|
||

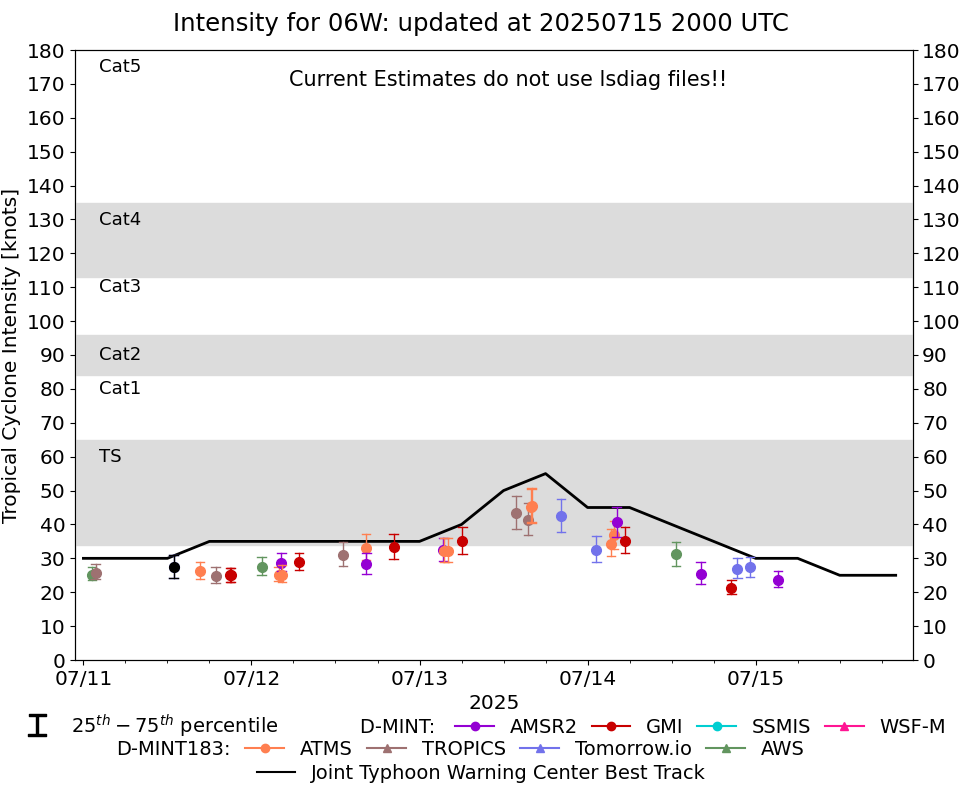 |
D-MINT HISTORY FILE for 2025_06W
| Date | Time | MW Sensor | MSLP | Vmax (30th-70th percentile average) | Vmax 25th percentile | Vmax 75th percentile | Image |
| 20250715 | 0314 UTC | AMSR2 | 996 hPa | 24 kts | 21 kts | 26 kts | 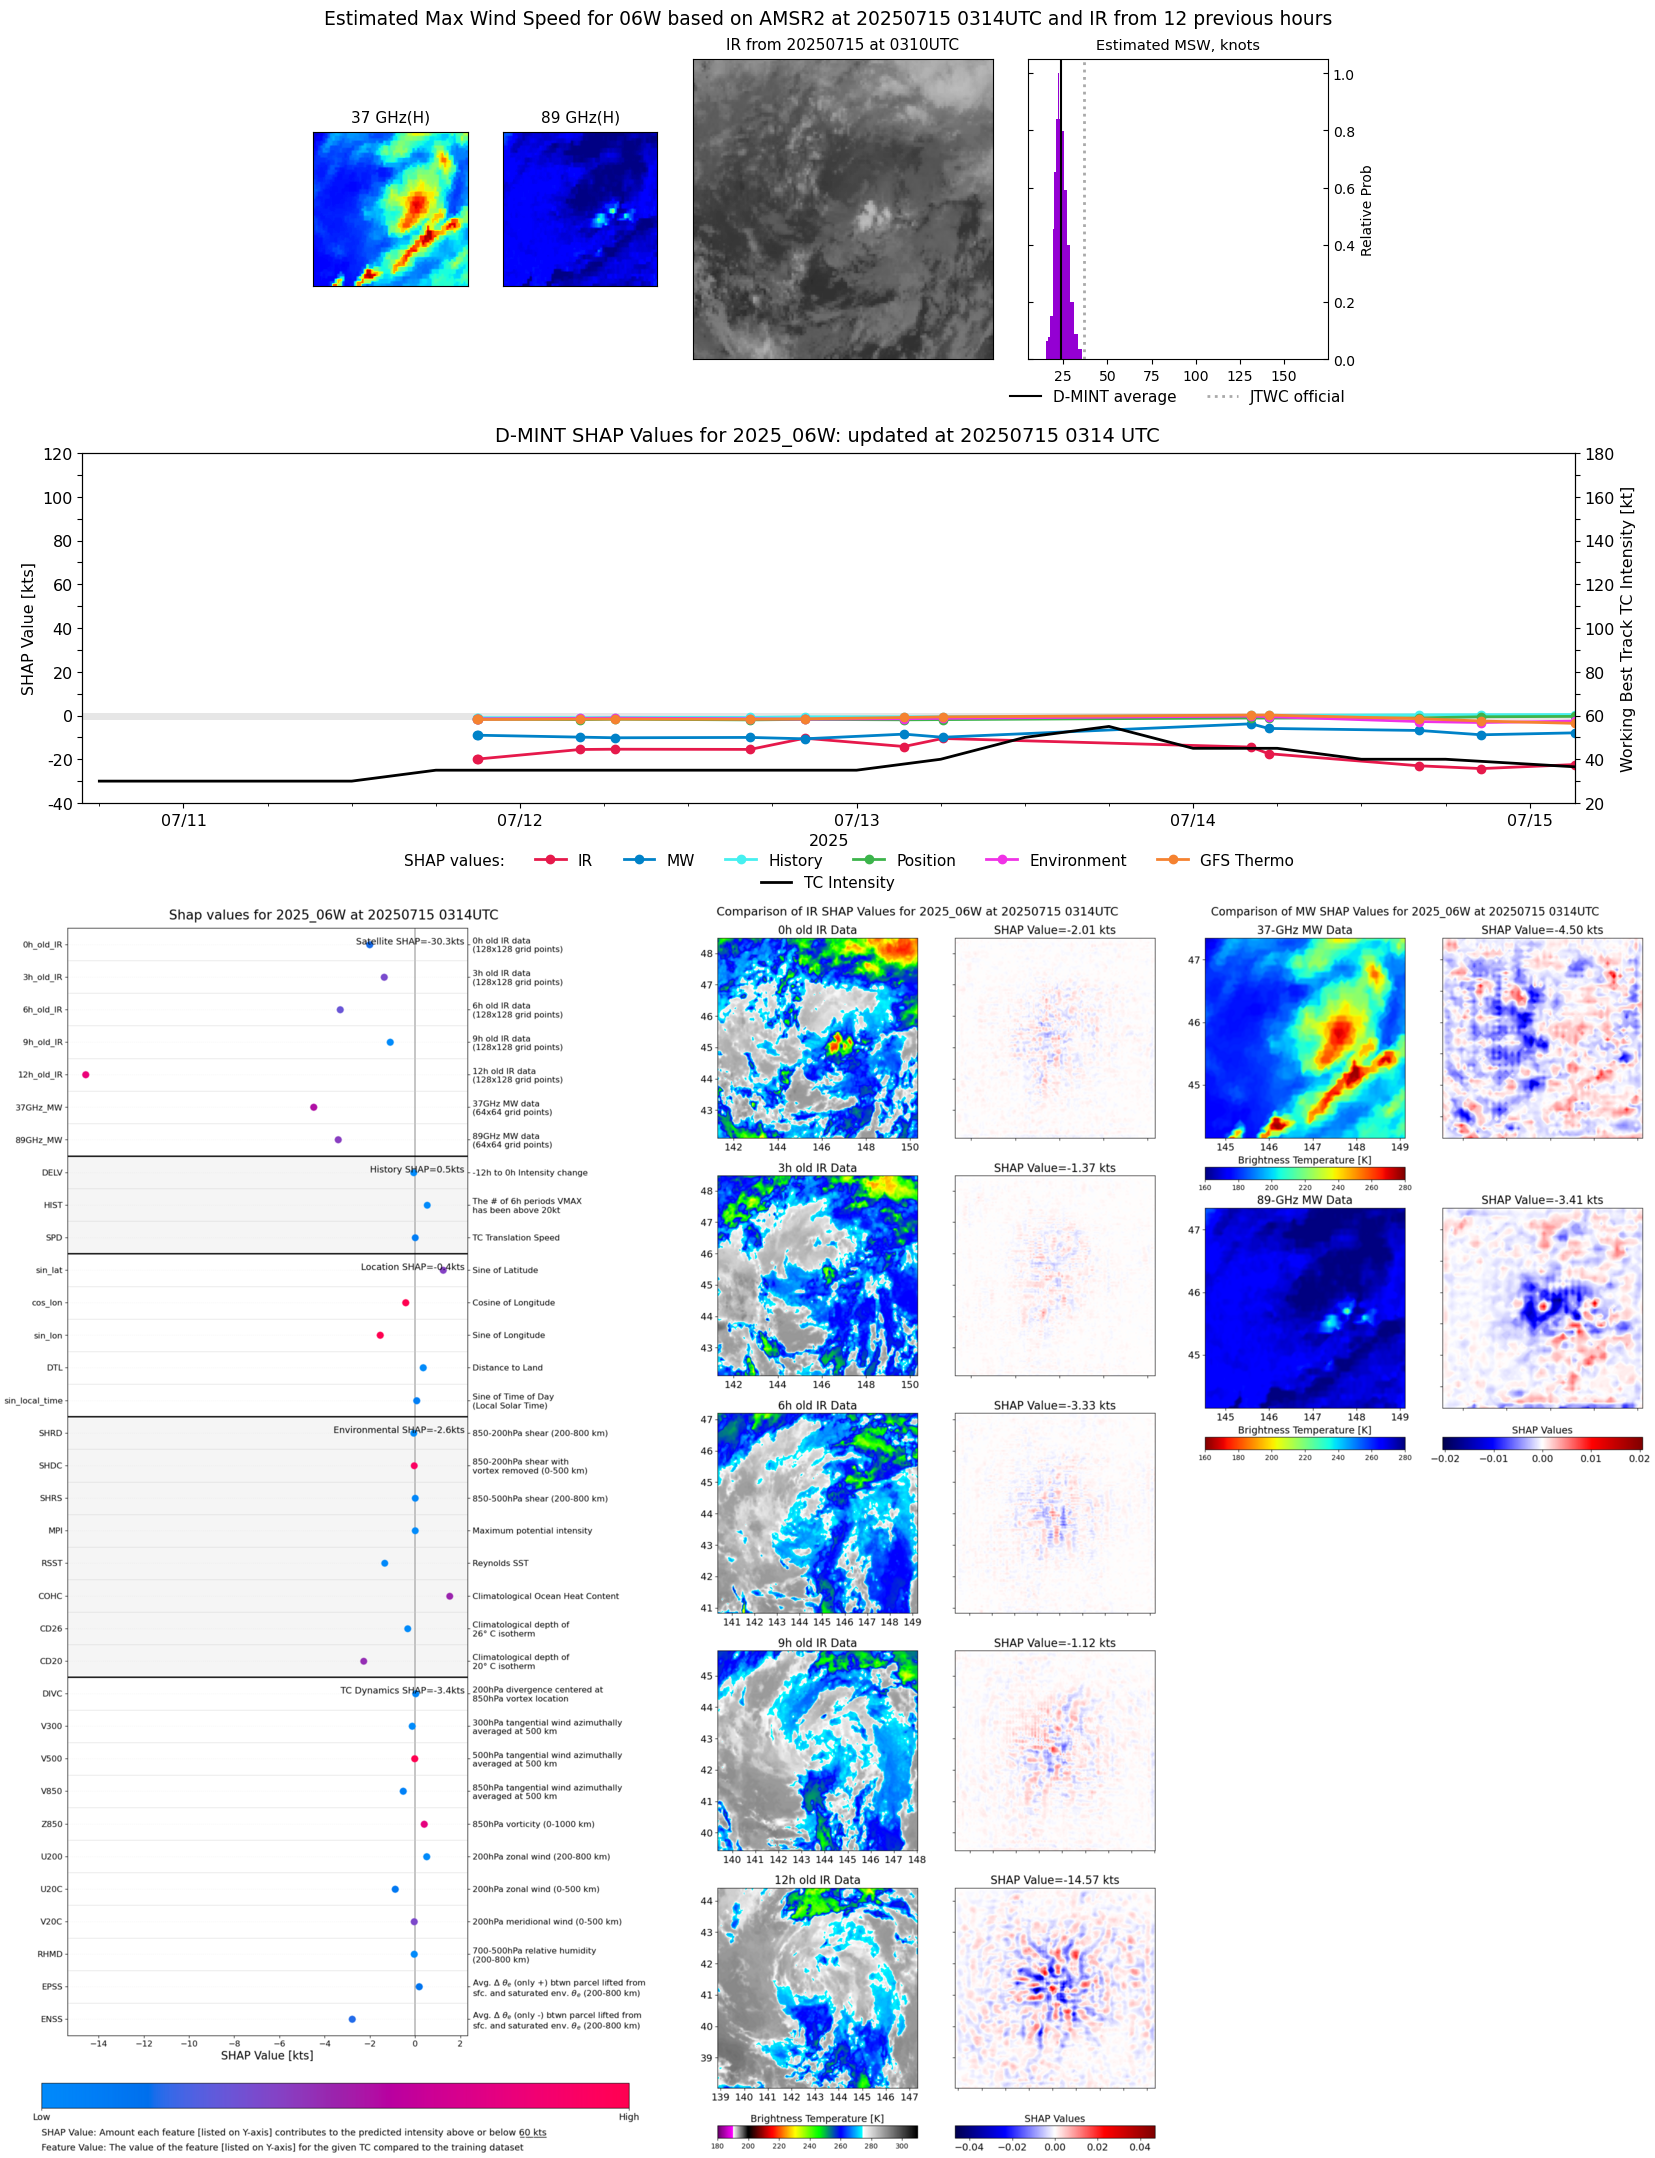 |
| 20250714 | 2314 UTC | TMS03 | 995 hPa | 27 kts | 25 kts | 30 kts | 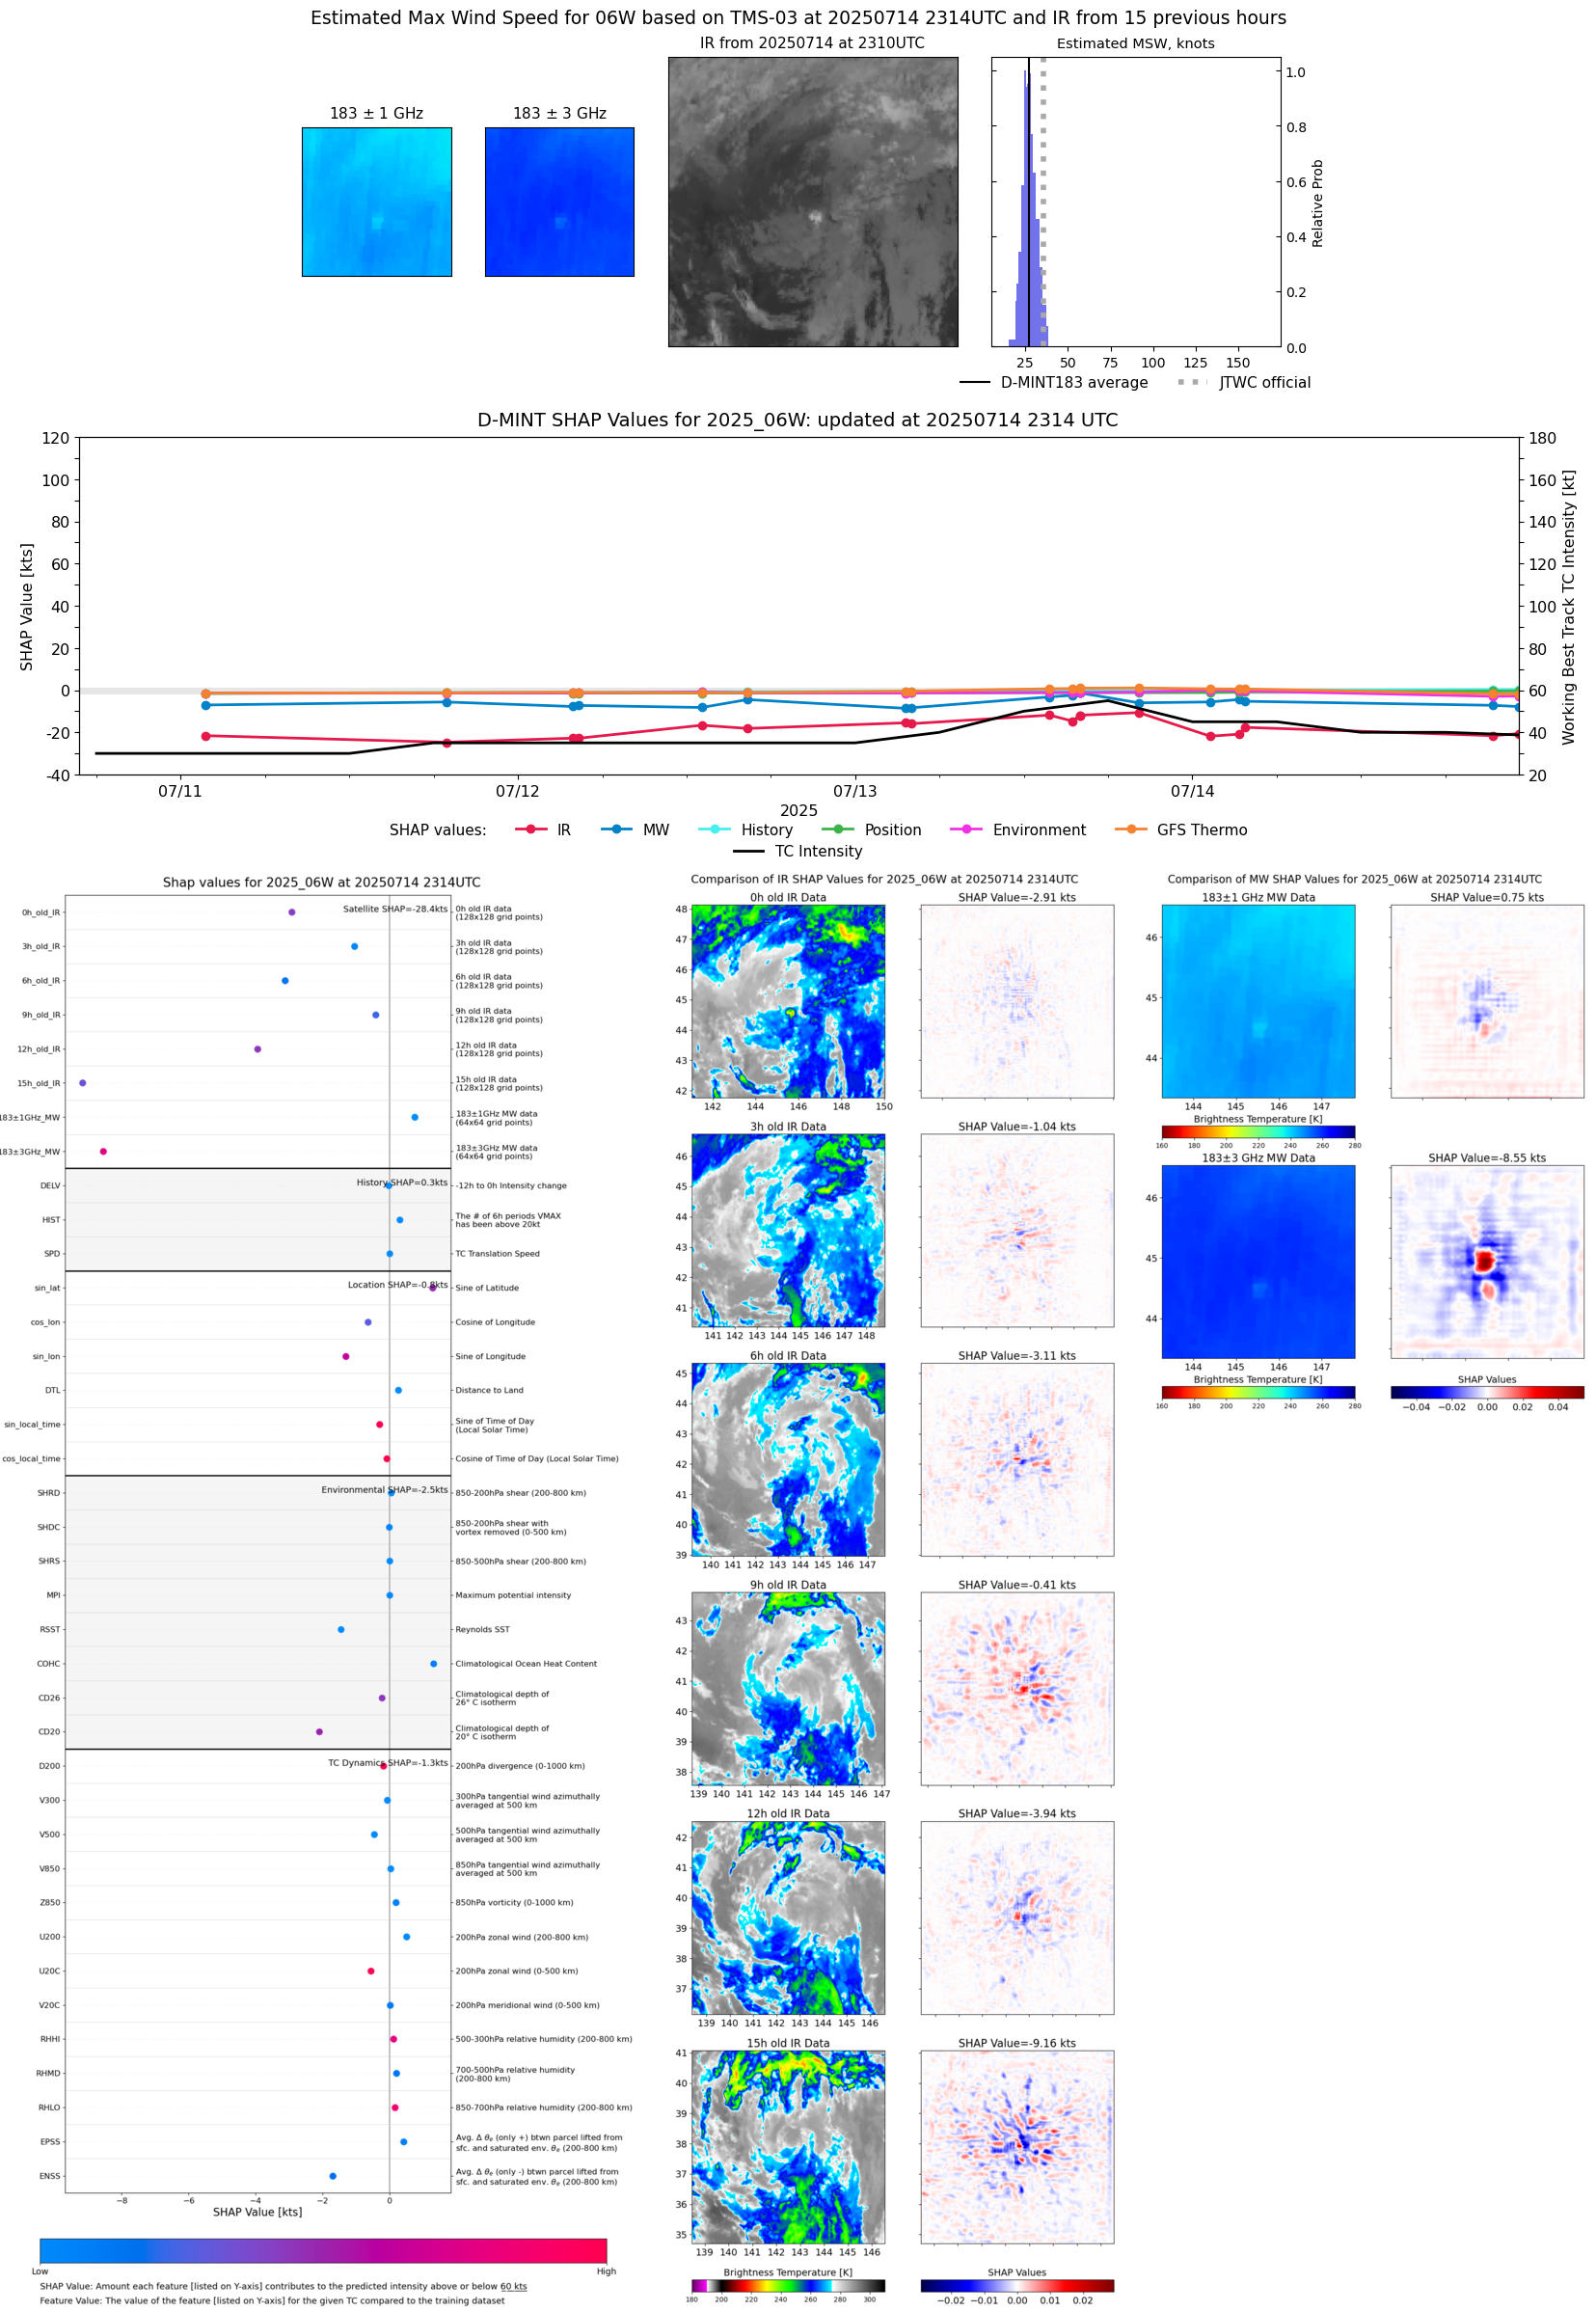 |
| 20250714 | 2124 UTC | TMS03 | 994 hPa | 27 kts | 24 kts | 30 kts | 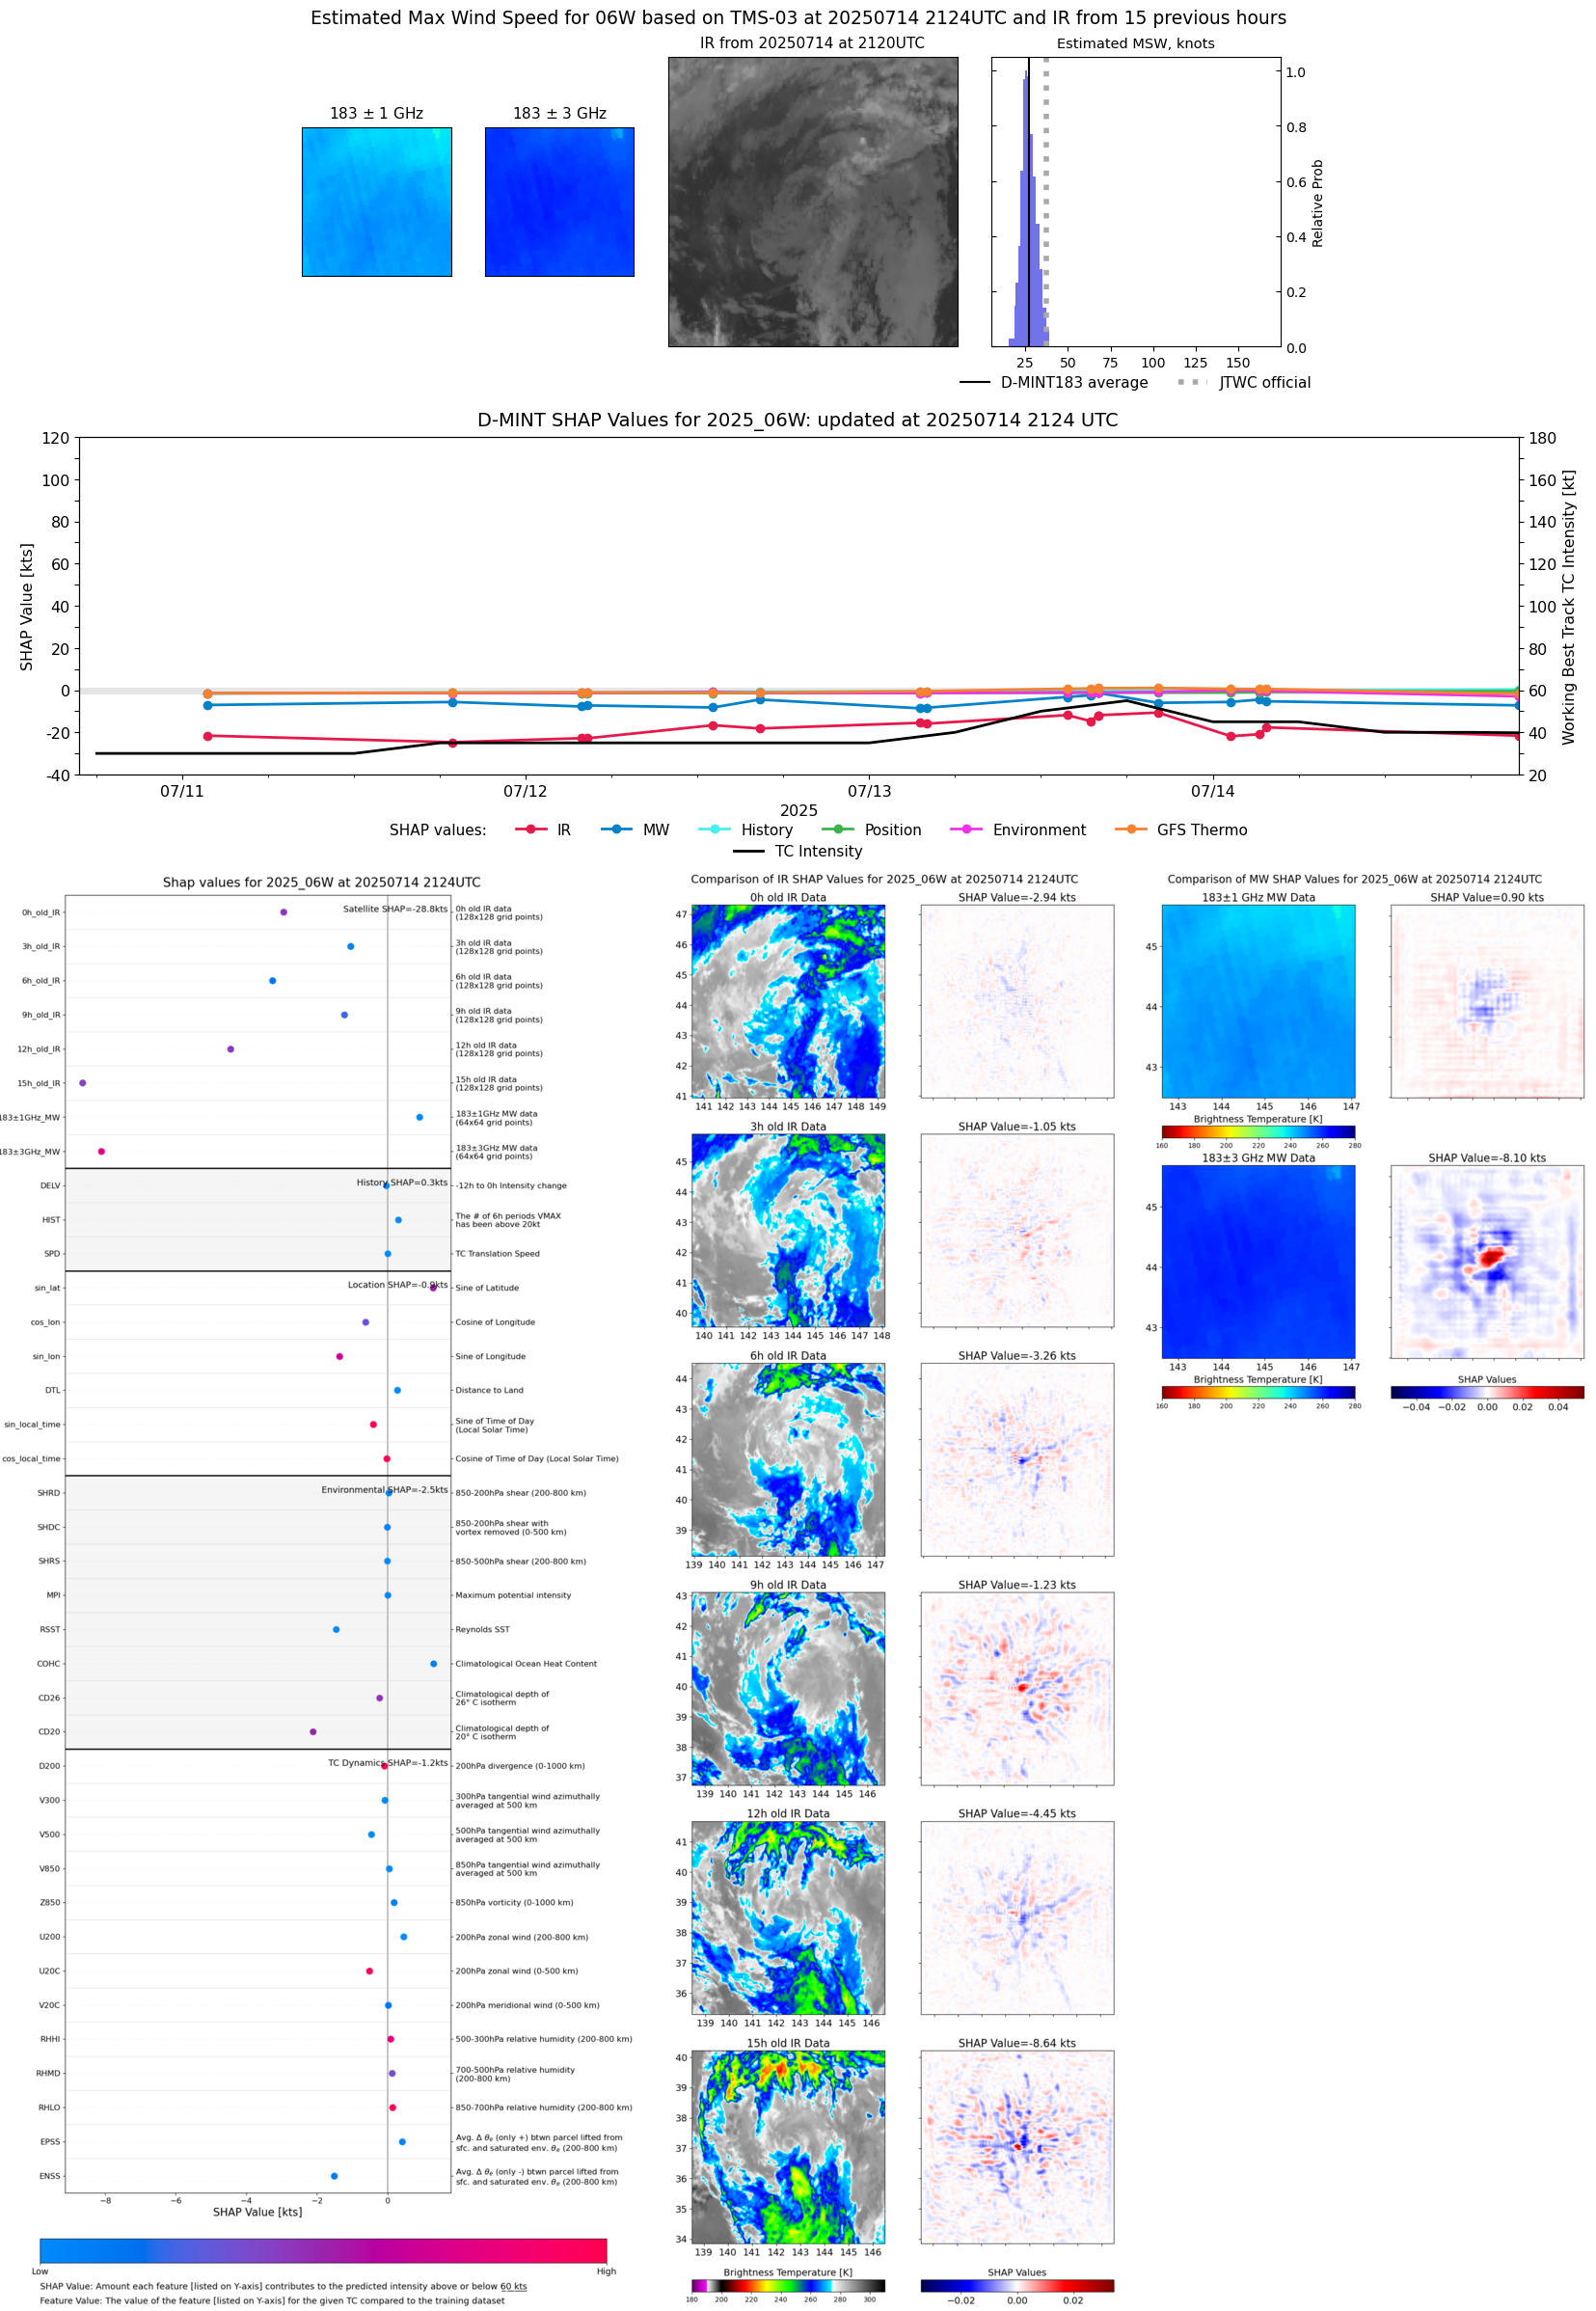 |
| 20250714 | 2033 UTC | GMI | 995 hPa | 21 kts | 19 kts | 24 kts | 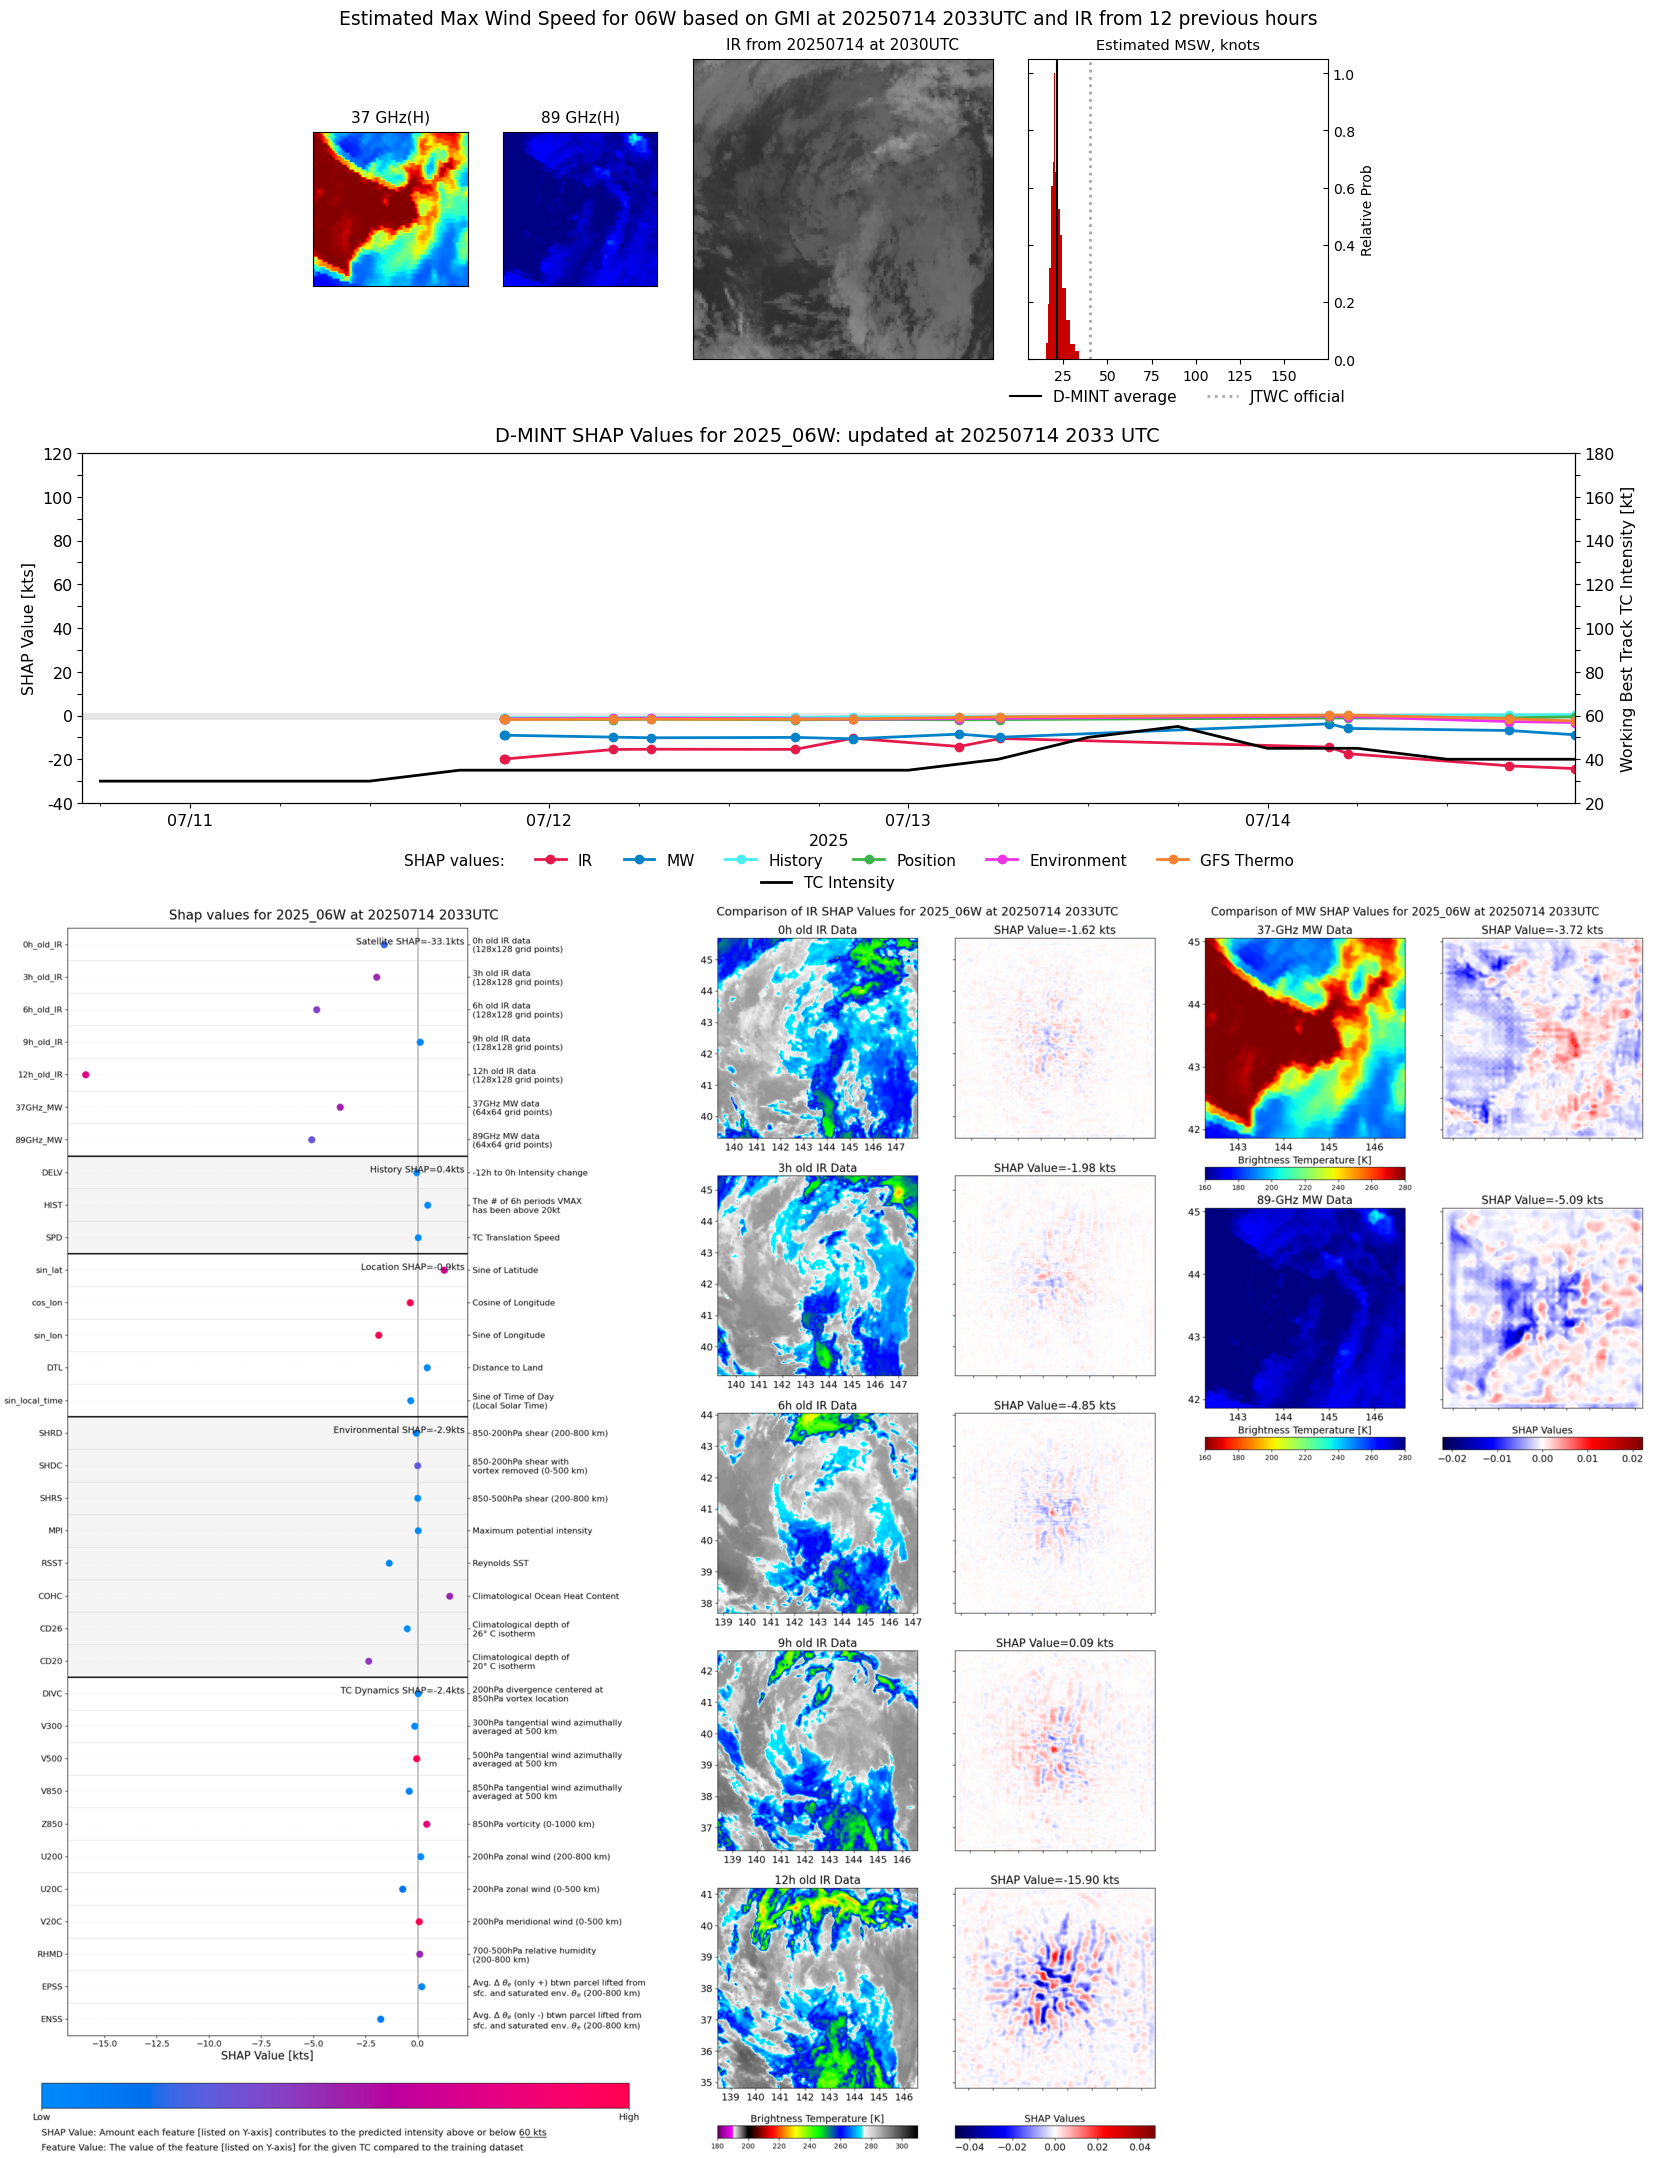 |
| 20250714 | 1608 UTC | AMSR2 | 995 hPa | 26 kts | 23 kts | 29 kts | 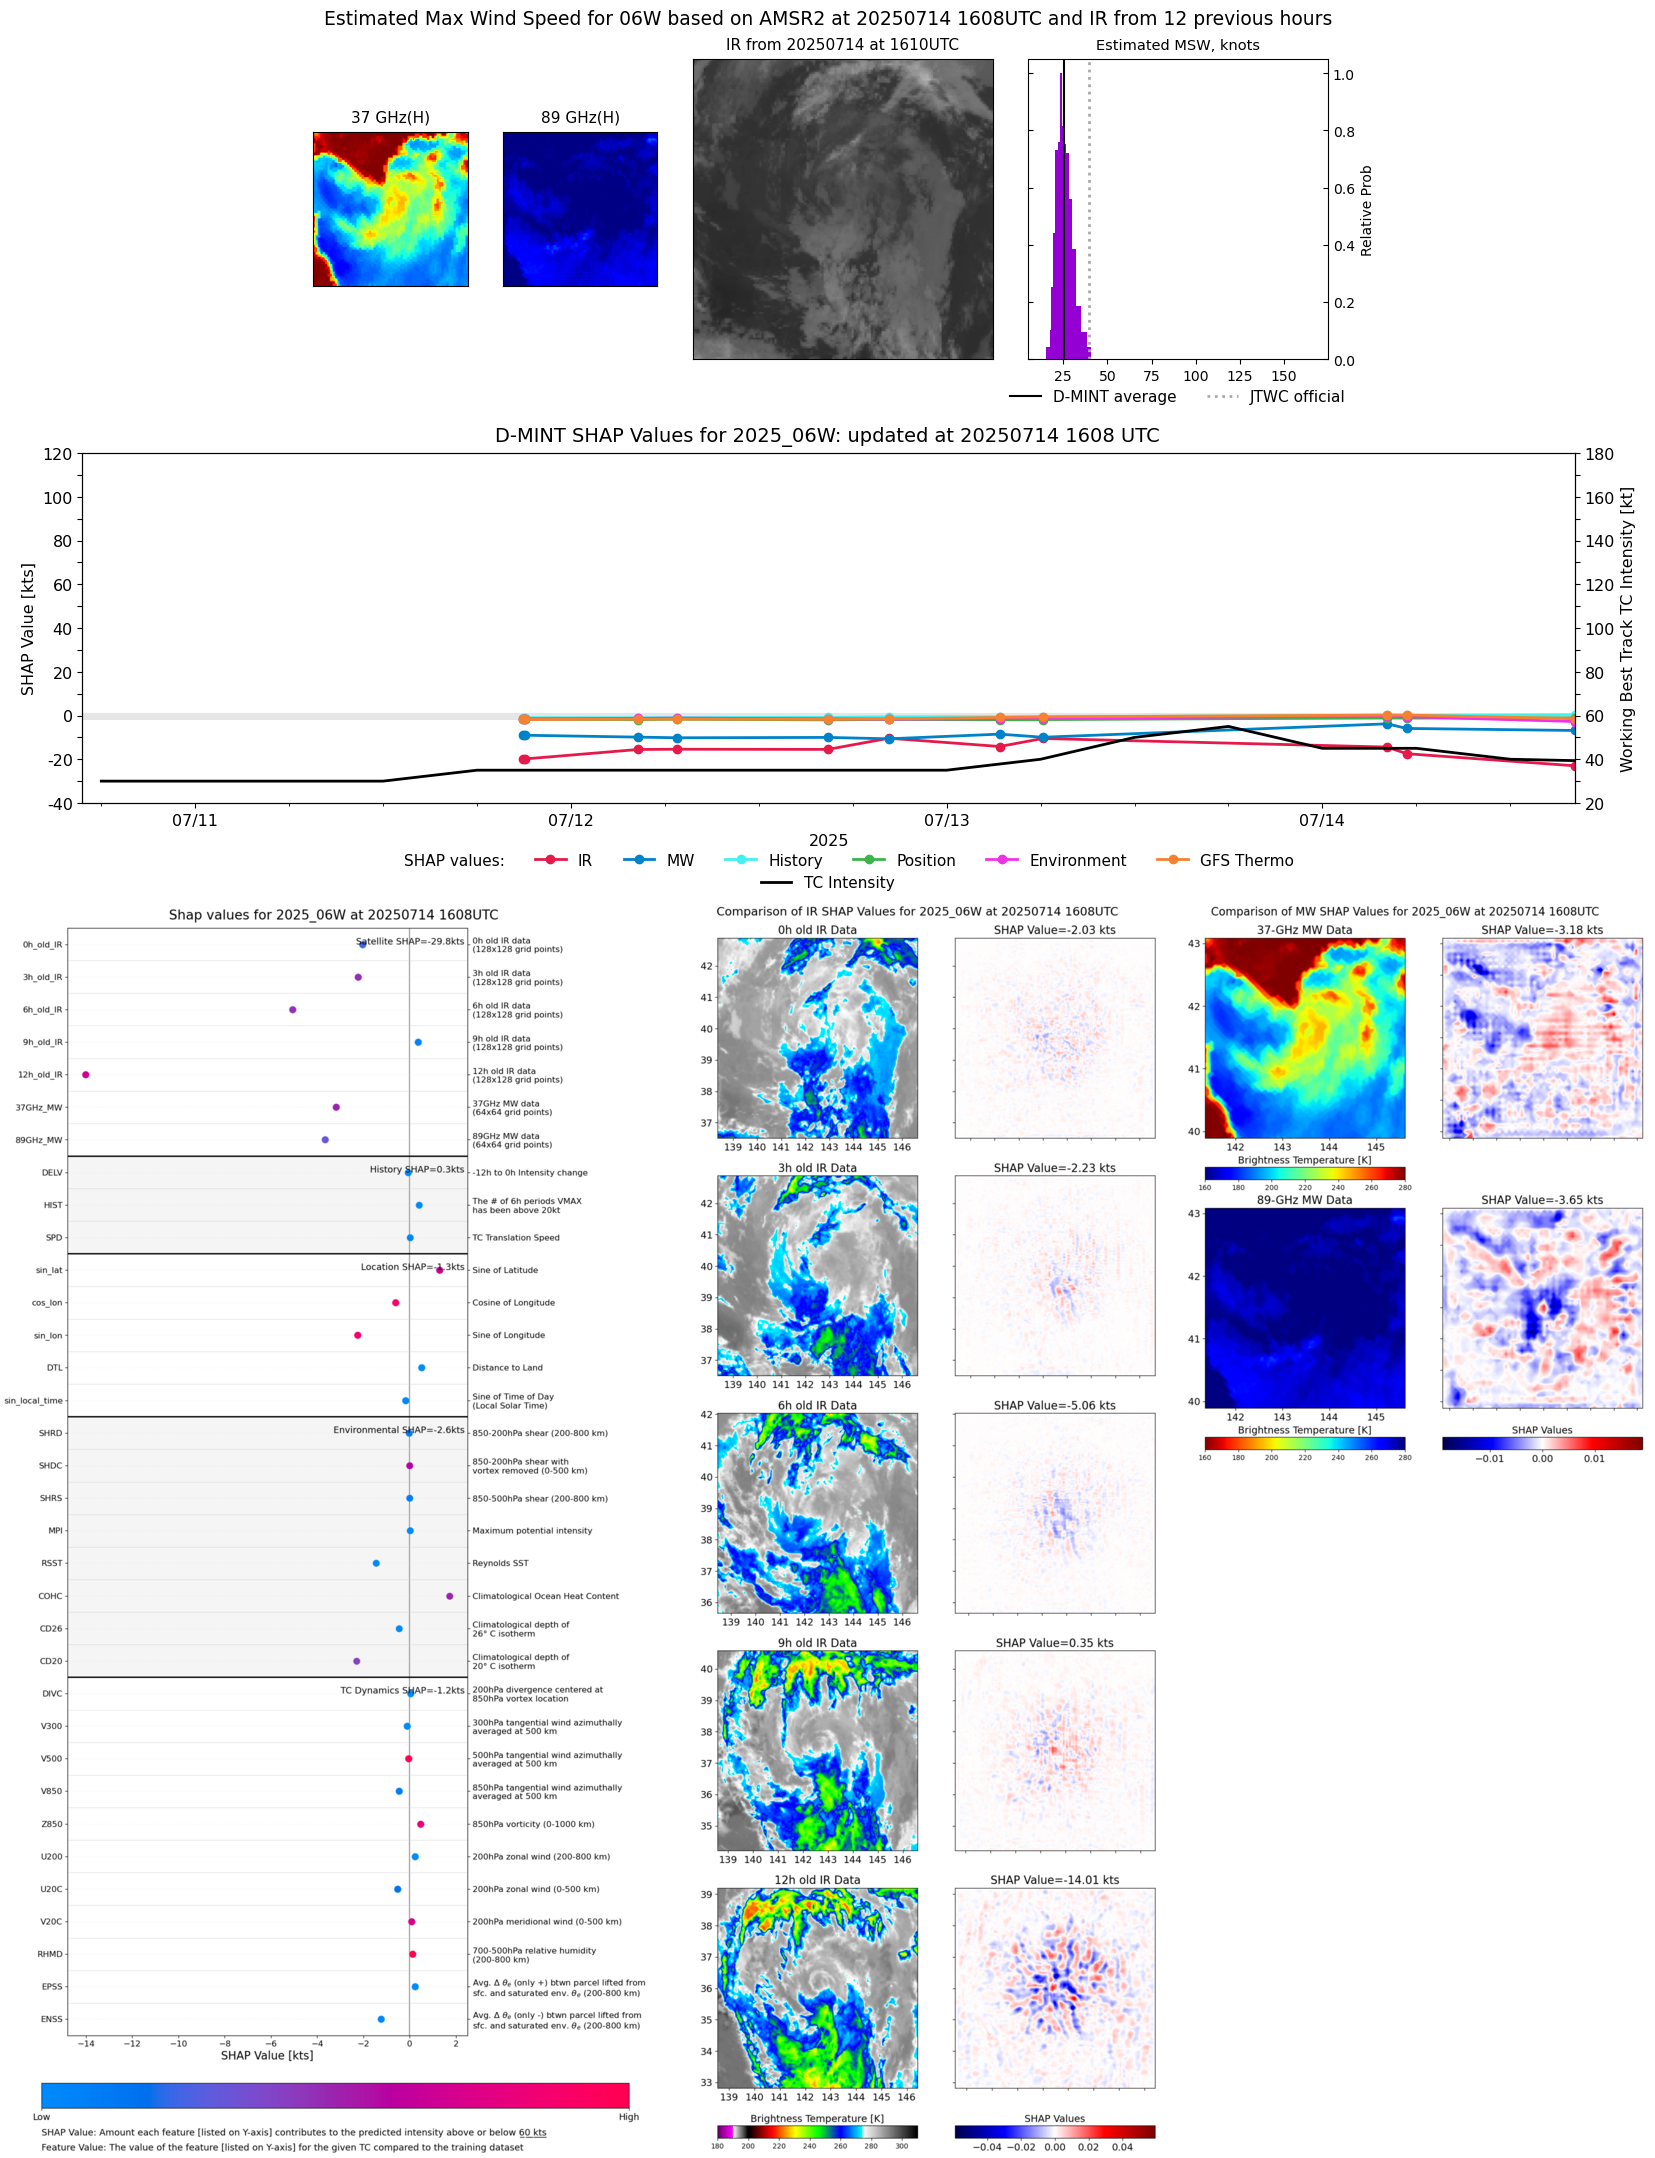 |
| 20250714 | 1235 UTC | AWS | 991 hPa | 31 kts | 28 kts | 35 kts | 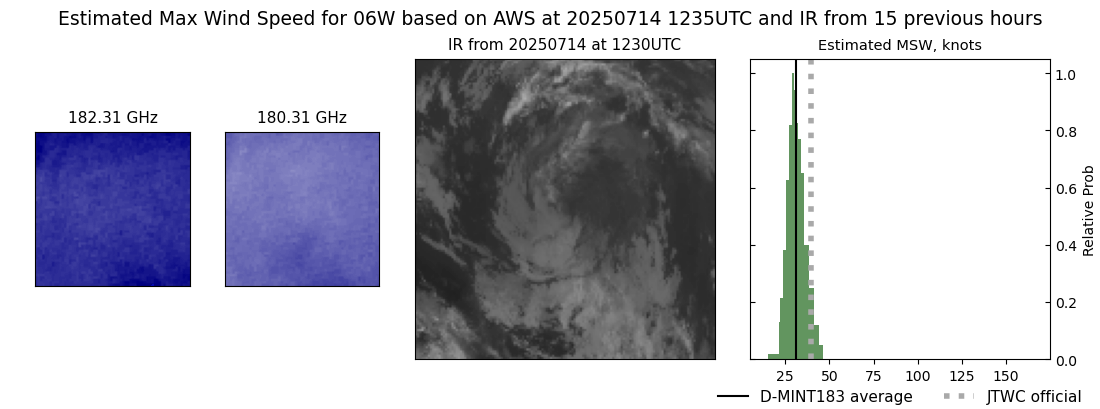 |
| 20250714 | 0523 UTC | GMI | 990 hPa | 35 kts | 32 kts | 39 kts | 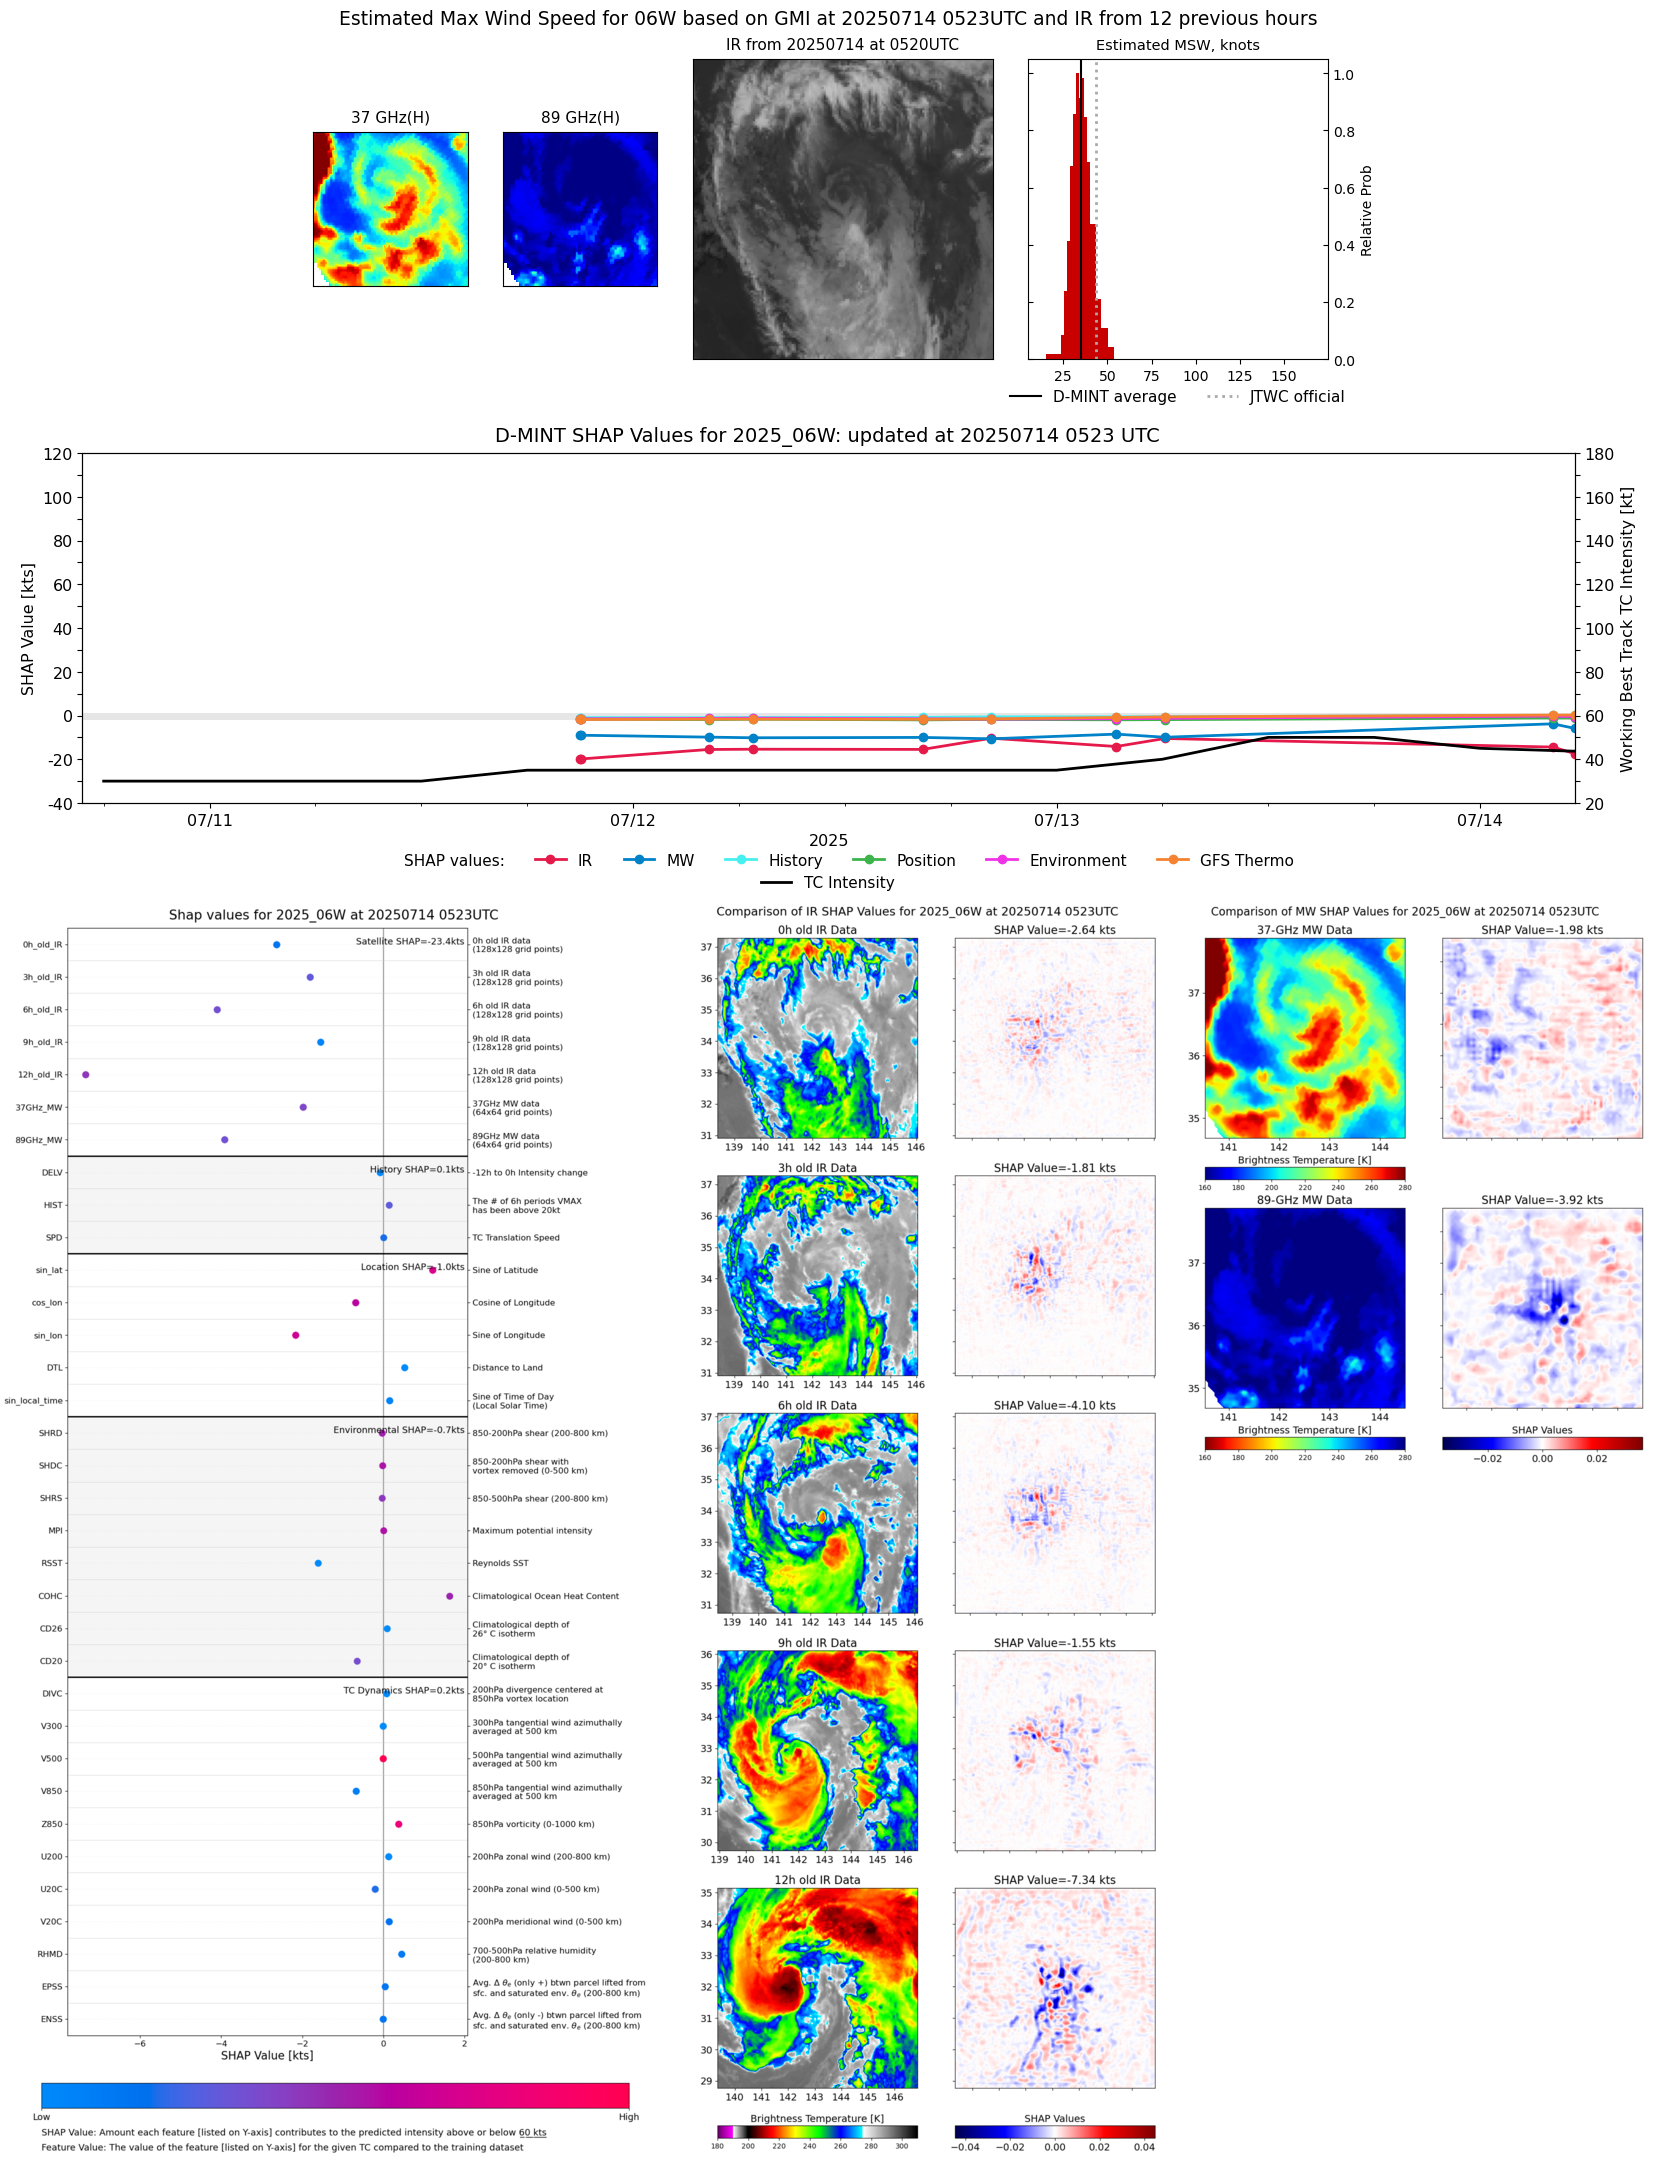 |
| 20250714 | 0408 UTC | AMSR2 | 988 hPa | 41 kts | 36 kts | 45 kts | 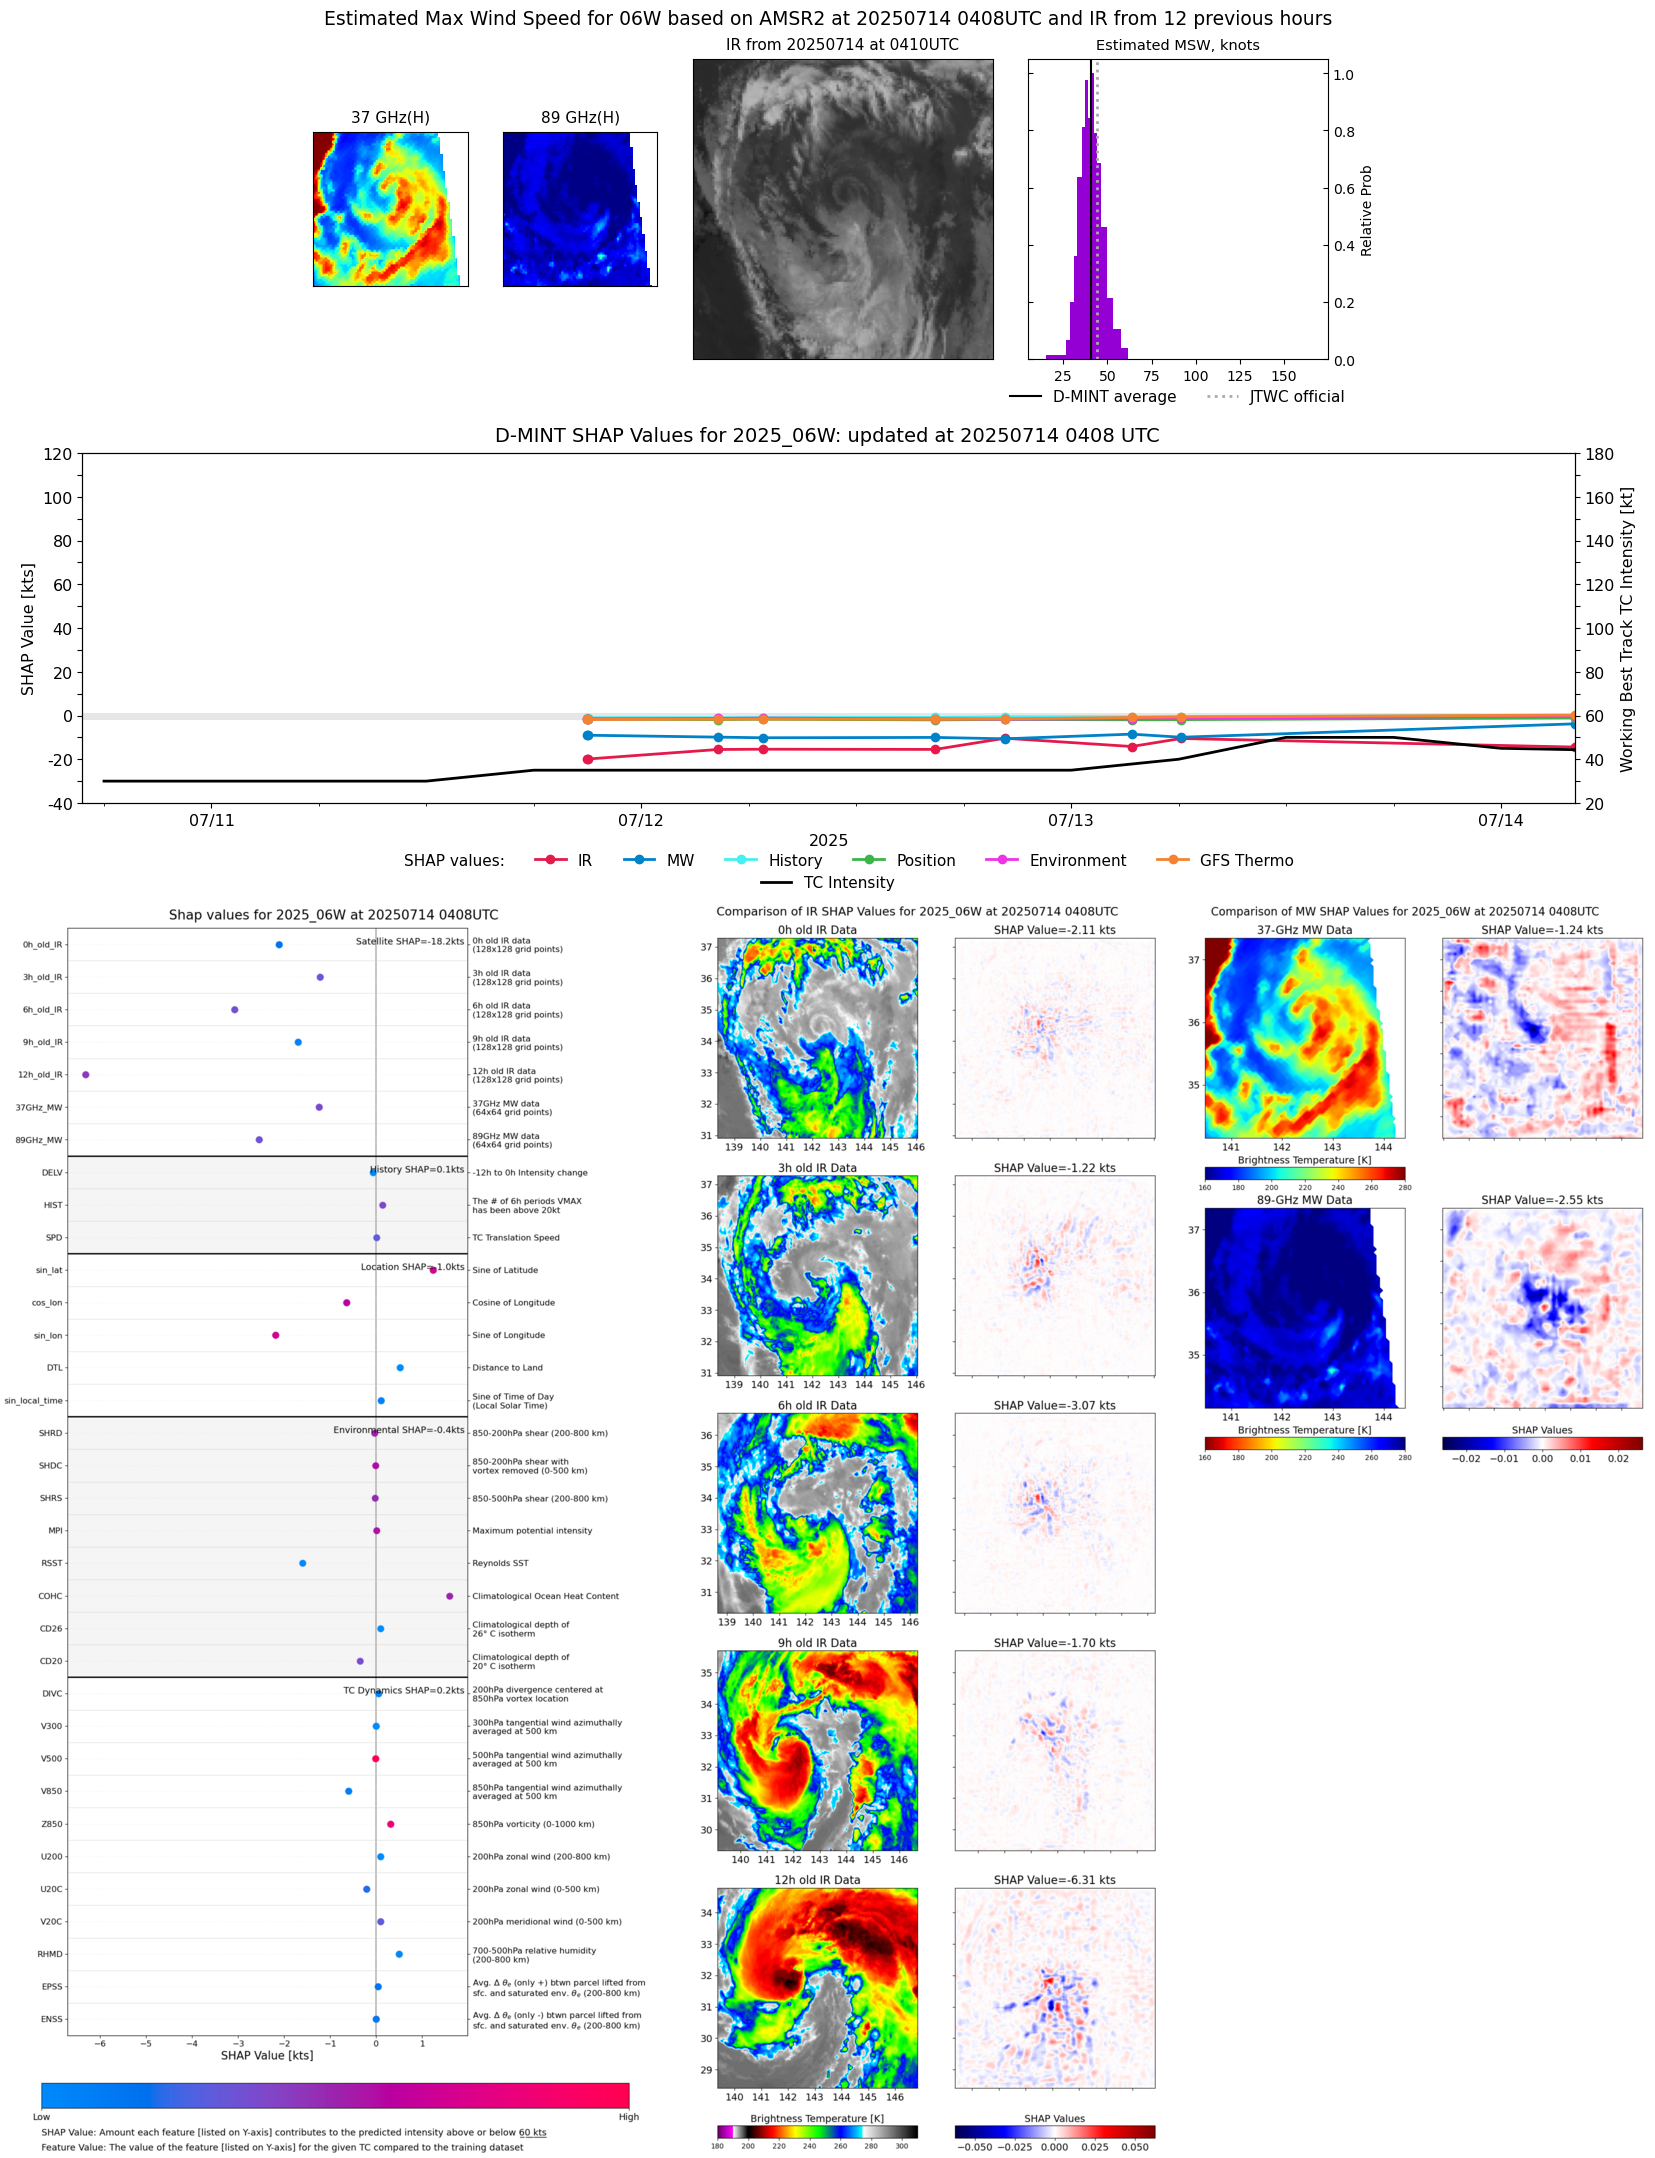 |
| 20250714 | 0345 UTC | ATMS-NPP | 987 hPa | 37 kts | 33 kts | 41 kts |  |
| 20250714 | 0318 UTC | ATMS-N21 | 987 hPa | 34 kts | 31 kts | 39 kts | 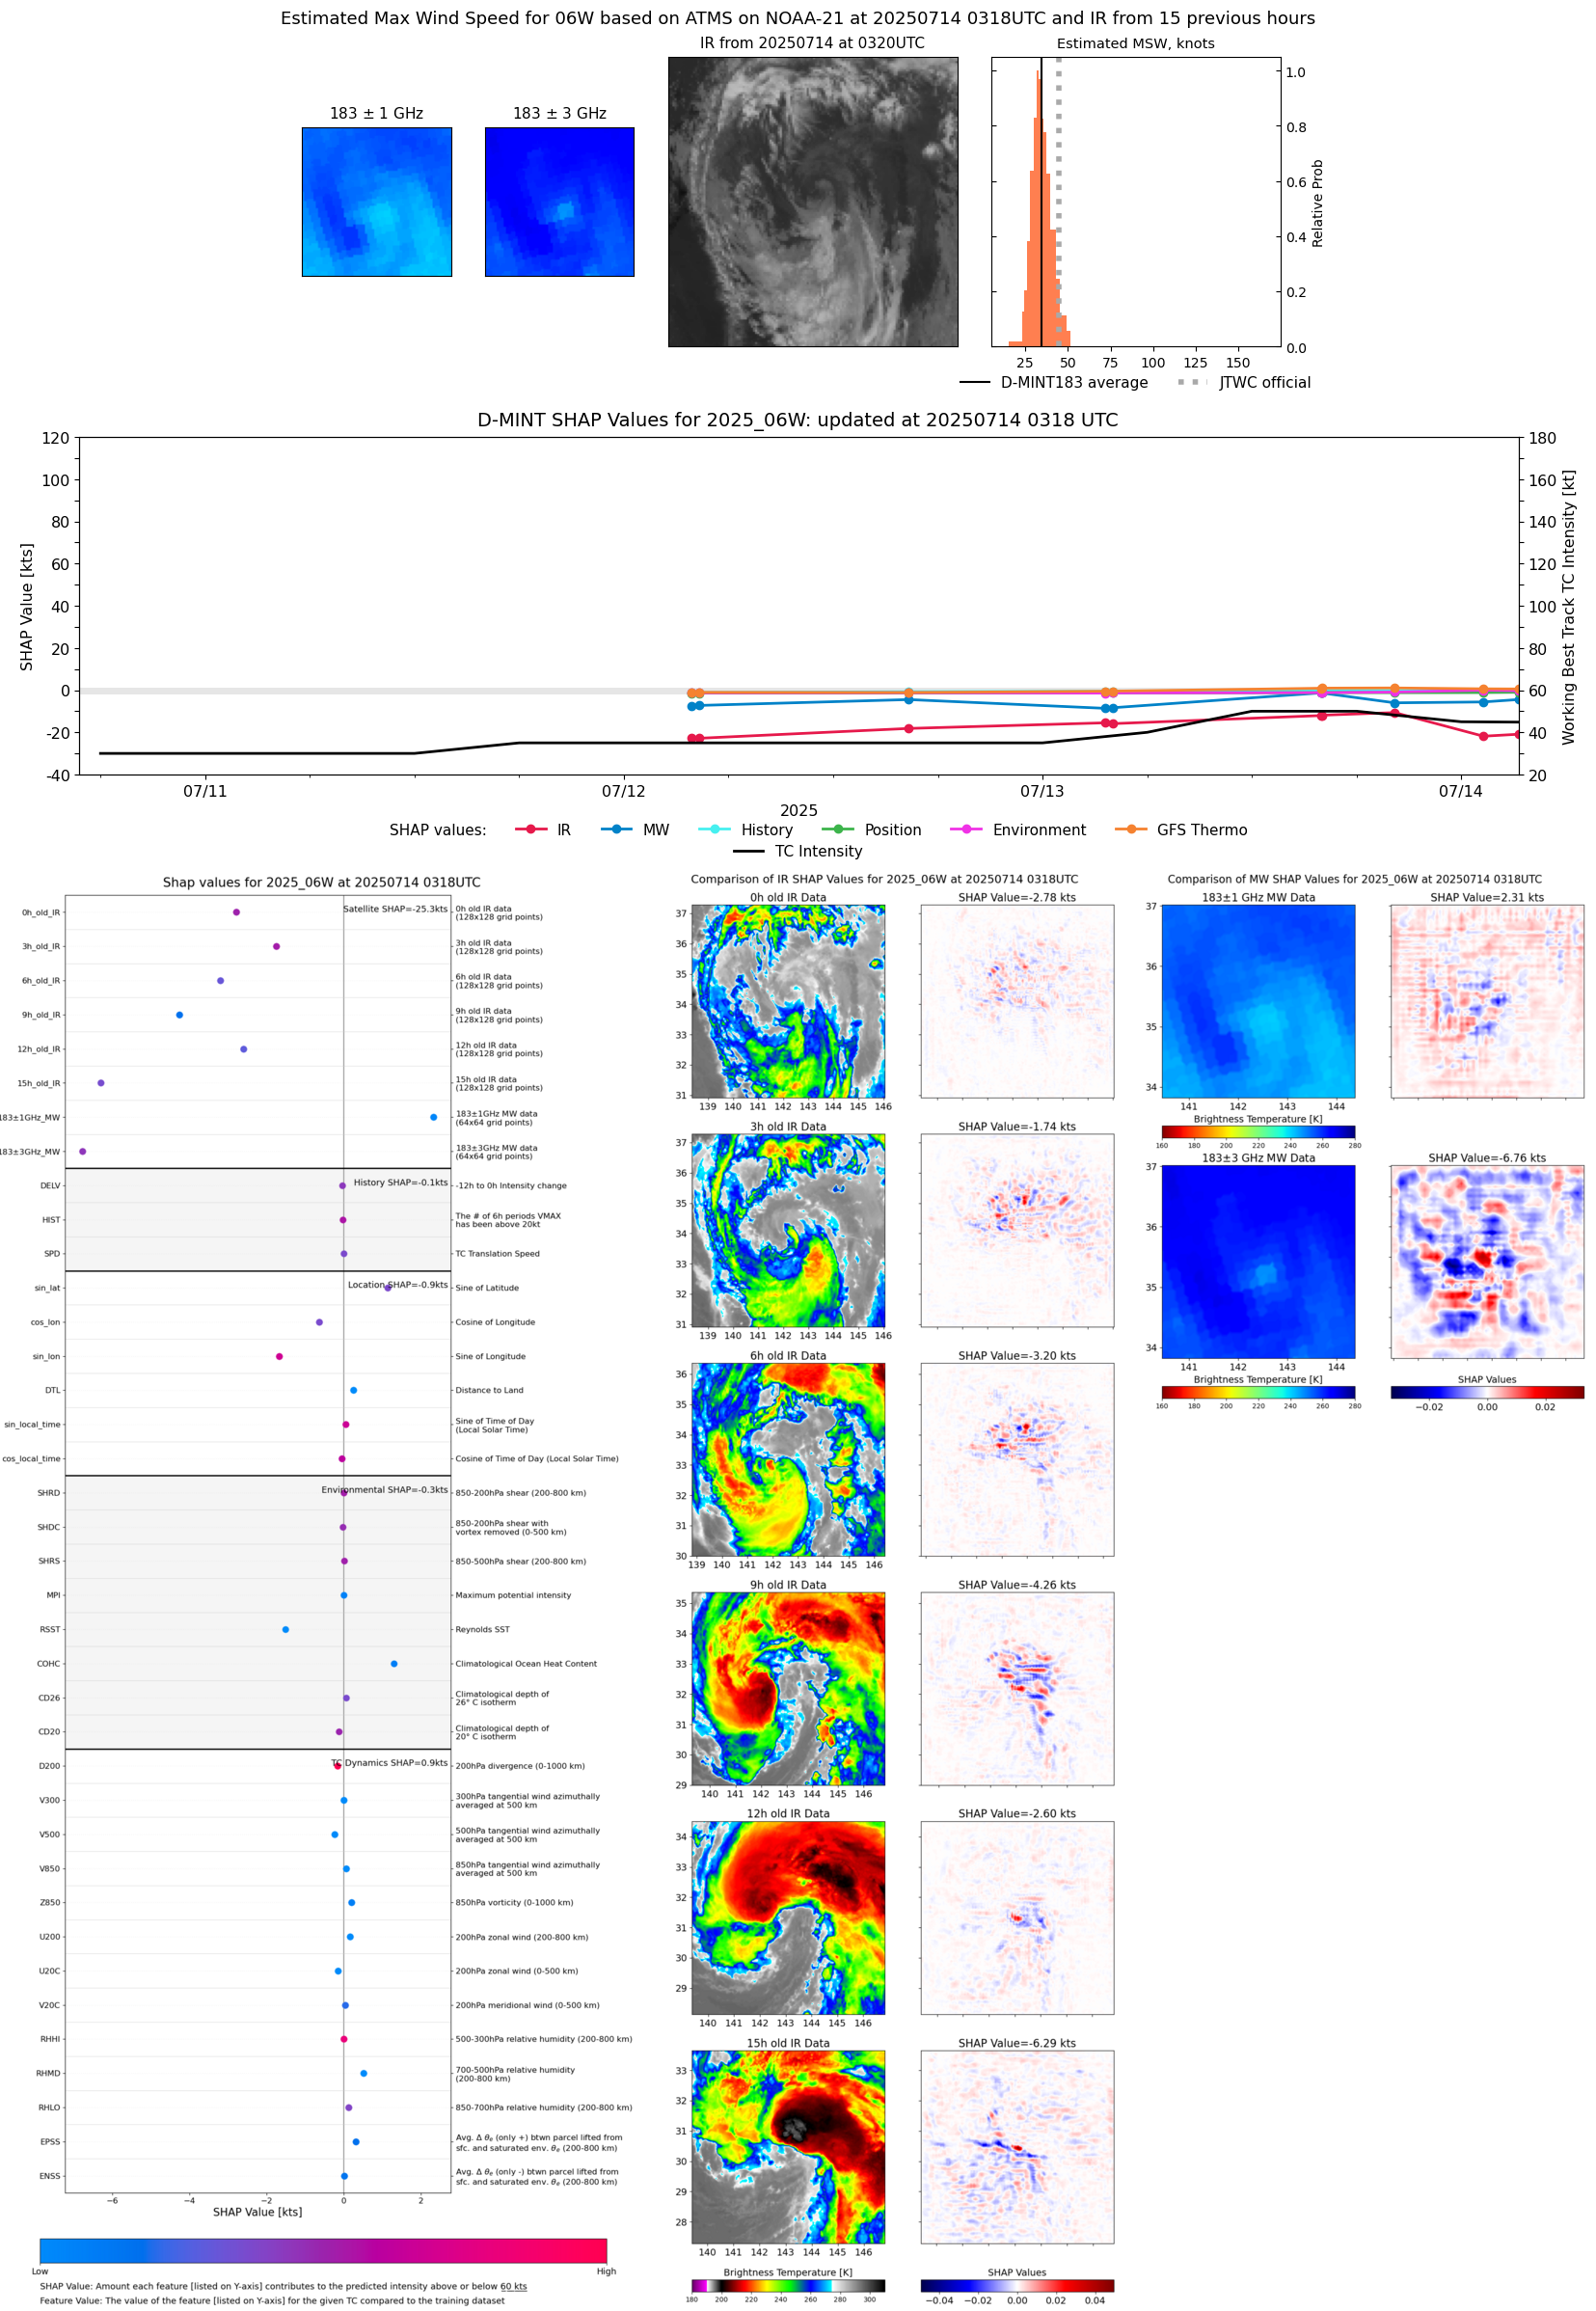 |
| 20250714 | 0116 UTC | TMS02 | 989 hPa | 32 kts | 29 kts | 37 kts | 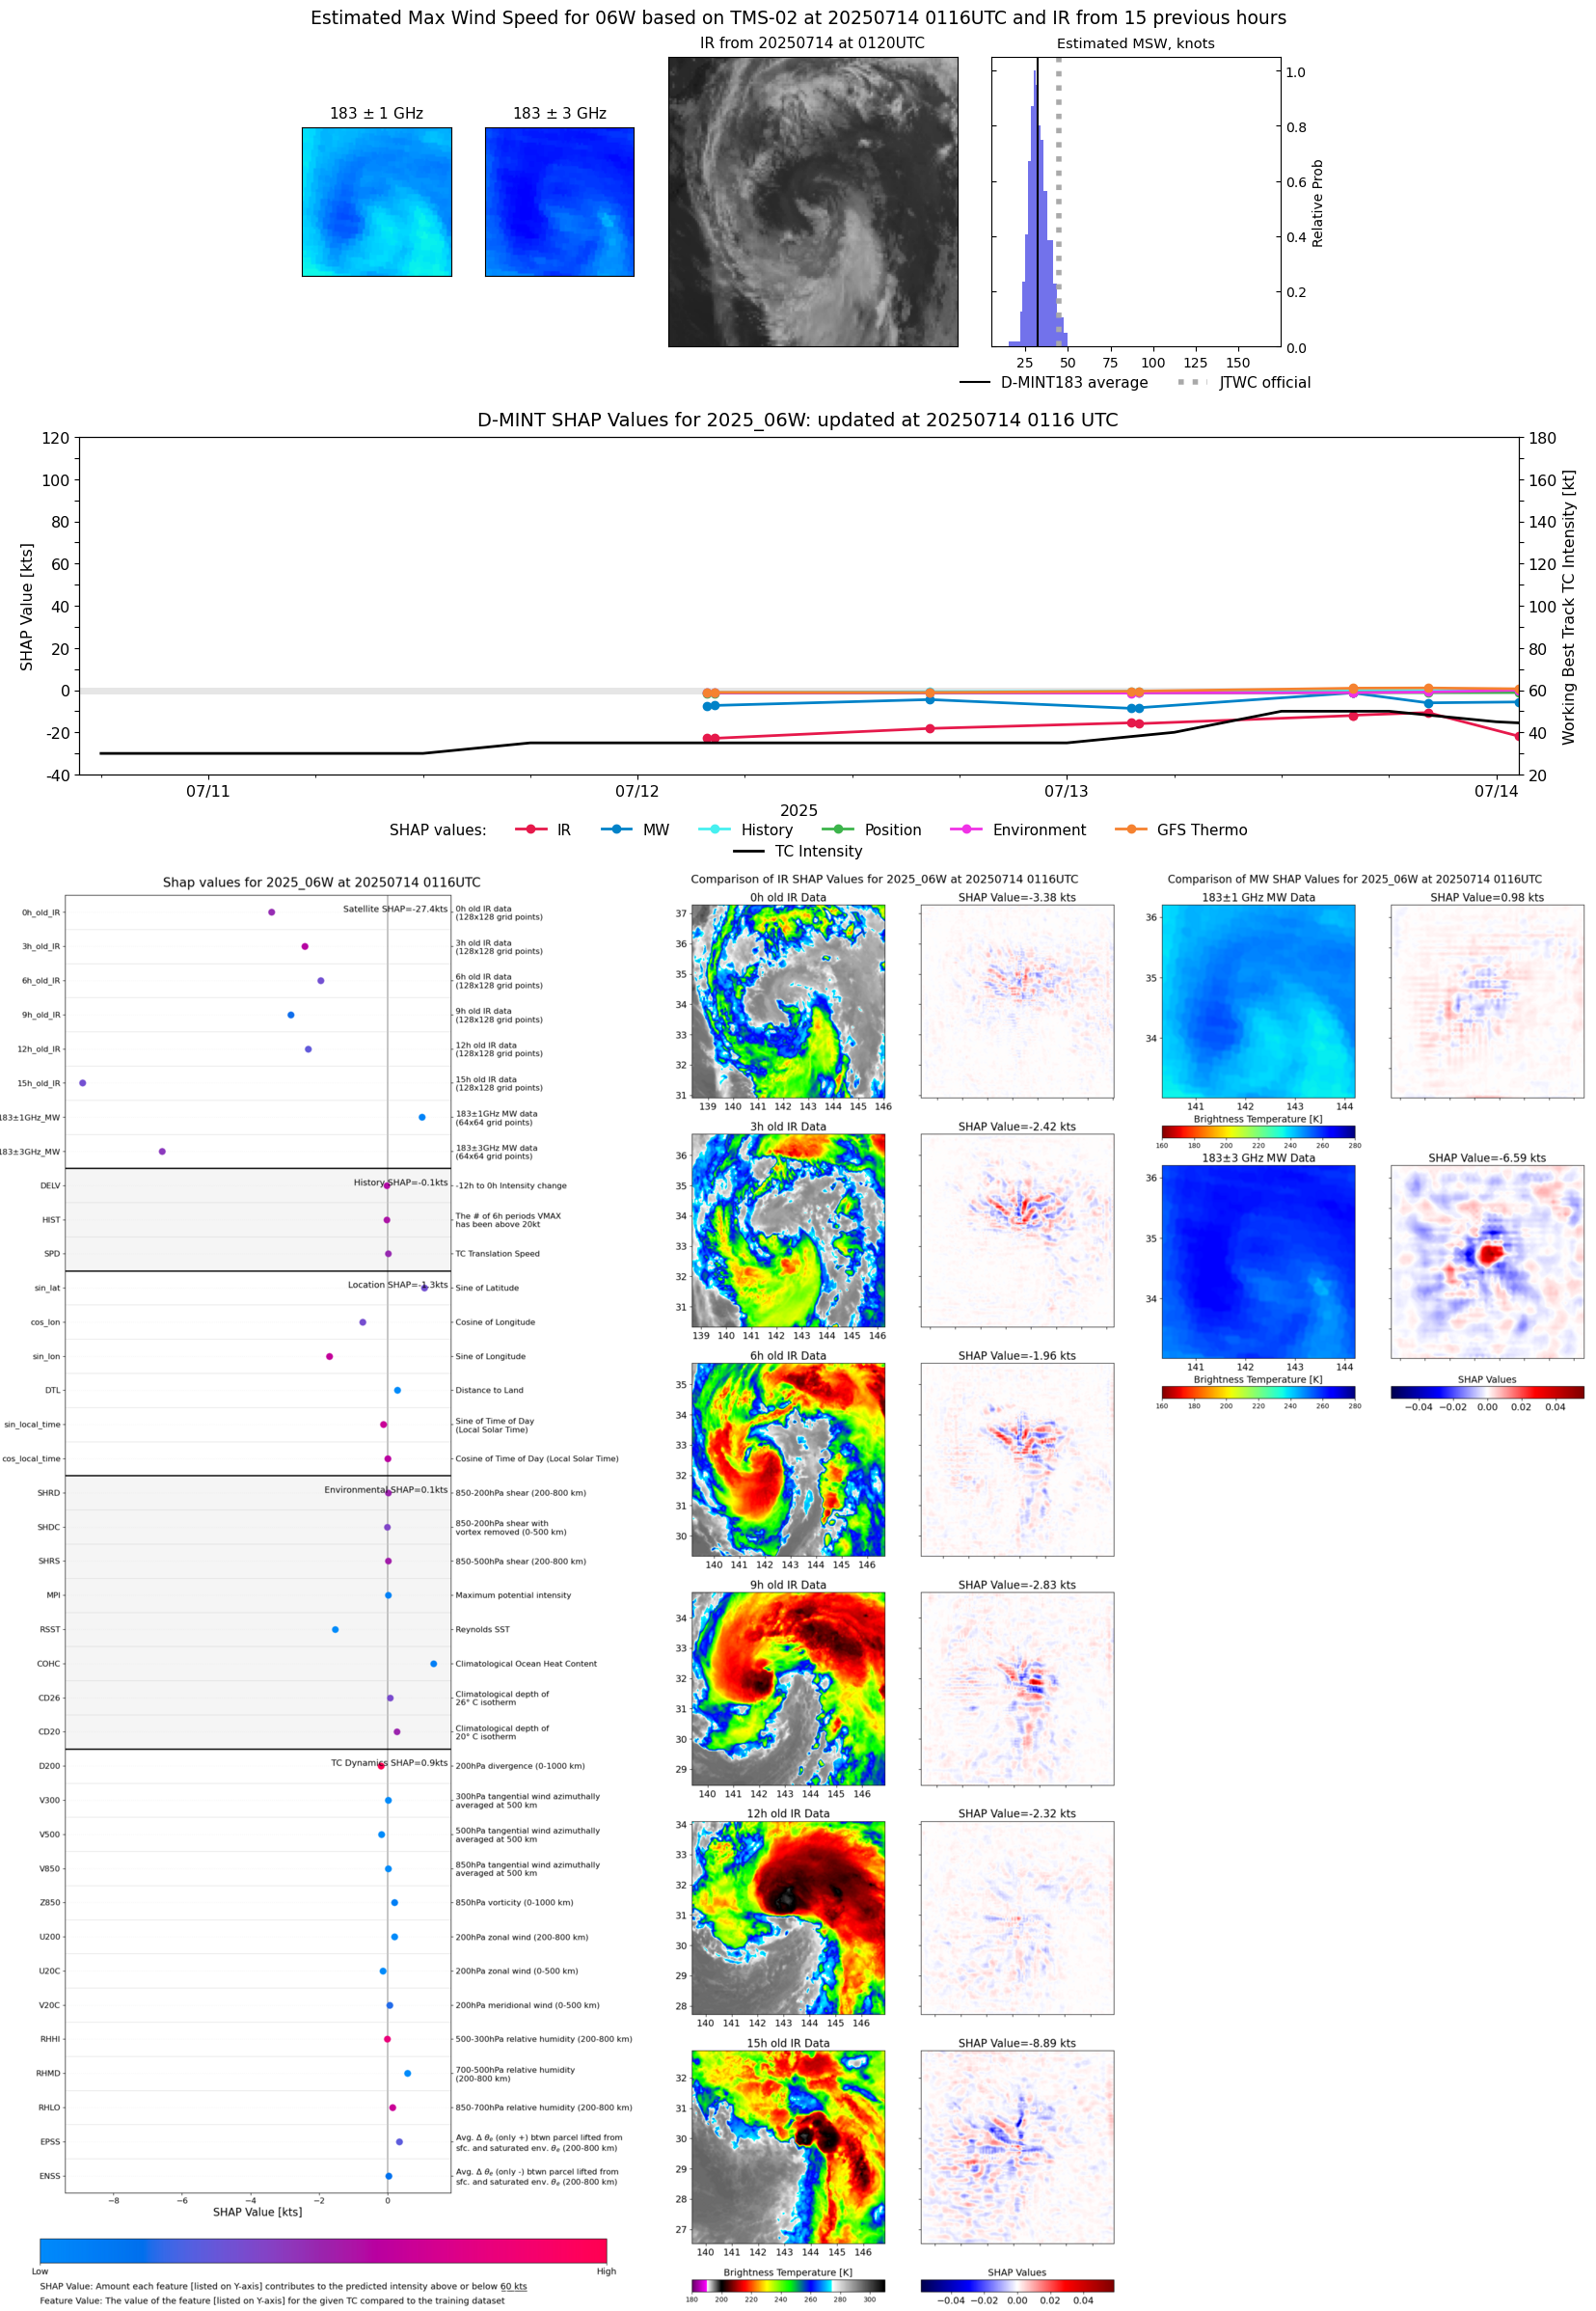 |
| 20250713 | 2011 UTC | TMS03 | 991 hPa | 42 kts | 38 kts | 47 kts | 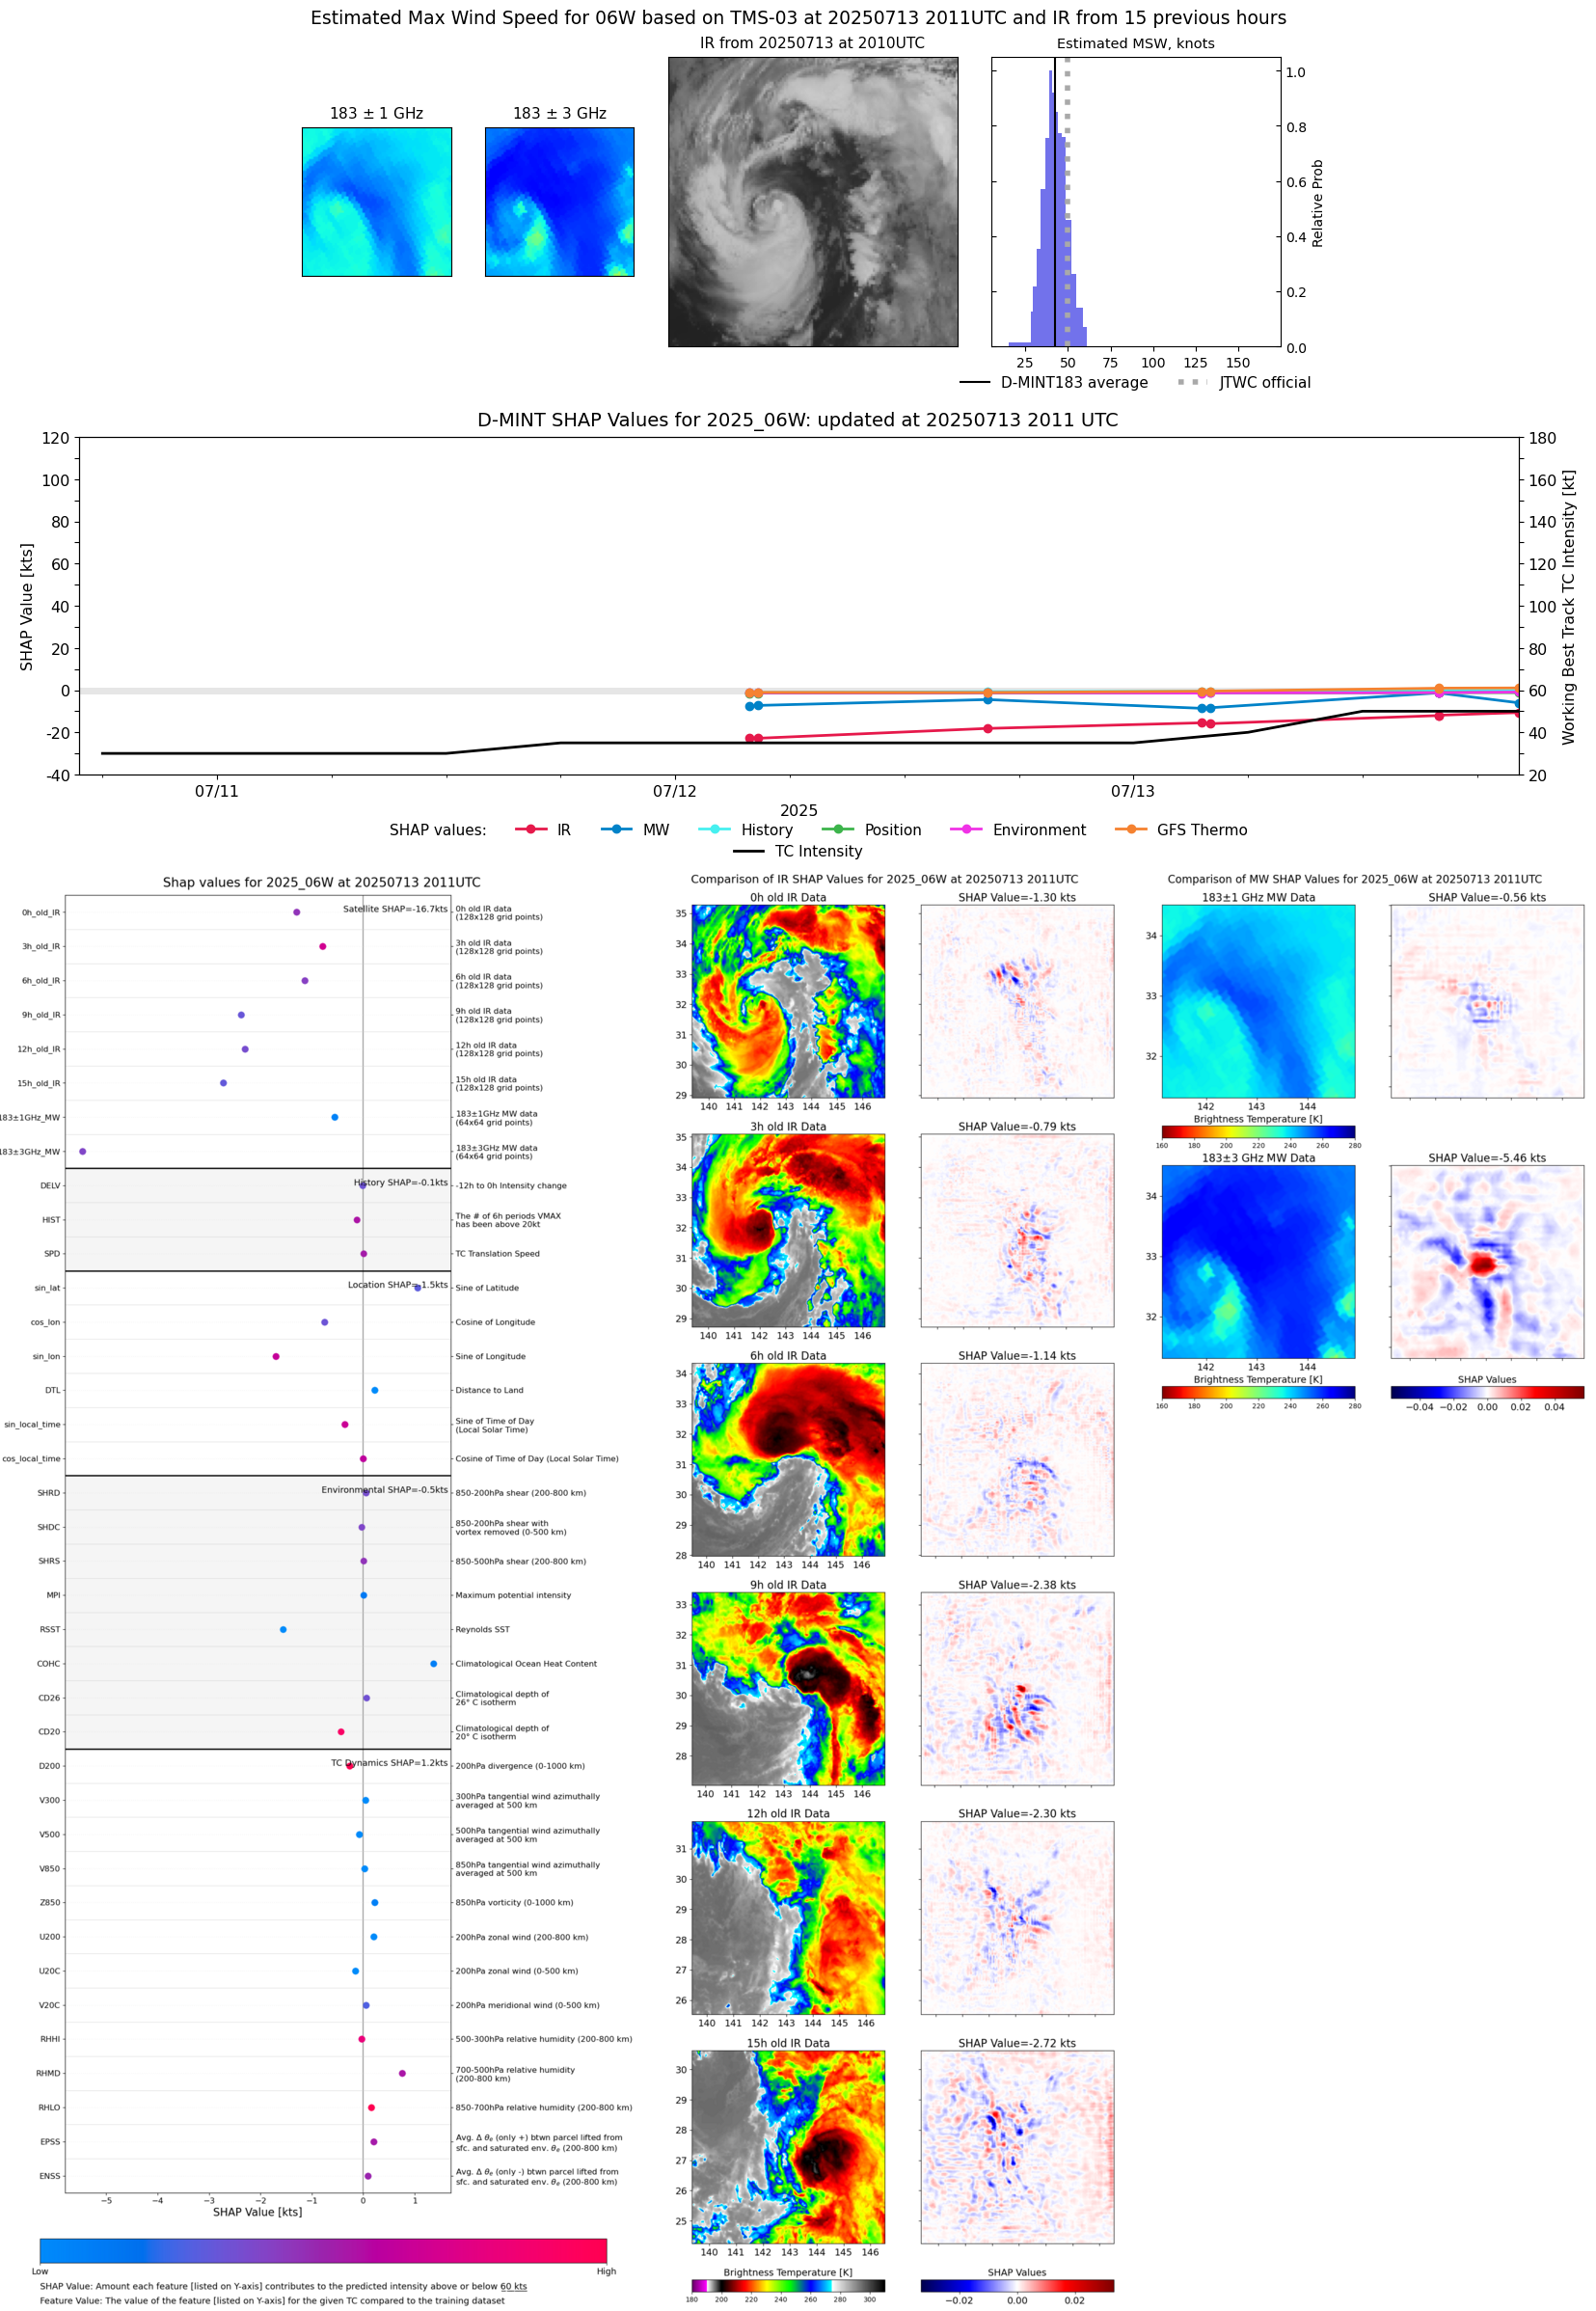 |
| 20250713 | 1600 UTC | ATMS-N21 | 988 hPa | 46 kts | 41 kts | 51 kts | 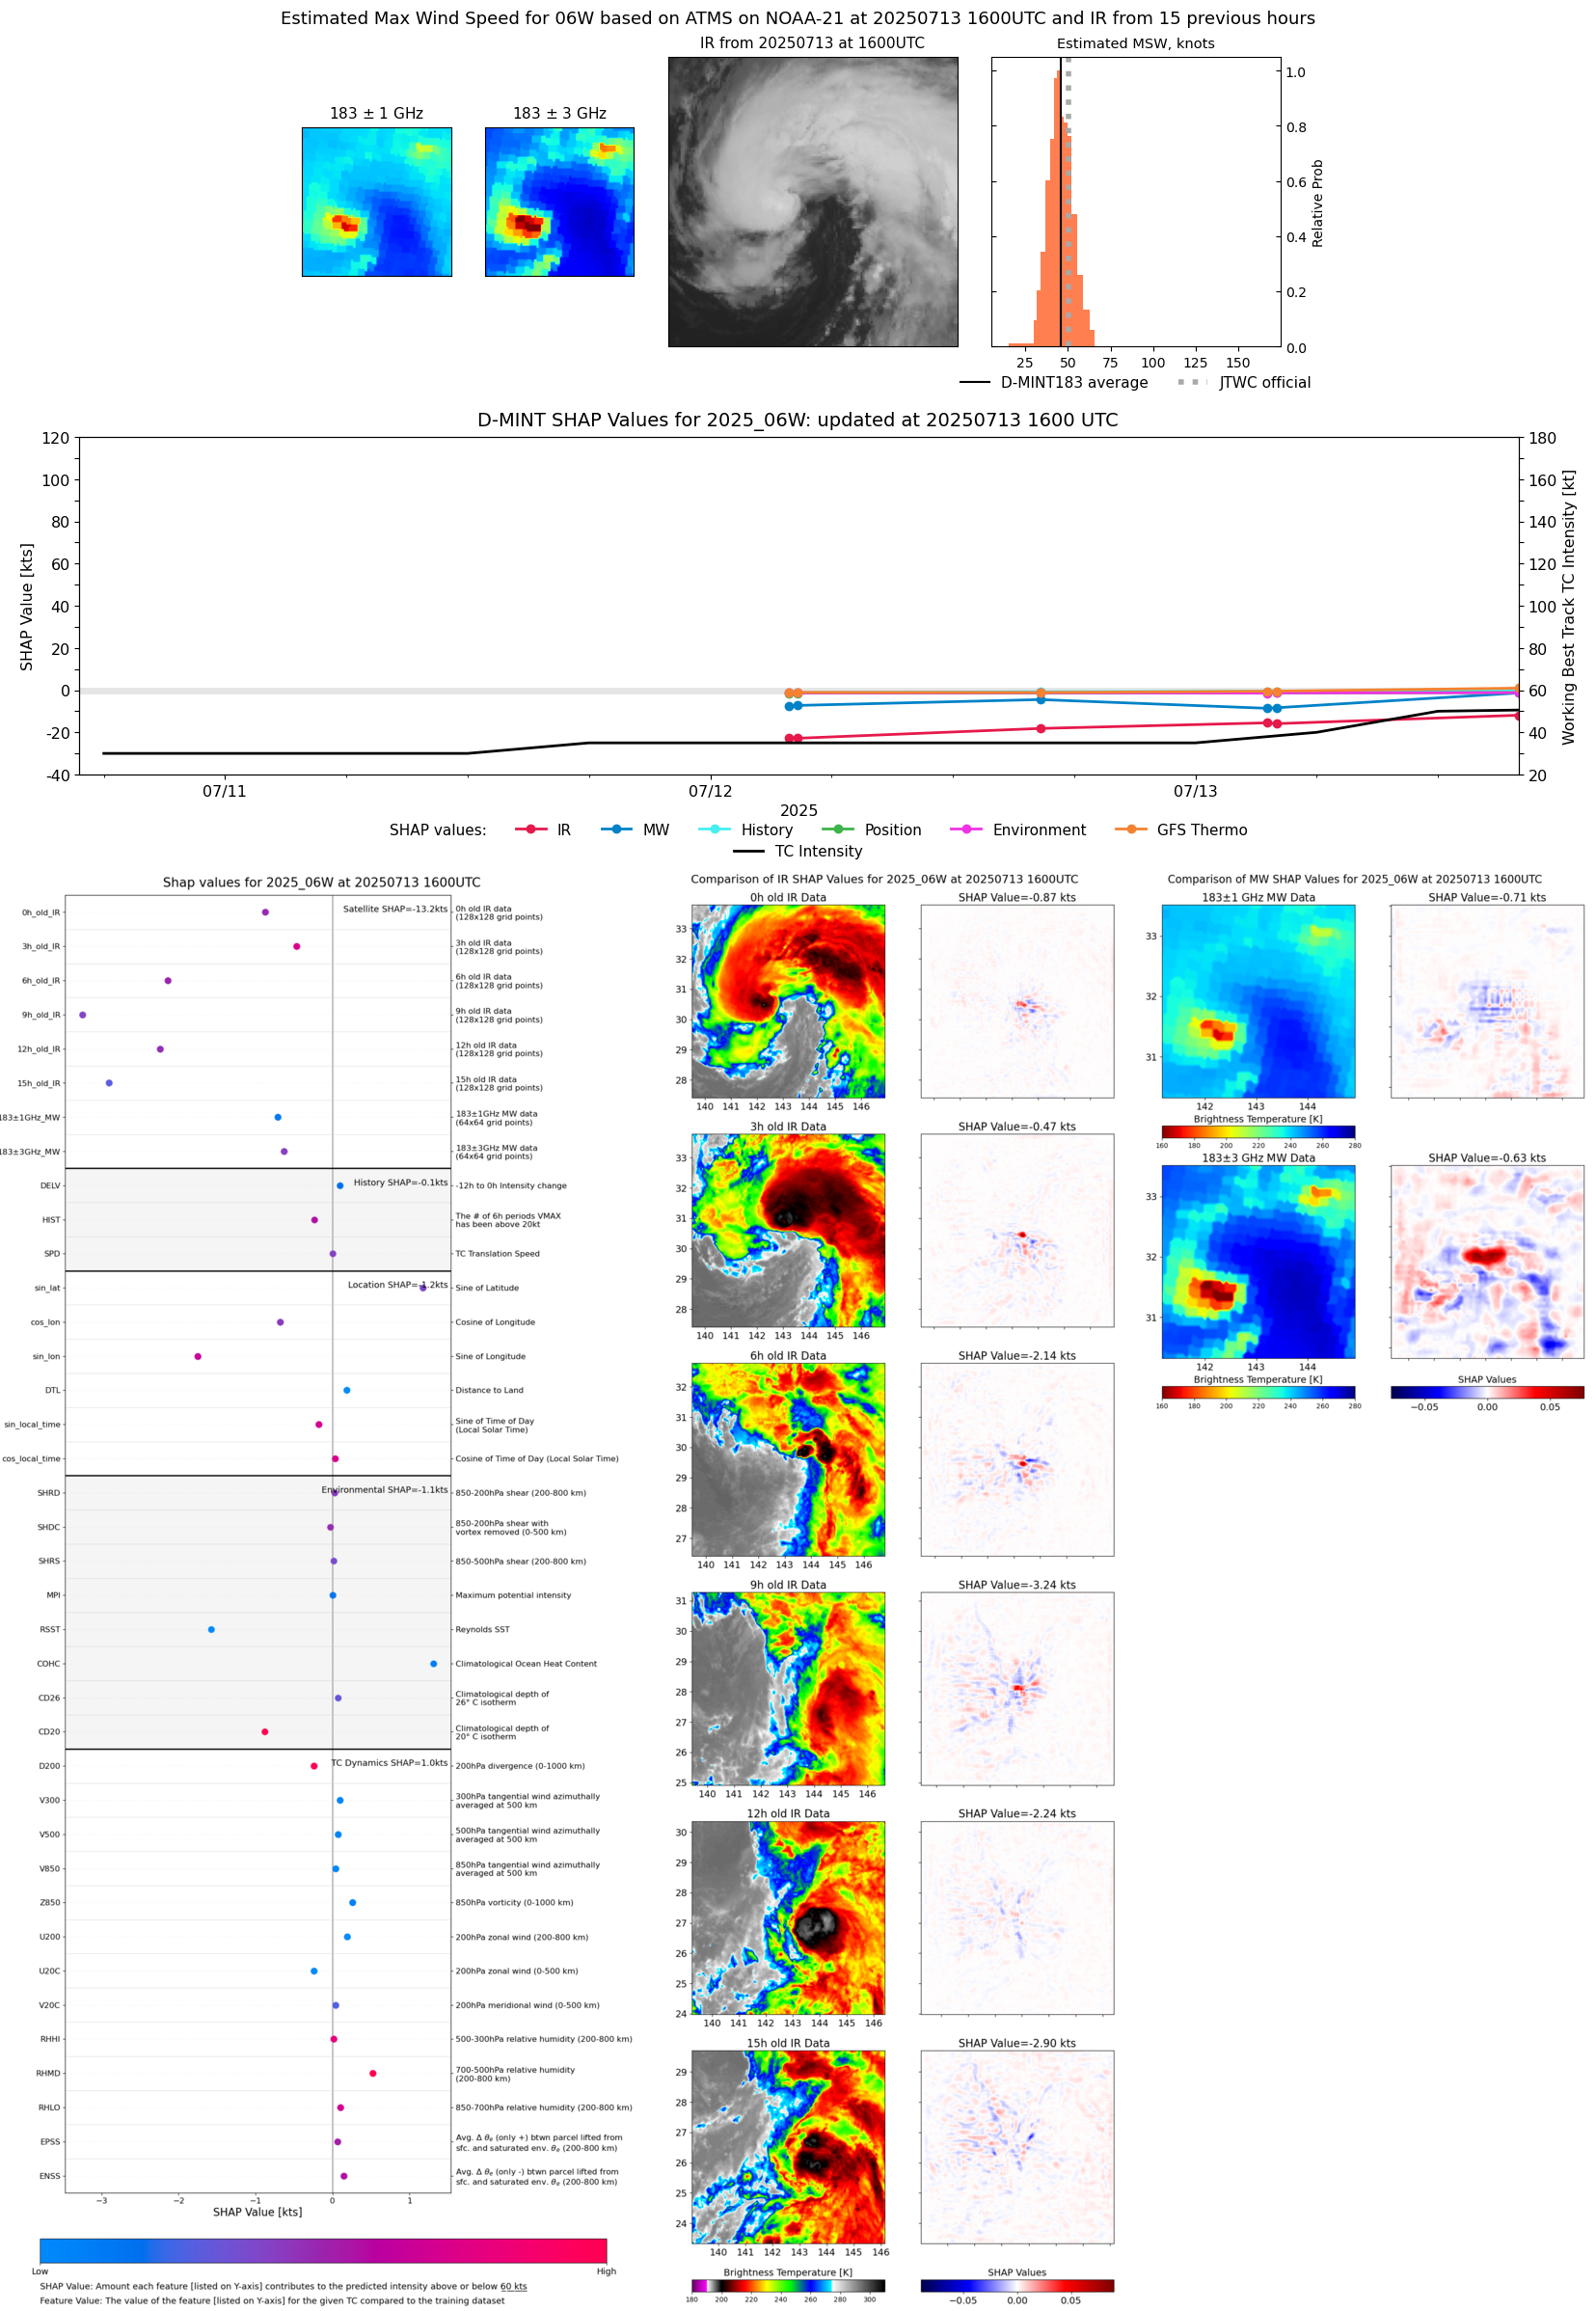 |
| 20250713 | 1559 UTC | ATMS-N21 | 987 hPa | 45 kts | 40 kts | 50 kts | 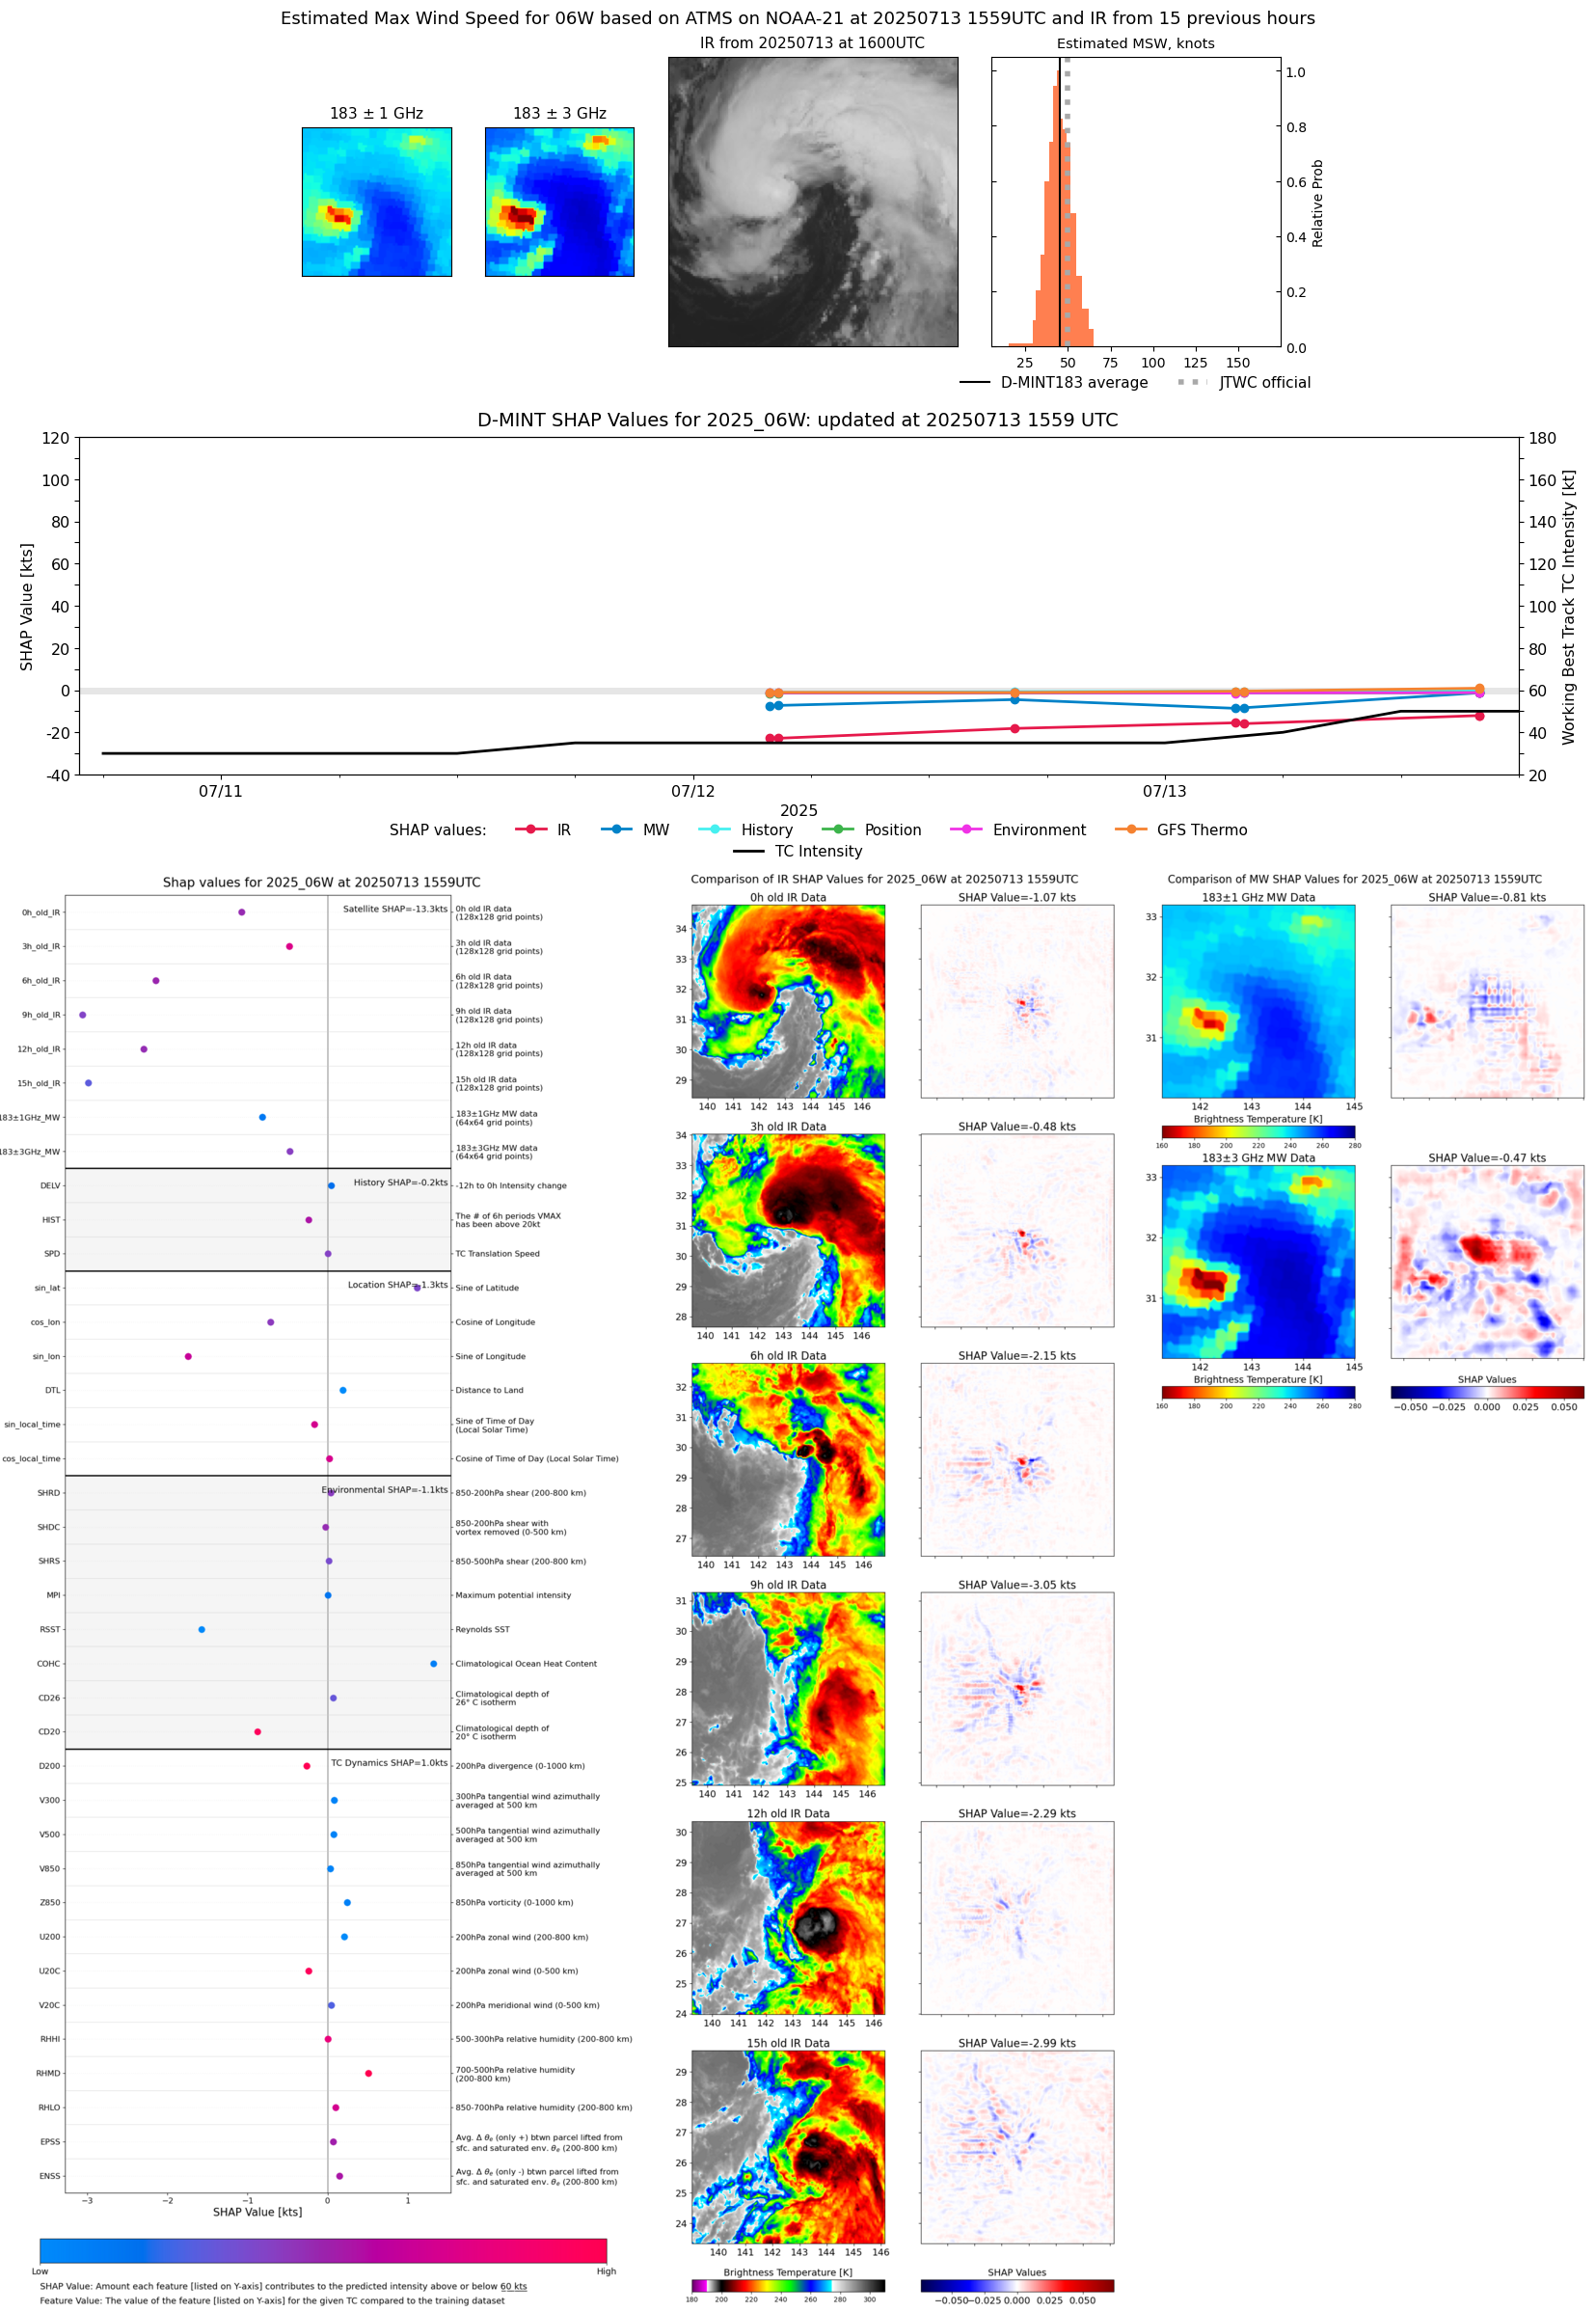 |
| 20250713 | 1528 UTC | TROPICS03 | 990 hPa | 41 kts | 37 kts | 46 kts |  |
| 20250713 | 1350 UTC | TROPICS03 | 991 hPa | 43 kts | 39 kts | 48 kts | 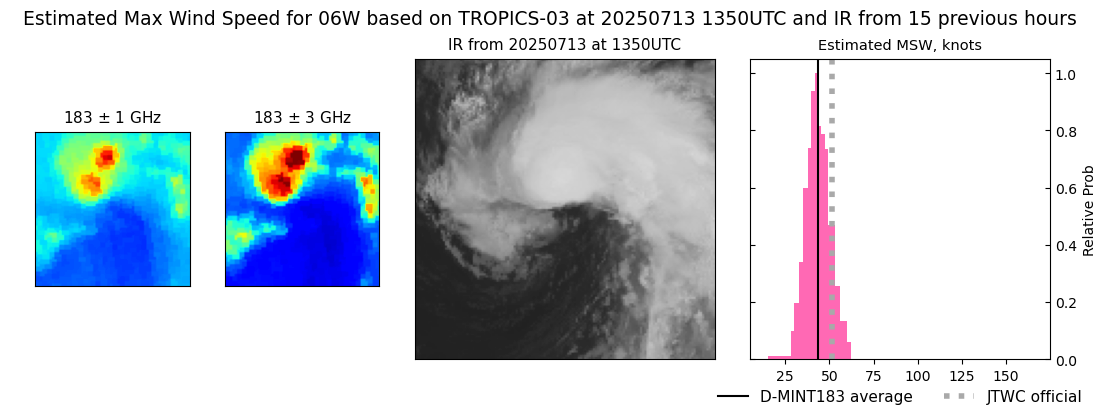 |
| 20250713 | 0608 UTC | GMI | 998 hPa | 35 kts | 31 kts | 39 kts | 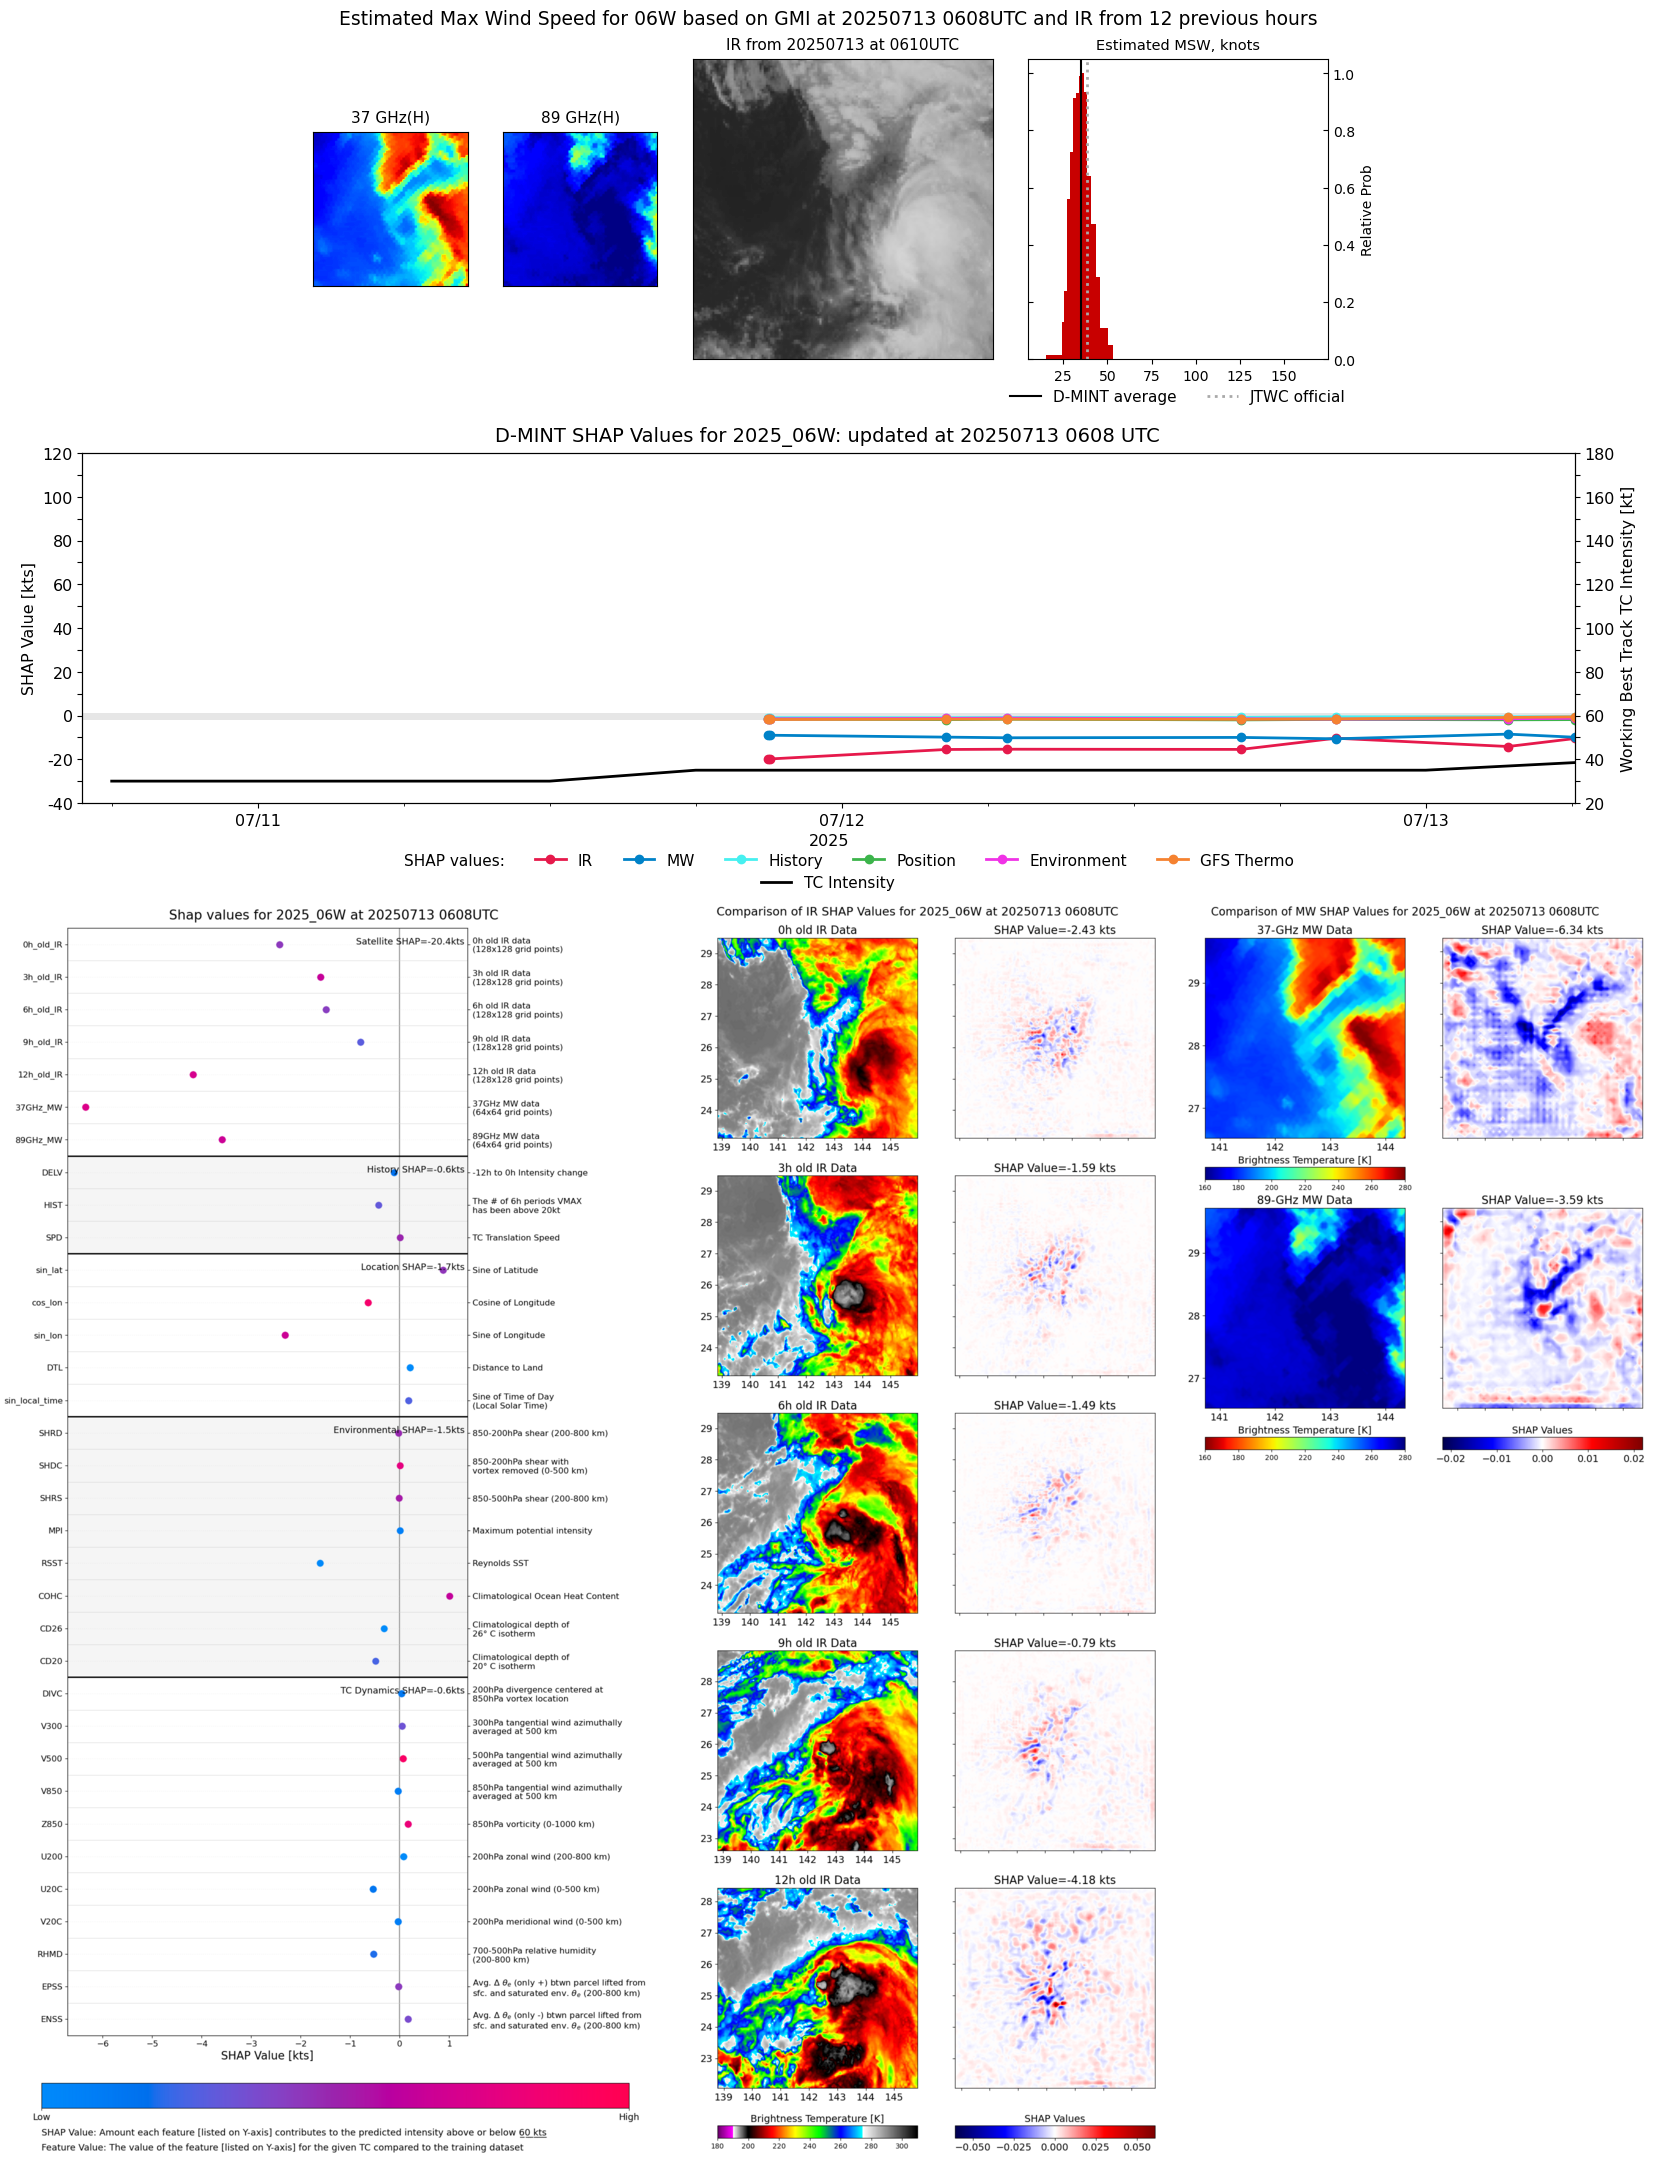 |
| 20250713 | 0401 UTC | ATMS-NPP | 998 hPa | 32 kts | 29 kts | 36 kts | 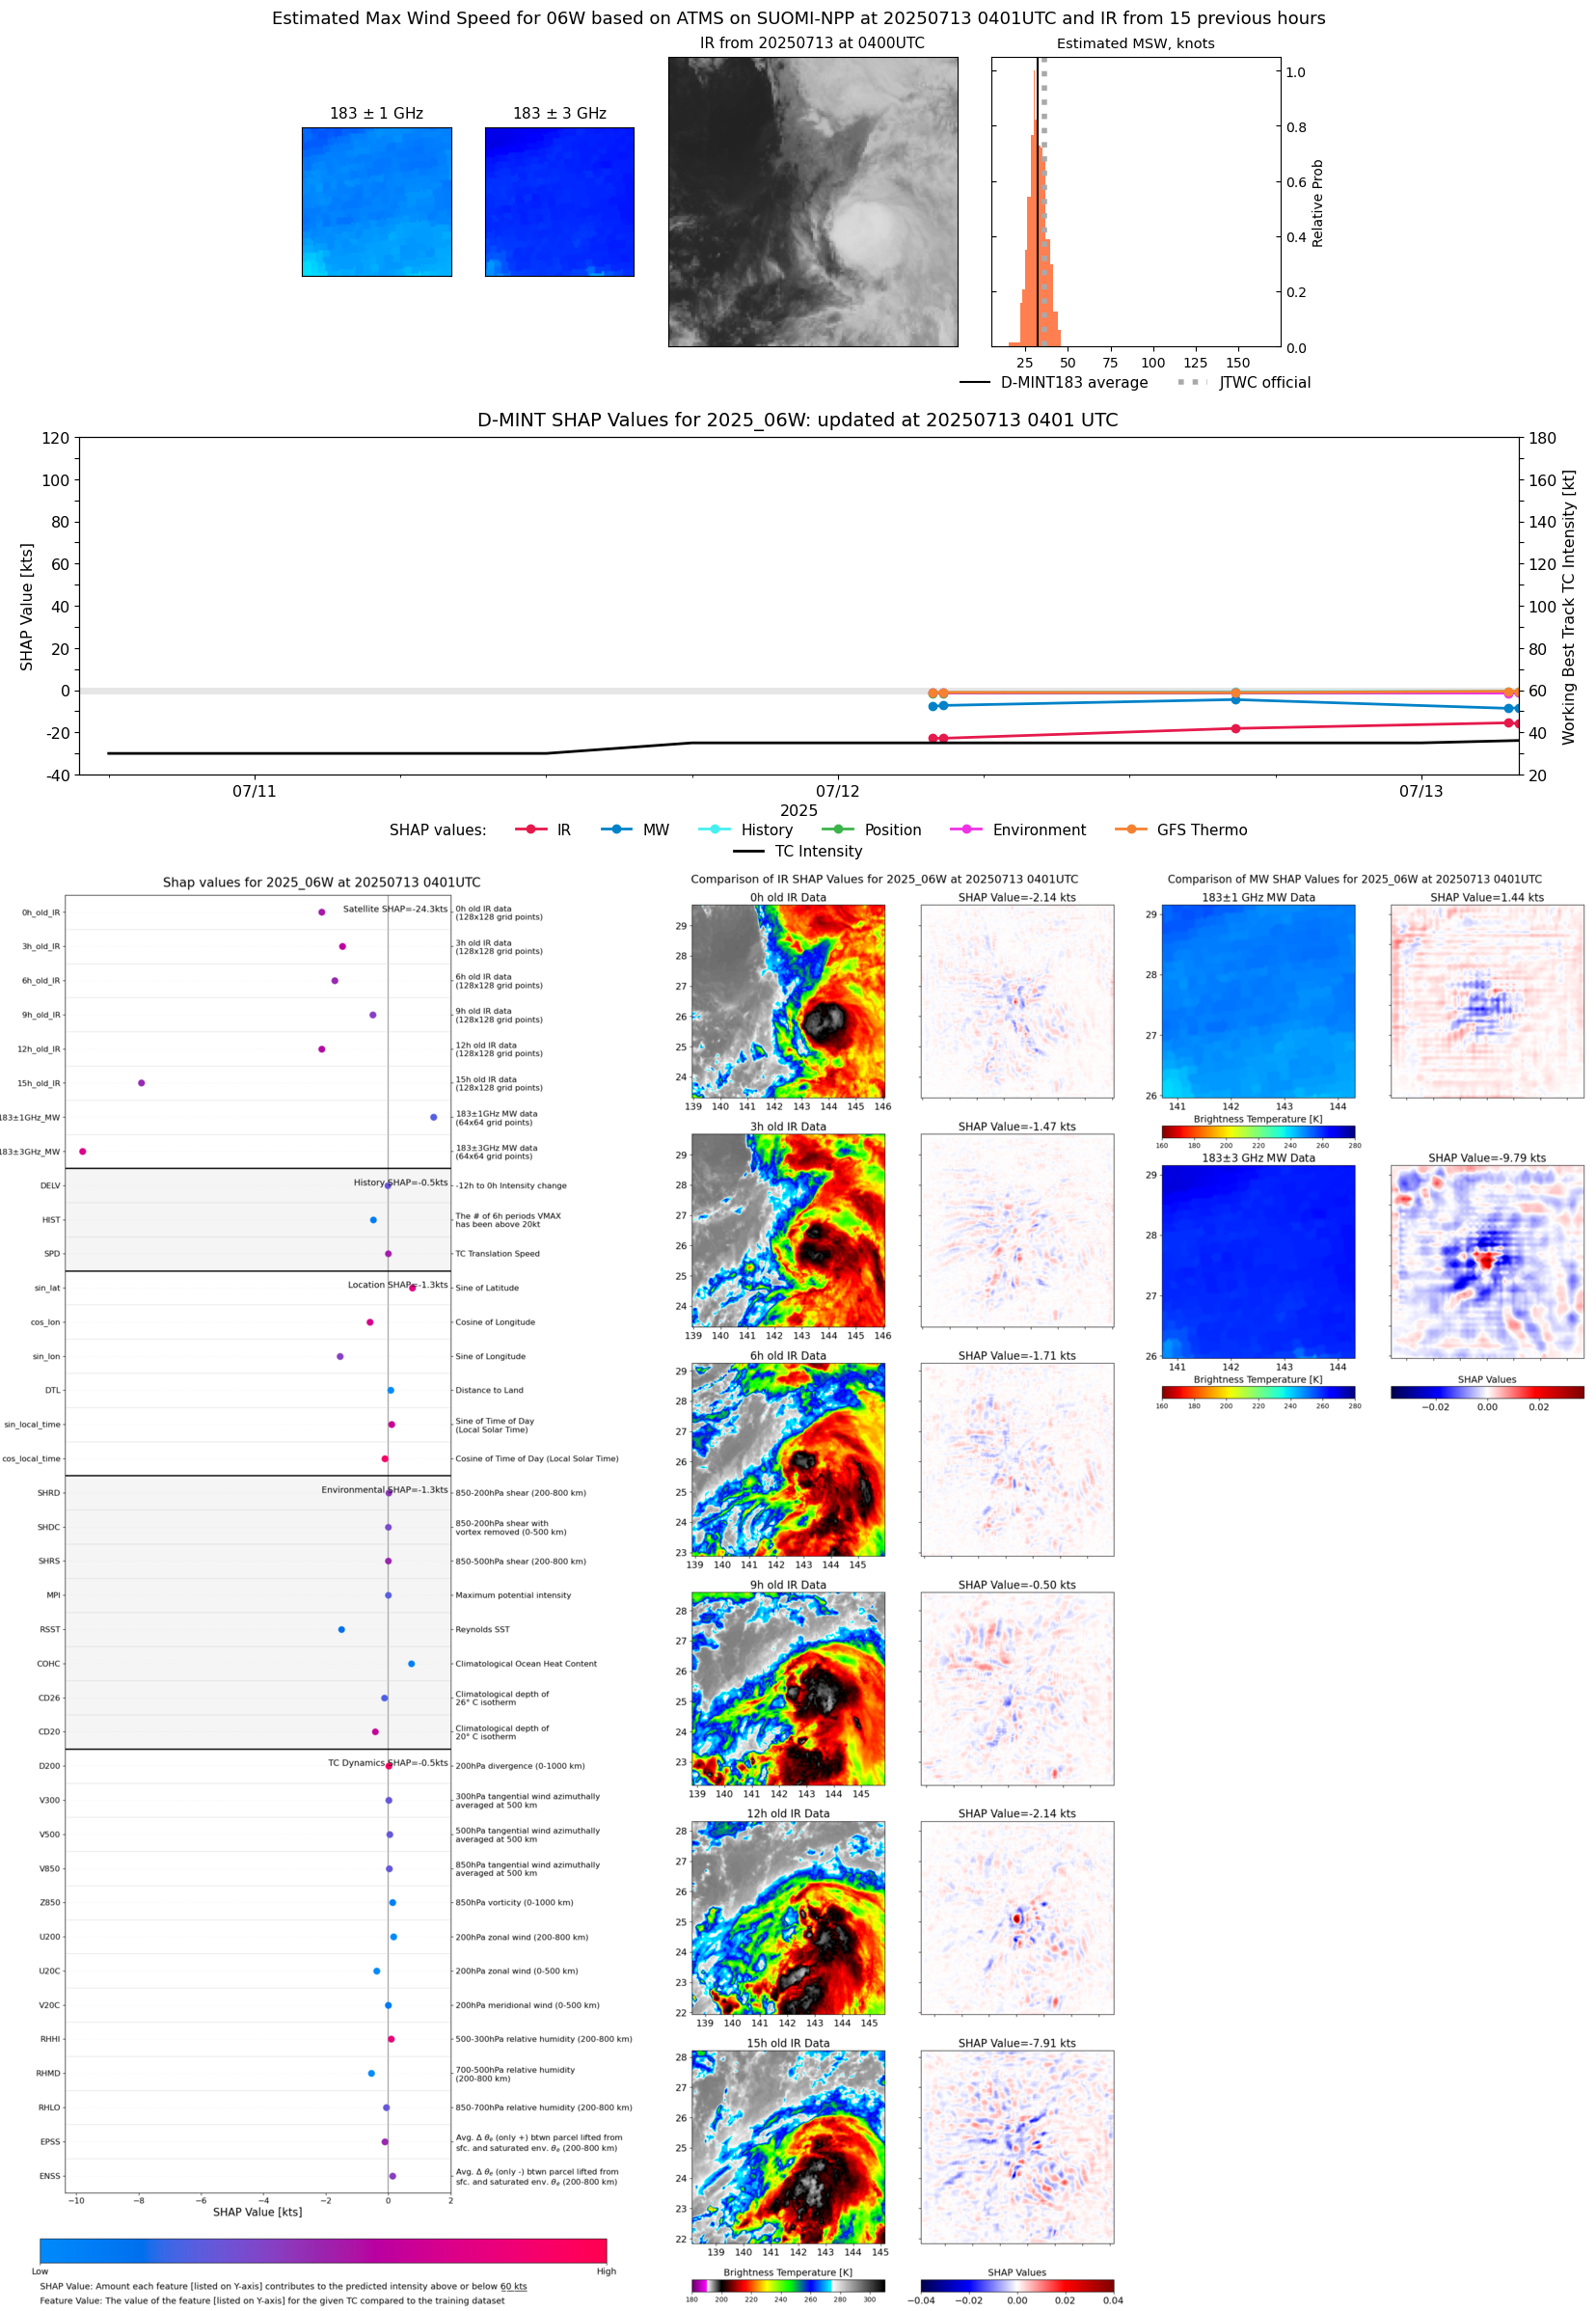 |
| 20250713 | 0334 UTC | ATMS-N21 | 998 hPa | 32 kts | 29 kts | 36 kts |  |
| 20250713 | 0323 UTC | AMSR2 | 998 hPa | 32 kts | 29 kts | 36 kts | 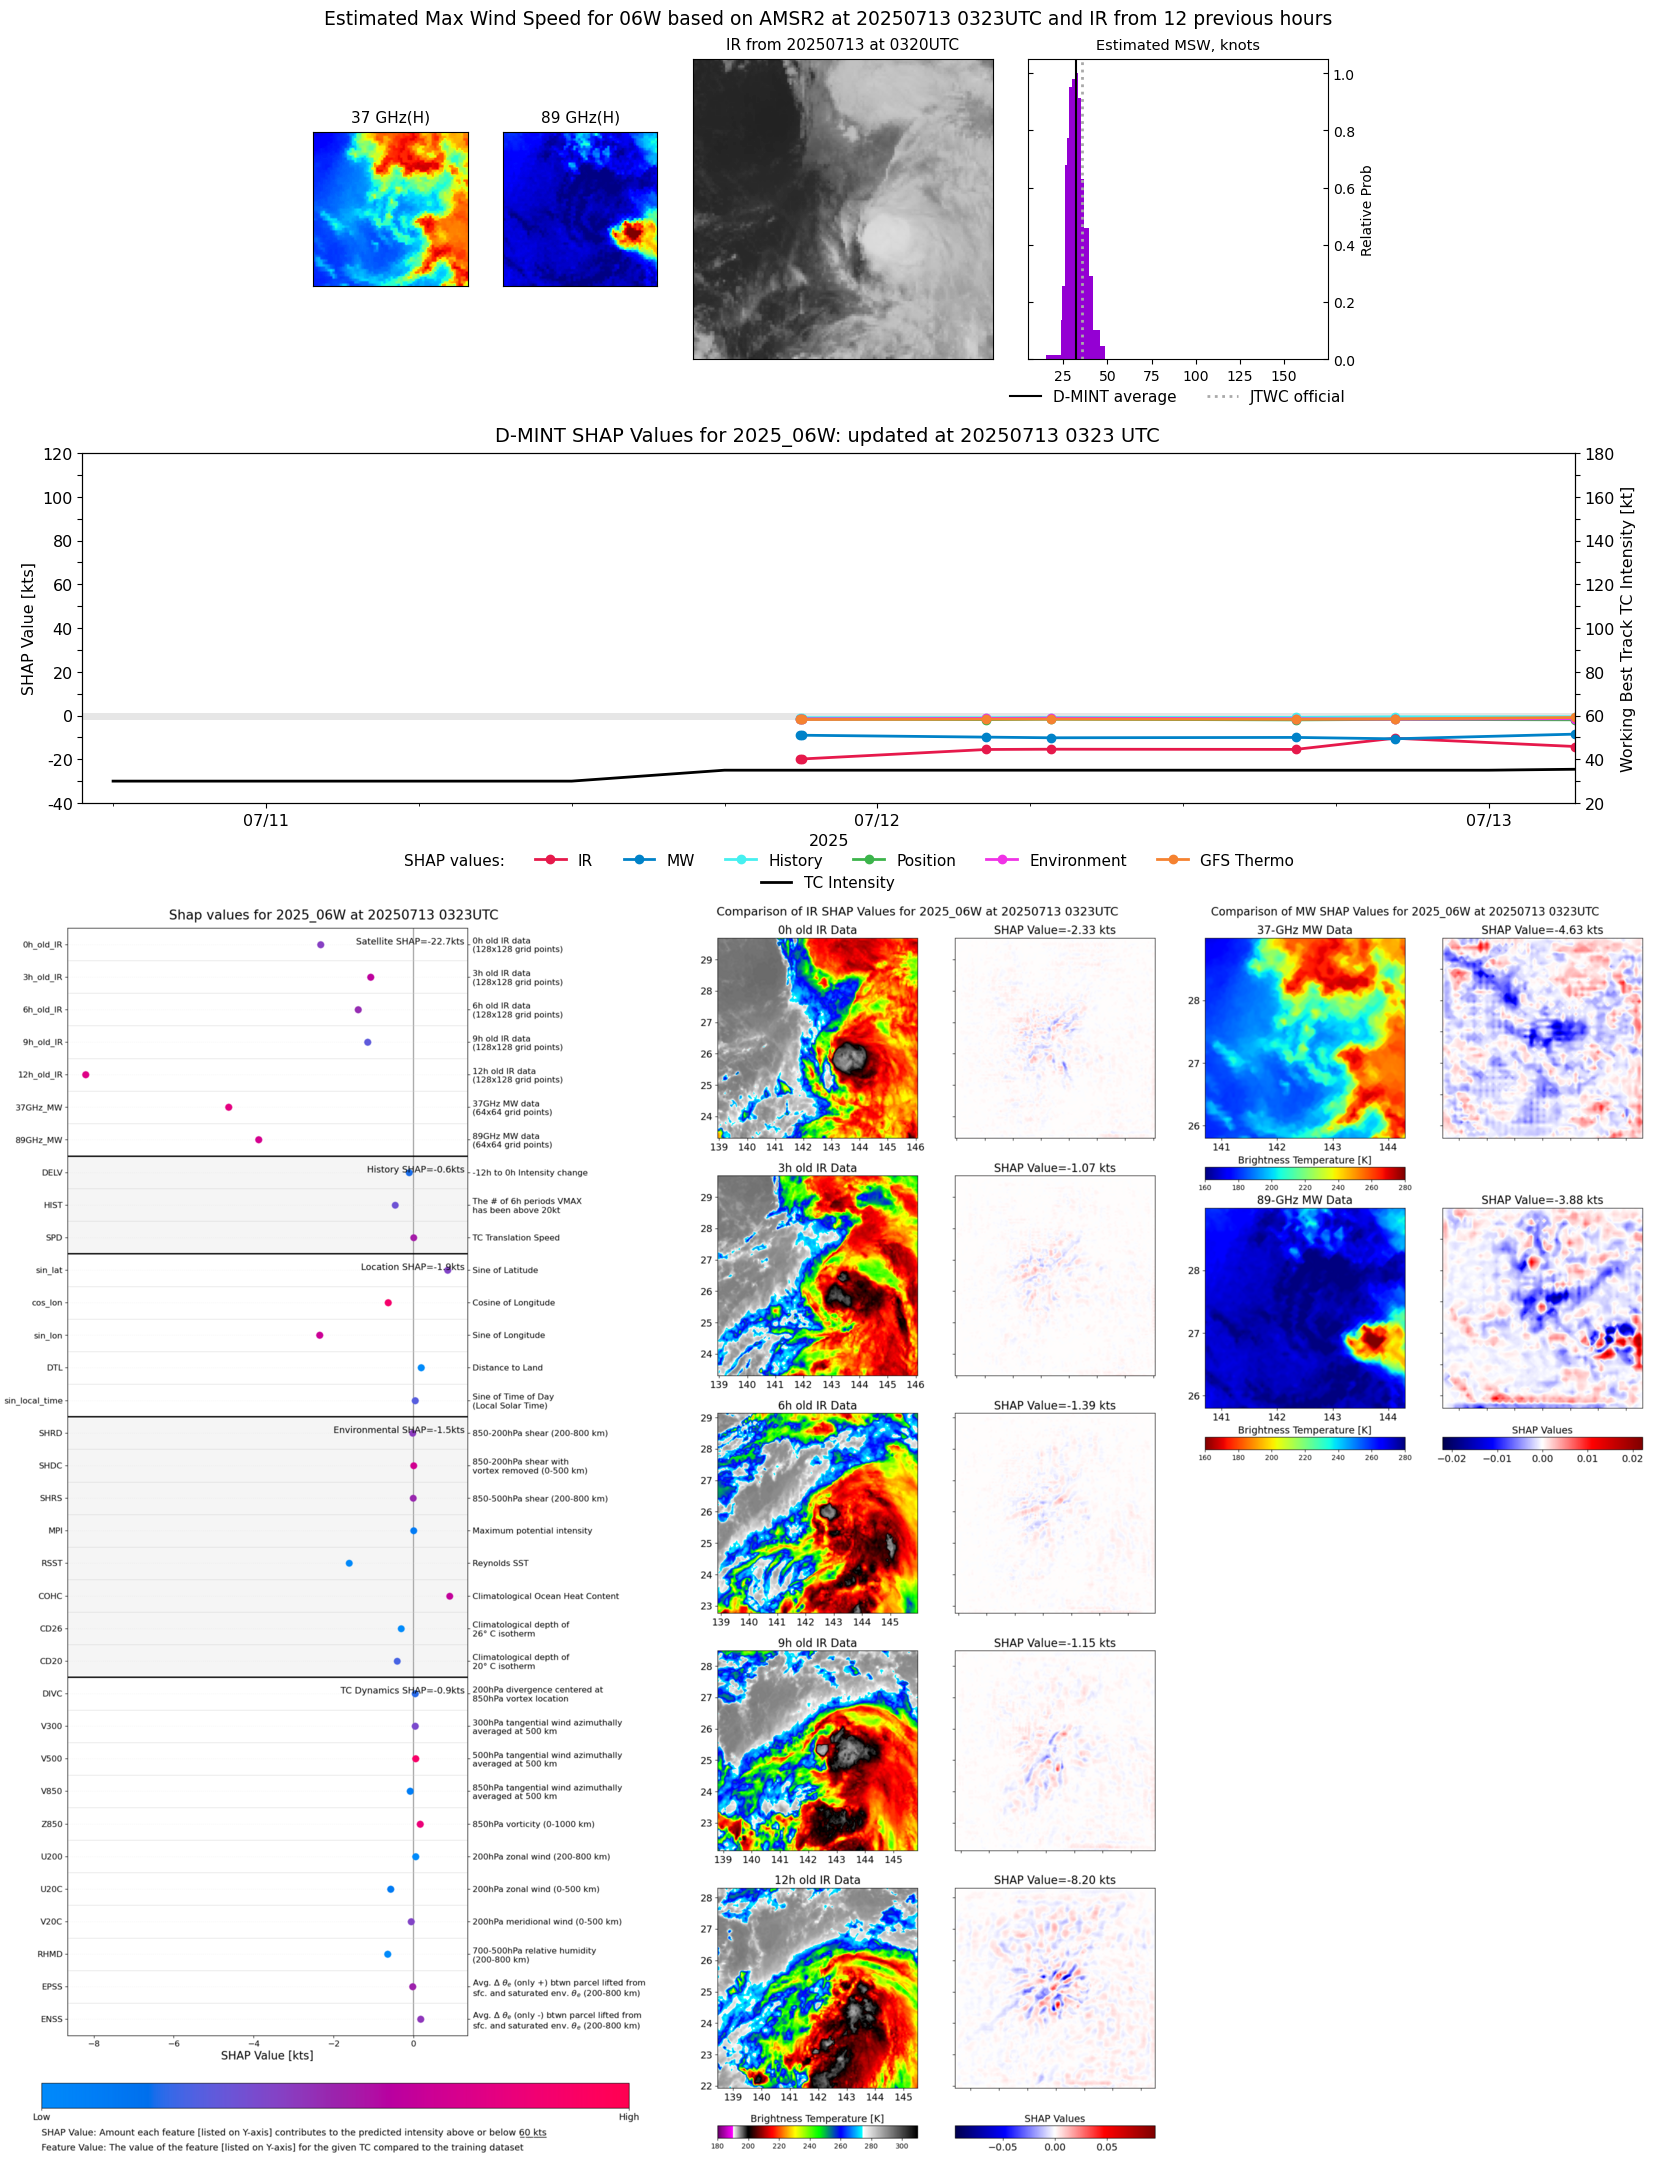 |
| 20250712 | 2018 UTC | GMI | 999 hPa | 33 kts | 30 kts | 37 kts | 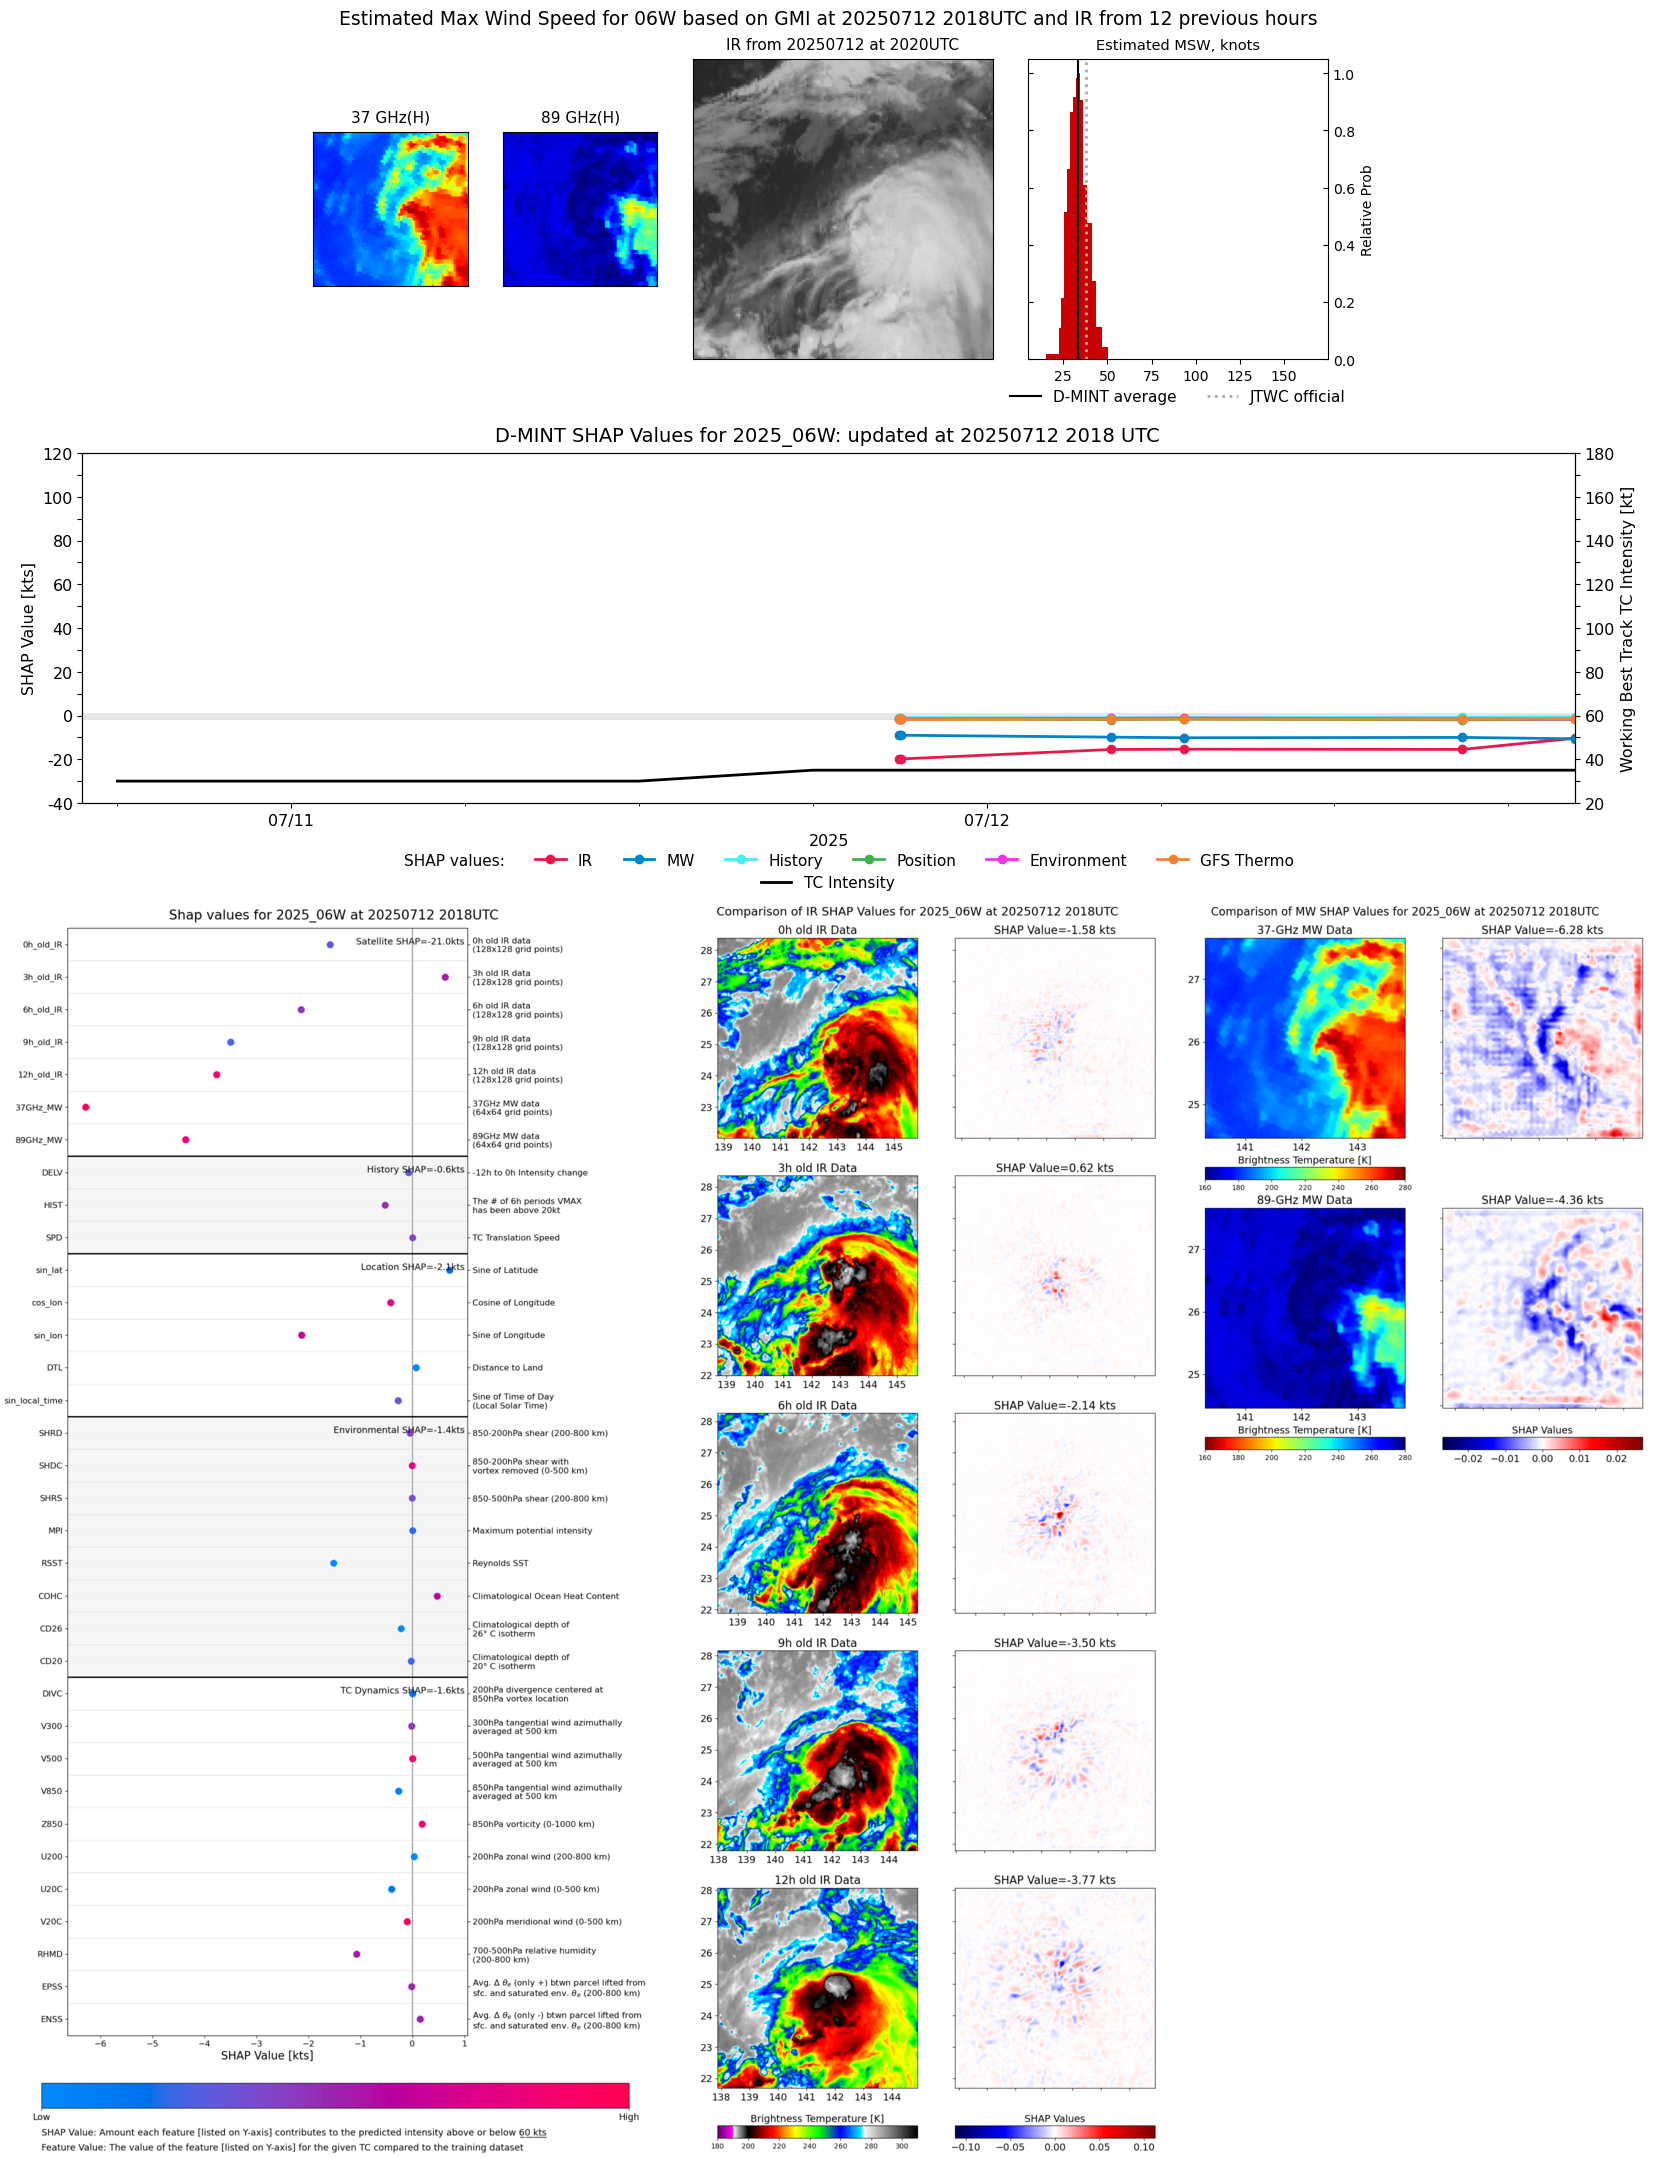 |
| 20250712 | 1625 UTC | AMSR2 | 1000 hPa | 28 kts | 26 kts | 32 kts | 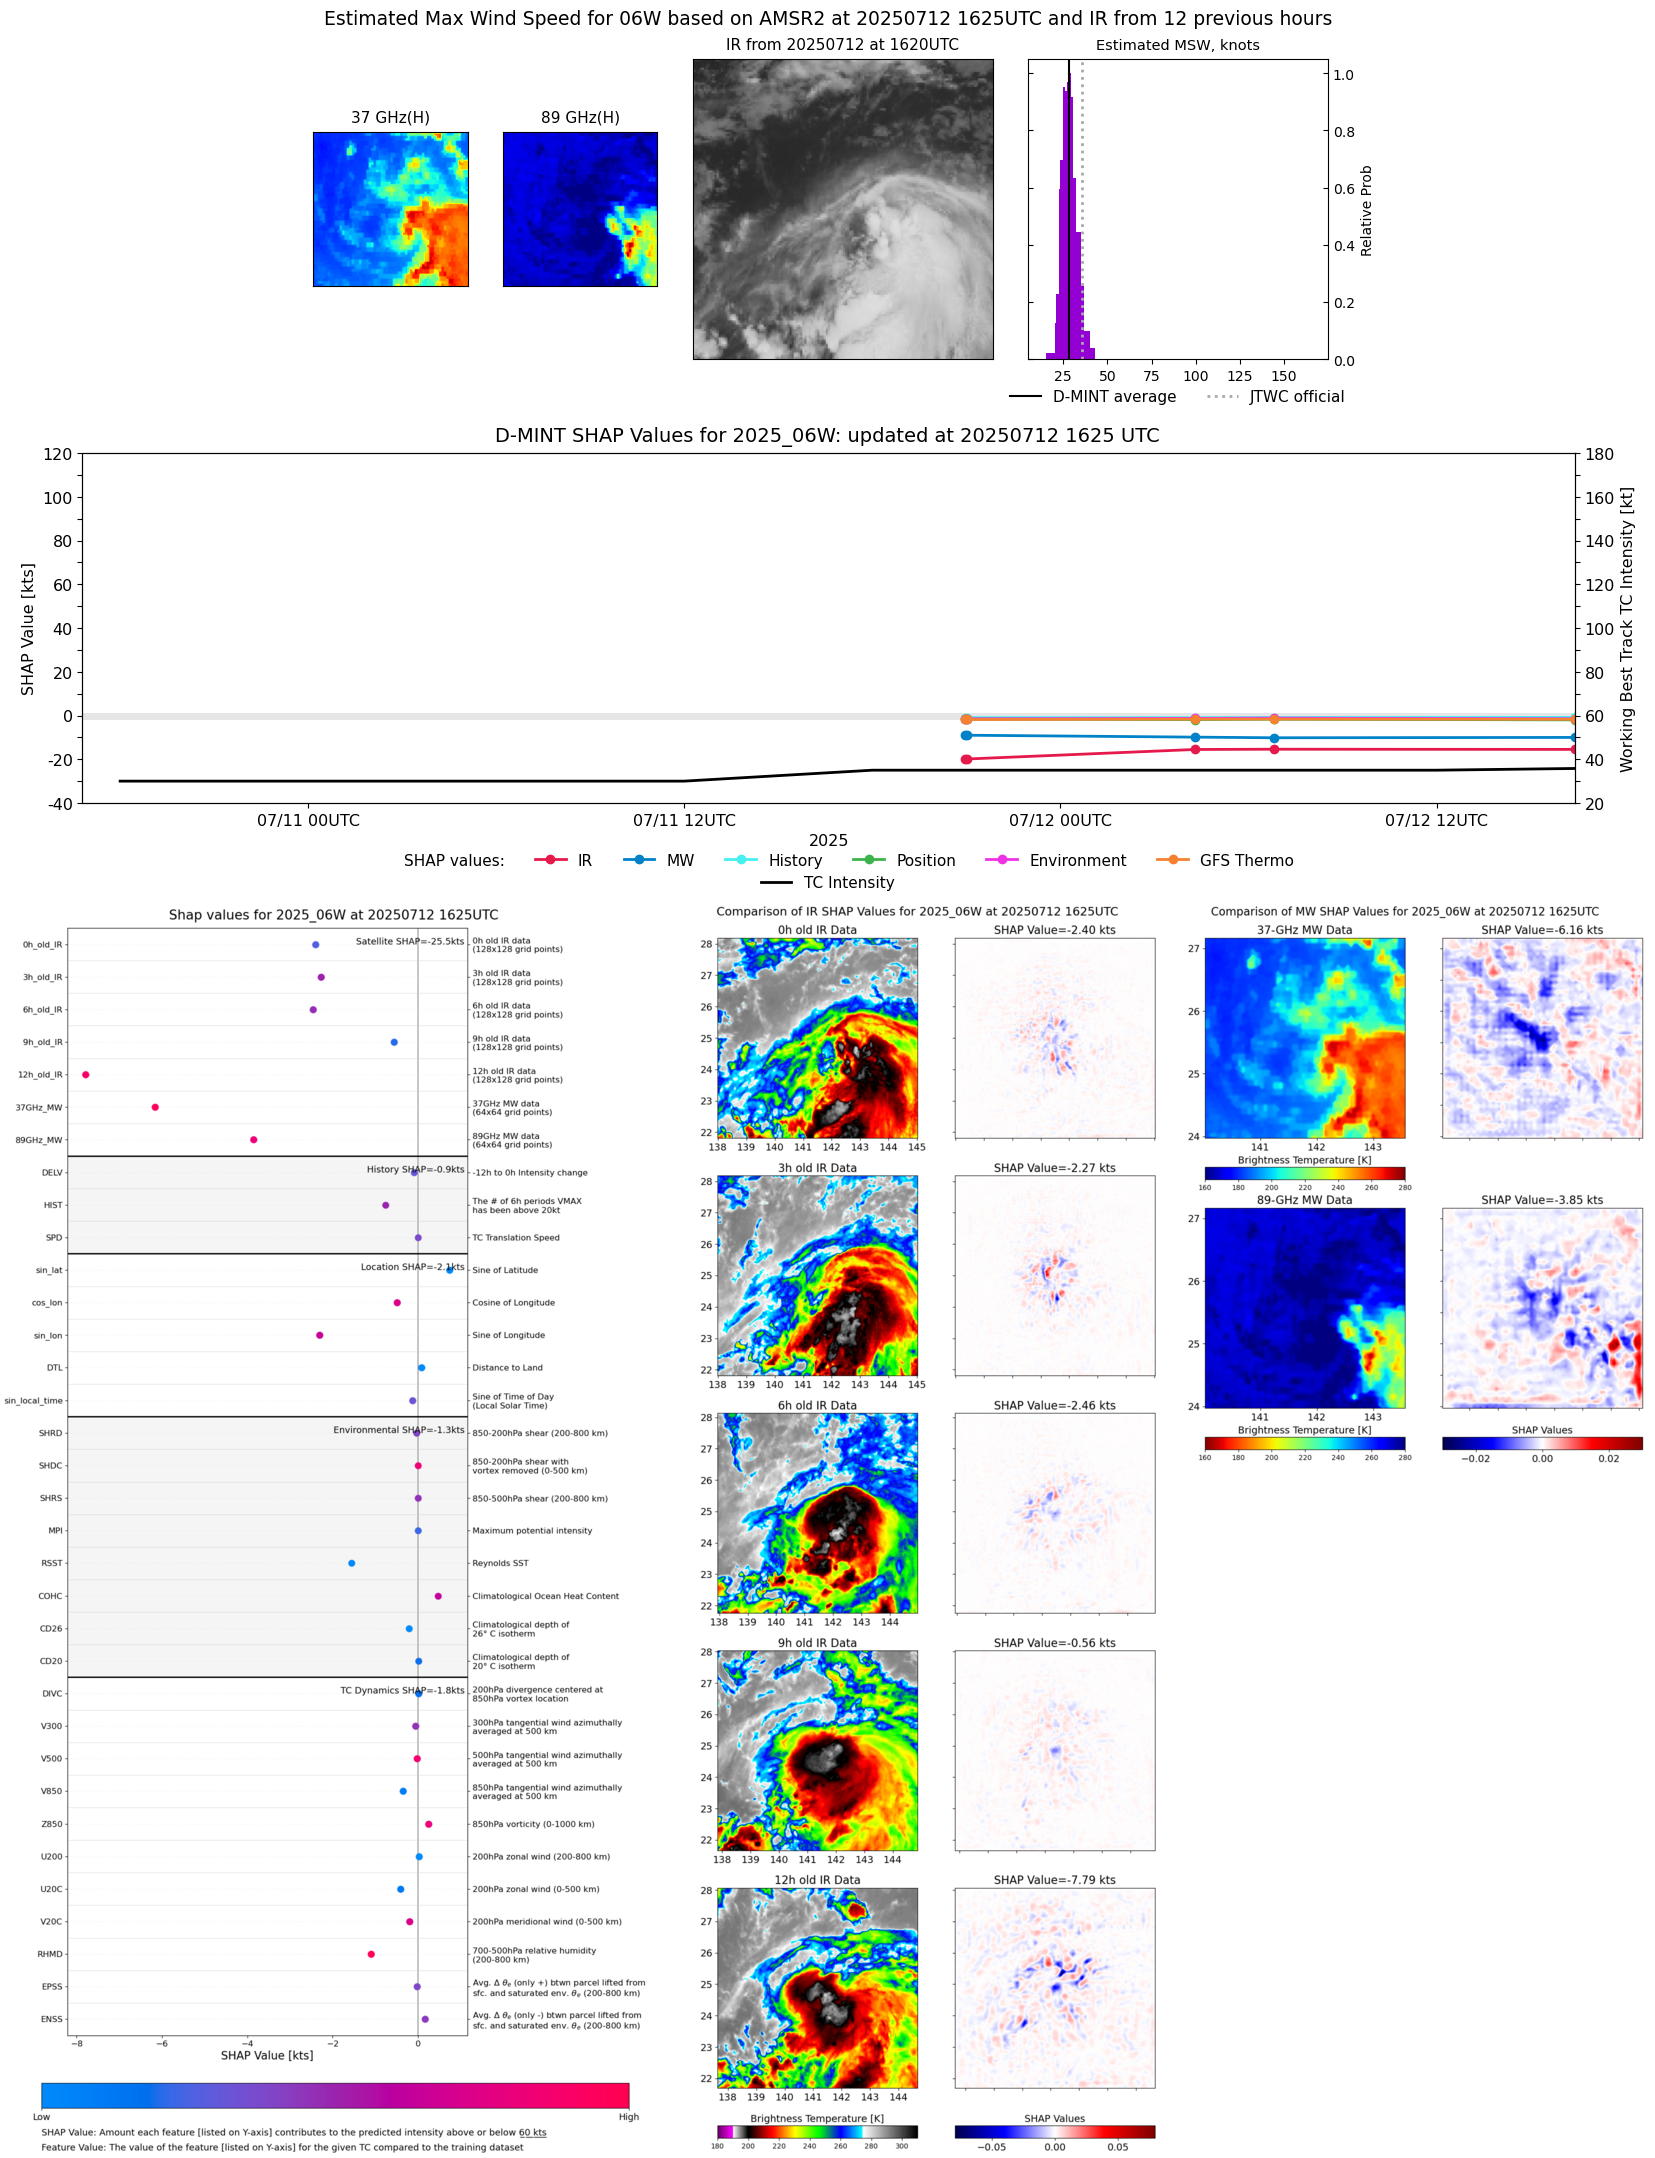 |
| 20250712 | 1620 UTC | ATMS-N21 | 1000 hPa | 33 kts | 30 kts | 37 kts |  |
| 20250712 | 1305 UTC | TROPICS03 | 1000 hPa | 31 kts | 28 kts | 35 kts | 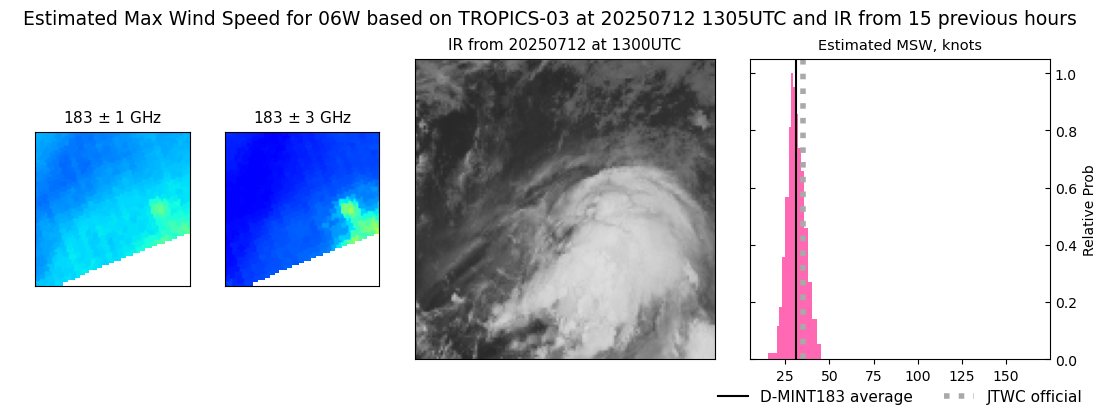 |
| 20250712 | 0648 UTC | GMI | 1002 hPa | 29 kts | 26 kts | 32 kts |  |
| 20250712 | 0419 UTC | ATMS-NPP | 1002 hPa | 25 kts | 23 kts | 28 kts | 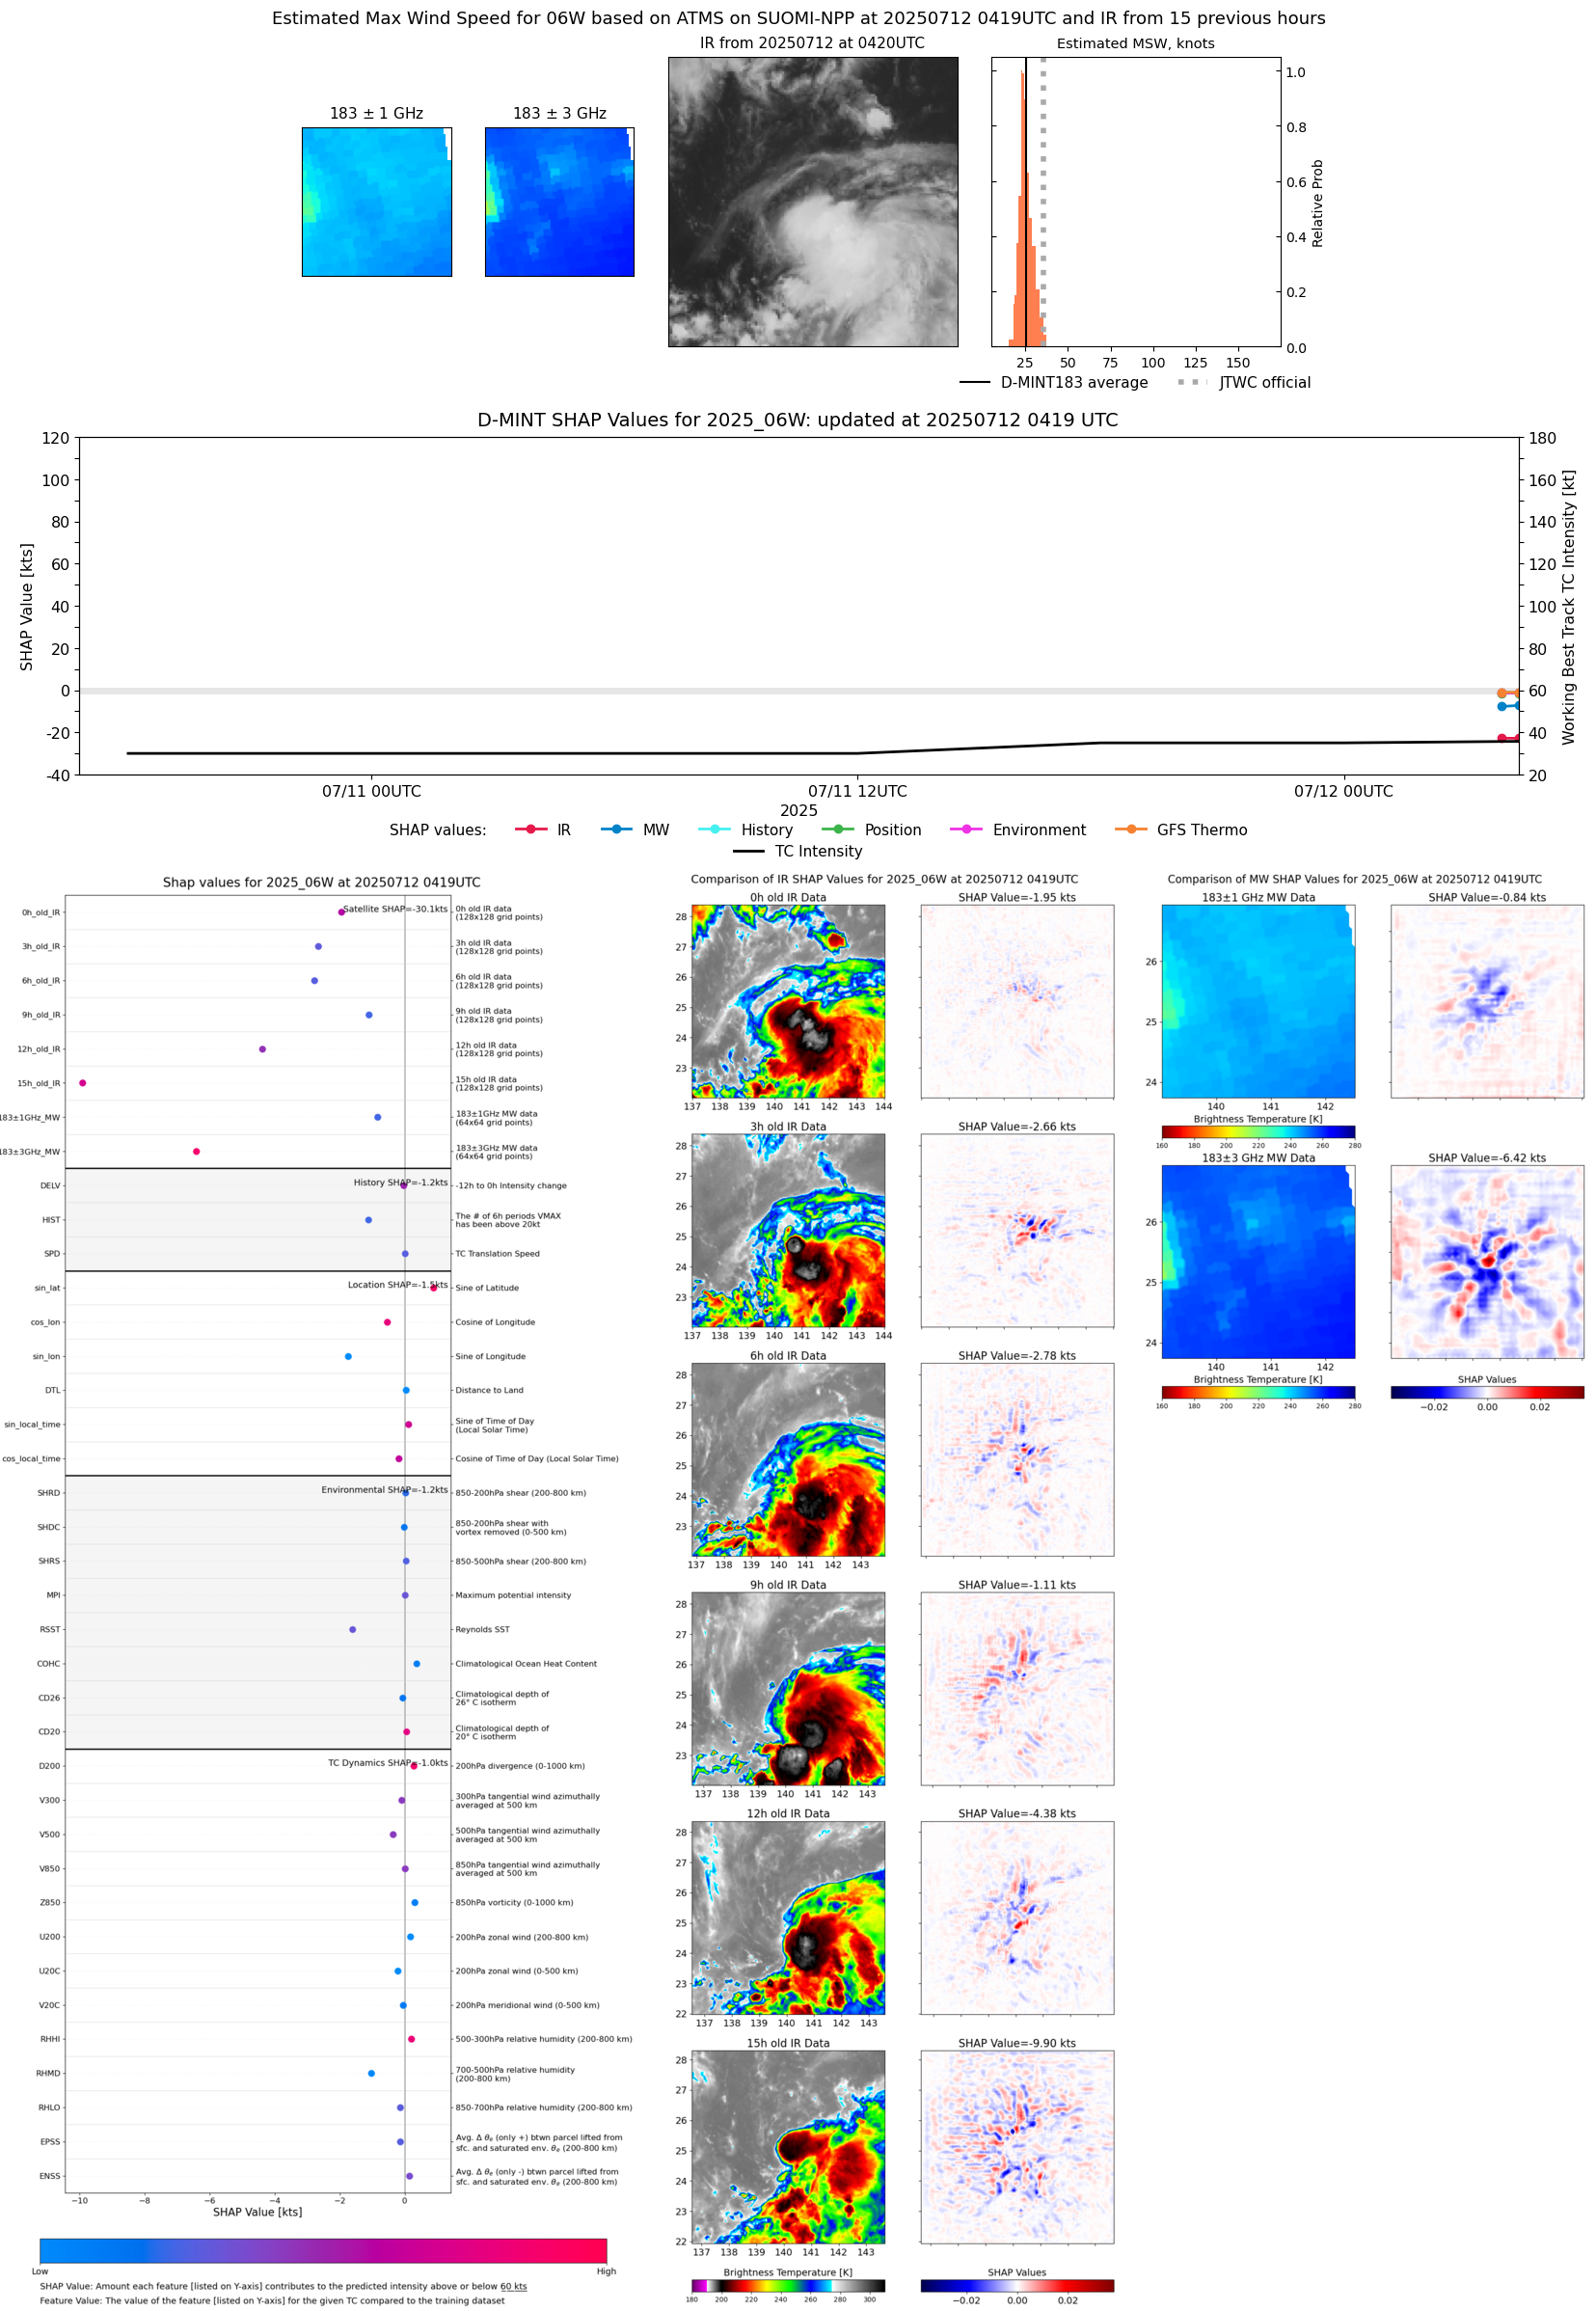 |
| 20250712 | 0417 UTC | AMSR2 | 1002 hPa | 29 kts | 26 kts | 32 kts | 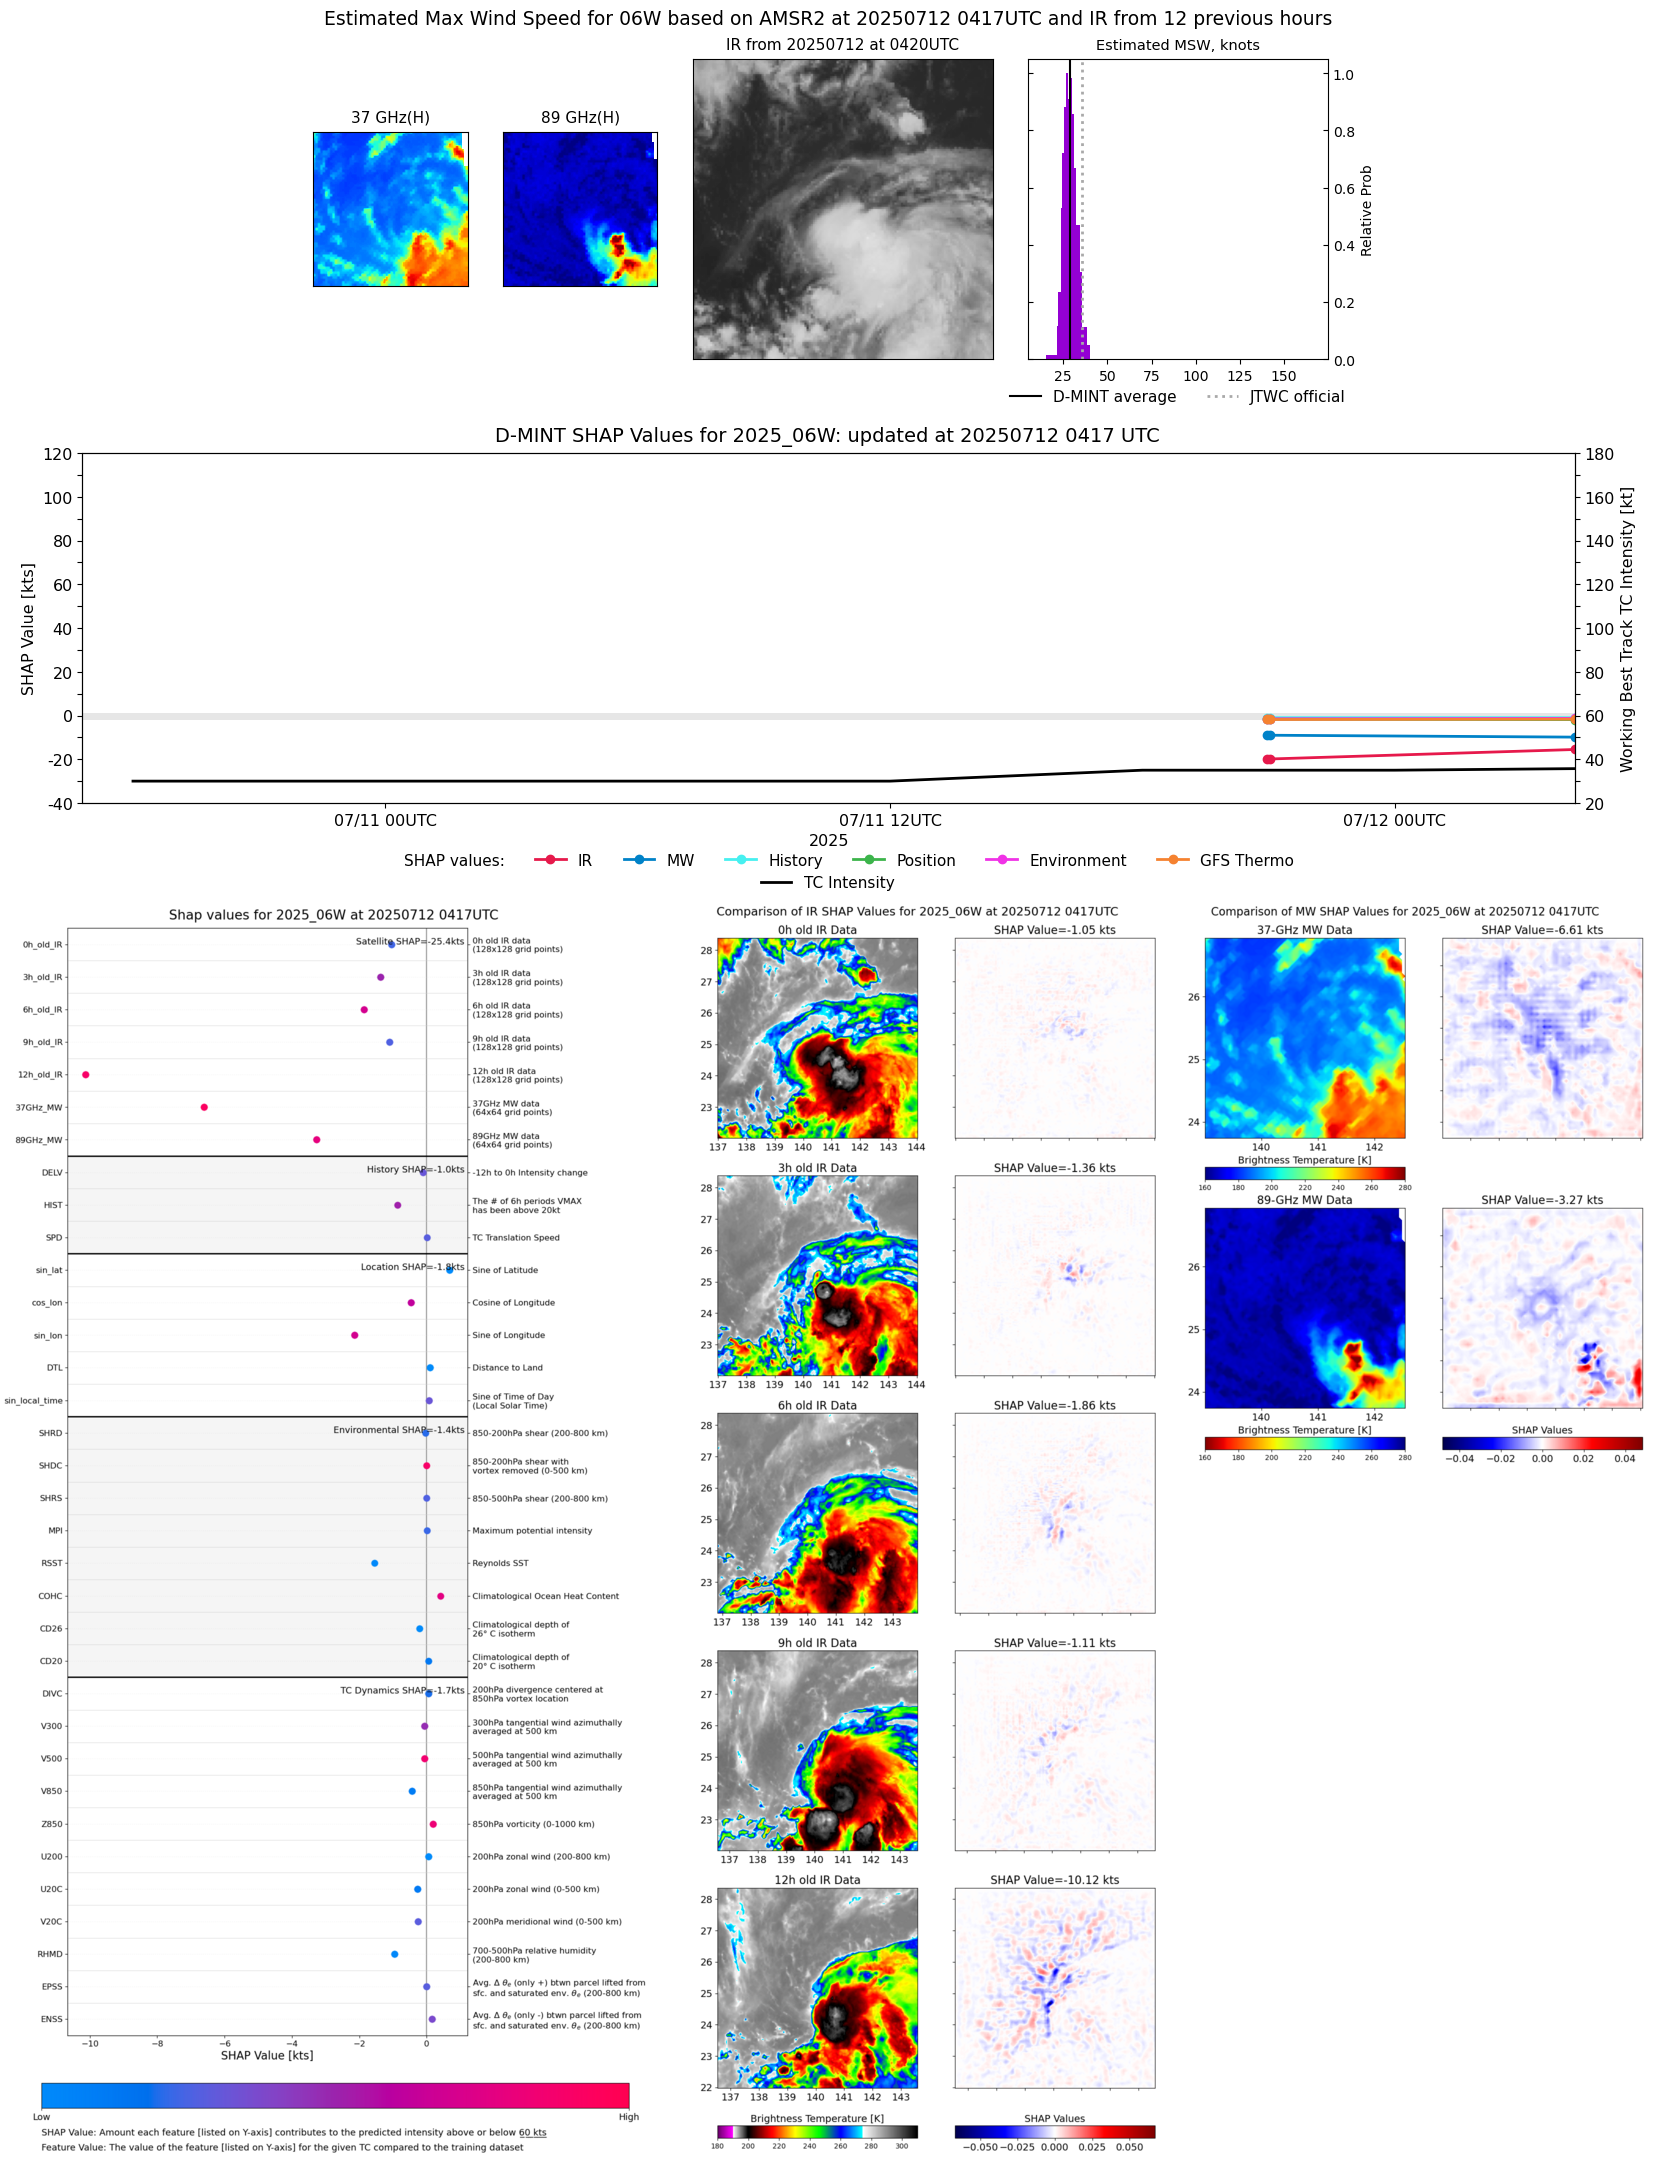 |
| 20250712 | 0353 UTC | ATMS-N21 | 1003 hPa | 25 kts | 23 kts | 27 kts | 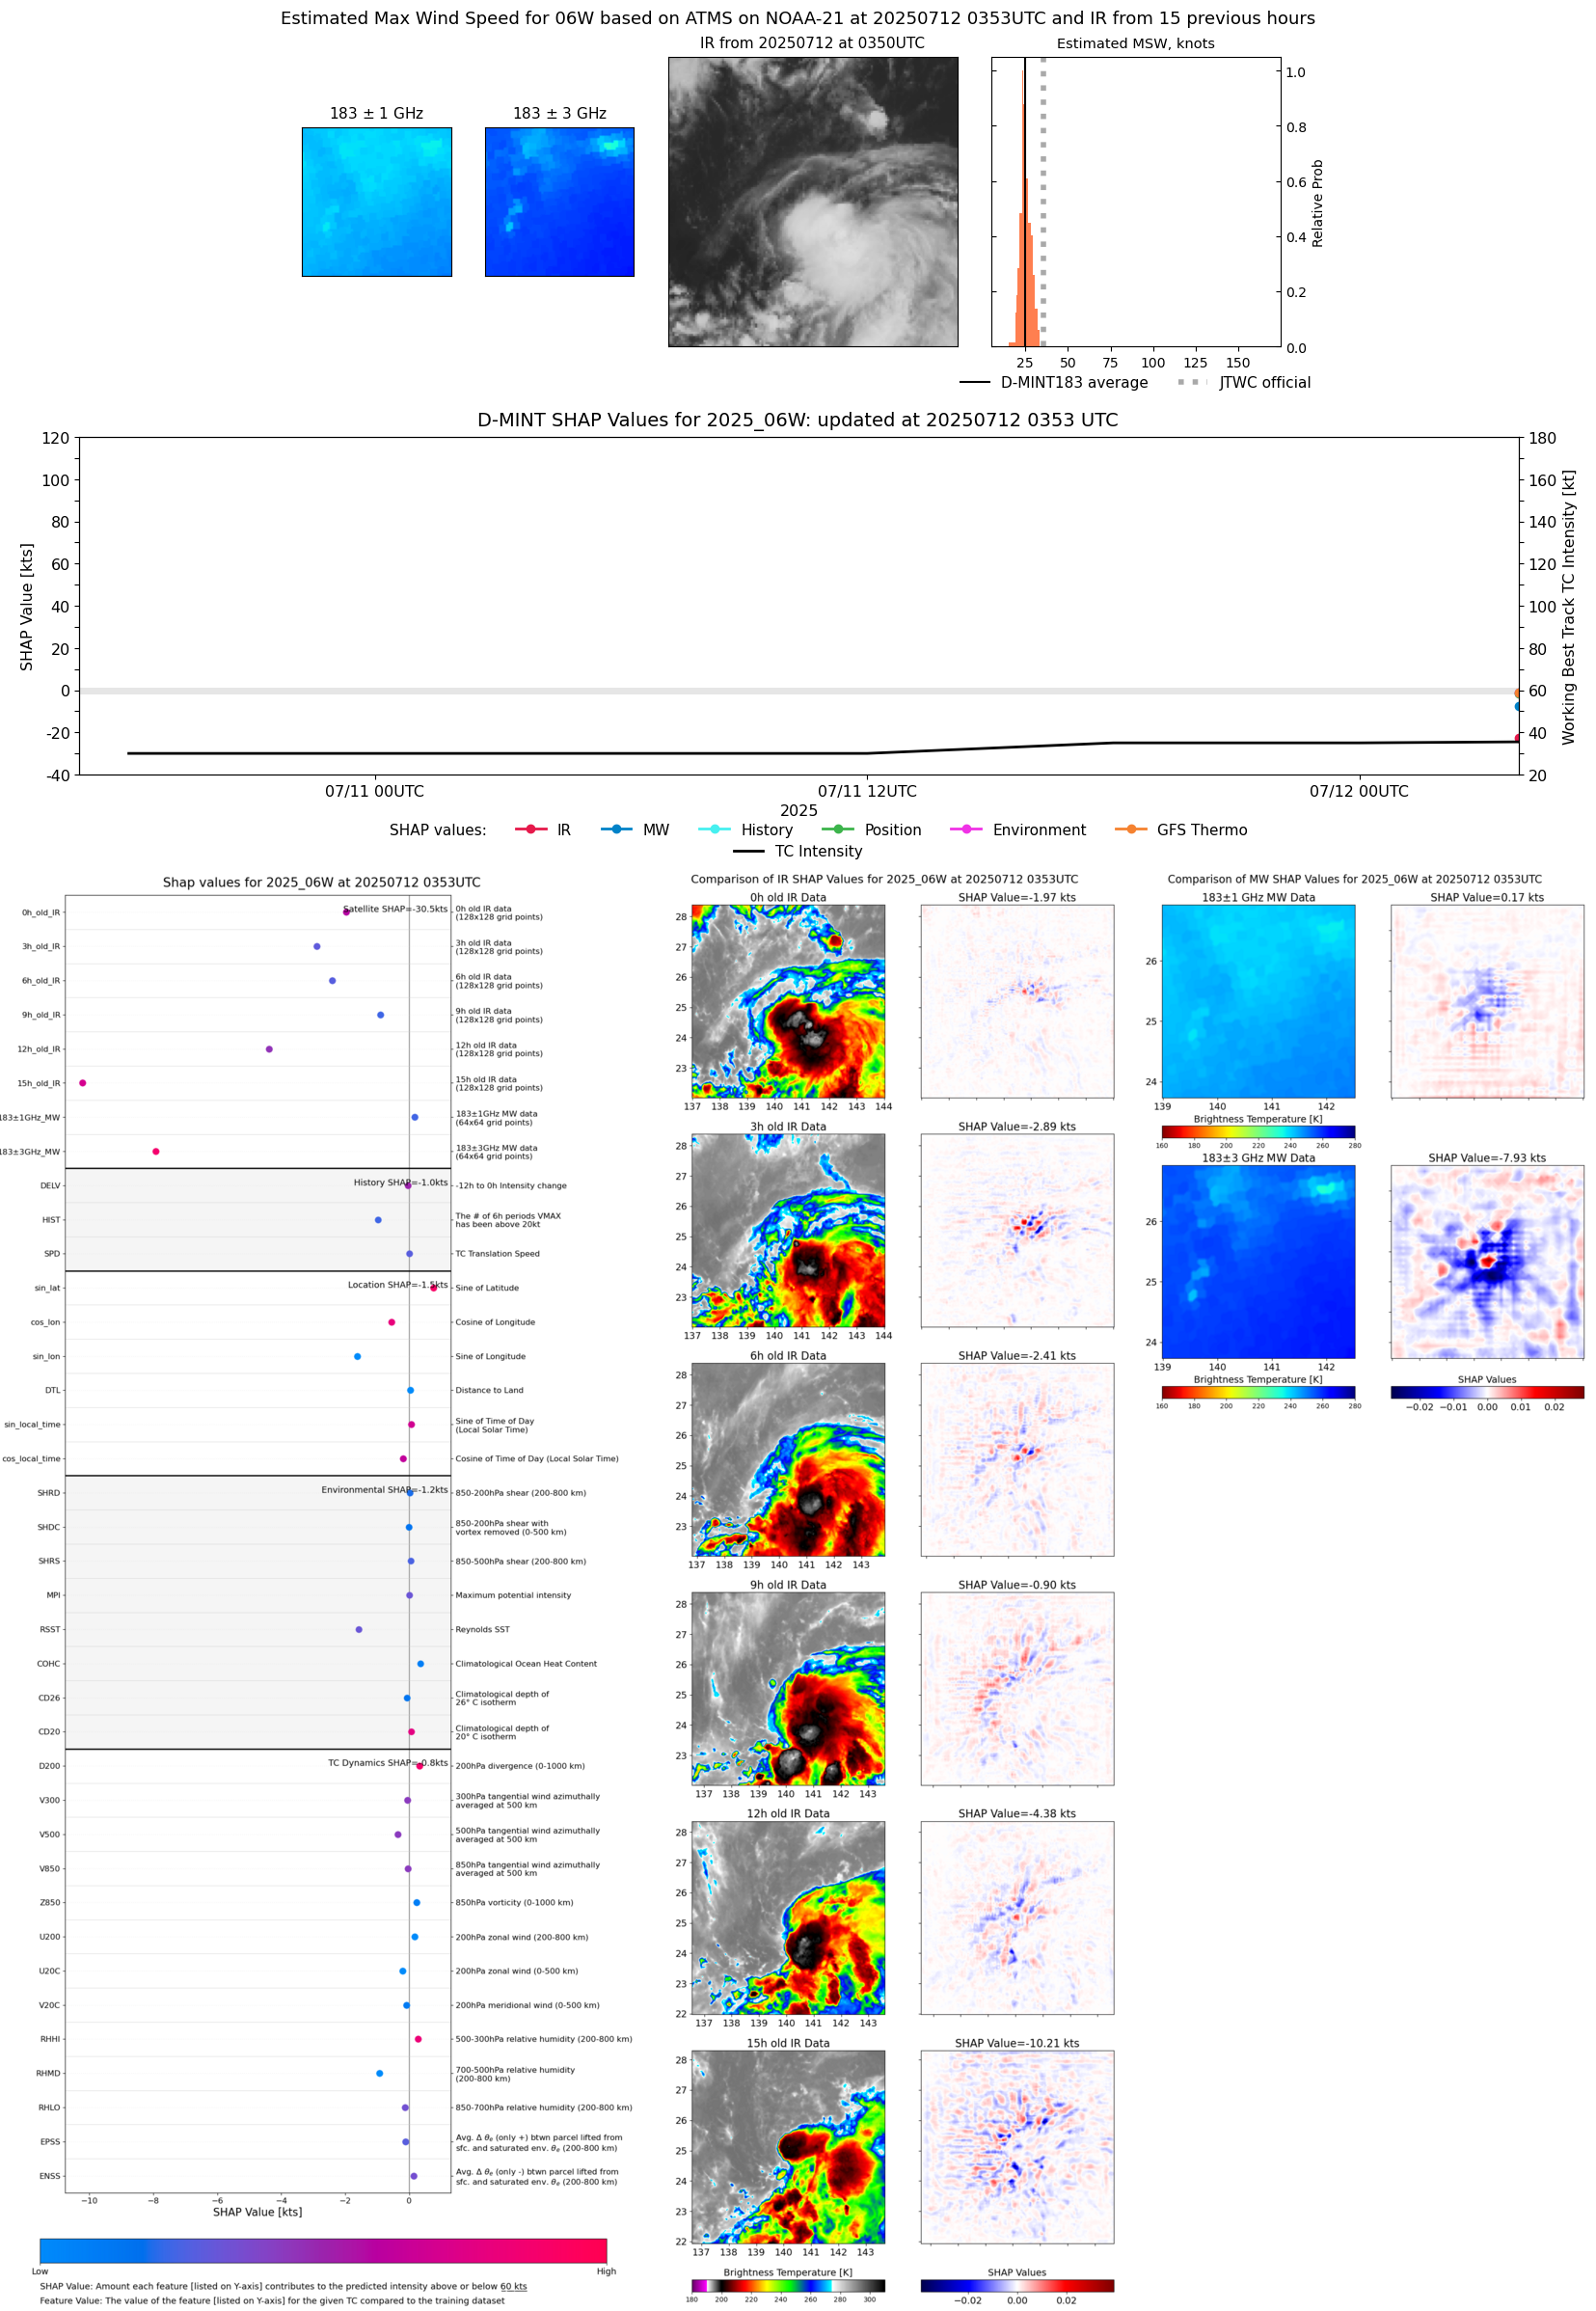 |
| 20250712 | 0127 UTC | AWS | 1002 hPa | 27 kts | 25 kts | 30 kts | 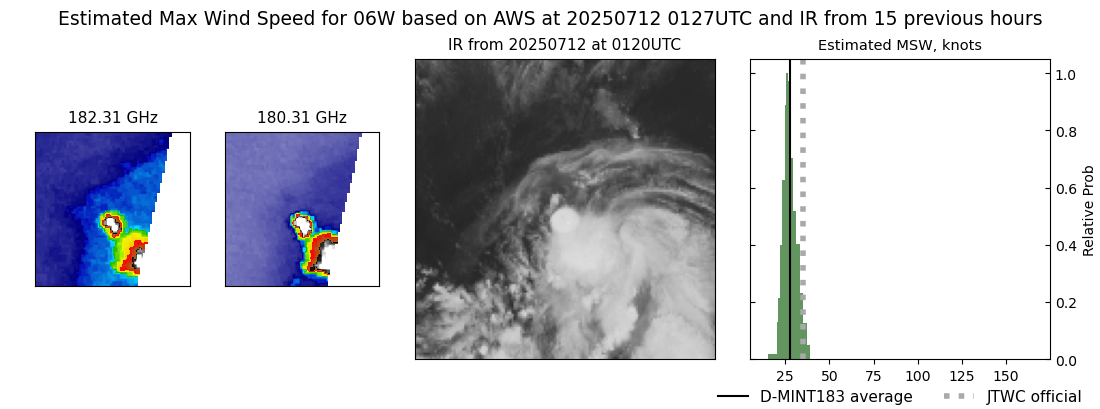 |
| 20250711 | 2102 UTC | GMI | 1002 hPa | 25 kts | 23 kts | 27 kts |  |
| 20250711 | 2058 UTC | GMI | 1002 hPa | 25 kts | 23 kts | 27 kts | 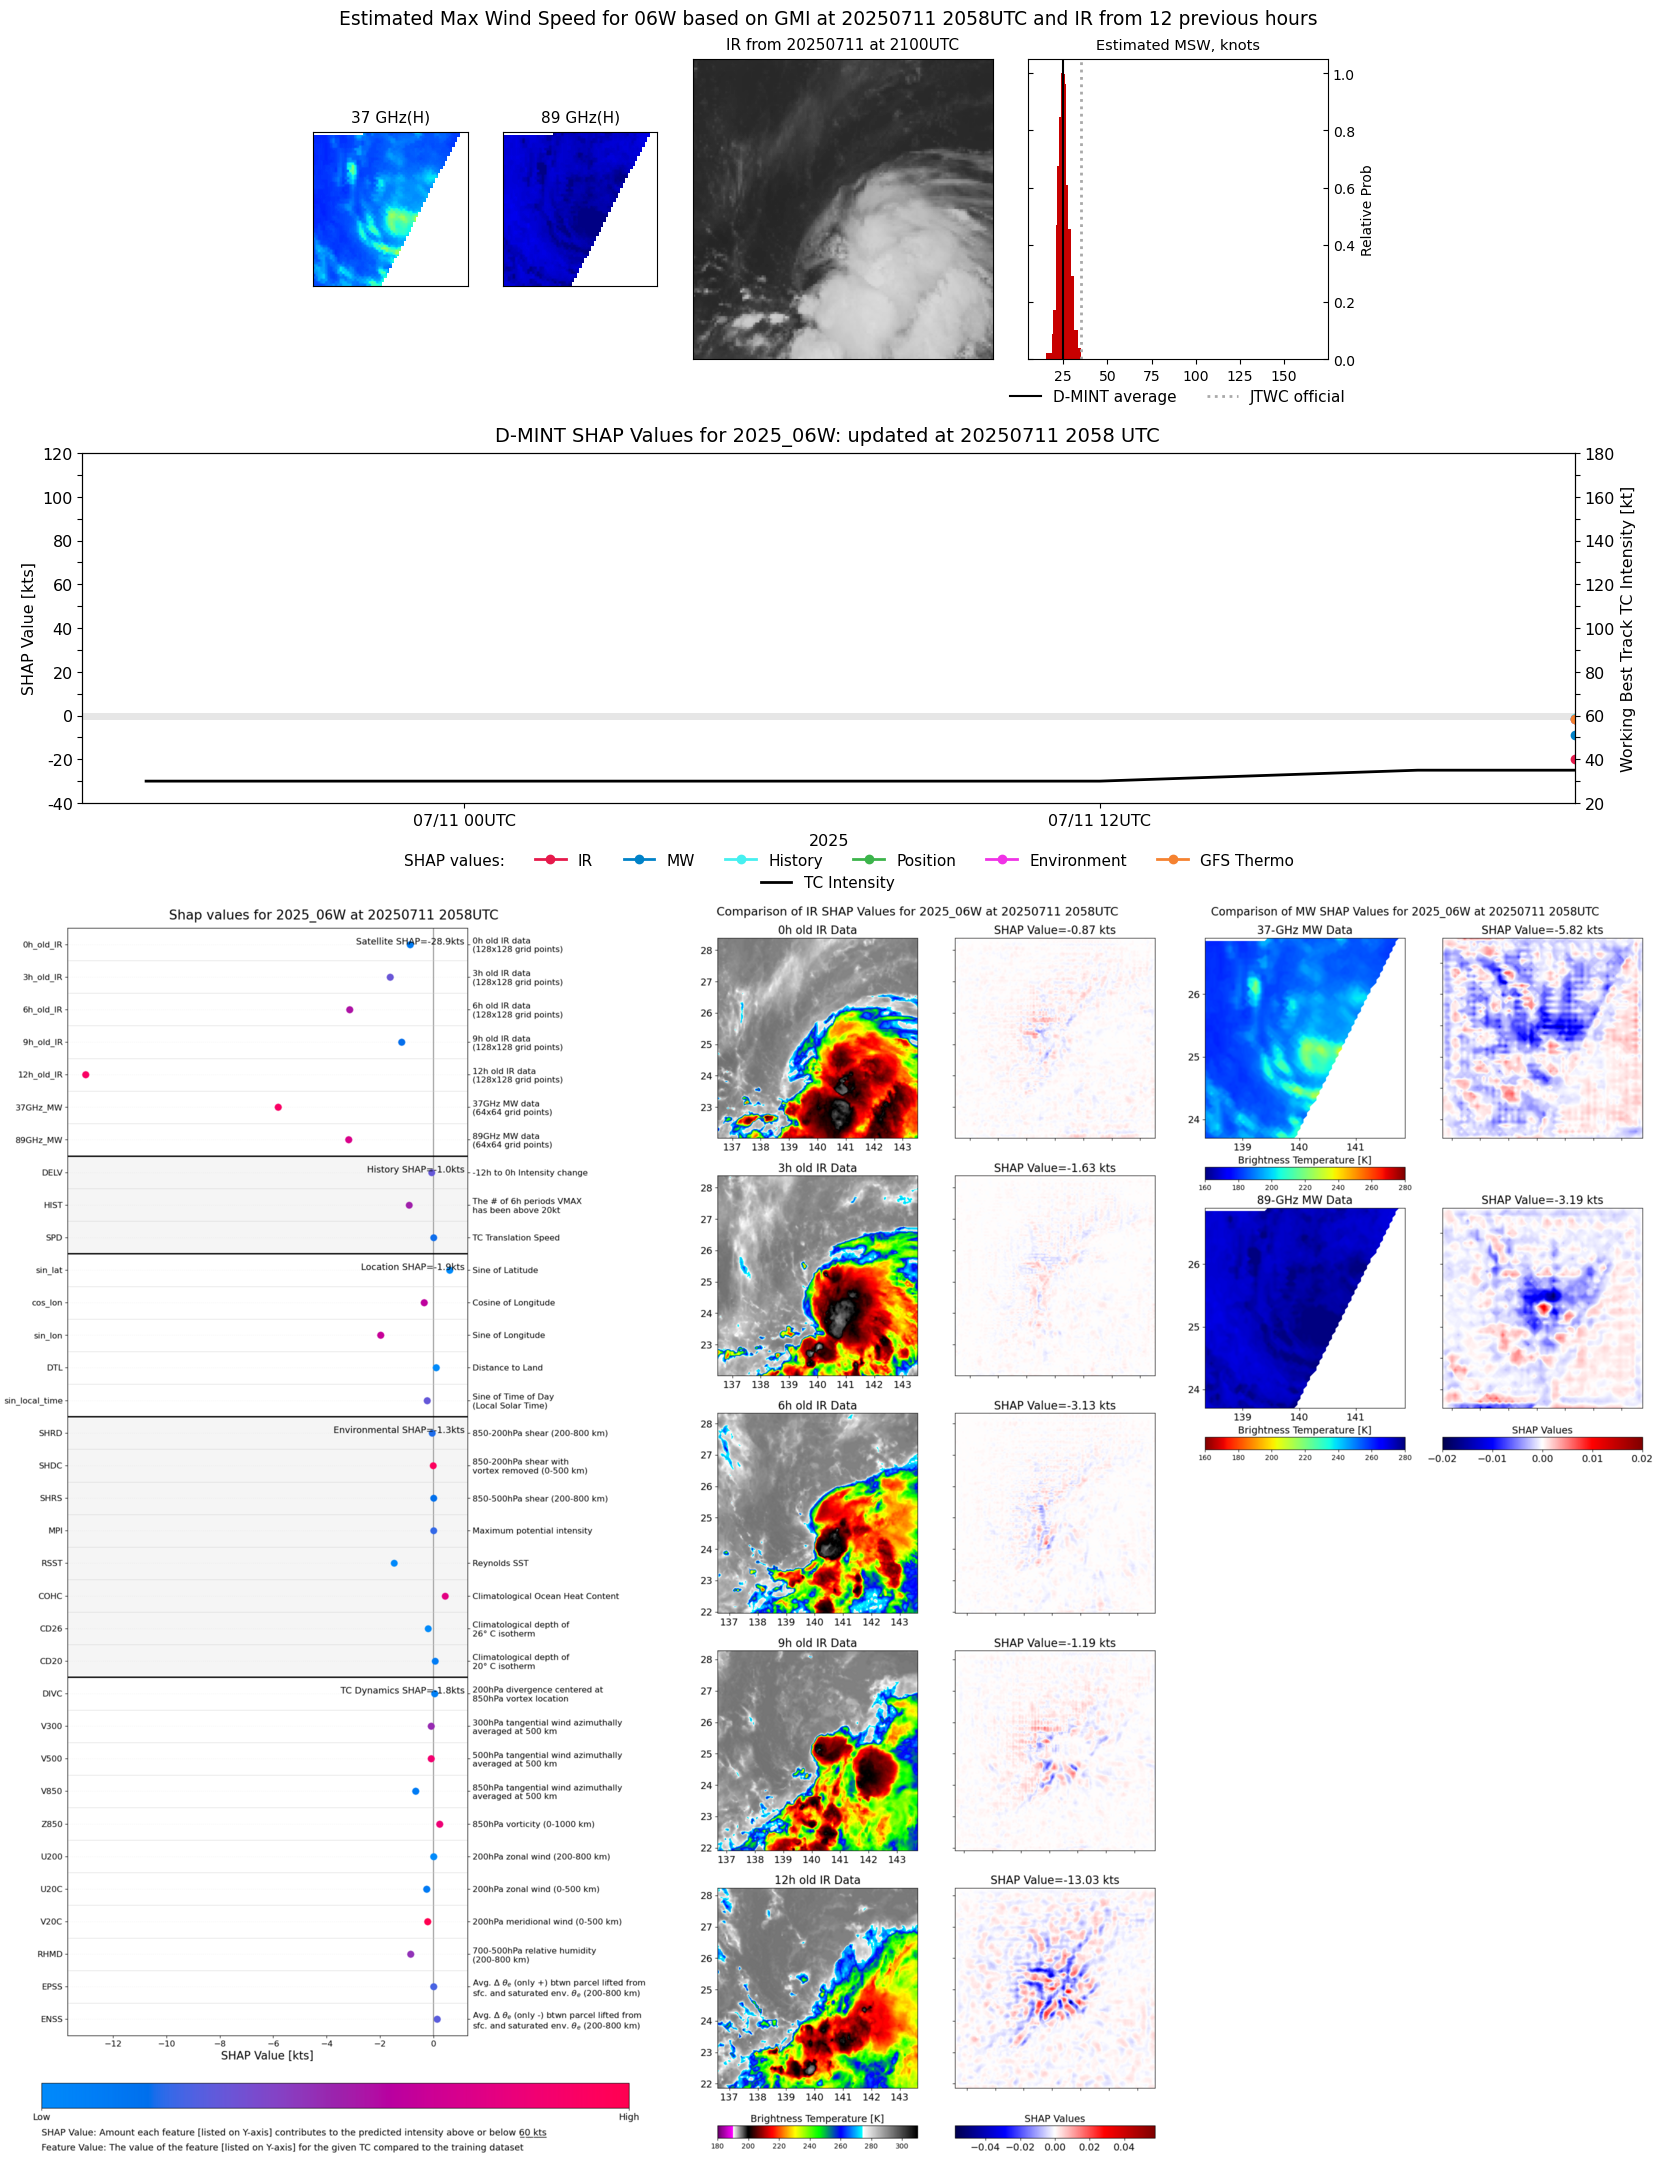 |
| 20250711 | 1853 UTC | TROPICS03 | 1003 hPa | 25 kts | 23 kts | 27 kts | 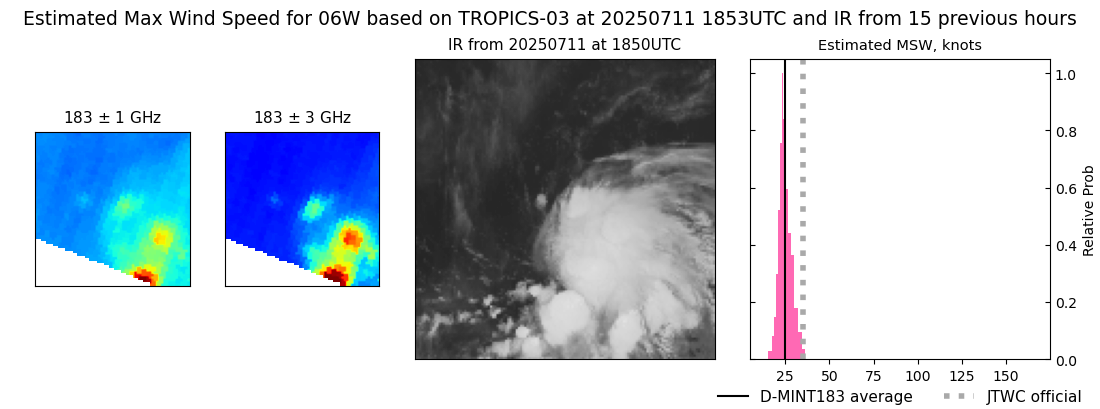 |
| 20250711 | 1638 UTC | ATMS-N21 | NaN hPa | 26 kts | 24 kts | 29 kts | 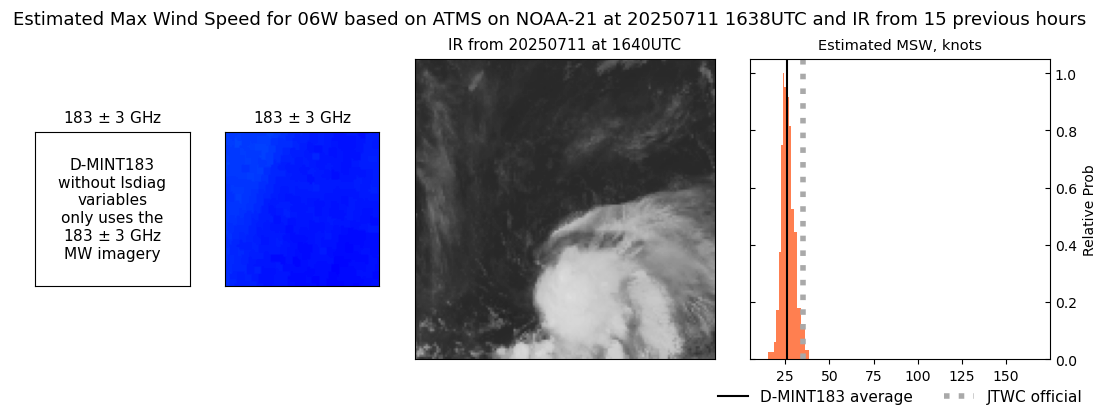 |
| 20250711 | 1253 UTC | TMS02 | NaN hPa | 27 kts | 24 kts | 31 kts | 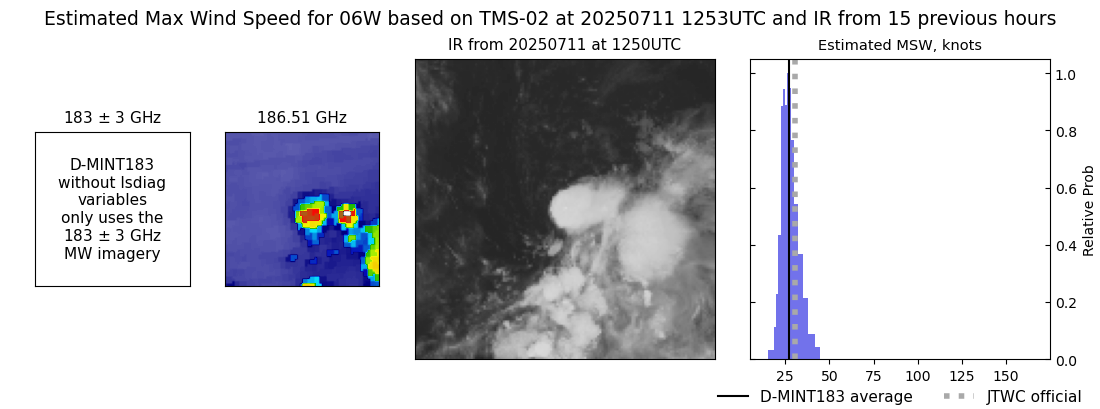 |
| 20250711 | 0144 UTC | TROPICS05 | 1004 hPa | 26 kts | 24 kts | 28 kts | 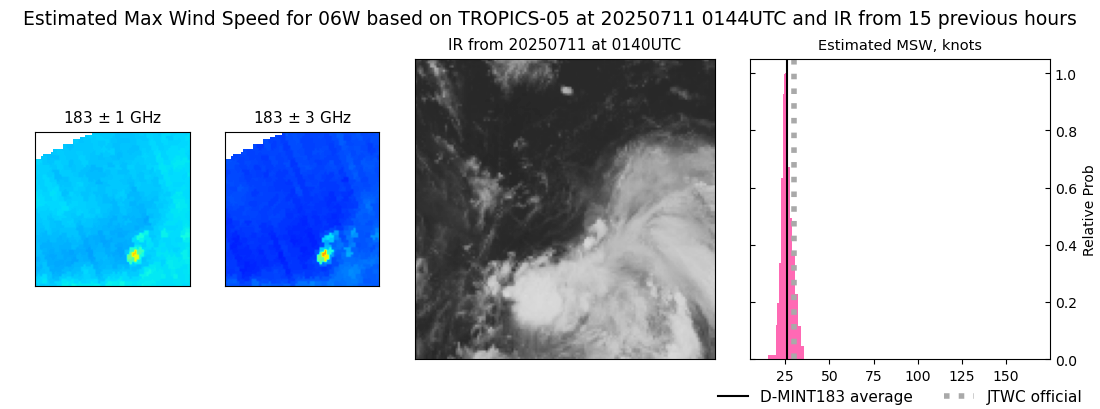 |
| 20250711 | 0116 UTC | AWS | 1004 hPa | 25 kts | 23 kts | 27 kts | 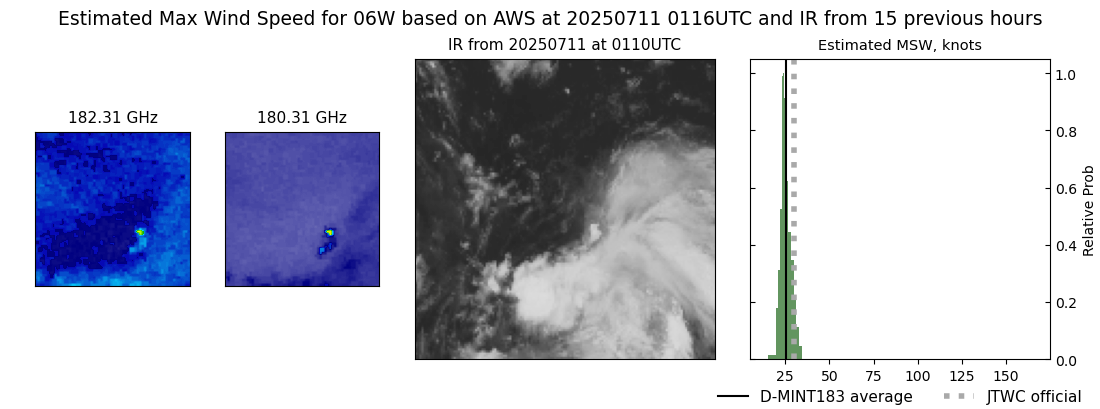 |