|
||

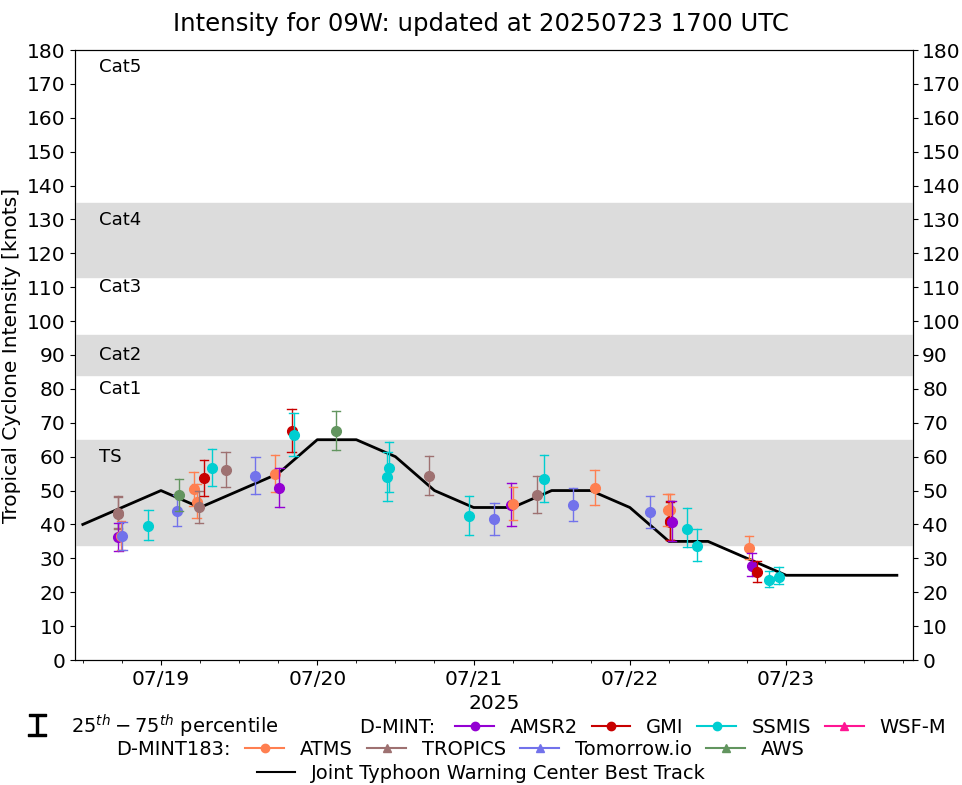 |
D-MINT HISTORY FILE for 2025_09W
| Date | Time | MW Sensor | MSLP | Vmax (30th-70th percentile average) | Vmax 25th percentile | Vmax 75th percentile | Image |
| 20250722 | 2251 UTC | SSMISF17 | 1000 hPa | 25 kts | 22 kts | 27 kts | 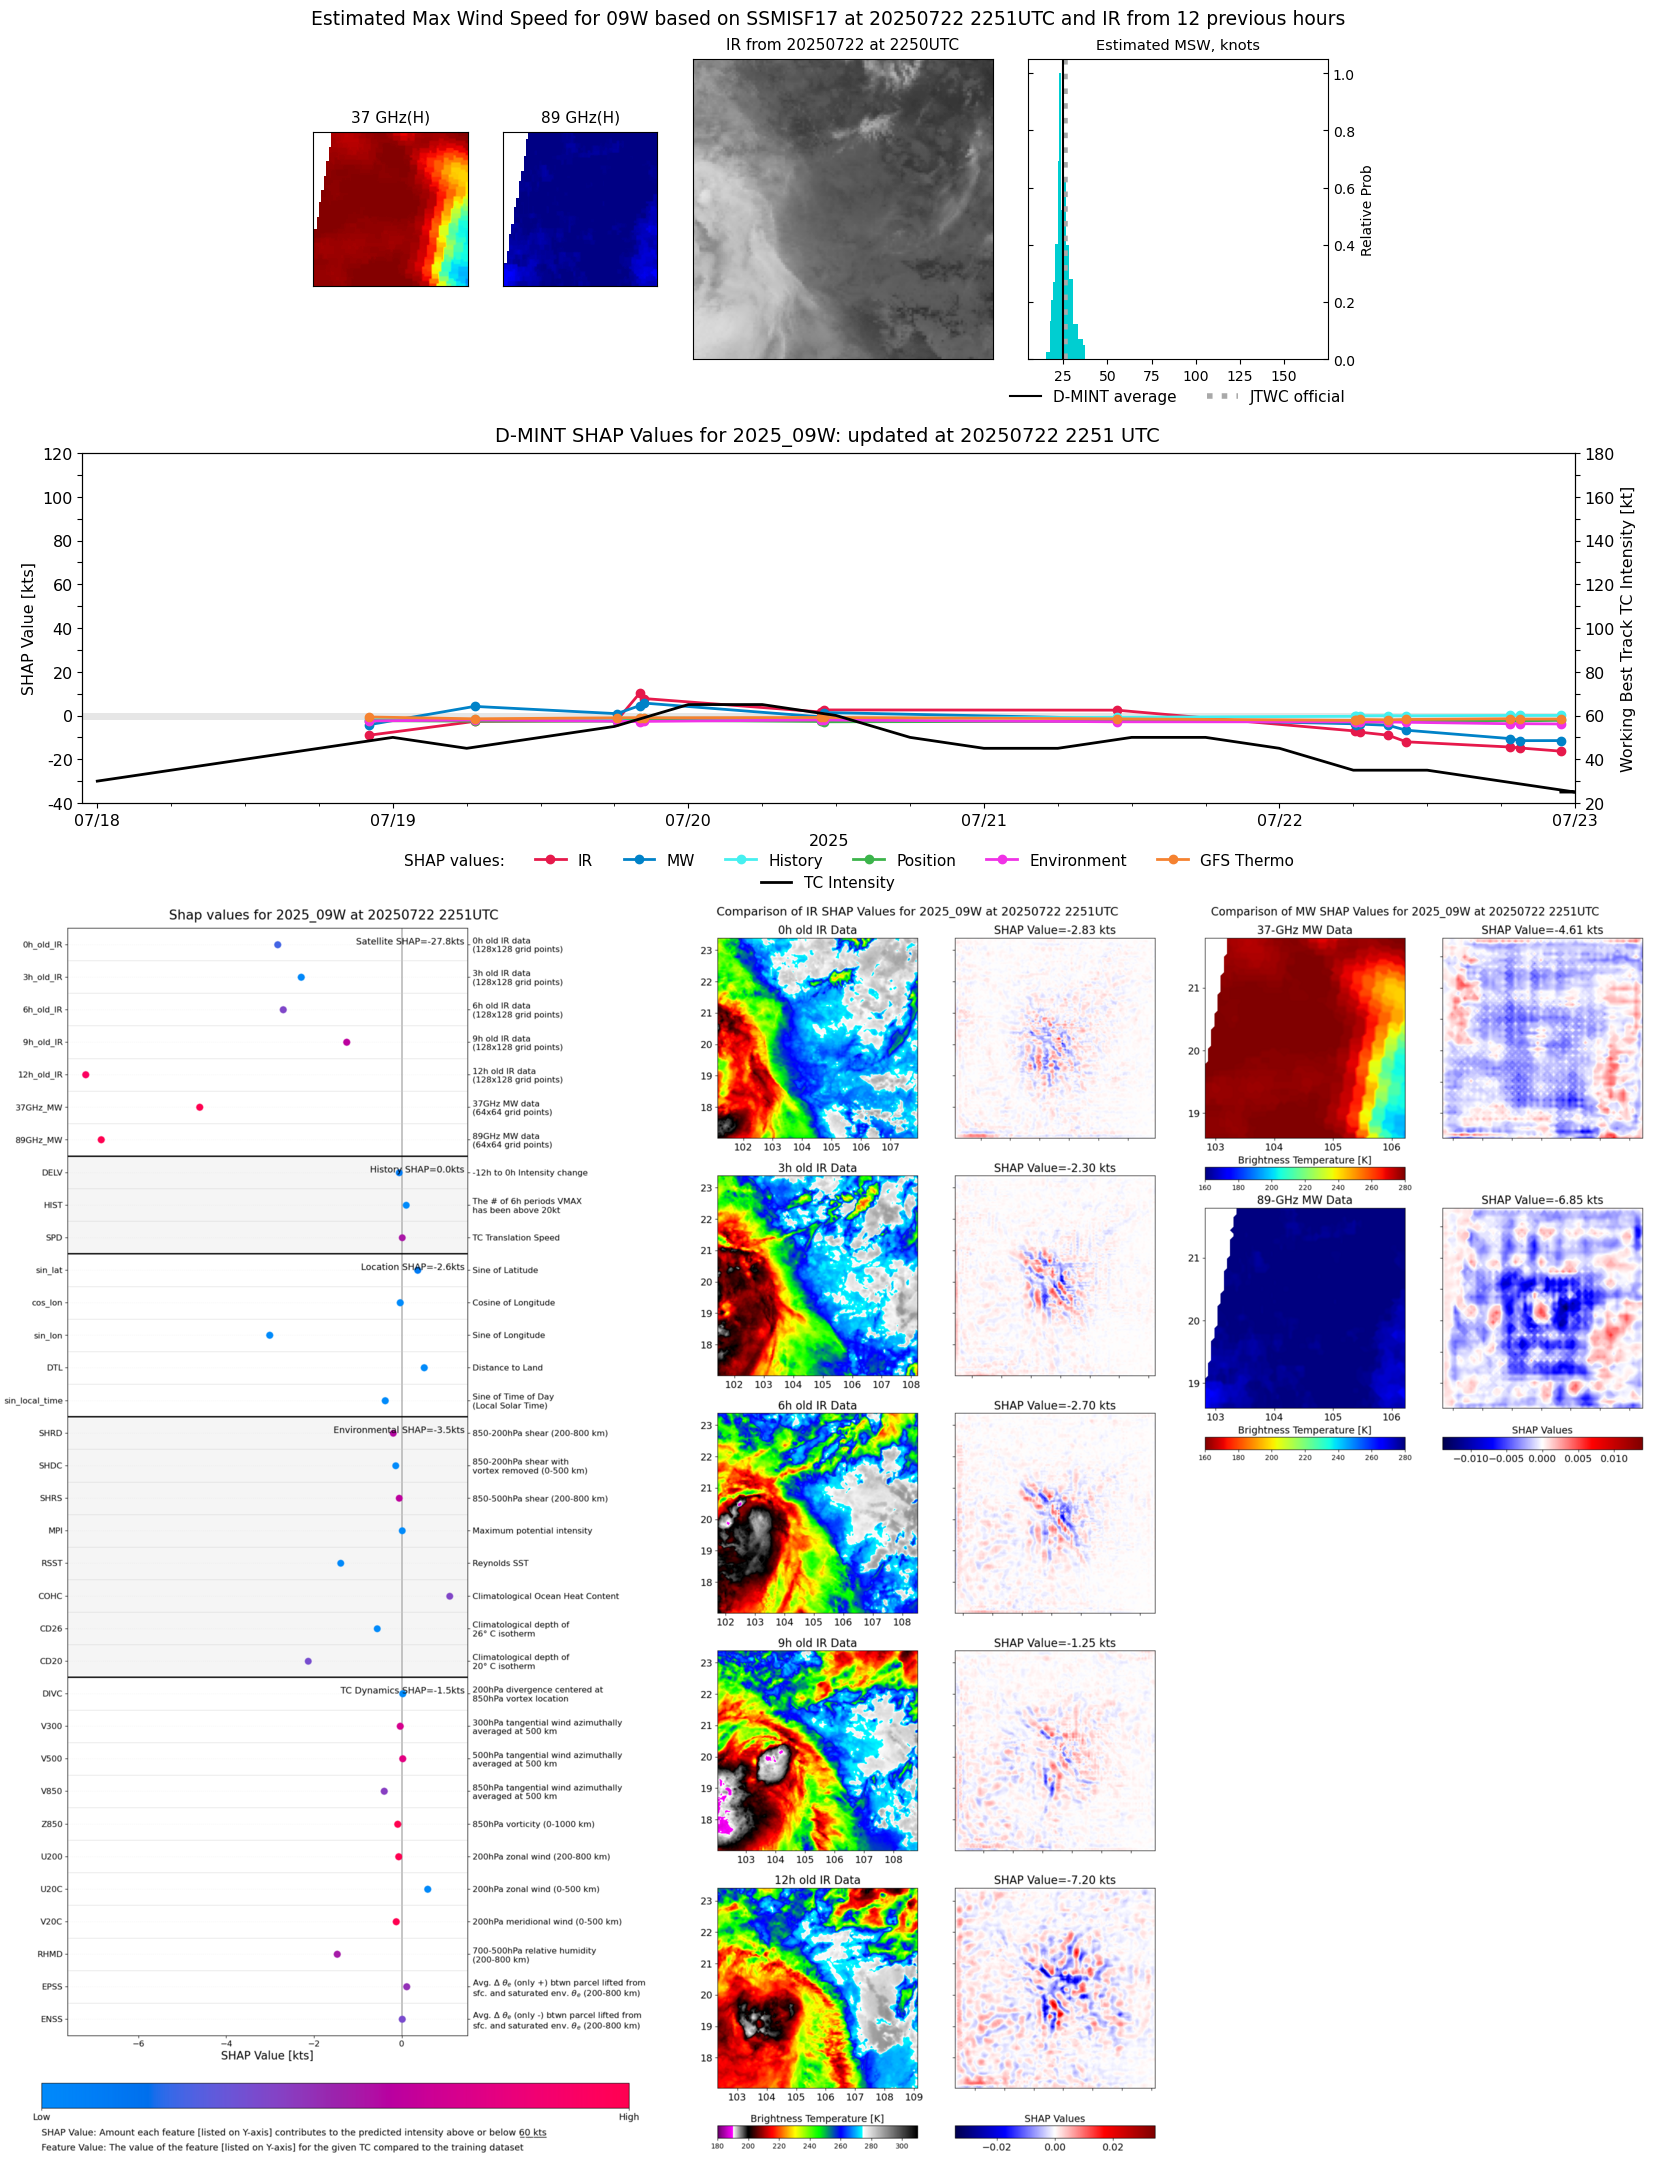 |
| 20250722 | 2121 UTC | SSMISF18 | 999 hPa | 24 kts | 22 kts | 26 kts |  |
| 20250722 | 1933 UTC | GMI | 1001 hPa | 26 kts | 23 kts | 29 kts | 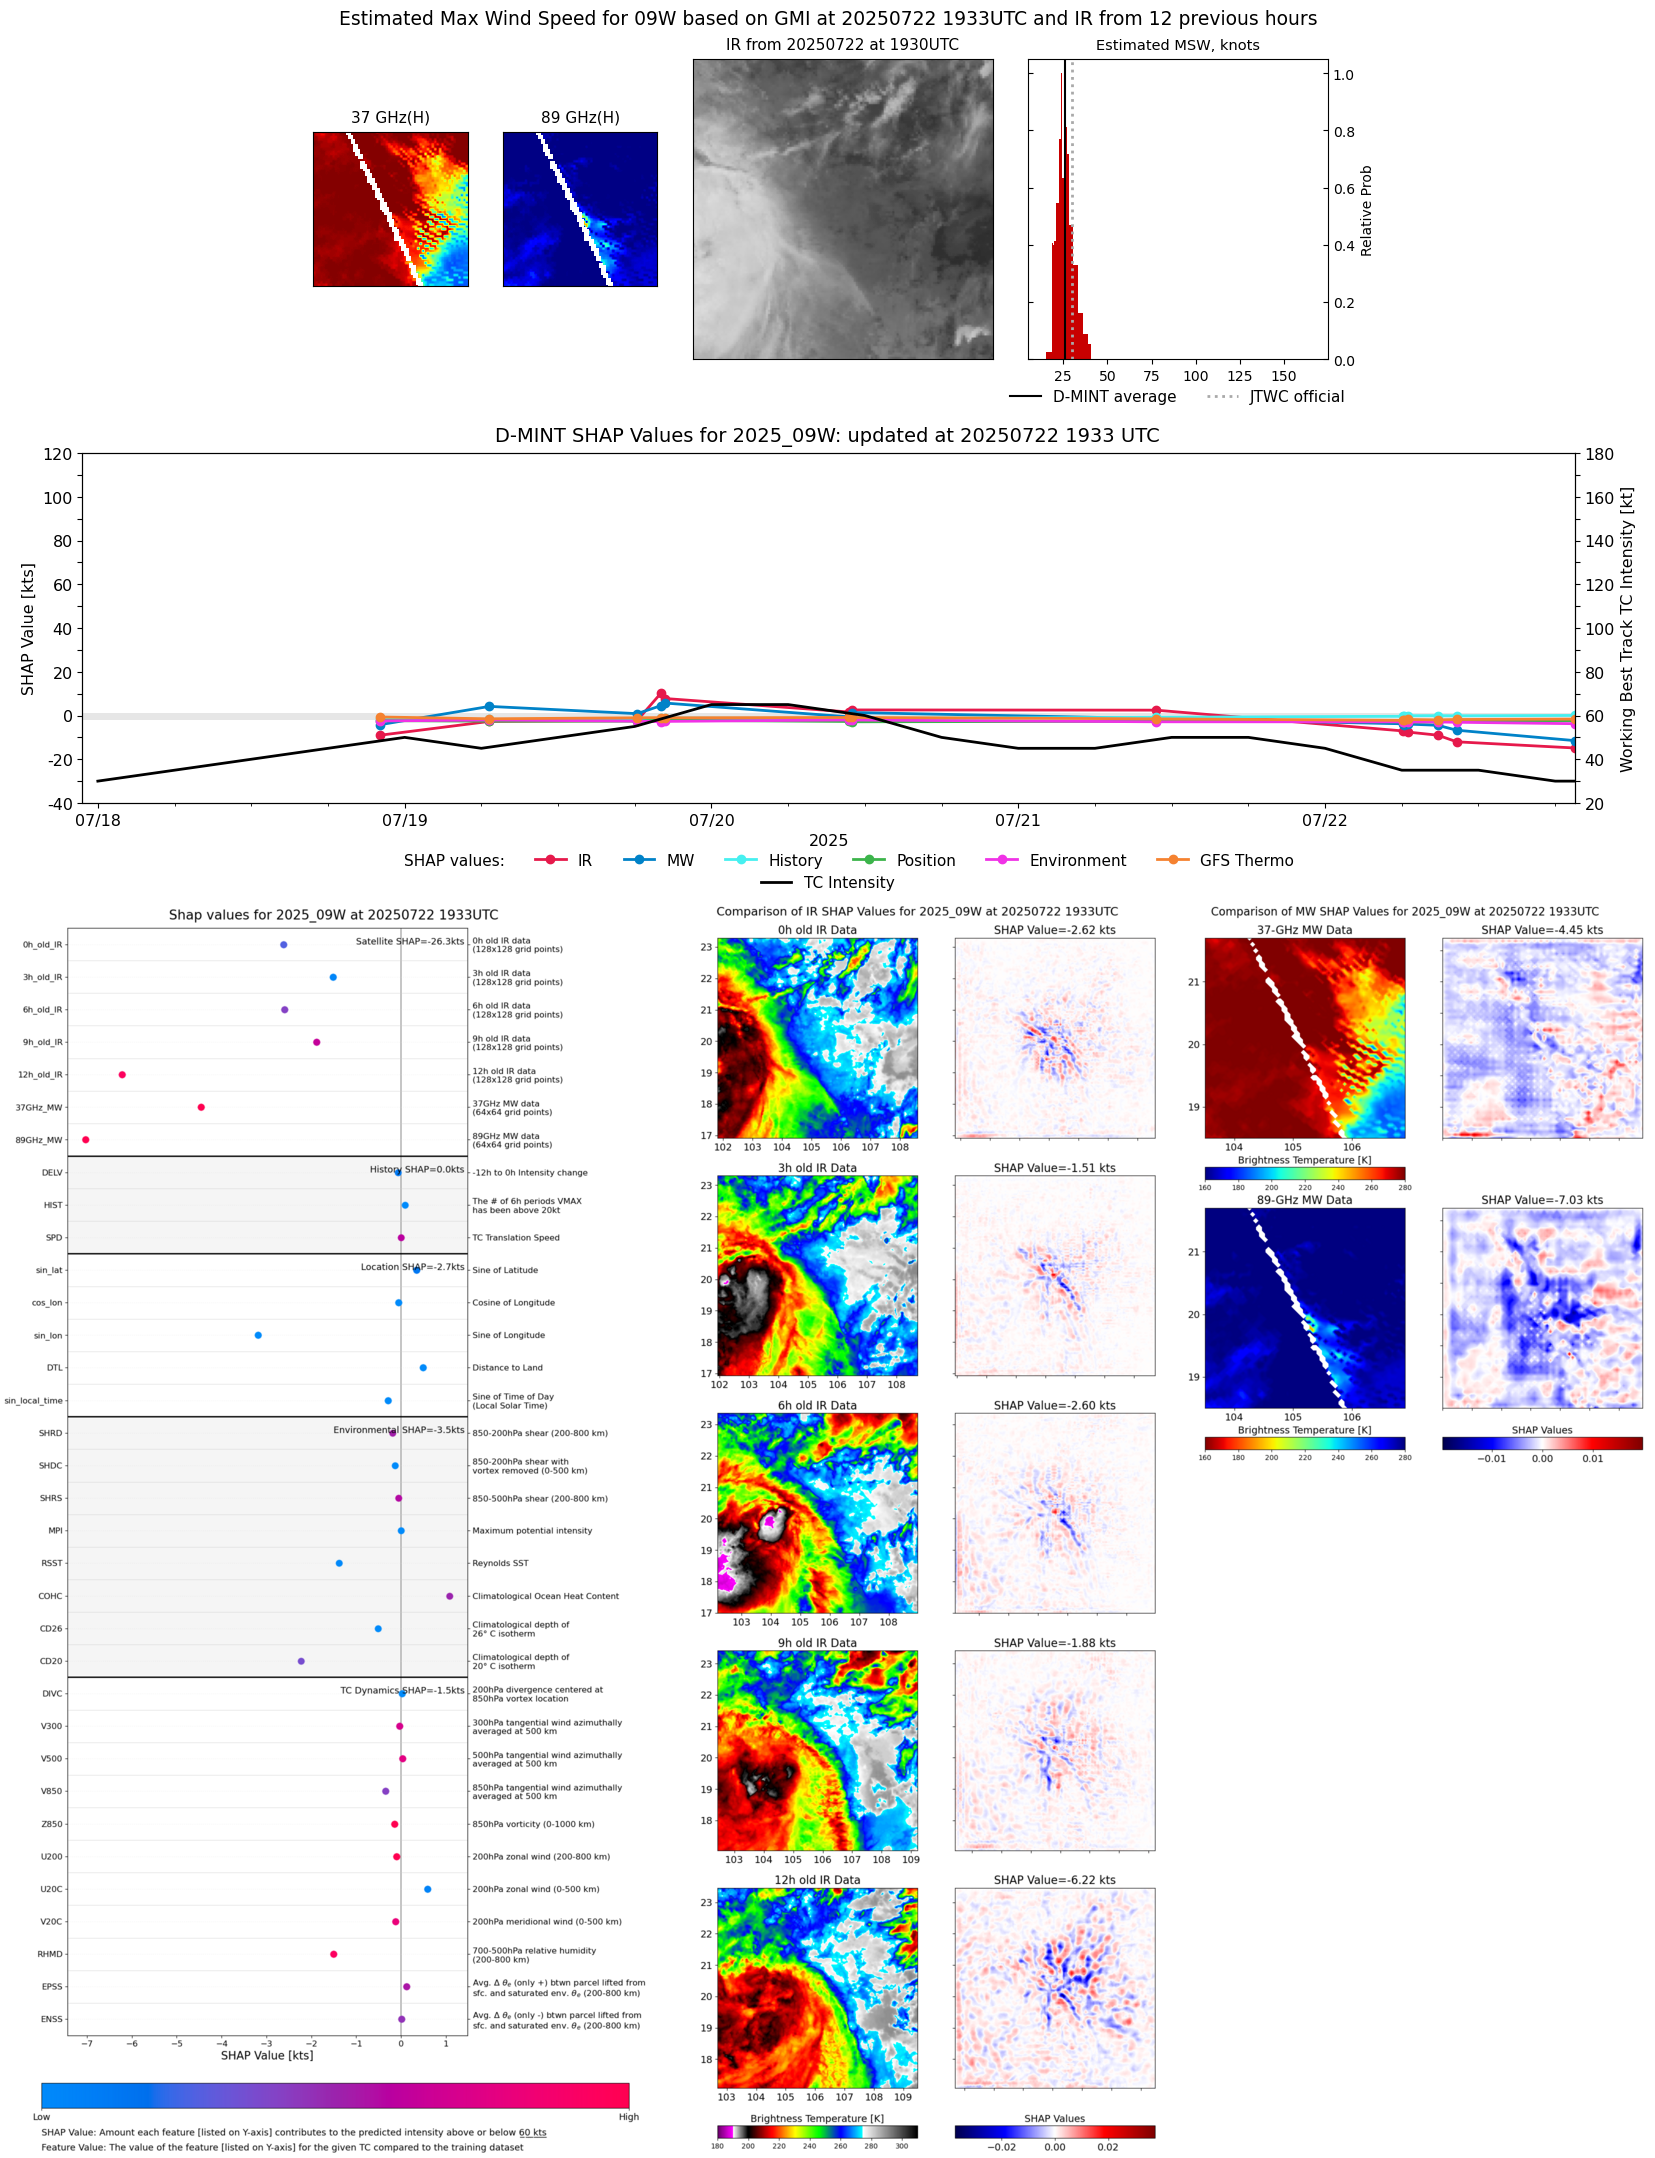 |
| 20250722 | 1842 UTC | AMSR2 | 999 hPa | 28 kts | 25 kts | 31 kts | 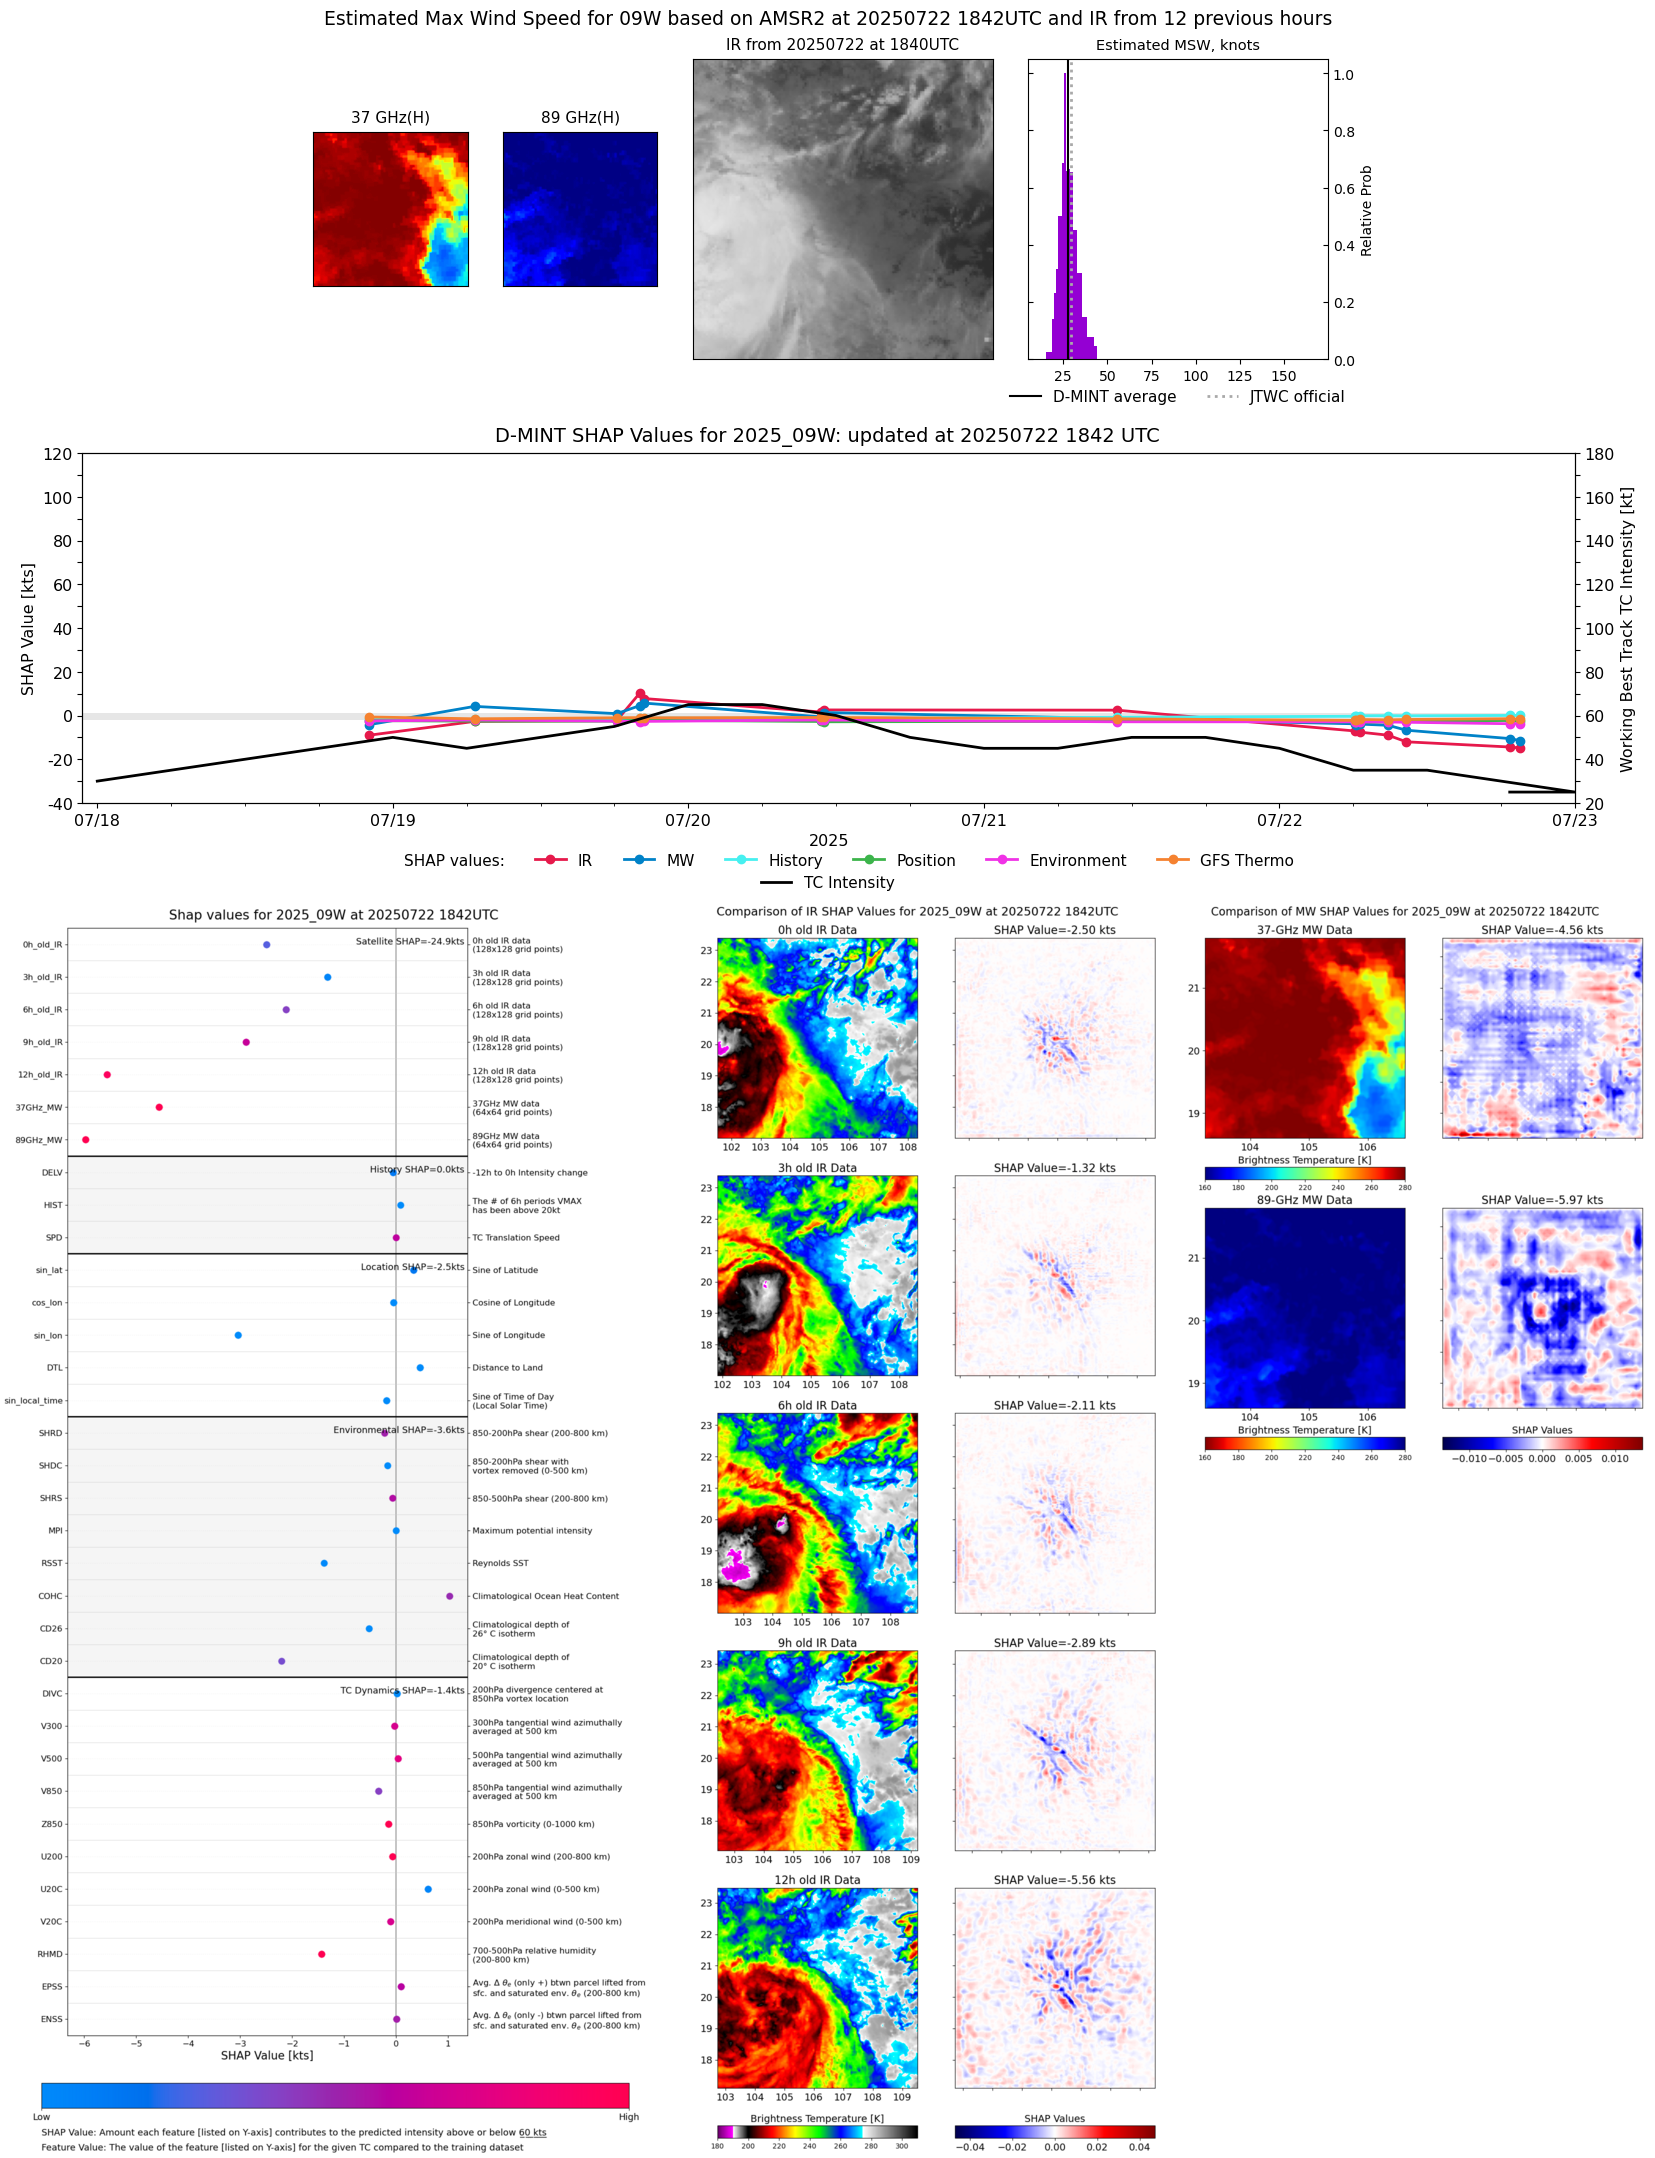 |
| 20250722 | 1816 UTC | ATMS-N21 | 993 hPa | 33 kts | 30 kts | 37 kts | 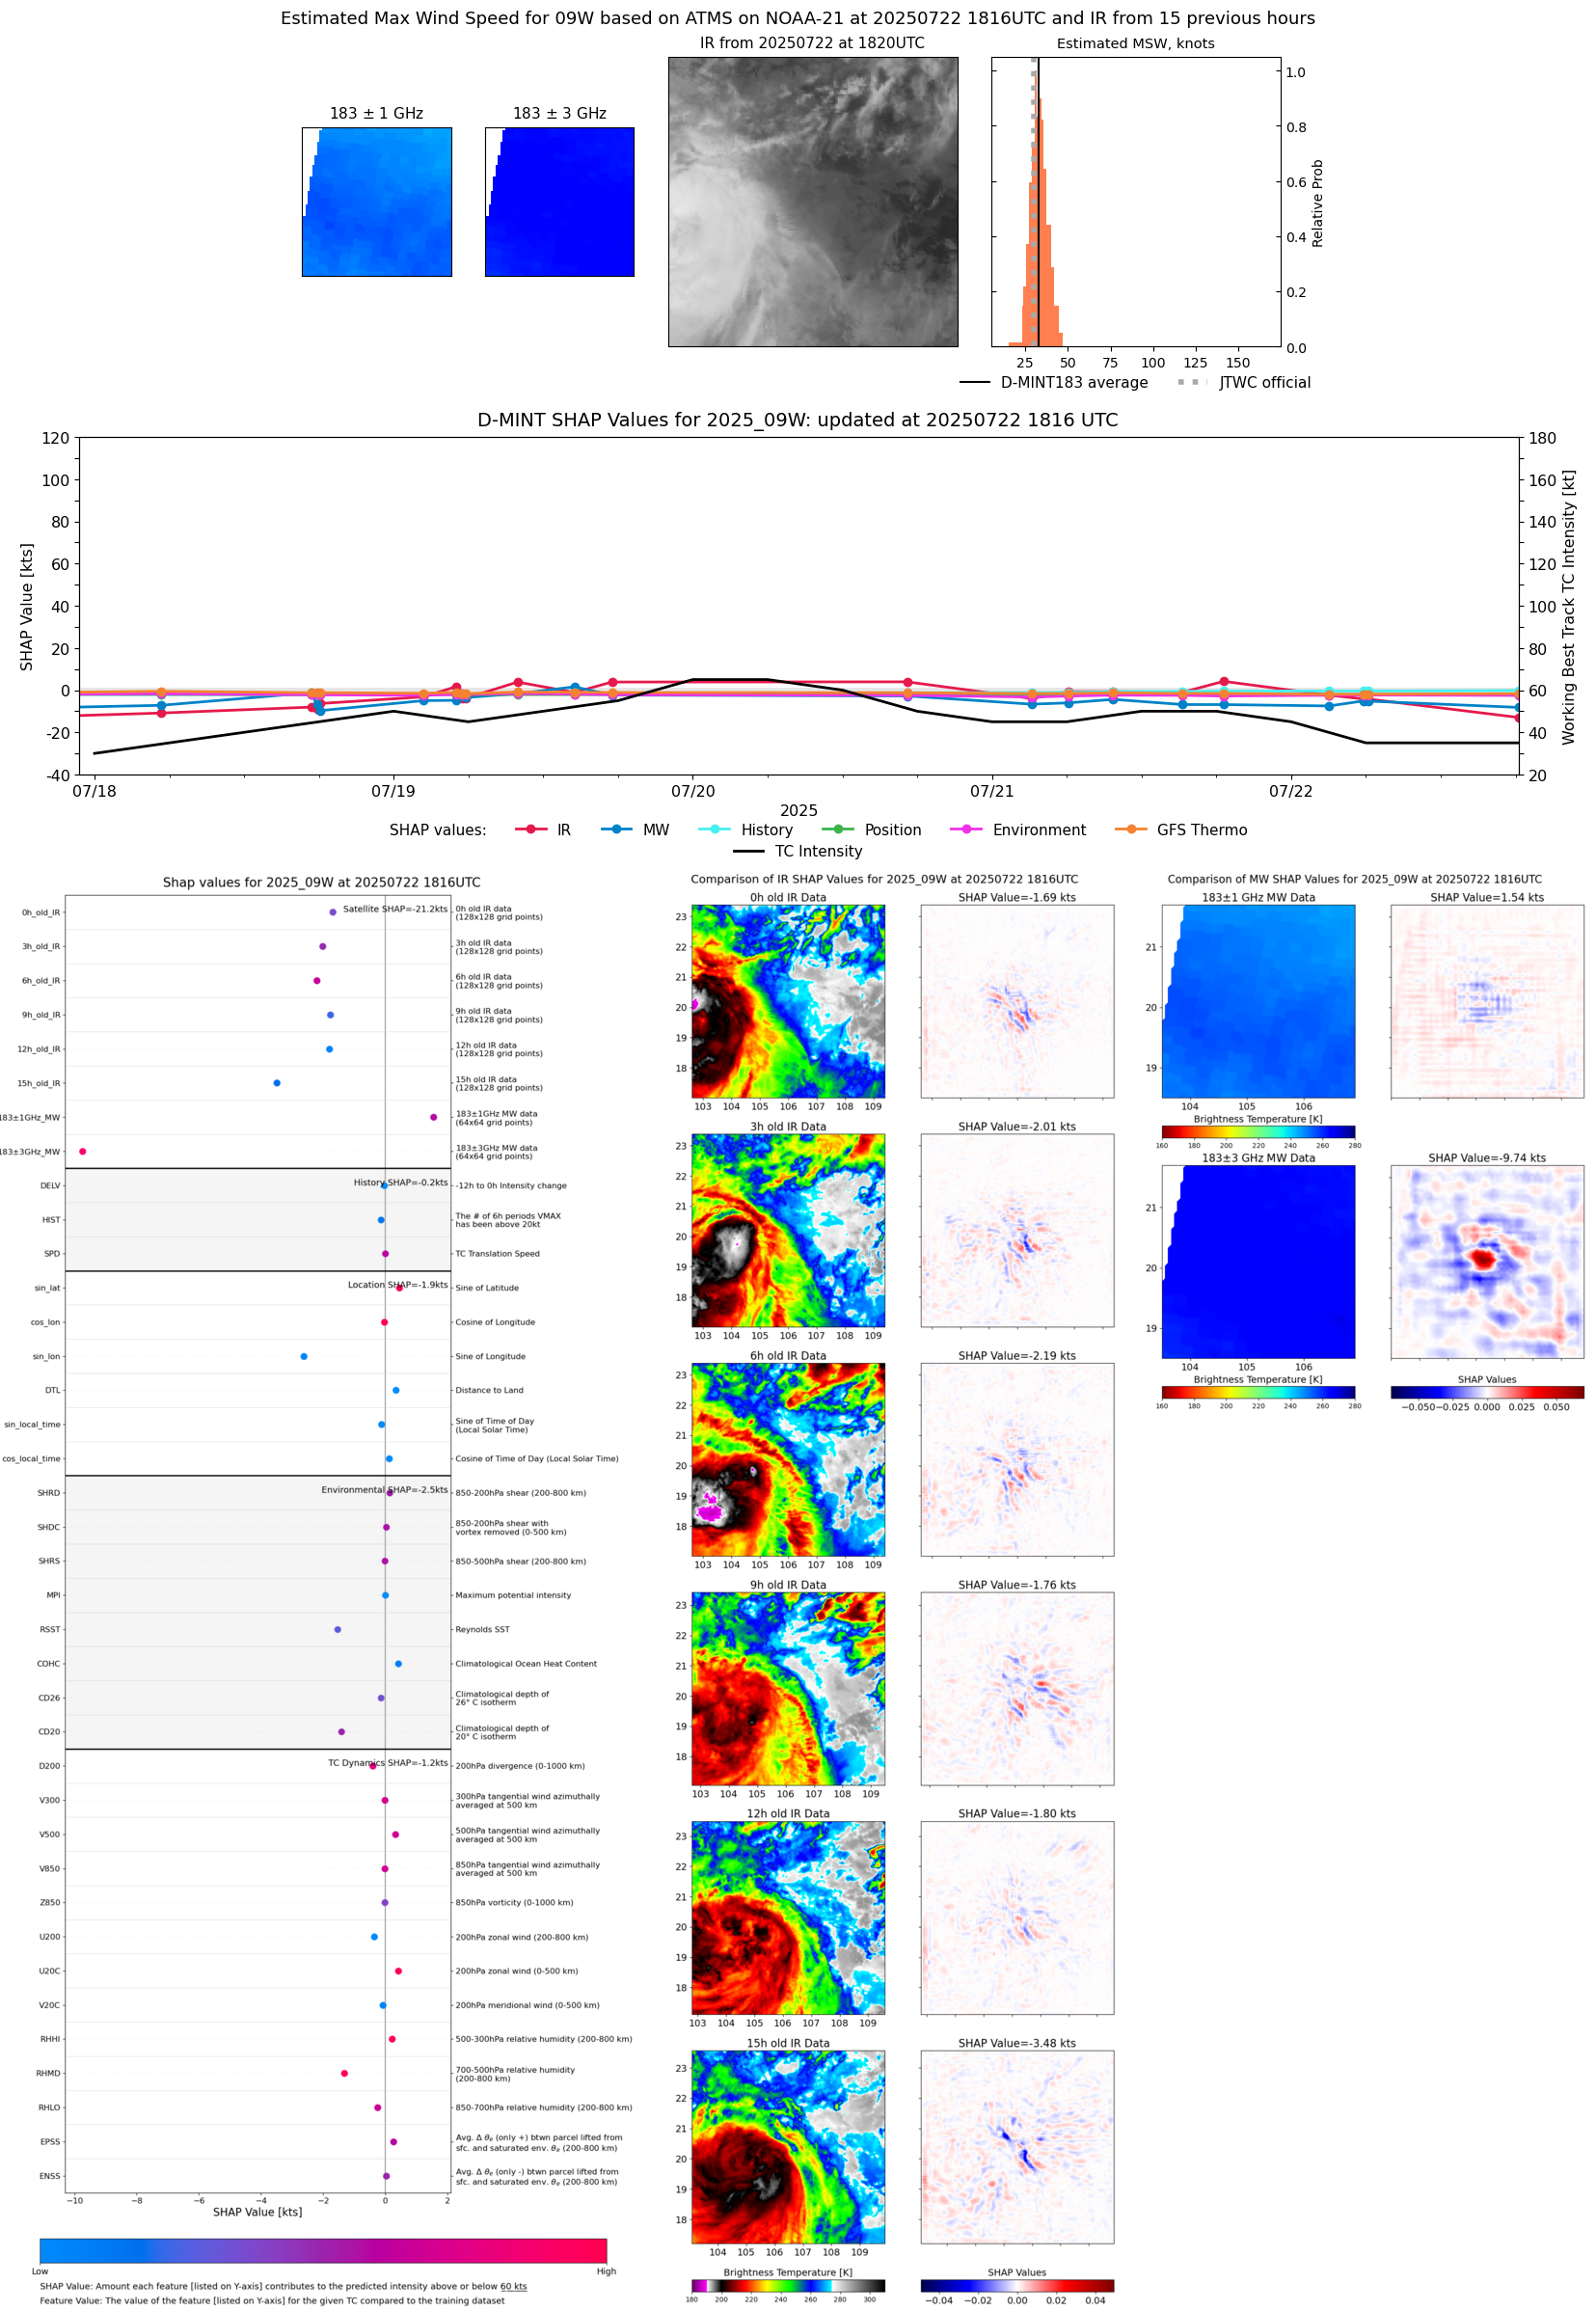 |
| 20250722 | 1018 UTC | SSMISF17 | 990 hPa | 34 kts | 29 kts | 39 kts | 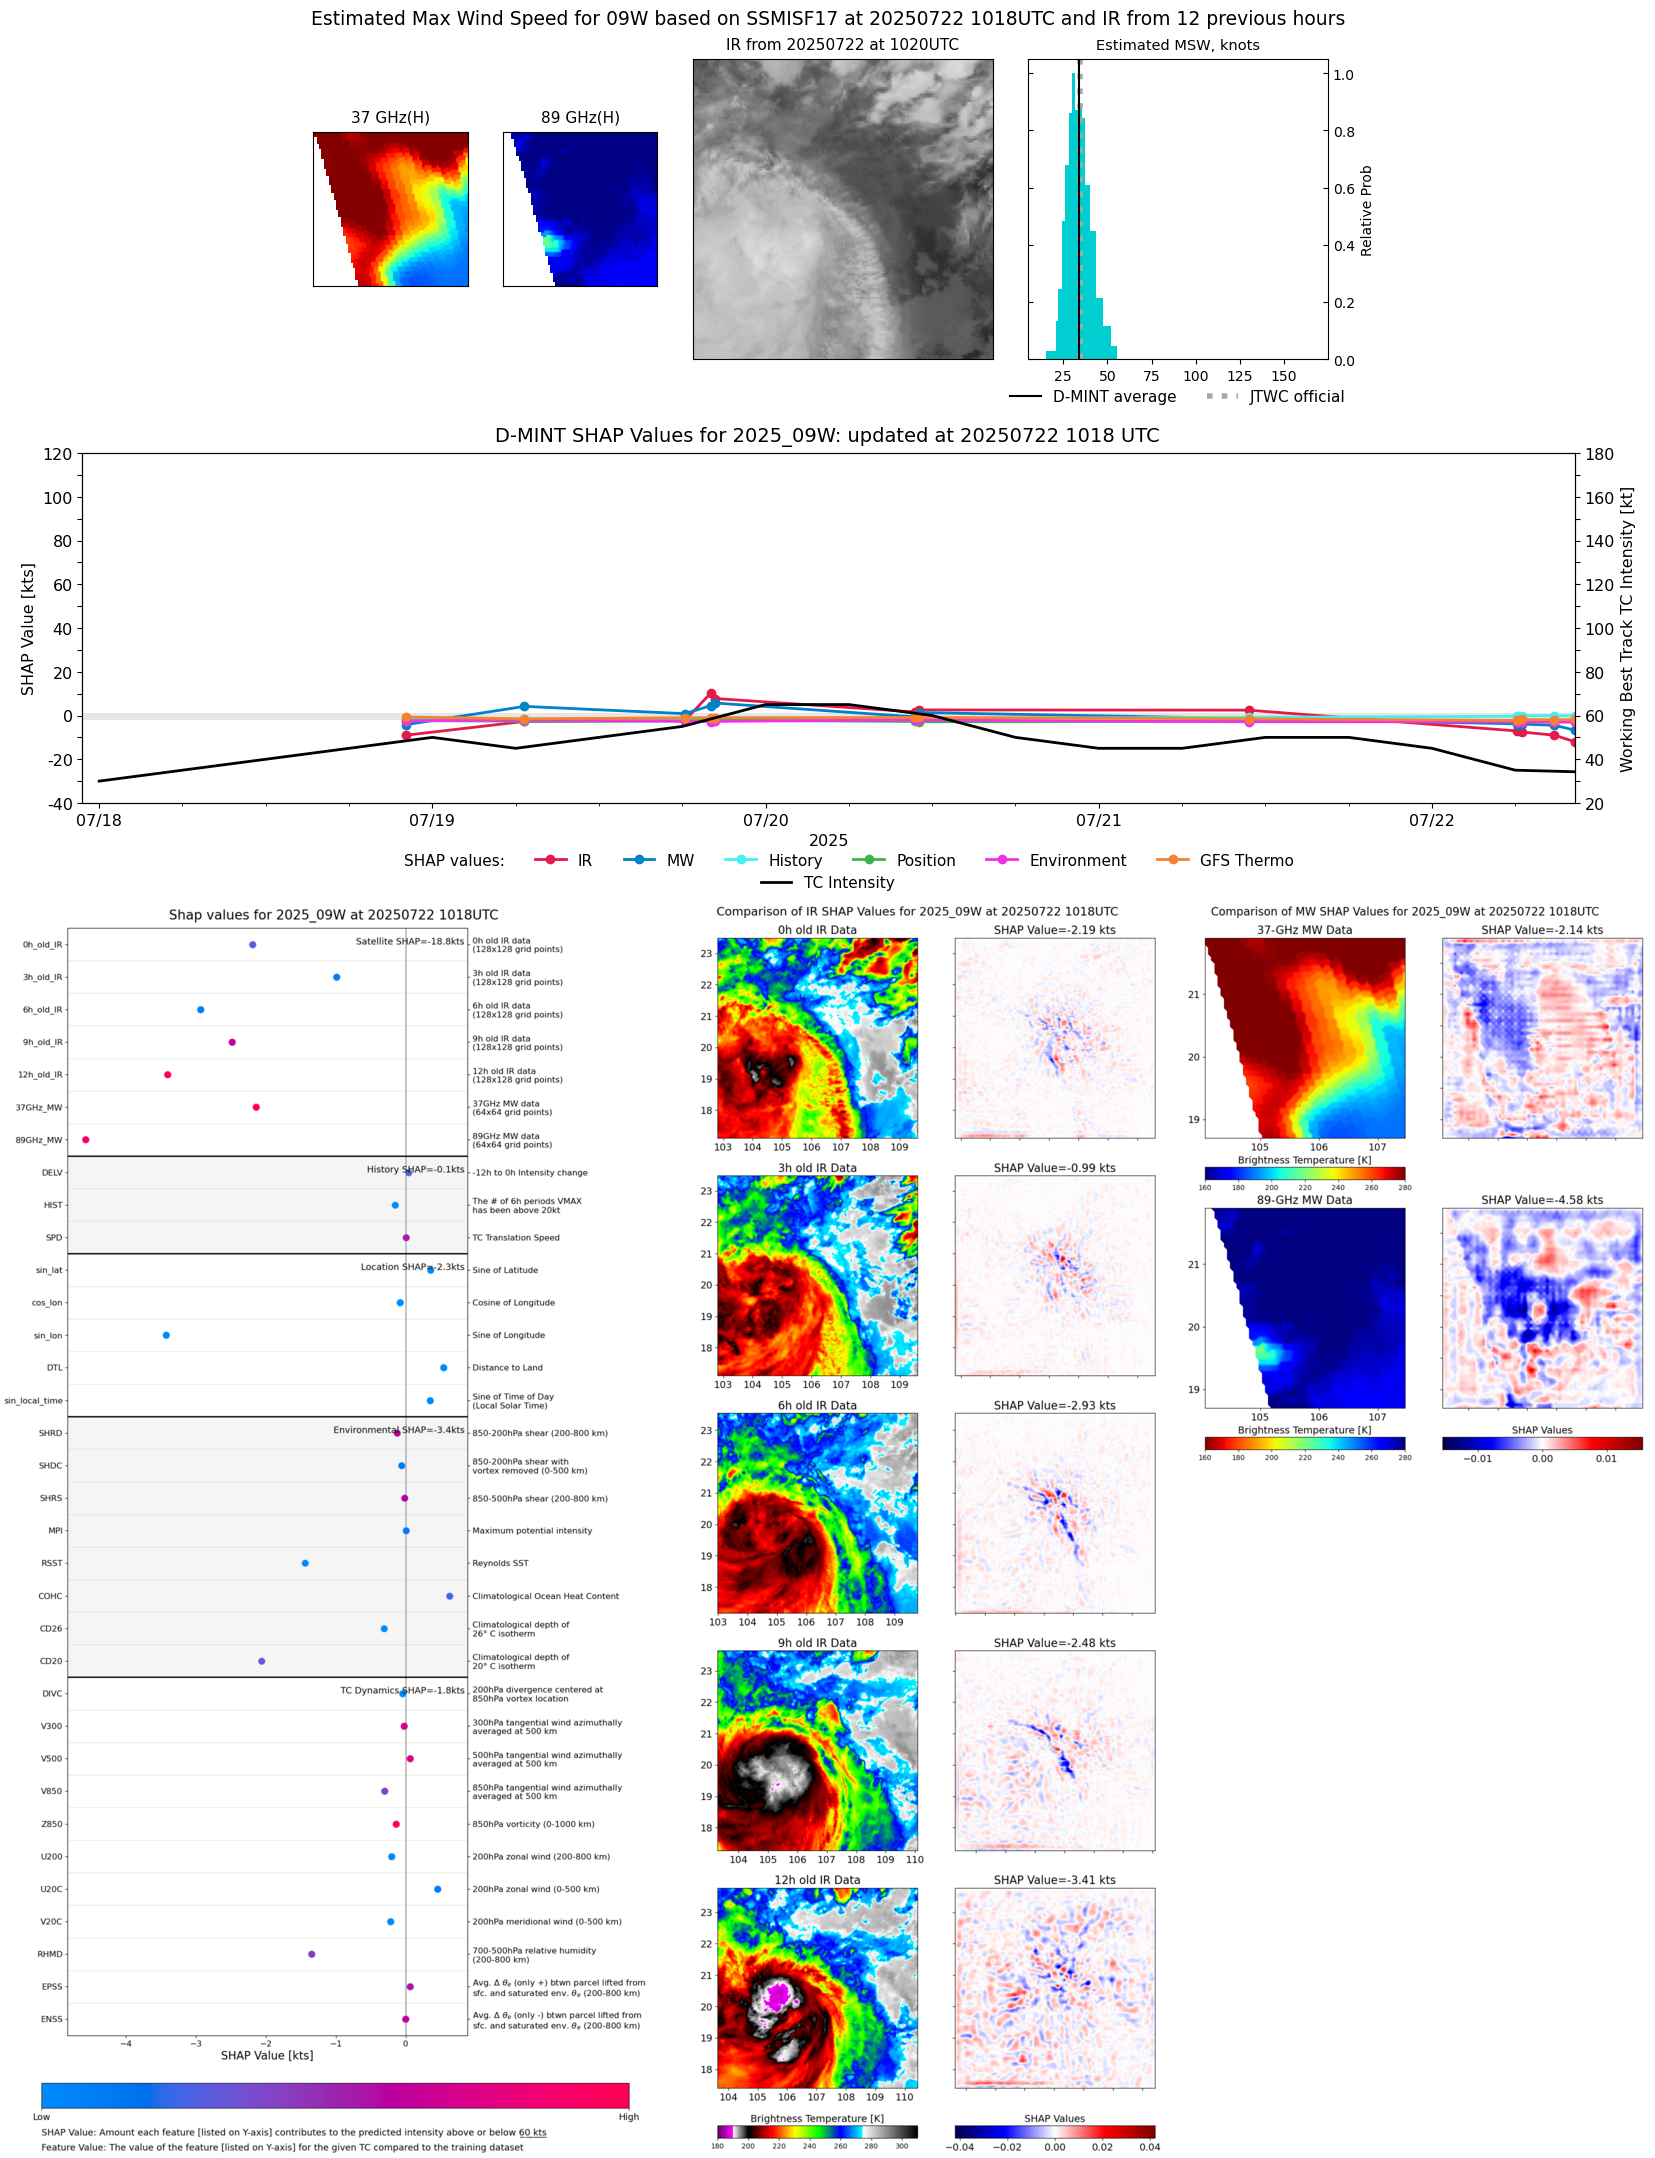 |
| 20250722 | 0849 UTC | SSMISF18 | 987 hPa | 39 kts | 33 kts | 45 kts |  |
| 20250722 | 0631 UTC | AMSR2 | 987 hPa | 41 kts | 35 kts | 47 kts | 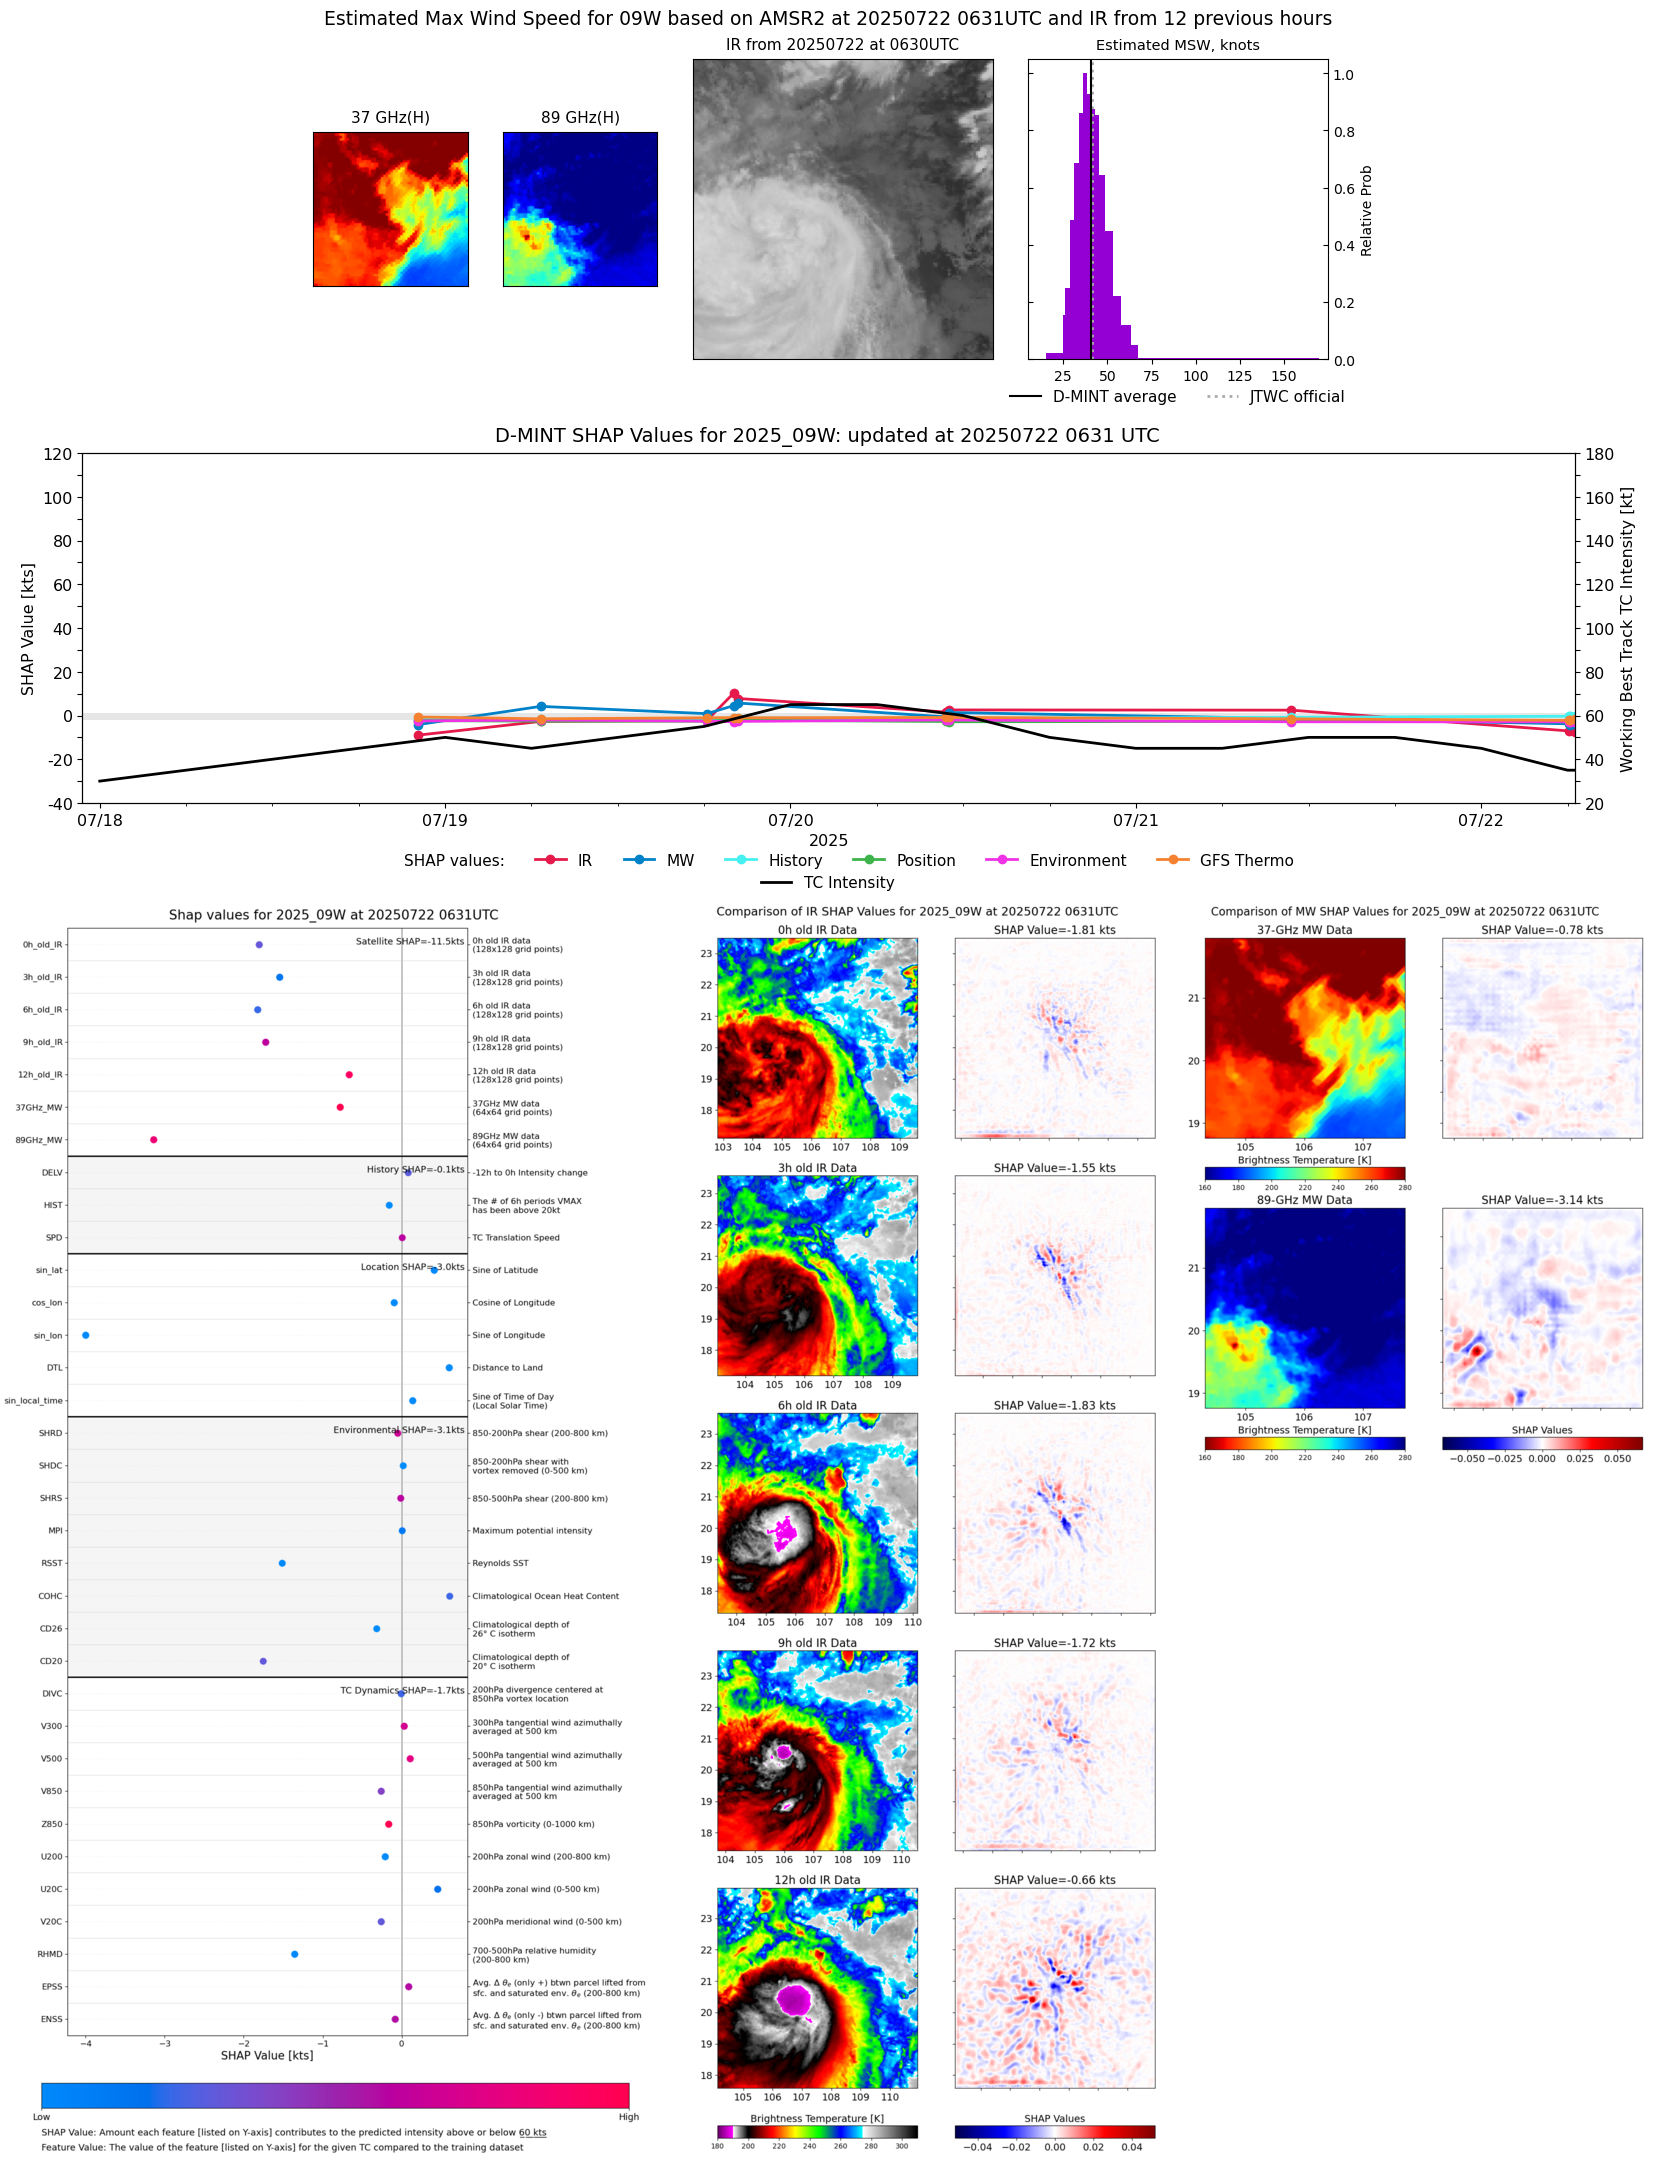 |
| 20250722 | 0612 UTC | ATMS-NPP | 984 hPa | 44 kts | 39 kts | 49 kts | 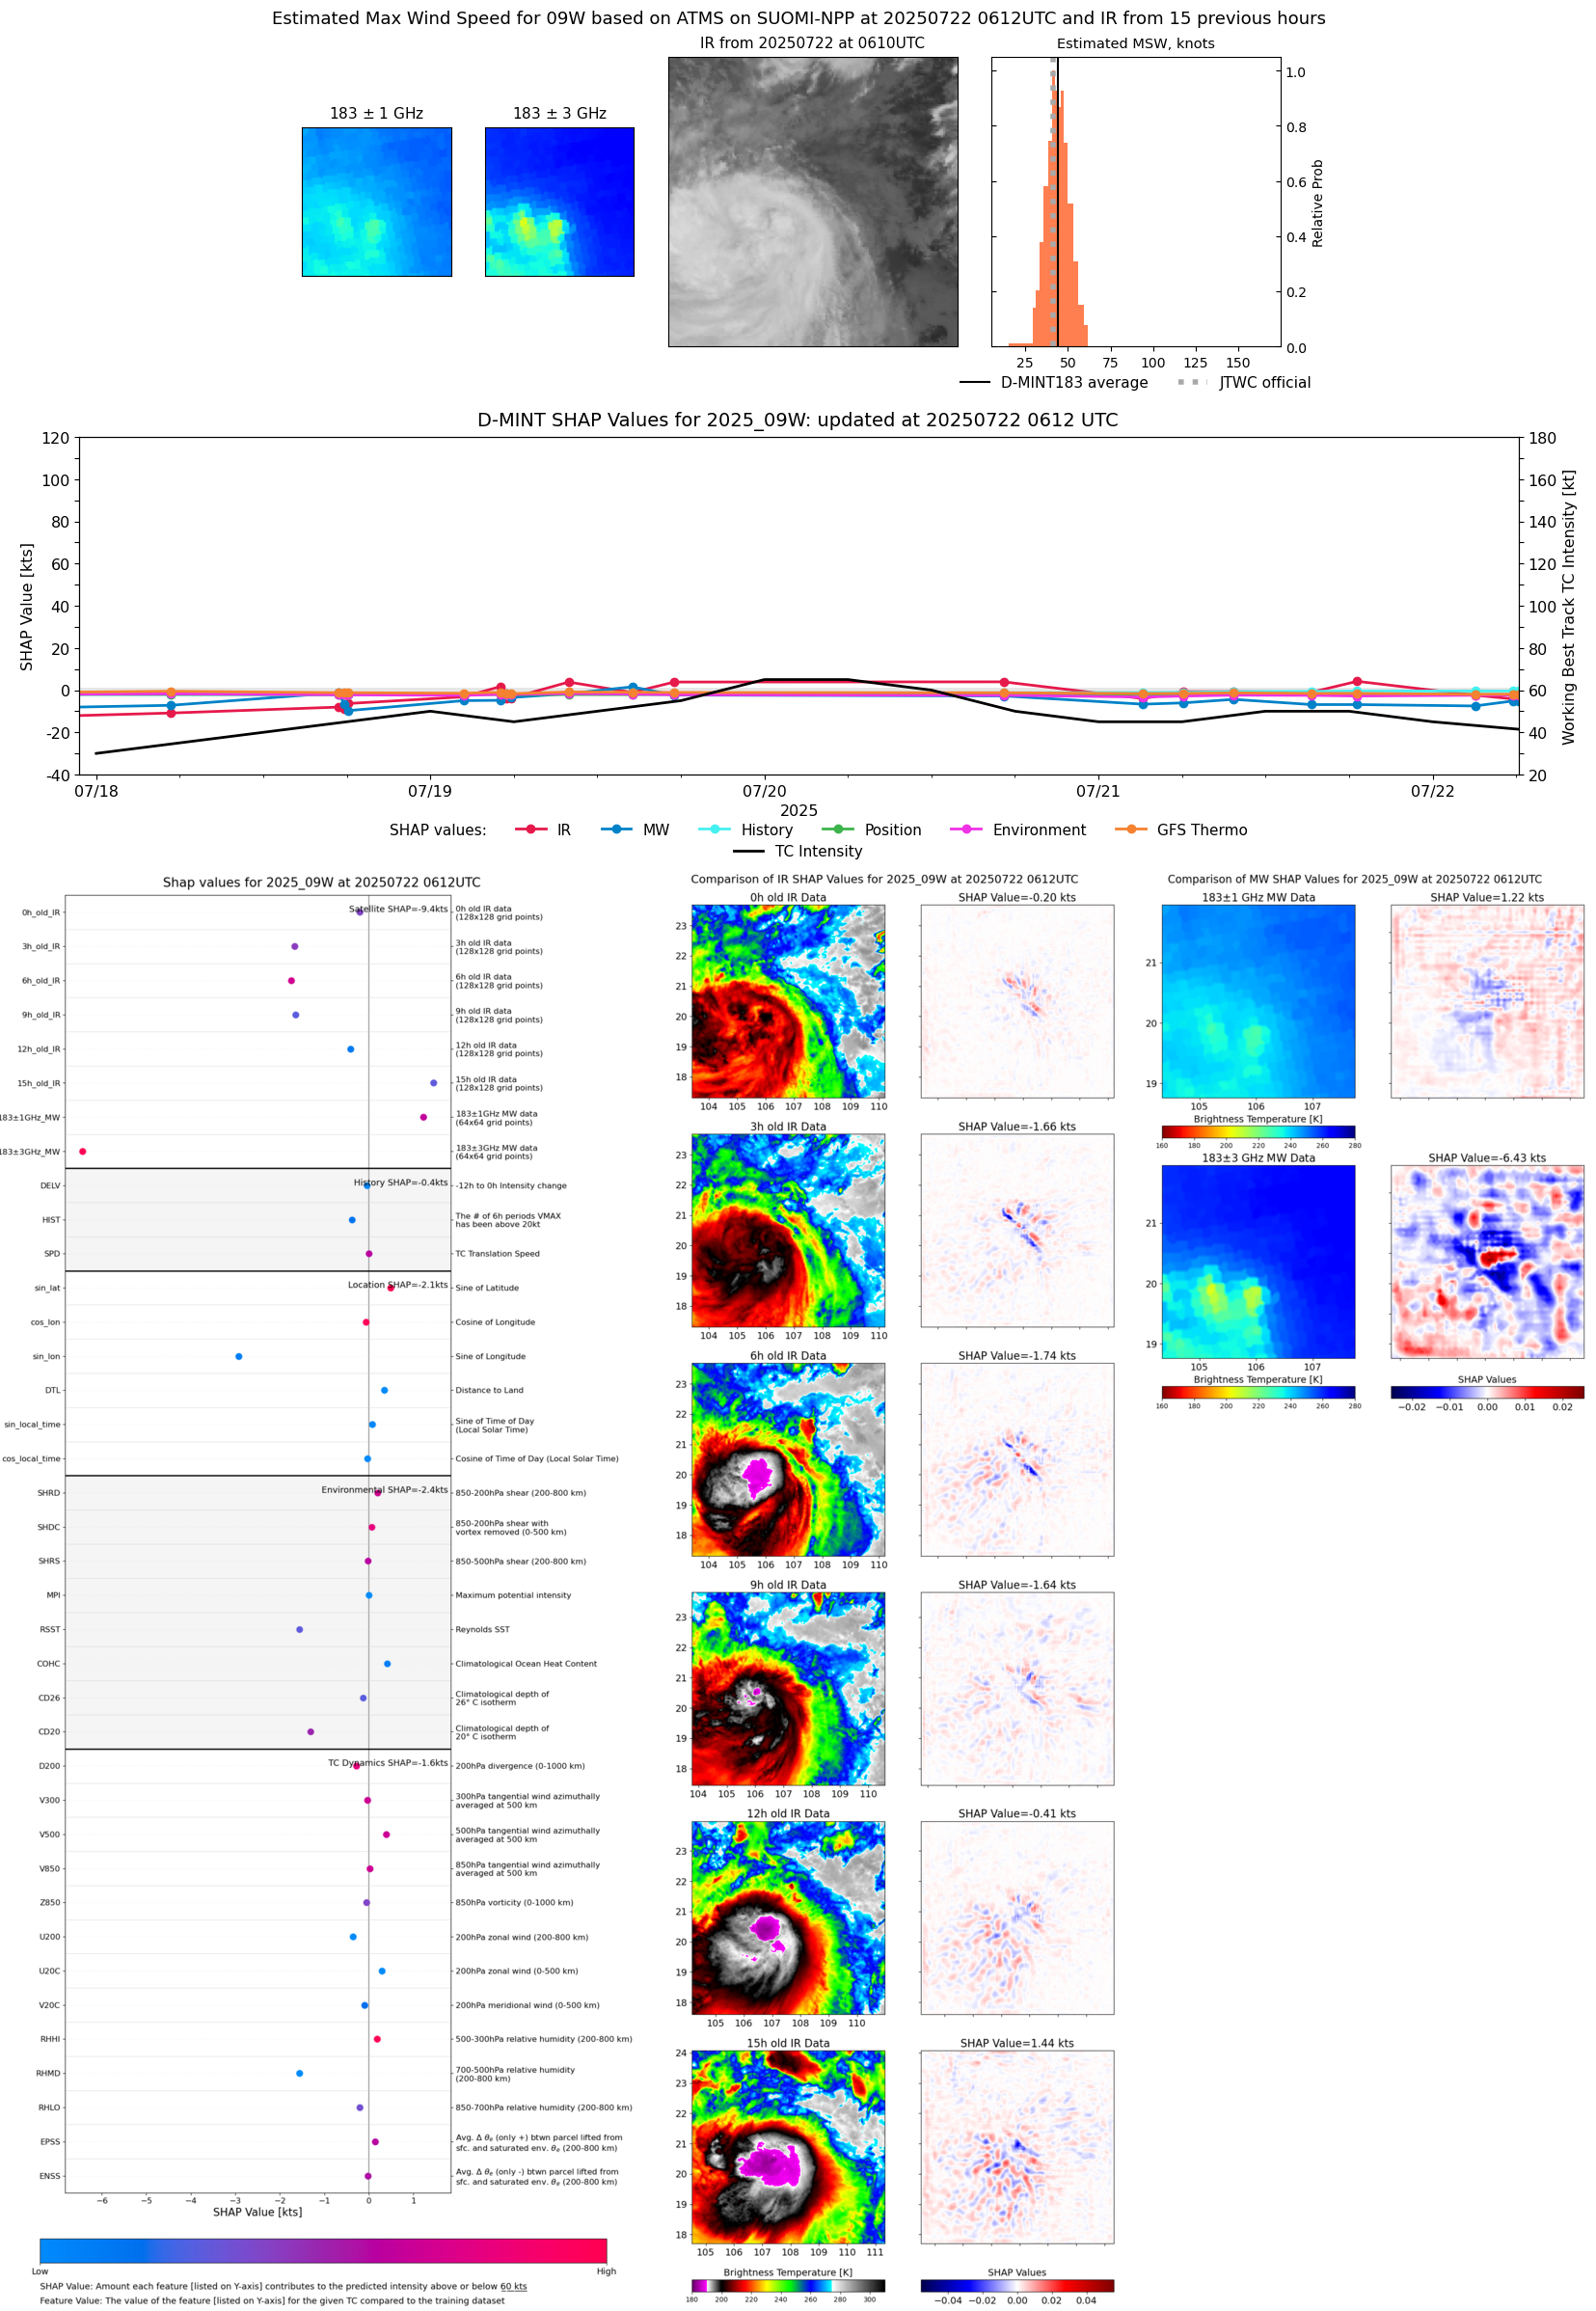 |
| 20250722 | 0611 UTC | GMI | 993 hPa | 41 kts | 35 kts | 47 kts |  |
| 20250722 | 0608 UTC | GMI | 993 hPa | 41 kts | 36 kts | 47 kts | 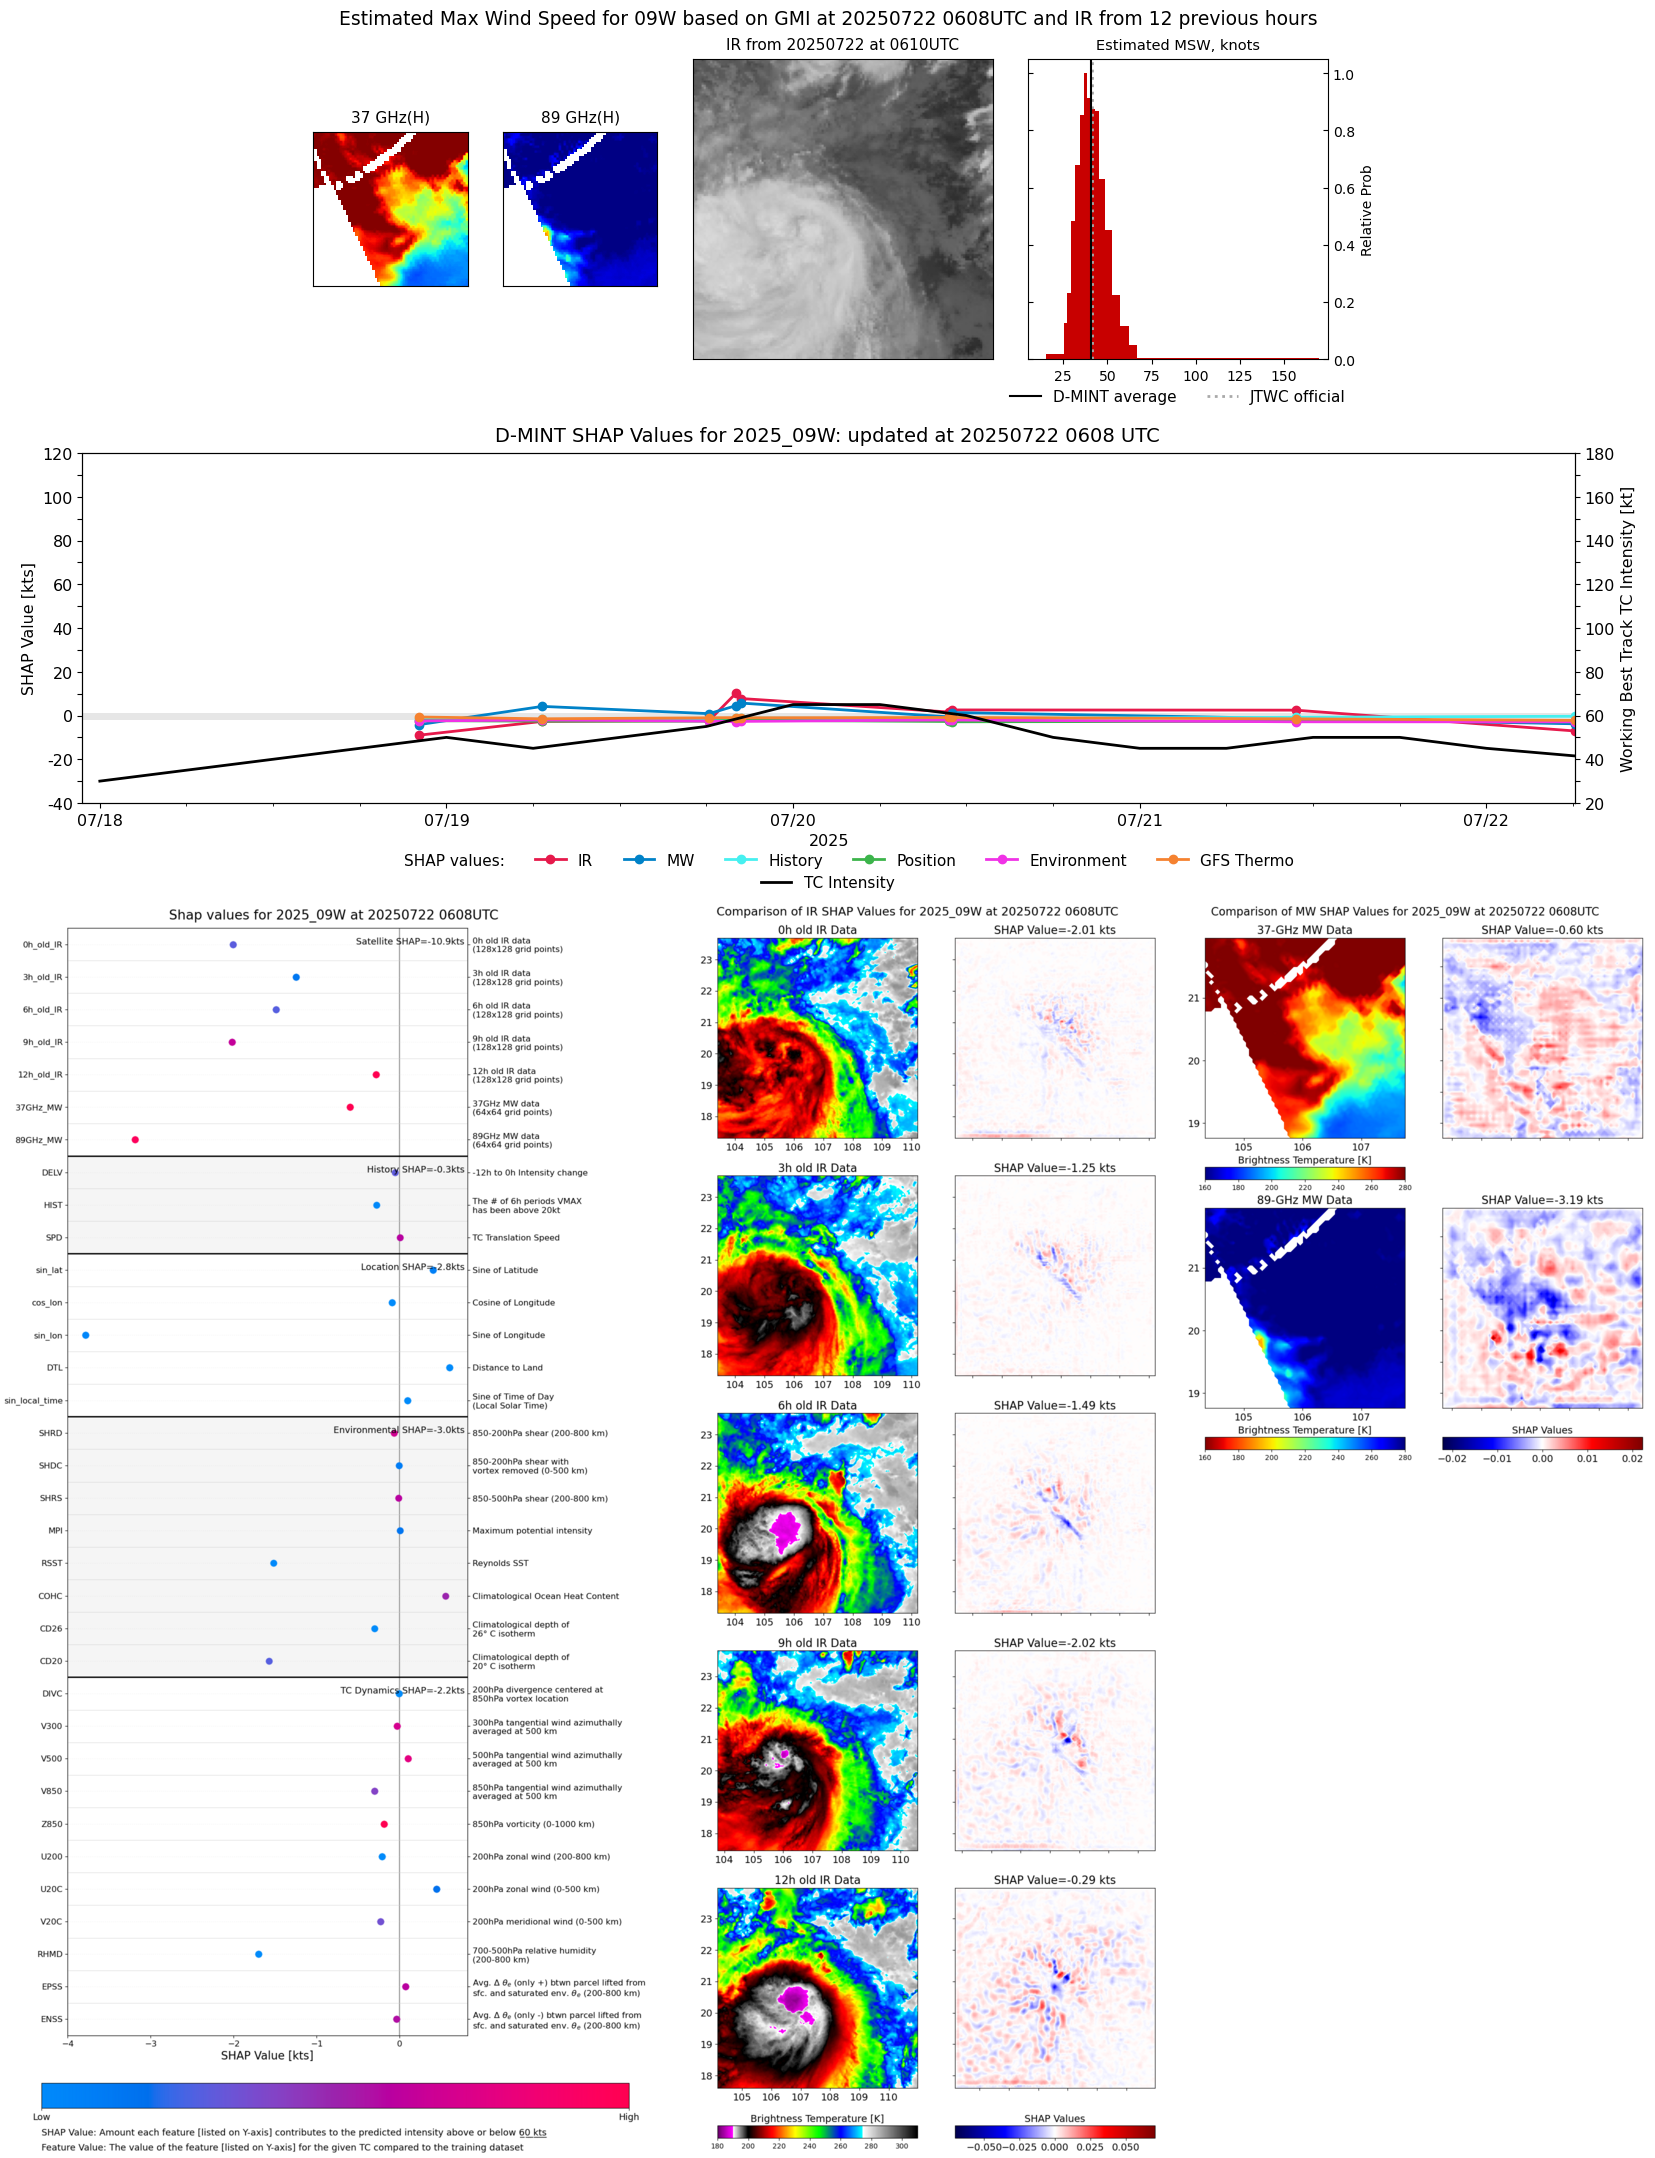 |
| 20250722 | 0547 UTC | ATMS-N21 | 986 hPa | 44 kts | 40 kts | 49 kts | 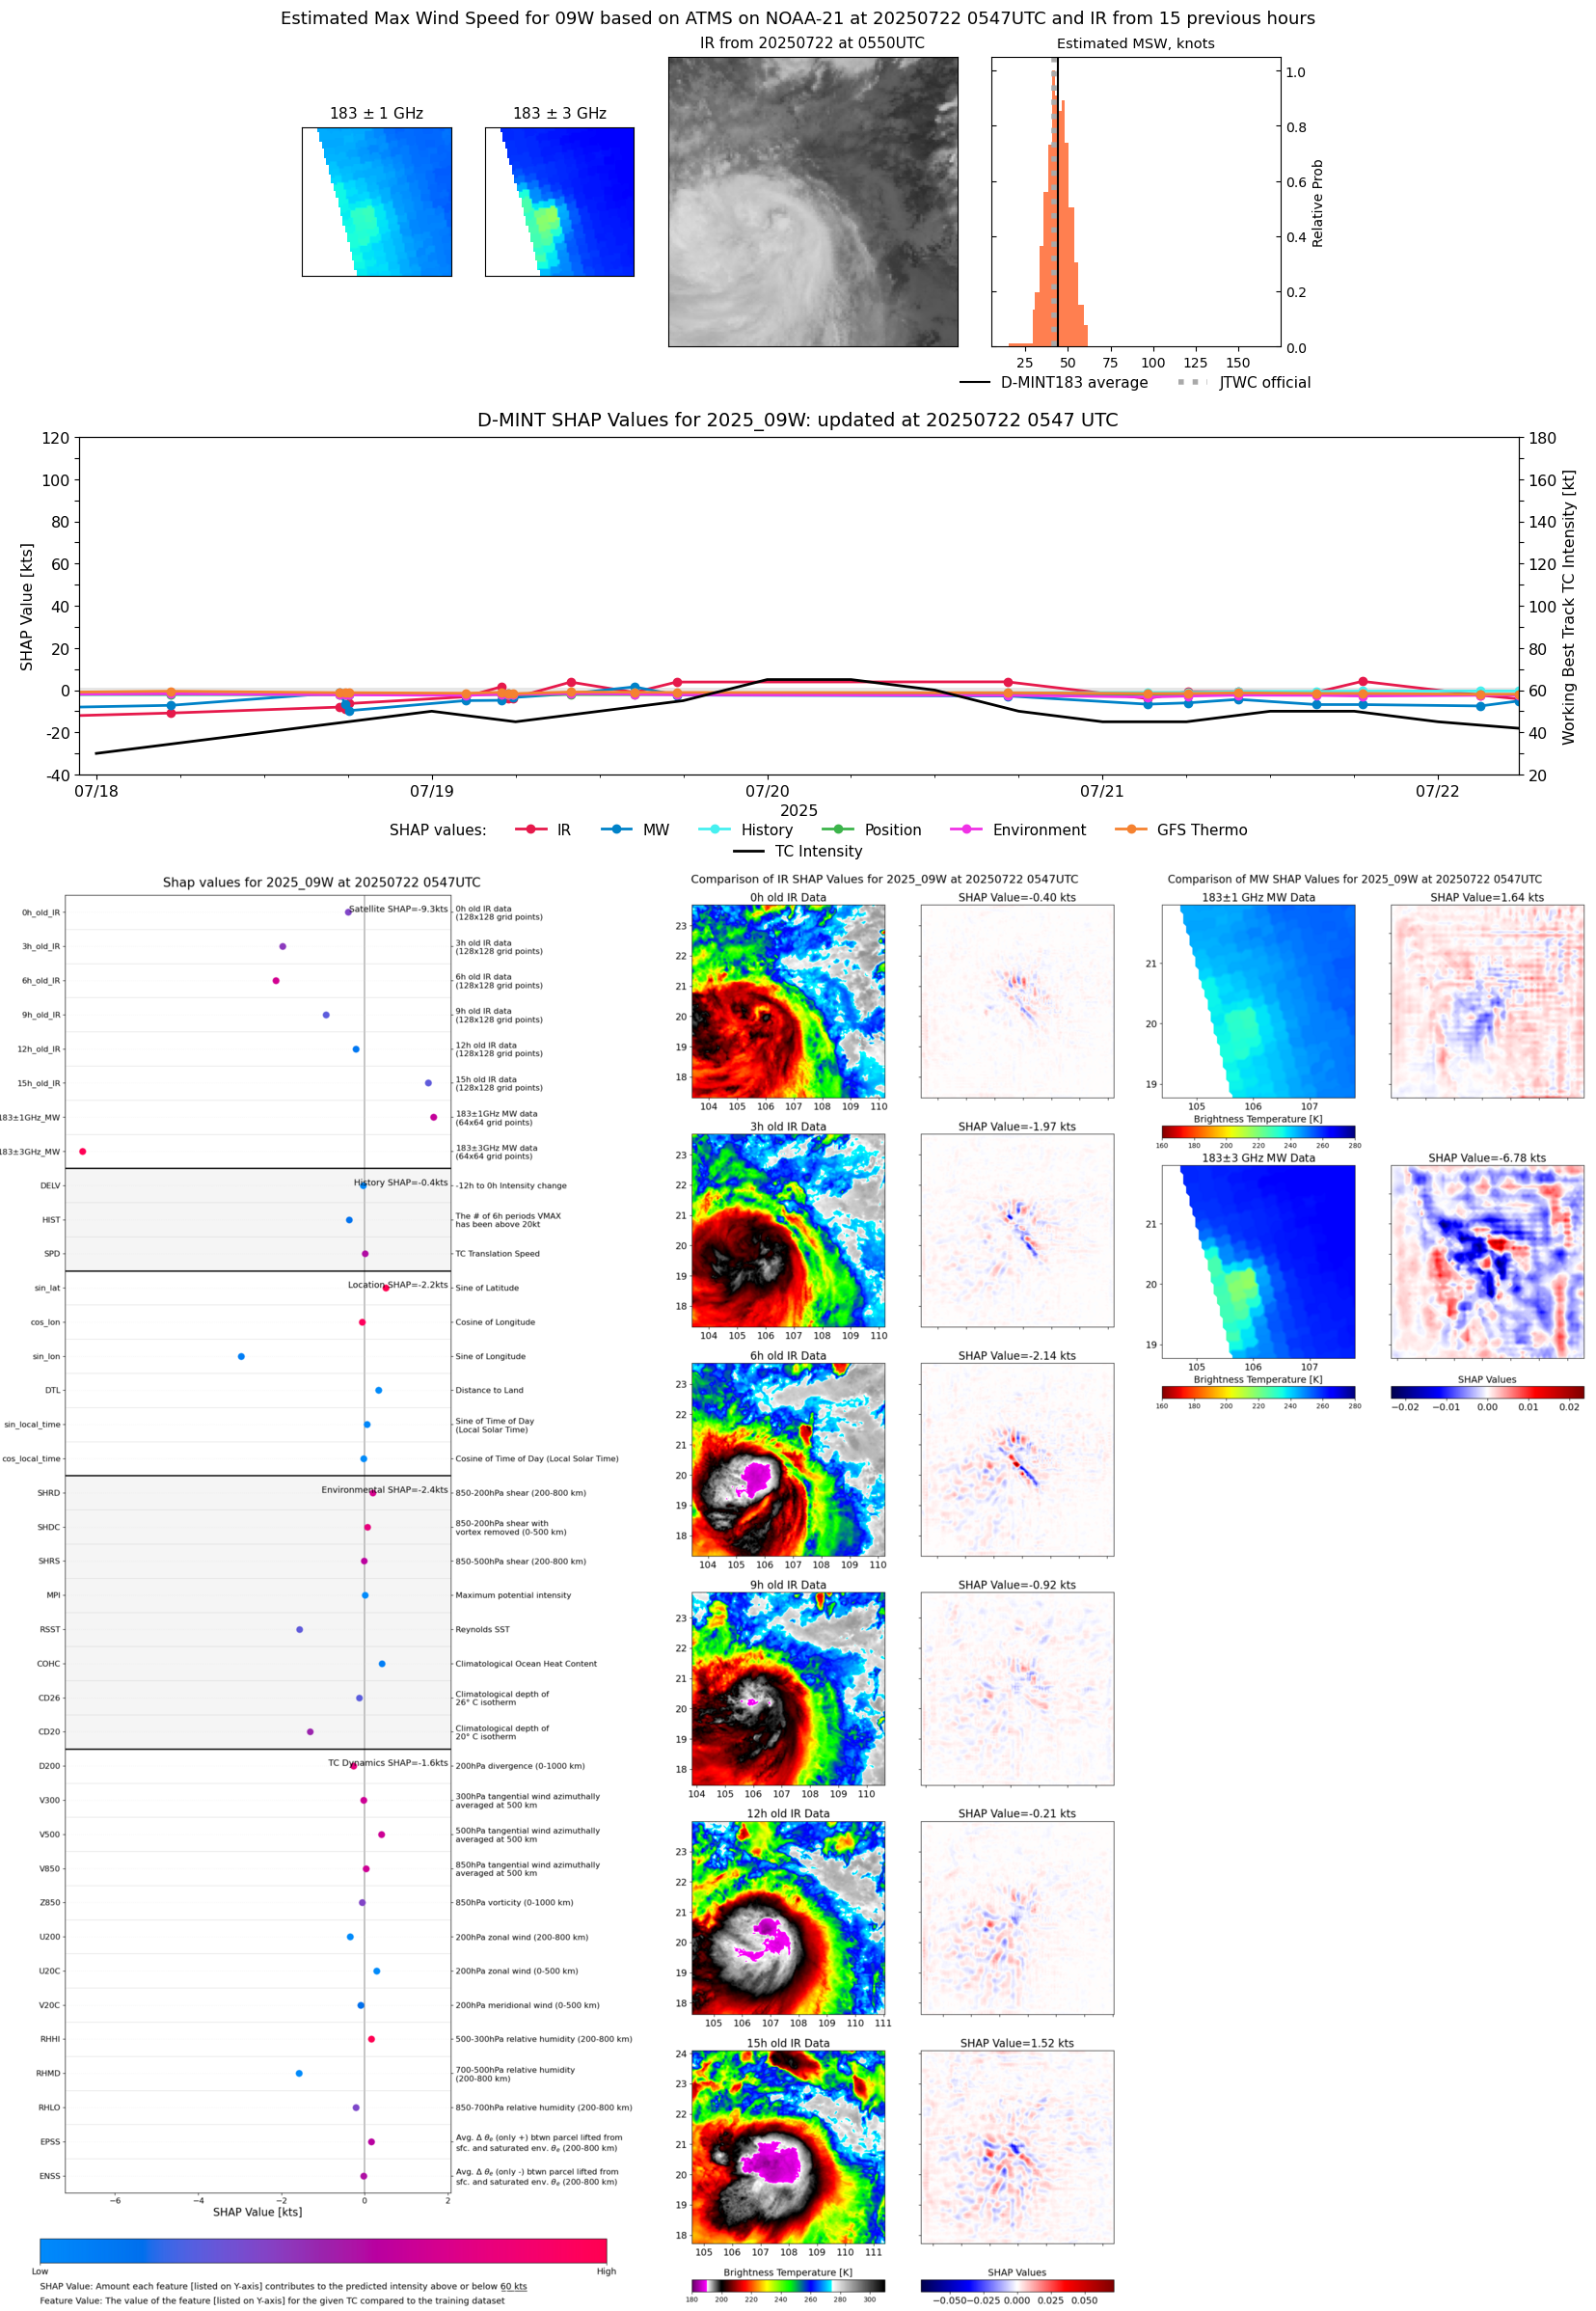 |
| 20250722 | 0303 UTC | TMS03 | 984 hPa | 44 kts | 39 kts | 48 kts | 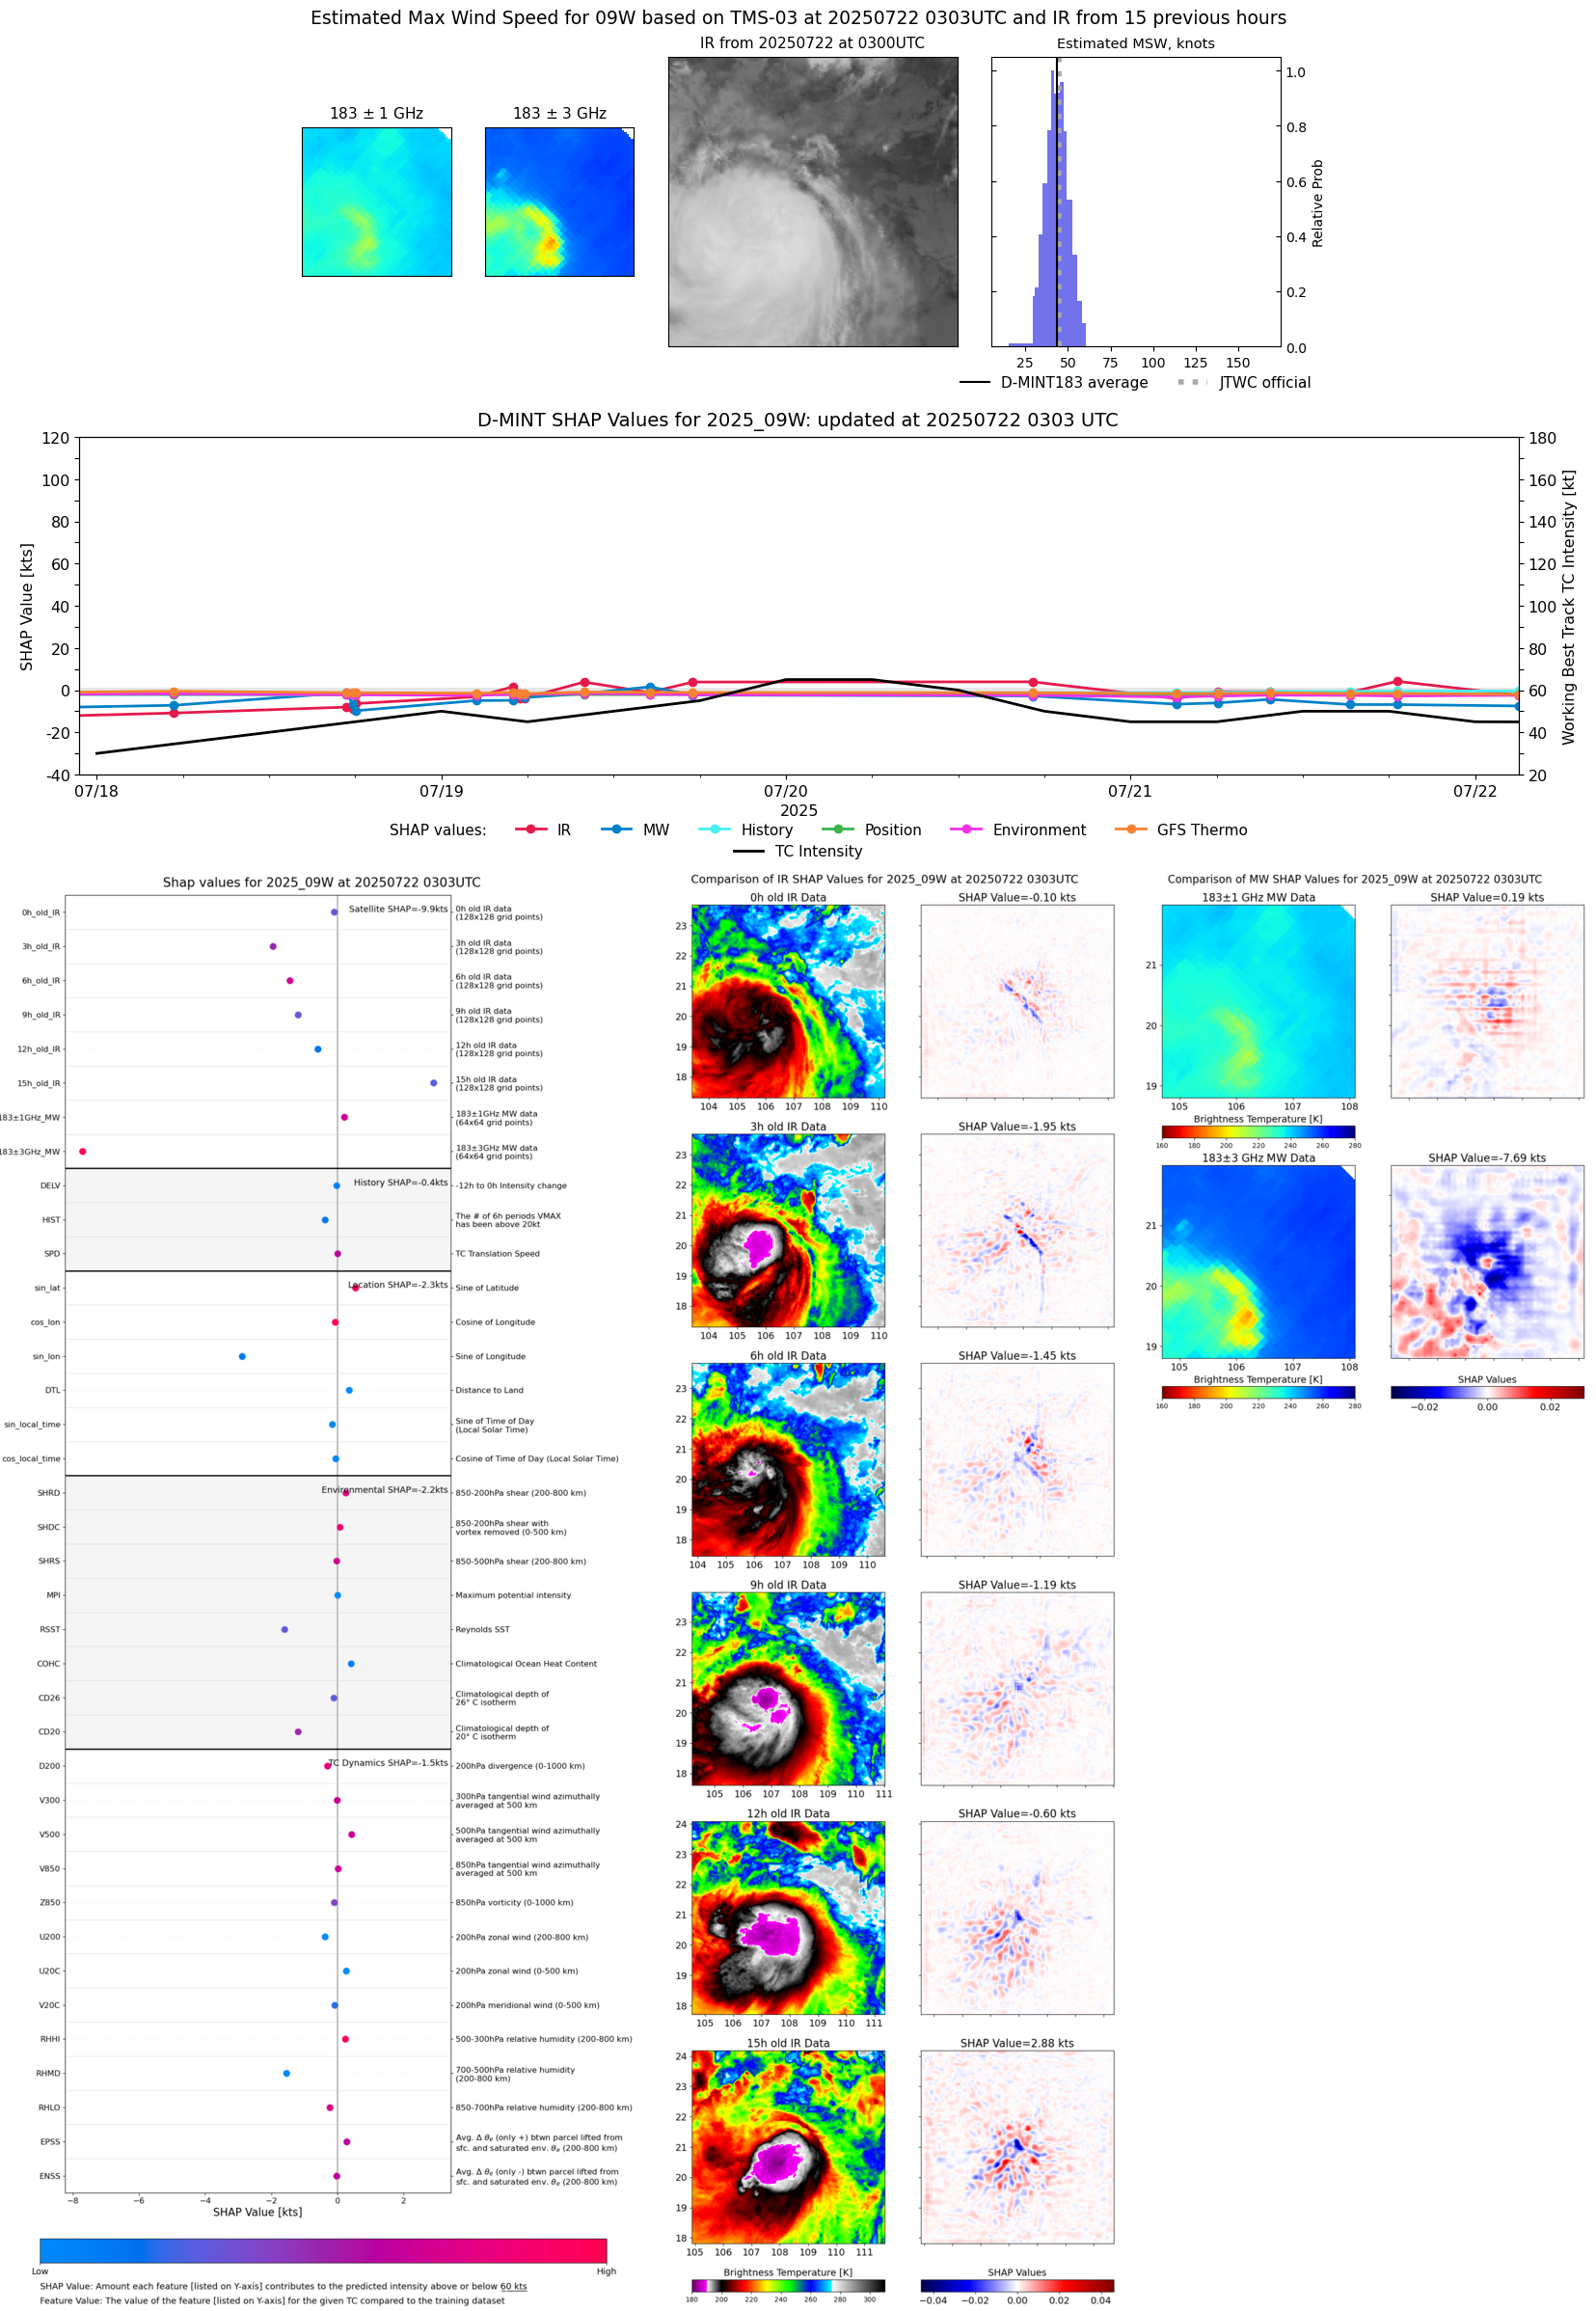 |
| 20250721 | 1835 UTC | ATMS-N21 | 978 hPa | 51 kts | 46 kts | 56 kts | 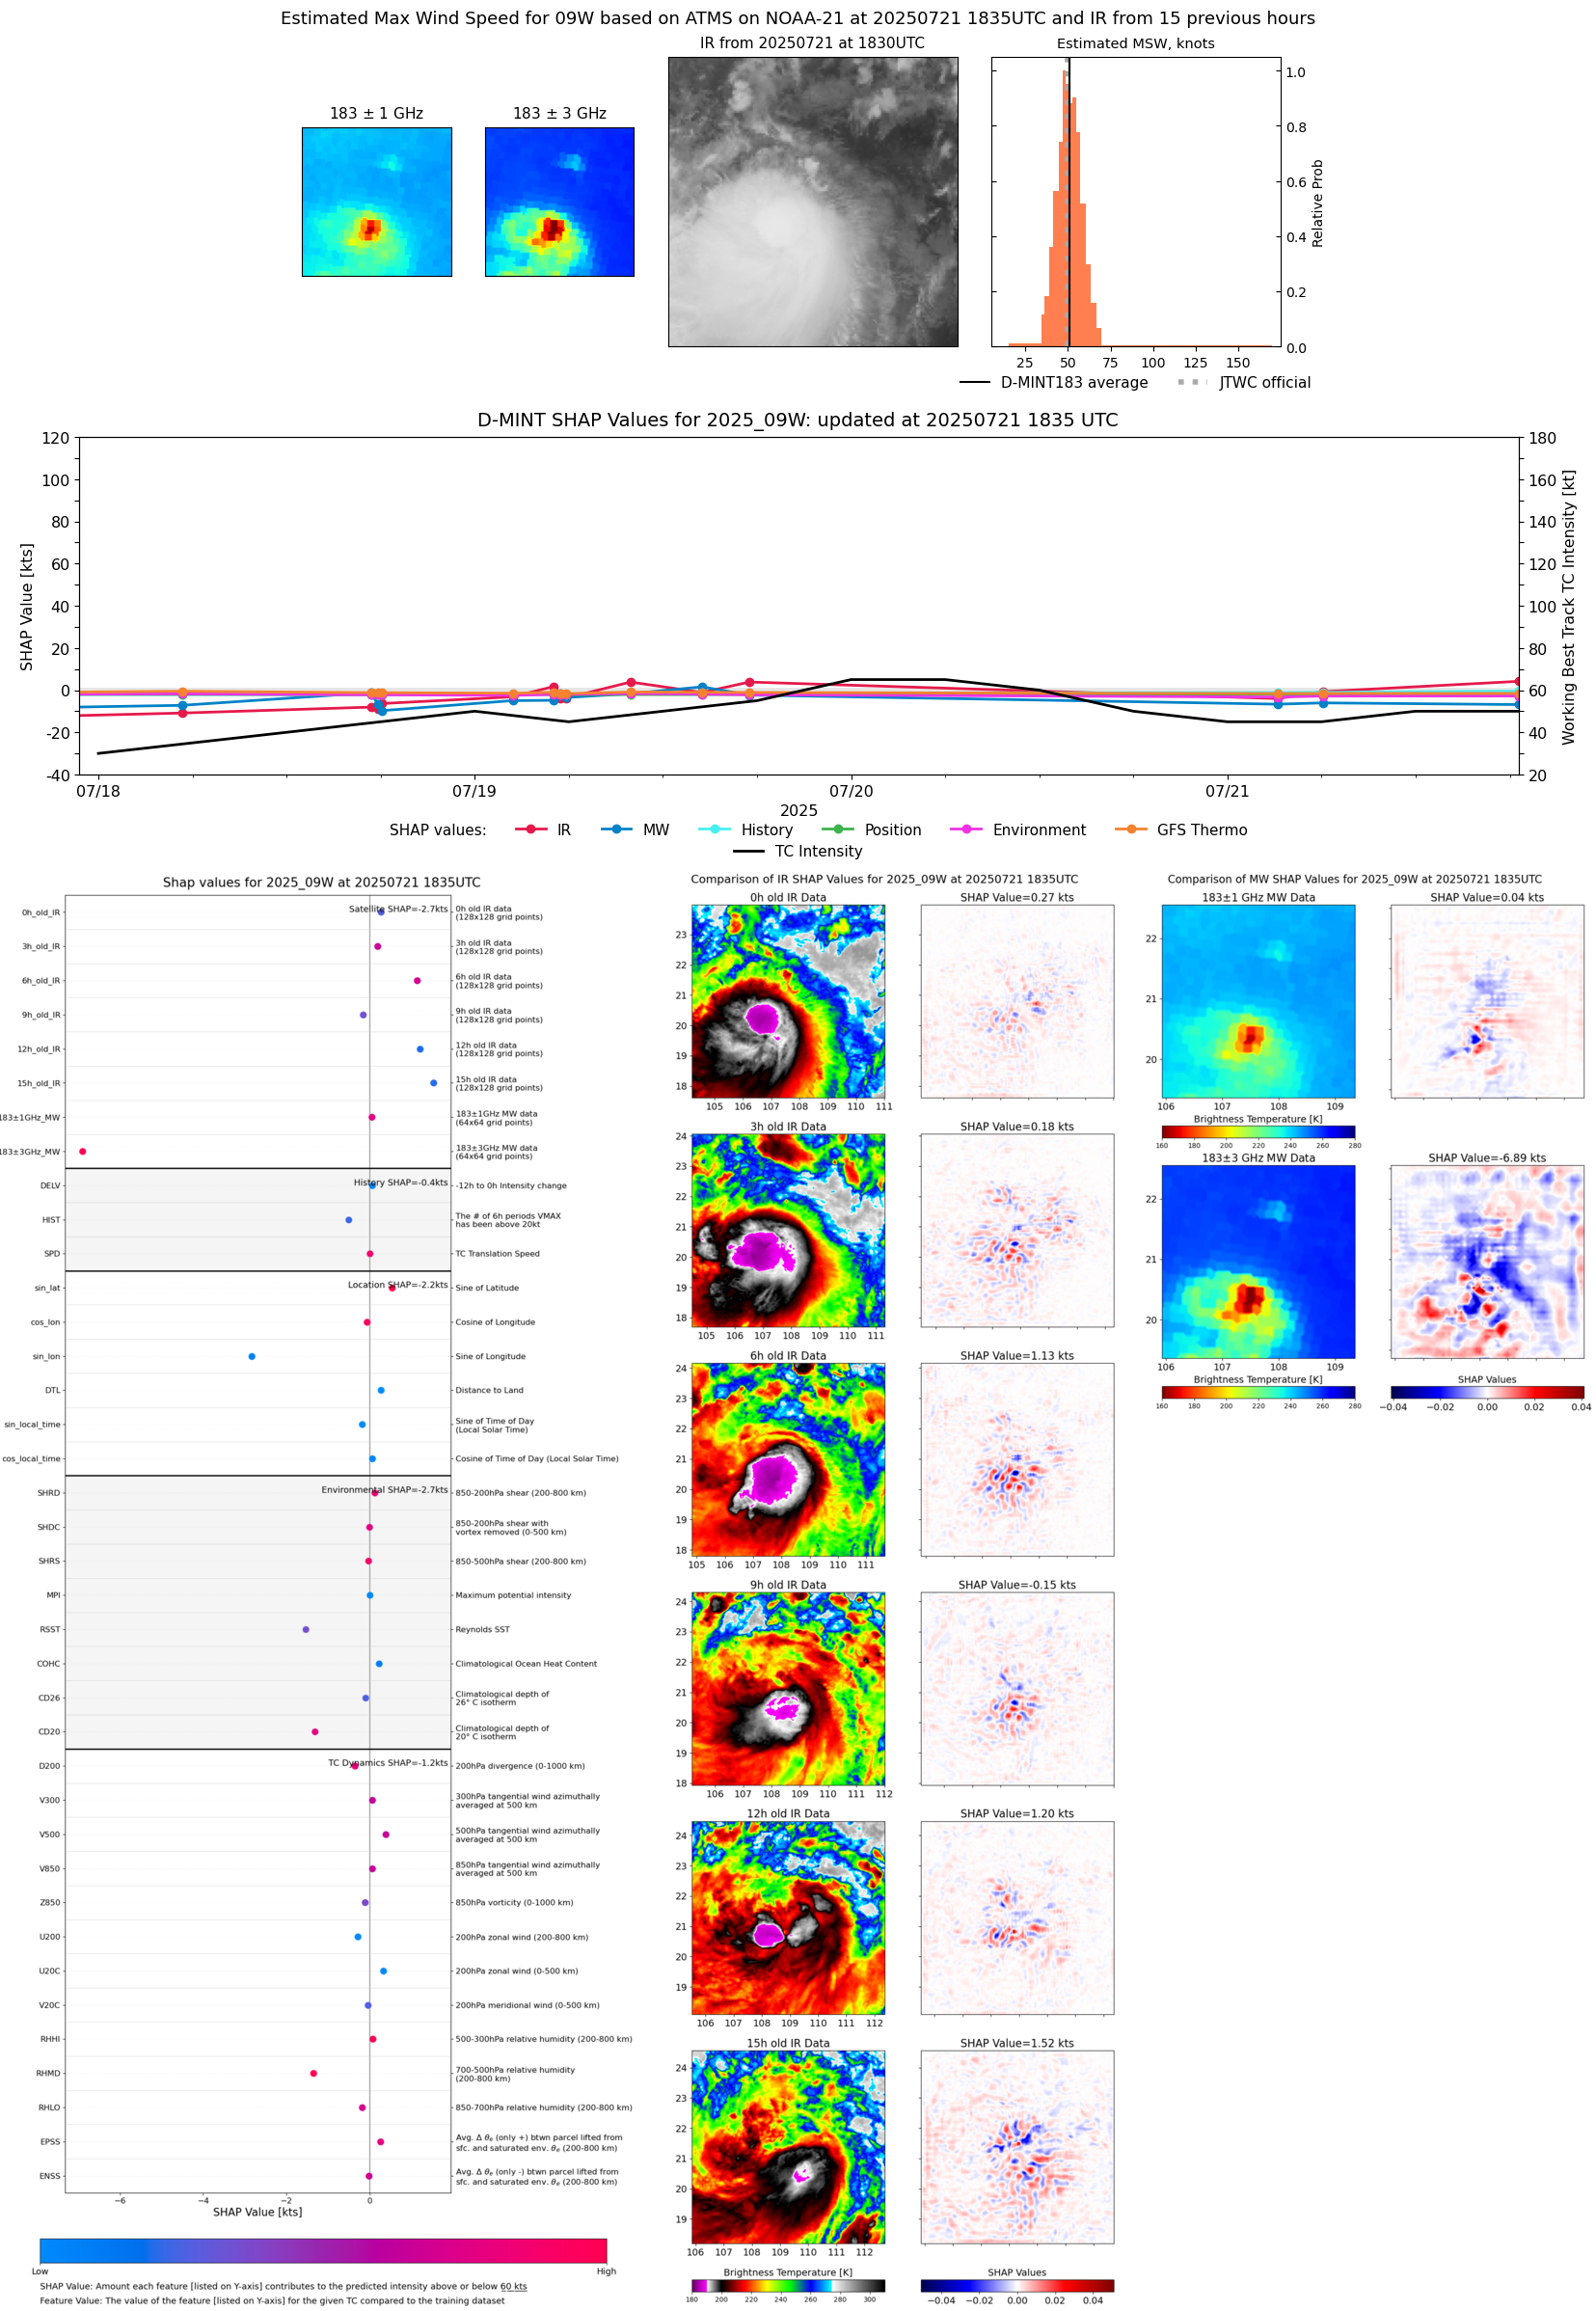 |
| 20250721 | 1518 UTC | TMS02 | 982 hPa | 46 kts | 41 kts | 51 kts |  |
| 20250721 | 1047 UTC | SSMISF16 | 981 hPa | 53 kts | 47 kts | 61 kts | 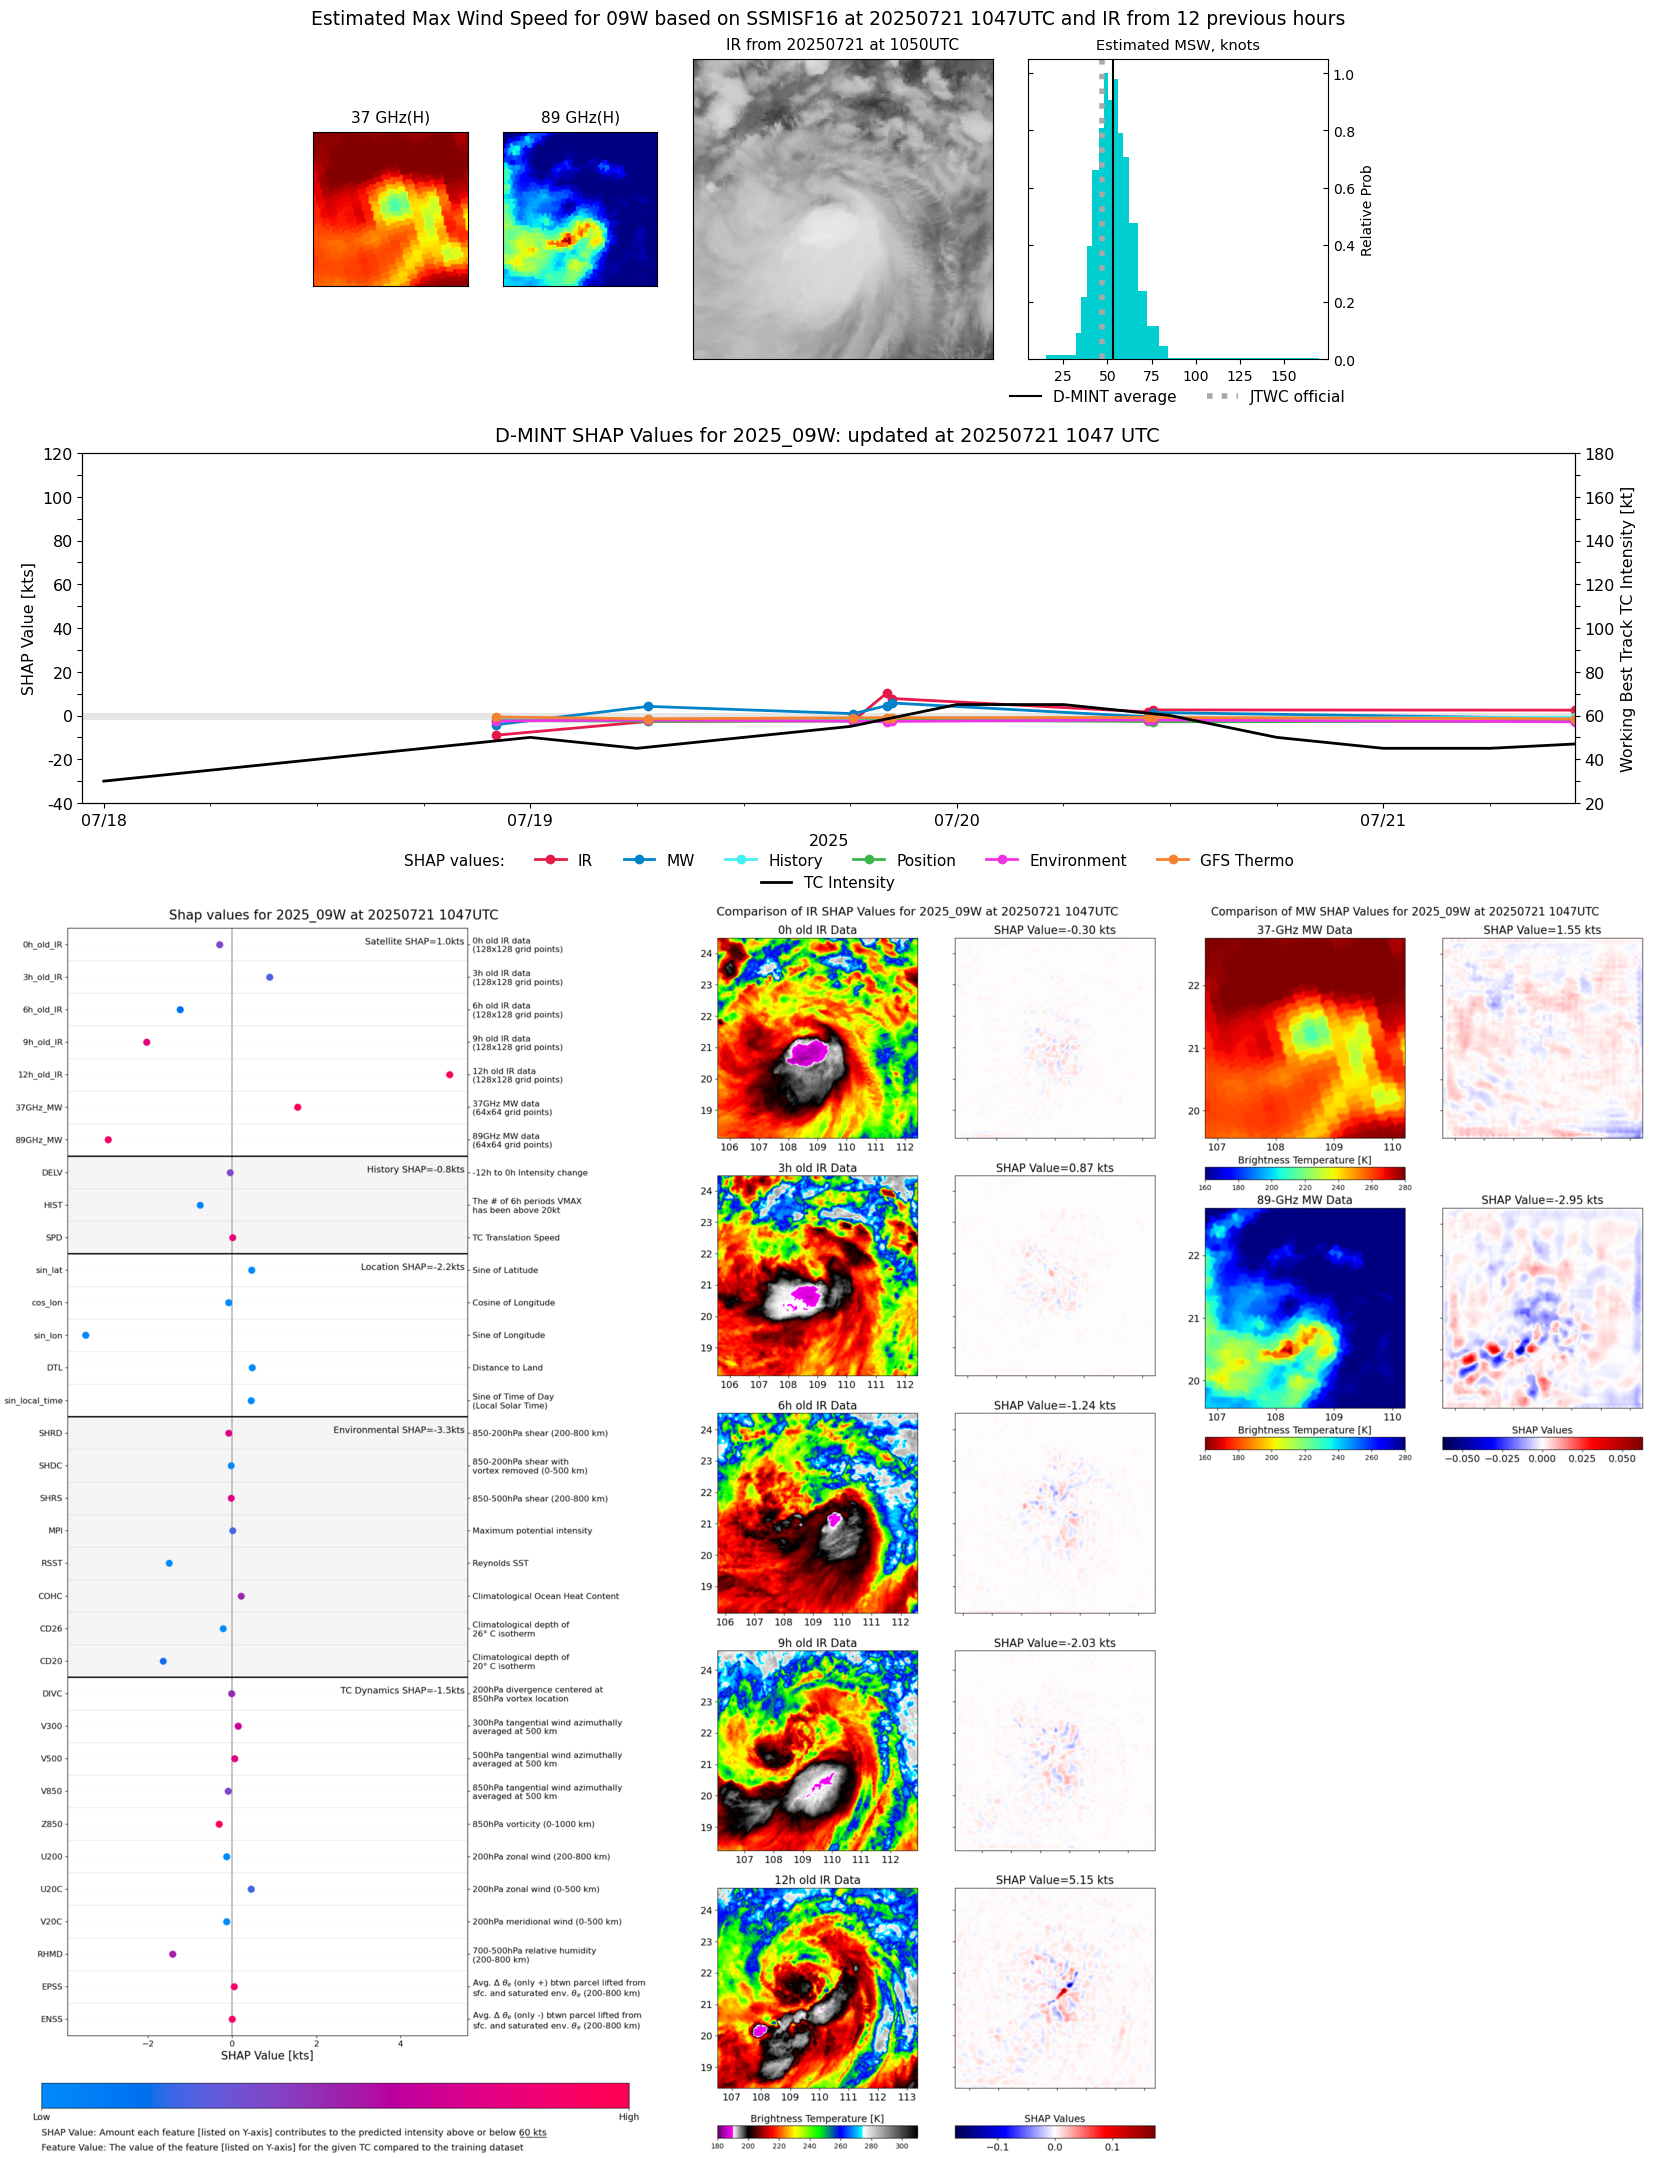 |
| 20250721 | 0943 UTC | TROPICS03 | 982 hPa | 49 kts | 43 kts | 54 kts | 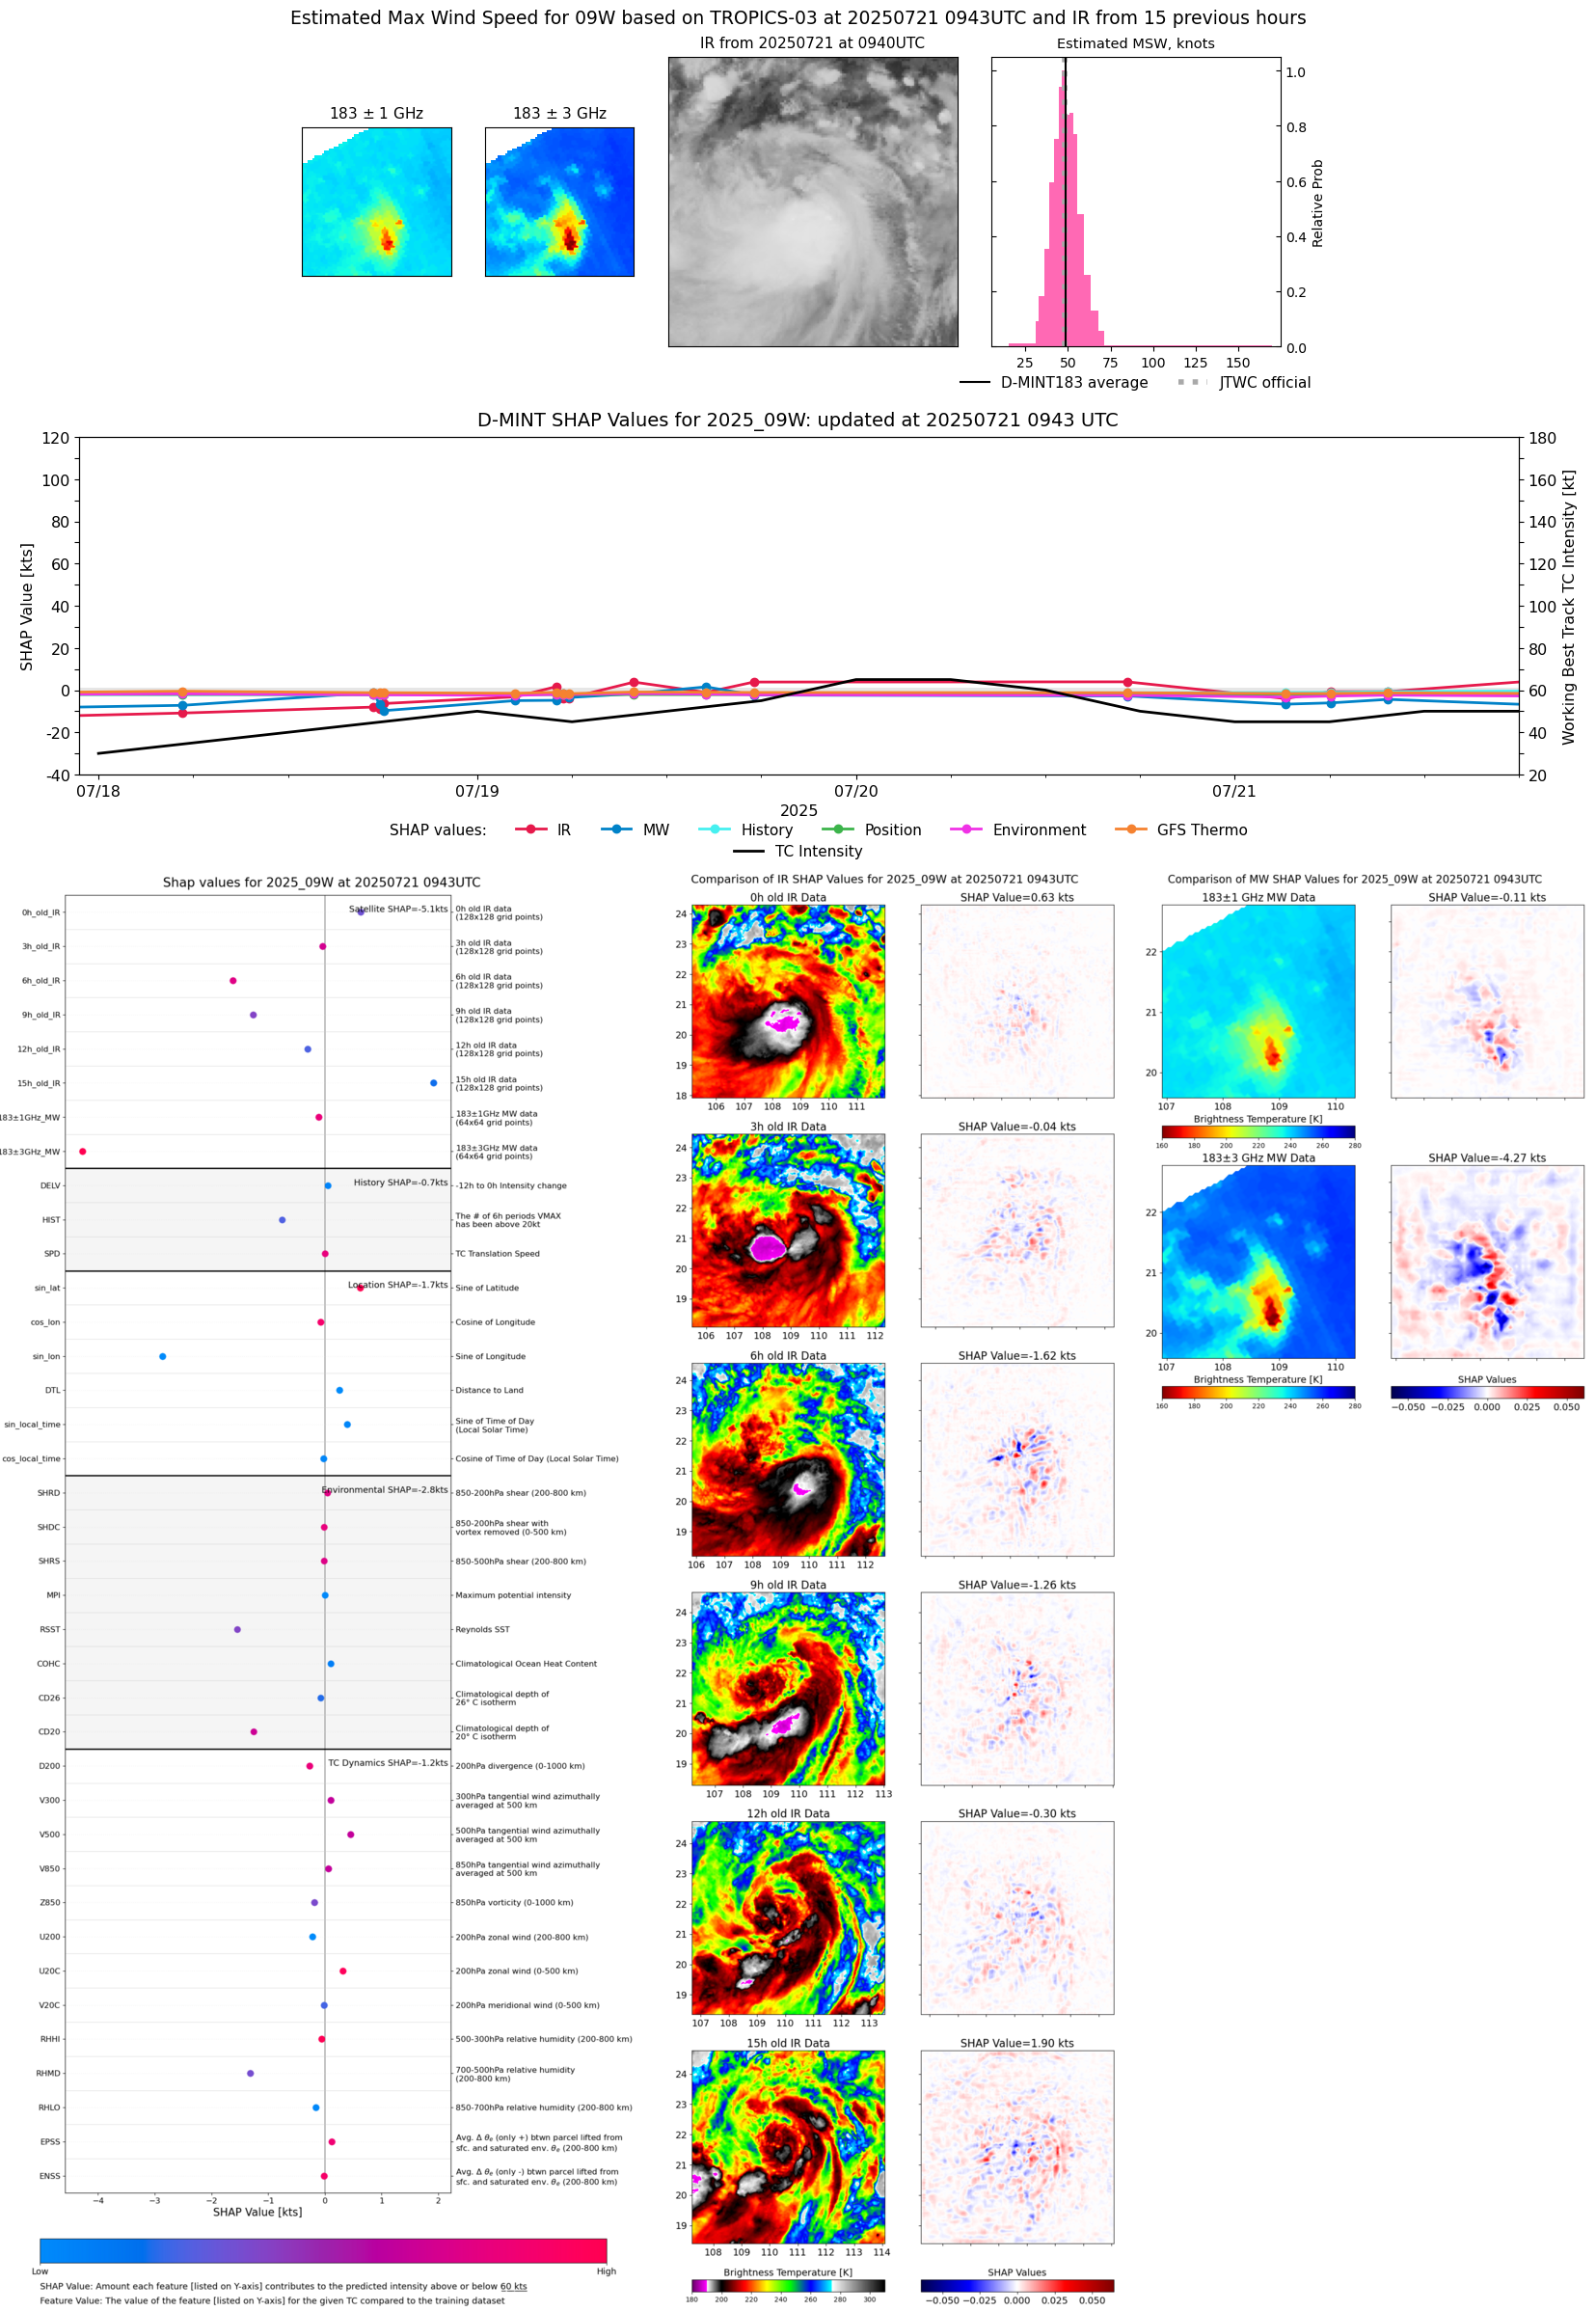 |
| 20250721 | 0606 UTC | ATMS-N21 | 988 hPa | 46 kts | 41 kts | 51 kts | 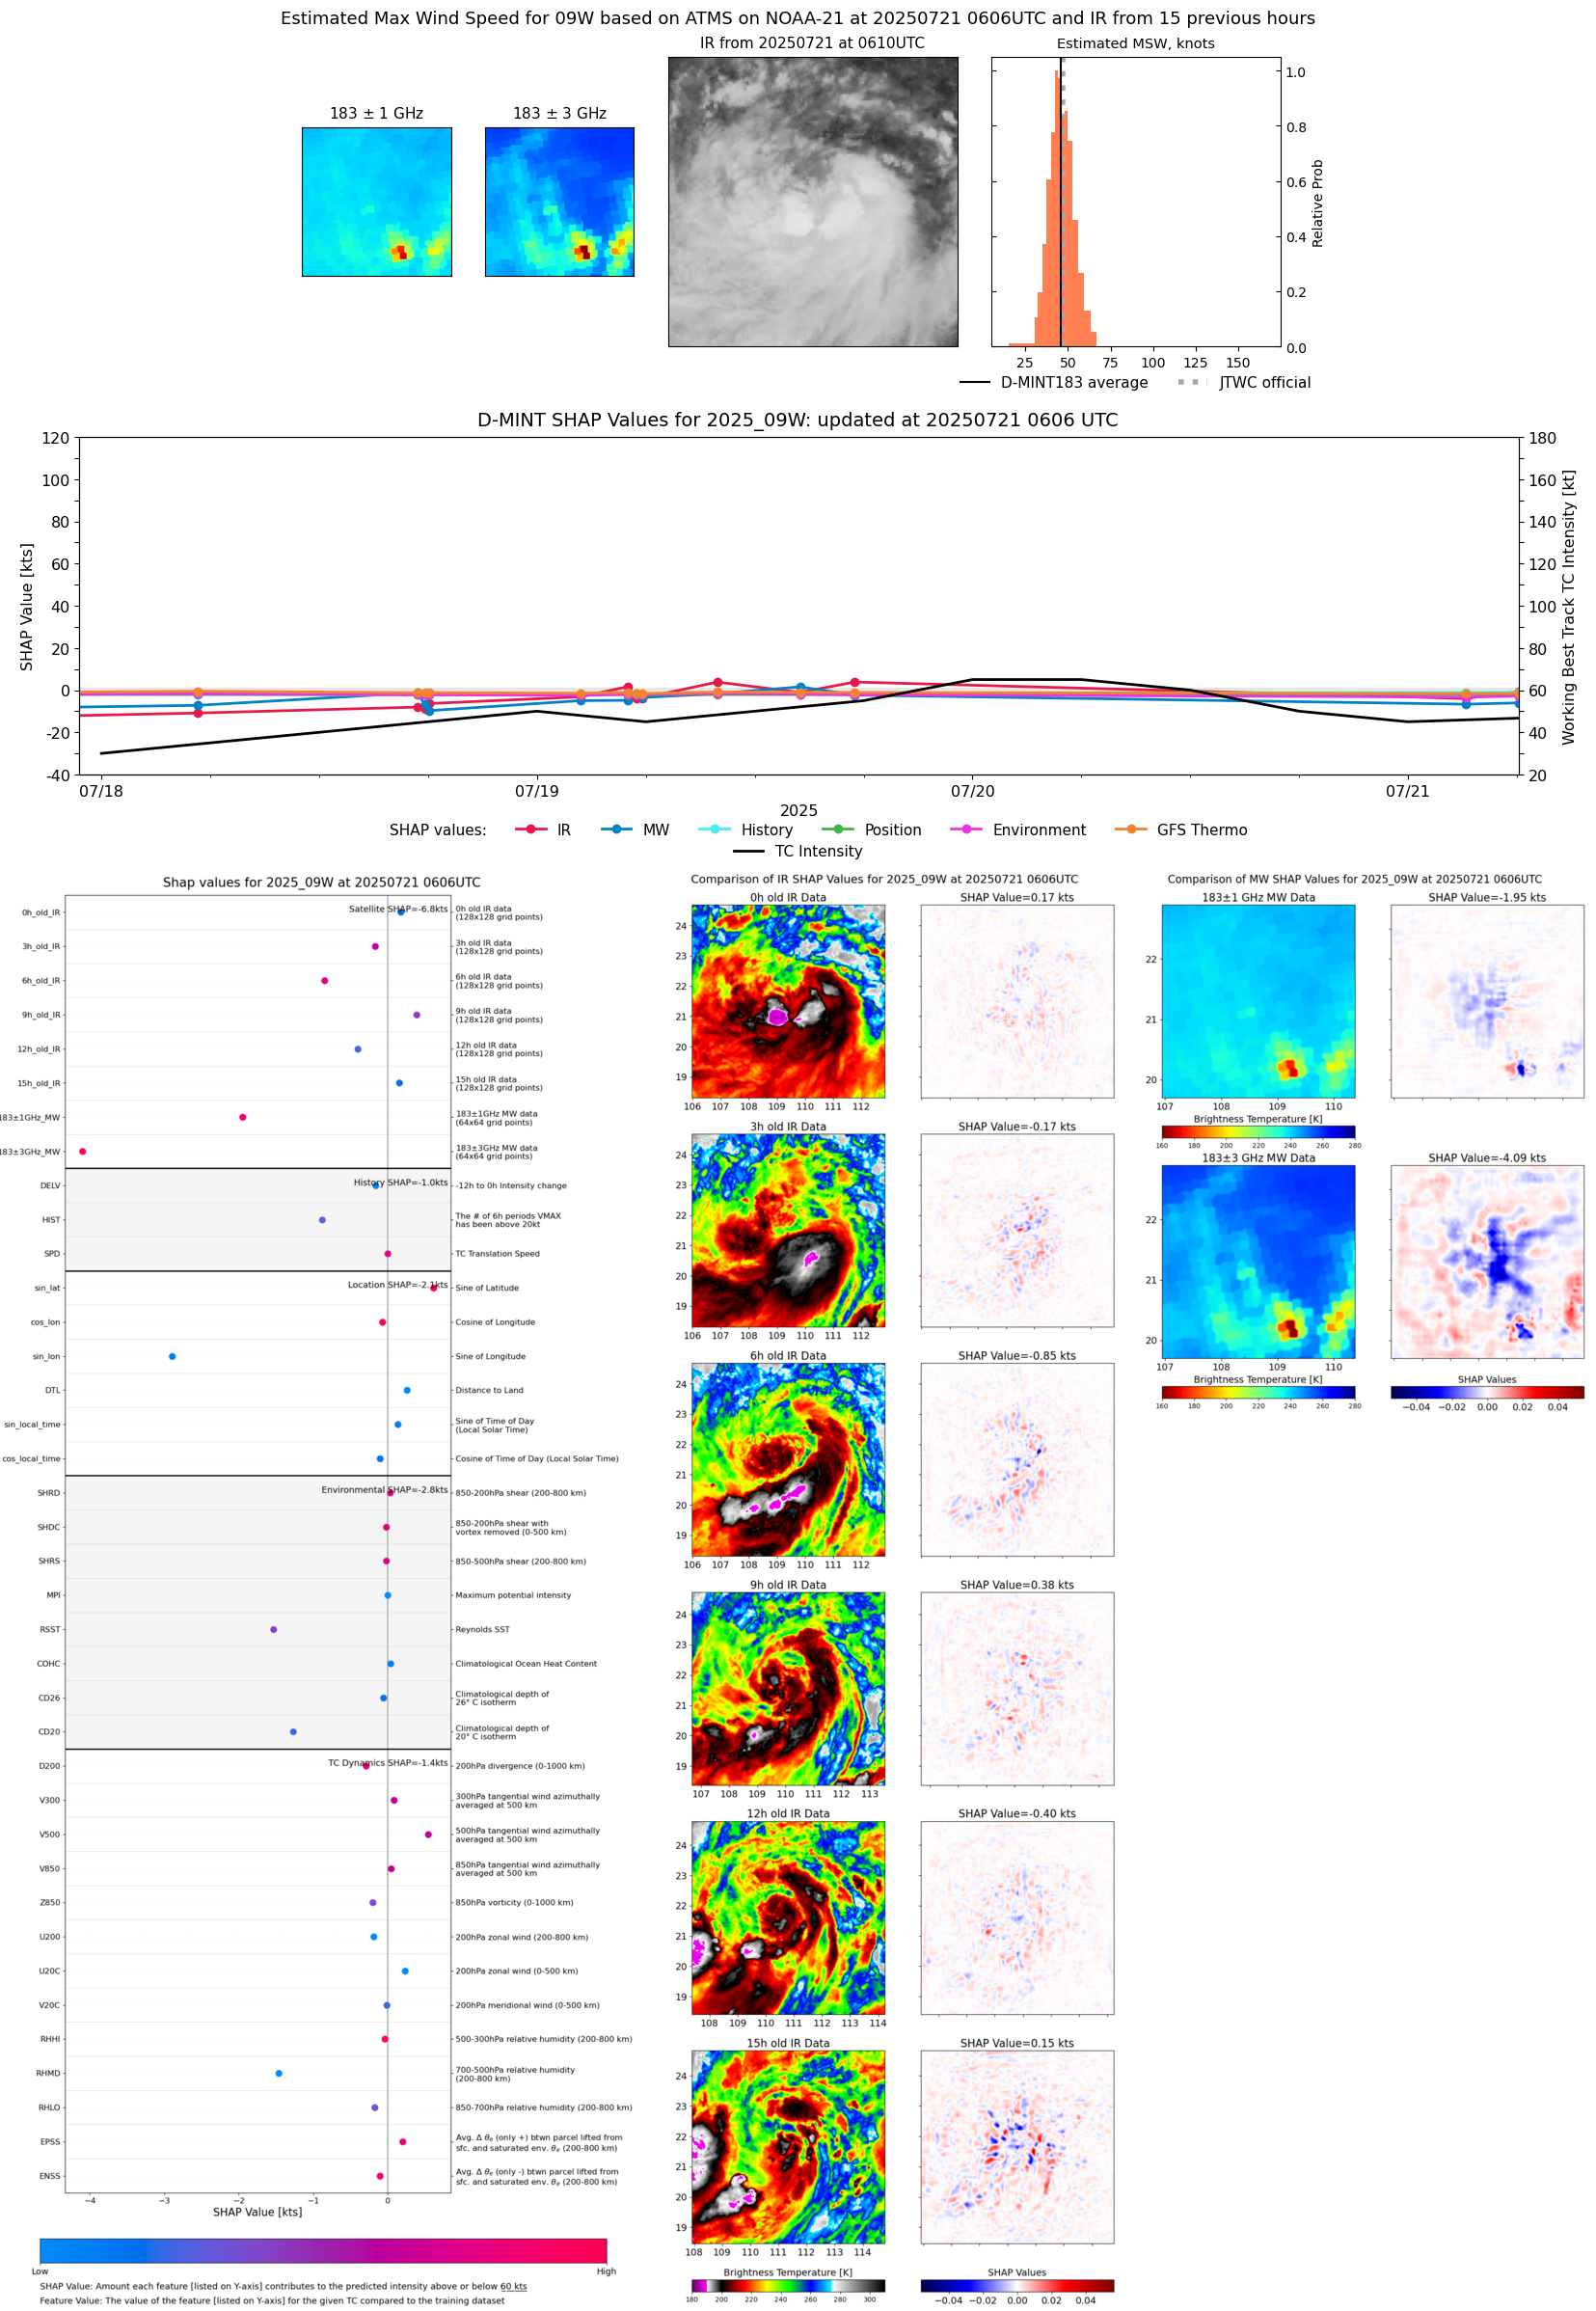 |
| 20250721 | 0549 UTC | AMSR2 | 987 hPa | 46 kts | 40 kts | 52 kts | 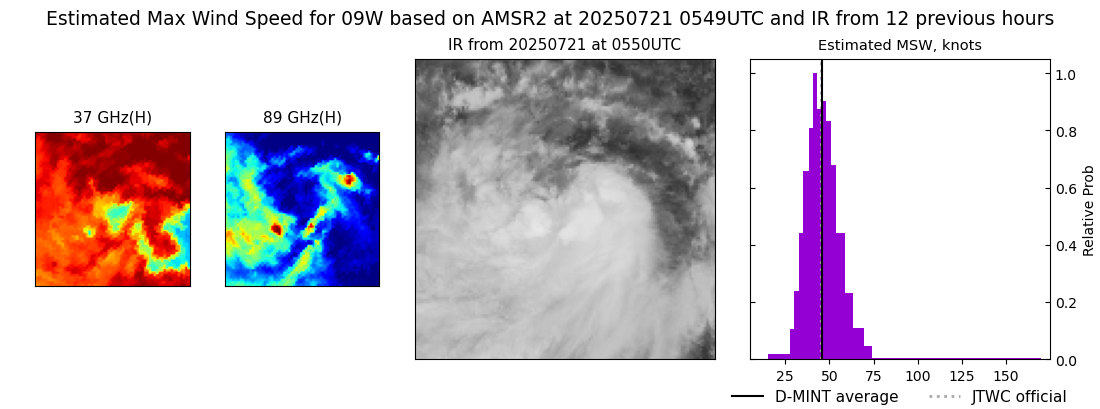 |
| 20250721 | 0312 UTC | TMS02 | 984 hPa | 42 kts | 37 kts | 46 kts |  |
| 20250720 | 2318 UTC | SSMISF17 | 986 hPa | 42 kts | 37 kts | 48 kts | 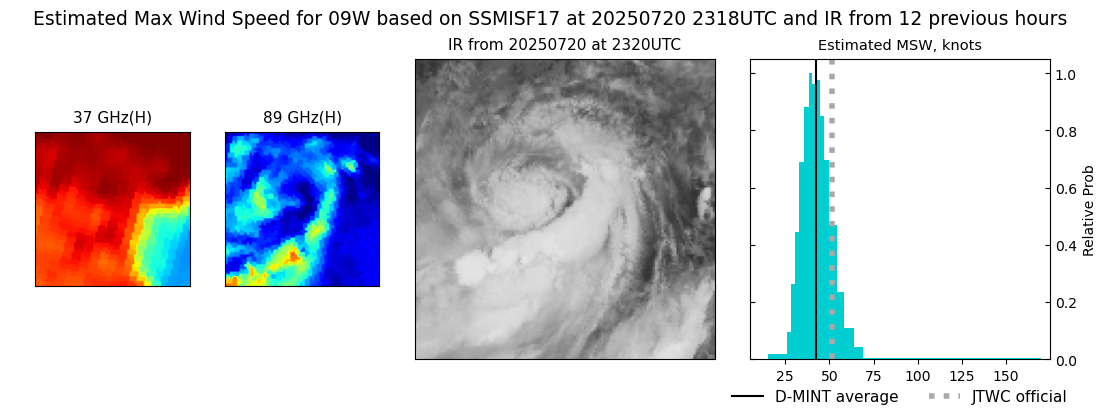 |
| 20250720 | 1711 UTC | TROPICS03 | 970 hPa | 54 kts | 49 kts | 60 kts | 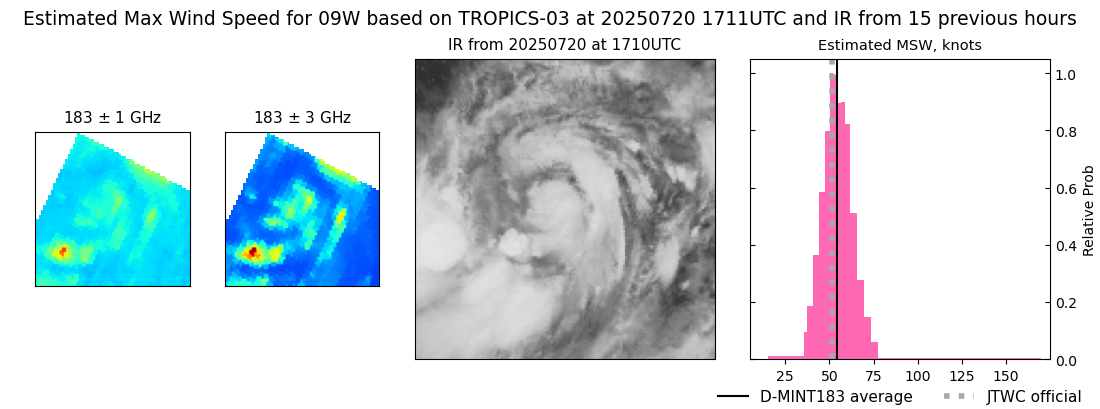 |
| 20250720 | 1101 UTC | SSMISF16 | 986 hPa | 57 kts | 50 kts | 64 kts | 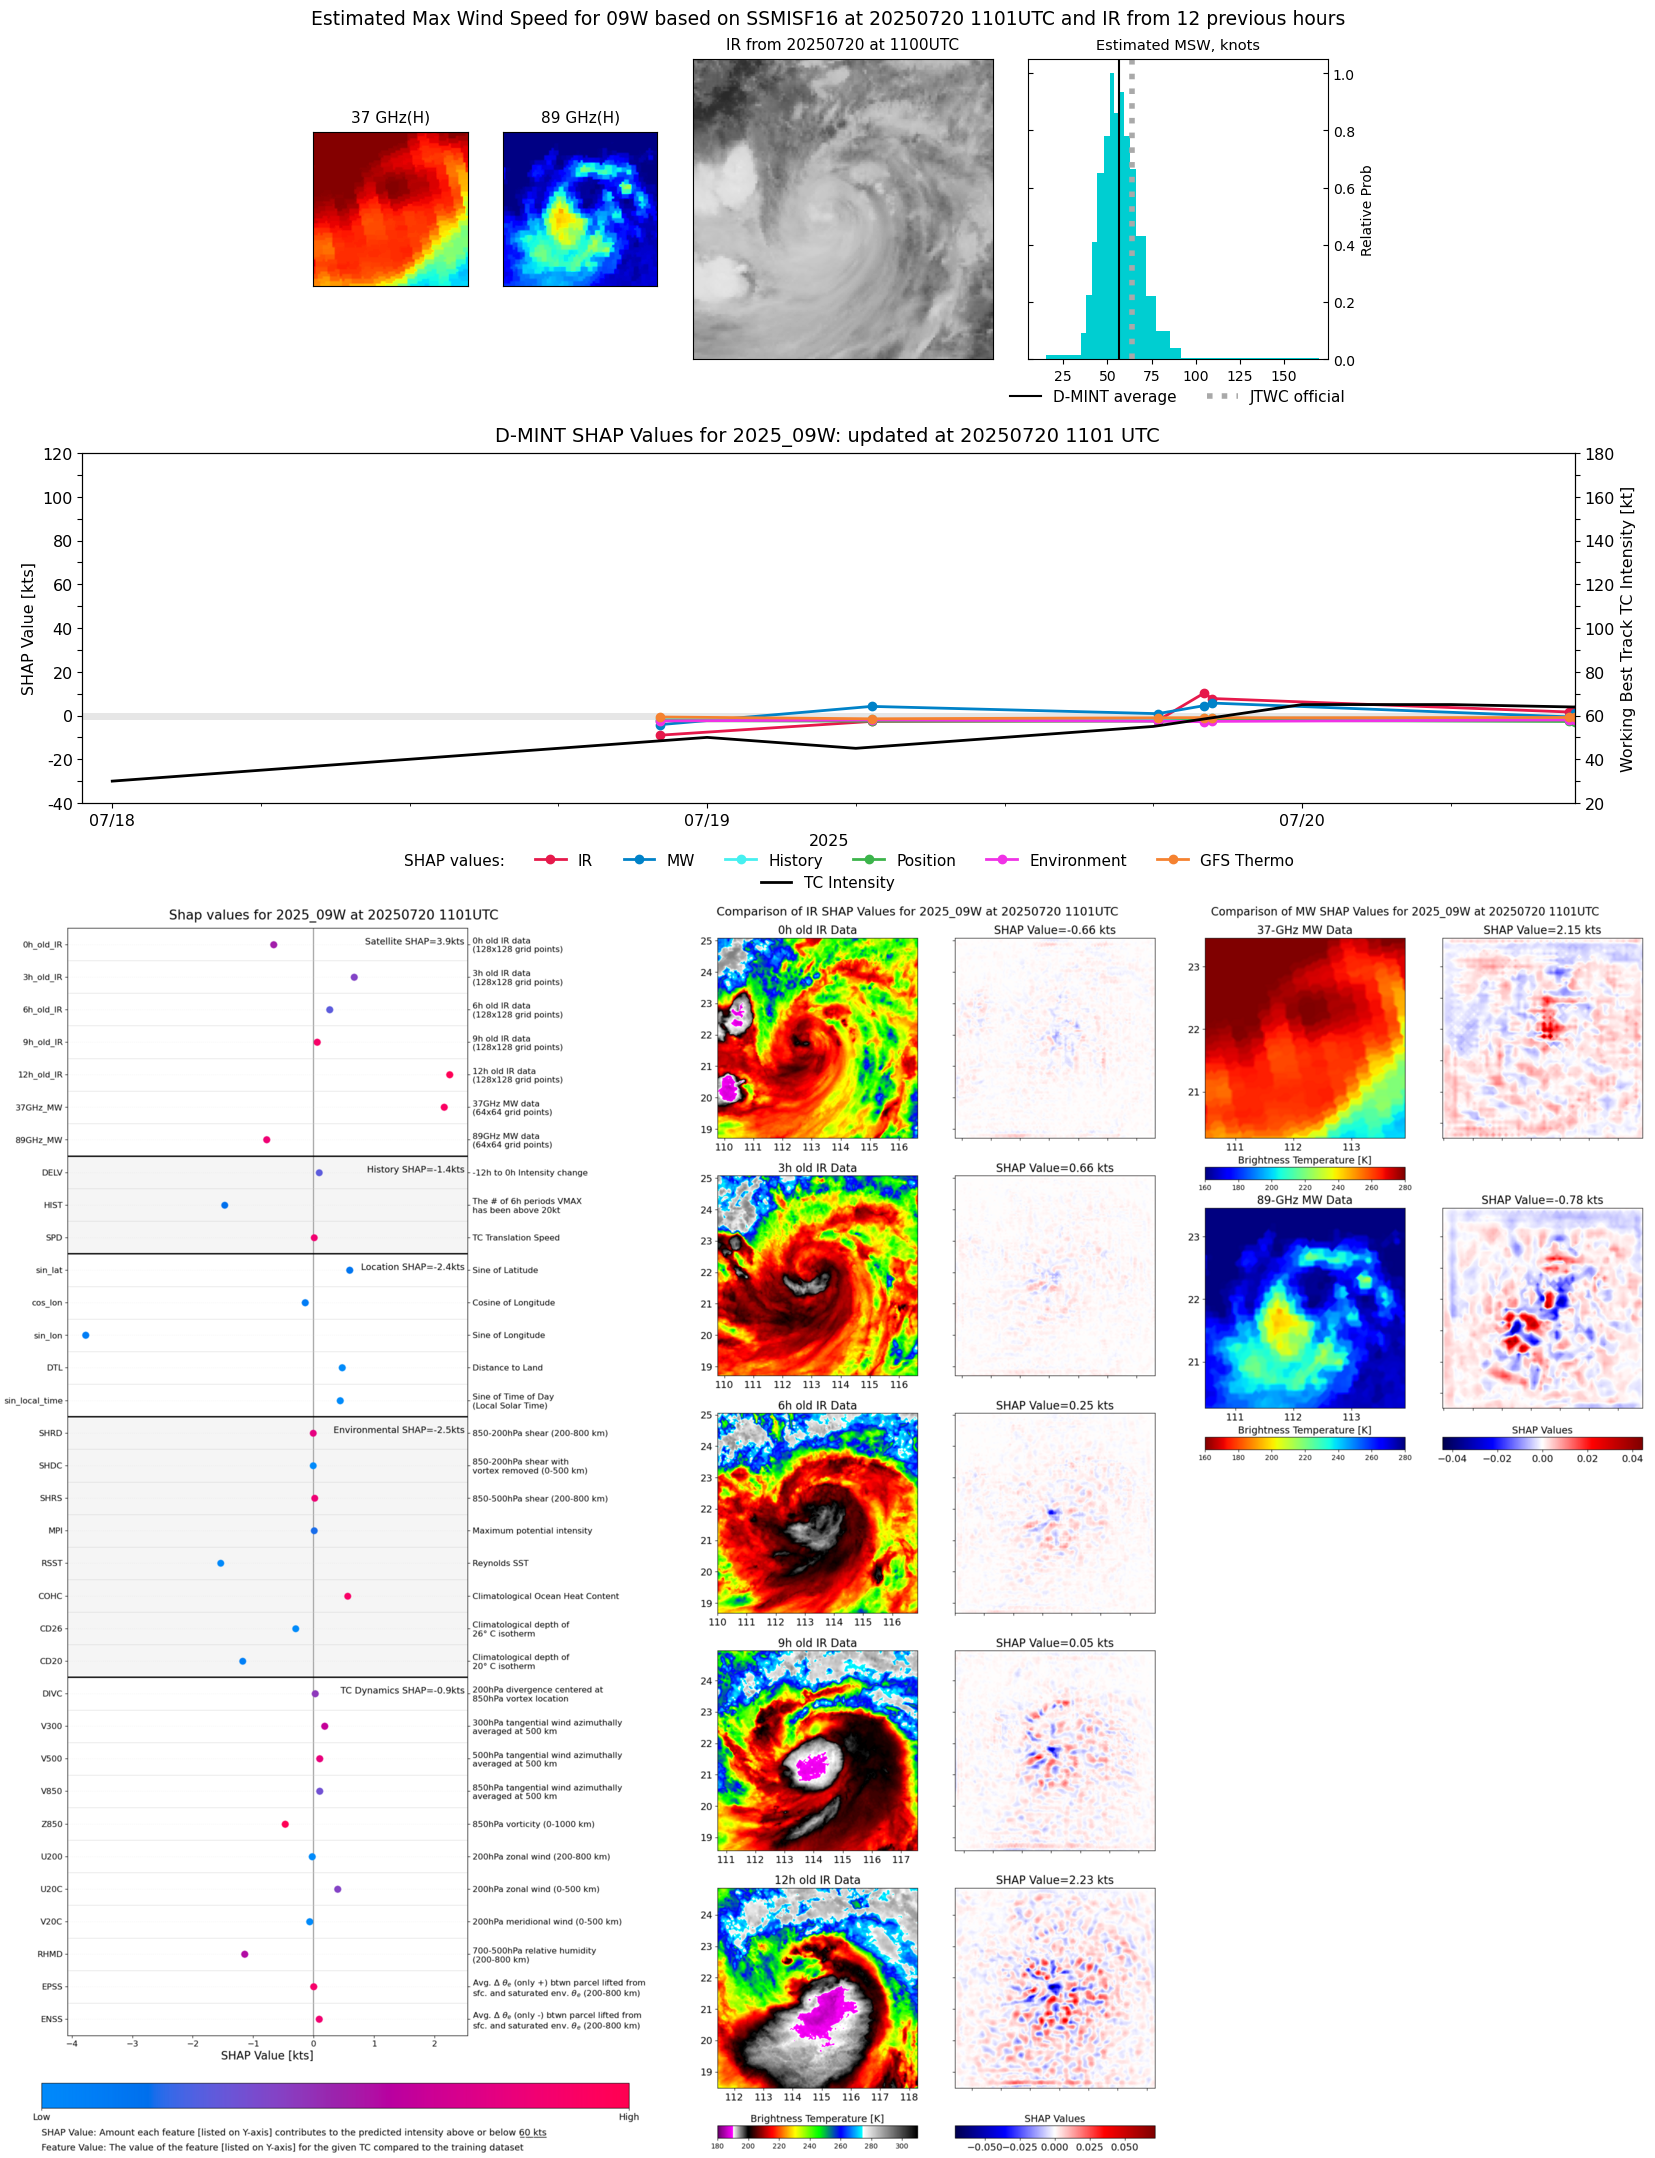 |
| 20250720 | 1047 UTC | SSMISF17 | 986 hPa | 54 kts | 47 kts | 61 kts |  |
| 20250719 | 2022 UTC | SSMISF18 | 977 hPa | 66 kts | 60 kts | 73 kts | 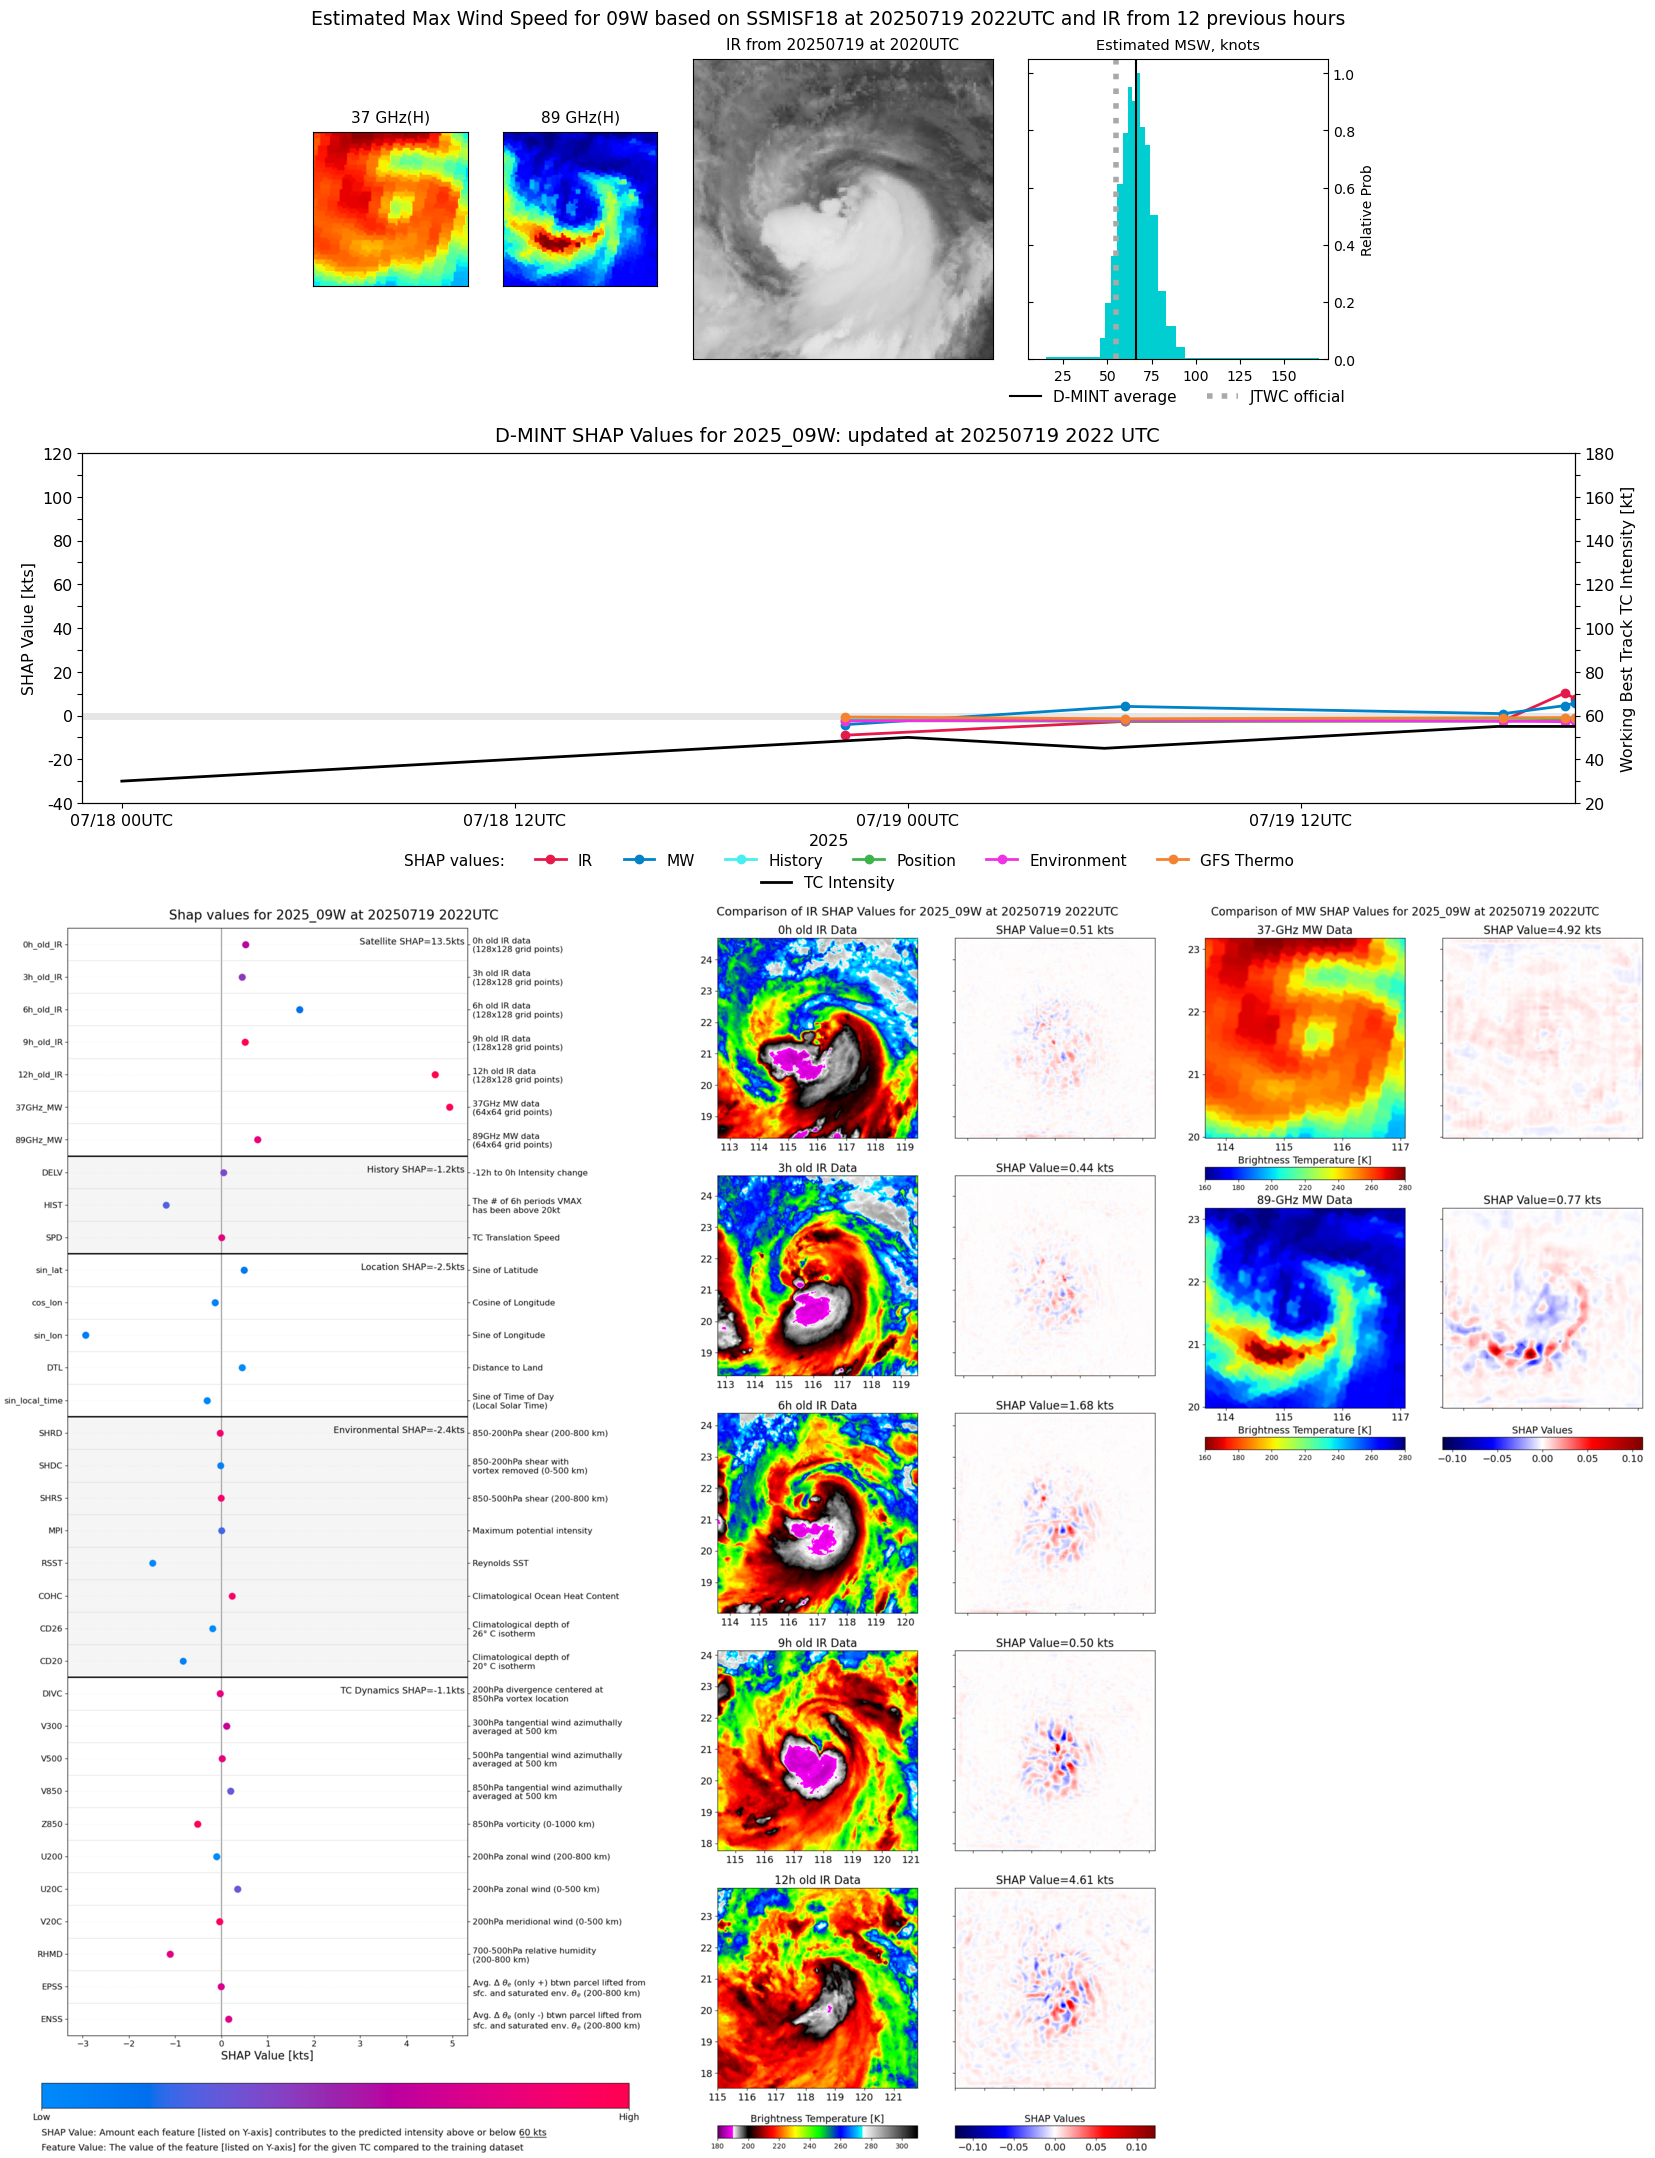 |
| 20250719 | 2003 UTC | GMI | 975 hPa | 68 kts | 61 kts | 74 kts | 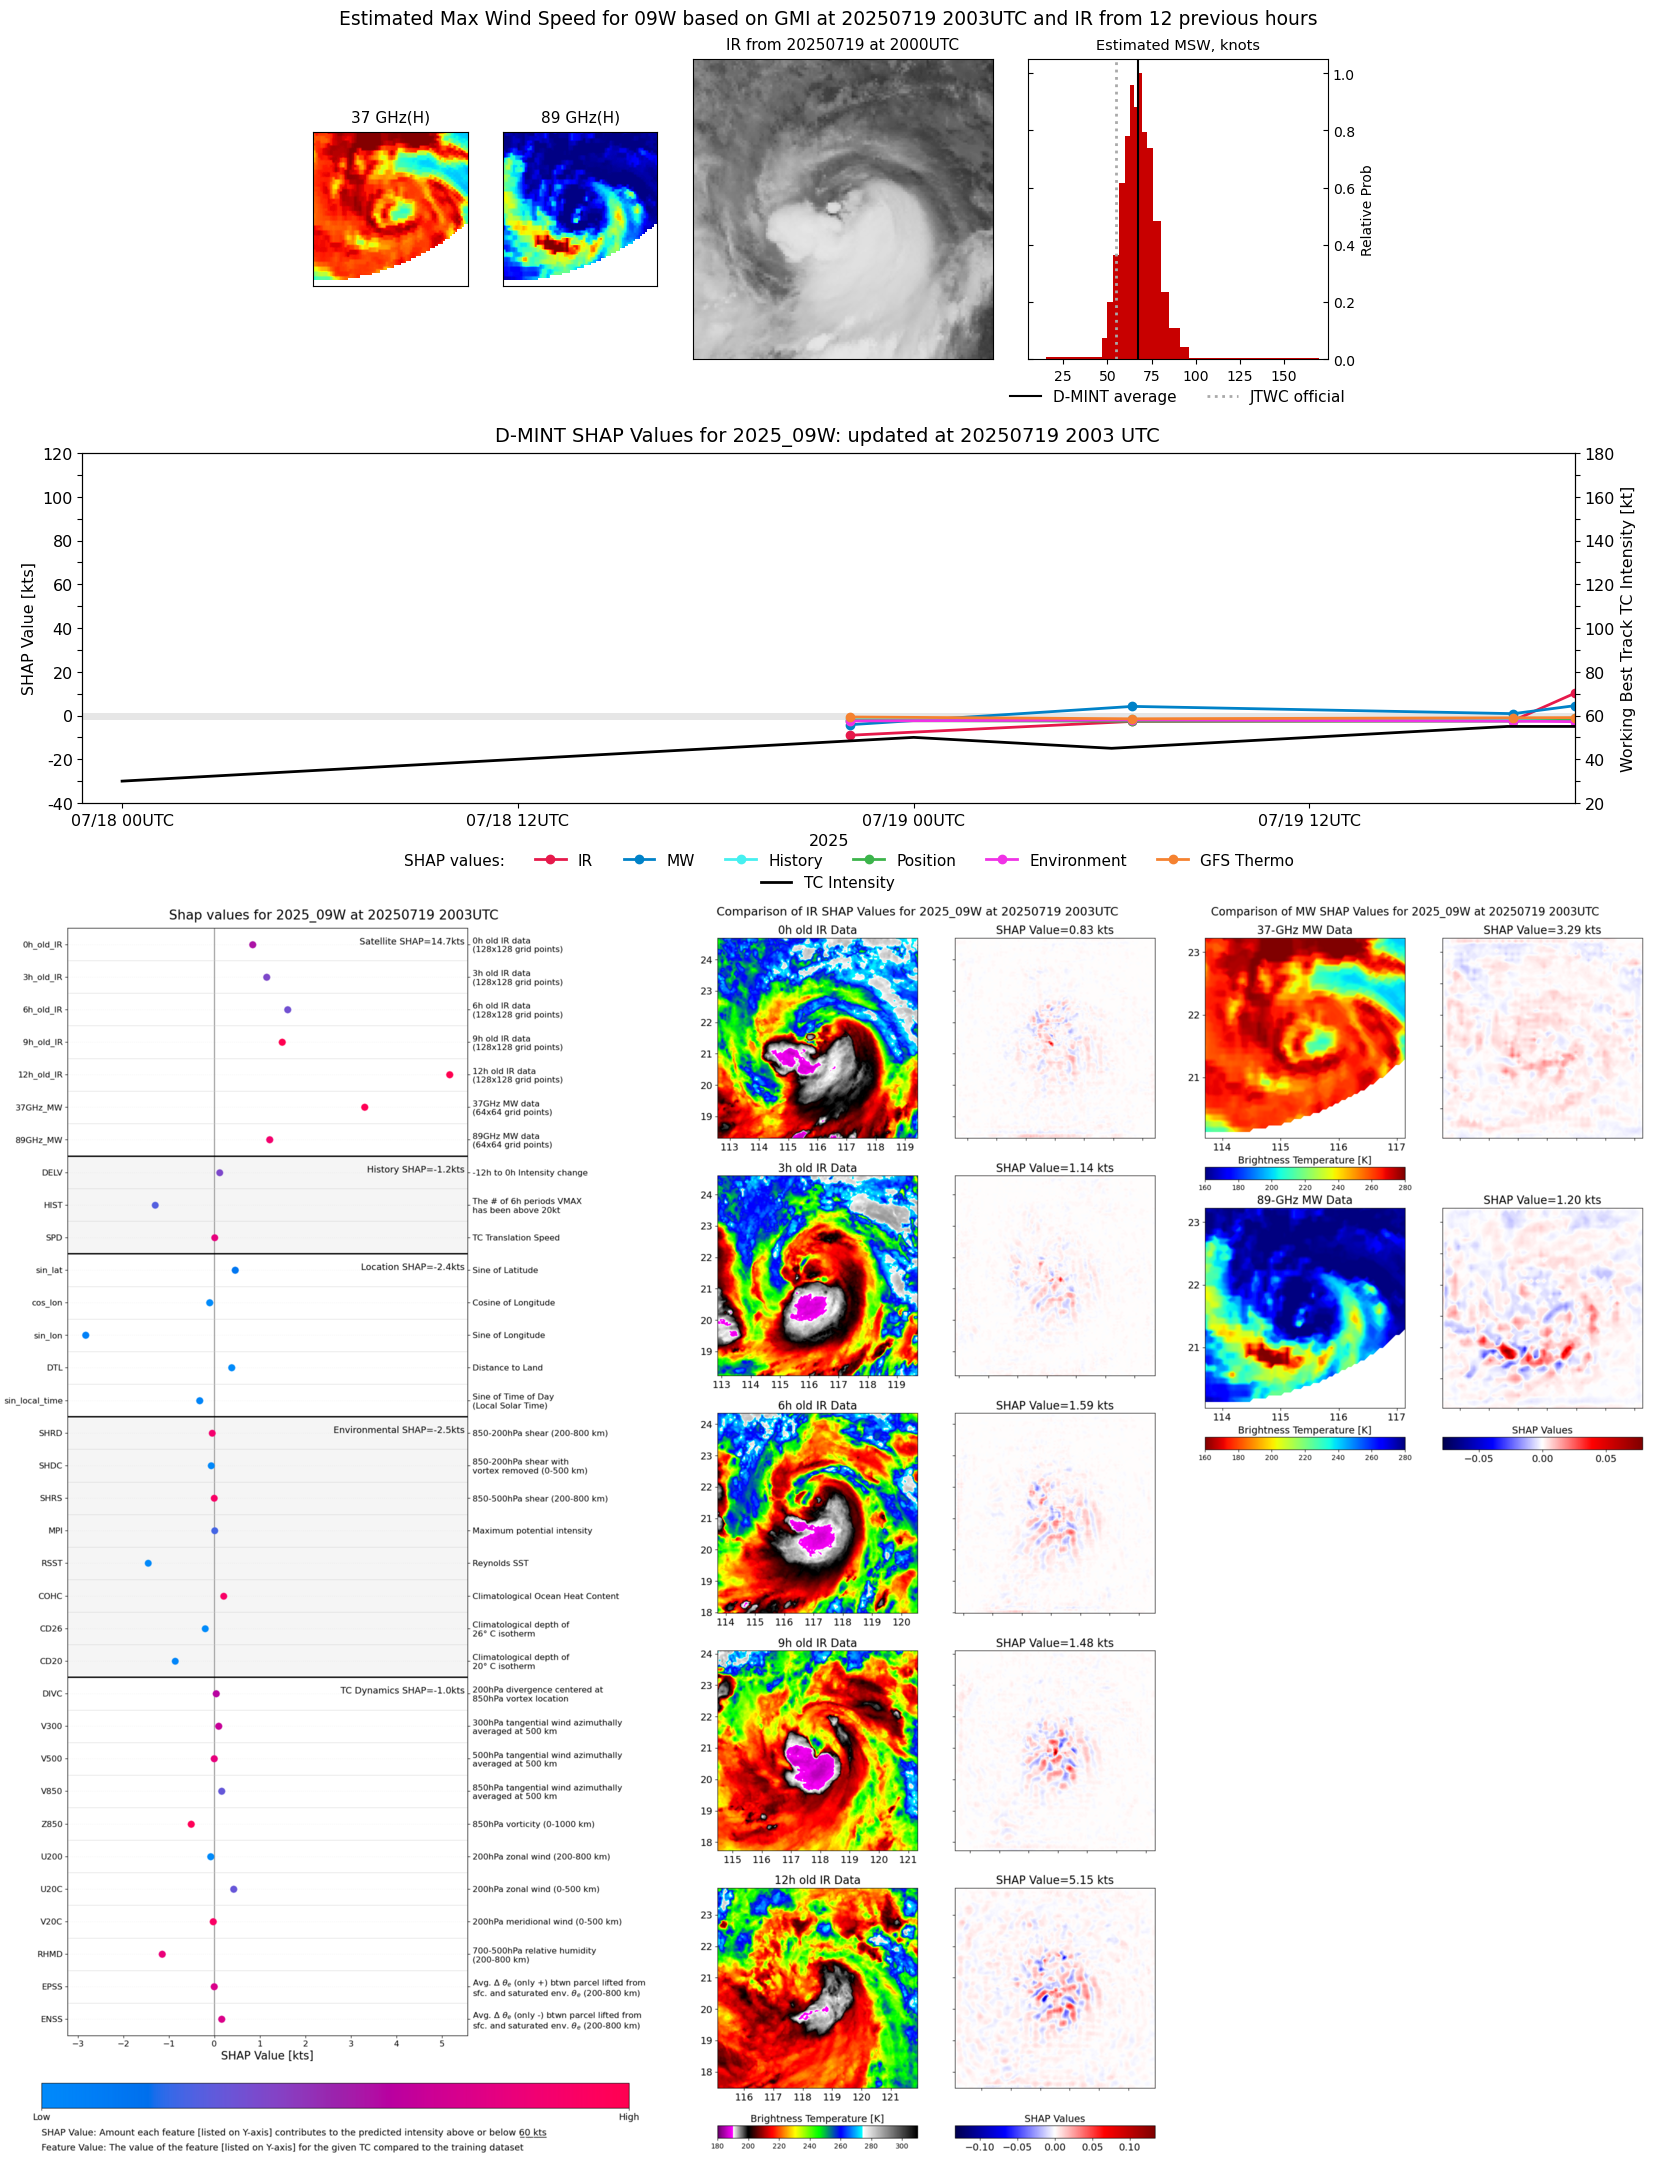 |
| 20250719 | 1811 UTC | AMSR2 | 986 hPa | 51 kts | 45 kts | 57 kts | 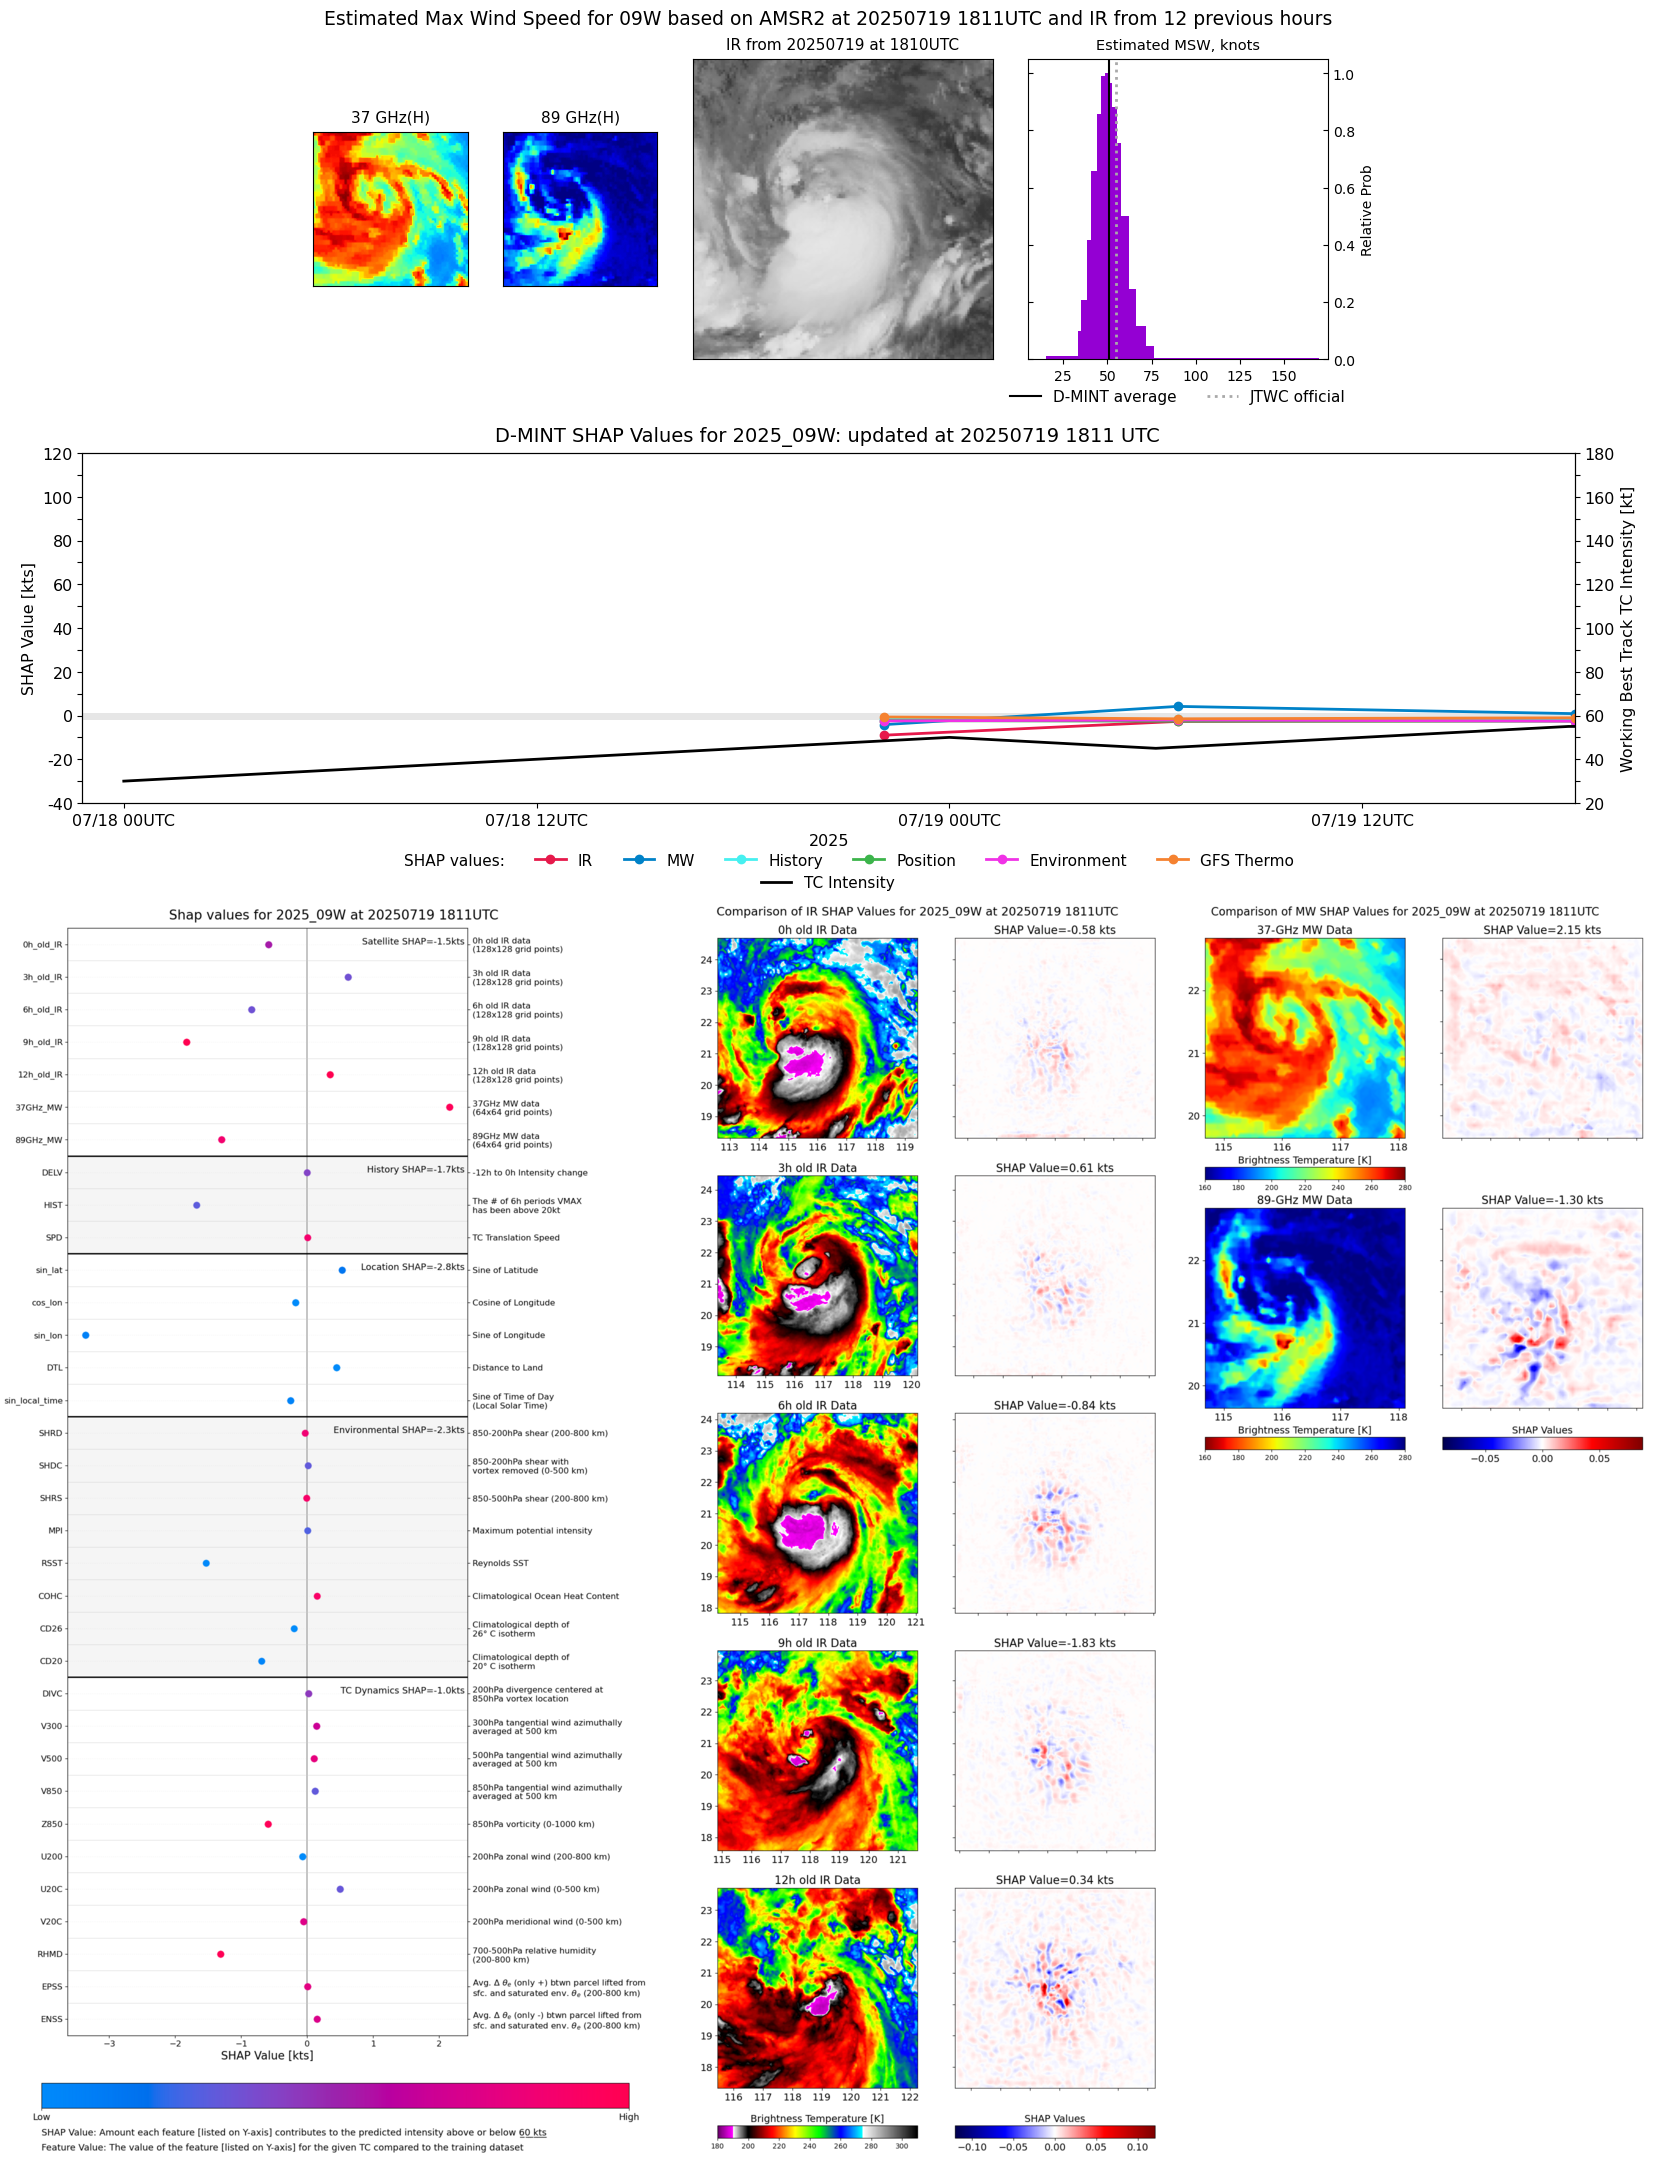 |
| 20250719 | 1731 UTC | ATMS-N21 | 975 hPa | 55 kts | 49 kts | 61 kts | 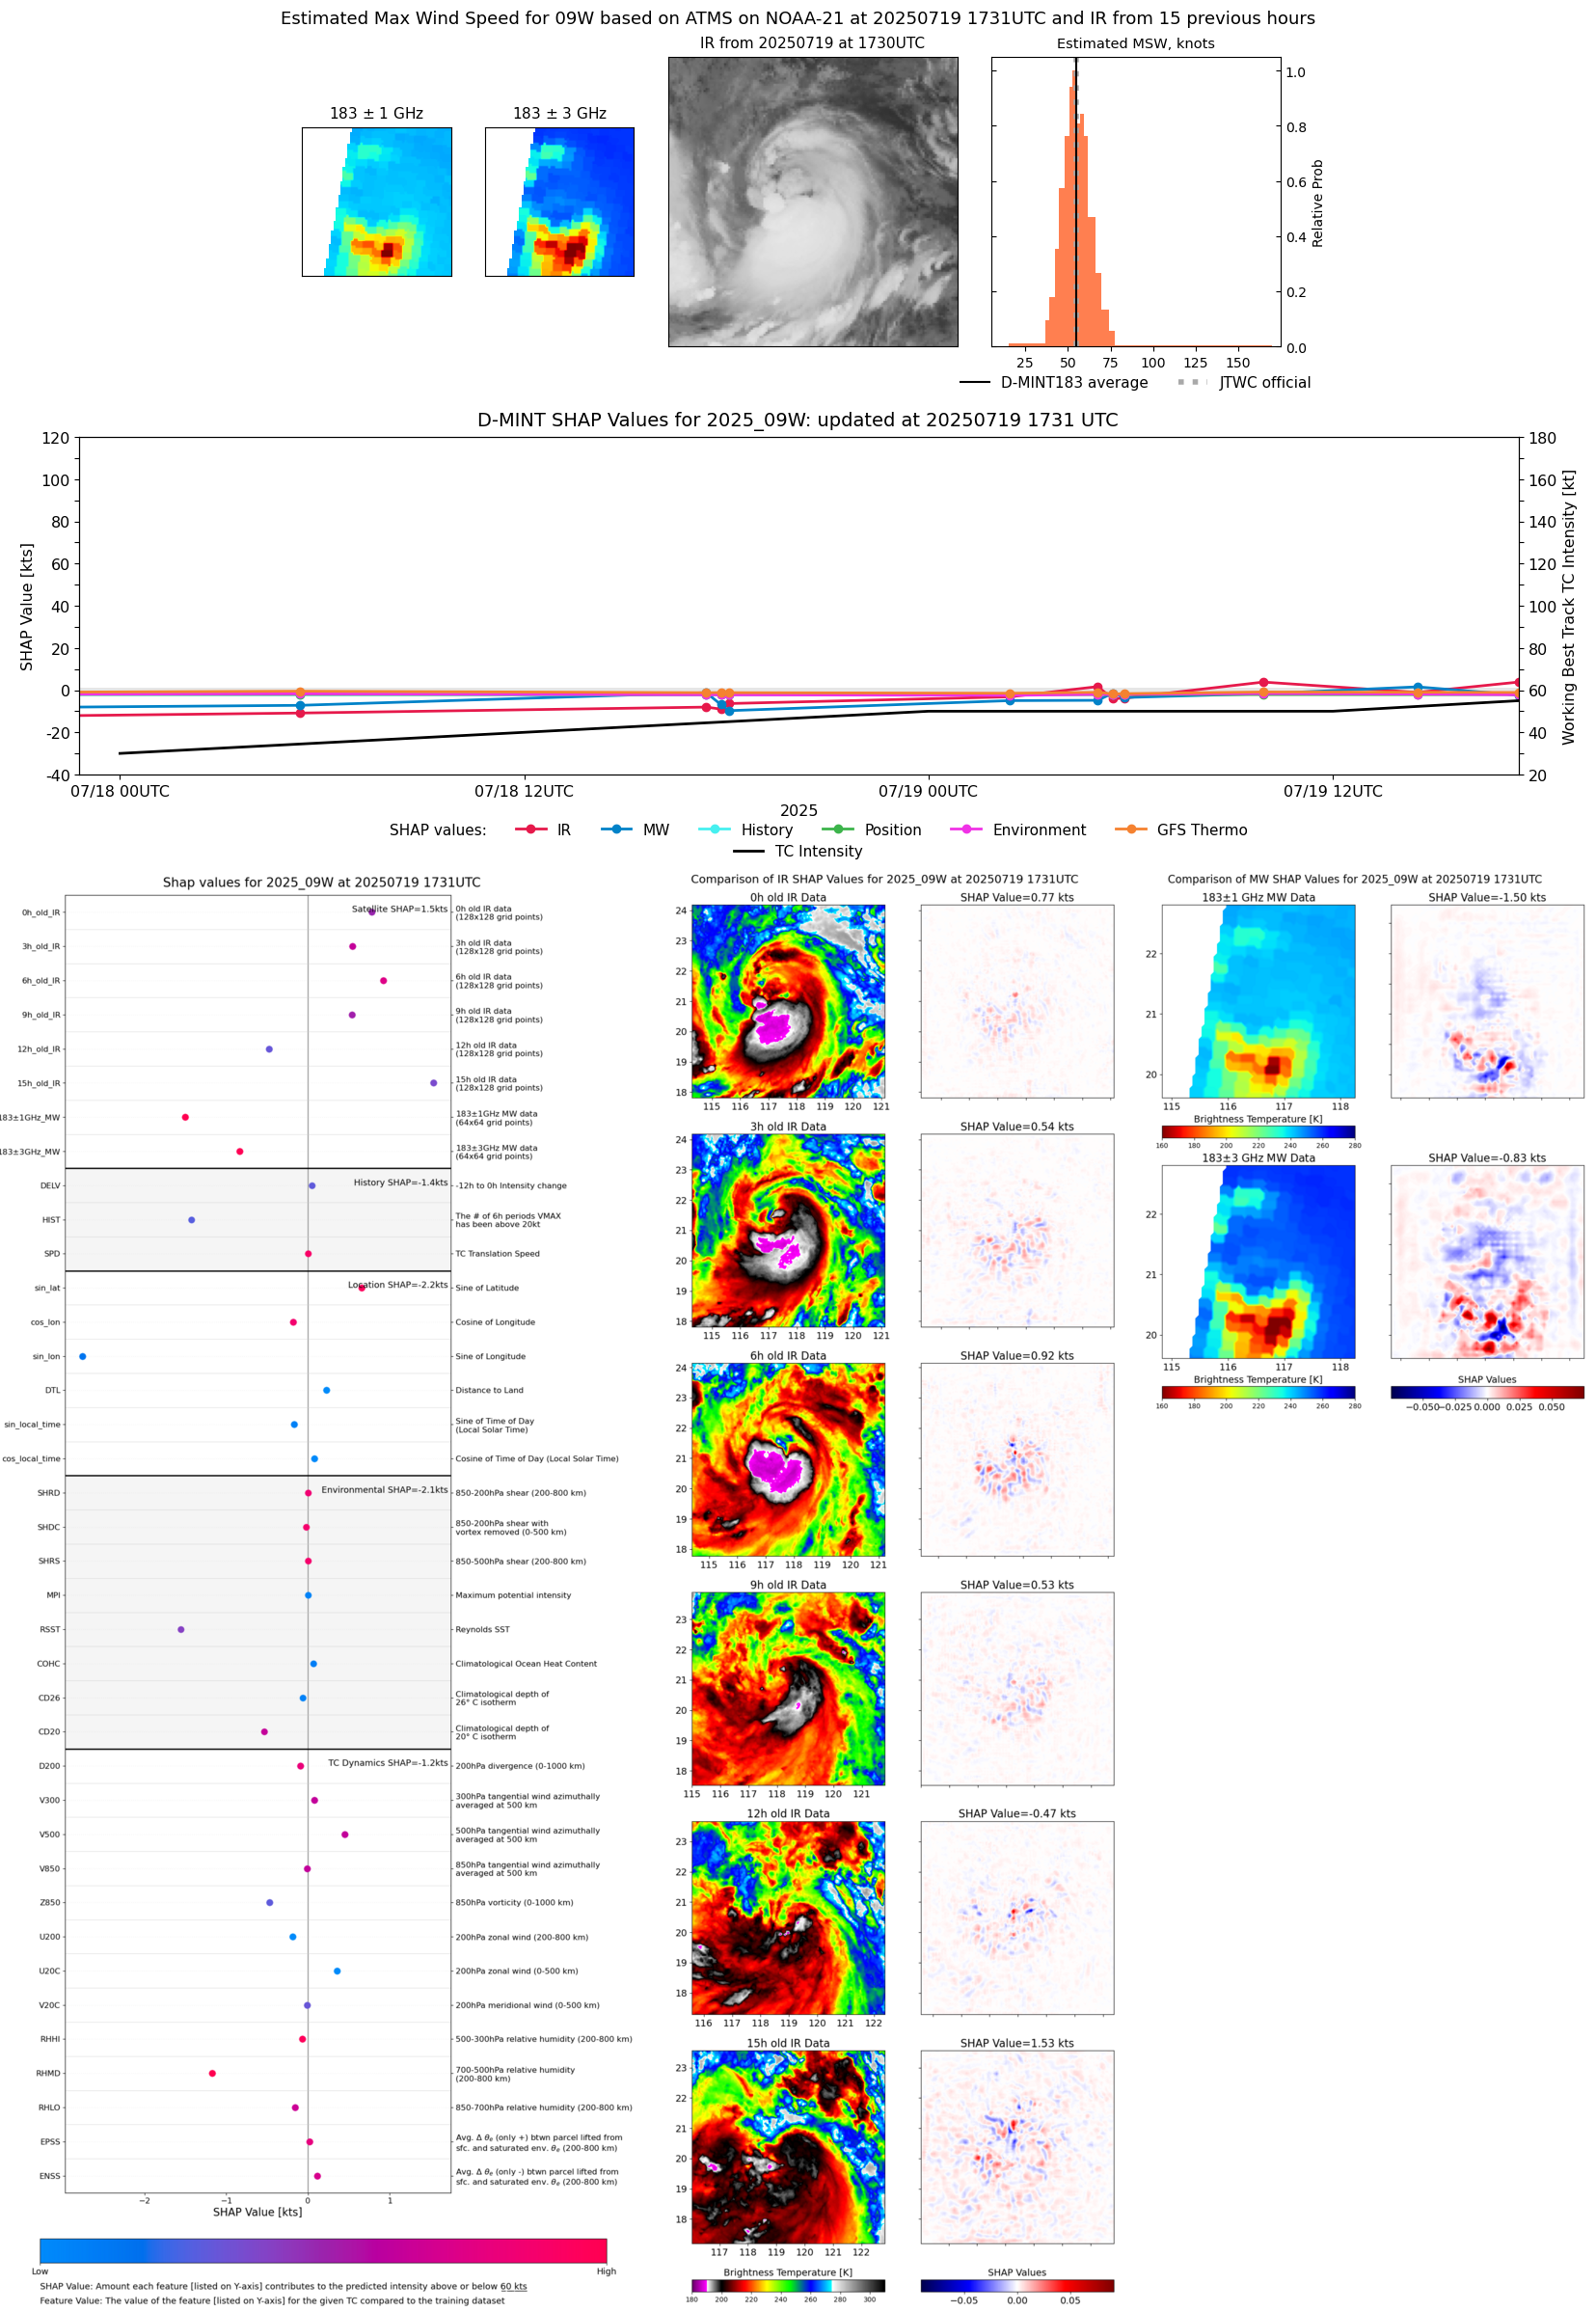 |
| 20250719 | 1430 UTC | TMS02 | 977 hPa | 54 kts | 49 kts | 60 kts | 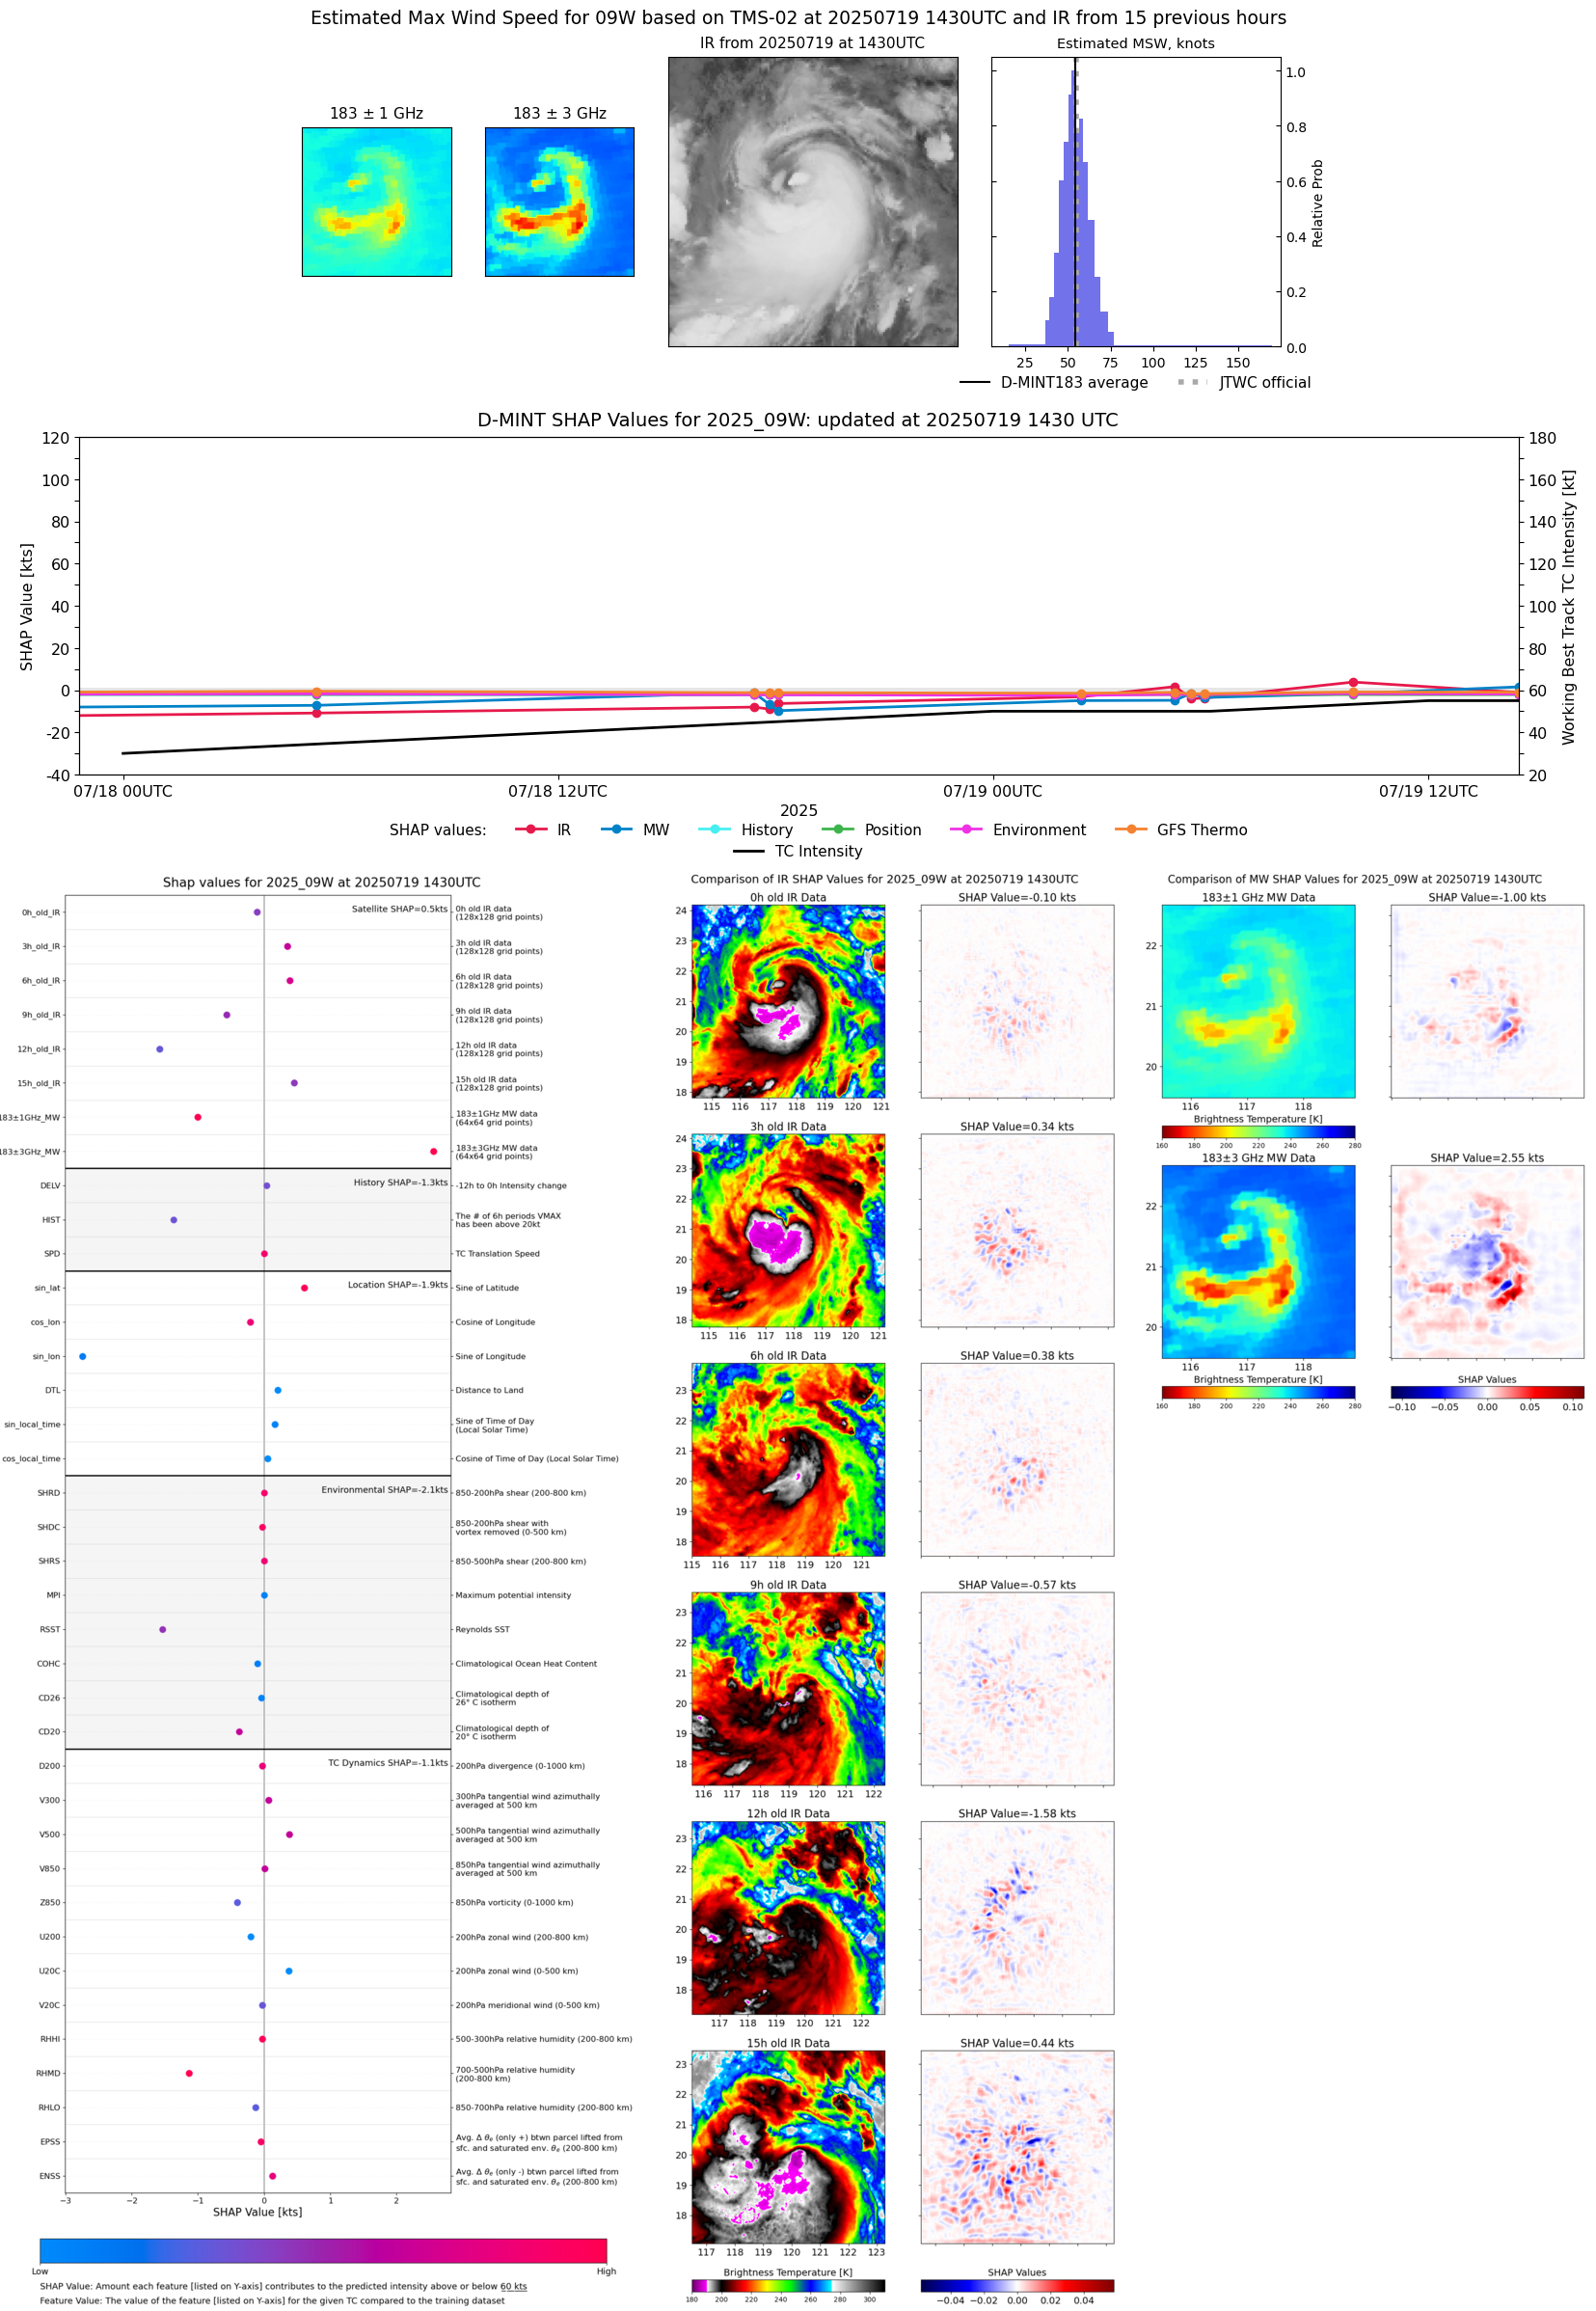 |
| 20250719 | 0956 UTC | TROPICS03 | 972 hPa | 56 kts | 51 kts | 61 kts | 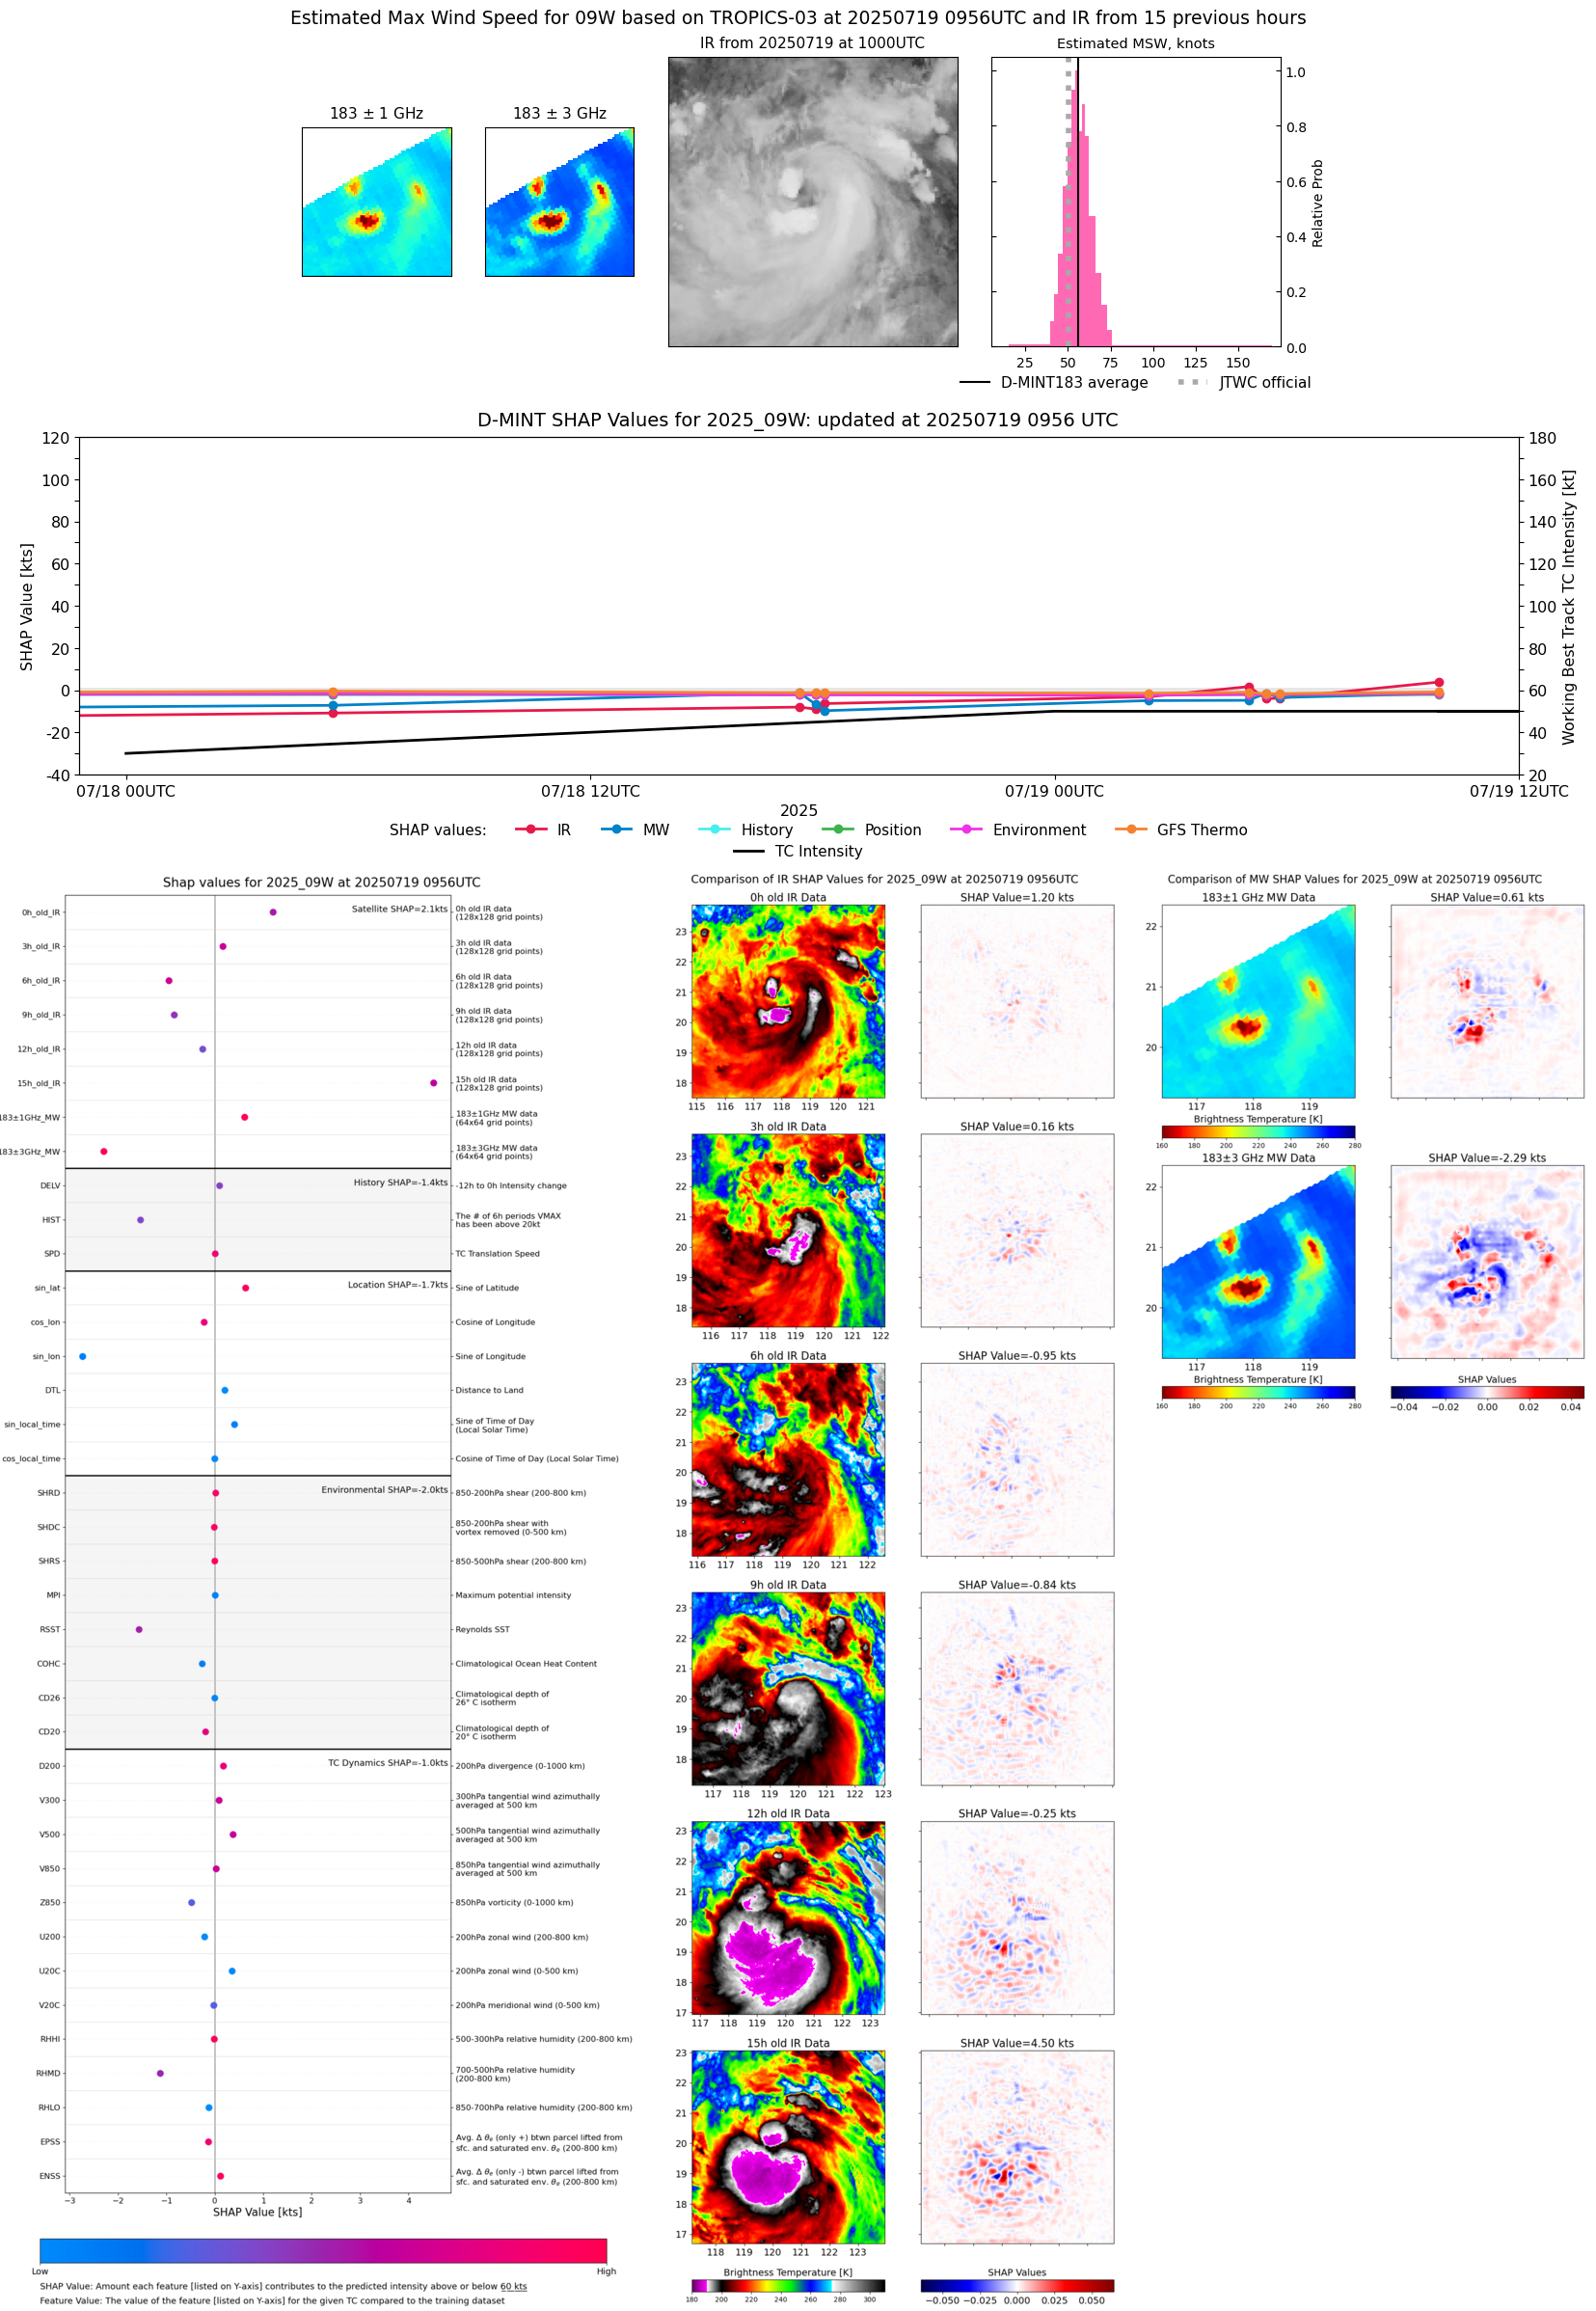 |
| 20250719 | 0750 UTC | SSMISF18 | 978 hPa | 57 kts | 51 kts | 62 kts | 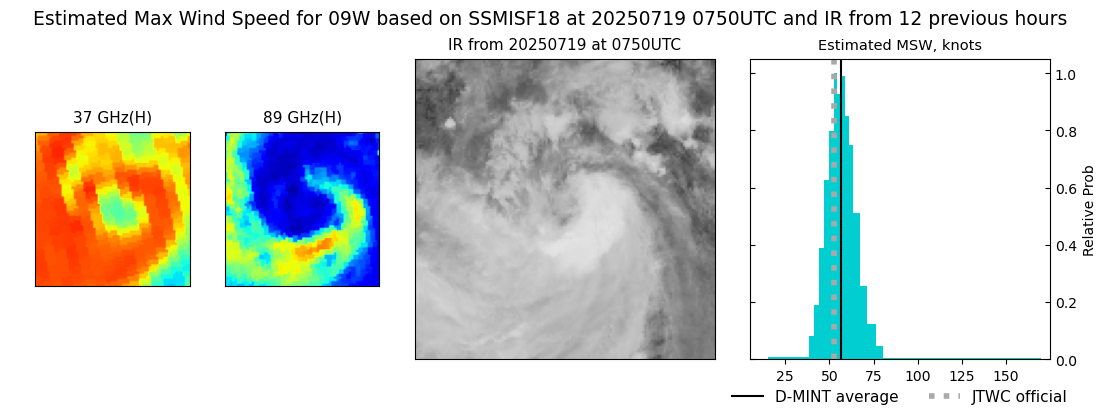 |
| 20250719 | 0638 UTC | GMI | 977 hPa | 54 kts | 49 kts | 59 kts | 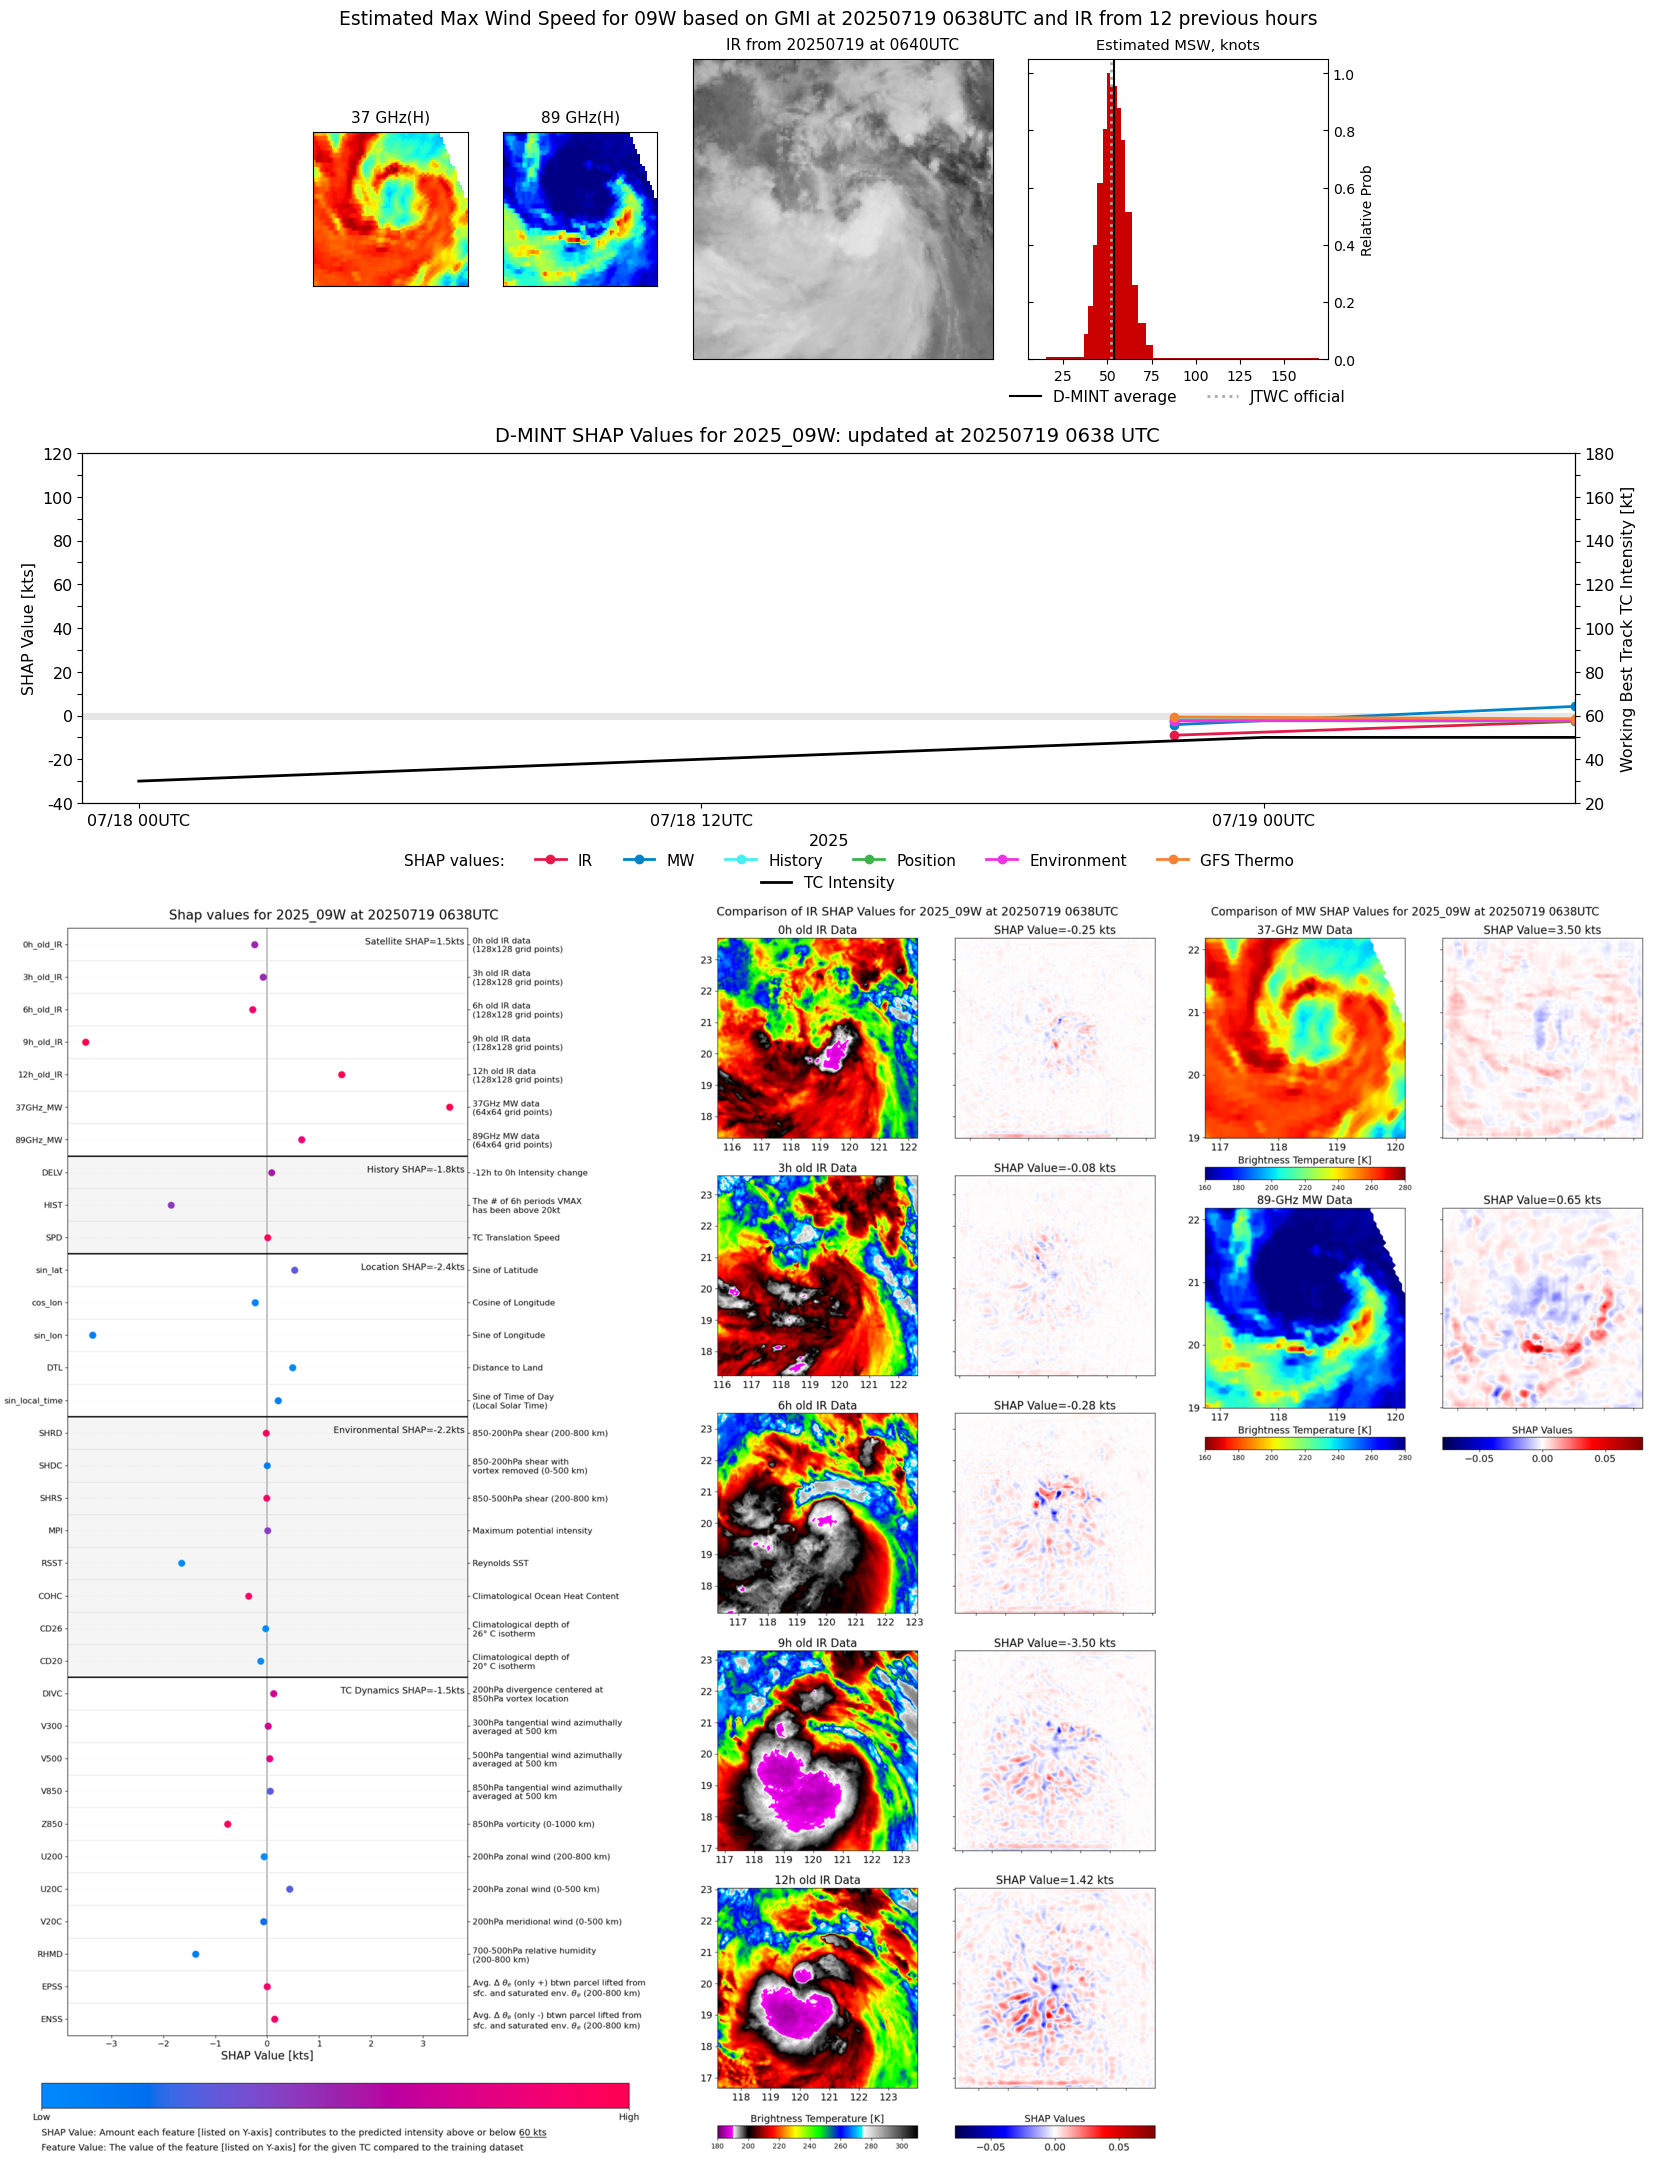 |
| 20250719 | 0549 UTC | TROPICS05 | 980 hPa | 45 kts | 41 kts | 50 kts | 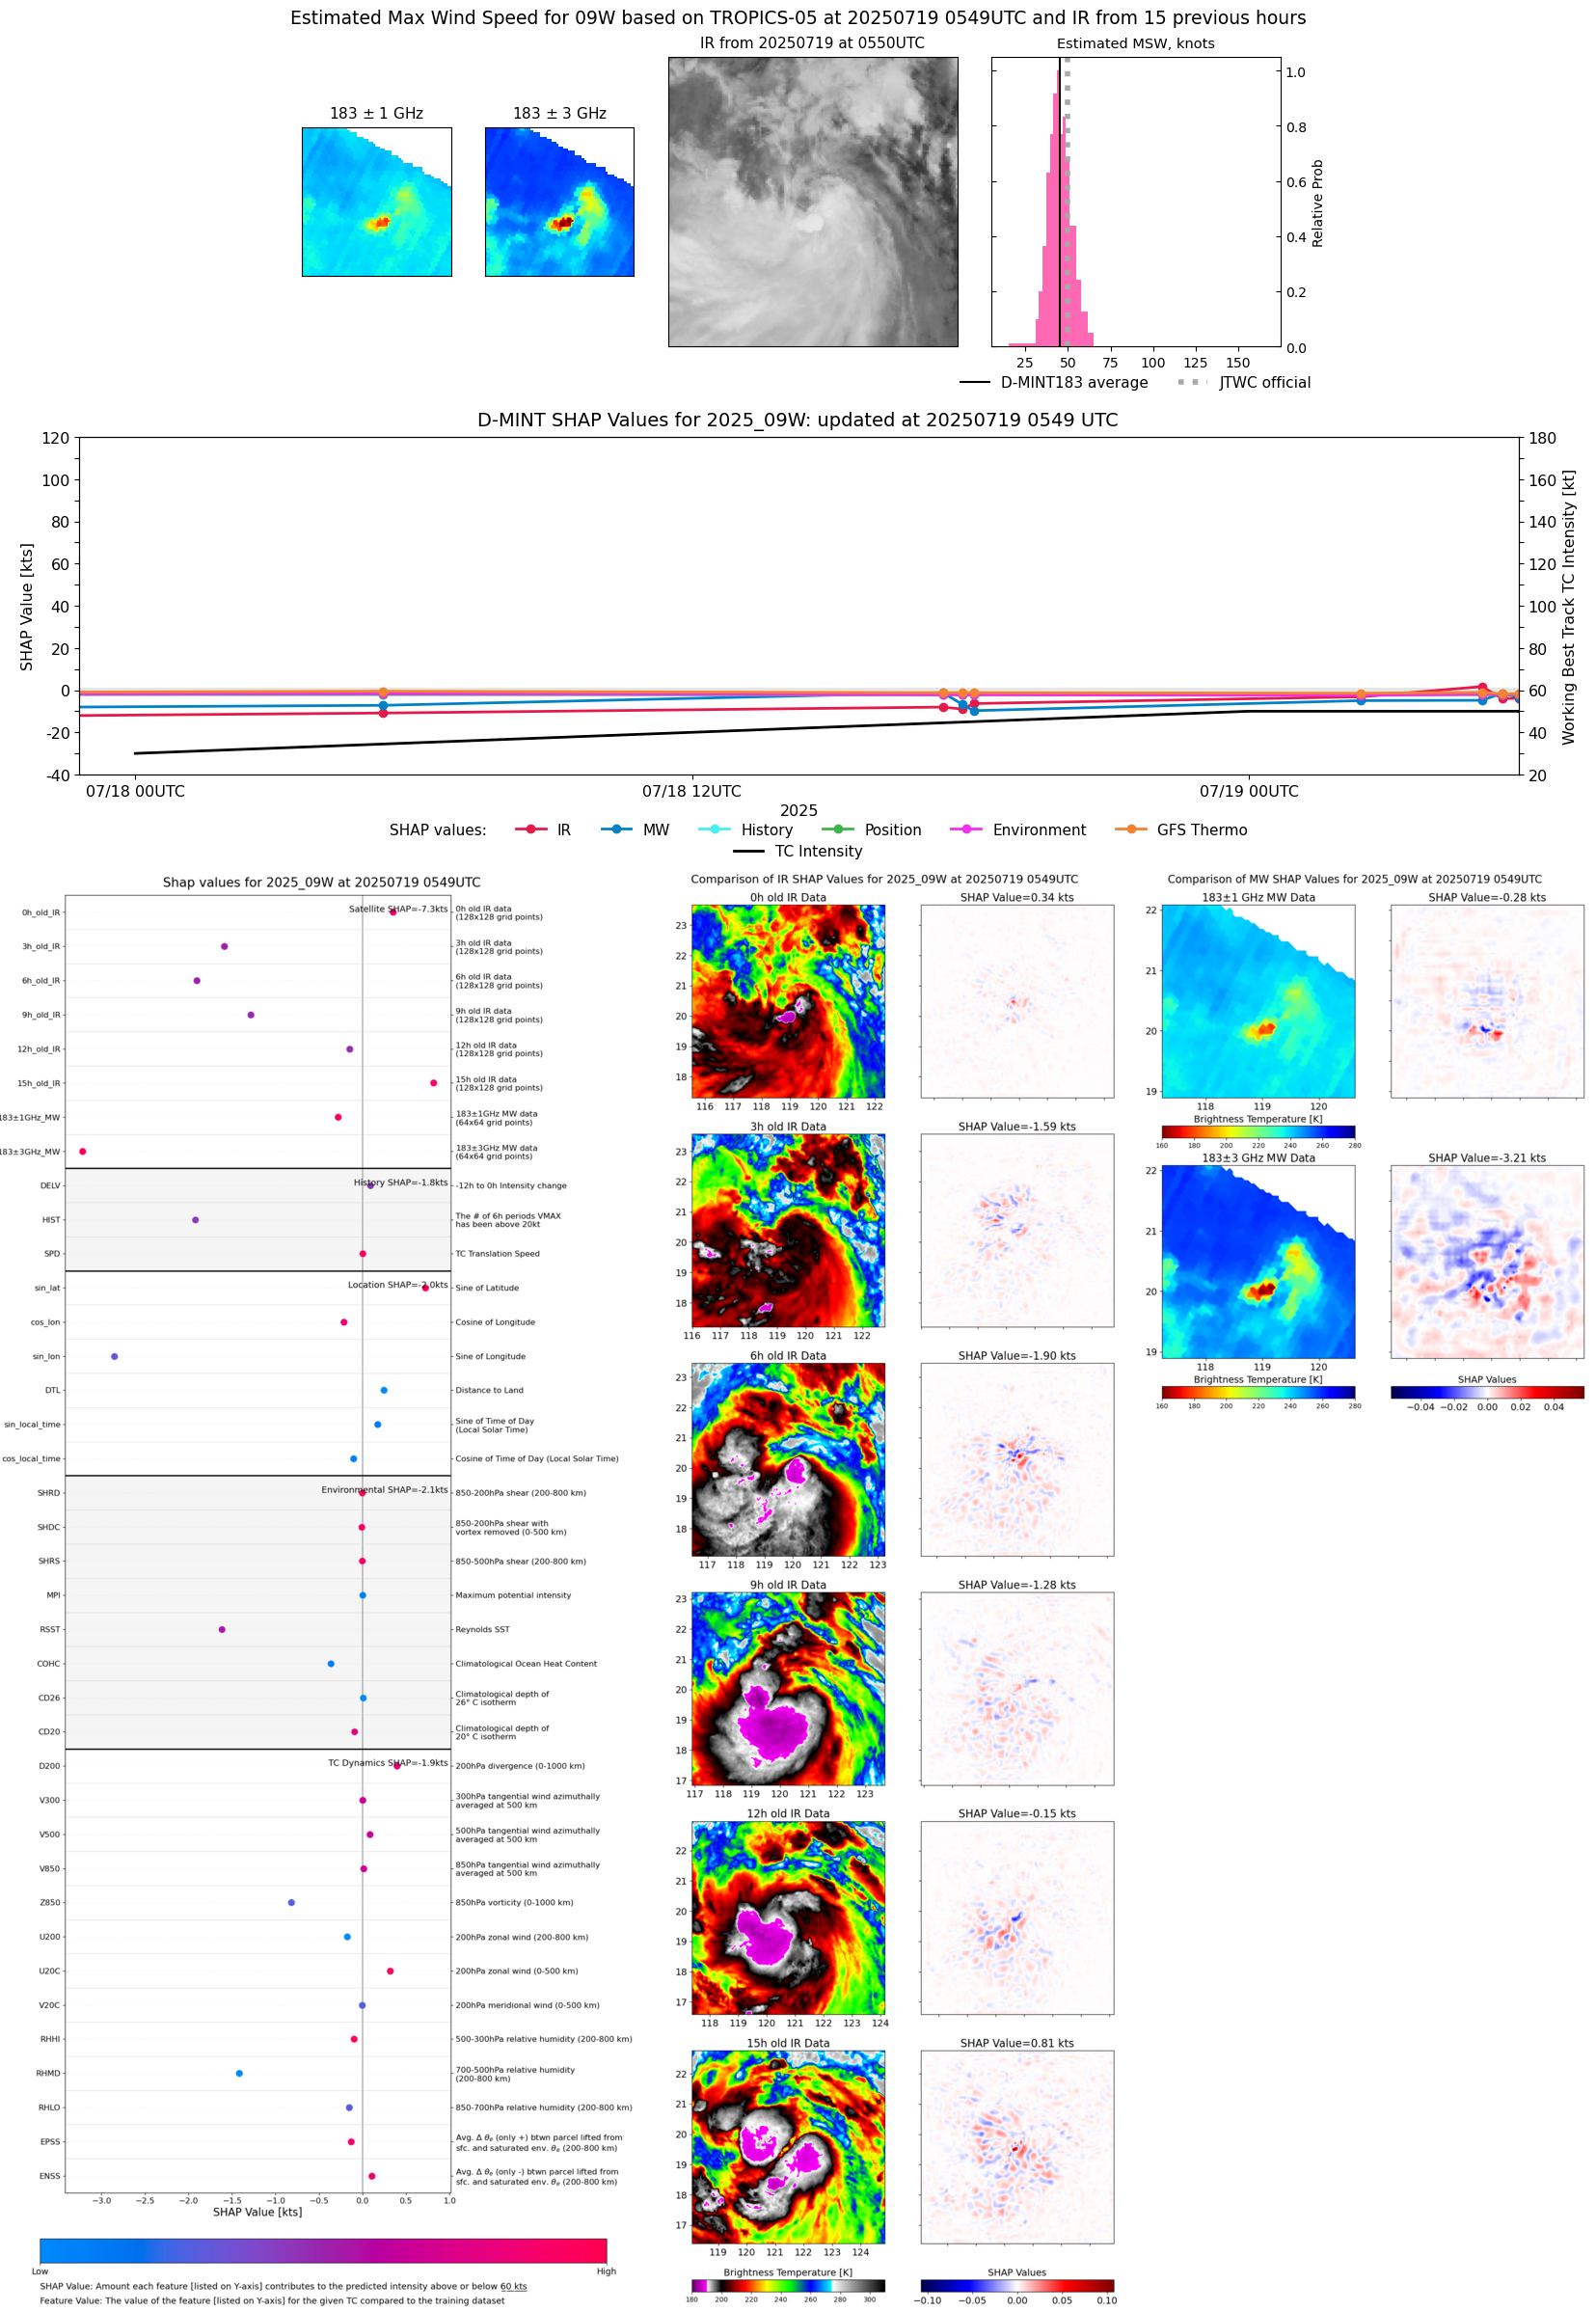 |
| 20250719 | 0528 UTC | ATMS-NPP | 978 hPa | 47 kts | 42 kts | 52 kts | 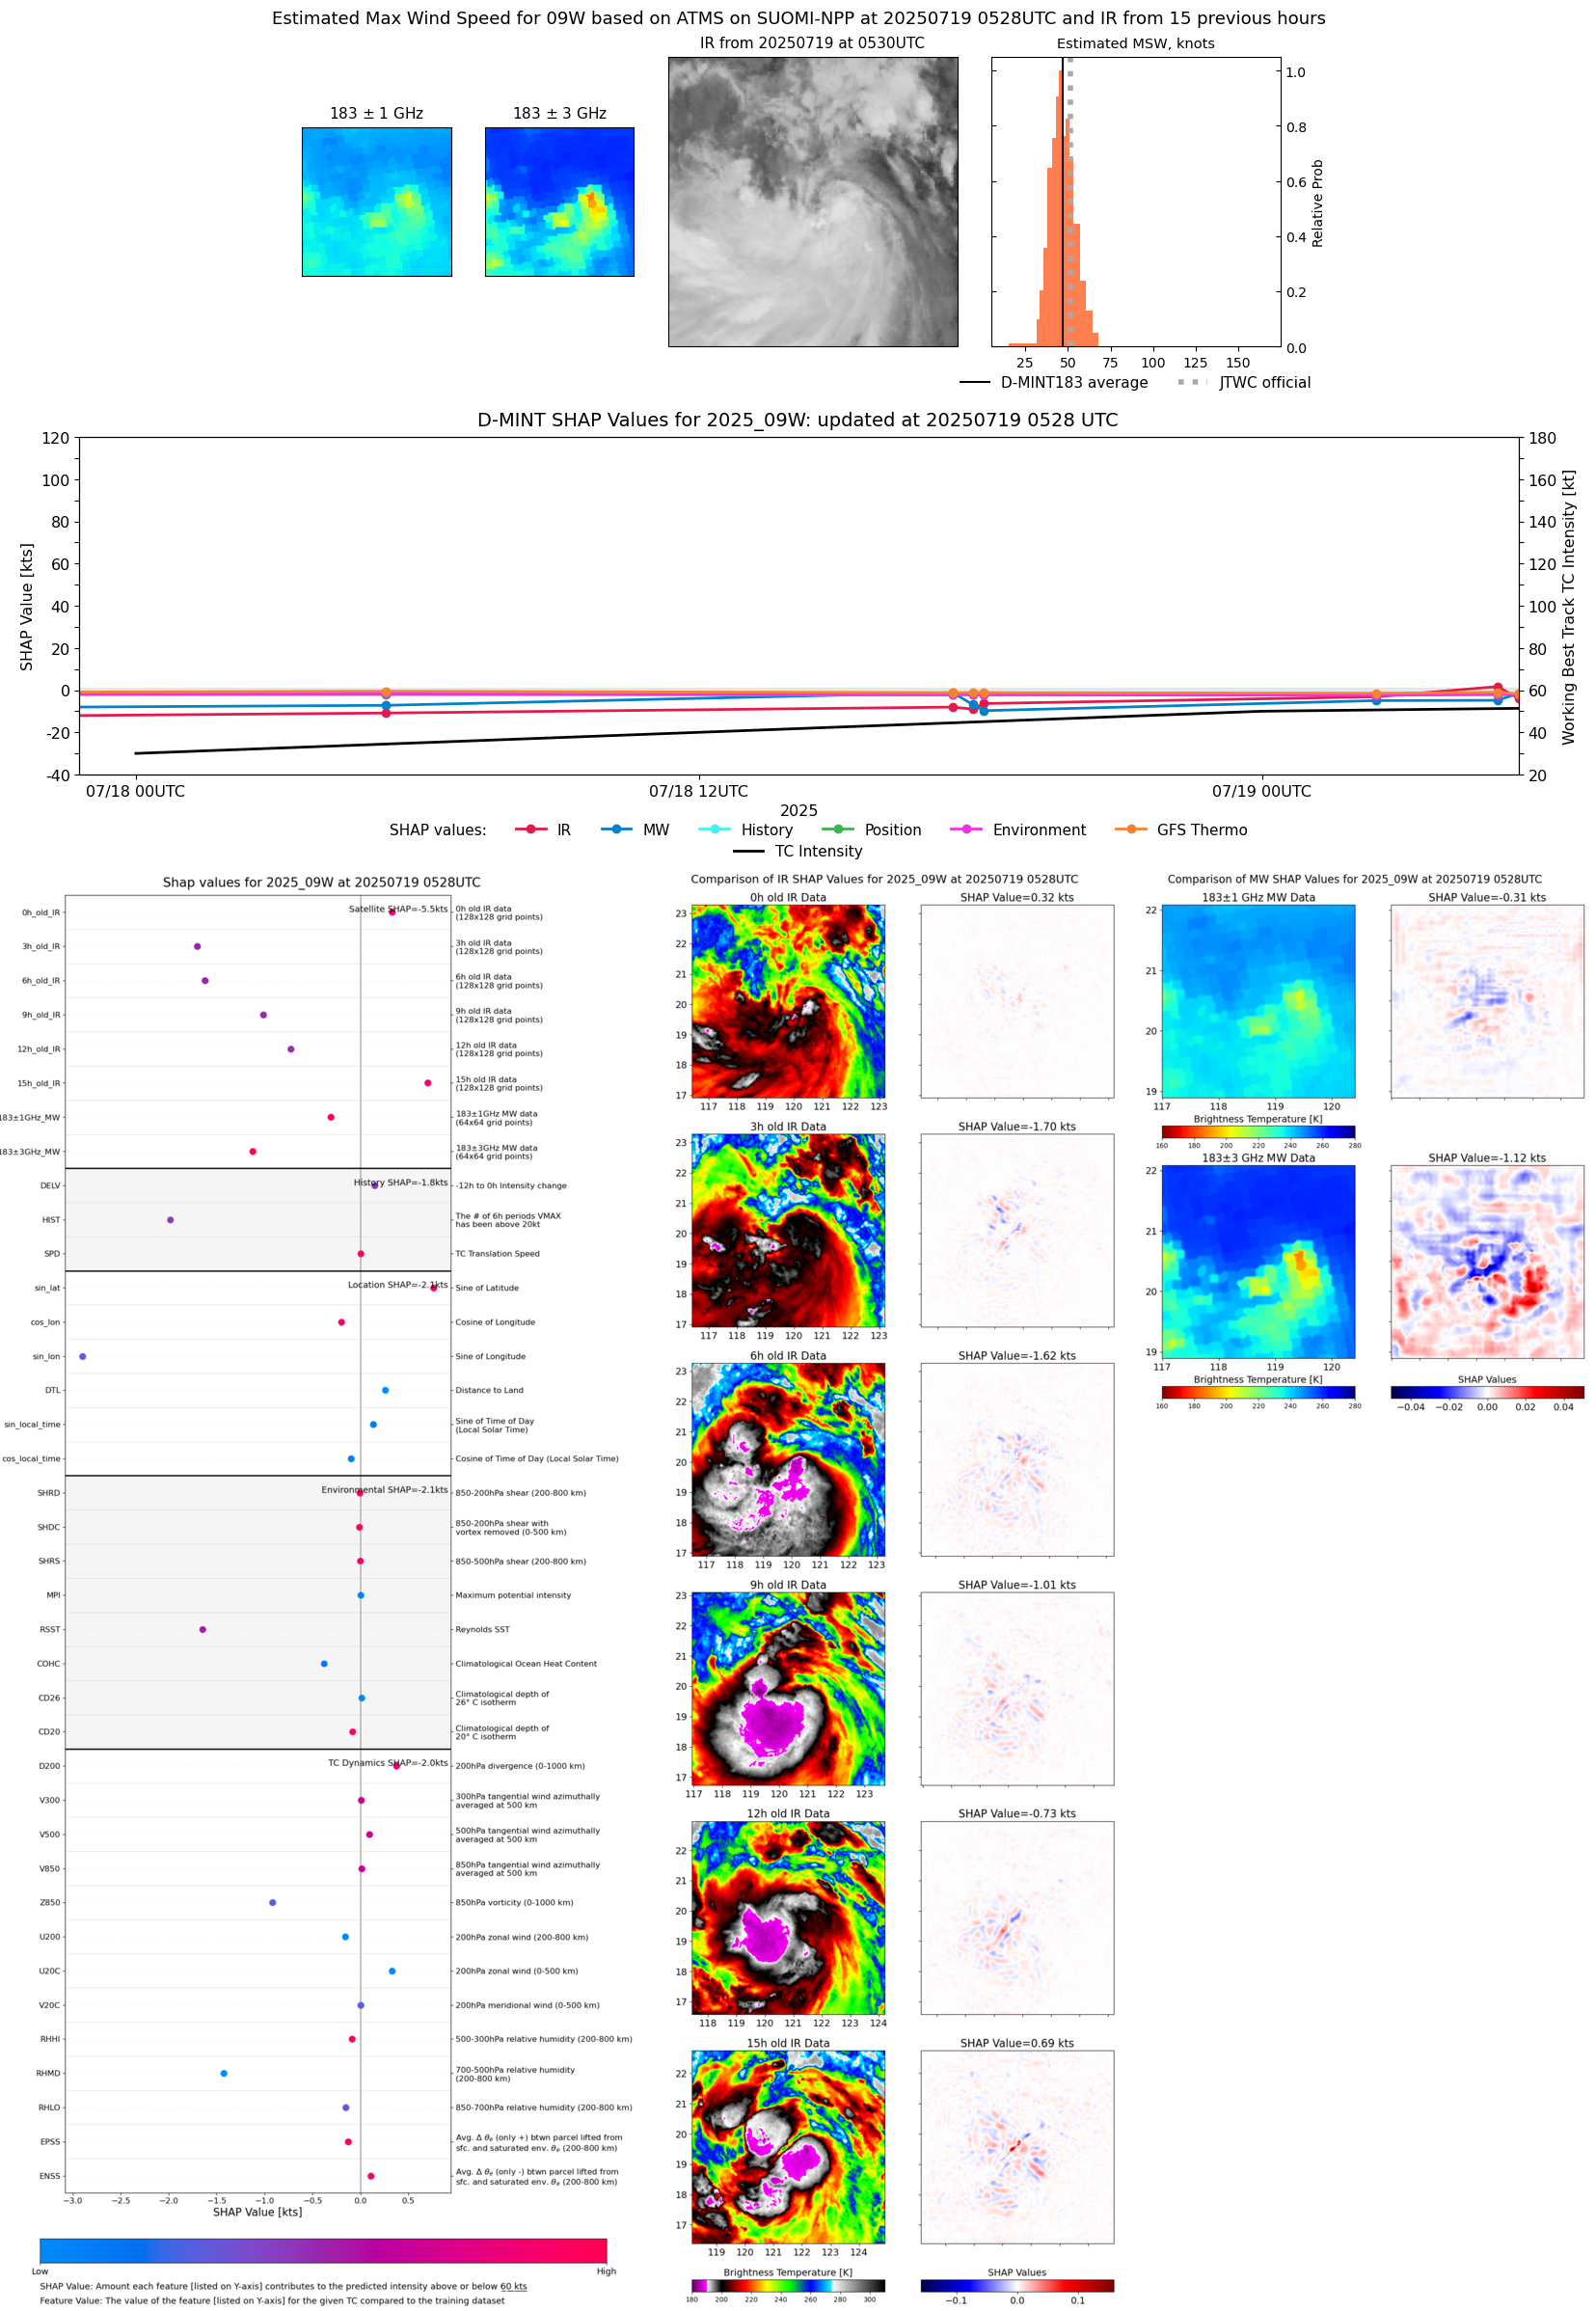 |
| 20250719 | 0501 UTC | ATMS-N21 | 980 hPa | 50 kts | 46 kts | 55 kts |  |
| 20250719 | 0225 UTC | TMS02 | 982 hPa | 44 kts | 40 kts | 49 kts | 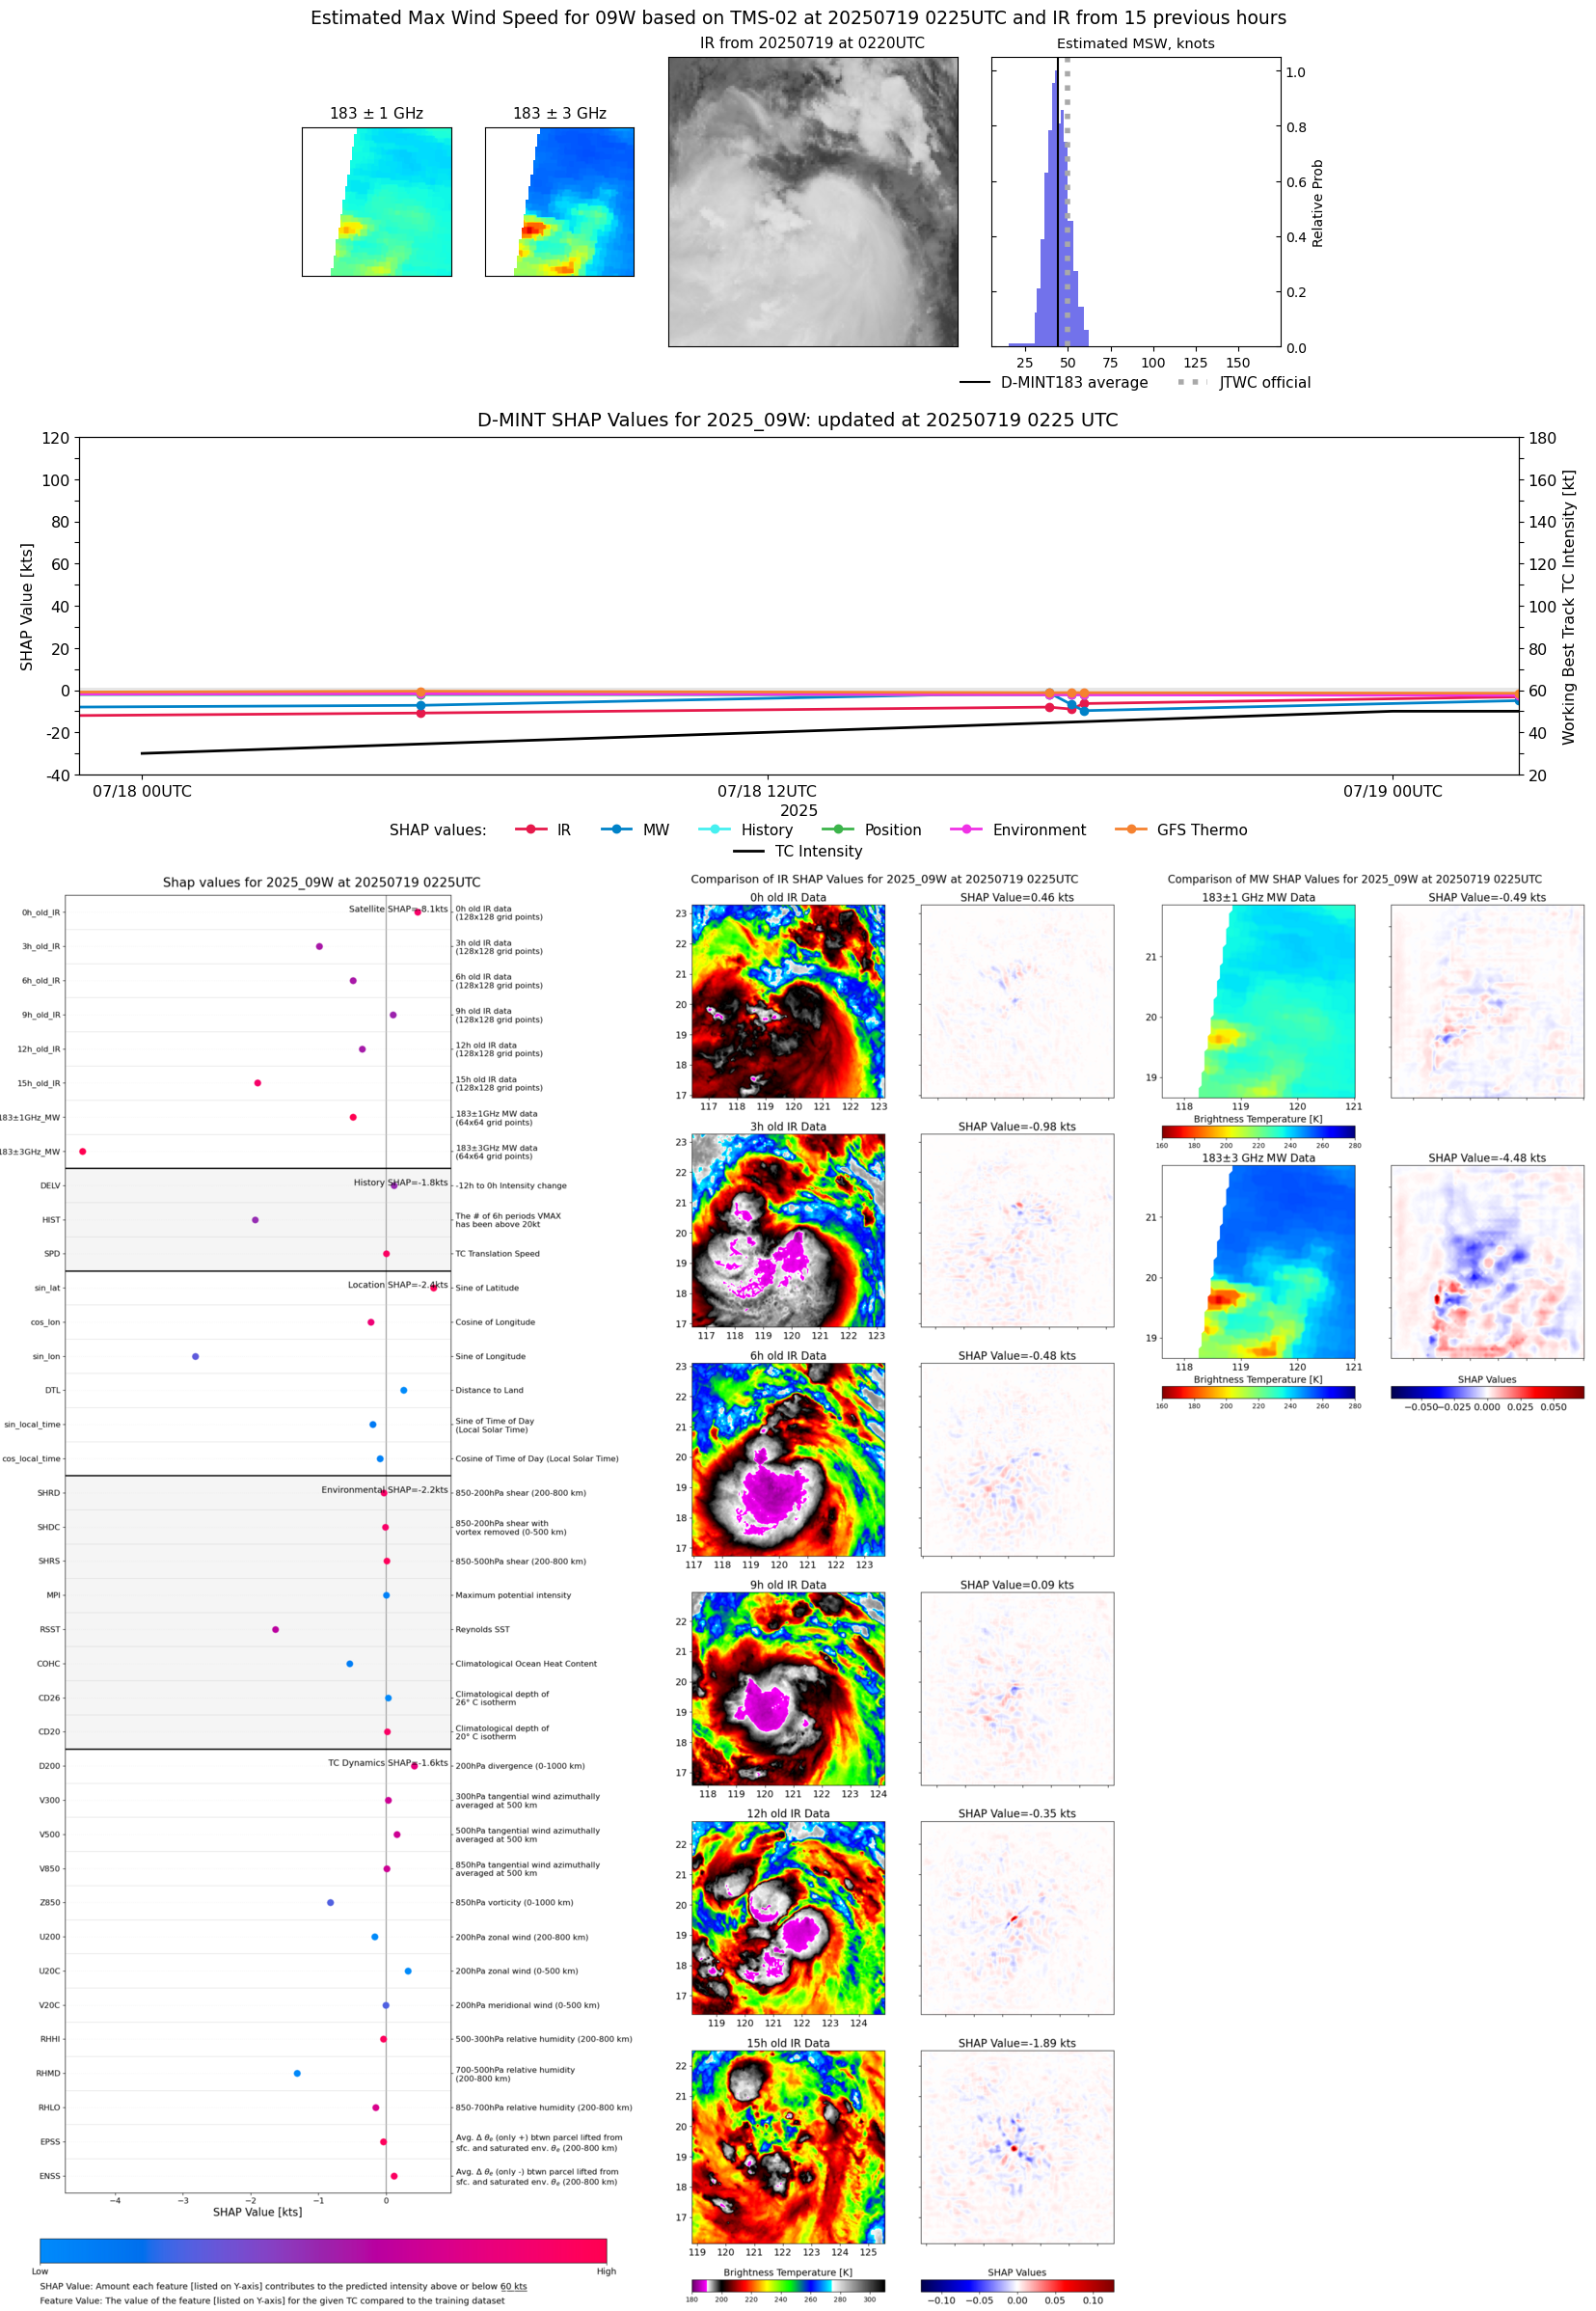 |
| 20250718 | 2205 UTC | SSMISF17 | 985 hPa | 40 kts | 35 kts | 44 kts | 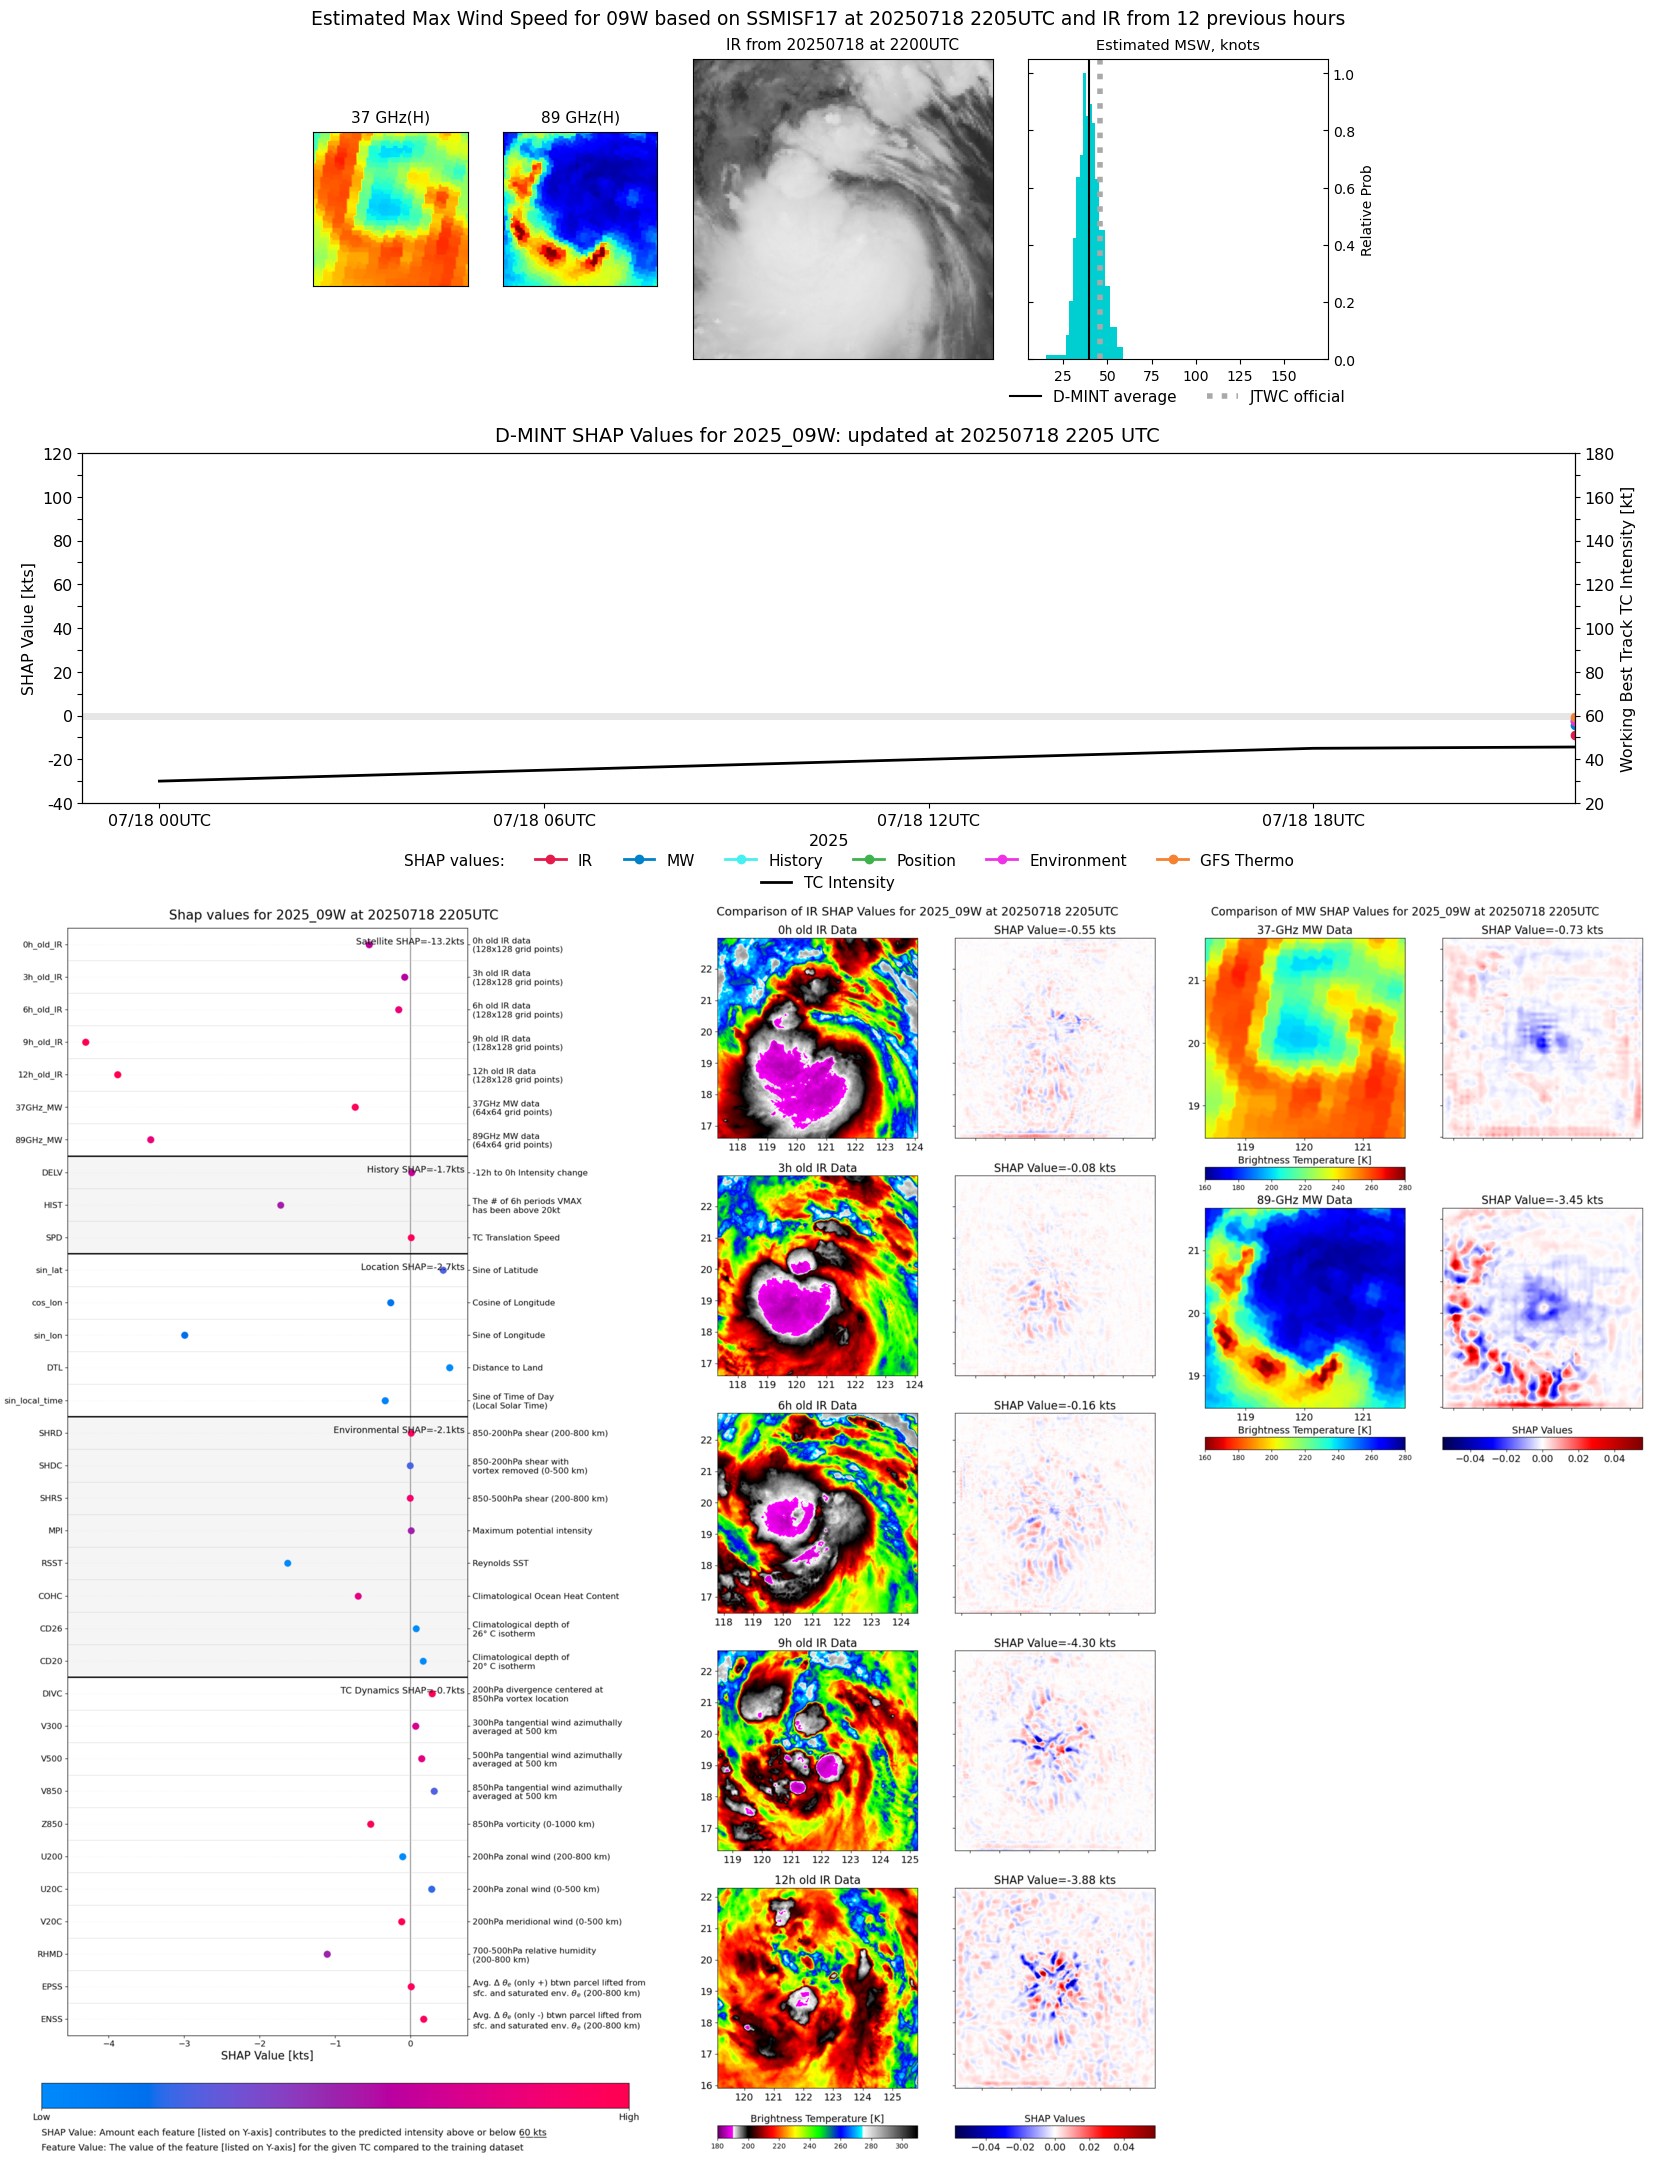 |
| 20250718 | 1804 UTC | TMS03 | 990 hPa | 36 kts | 32 kts | 41 kts | 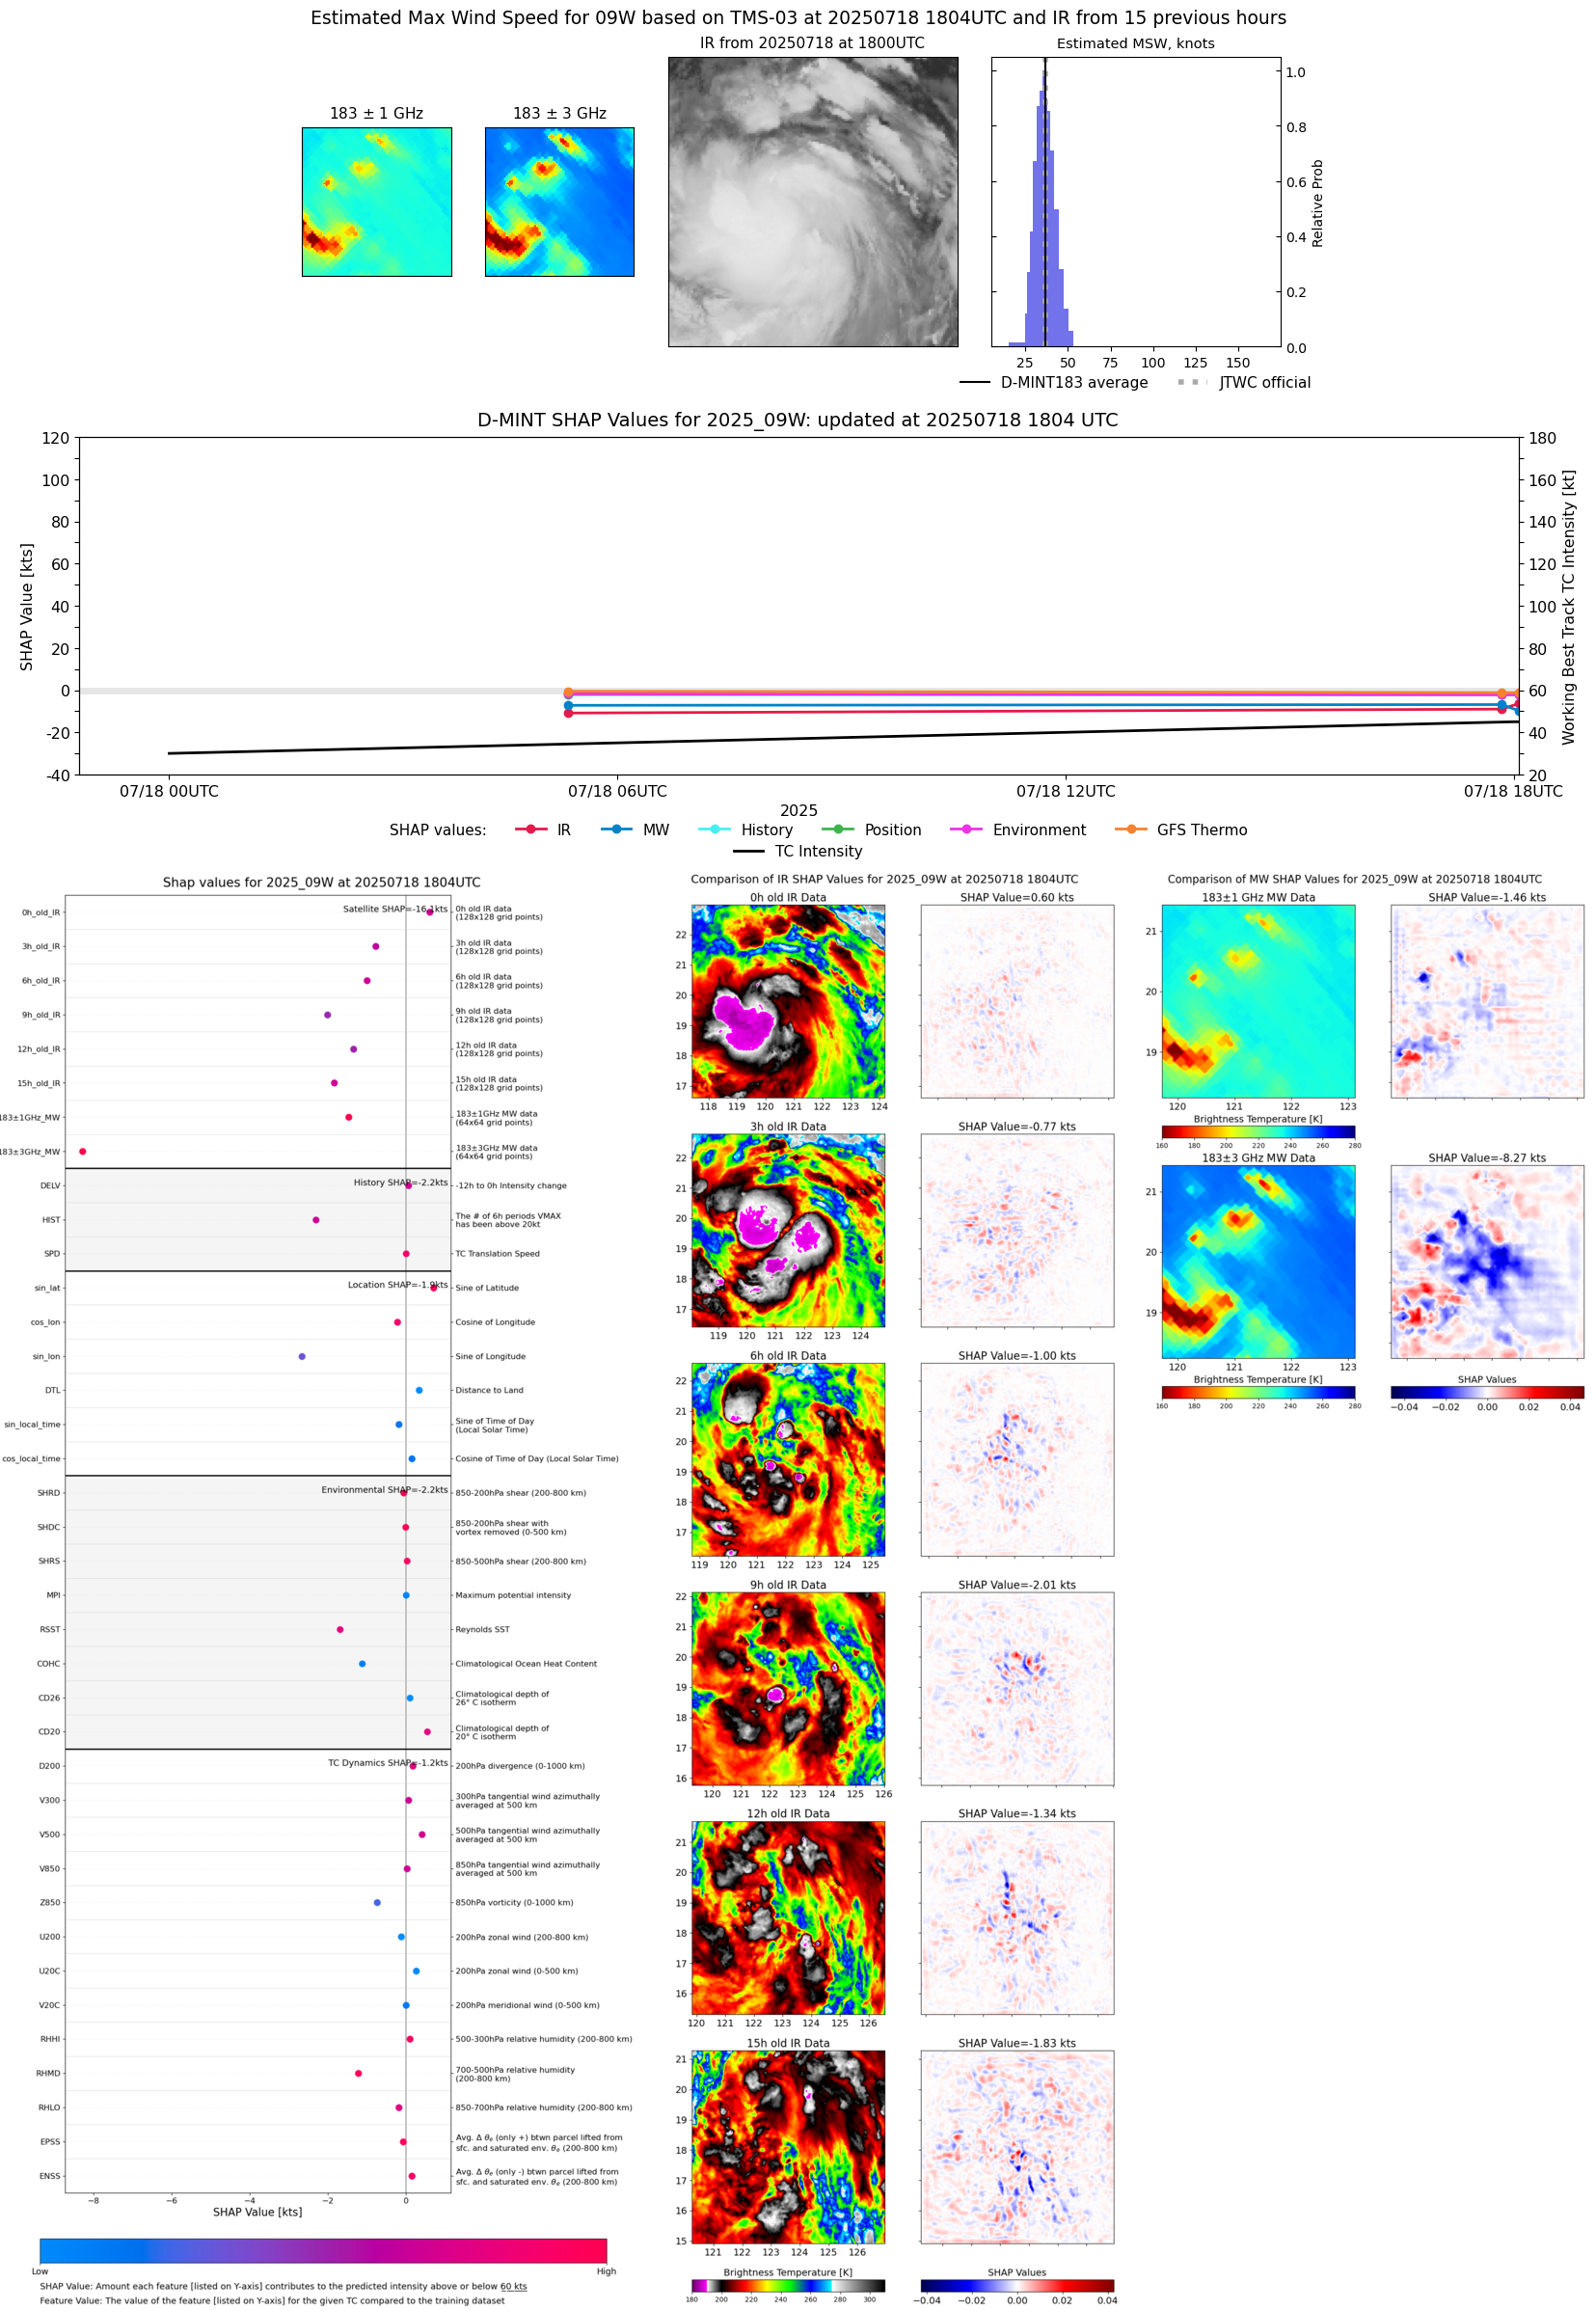 |
| 20250718 | 1750 UTC | ATMS-N21 | 990 hPa | 37 kts | 33 kts | 41 kts | 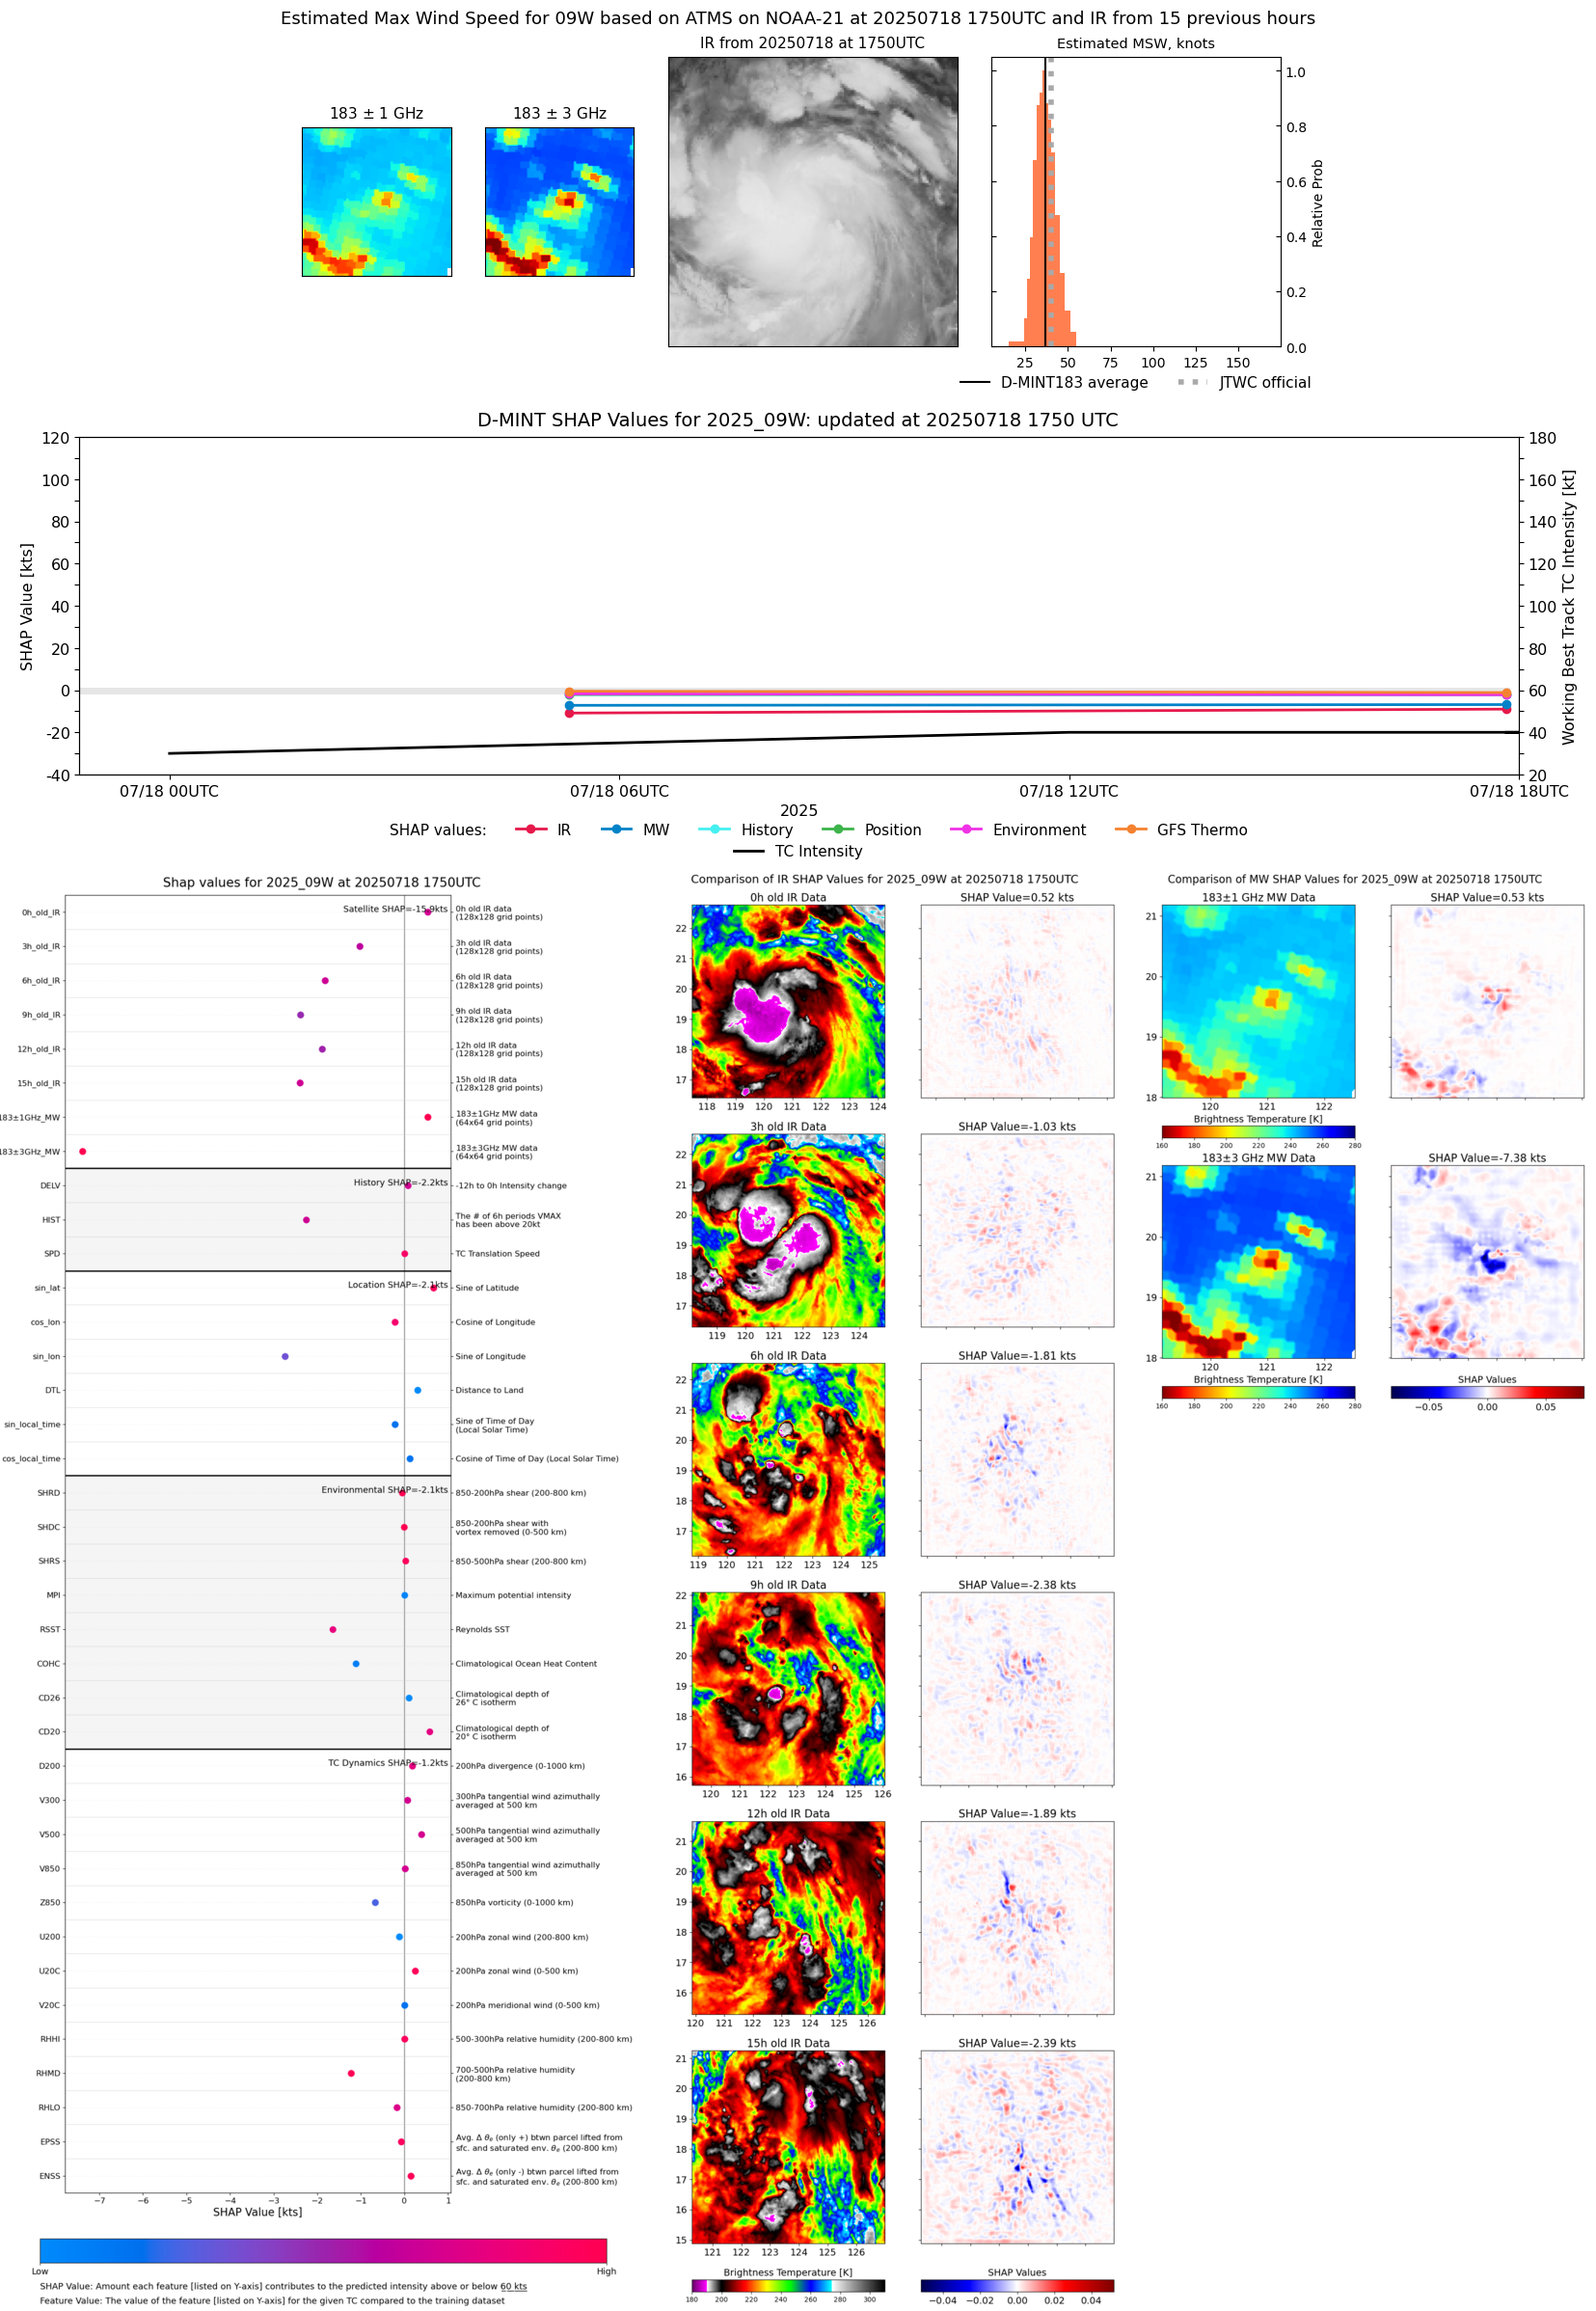 |
| 20250718 | 1728 UTC | AMSR2 | 988 hPa | 36 kts | 32 kts | 40 kts |  |
| 20250718 | 1725 UTC | TROPICS03 | 987 hPa | 43 kts | 39 kts | 48 kts | 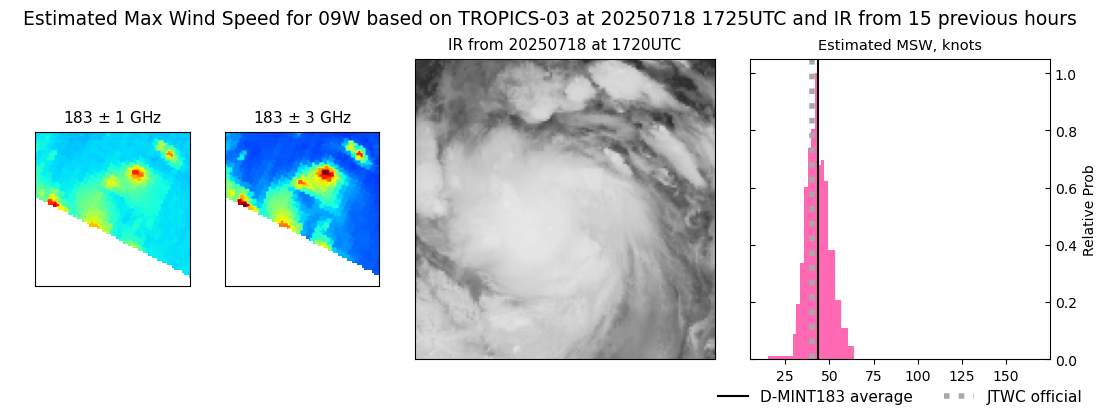 |
| 20250718 | 1724 UTC | TROPICS03 | 985 hPa | 43 kts | 39 kts | 48 kts | 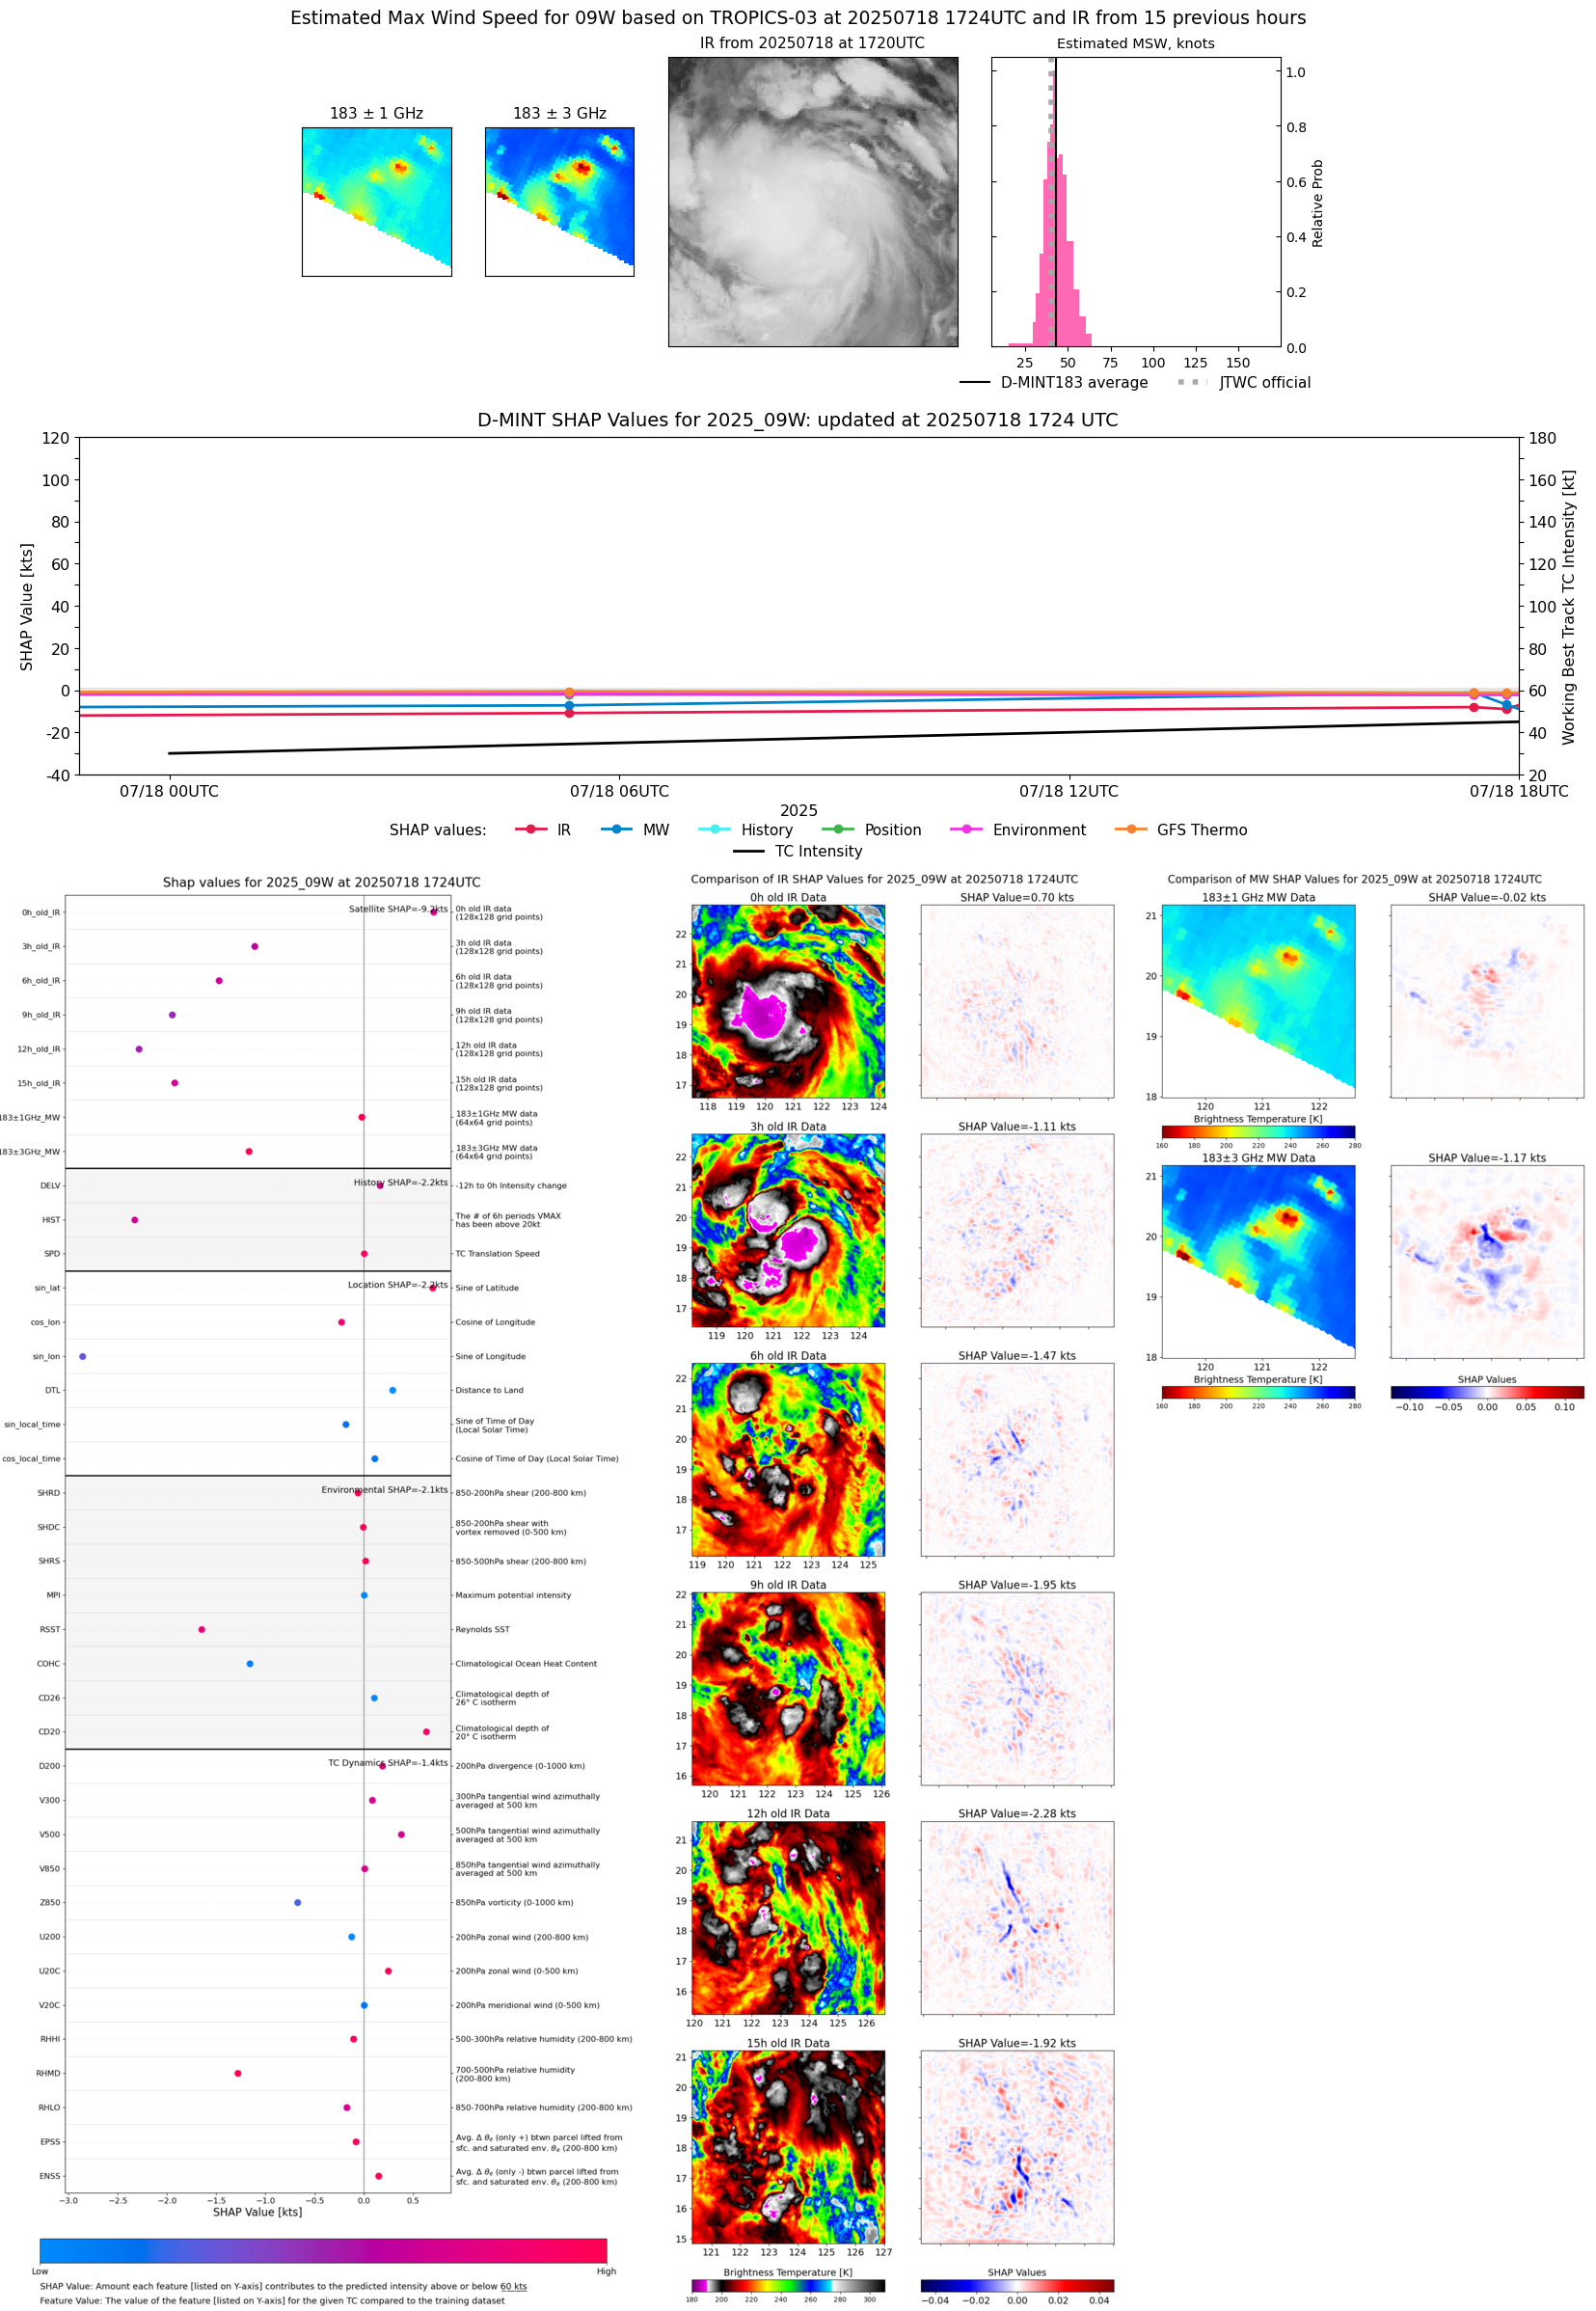 |
| 20250718 | 0520 UTC | ATMS-N21 | 991 hPa | 36 kts | 32 kts | 39 kts | 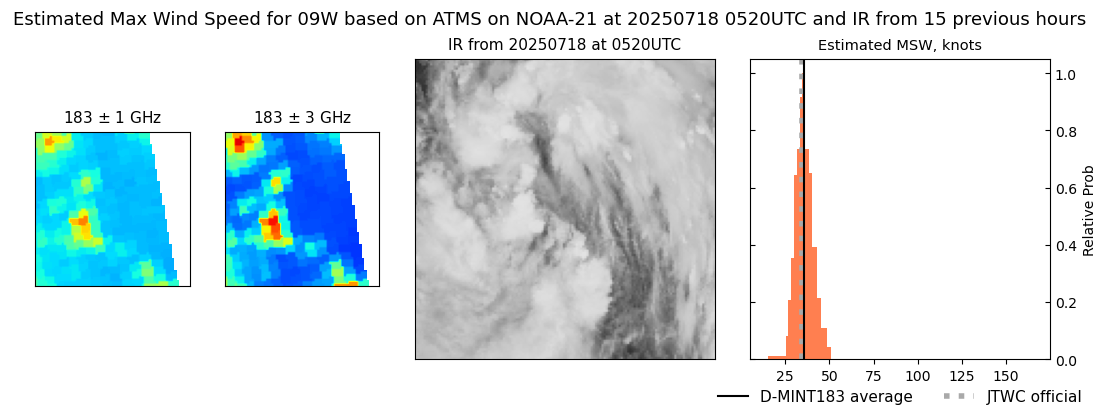 |
| 20250717 | 1820 UTC | TROPICS03 | 991 hPa | 31 kts | 28 kts | 35 kts | 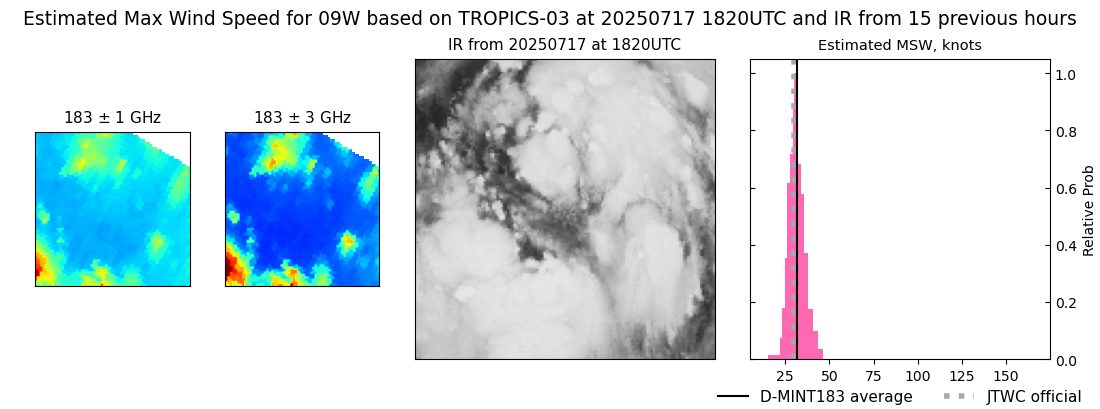 |
| 20250717 | 1008 UTC | TROPICS03 | 993 hPa | 25 kts | 23 kts | 27 kts | 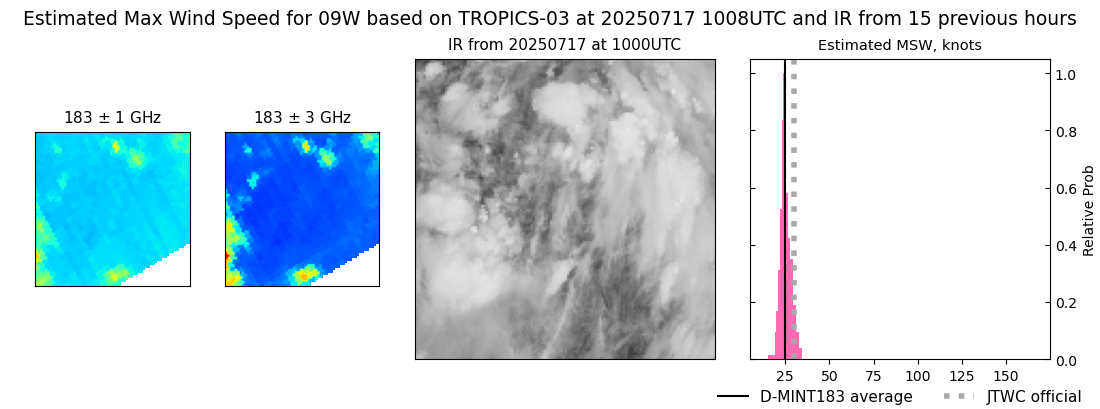 |