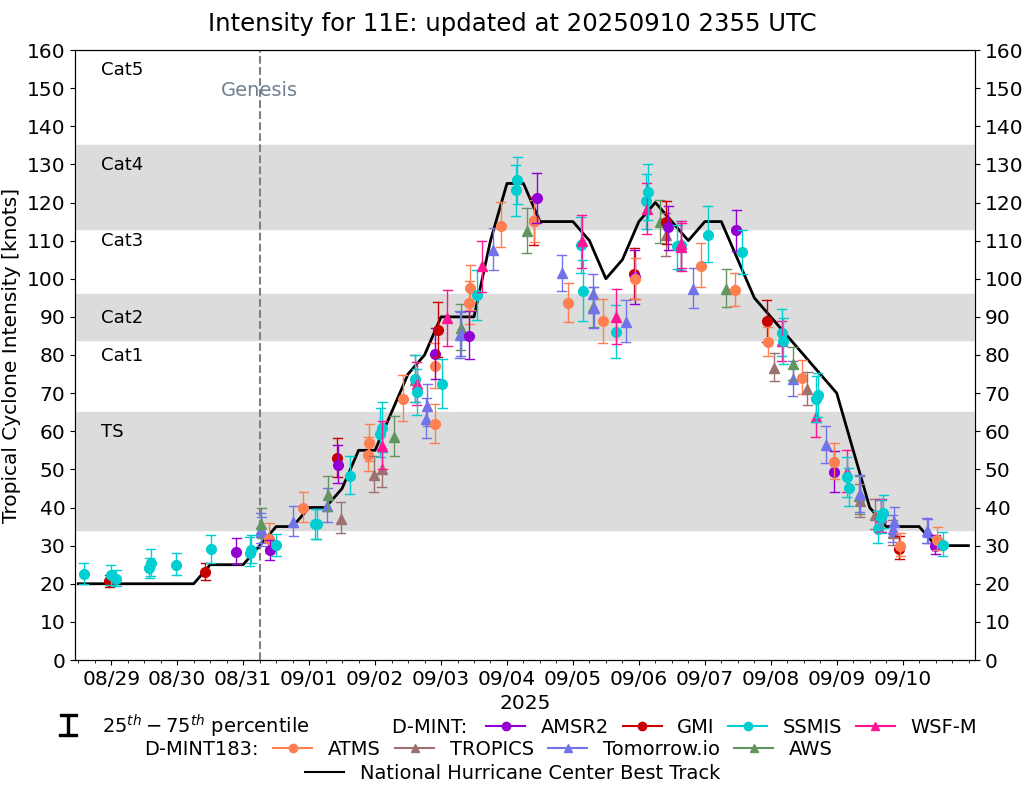
|
||

 |
D-MINT HISTORY FILE for 2025_11E
| Date | Time | MW Sensor | MSLP | Vmax (30th-70th percentile average) | Vmax 25th percentile | Vmax 75th percentile | Image |
| 20250910 | 1440 UTC | SSMISF18 | 1011 hPa | 30 kts | 27 kts | 34 kts | 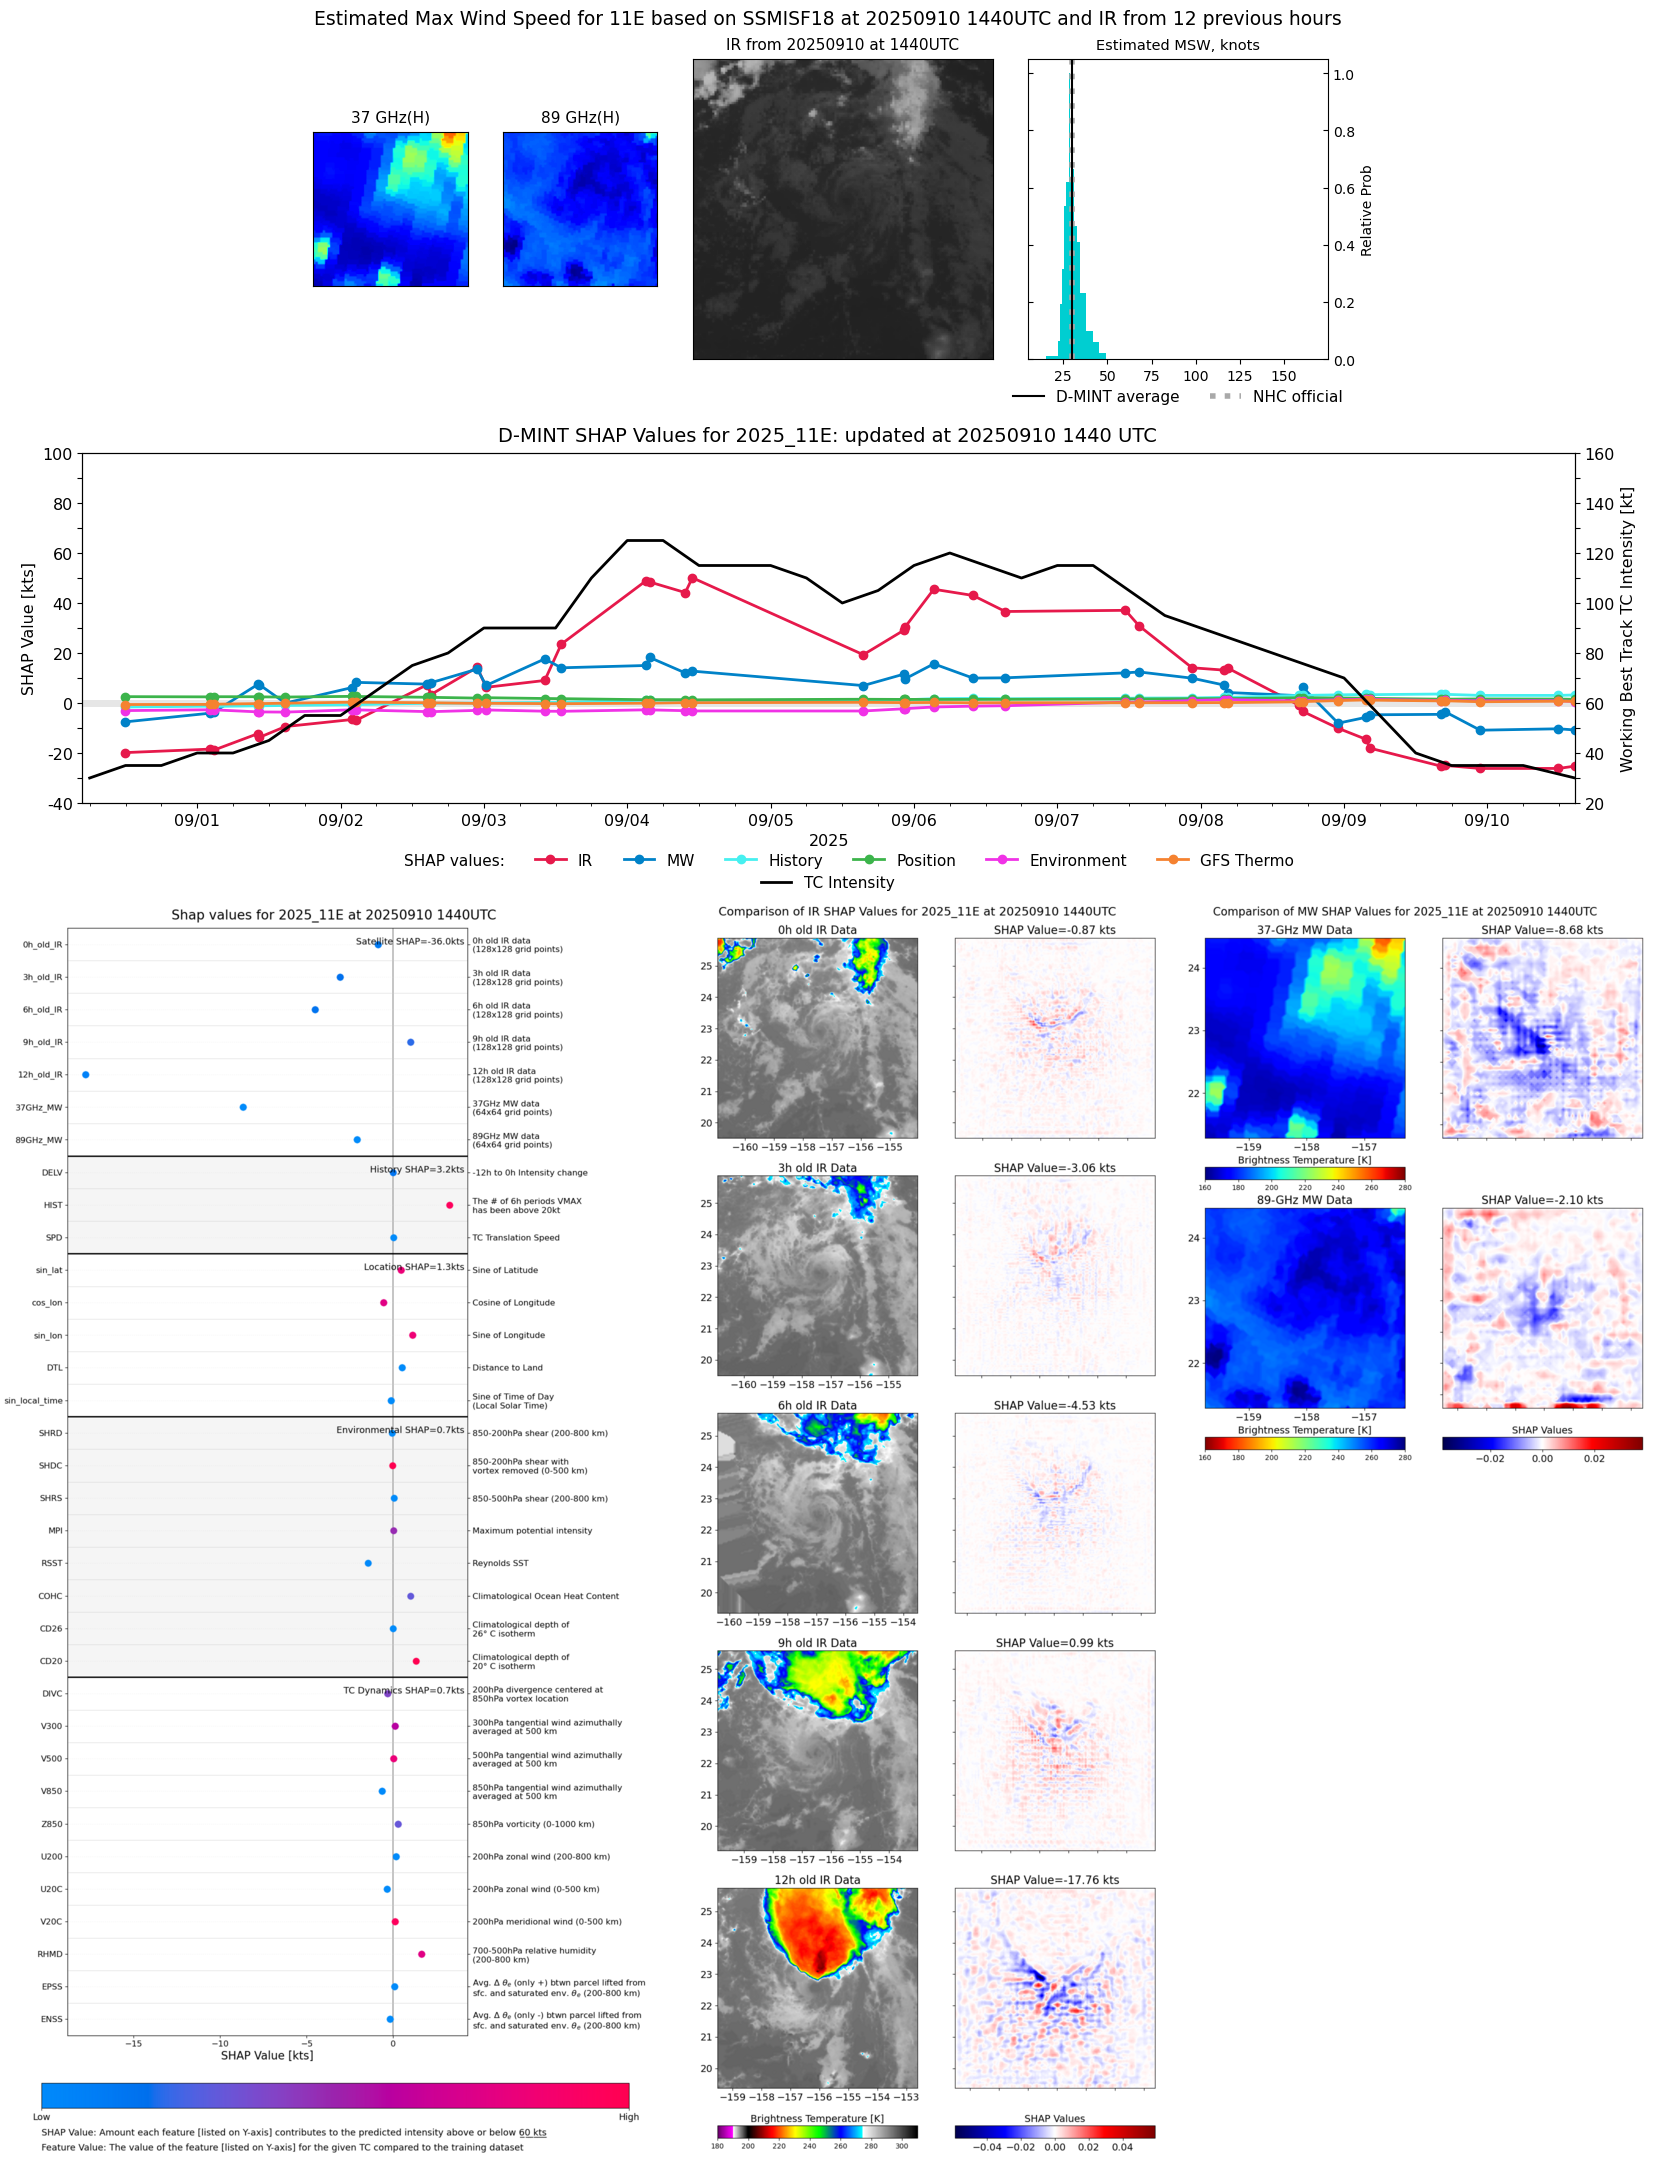 |
| 20250910 | 1232 UTC | ATMS-N21 | 1008 hPa | 32 kts | 29 kts | 35 kts | 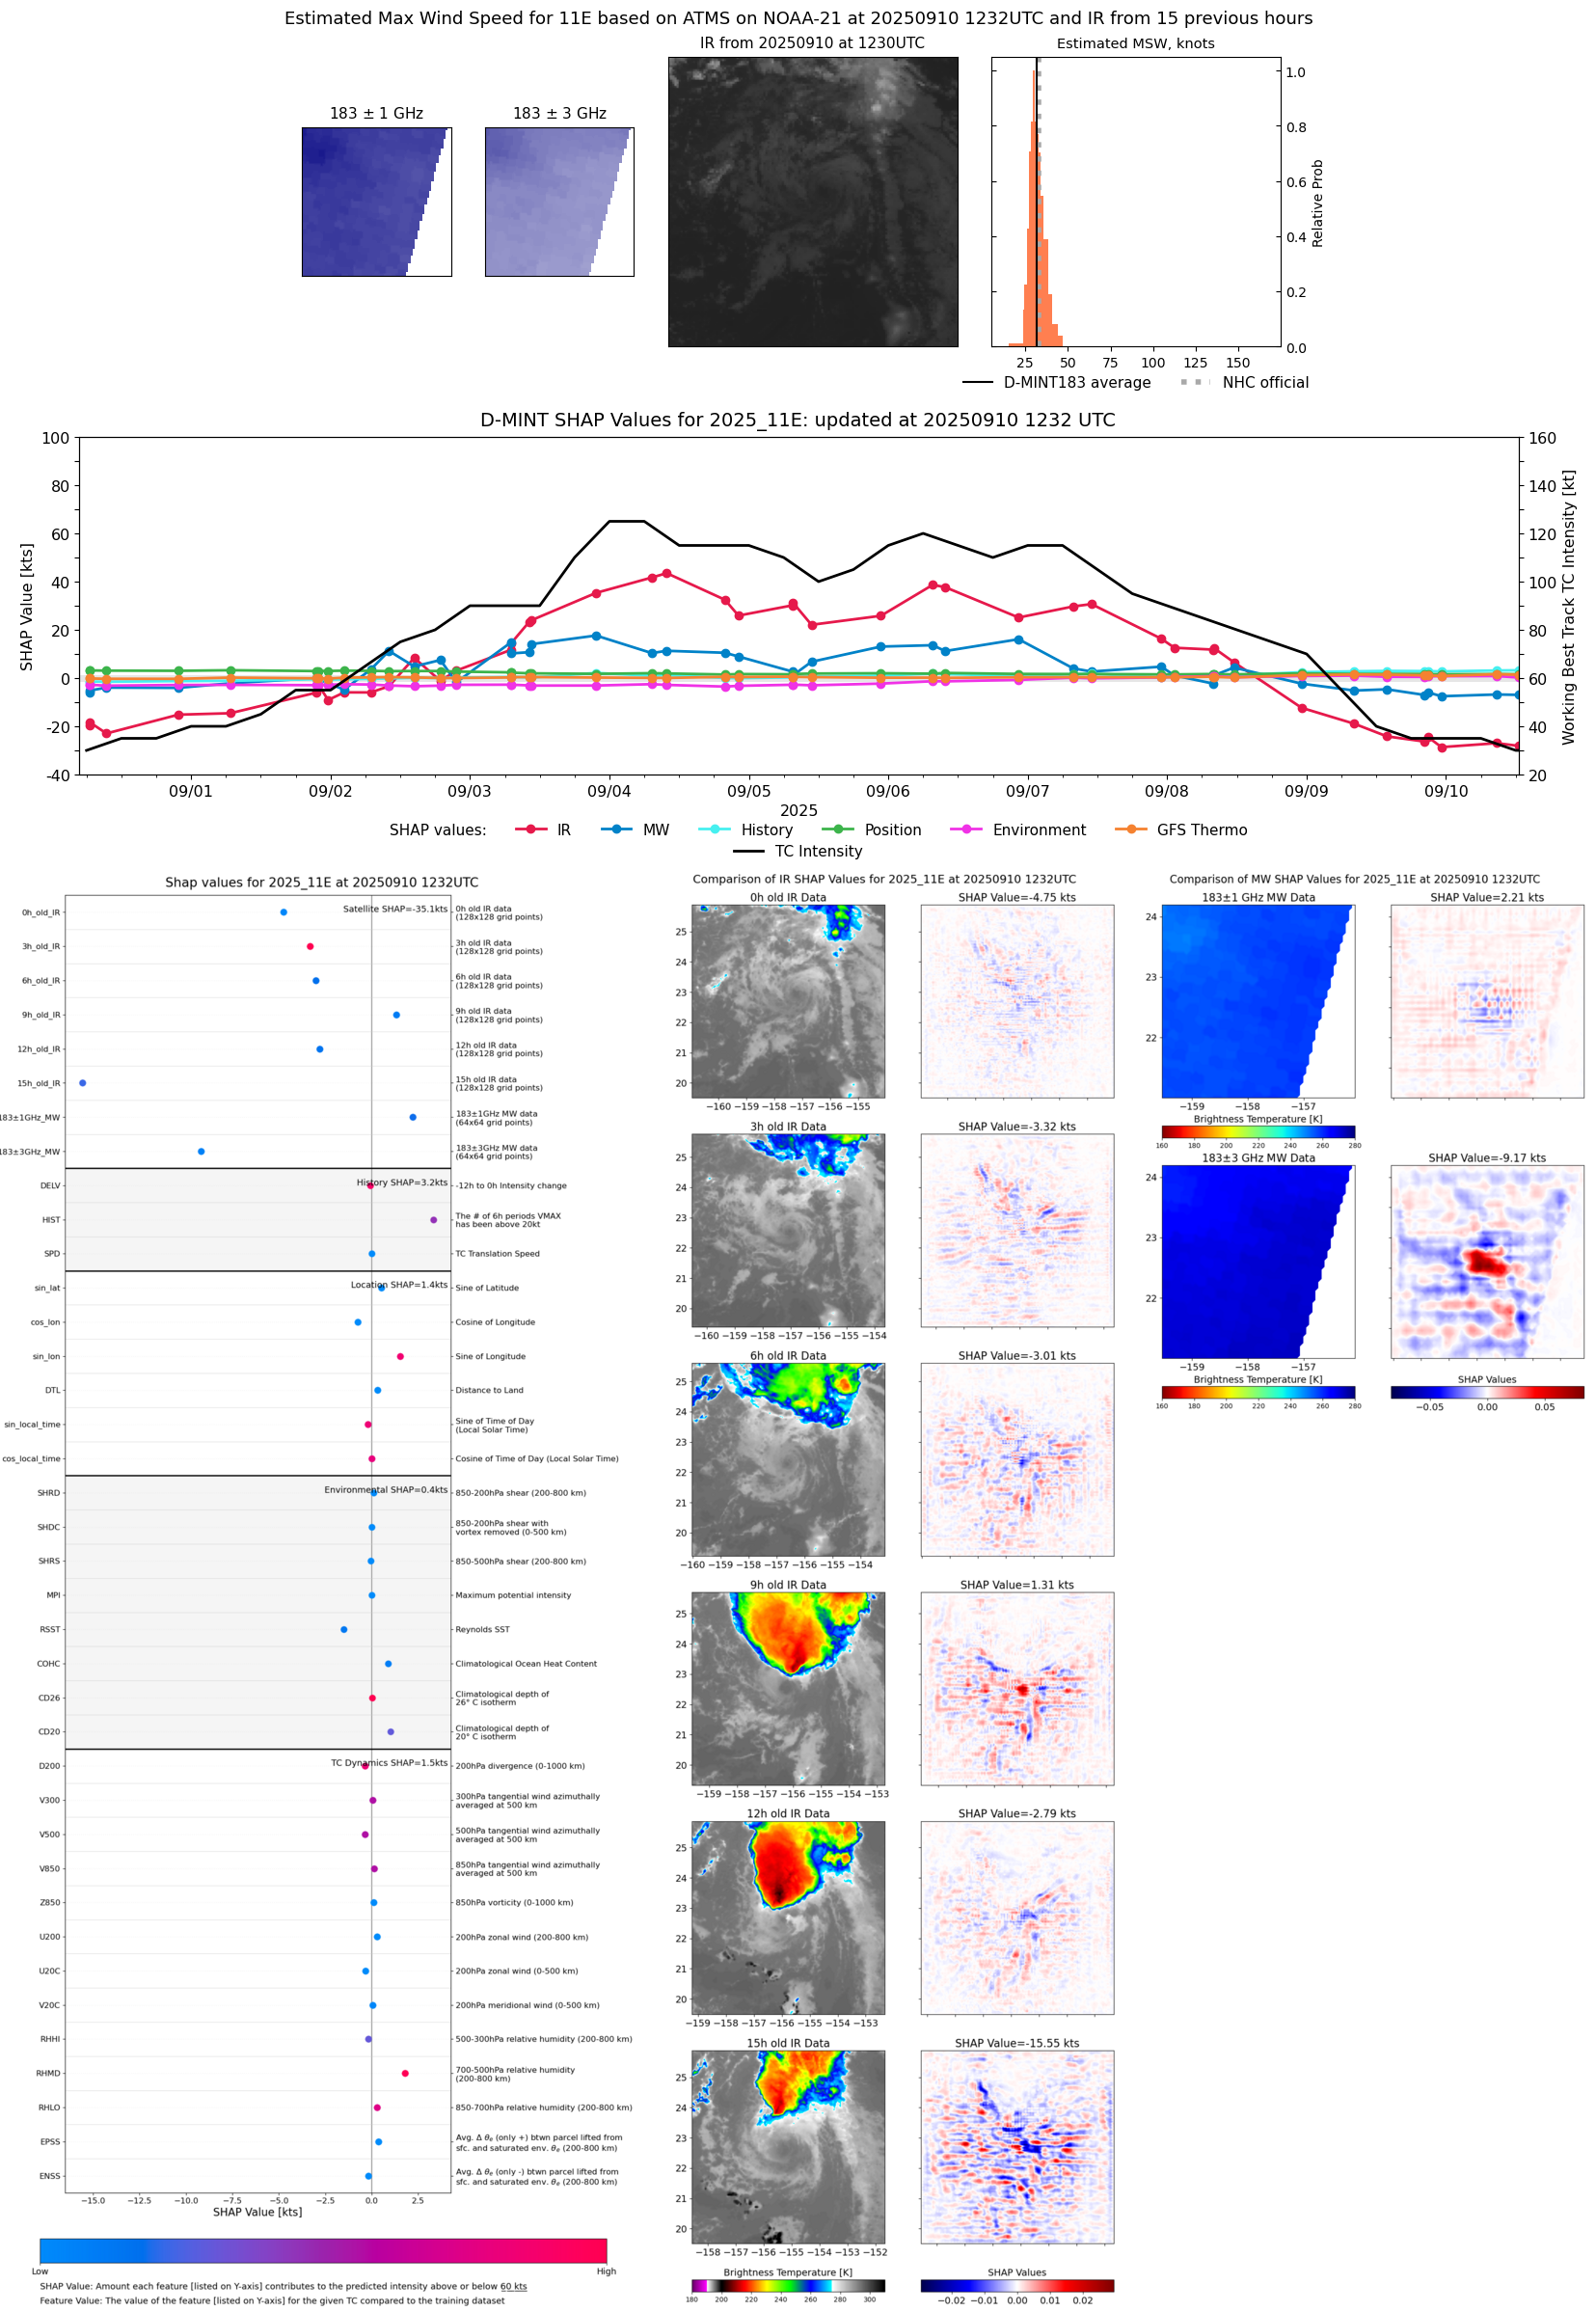 |
| 20250910 | 1154 UTC | AMSR2 | 1011 hPa | 30 kts | 28 kts | 33 kts | 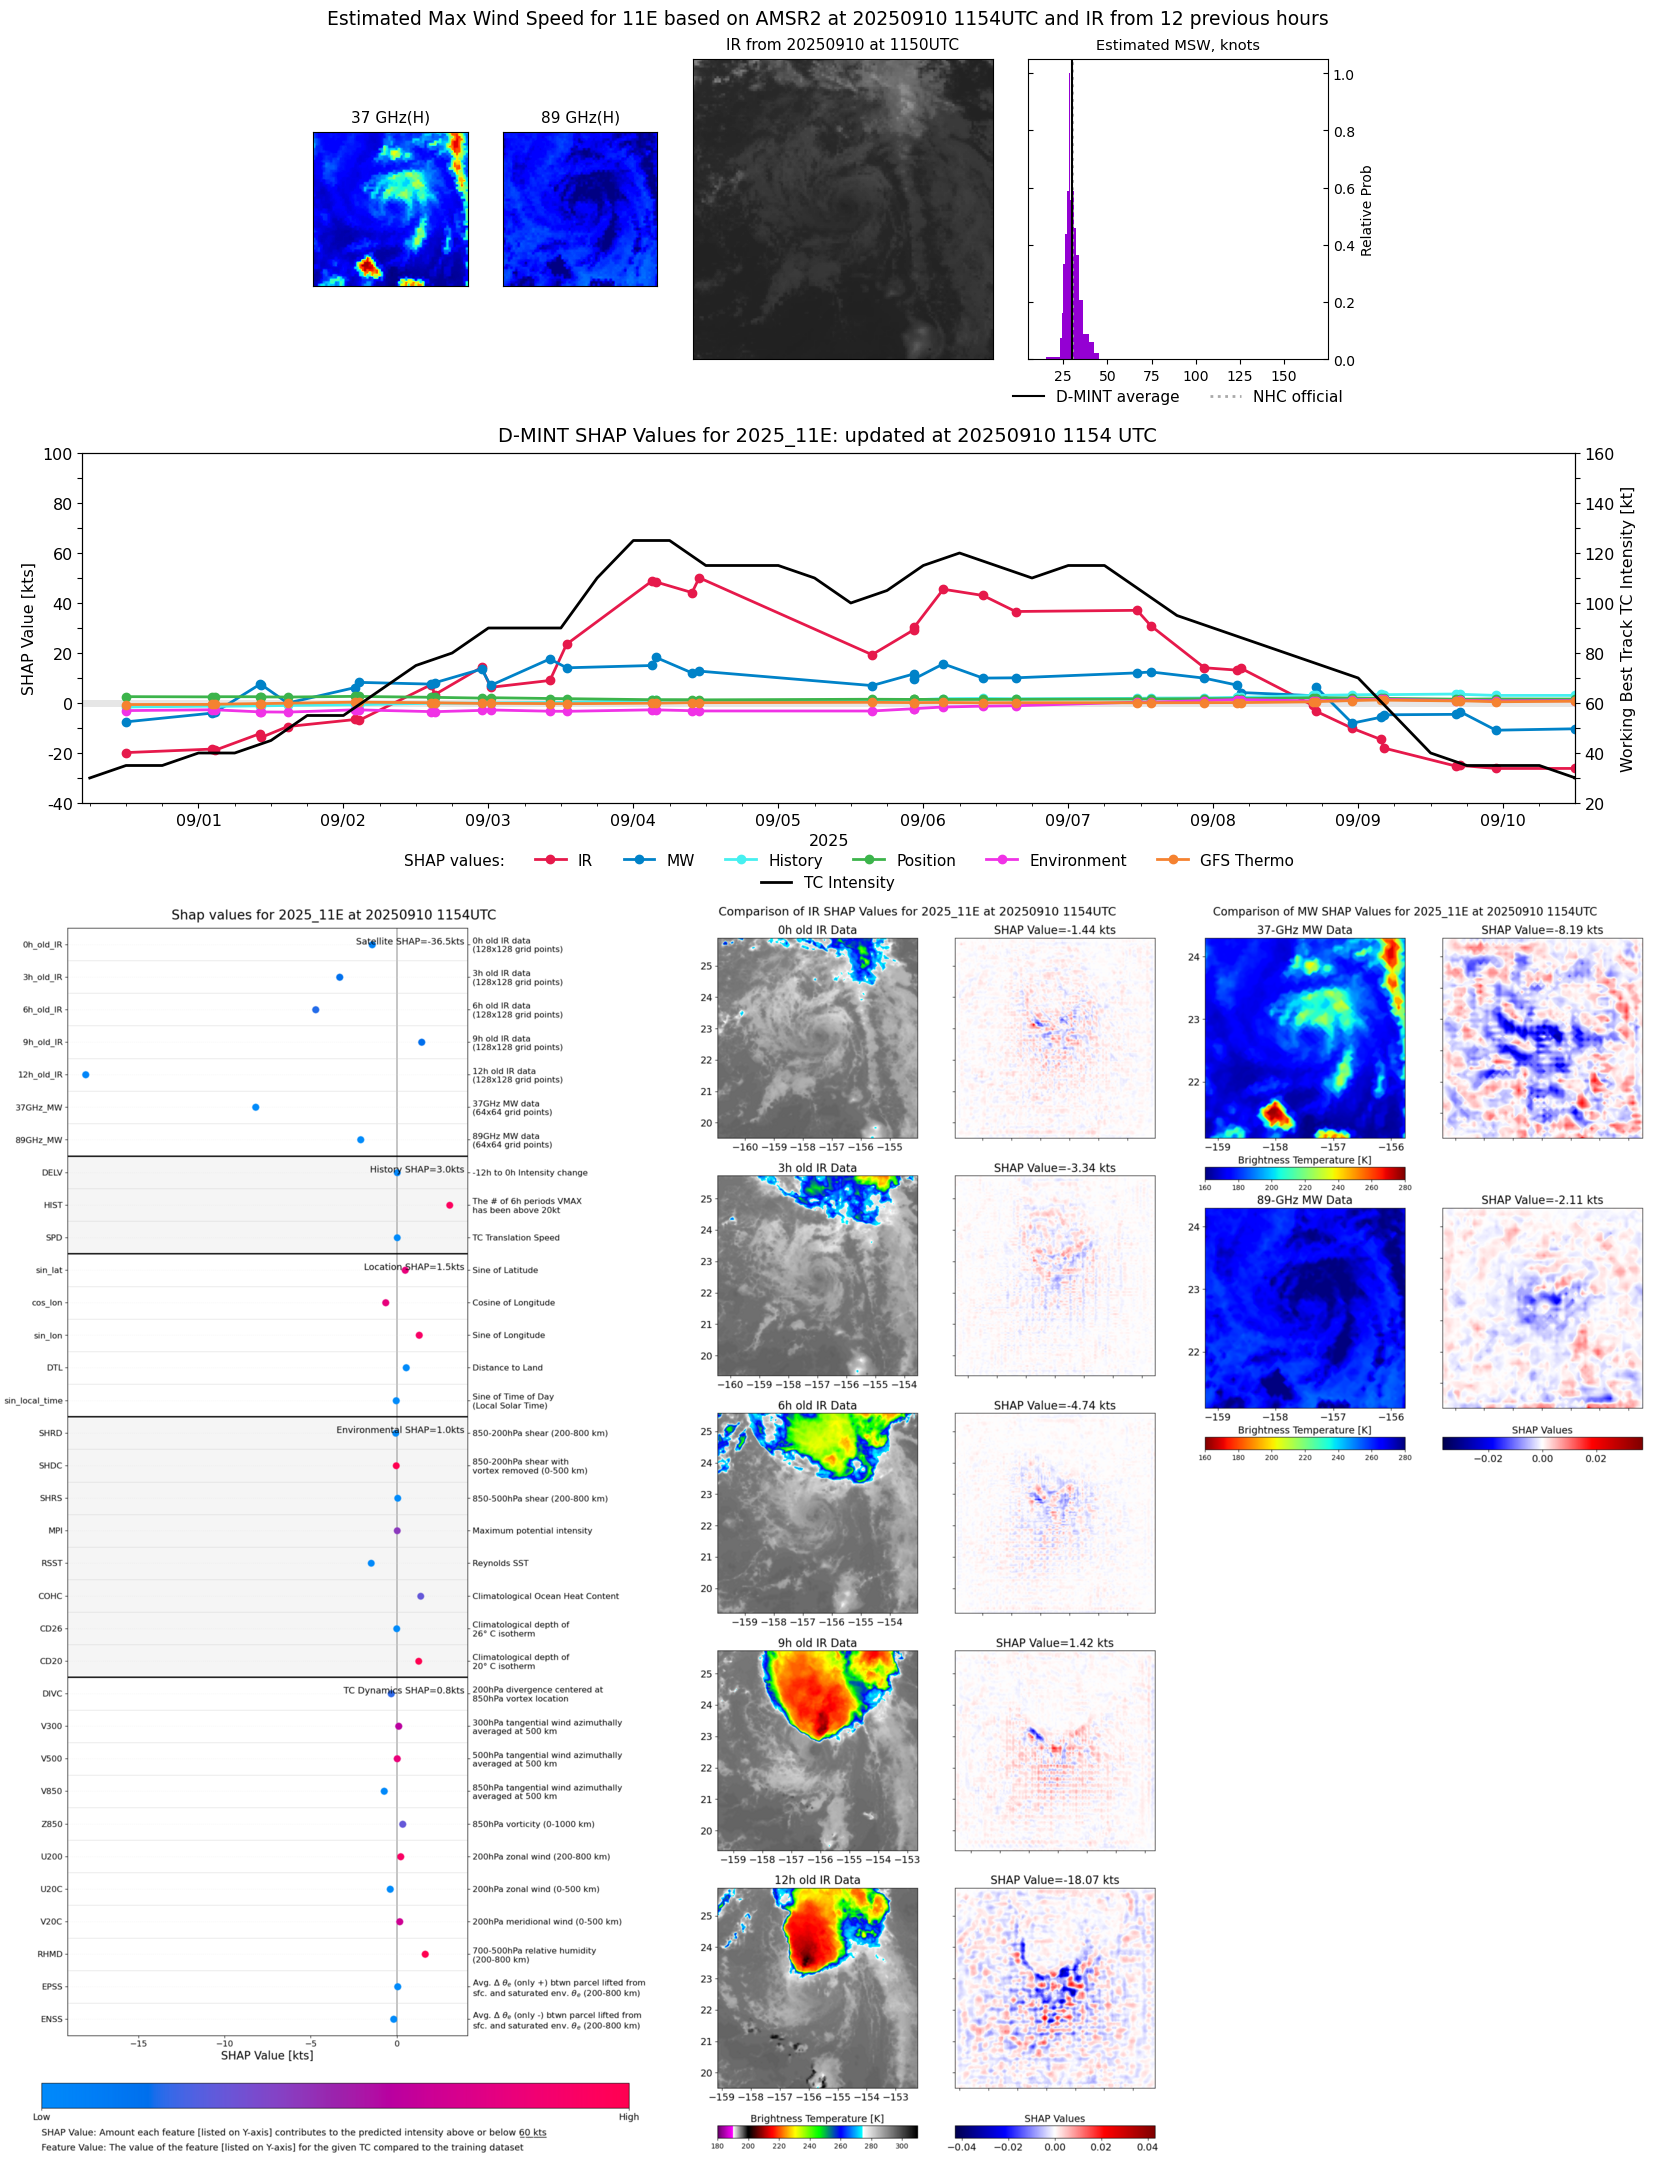 |
| 20250910 | 0902 UTC | TMS06 | 1007 hPa | 34 kts | 31 kts | 37 kts |  |
| 20250910 | 0844 UTC | TMS02 | 1007 hPa | 34 kts | 31 kts | 37 kts | 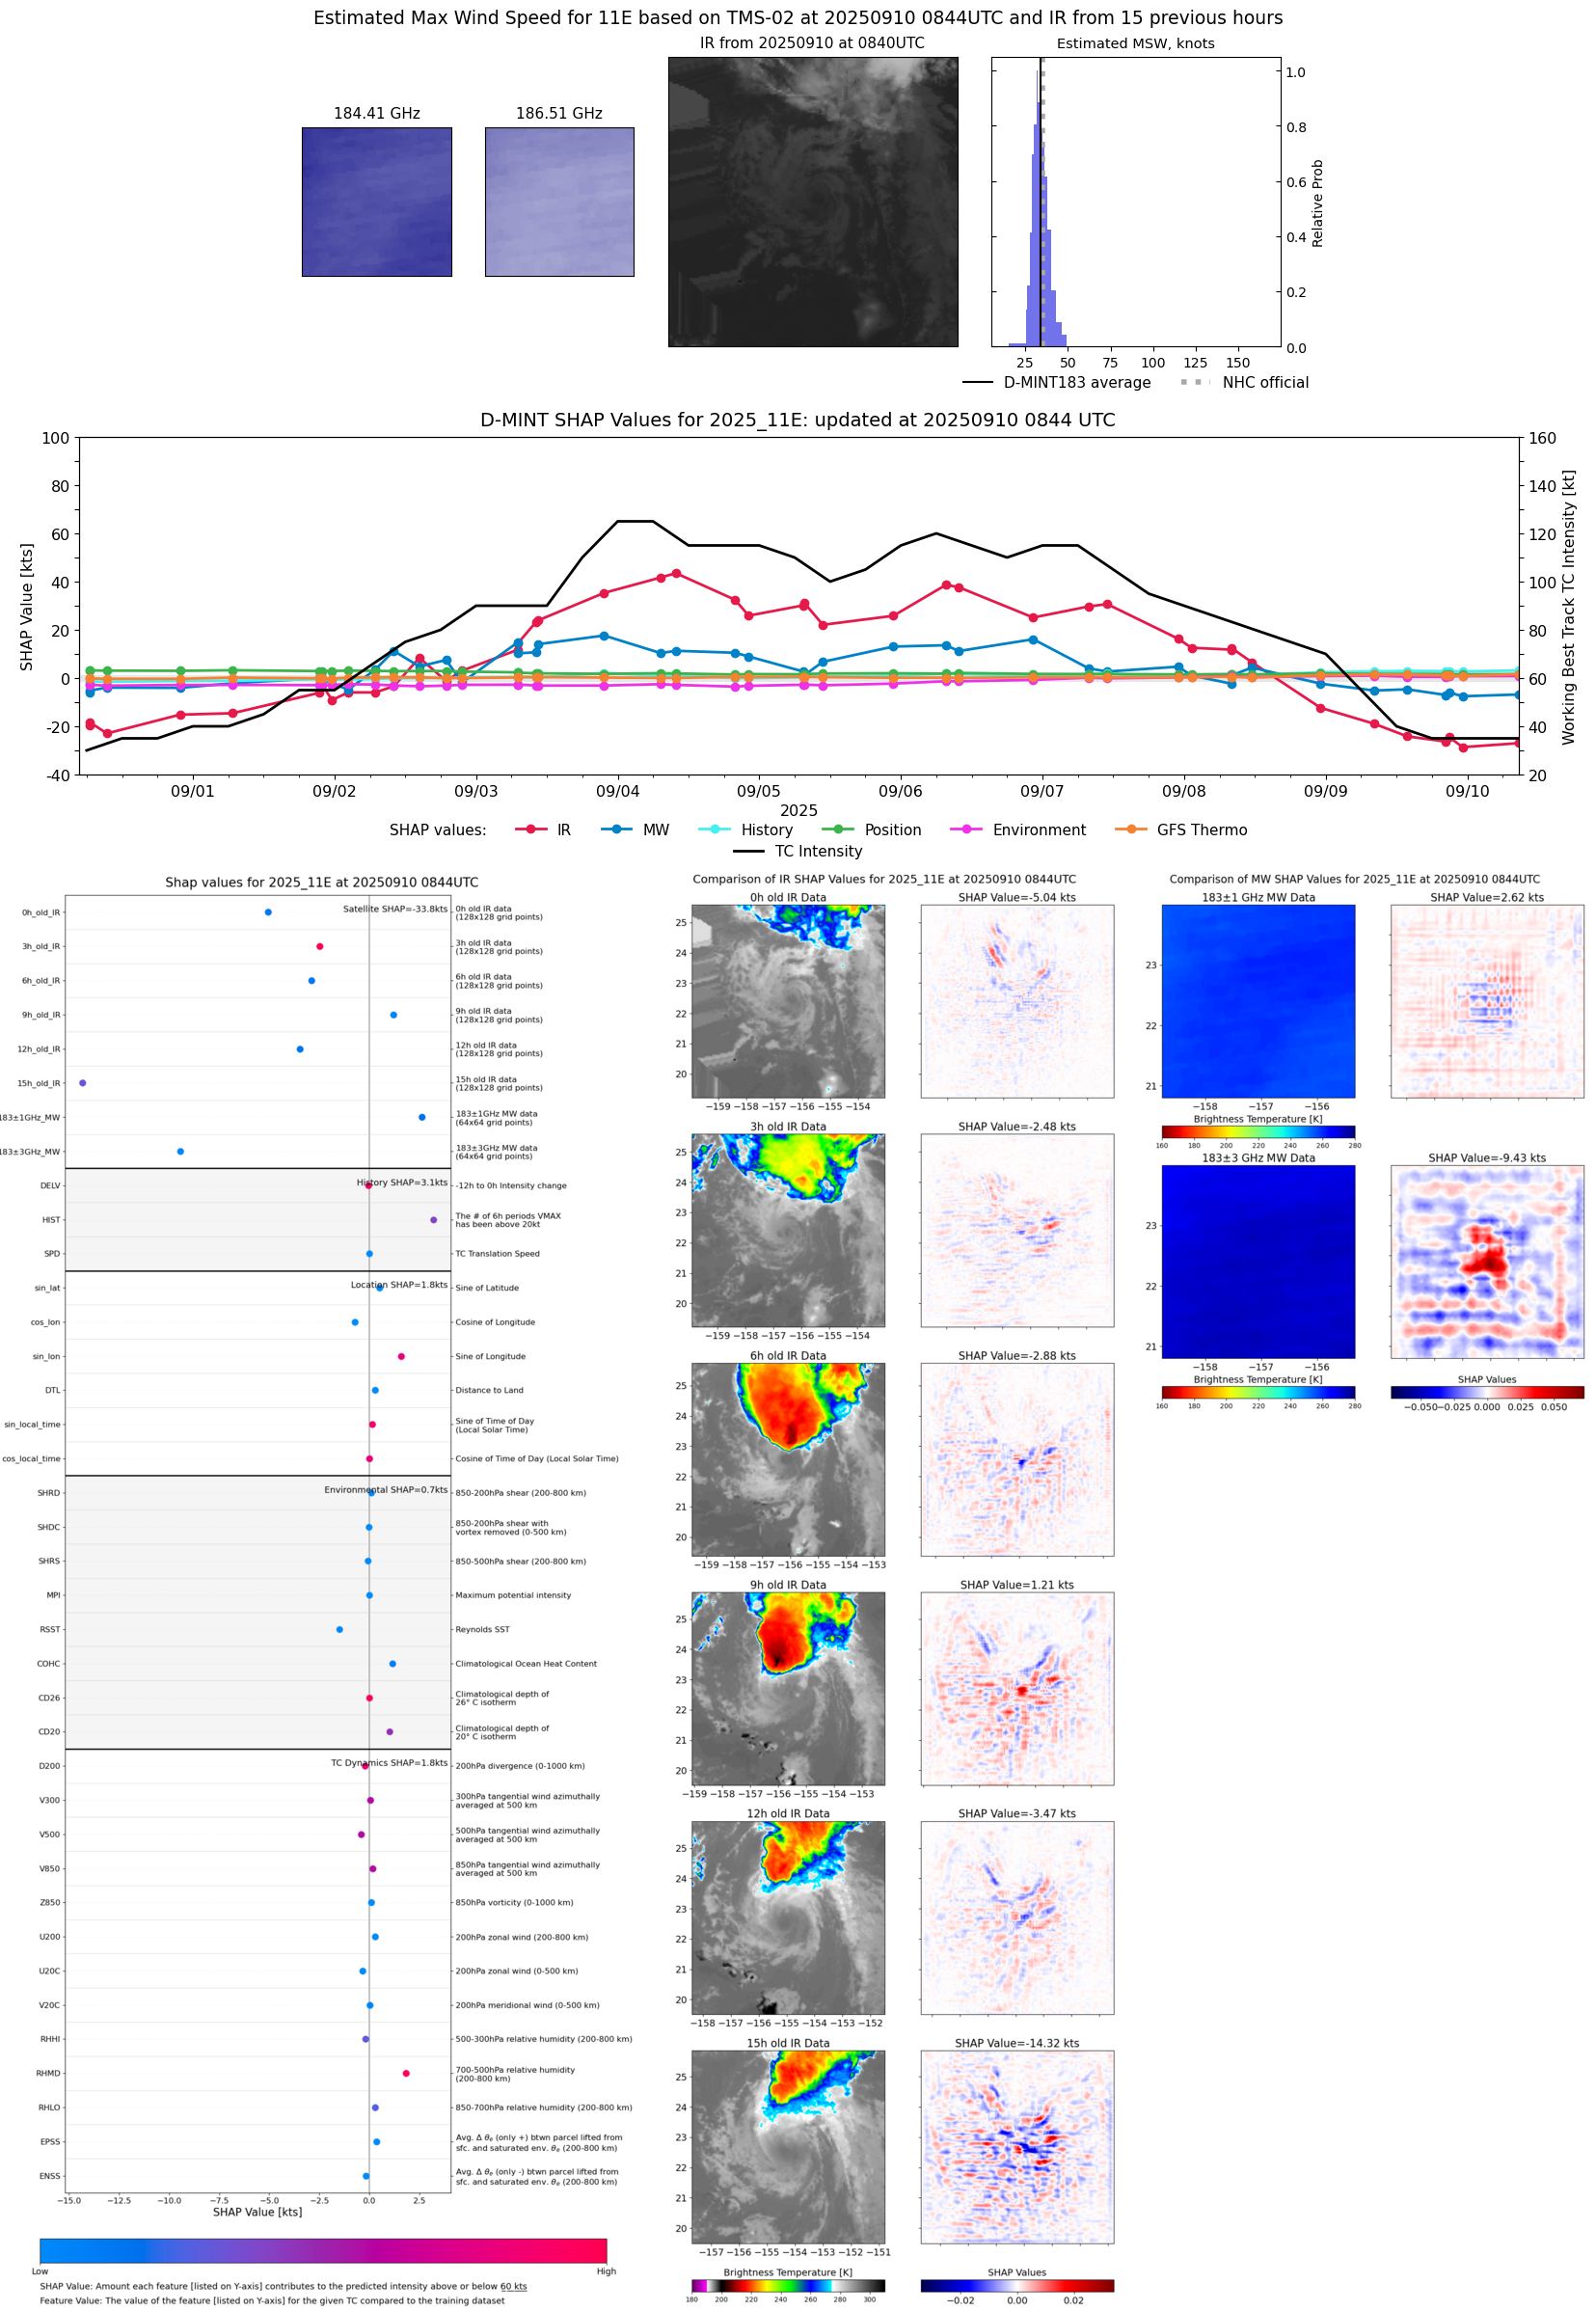 |
| 20250909 | 2312 UTC | ATMS-N20 | 1008 hPa | 30 kts | 27 kts | 33 kts | 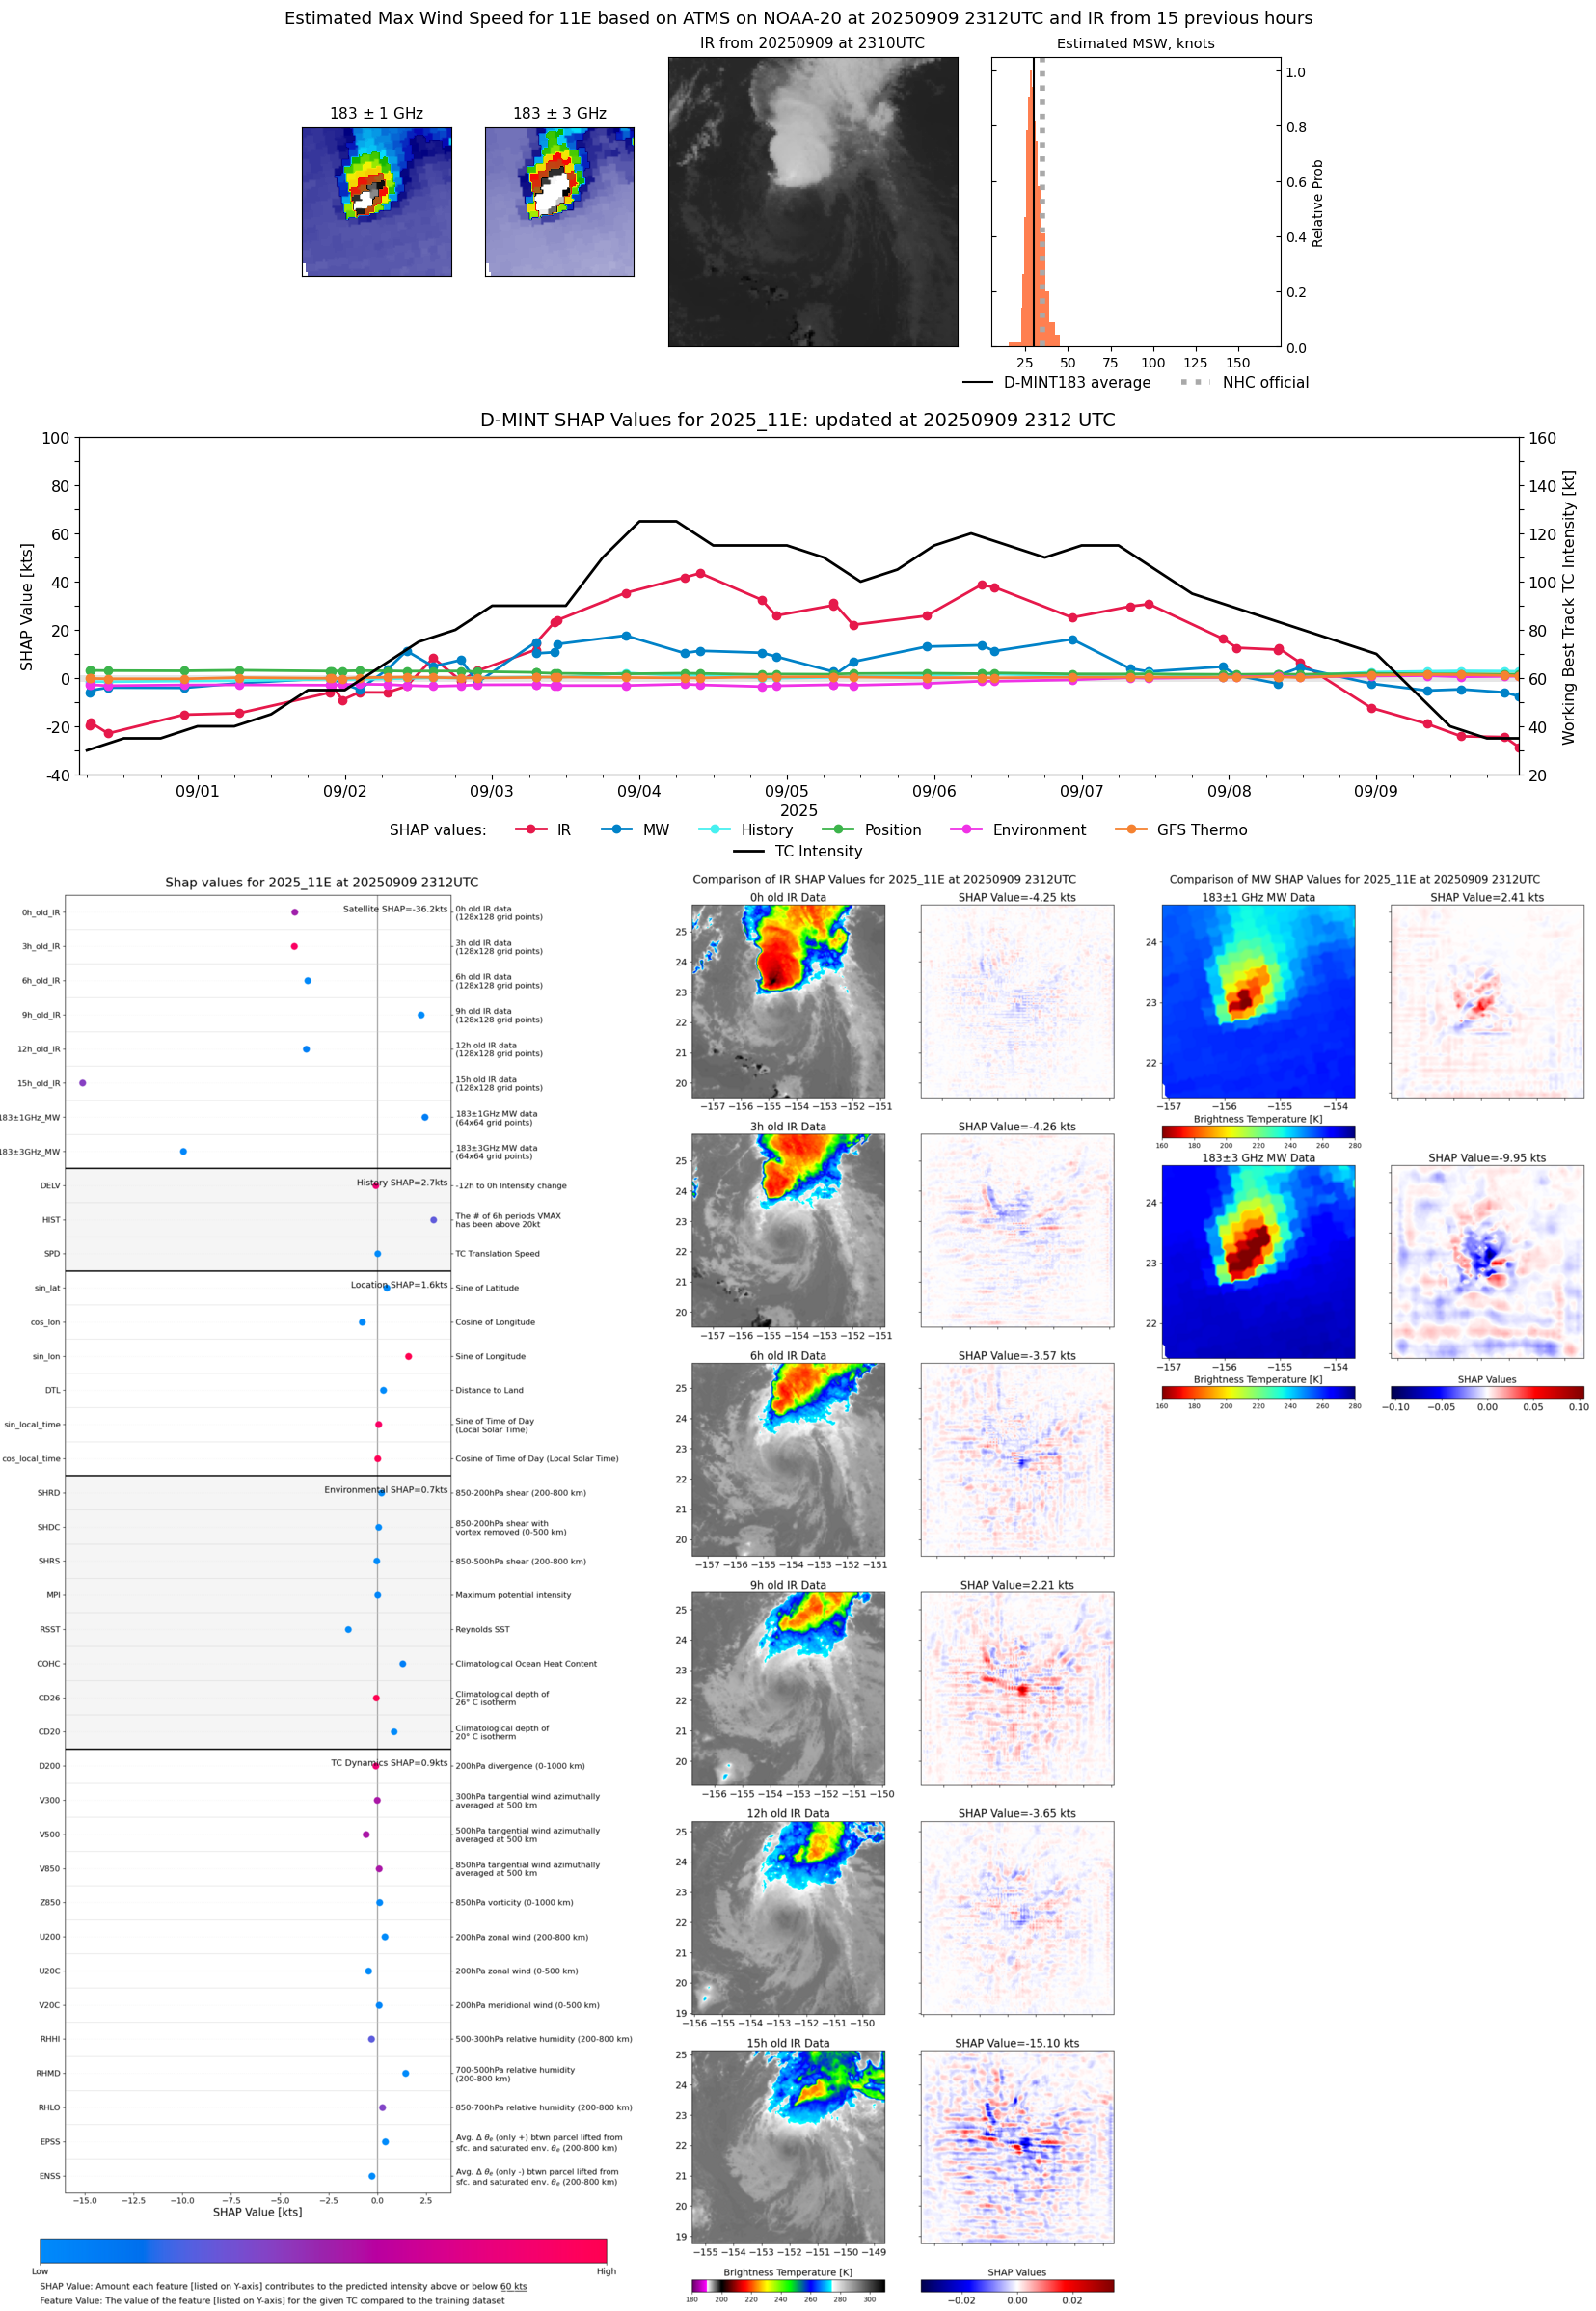 |
| 20250909 | 2248 UTC | GMI | 1010 hPa | 29 kts | 27 kts | 32 kts | 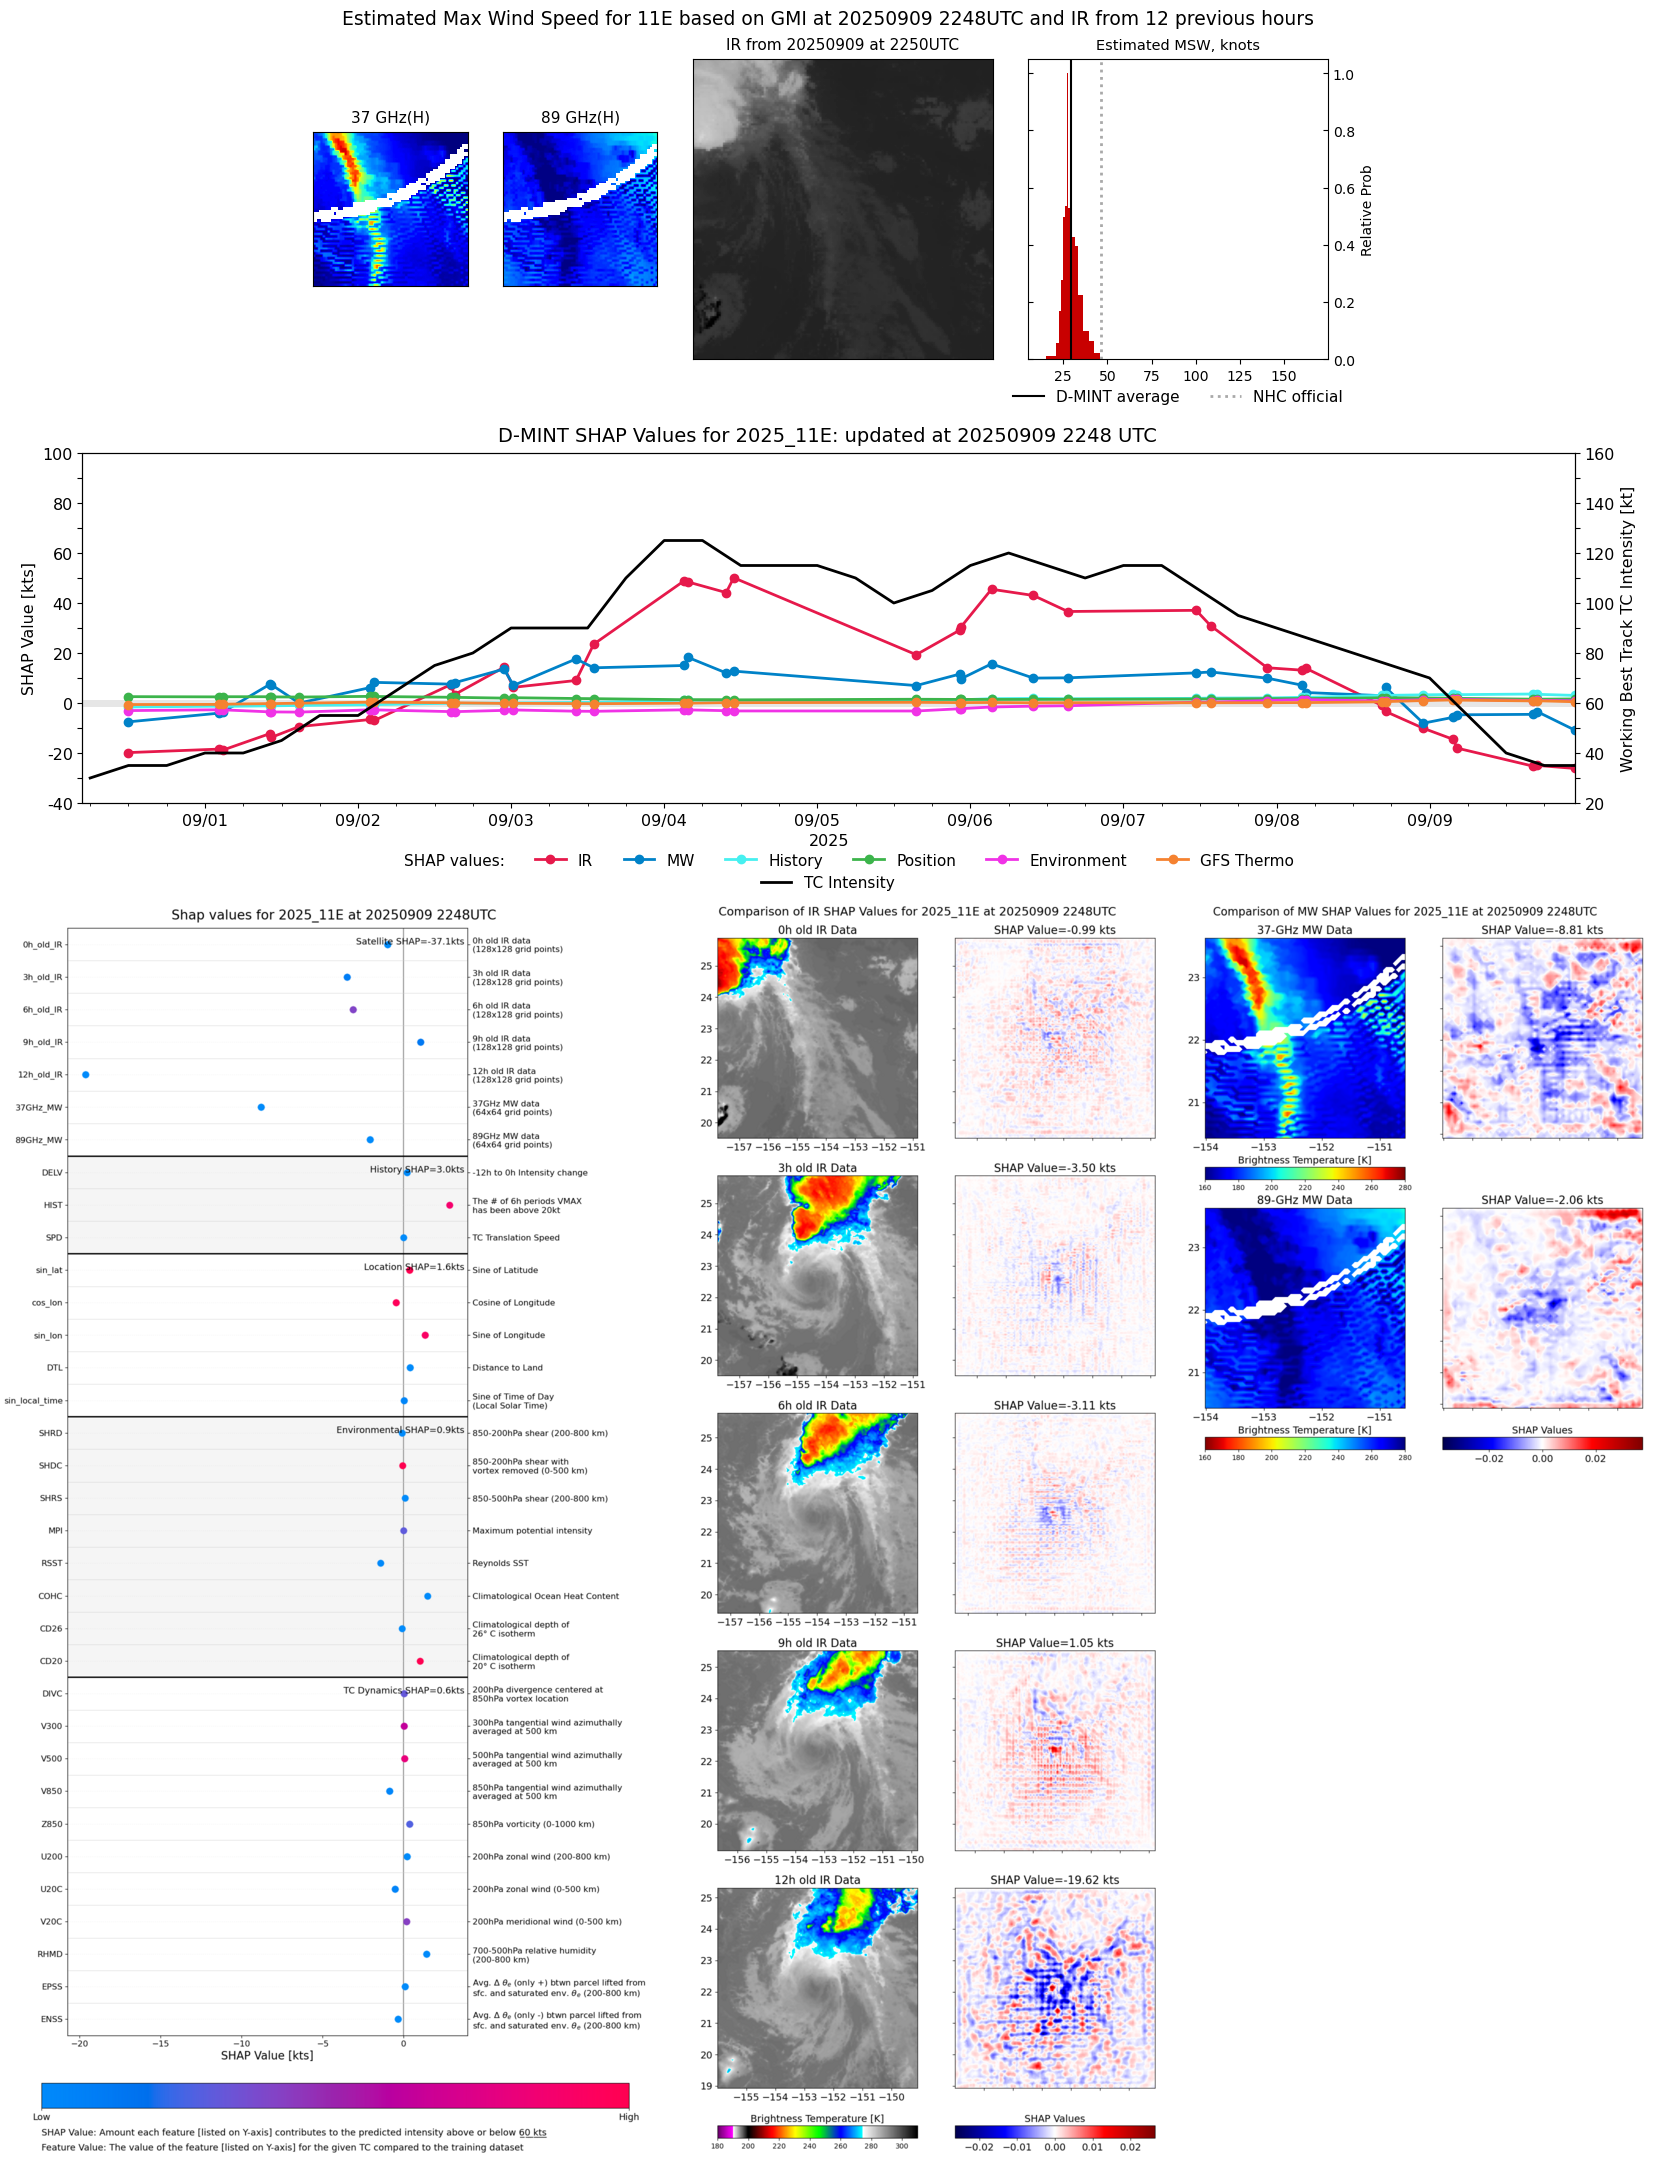 |
| 20250909 | 2054 UTC | TMS02 | 1006 hPa | 36 kts | 33 kts | 40 kts | 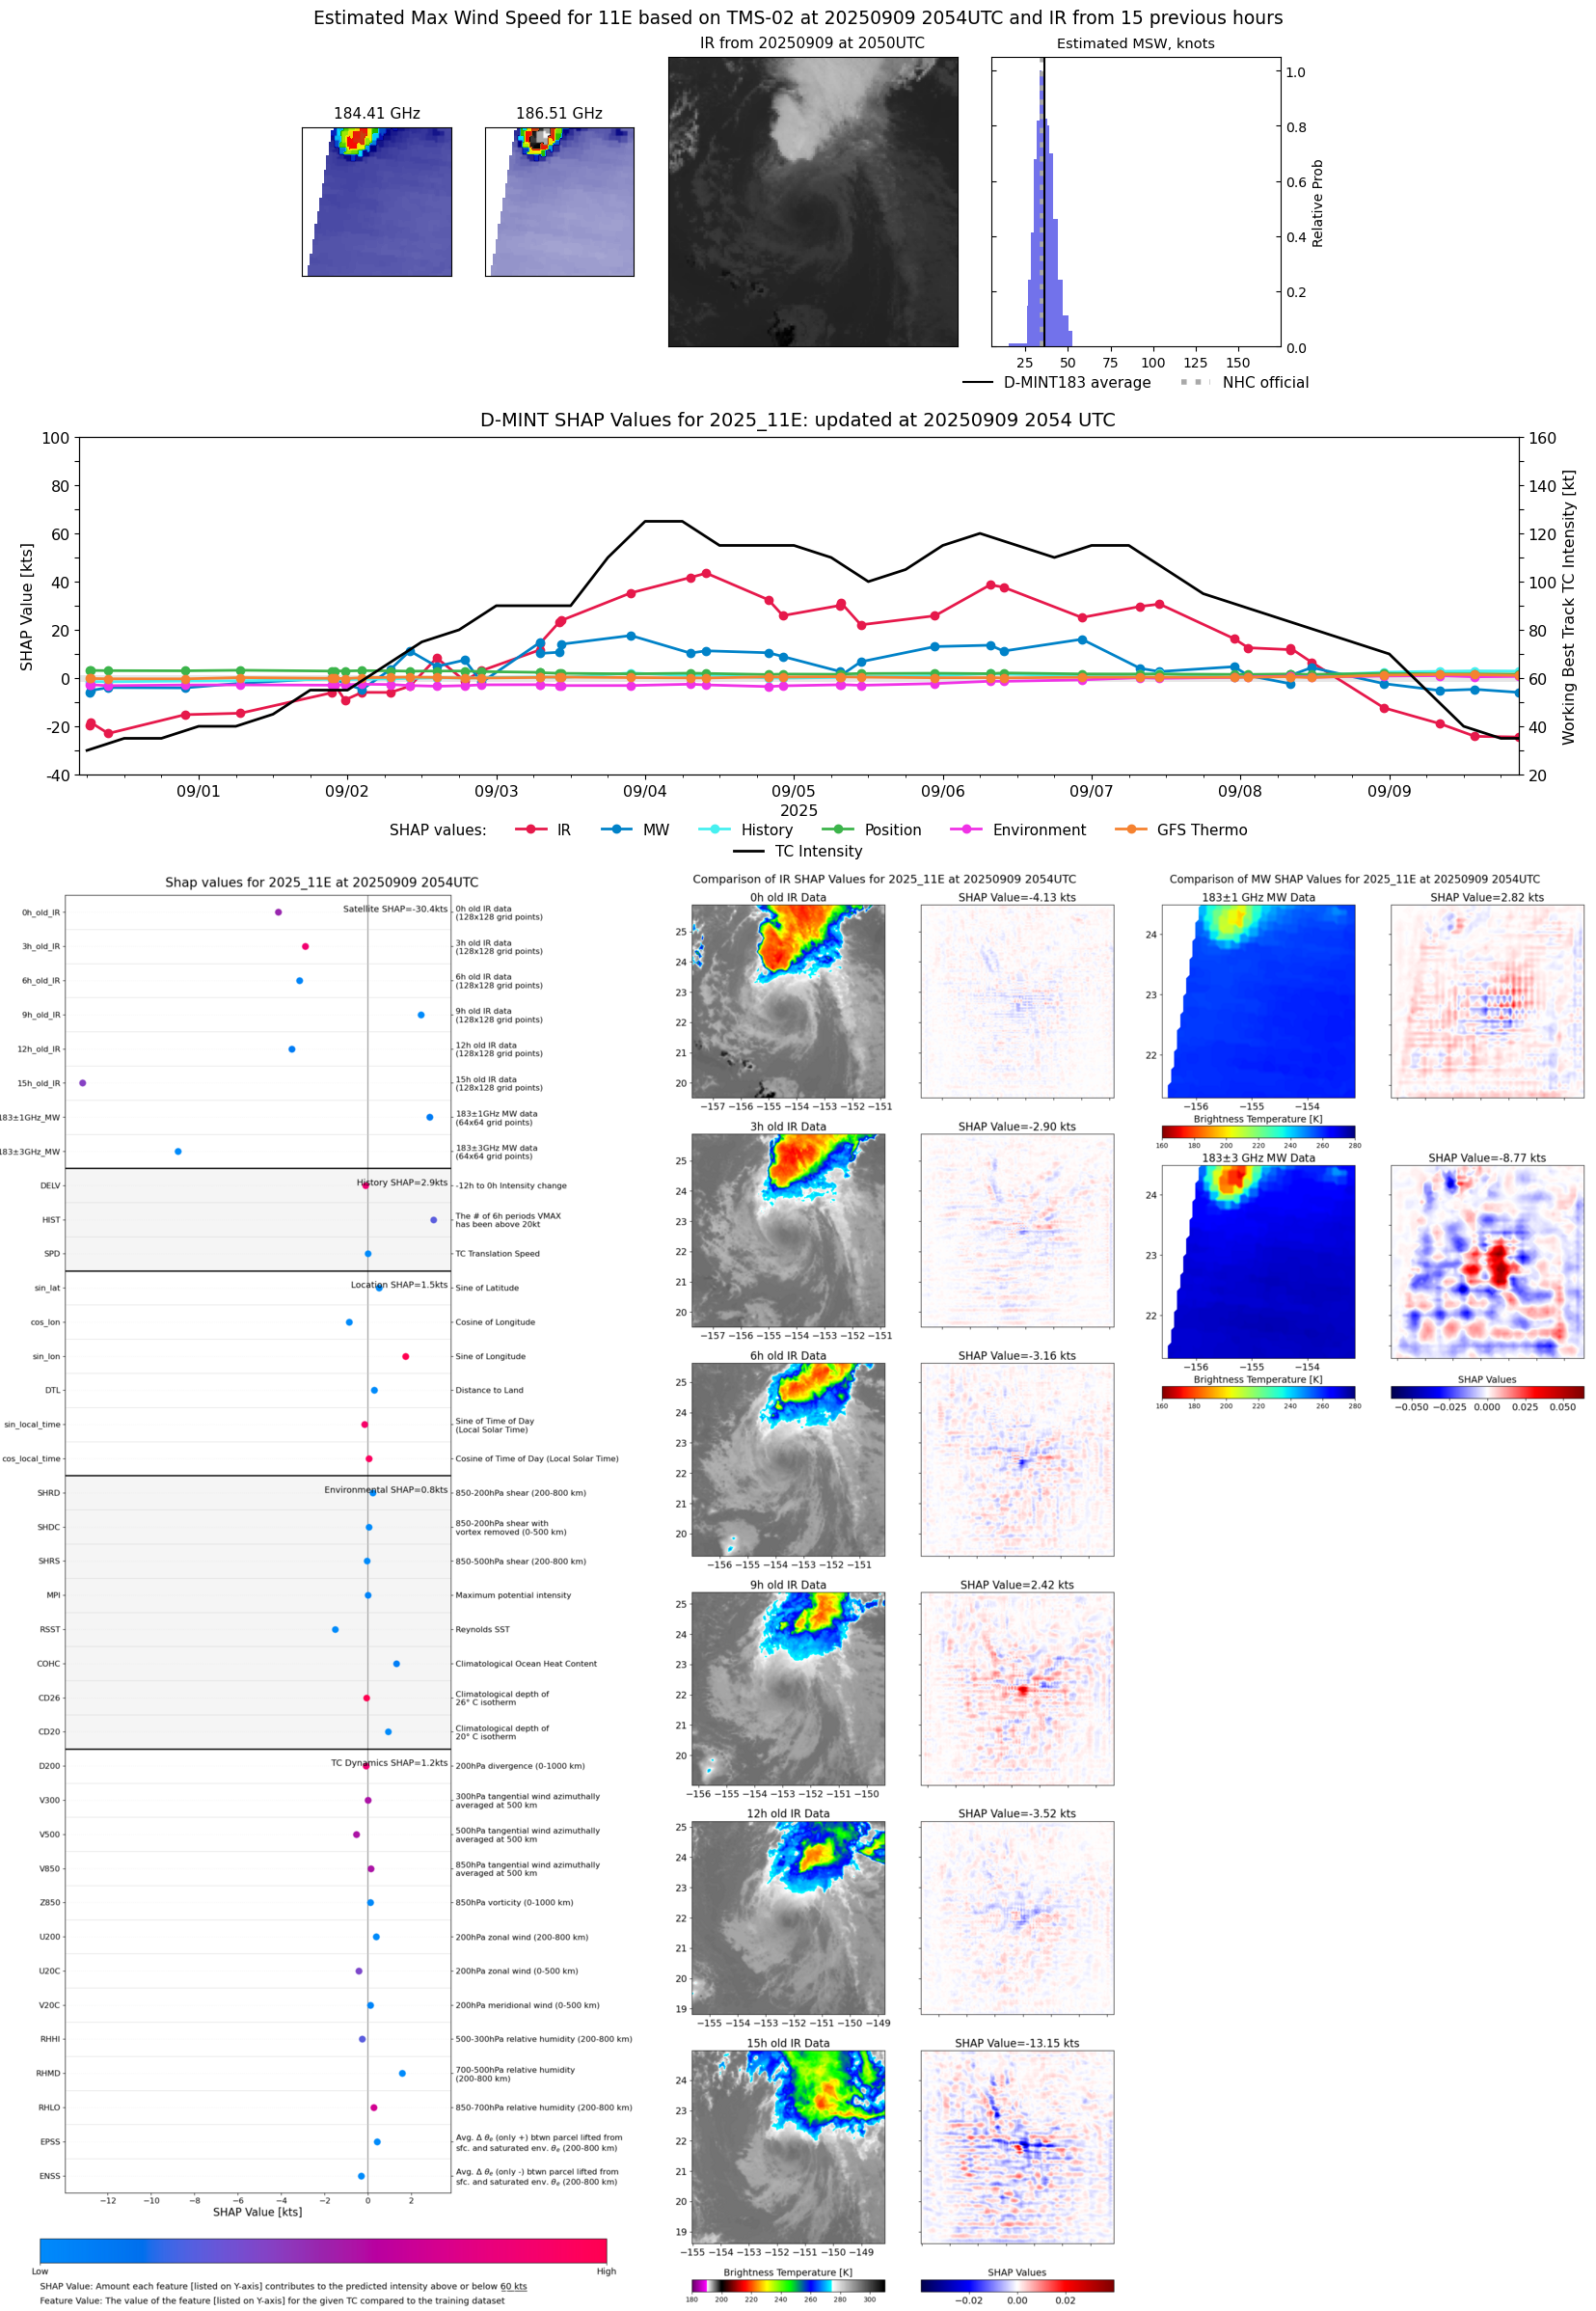 |
| 20250909 | 2028 UTC | TMS05 | 1007 hPa | 34 kts | 31 kts | 38 kts | 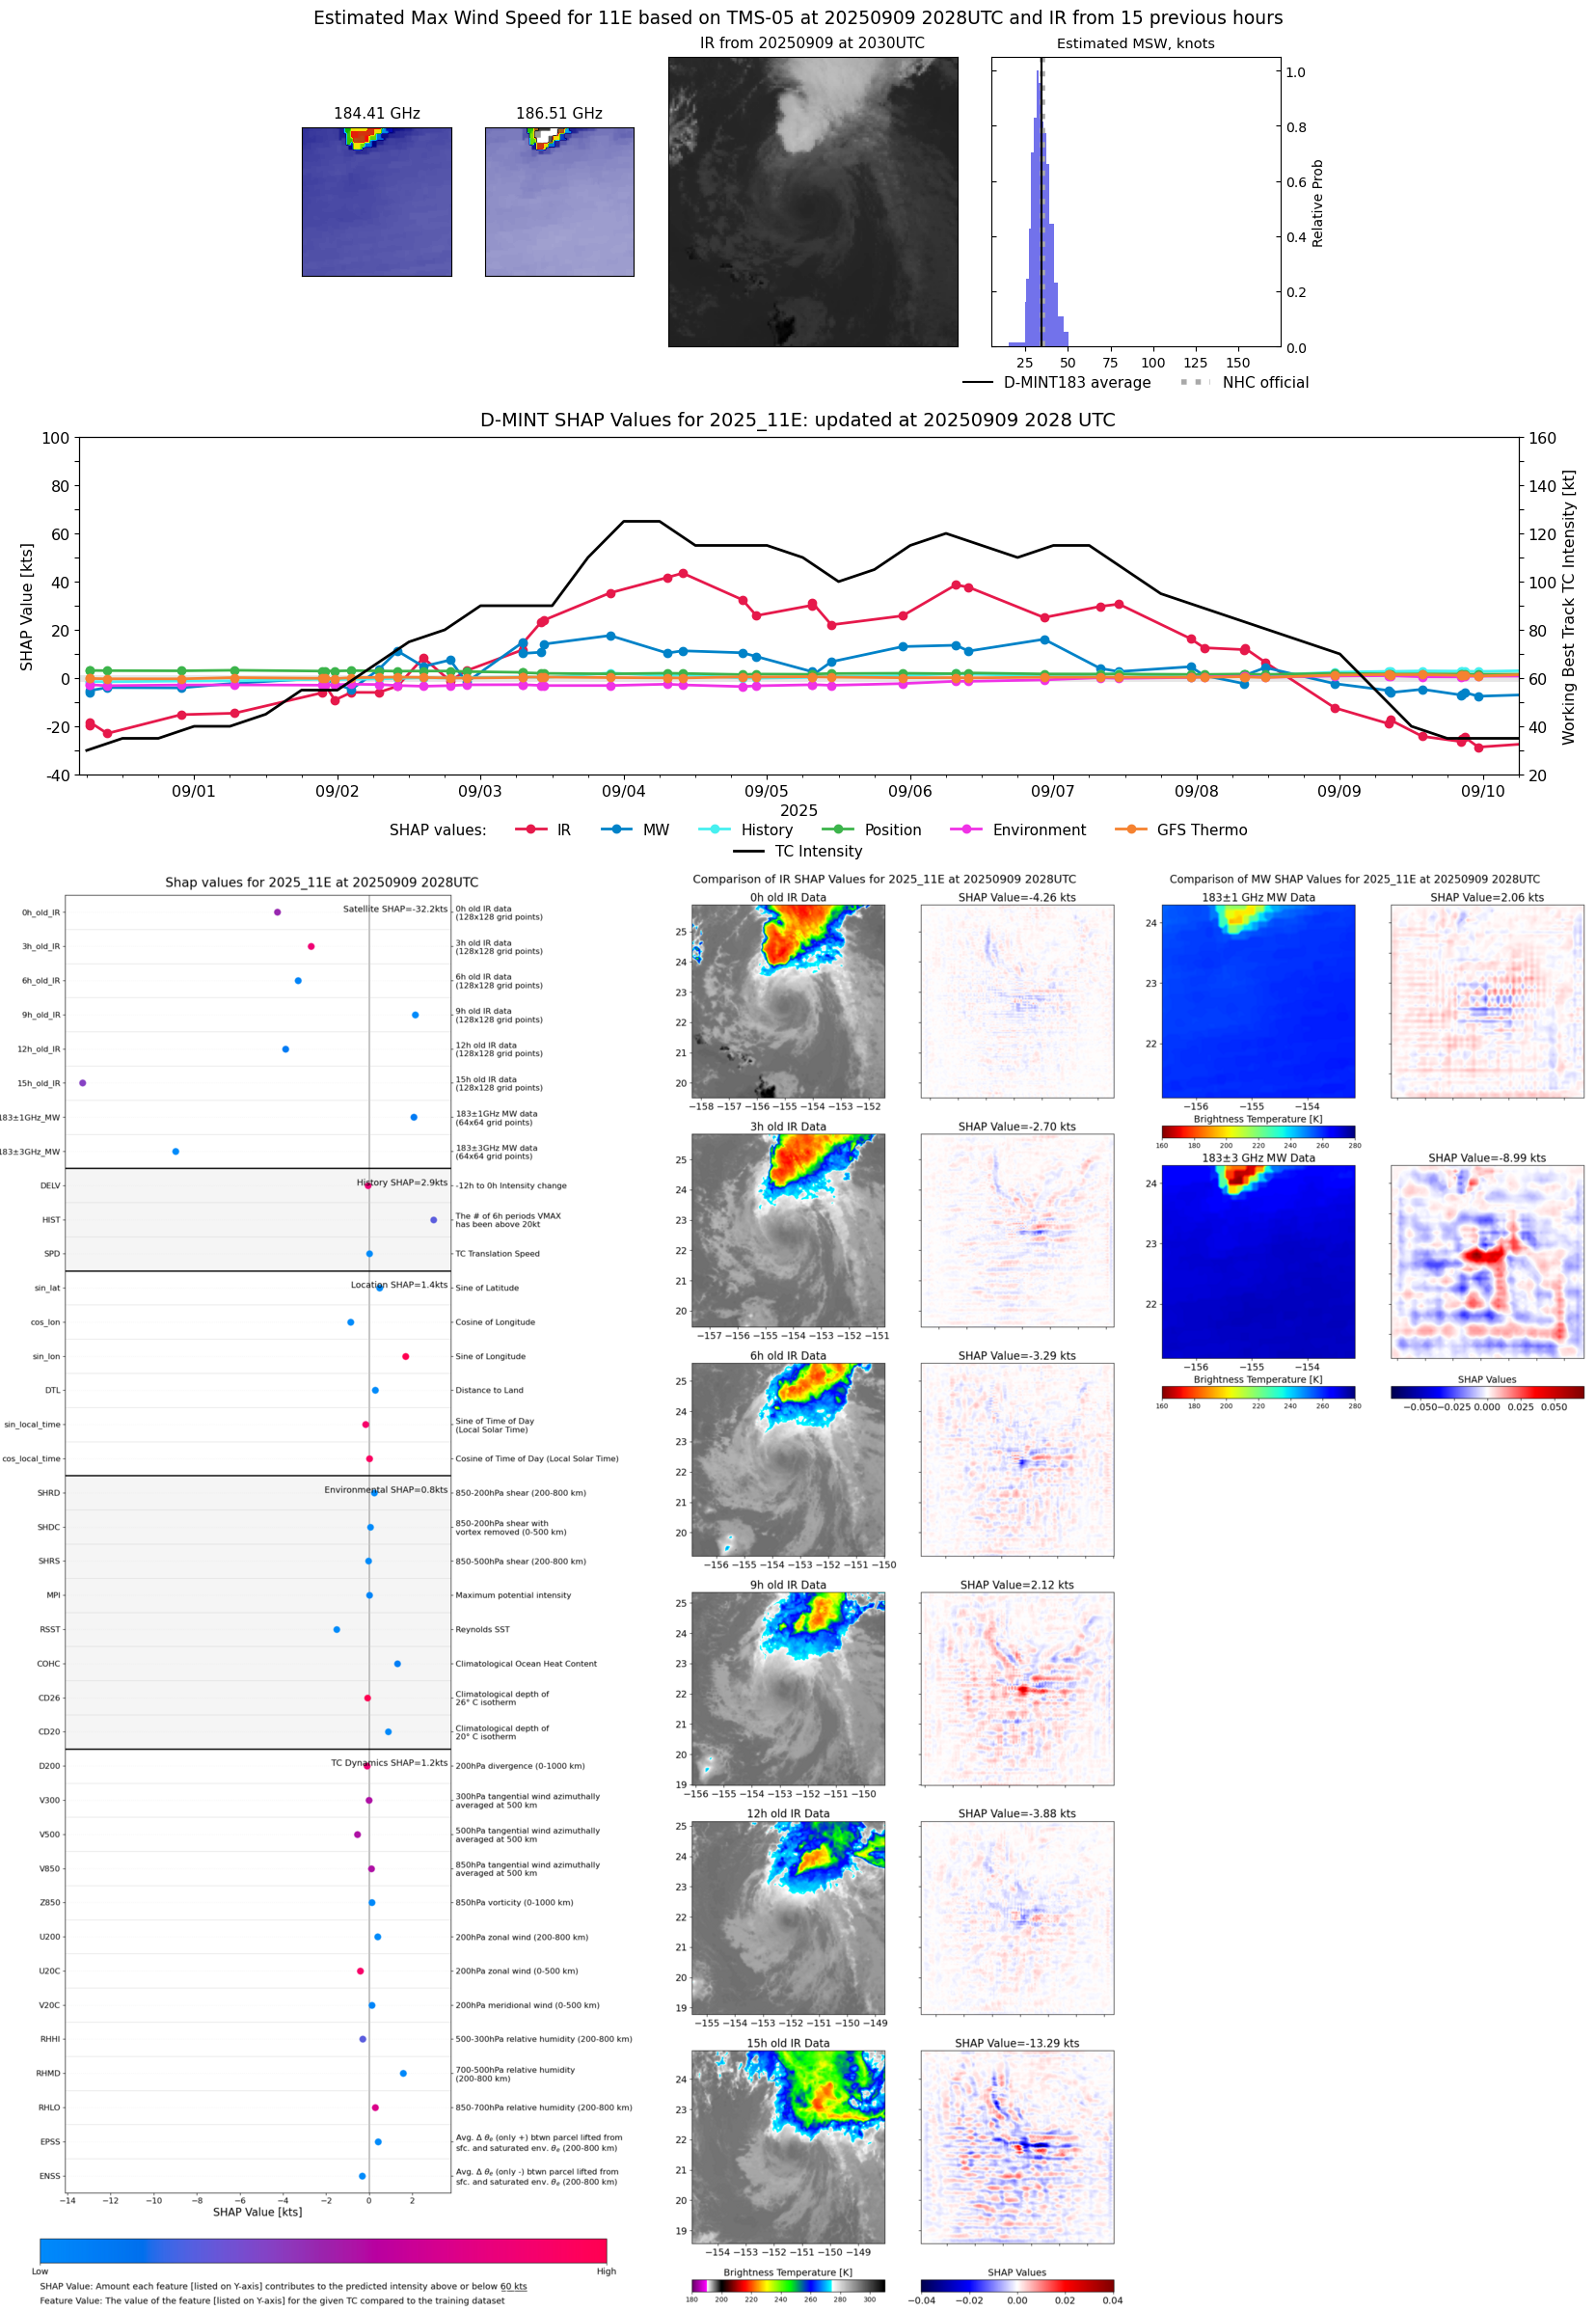 |
| 20250909 | 2020 UTC | TROPICS05 | 1008 hPa | 33 kts | 30 kts | 37 kts | 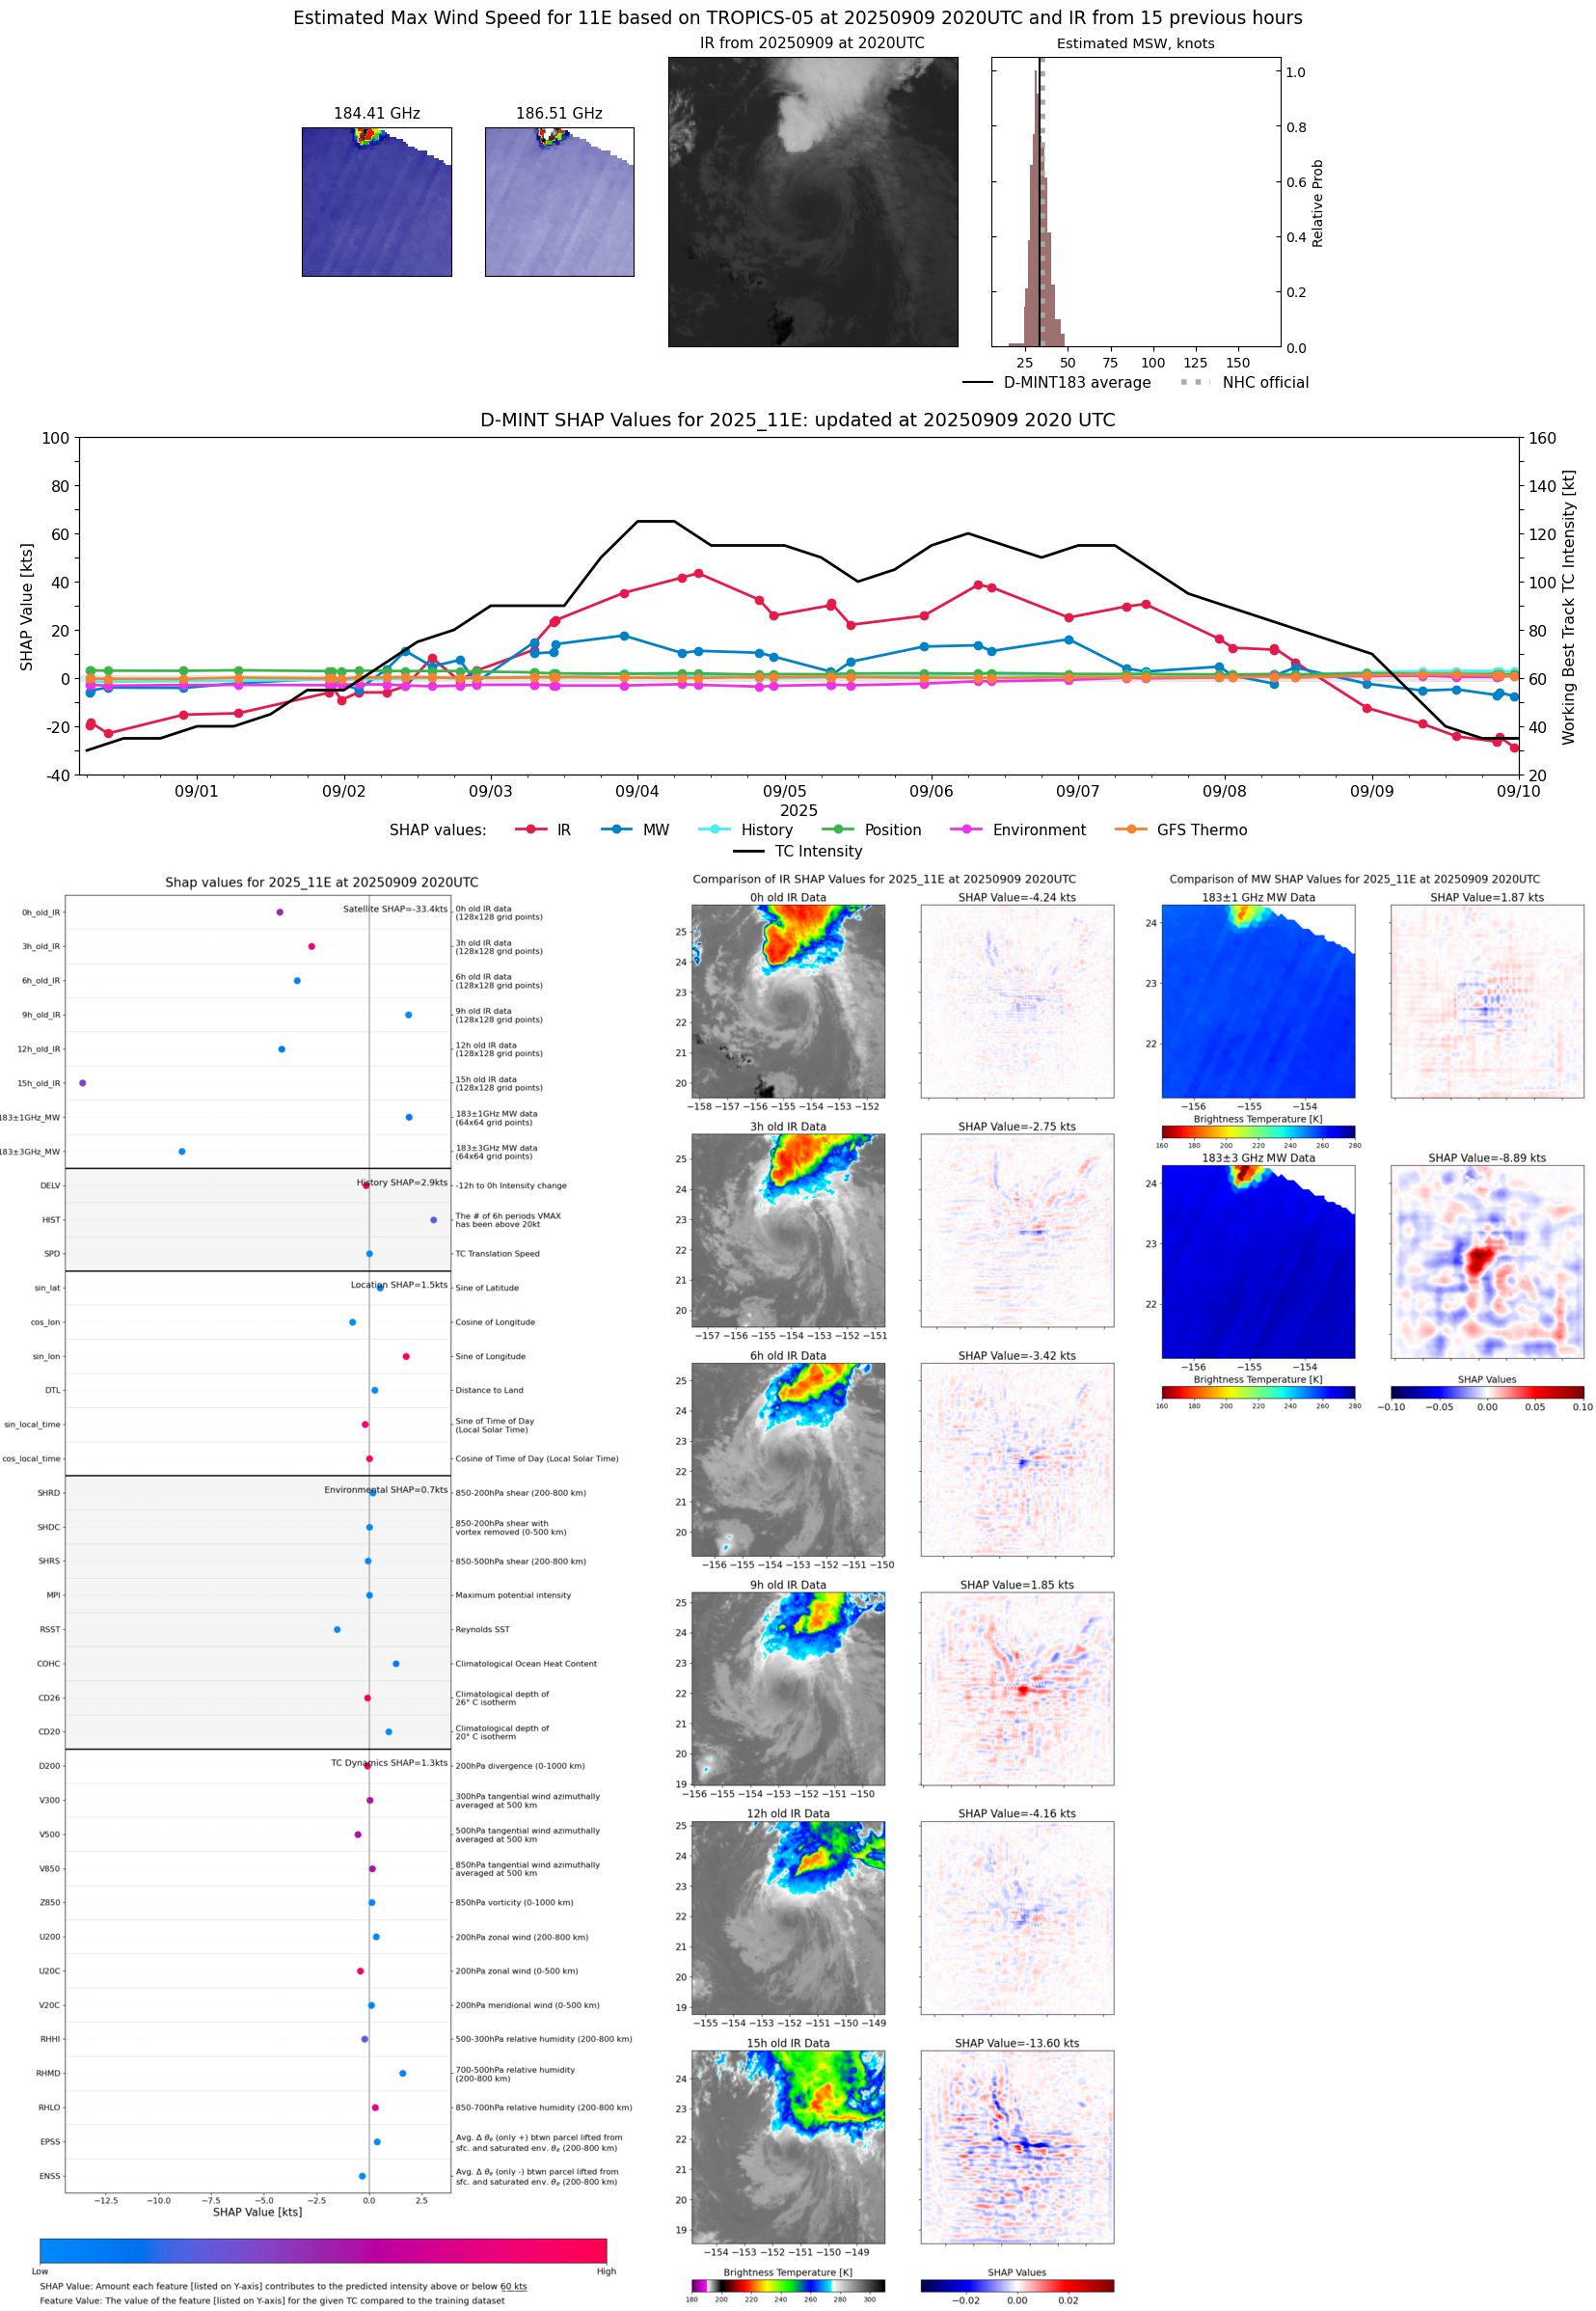 |
| 20250909 | 1652 UTC | SSMISF16 | 1008 hPa | 39 kts | 35 kts | 43 kts | 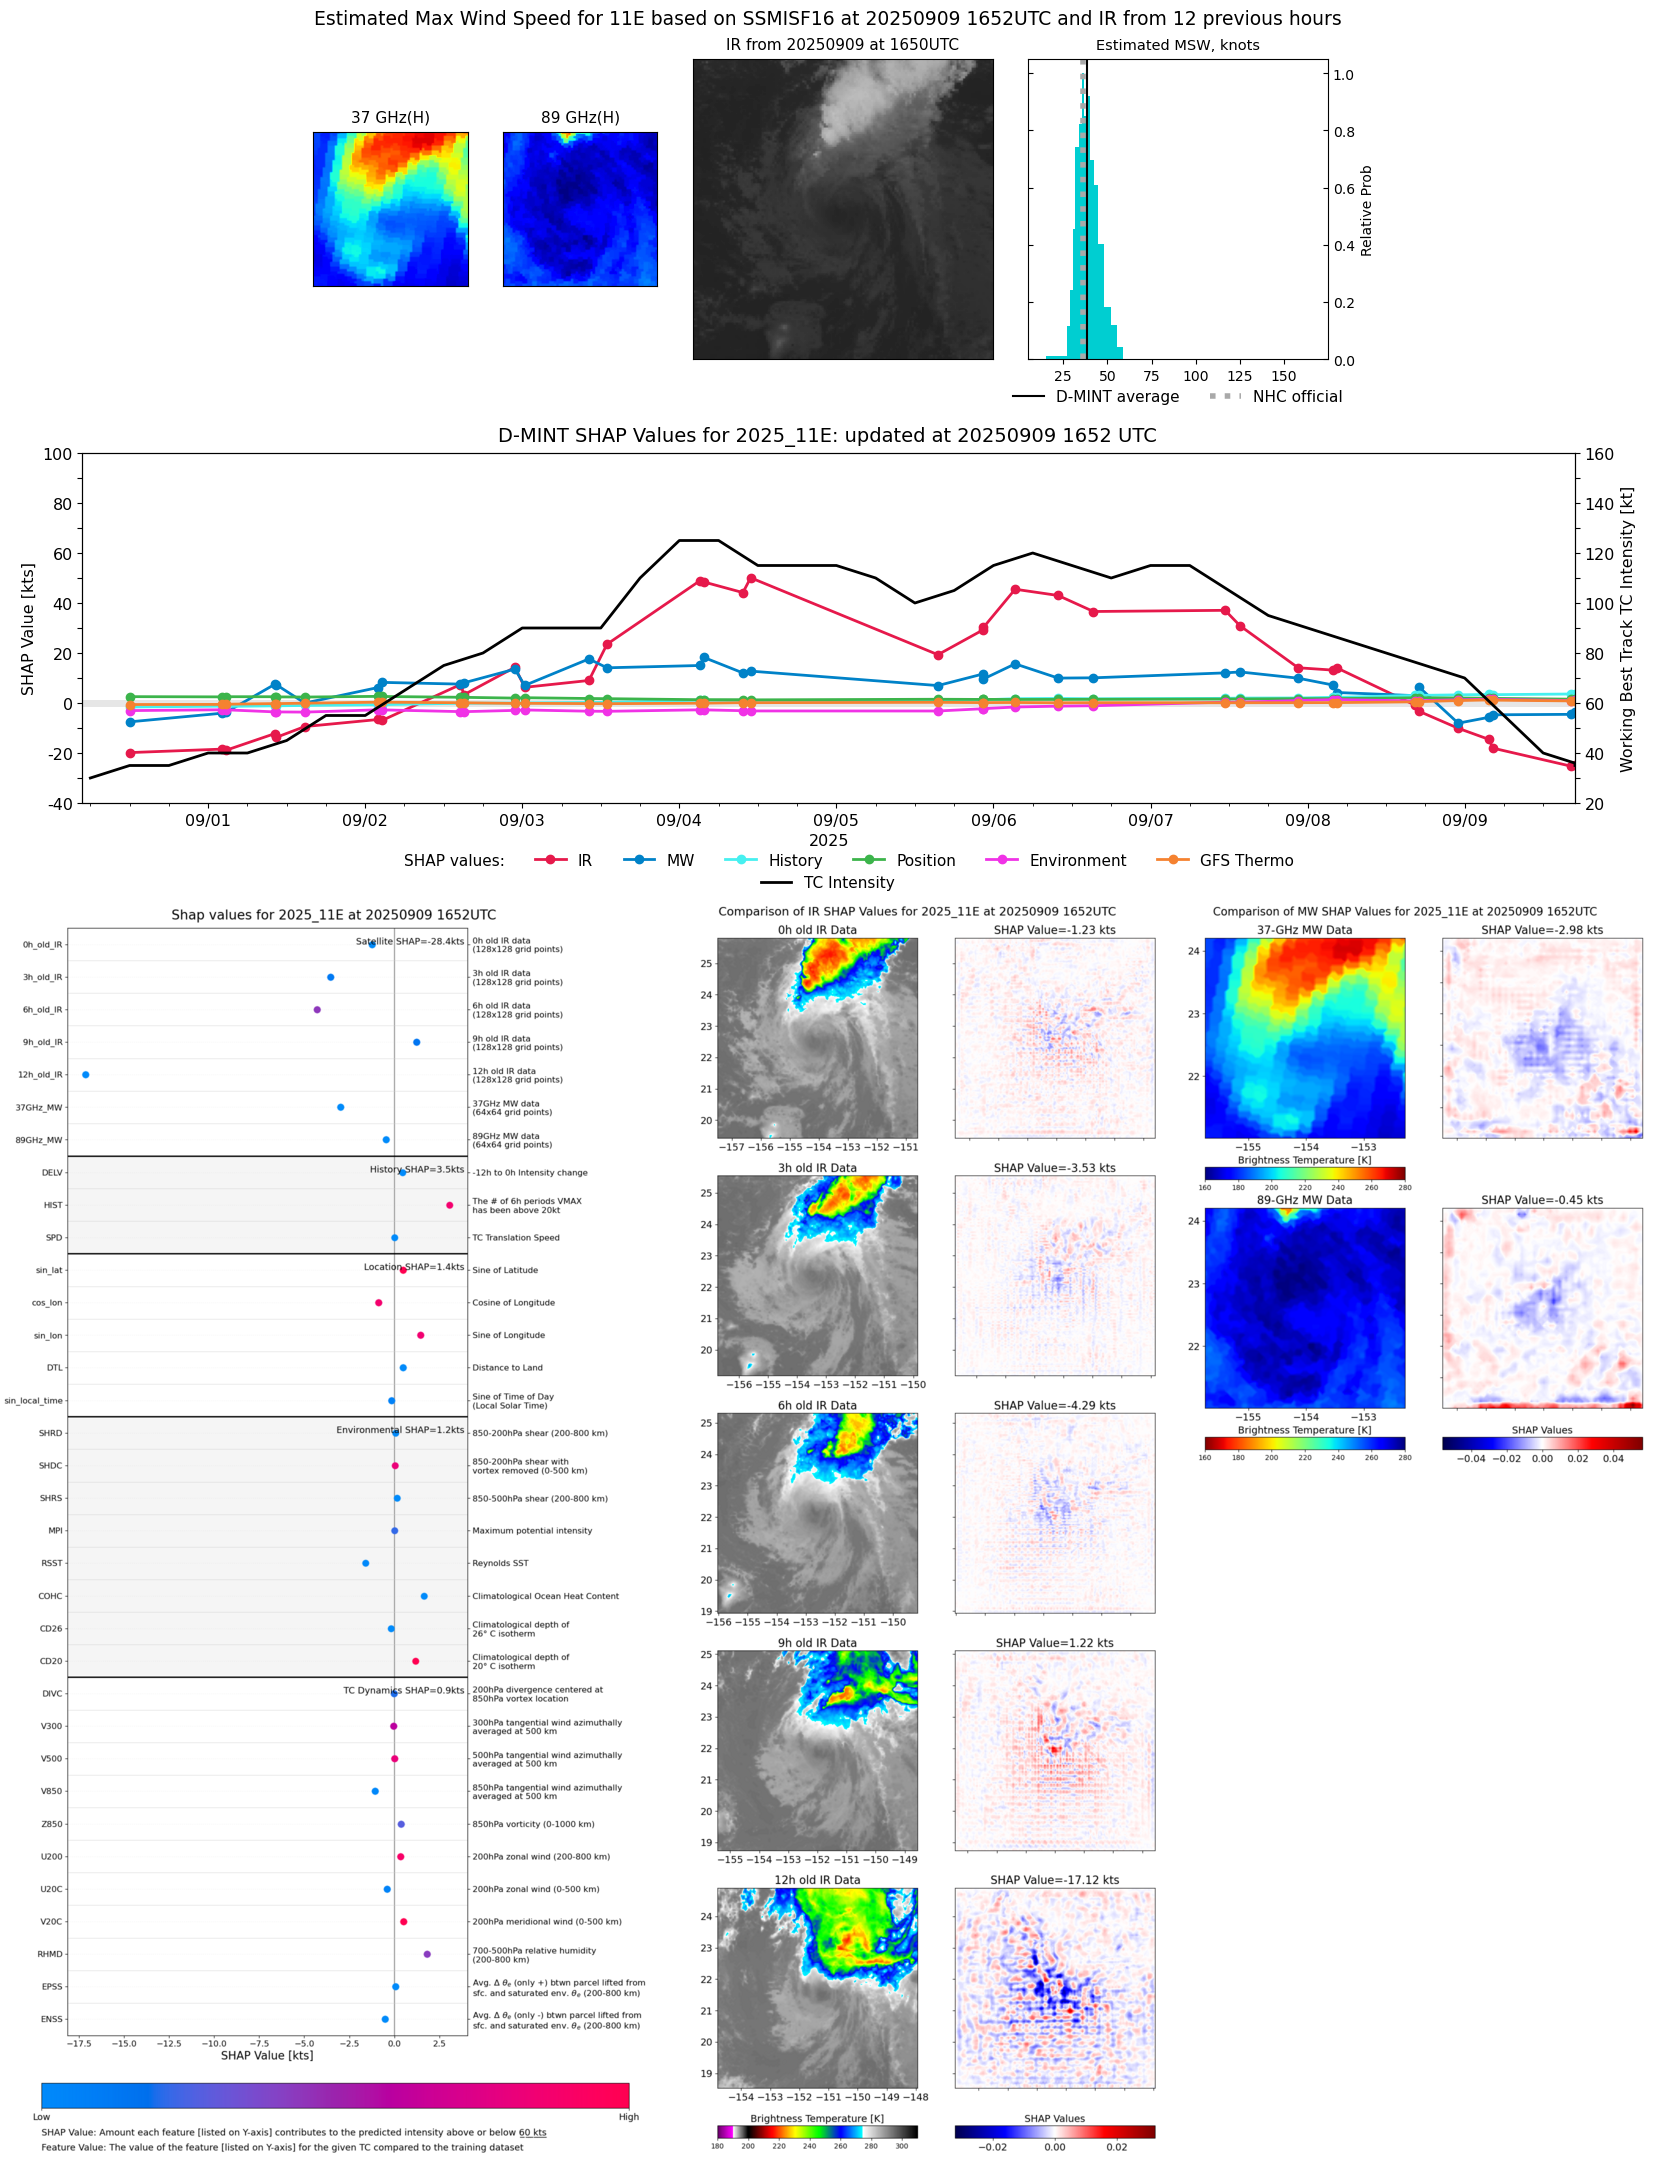 |
| 20250909 | 1613 UTC | SSMISF17 | 1006 hPa | 37 kts | 33 kts | 42 kts |  |
| 20250909 | 1607 UTC | WSFM01 | 1009 hPa | 38 kts | 34 kts | 42 kts | 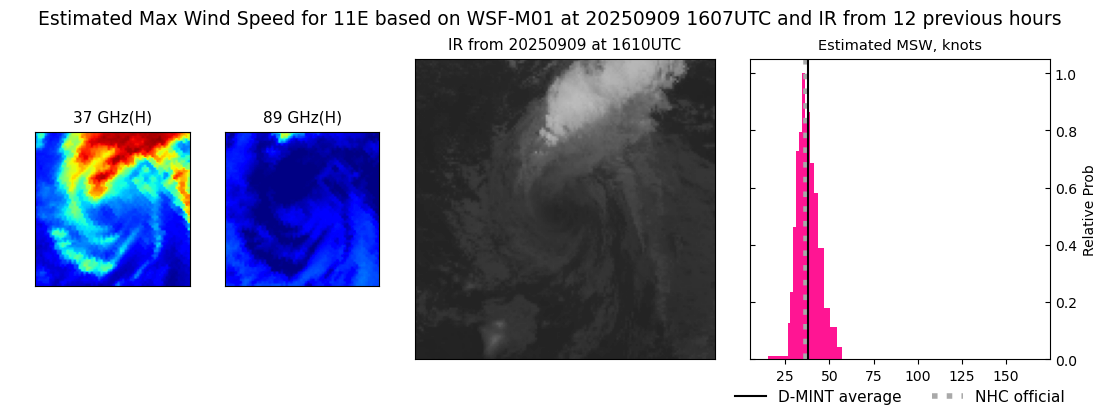 |
| 20250909 | 1606 UTC | WSFM01 | 1008 hPa | 37 kts | 33 kts | 42 kts | 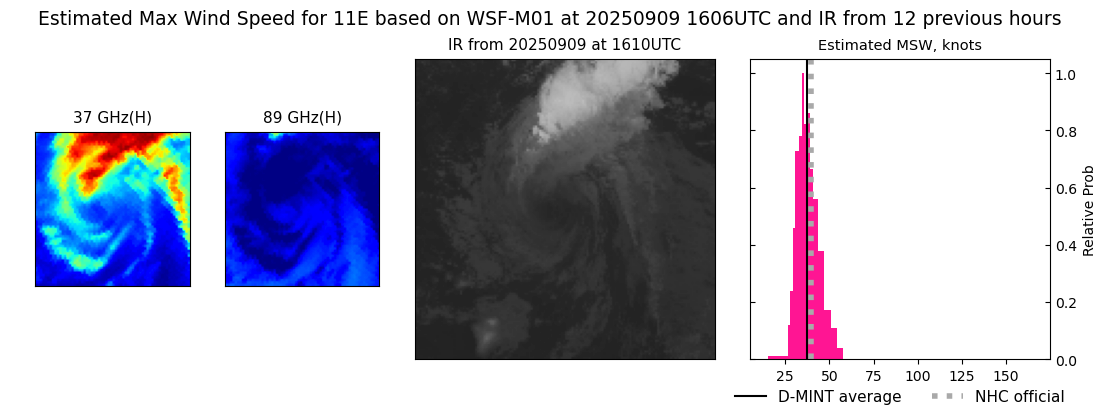 |
| 20250909 | 1454 UTC | SSMISF18 | 1007 hPa | 34 kts | 31 kts | 39 kts | 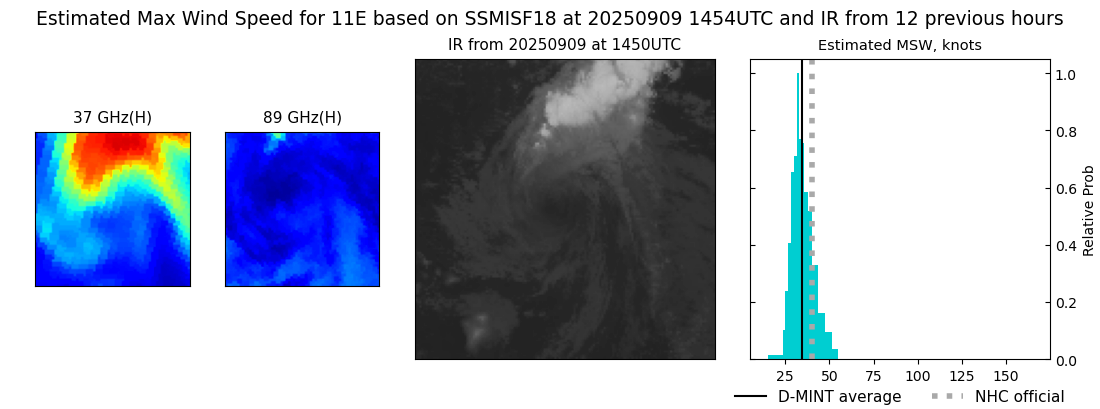 |
| 20250909 | 1349 UTC | TROPICS05 | 1007 hPa | 38 kts | 34 kts | 42 kts | 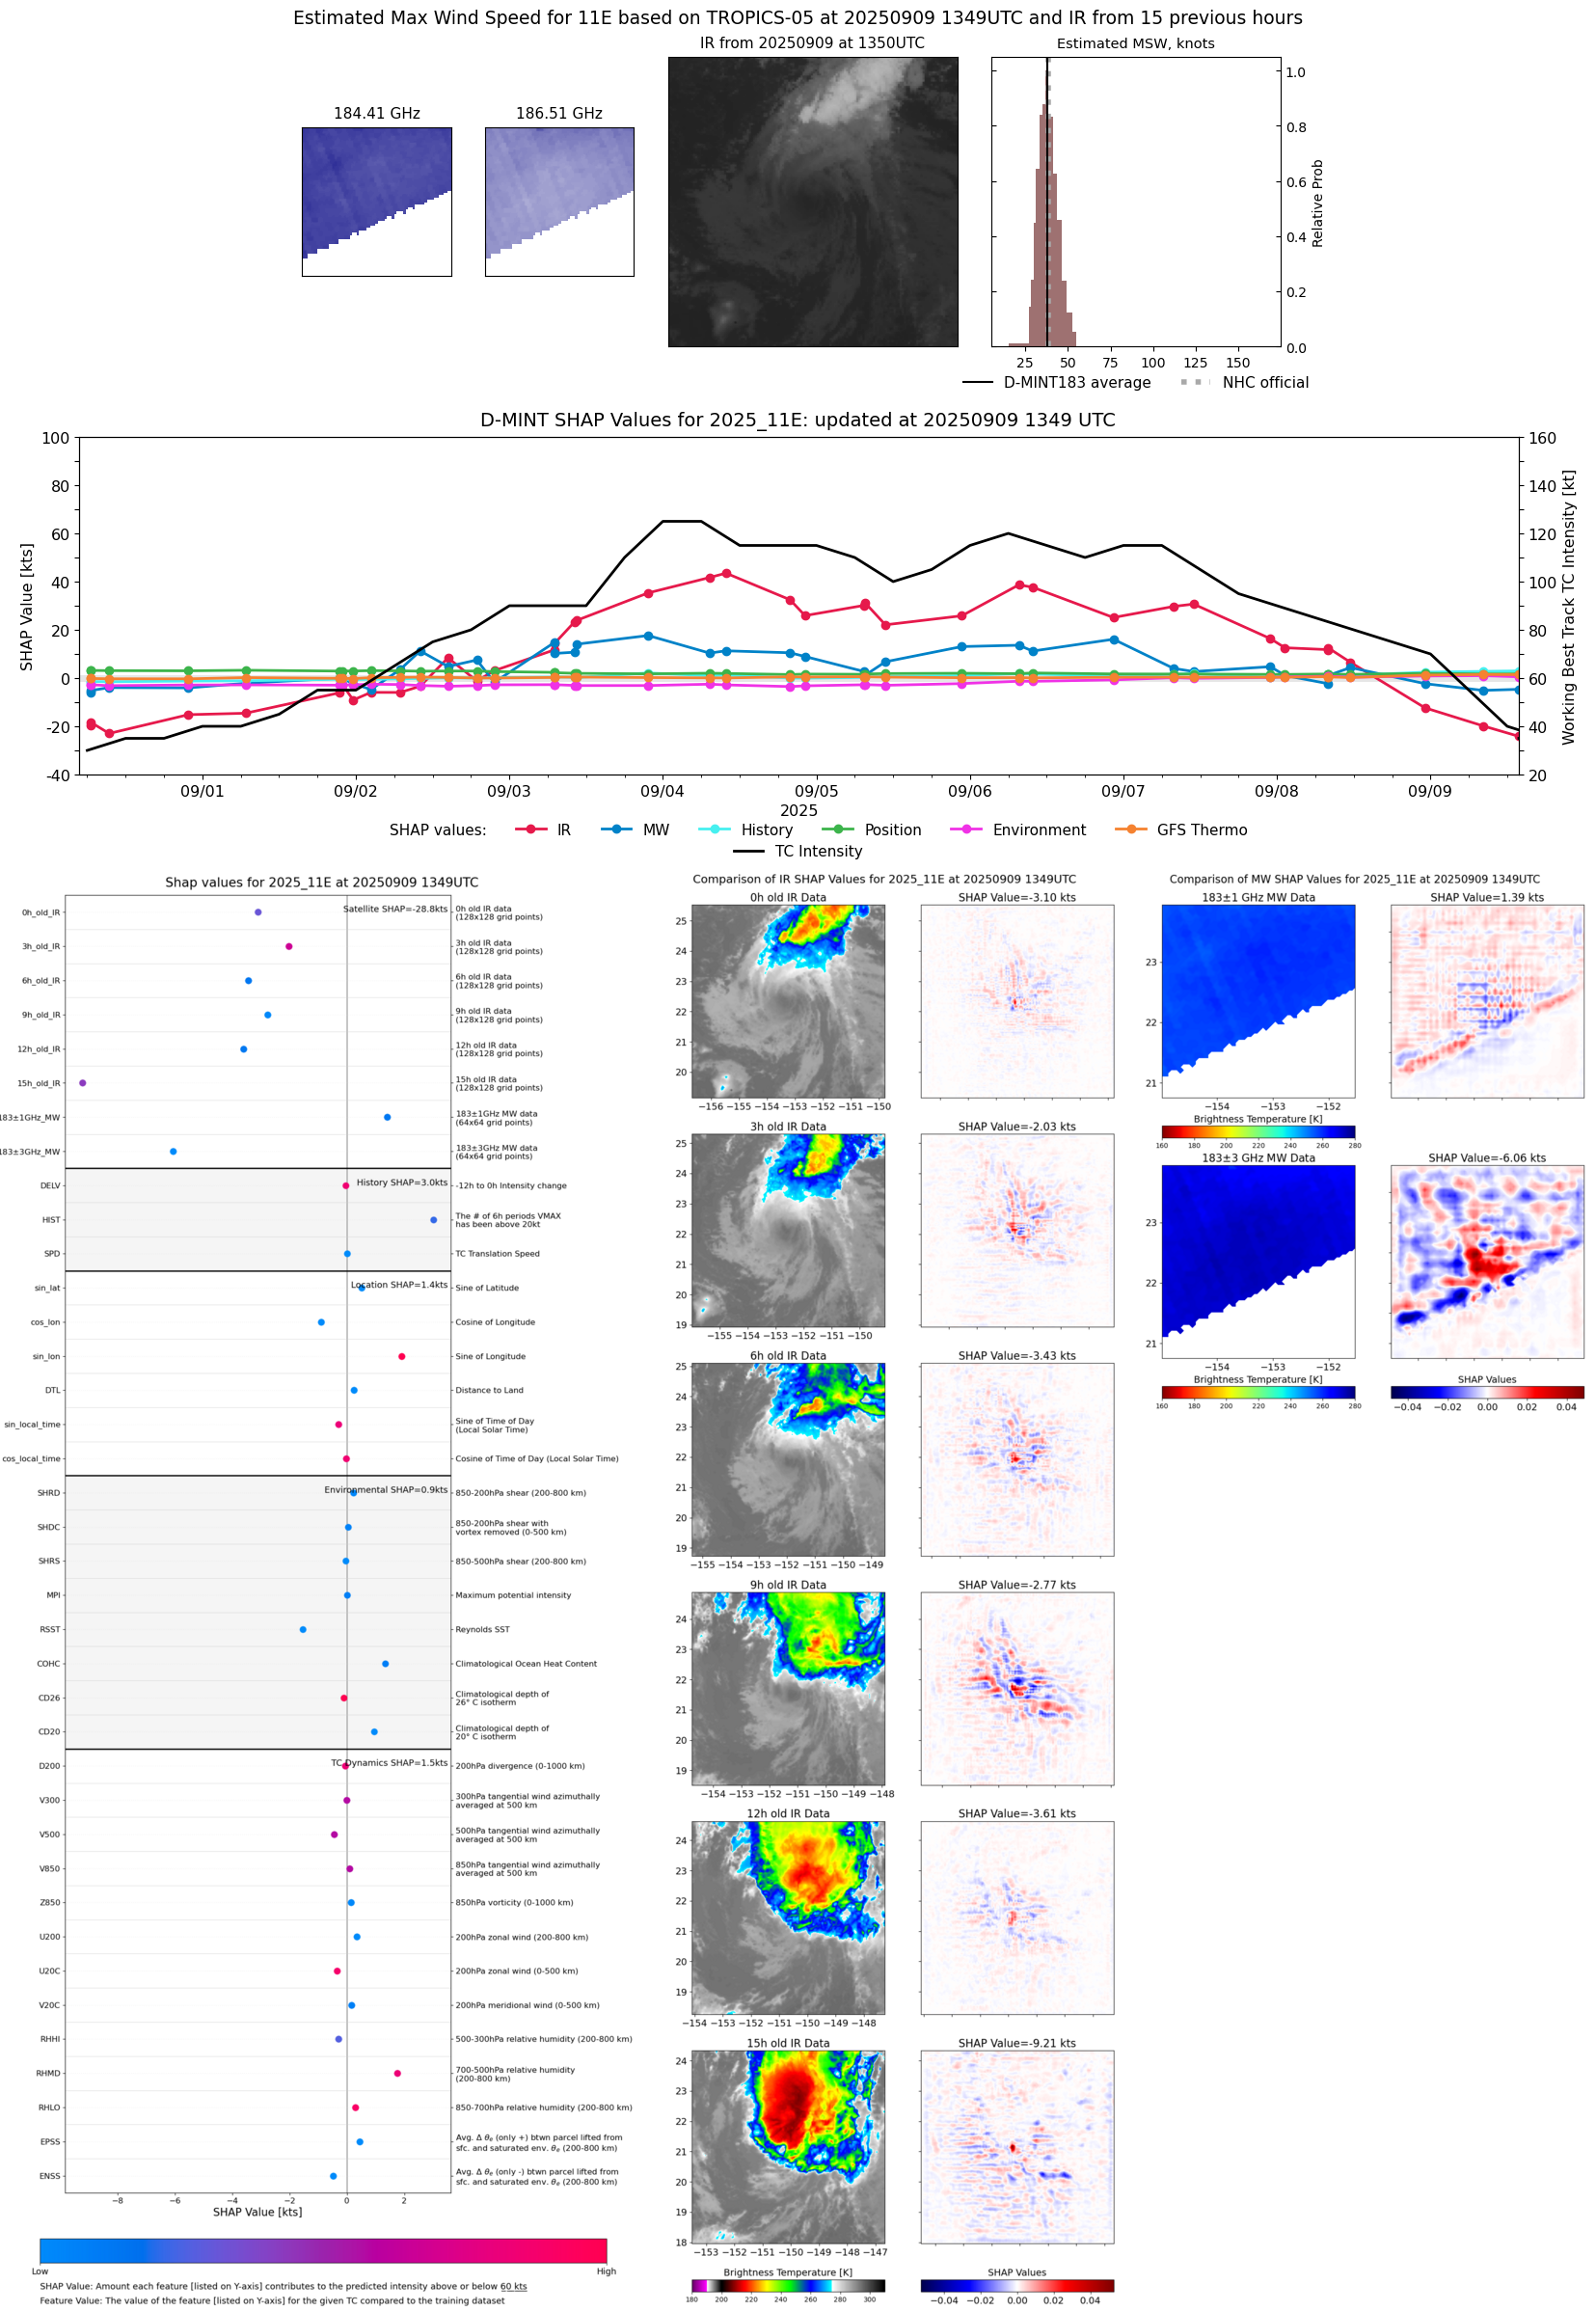 |
| 20250909 | 0828 UTC | TMS05 | 1005 hPa | 44 kts | 39 kts | 49 kts | 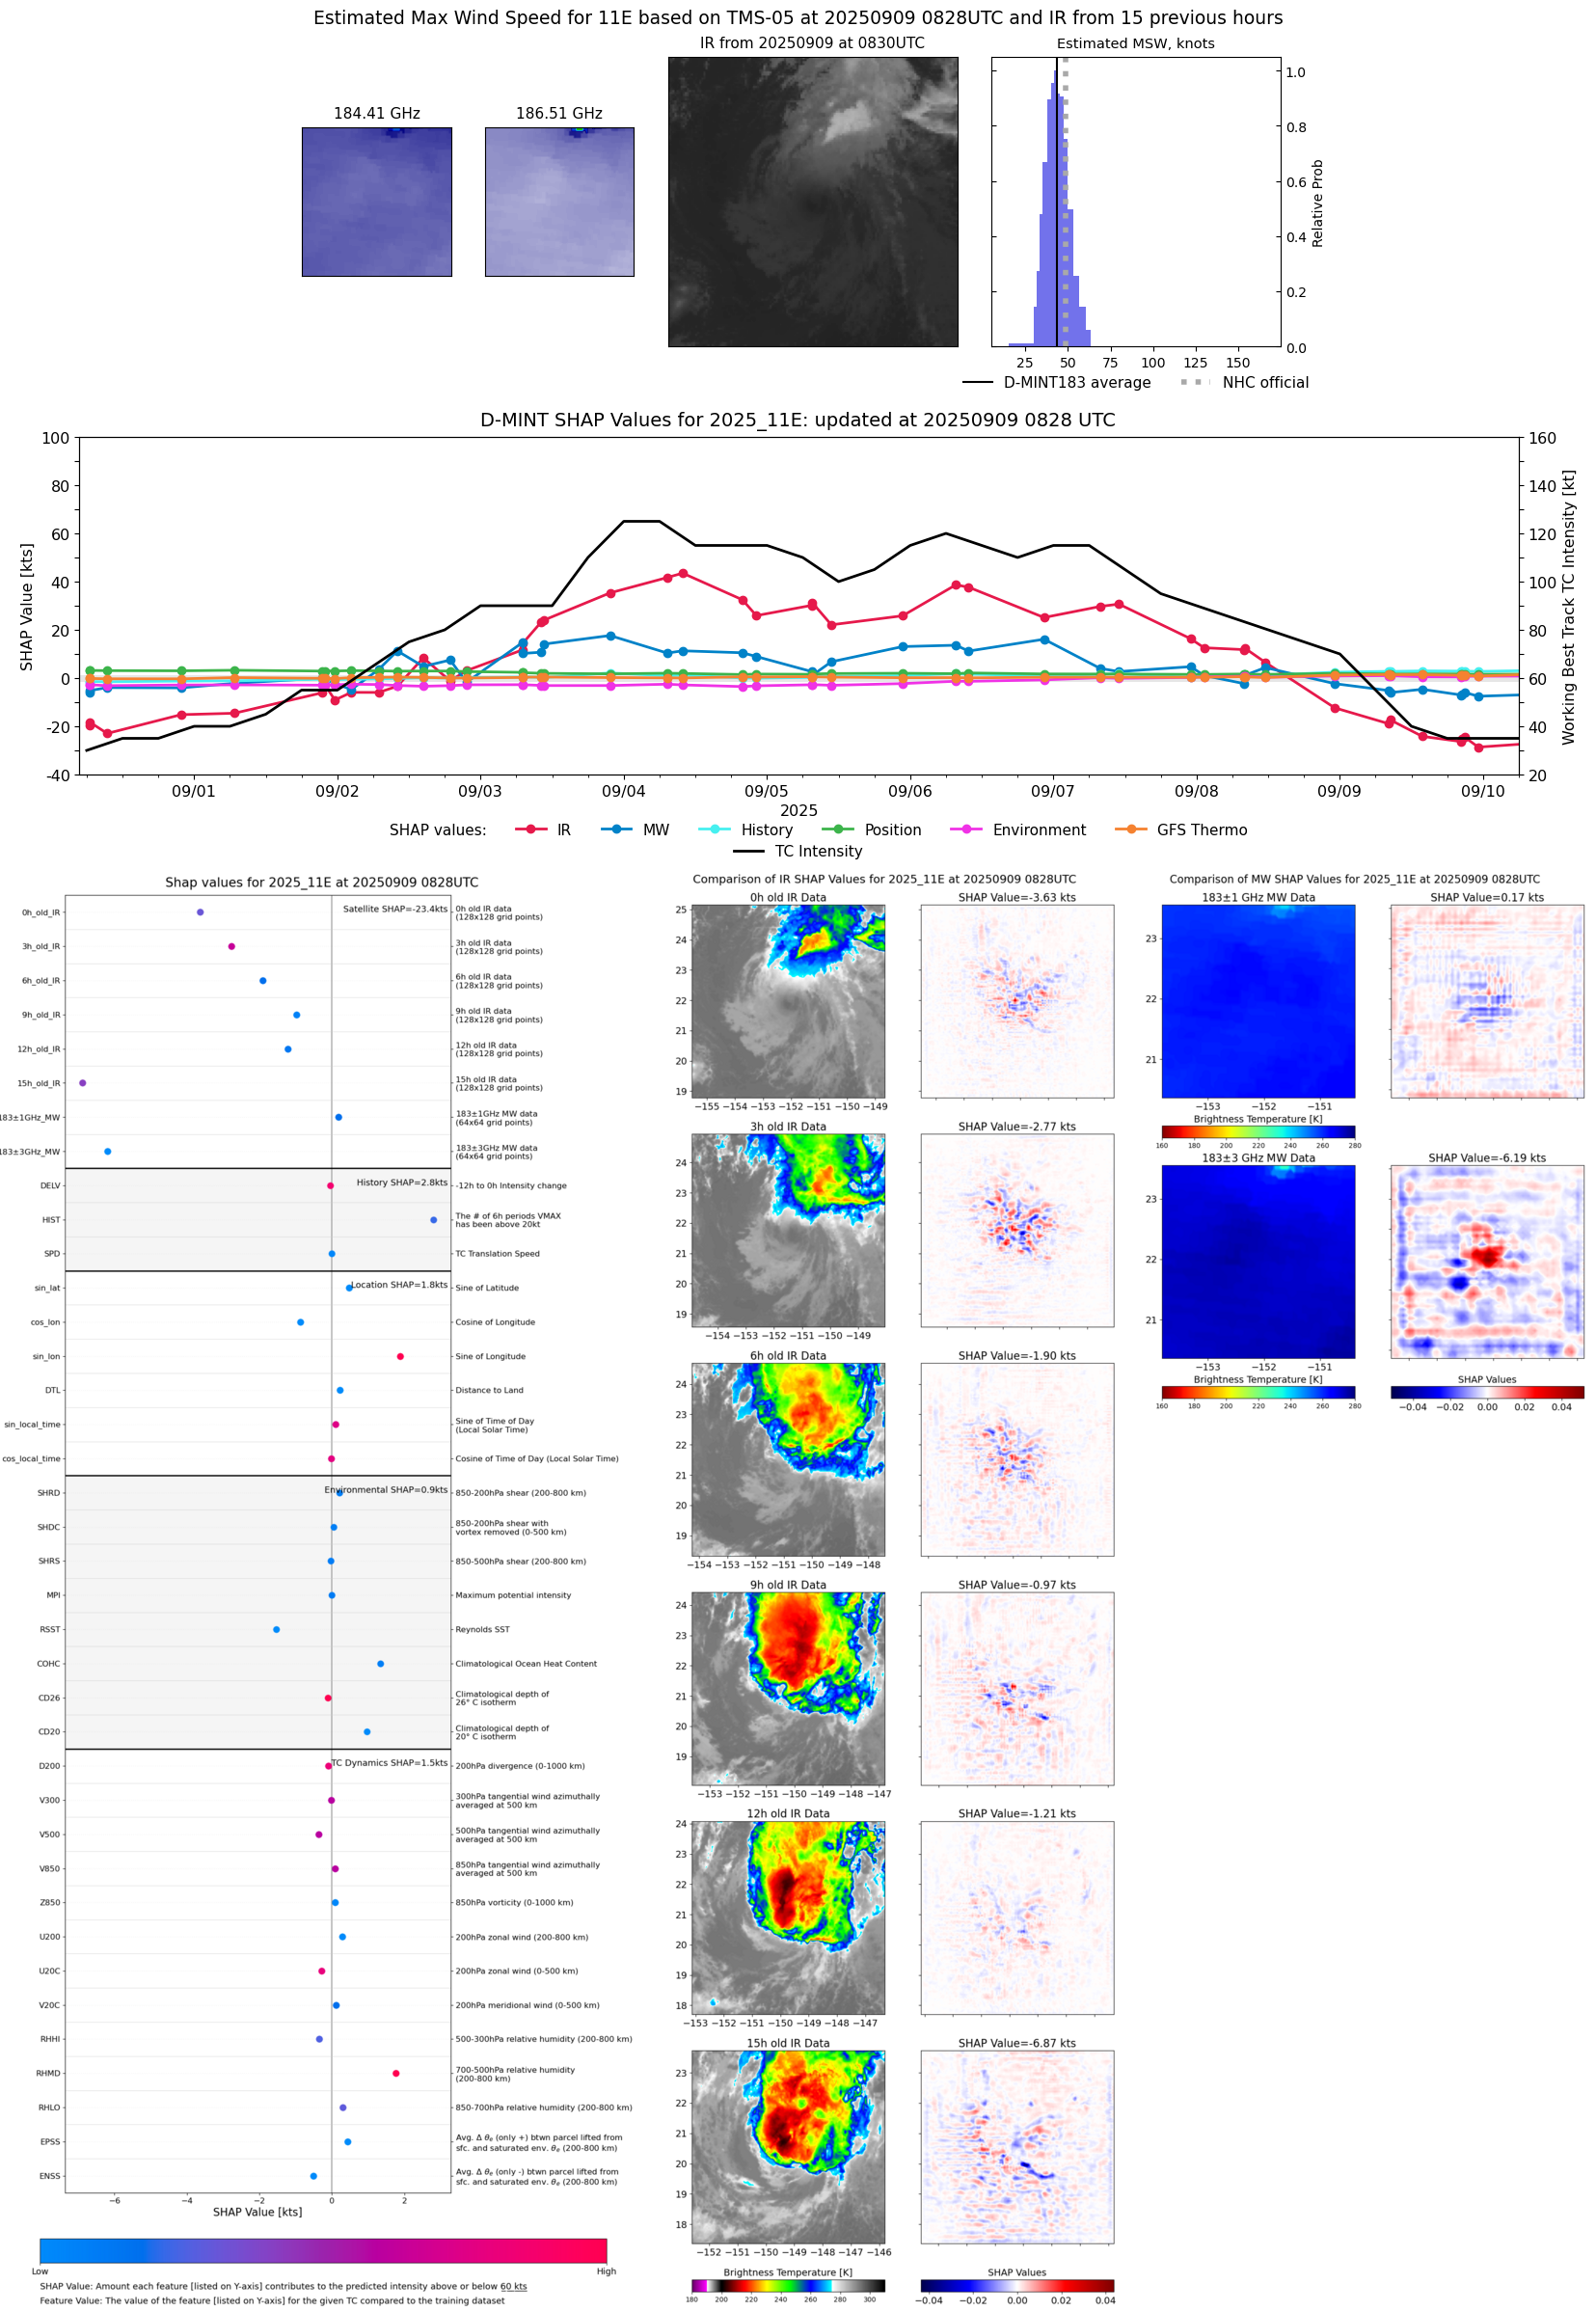 |
| 20250909 | 0824 UTC | TROPICS03 | 1004 hPa | 42 kts | 37 kts | 46 kts | 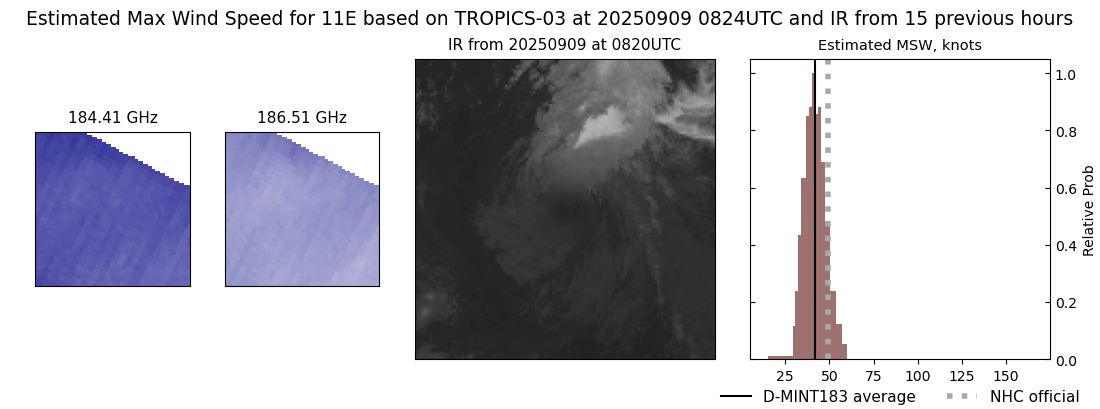 |
| 20250909 | 0813 UTC | AWS | 1004 hPa | 43 kts | 38 kts | 48 kts | 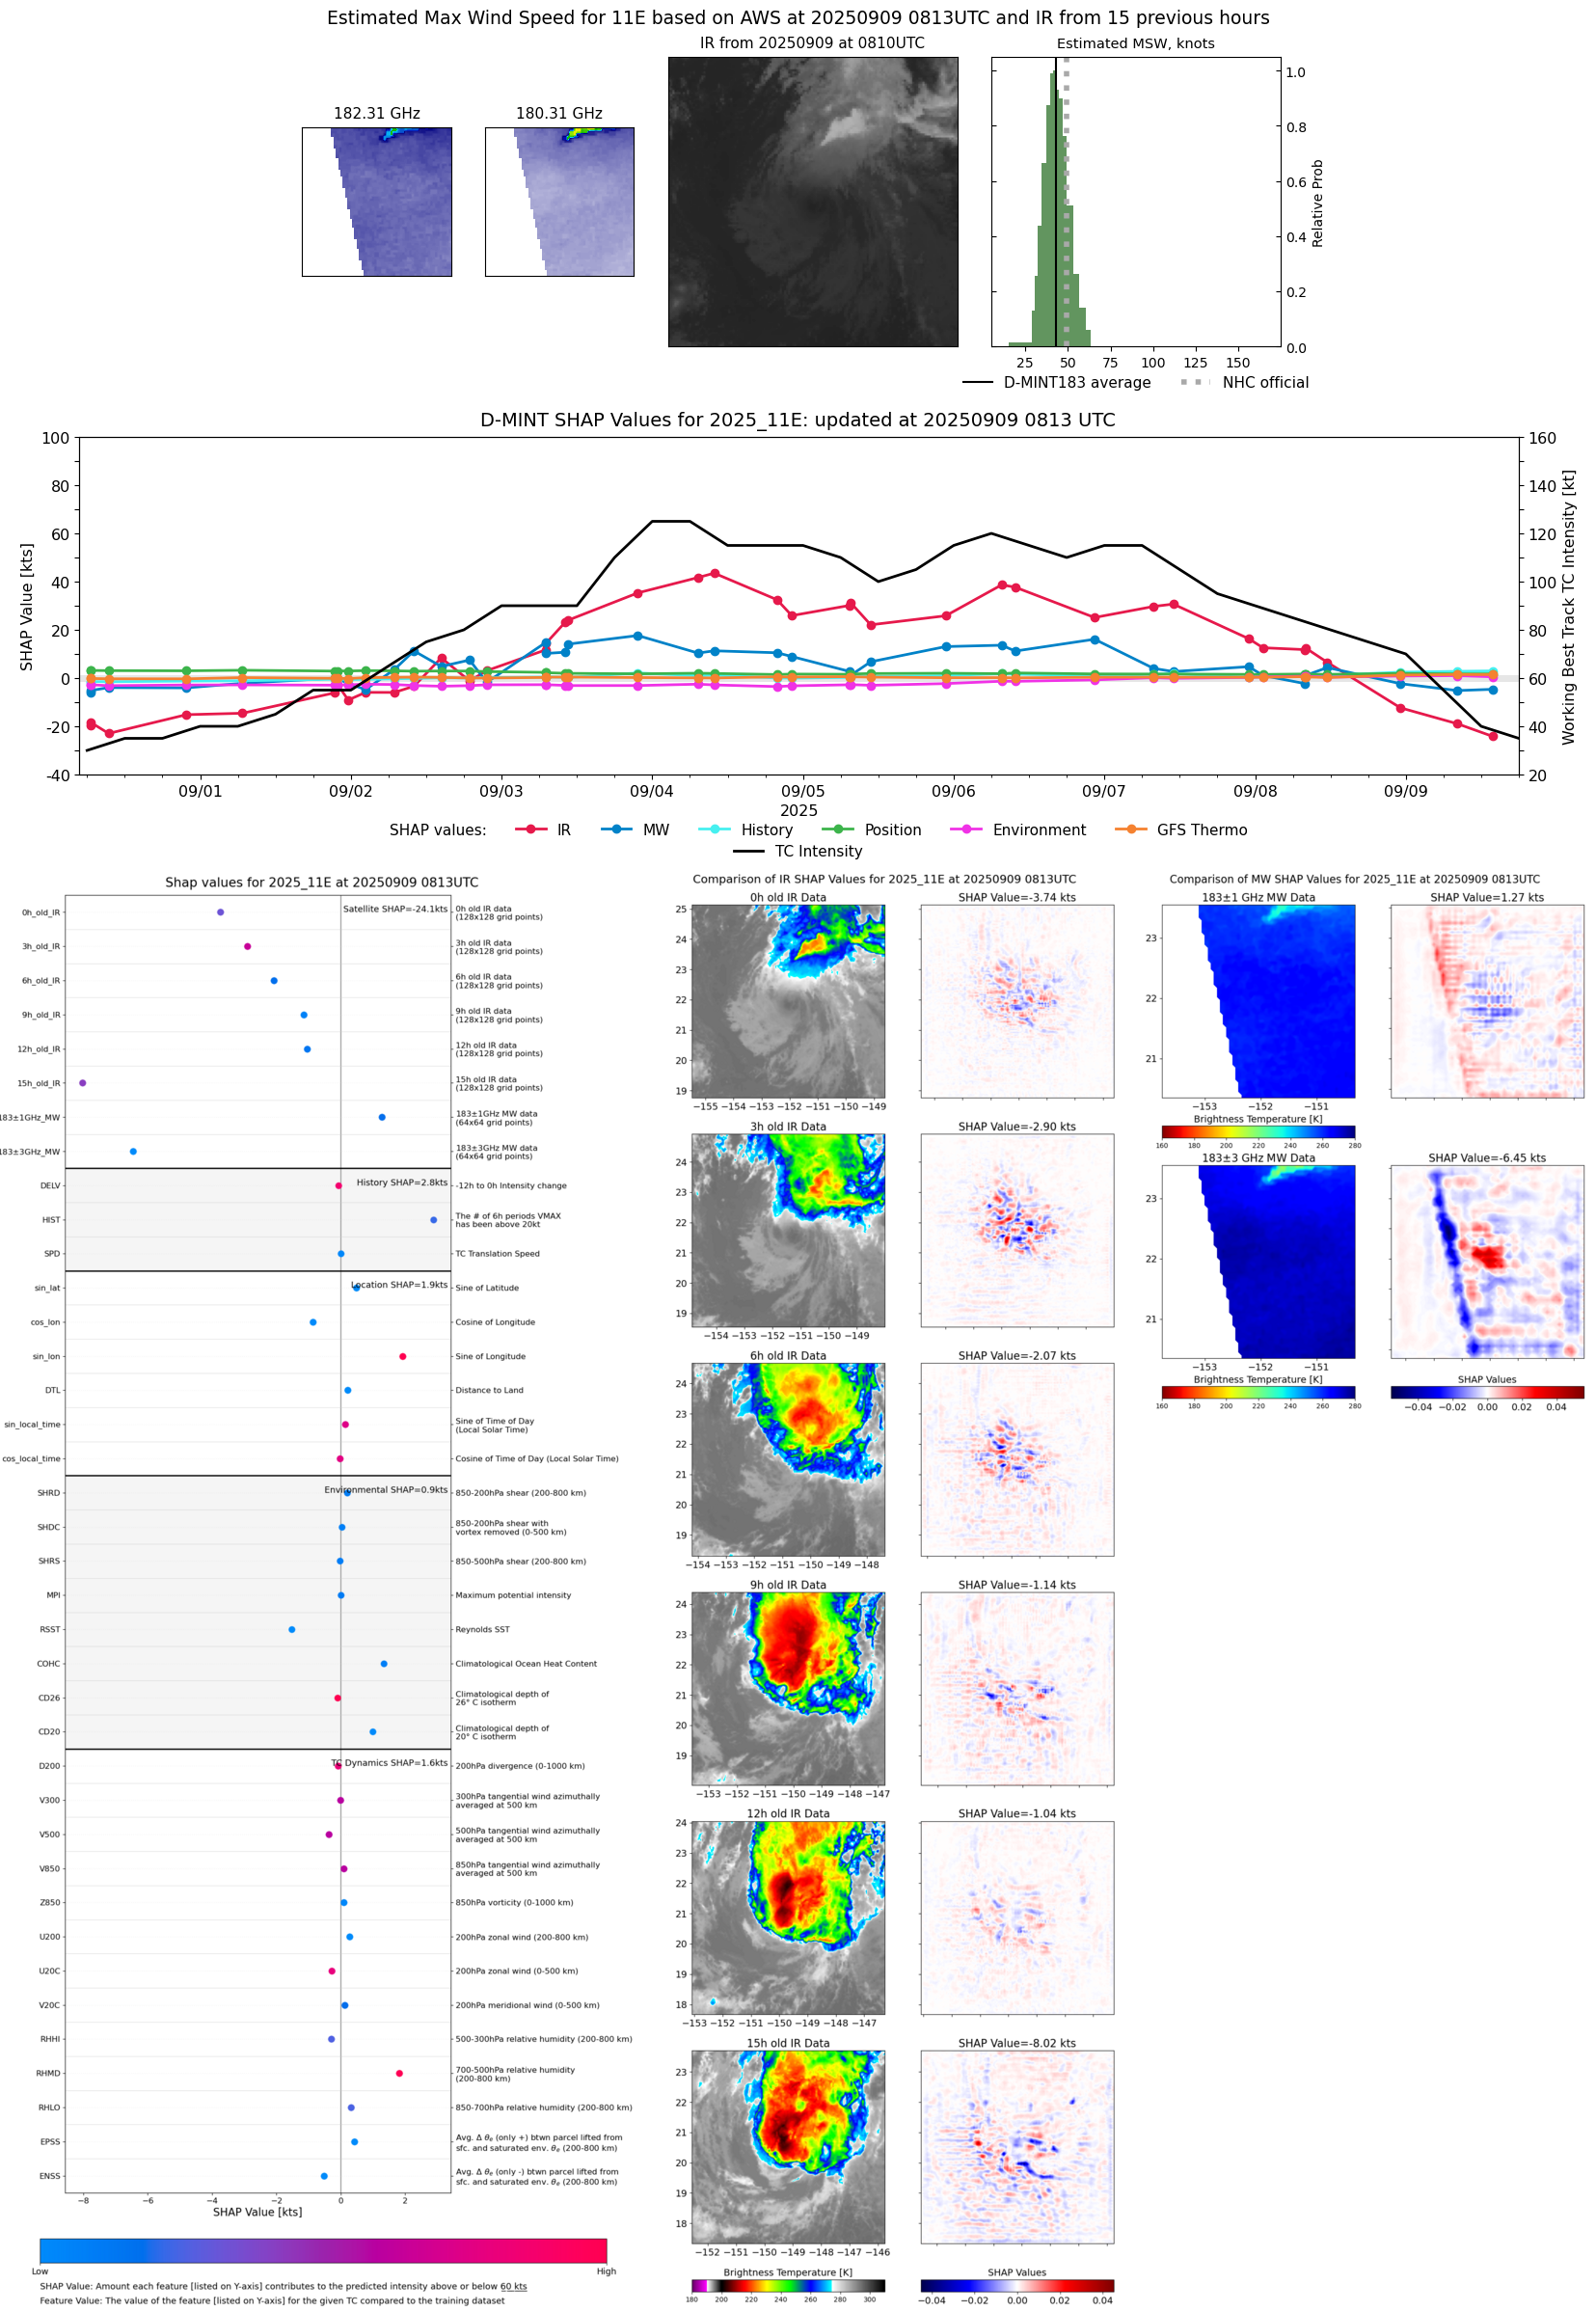 |
| 20250909 | 0813 UTC | AWS | NaN hPa | 0 kts | 0 kts | 0 kts |  |
| 20250909 | 0420 UTC | SSMISF16 | 1003 hPa | 45 kts | 40 kts | 50 kts | 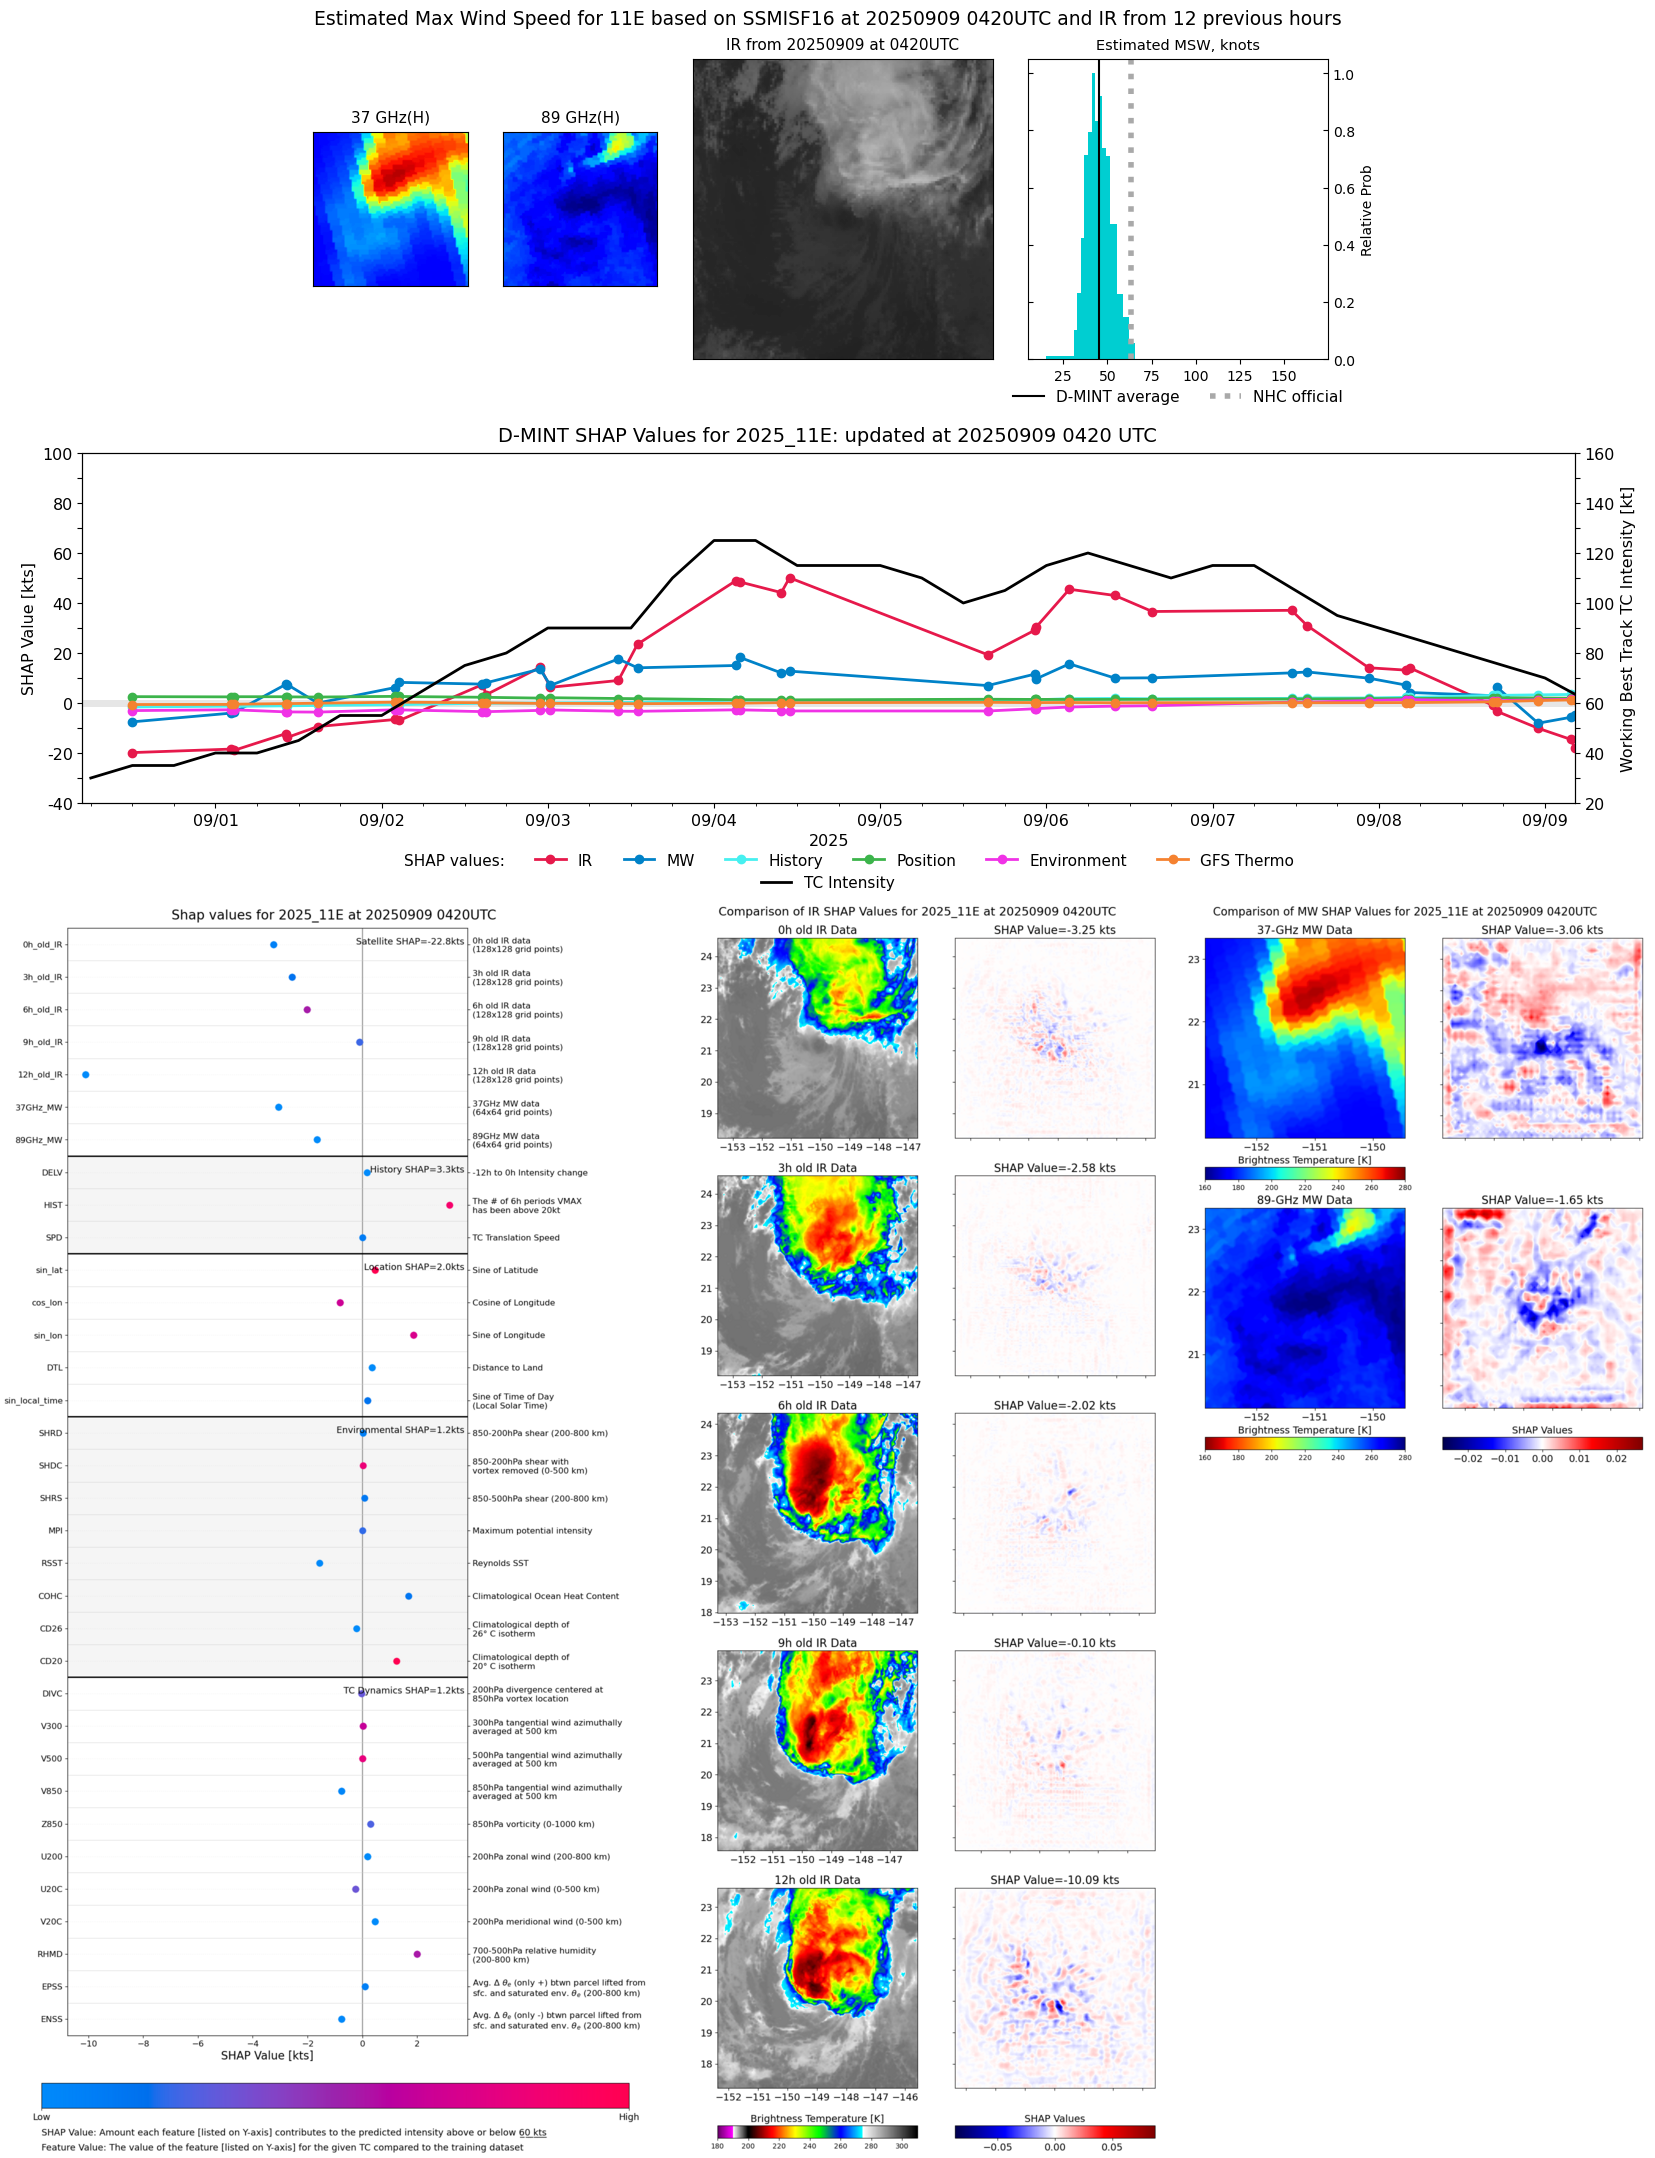 |
| 20250909 | 0342 UTC | SSMISF17 | 1003 hPa | 48 kts | 43 kts | 53 kts |  |
| 20250909 | 0338 UTC | WSFM01 | 1001 hPa | 49 kts | 44 kts | 55 kts | 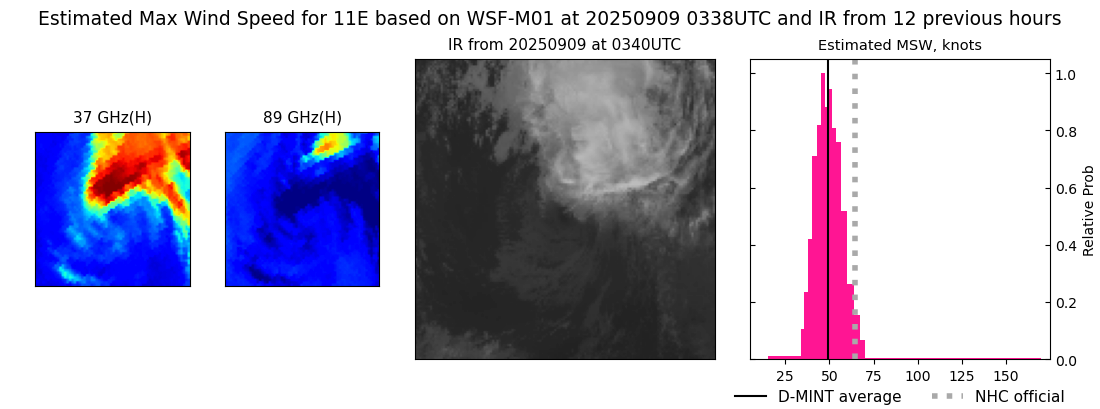 |
| 20250908 | 2308 UTC | ATMS-NPP | 999 hPa | 52 kts | 47 kts | 57 kts | 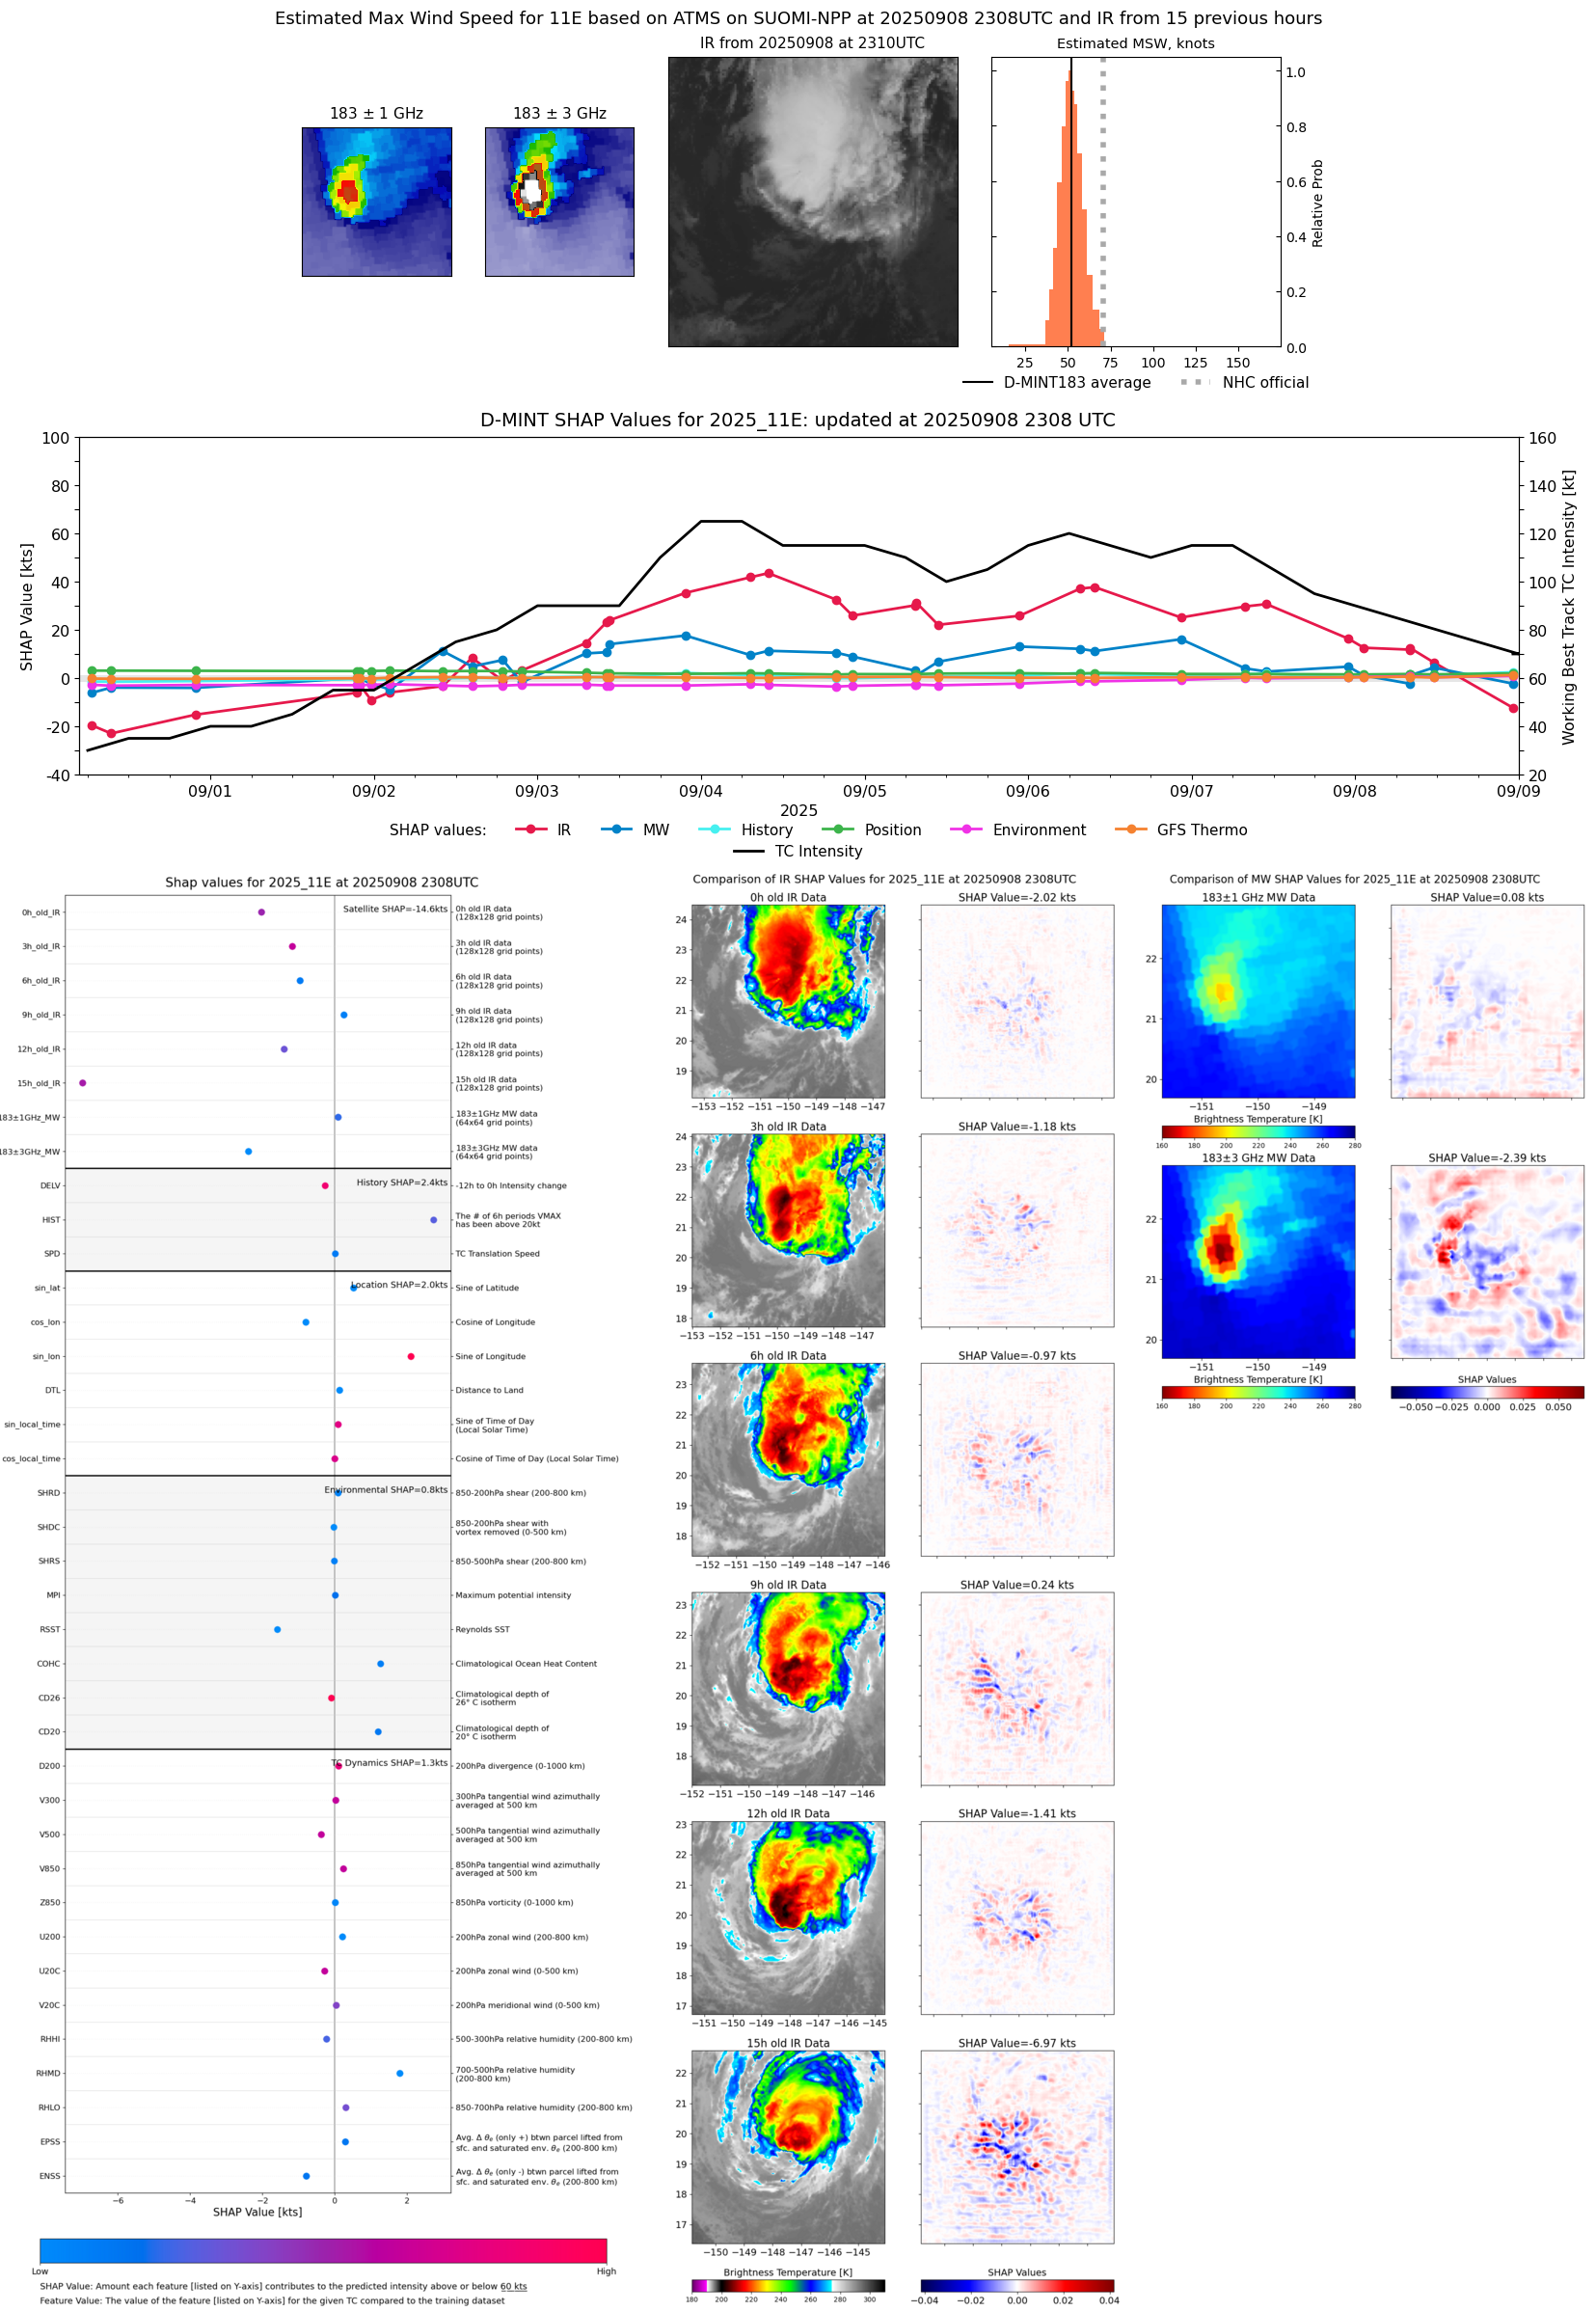 |
| 20250908 | 2301 UTC | AMSR2 | 1006 hPa | 49 kts | 44 kts | 55 kts | 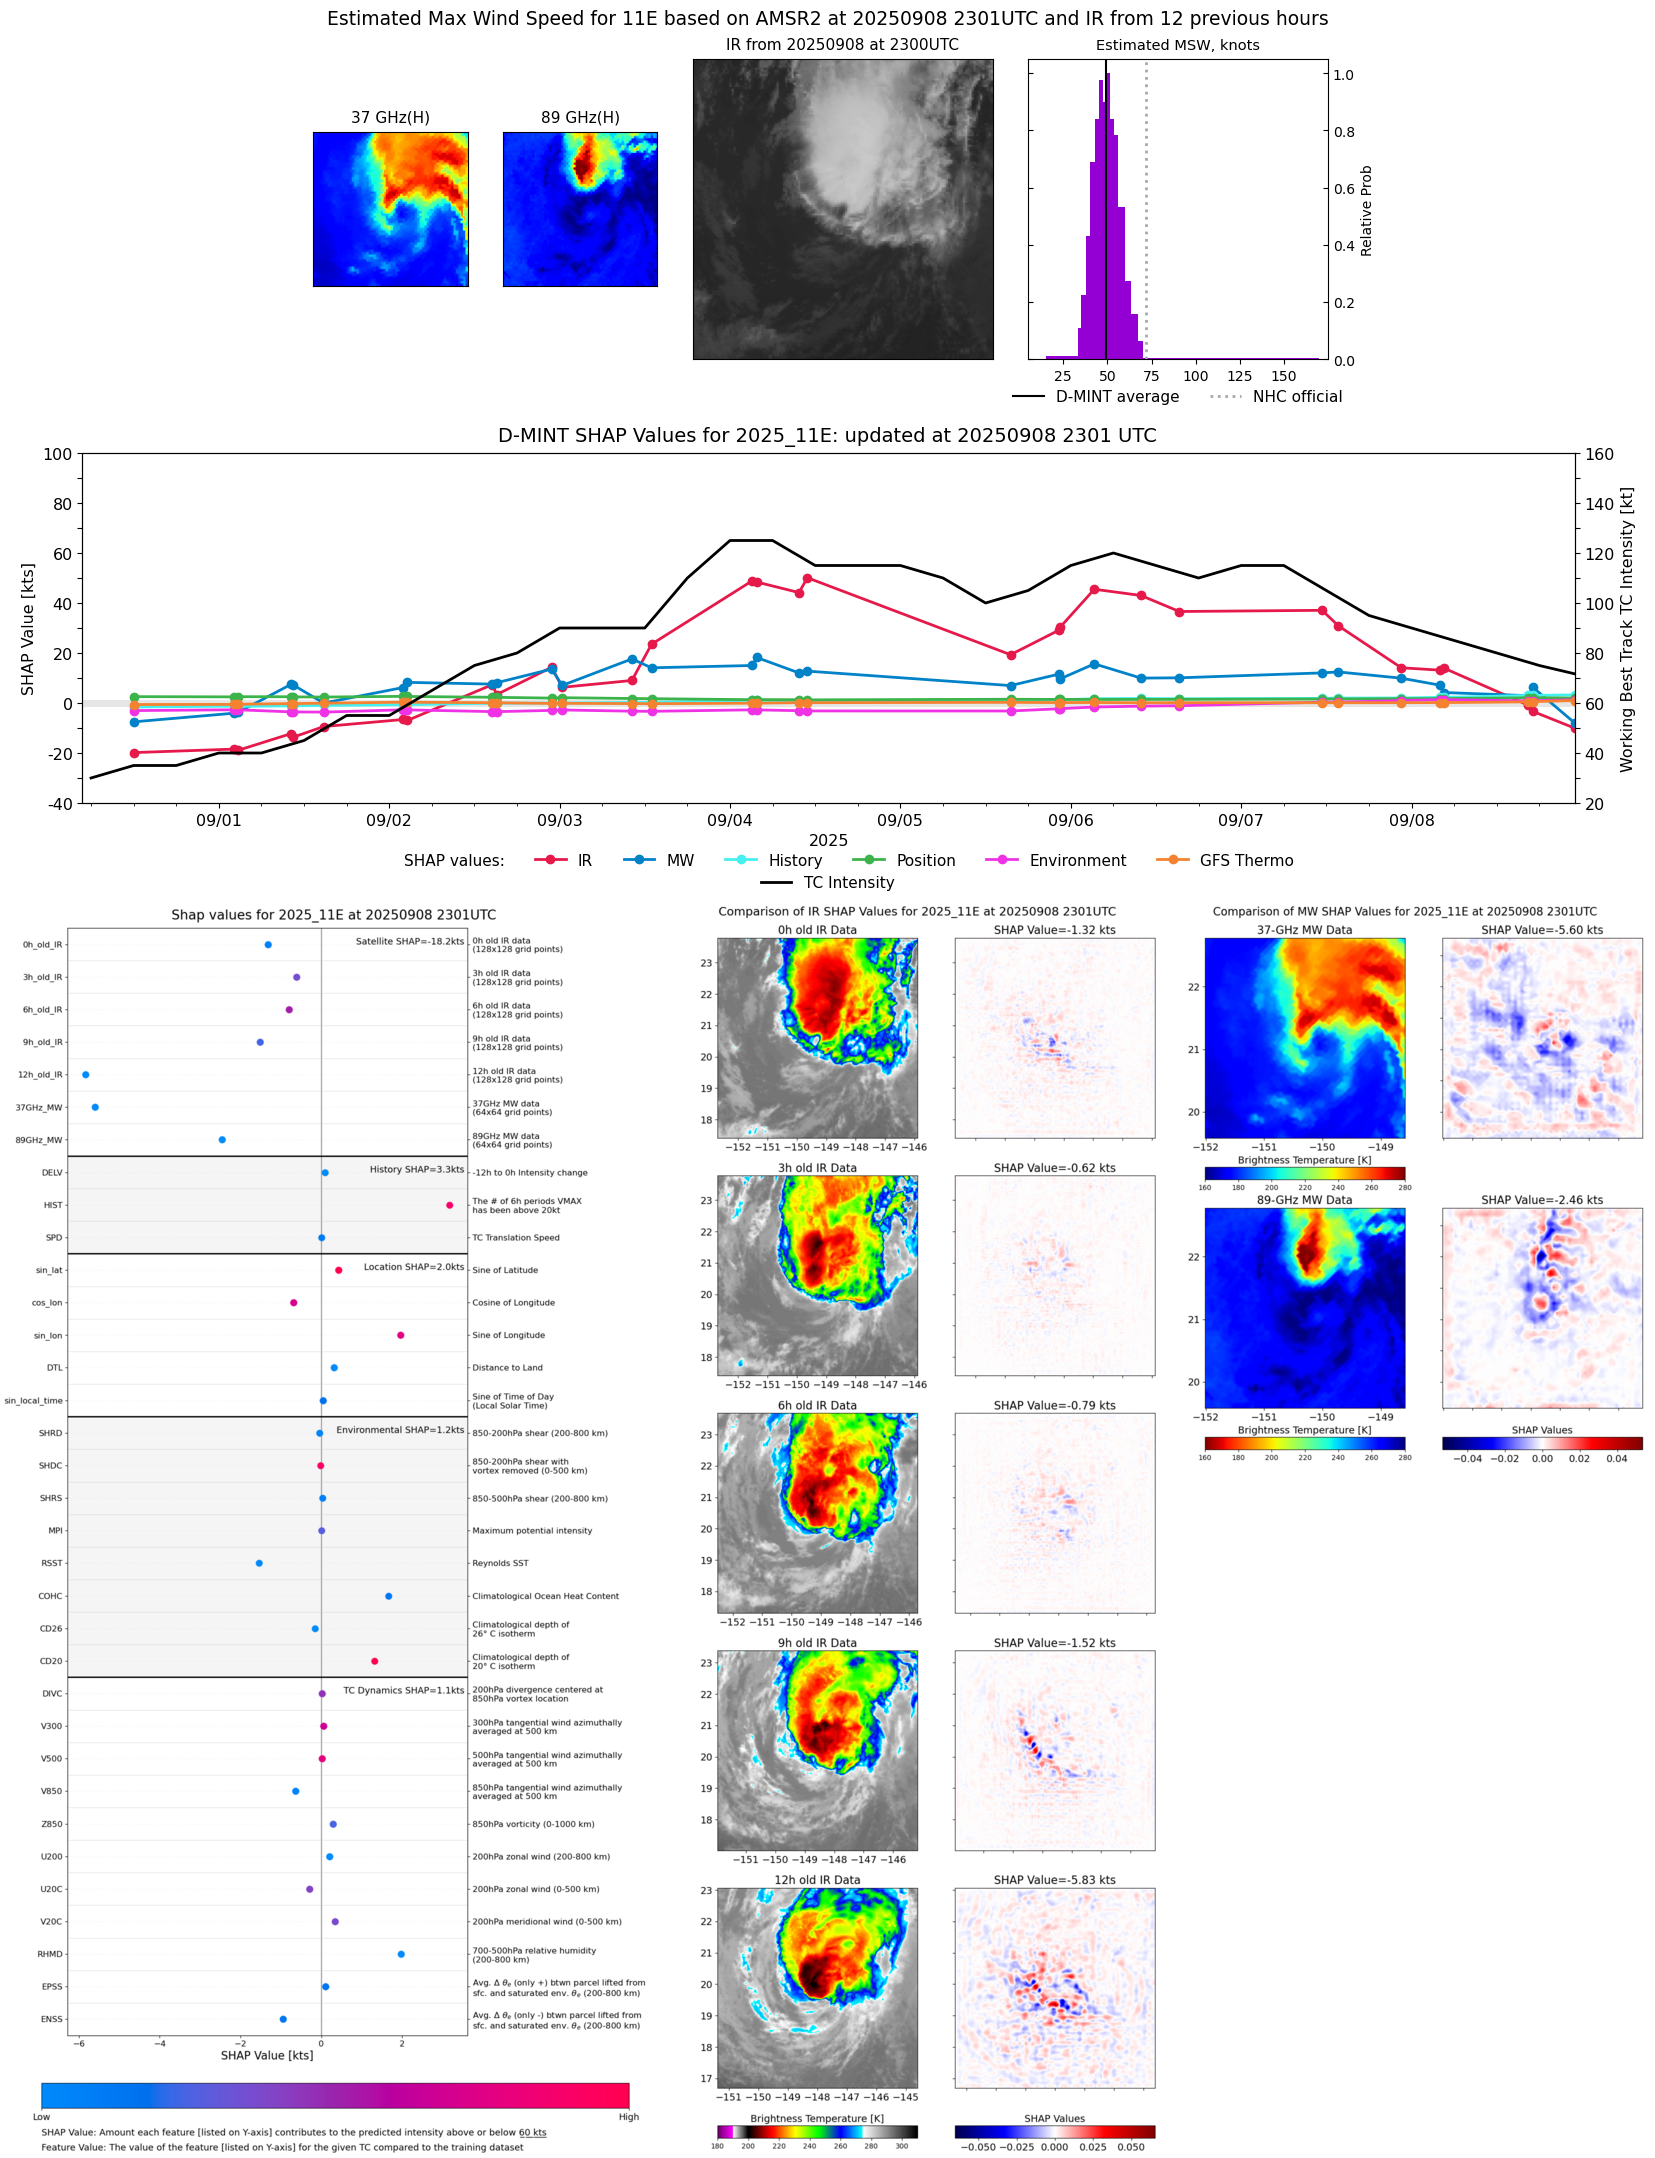 |
| 20250908 | 2001 UTC | TMS06 | 998 hPa | 56 kts | 52 kts | 61 kts | 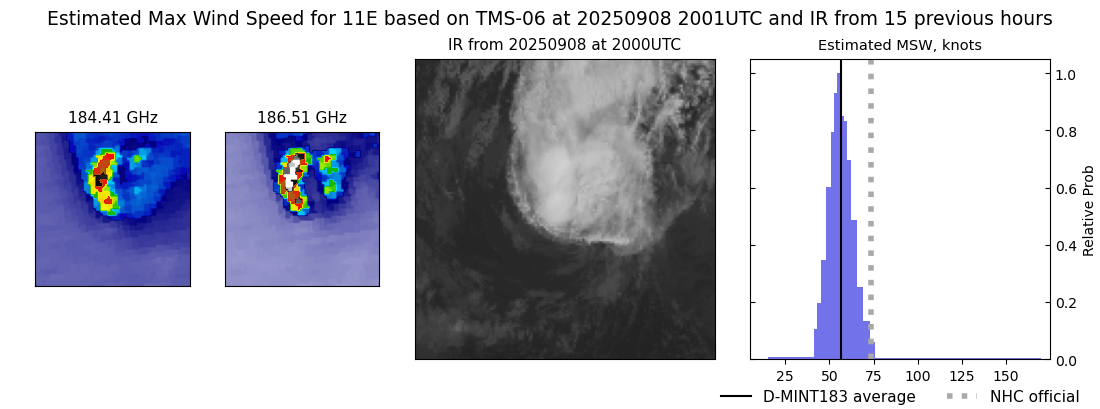 |
| 20250908 | 1706 UTC | SSMISF16 | 988 hPa | 70 kts | 64 kts | 75 kts | 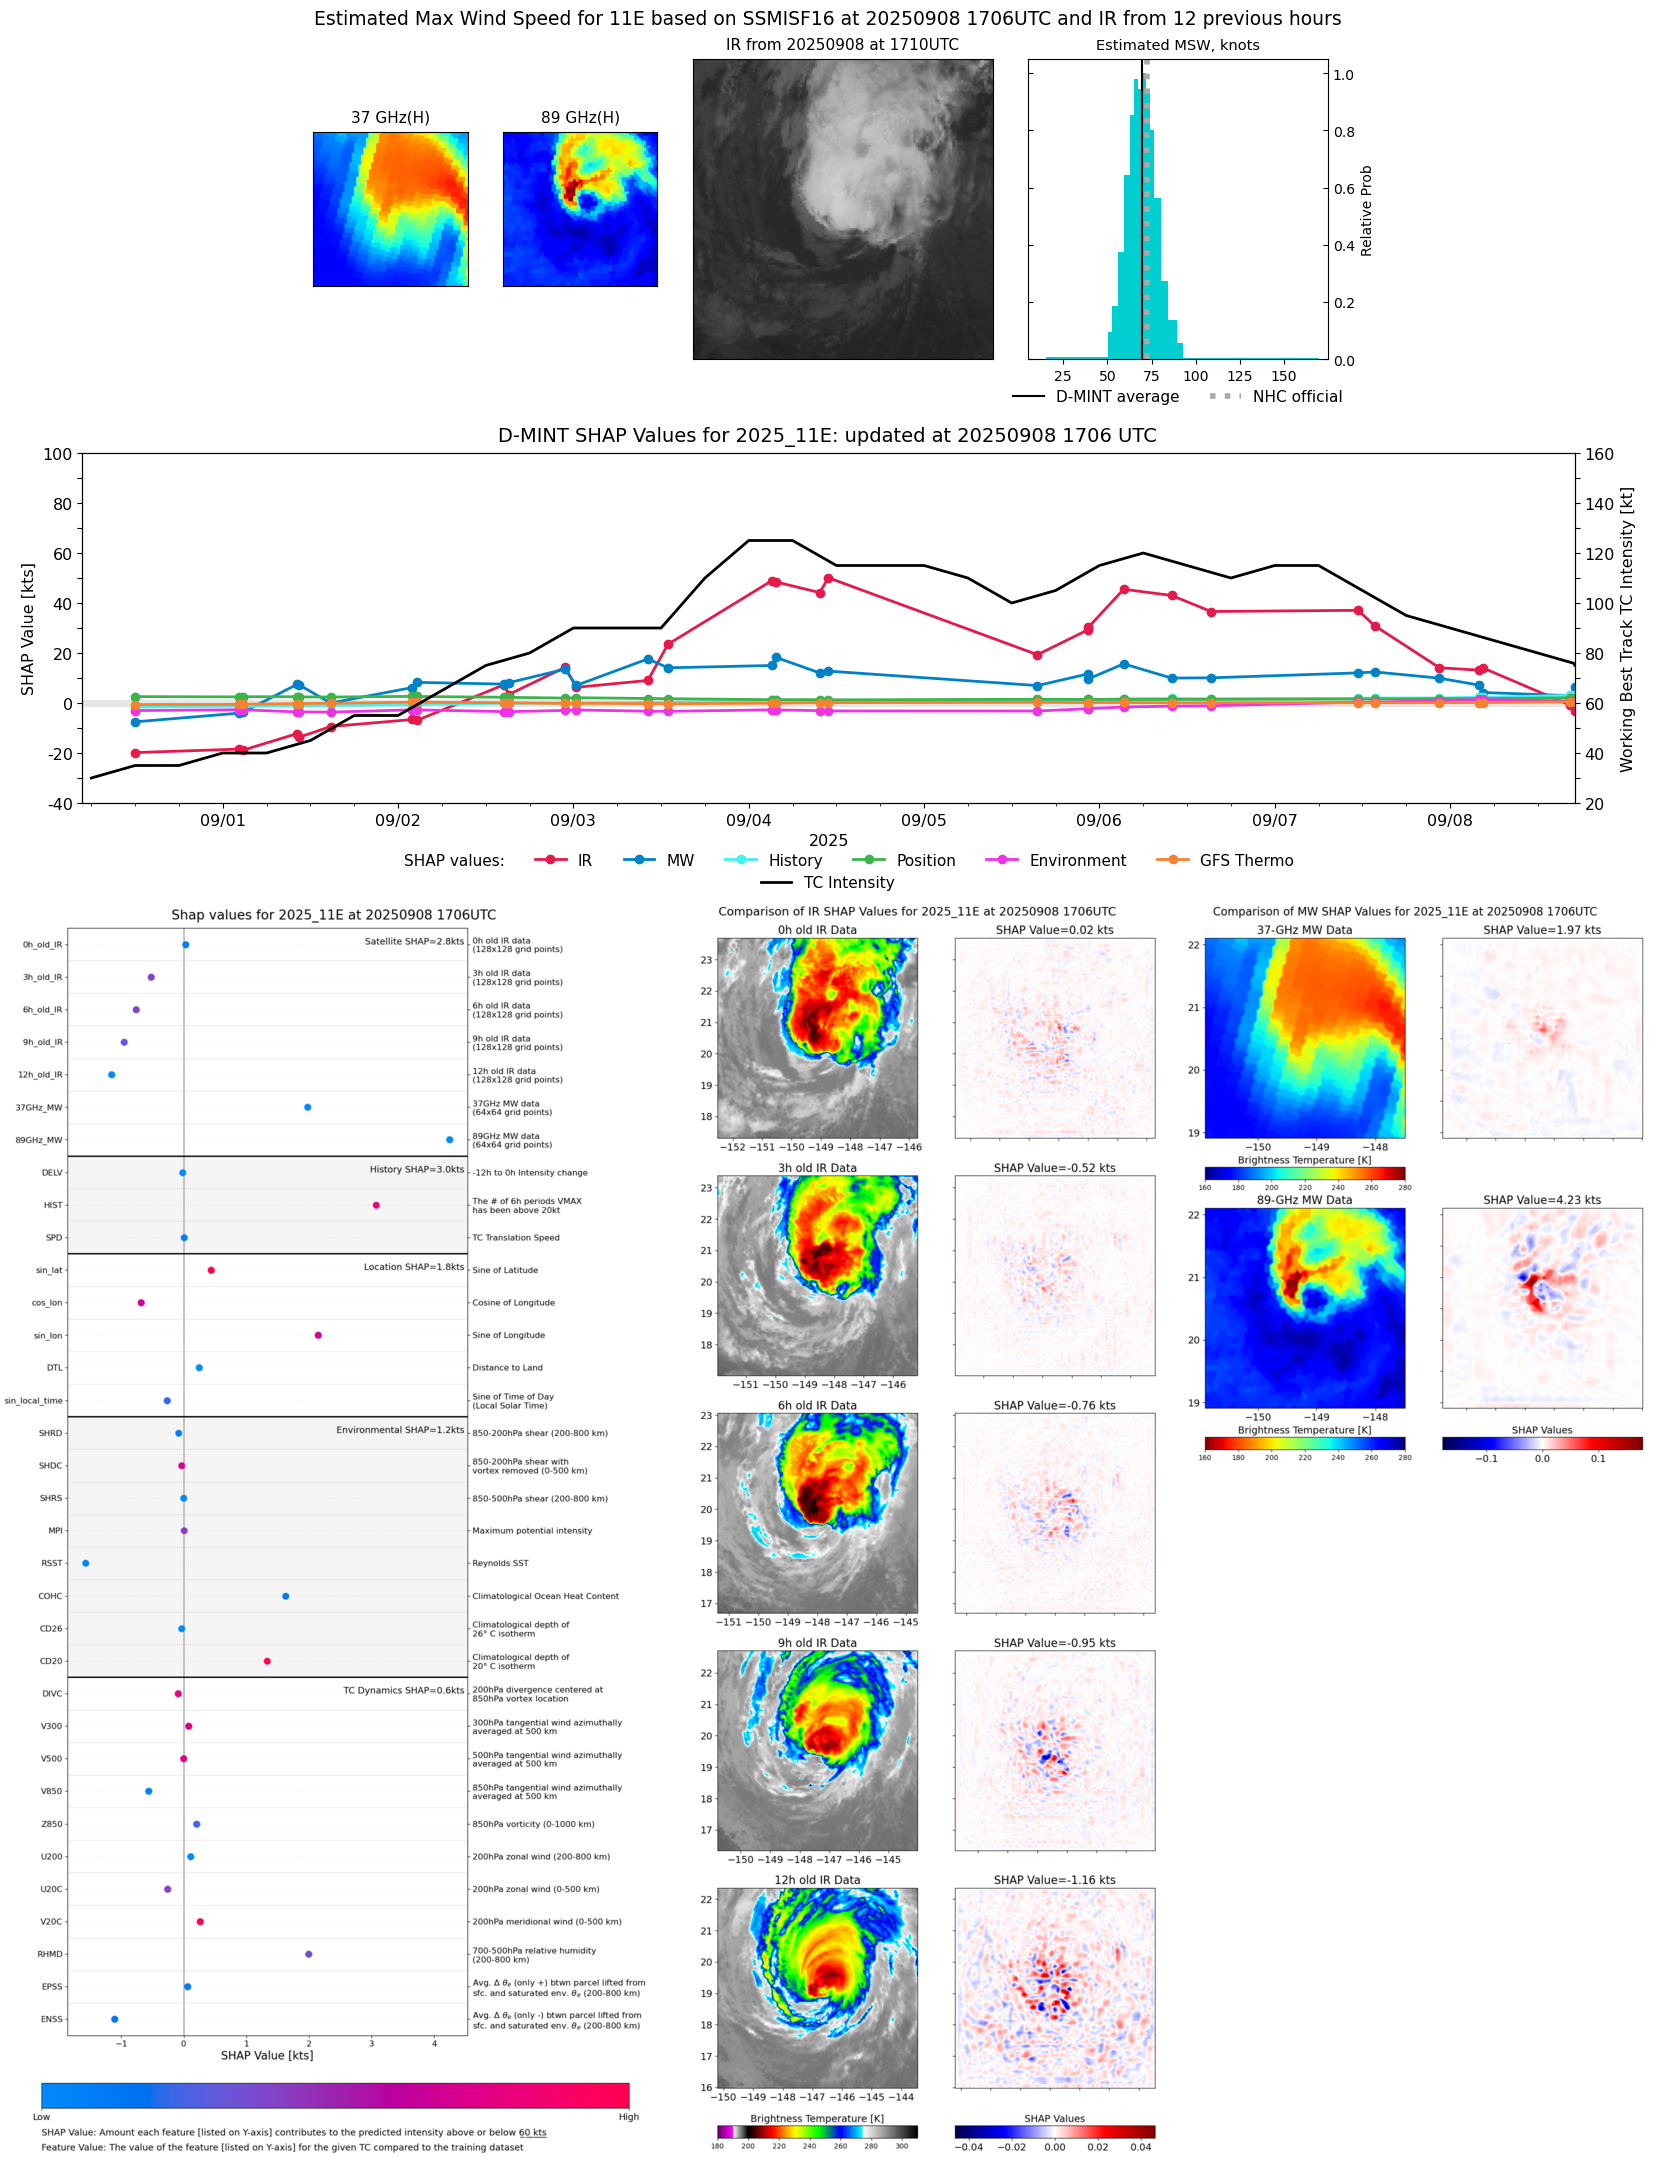 |
| 20250908 | 1628 UTC | SSMISF17 | 988 hPa | 68 kts | 63 kts | 74 kts |  |
| 20250908 | 1626 UTC | WSFM01 | 989 hPa | 64 kts | 58 kts | 69 kts | 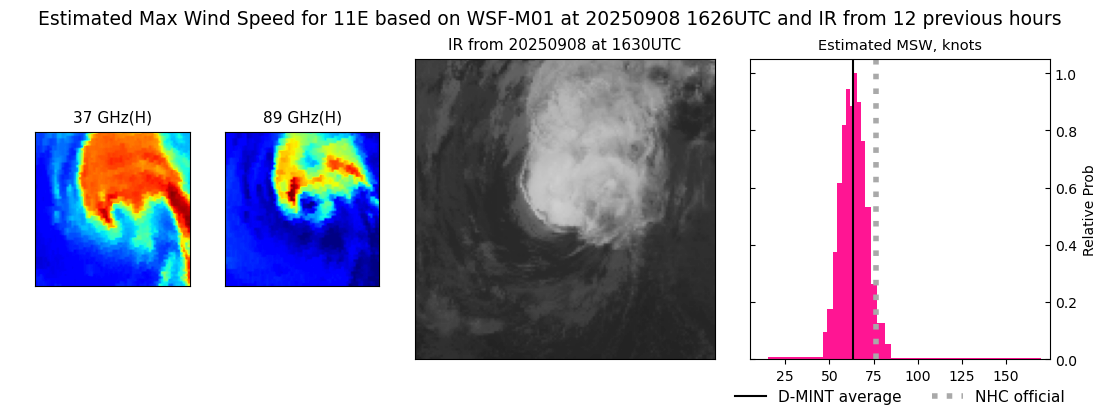 |
| 20250908 | 1313 UTC | TROPICS05 | 988 hPa | 71 kts | 67 kts | 76 kts |  |
| 20250908 | 1130 UTC | ATMS-N21 | 981 hPa | 74 kts | 70 kts | 79 kts | 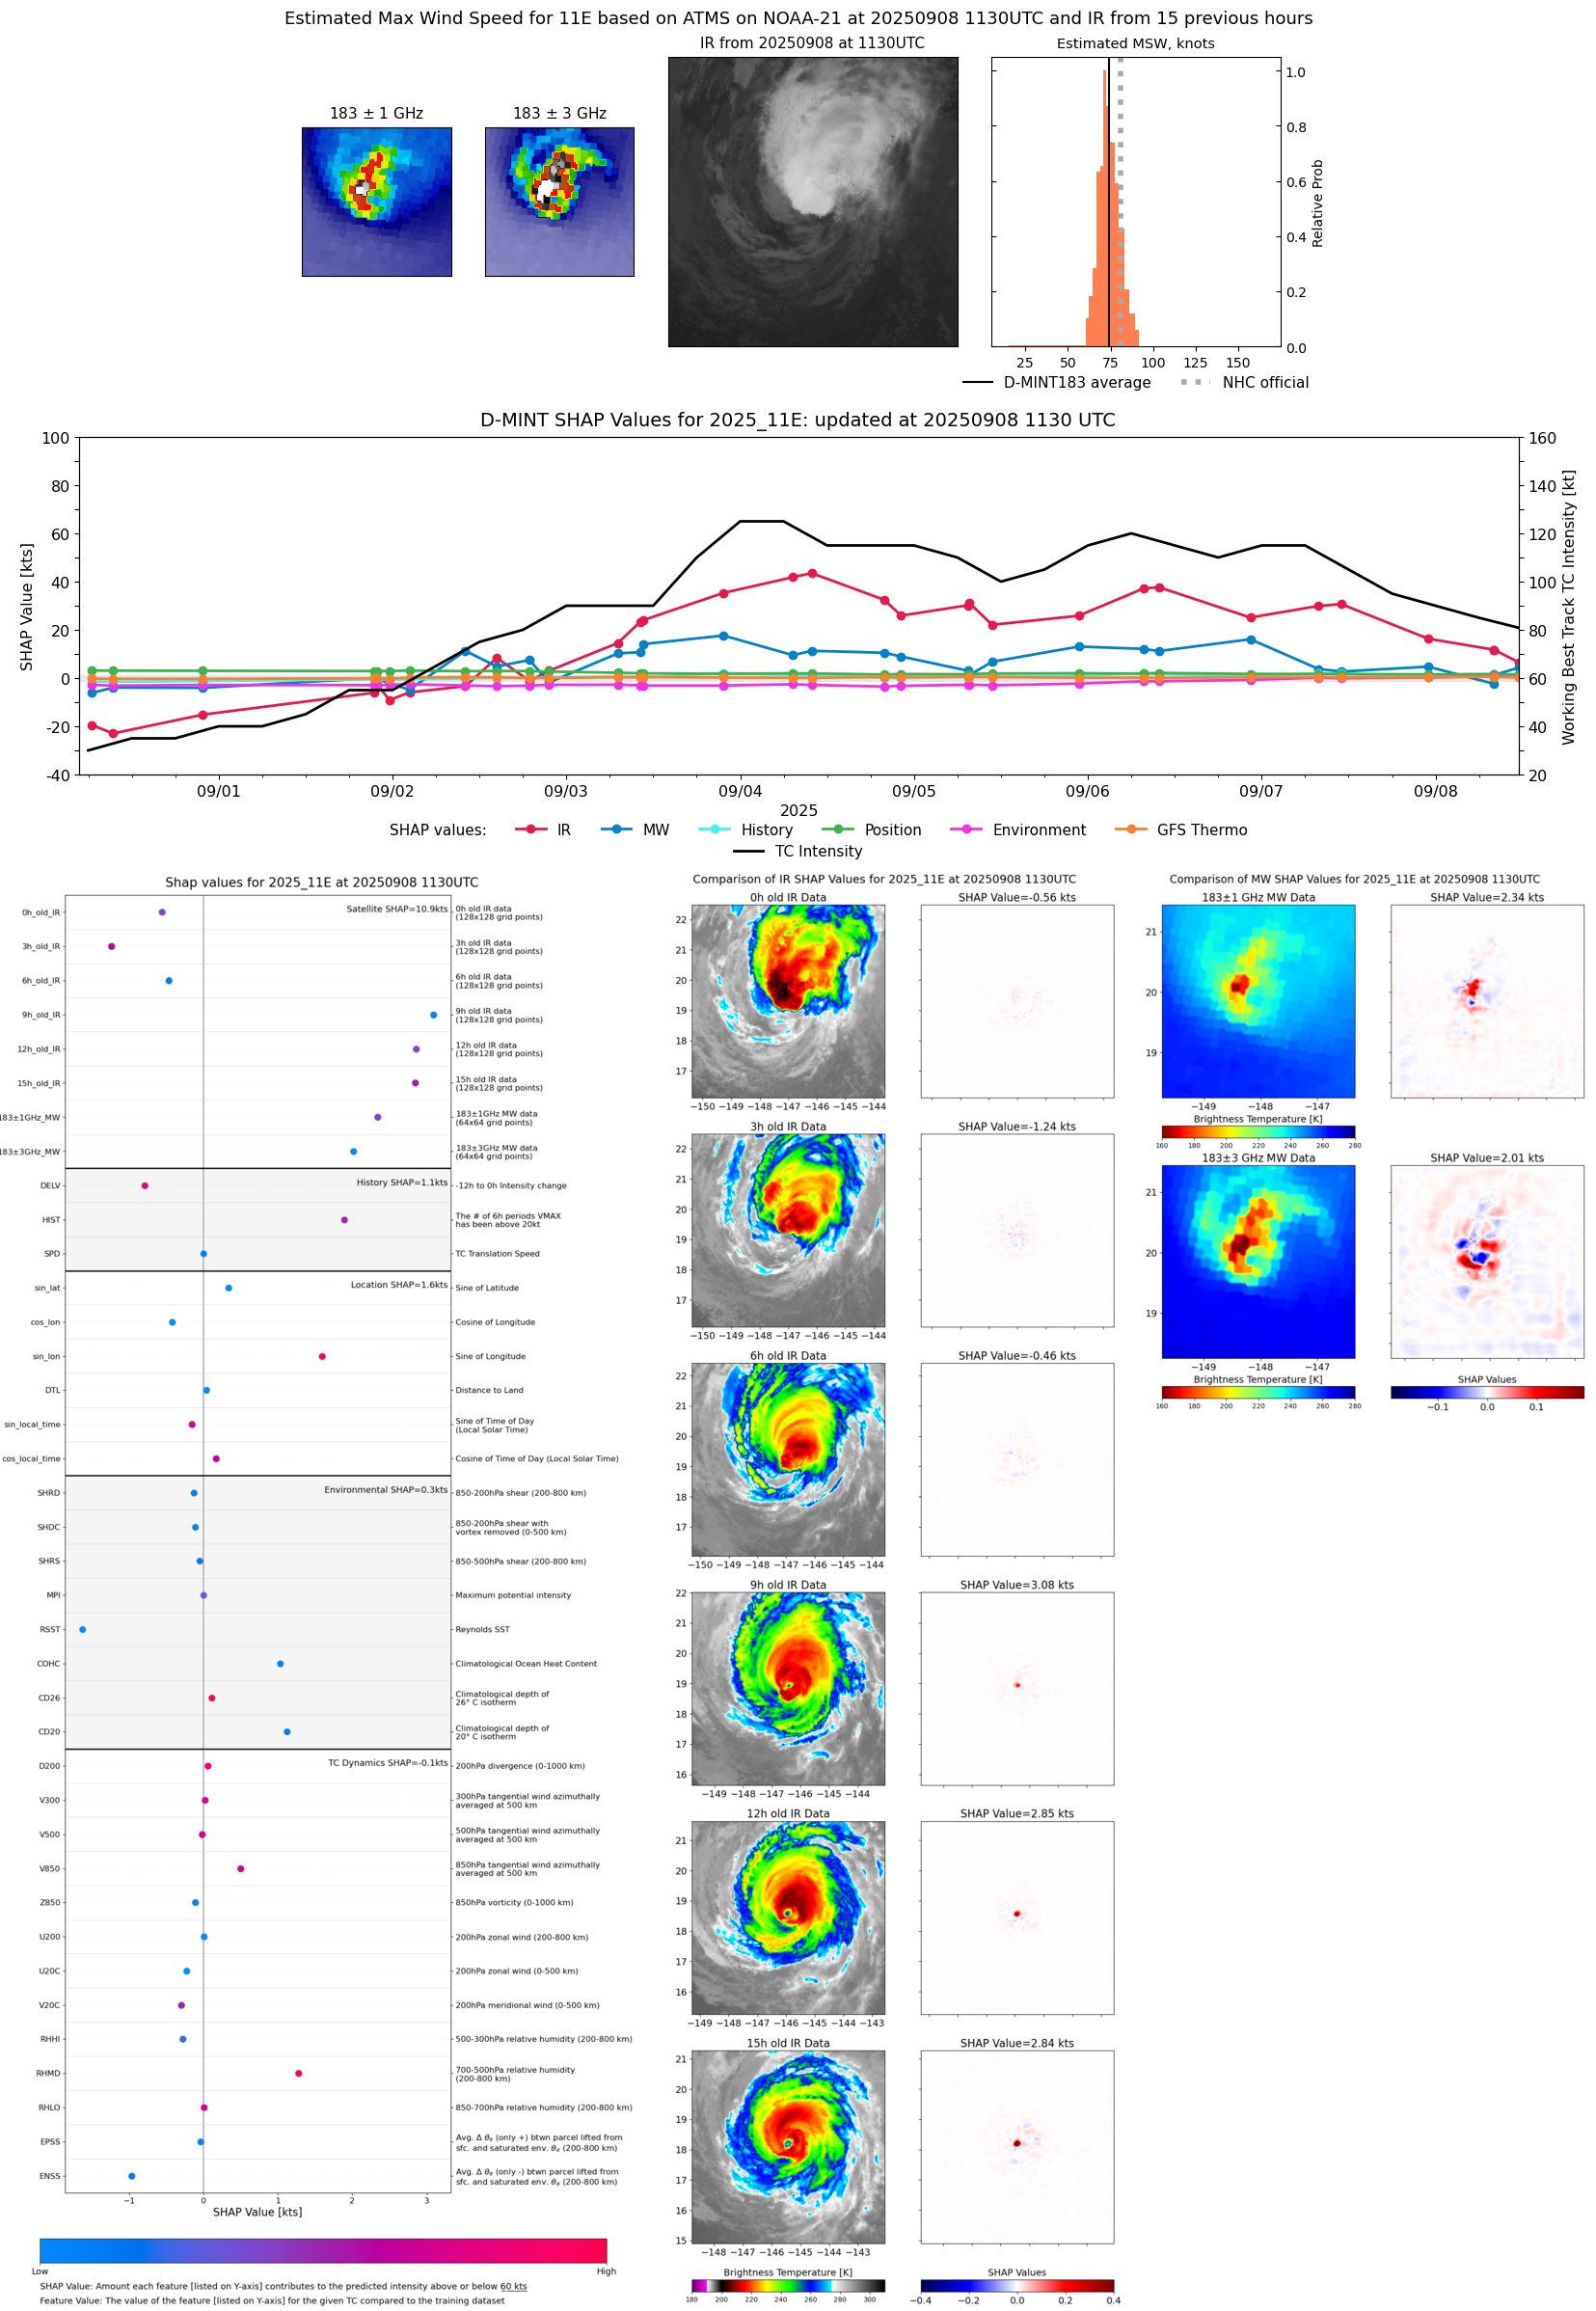 |
| 20250908 | 0802 UTC | AWS | 978 hPa | 78 kts | 73 kts | 82 kts |  |
| 20250908 | 0802 UTC | AWS | NaN hPa | 0 kts | 0 kts | 0 kts |  |
| 20250908 | 0759 UTC | TMS02 | 982 hPa | 74 kts | 69 kts | 78 kts |  |
| 20250908 | 0433 UTC | SSMISF16 | 984 hPa | 84 kts | 78 kts | 90 kts | 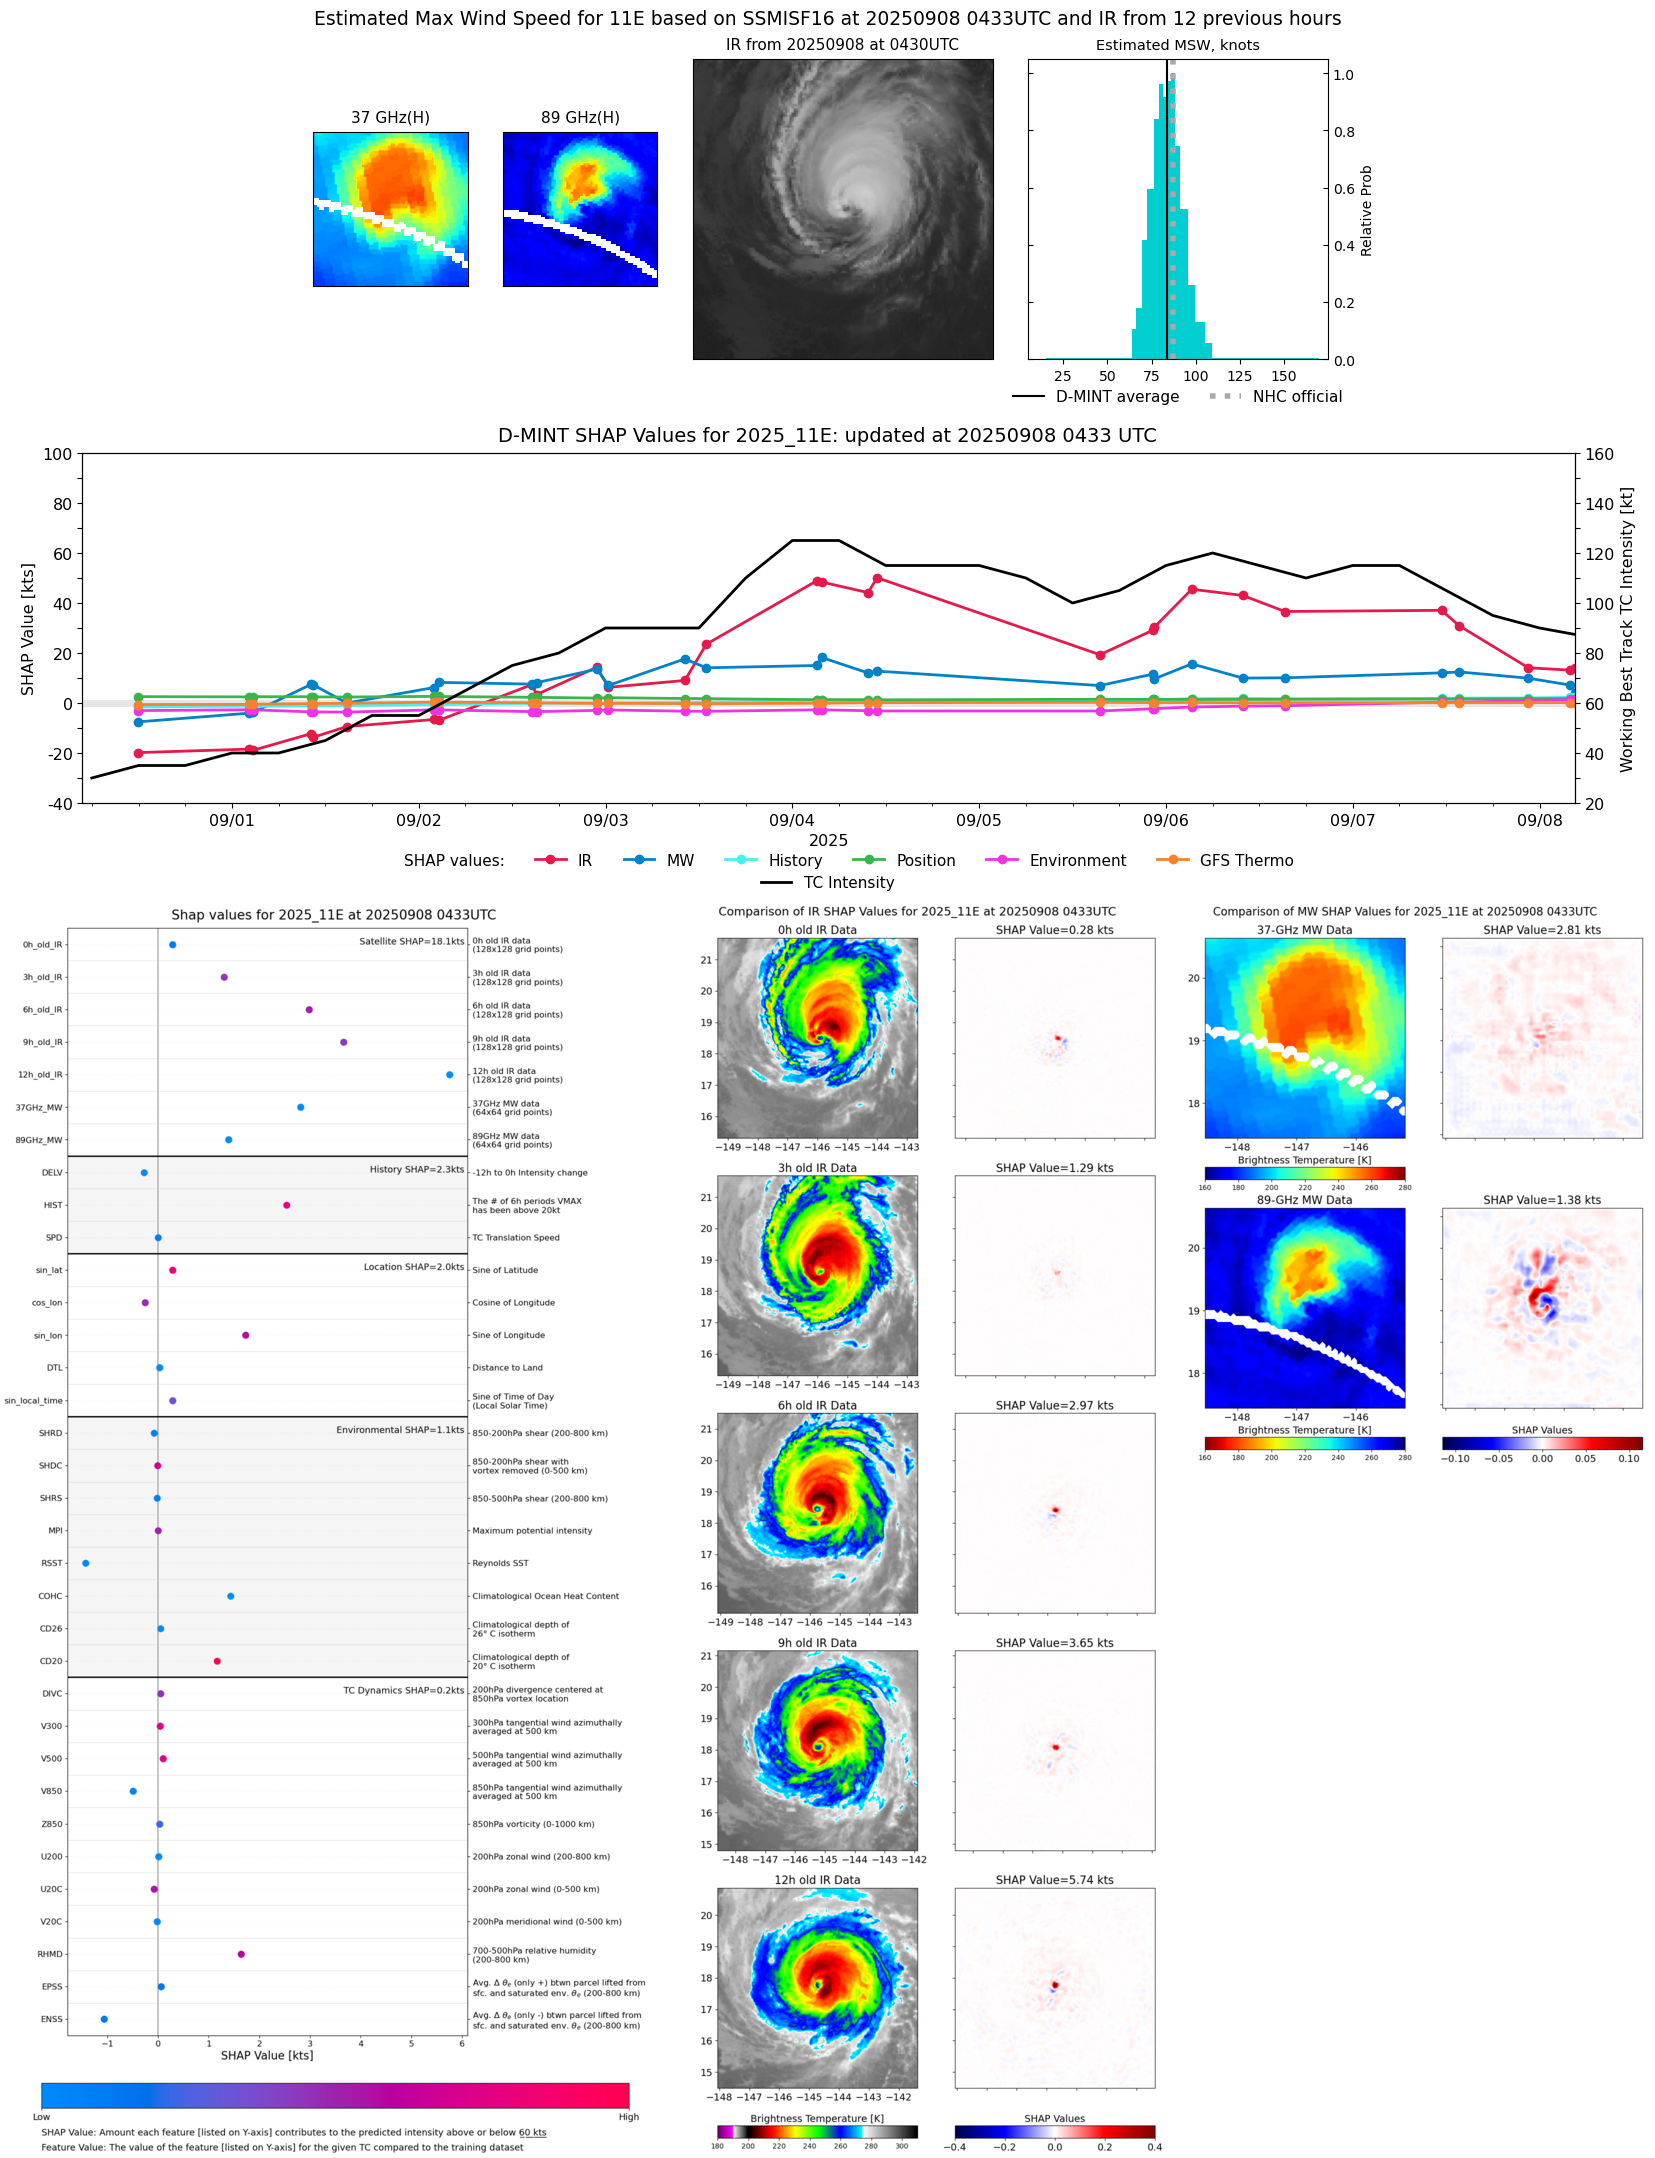 |
| 20250908 | 0357 UTC | WSFM01 | 979 hPa | 84 kts | 78 kts | 89 kts | 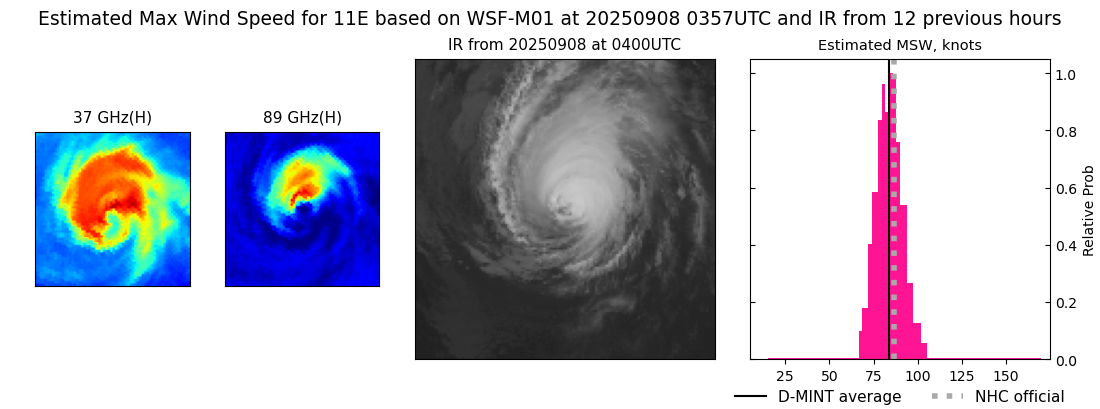 |
| 20250908 | 0356 UTC | SSMISF17 | 978 hPa | 86 kts | 80 kts | 92 kts | 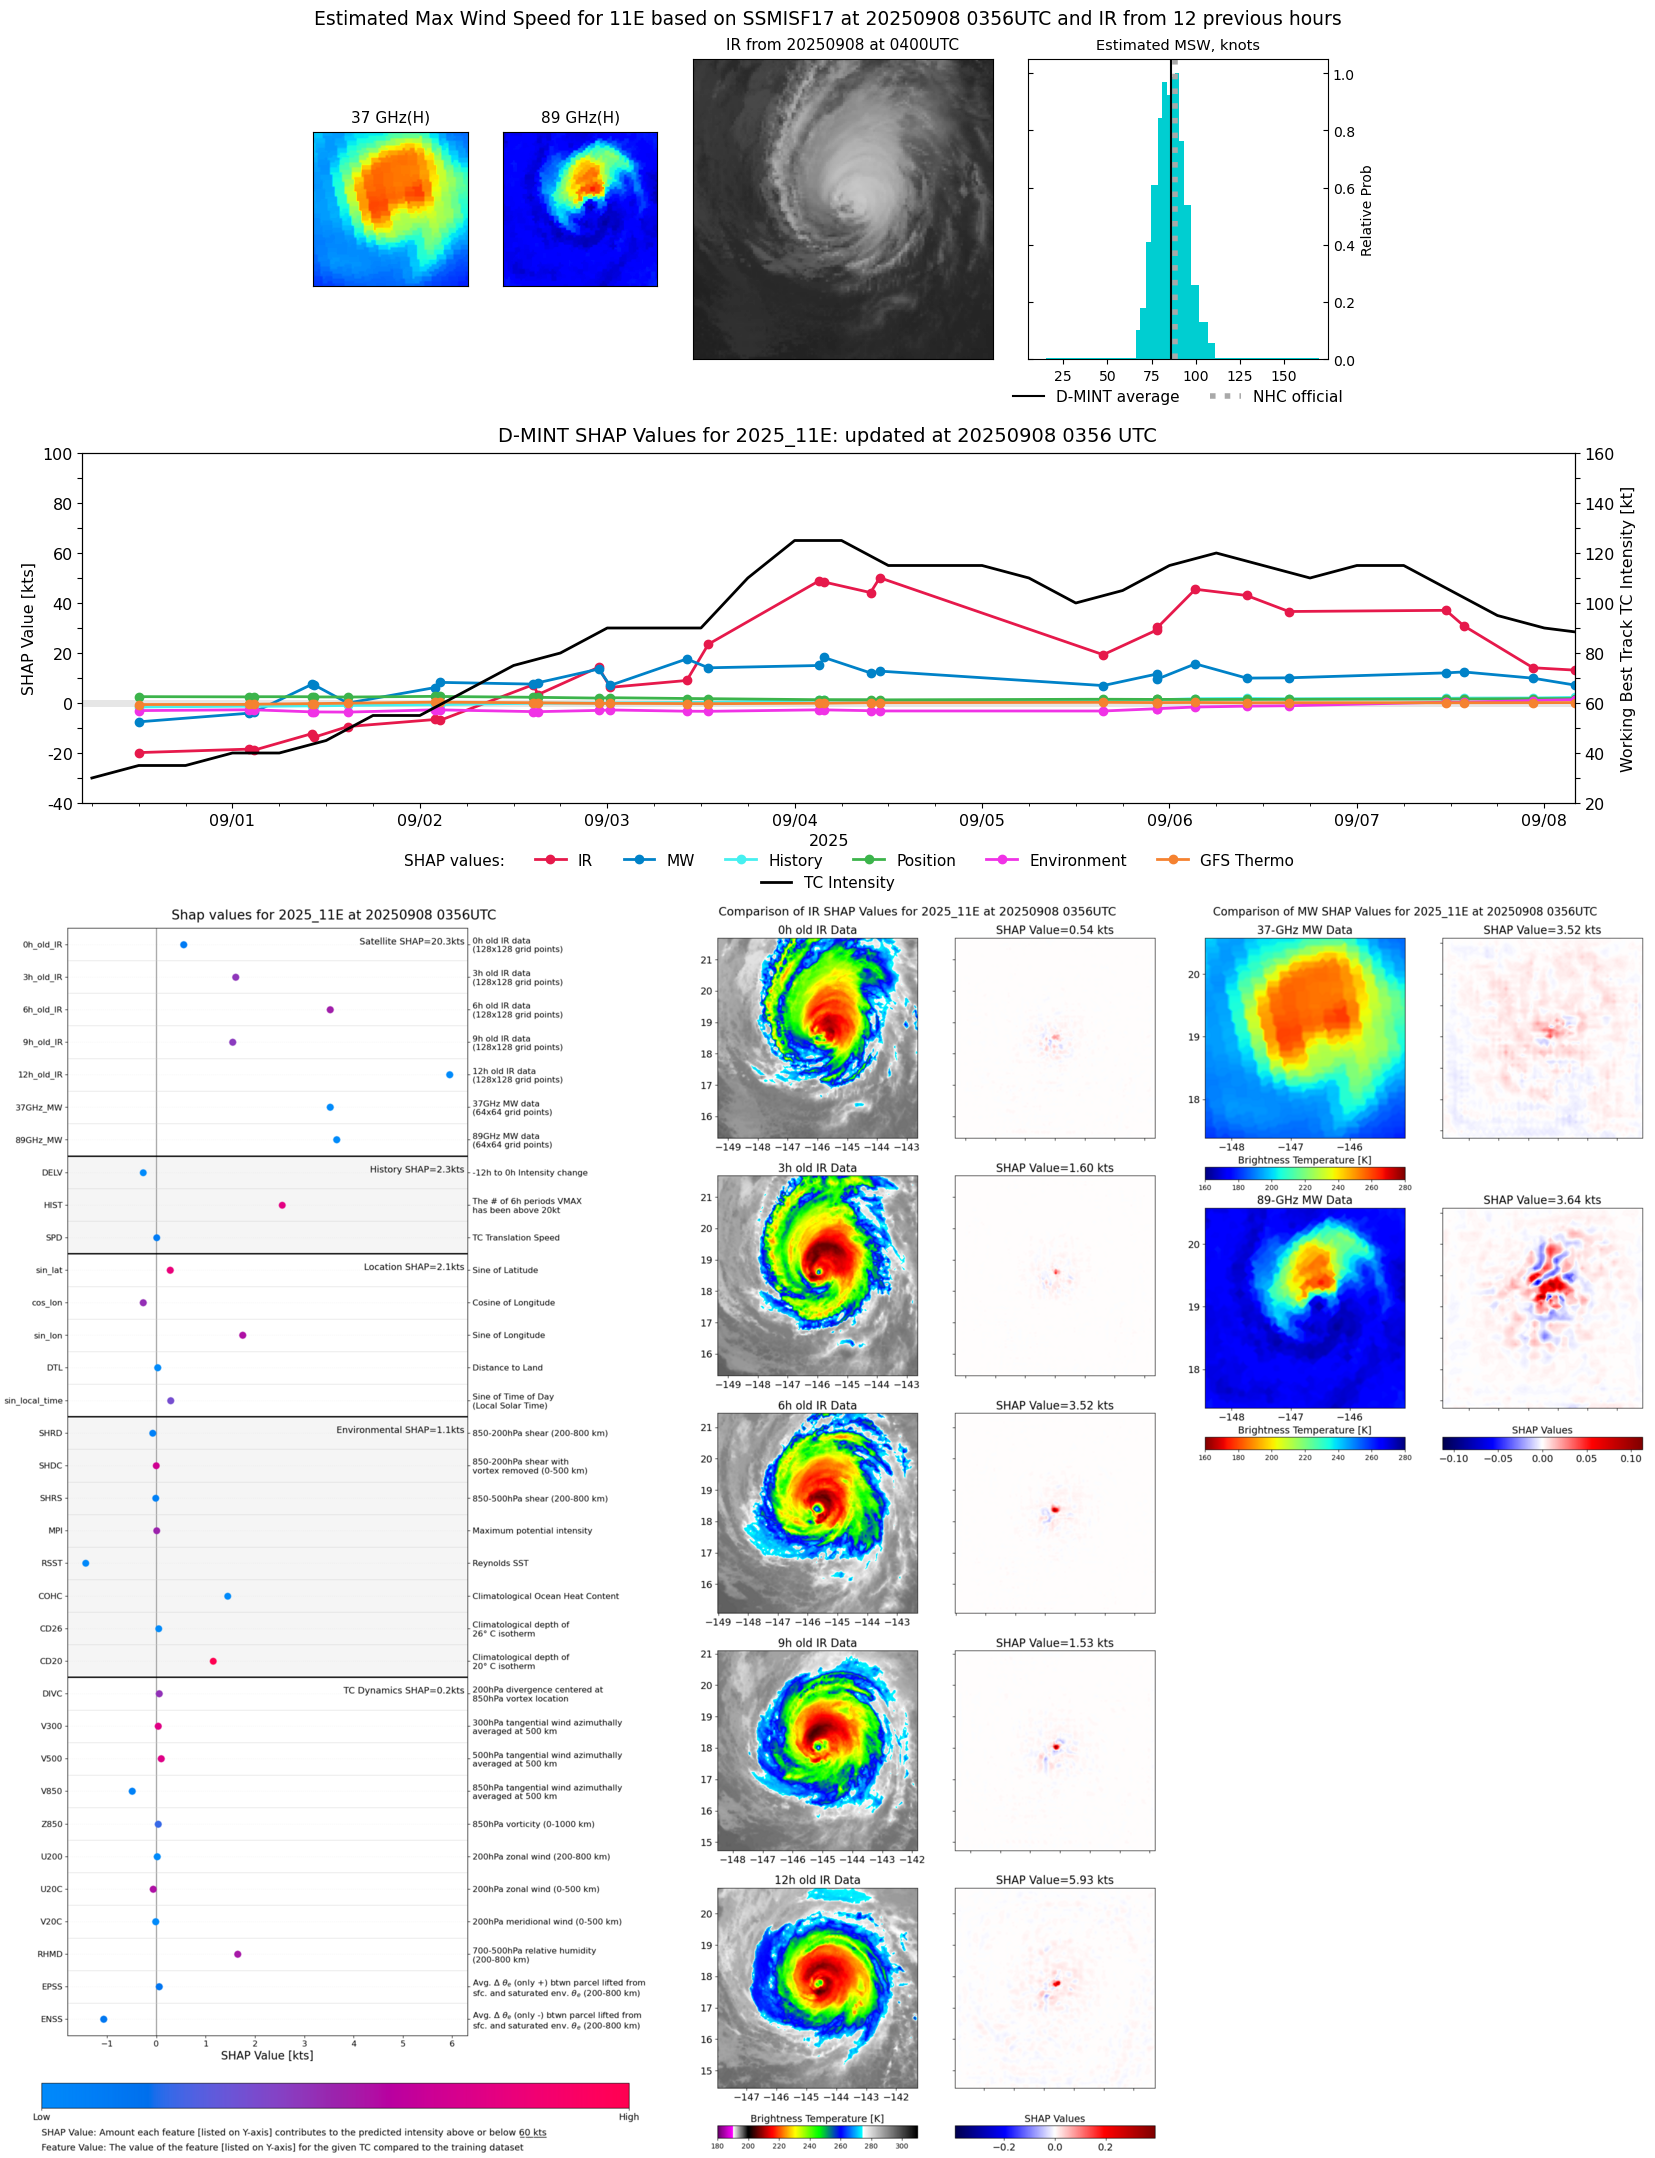 |
| 20250908 | 0115 UTC | TROPICS03 | 975 hPa | 77 kts | 73 kts | 80 kts |  |
| 20250907 | 2259 UTC | ATMS-N21 | 975 hPa | 83 kts | 80 kts | 87 kts | 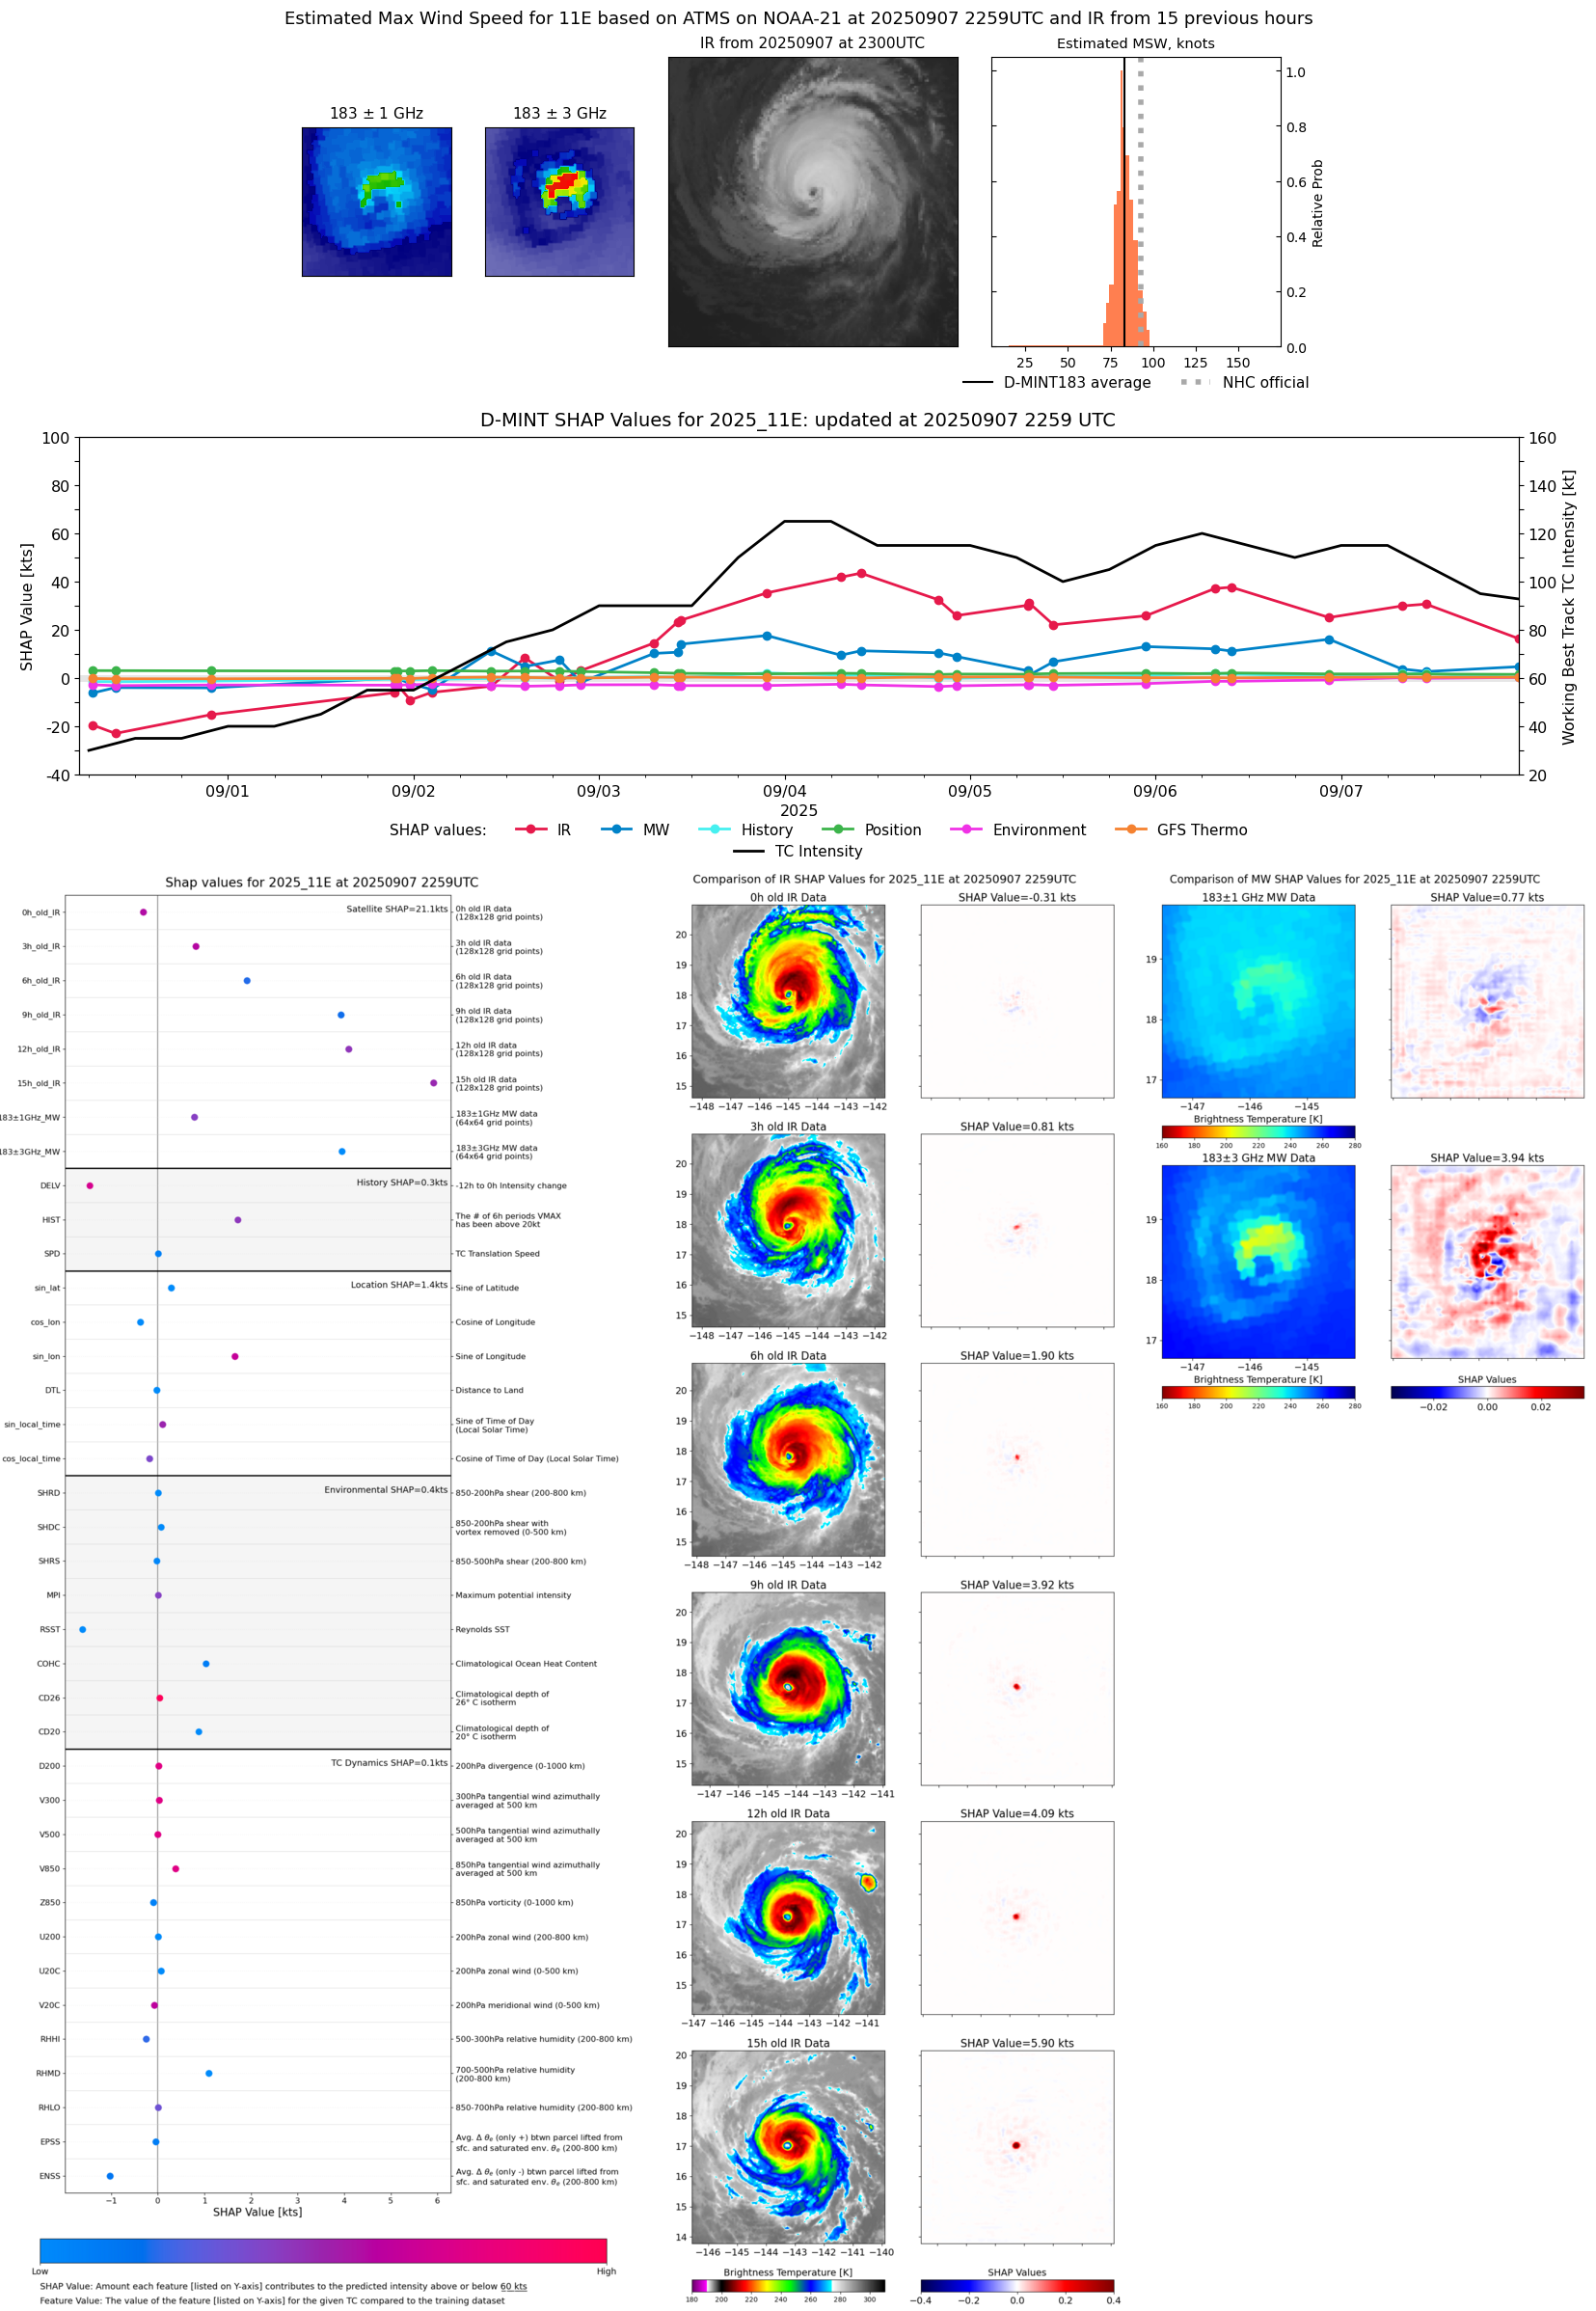 |
| 20250907 | 2233 UTC | GMI | 976 hPa | 89 kts | 83 kts | 94 kts |  |
| 20250907 | 1341 UTC | SSMISF18 | 960 hPa | 107 kts | 101 kts | 113 kts | 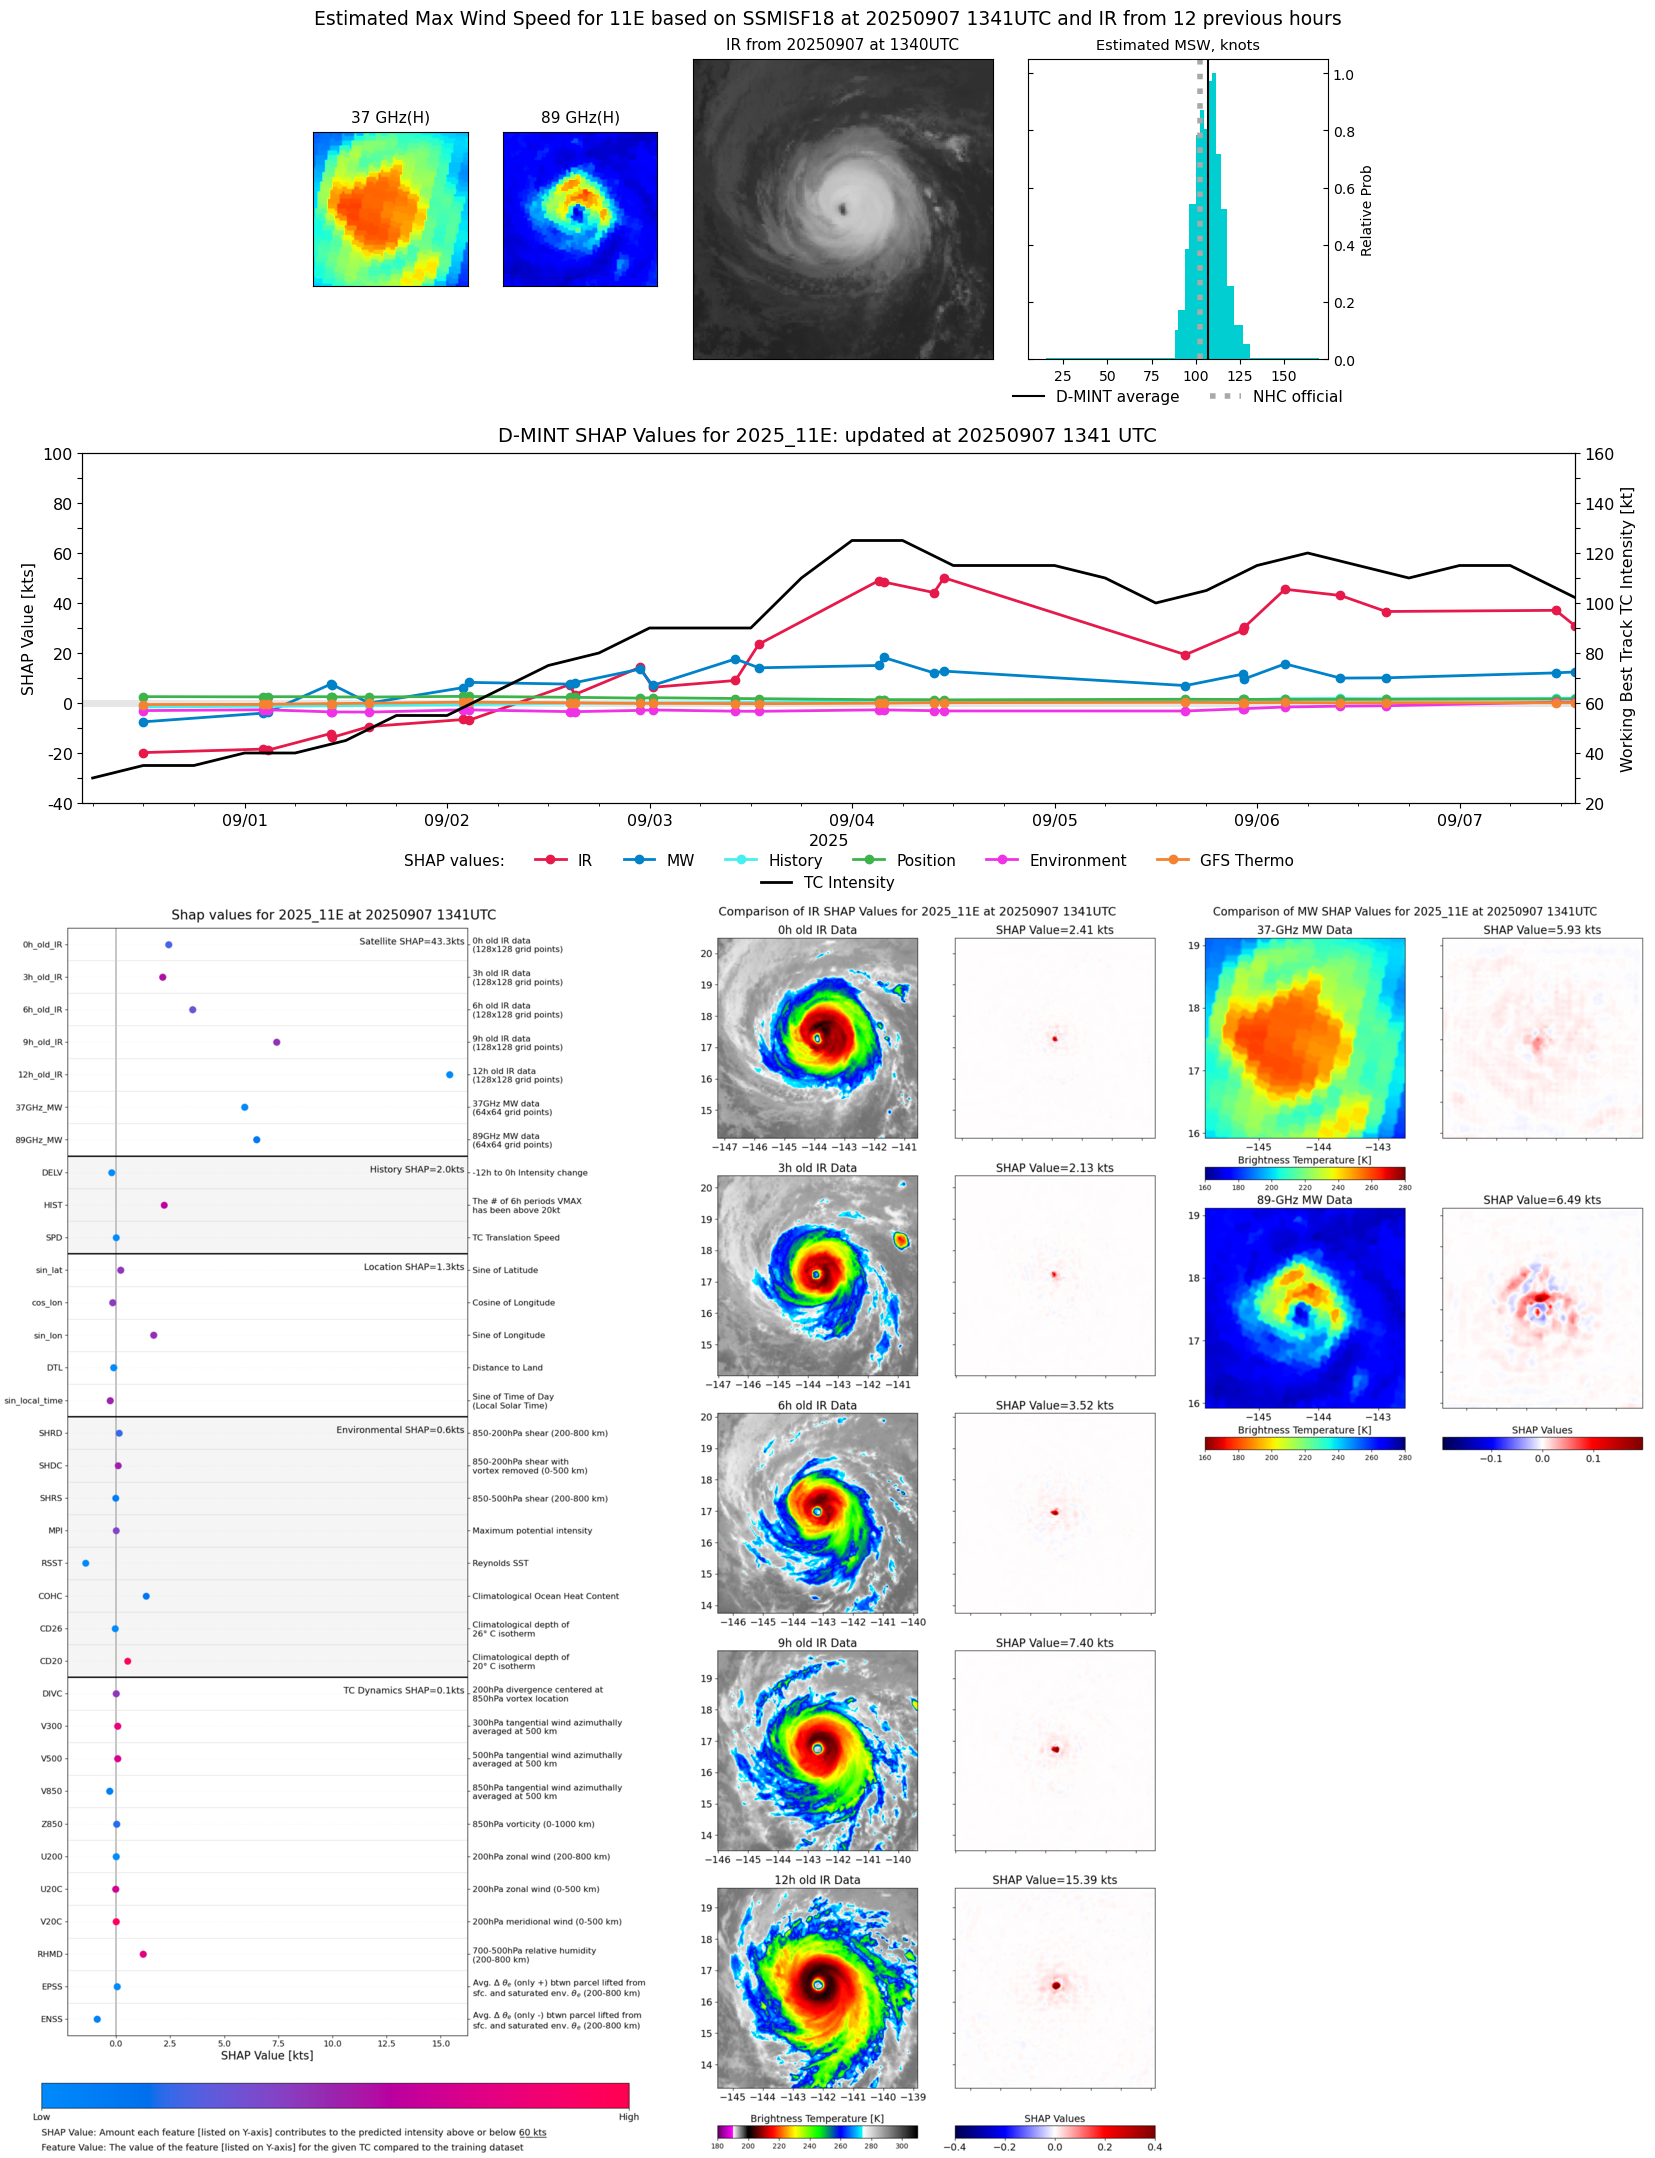 |
| 20250907 | 1124 UTC | AMSR2 | 960 hPa | 113 kts | 107 kts | 118 kts | 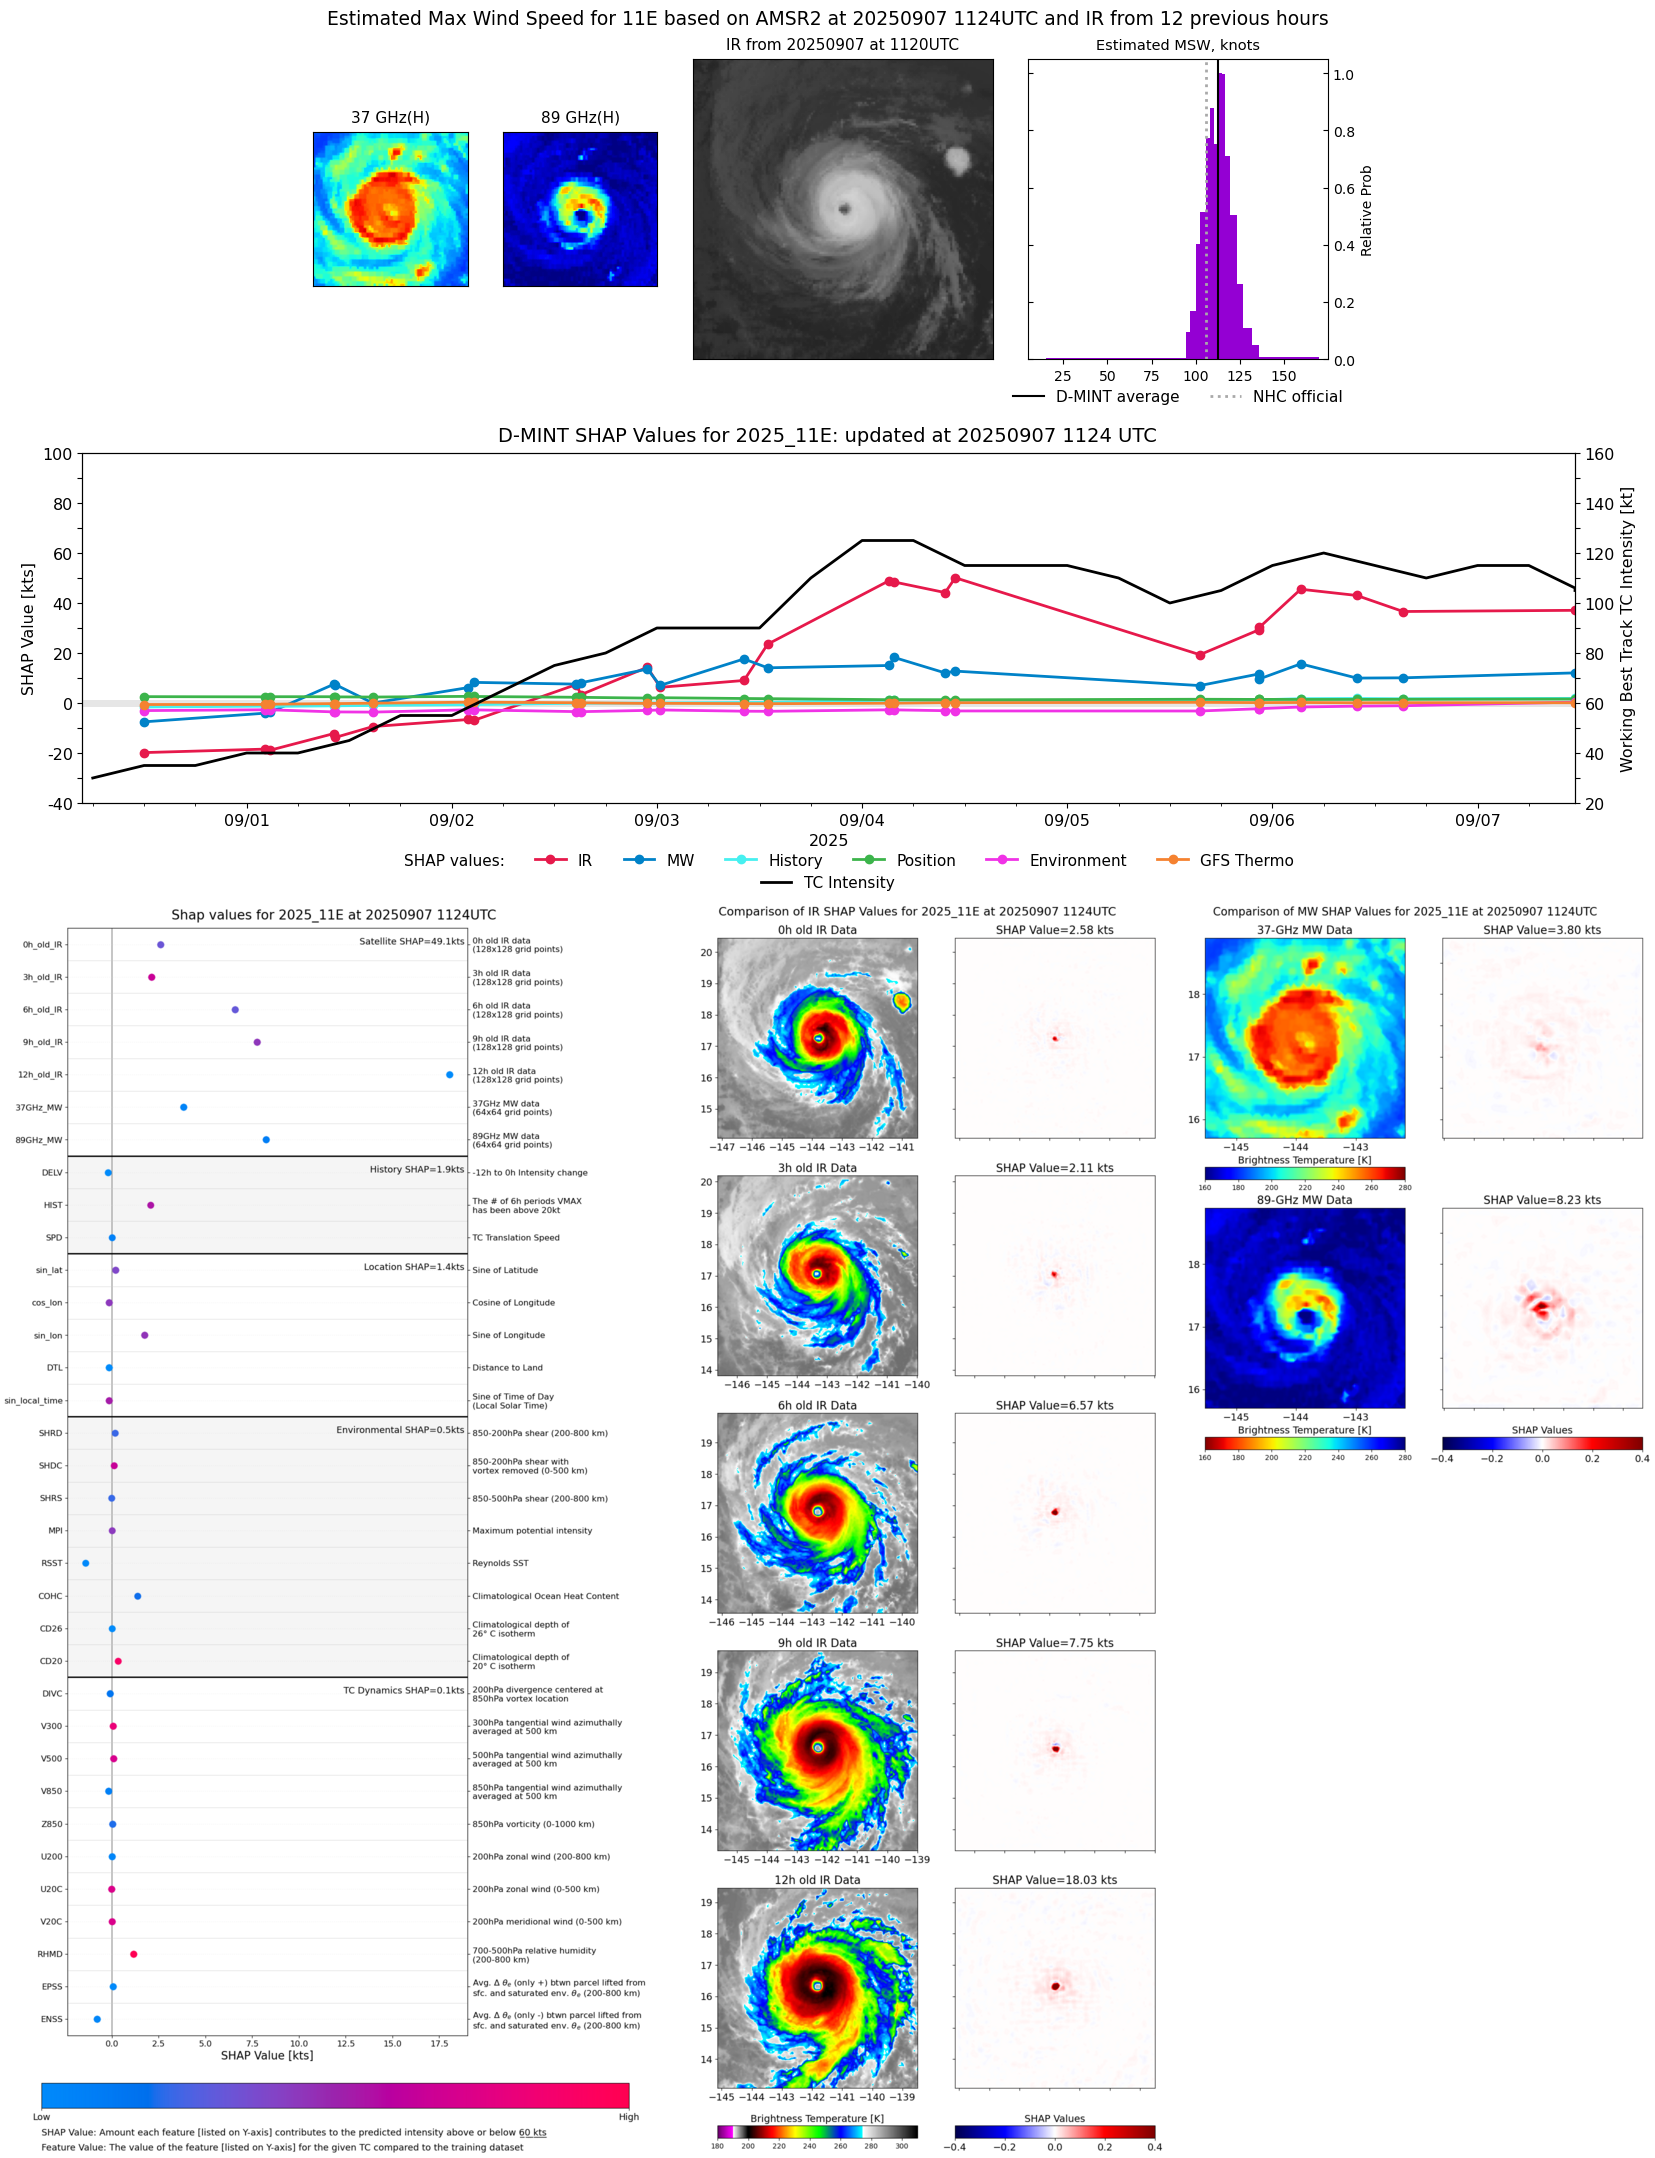 |
| 20250907 | 1058 UTC | ATMS-N20 | 966 hPa | 97 kts | 93 kts | 101 kts |  |
| 20250907 | 0750 UTC | AWS | 966 hPa | 97 kts | 93 kts | 102 kts |  |
| 20250907 | 0750 UTC | AWS | NaN hPa | 0 kts | 0 kts | 0 kts | 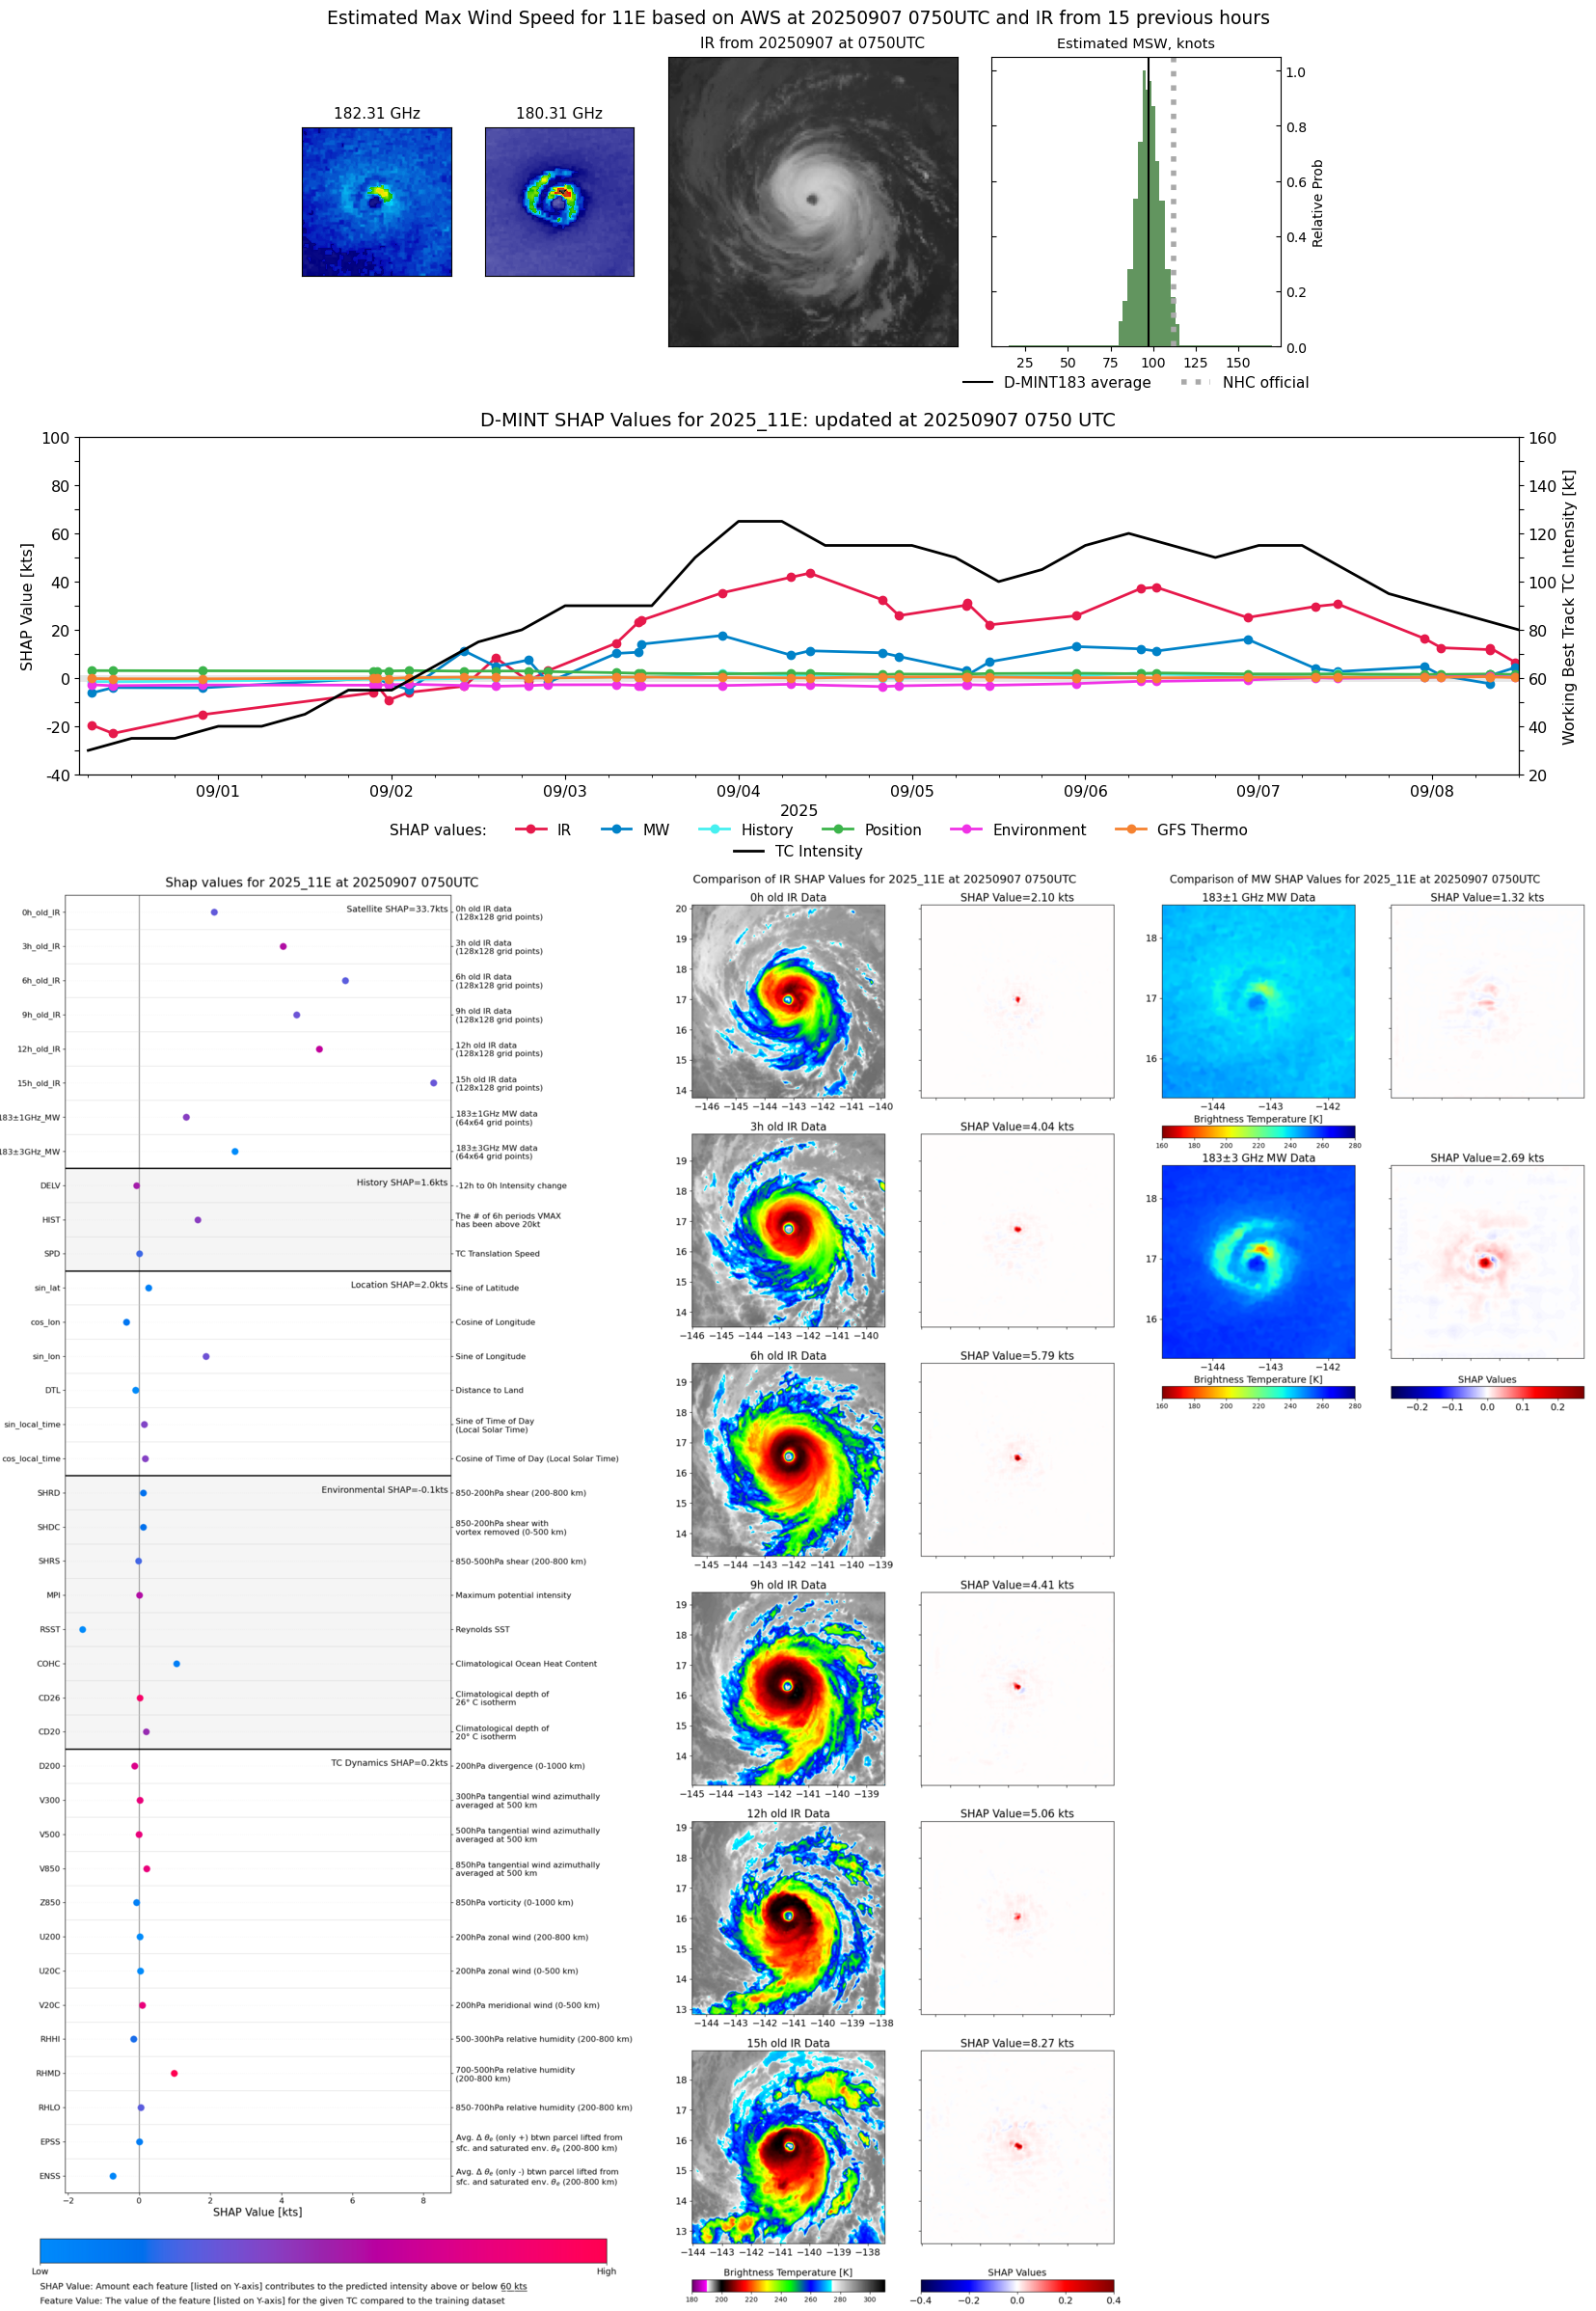 |
| 20250907 | 0108 UTC | SSMISF18 | 963 hPa | 112 kts | 104 kts | 119 kts |  |
| 20250906 | 2226 UTC | ATMS-N20 | 961 hPa | 103 kts | 98 kts | 109 kts | 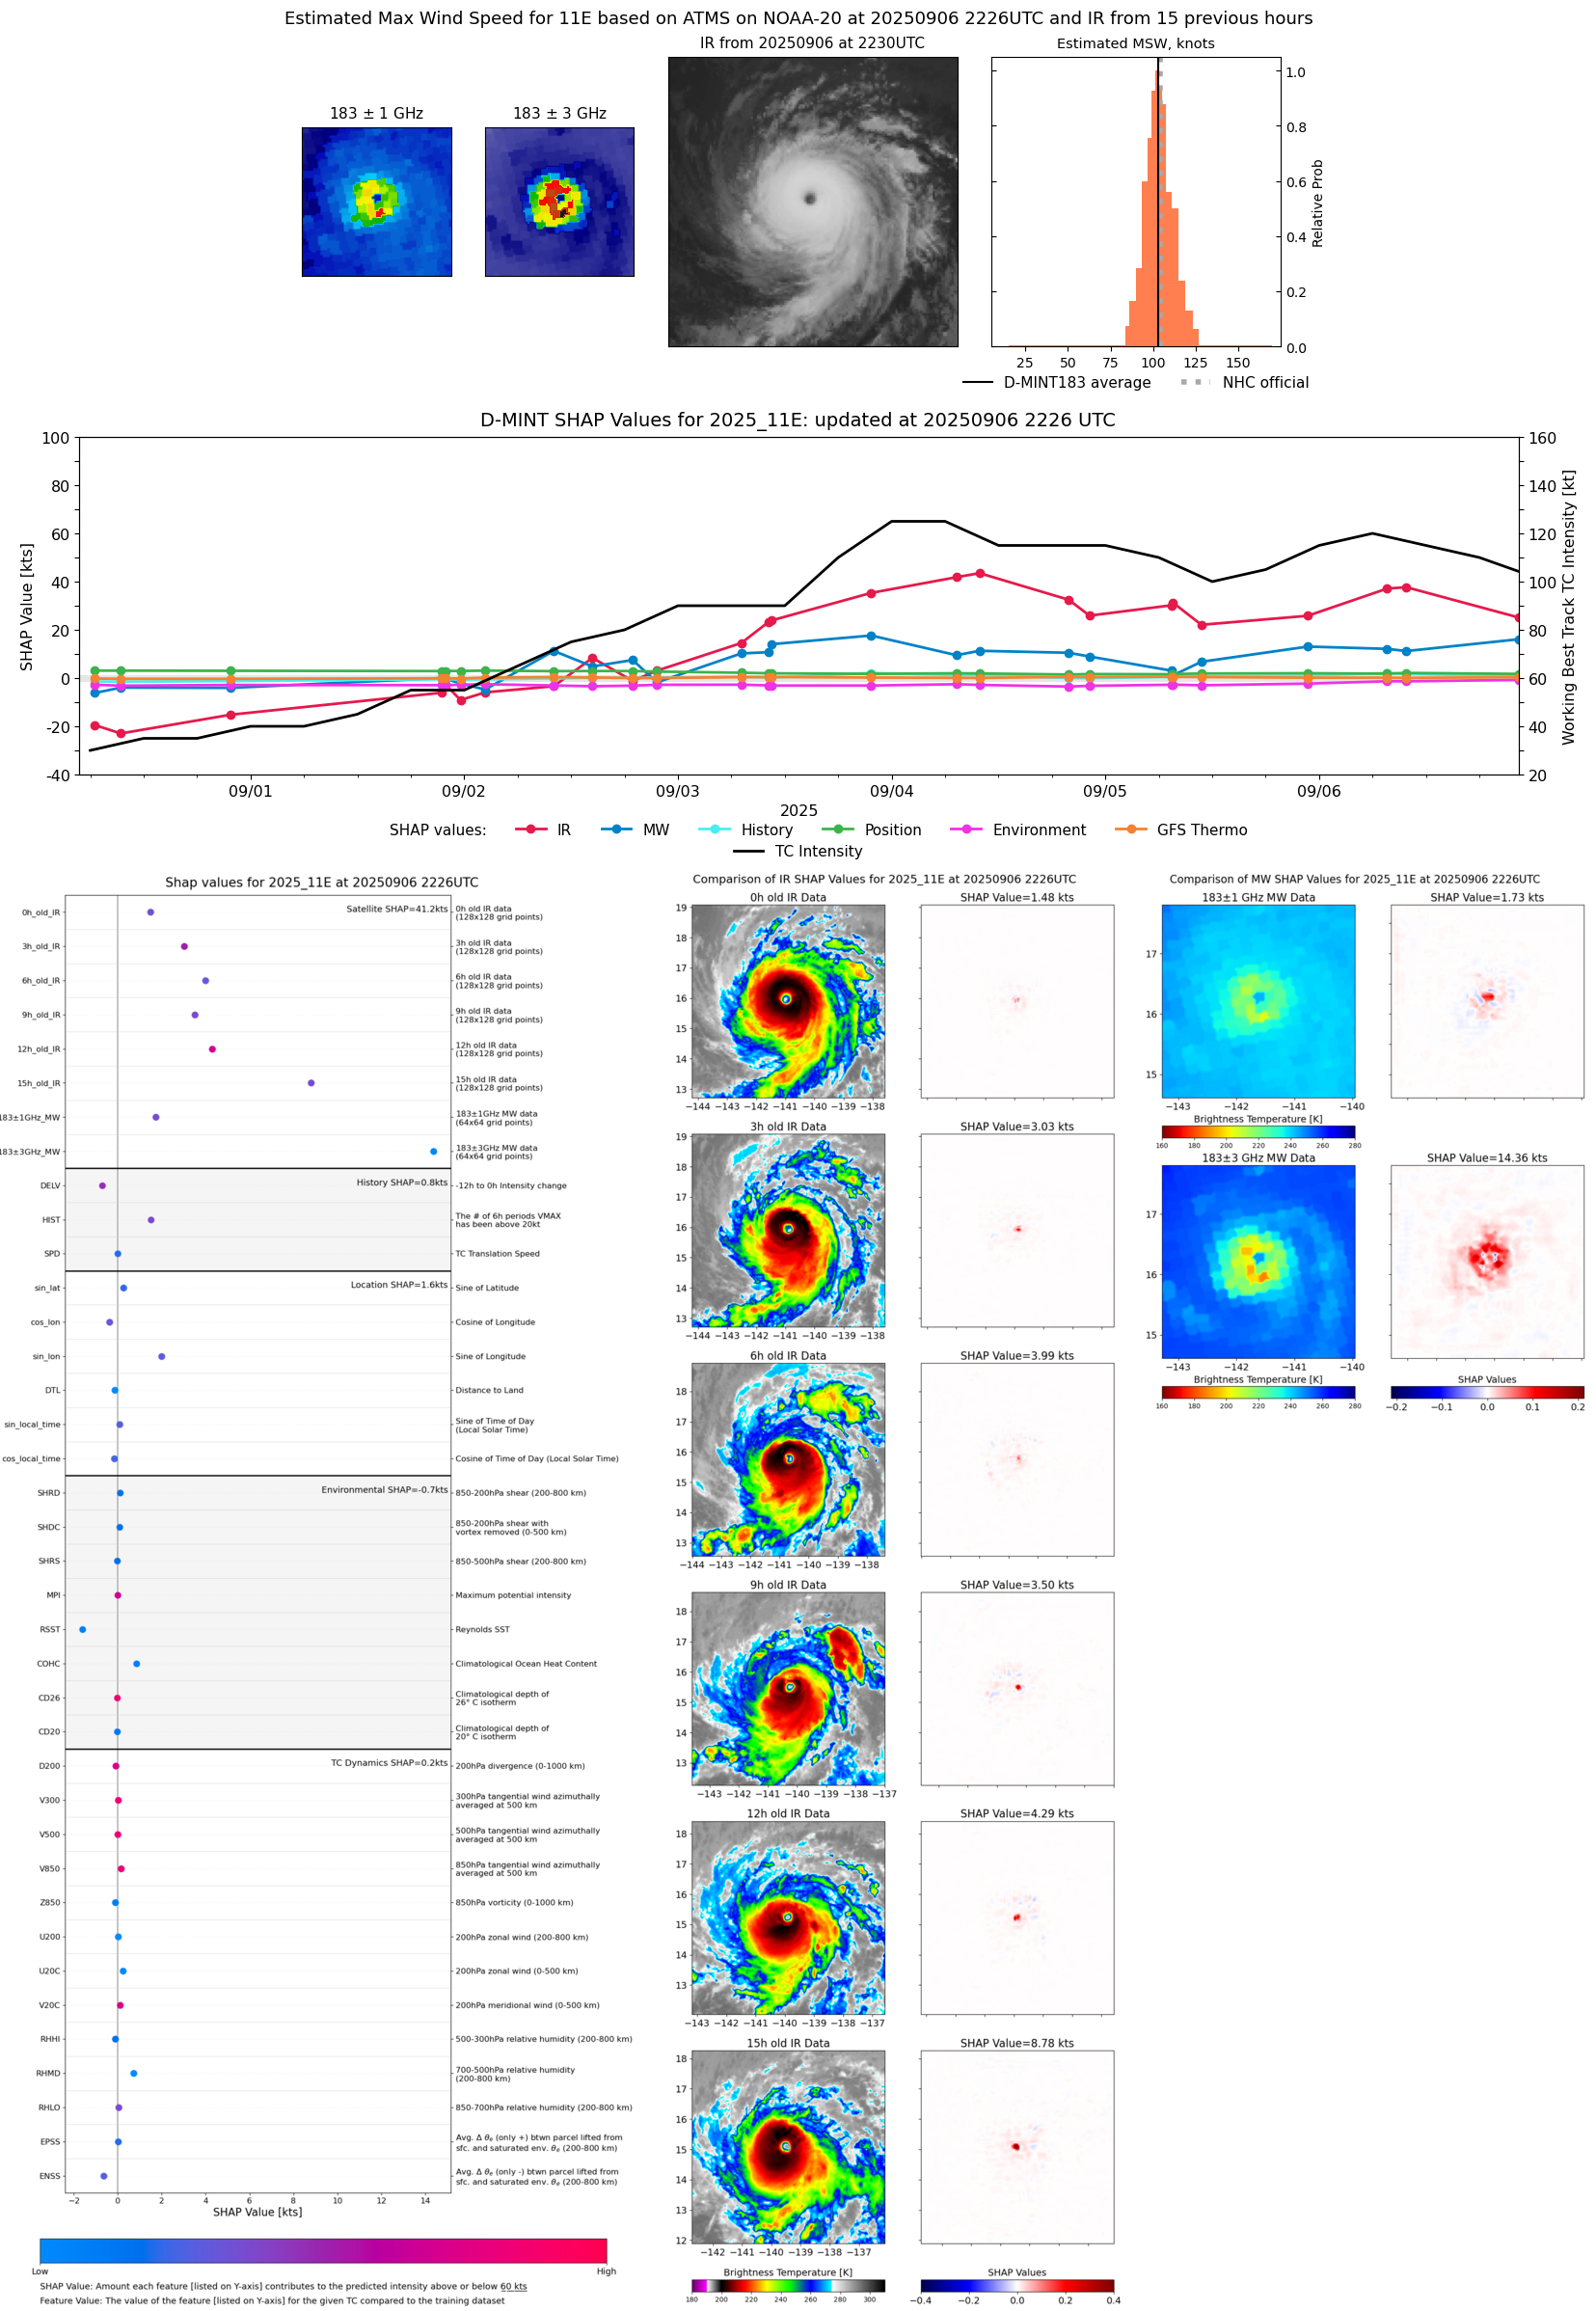 |
| 20250906 | 1945 UTC | TMS05 | 965 hPa | 97 kts | 92 kts | 103 kts | 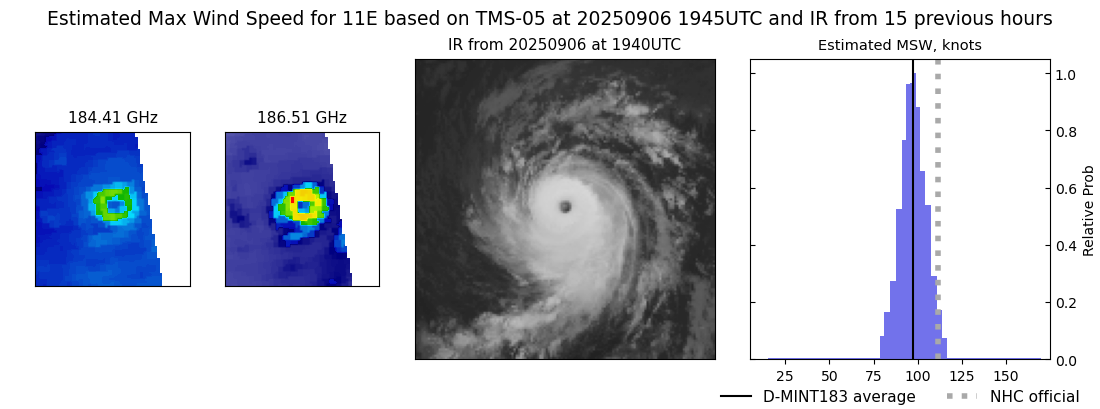 |
| 20250906 | 1527 UTC | WSFM01 | 962 hPa | 108 kts | 102 kts | 115 kts | 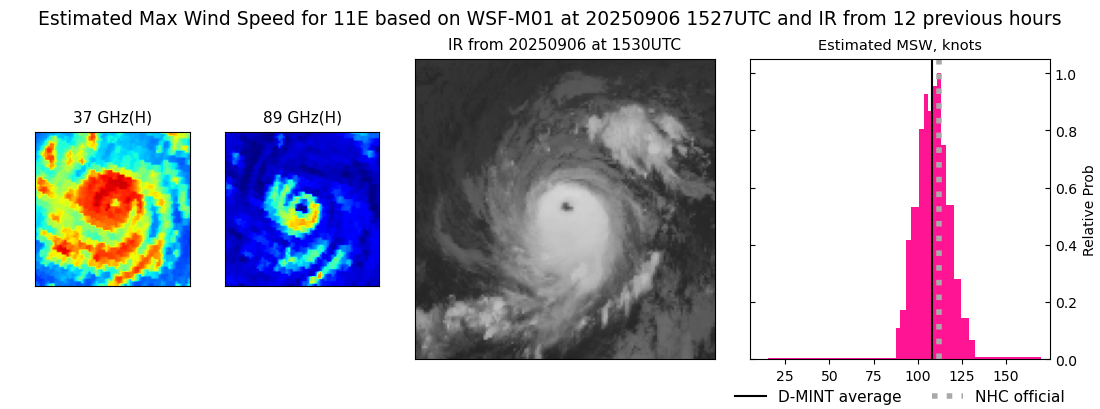 |
| 20250906 | 1527 UTC | WSFM01 | 956 hPa | 109 kts | 103 kts | 115 kts | 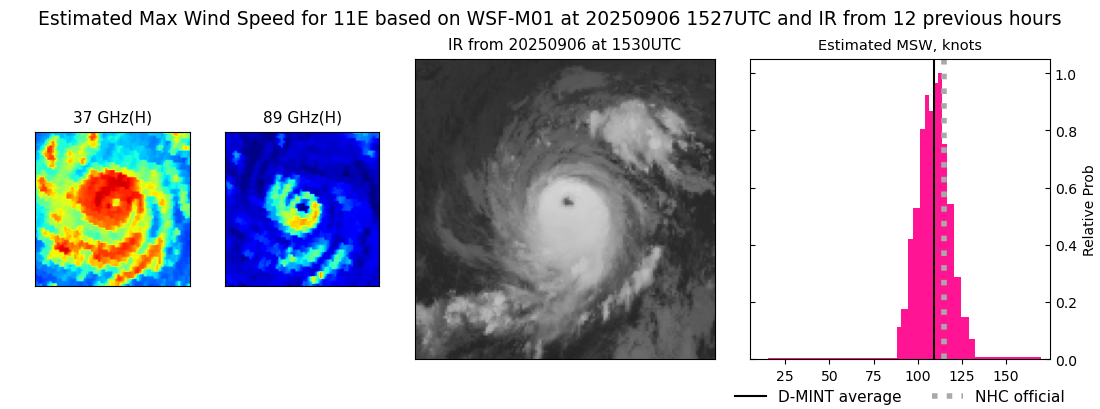 |
| 20250906 | 1517 UTC | SSMISF17 | 961 hPa | 109 kts | 102 kts | 115 kts |  |
| 20250906 | 1356 UTC | SSMISF18 | 955 hPa | 108 kts | 103 kts | 114 kts | 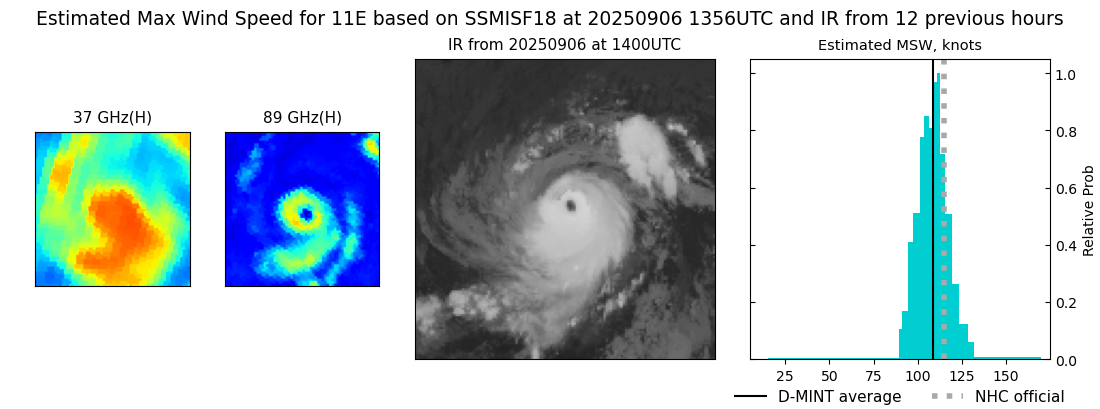 |
| 20250906 | 1042 UTC | AMSR2 | 955 hPa | 113 kts | 108 kts | 119 kts | 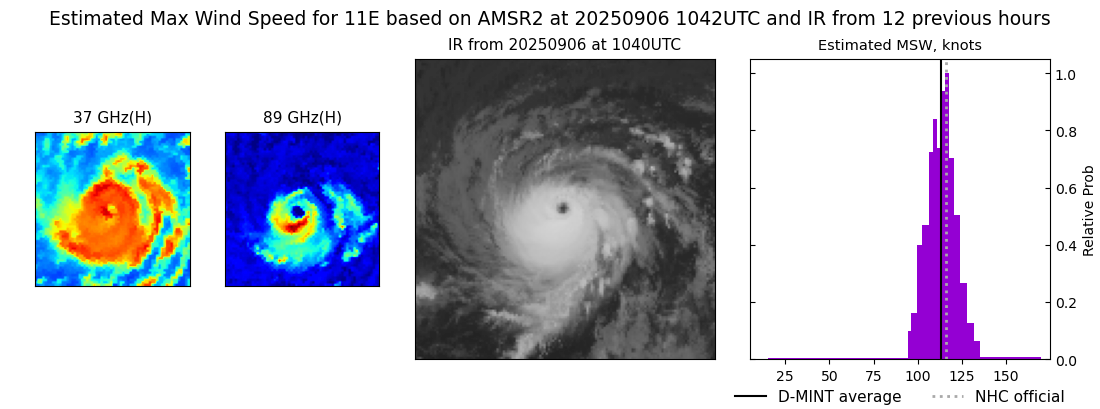 |
| 20250906 | 0953 UTC | GMI | 956 hPa | 115 kts | 109 kts | 120 kts | 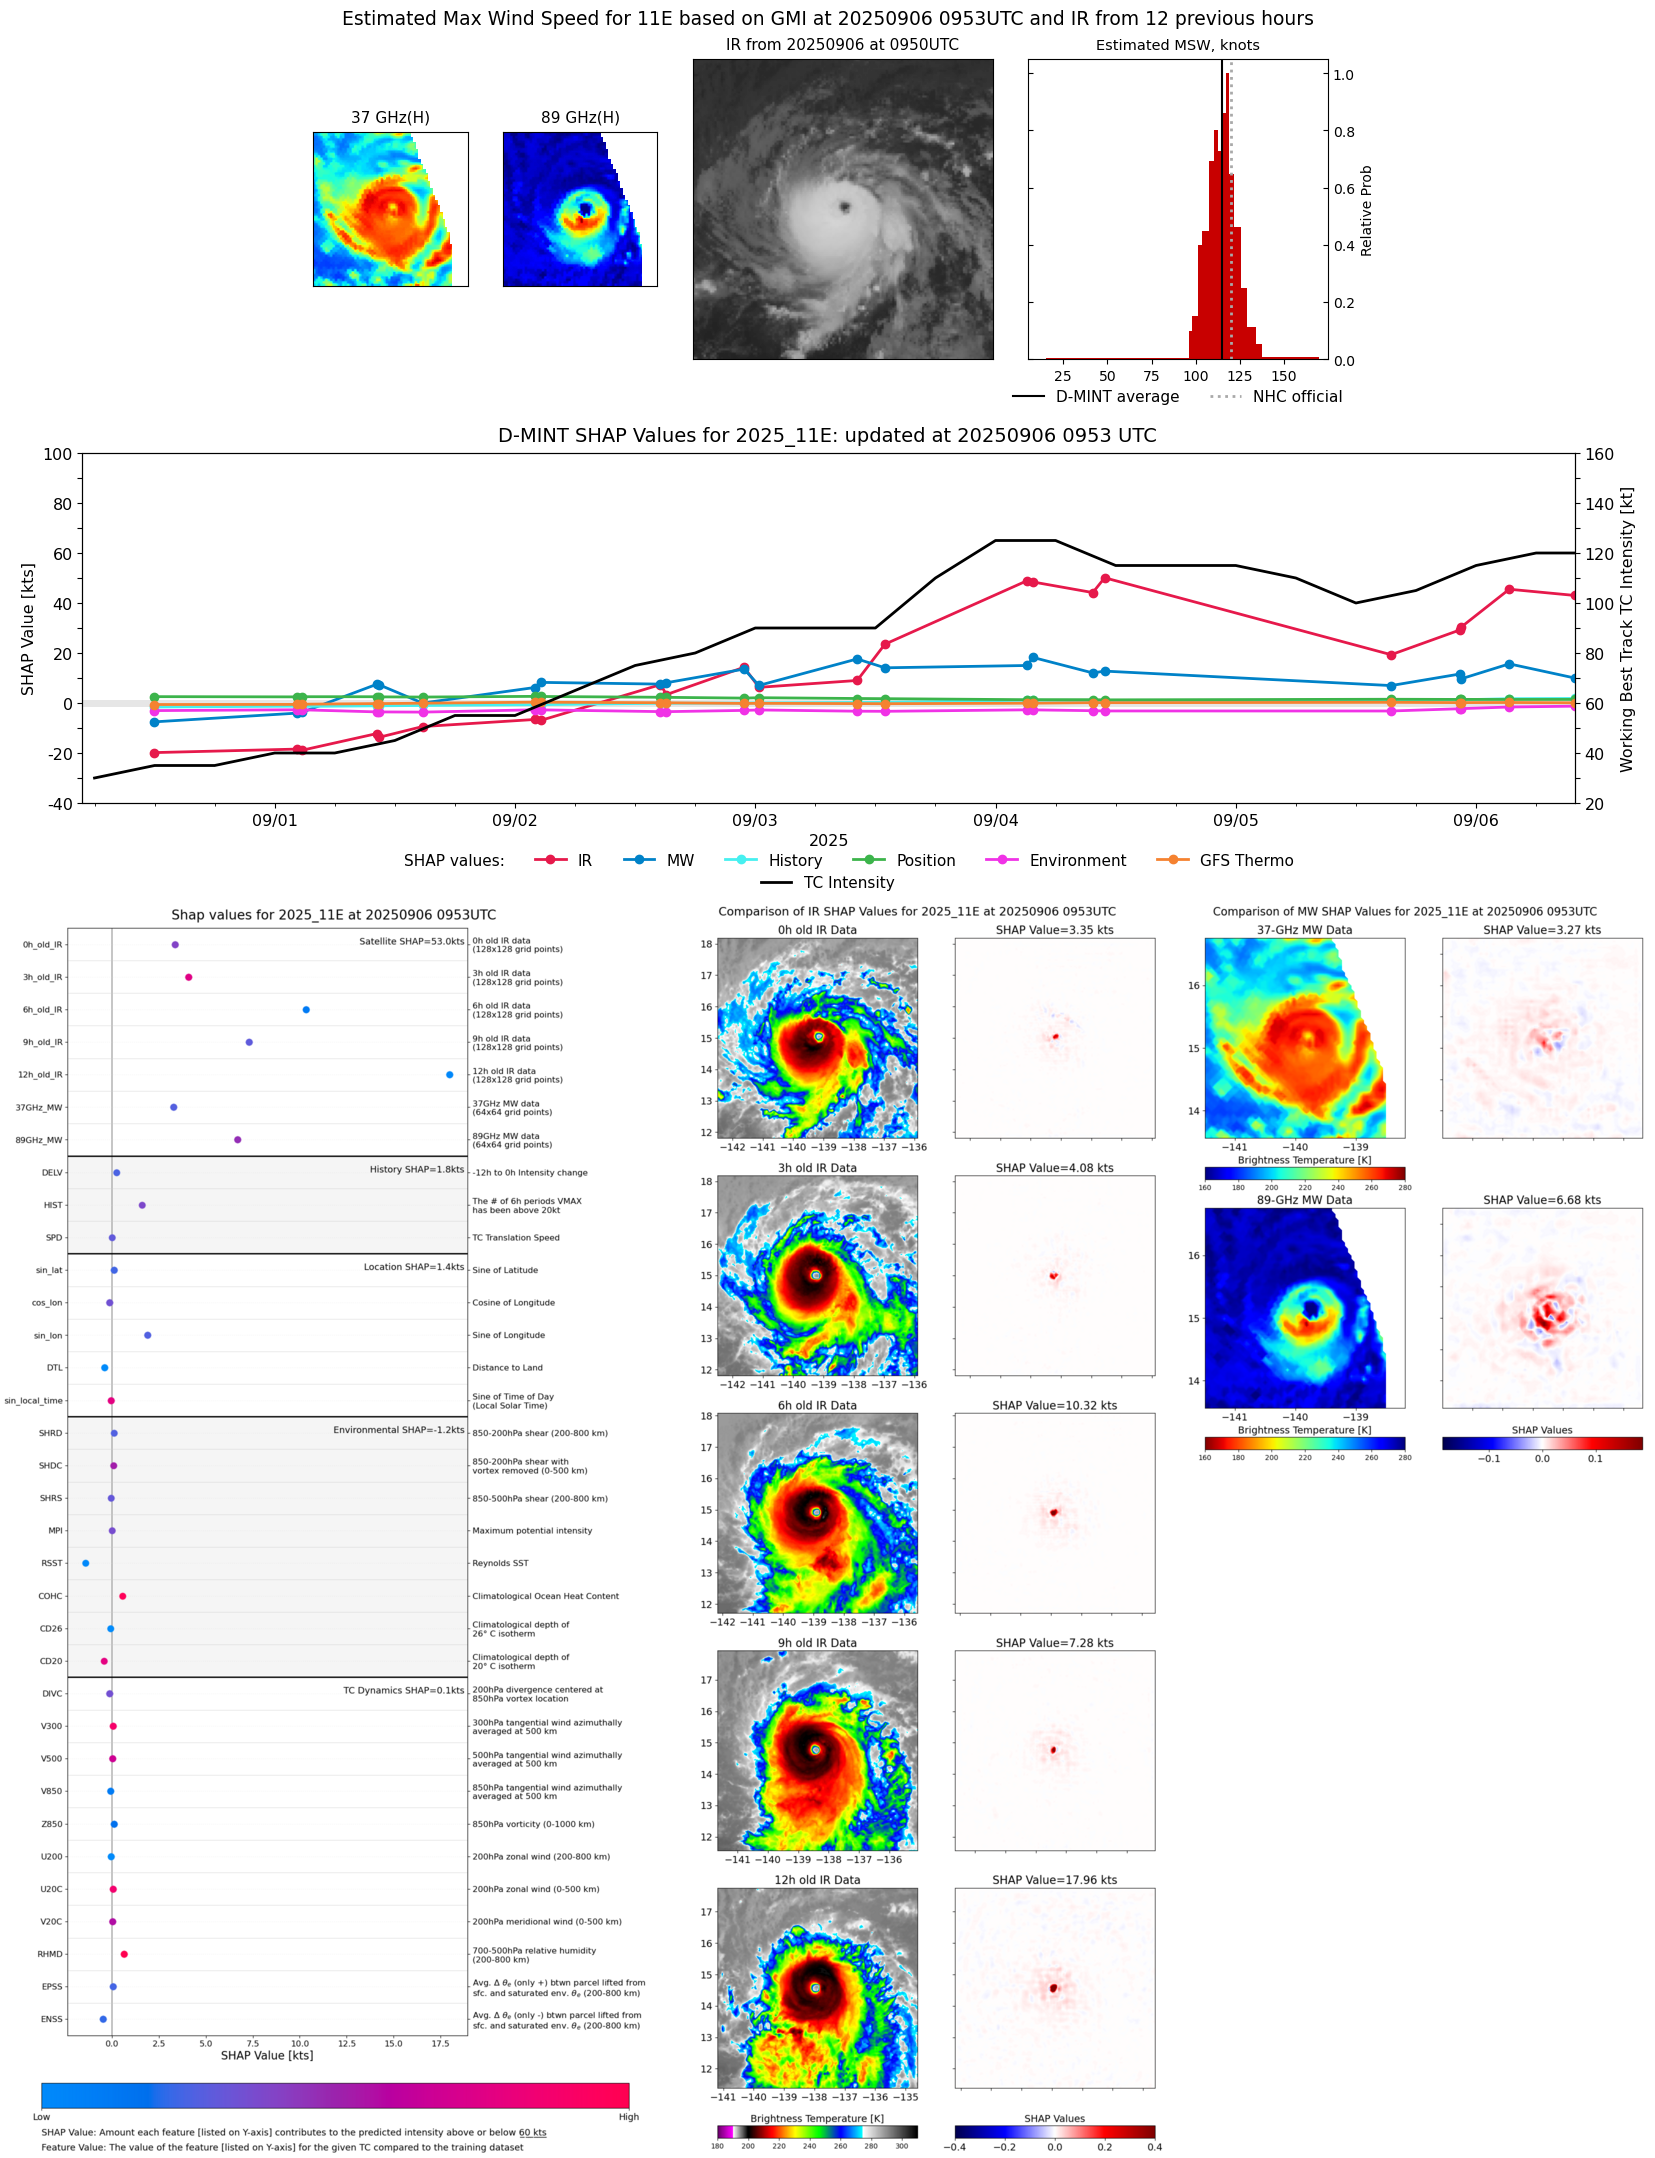 |
| 20250906 | 0948 UTC | TROPICS03 | 959 hPa | 111 kts | 106 kts | 117 kts |  |
| 20250906 | 0739 UTC | AWS | 958 hPa | 115 kts | 109 kts | 121 kts |  |
| 20250906 | 0319 UTC | SSMISF16 | 956 hPa | 123 kts | 115 kts | 130 kts |  |
| 20250906 | 0255 UTC | WSFM01 | 955 hPa | 118 kts | 112 kts | 125 kts | 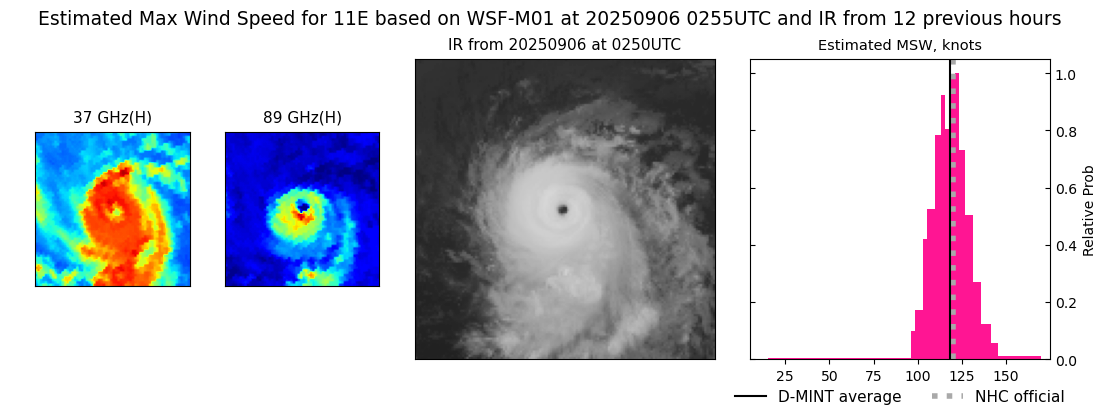 |
| 20250906 | 0242 UTC | SSMISF17 | 953 hPa | 120 kts | 113 kts | 127 kts | 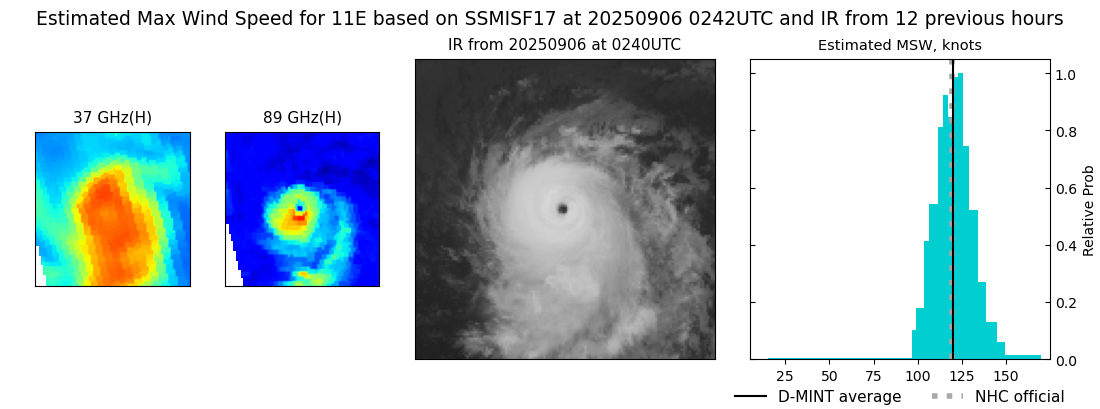 |
| 20250905 | 2244 UTC | ATMS-N20 | 962 hPa | 100 kts | 95 kts | 105 kts | 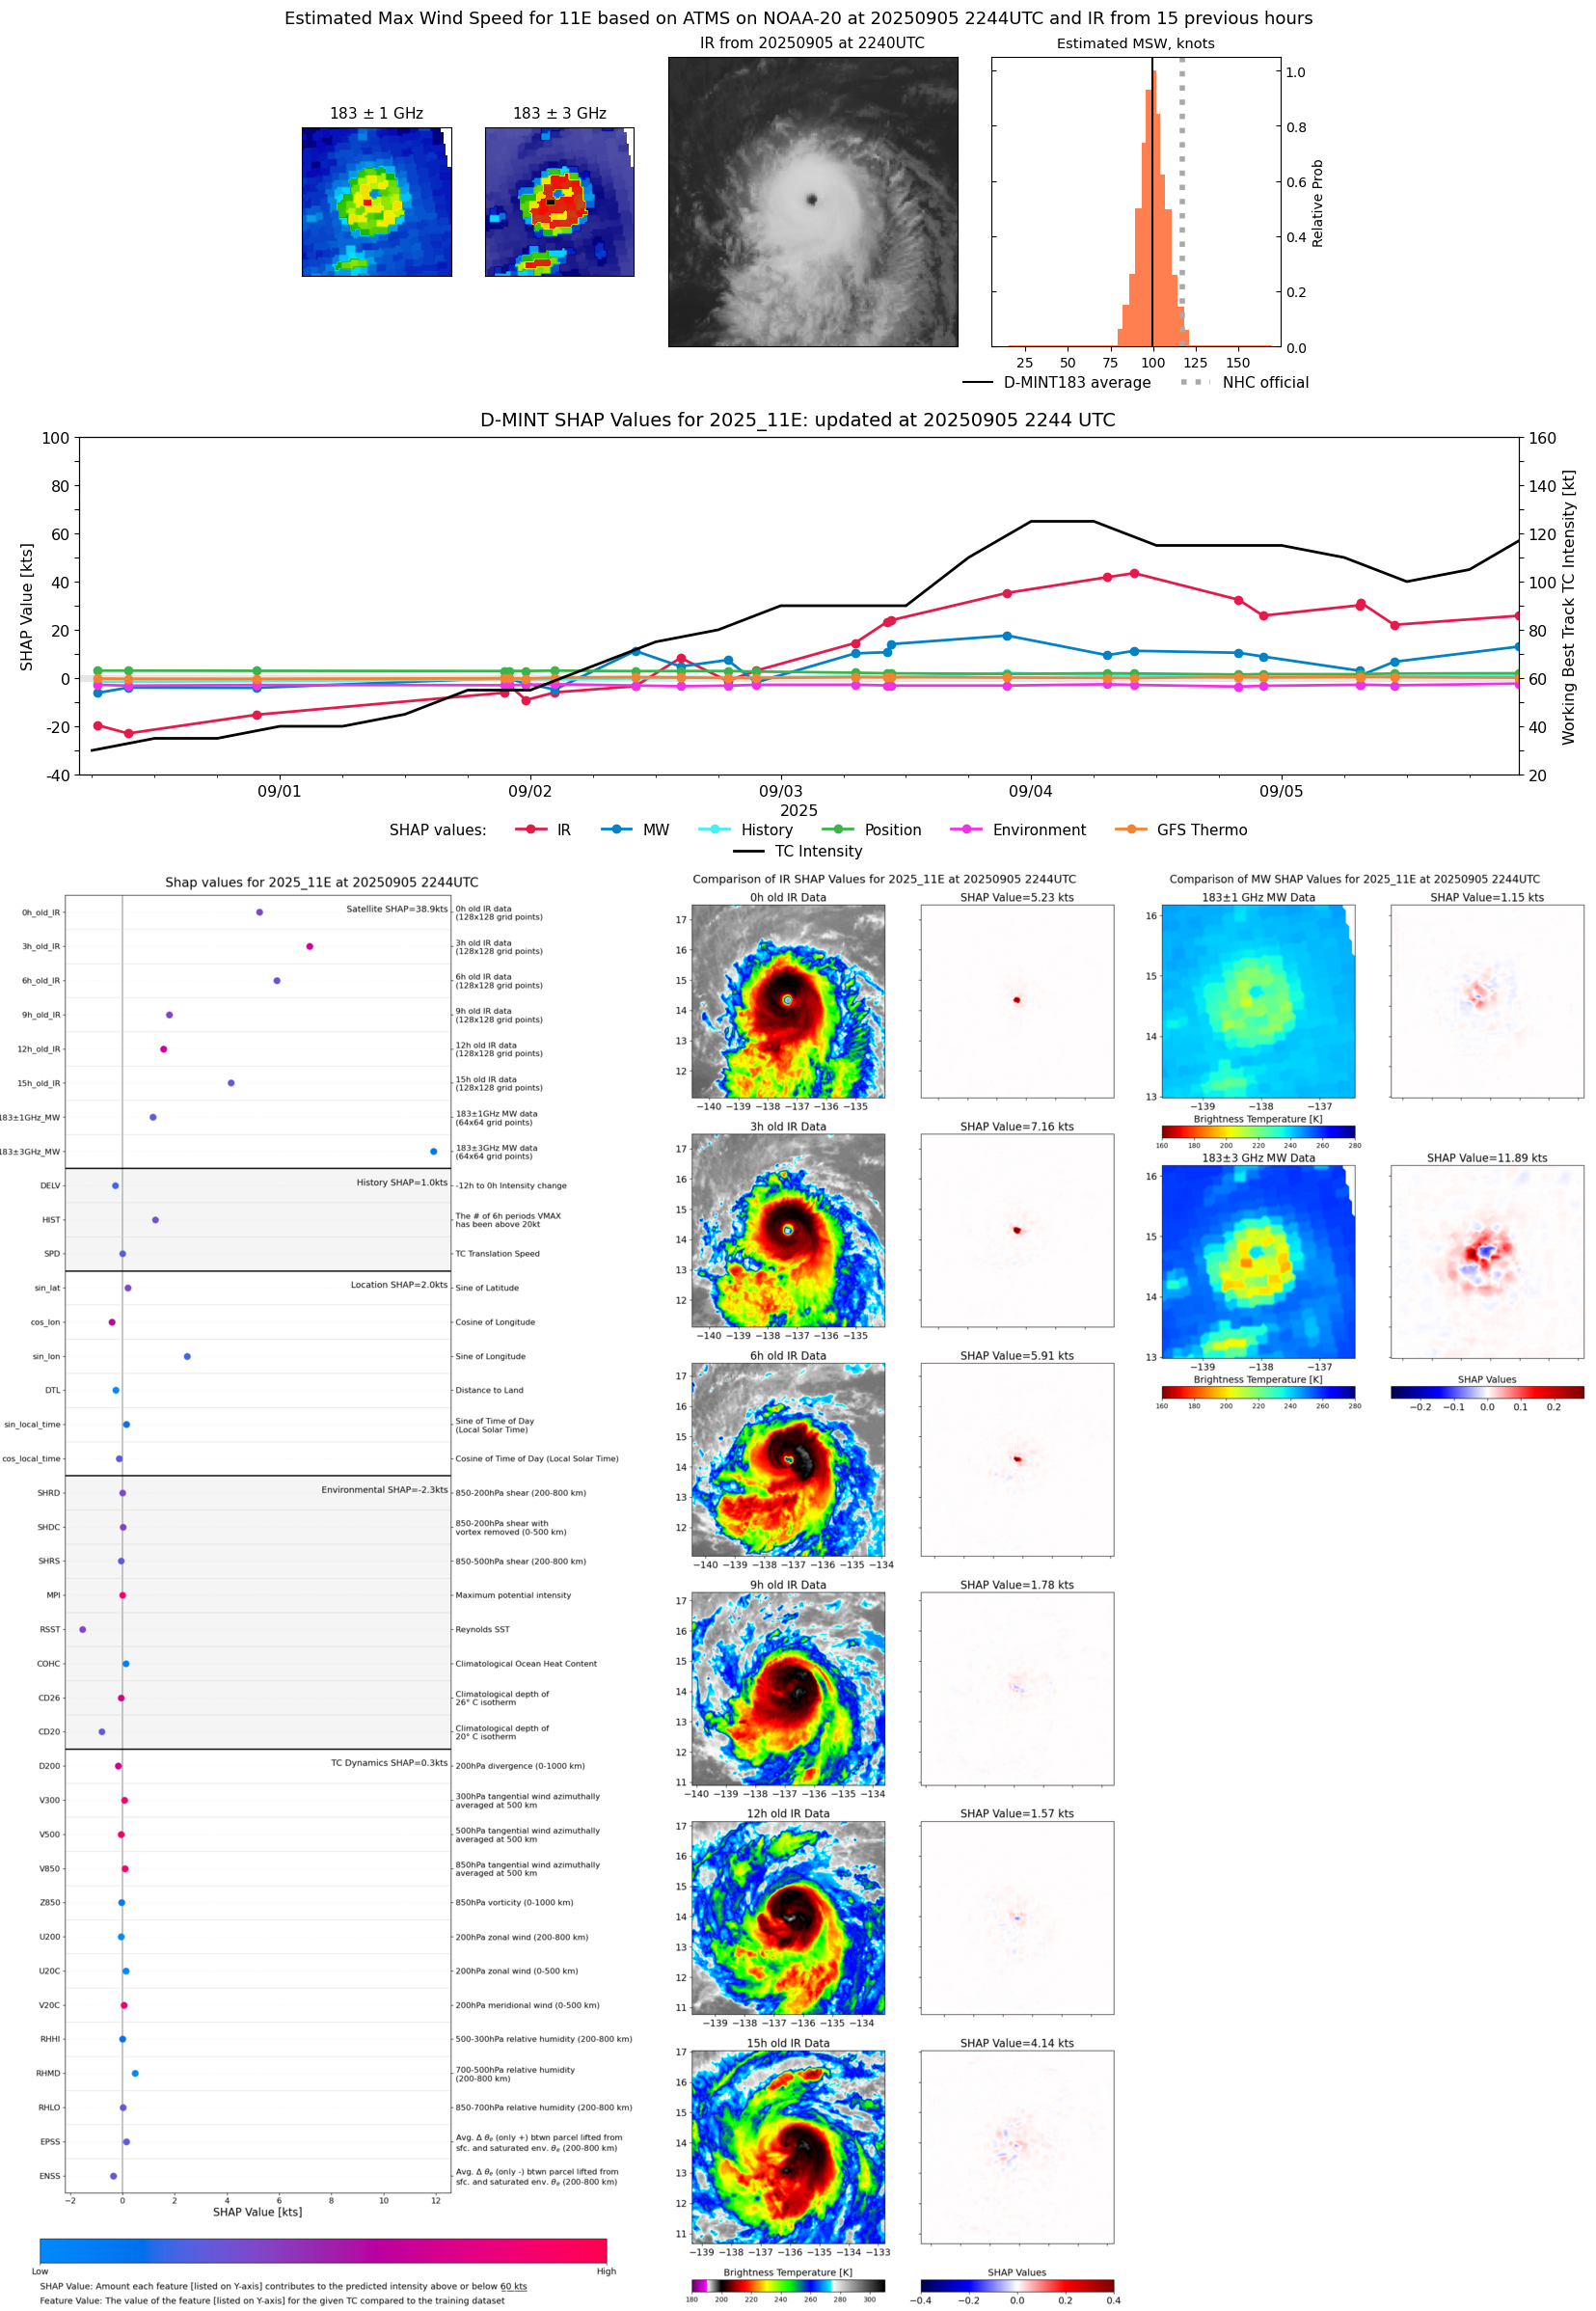 |
| 20250905 | 2228 UTC | AMSR2 | 966 hPa | 100 kts | 93 kts | 108 kts | 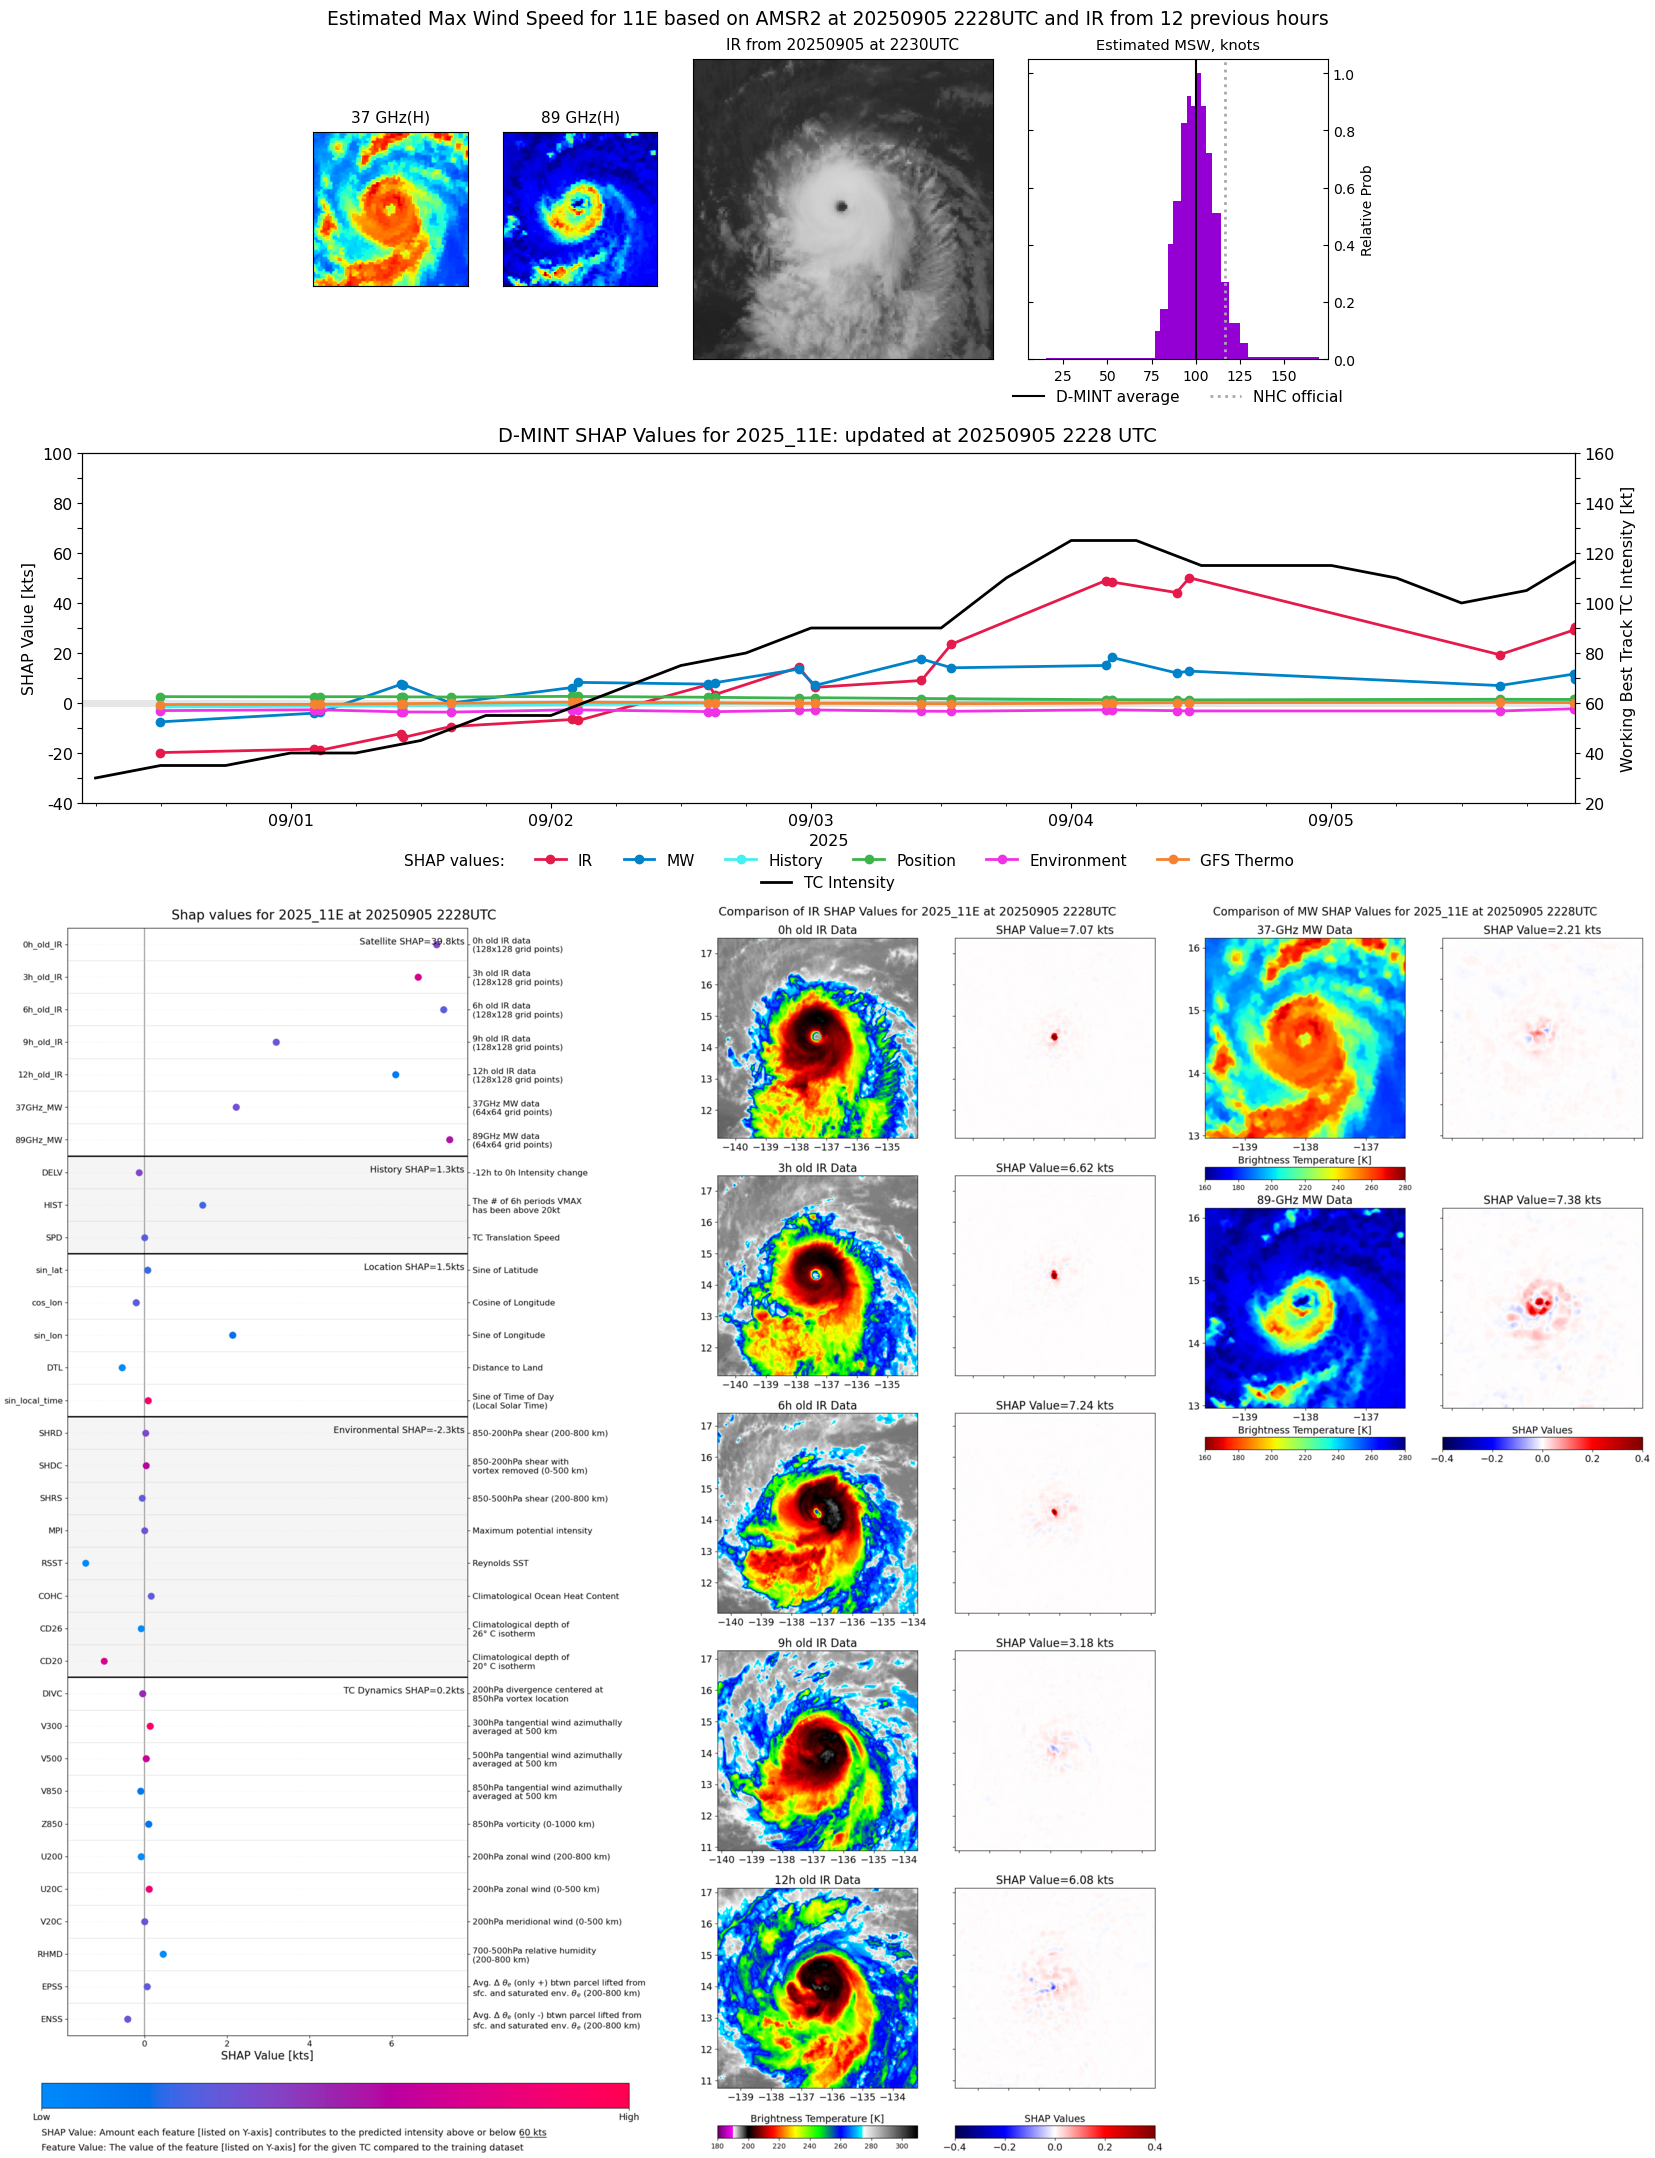 |
| 20250905 | 2223 UTC | GMI | 969 hPa | 101 kts | 95 kts | 108 kts | 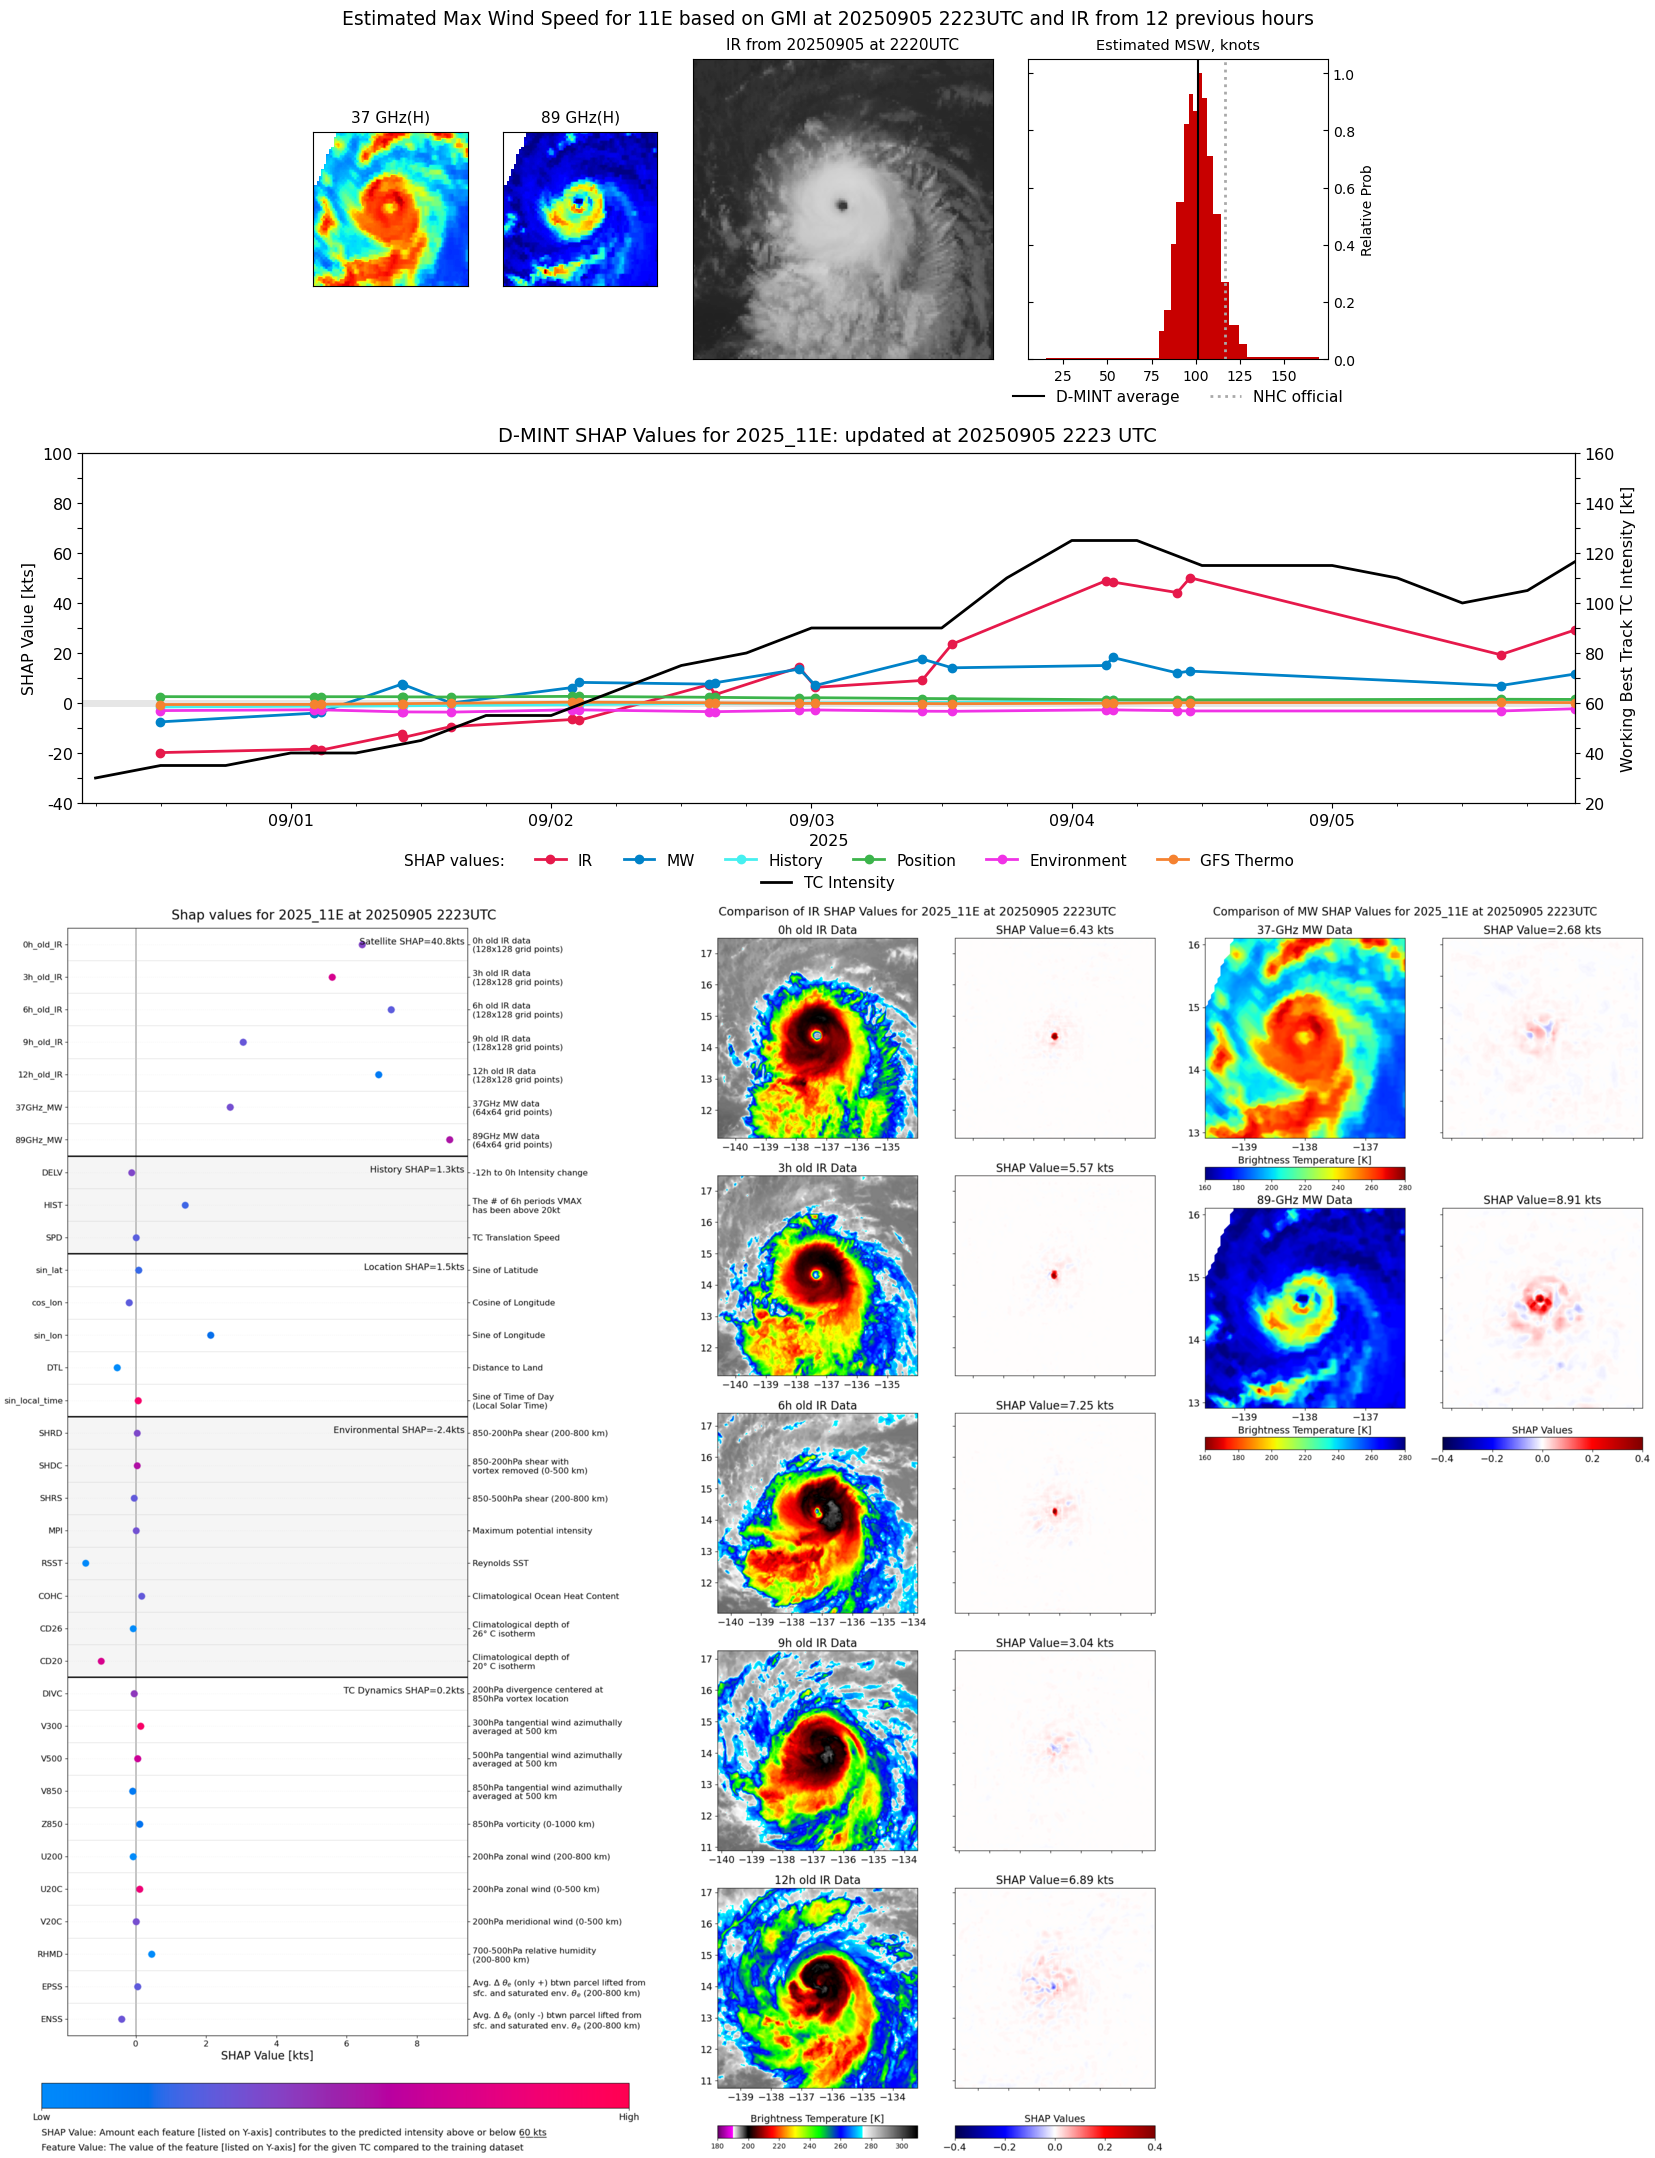 |
| 20250905 | 1917 UTC | TMS06 | 970 hPa | 89 kts | 83 kts | 94 kts | 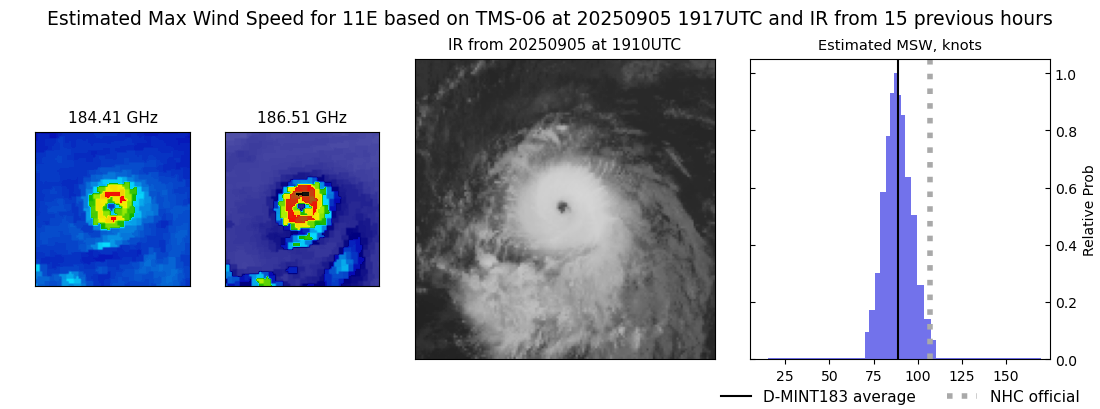 |
| 20250905 | 1548 UTC | WSFM01 | 974 hPa | 90 kts | 83 kts | 97 kts | 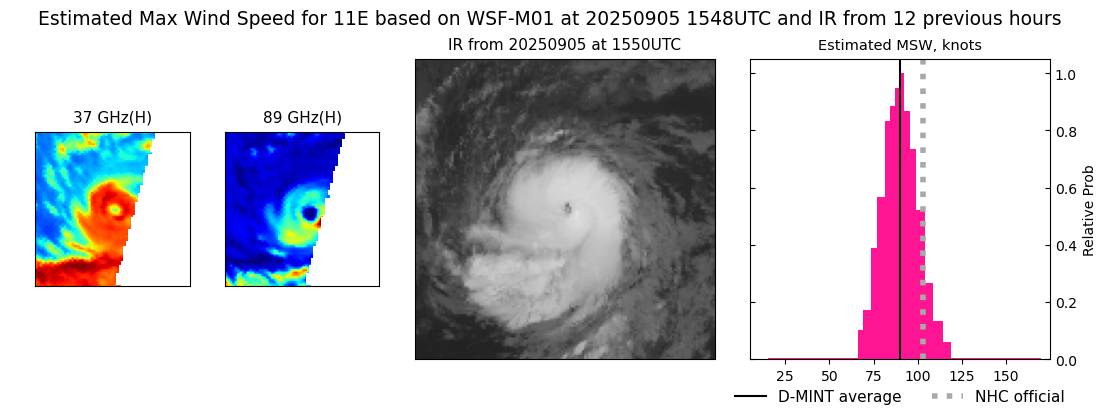 |
| 20250905 | 1531 UTC | SSMISF17 | 978 hPa | 86 kts | 79 kts | 93 kts | 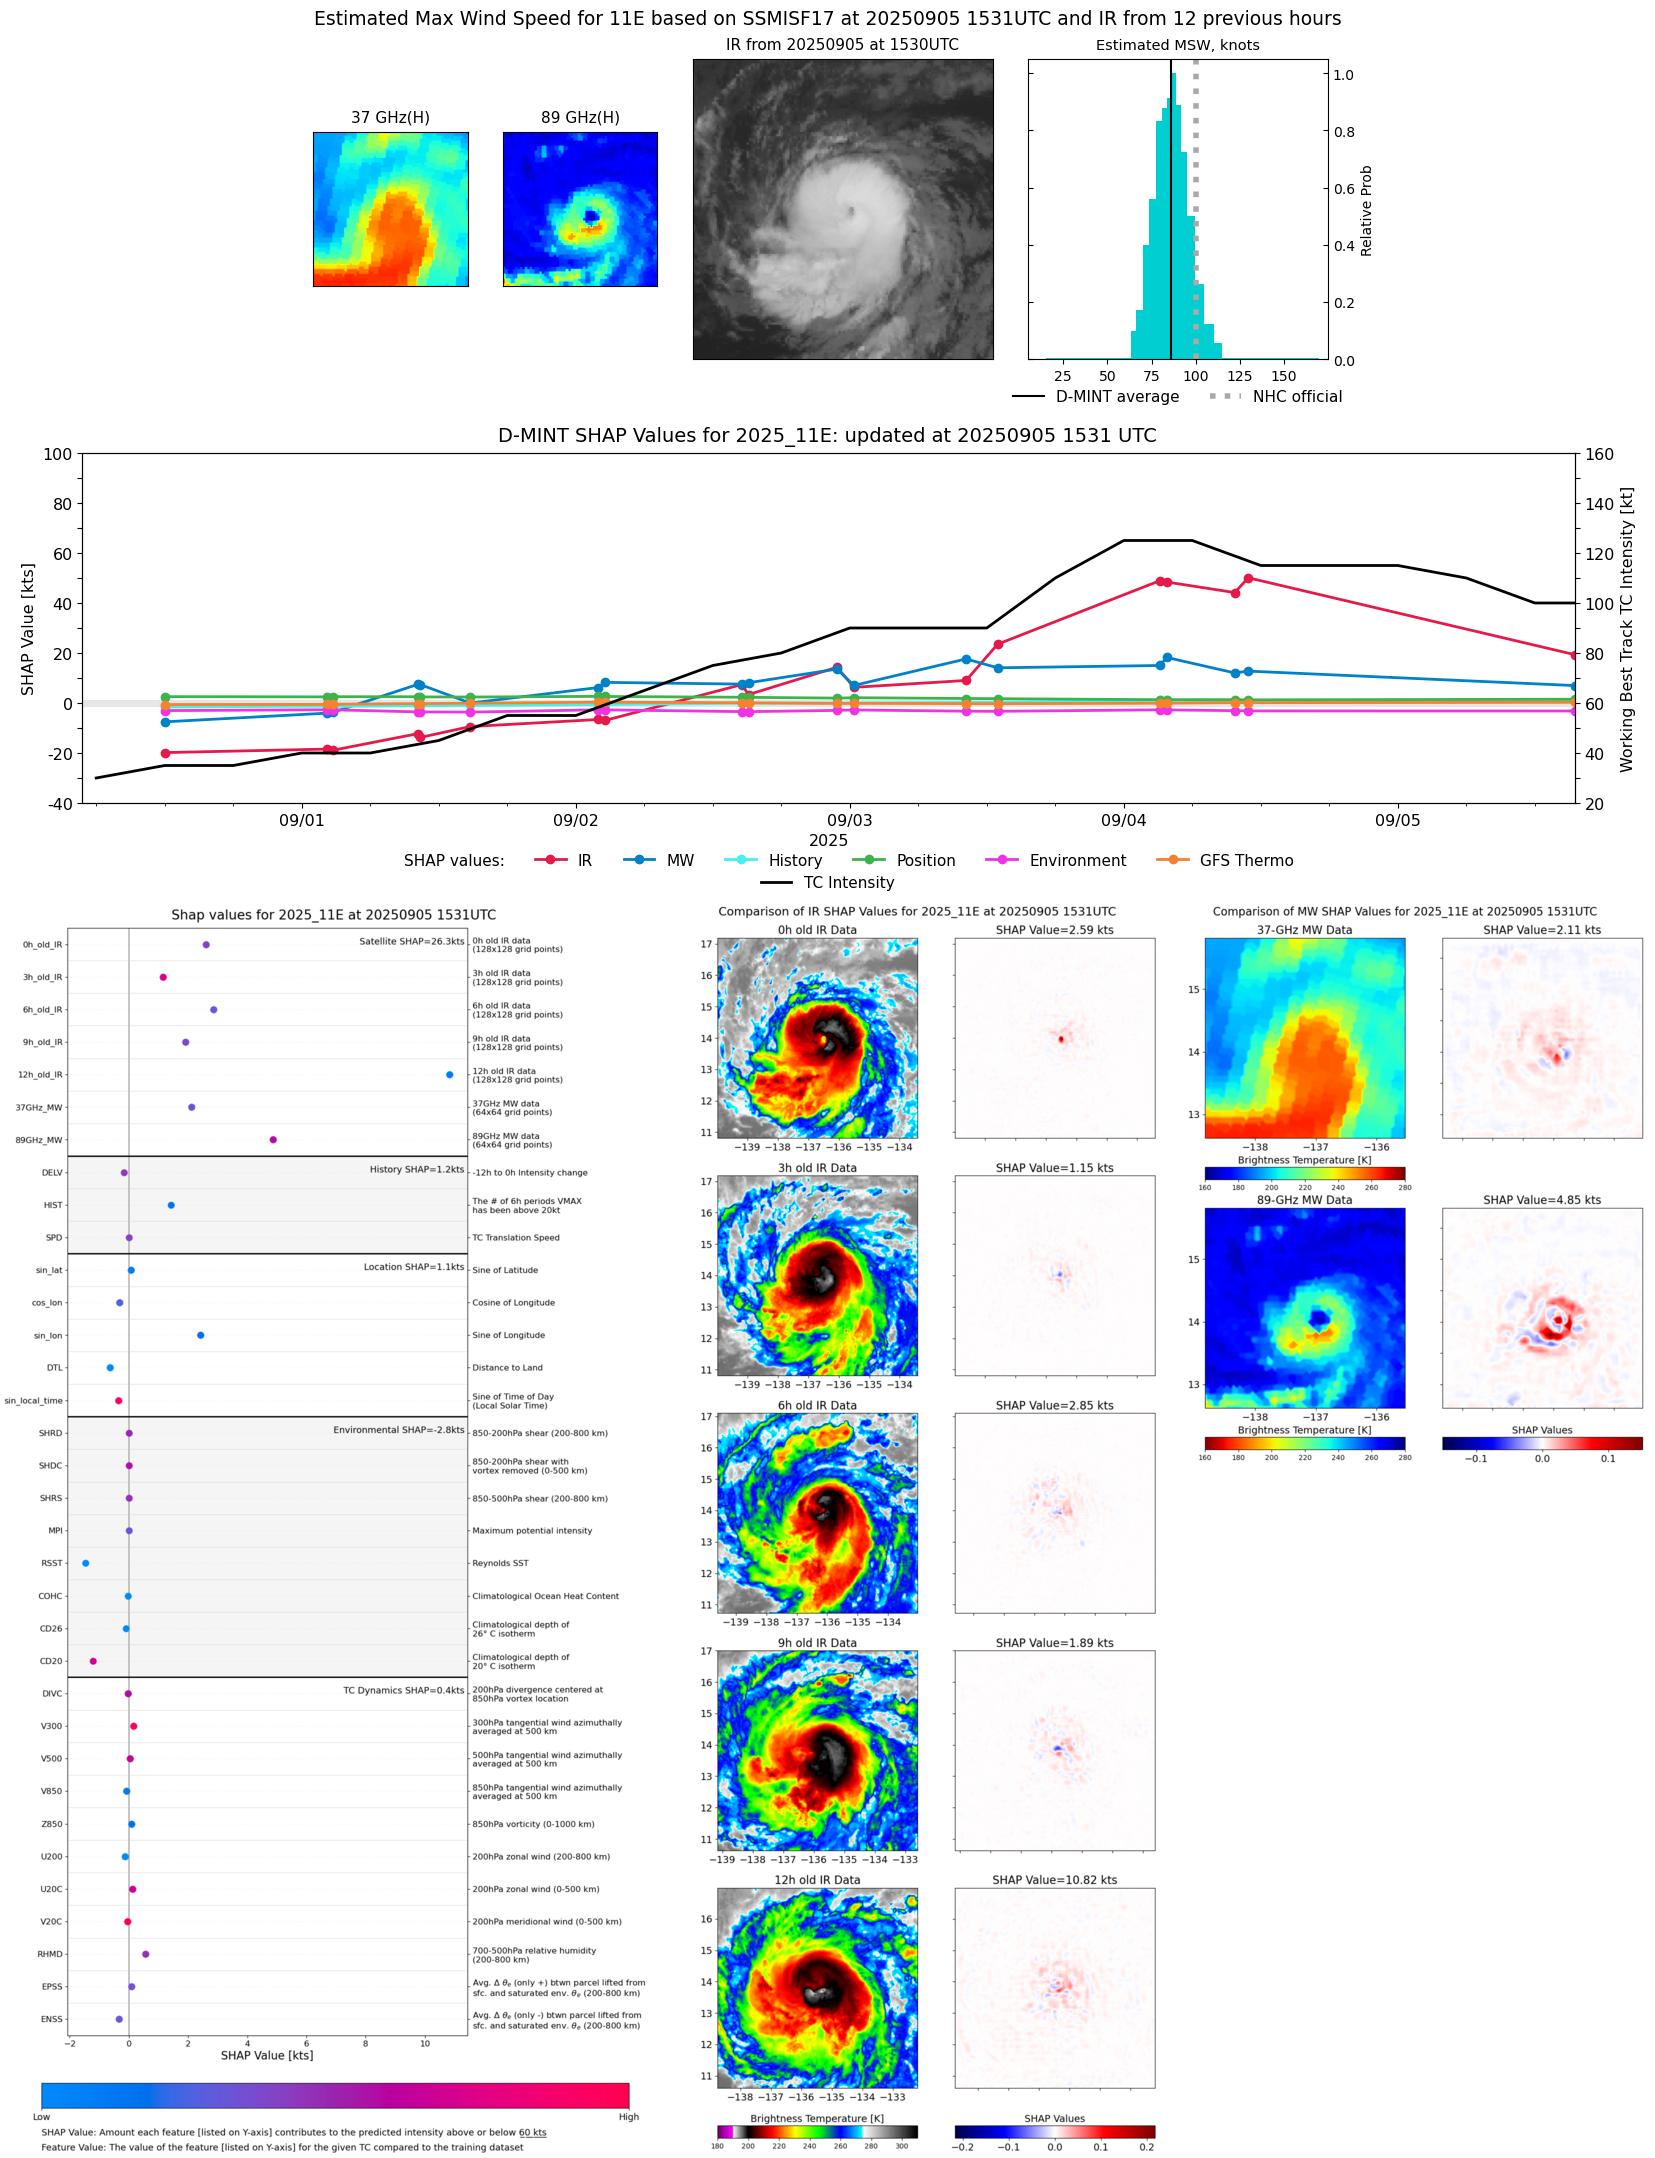 |
| 20250905 | 1047 UTC | ATMS-N21 | 970 hPa | 89 kts | 83 kts | 95 kts | 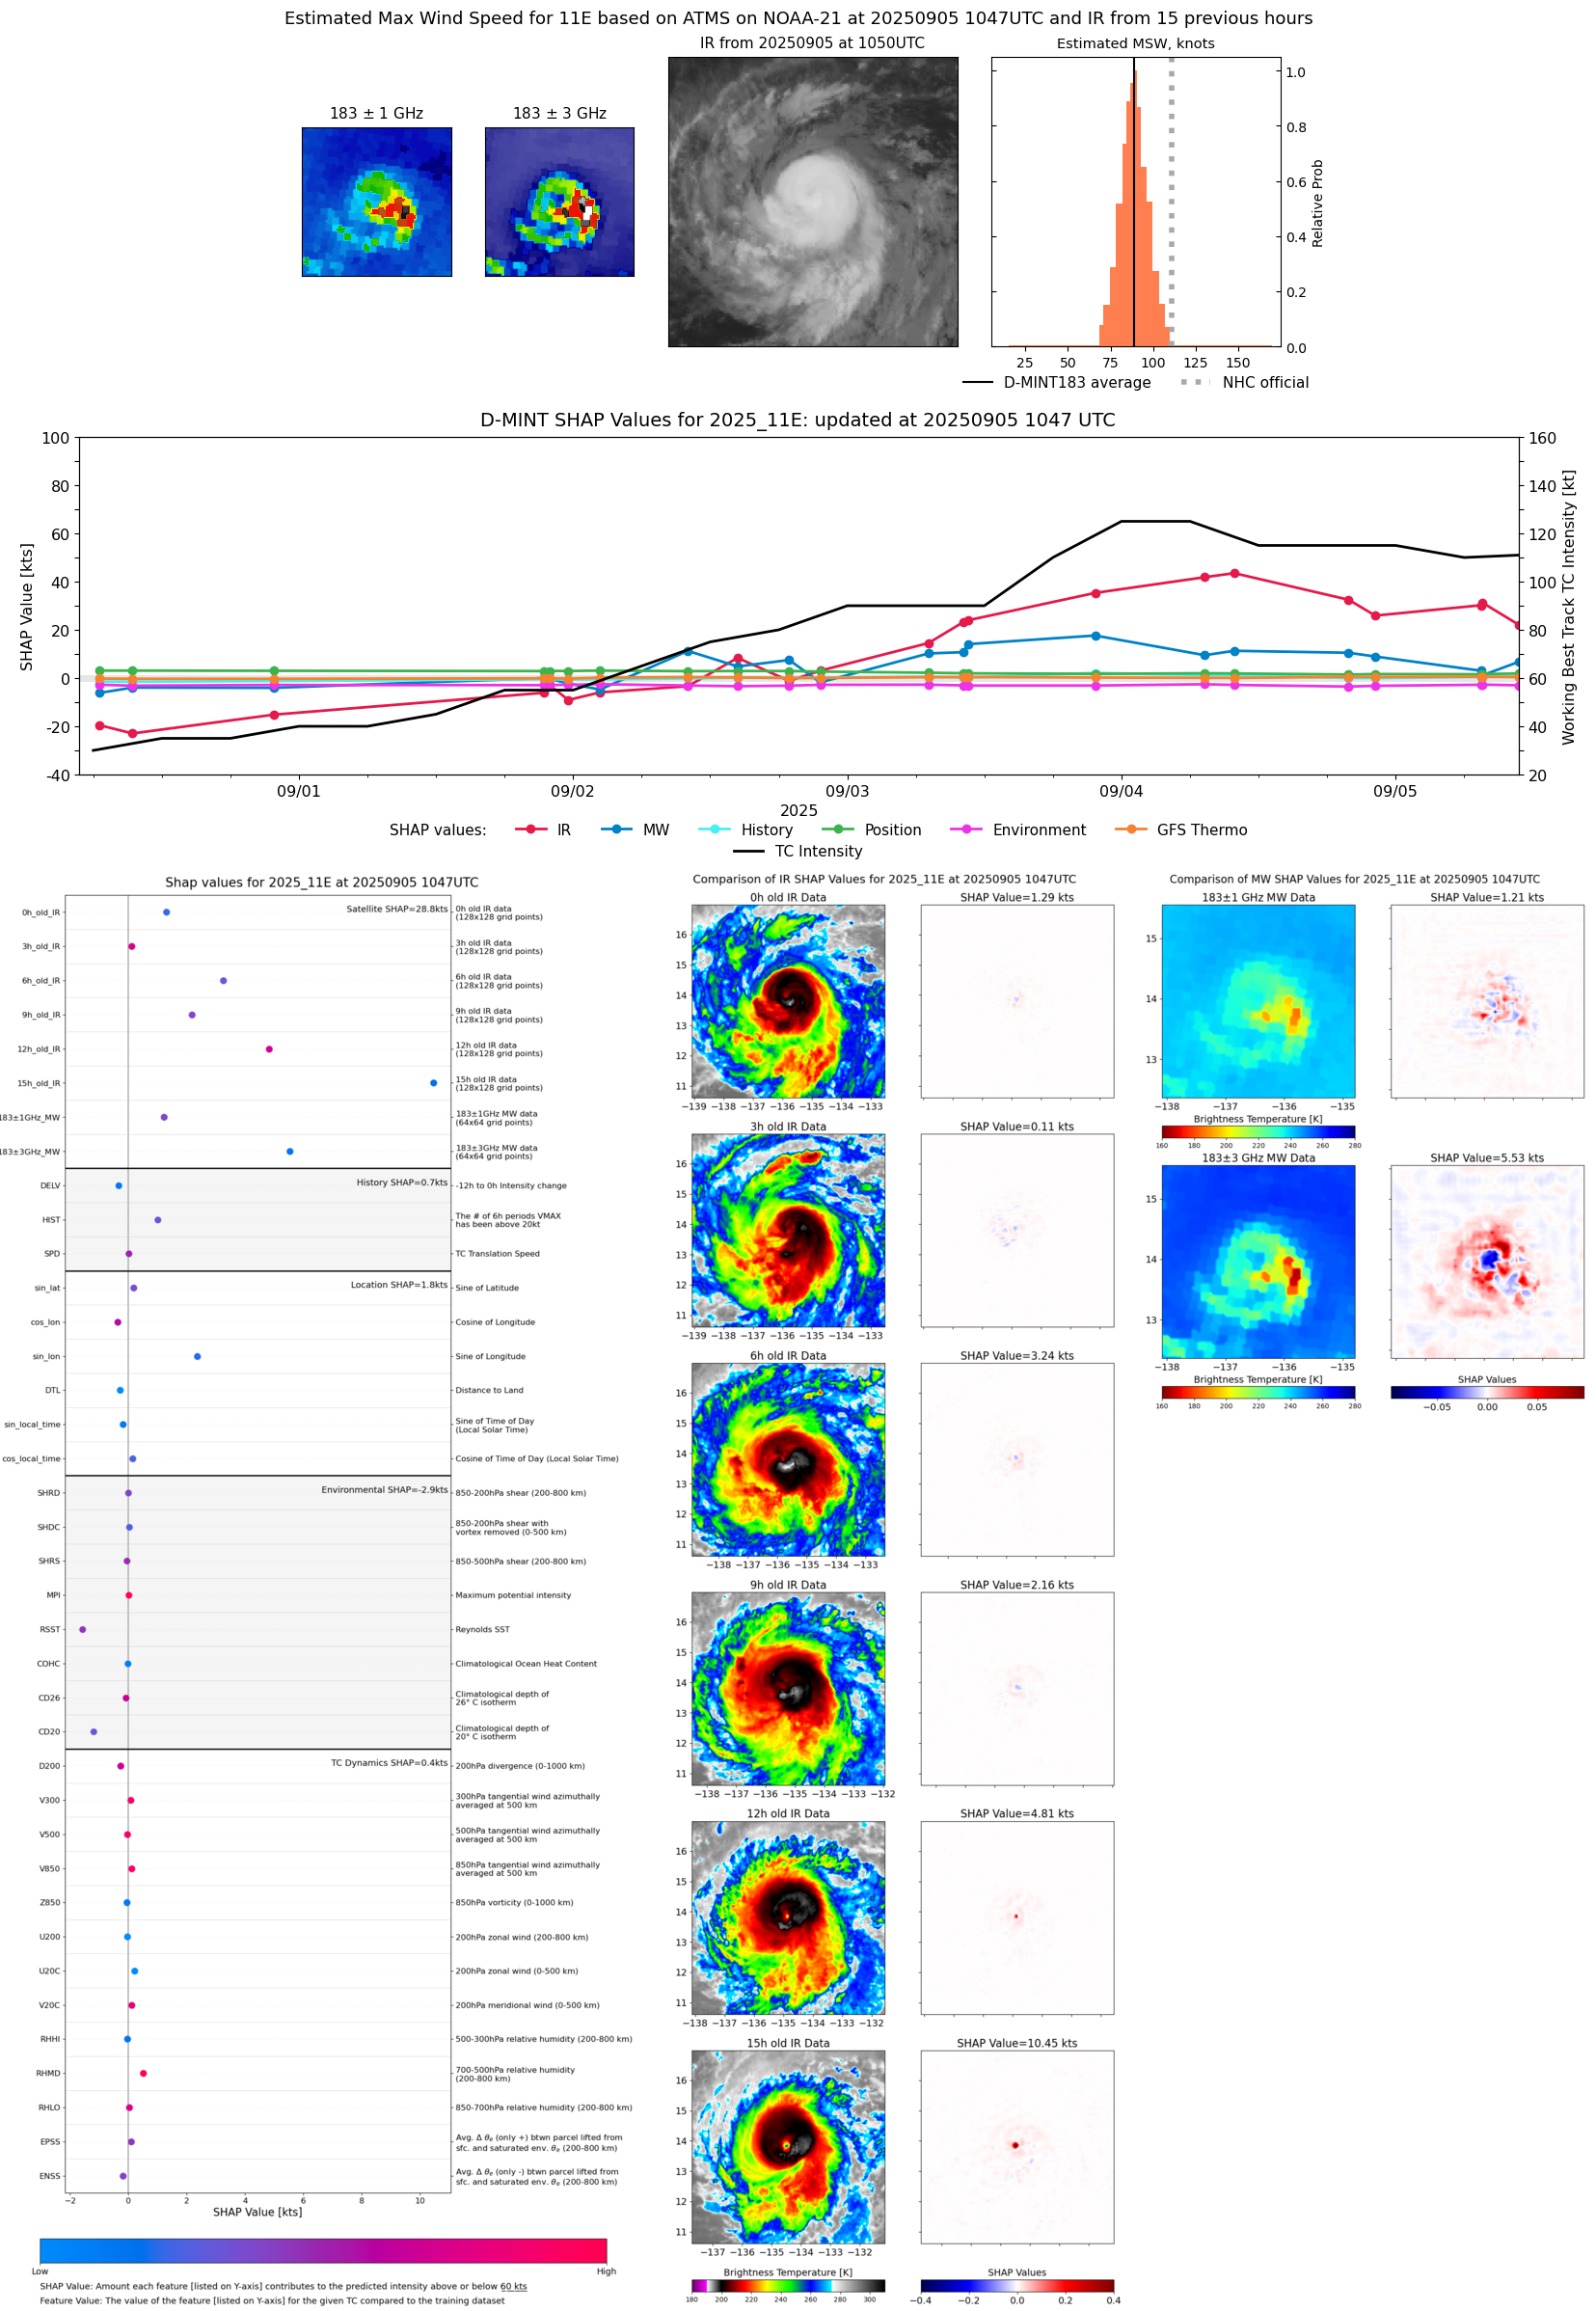 |
| 20250905 | 0736 UTC | TMS02 | 973 hPa | 92 kts | 87 kts | 98 kts |  |
| 20250905 | 0728 UTC | AWS | 969 hPa | 92 kts | 87 kts | 98 kts | 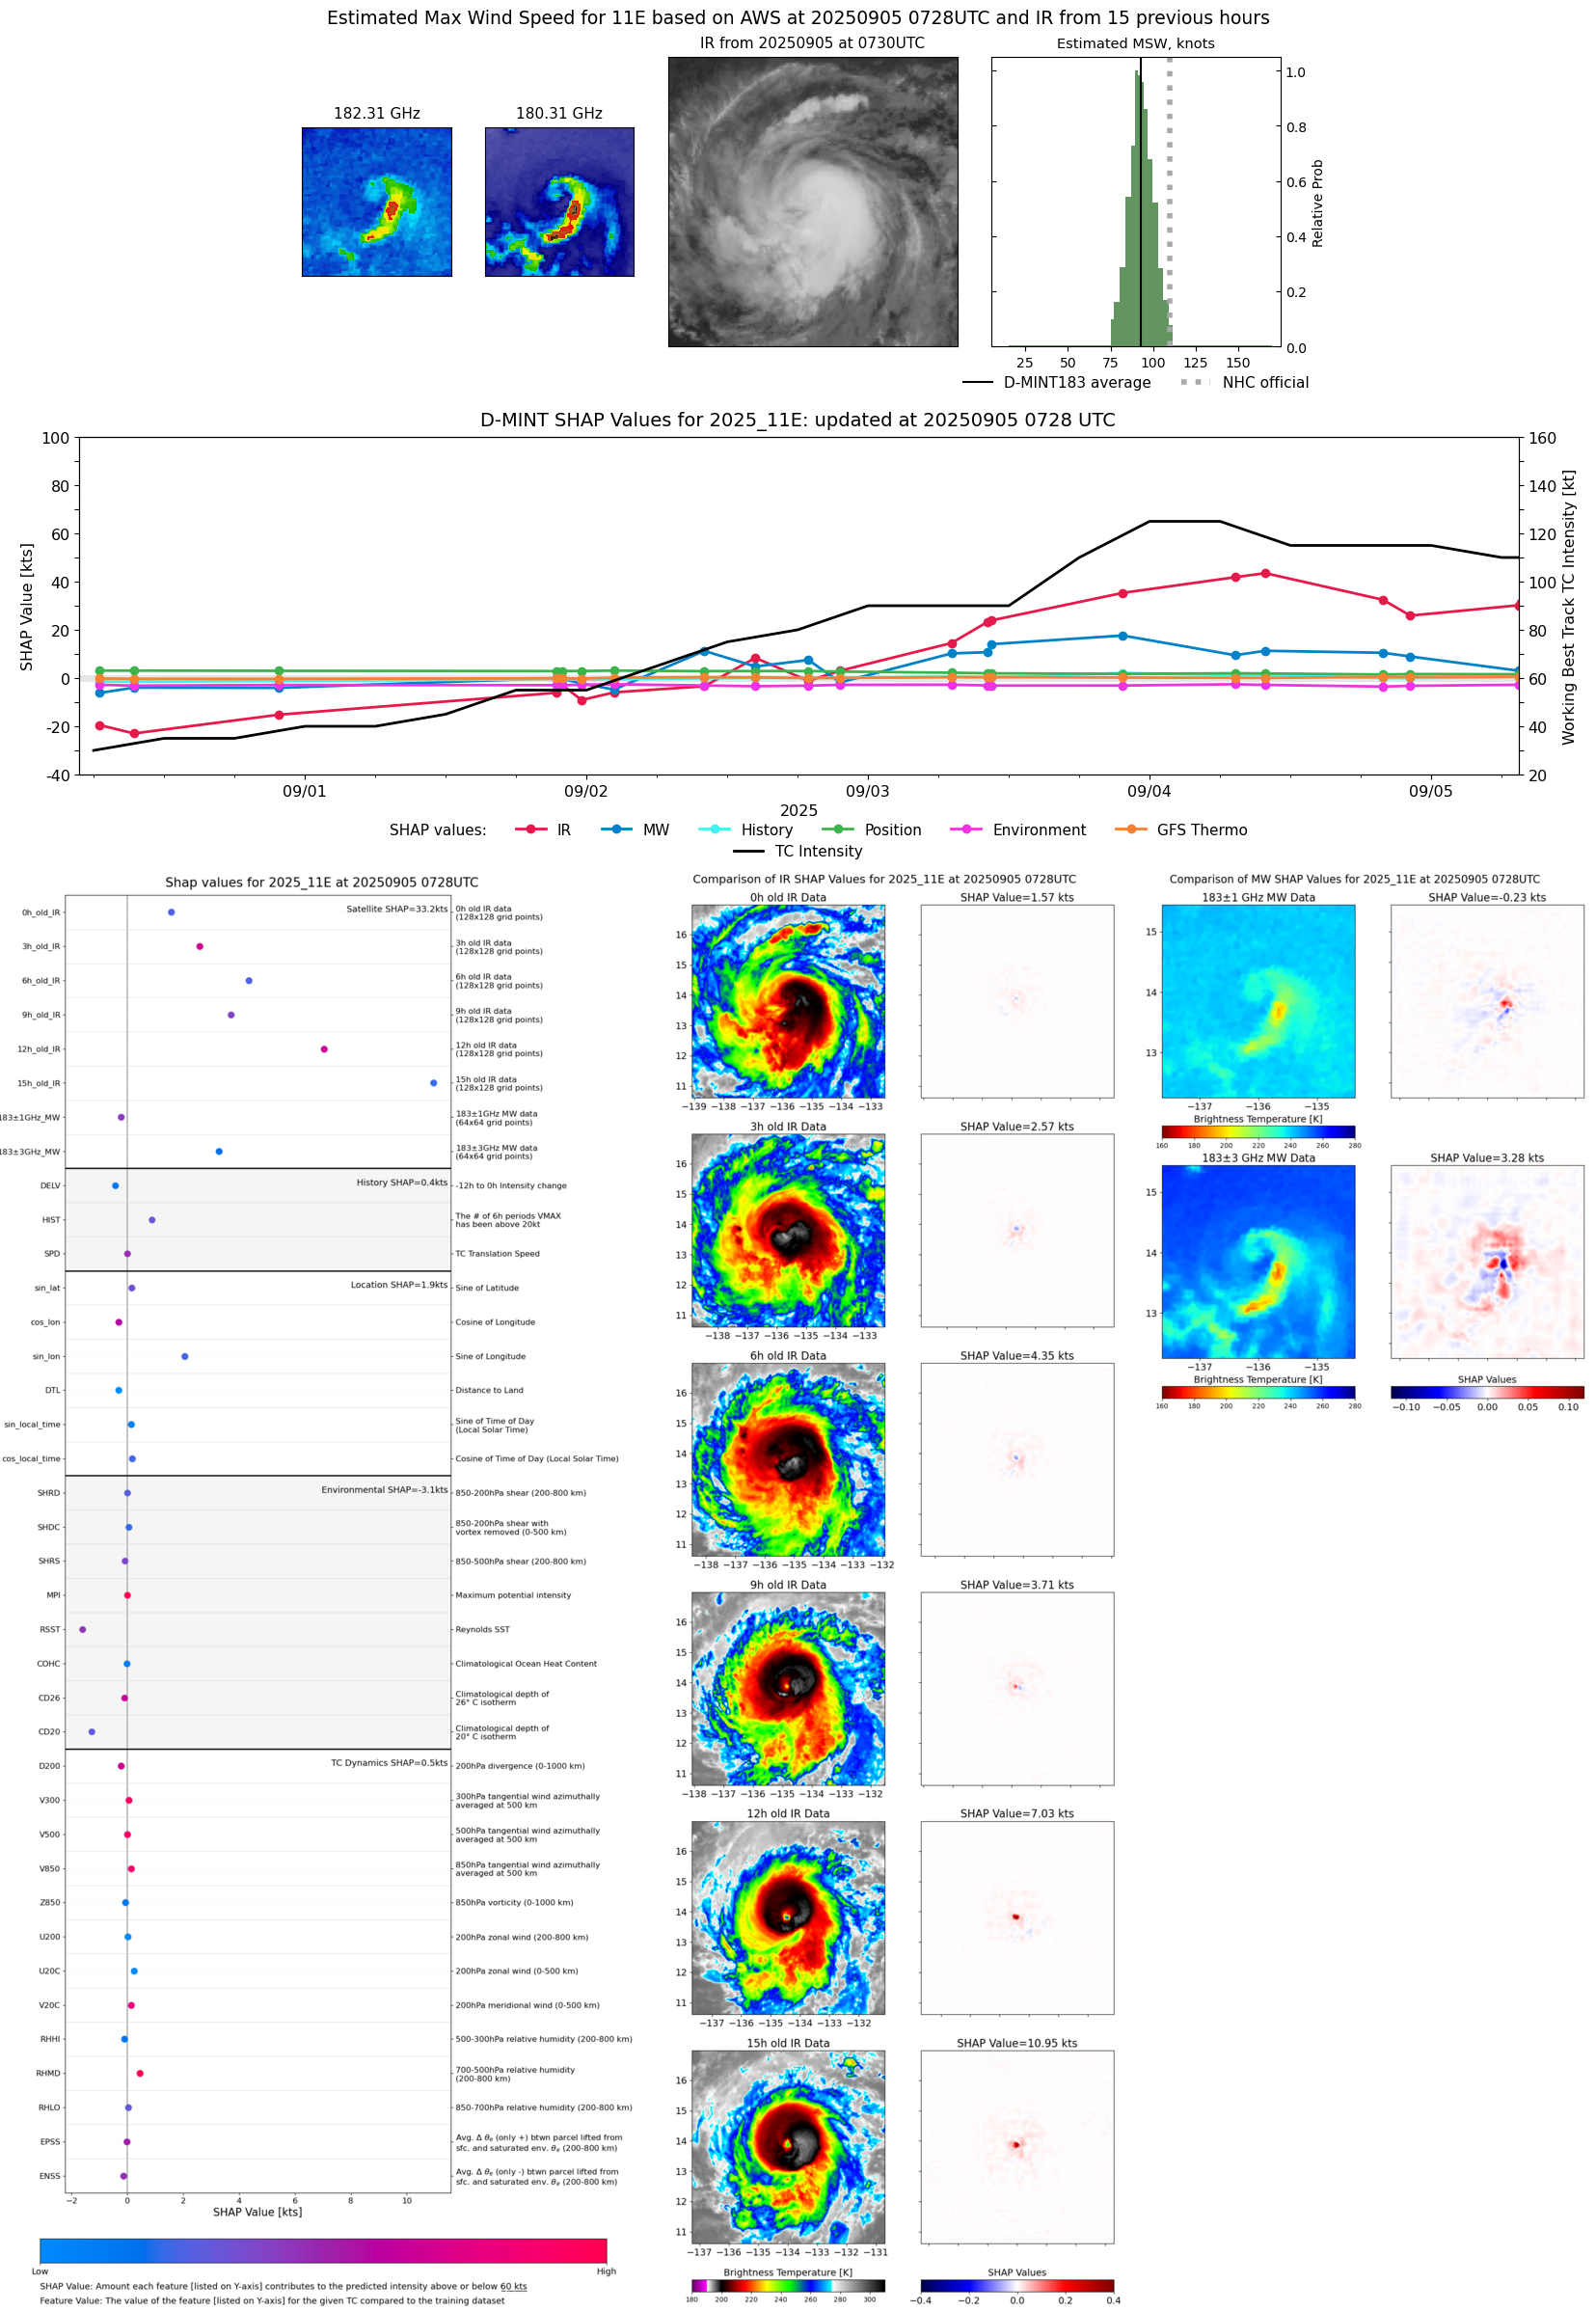 |
| 20250905 | 0711 UTC | TMS06 | 969 hPa | 96 kts | 91 kts | 101 kts |  |
| 20250905 | 0332 UTC | SSMISF16 | 963 hPa | 97 kts | 89 kts | 105 kts |  |
| 20250905 | 0315 UTC | WSFM01 | 957 hPa | 110 kts | 103 kts | 117 kts | 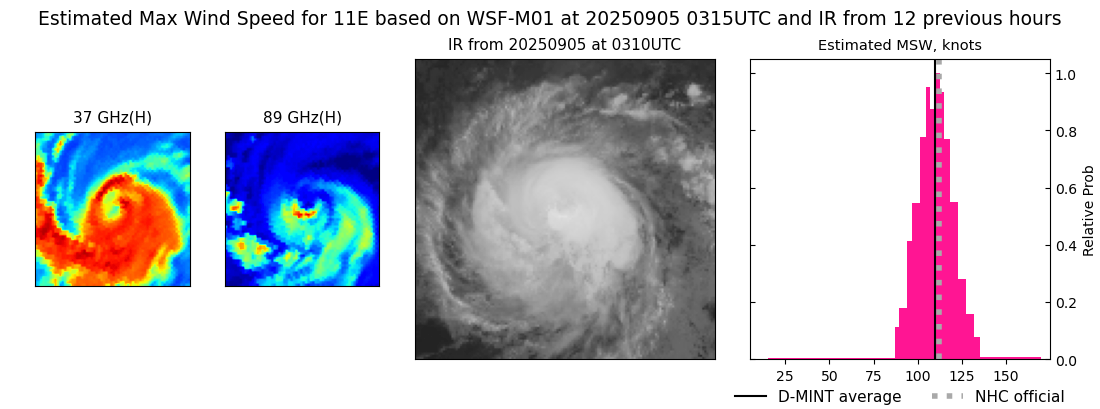 |
| 20250905 | 0255 UTC | SSMISF17 | 958 hPa | 109 kts | 102 kts | 116 kts | 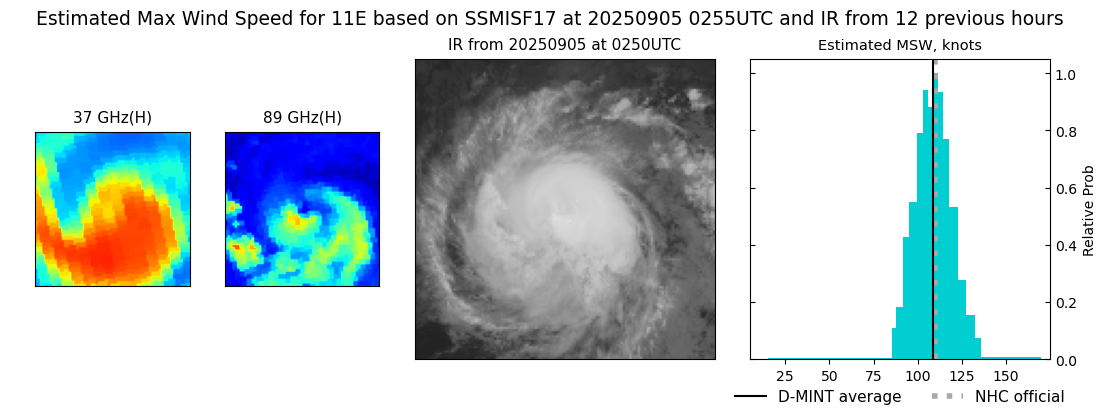 |
| 20250904 | 2213 UTC | ATMS-N21 | 961 hPa | 94 kts | 89 kts | 99 kts | 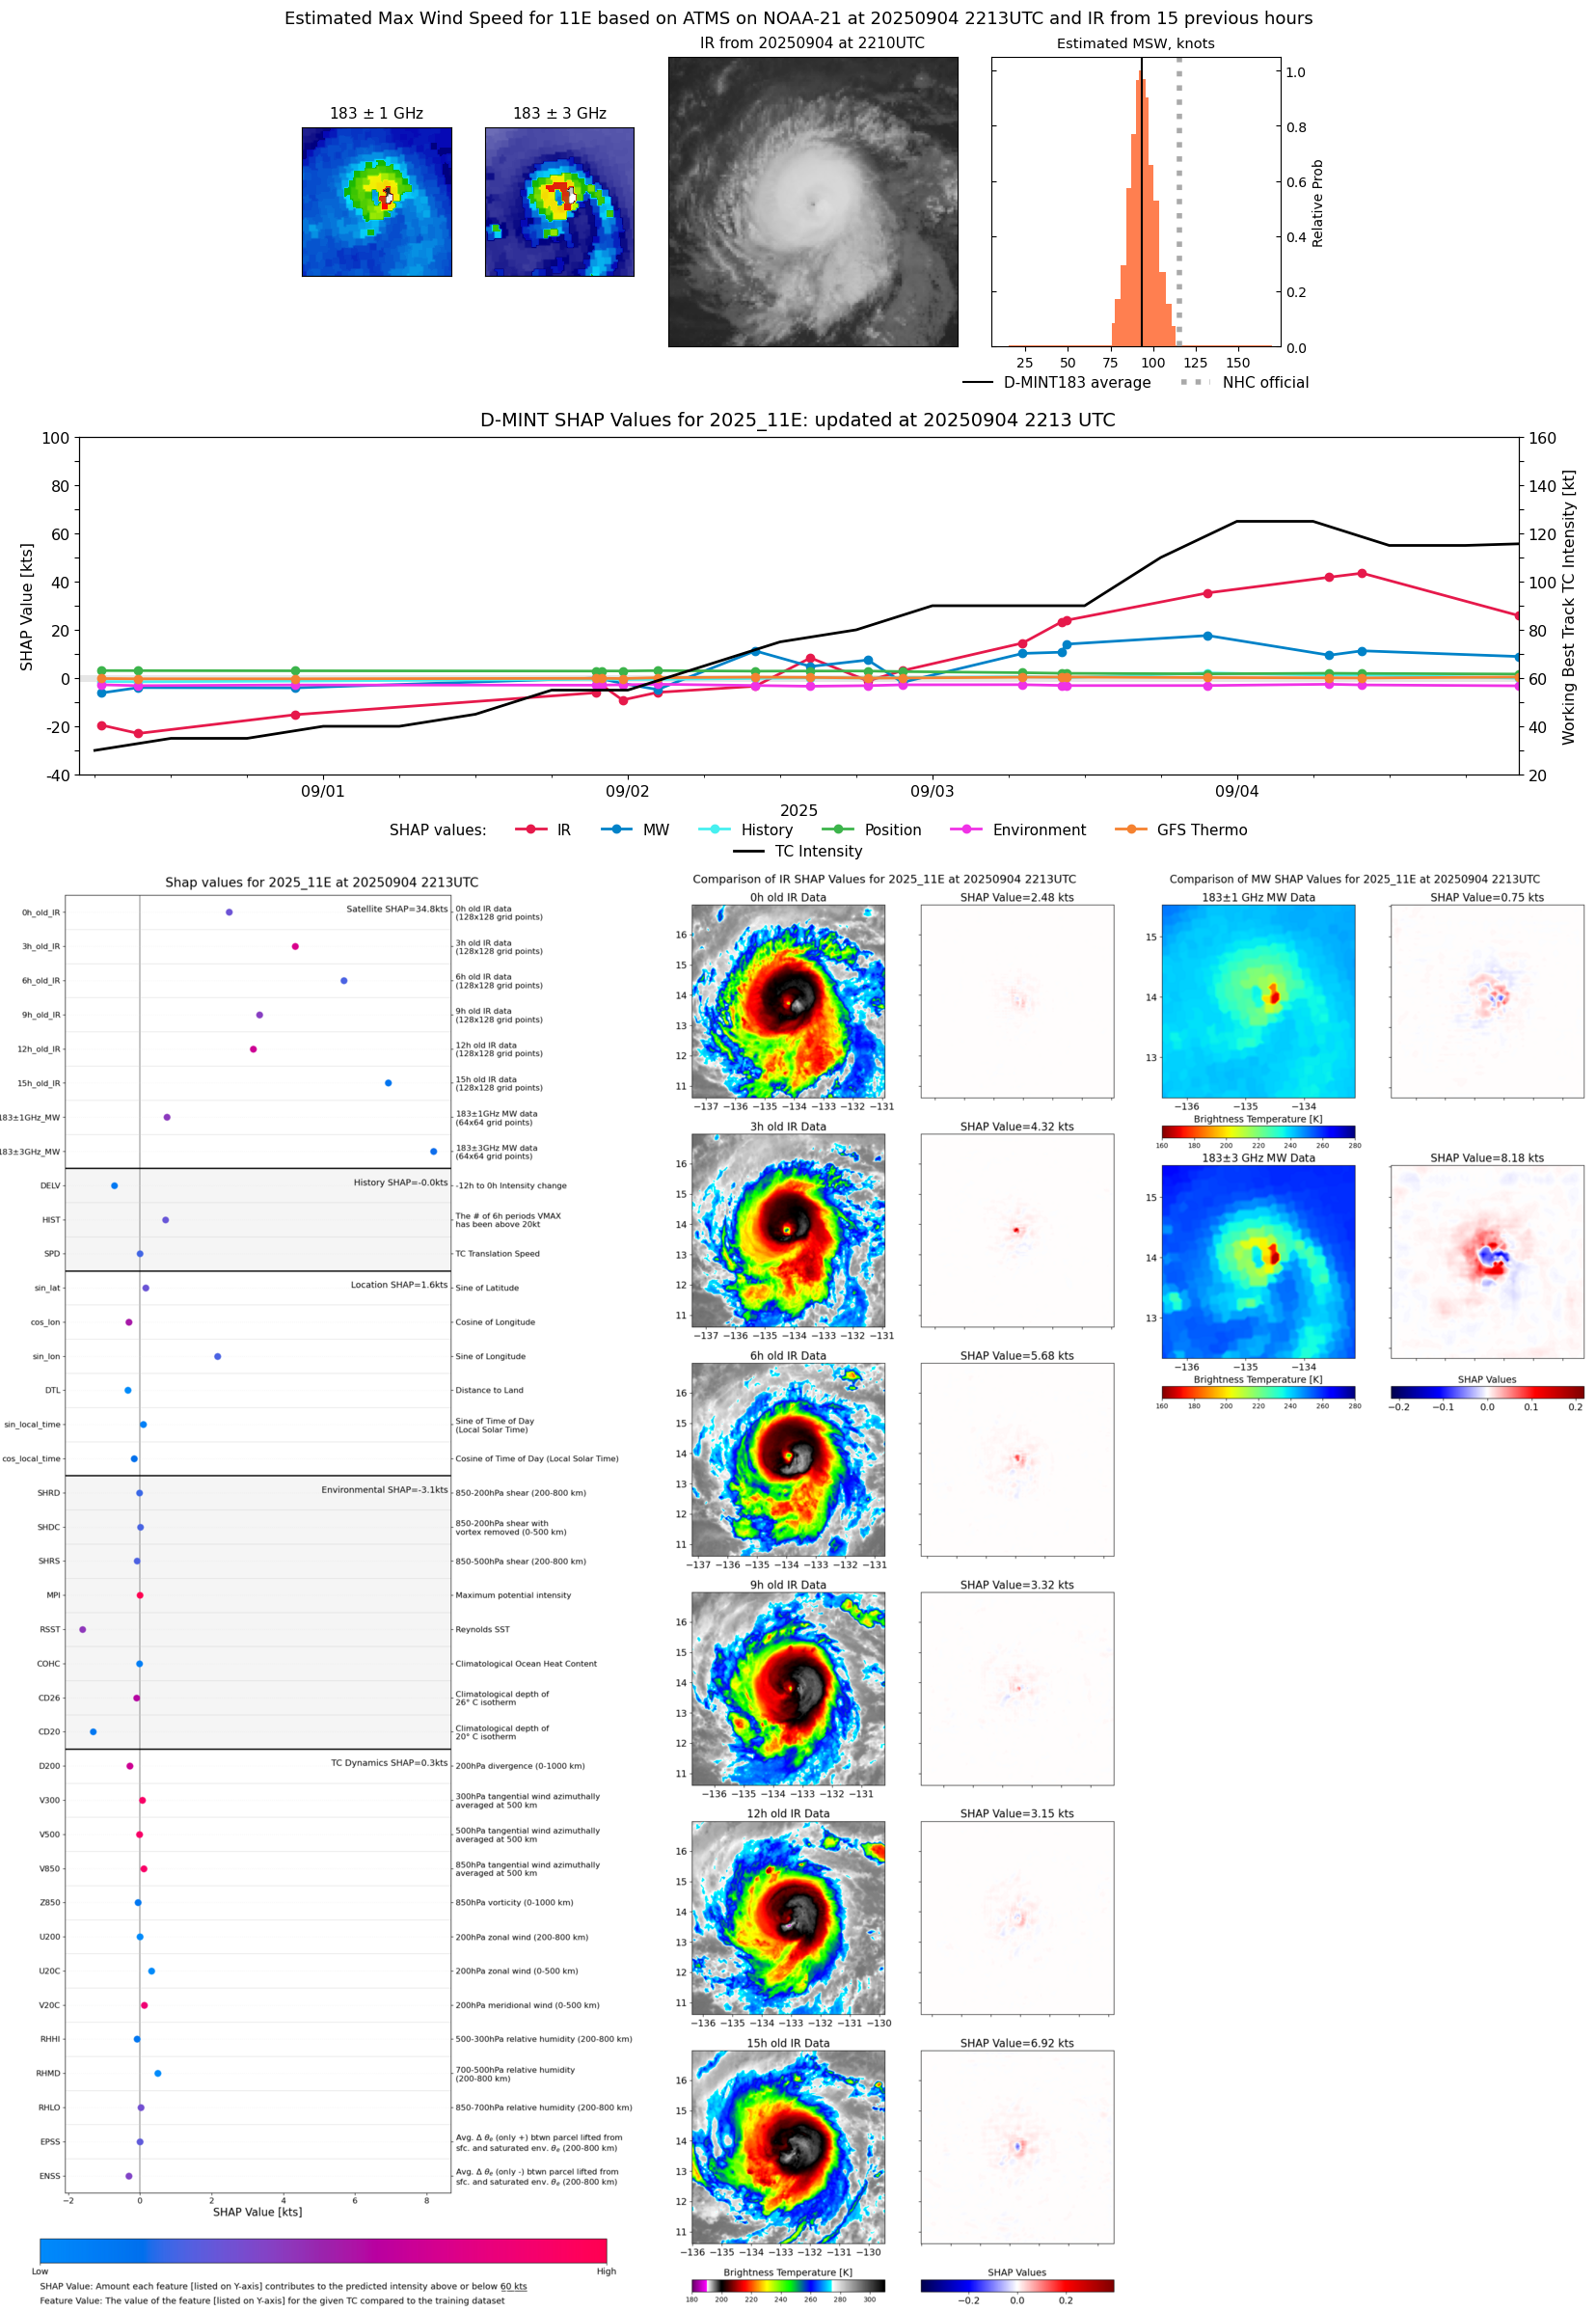 |
| 20250904 | 1953 UTC | TMS02 | 963 hPa | 101 kts | 97 kts | 106 kts |  |
| 20250904 | 1054 UTC | AMSR2 | 957 hPa | 121 kts | 115 kts | 128 kts | 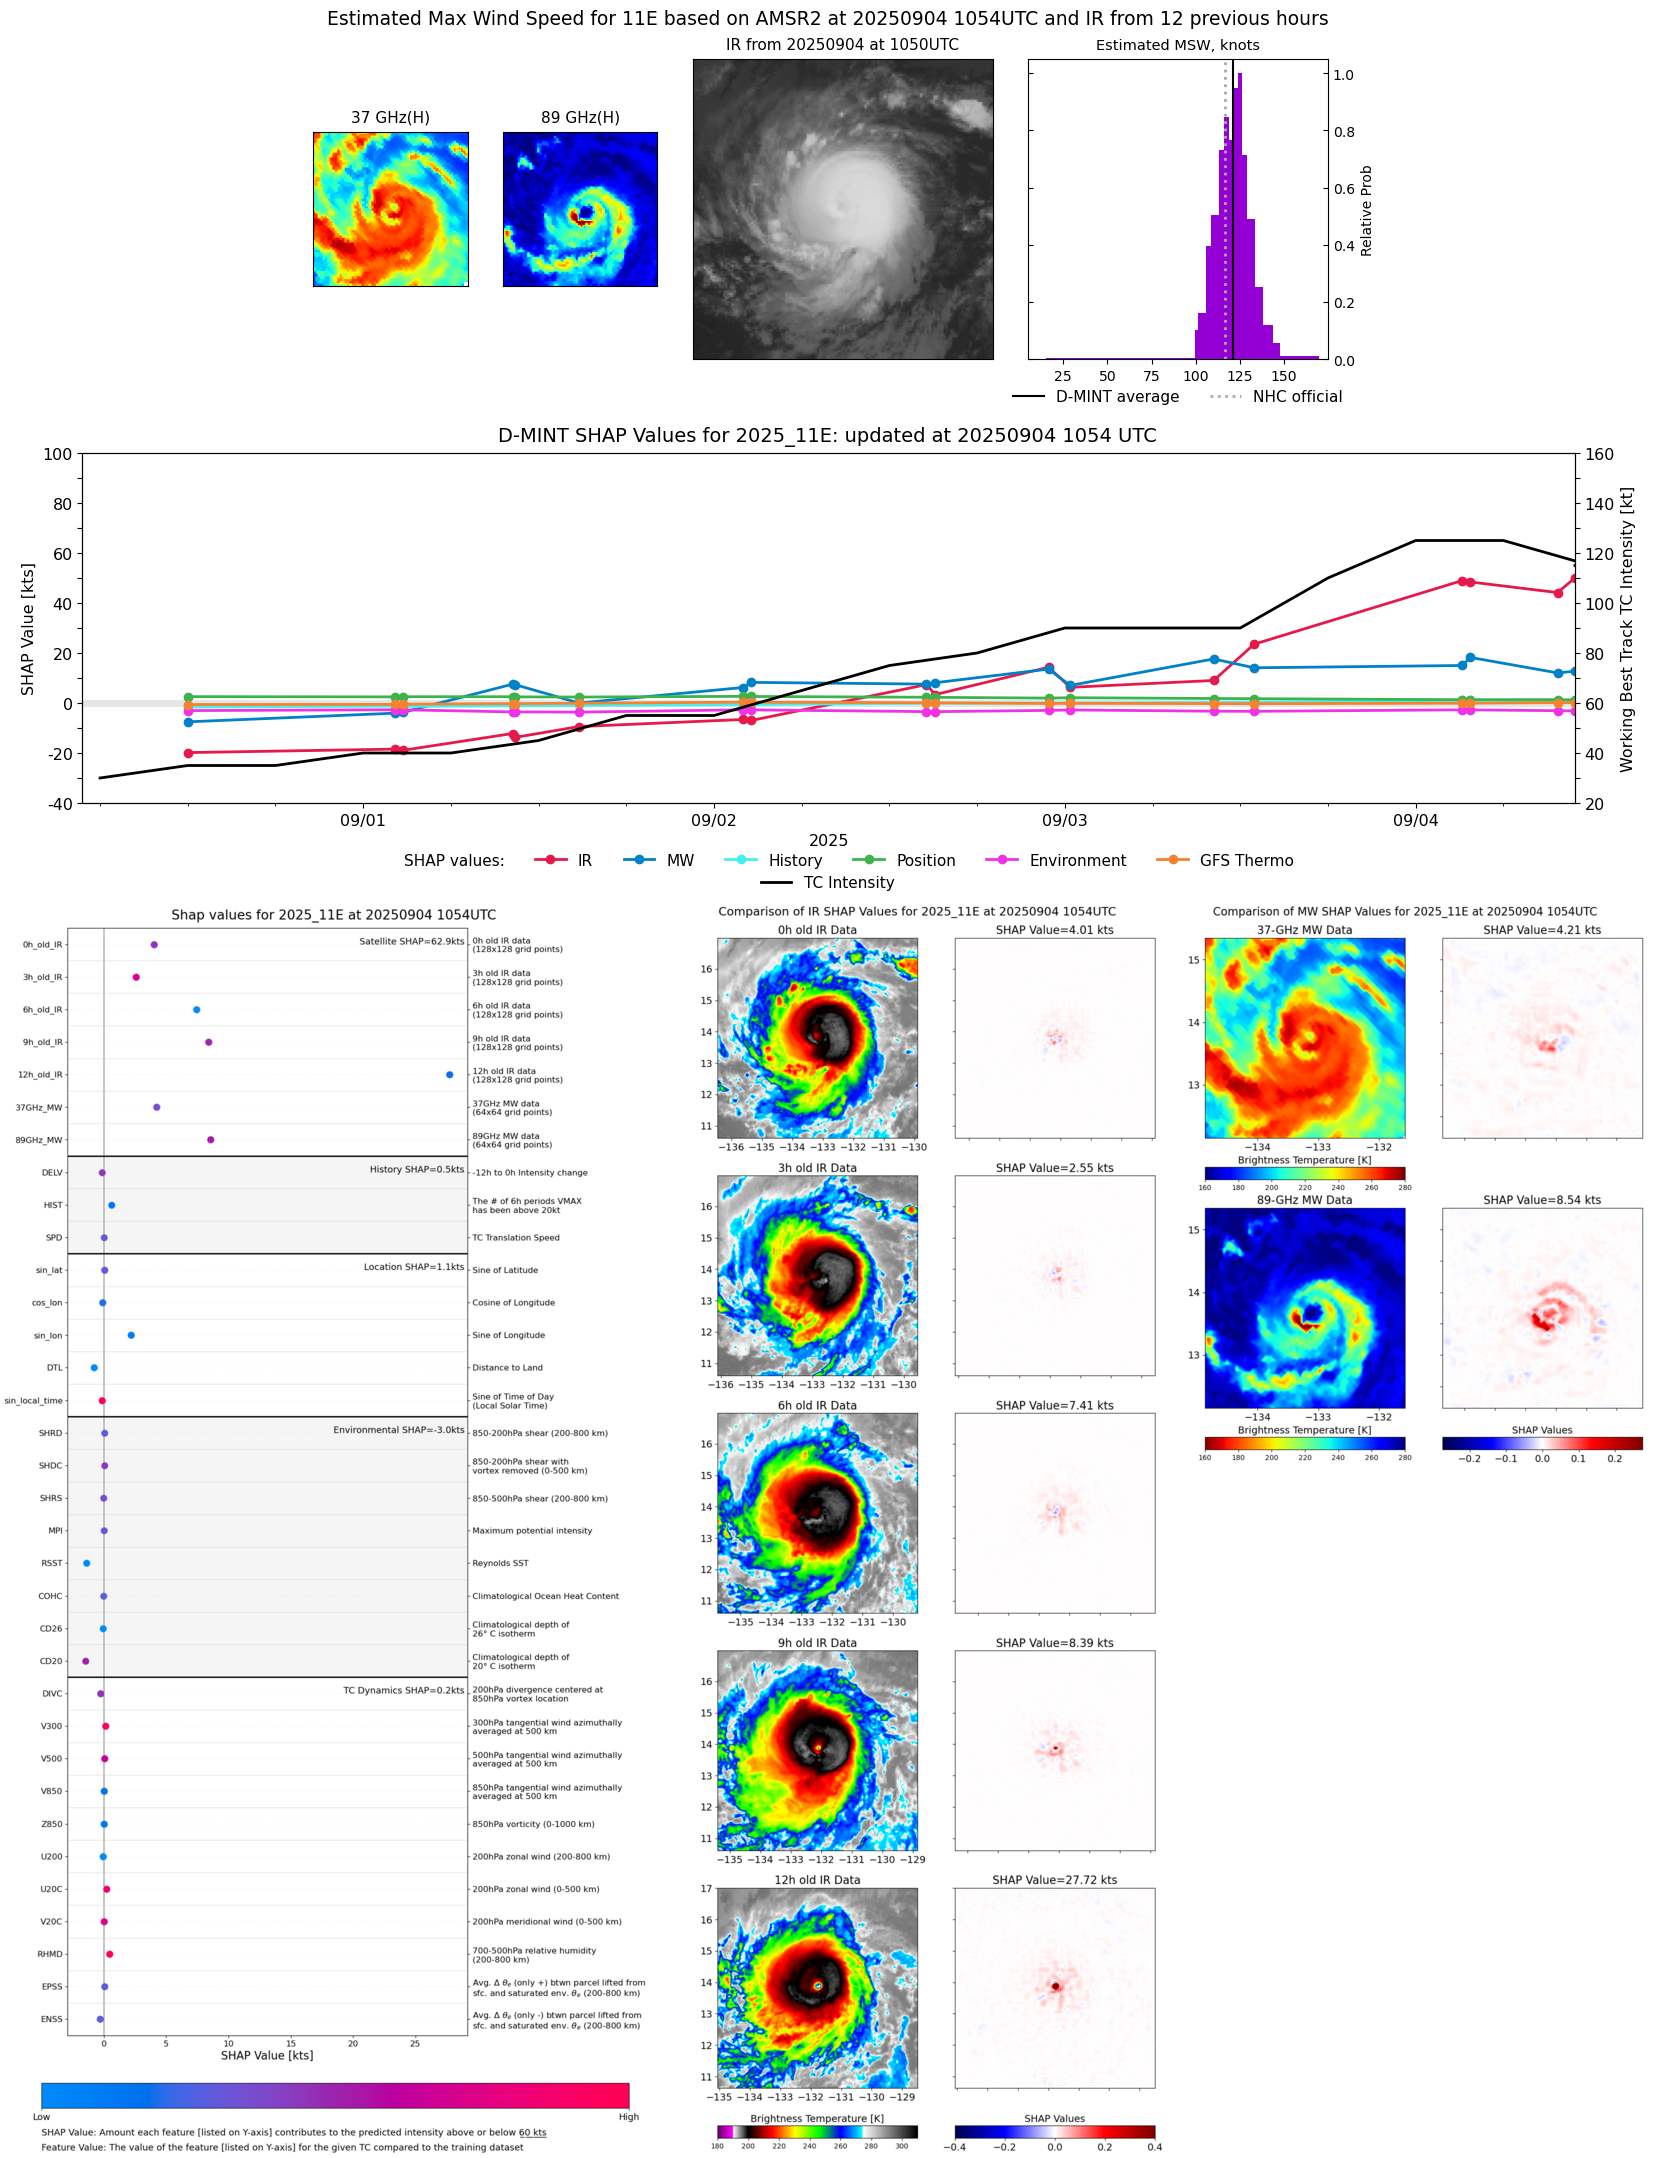 |
| 20250904 | 0952 UTC | ATMS- | 957 hPa | 115 kts | 110 kts | 121 kts |  |
| 20250904 | 0943 UTC | GMI | 957 hPa | 115 kts | 109 kts | 121 kts | 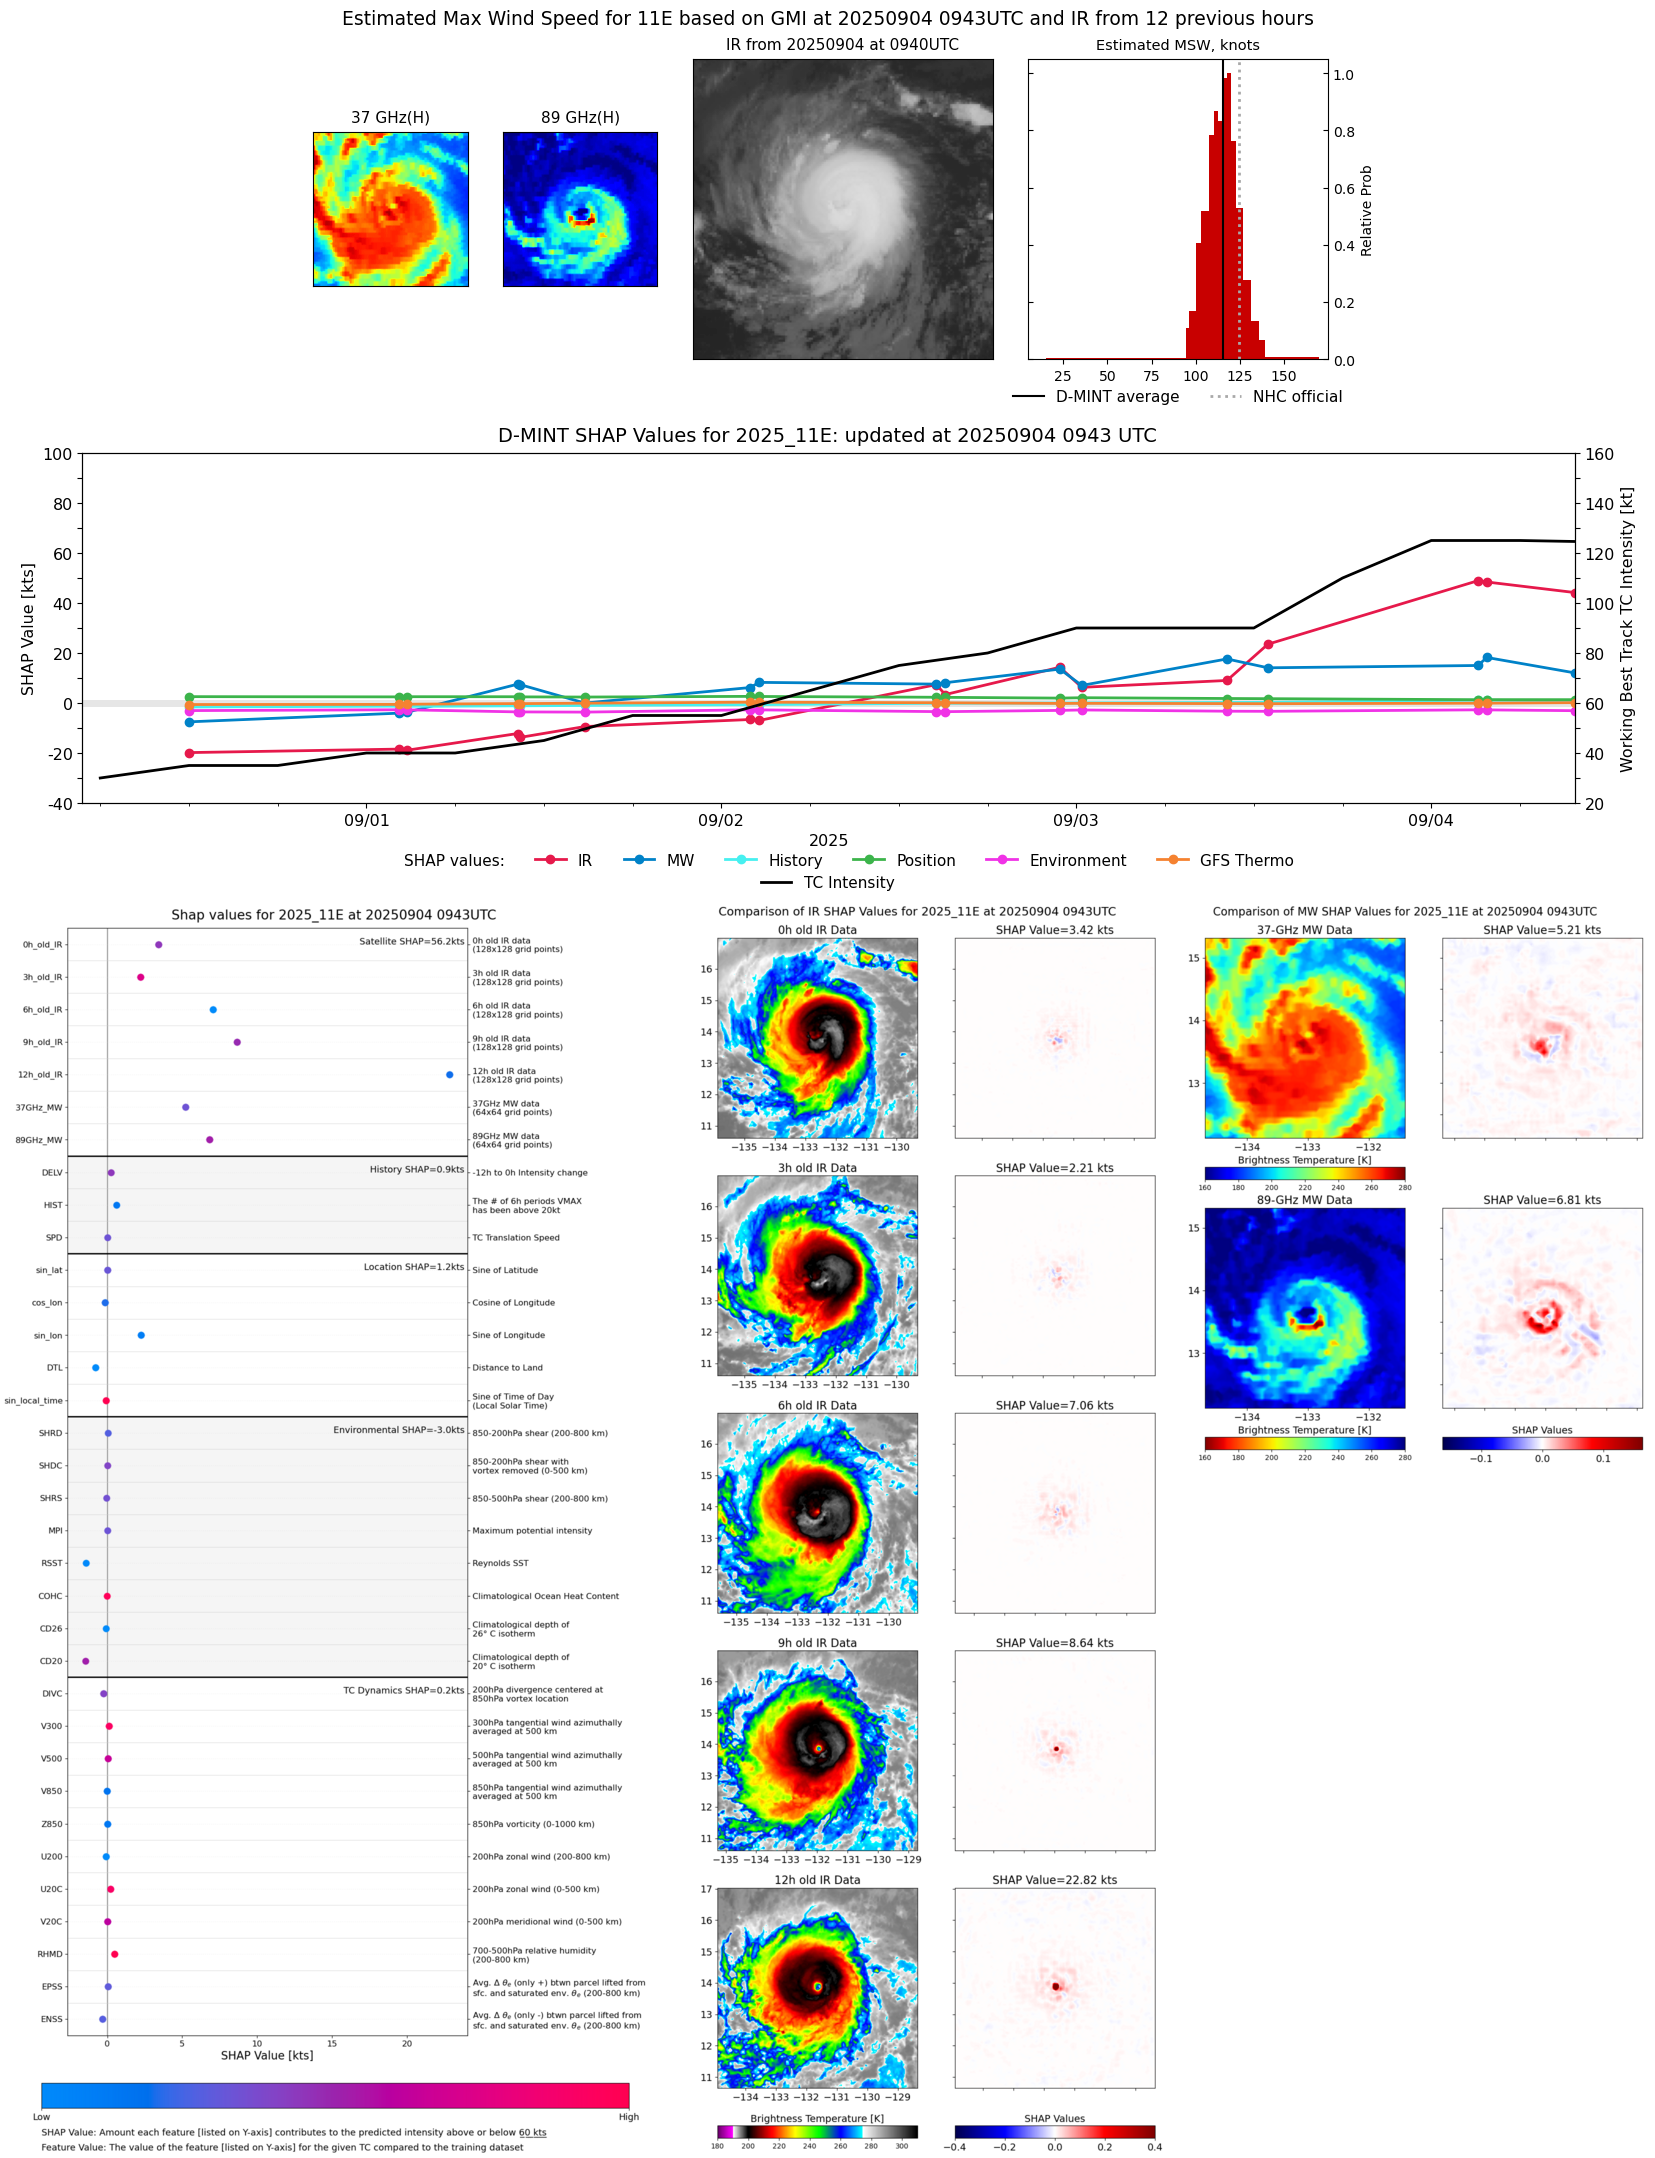 |
| 20250904 | 0717 UTC | AWS | 960 hPa | 113 kts | 107 kts | 118 kts |  |
| 20250904 | 0345 UTC | SSMISF16 | 950 hPa | 126 kts | 120 kts | 132 kts | 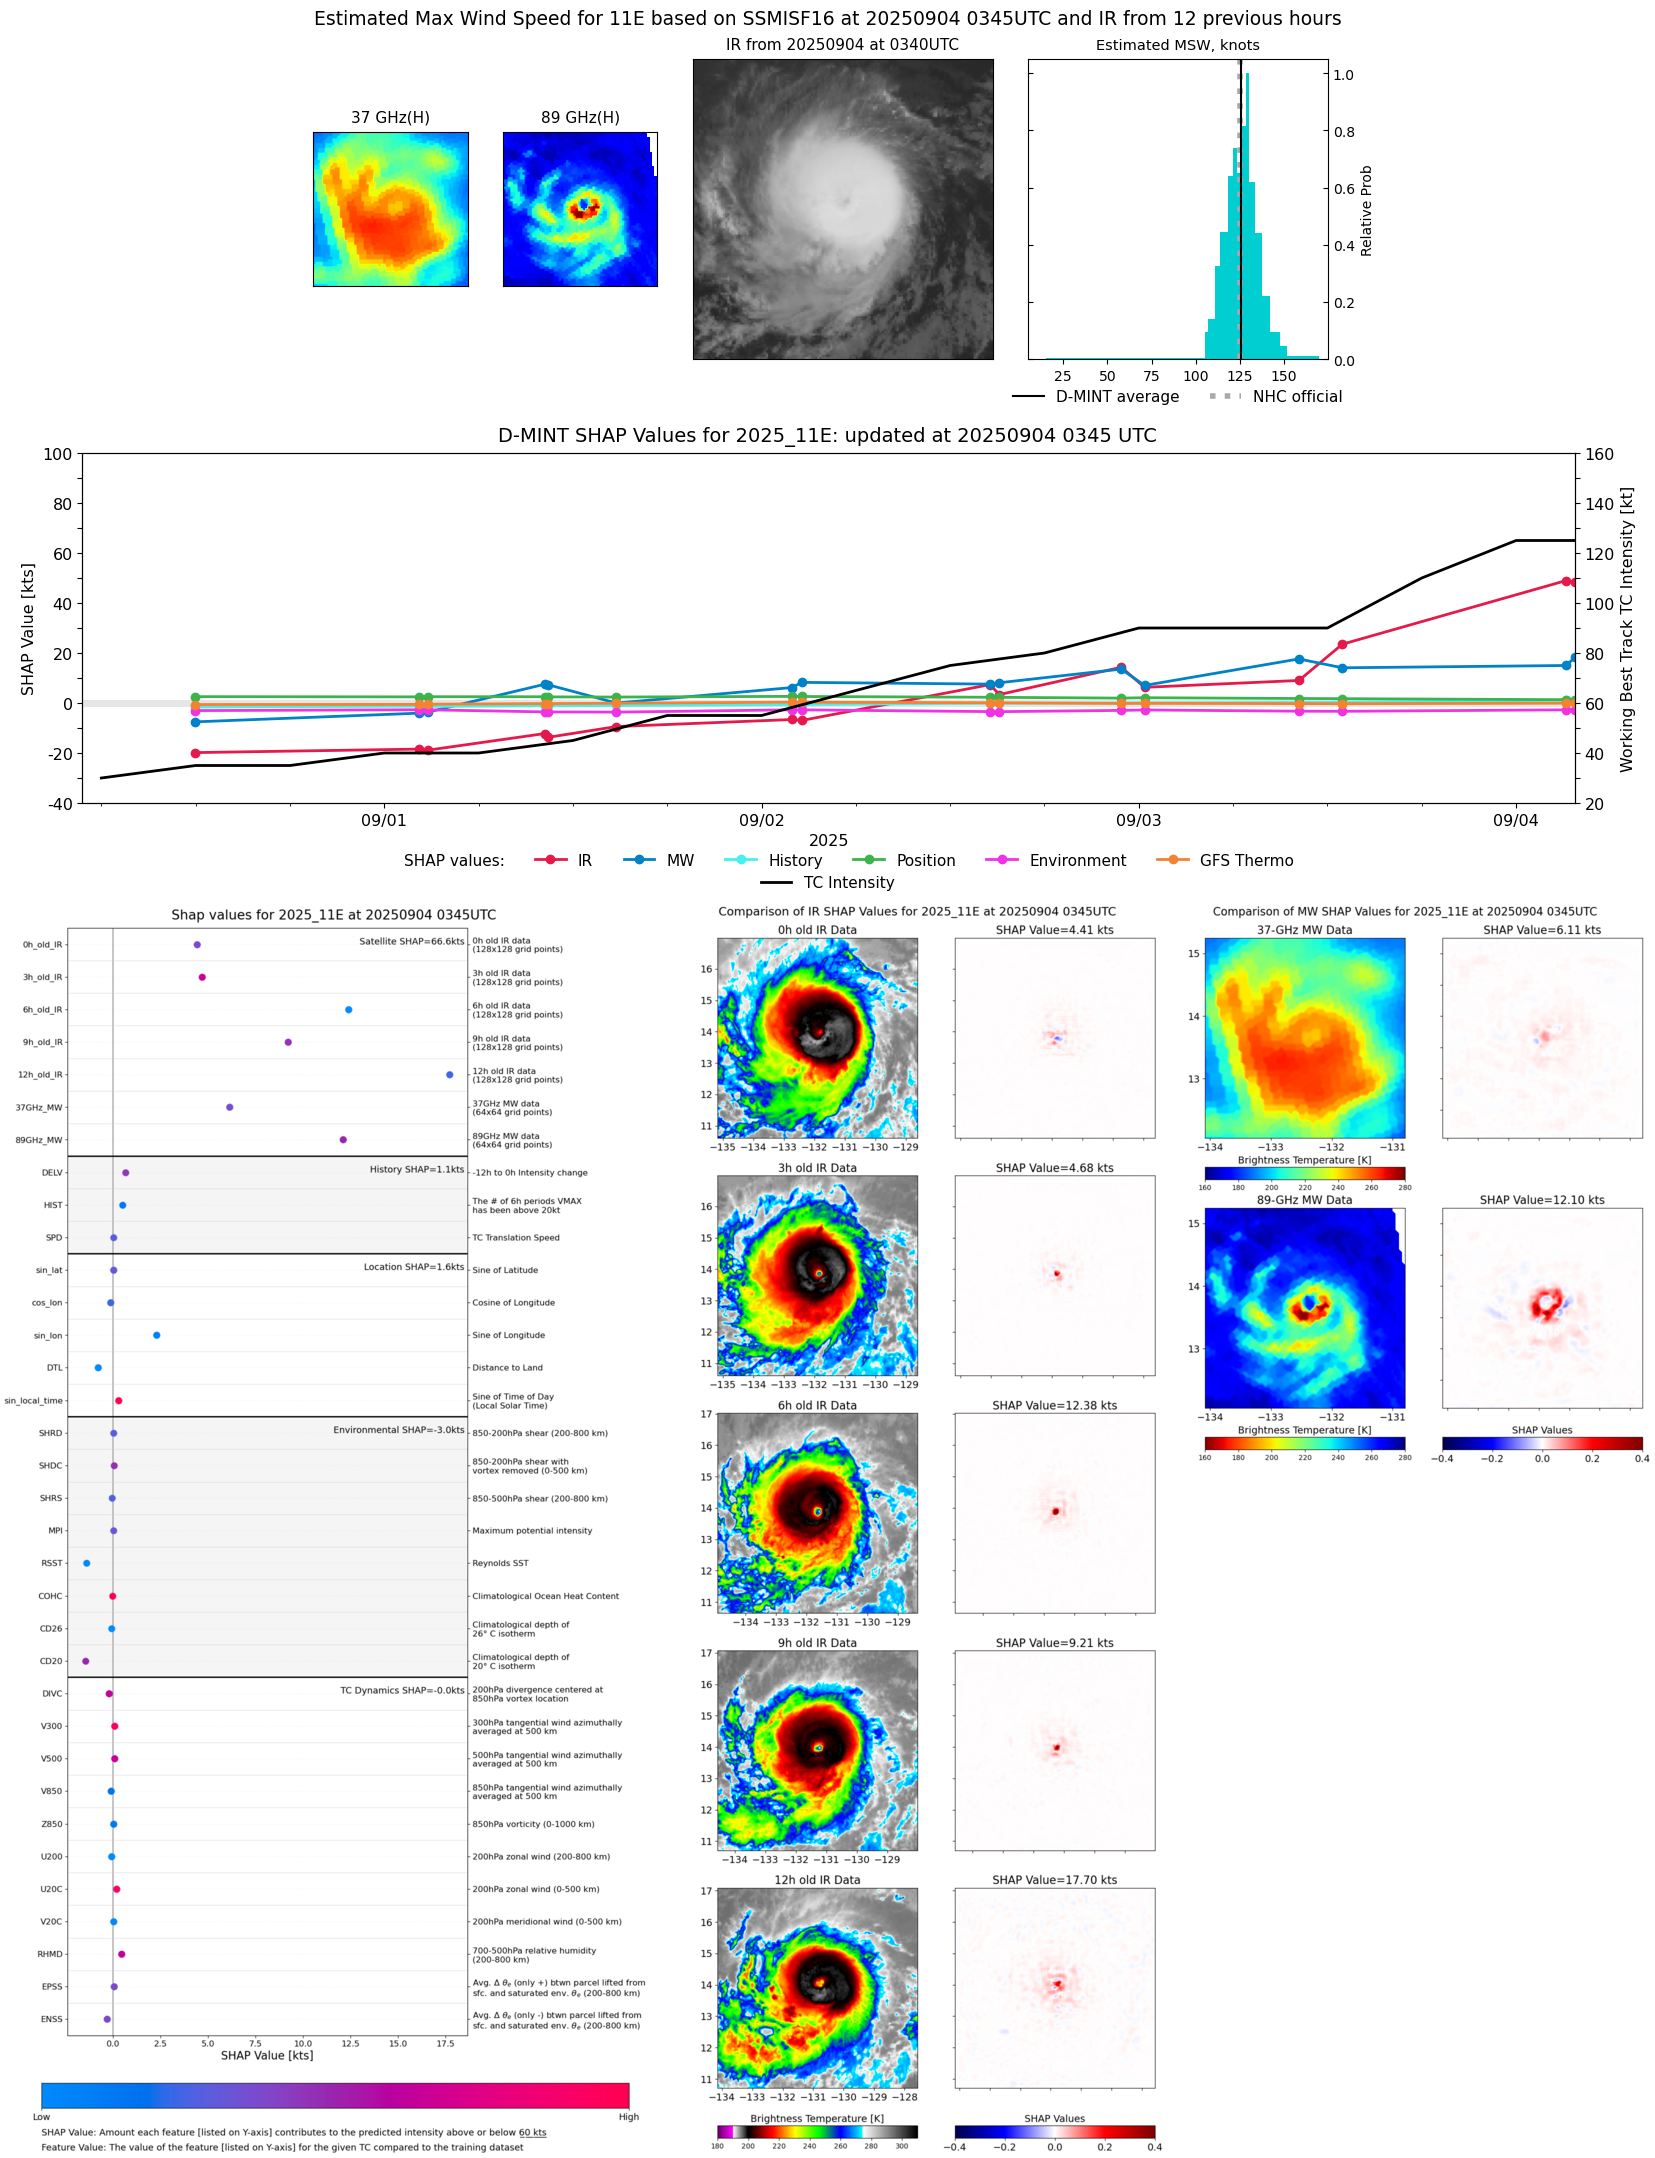 |
| 20250904 | 0310 UTC | SSMISF17 | 950 hPa | 123 kts | 116 kts | 130 kts | 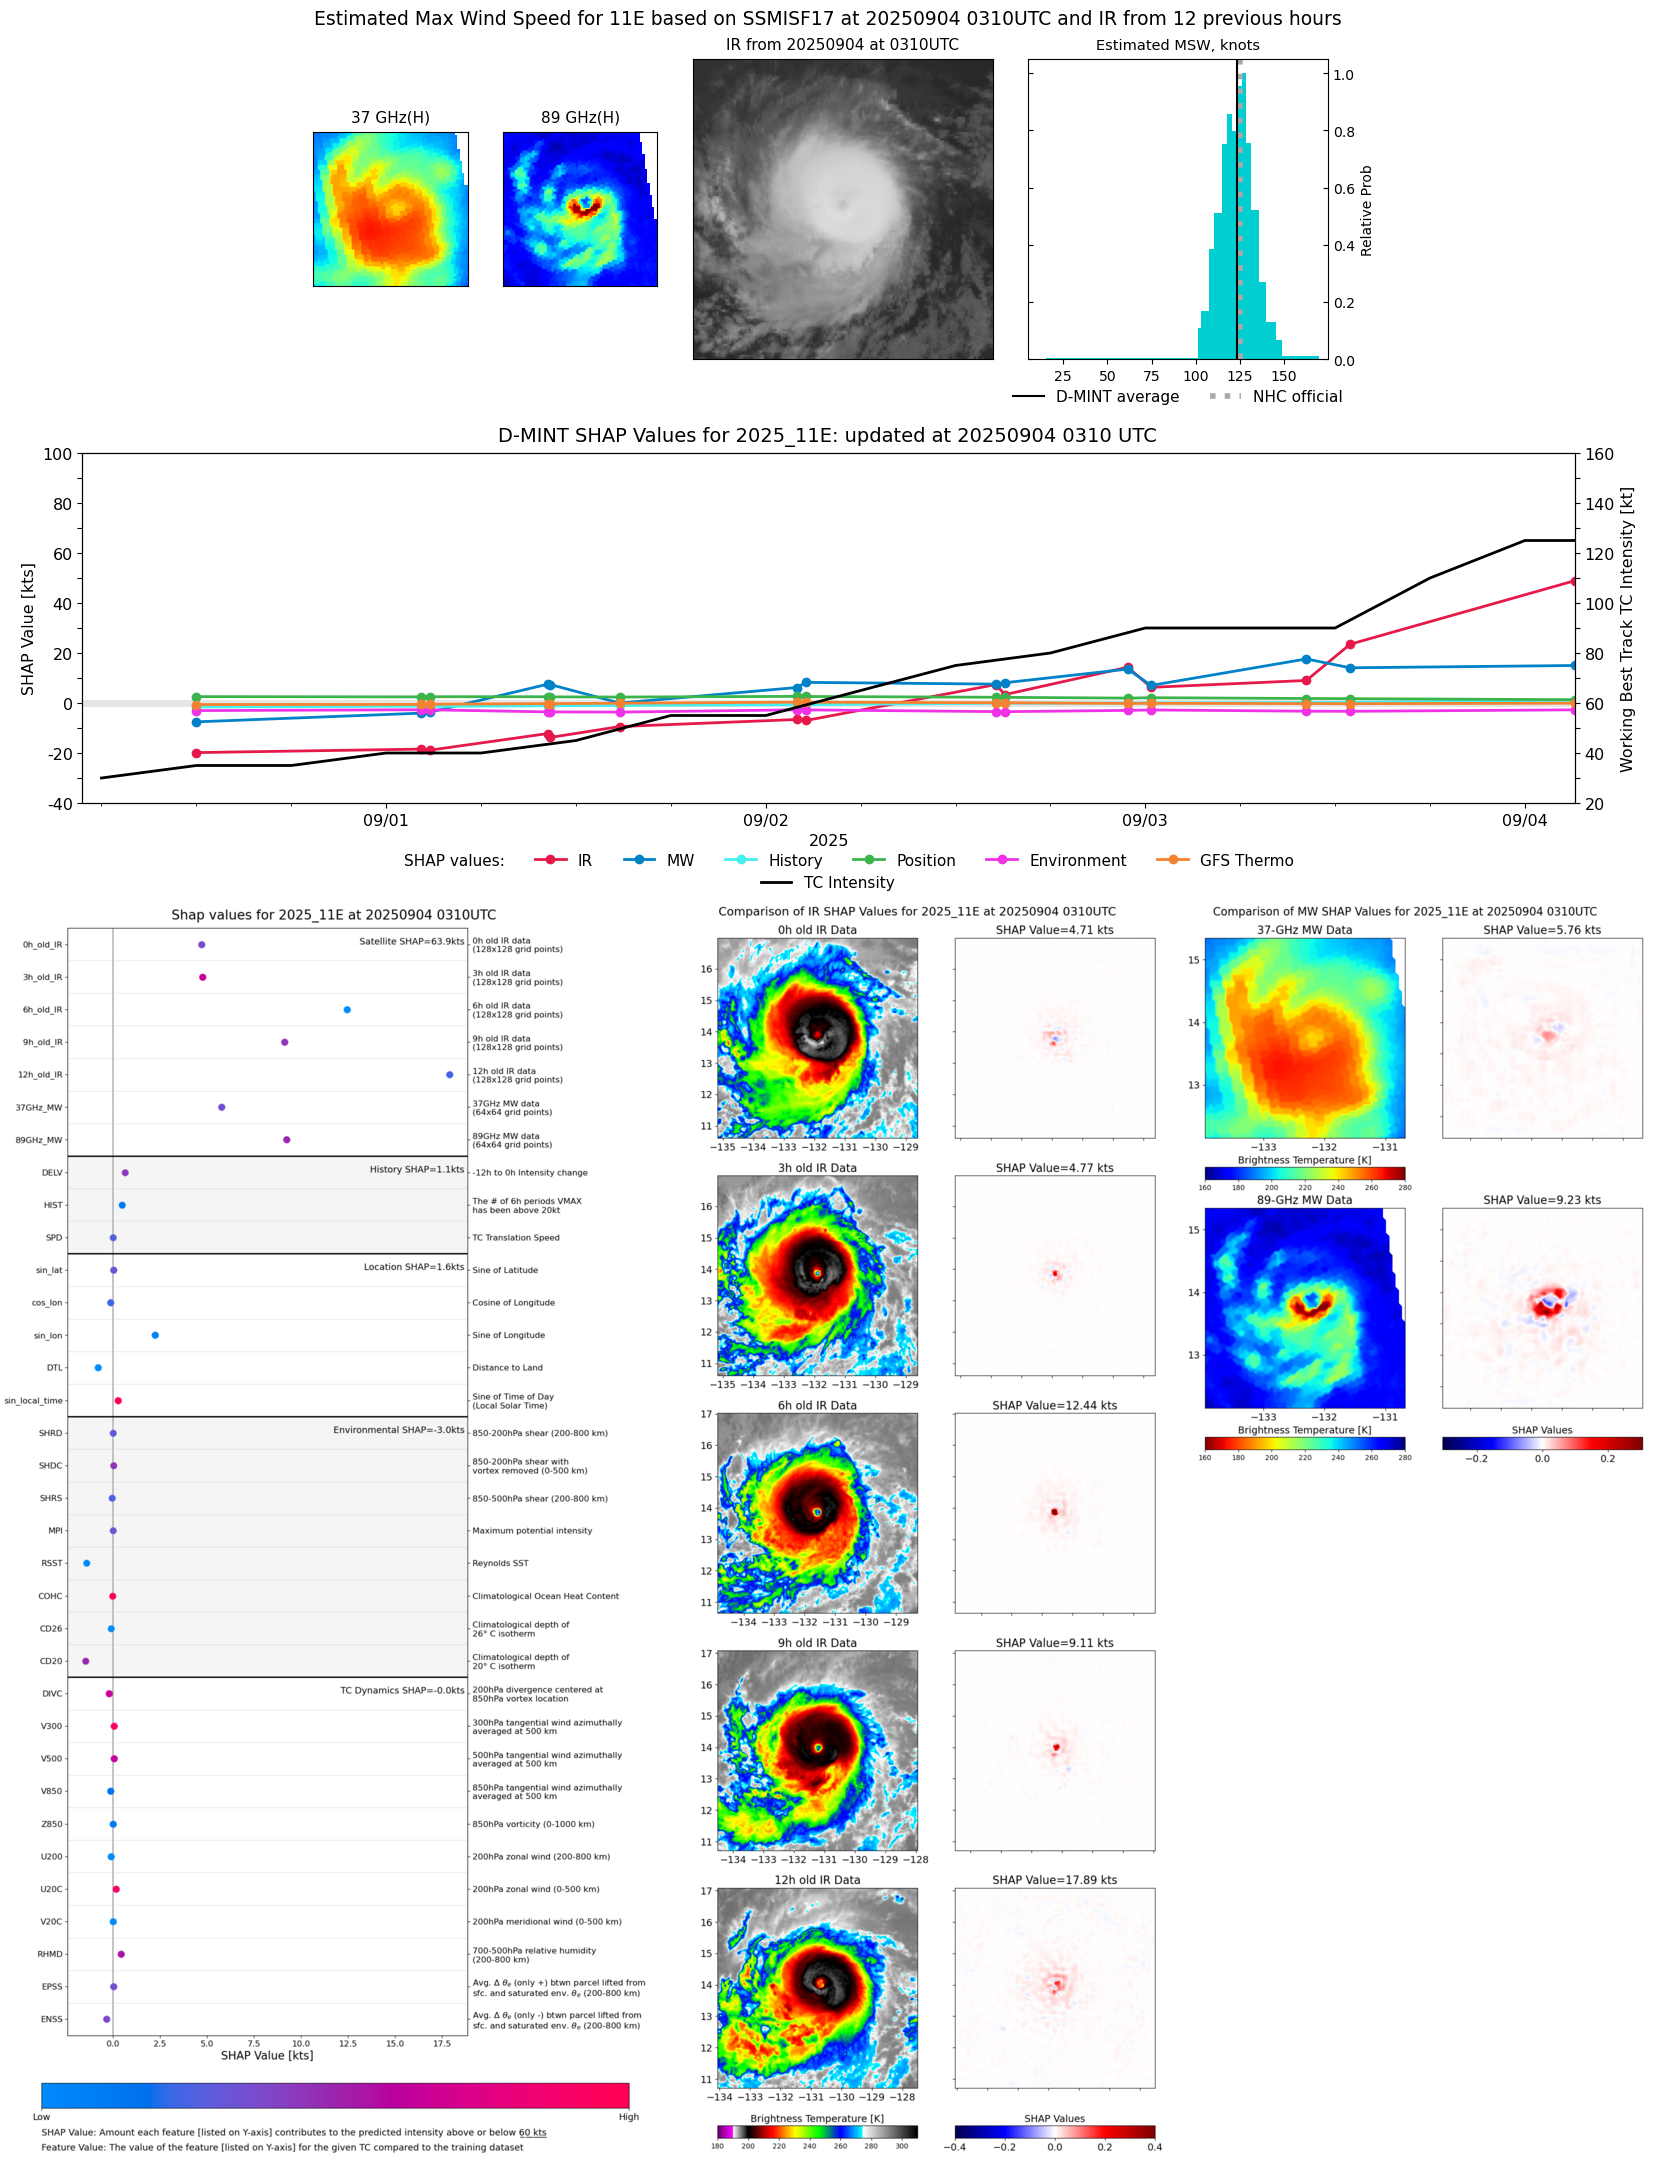 |
| 20250903 | 2142 UTC | ATMS-N20 | 954 hPa | 114 kts | 108 kts | 120 kts | 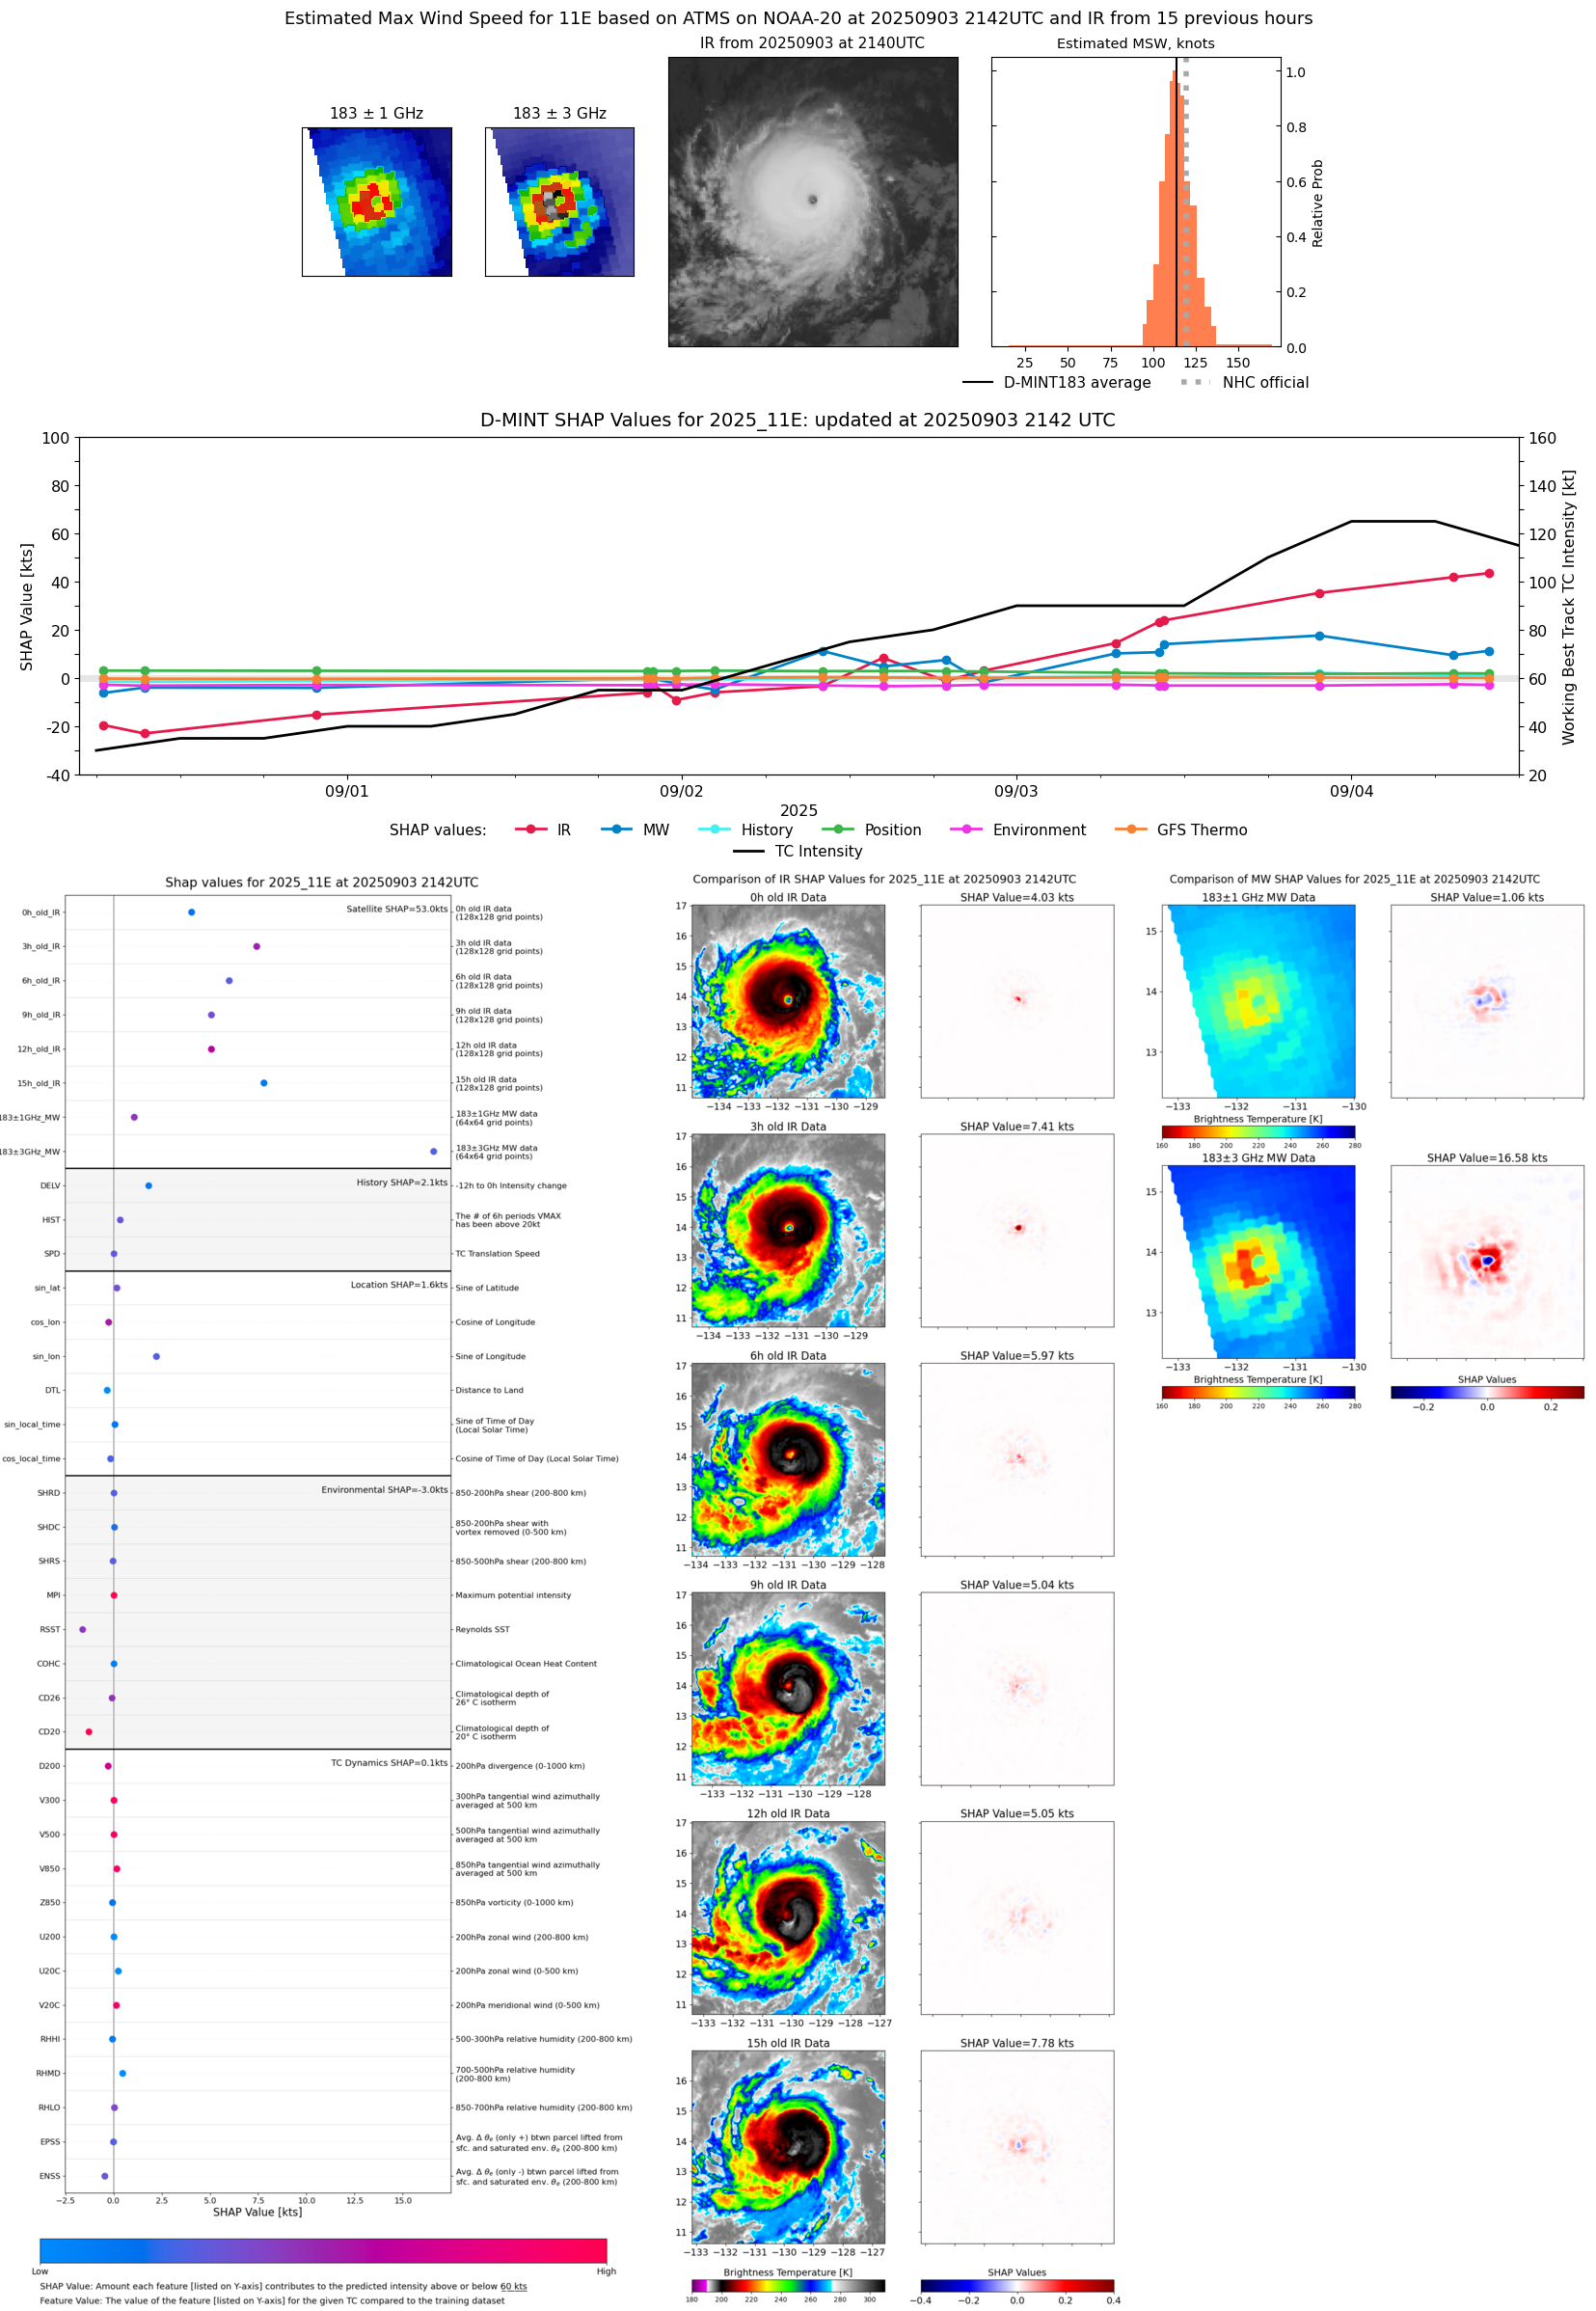 |
| 20250903 | 1902 UTC | TMS05 | 960 hPa | 108 kts | 102 kts | 113 kts | 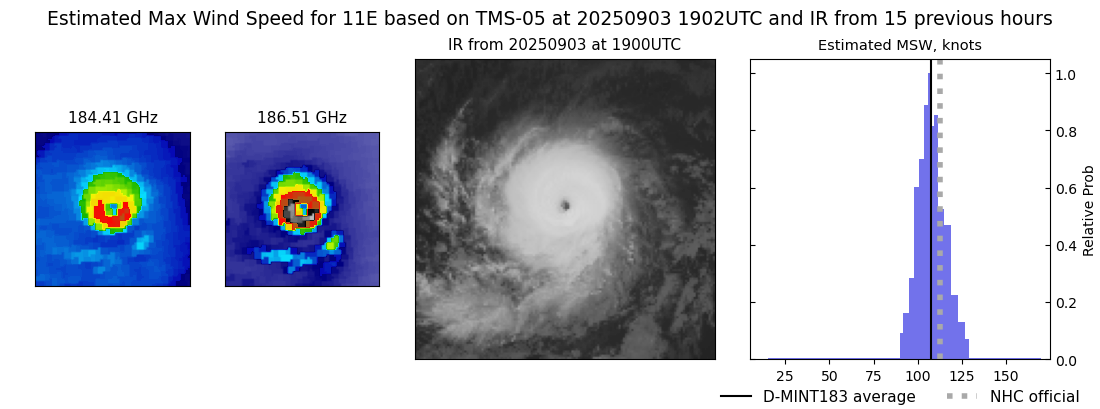 |
| 20250903 | 1446 UTC | WSFM01 | 970 hPa | 103 kts | 96 kts | 110 kts |  |
| 20250903 | 1257 UTC | SSMISF18 | 972 hPa | 96 kts | 89 kts | 102 kts | 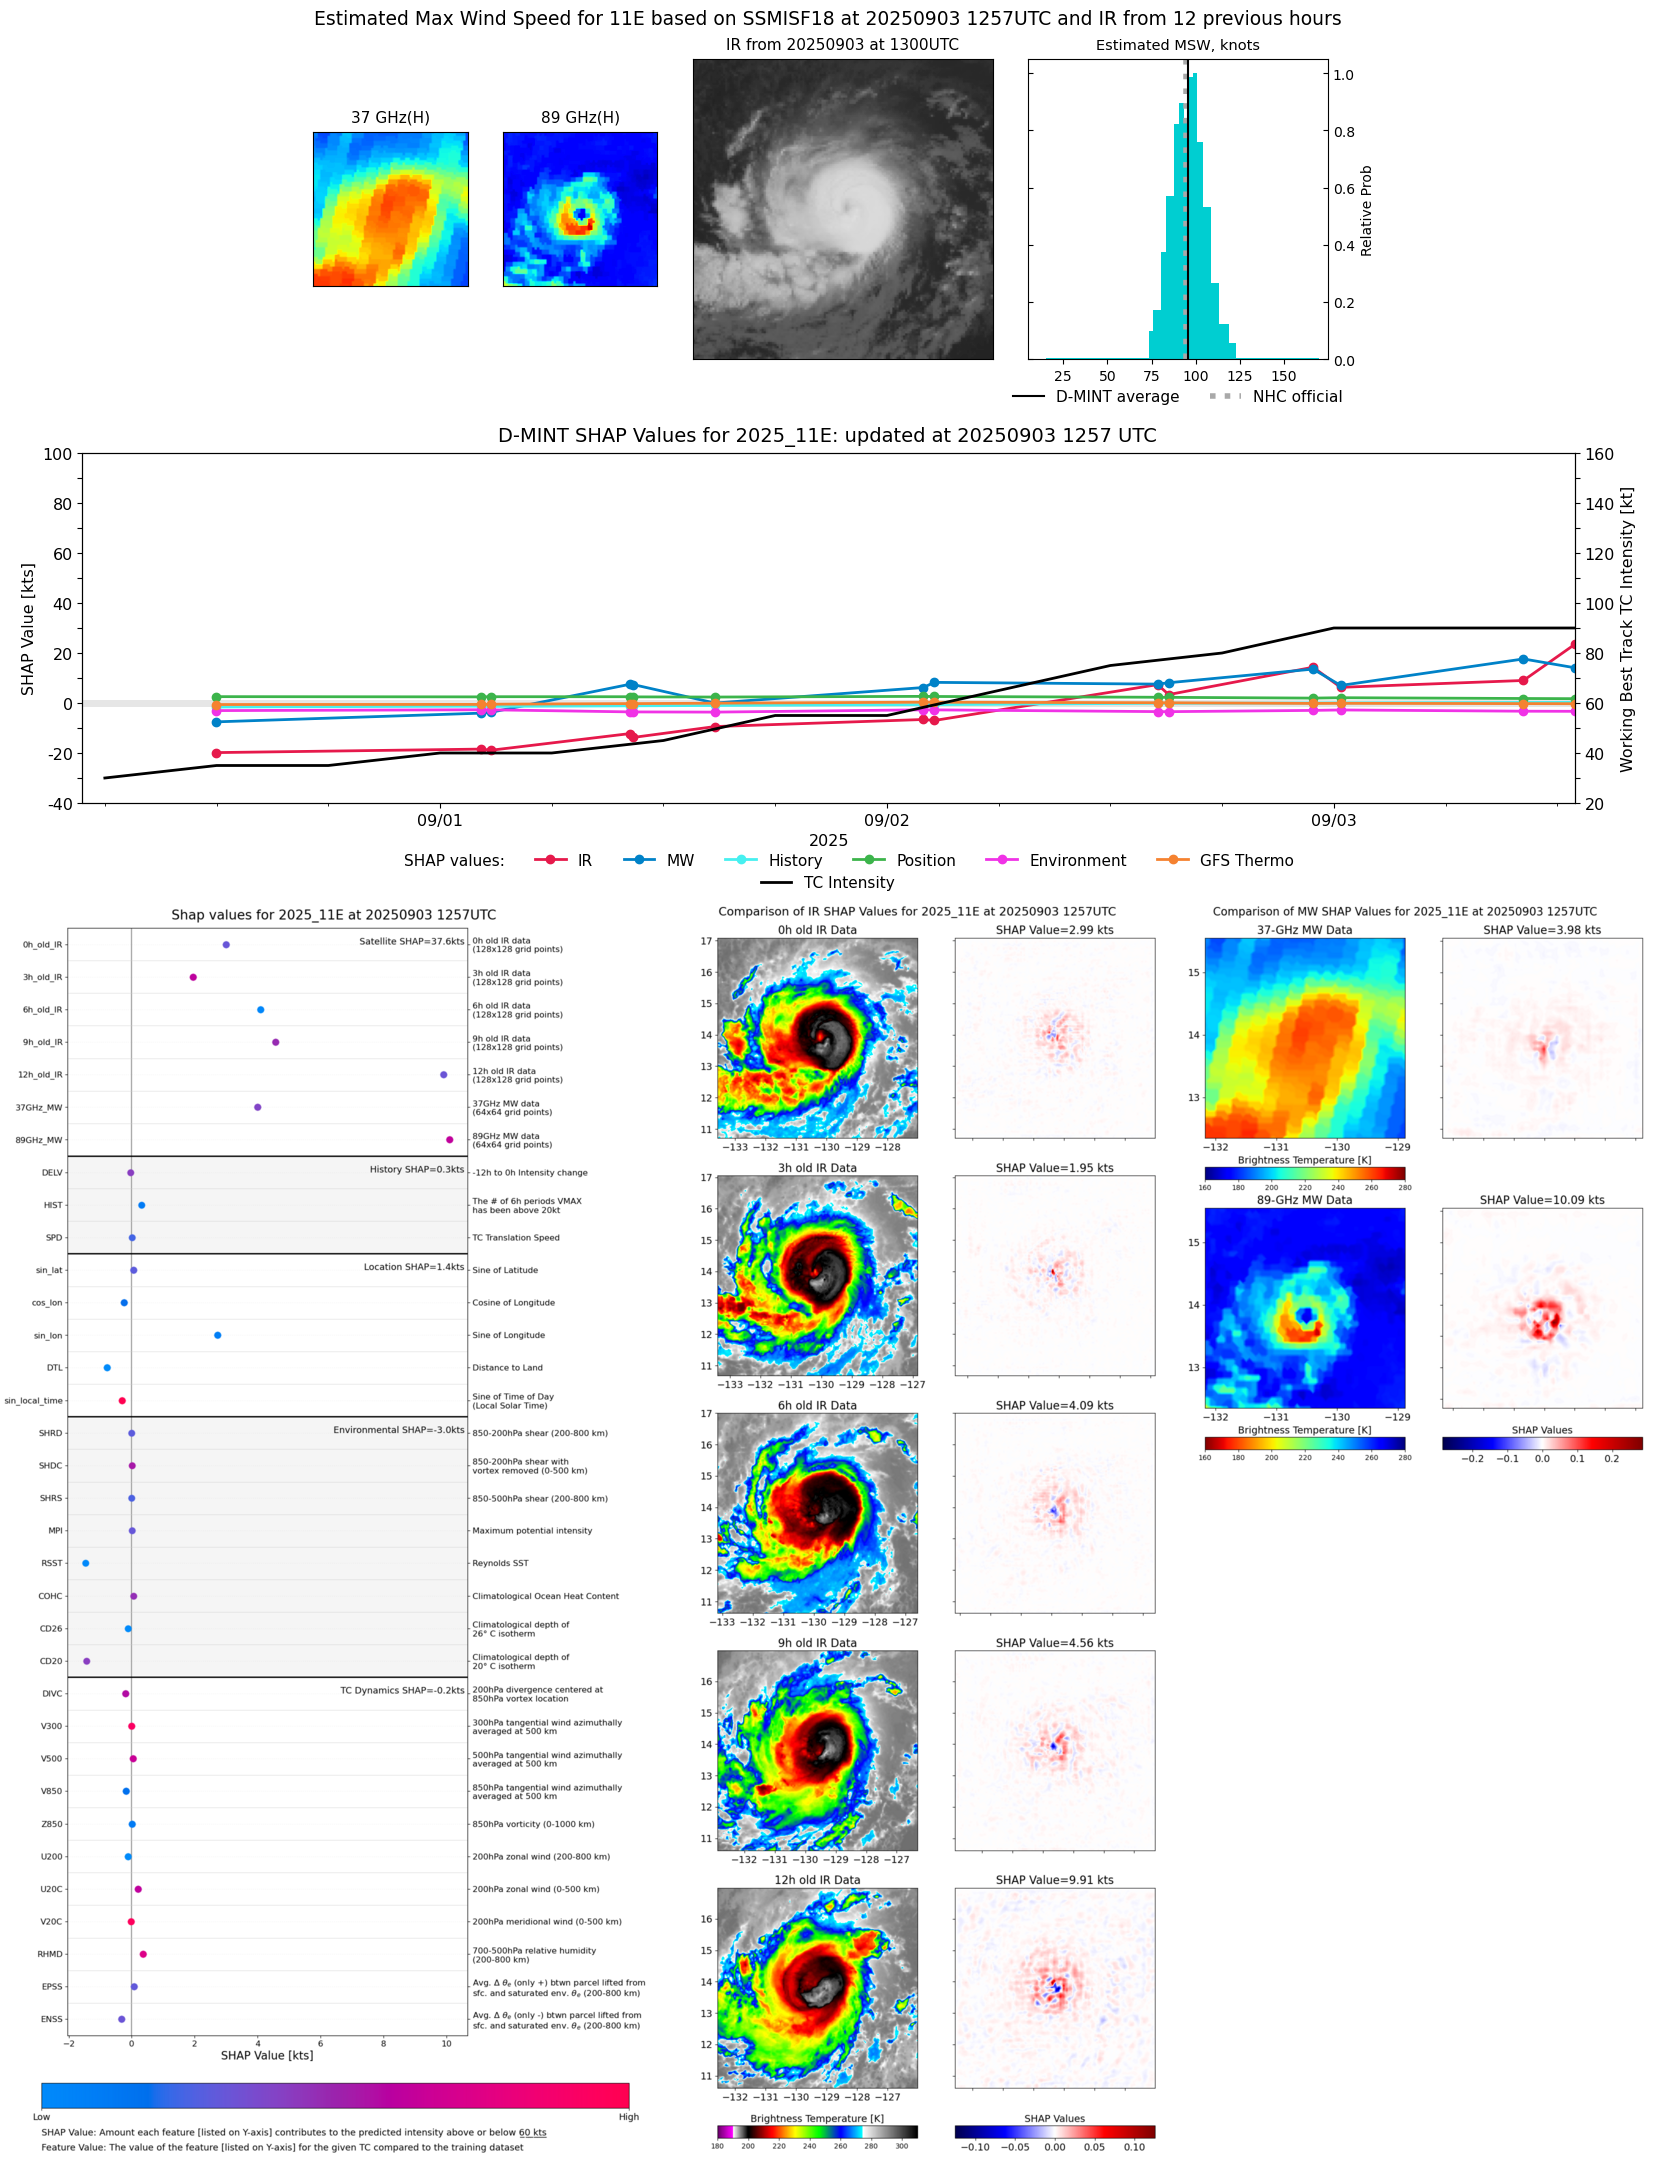 |
| 20250903 | 1033 UTC | ATMS-N20 | 966 hPa | 98 kts | 92 kts | 104 kts |  |
| 20250903 | 1011 UTC | AMSR2 | 979 hPa | 85 kts | 79 kts | 91 kts | 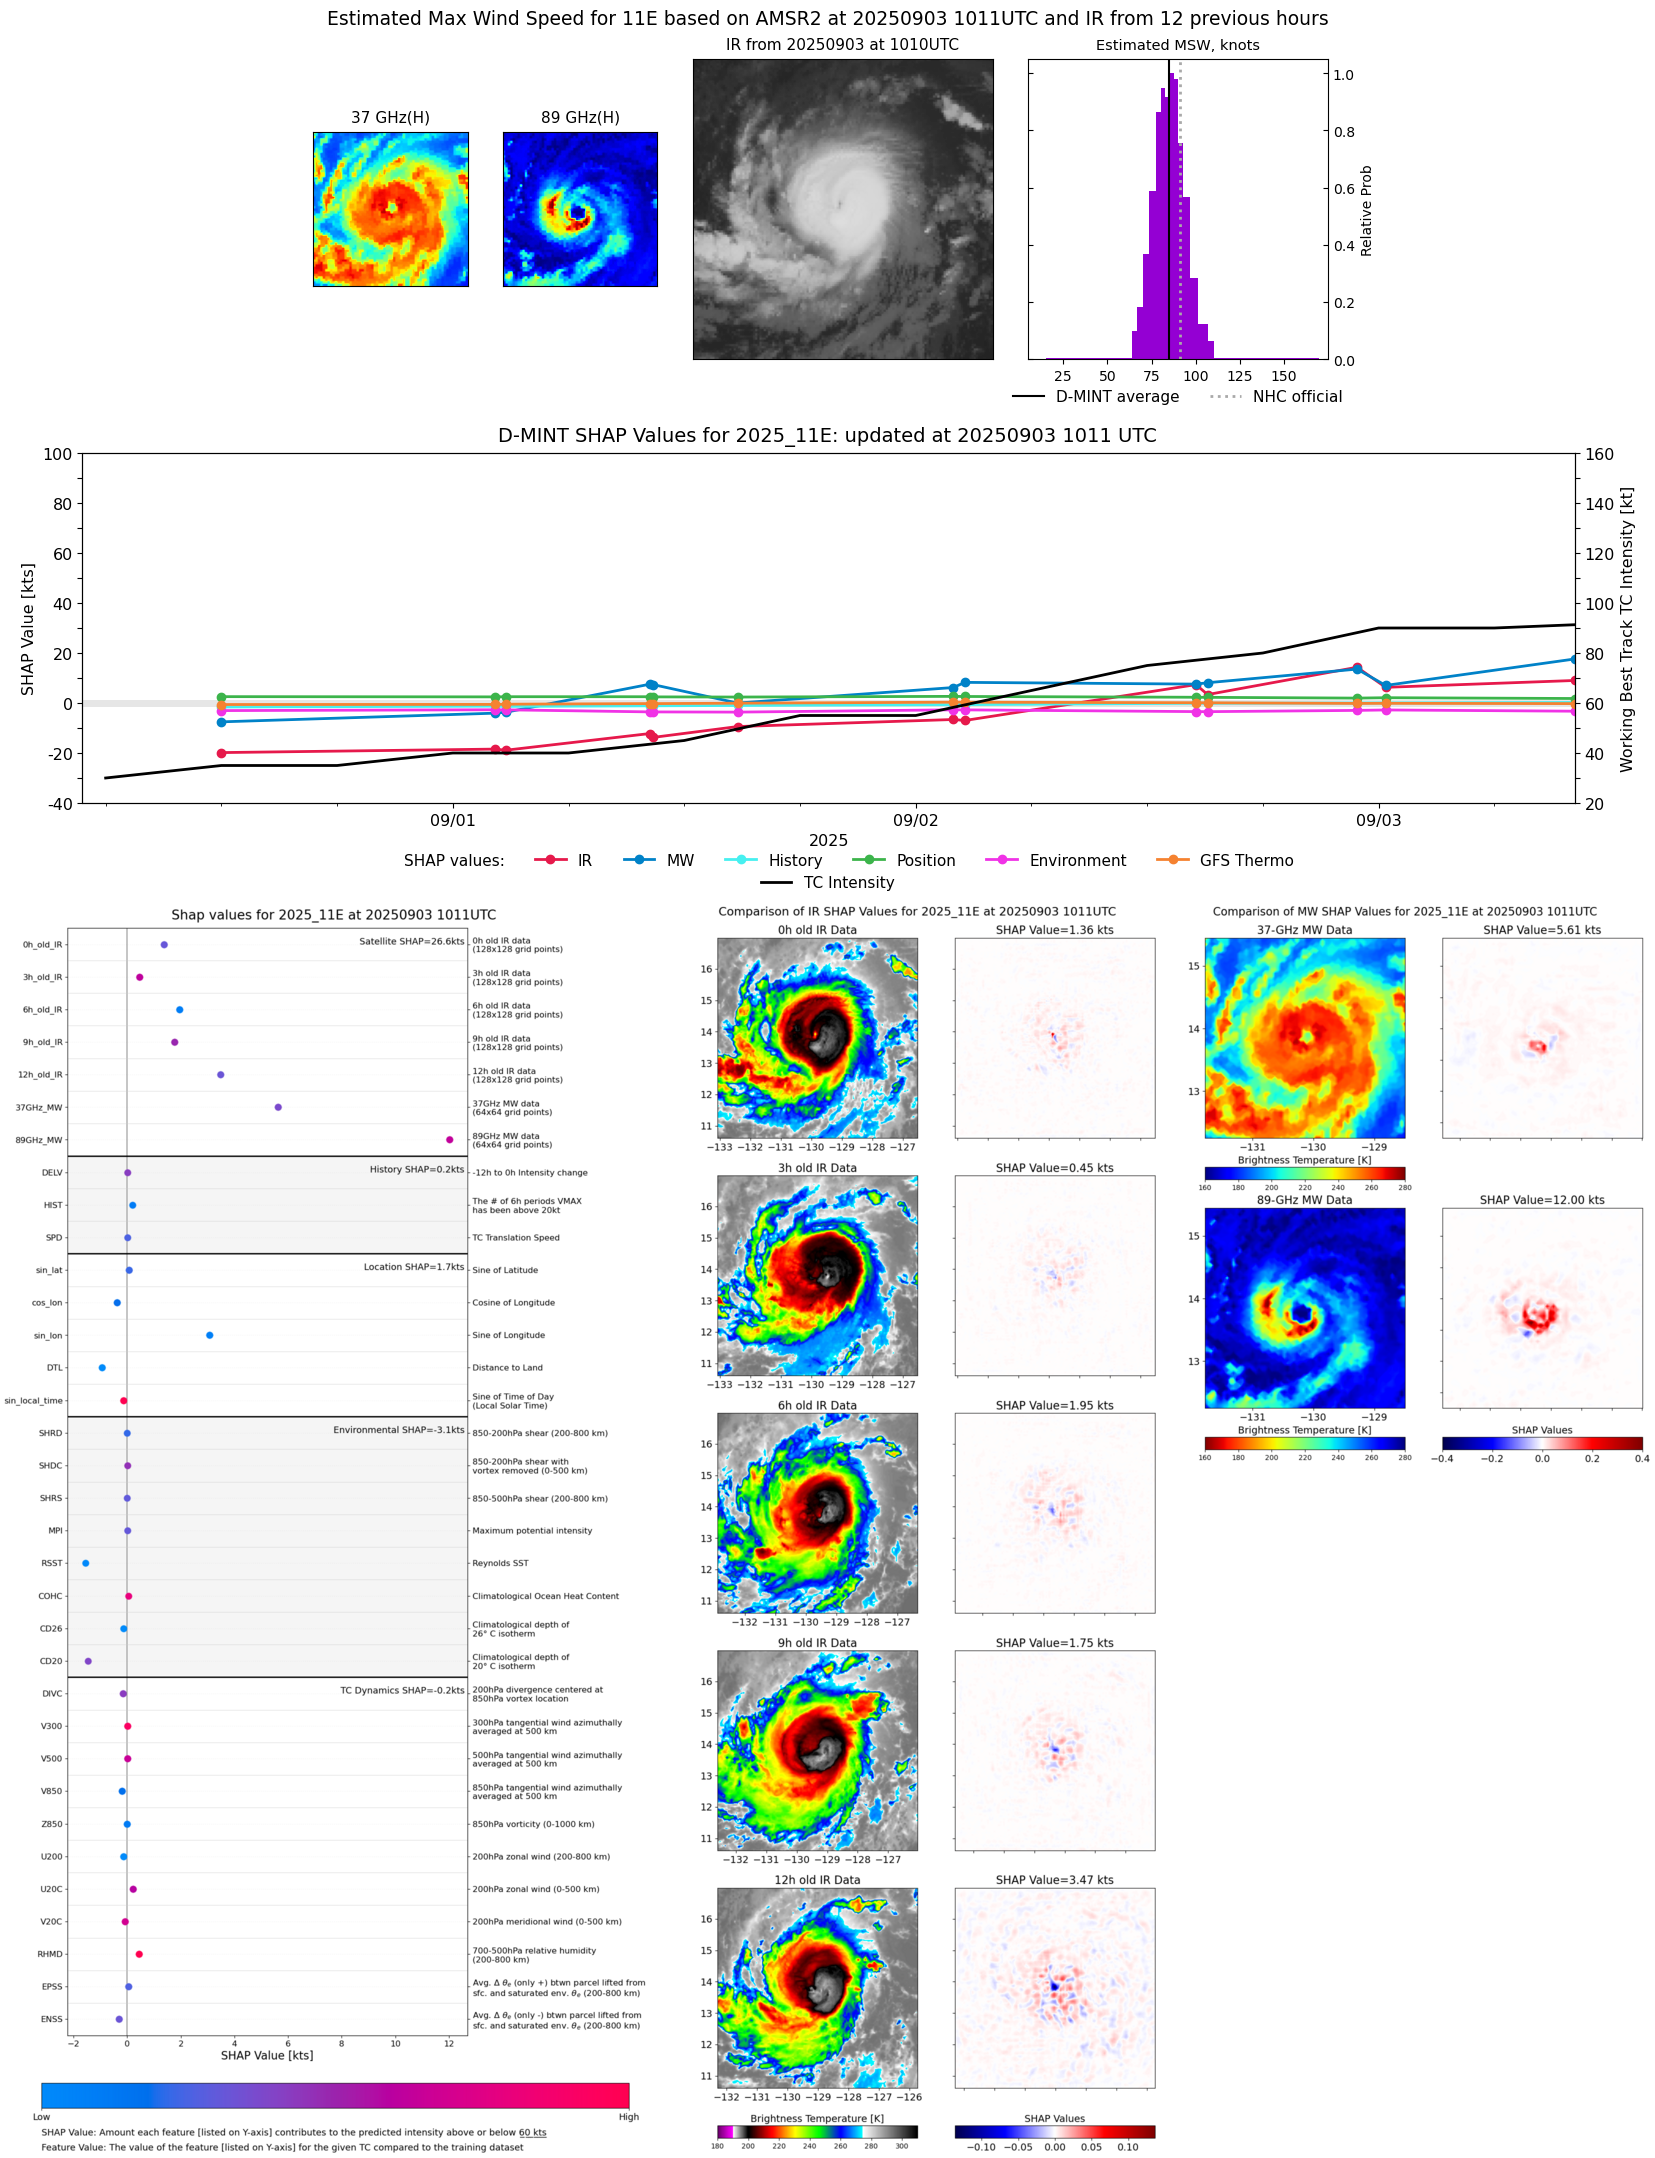 |
| 20250903 | 1011 UTC | ATMS-NPP | 966 hPa | 94 kts | 88 kts | 100 kts |  |
| 20250903 | 0707 UTC | TMS02 | 978 hPa | 85 kts | 80 kts | 91 kts | 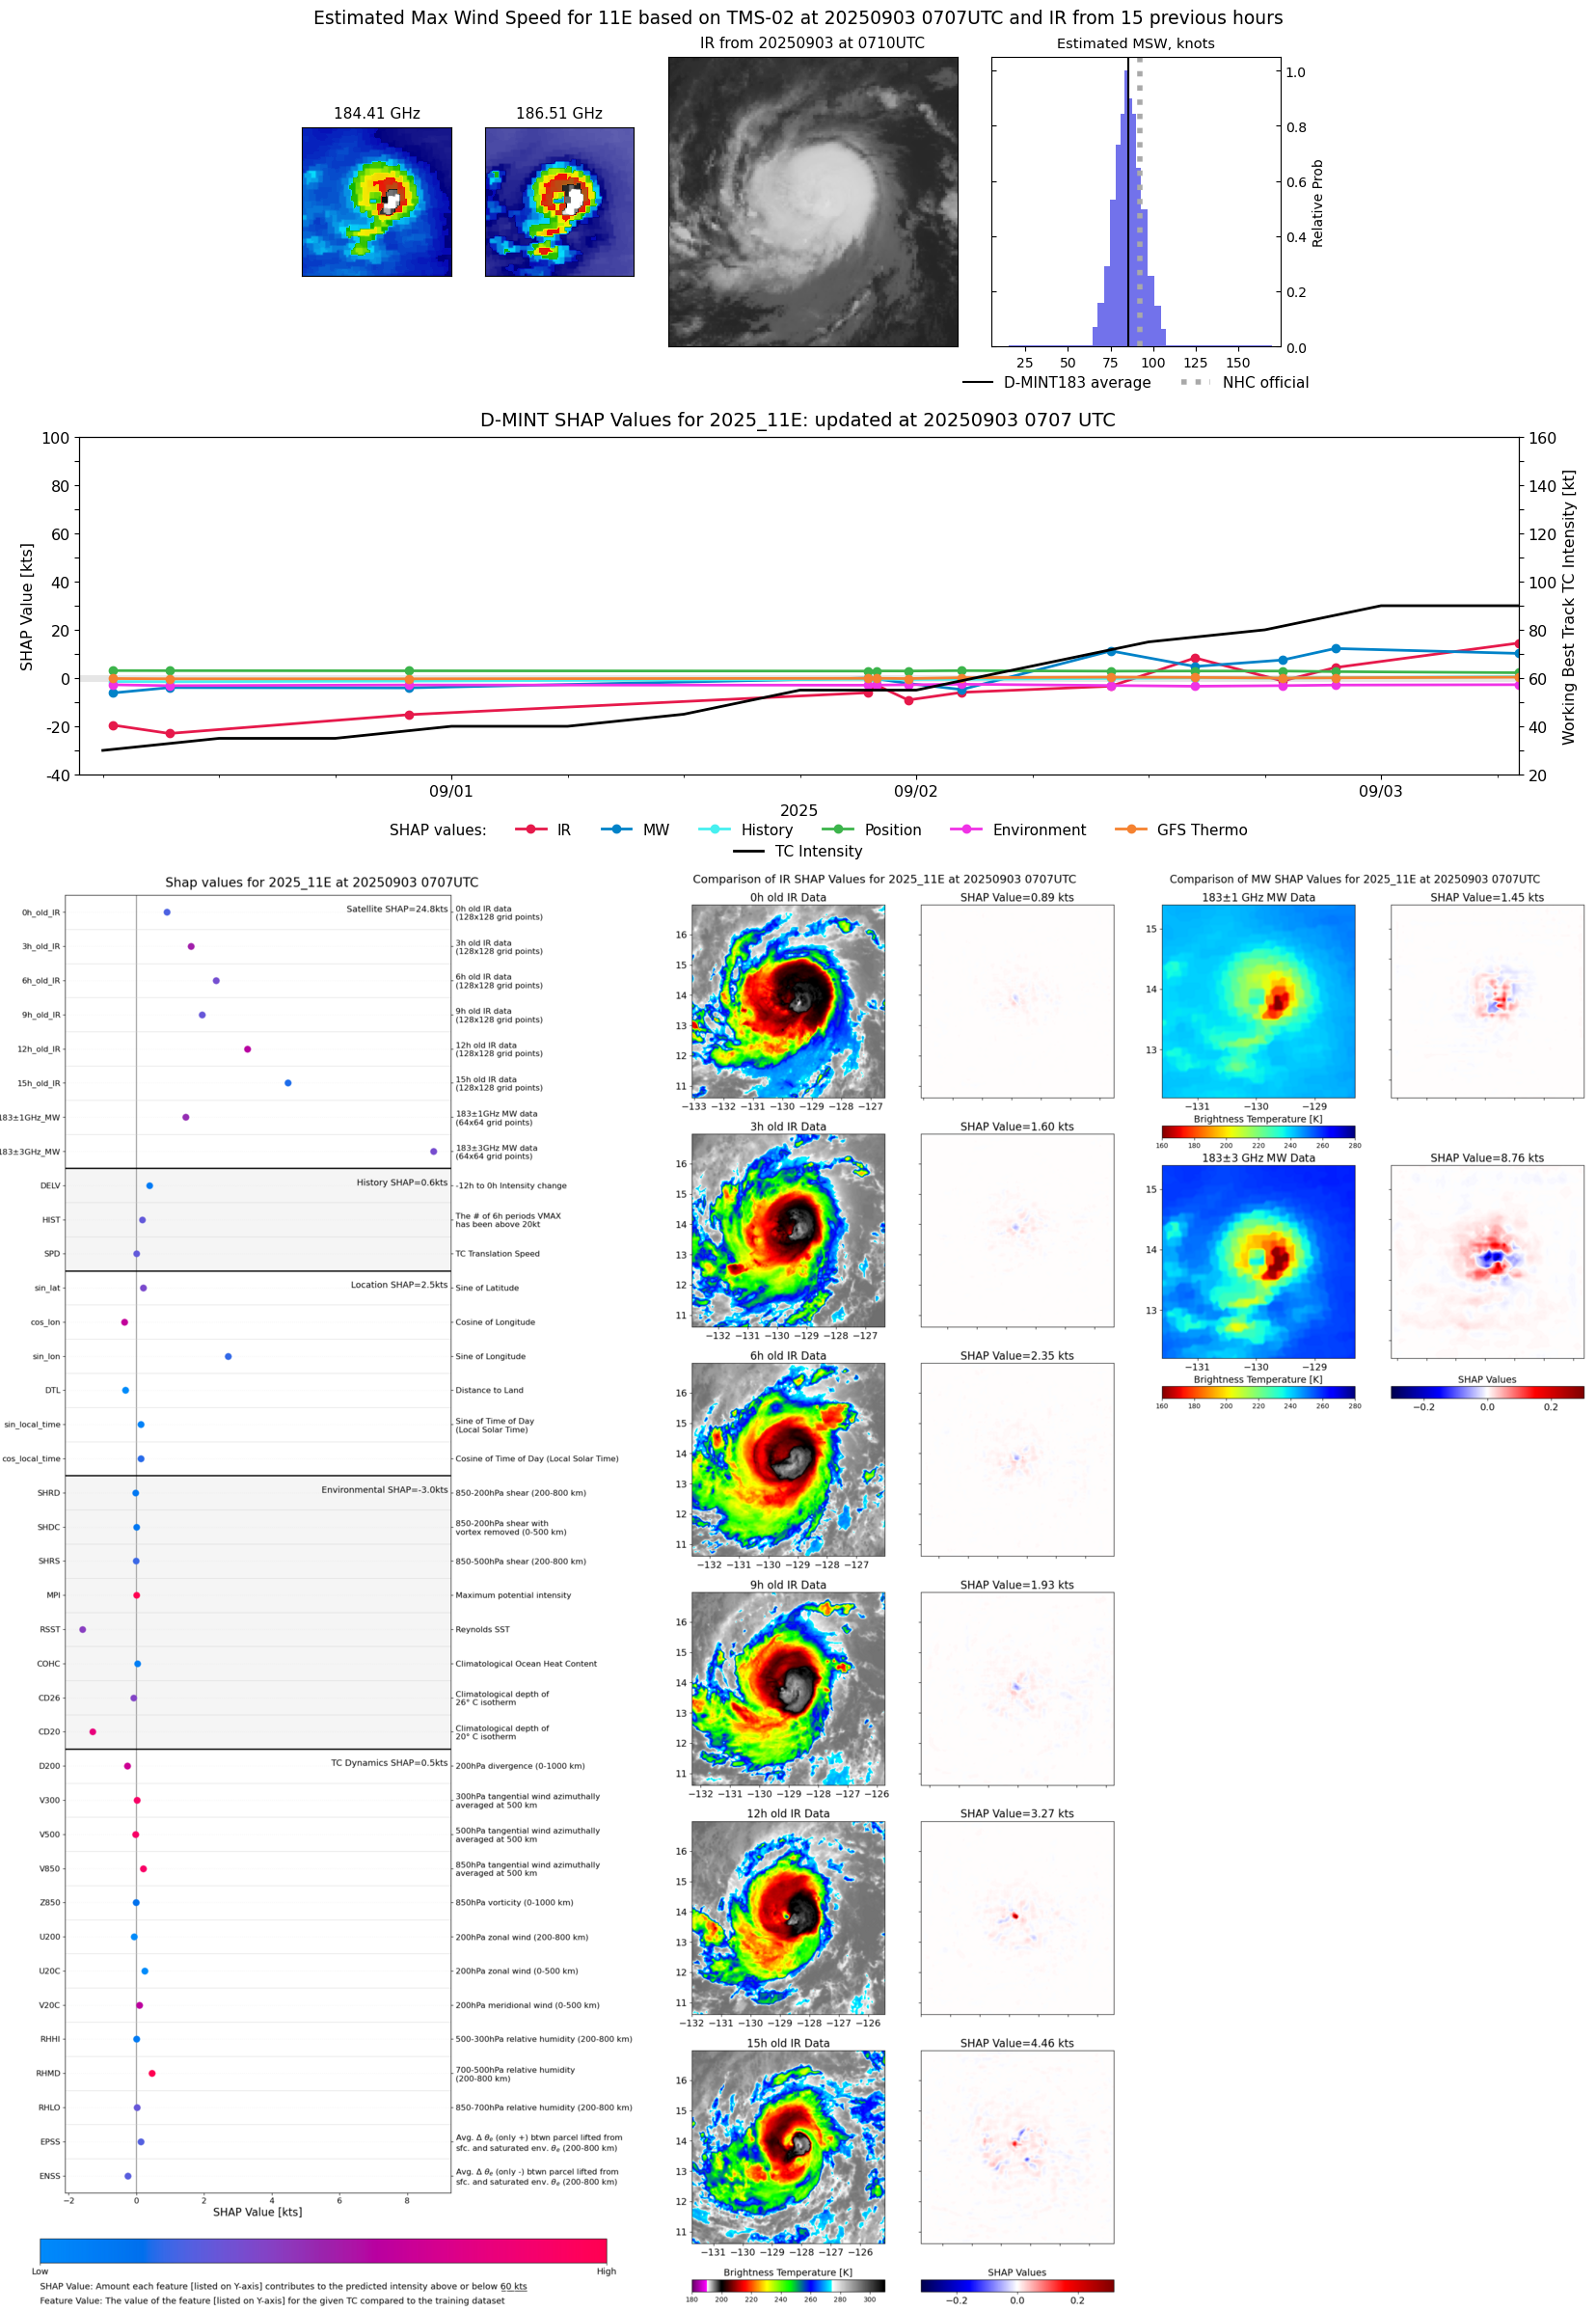 |
| 20250903 | 0706 UTC | AWS | 976 hPa | 87 kts | 81 kts | 93 kts | 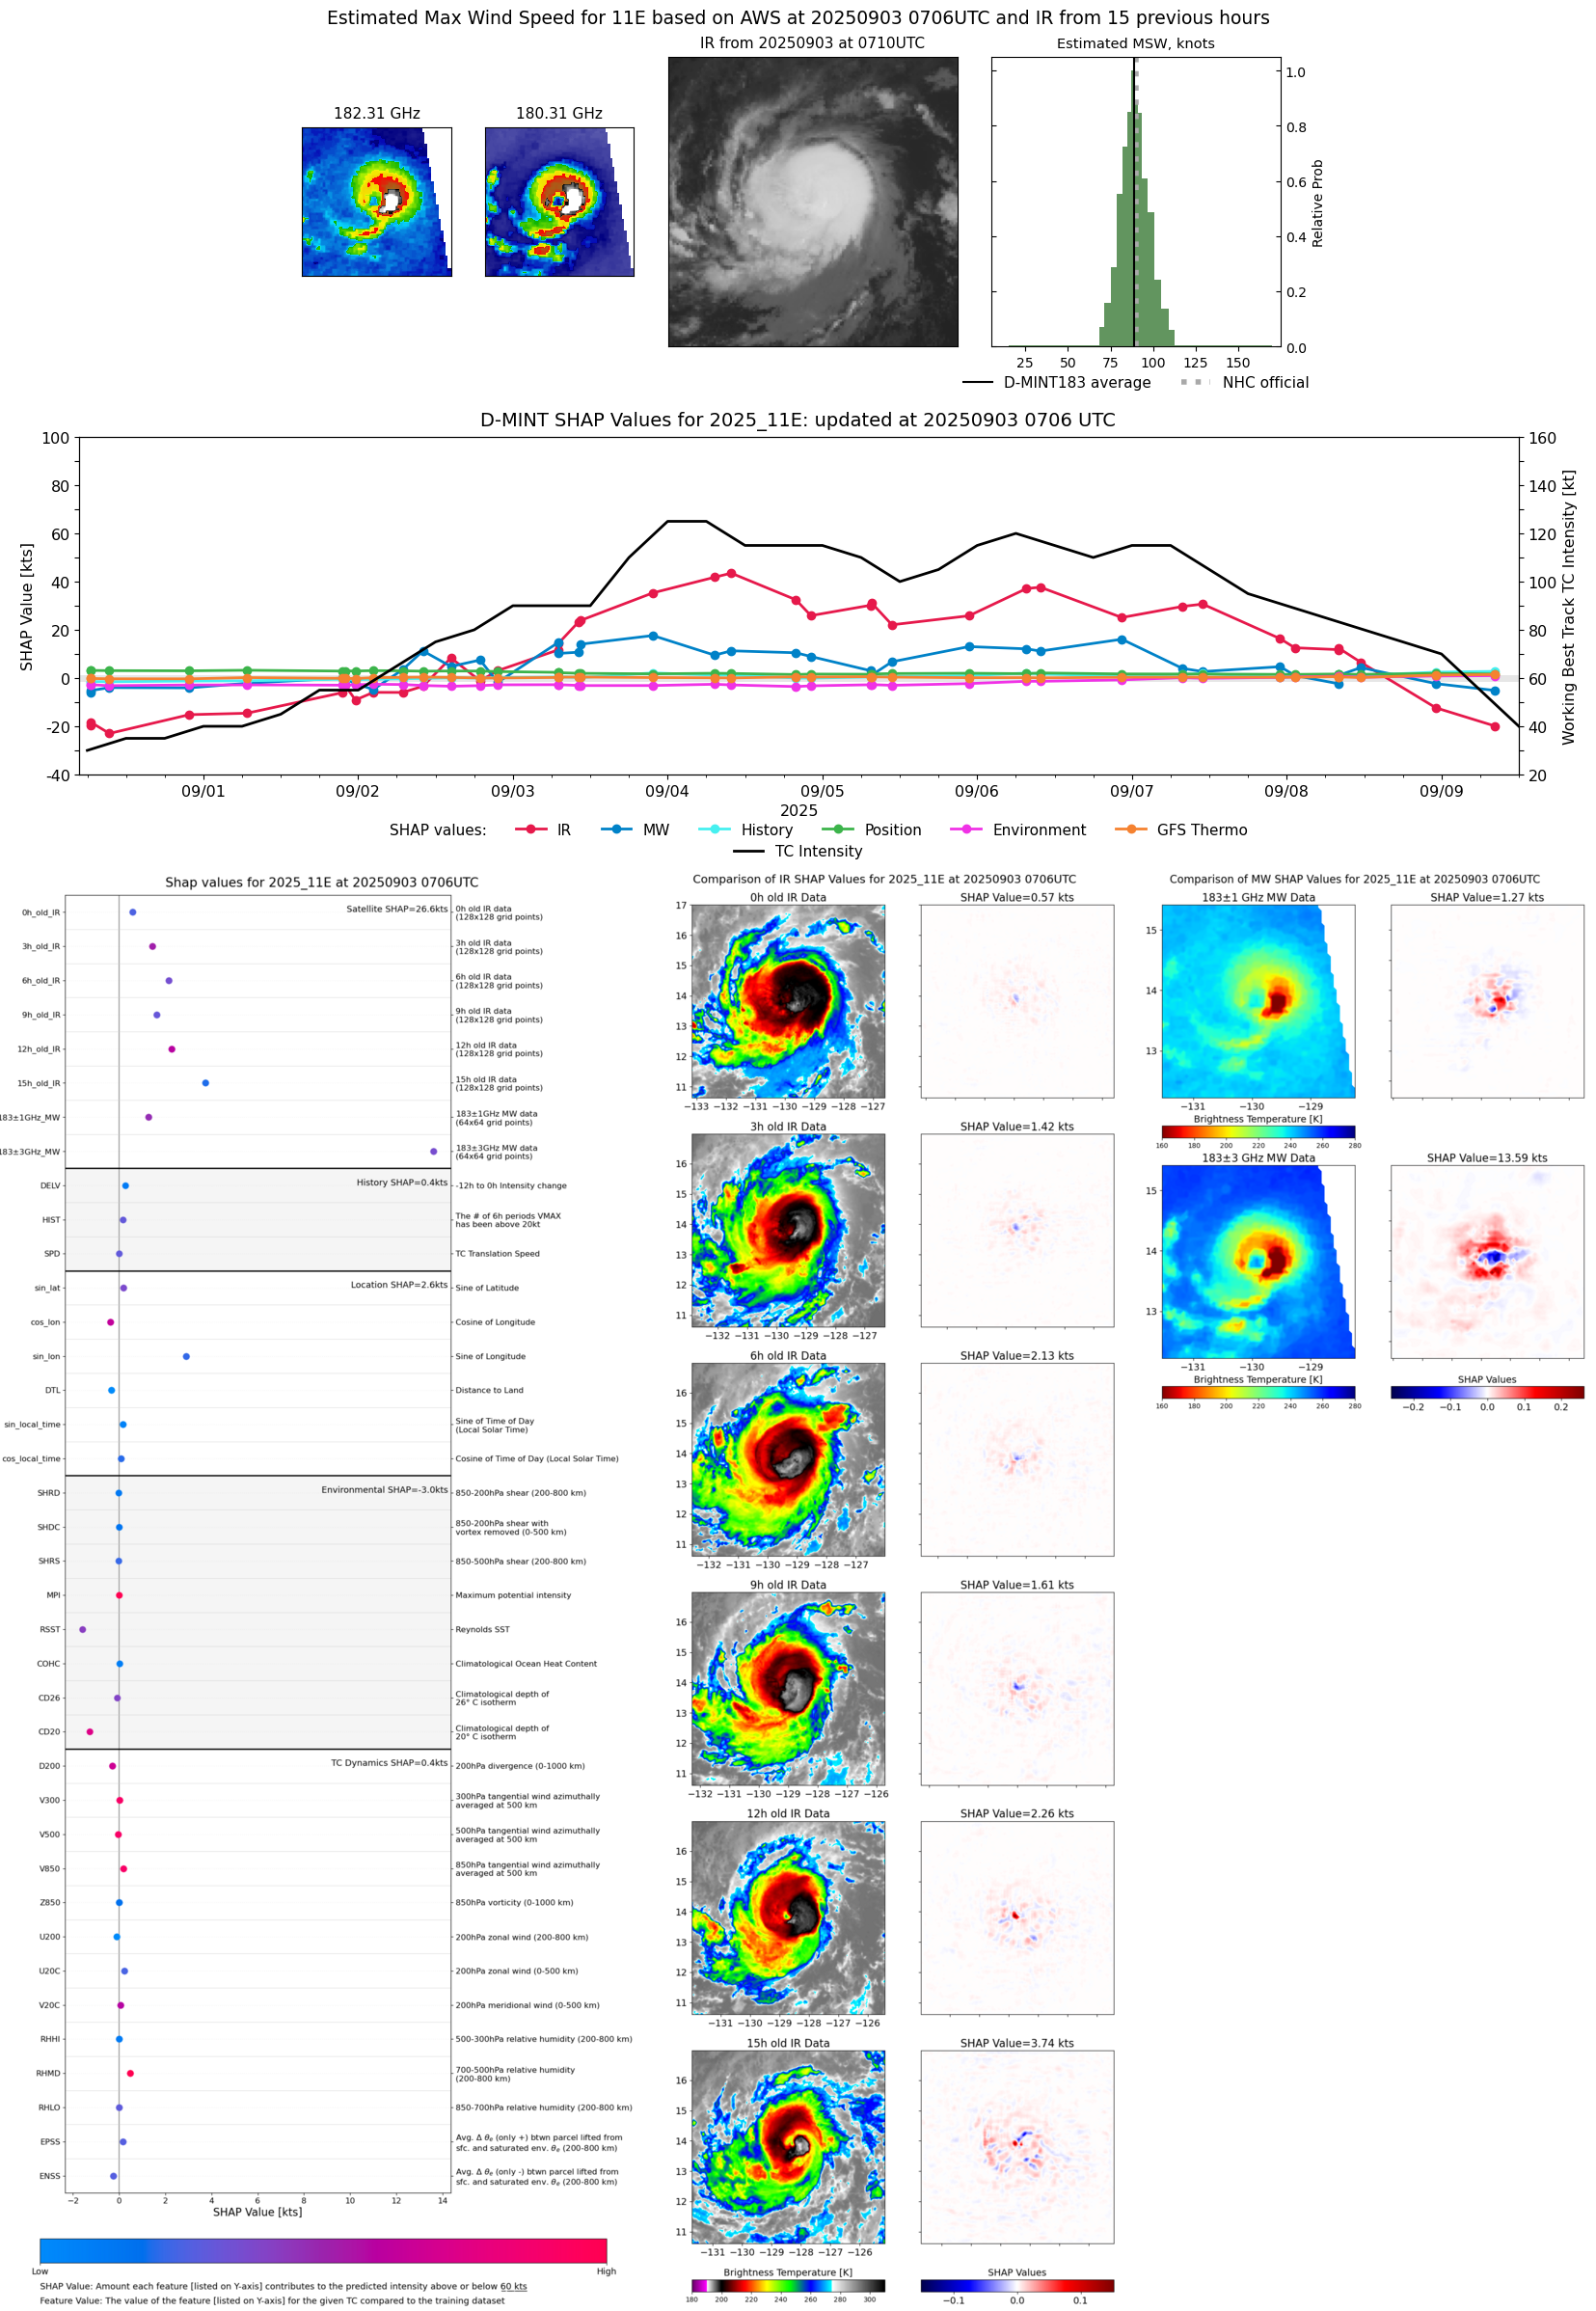 |
| 20250903 | 0653 UTC | TMS05 | 978 hPa | 85 kts | 79 kts | 92 kts |  |
| 20250903 | 0214 UTC | WSFM01 | 979 hPa | 90 kts | 82 kts | 97 kts | 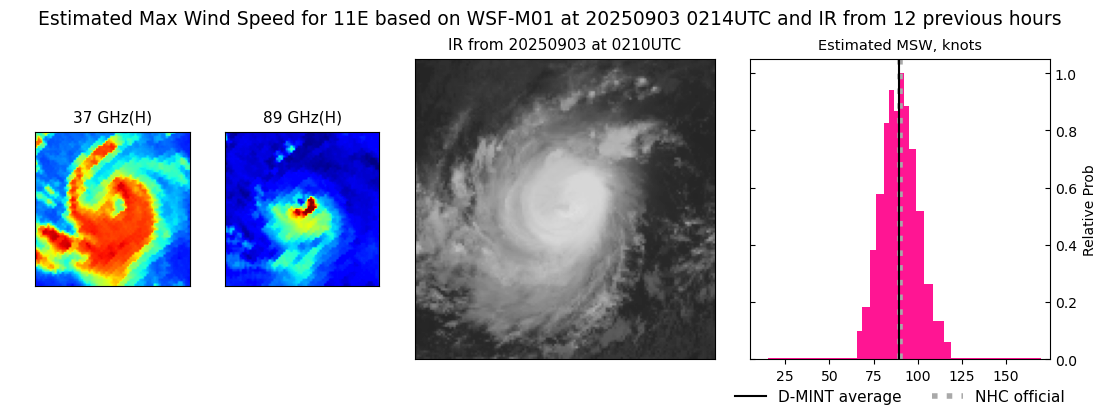 |
| 20250903 | 0022 UTC | SSMISF18 | 980 hPa | 72 kts | 66 kts | 79 kts |  |
| 20250902 | 2253 UTC | GMI | 983 hPa | 87 kts | 79 kts | 94 kts | 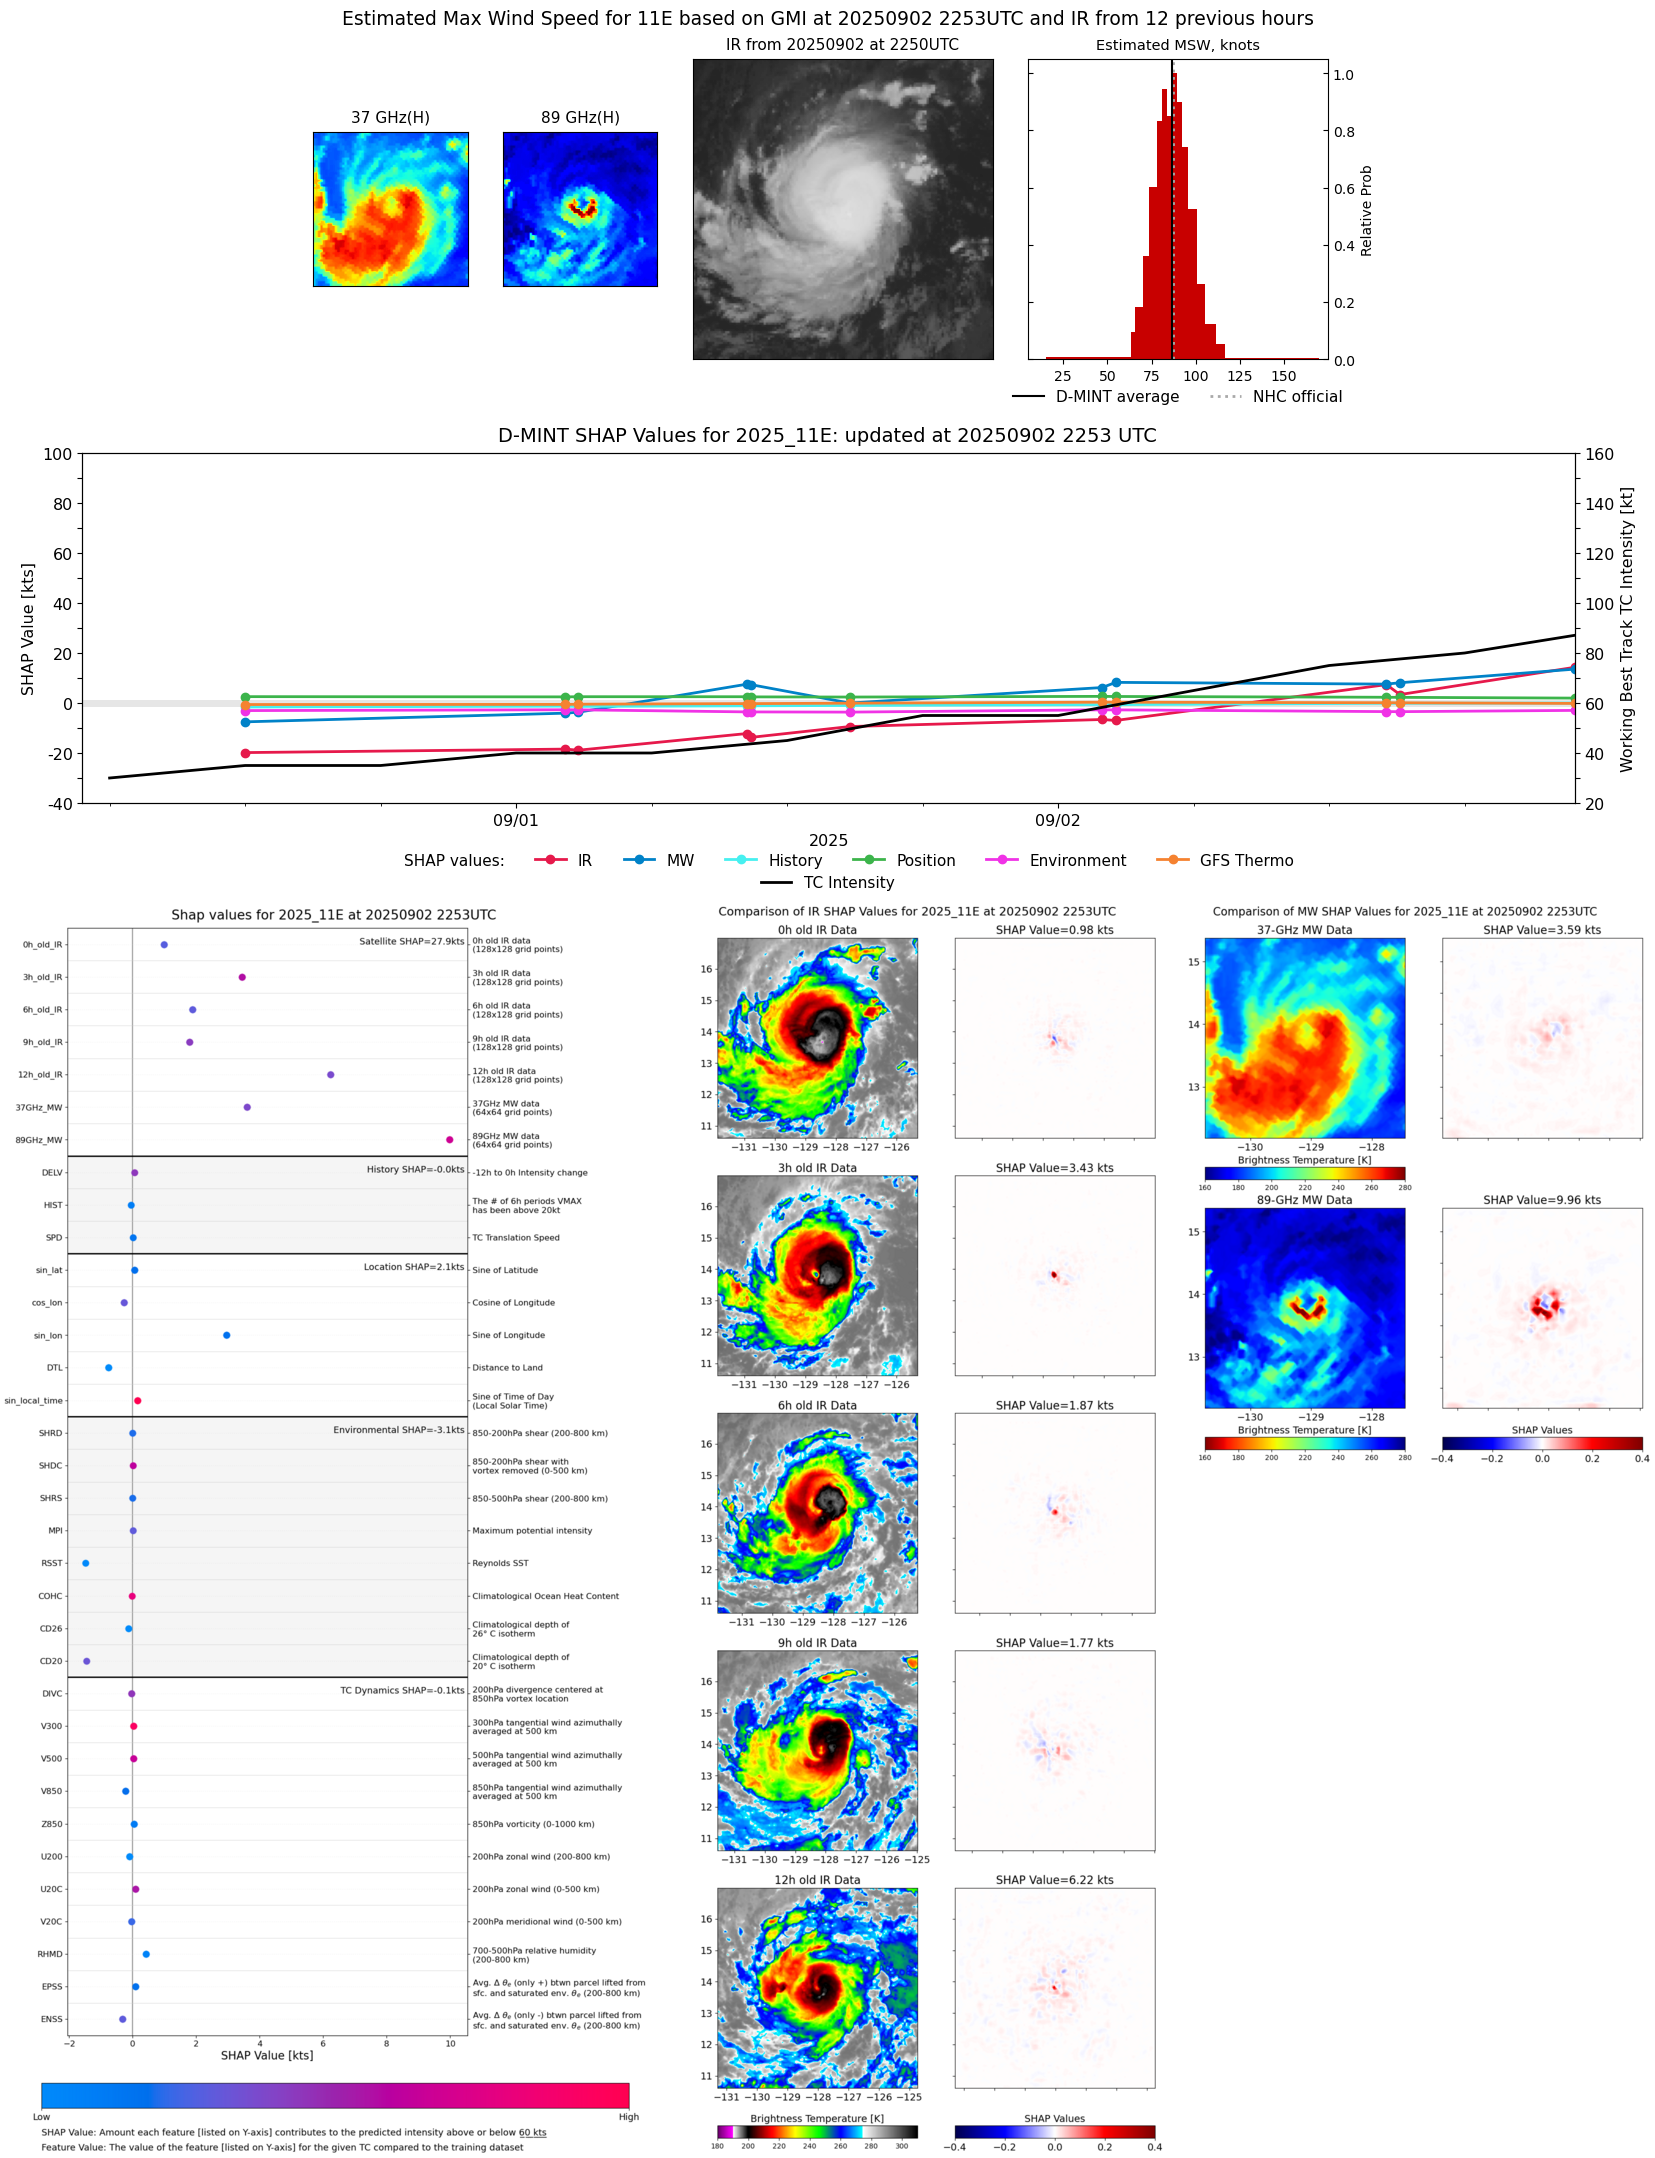 |
| 20250902 | 2157 UTC | AMSR2 | 983 hPa | 80 kts | 74 kts | 87 kts | 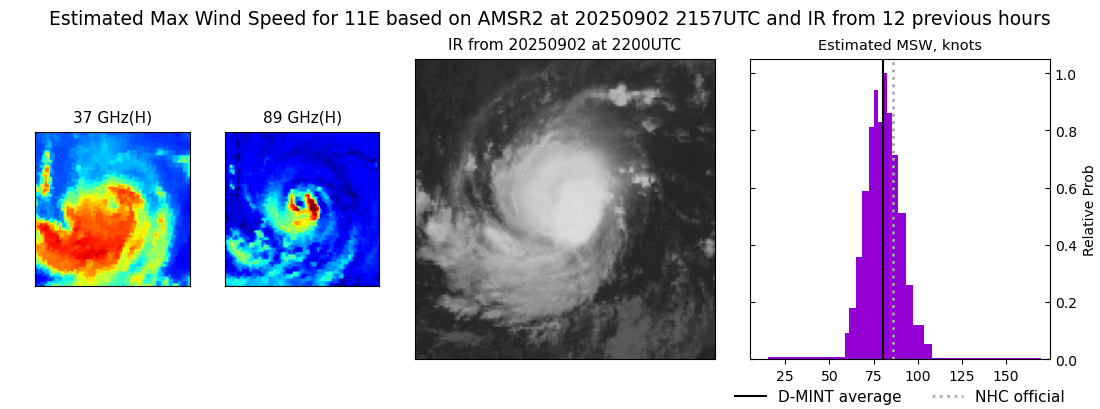 |
| 20250902 | 2138 UTC | ATMS- | 984 hPa | 77 kts | 71 kts | 83 kts |  |
| 20250902 | 2138 UTC | ATMS-NPP | 984 hPa | 77 kts | 71 kts | 83 kts | 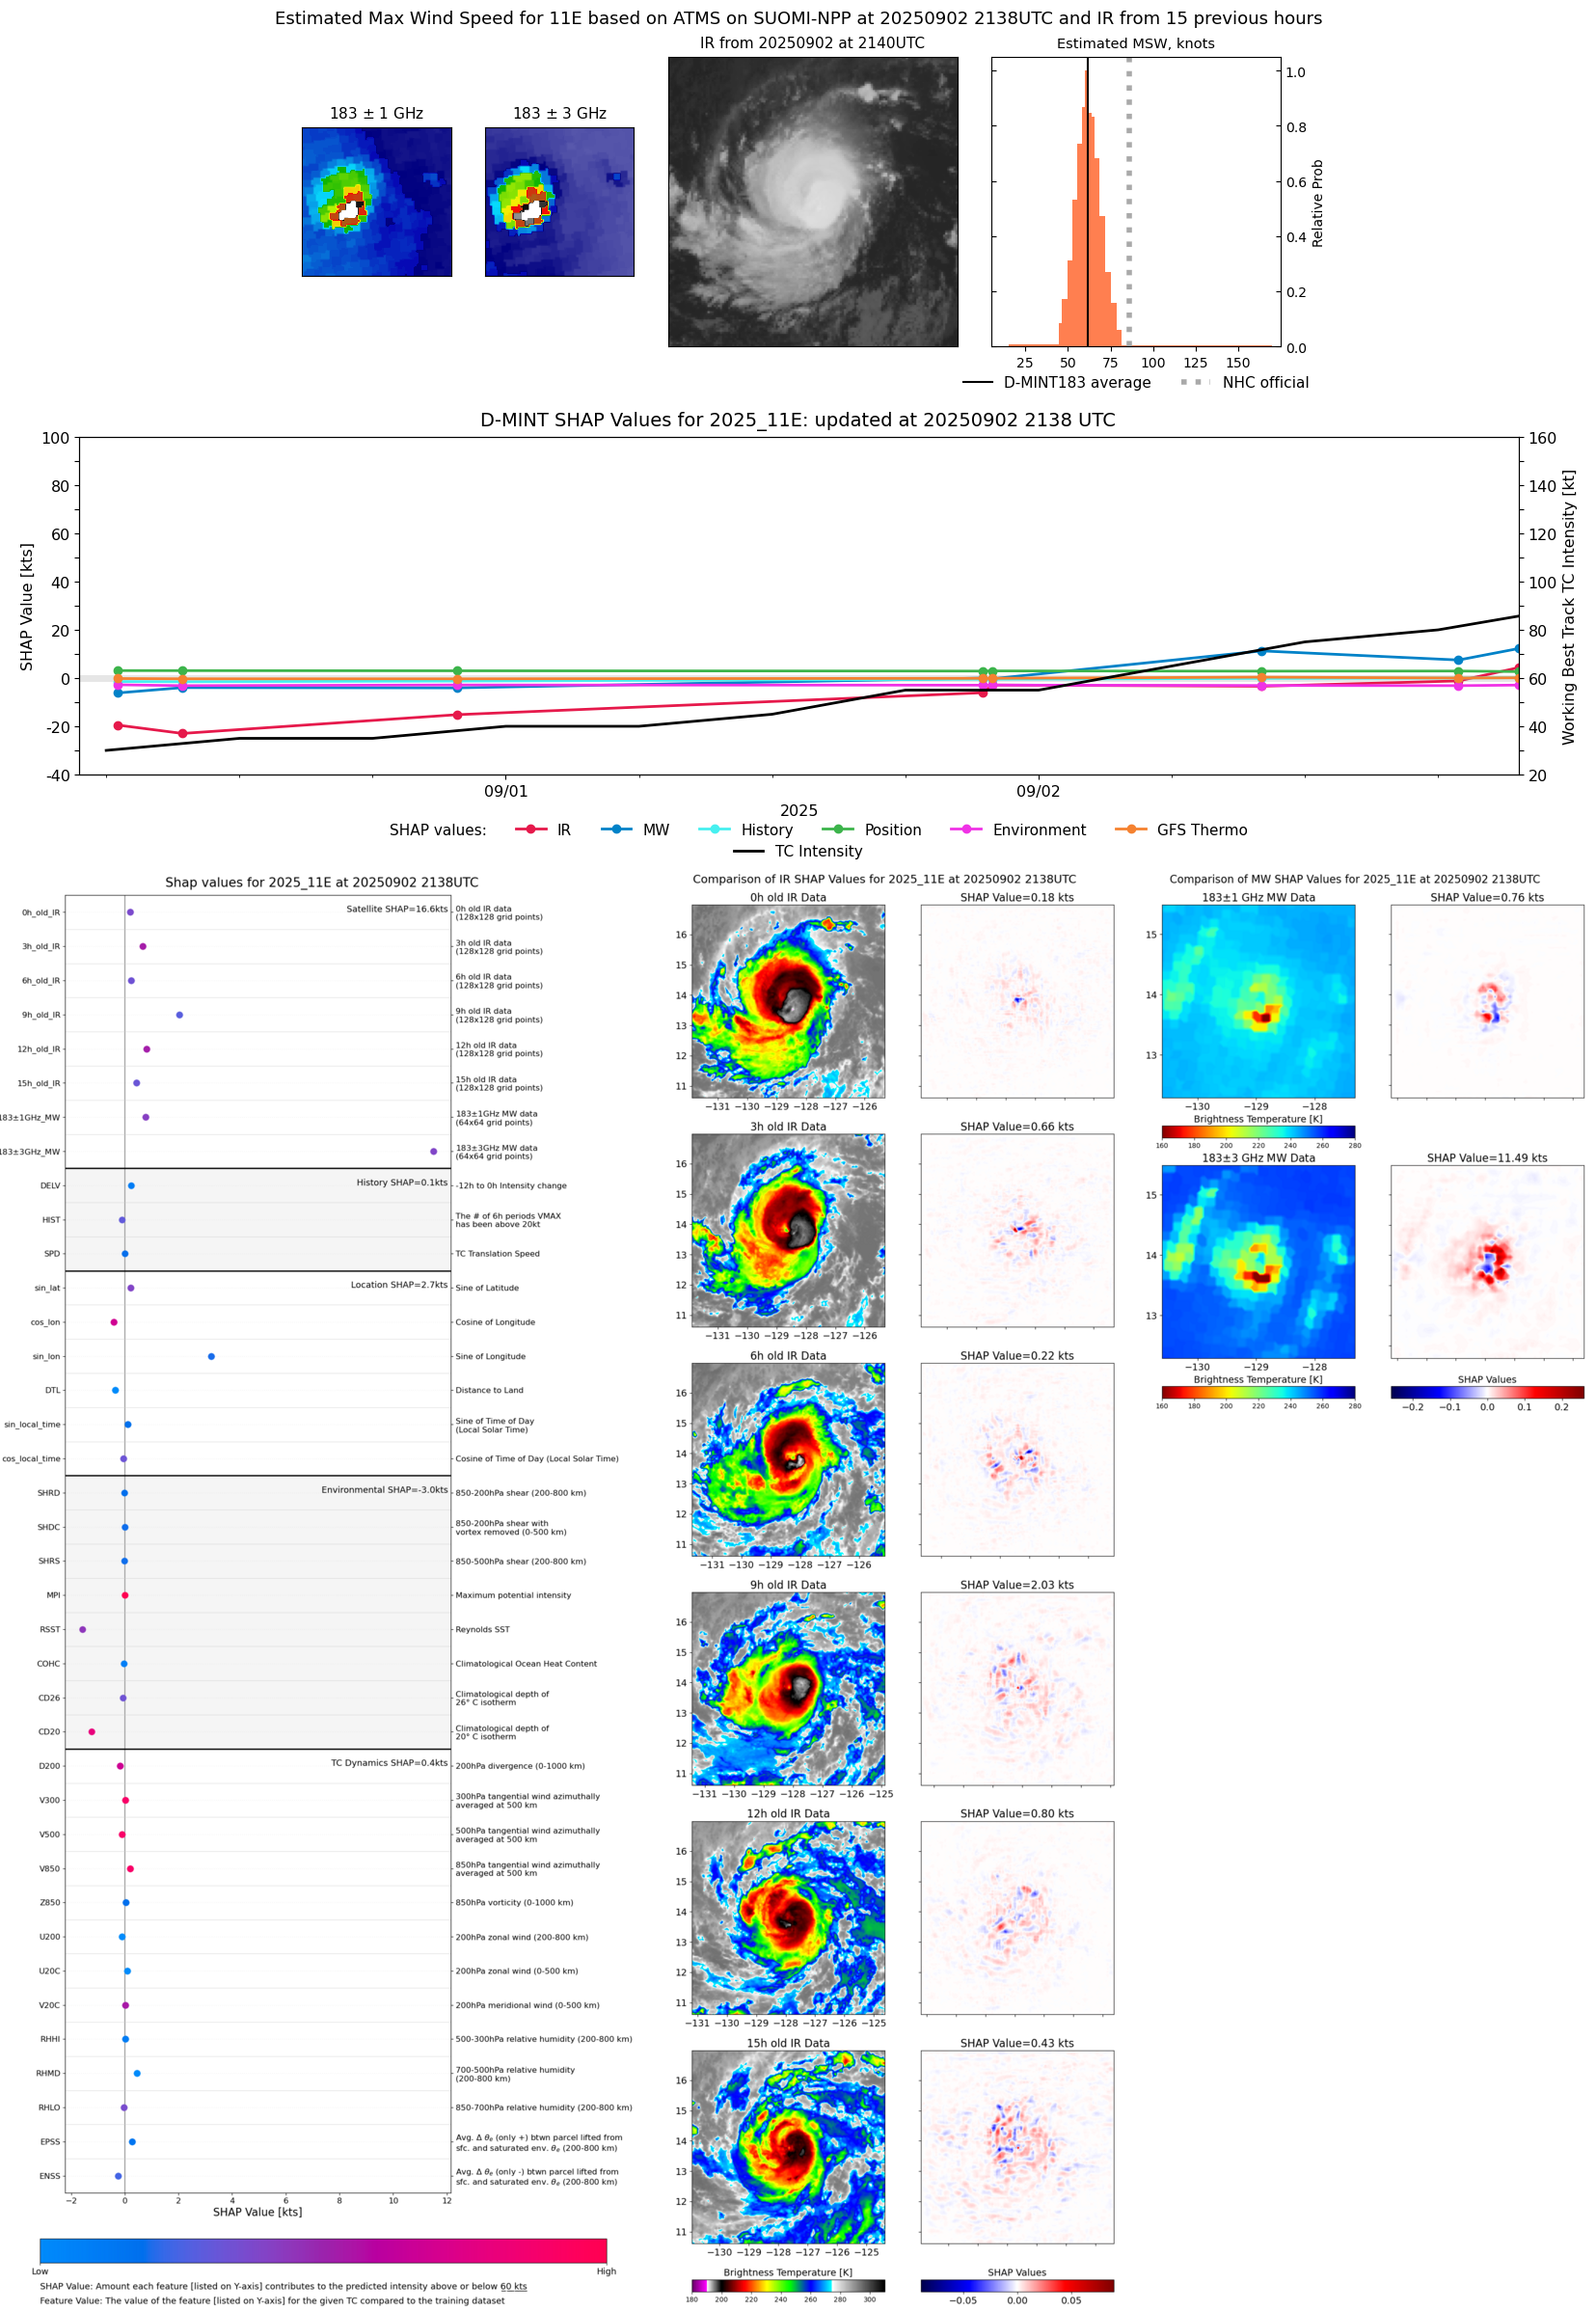 |
| 20250902 | 1855 UTC | TMS02 | 989 hPa | 67 kts | 61 kts | 72 kts | 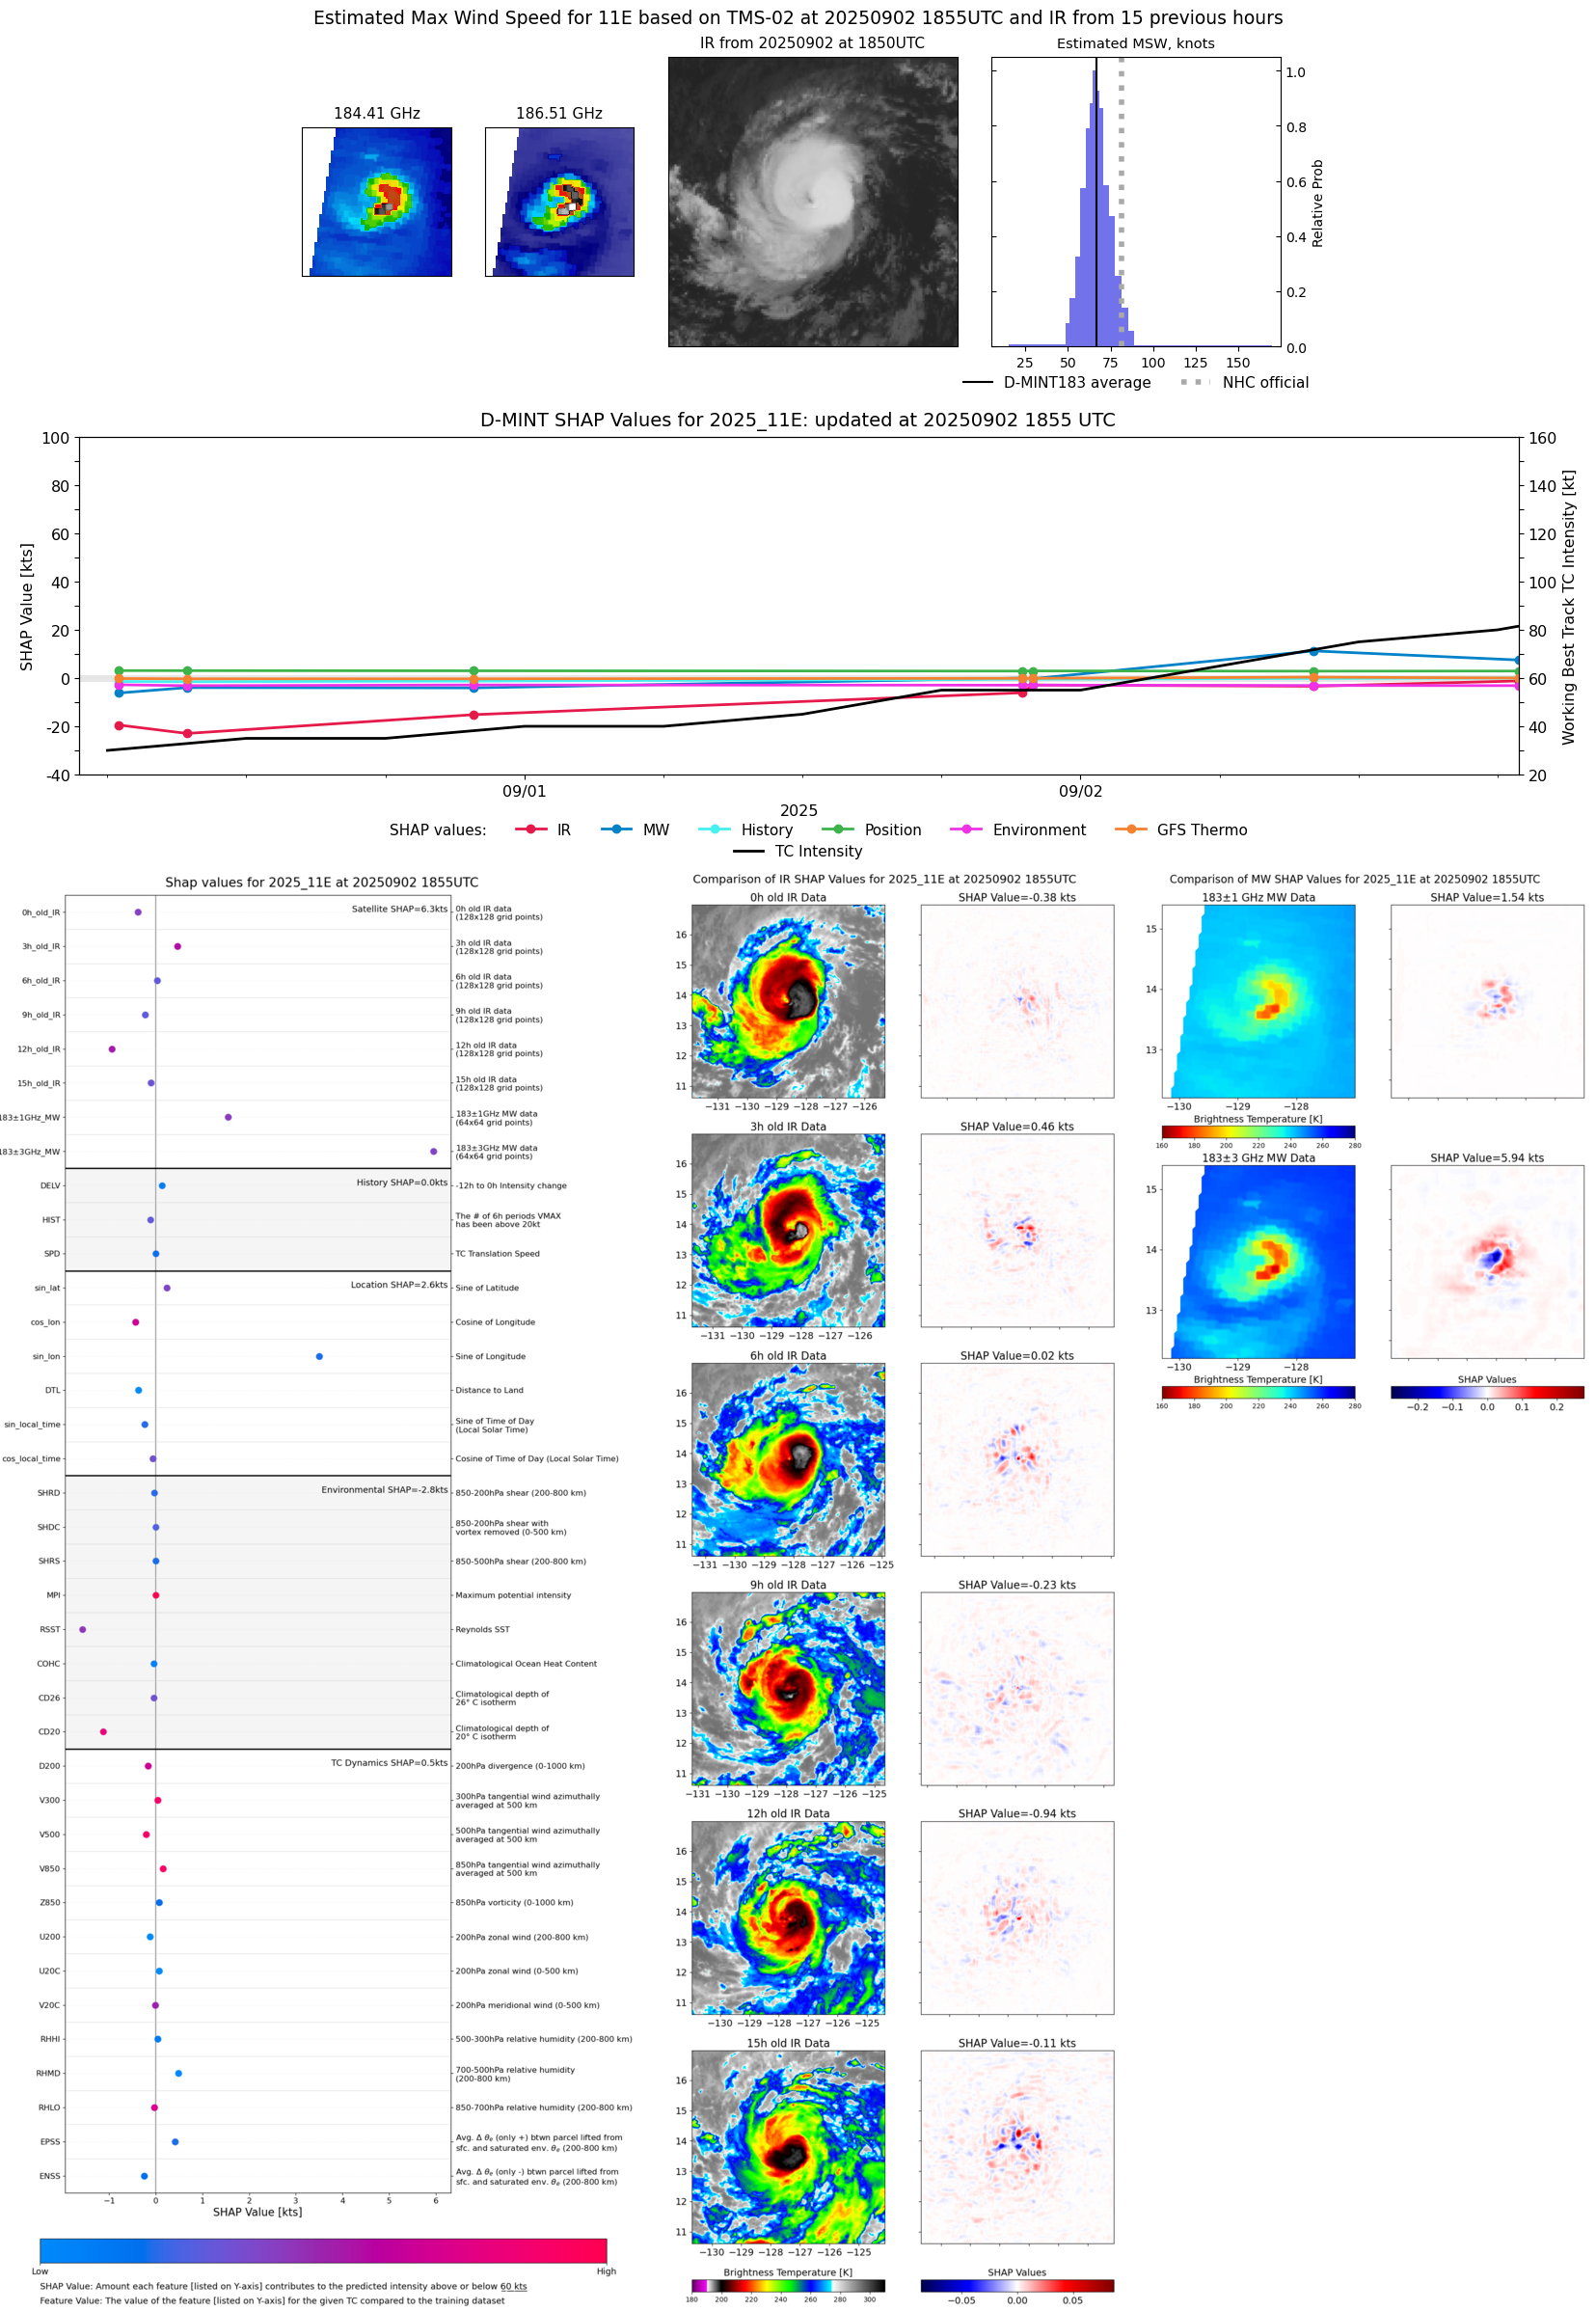 |
| 20250902 | 1832 UTC | TMS06 | 989 hPa | 63 kts | 58 kts | 69 kts | 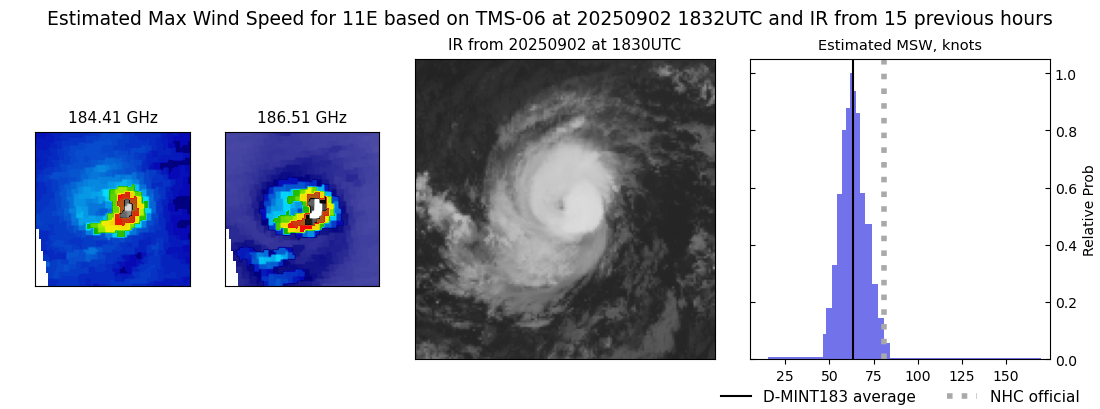 |
| 20250902 | 1508 UTC | SSMISF16 | 987 hPa | 70 kts | 64 kts | 76 kts | 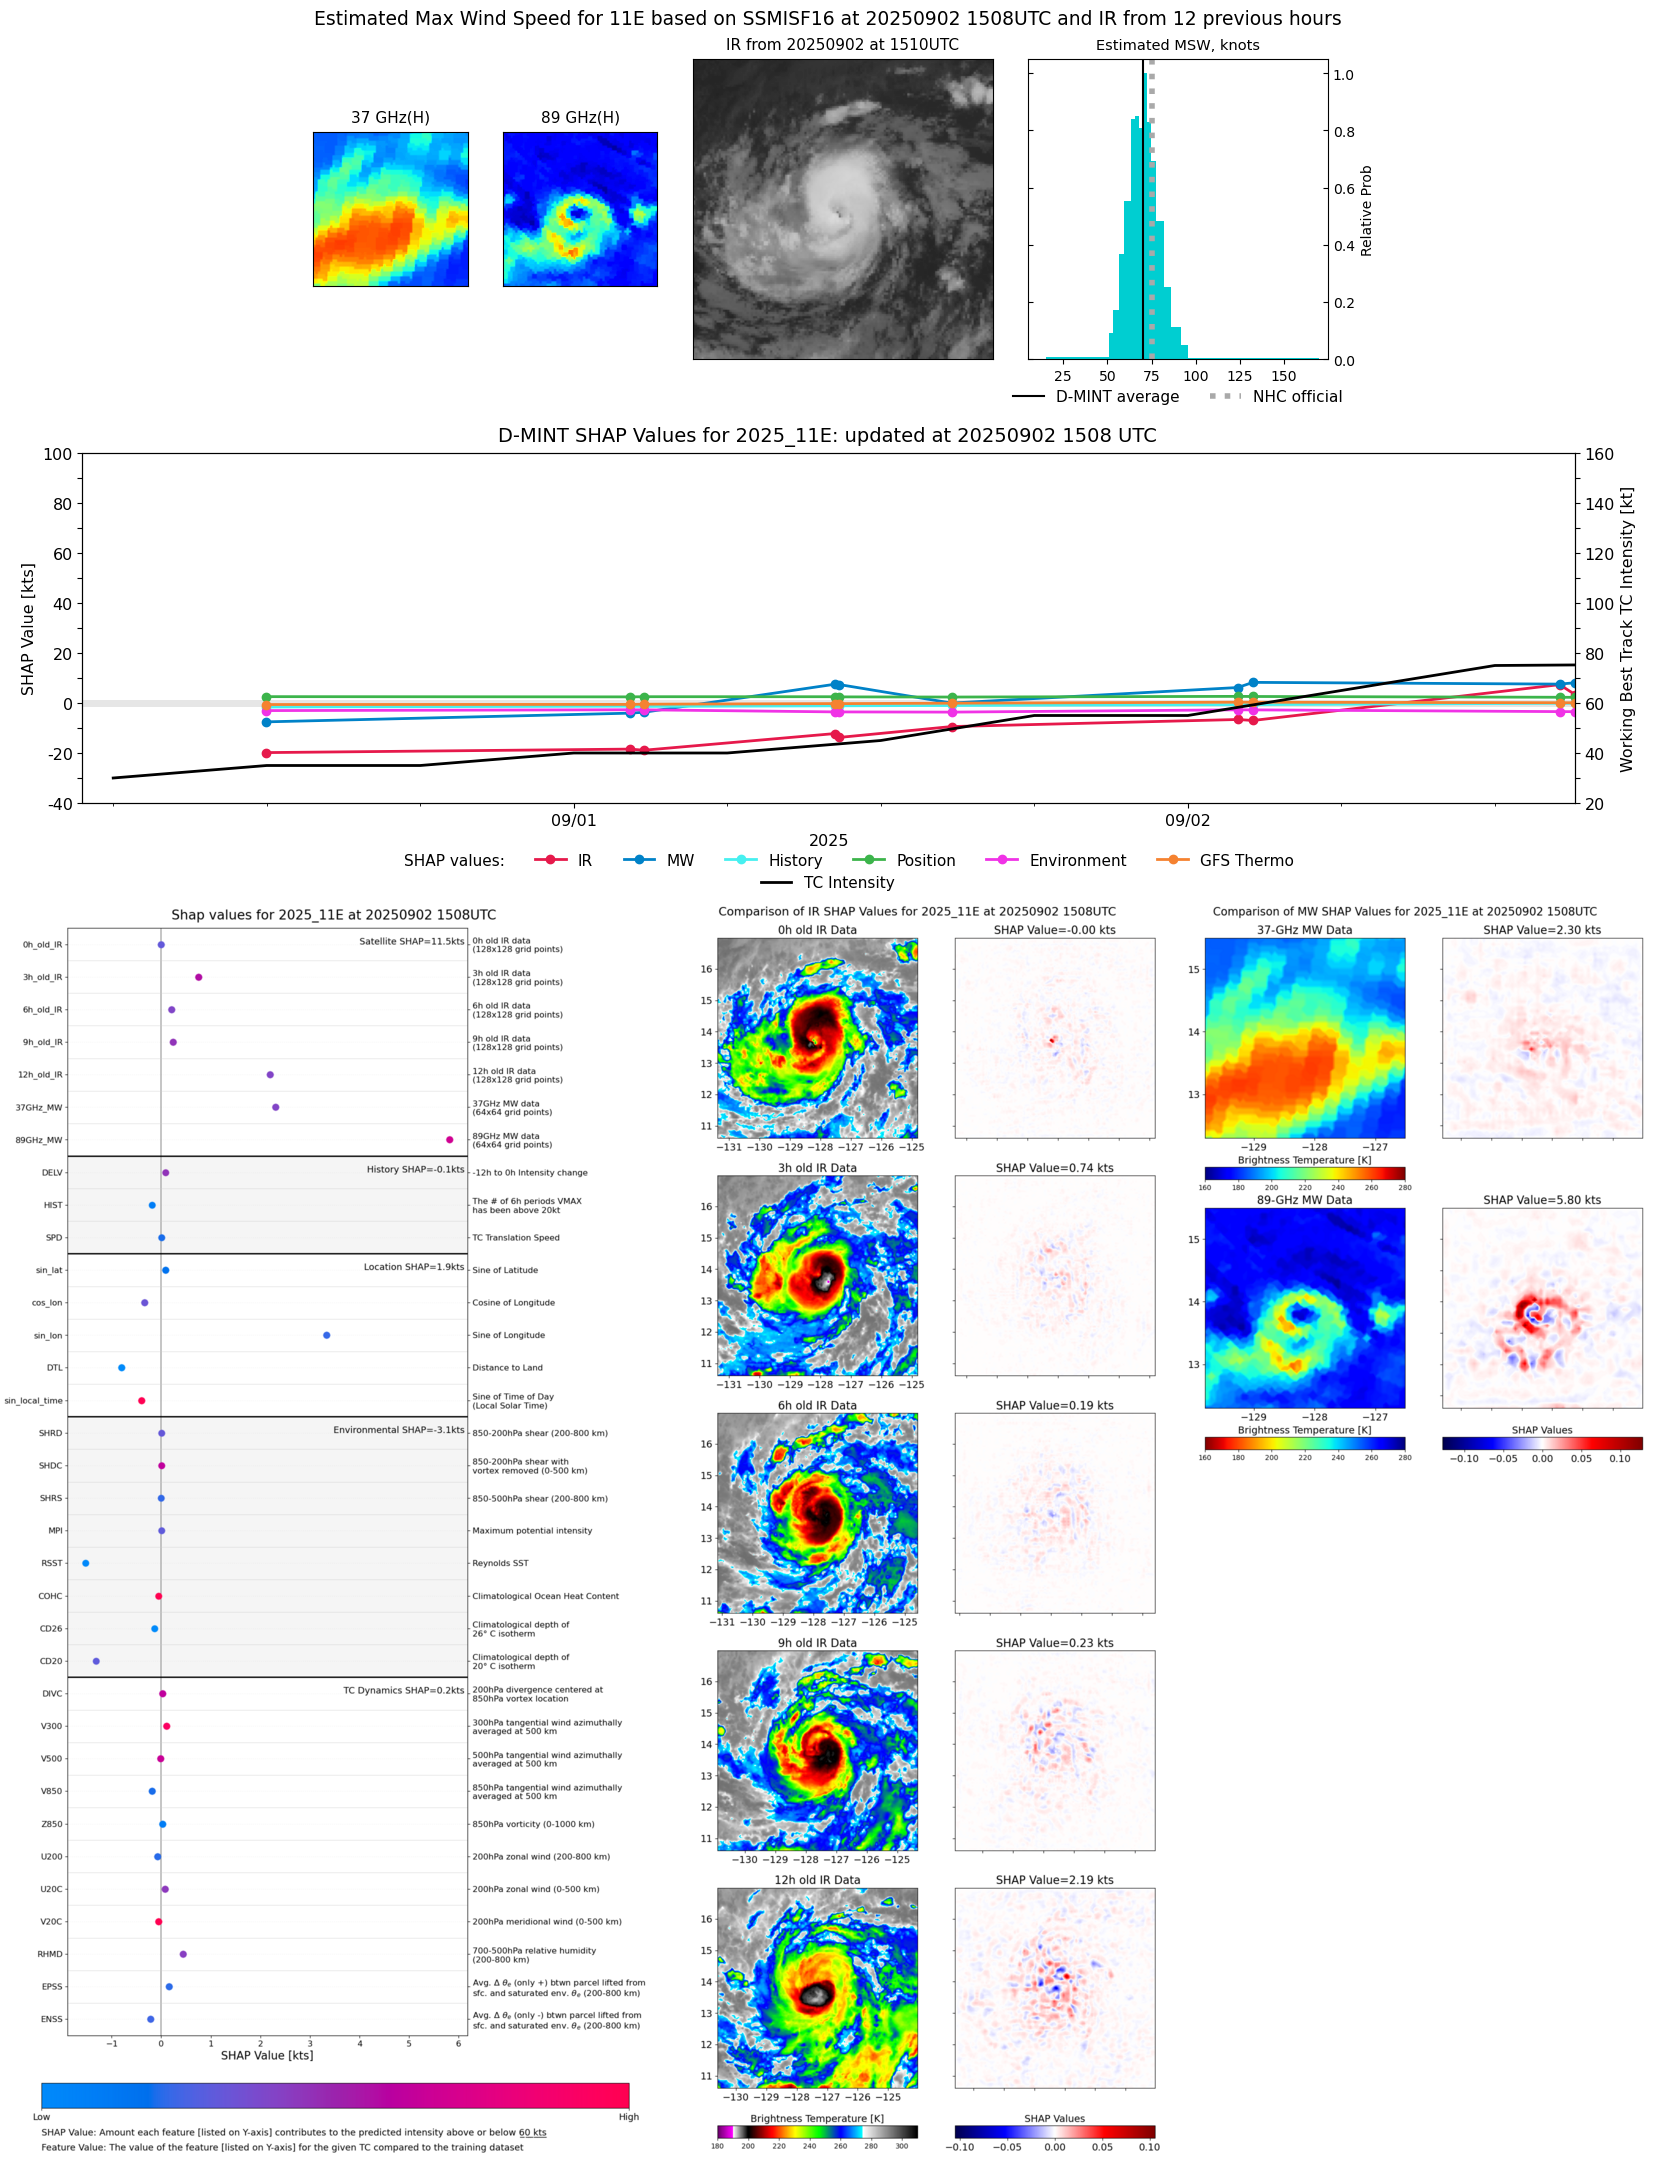 |
| 20250902 | 1507 UTC | WSFM01 | 985 hPa | 72 kts | 67 kts | 78 kts | 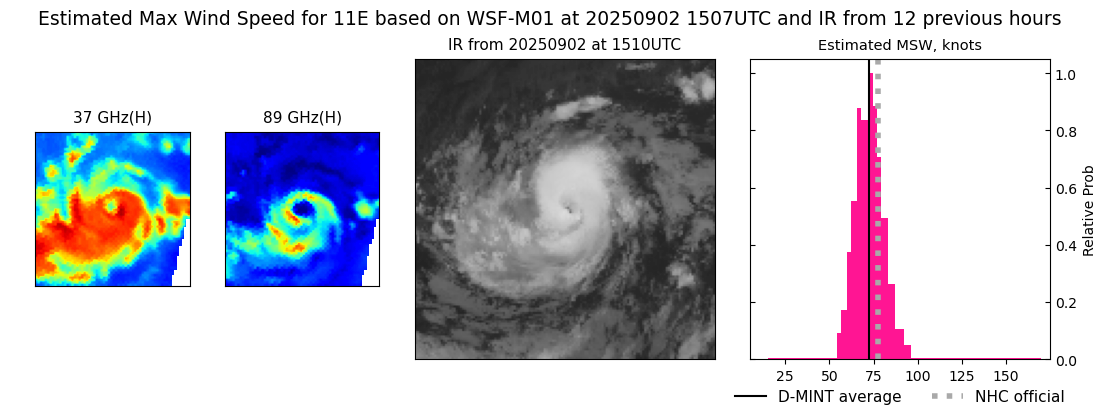 |
| 20250902 | 1432 UTC | SSMISF17 | 986 hPa | 74 kts | 68 kts | 80 kts |  |
| 20250902 | 1424 UTC | TROPICS05 | 987 hPa | 74 kts | 68 kts | 80 kts |  |
| 20250902 | 1003 UTC | ATMS-N21 | 989 hPa | 68 kts | 63 kts | 75 kts |  |
| 20250902 | 0656 UTC | AWS | 997 hPa | 59 kts | 53 kts | 64 kts | 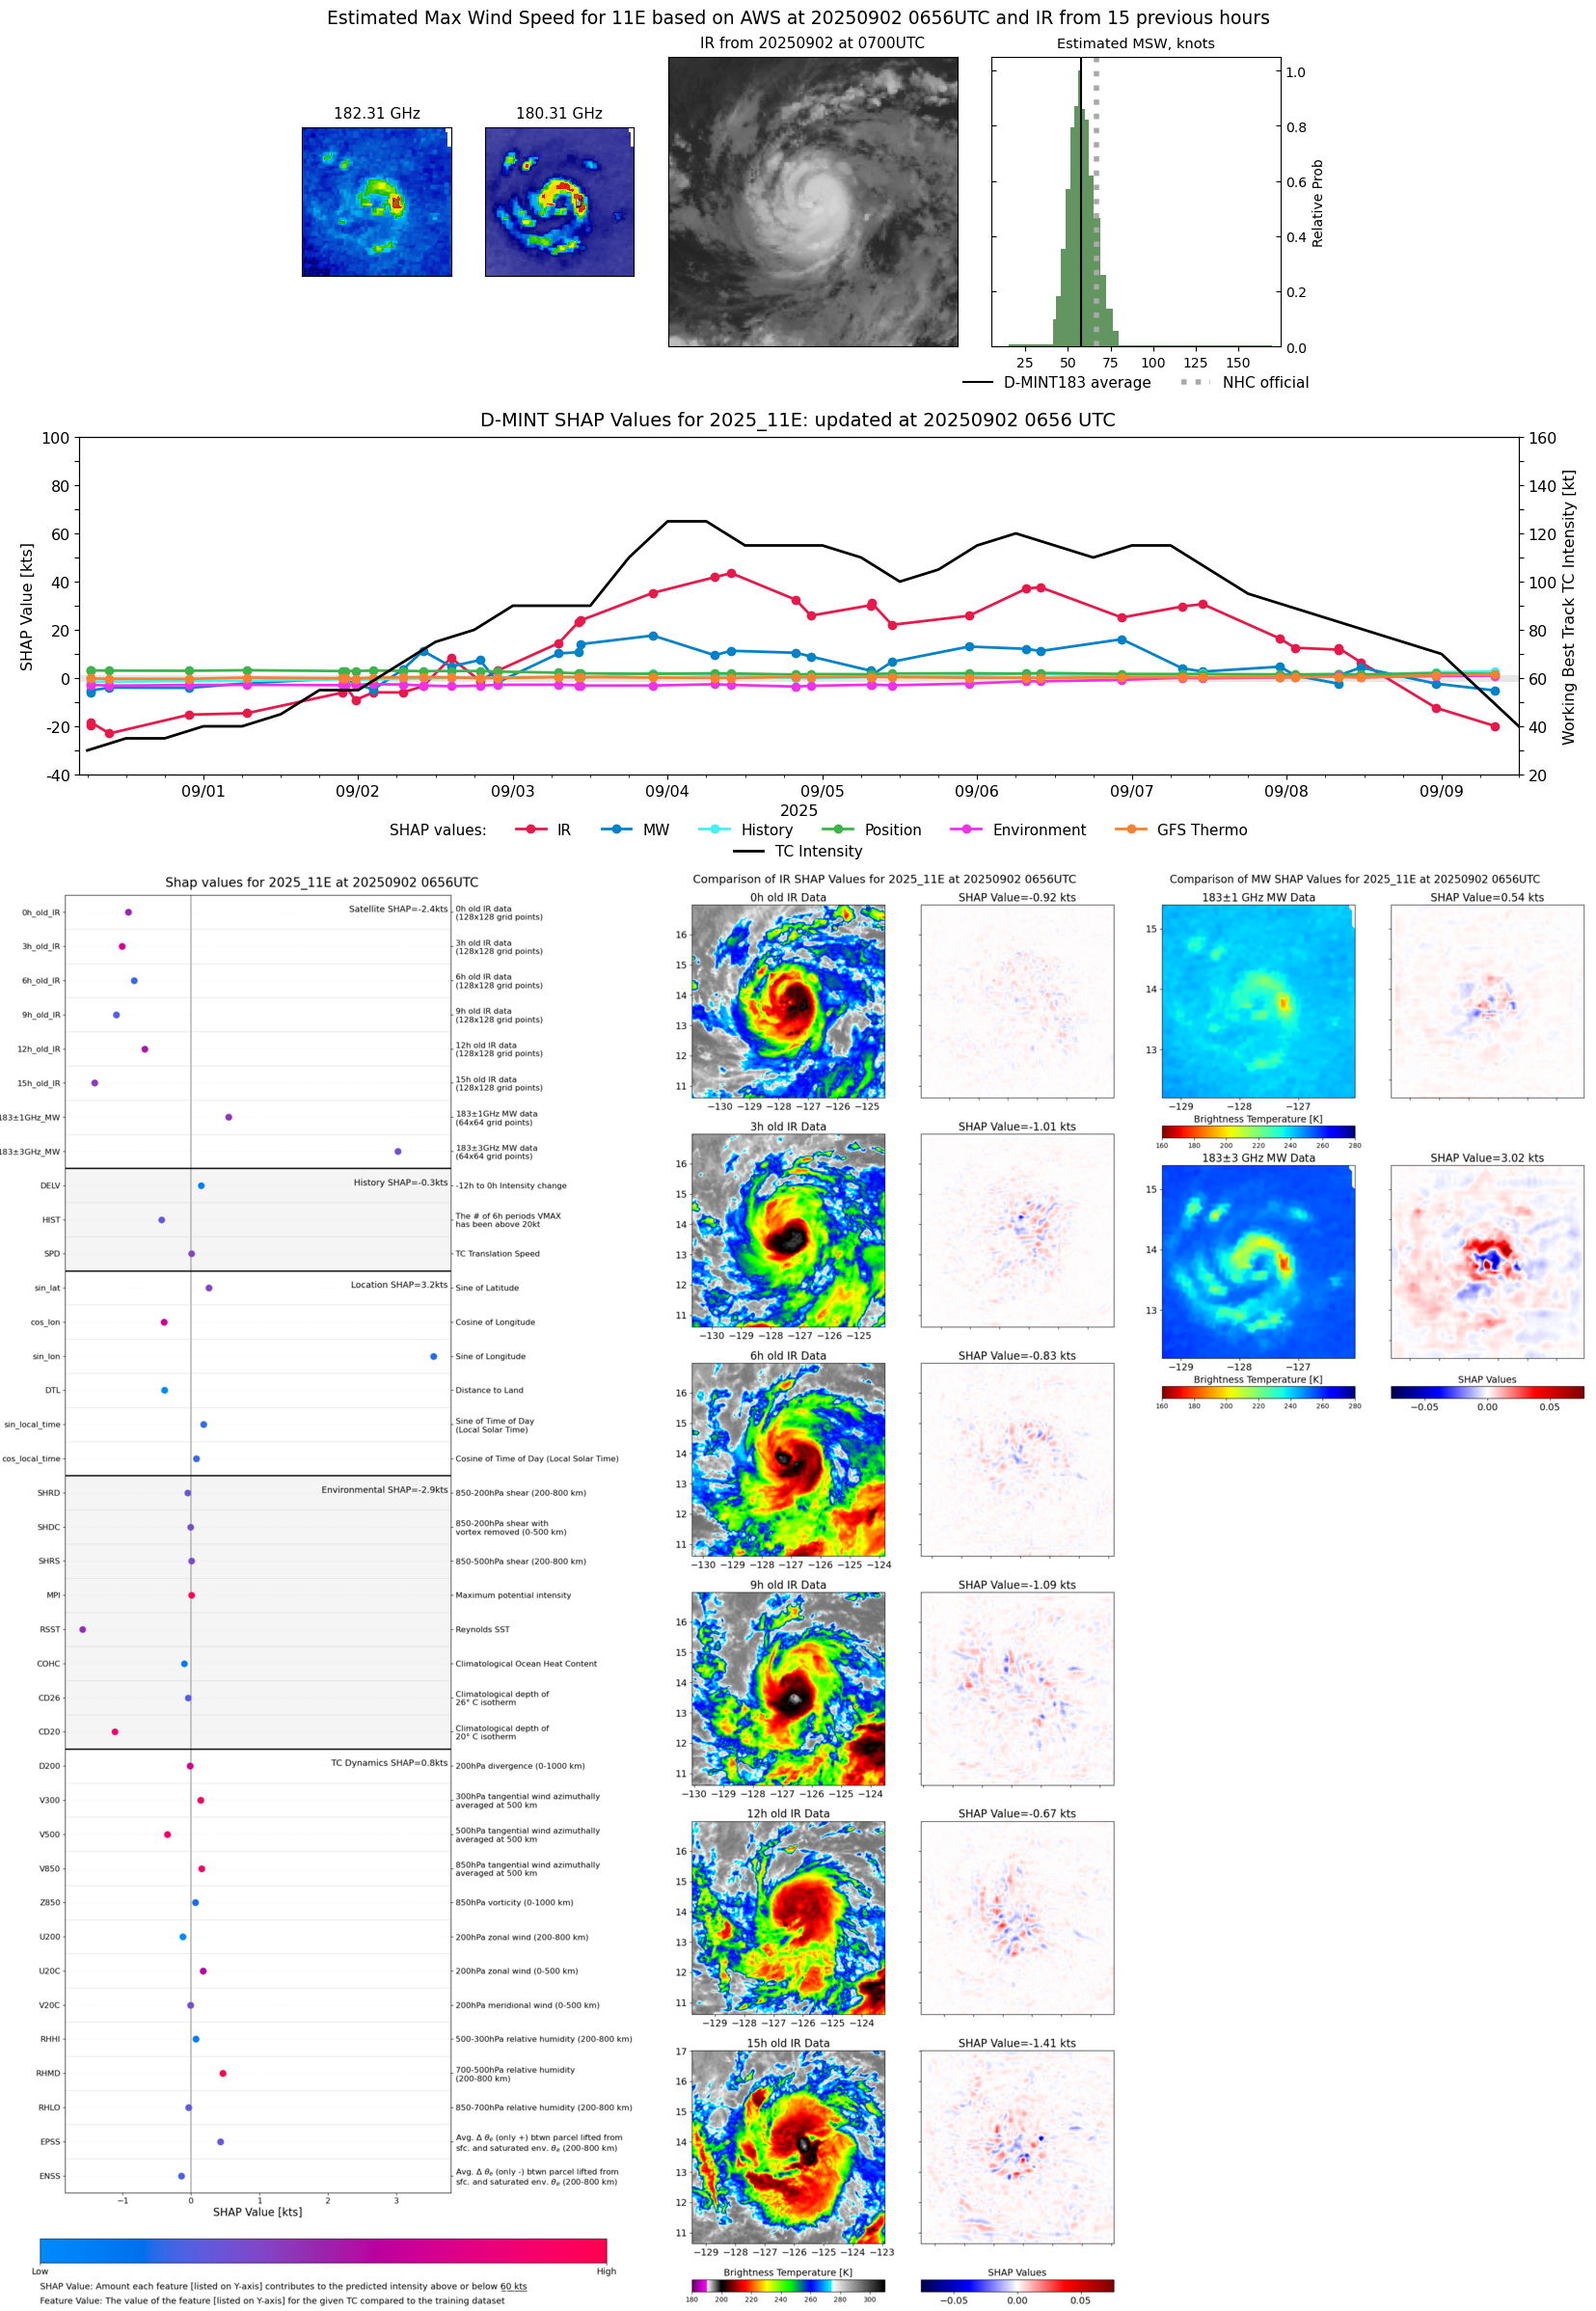 |
| 20250902 | 0234 UTC | WSFM01 | 998 hPa | 56 kts | 50 kts | 63 kts | 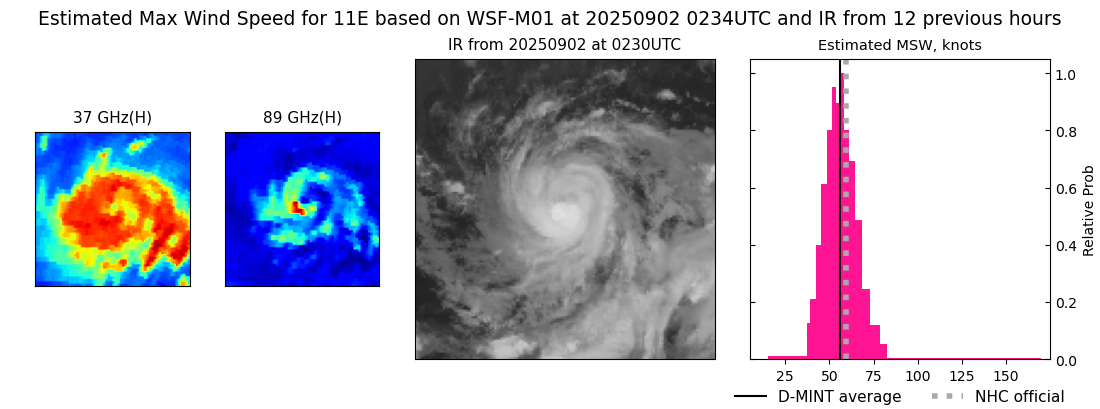 |
| 20250902 | 0233 UTC | SSMISF16 | 993 hPa | 61 kts | 55 kts | 68 kts | 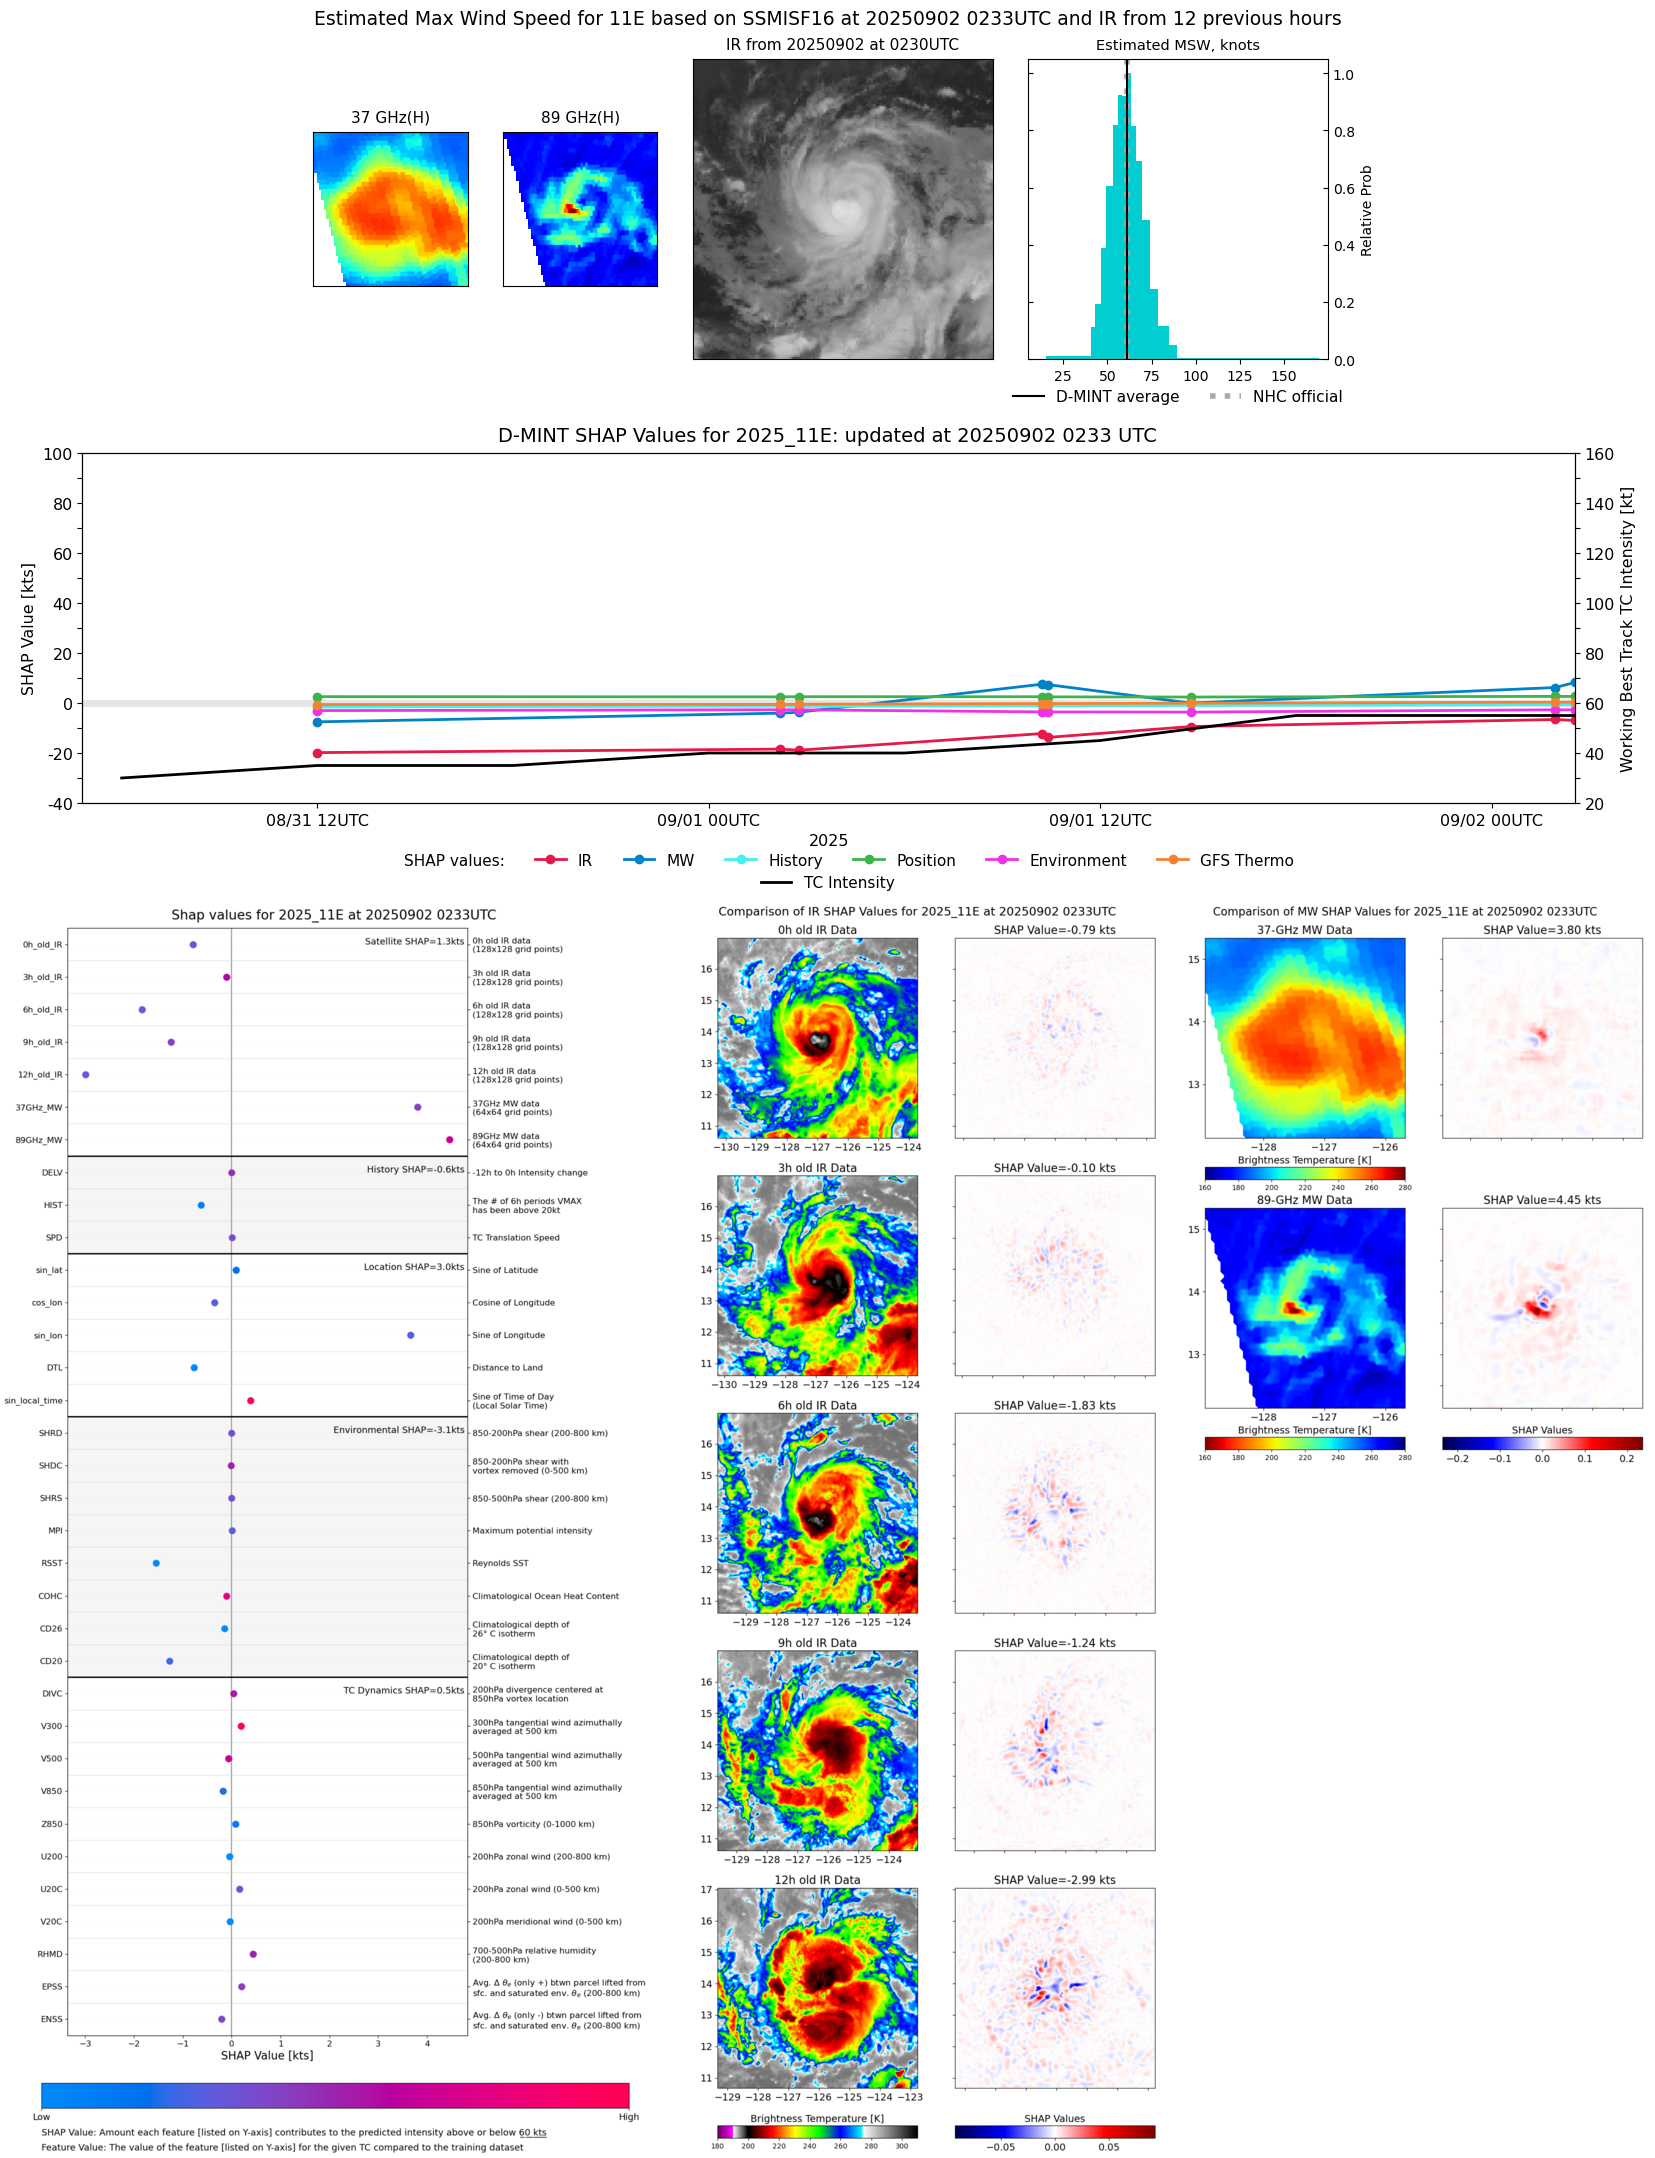 |
| 20250902 | 0221 UTC | TROPICS03 | 998 hPa | 50 kts | 45 kts | 55 kts |  |
| 20250902 | 0157 UTC | SSMISF17 | 995 hPa | 59 kts | 53 kts | 66 kts | 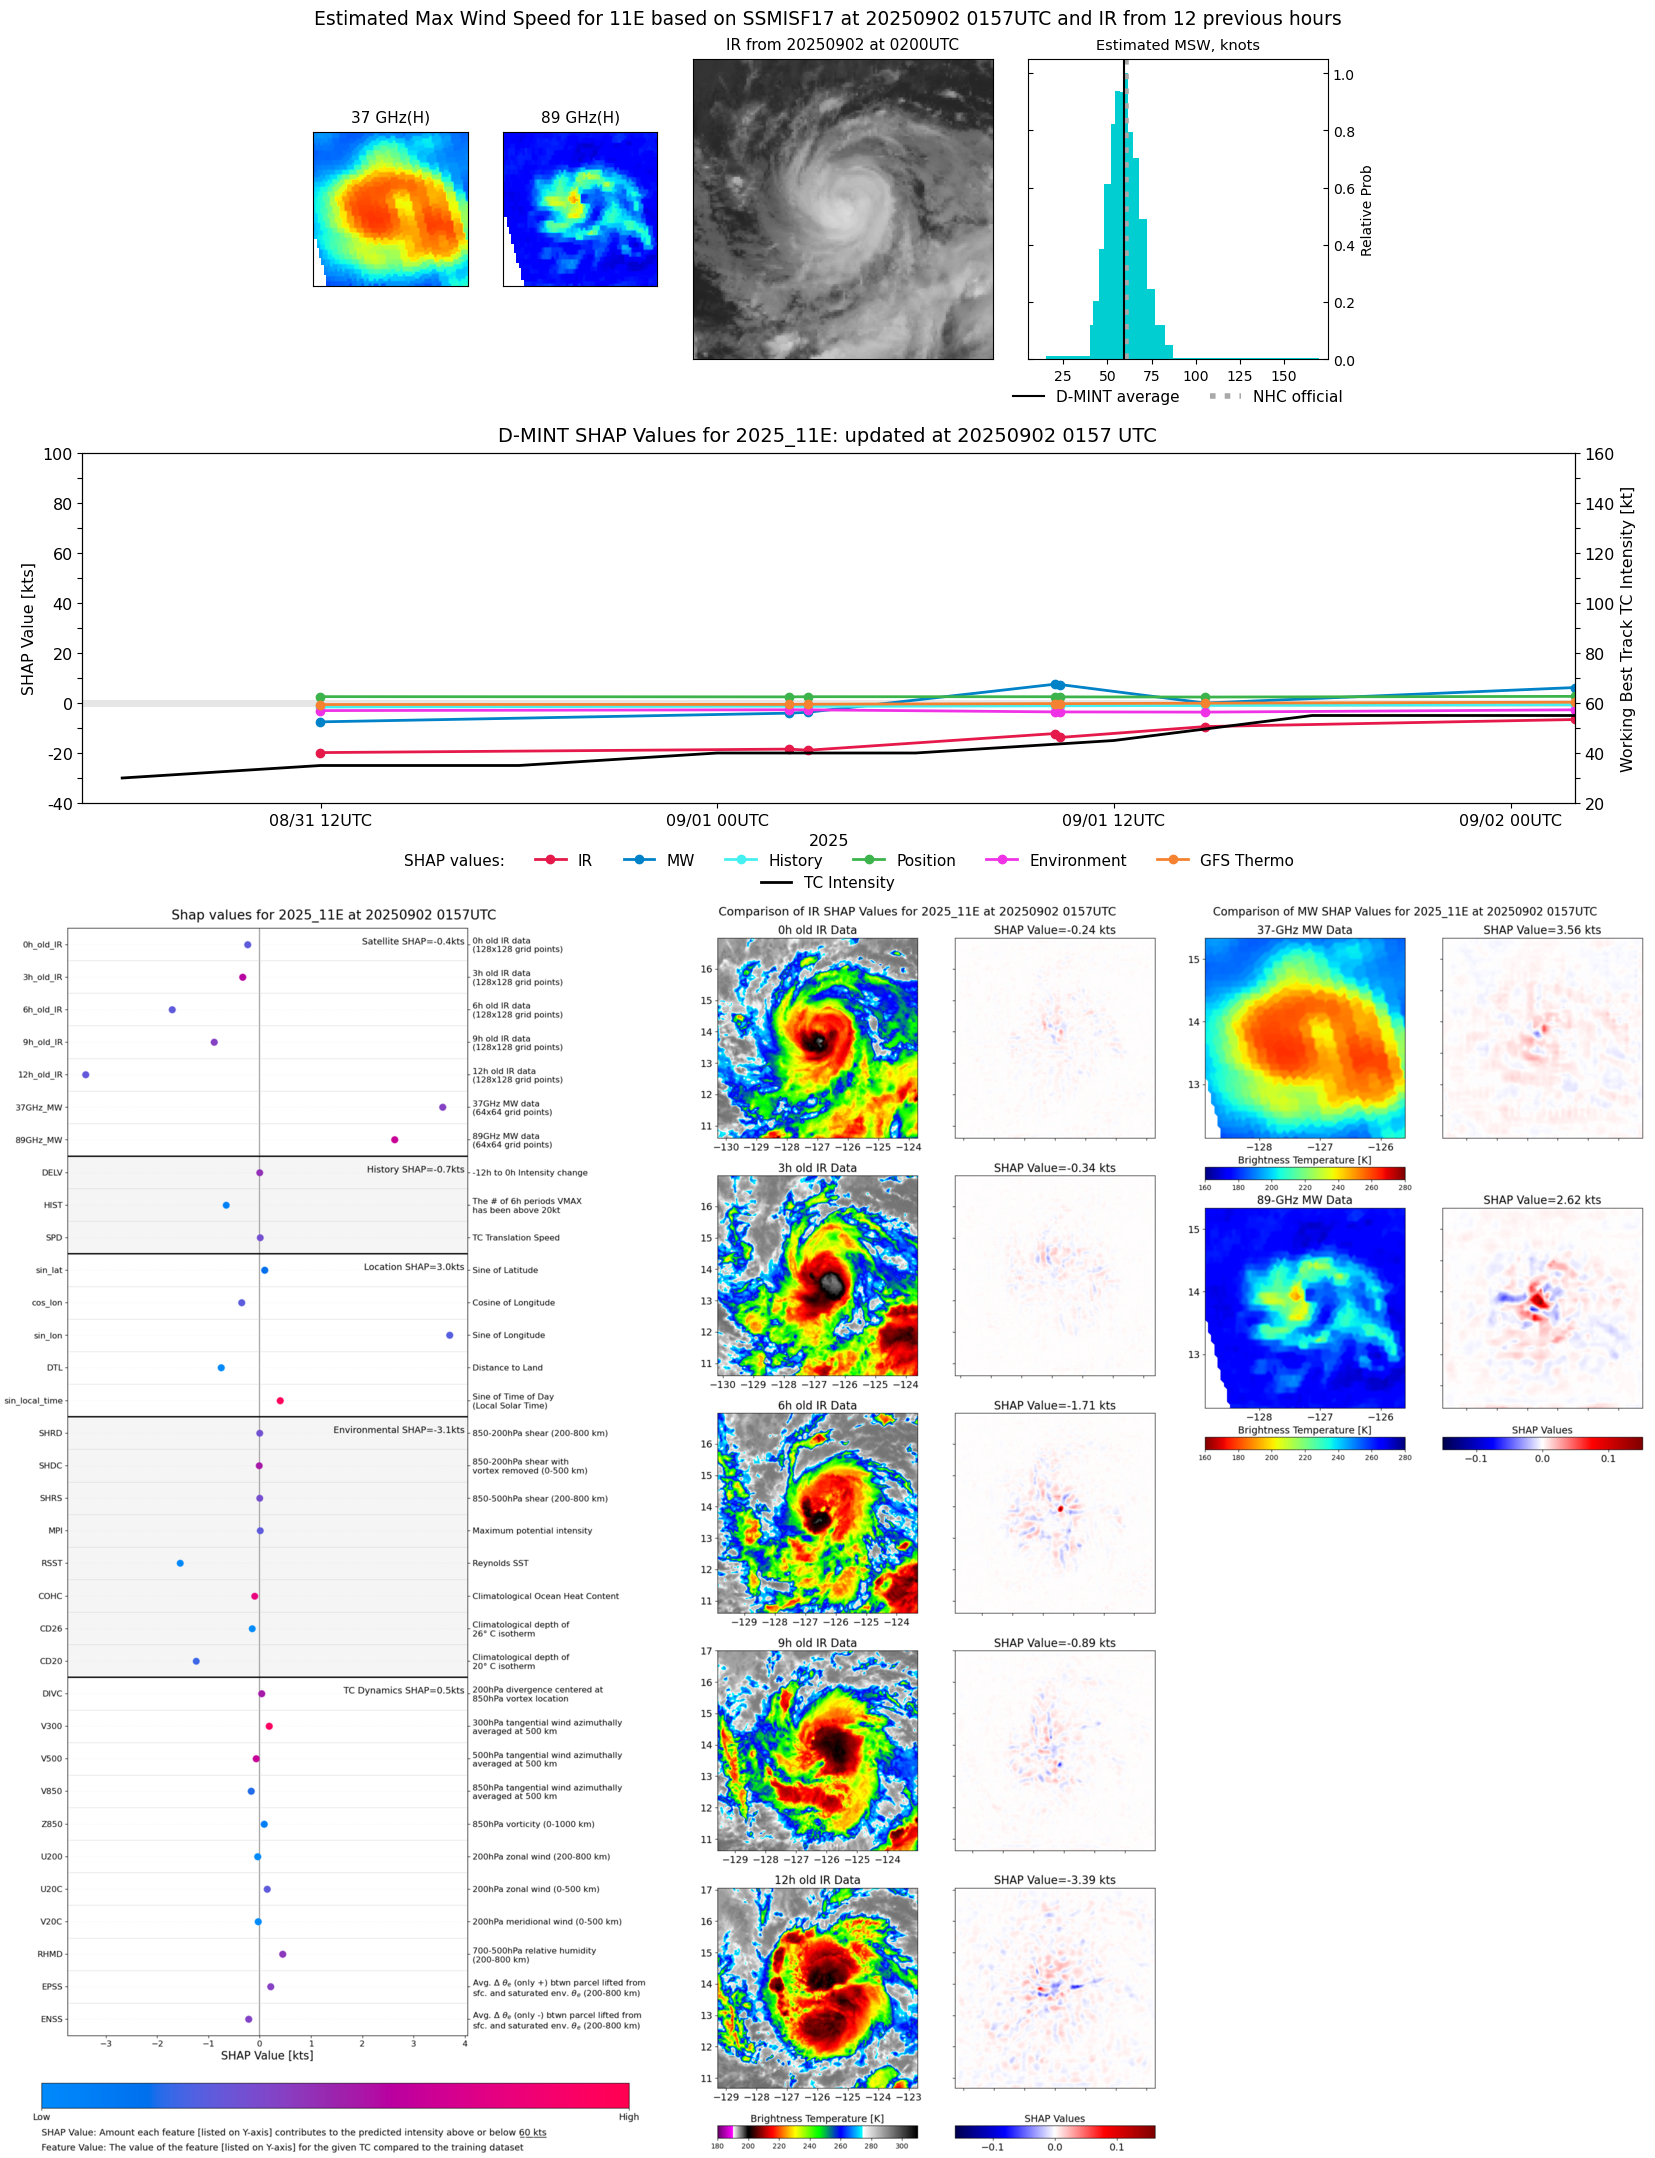 |
| 20250901 | 2335 UTC | TROPICS05 | 1001 hPa | 49 kts | 44 kts | 53 kts | 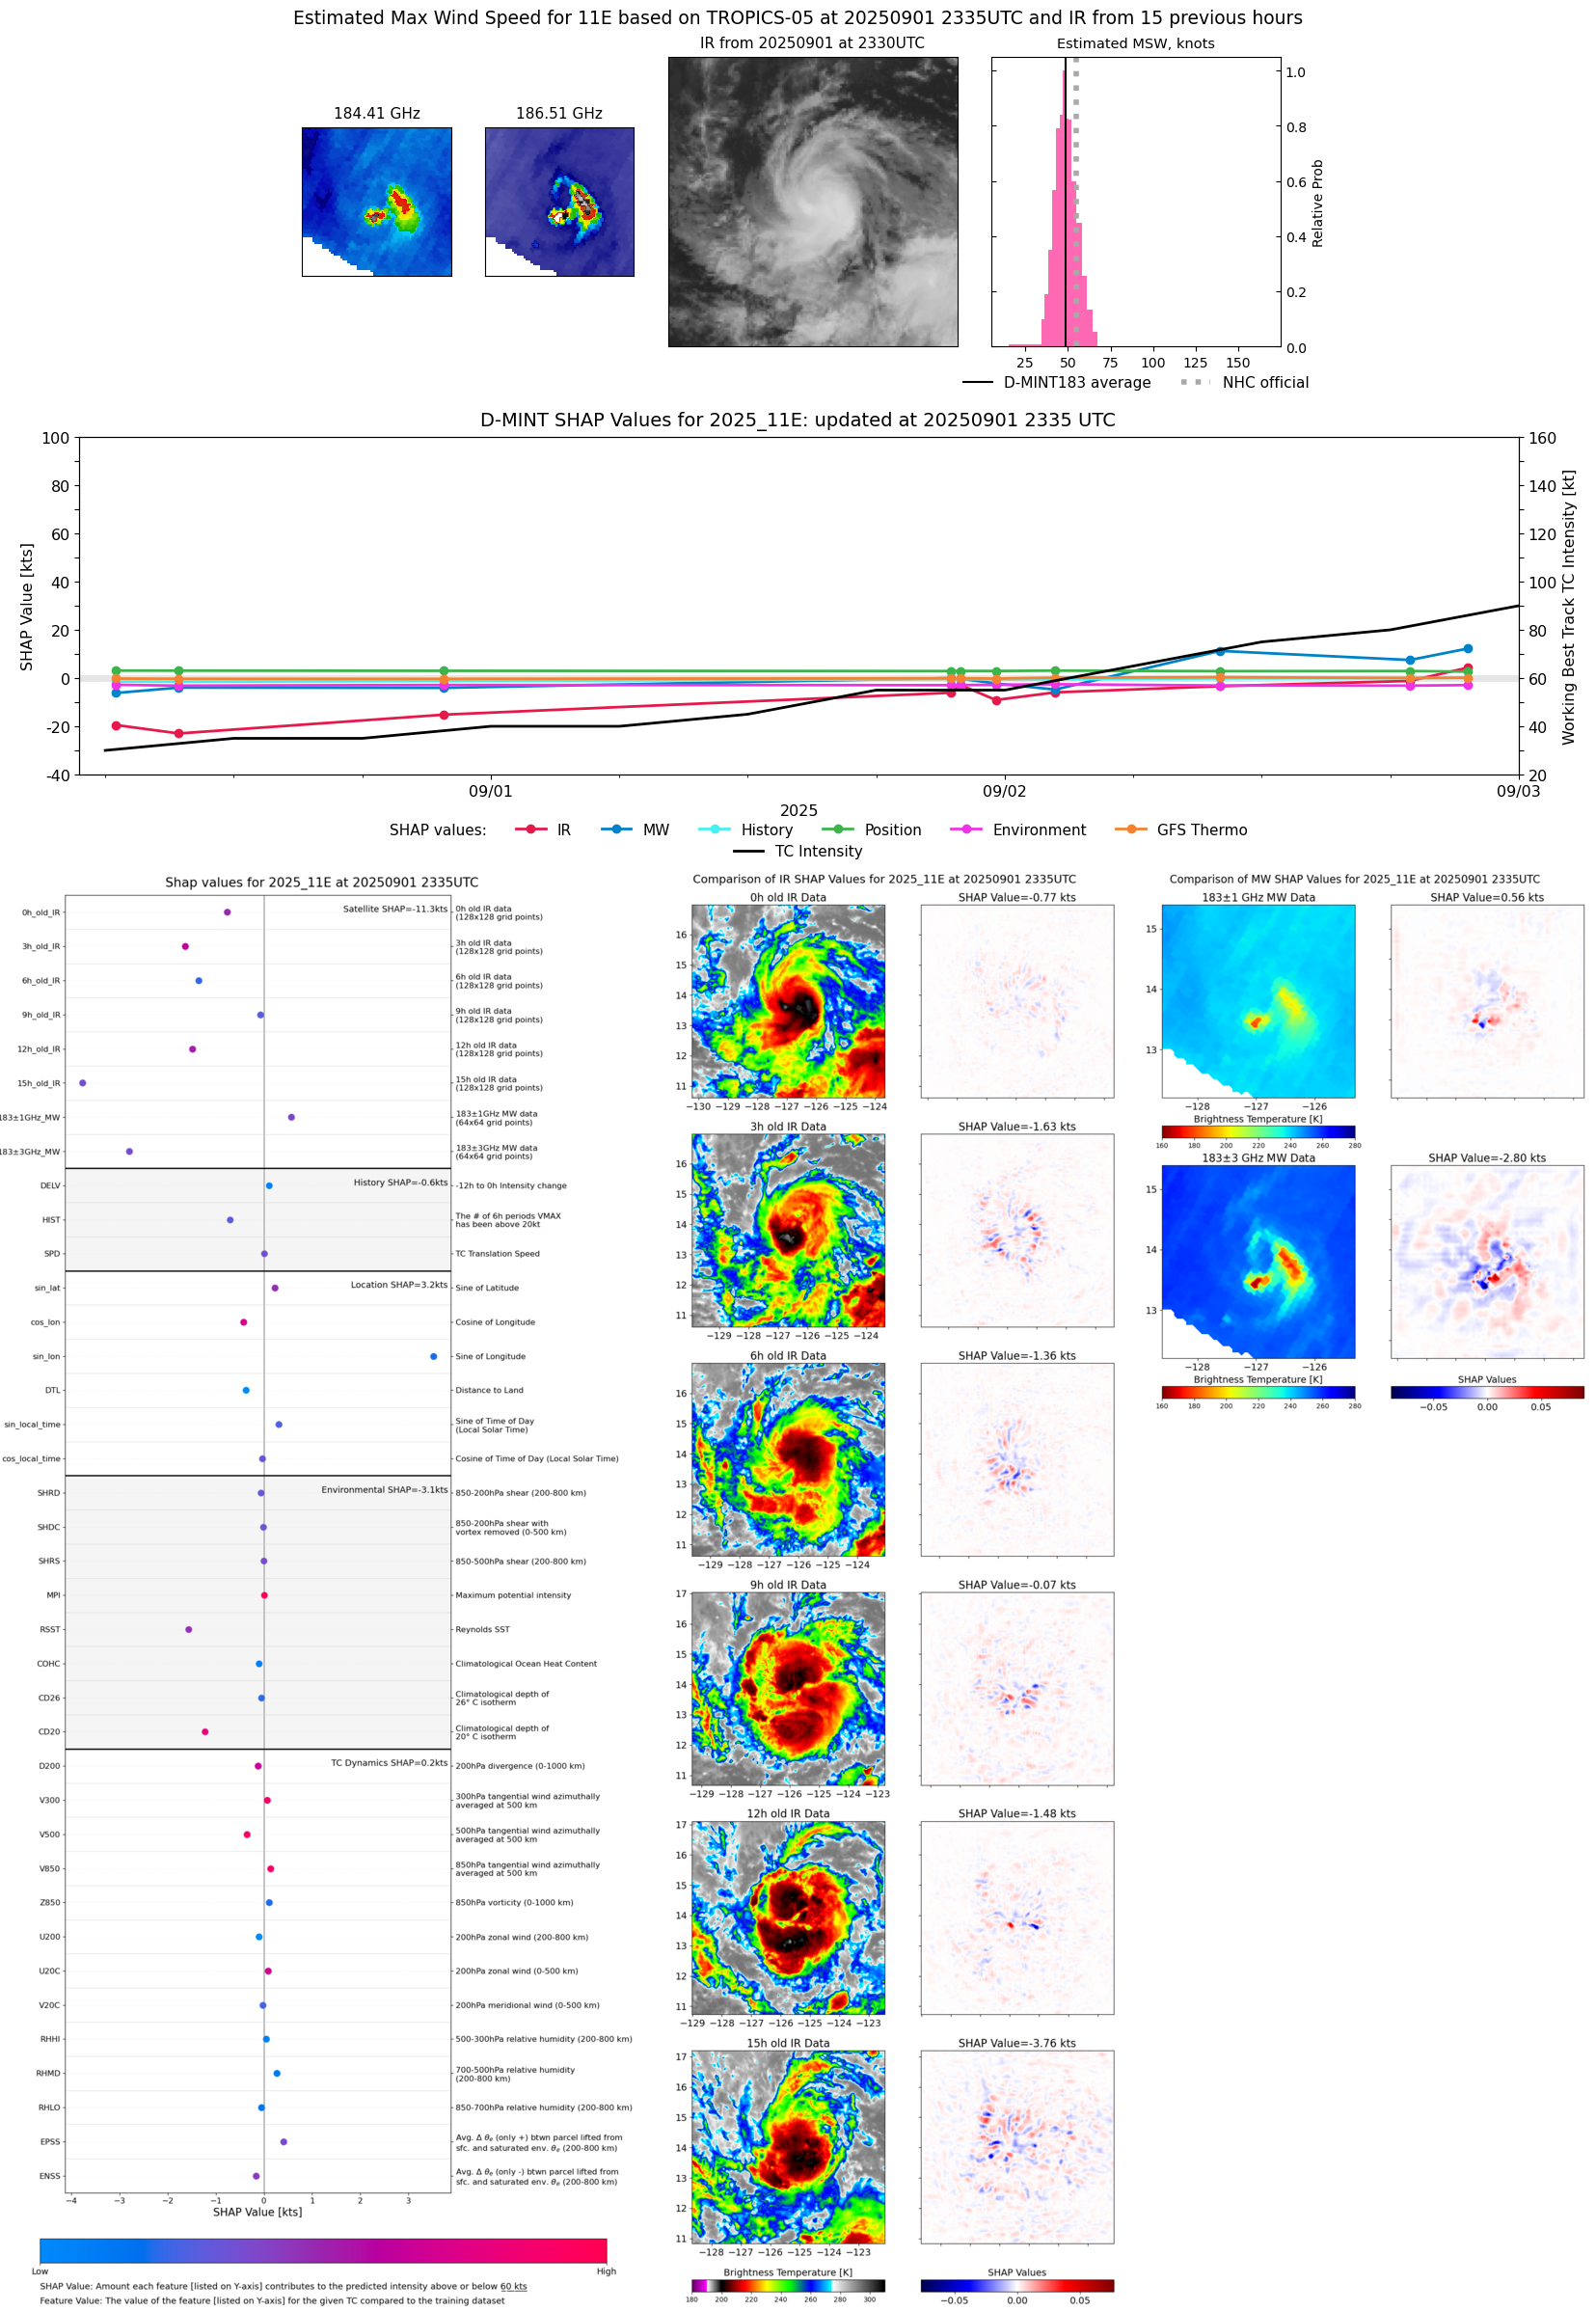 |
| 20250901 | 2156 UTC | ATMS-NPP | 998 hPa | 57 kts | 52 kts | 62 kts | 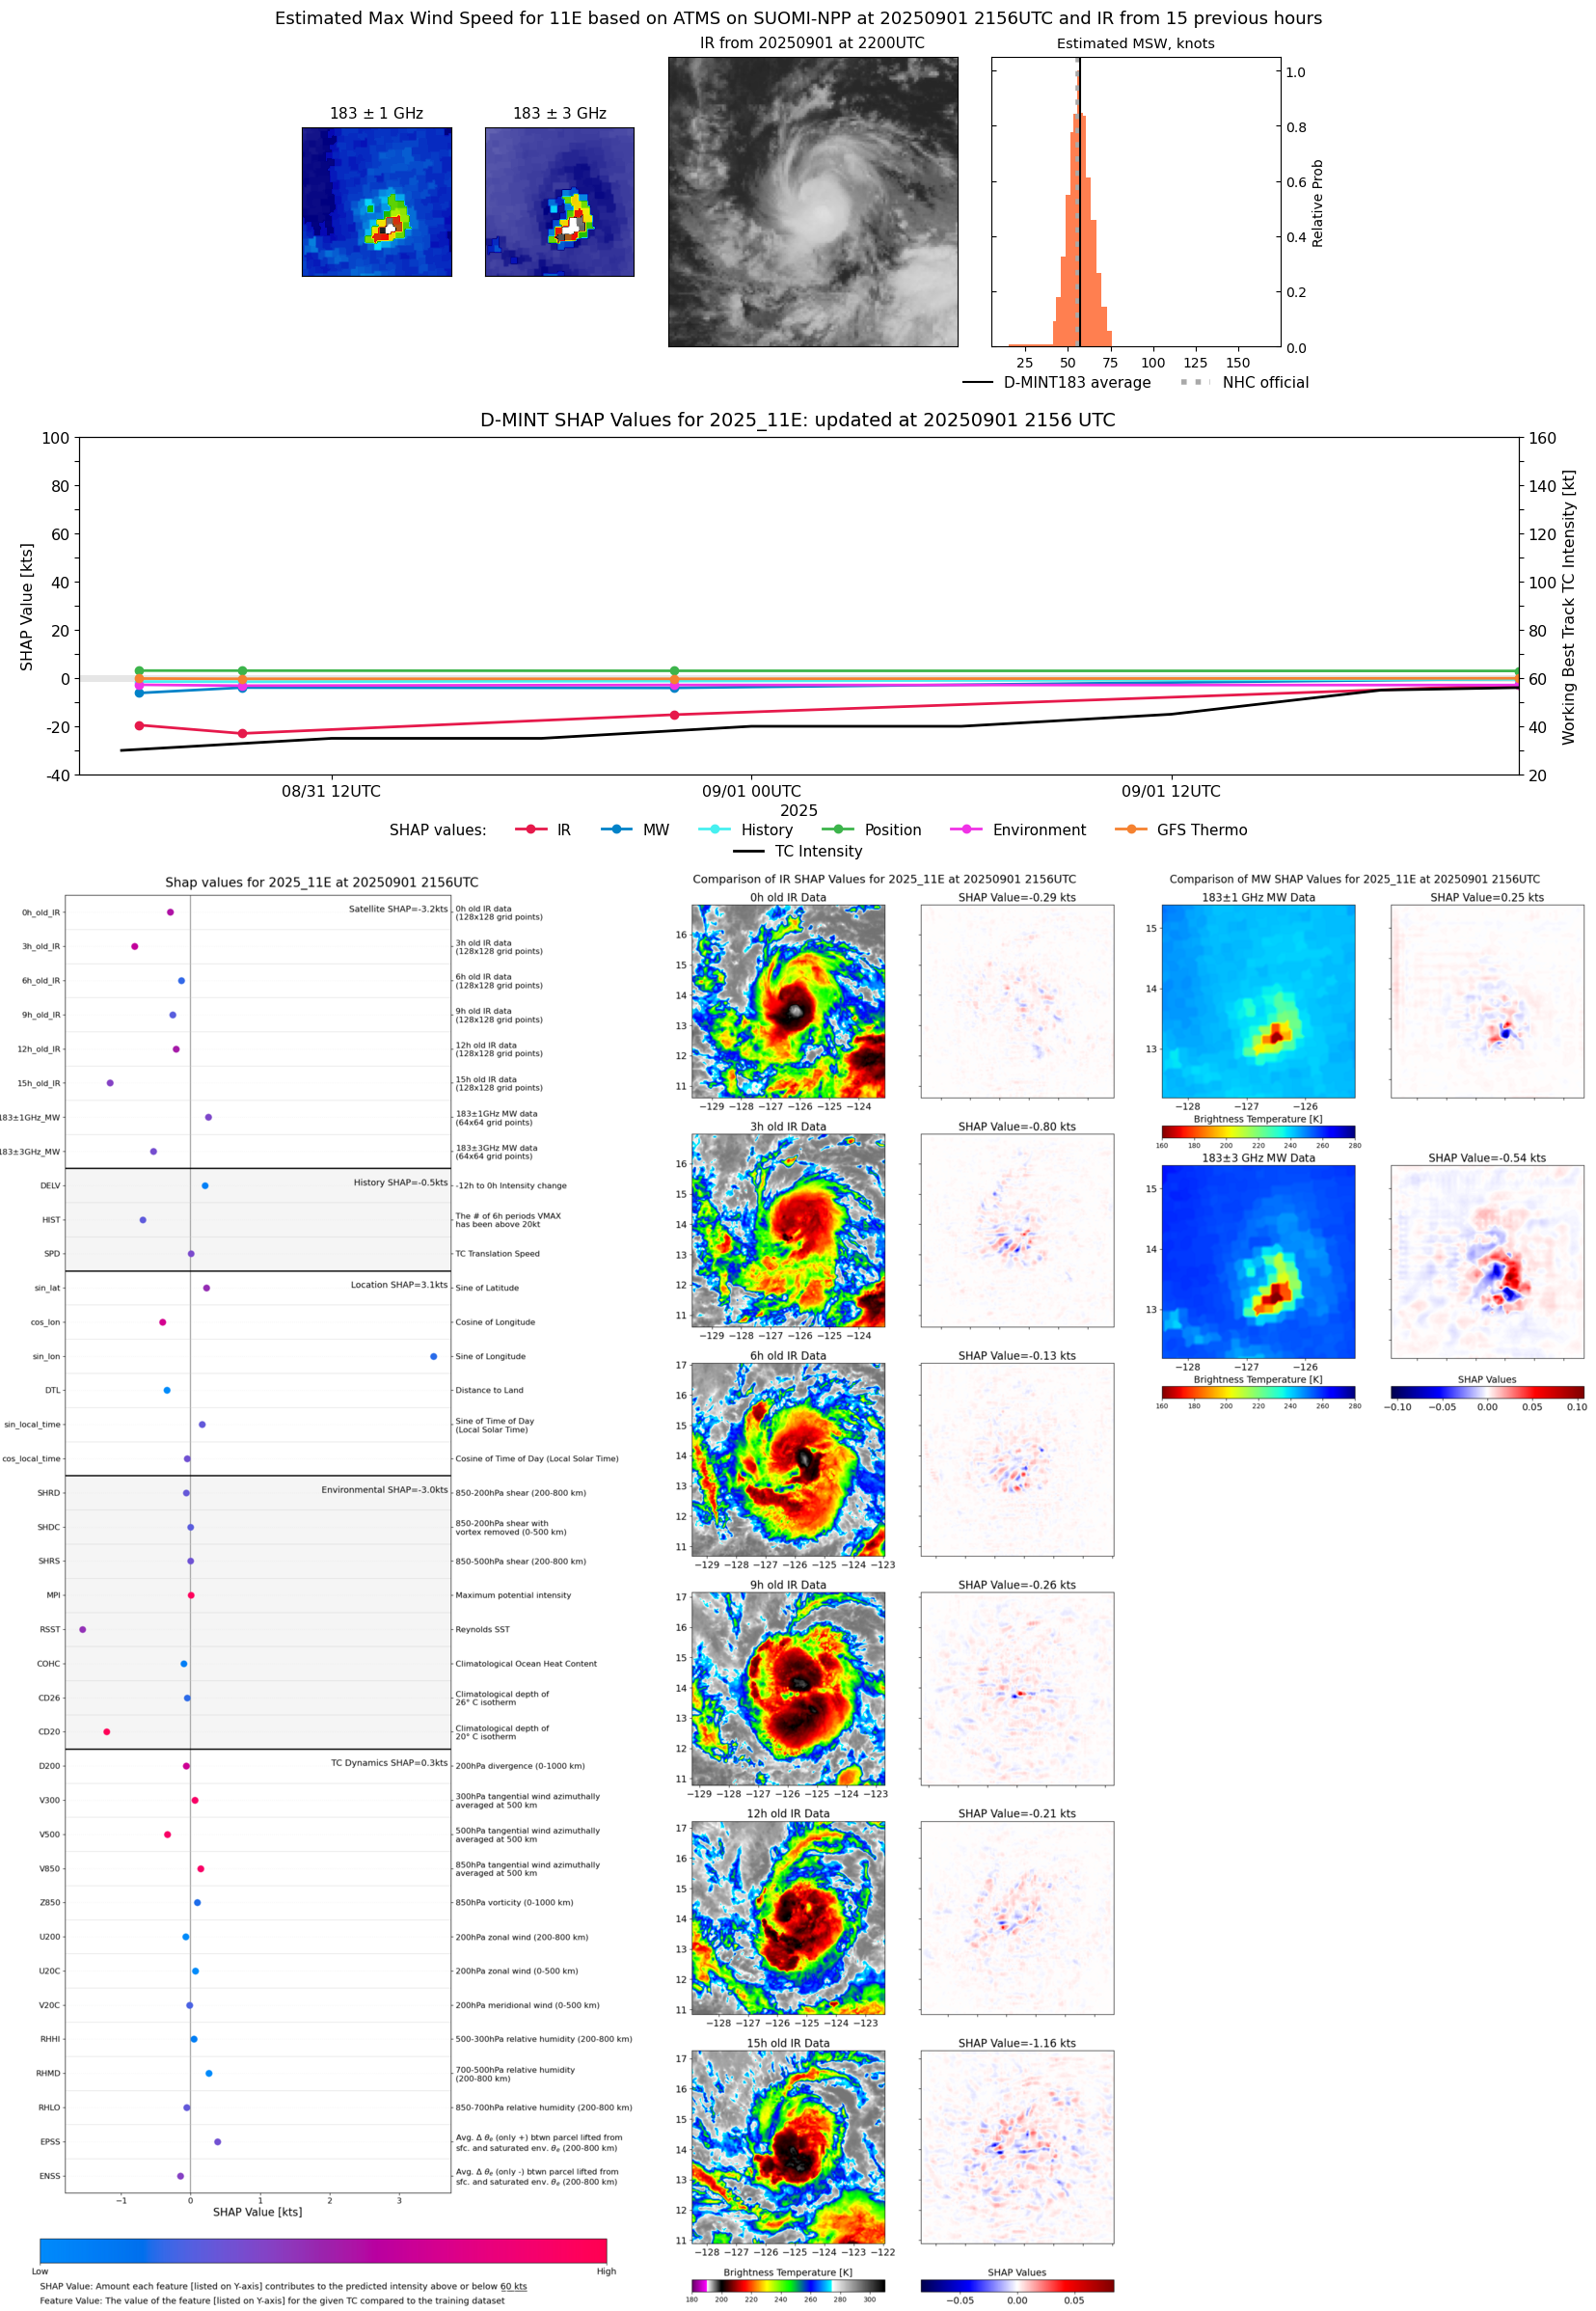 |
| 20250901 | 2129 UTC | ATMS-N21 | 998 hPa | 54 kts | 50 kts | 59 kts |  |
| 20250901 | 1446 UTC | SSMISF17 | 1000 hPa | 48 kts | 44 kts | 53 kts | 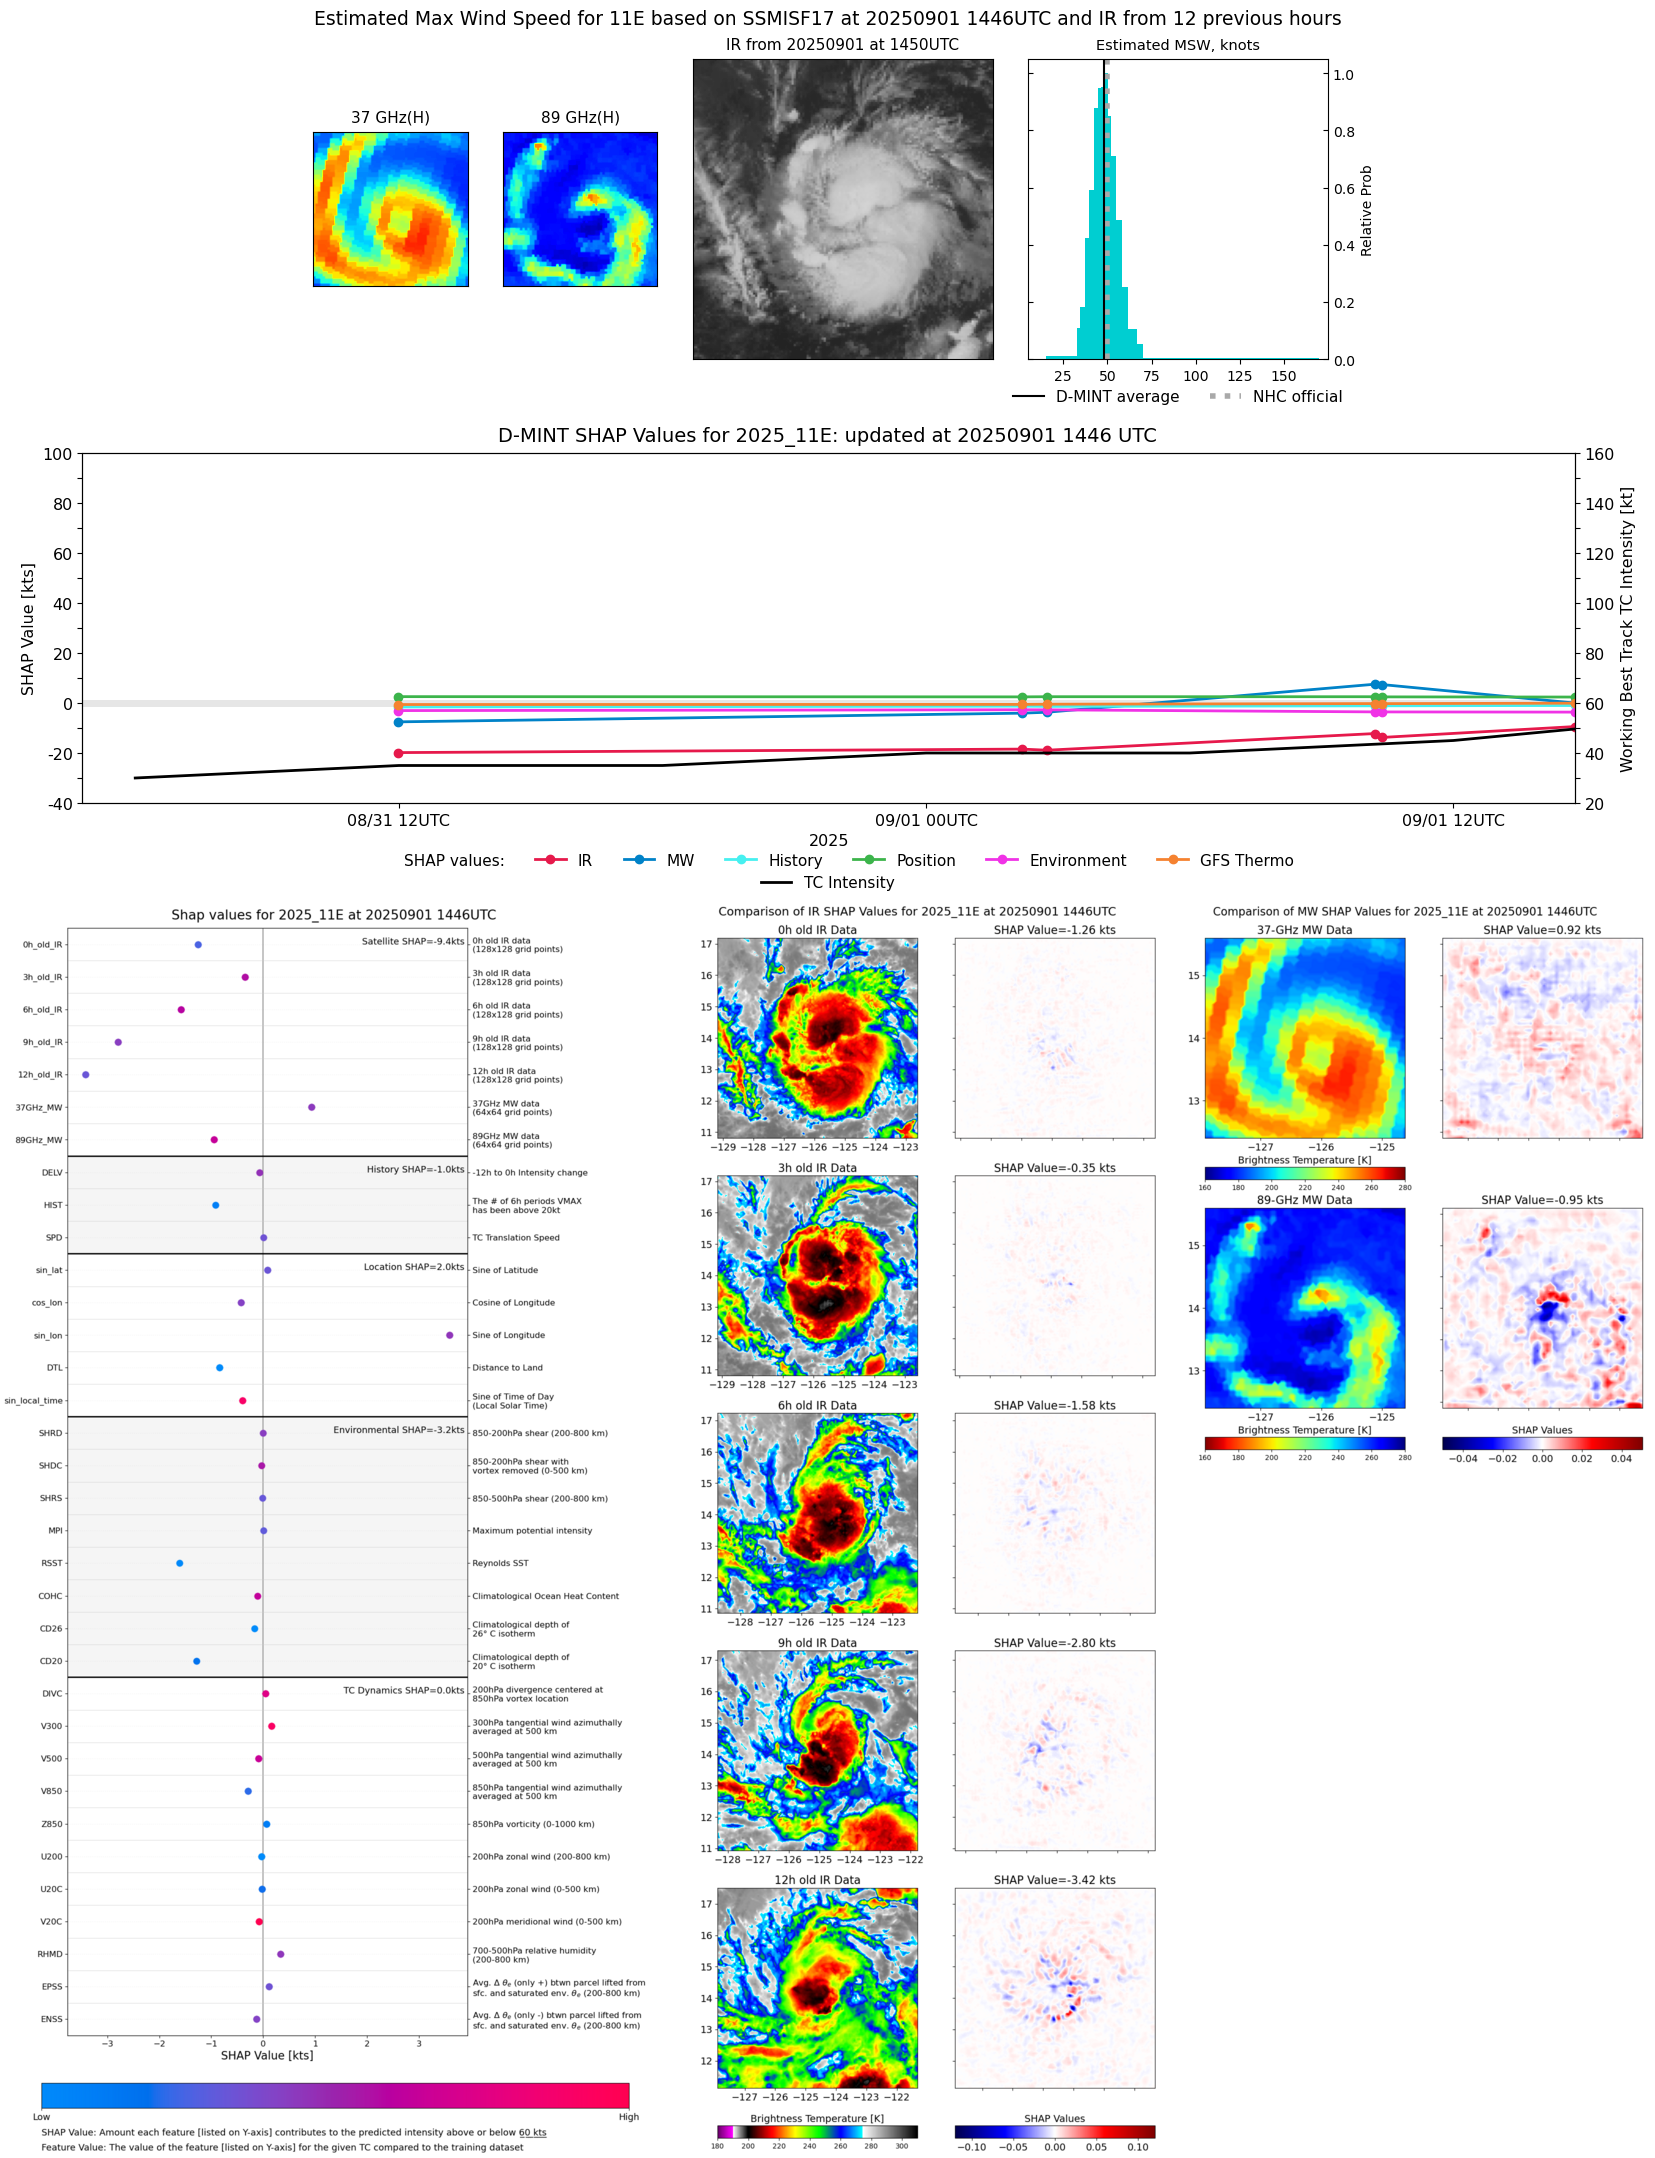 |
| 20250901 | 1132 UTC | TROPICS03 | 1002 hPa | 37 kts | 33 kts | 41 kts | 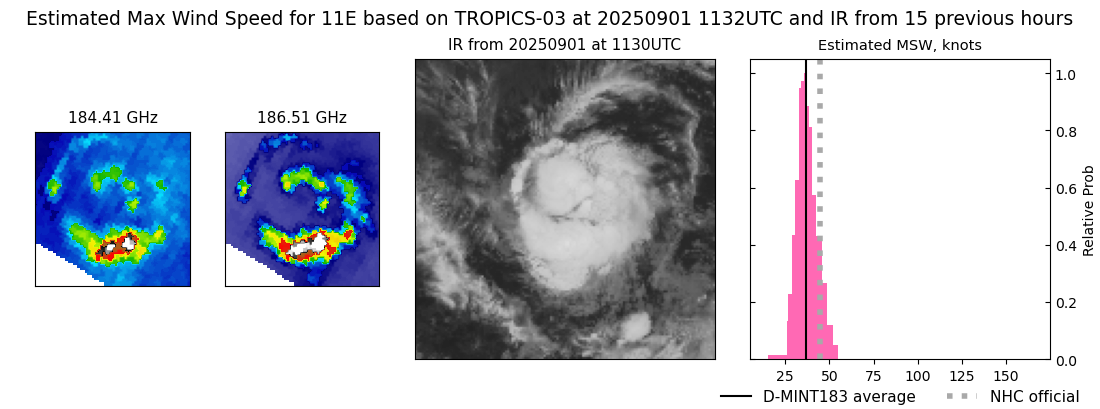 |
| 20250901 | 1023 UTC | AMSR2 | 997 hPa | 51 kts | 46 kts | 56 kts | 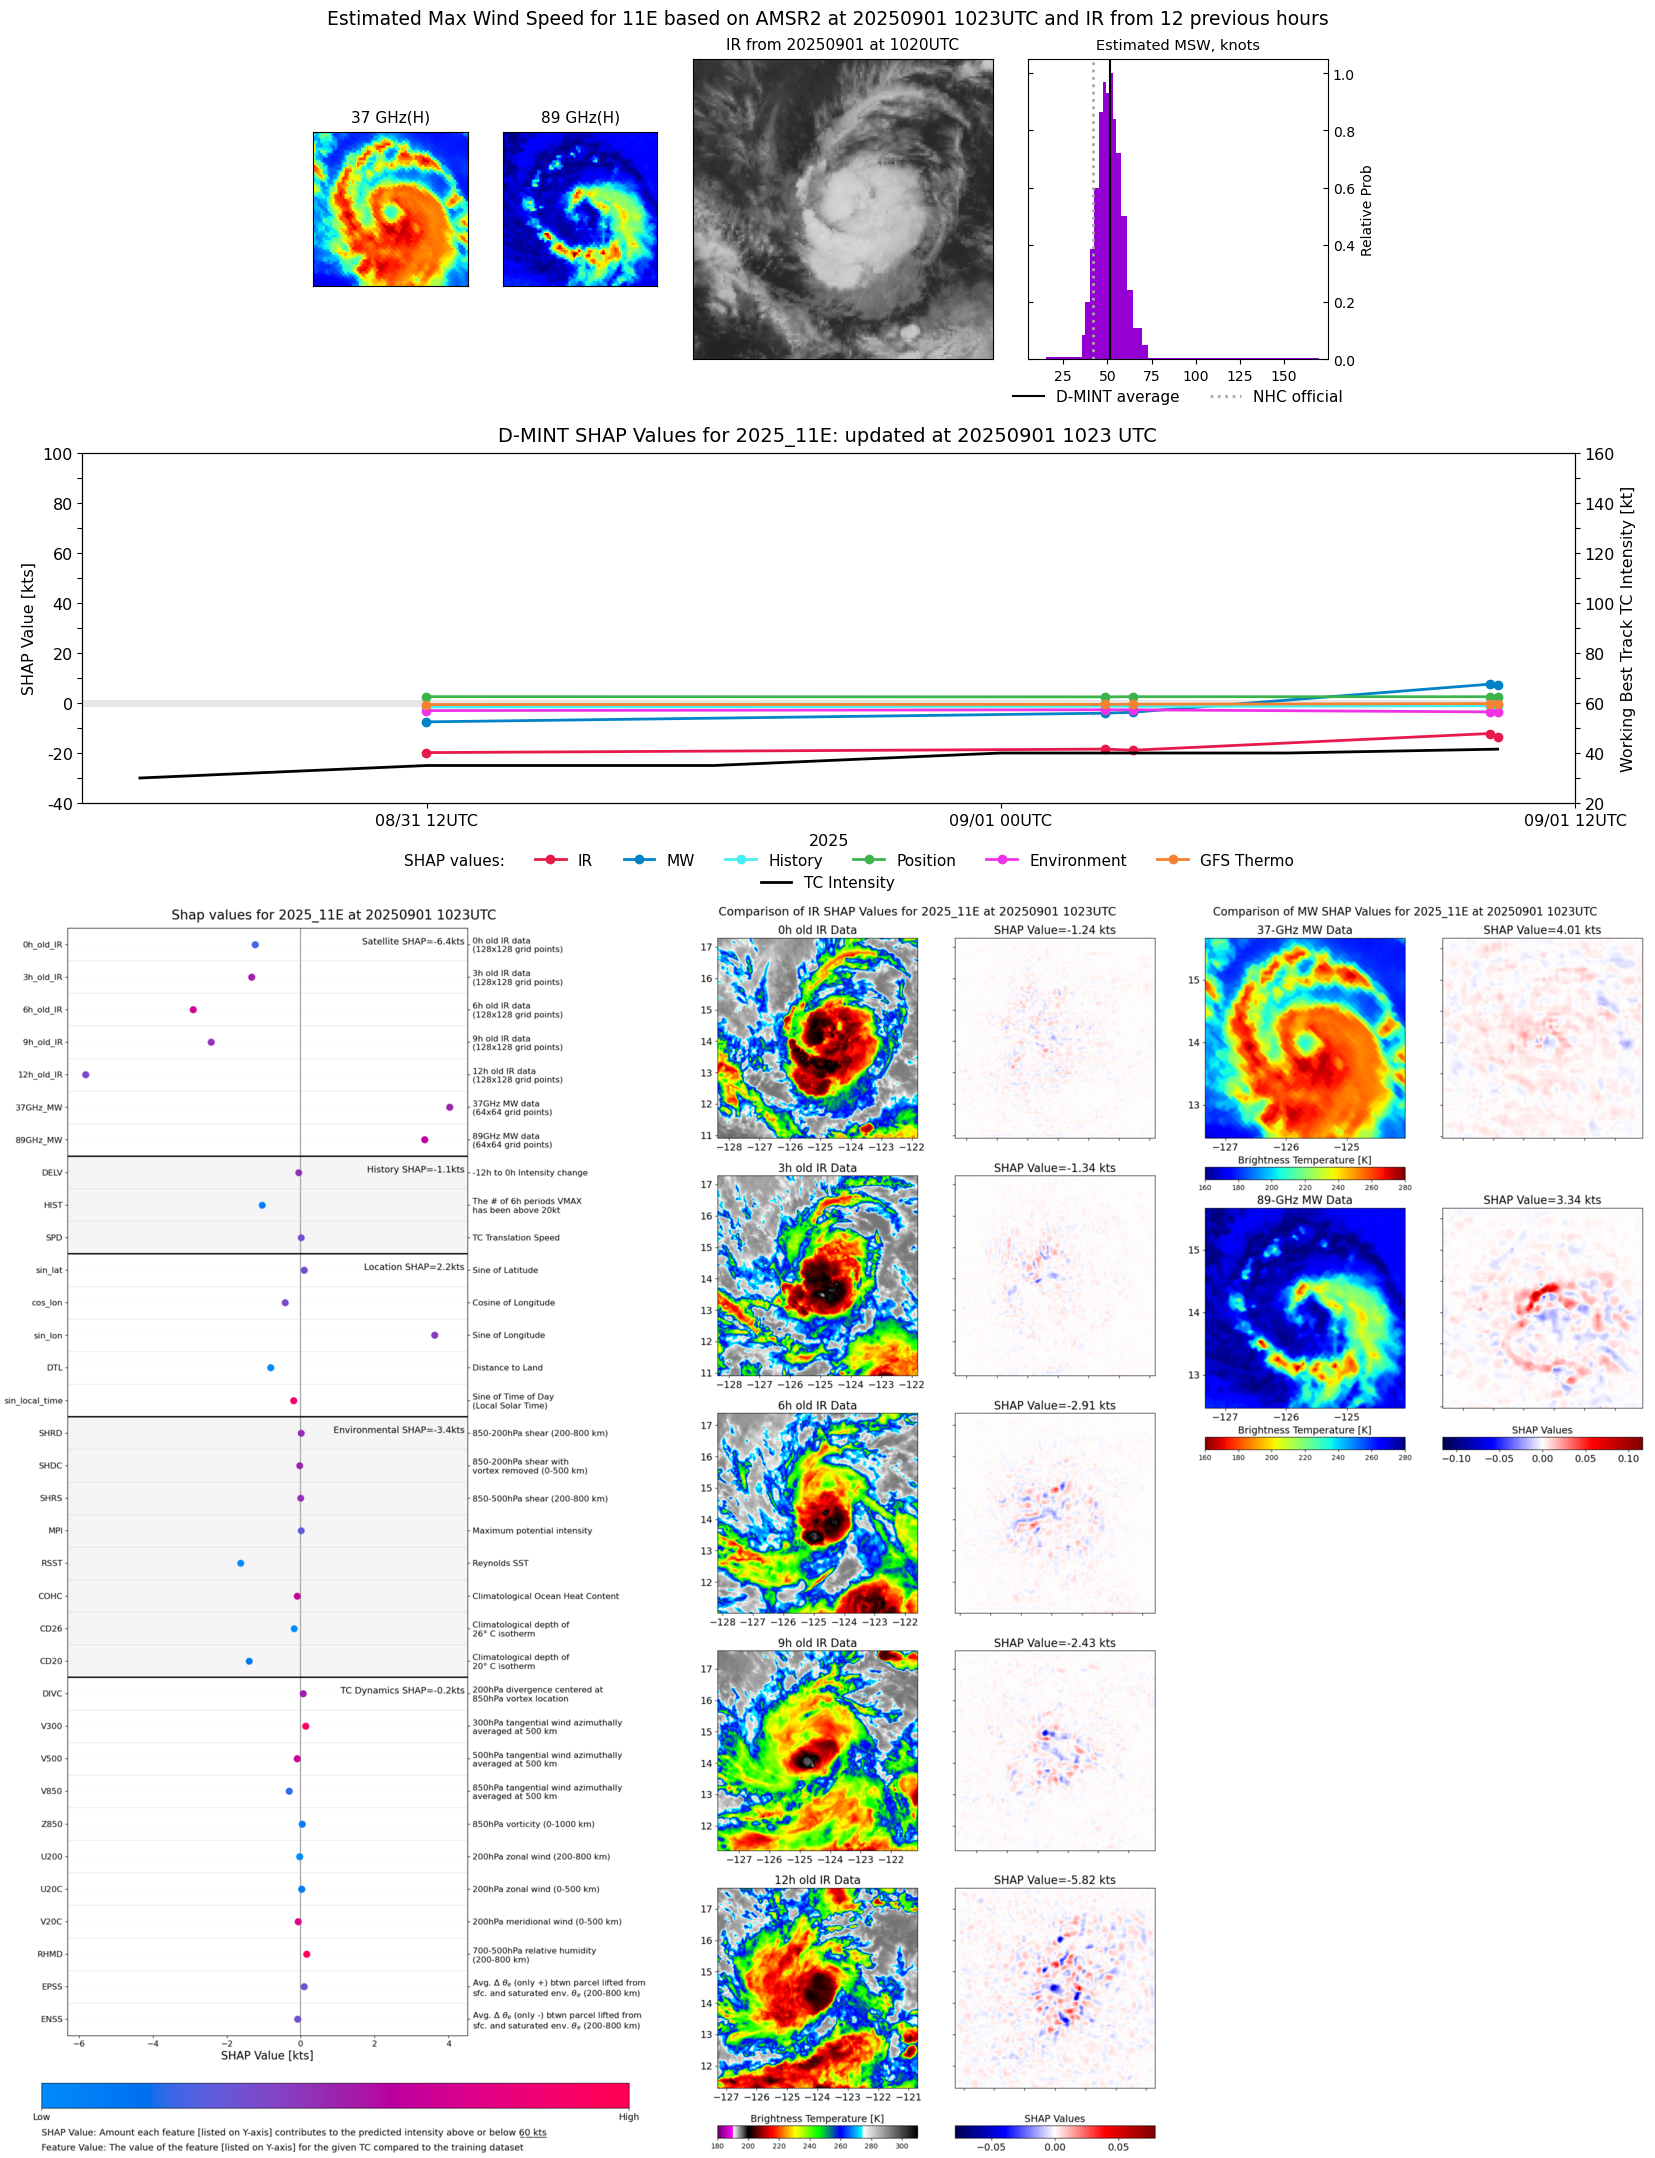 |
| 20250901 | 1013 UTC | GMI | 995 hPa | 53 kts | 48 kts | 58 kts | 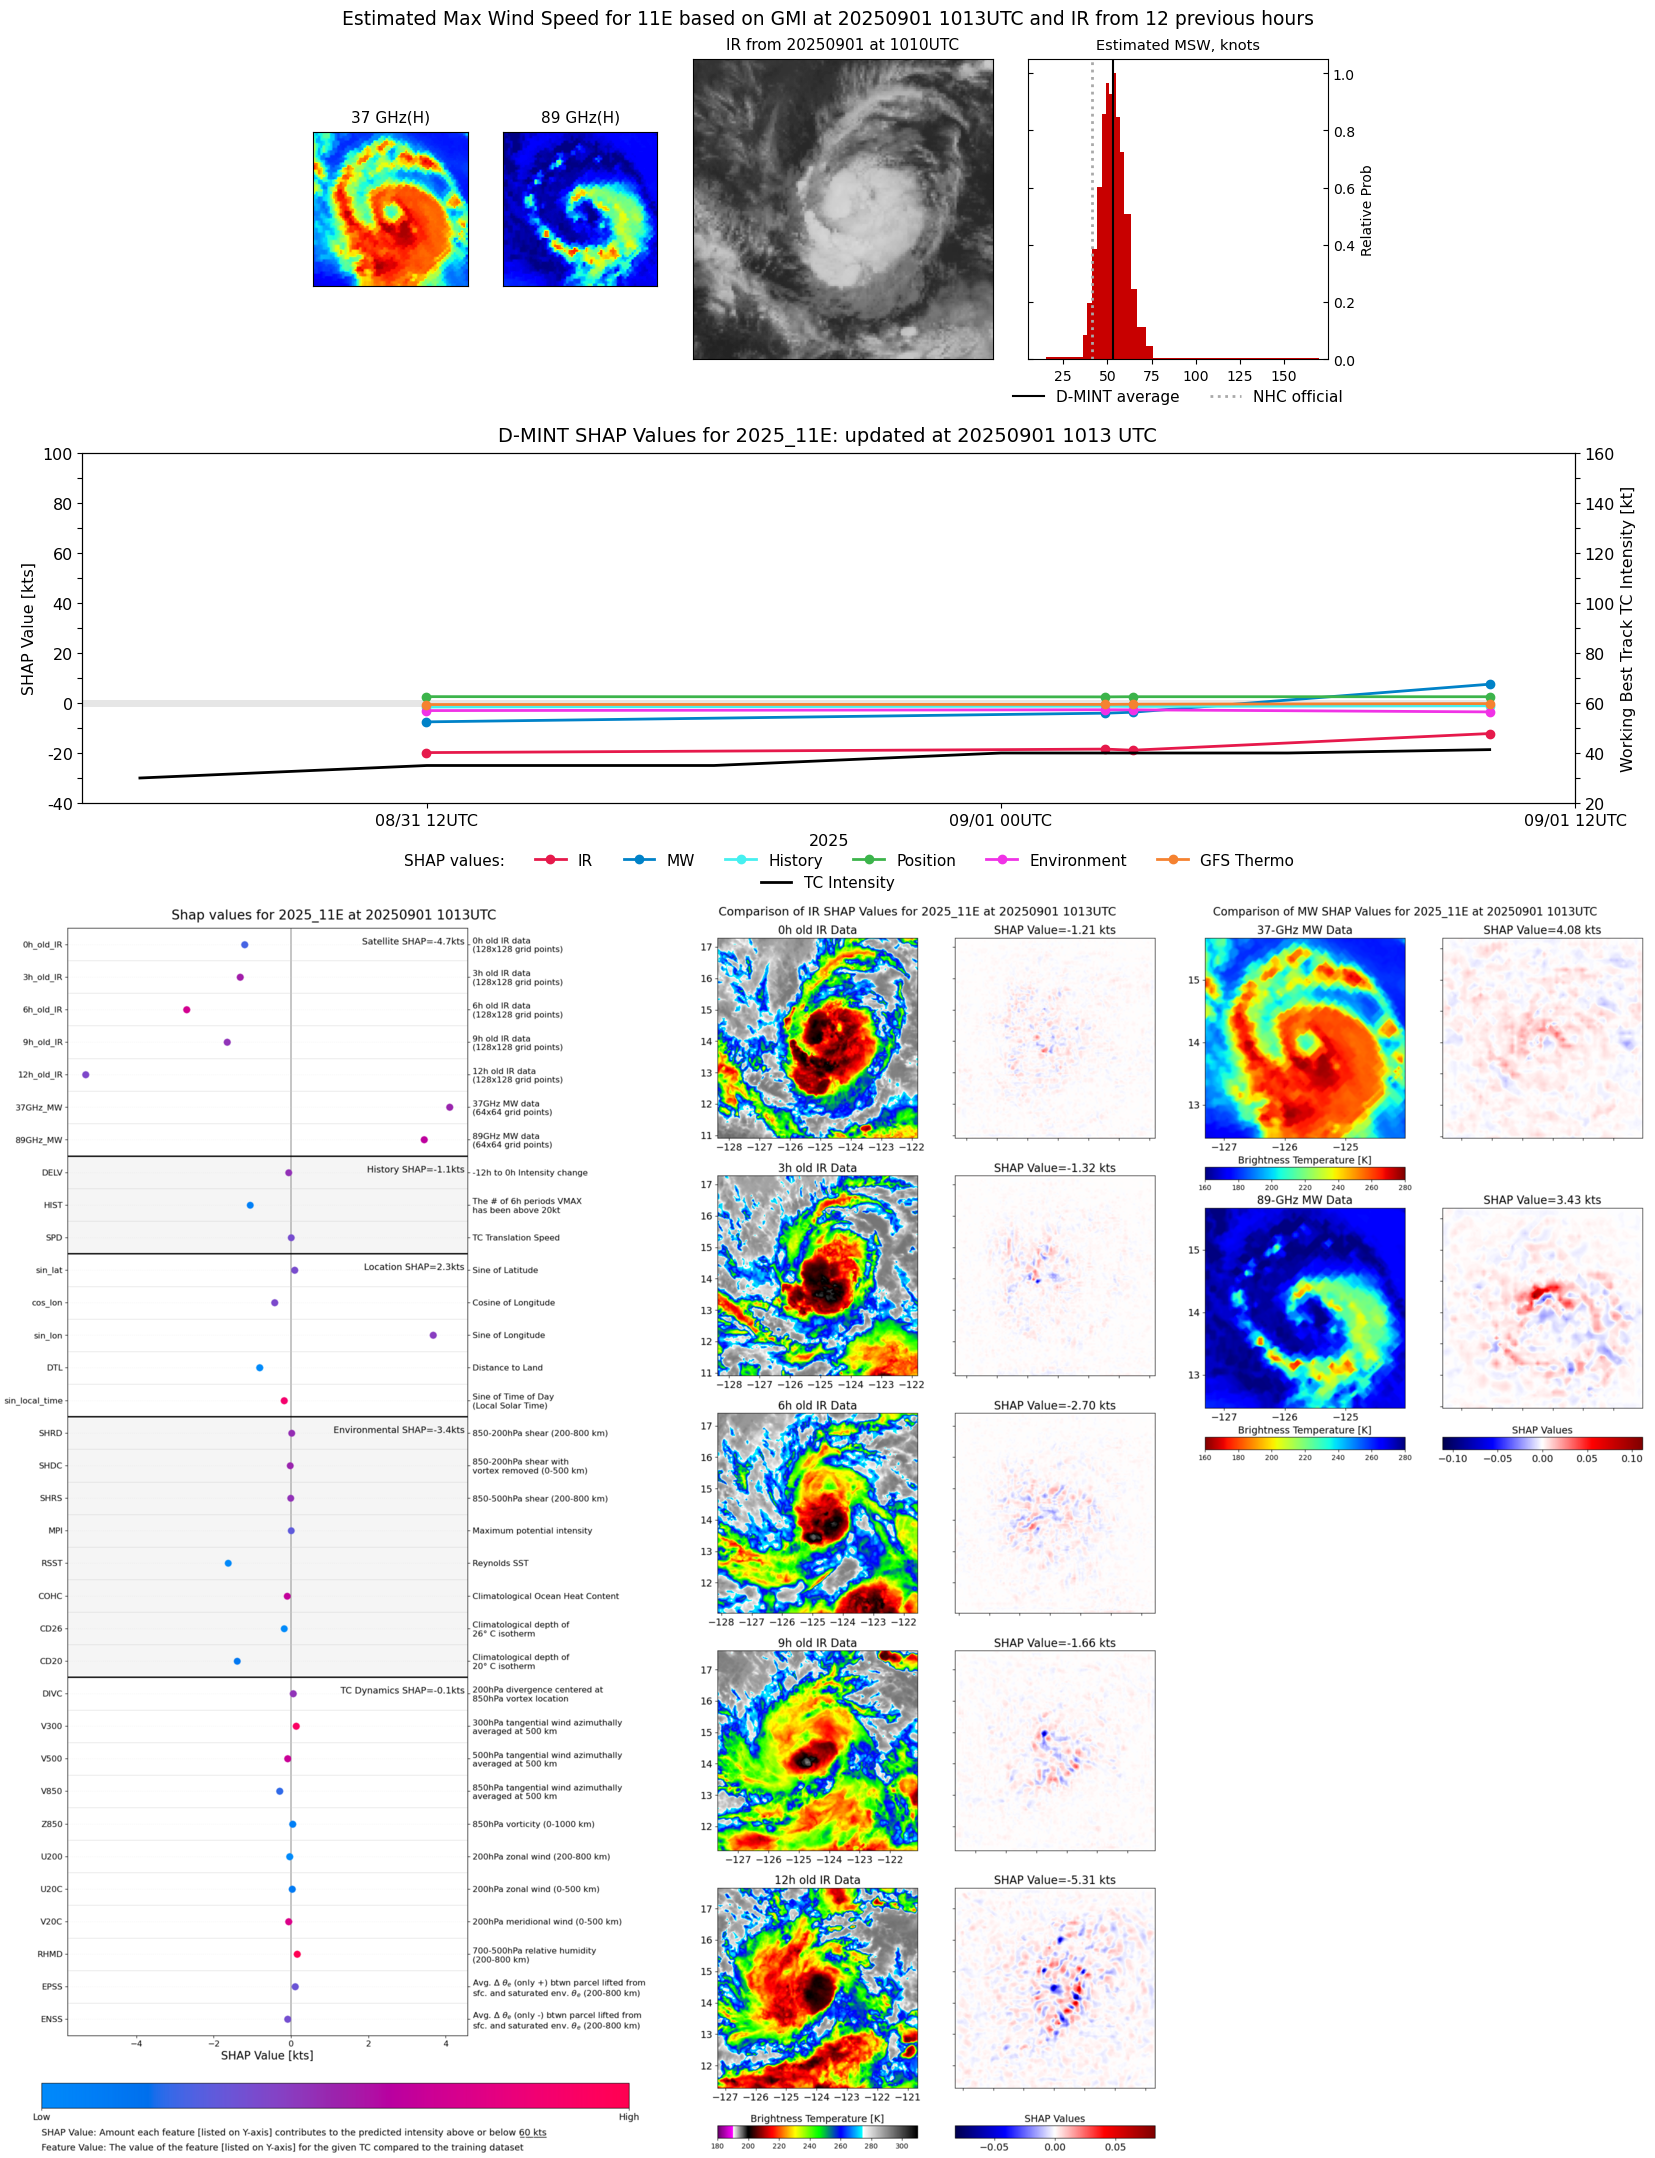 |
| 20250901 | 0645 UTC | AWS | 1003 hPa | 43 kts | 39 kts | 48 kts |  |
| 20250901 | 0638 UTC | TMS06 | 1004 hPa | 40 kts | 36 kts | 45 kts | 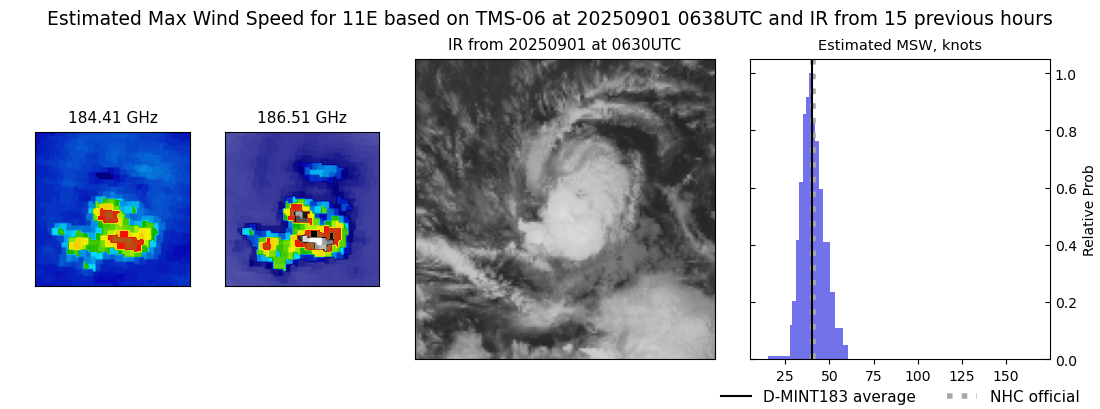 |
| 20250901 | 0245 UTC | SSMISF16 | 1004 hPa | 36 kts | 32 kts | 40 kts | 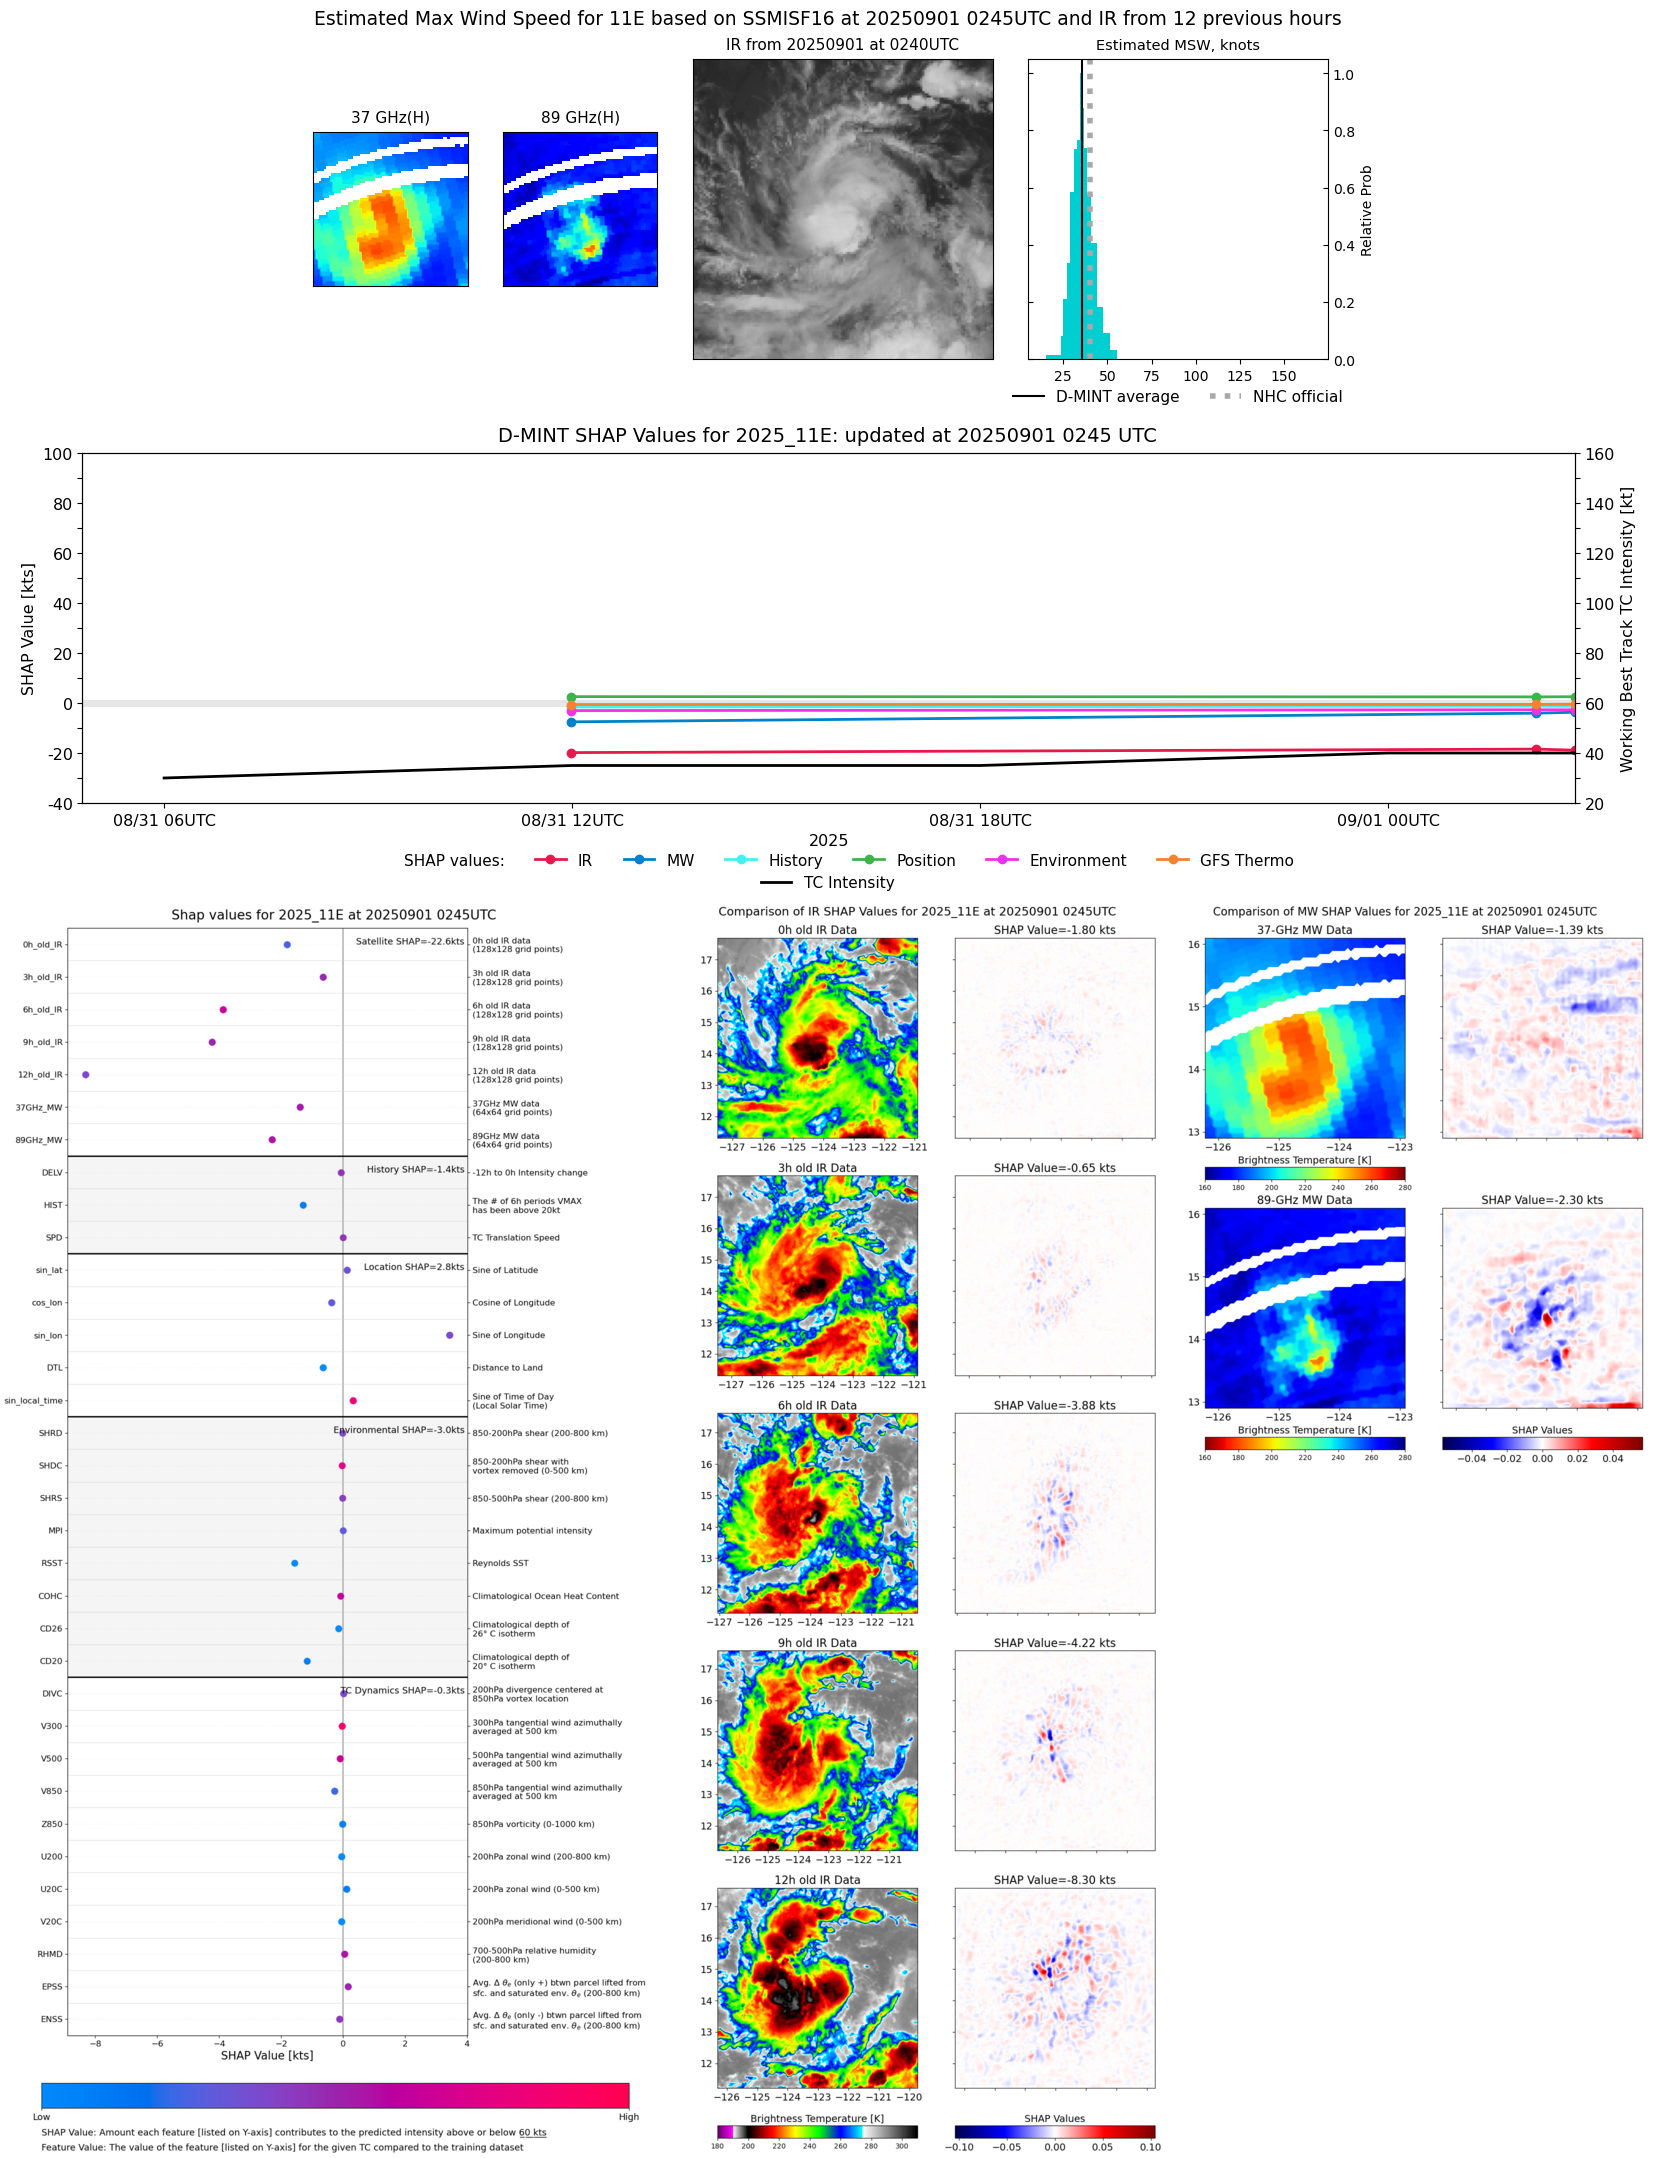 |
| 20250901 | 0211 UTC | SSMISF17 | 1003 hPa | 36 kts | 32 kts | 40 kts | 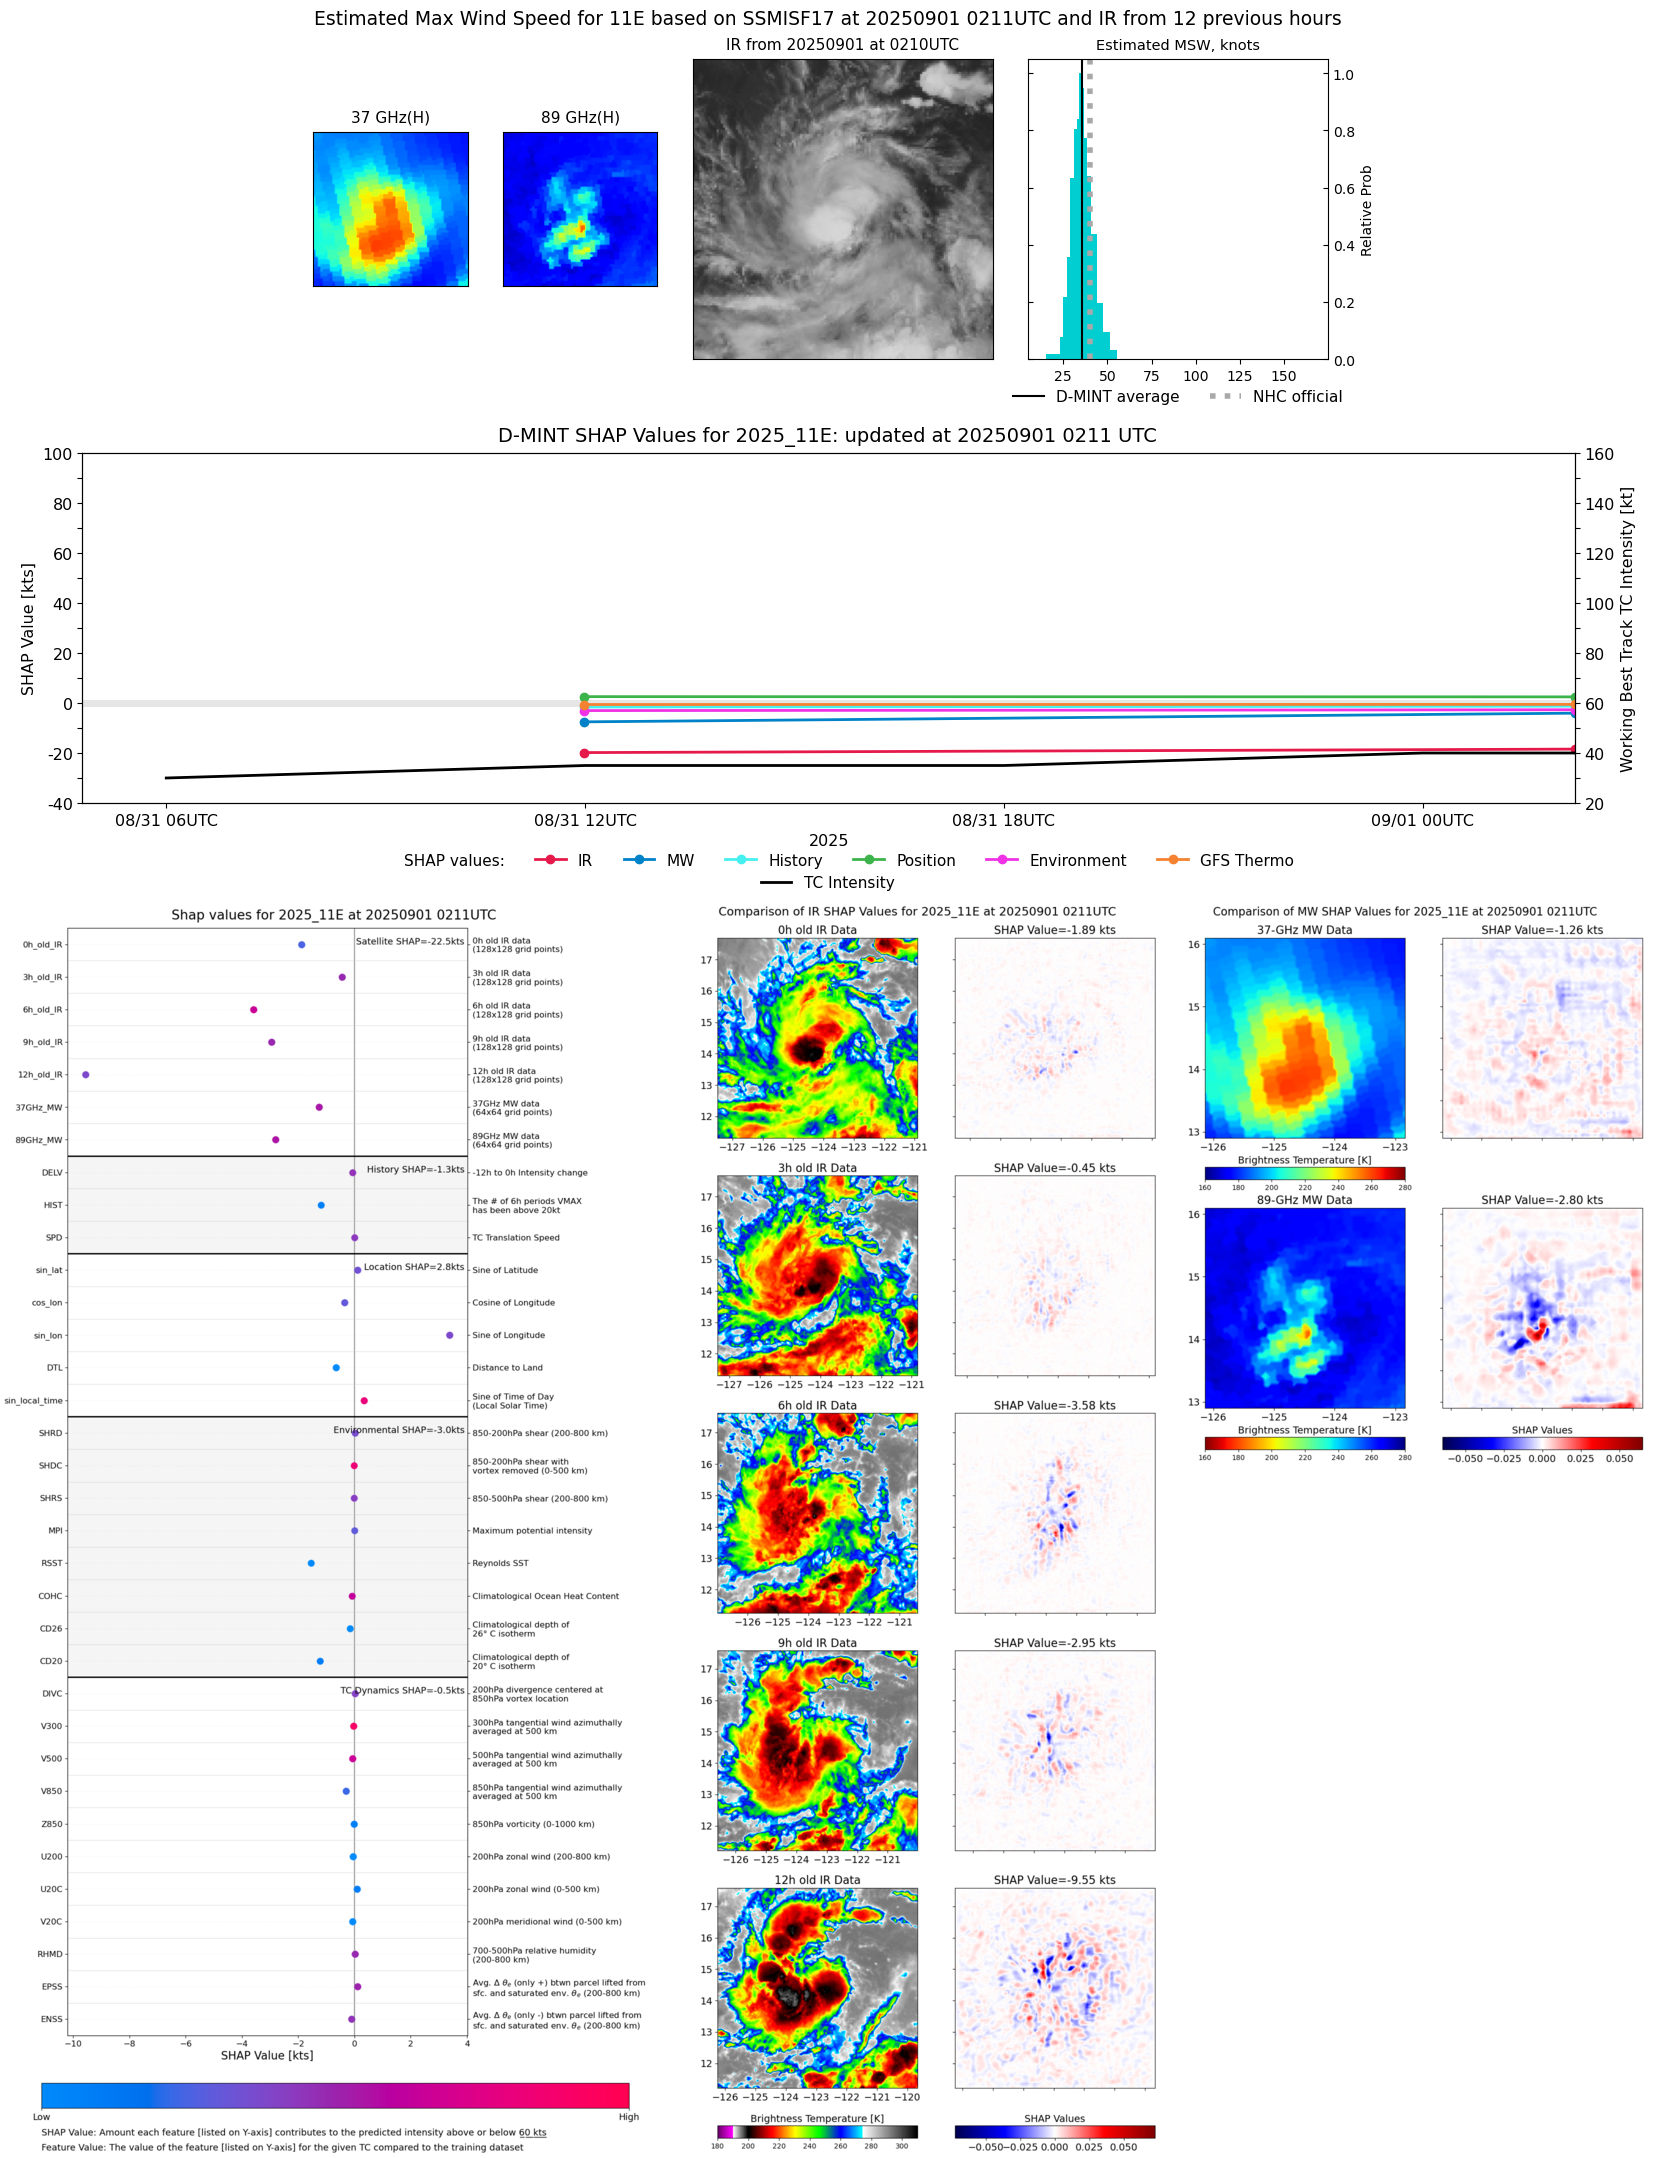 |
| 20250831 | 2148 UTC | ATMS-N21 | 1004 hPa | 40 kts | 36 kts | 44 kts | 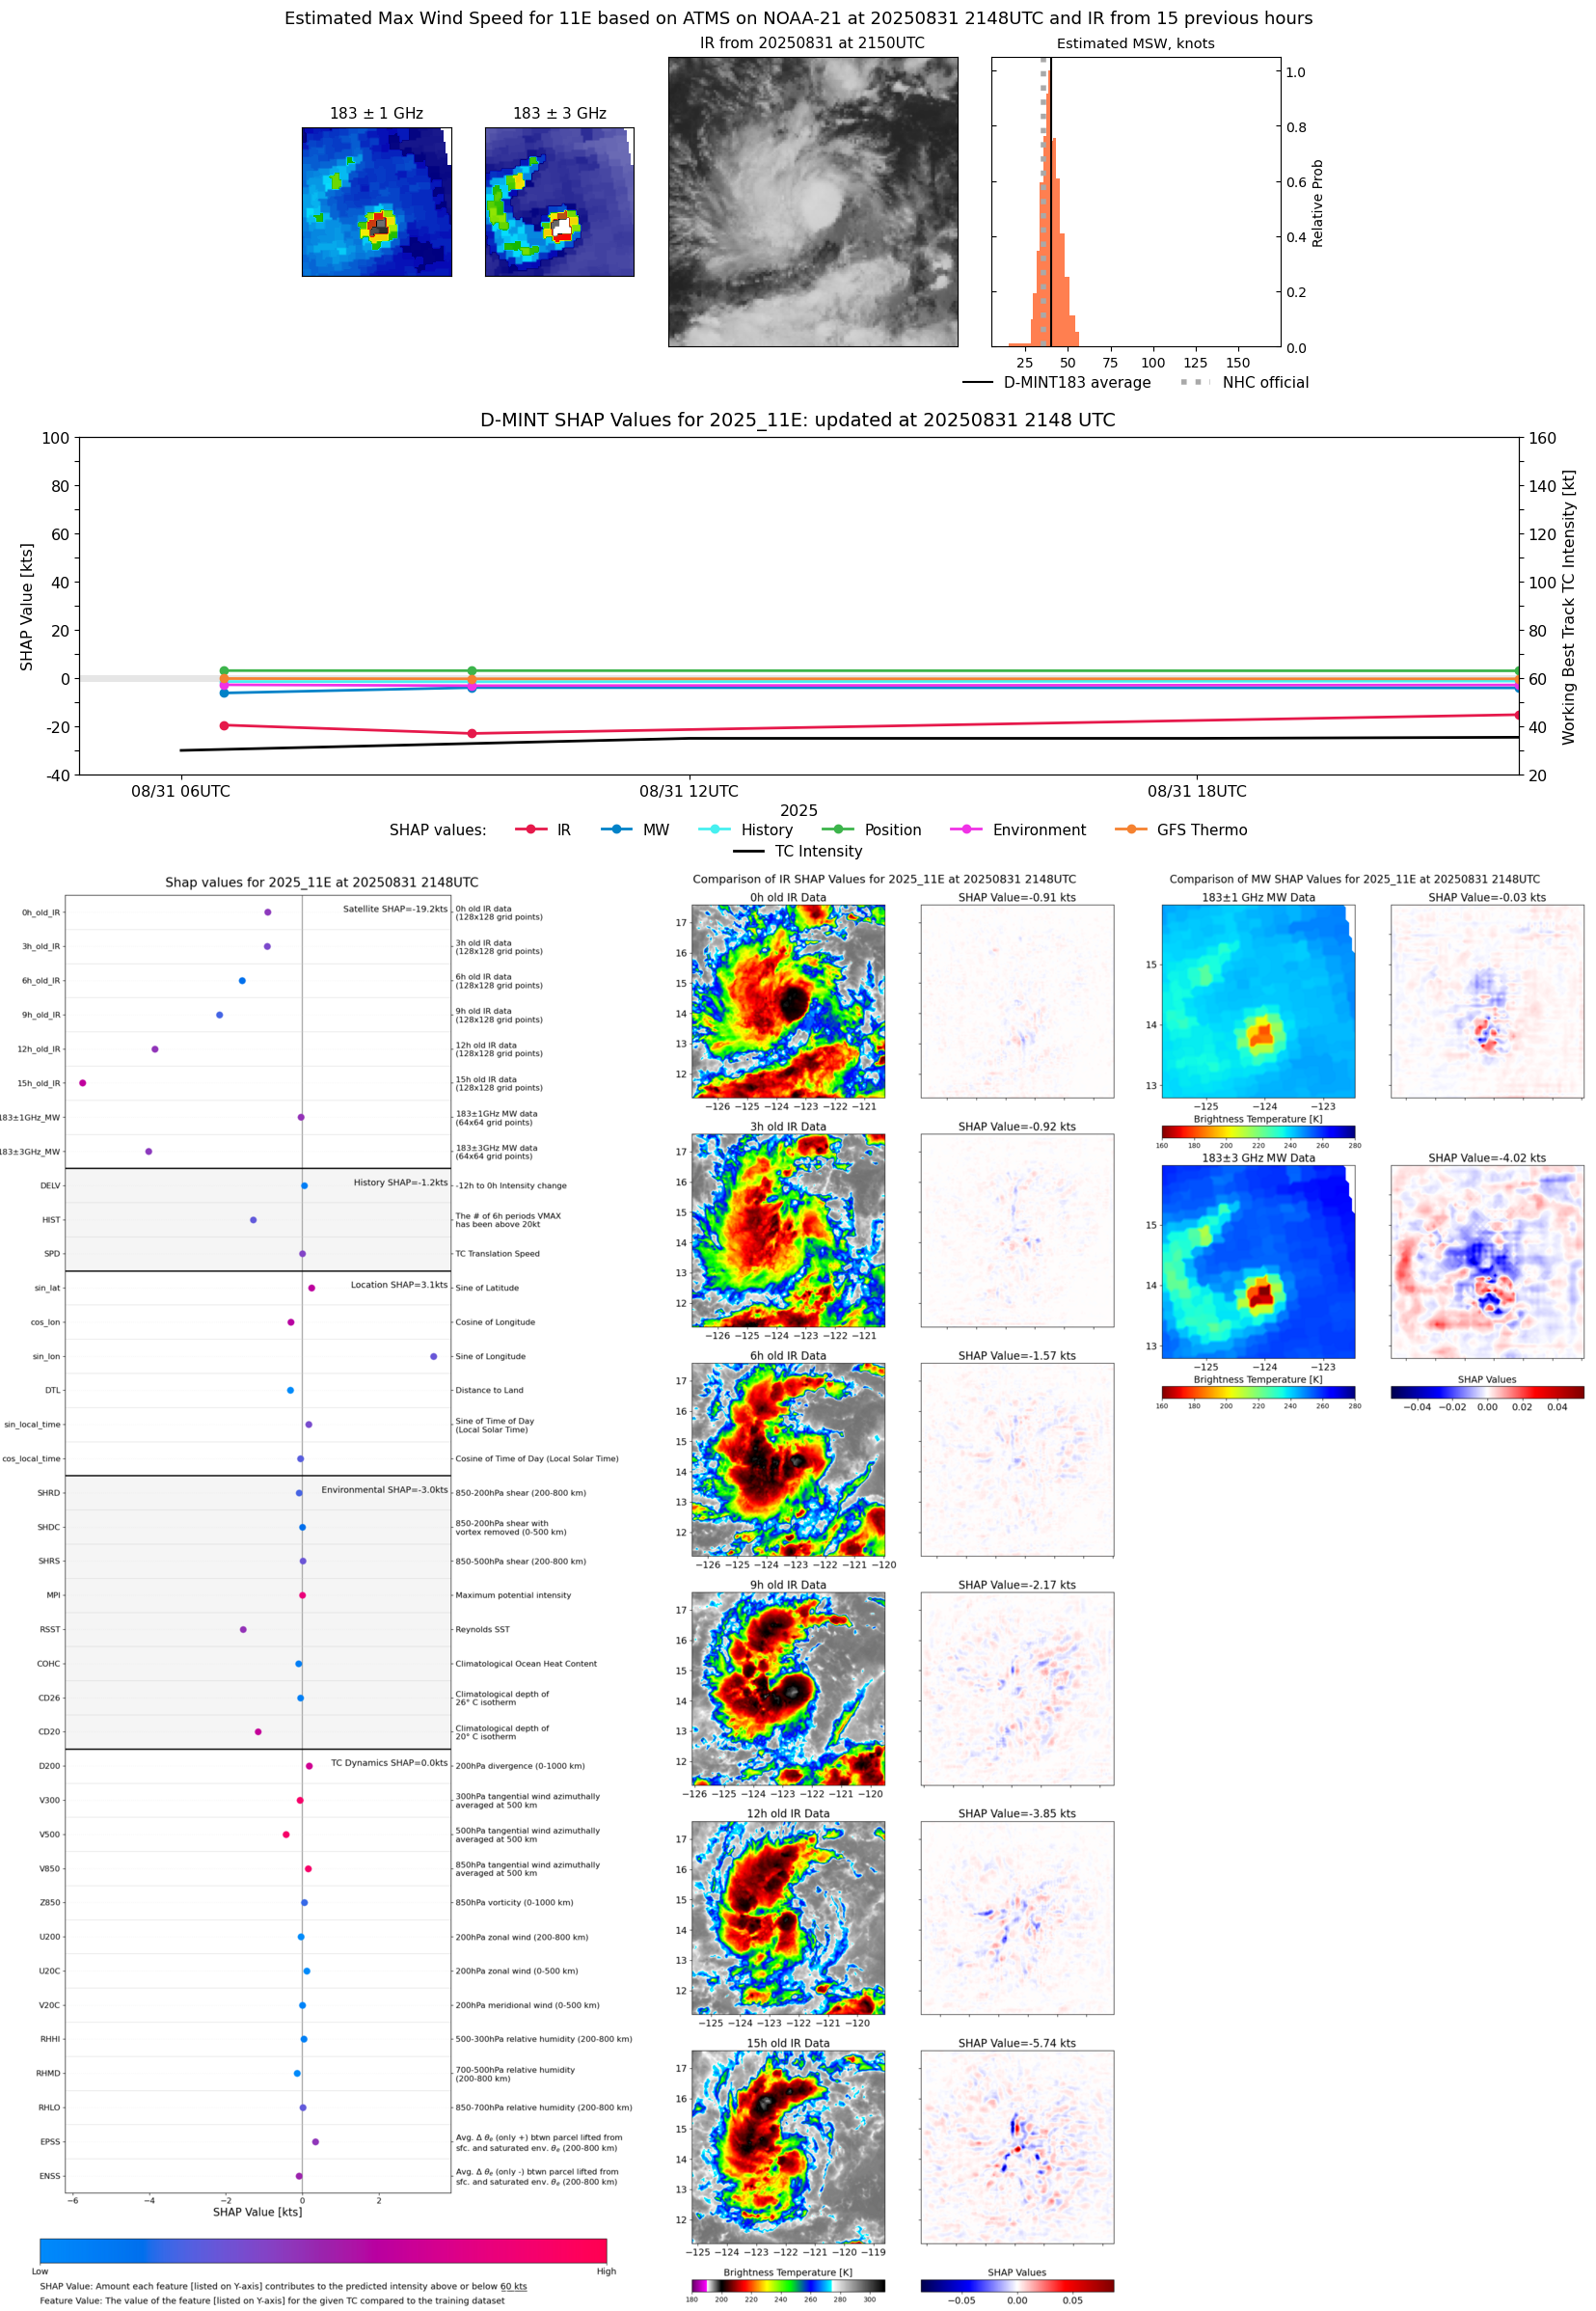 |
| 20250831 | 1818 UTC | TMS05 | 1003 hPa | 36 kts | 32 kts | 40 kts |  |
| 20250831 | 1159 UTC | SSMISF18 | 1007 hPa | 30 kts | 27 kts | 33 kts | 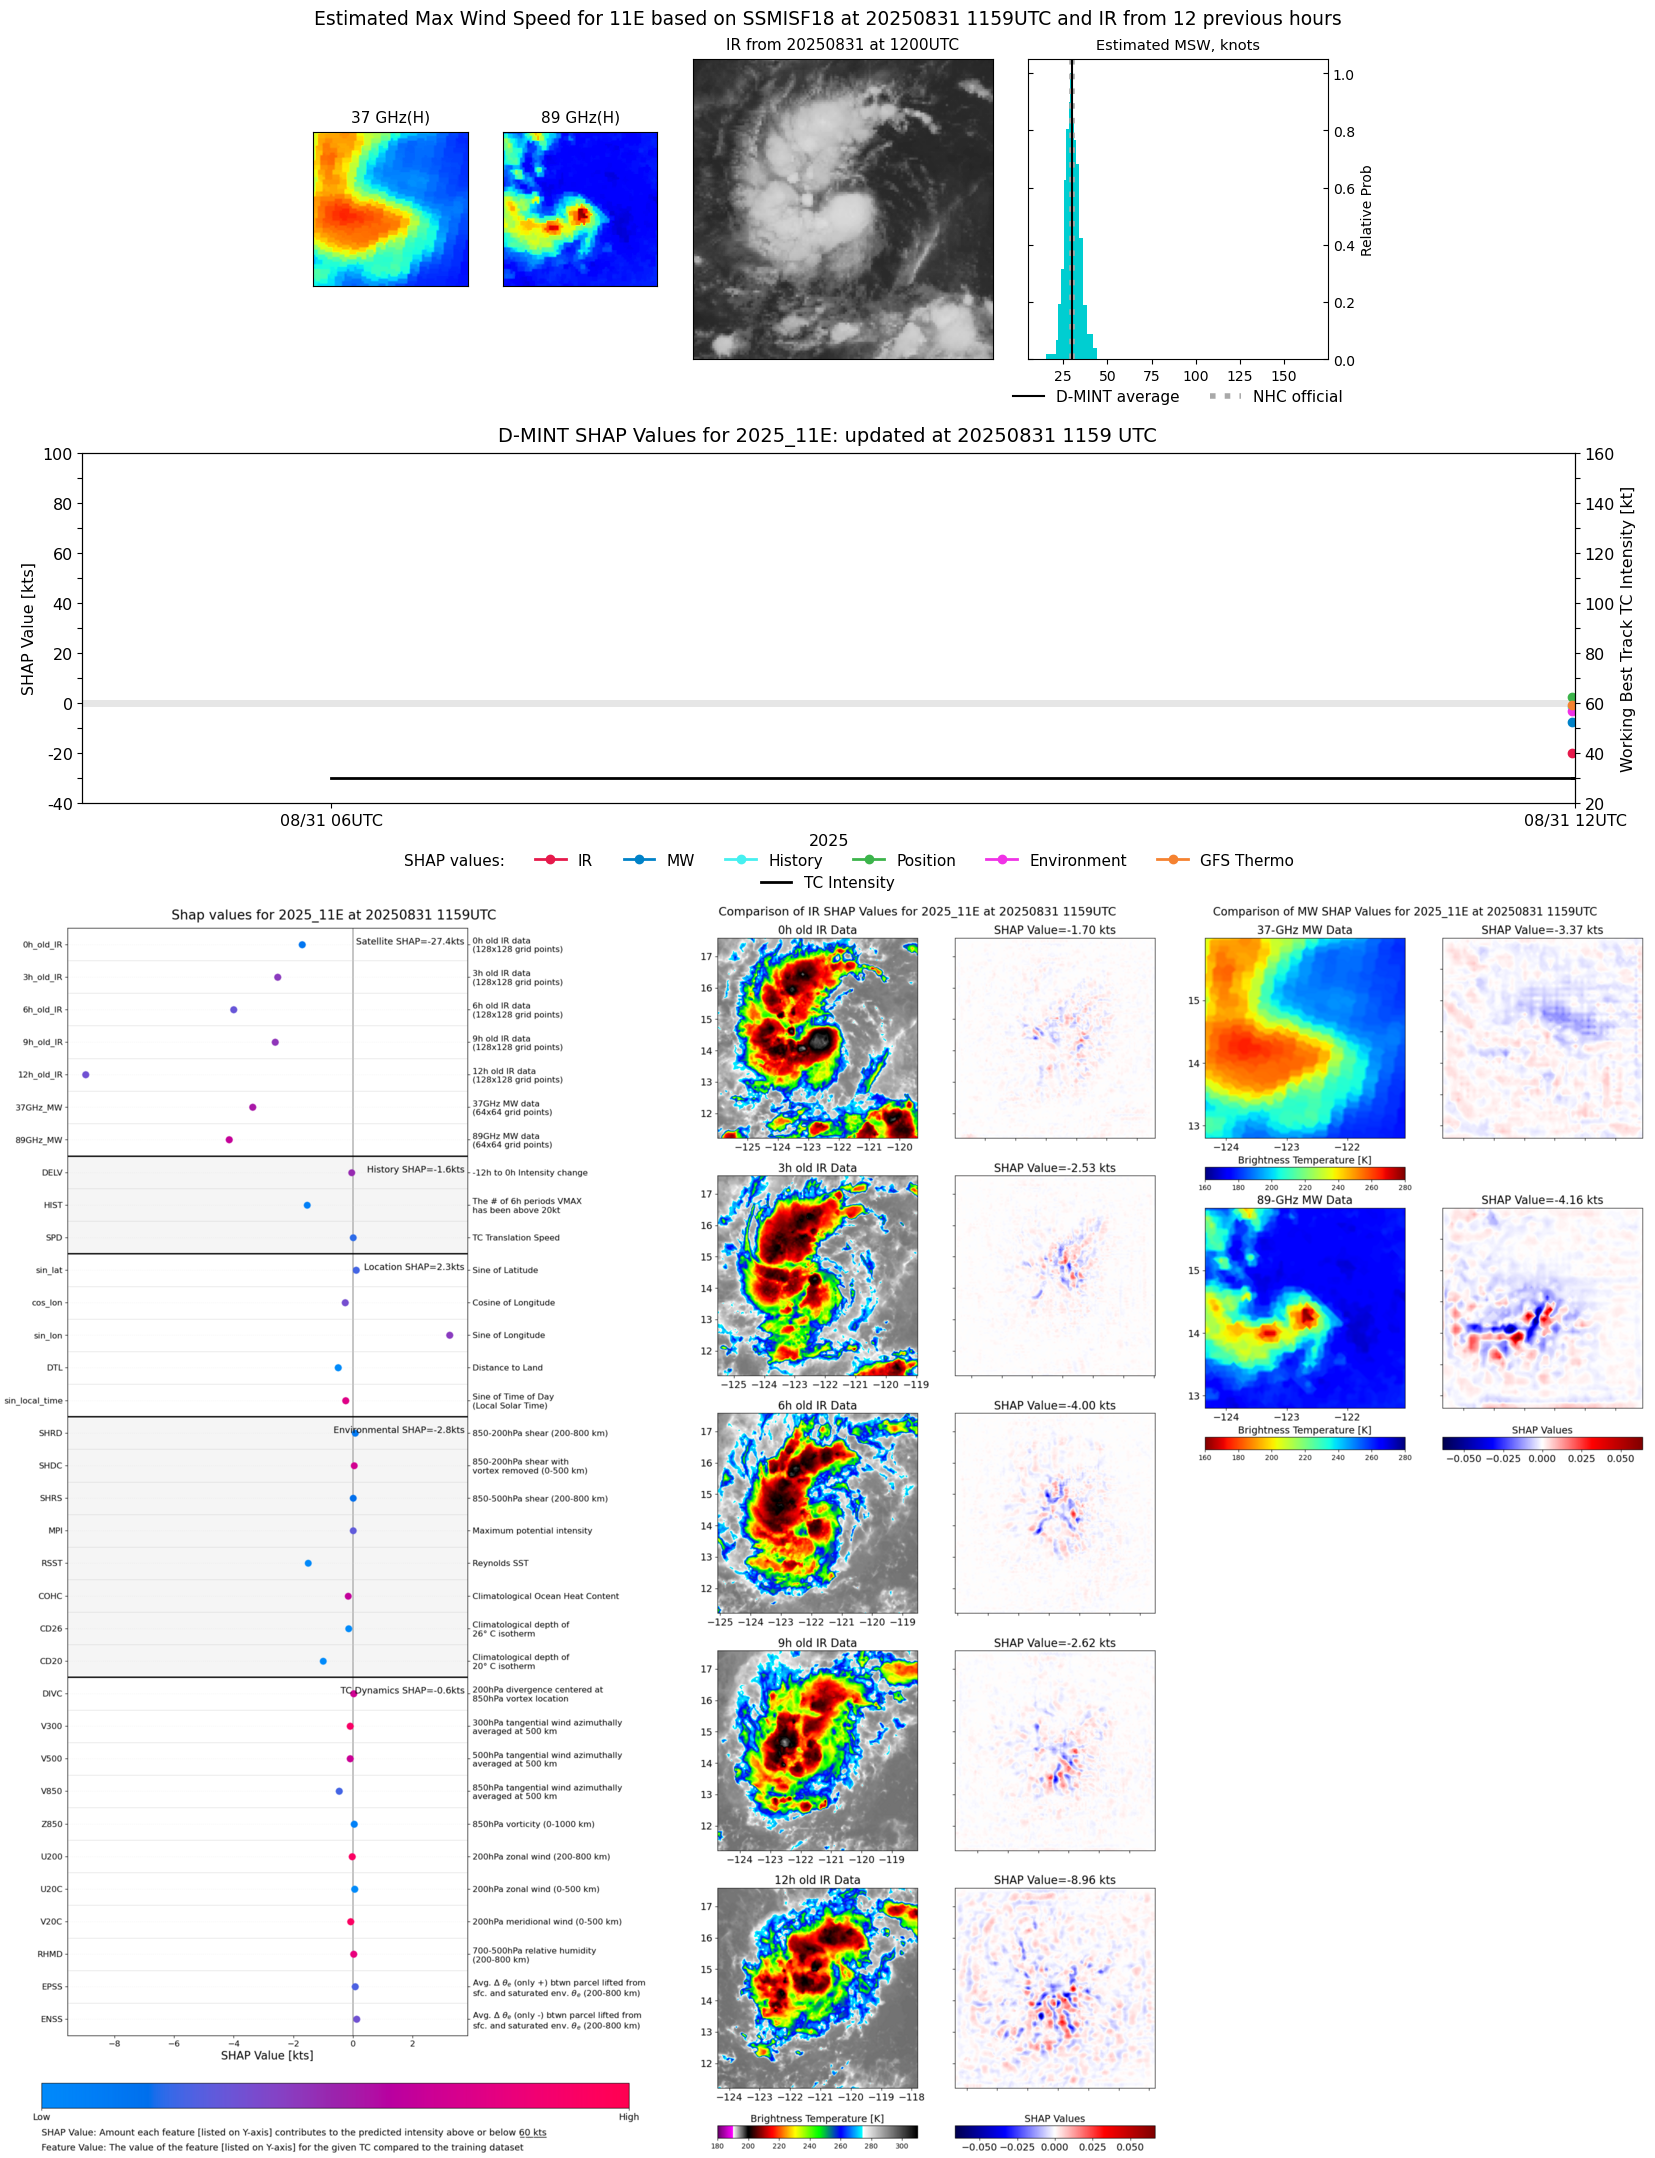 |
| 20250831 | 0940 UTC | AMSR2 | NaN hPa | 29 kts | 26 kts | 32 kts |  |
| 20250831 | 0926 UTC | ATMS-NPP | 1007 hPa | 32 kts | 28 kts | 36 kts | 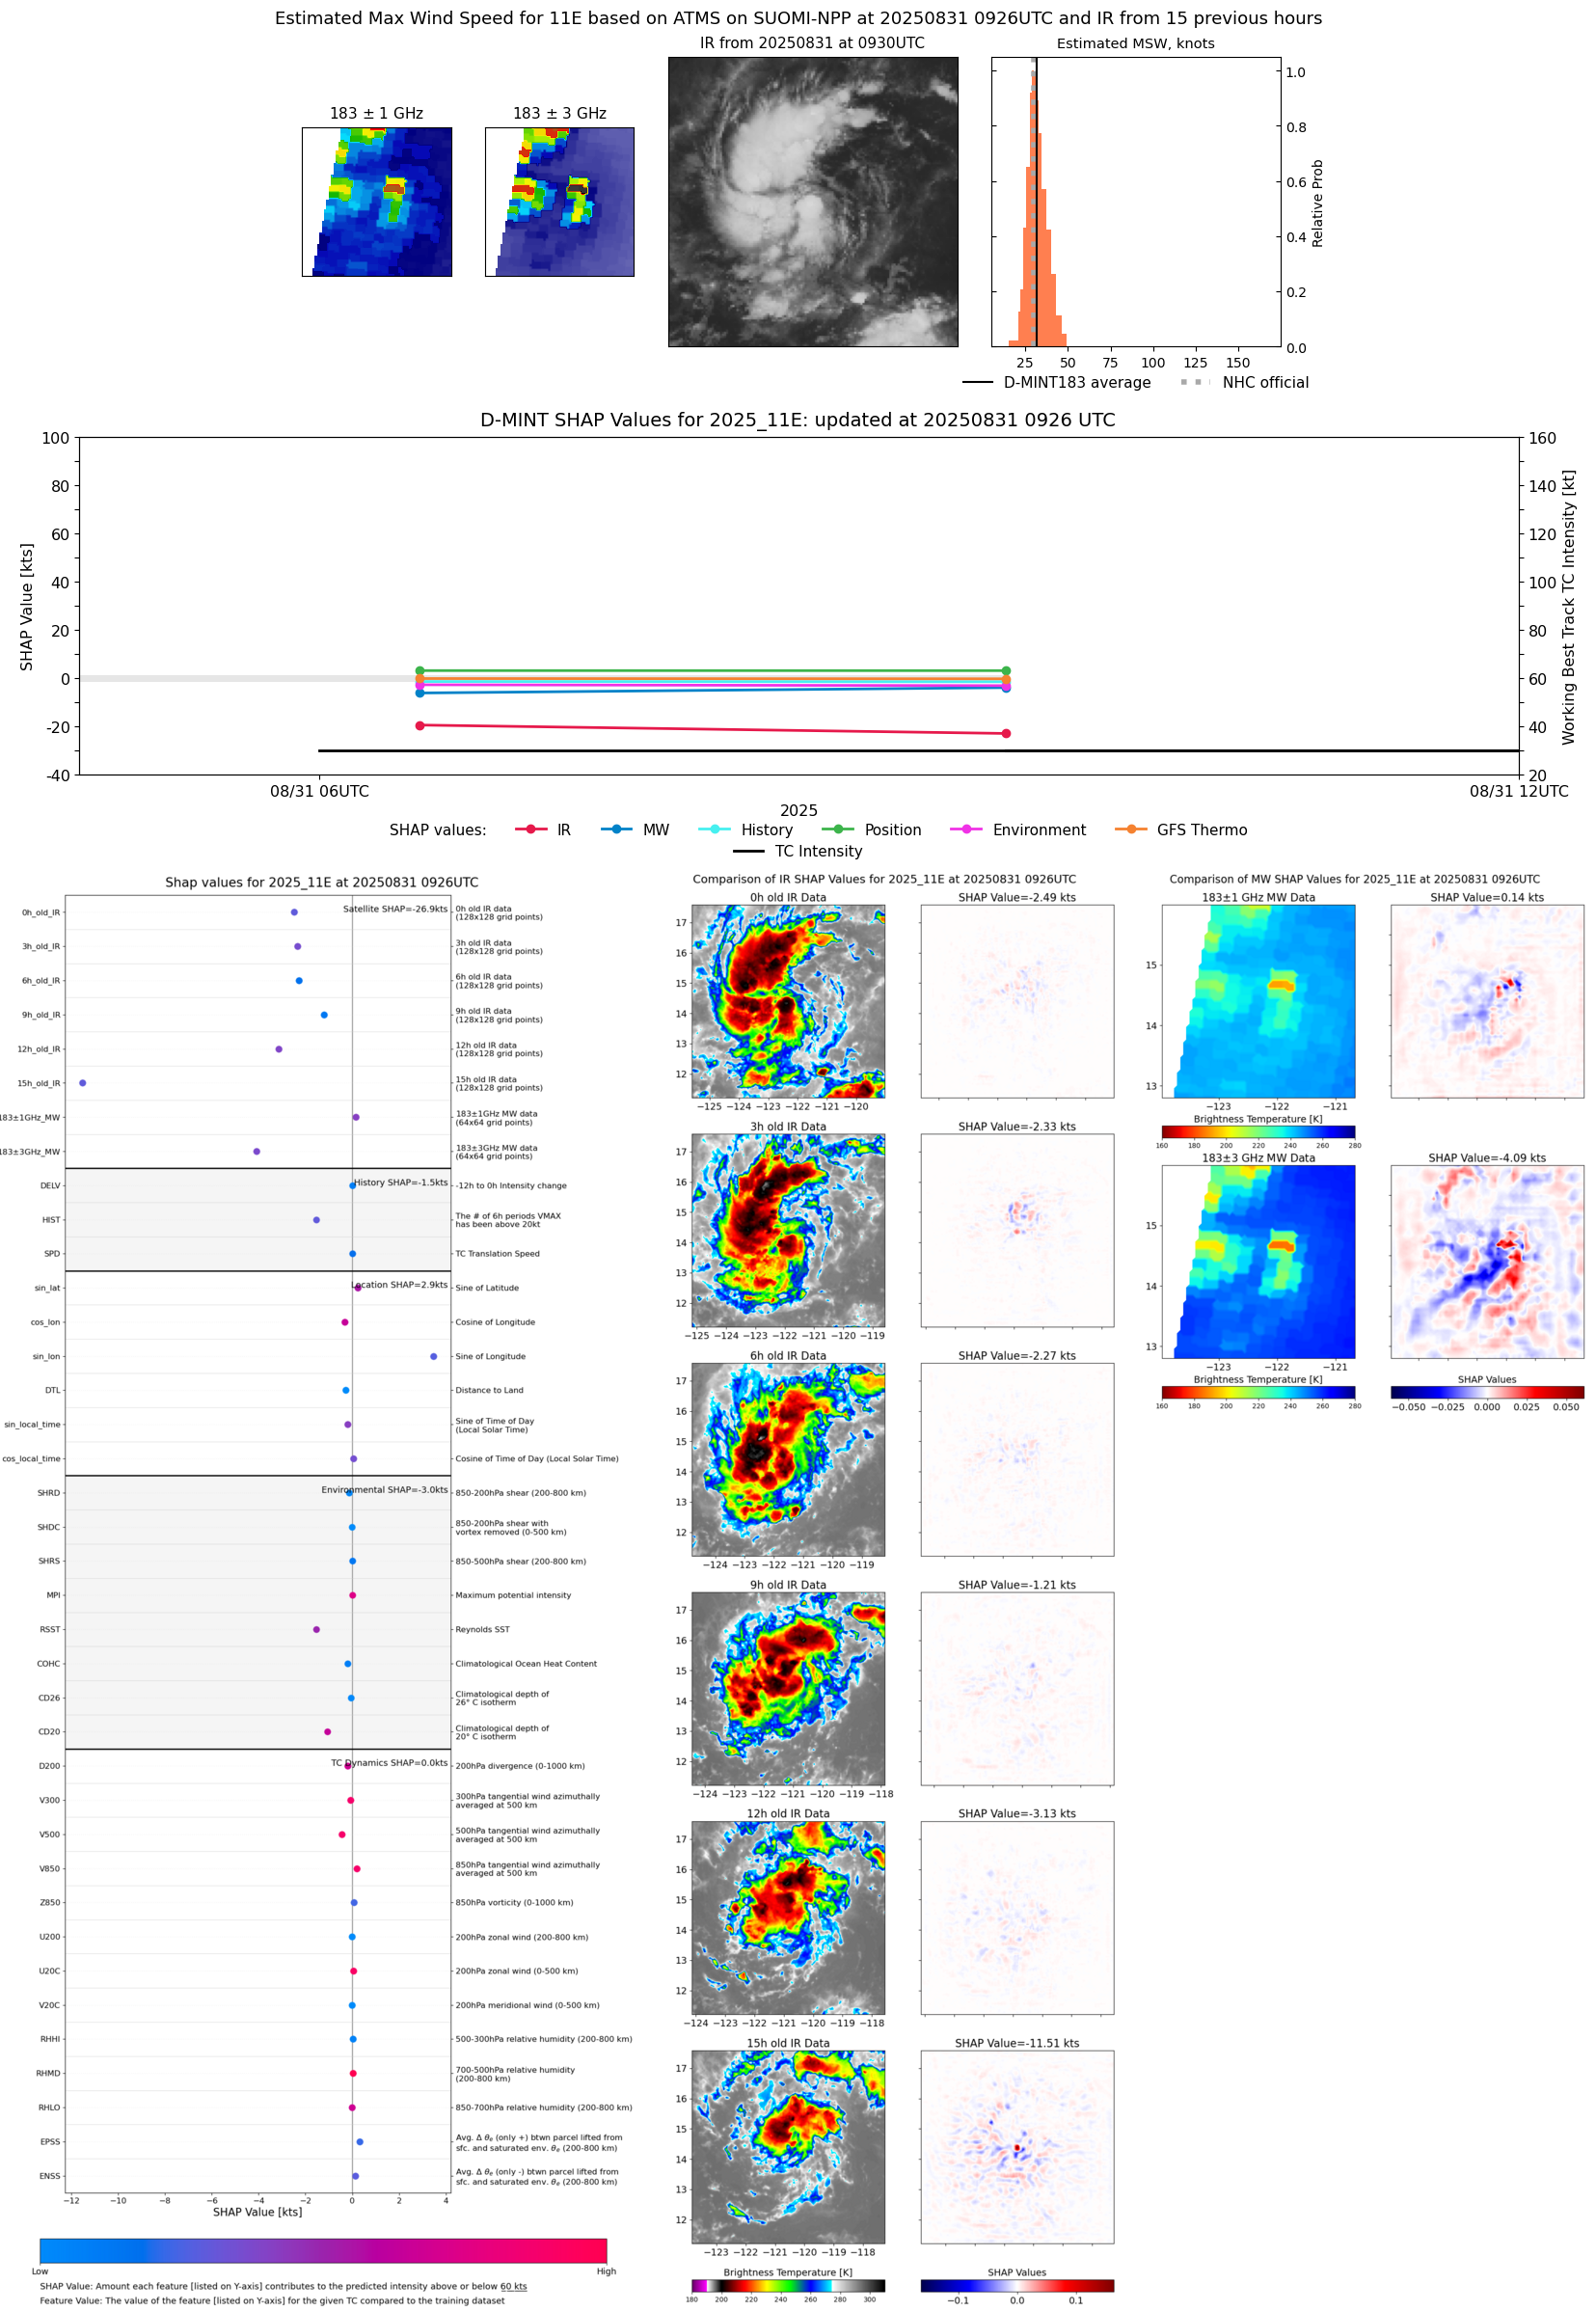 |
| 20250831 | 0634 UTC | AWS | 1006 hPa | 36 kts | 32 kts | 40 kts | 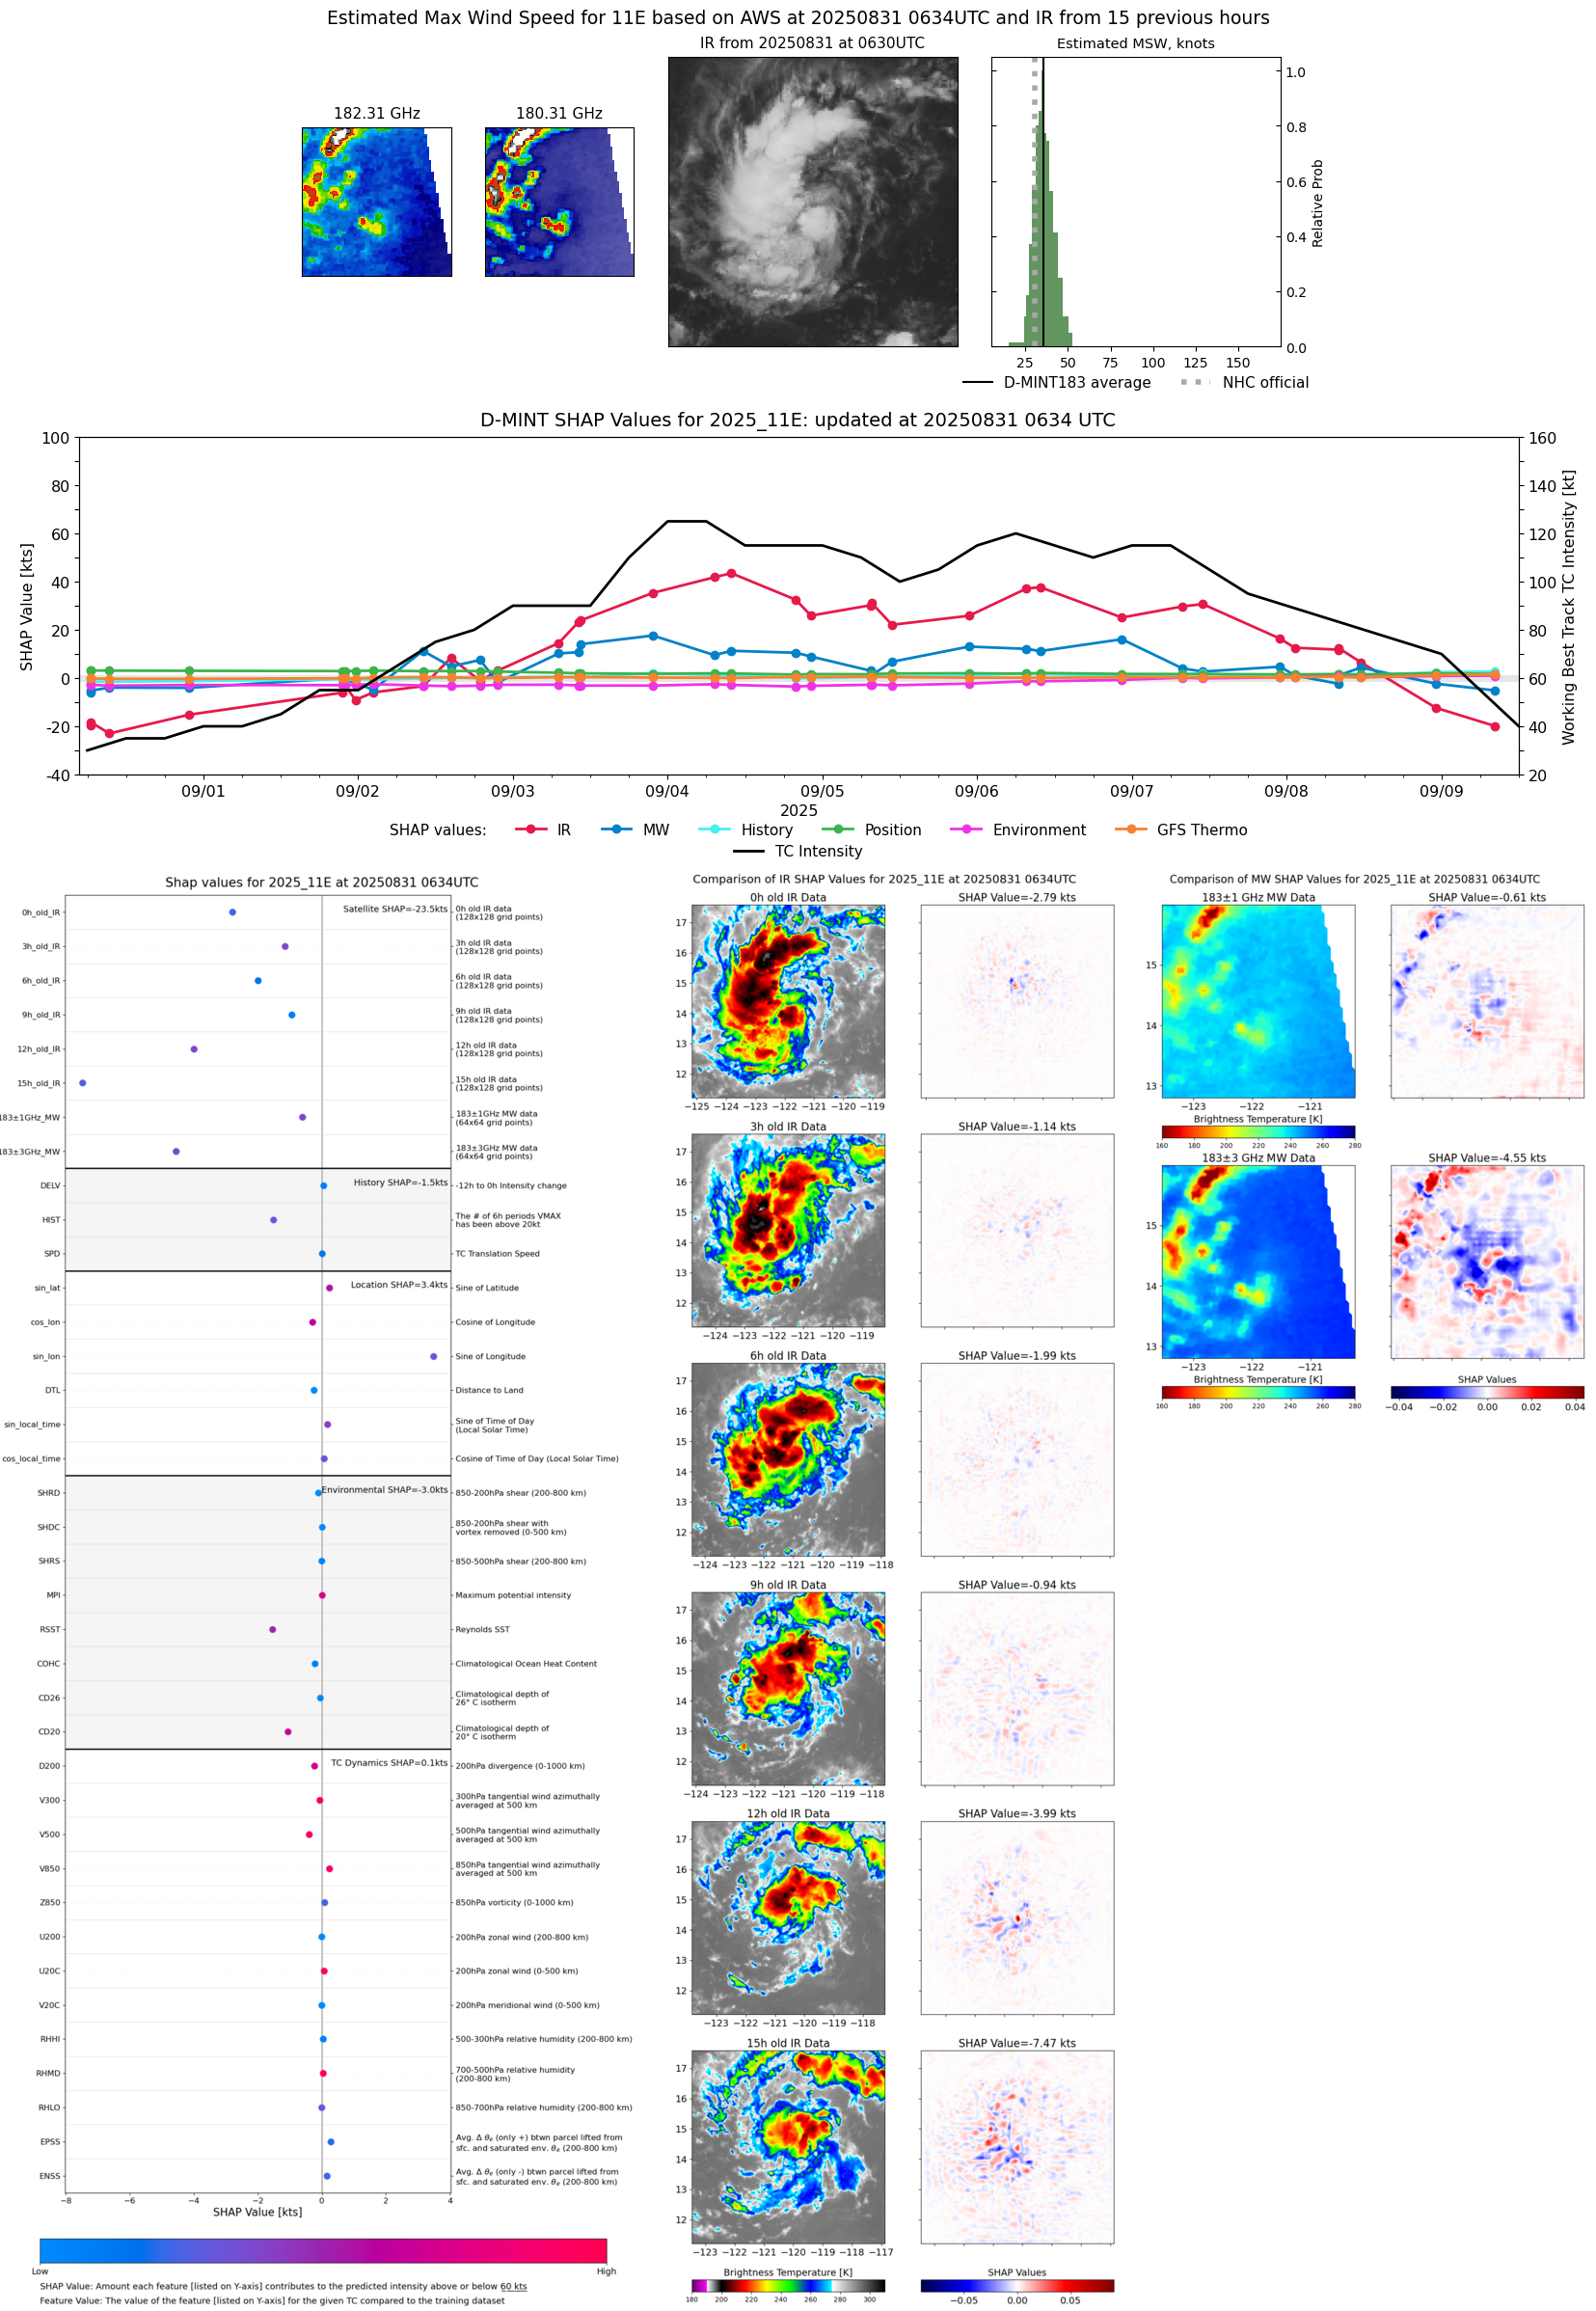 |
| 20250831 | 0630 UTC | TMS02 | NaN hPa | 33 kts | 30 kts | 37 kts |  |
| 20250831 | 0622 UTC | TMS05 | 1007 hPa | 34 kts | 31 kts | 39 kts | 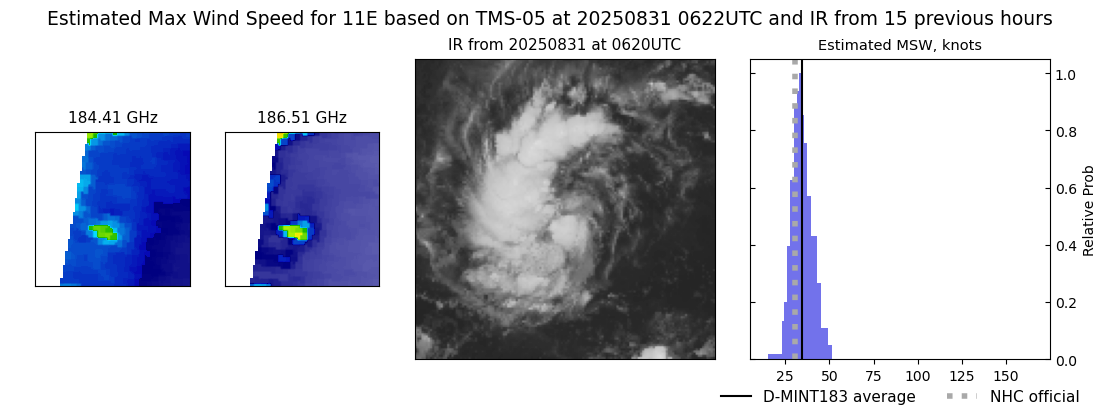 |
| 20250831 | 0259 UTC | SSMISF16 | NaN hPa | 29 kts | 25 kts | 33 kts | 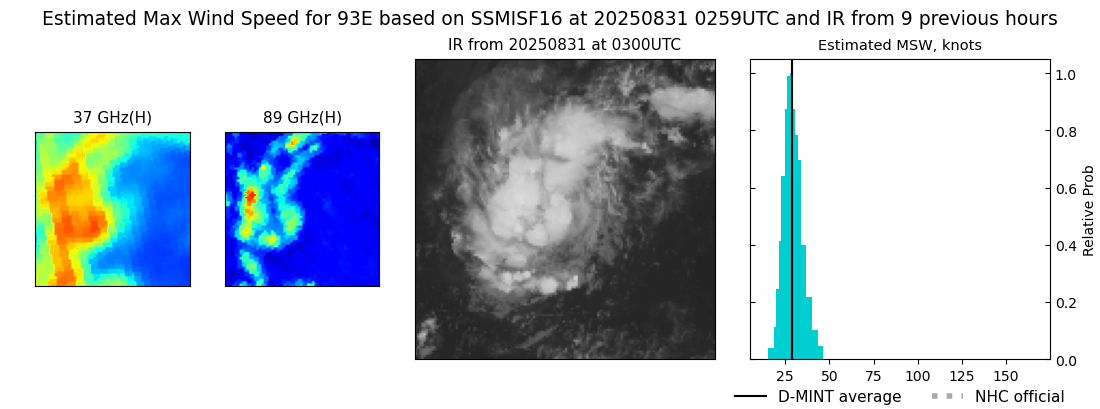 |
| 20250831 | 0226 UTC | SSMISF17 | NaN hPa | 28 kts | 25 kts | 32 kts | 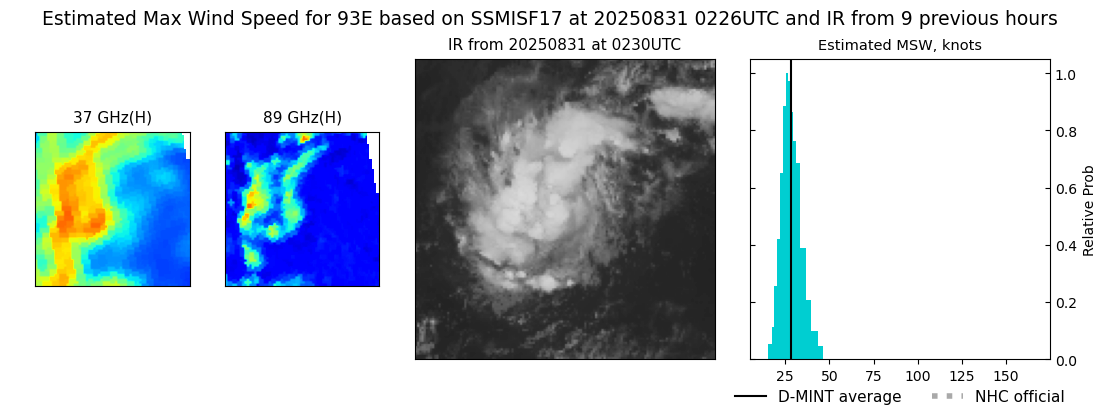 |
| 20250830 | 2126 UTC | AMSR2 | NaN hPa | 28 kts | 25 kts | 32 kts | 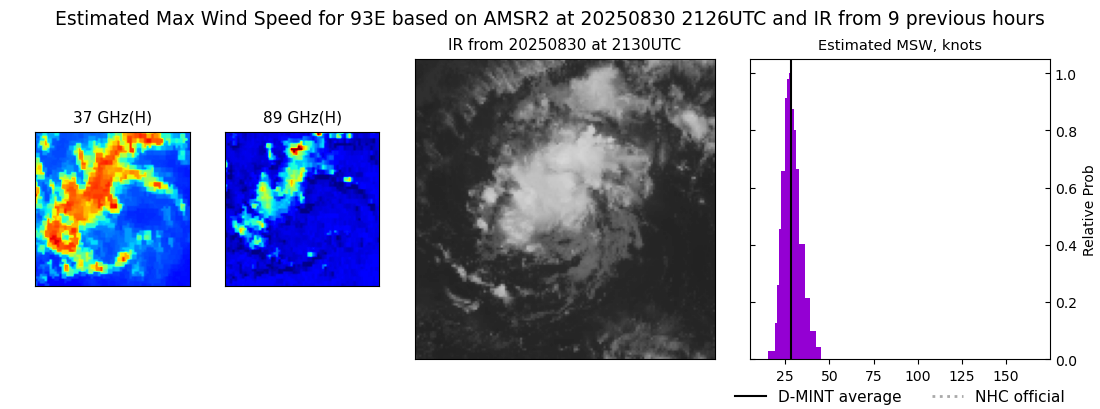 |
| 20250830 | 1211 UTC | SSMISF18 | NaN hPa | 29 kts | 26 kts | 33 kts | 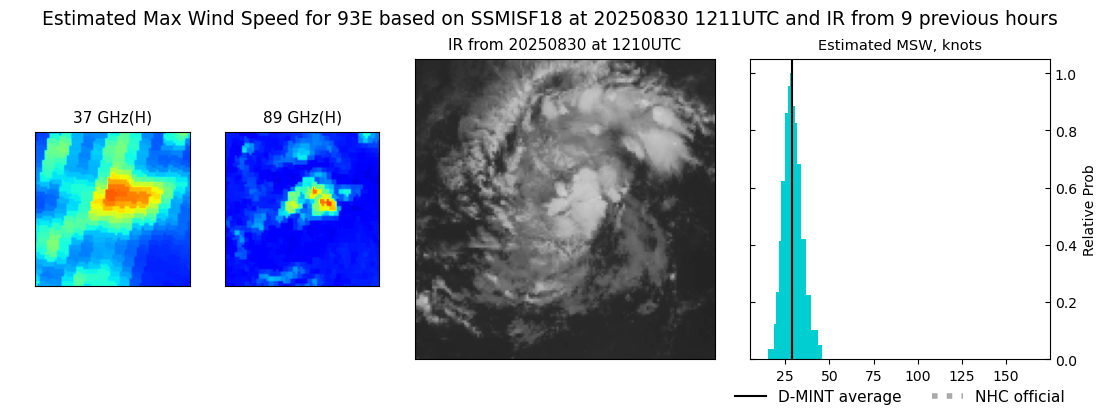 |
| 20250830 | 1008 UTC | GMI | NaN hPa | 23 kts | 21 kts | 25 kts | 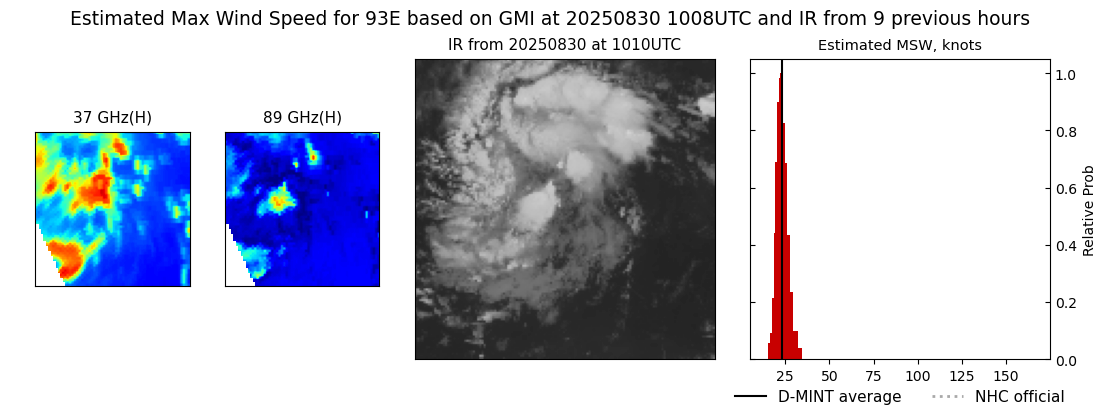 |
| 20250829 | 2336 UTC | SSMISF18 | NaN hPa | 25 kts | 22 kts | 28 kts |  |
| 20250829 | 1421 UTC | SSMISF16 | NaN hPa | 25 kts | 22 kts | 29 kts |  |
| 20250829 | 1347 UTC | SSMISF17 | NaN hPa | 24 kts | 22 kts | 27 kts |  |
| 20250829 | 0144 UTC | SSMISF16 | NaN hPa | 21 kts | 19 kts | 24 kts | 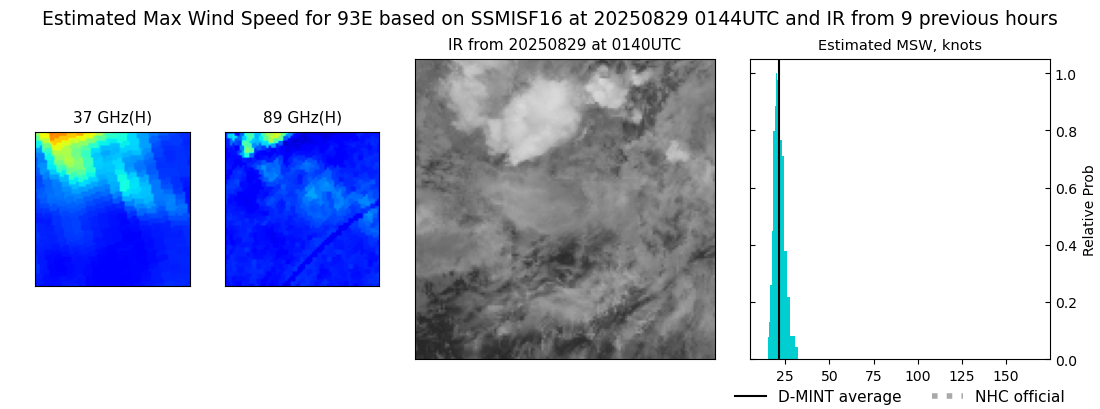 |
| 20250828 | 2350 UTC | SSMISF18 | NaN hPa | 22 kts | 20 kts | 25 kts | 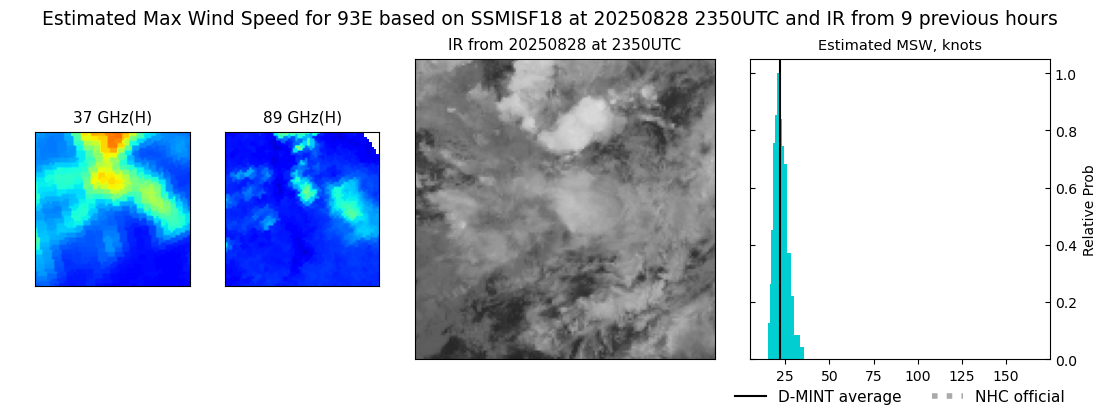 |
| 20250828 | 2315 UTC | GMI | NaN hPa | 21 kts | 19 kts | 22 kts | 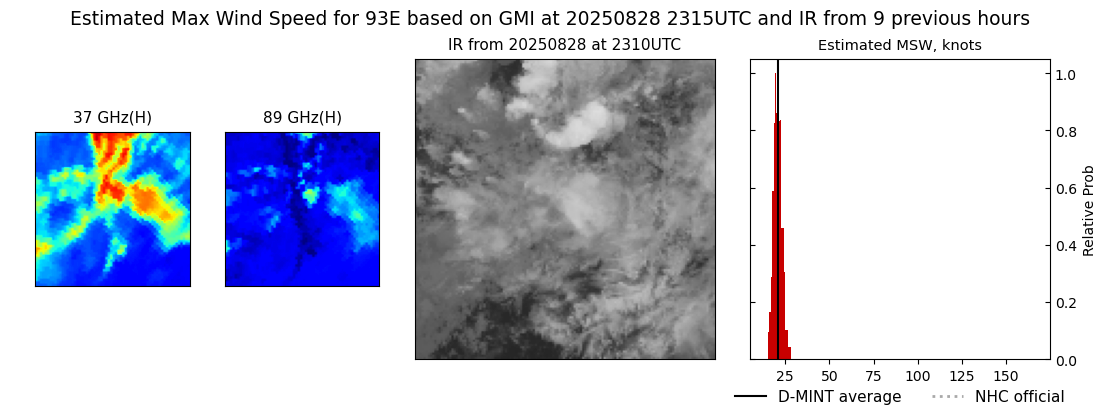 |
| 20250828 | 1402 UTC | SSMISF17 | NaN hPa | 23 kts | 20 kts | 25 kts | 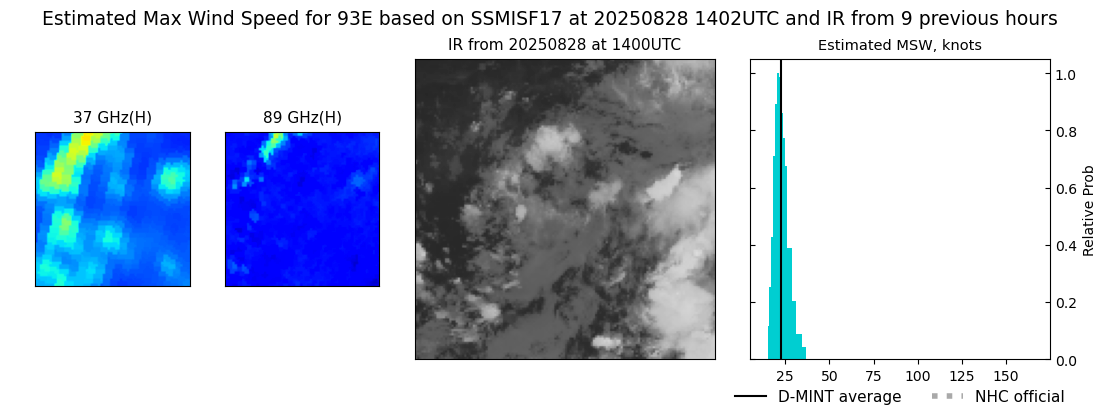 |