|
||

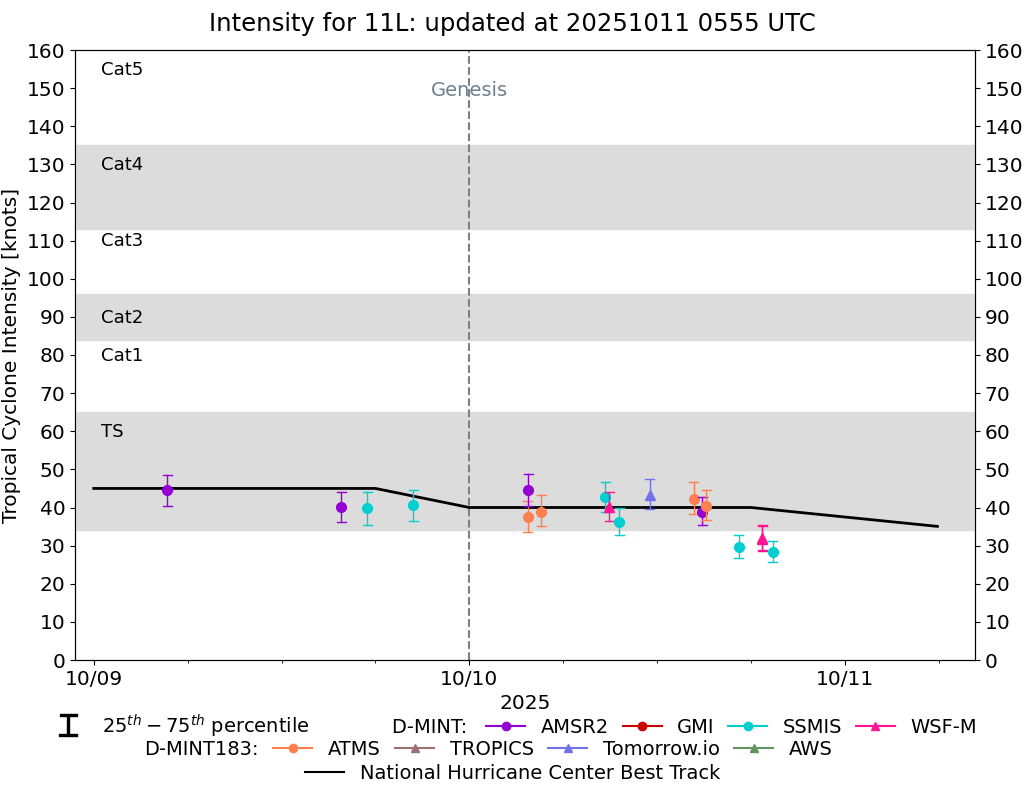 |
D-MINT HISTORY FILE for 2025_11L
| Date | Time | MW Sensor | MSLP | Vmax (30th-70th percentile average) | Vmax 25th percentile | Vmax 75th percentile | Image |
| 20251010 | 1924 UTC | SSMISF16 | 1003 hPa | 28 kts | 26 kts | 31 kts | 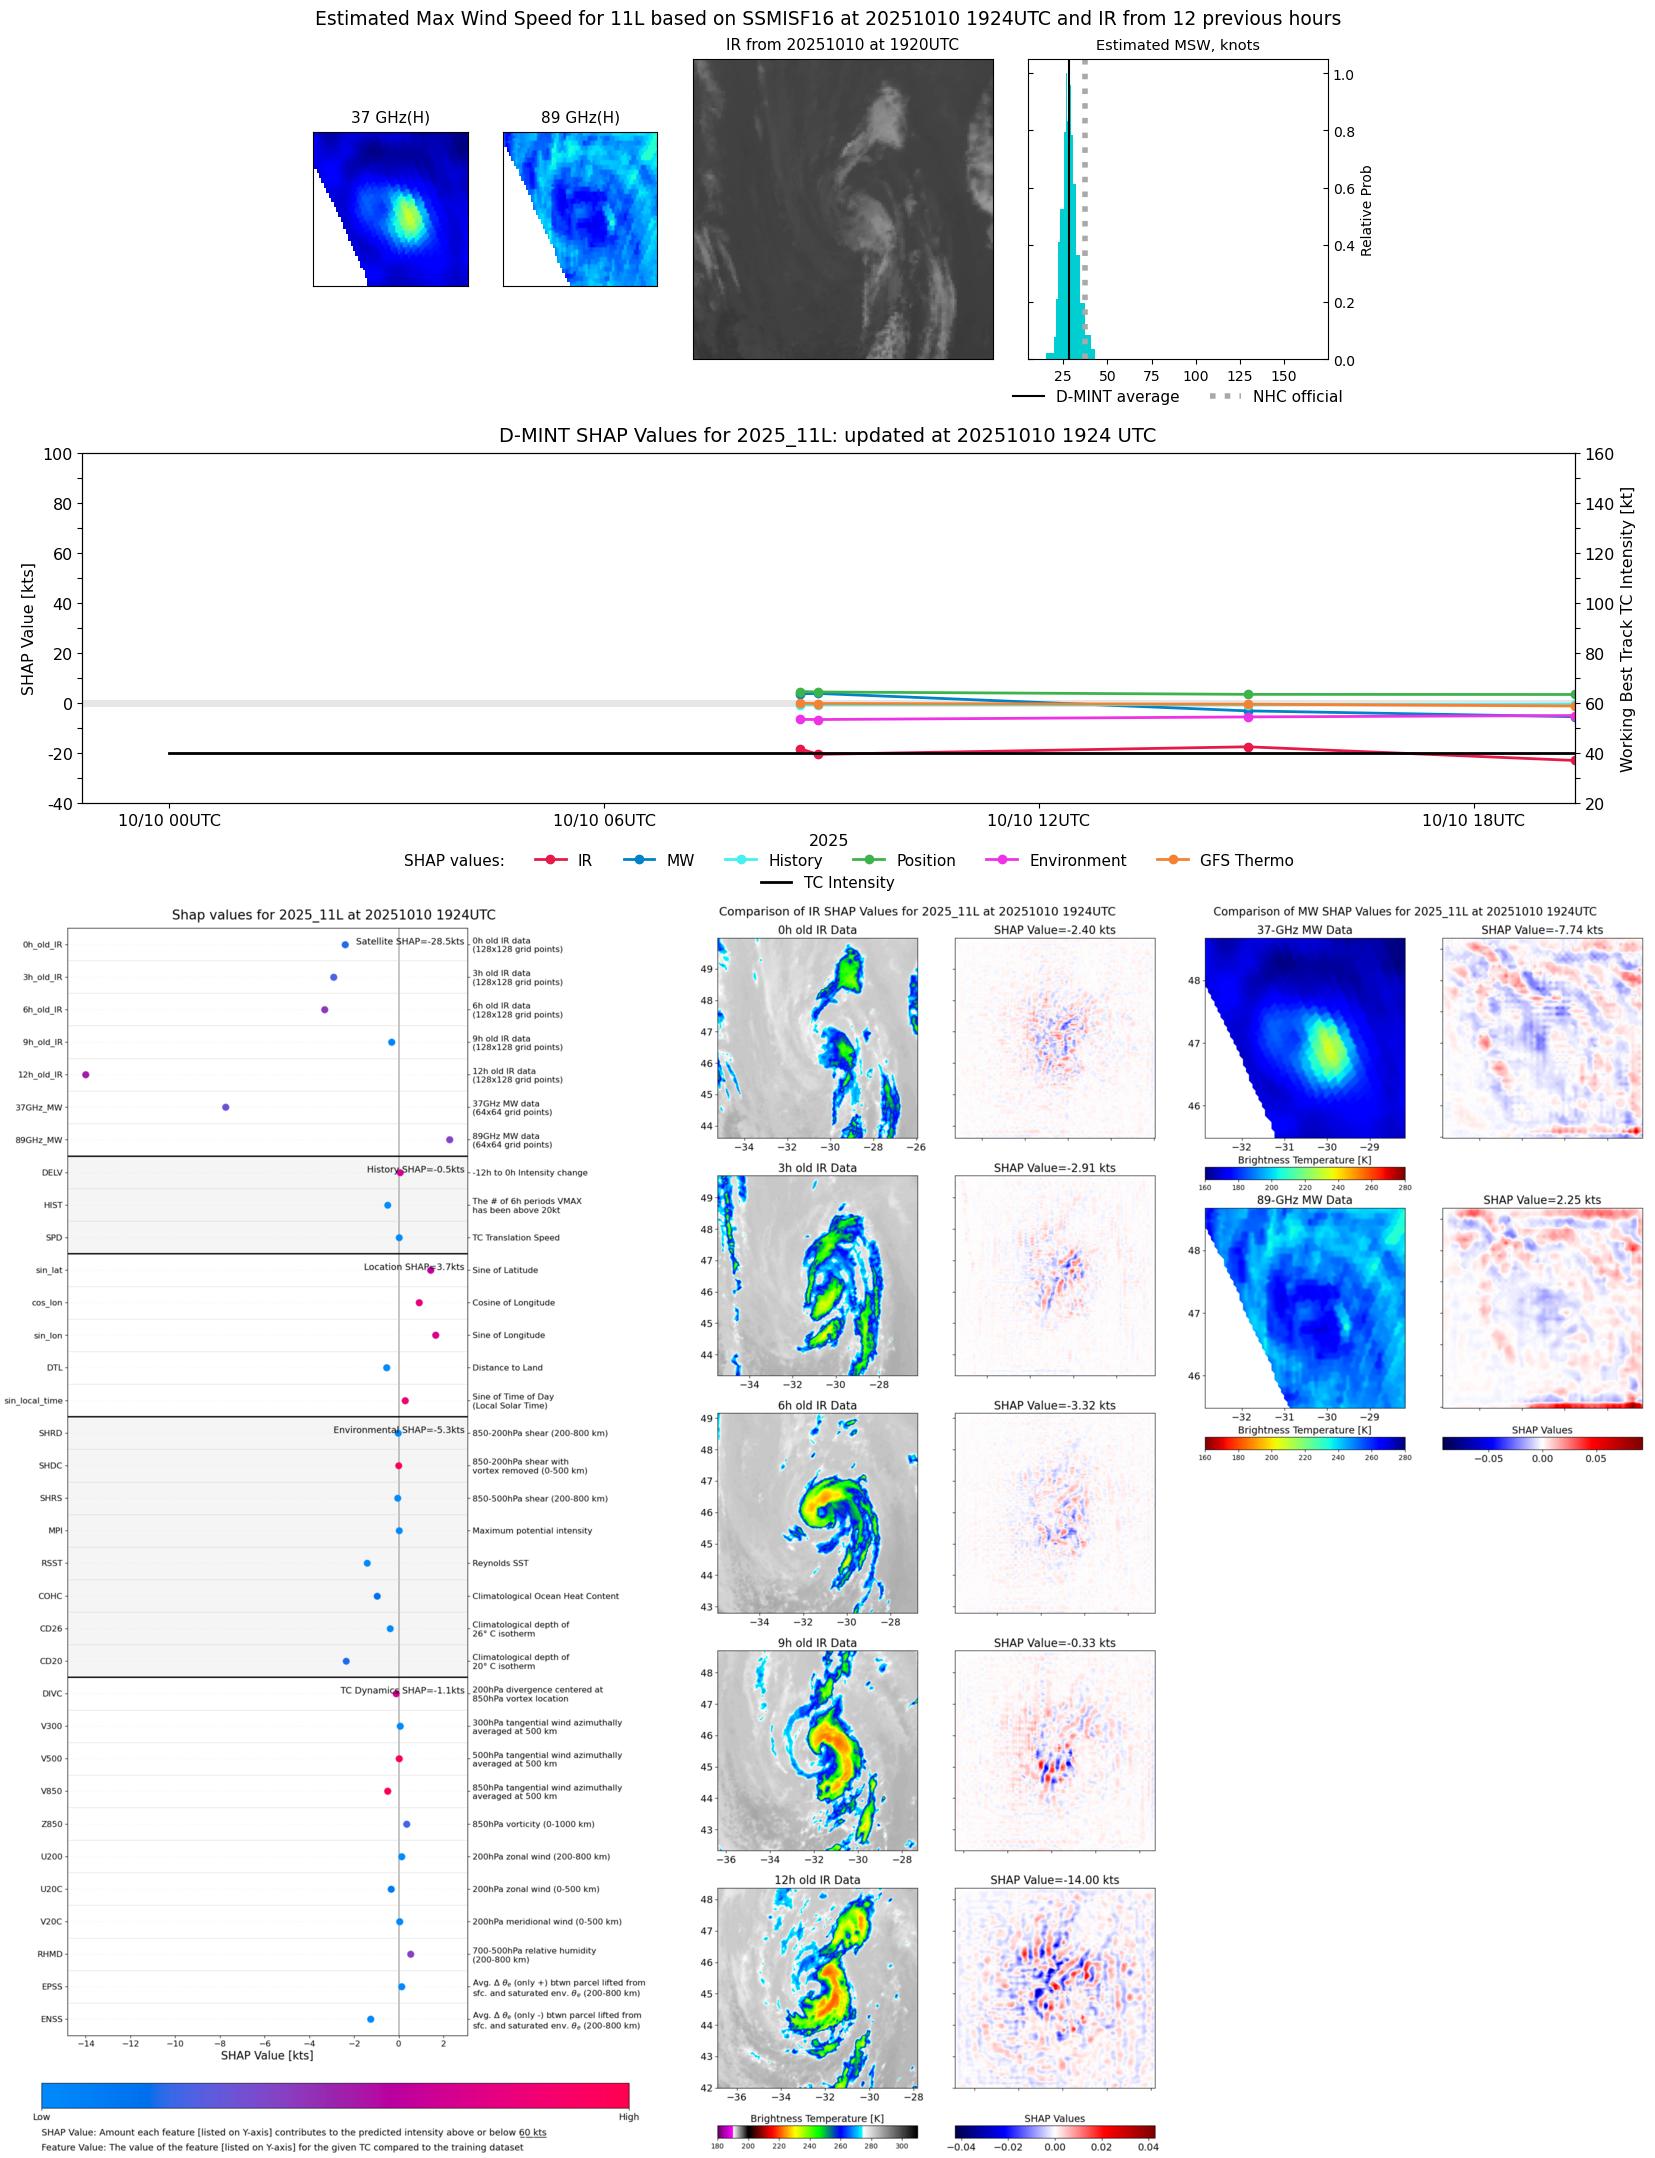 |
| 20251010 | 1843 UTC | WSFM01 | 1001 hPa | 32 kts | 29 kts | 35 kts | 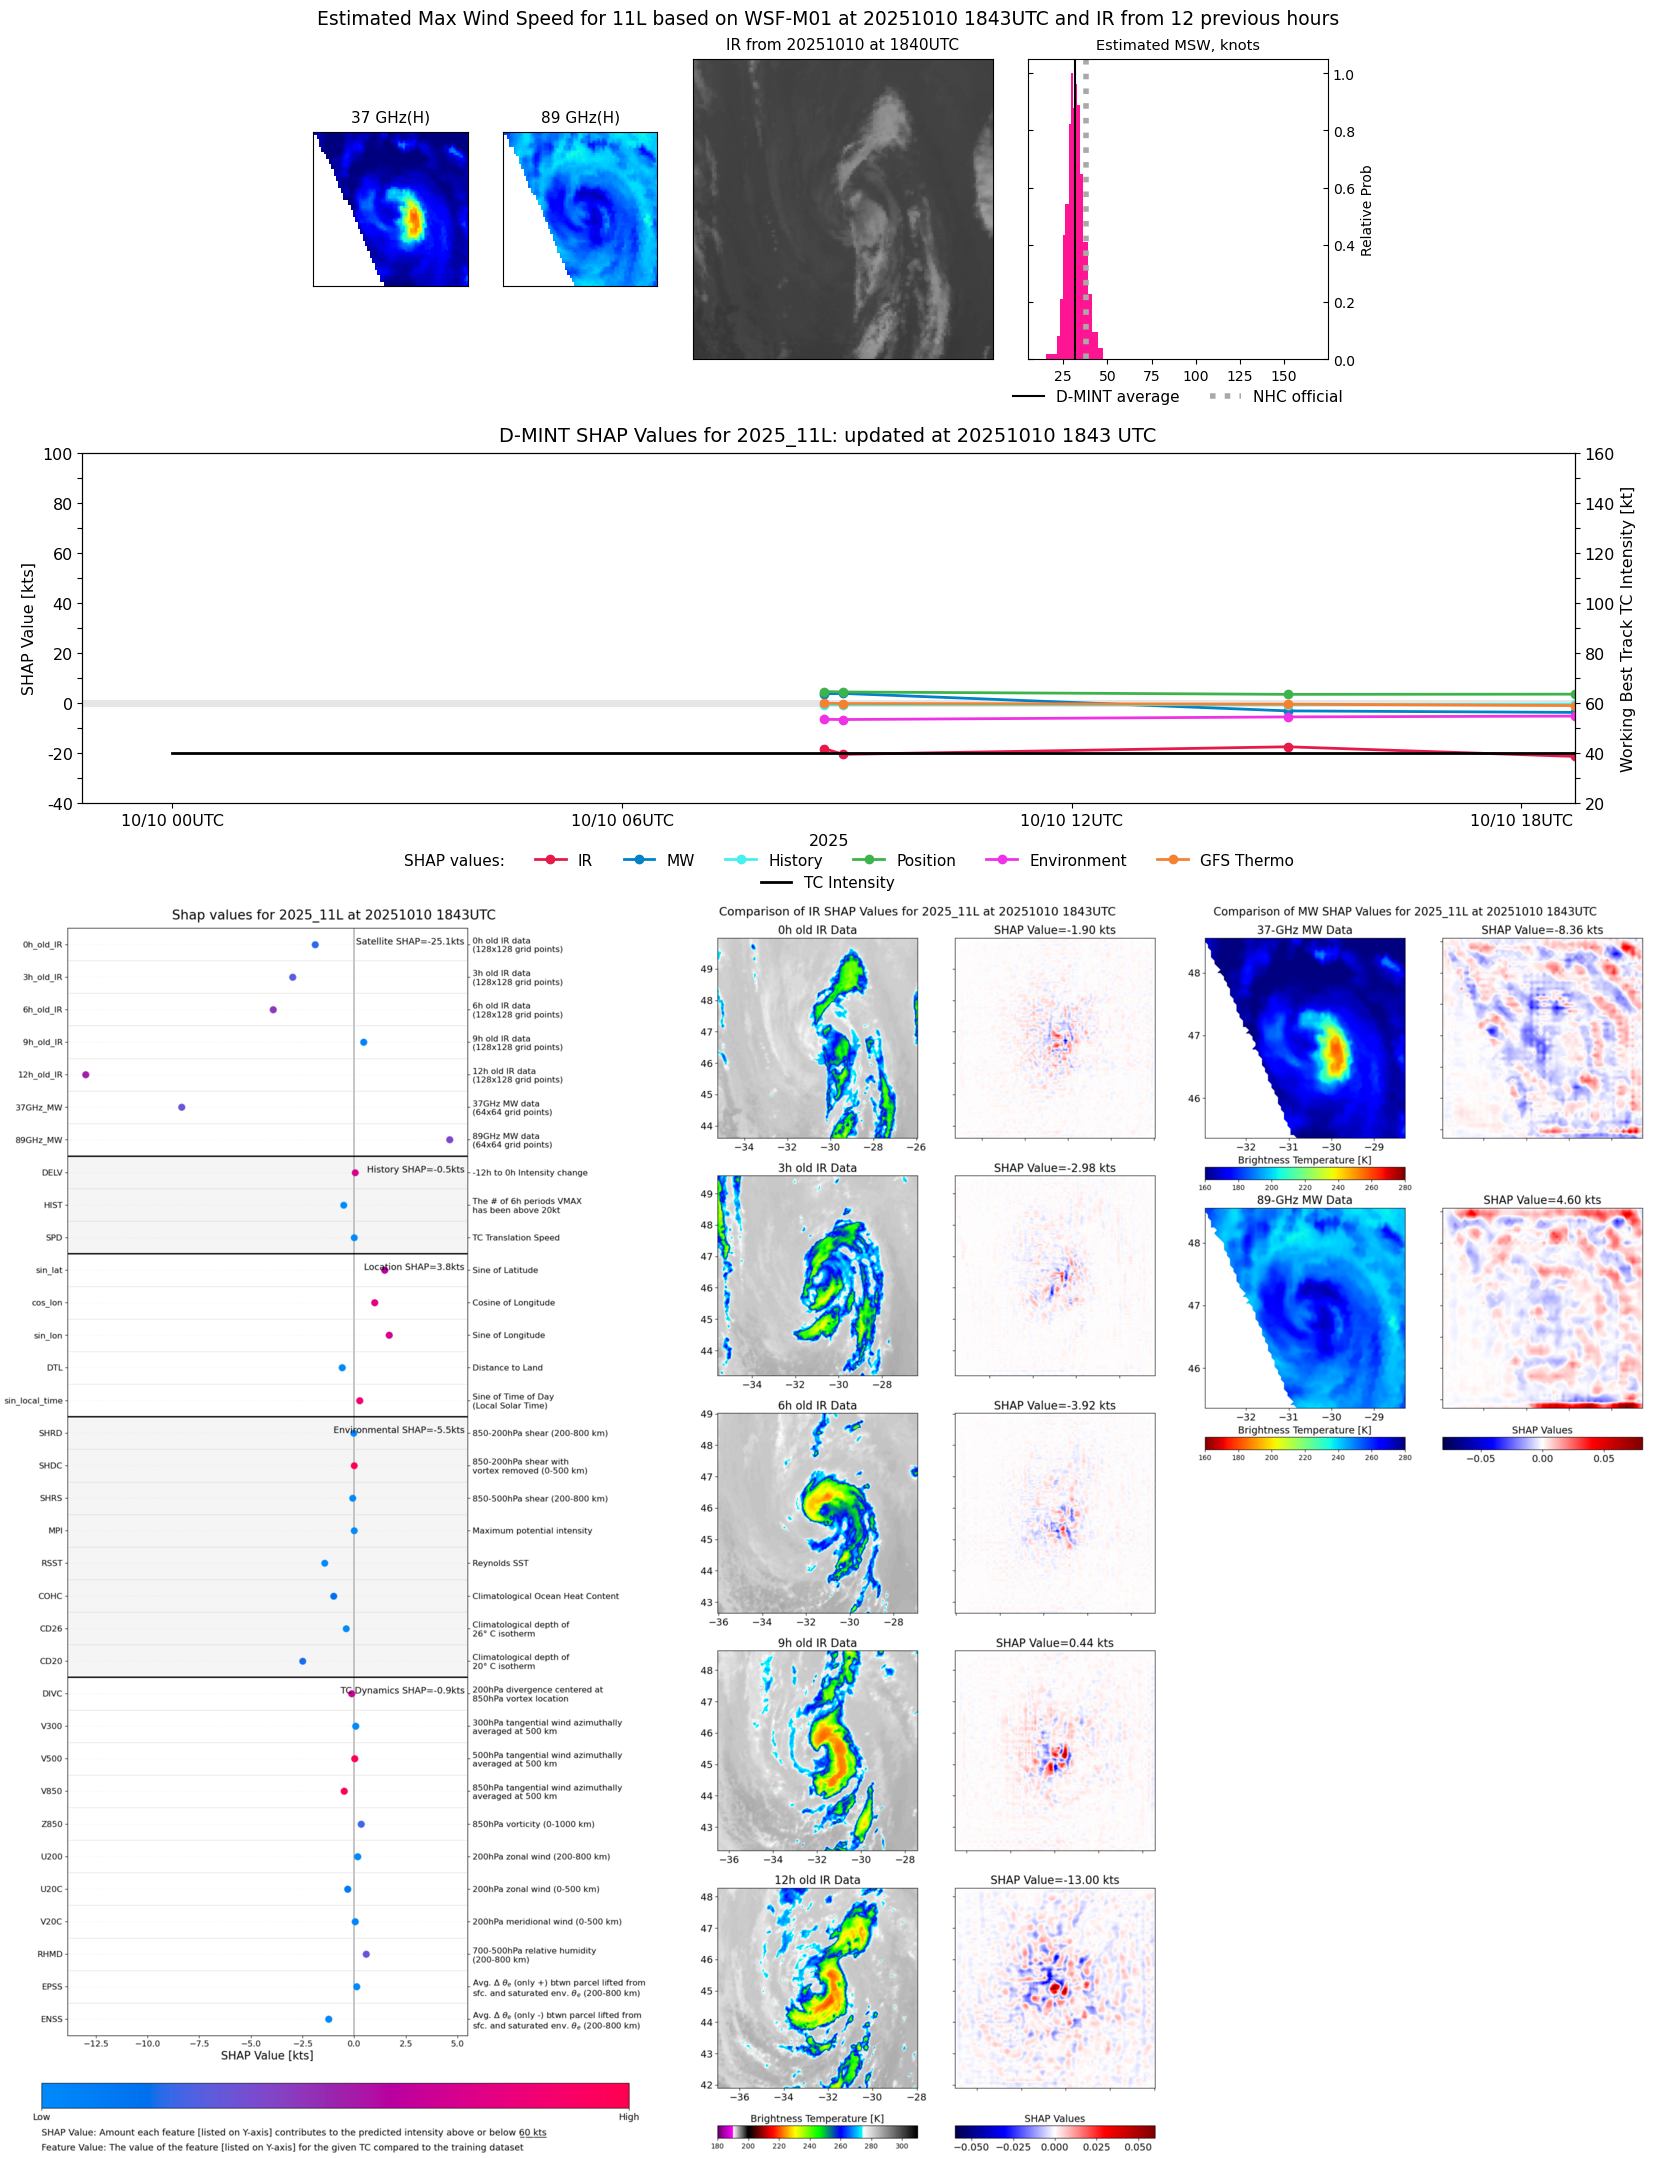 |
| 20251010 | 1843 UTC | WSFM01 | 1001 hPa | 32 kts | 29 kts | 35 kts |  |
| 20251010 | 1714 UTC | SSMISF18 | 1003 hPa | 30 kts | 27 kts | 33 kts | 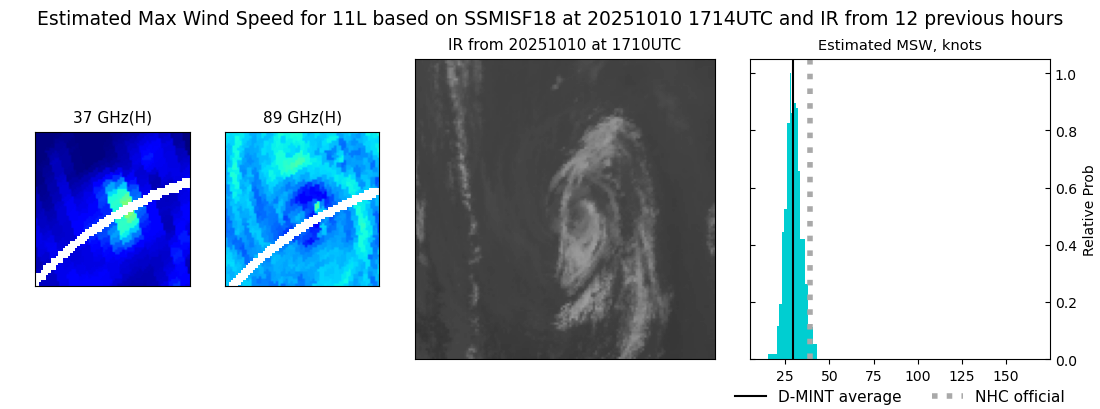 |
| 20251010 | 1509 UTC | ATMS-N20 | 1004 hPa | 40 kts | 37 kts | 44 kts | 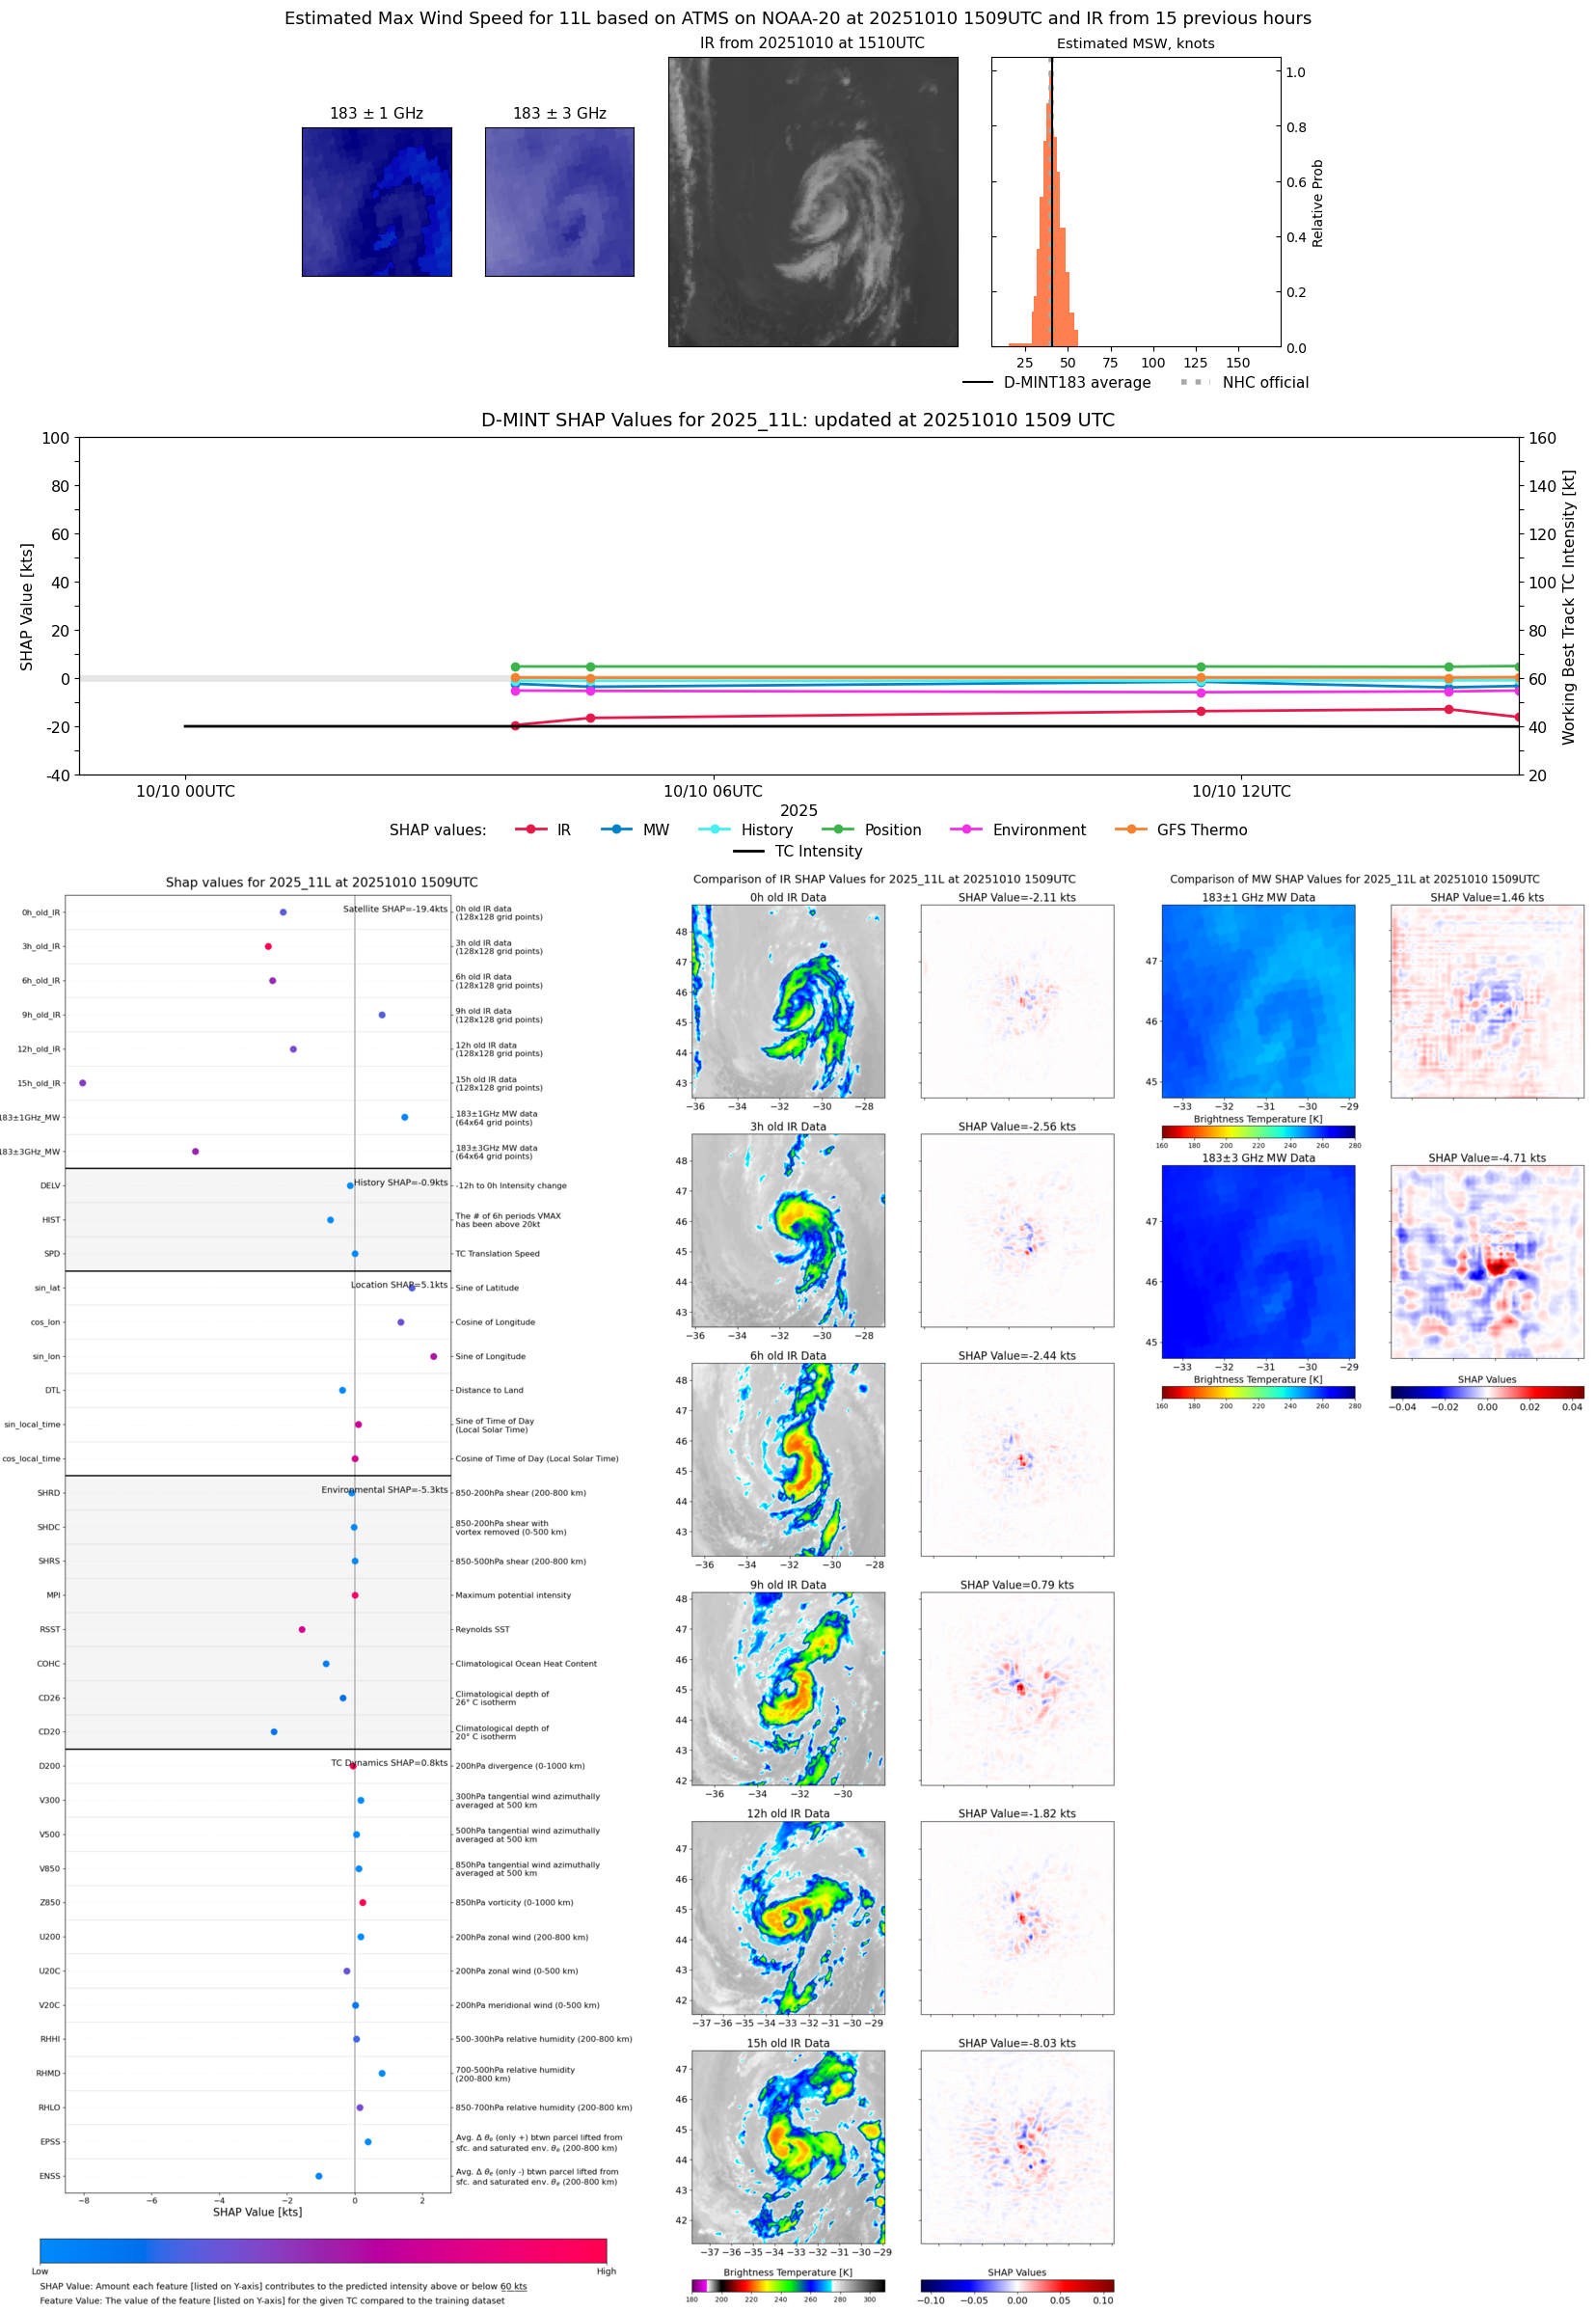 |
| 20251010 | 1453 UTC | AMSR2 | 1002 hPa | 39 kts | 35 kts | 43 kts |  |
| 20251010 | 1421 UTC | ATMS-N21 | 1003 hPa | 42 kts | 38 kts | 47 kts | 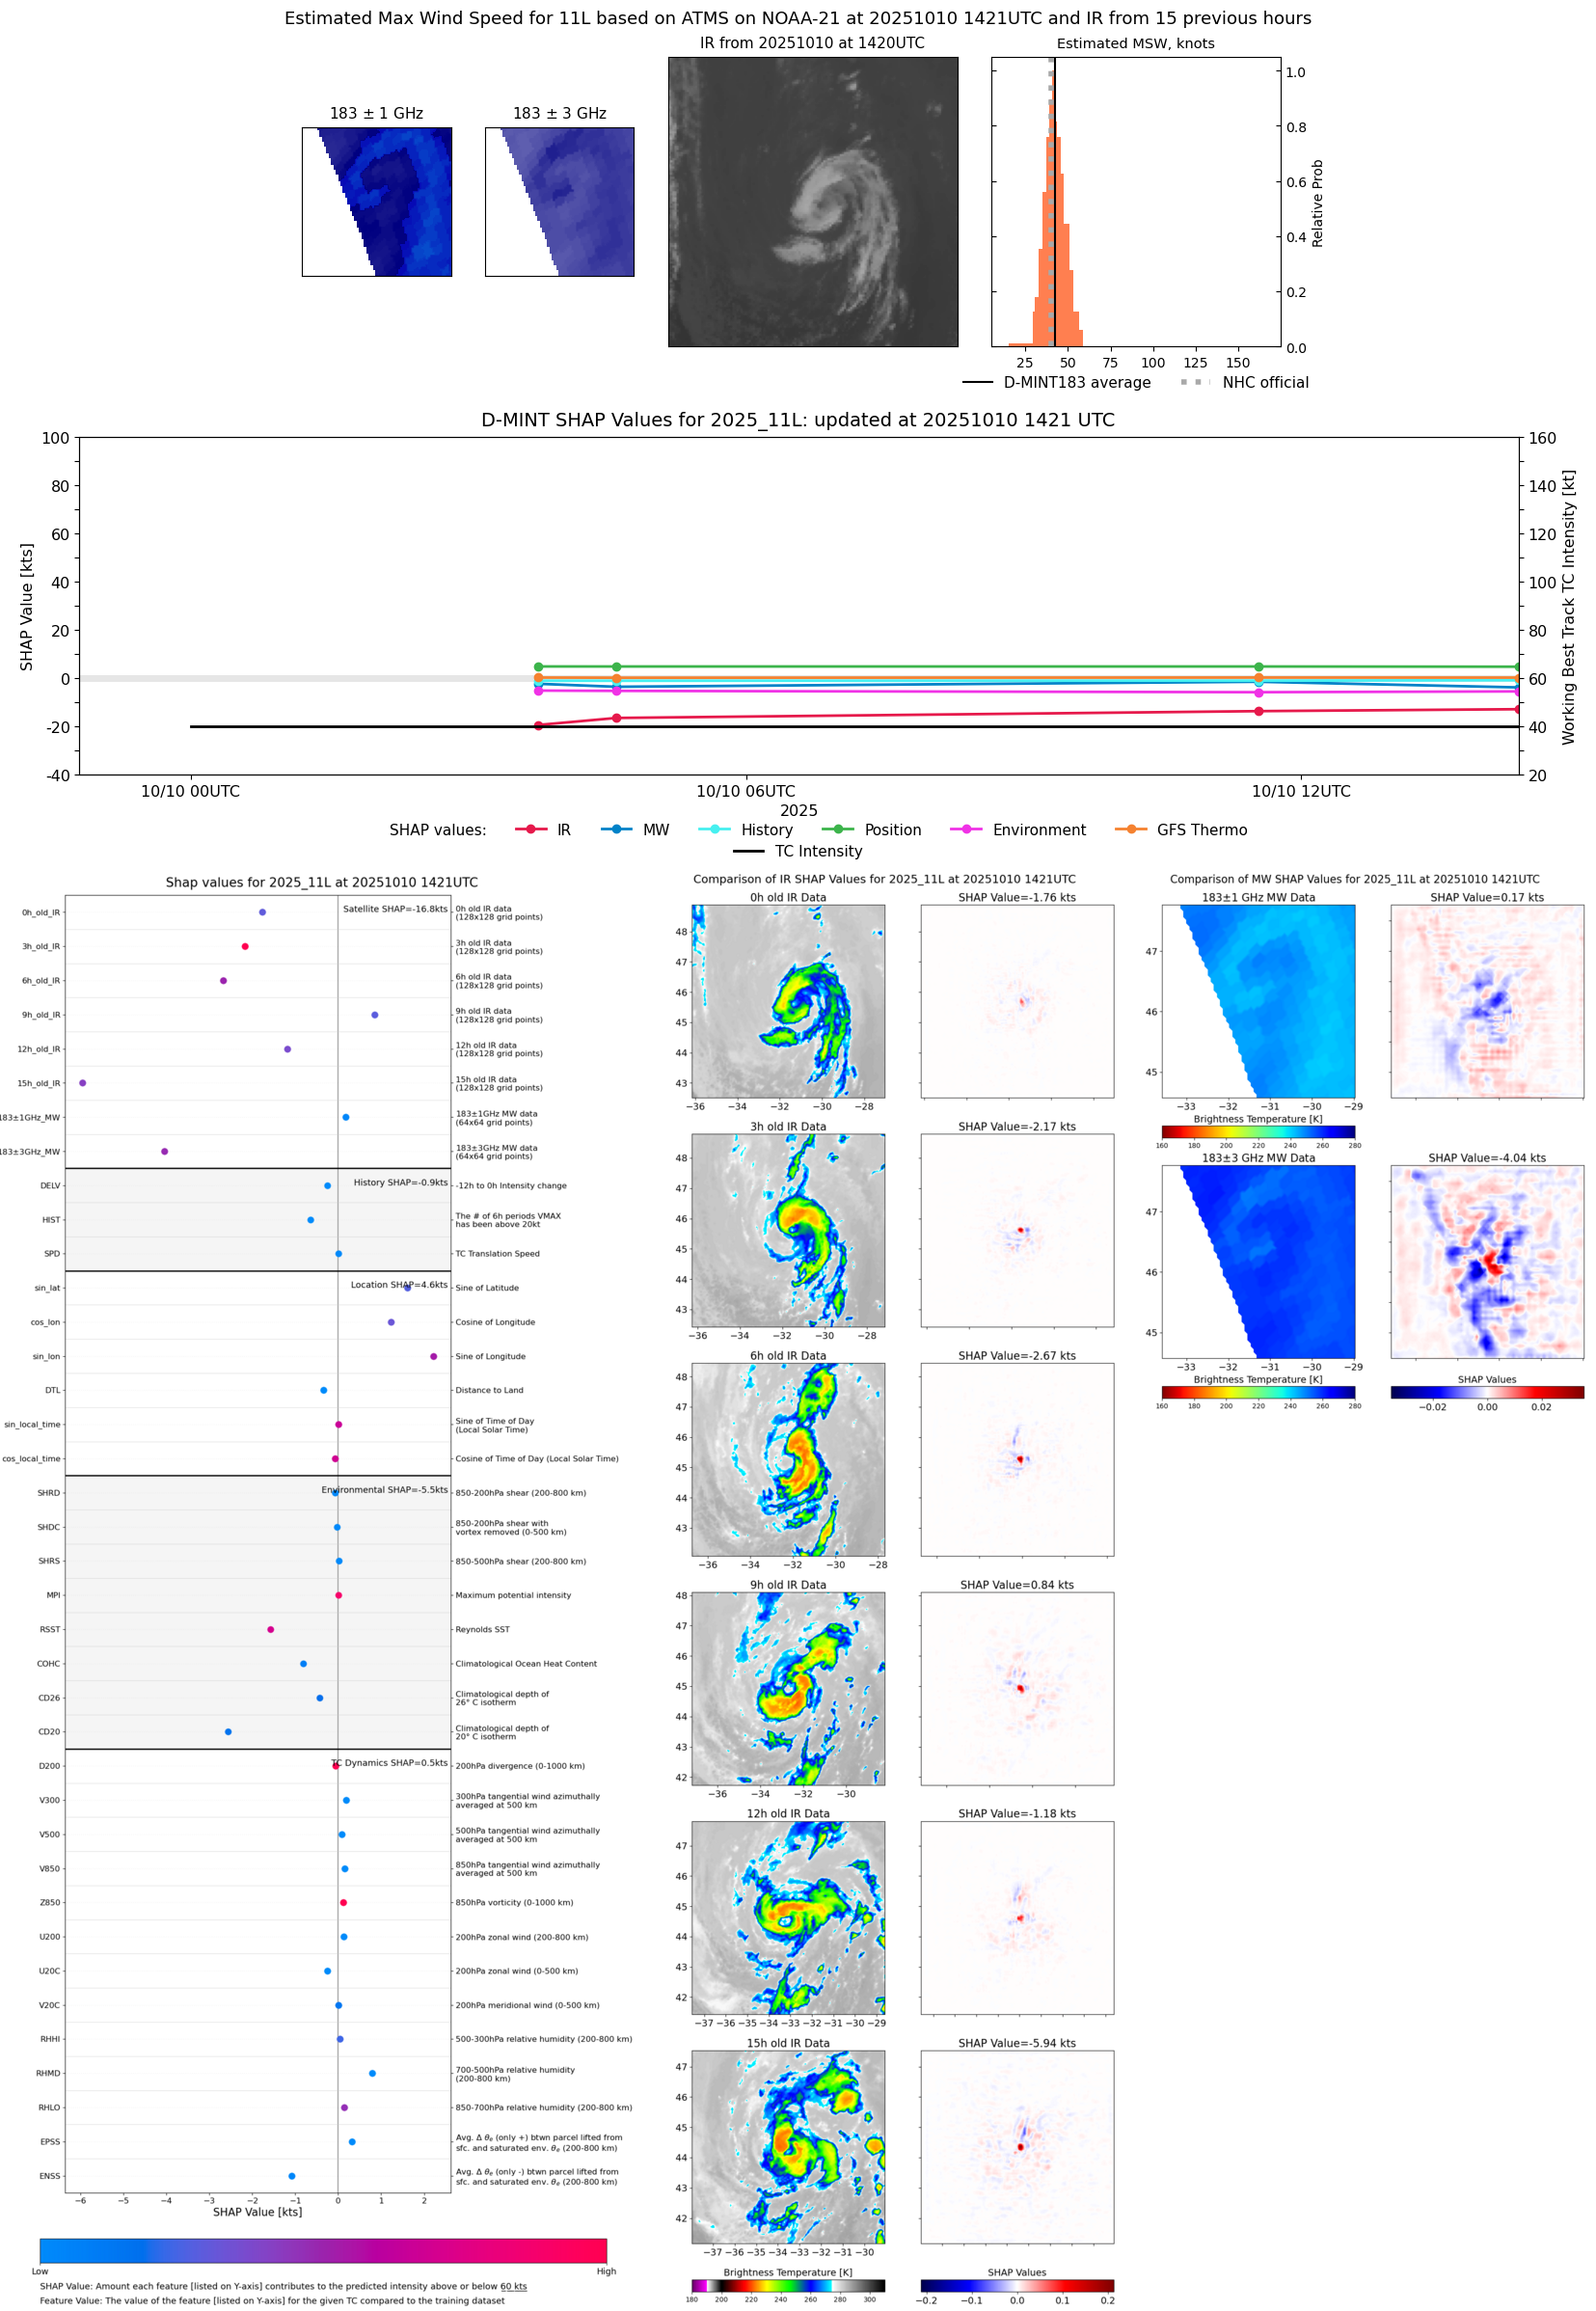 |
| 20251010 | 1132 UTC | TMS05 | 1002 hPa | 43 kts | 40 kts | 48 kts |  |
| 20251010 | 0935 UTC | SSMISF16 | 999 hPa | 36 kts | 33 kts | 40 kts |  |
| 20251010 | 0857 UTC | WSFM01 | 999 hPa | 40 kts | 36 kts | 44 kts | 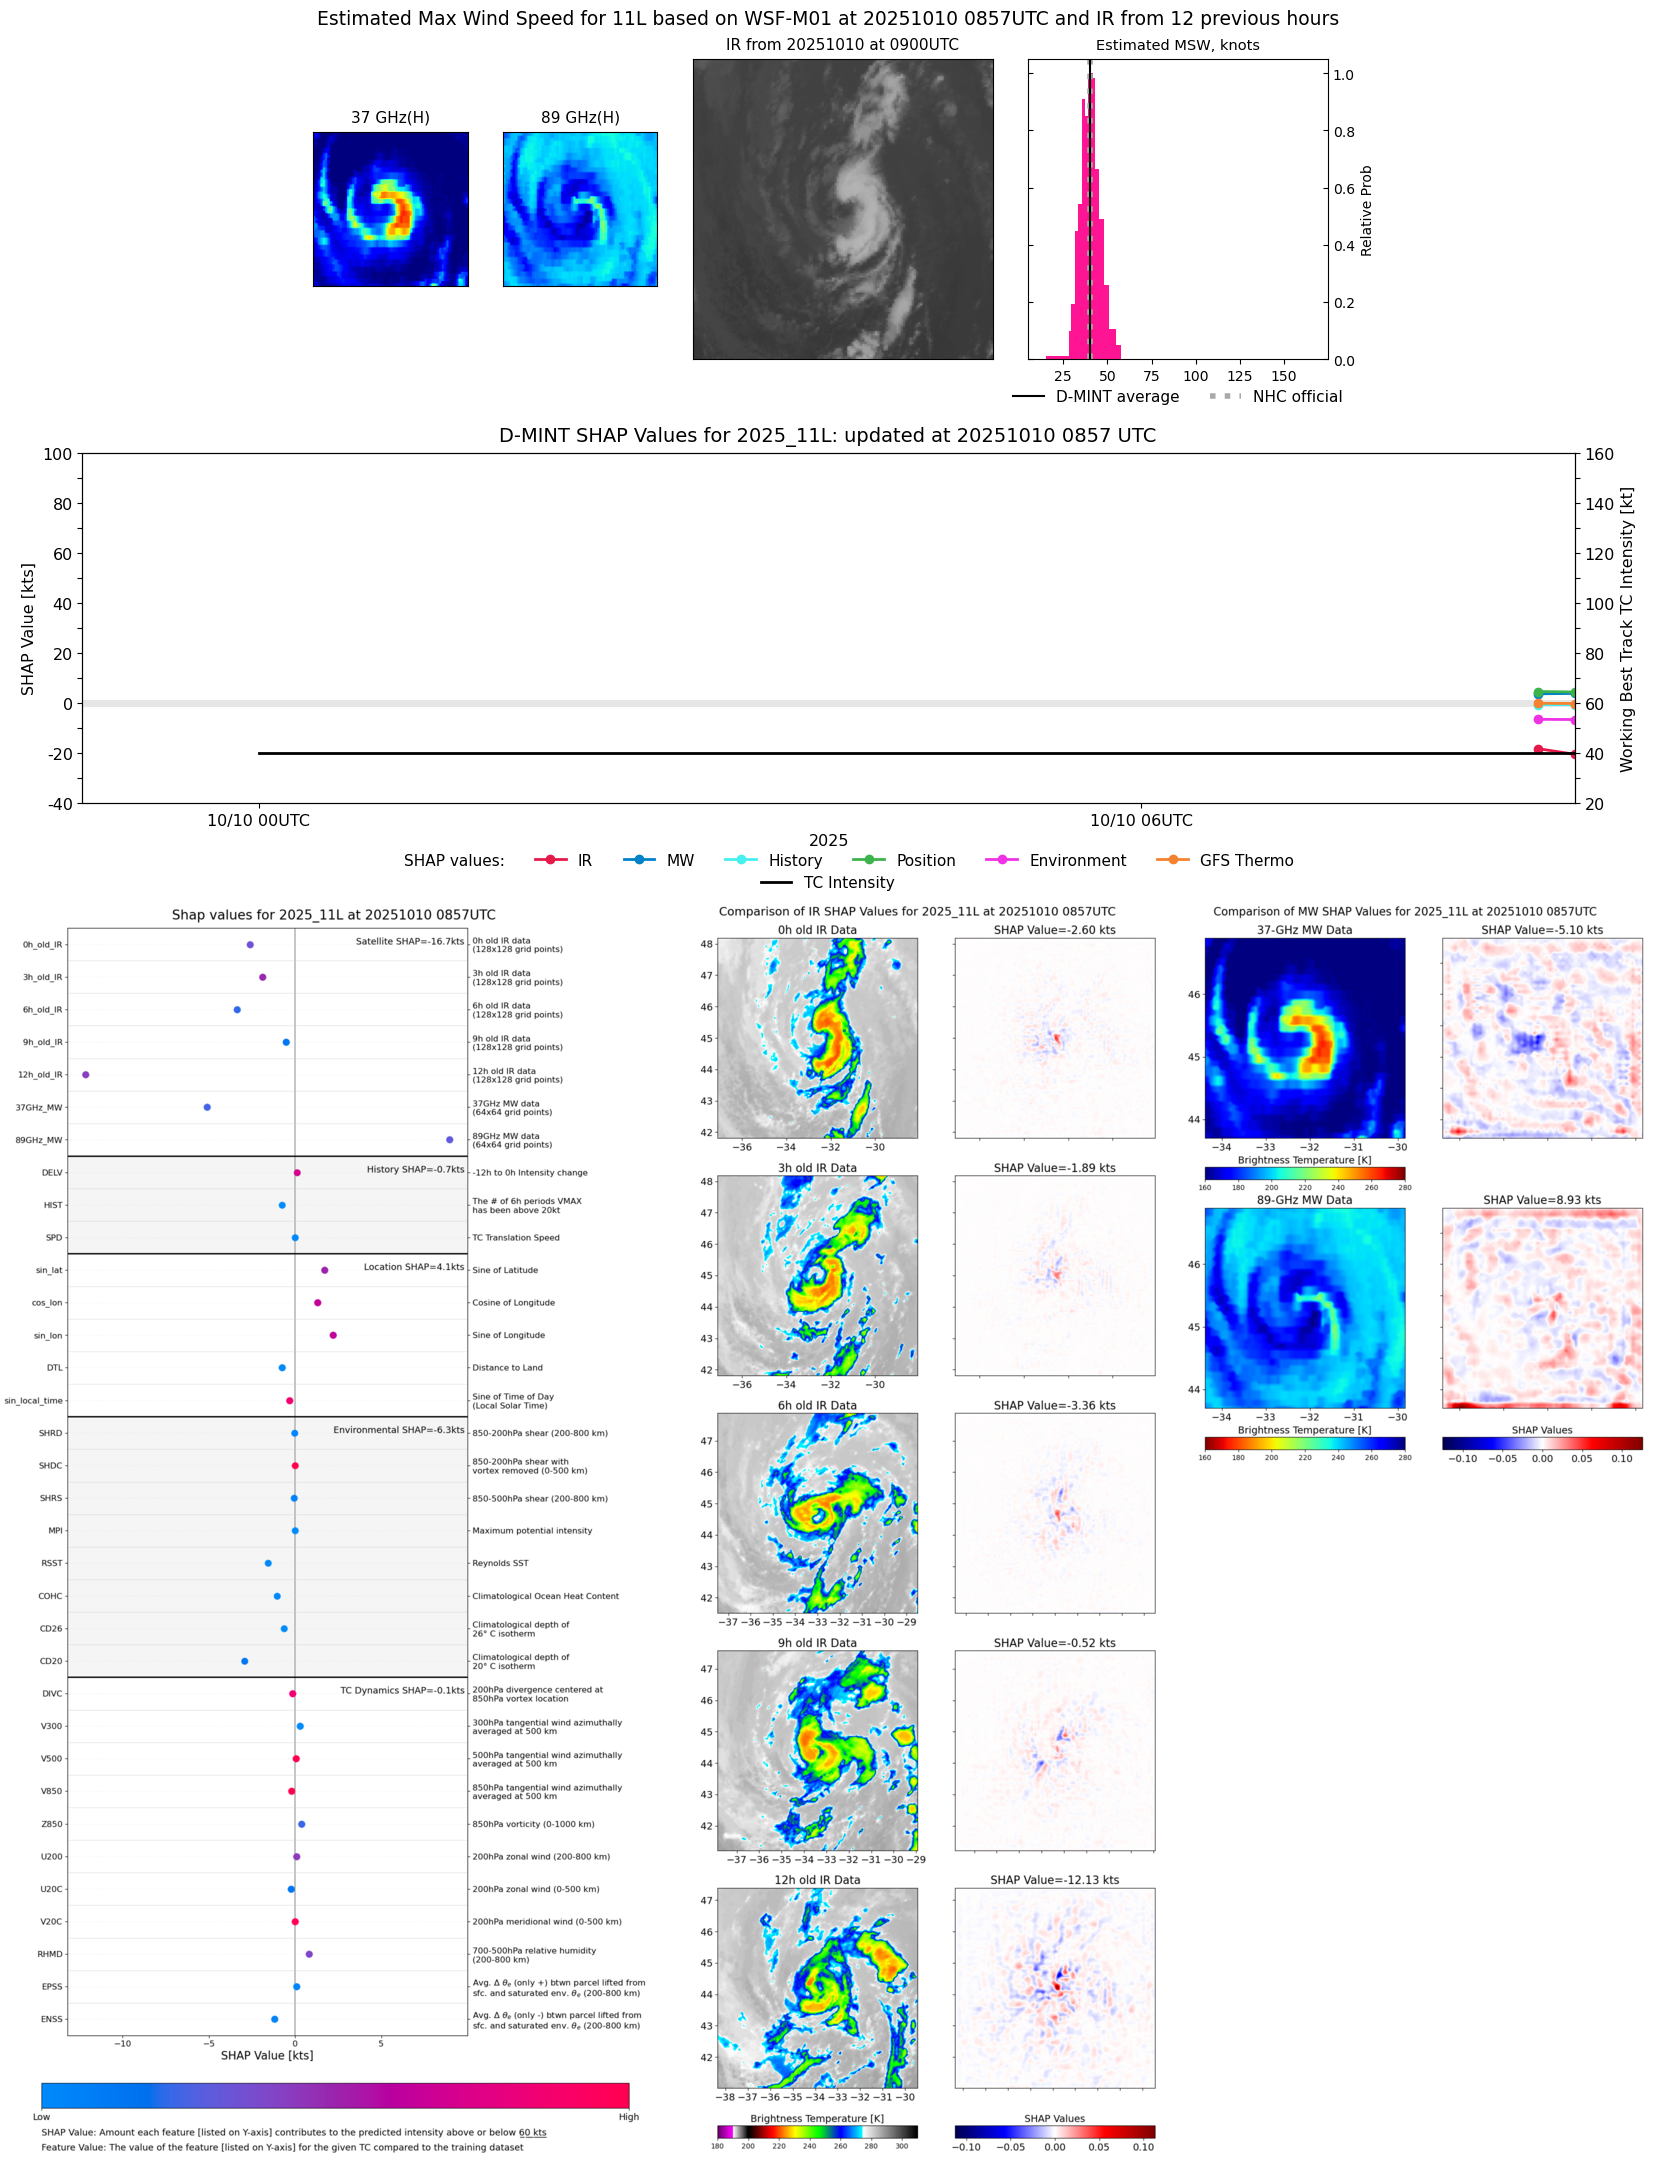 |
| 20251010 | 0842 UTC | SSMISF17 | 1000 hPa | 43 kts | 39 kts | 47 kts | 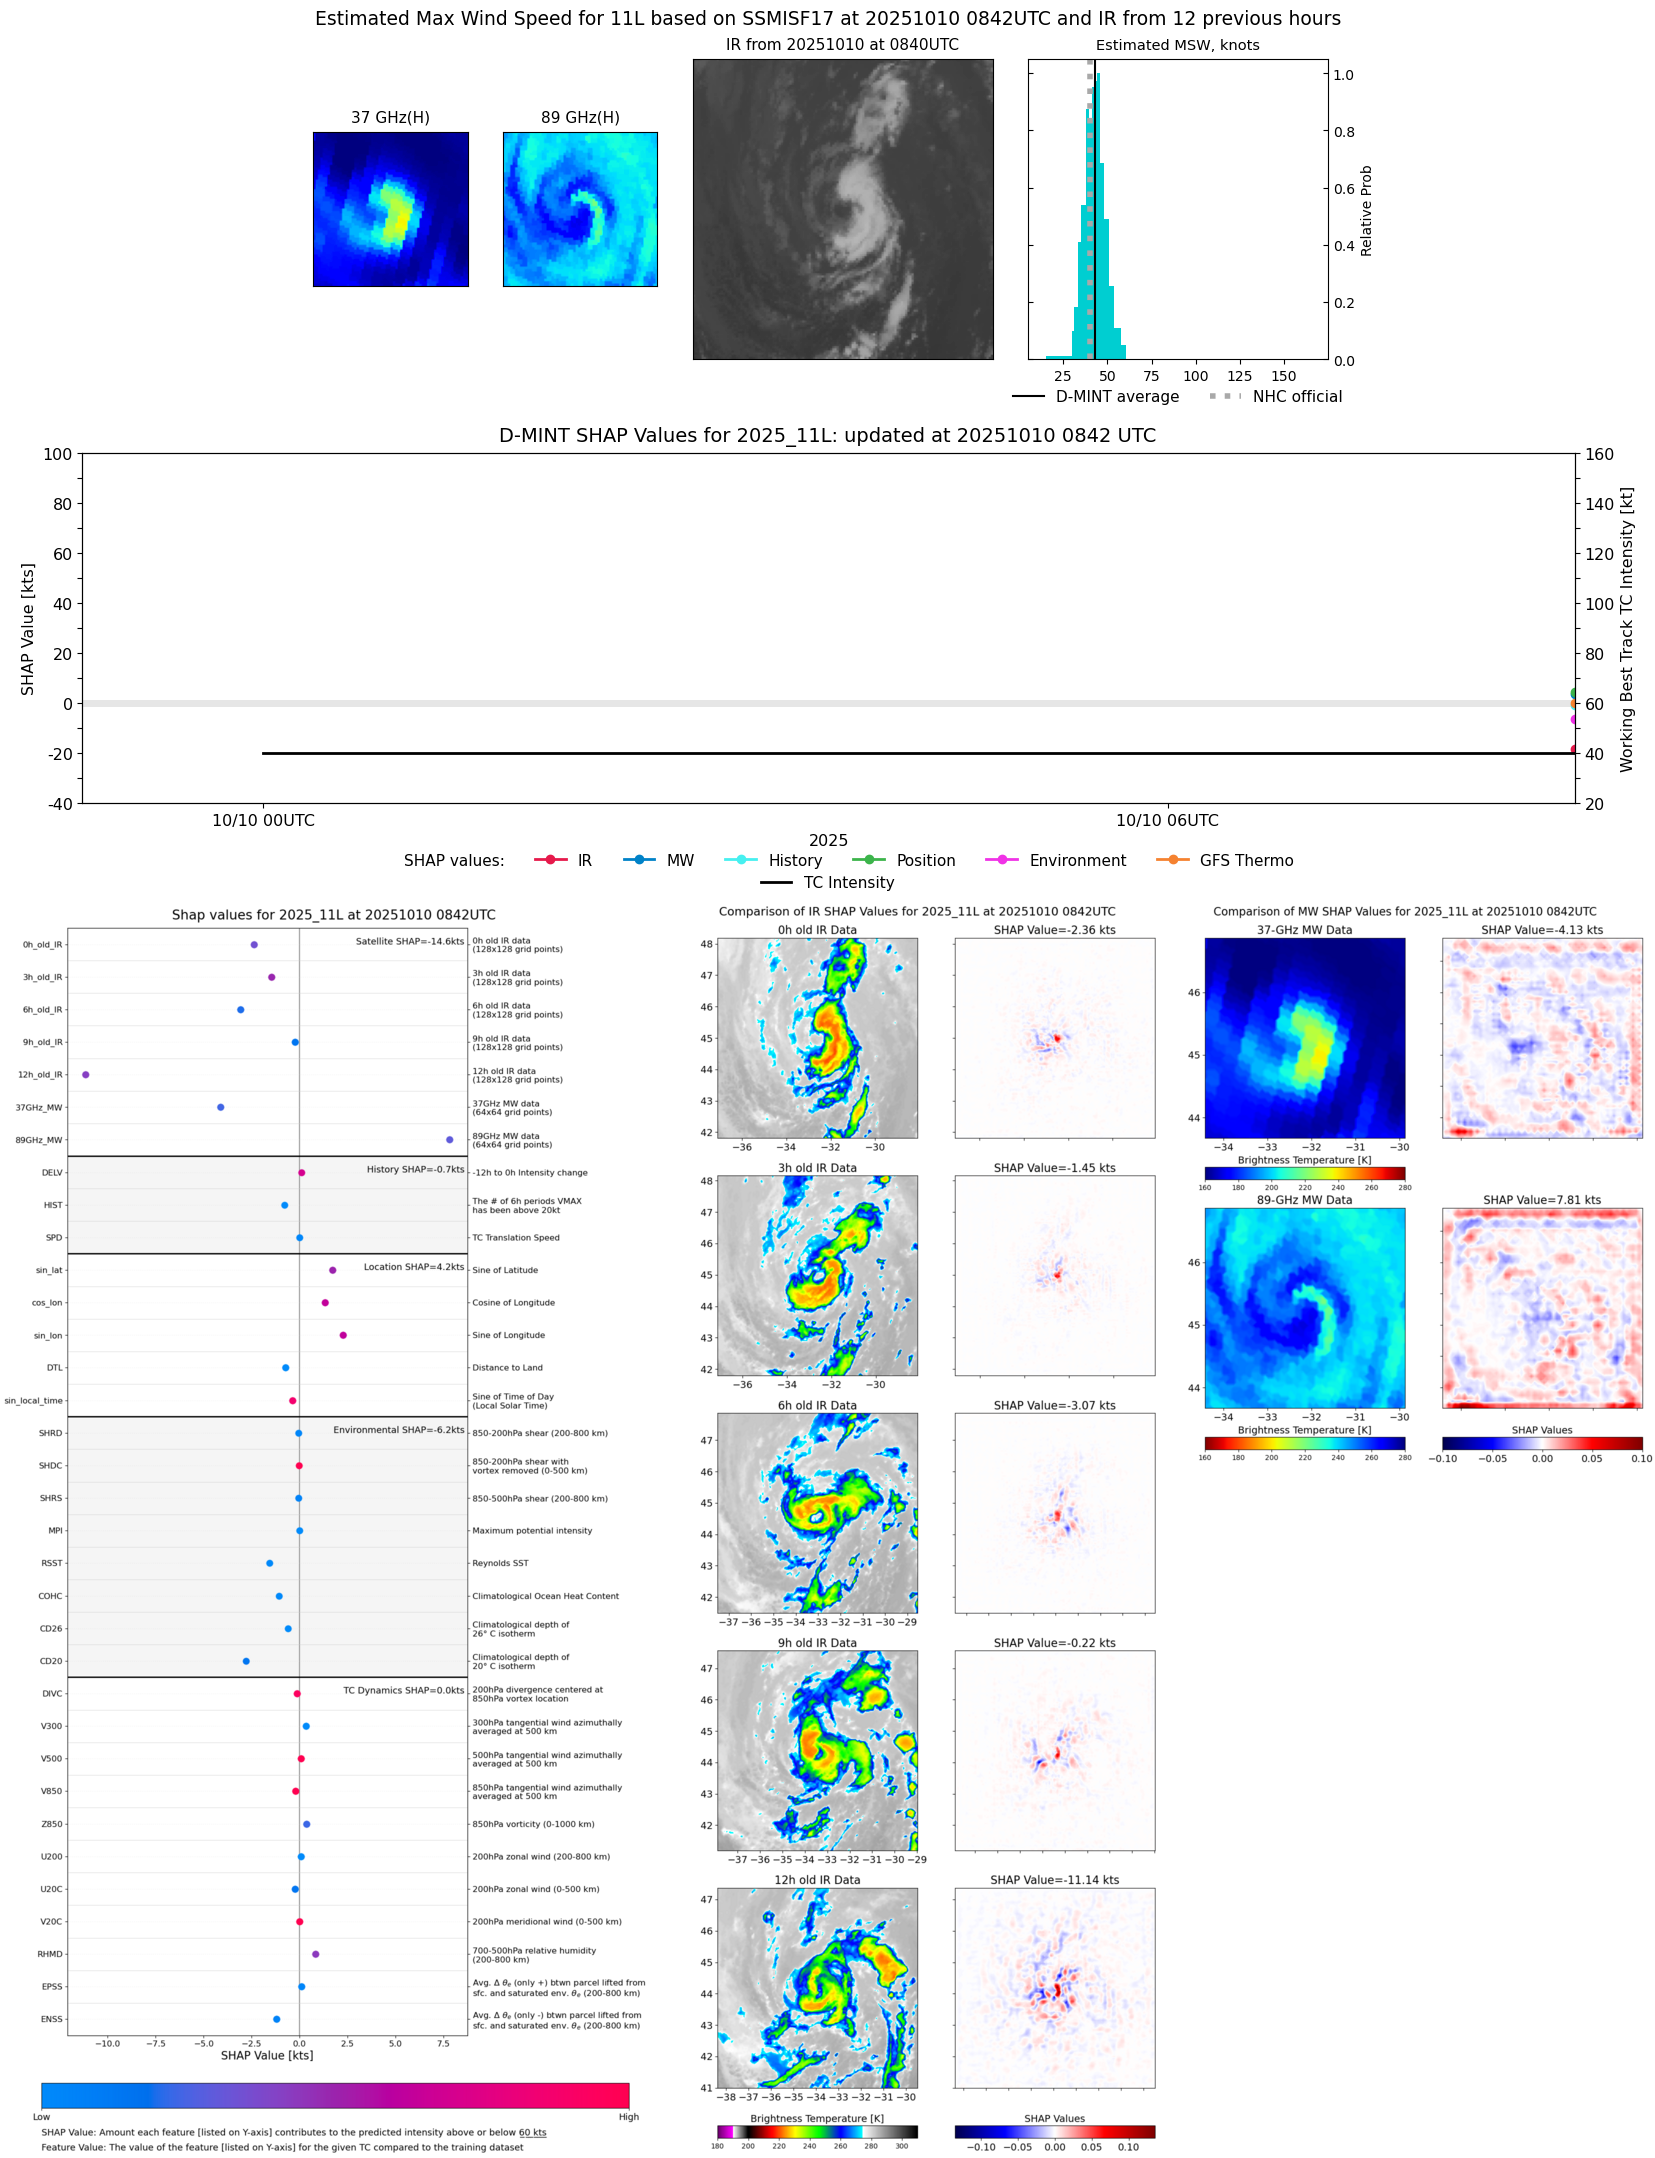 |
| 20251010 | 0436 UTC | ATMS-N21 | 1003 hPa | 39 kts | 35 kts | 43 kts | 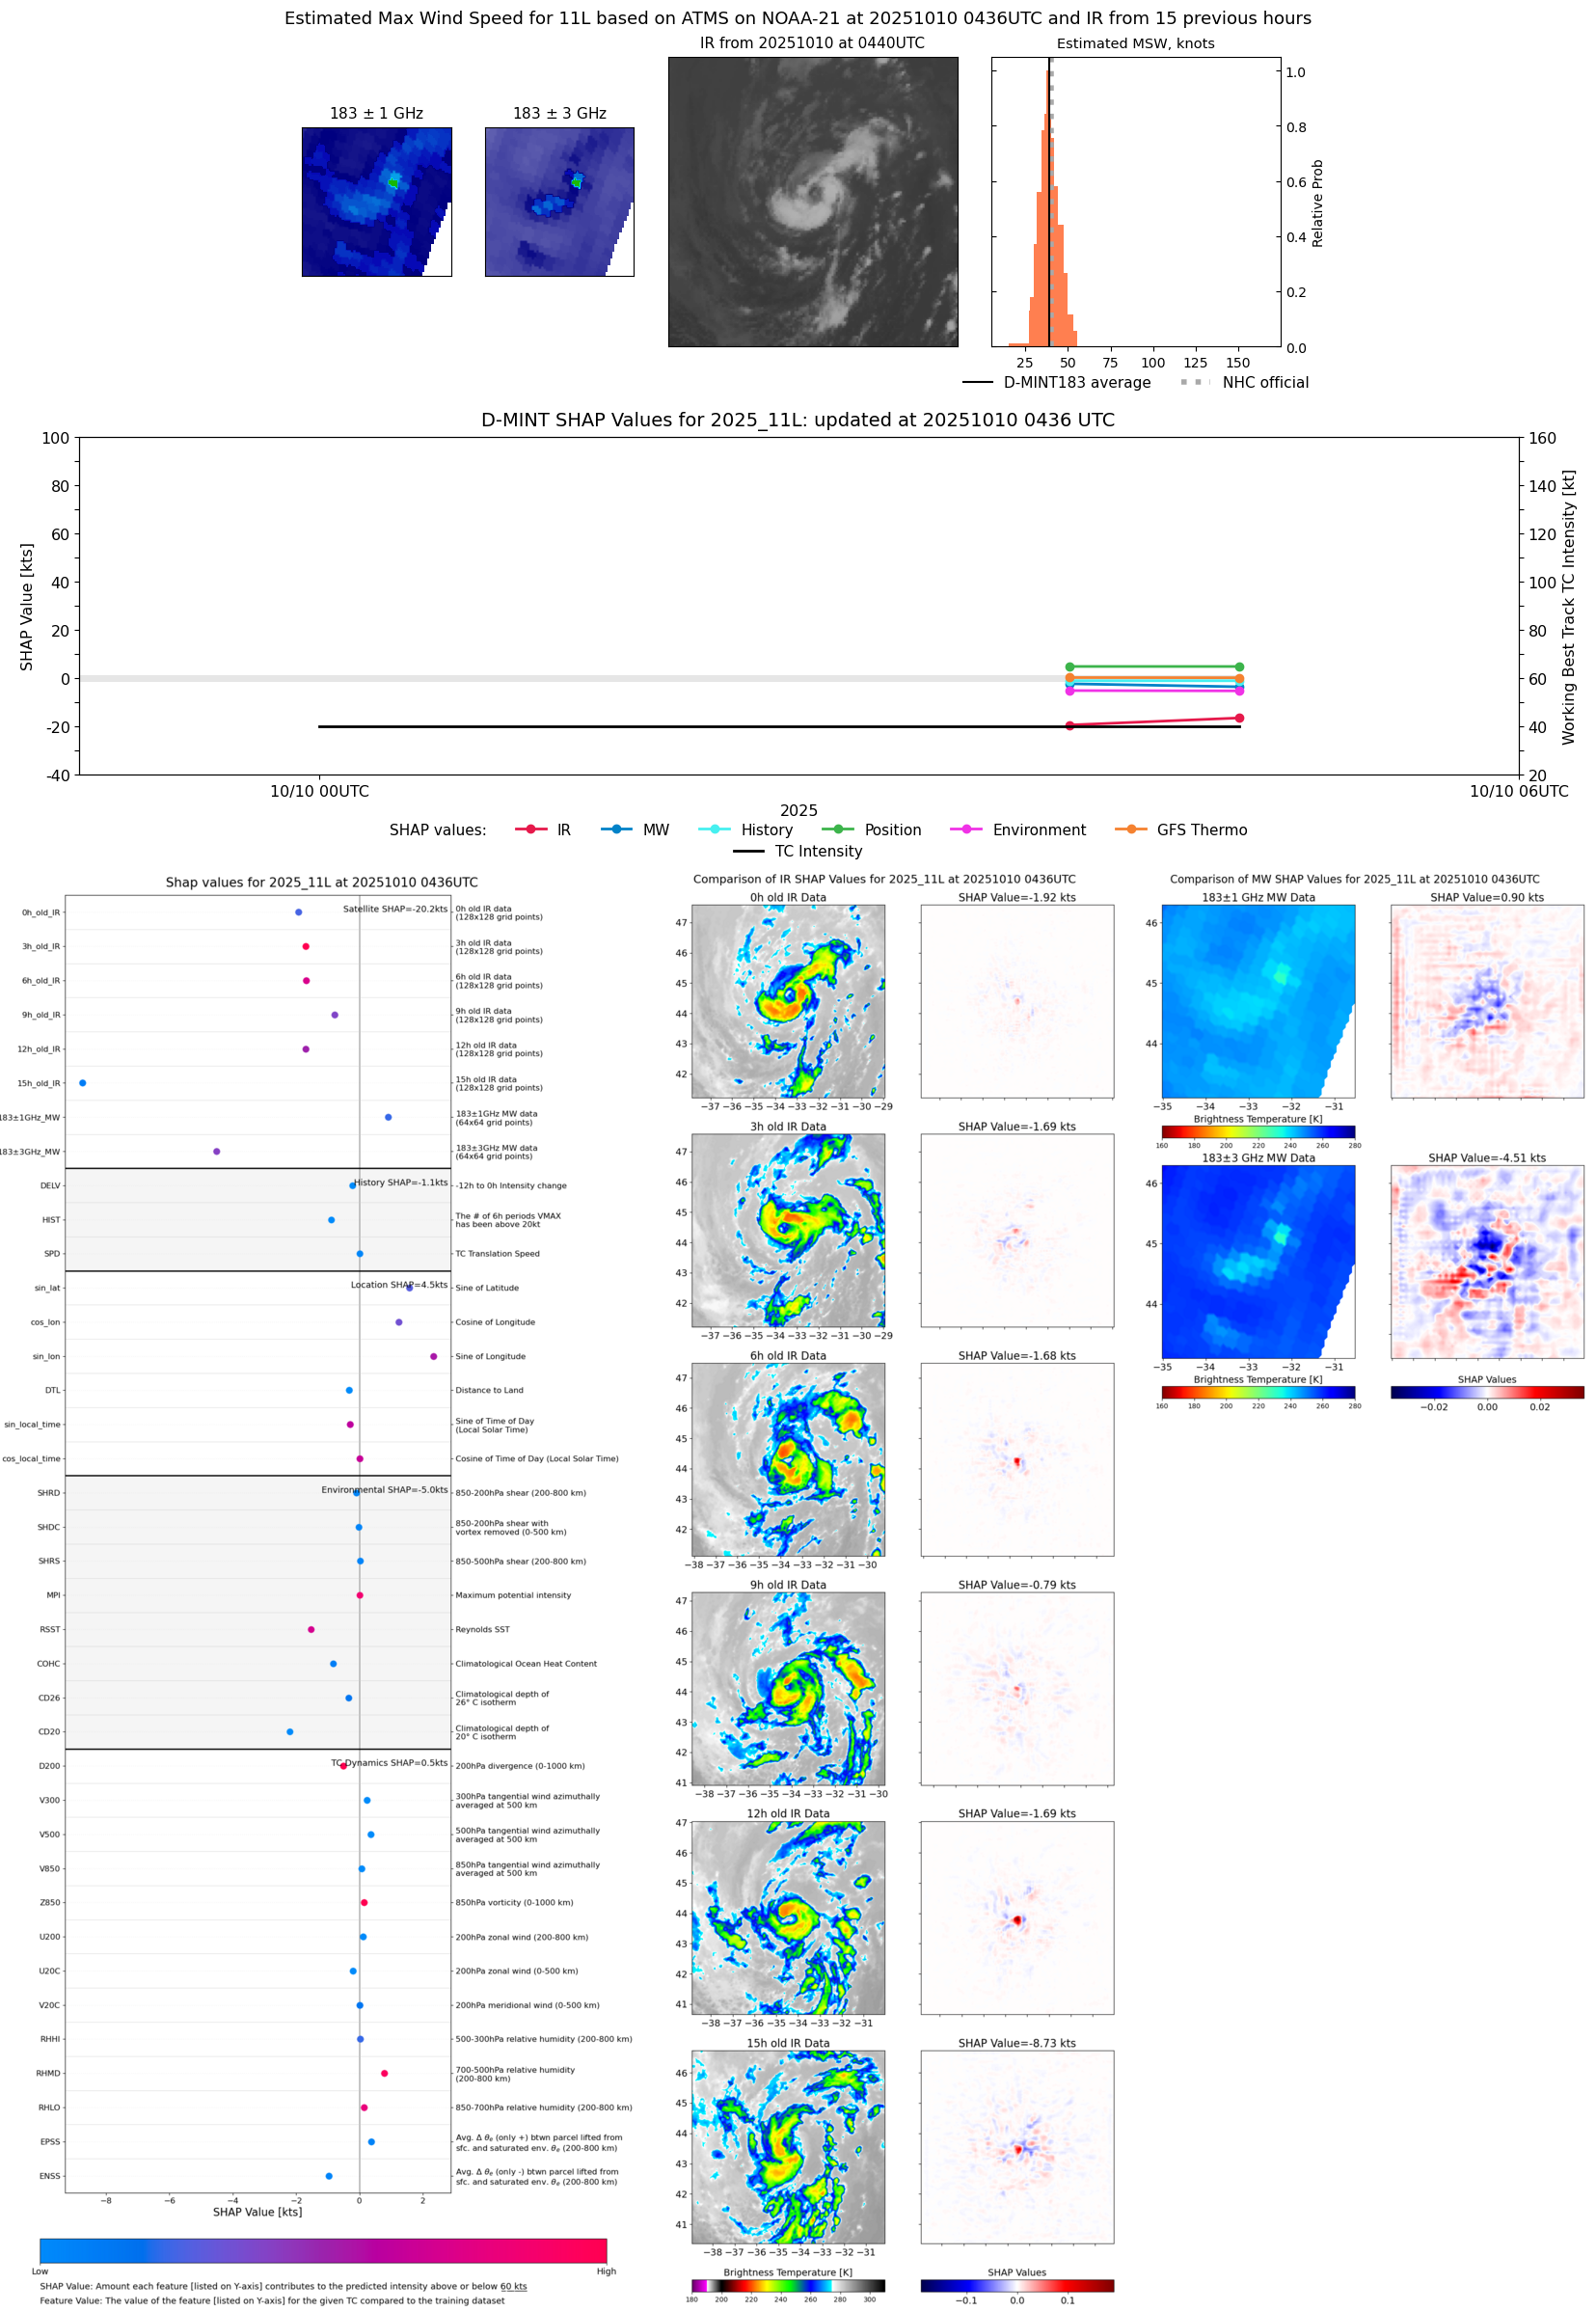 |
| 20251010 | 0346 UTC | AMSR2 | 998 hPa | 45 kts | 40 kts | 49 kts | 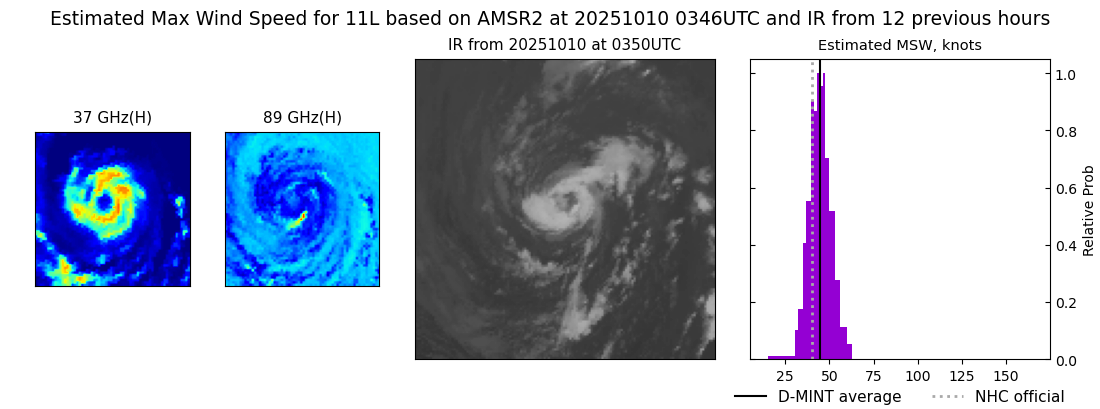 |
| 20251010 | 0345 UTC | ATMS-N20 | 1003 hPa | 37 kts | 34 kts | 42 kts | 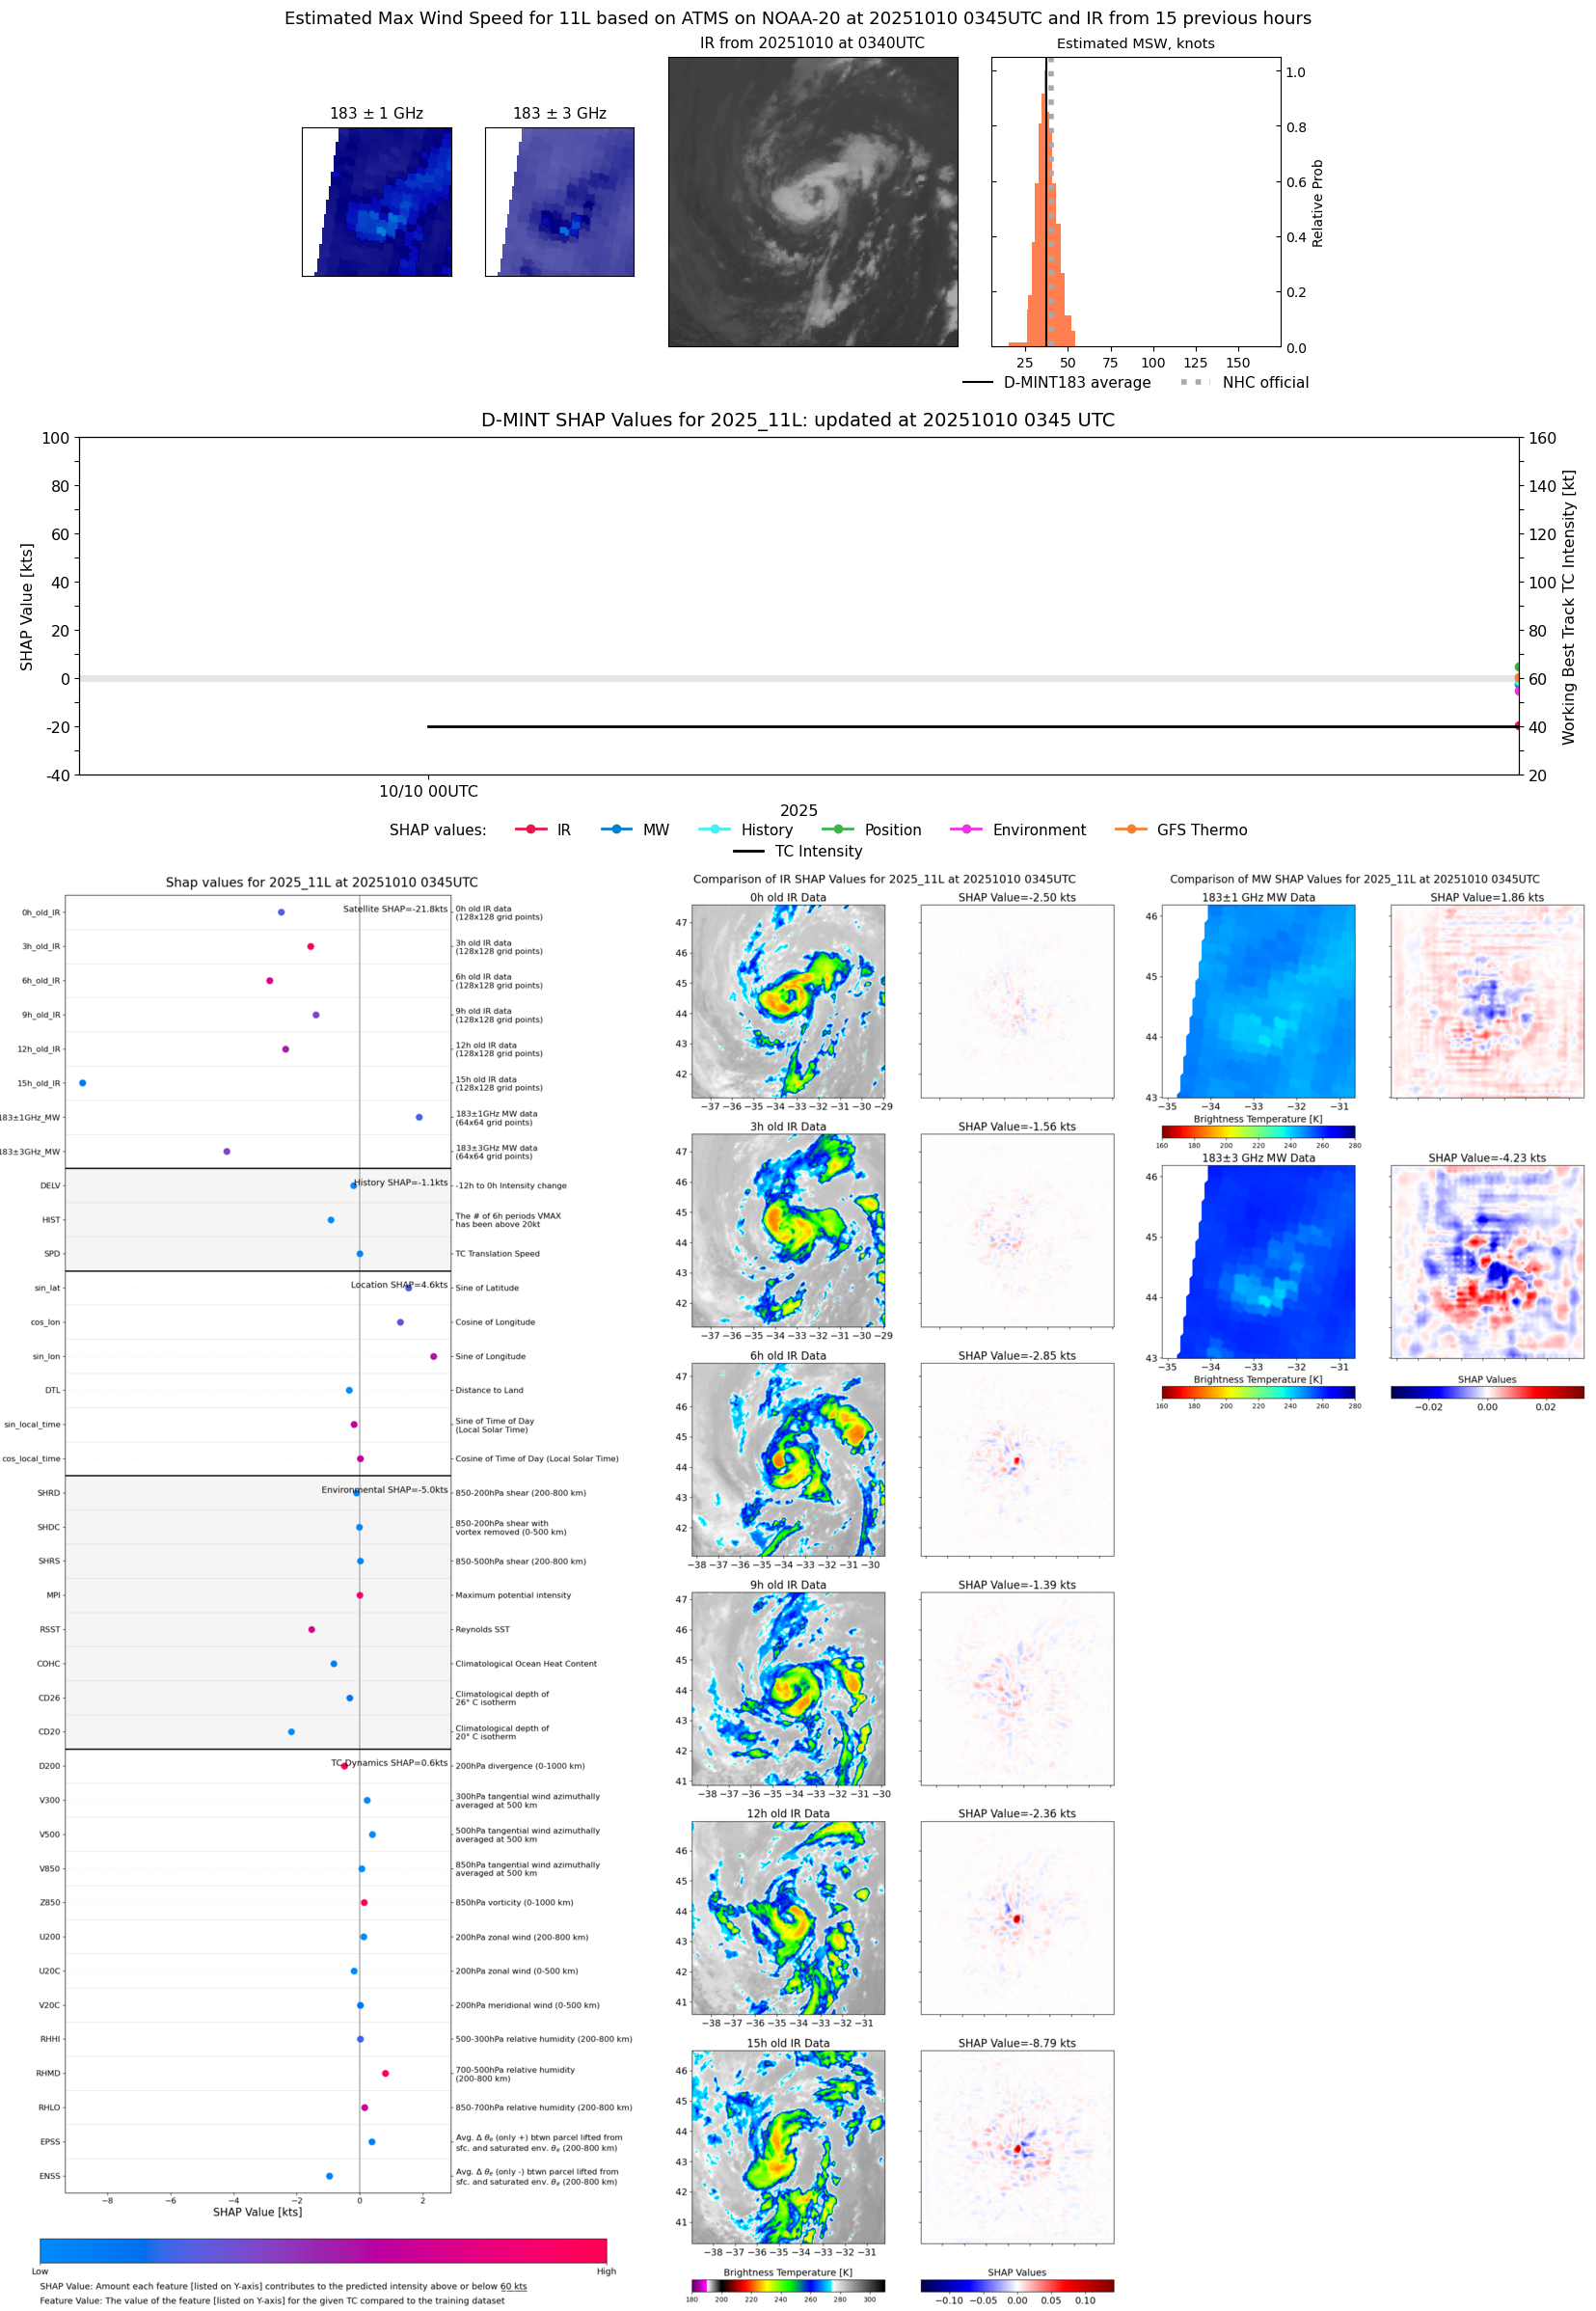 |
| 20251009 | 2025 UTC | SSMISF17 | NaN hPa | 41 kts | 36 kts | 44 kts | 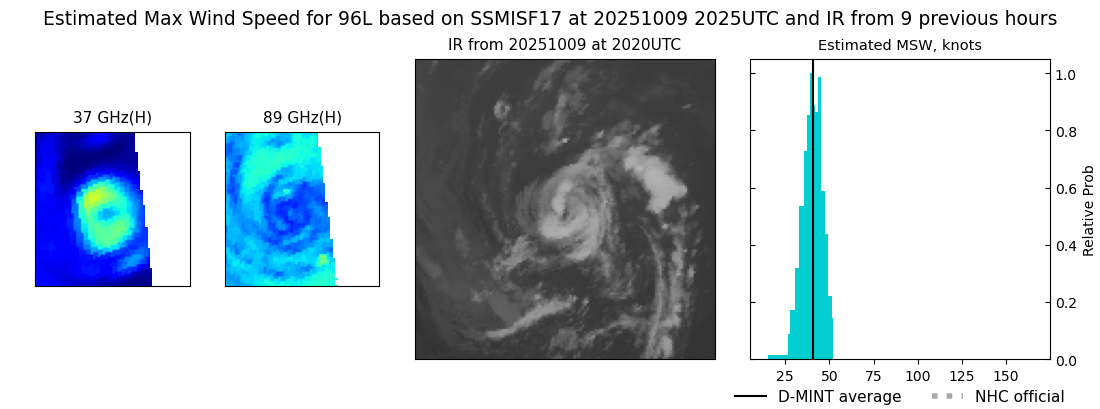 |
| 20251009 | 1728 UTC | SSMISF18 | NaN hPa | 40 kts | 36 kts | 44 kts | 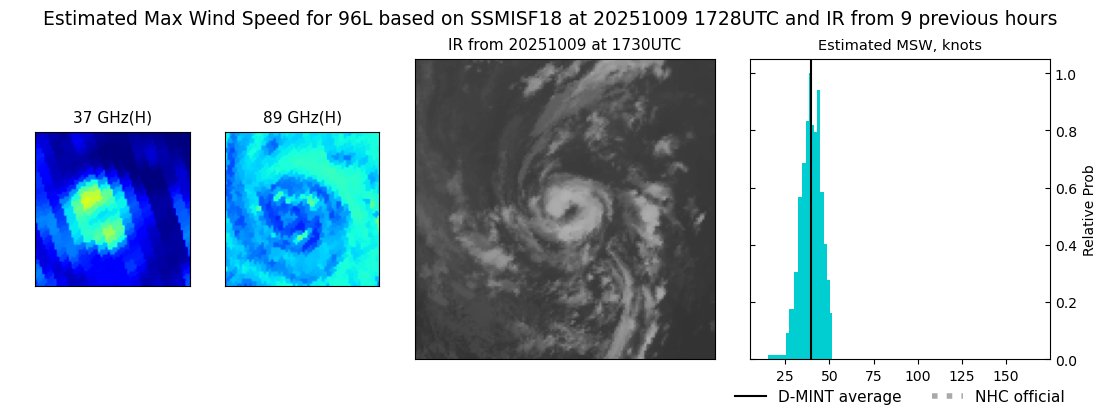 |
| 20251009 | 1548 UTC | AMSR2 | NaN hPa | 40 kts | 36 kts | 44 kts | 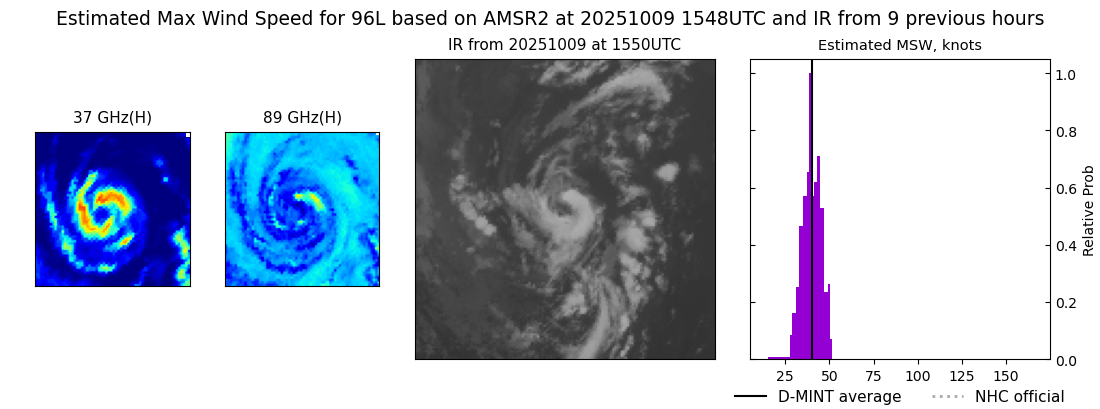 |
| 20251009 | 0441 UTC | AMSR2 | NaN hPa | 45 kts | 40 kts | 49 kts | 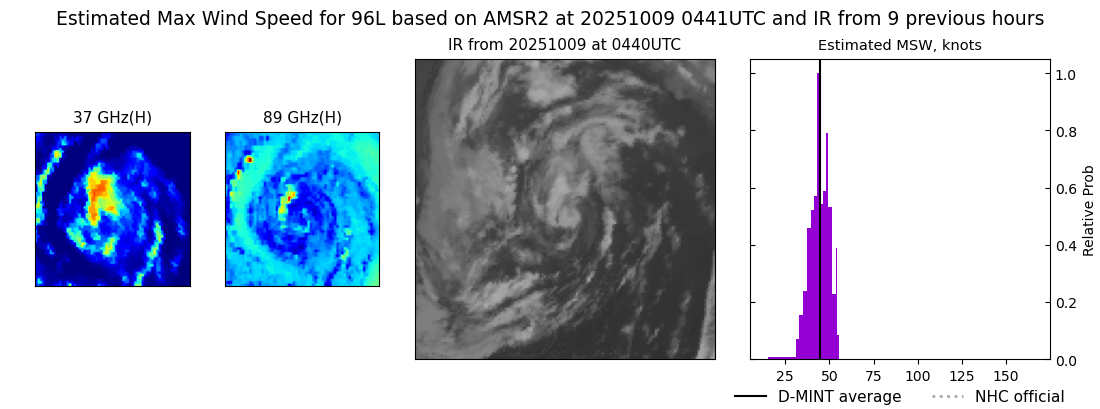 |