|
||

 |
D-MINT HISTORY FILE for 2025_11S
| Date | Time | MW Sensor | MSLP | Vmax (30th-70th percentile average) | Vmax 25th percentile | Vmax 75th percentile | Image |
| 20250205 | 1148 UTC | GMI | 998 hPa | 25 kts | 23 kts | 27 kts | 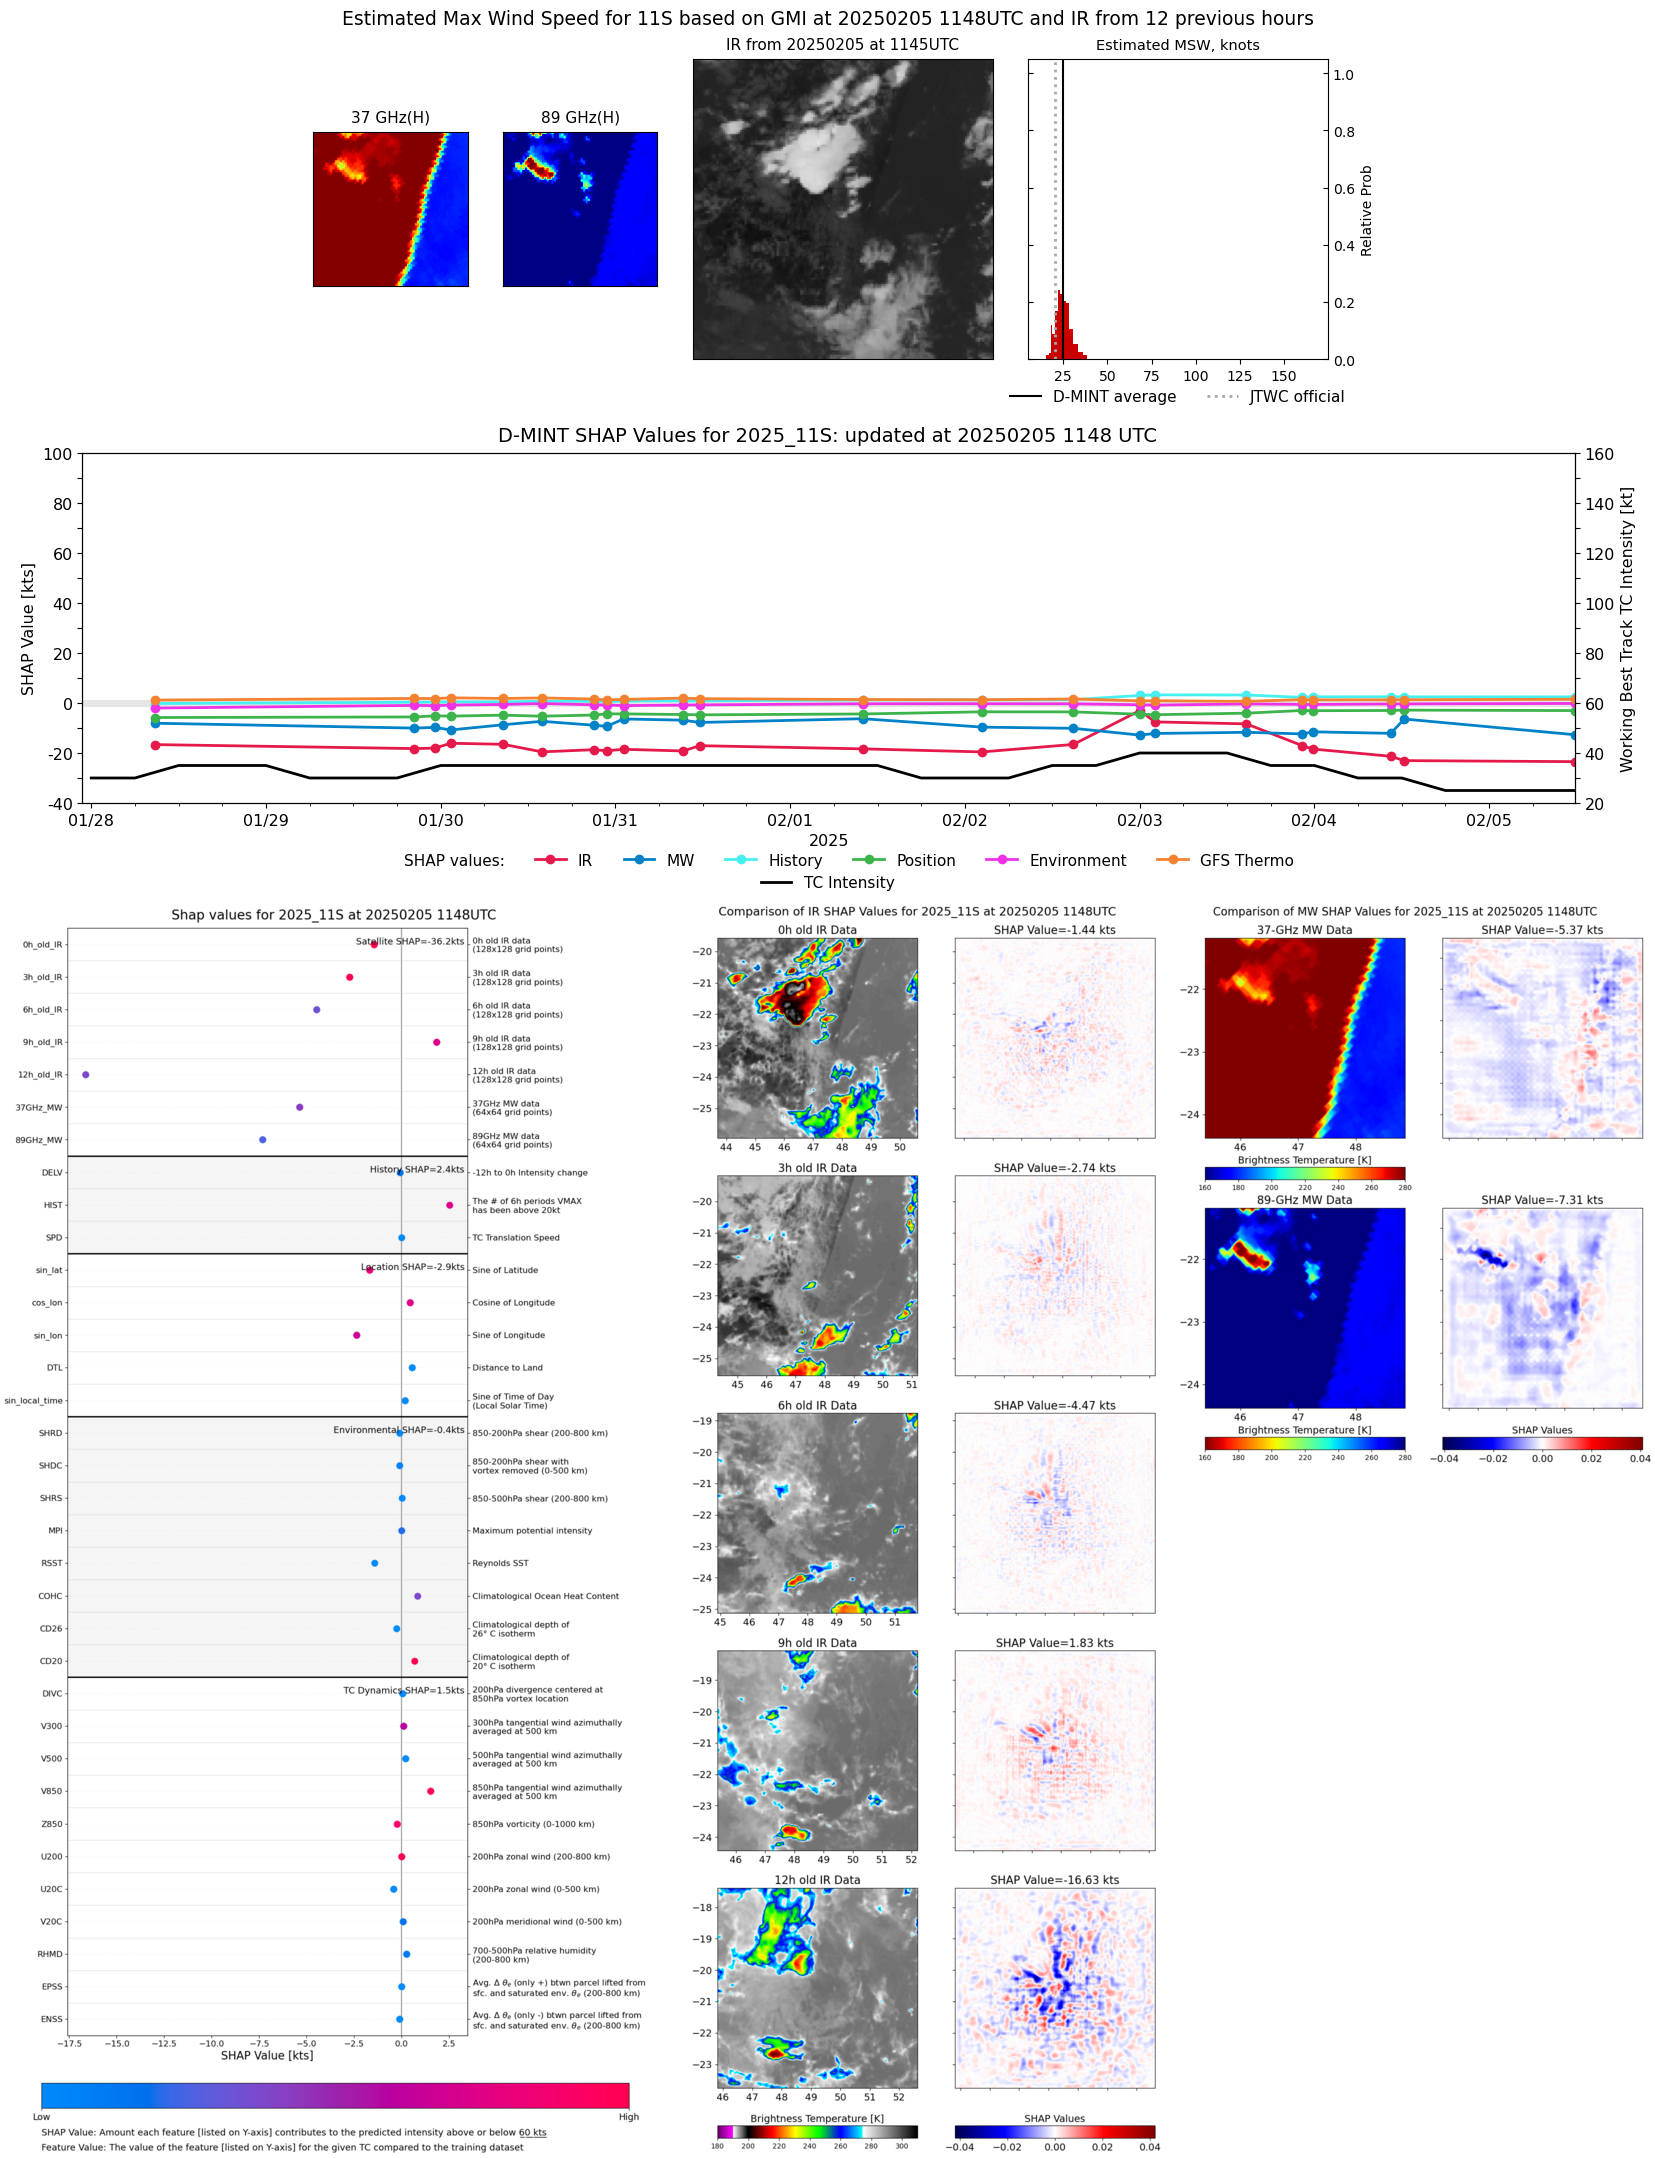 |
| 20250204 | 2223 UTC | GMI | 1002 hPa | 25 kts | 23 kts | 28 kts |  |
| 20250204 | 1502 UTC | SSMISF16 | 1002 hPa | 28 kts | 25 kts | 32 kts |  |
| 20250204 | 1221 UTC | SSMISF18 | 1000 hPa | 31 kts | 28 kts | 35 kts |  |
| 20250204 | 1030 UTC | AMSR2 | 1002 hPa | 27 kts | 24 kts | 30 kts |  |
| 20250204 | 0229 UTC | SSMISF16 | 998 hPa | 35 kts | 31 kts | 40 kts |  |
| 20250203 | 2349 UTC | SSMISF18 | 1001 hPa | 30 kts | 27 kts | 34 kts | 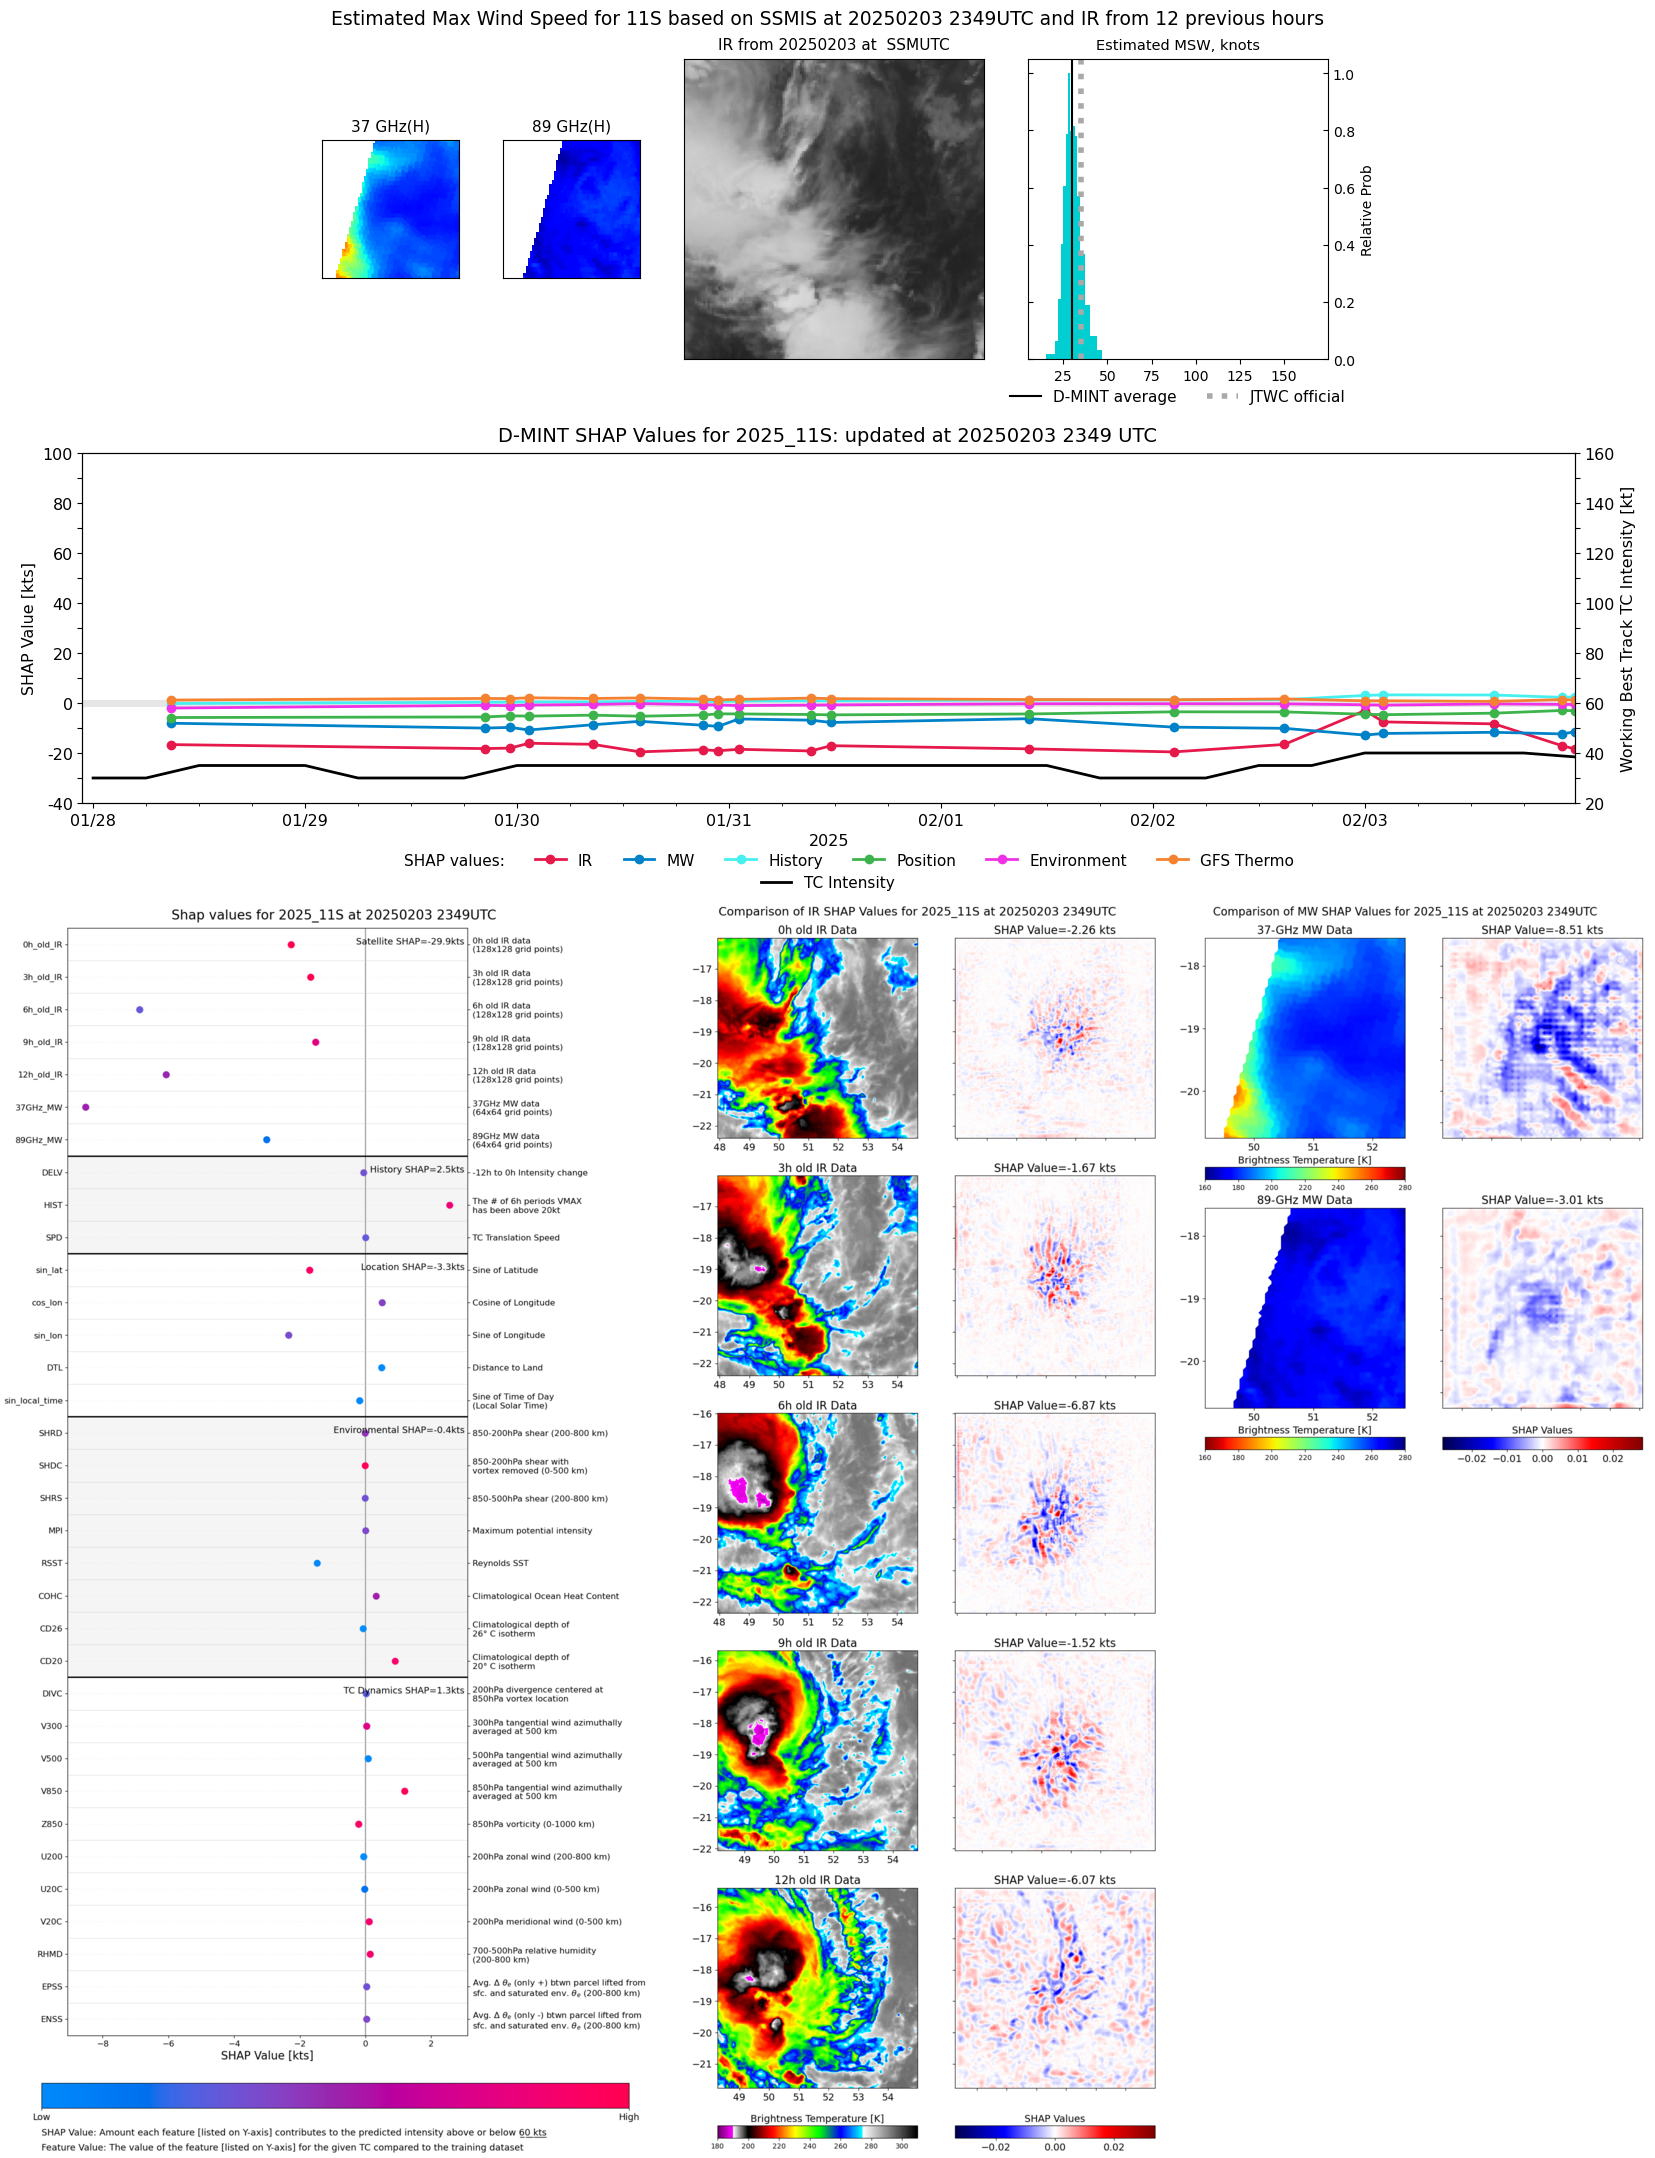 |
| 20250203 | 2219 UTC | AMSR2 | 1002 hPa | 31 kts | 28 kts | 34 kts | 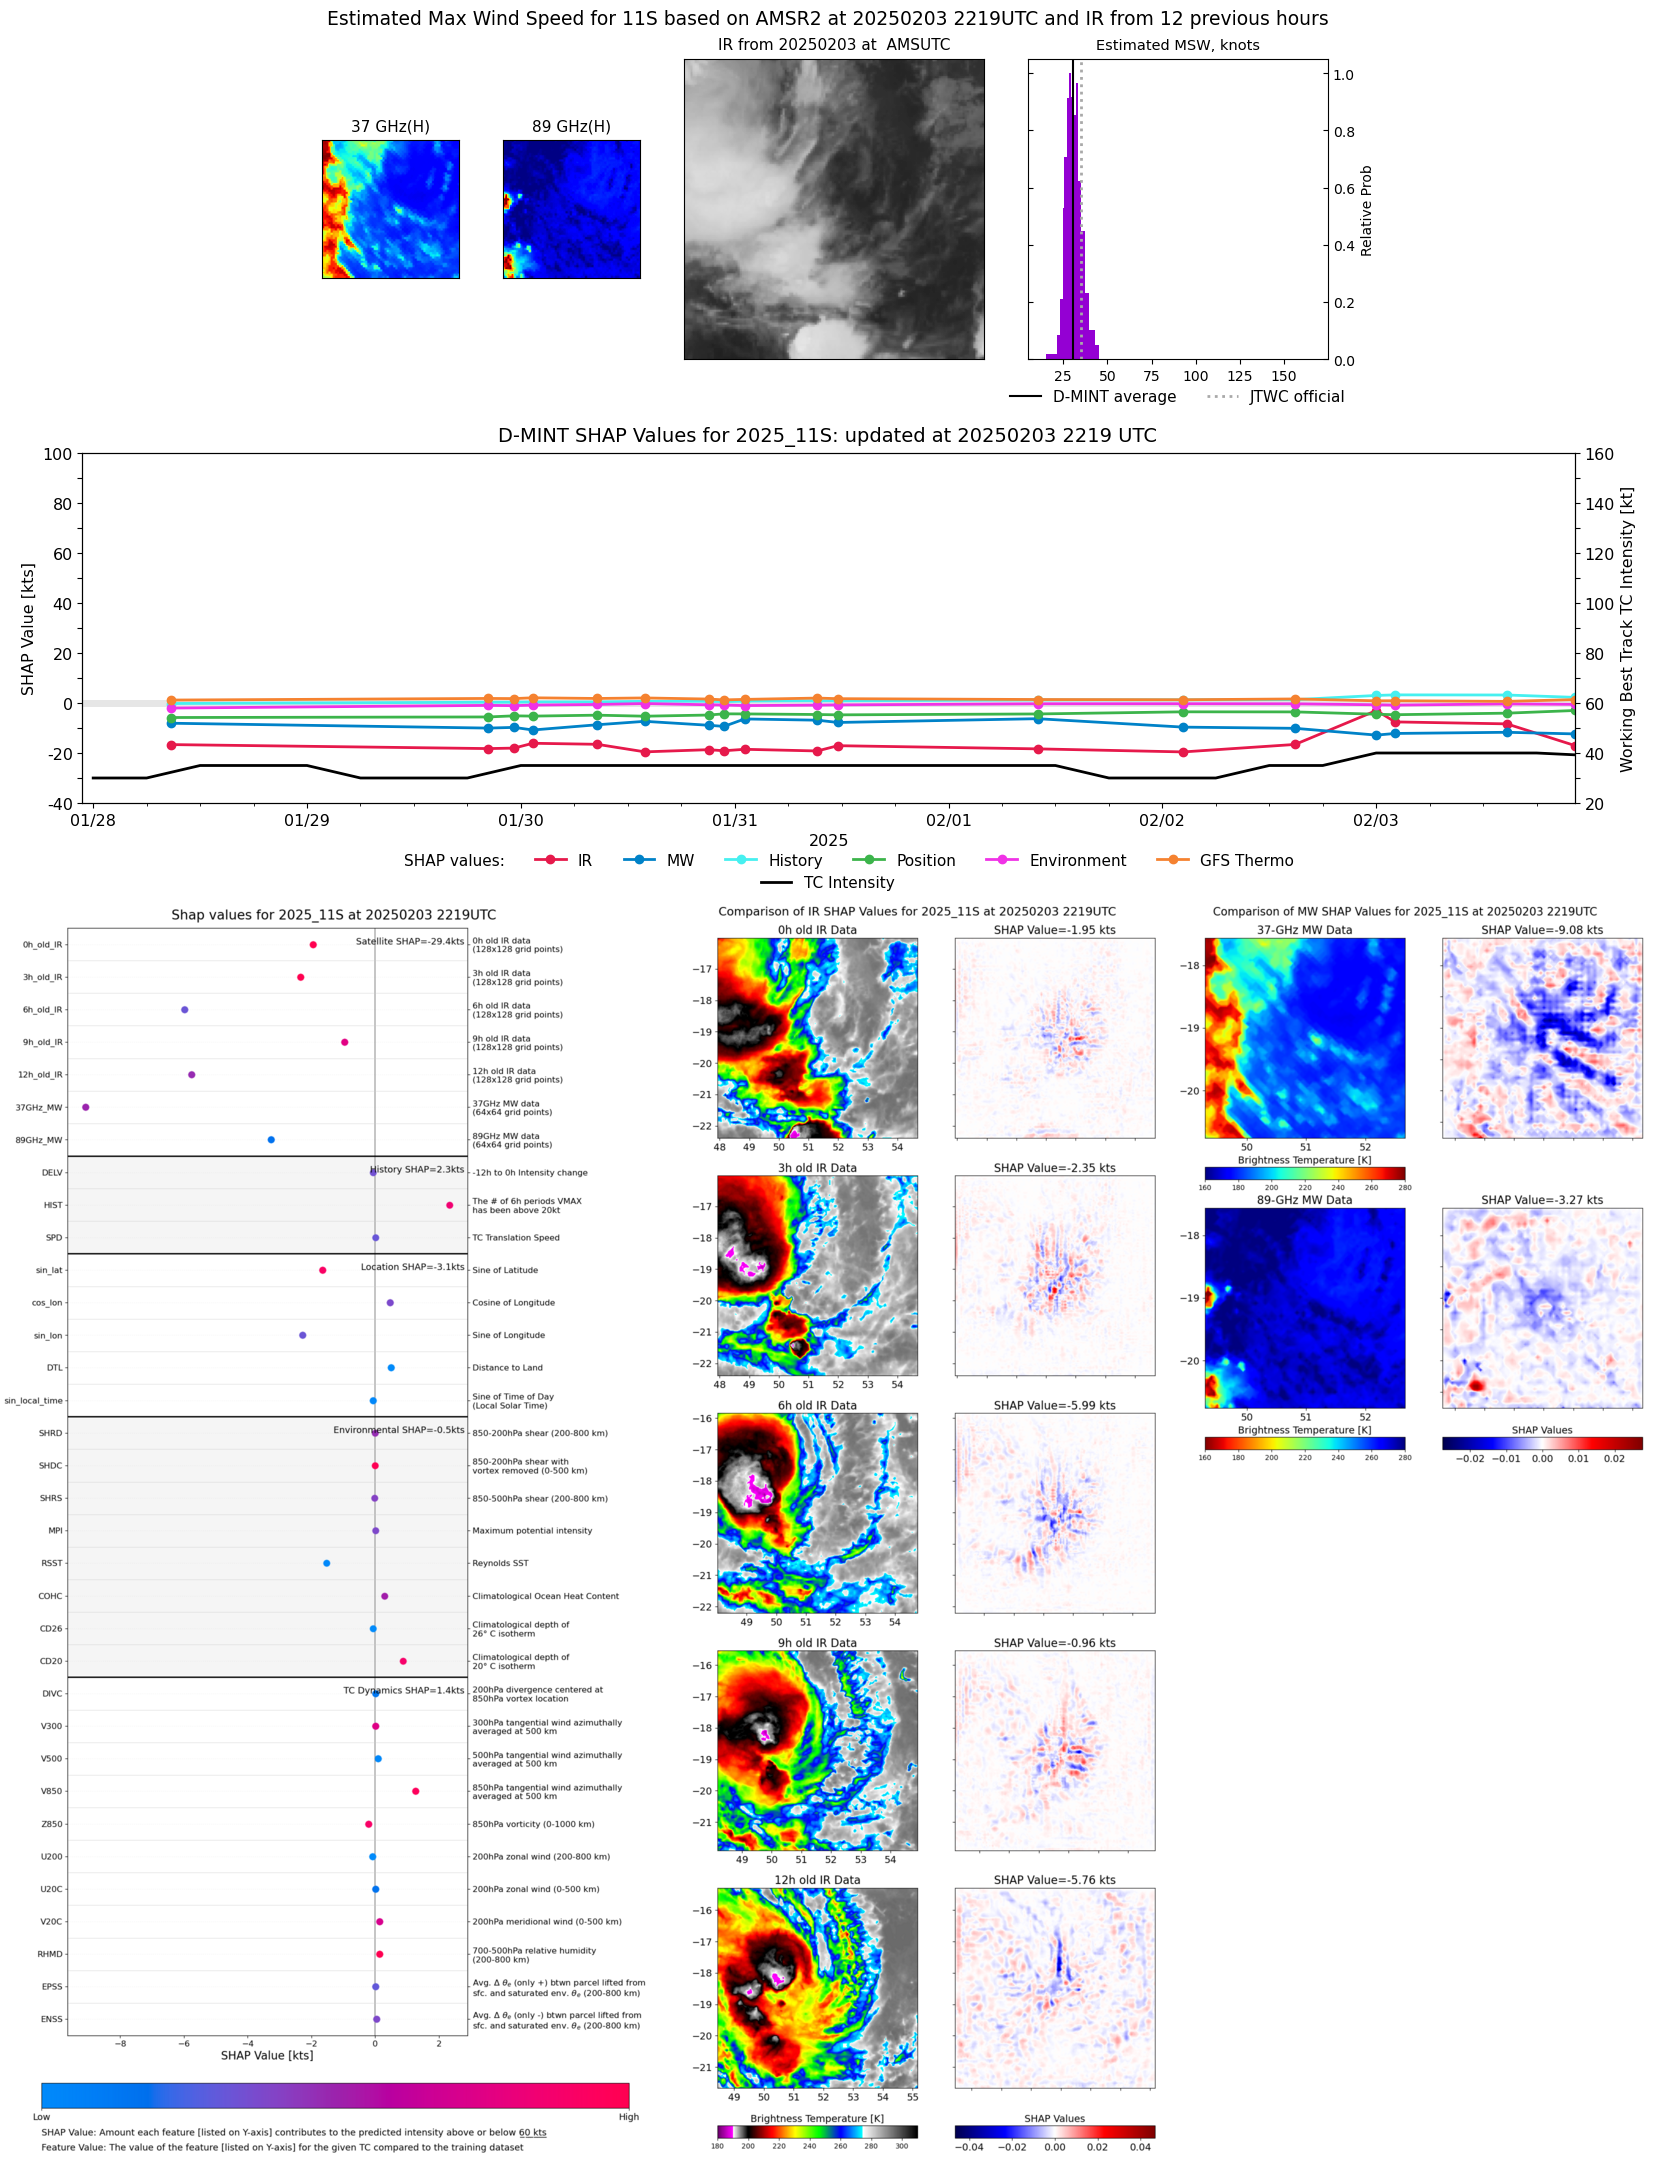 |
| 20250203 | 1516 UTC | SSMISF16 | 999 hPa | 41 kts | 35 kts | 48 kts |  |
| 20250203 | 1440 UTC | SSMISF17 | 997 hPa | 39 kts | 34 kts | 45 kts | 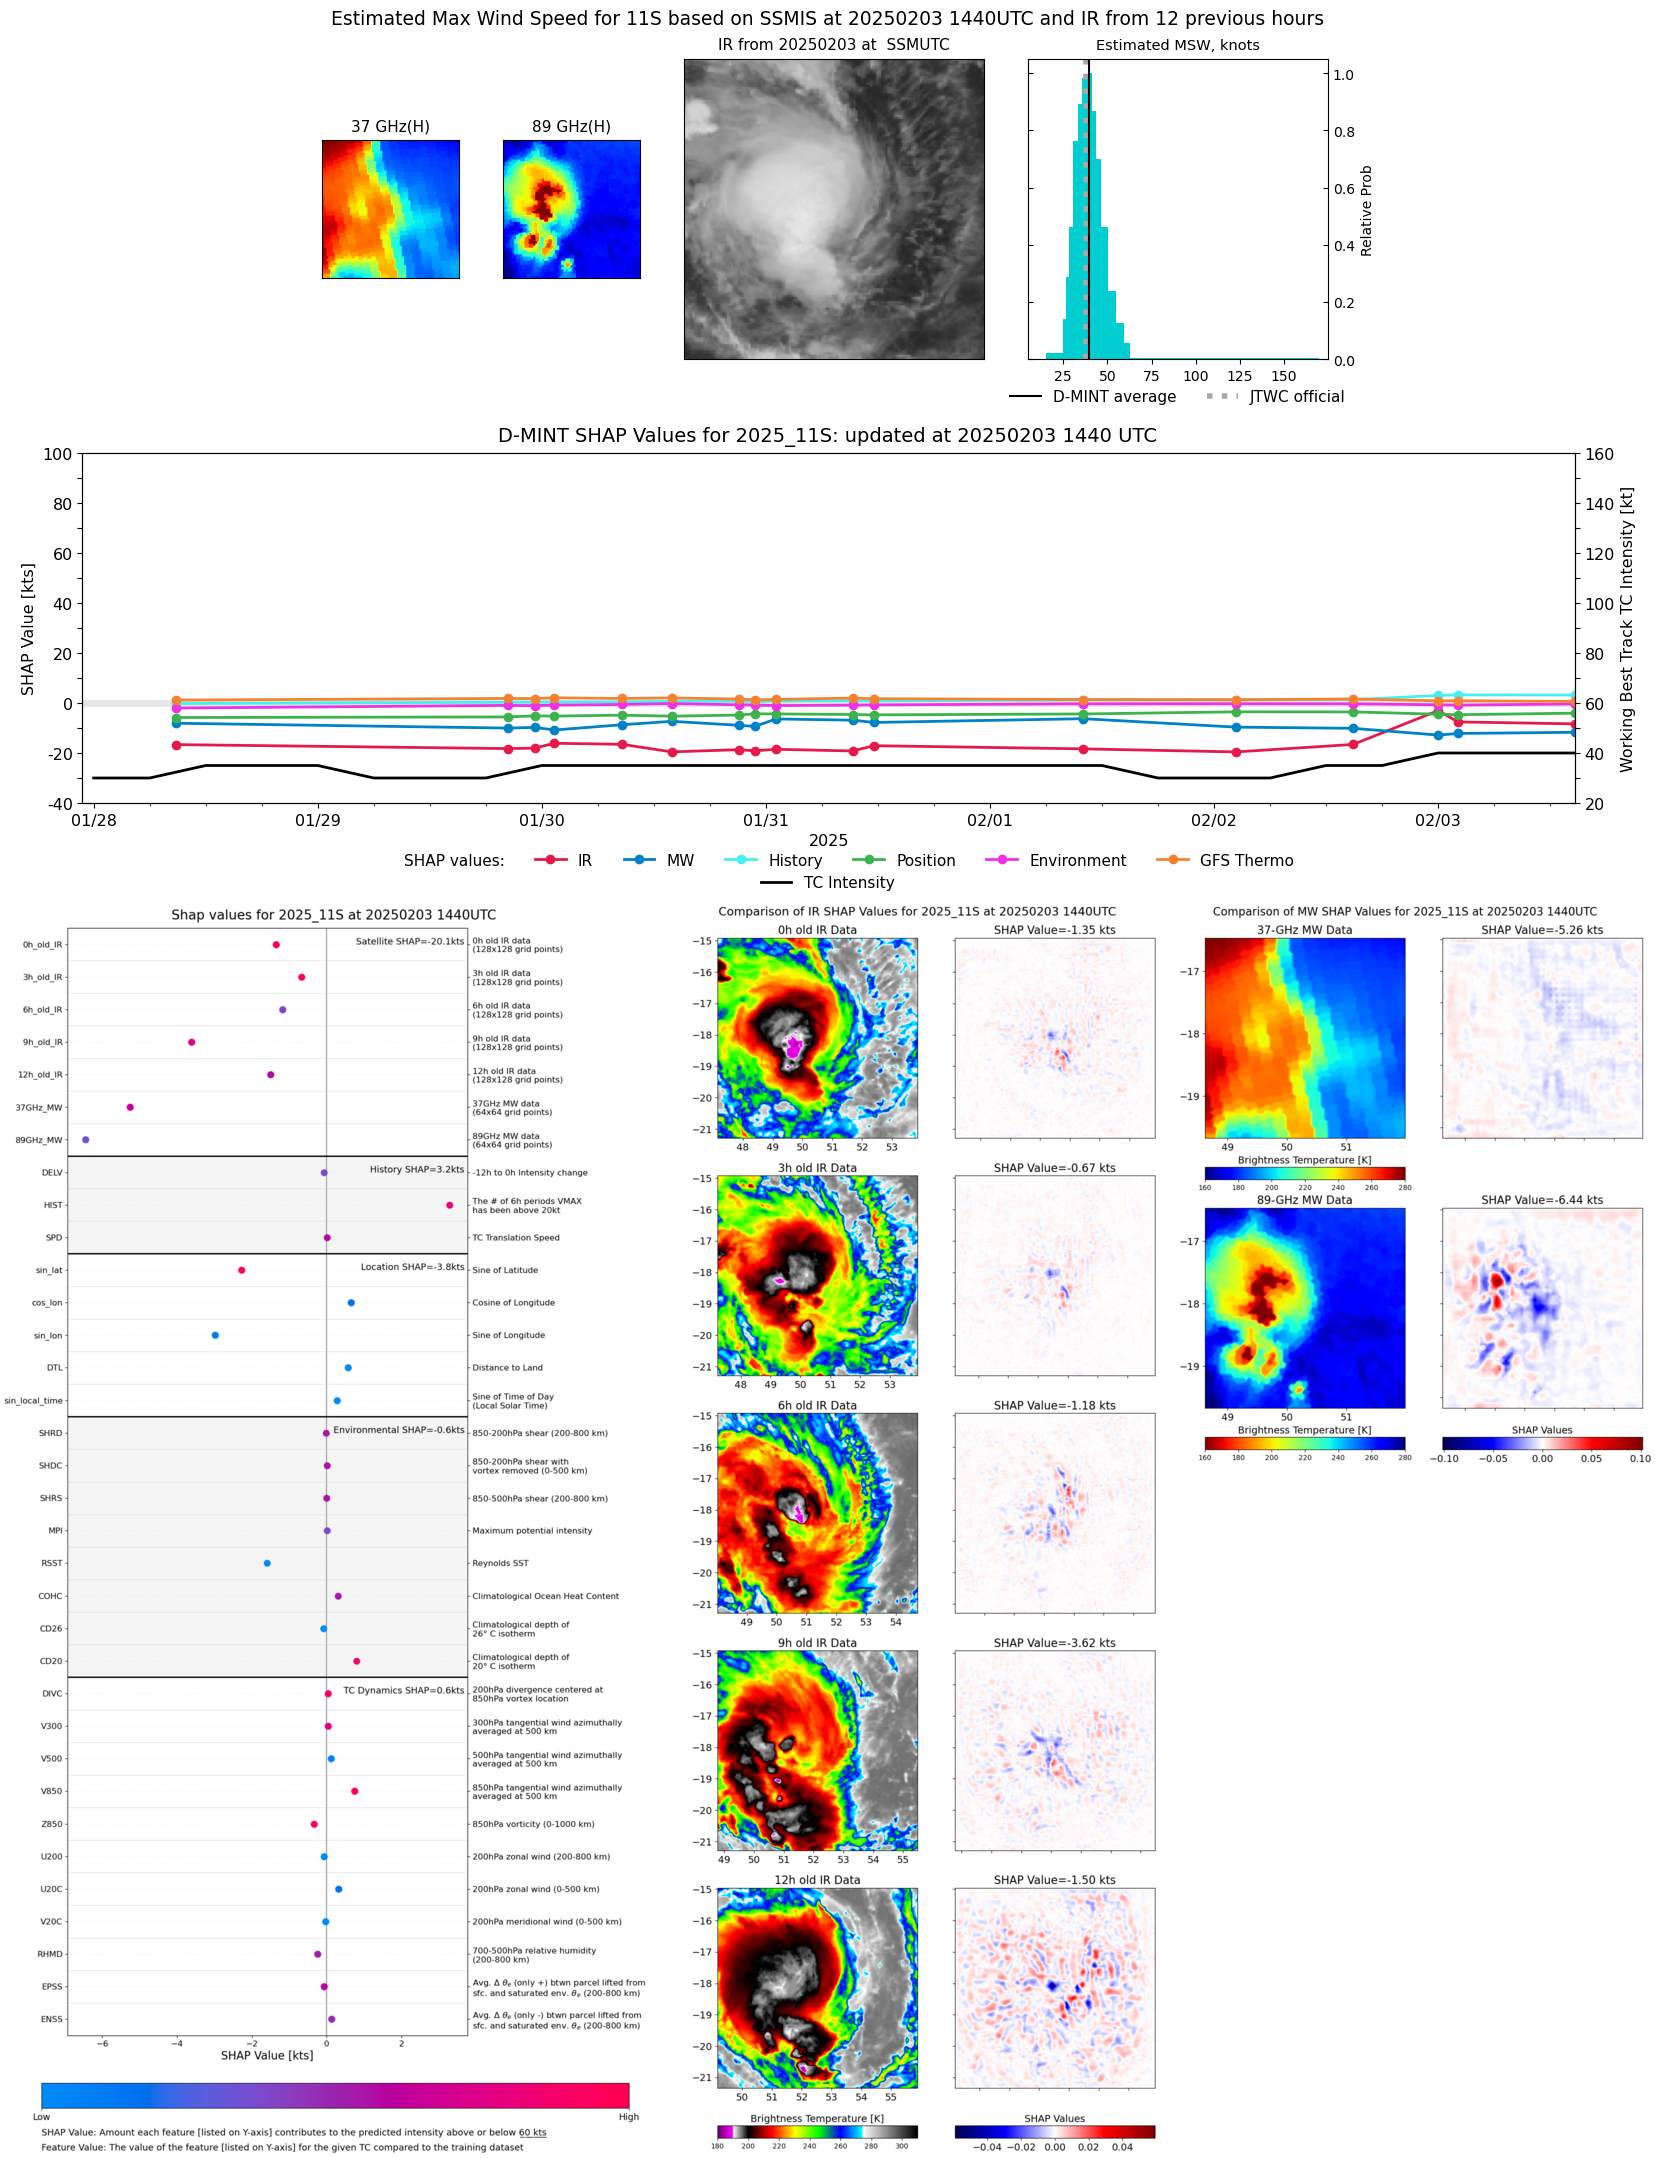 |
| 20250203 | 1235 UTC | SSMISF18 | NaN hPa | 36 kts | 30 kts | 42 kts |  |
| 20250203 | 1138 UTC | TROPICS05 | 998 hPa | 34 kts | 30 kts | 40 kts | 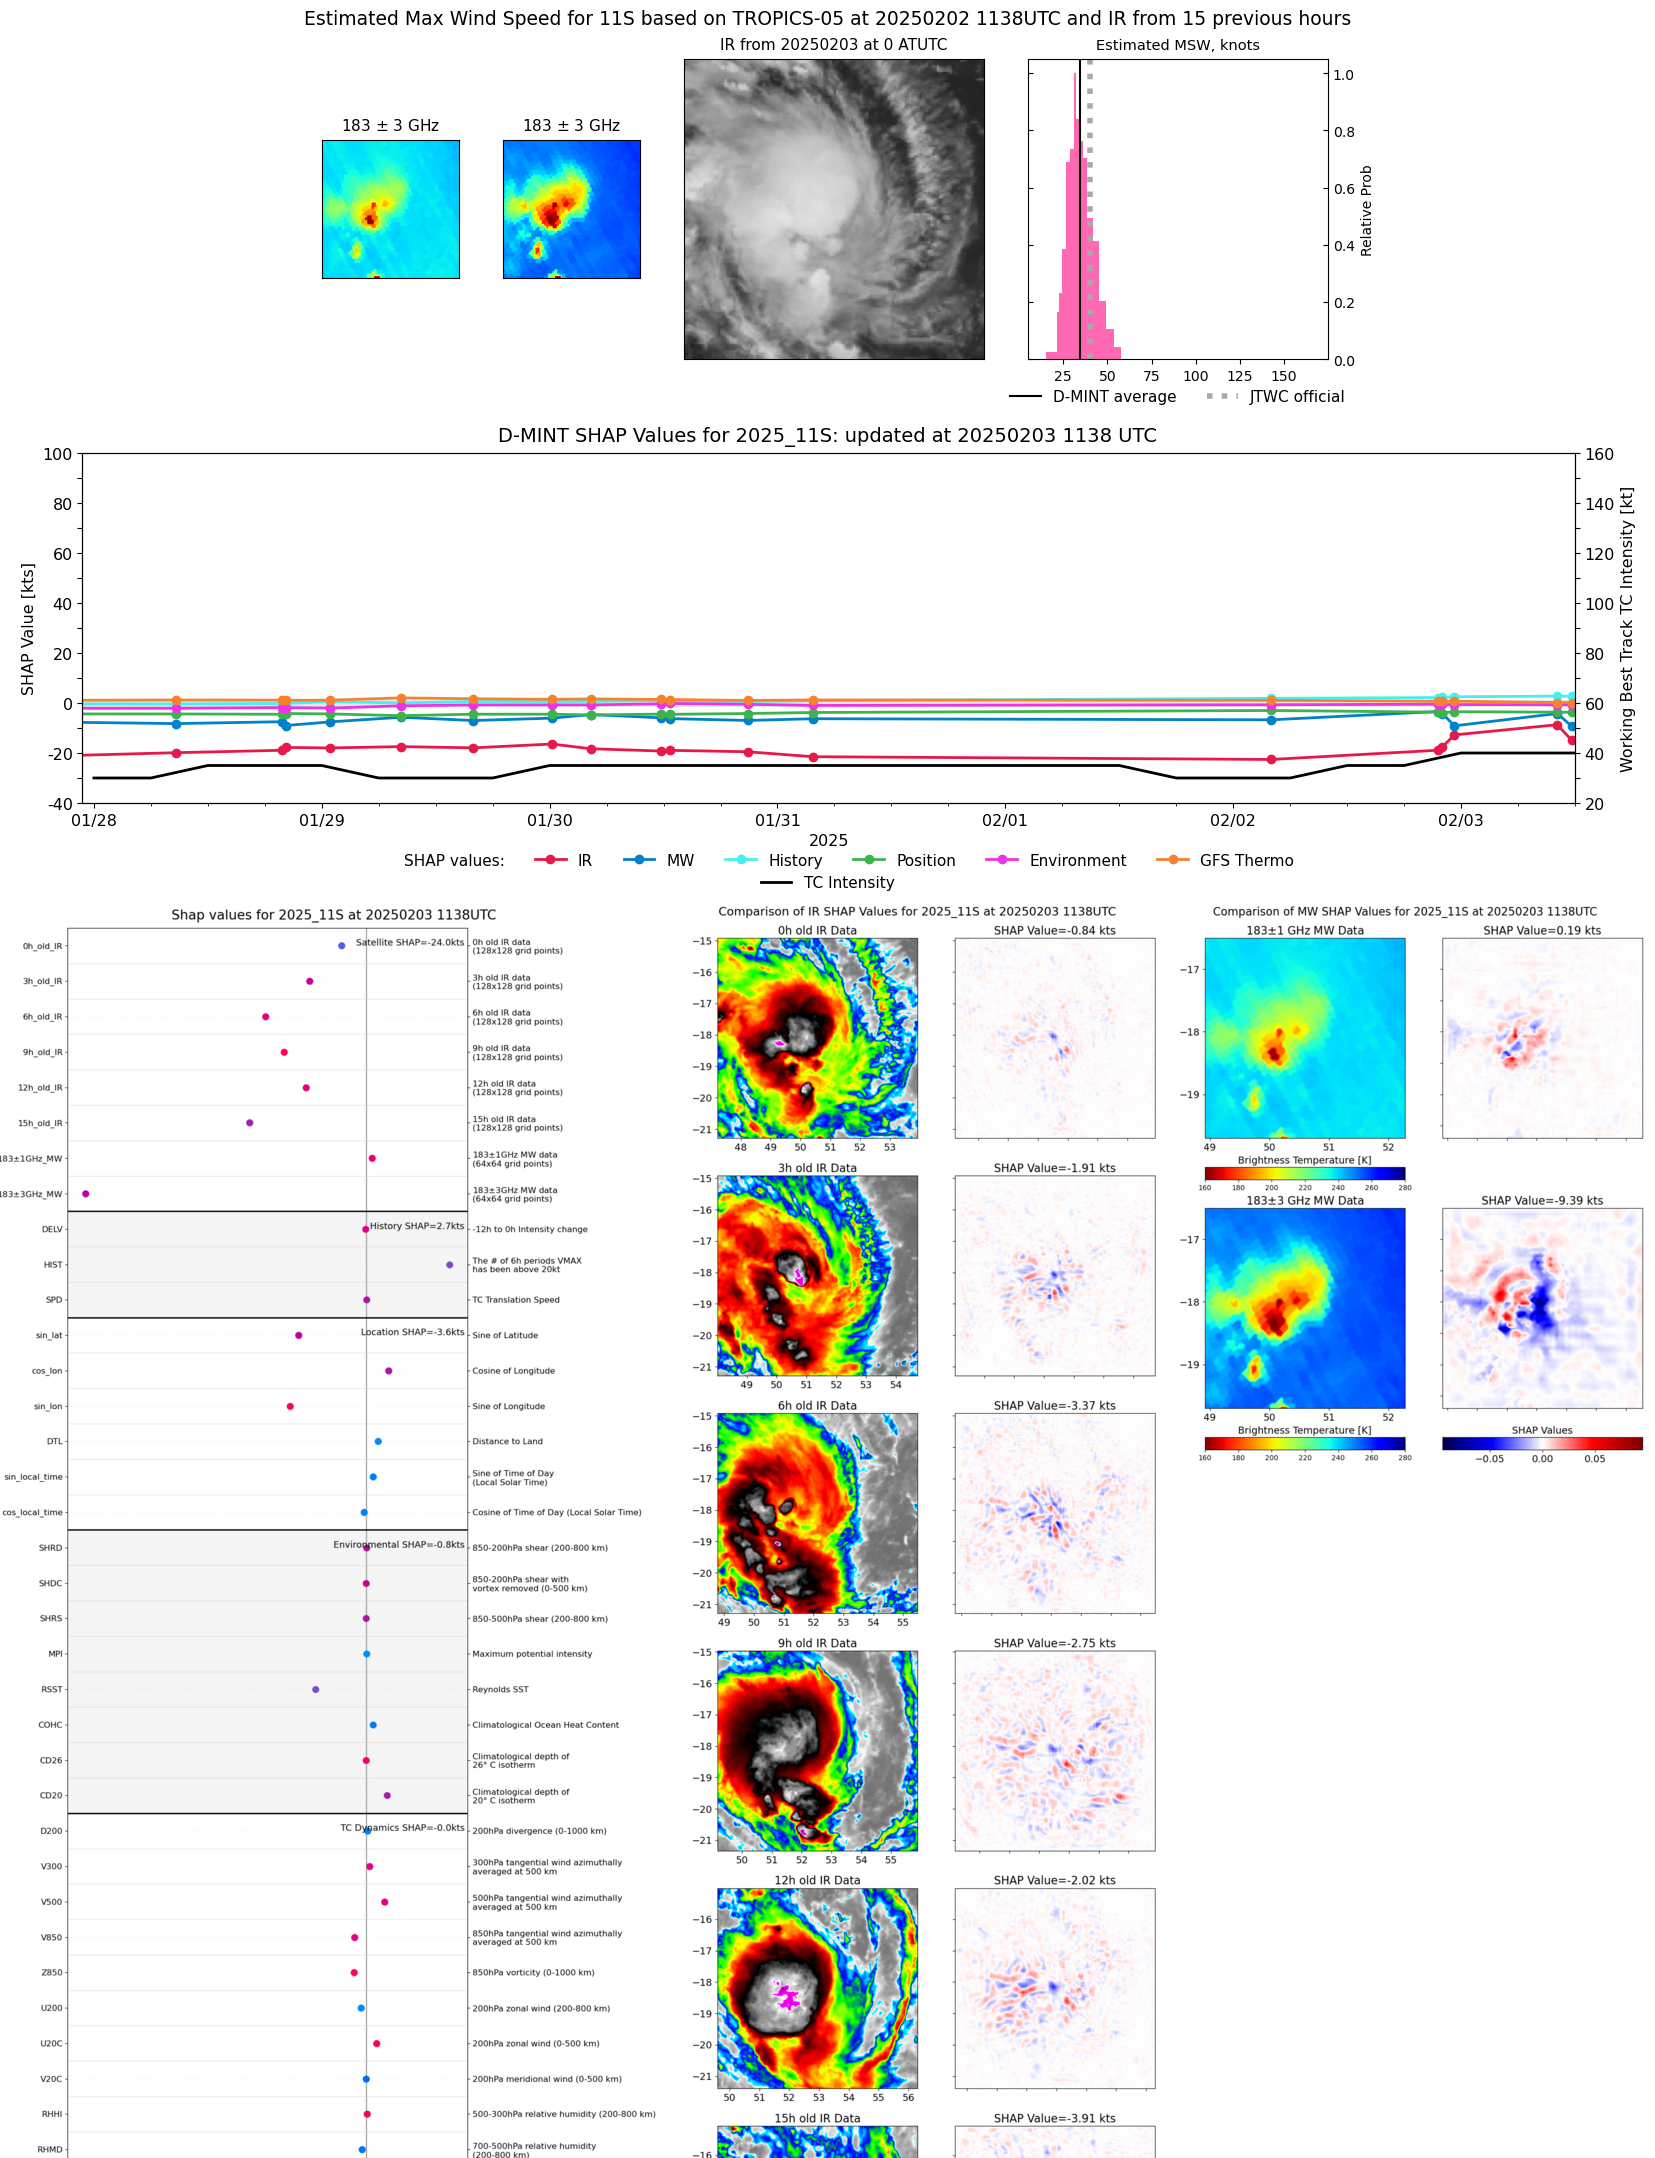 |
| 20250203 | 1008 UTC | ATMS-N20 | 989 hPa | 46 kts | 40 kts | 52 kts | 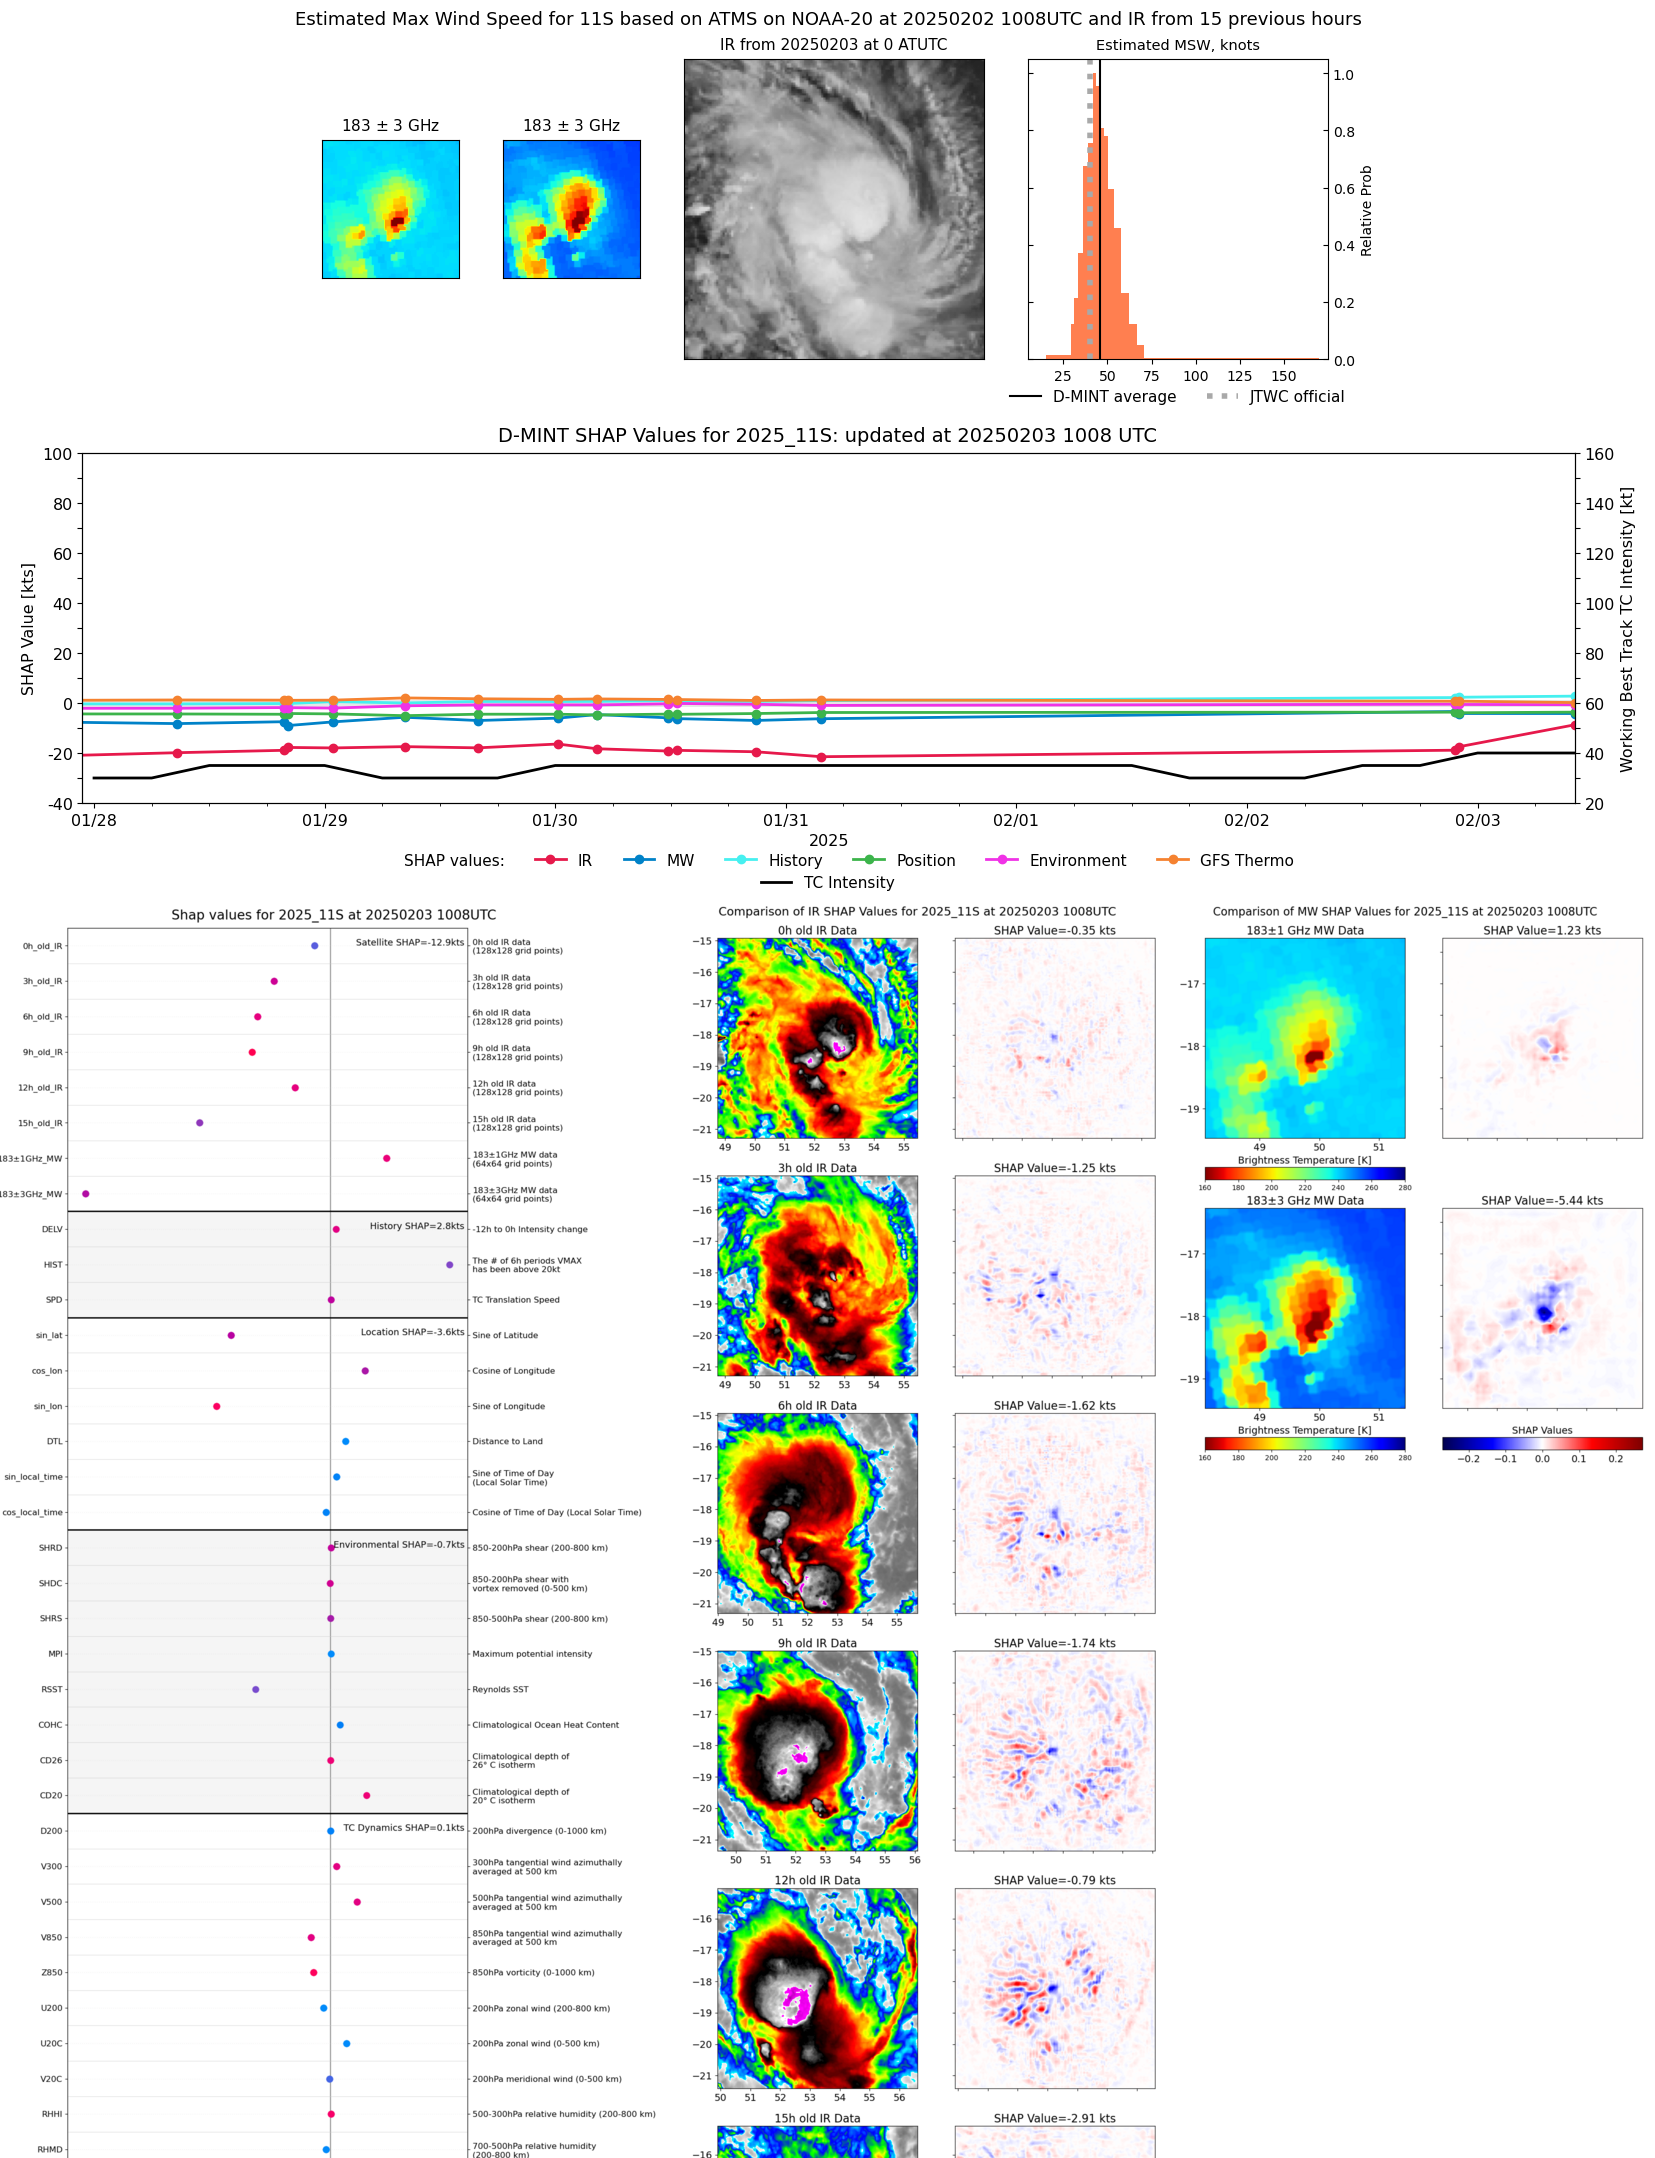 |
| 20250203 | 0242 UTC | SSMISF16 | 994 hPa | 42 kts | 36 kts | 49 kts |  |
| 20250203 | 0207 UTC | SSMISF17 | 993 hPa | 39 kts | 33 kts | 45 kts | 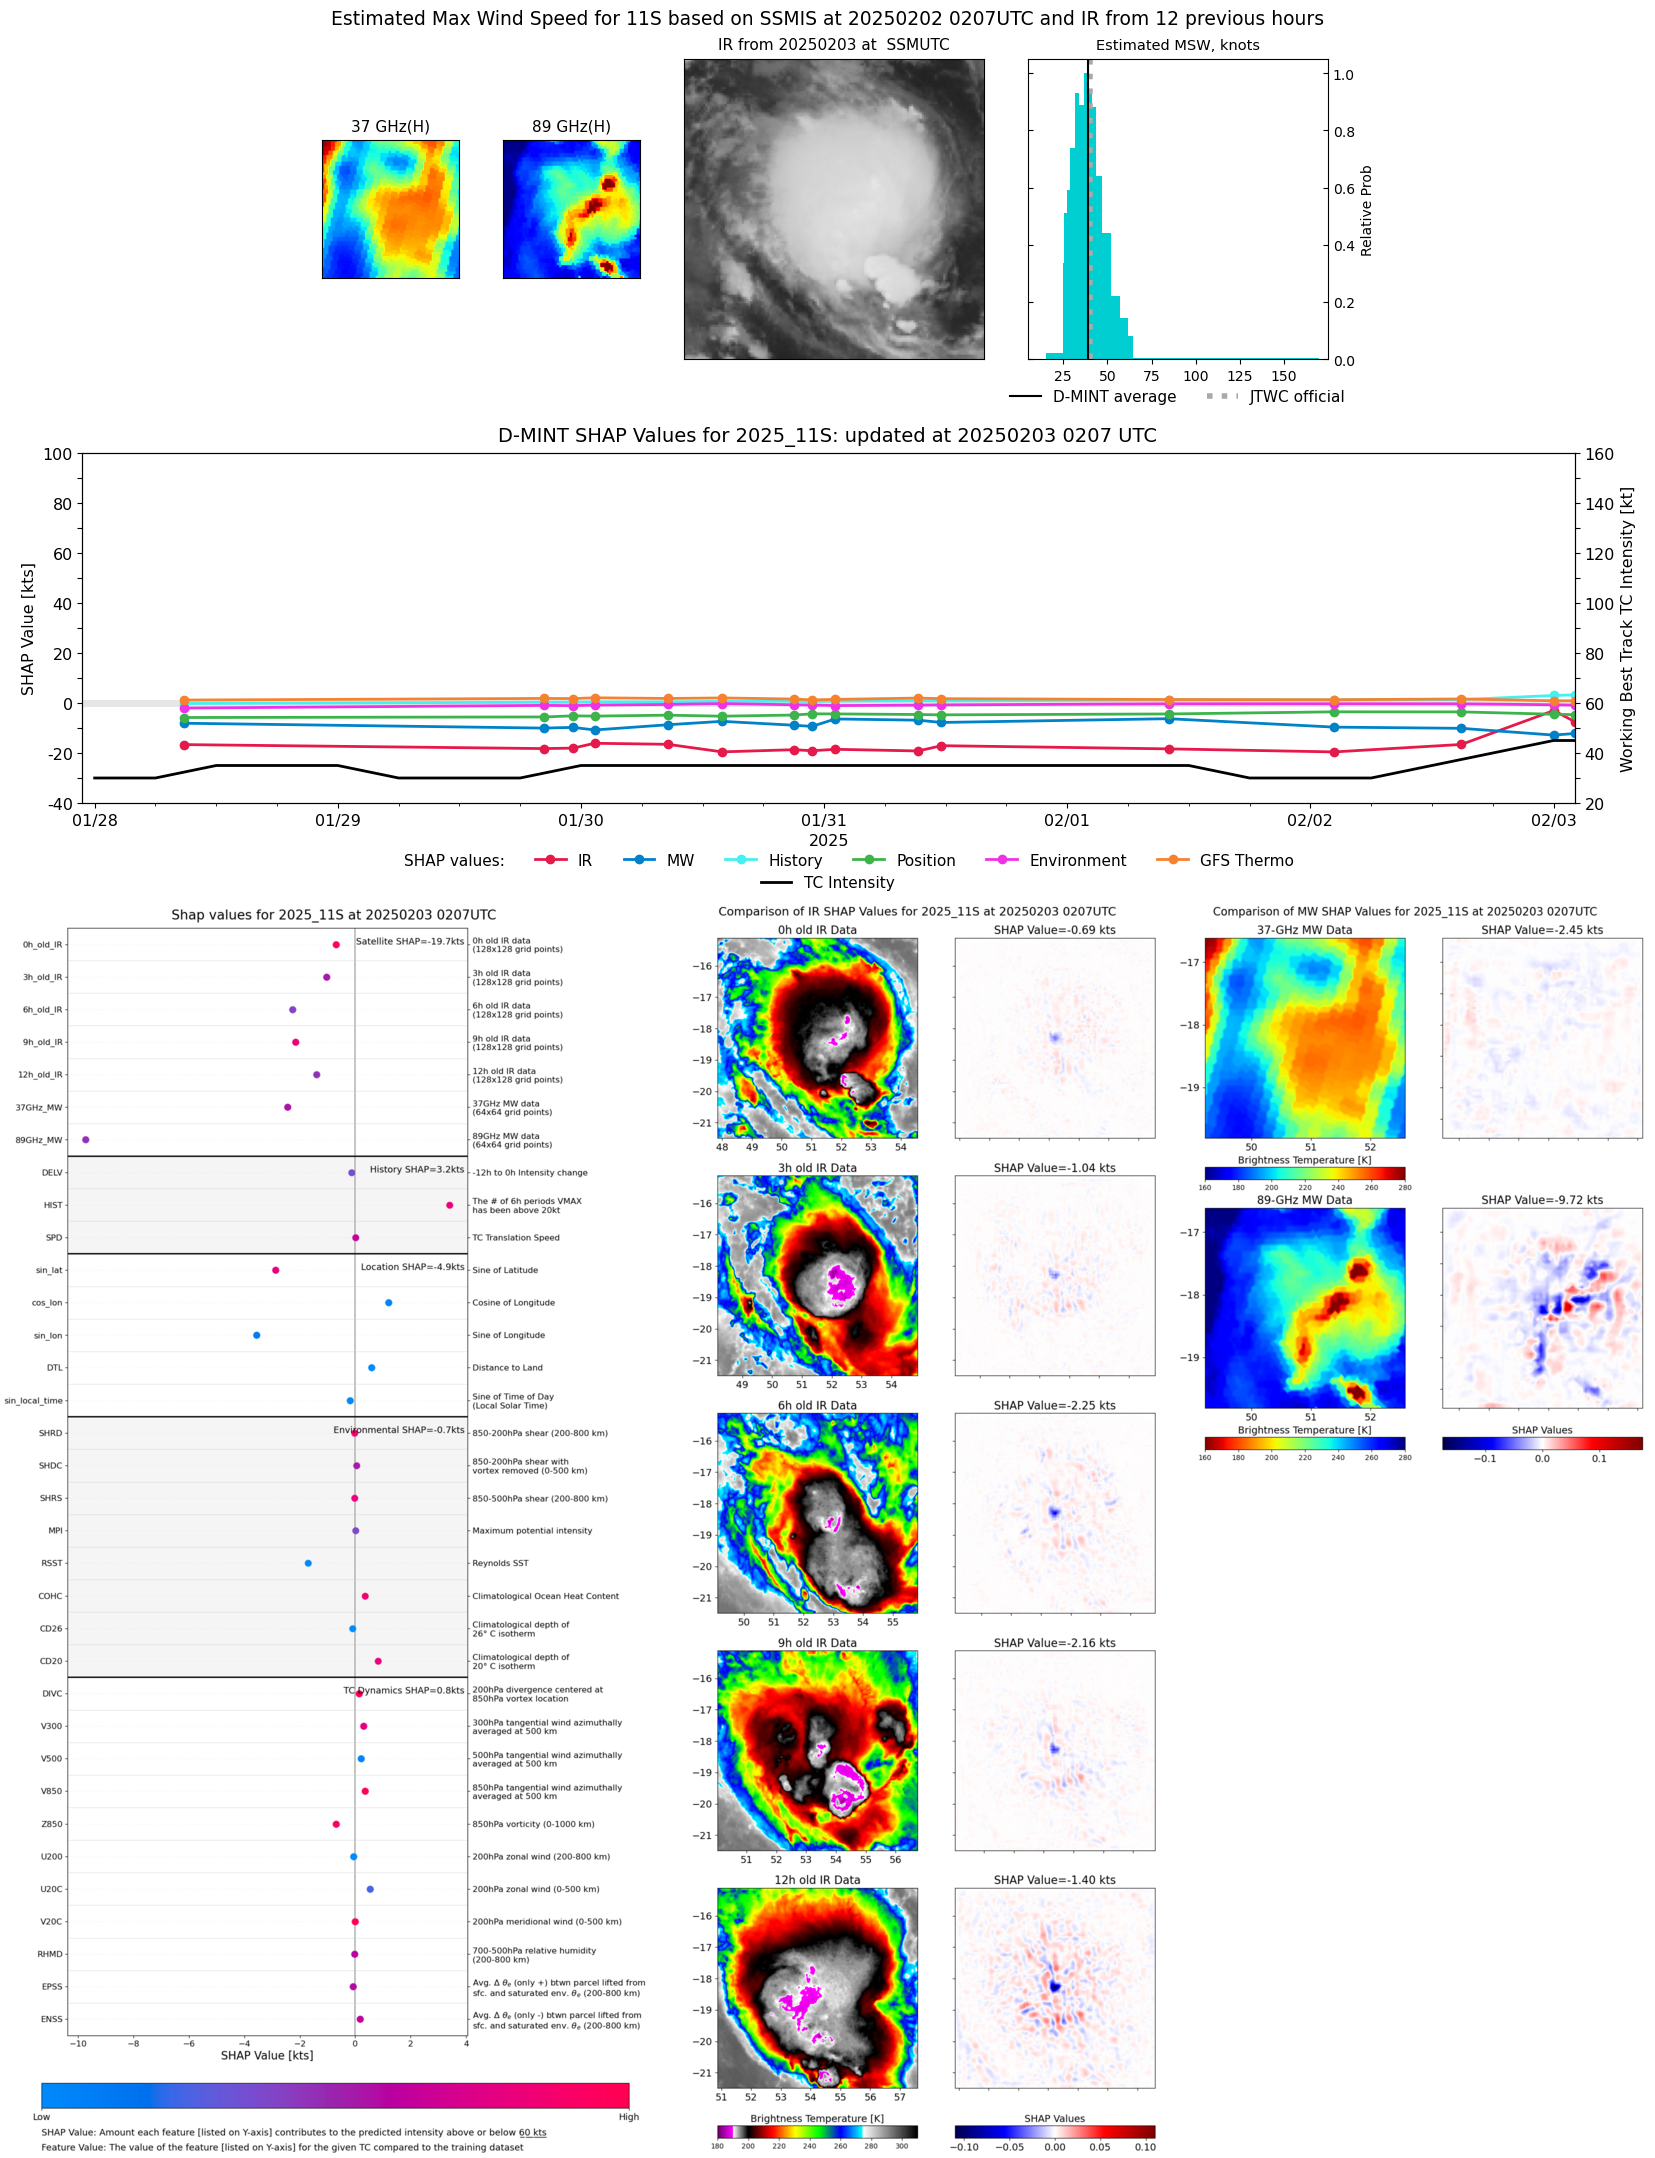 |
| 20250203 | 0002 UTC | SSMISF18 | 997 hPa | 43 kts | 37 kts | 49 kts | 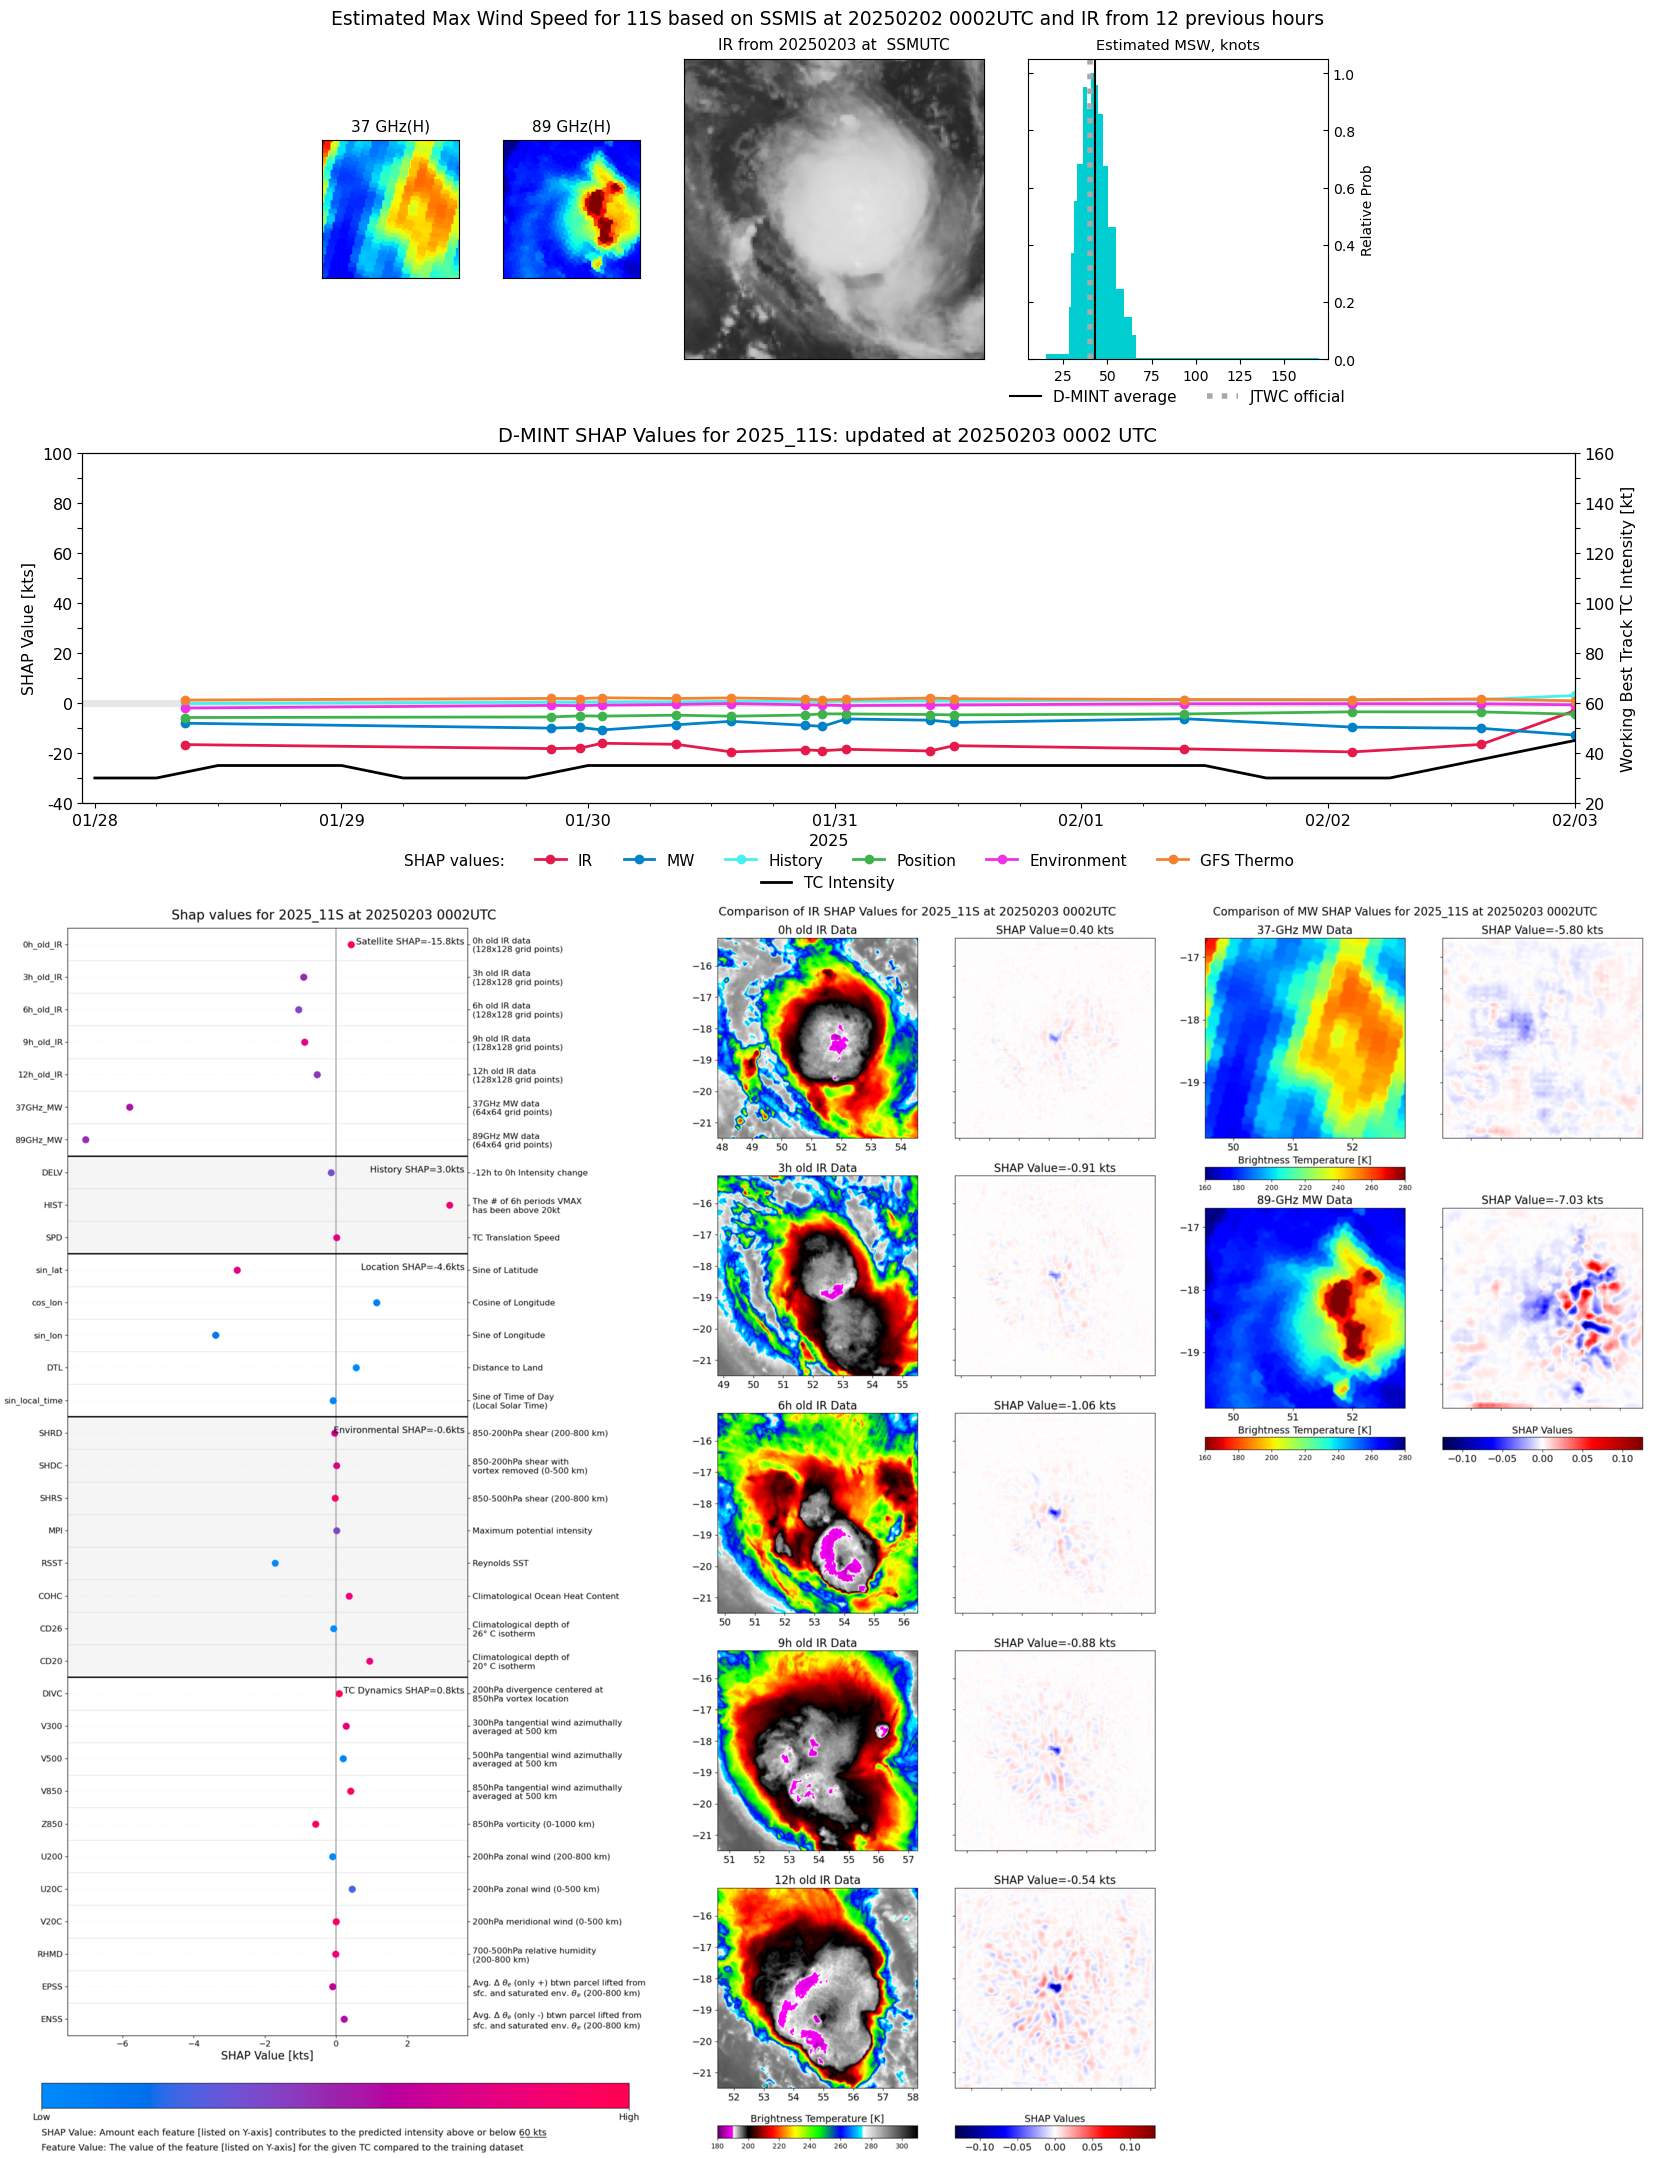 |
| 20250202 | 2318 UTC | TROPICS03 | 1000 hPa | 37 kts | 32 kts | 42 kts |  |
| 20250202 | 2202 UTC | ATMS-N20 | 996 hPa | 37 kts | 32 kts | 42 kts | 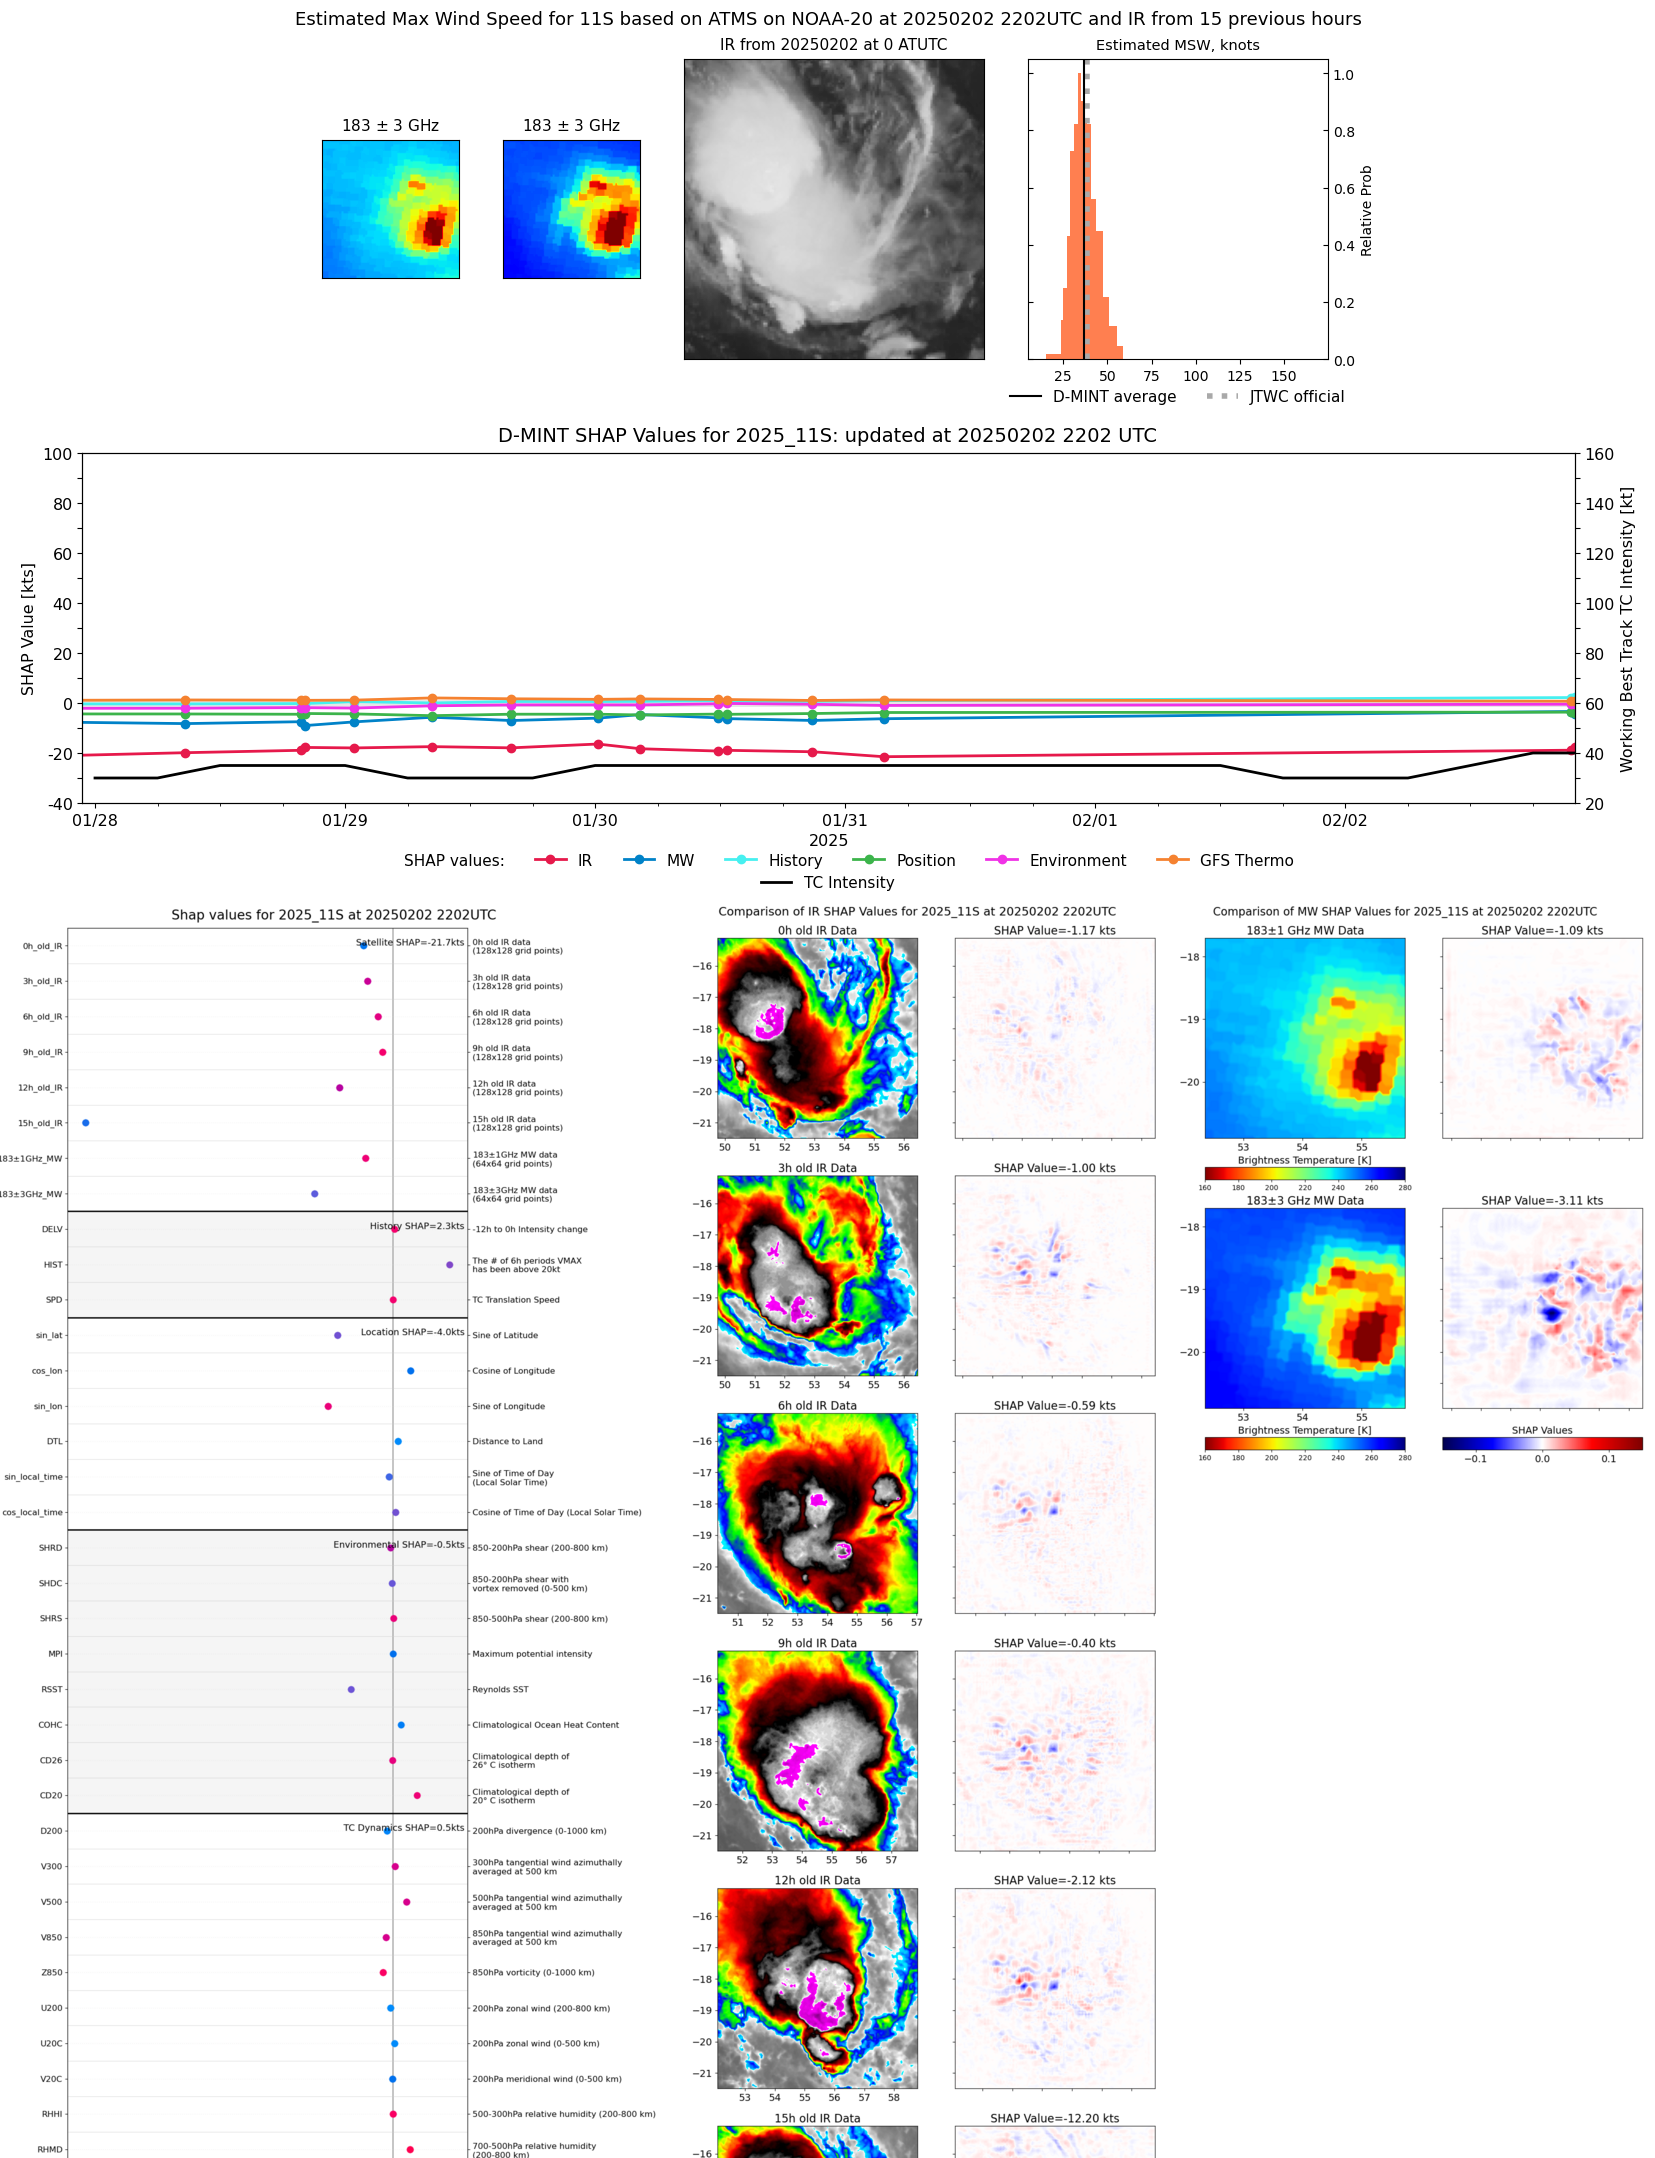 |
| 20250202 | 2137 UTC | ATMS-N20 | 995 hPa | 36 kts | 32 kts | 42 kts | 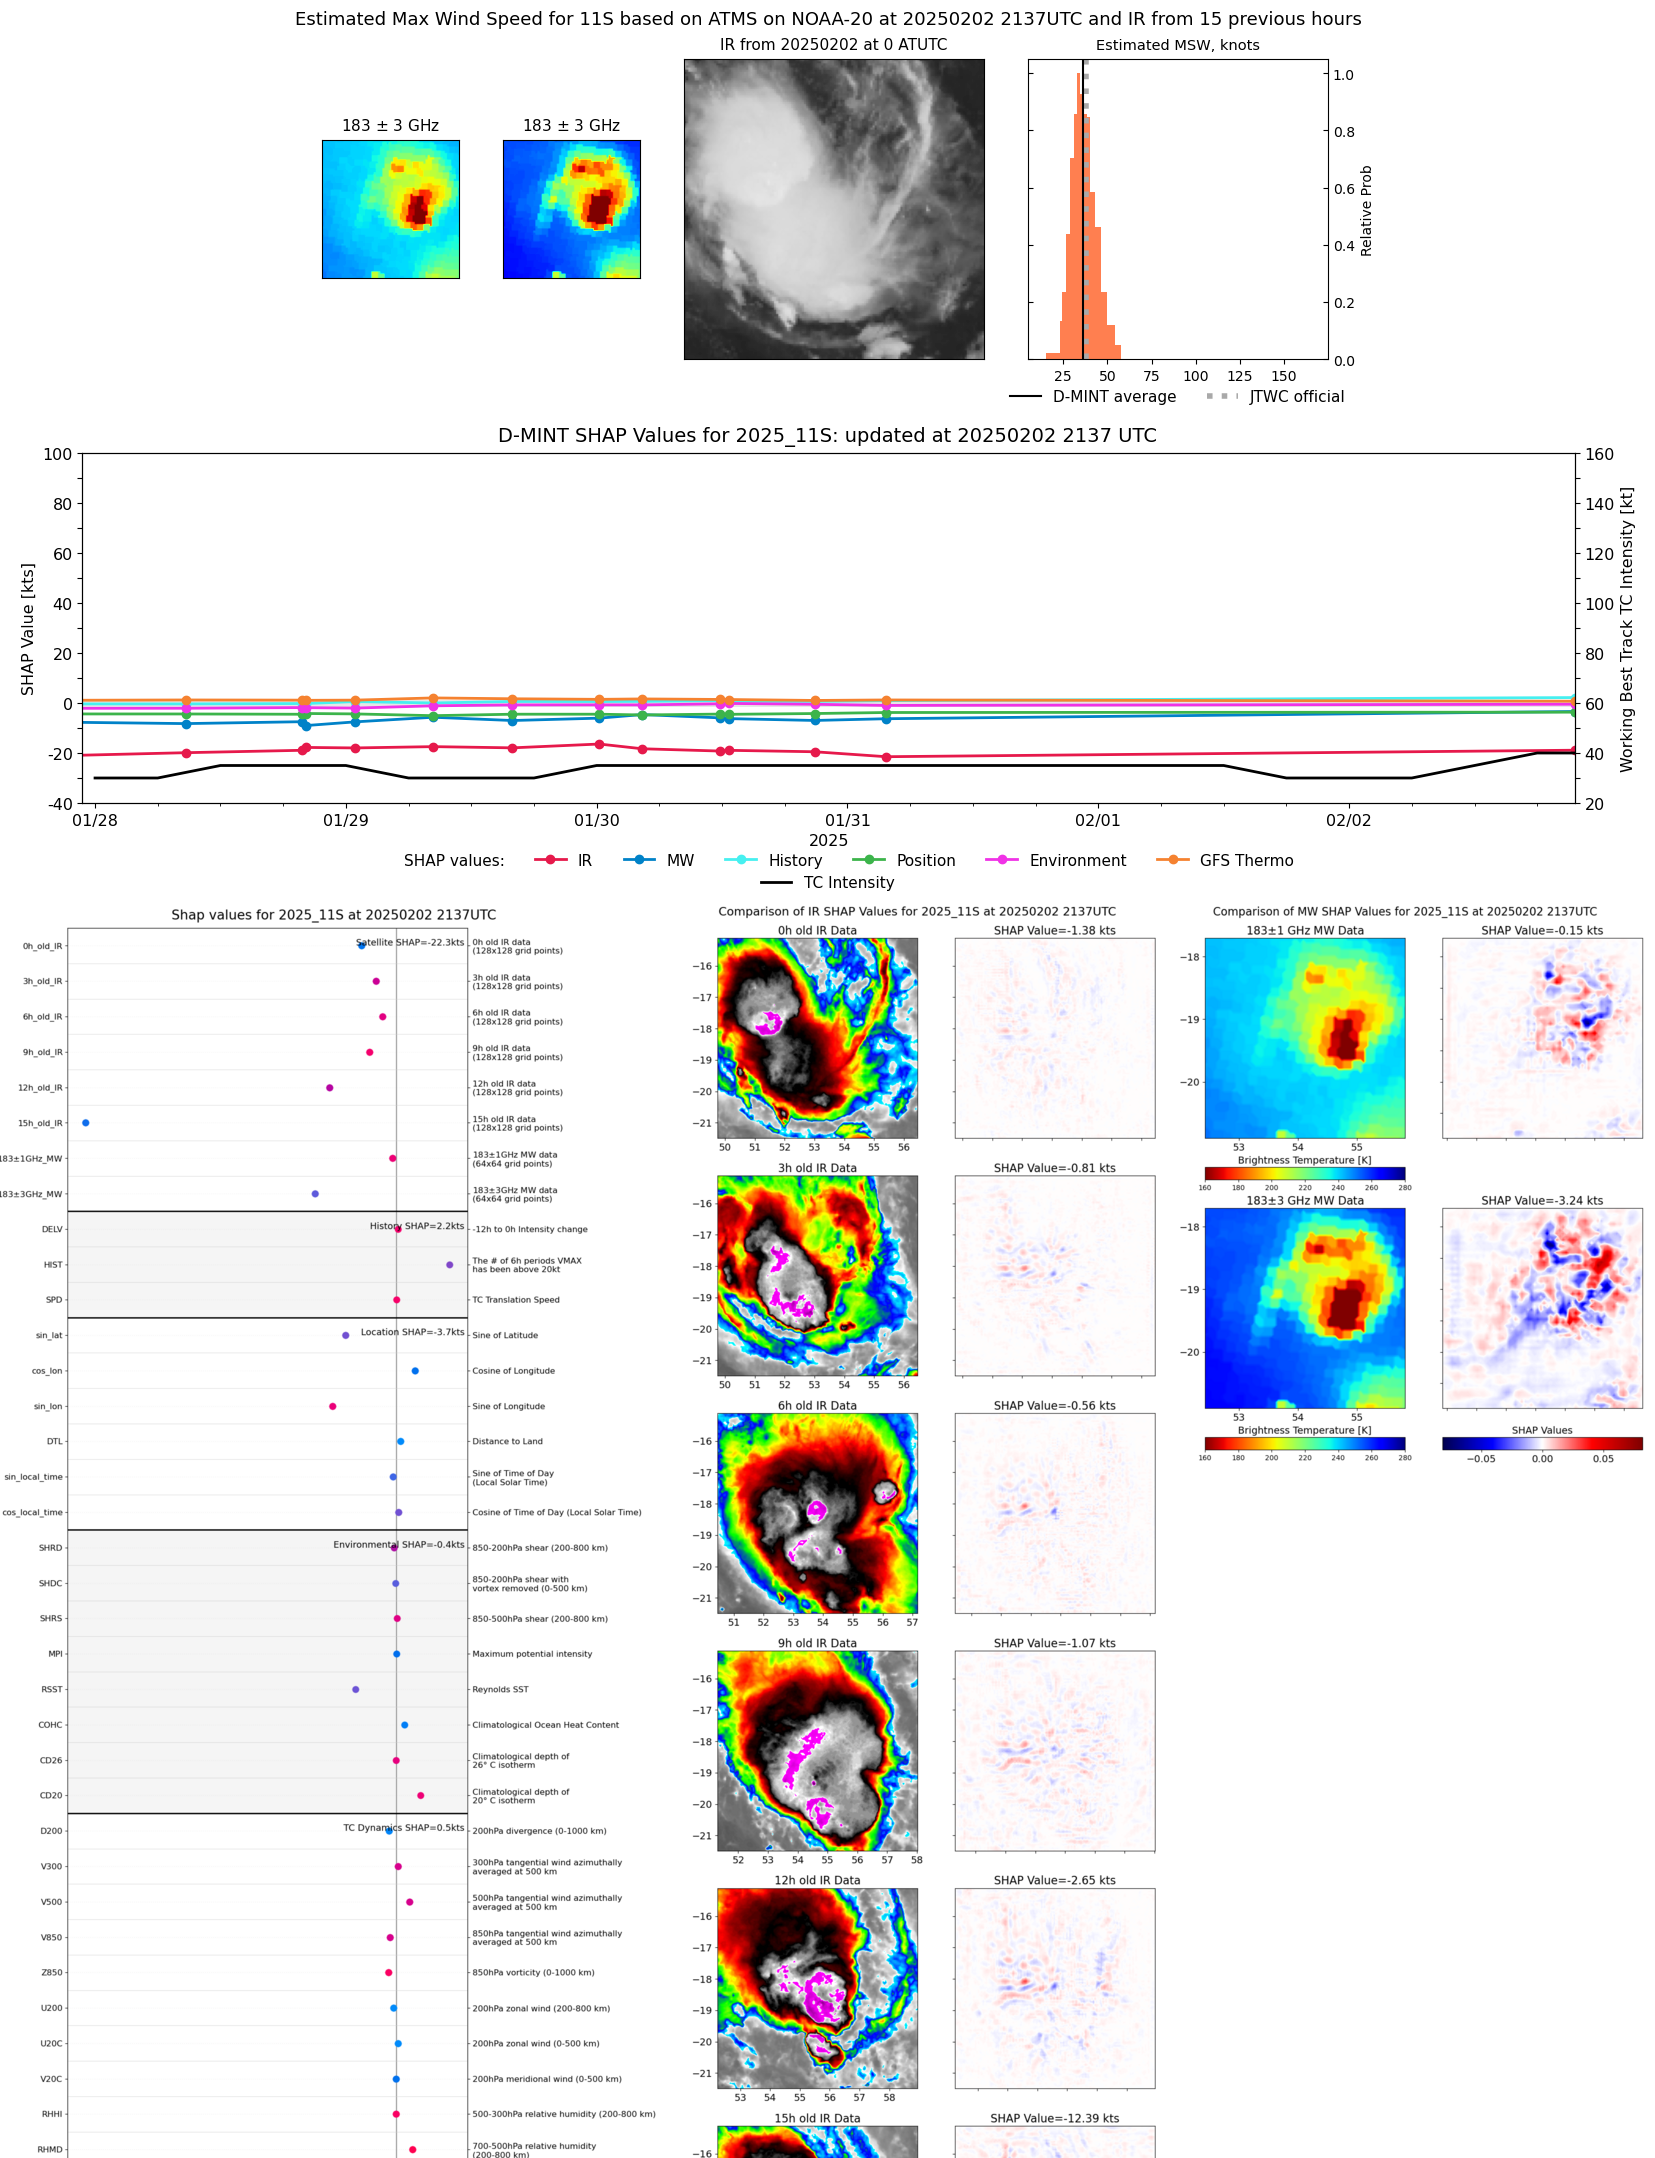 |
| 20250202 | 2136 UTC | AMSR2 | 1001 hPa | 31 kts | 28 kts | 34 kts | 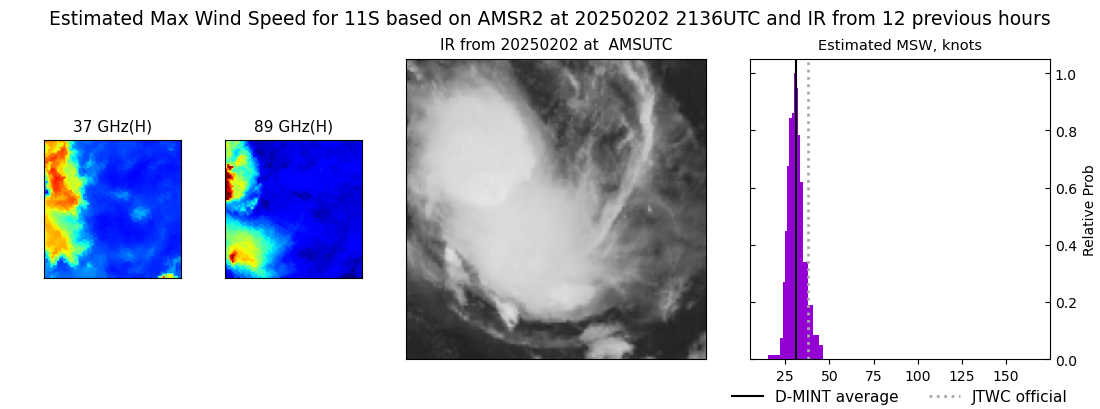 |
| 20250202 | 1454 UTC | SSMISF17 | 1005 hPa | 33 kts | 30 kts | 36 kts | 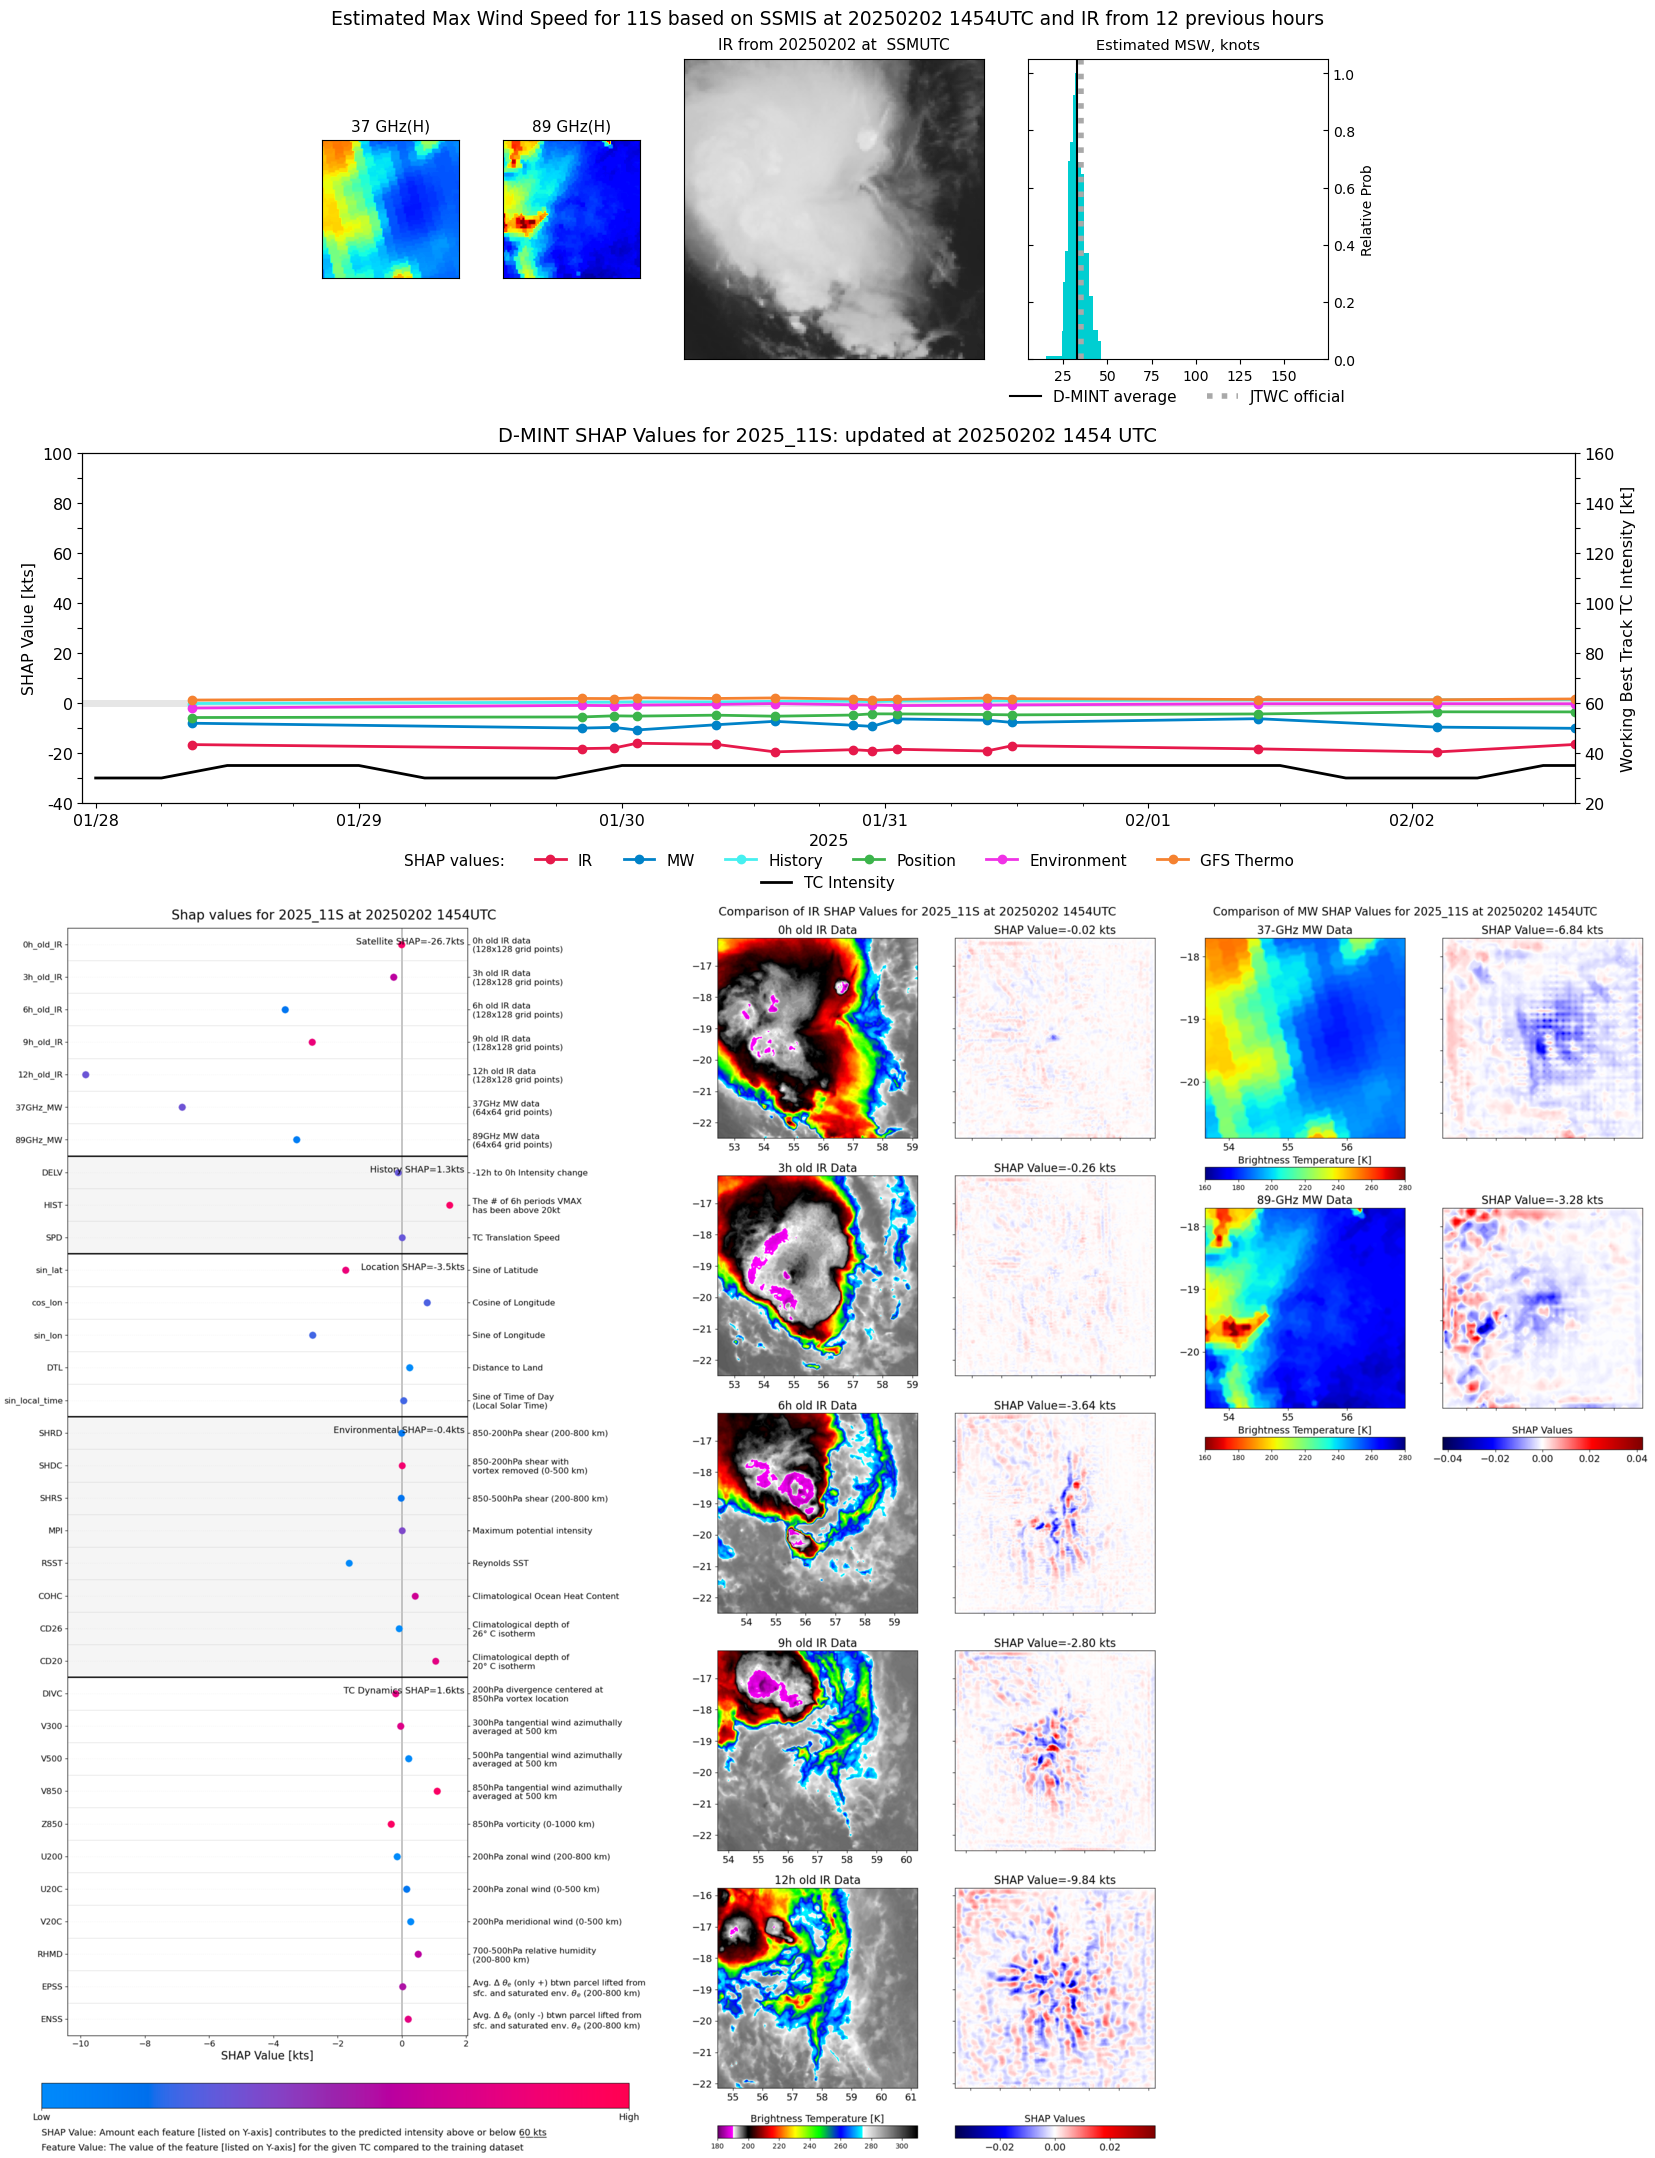 |
| 20250202 | 1113 UTC | TROPICS06 | 1000 hPa | 31 kts | 28 kts | 33 kts | 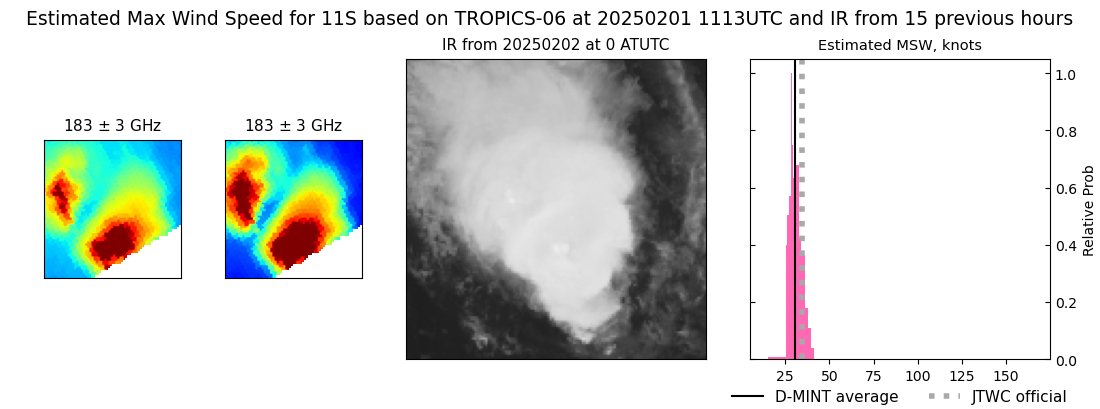 |
| 20250202 | 0401 UTC | TROPICS05 | 1002 hPa | 30 kts | 27 kts | 33 kts |  |
| 20250202 | 0221 UTC | SSMISF17 | 1000 hPa | 30 kts | 27 kts | 32 kts | 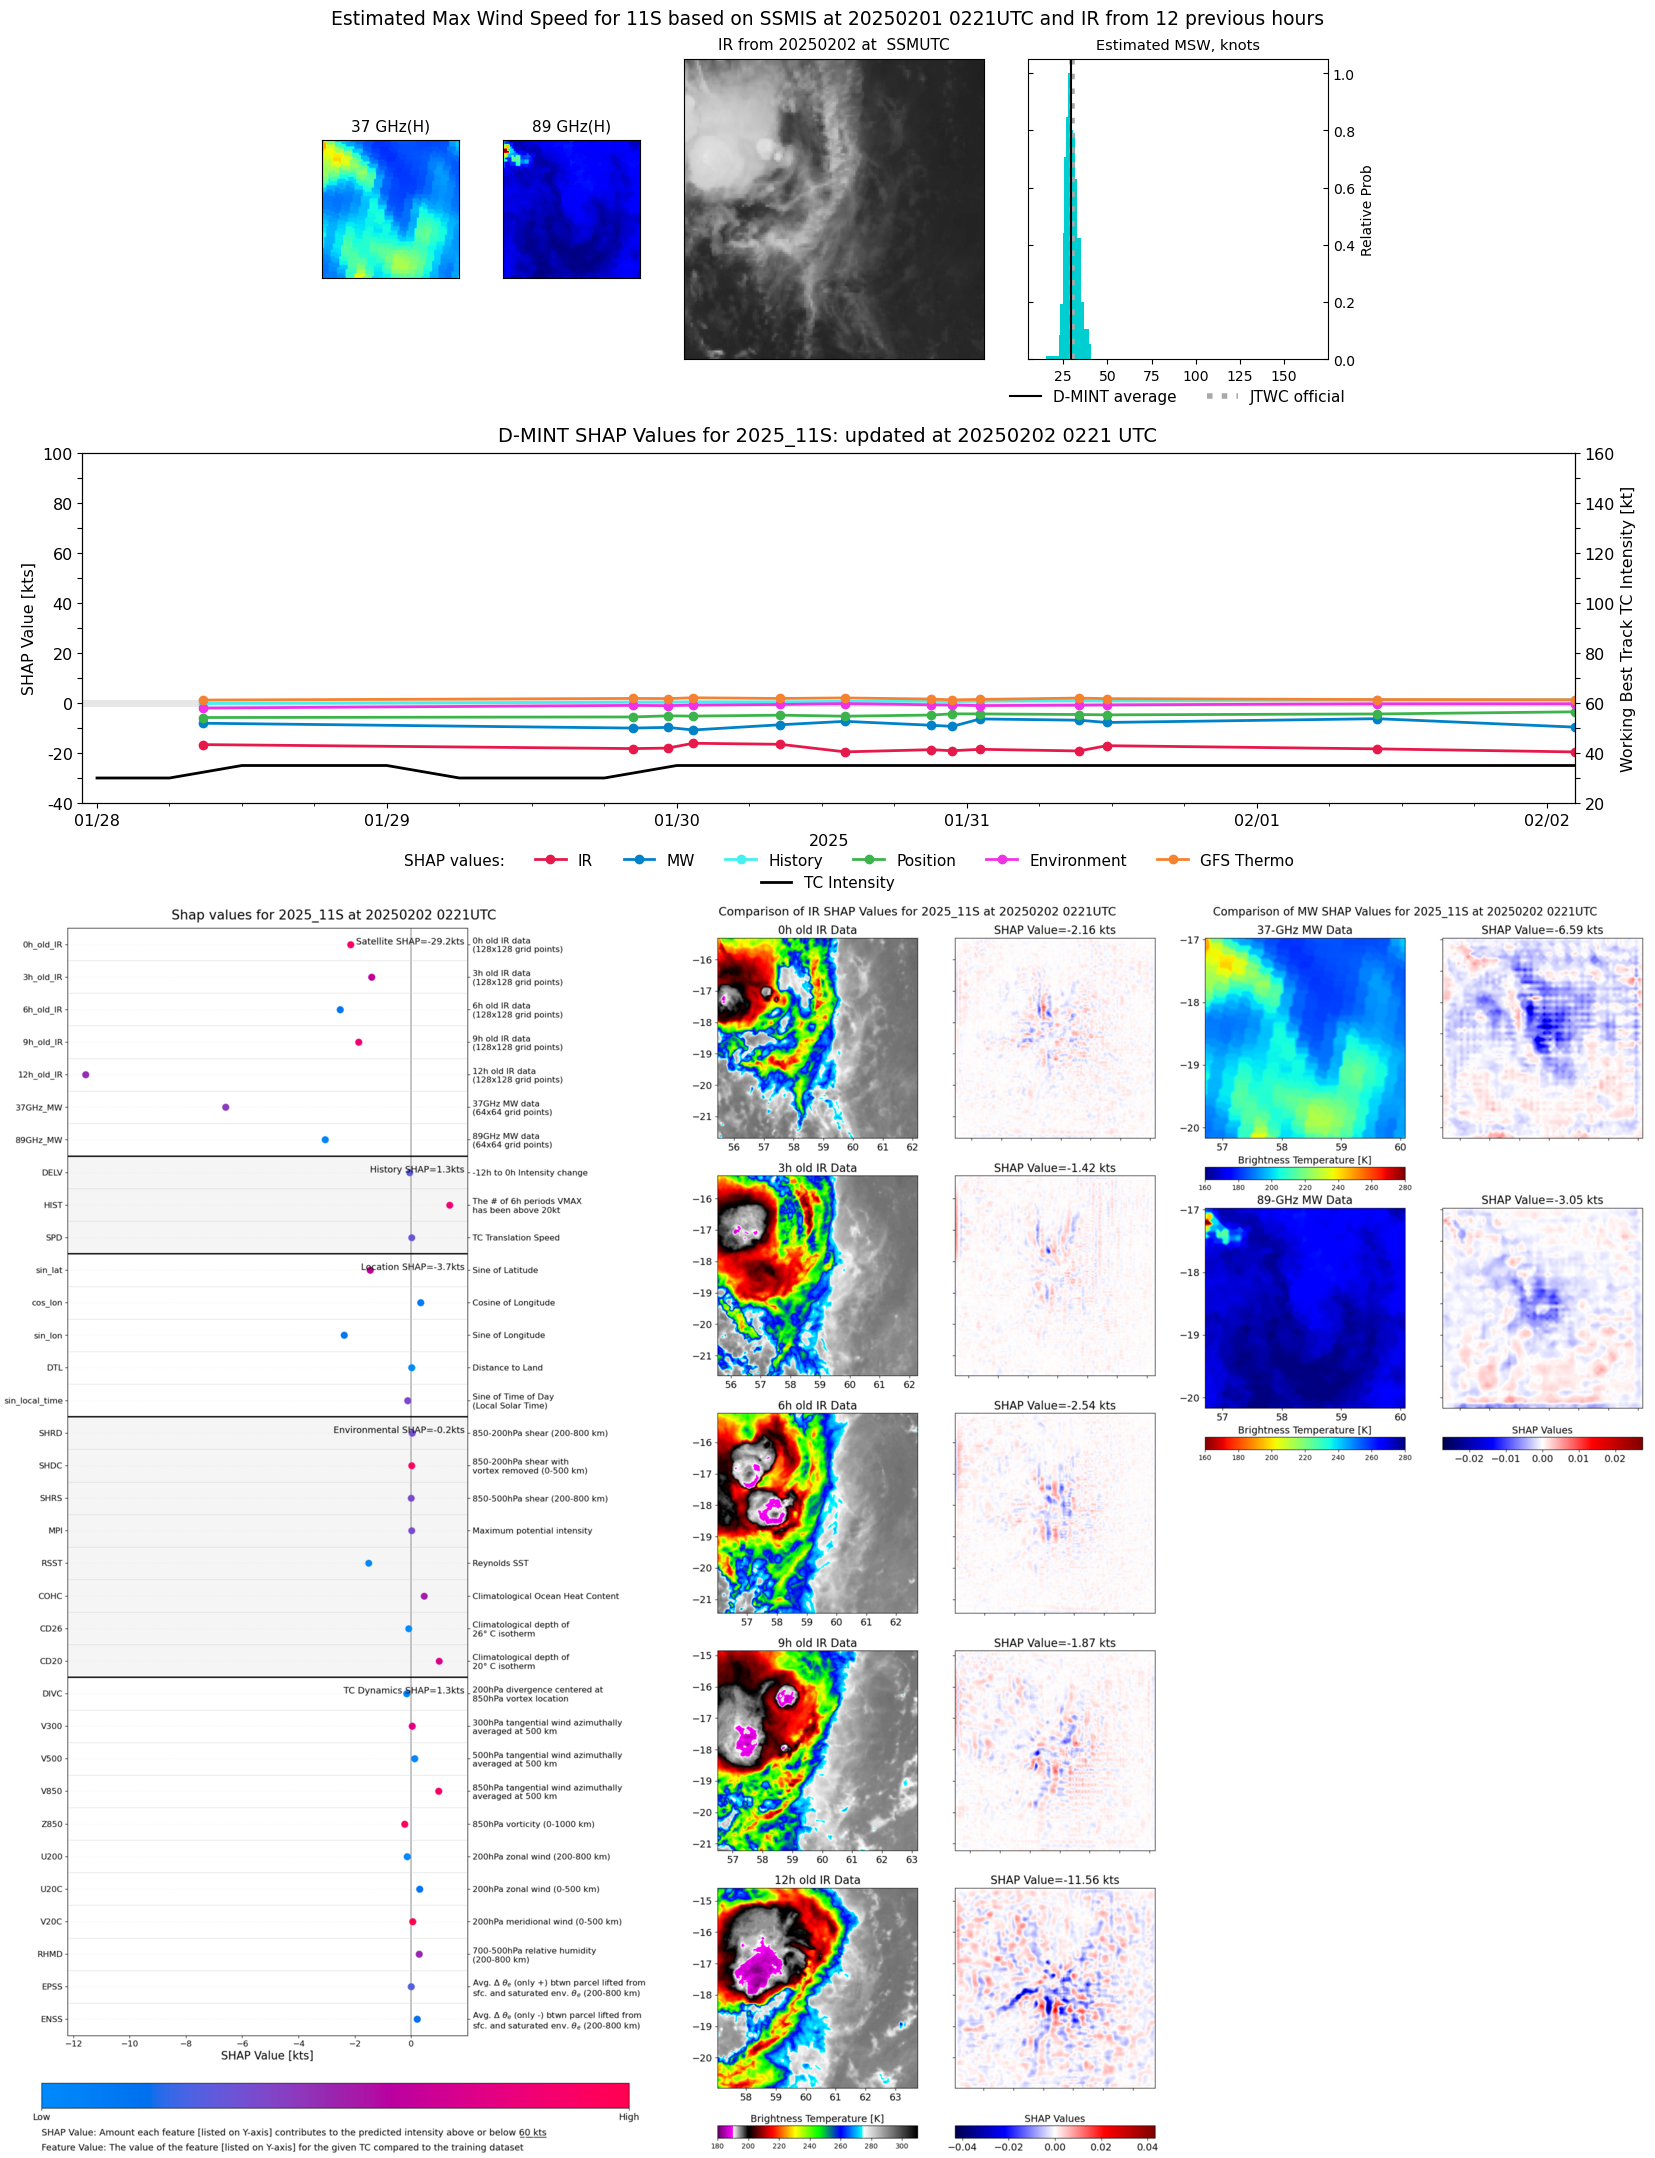 |
| 20250201 | 1403 UTC | SSMISF16 | 999 hPa | 31 kts | 29 kts | 34 kts |  |
| 20250201 | 1000 UTC | AMSR2 | 1000 hPa | 33 kts | 30 kts | 37 kts | 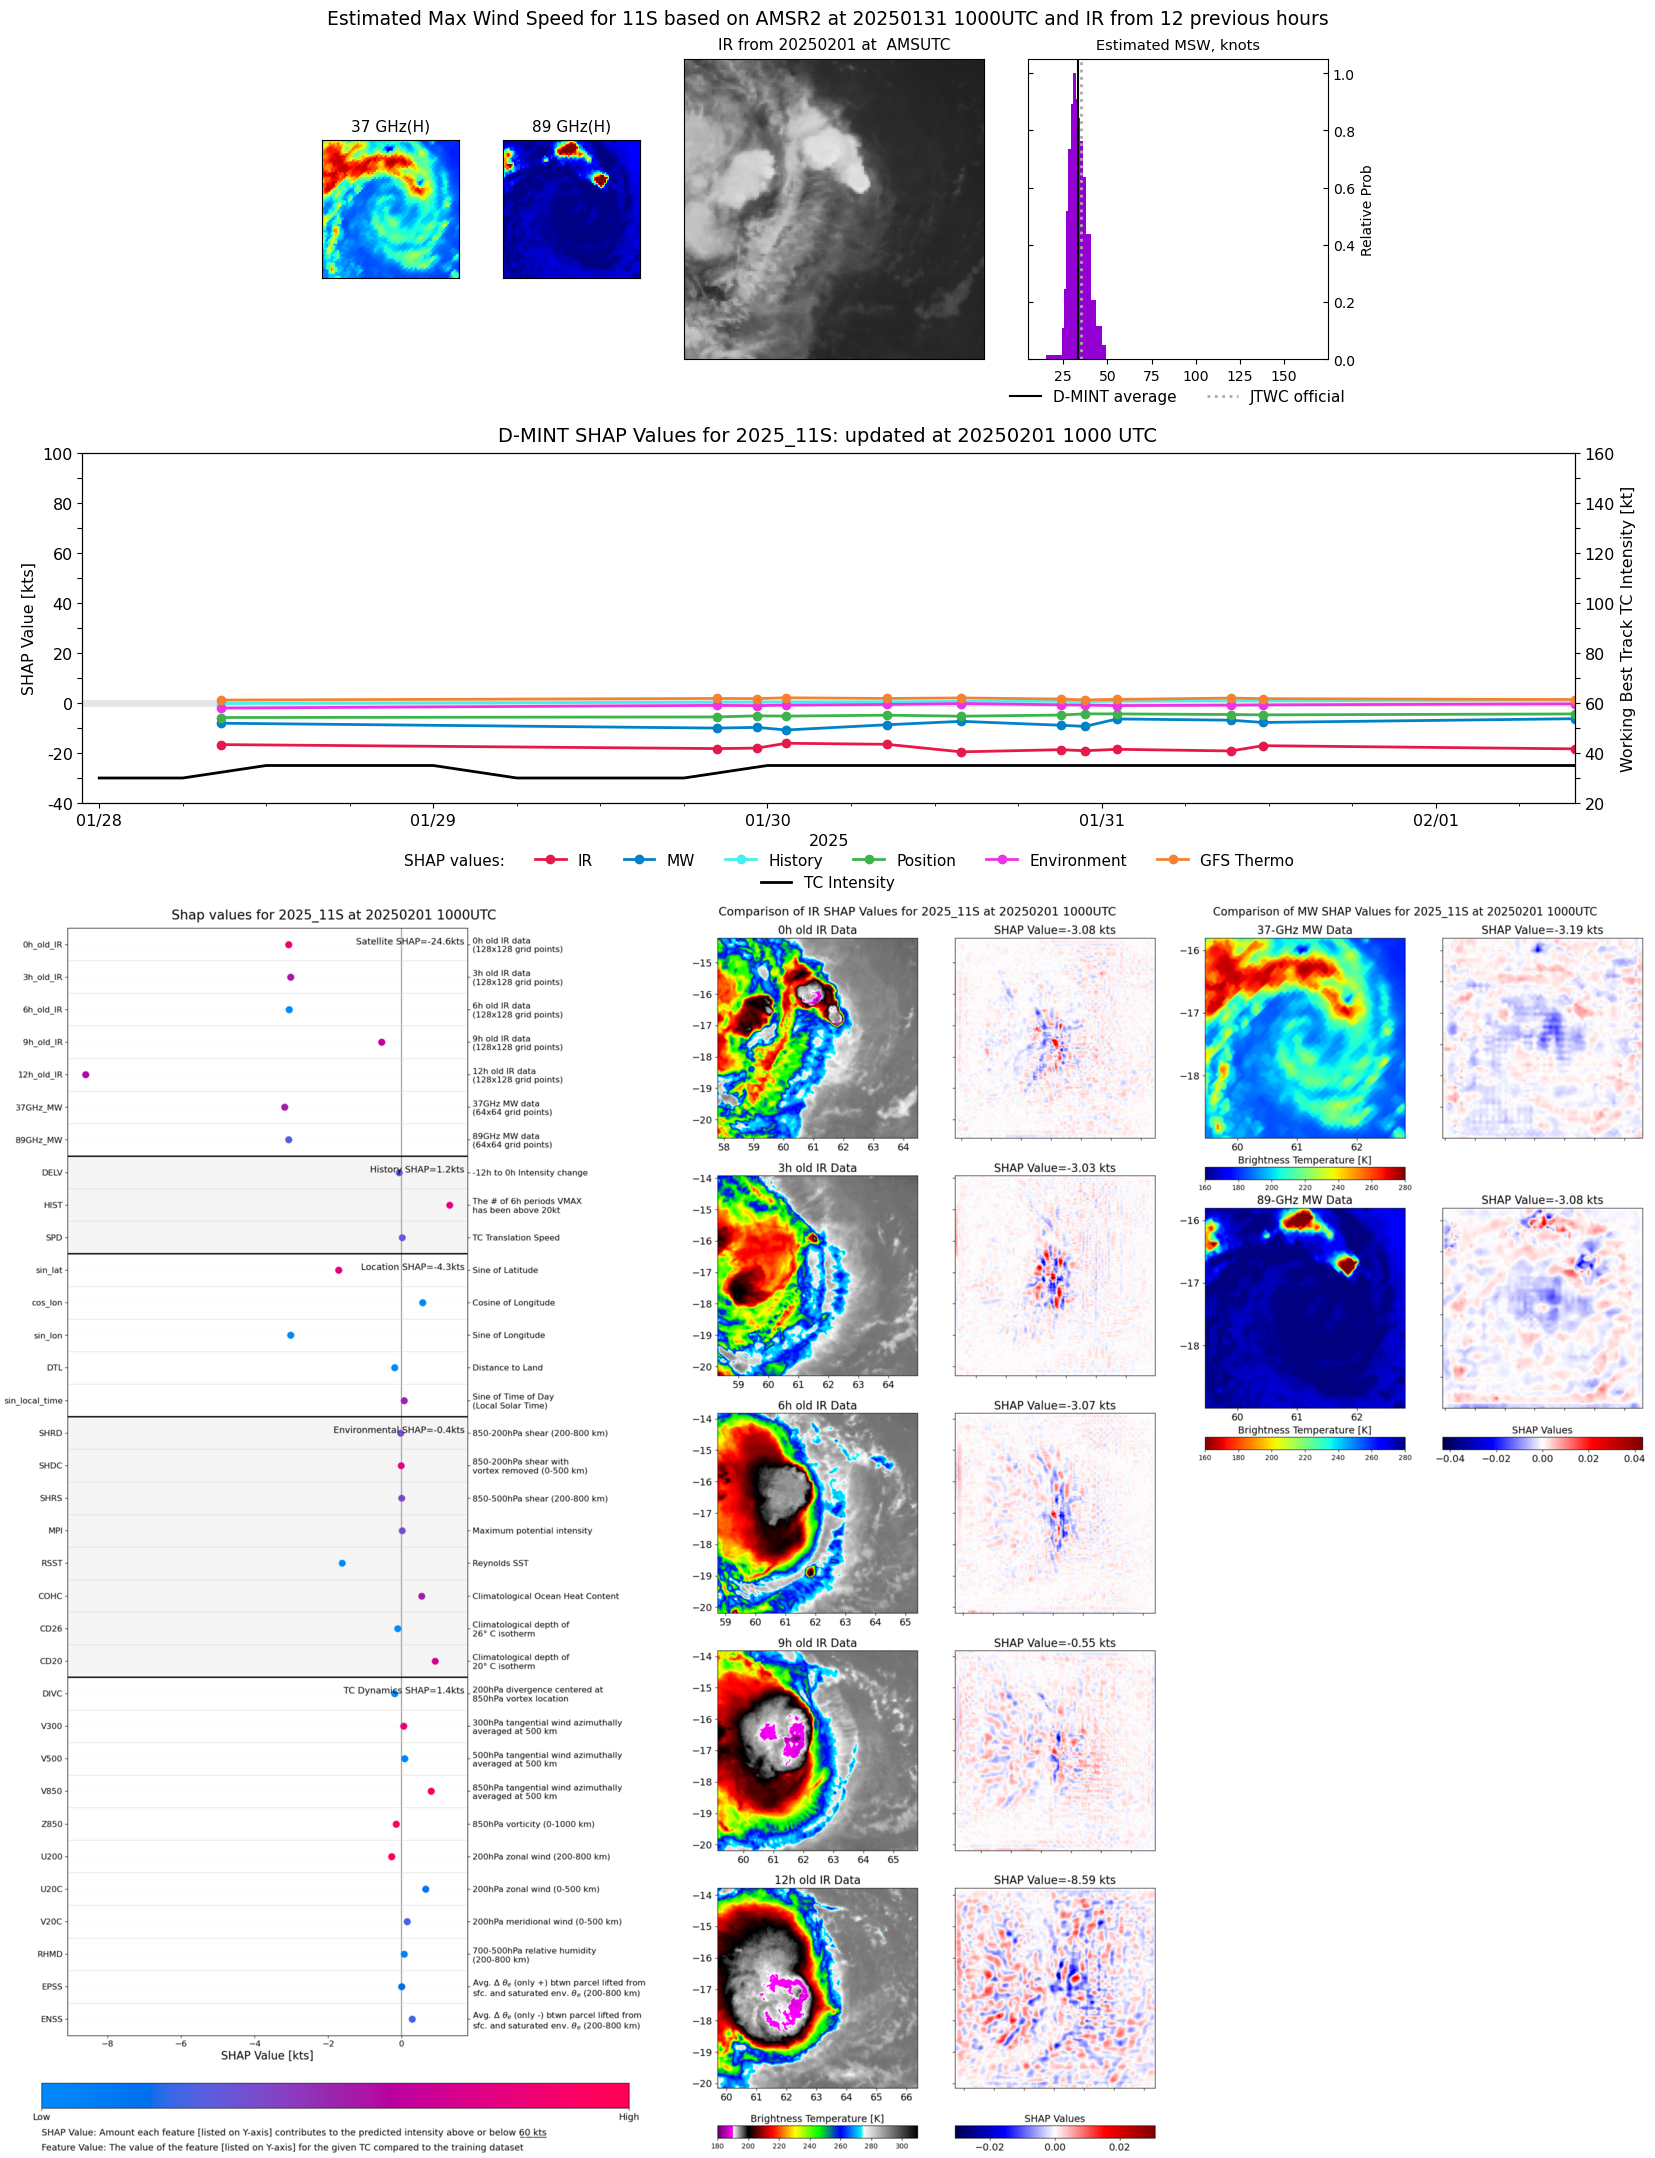 |
| 20250201 | 0129 UTC | SSMISF16 | 1003 hPa | 29 kts | 27 kts | 32 kts |  |
| 20250131 | 1416 UTC | SSMISF16 | 1000 hPa | 29 kts | 26 kts | 32 kts |  |
| 20250131 | 1341 UTC | SSMISF17 | NaN hPa | 30 kts | 27 kts | 33 kts |  |
| 20250131 | 1213 UTC | GMI | NaN hPa | 31 kts | 28 kts | 34 kts |  |
| 20250131 | 1135 UTC | SSMISF18 | 1001 hPa | 32 kts | 29 kts | 36 kts | 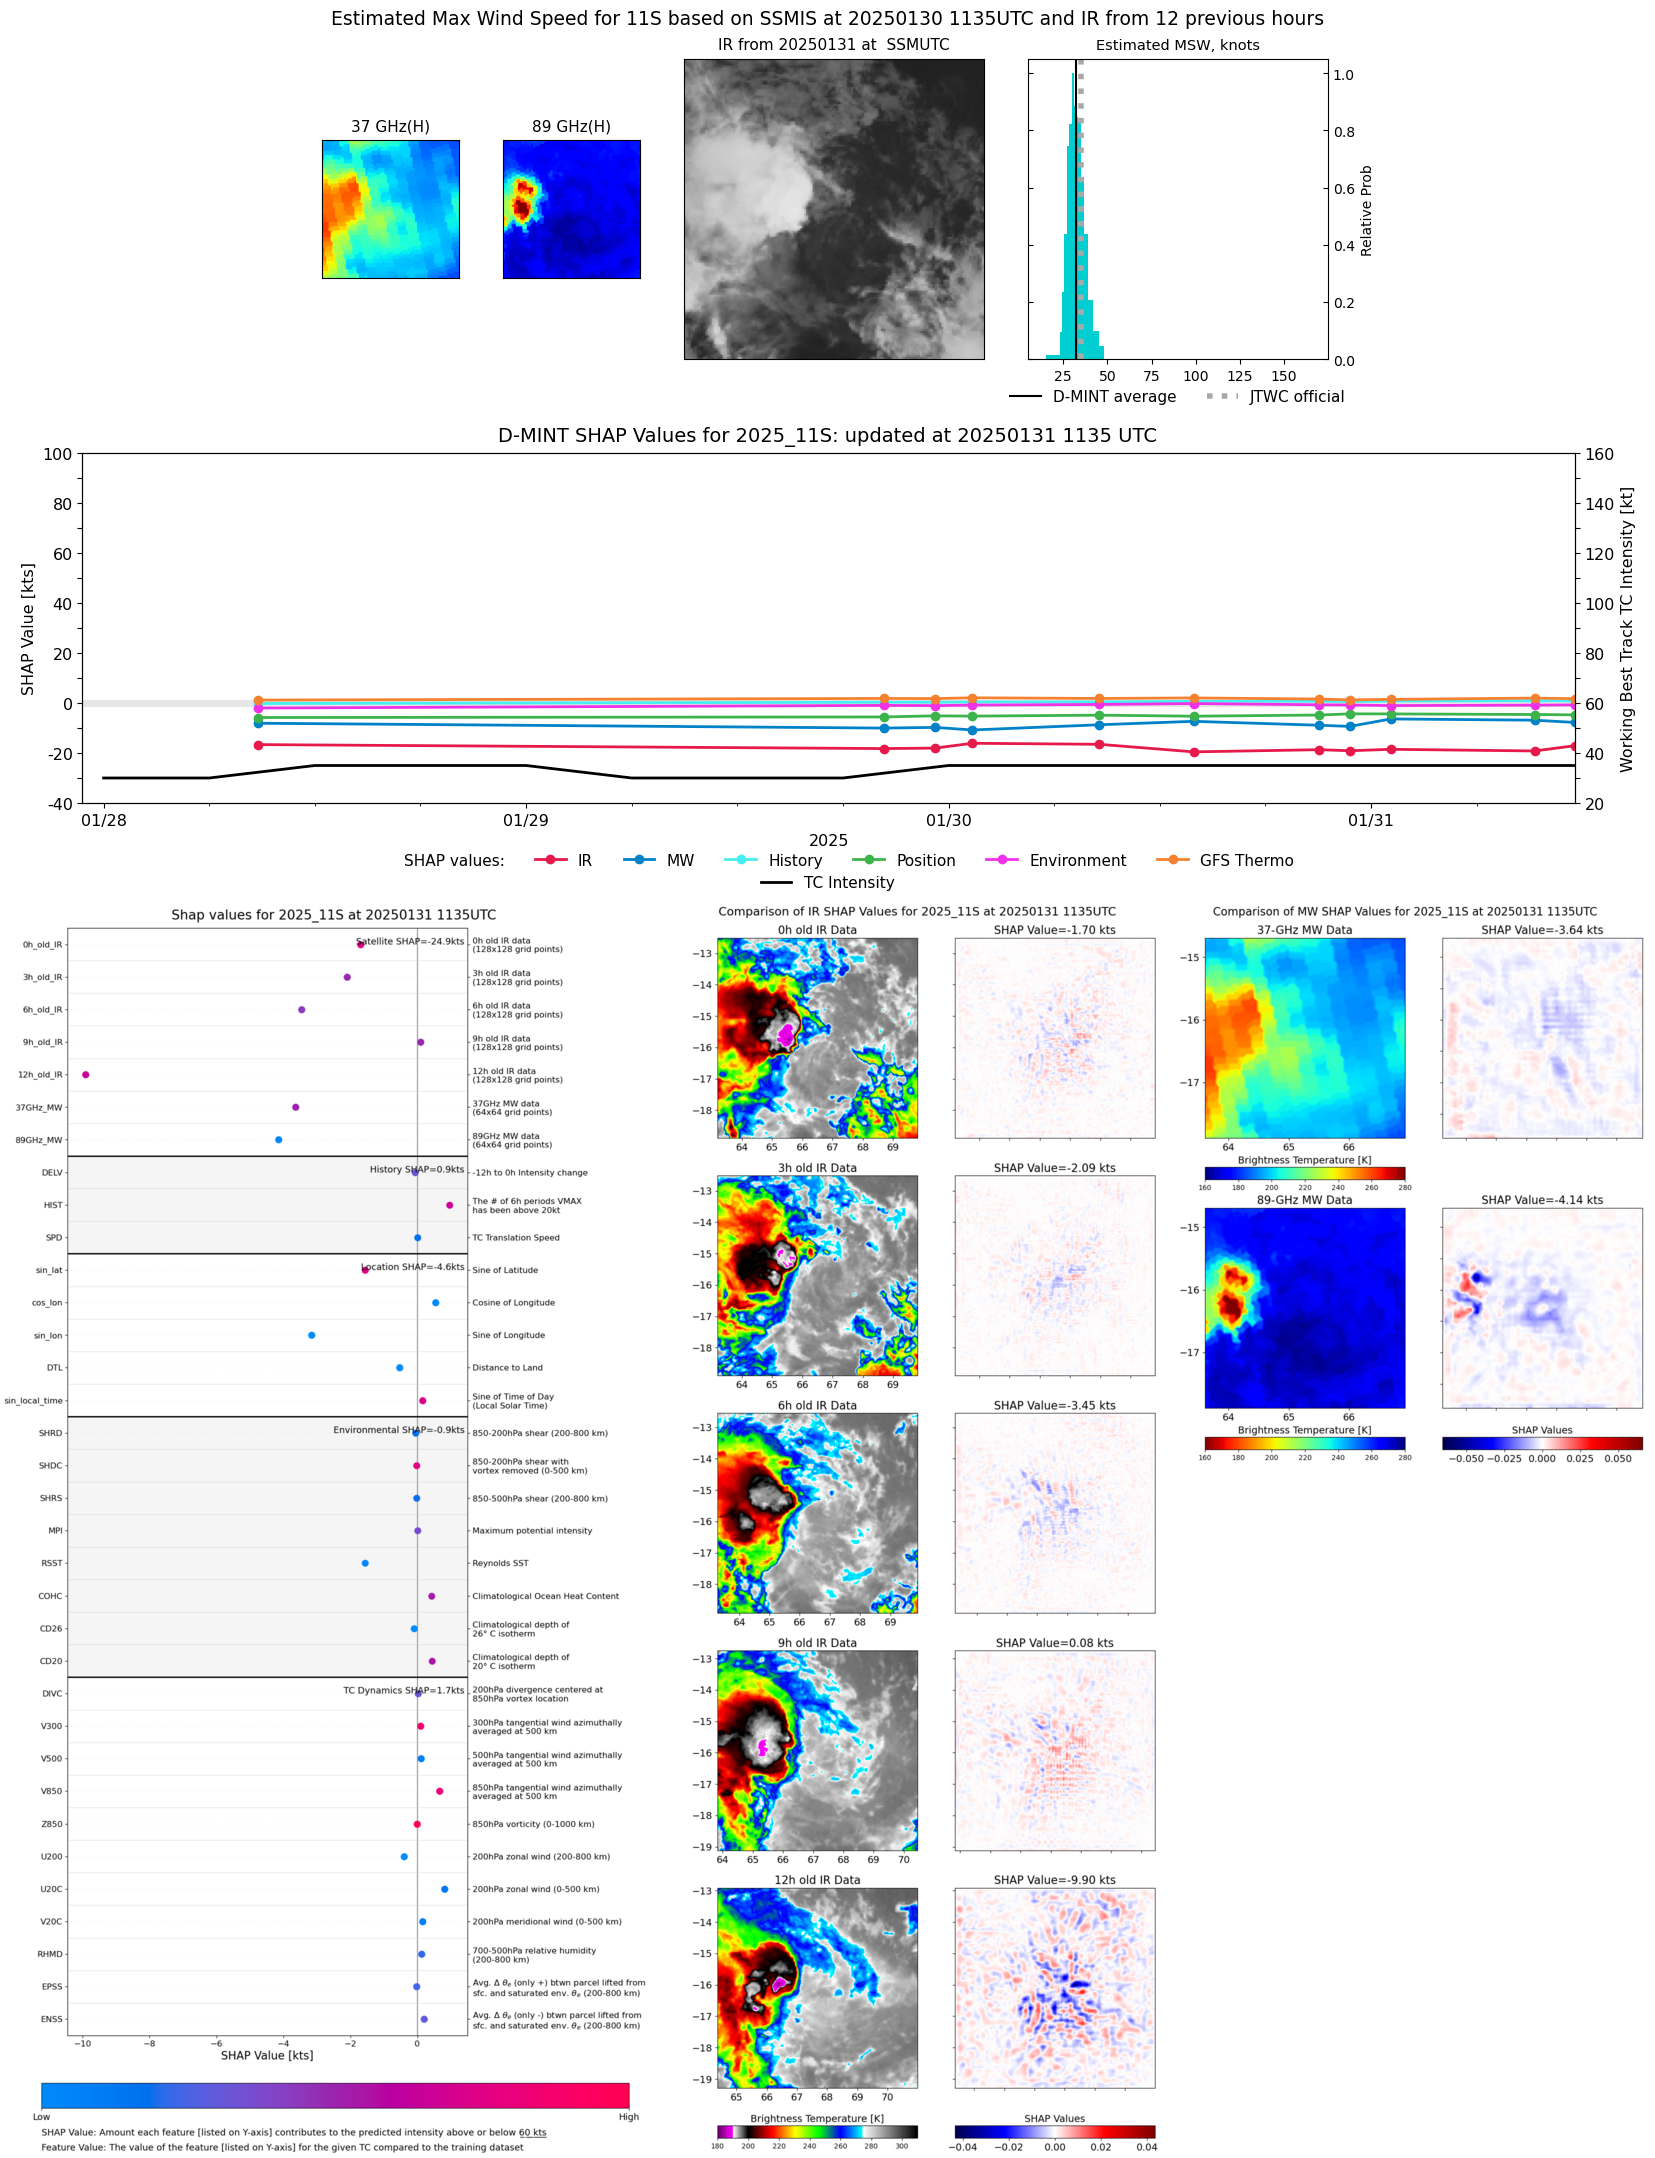 |
| 20250131 | 0923 UTC | ATMS-N20 | 1001 hPa | 30 kts | 28 kts | 33 kts |  |
| 20250131 | 0917 UTC | AMSR2 | 1000 hPa | 31 kts | 29 kts | 34 kts | 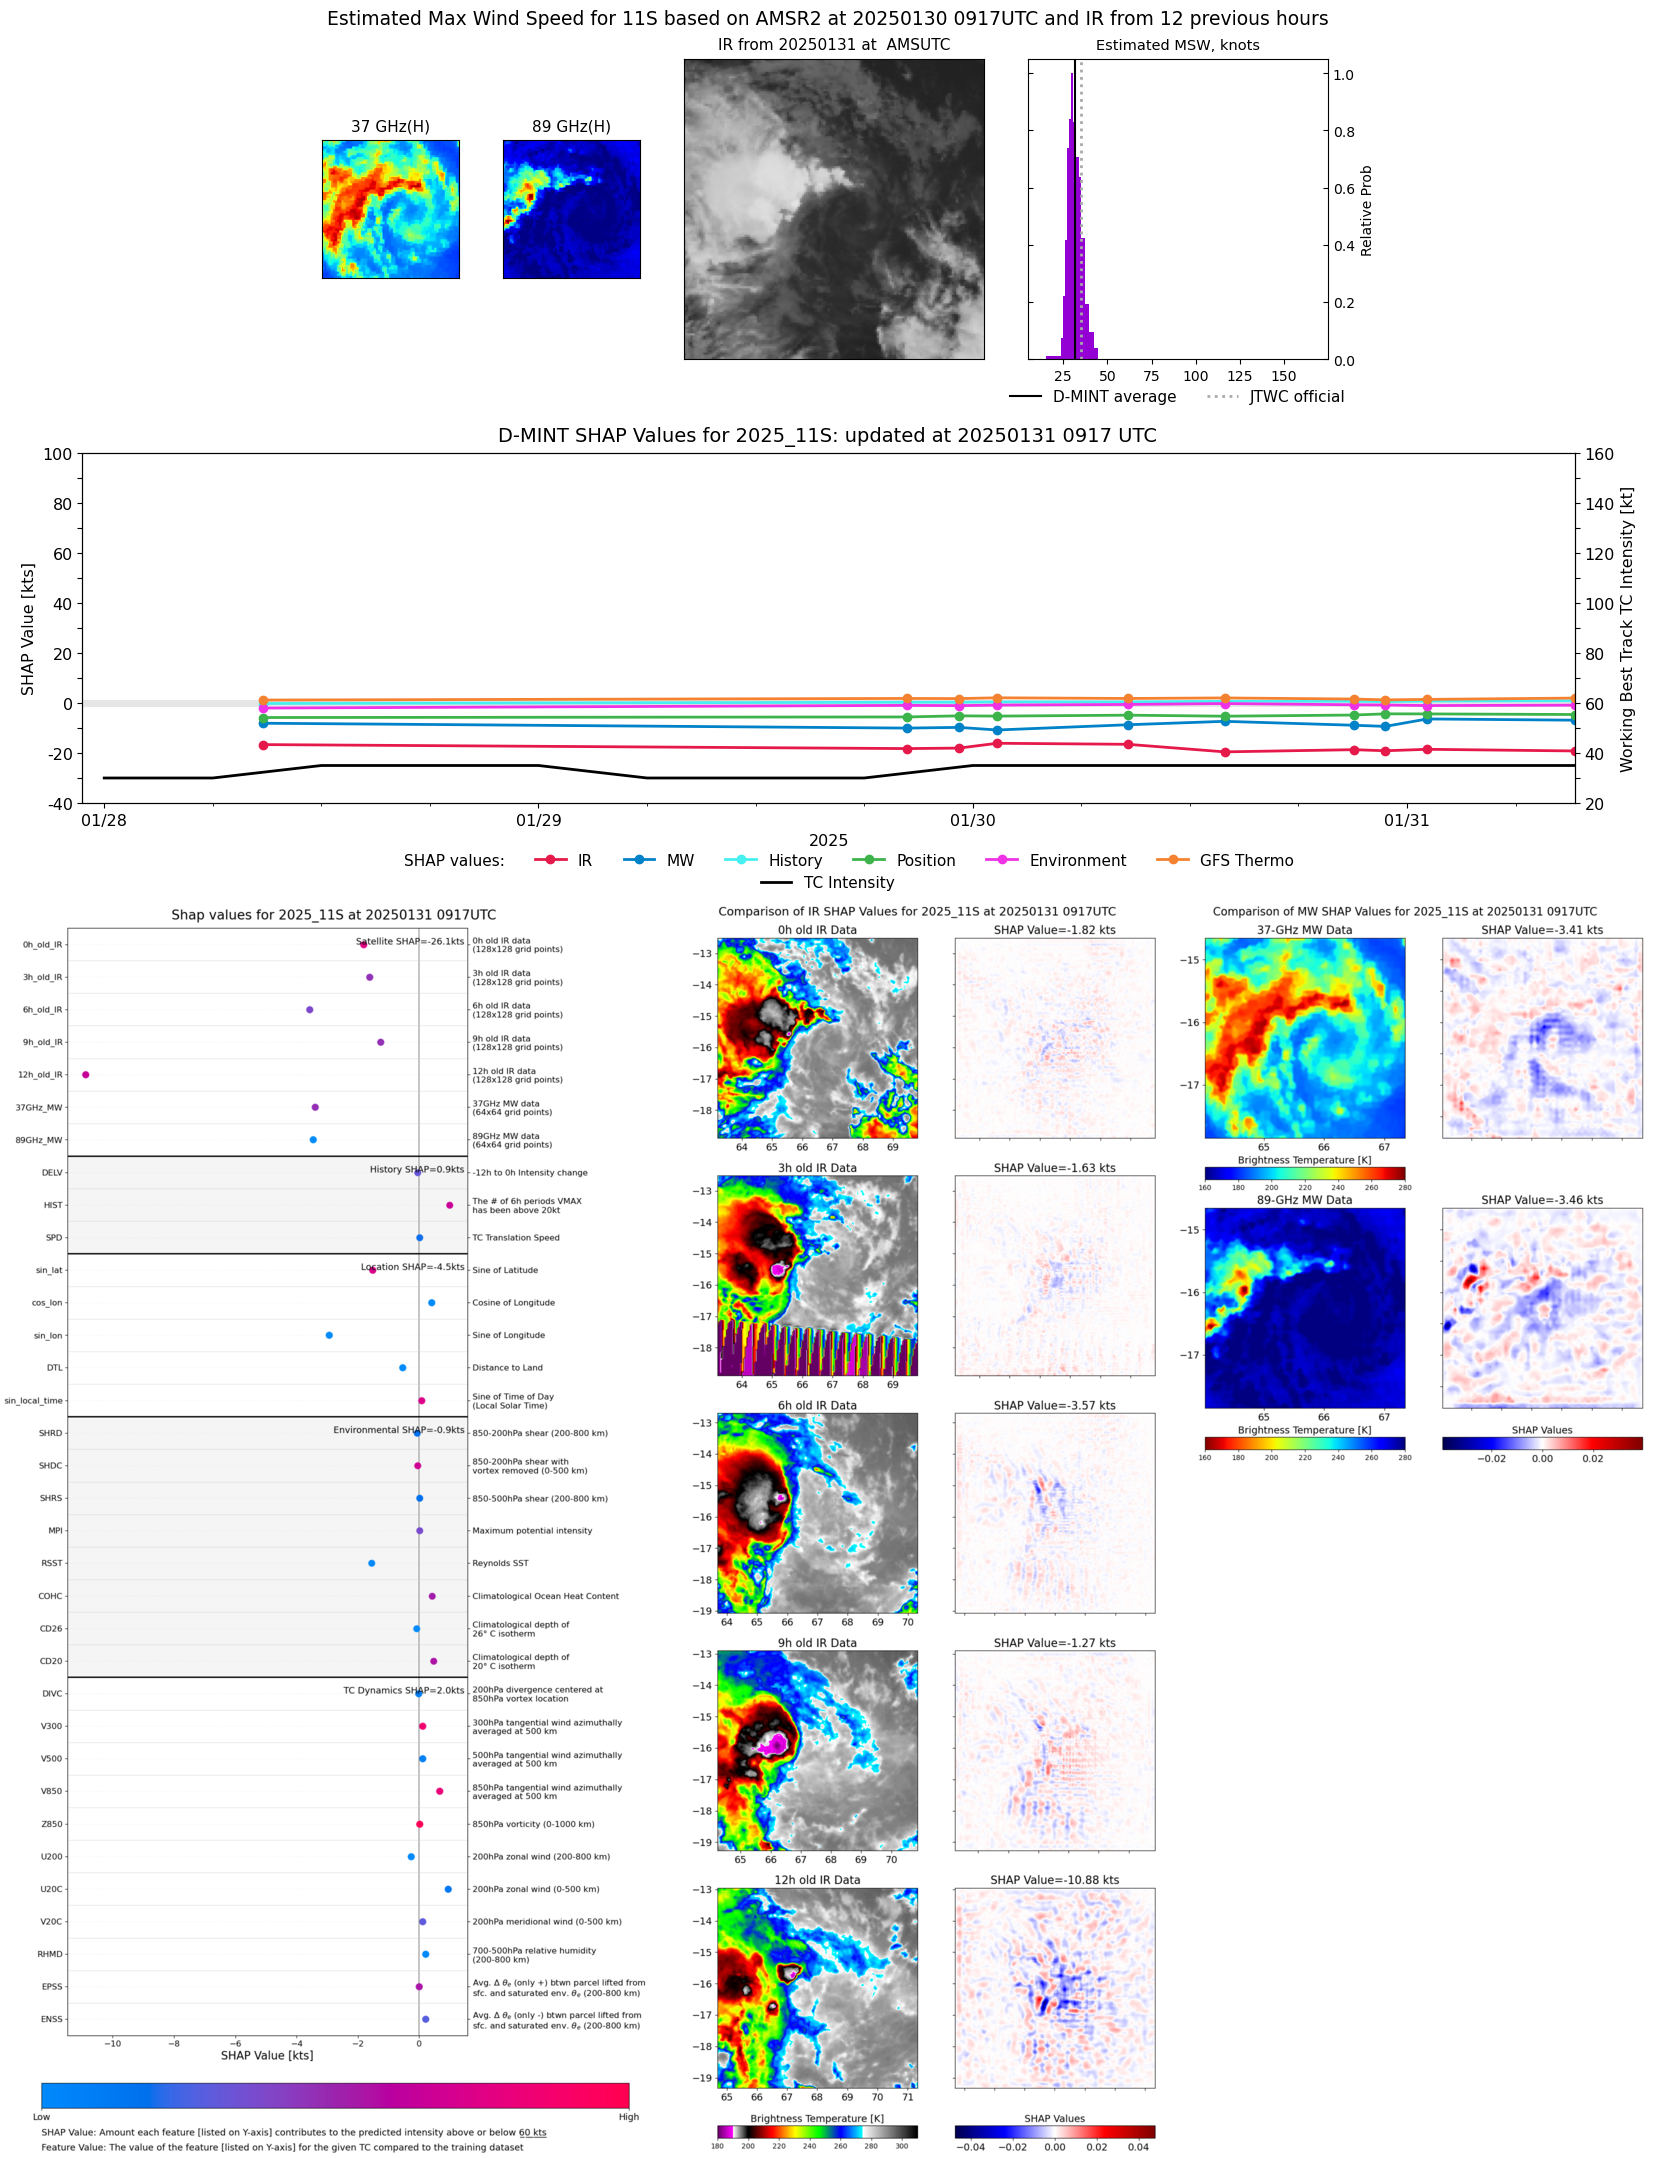 |
| 20250131 | 0342 UTC | TROPICS05 | 1001 hPa | 30 kts | 27 kts | 32 kts |  |
| 20250131 | 0141 UTC | SSMISF16 | 1001 hPa | 30 kts | 28 kts | 33 kts |  |
| 20250131 | 0107 UTC | SSMISF17 | 999 hPa | 32 kts | 29 kts | 35 kts | 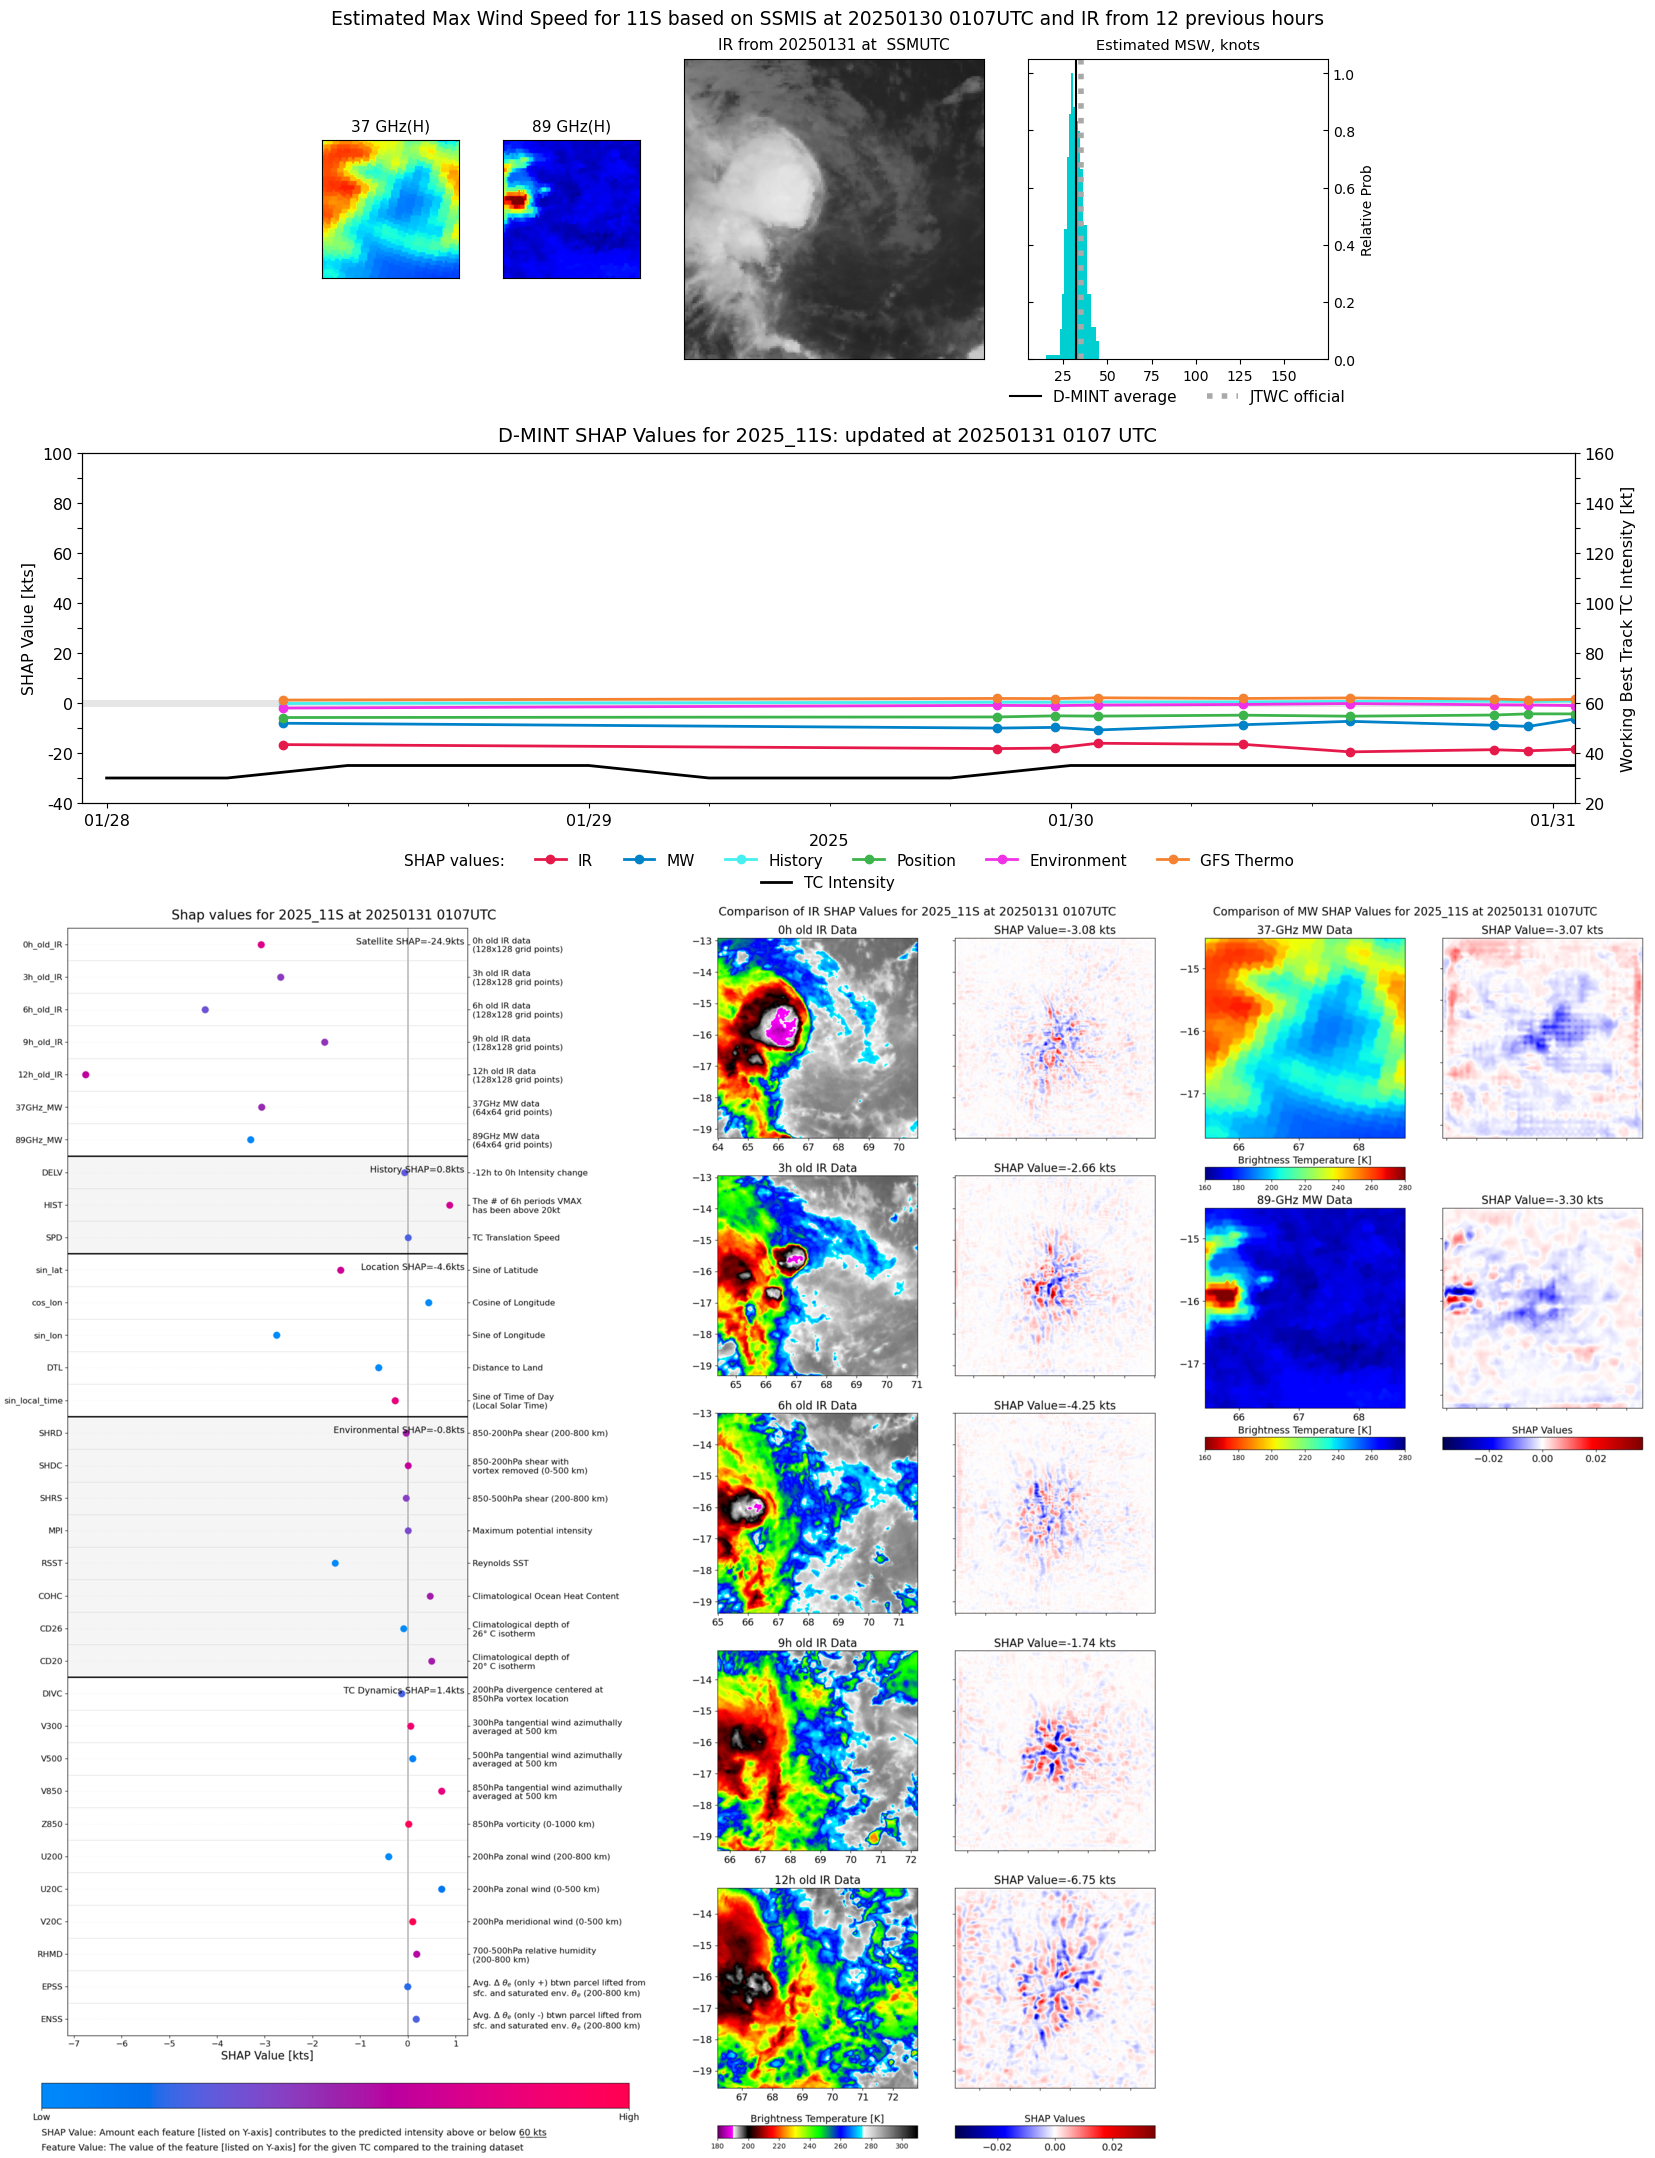 |
| 20250130 | 2301 UTC | SSMISF18 | 999 hPa | 28 kts | 26 kts | 30 kts |  |
| 20250130 | 2248 UTC | GMI | 999 hPa | 28 kts | 26 kts | 31 kts | 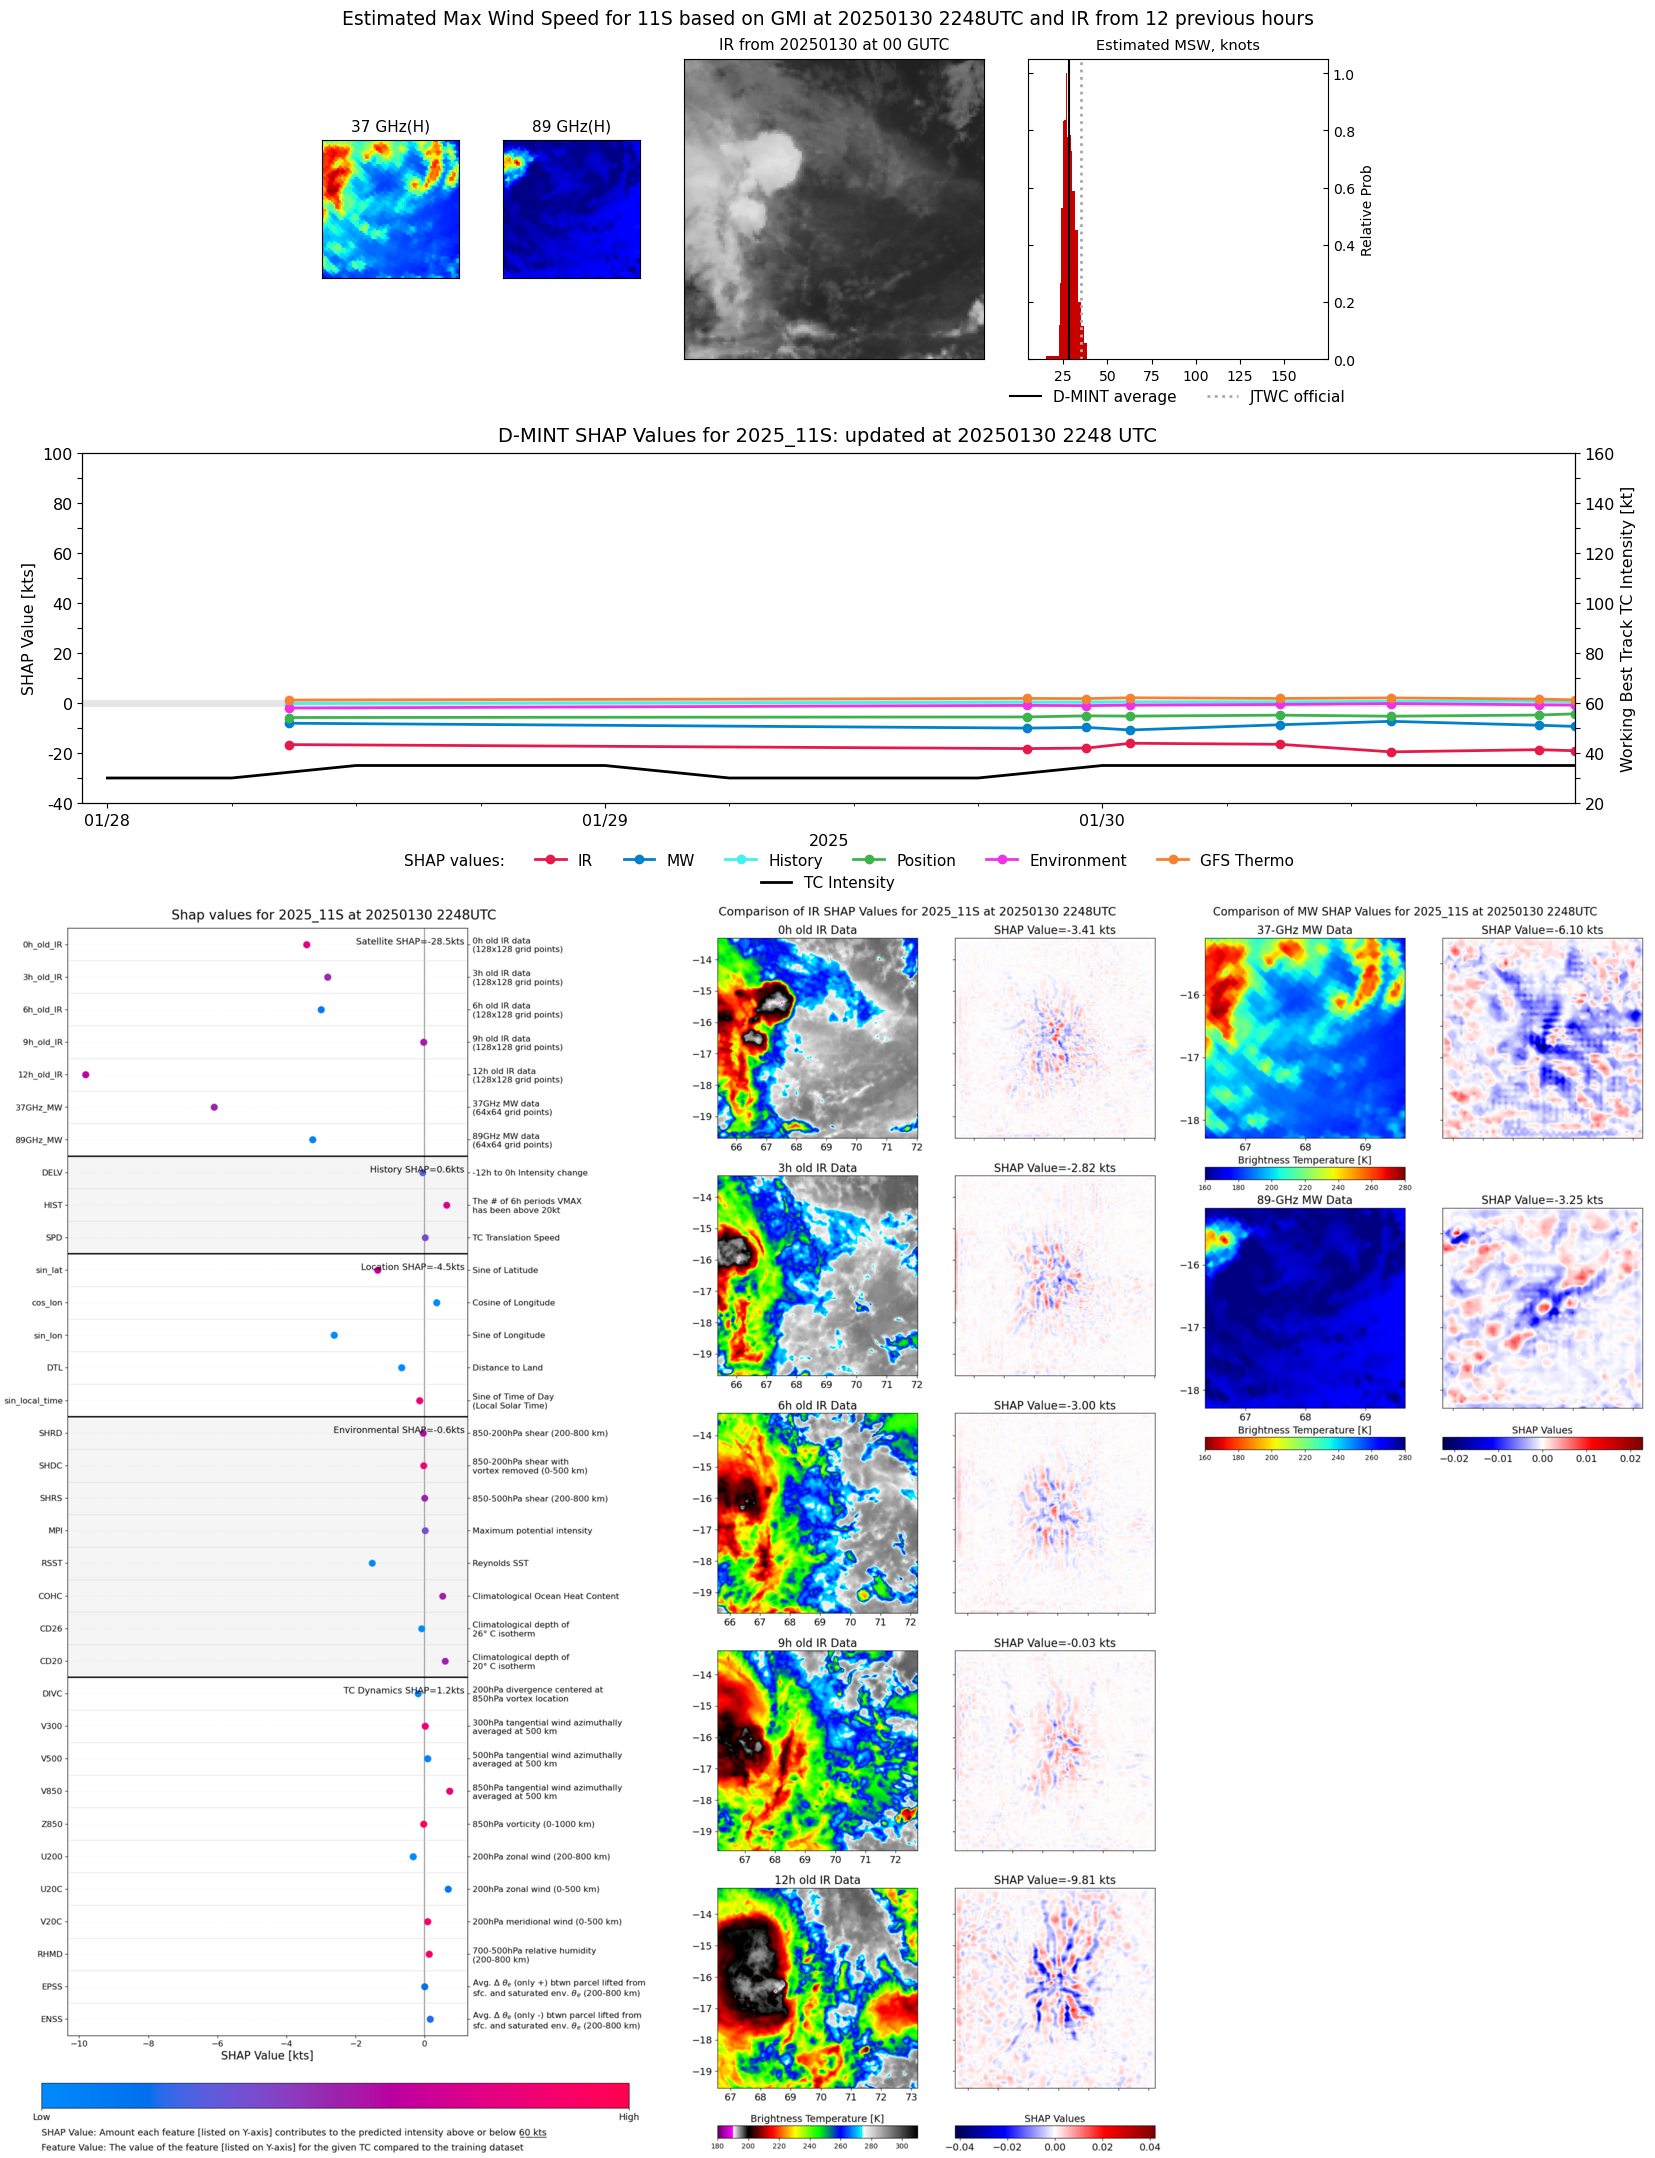 |
| 20250130 | 2104 UTC | AMSR2 | 999 hPa | 29 kts | 27 kts | 32 kts |  |
| 20250130 | 2051 UTC | ATMS-N20 | 997 hPa | 31 kts | 28 kts | 34 kts | 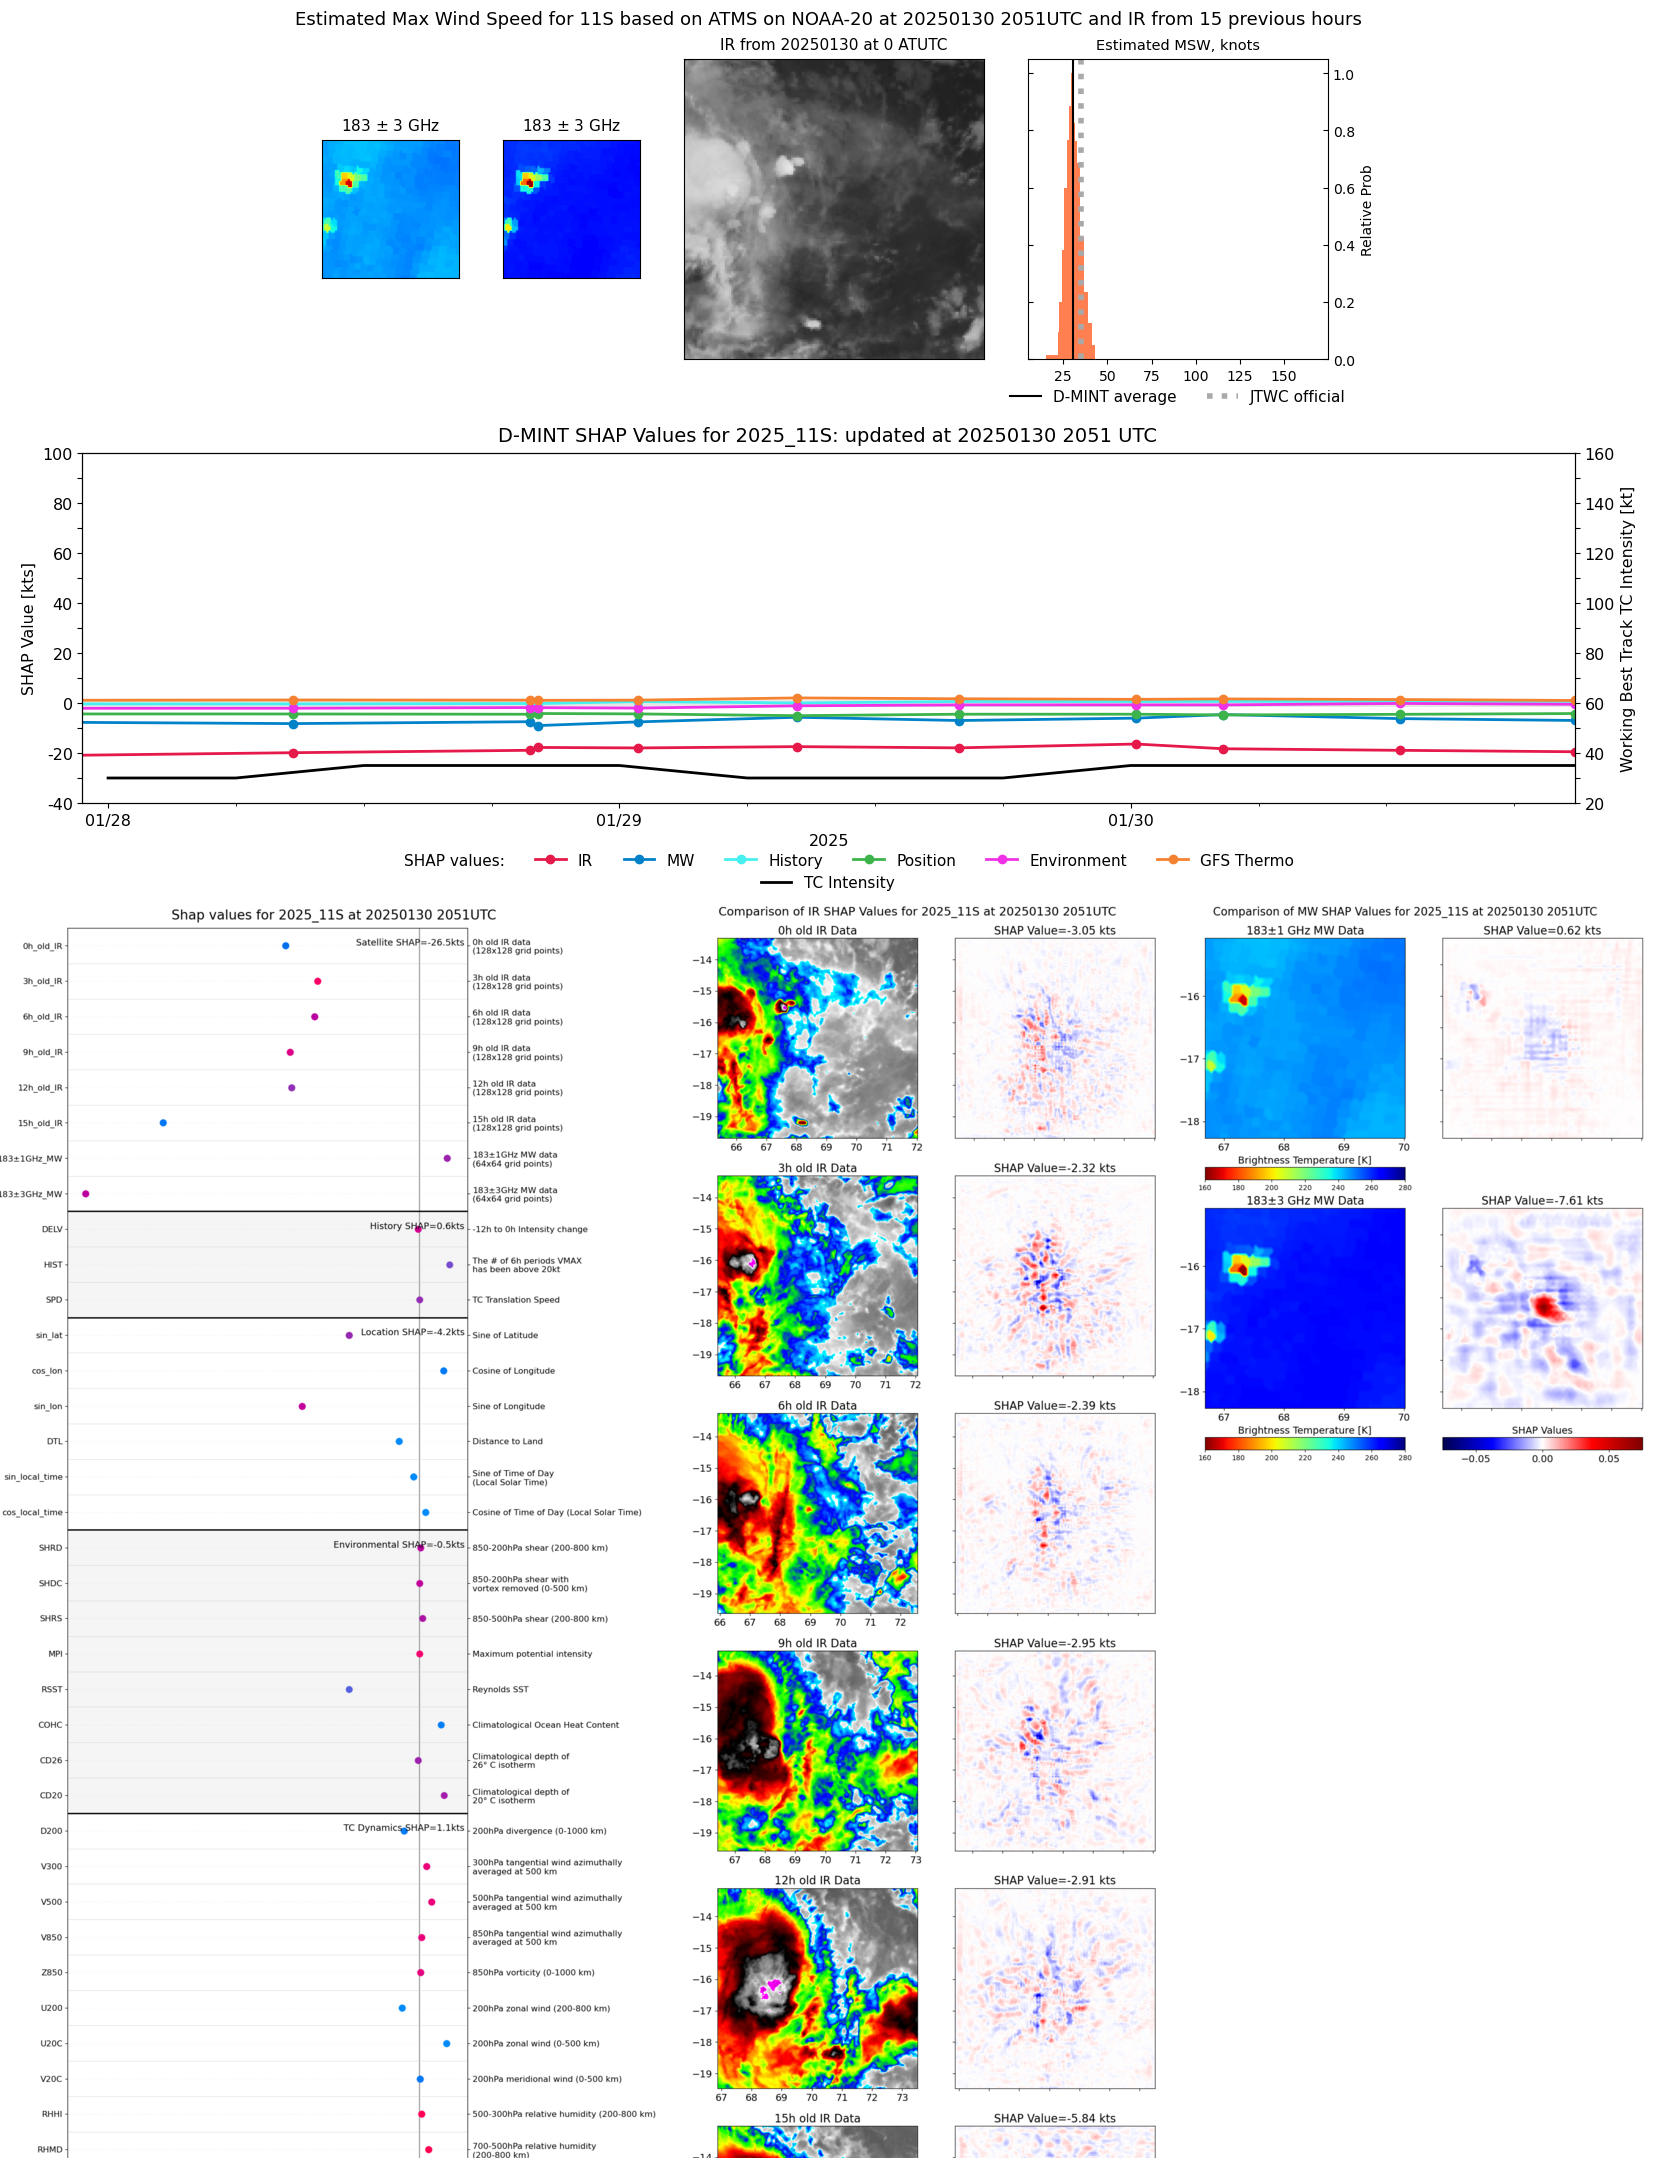 |
| 20250130 | 1355 UTC | SSMISF17 | 999 hPa | 30 kts | 28 kts | 33 kts |  |
| 20250130 | 1239 UTC | TROPICS05 | 997 hPa | 32 kts | 30 kts | 35 kts | 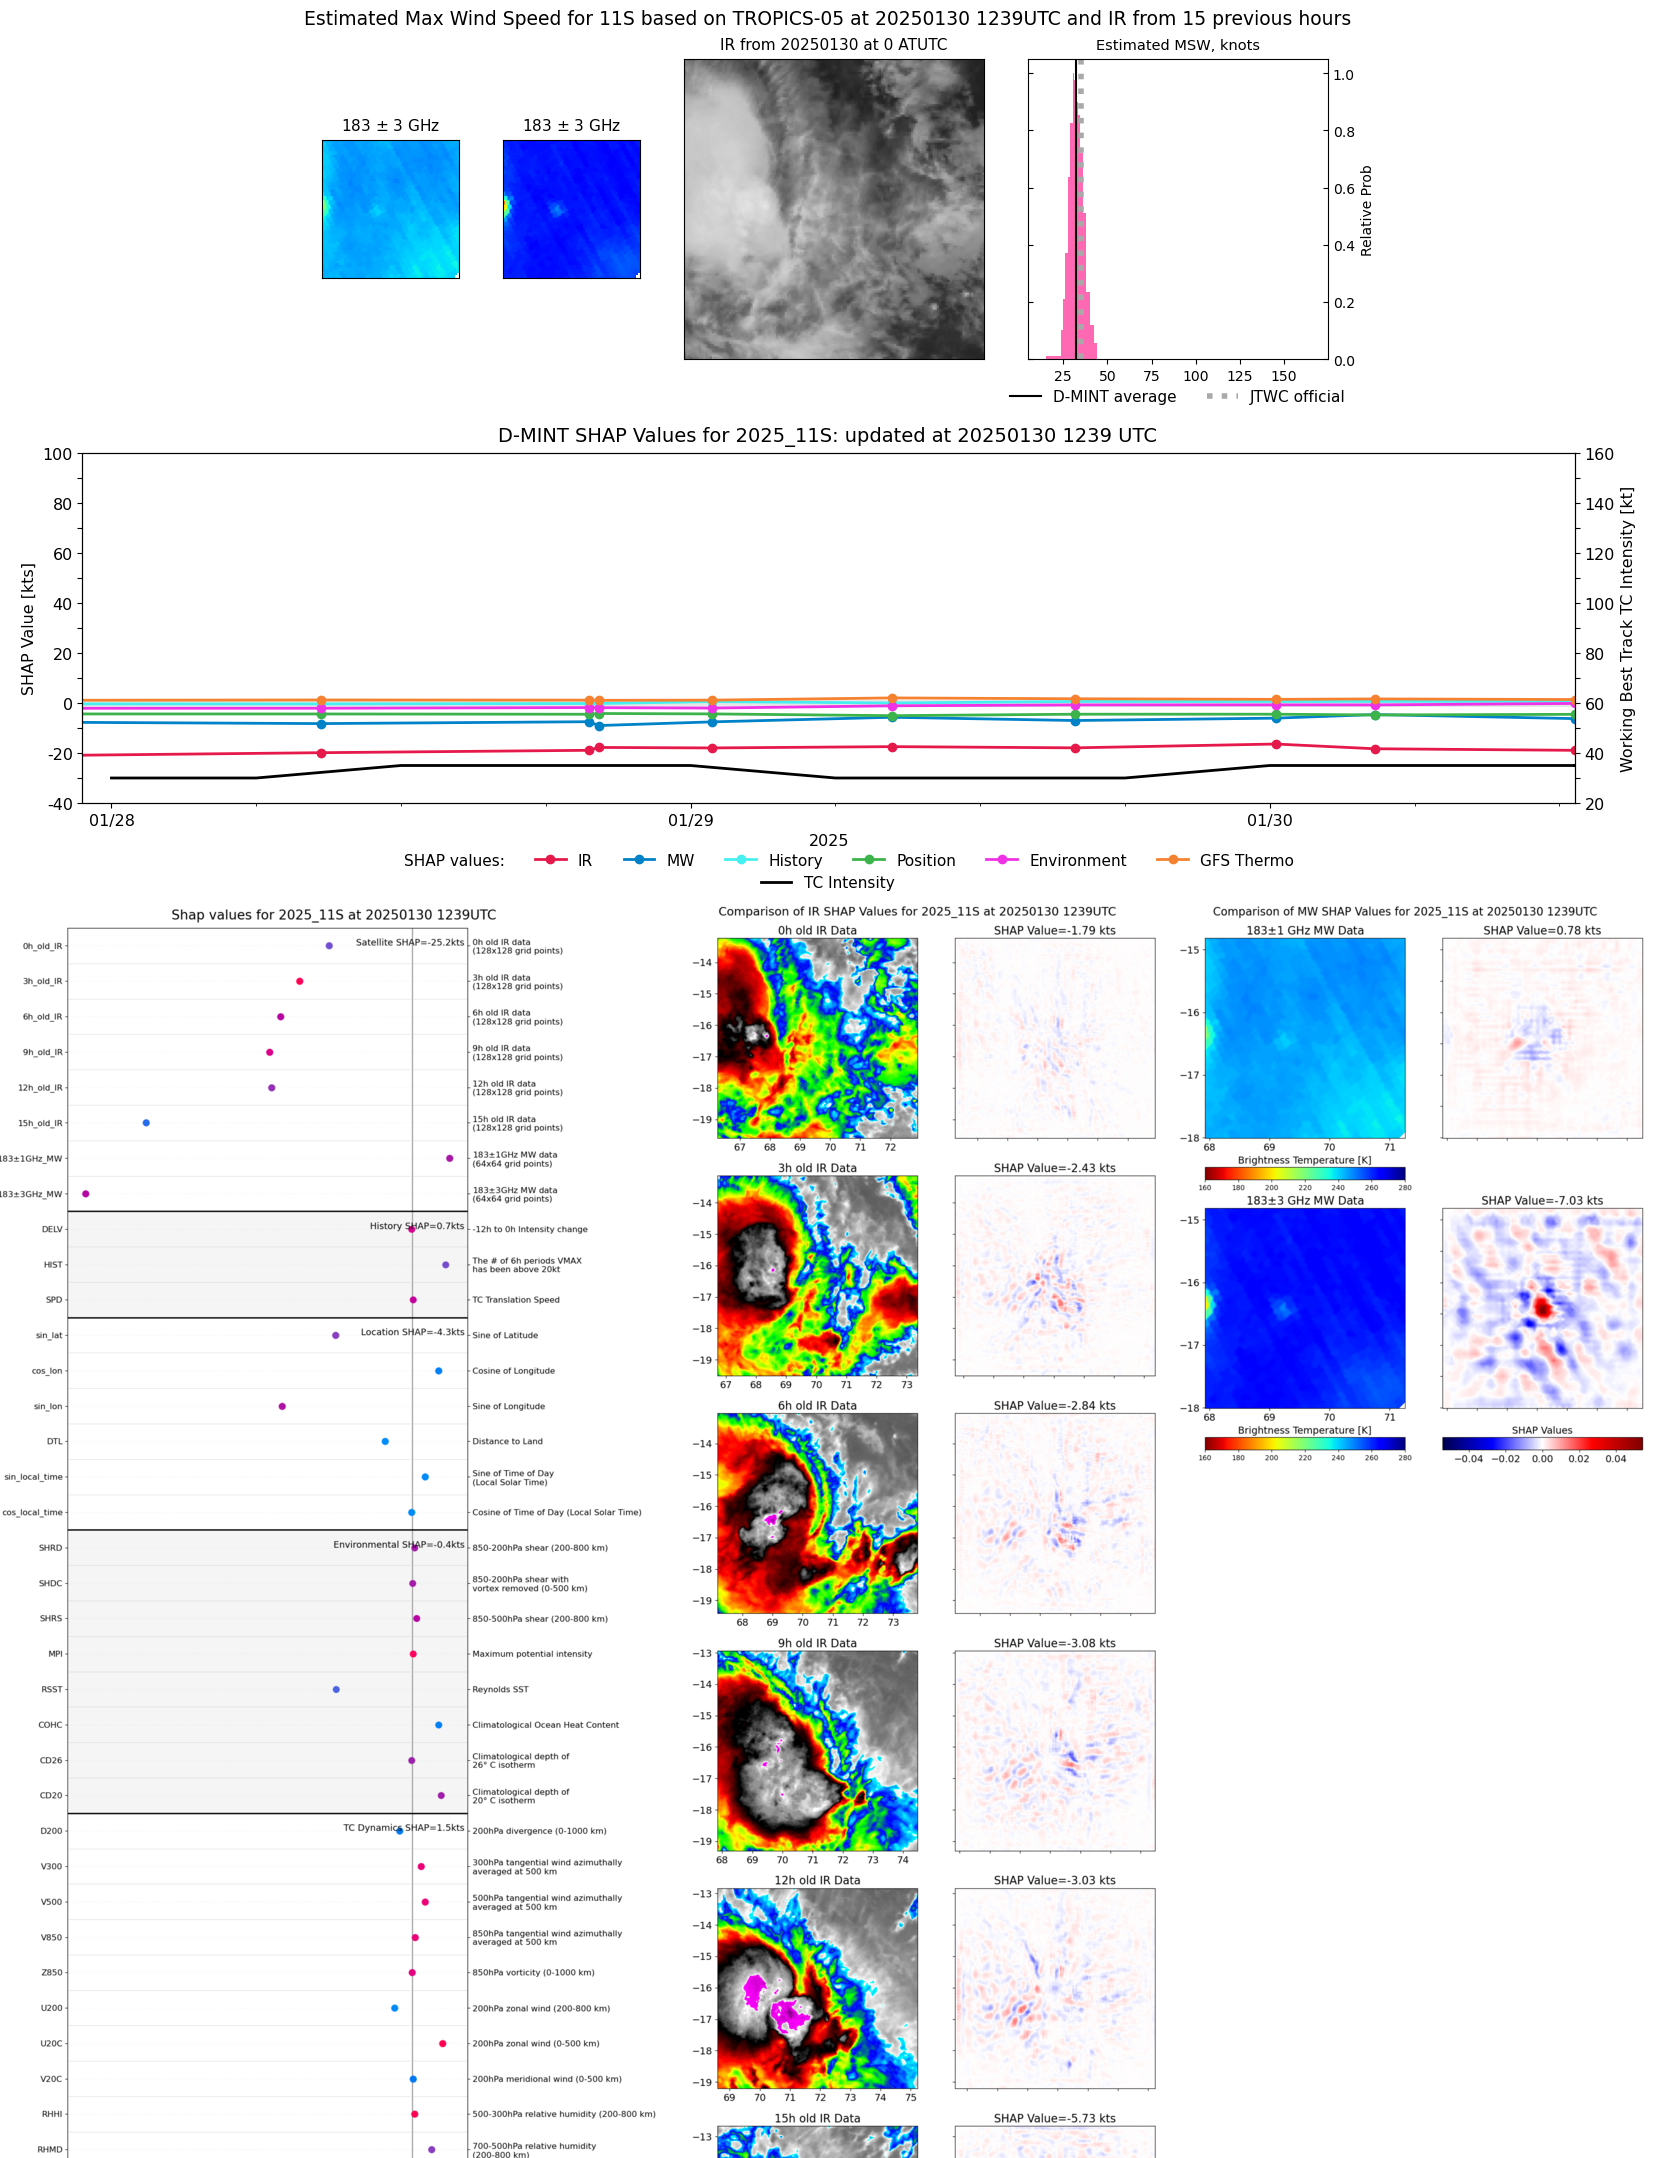 |
| 20250130 | 1150 UTC | SSMISF18 | 1002 hPa | 29 kts | 26 kts | 32 kts |  |
| 20250130 | 1146 UTC | TROPICS06 | 998 hPa | 32 kts | 30 kts | 35 kts |  |
| 20250130 | 0834 UTC | AMSR2 | 1002 hPa | 32 kts | 29 kts | 34 kts | 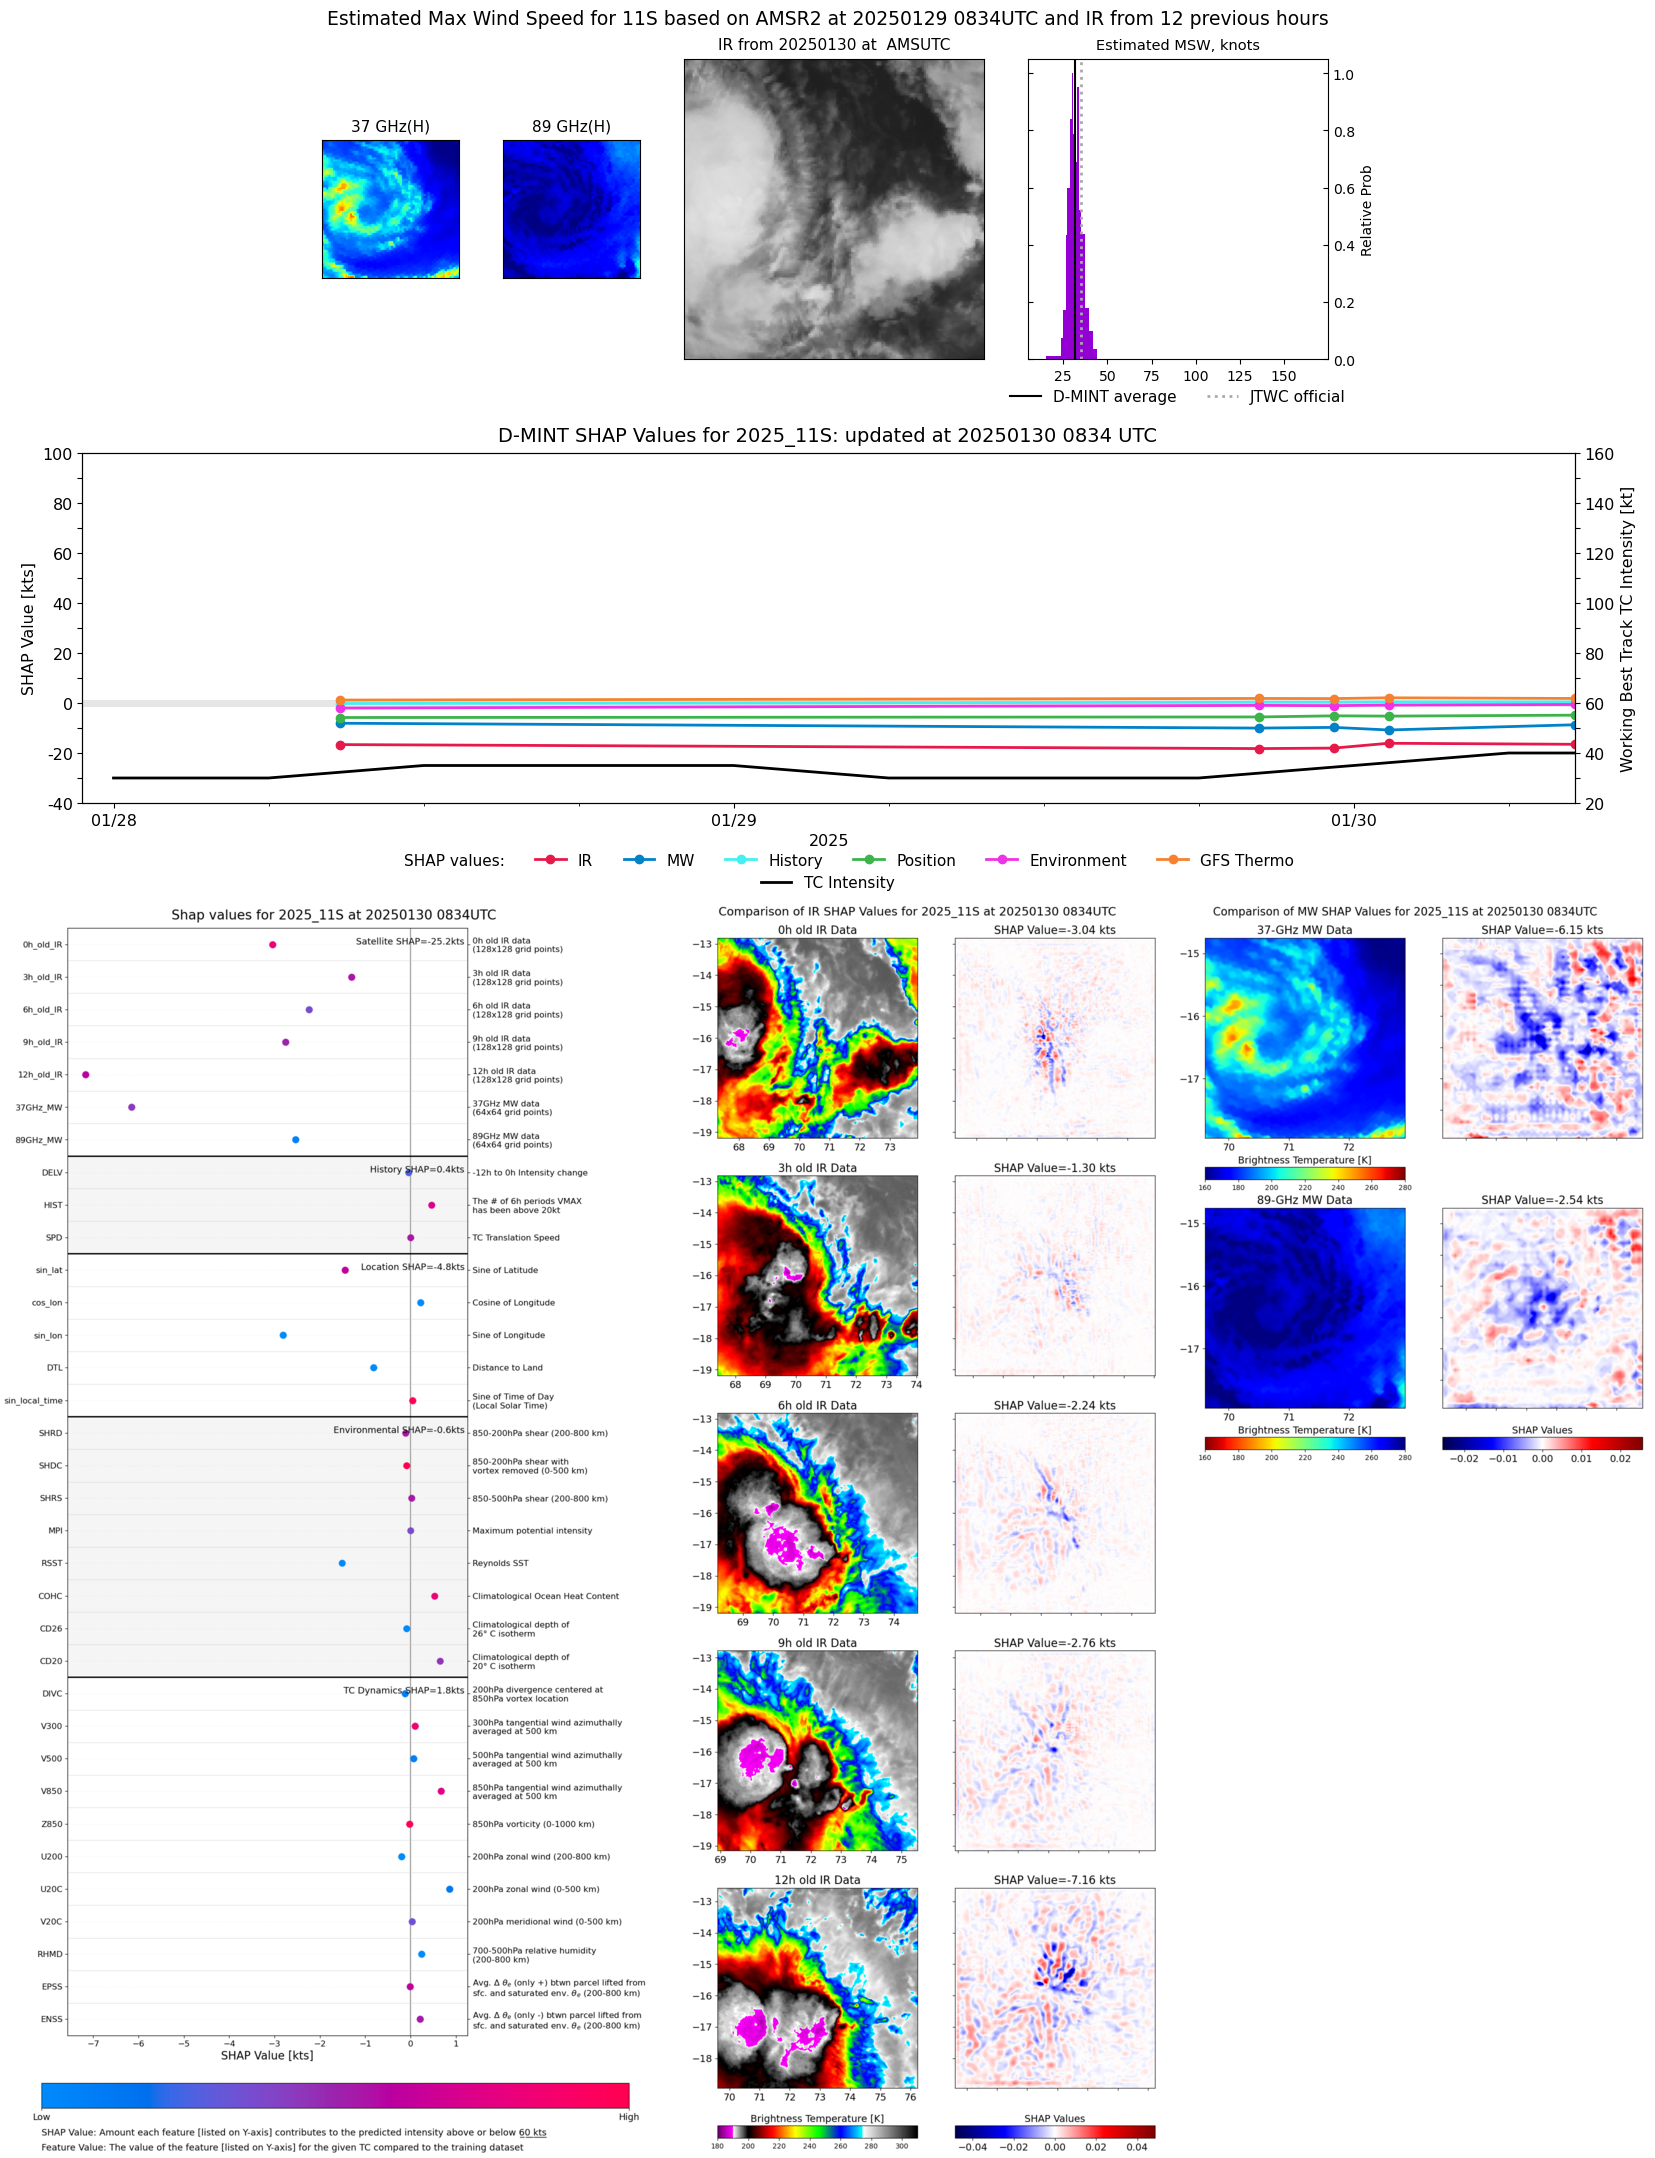 |
| 20250130 | 0421 UTC | TROPICS05 | 999 hPa | 34 kts | 31 kts | 37 kts | 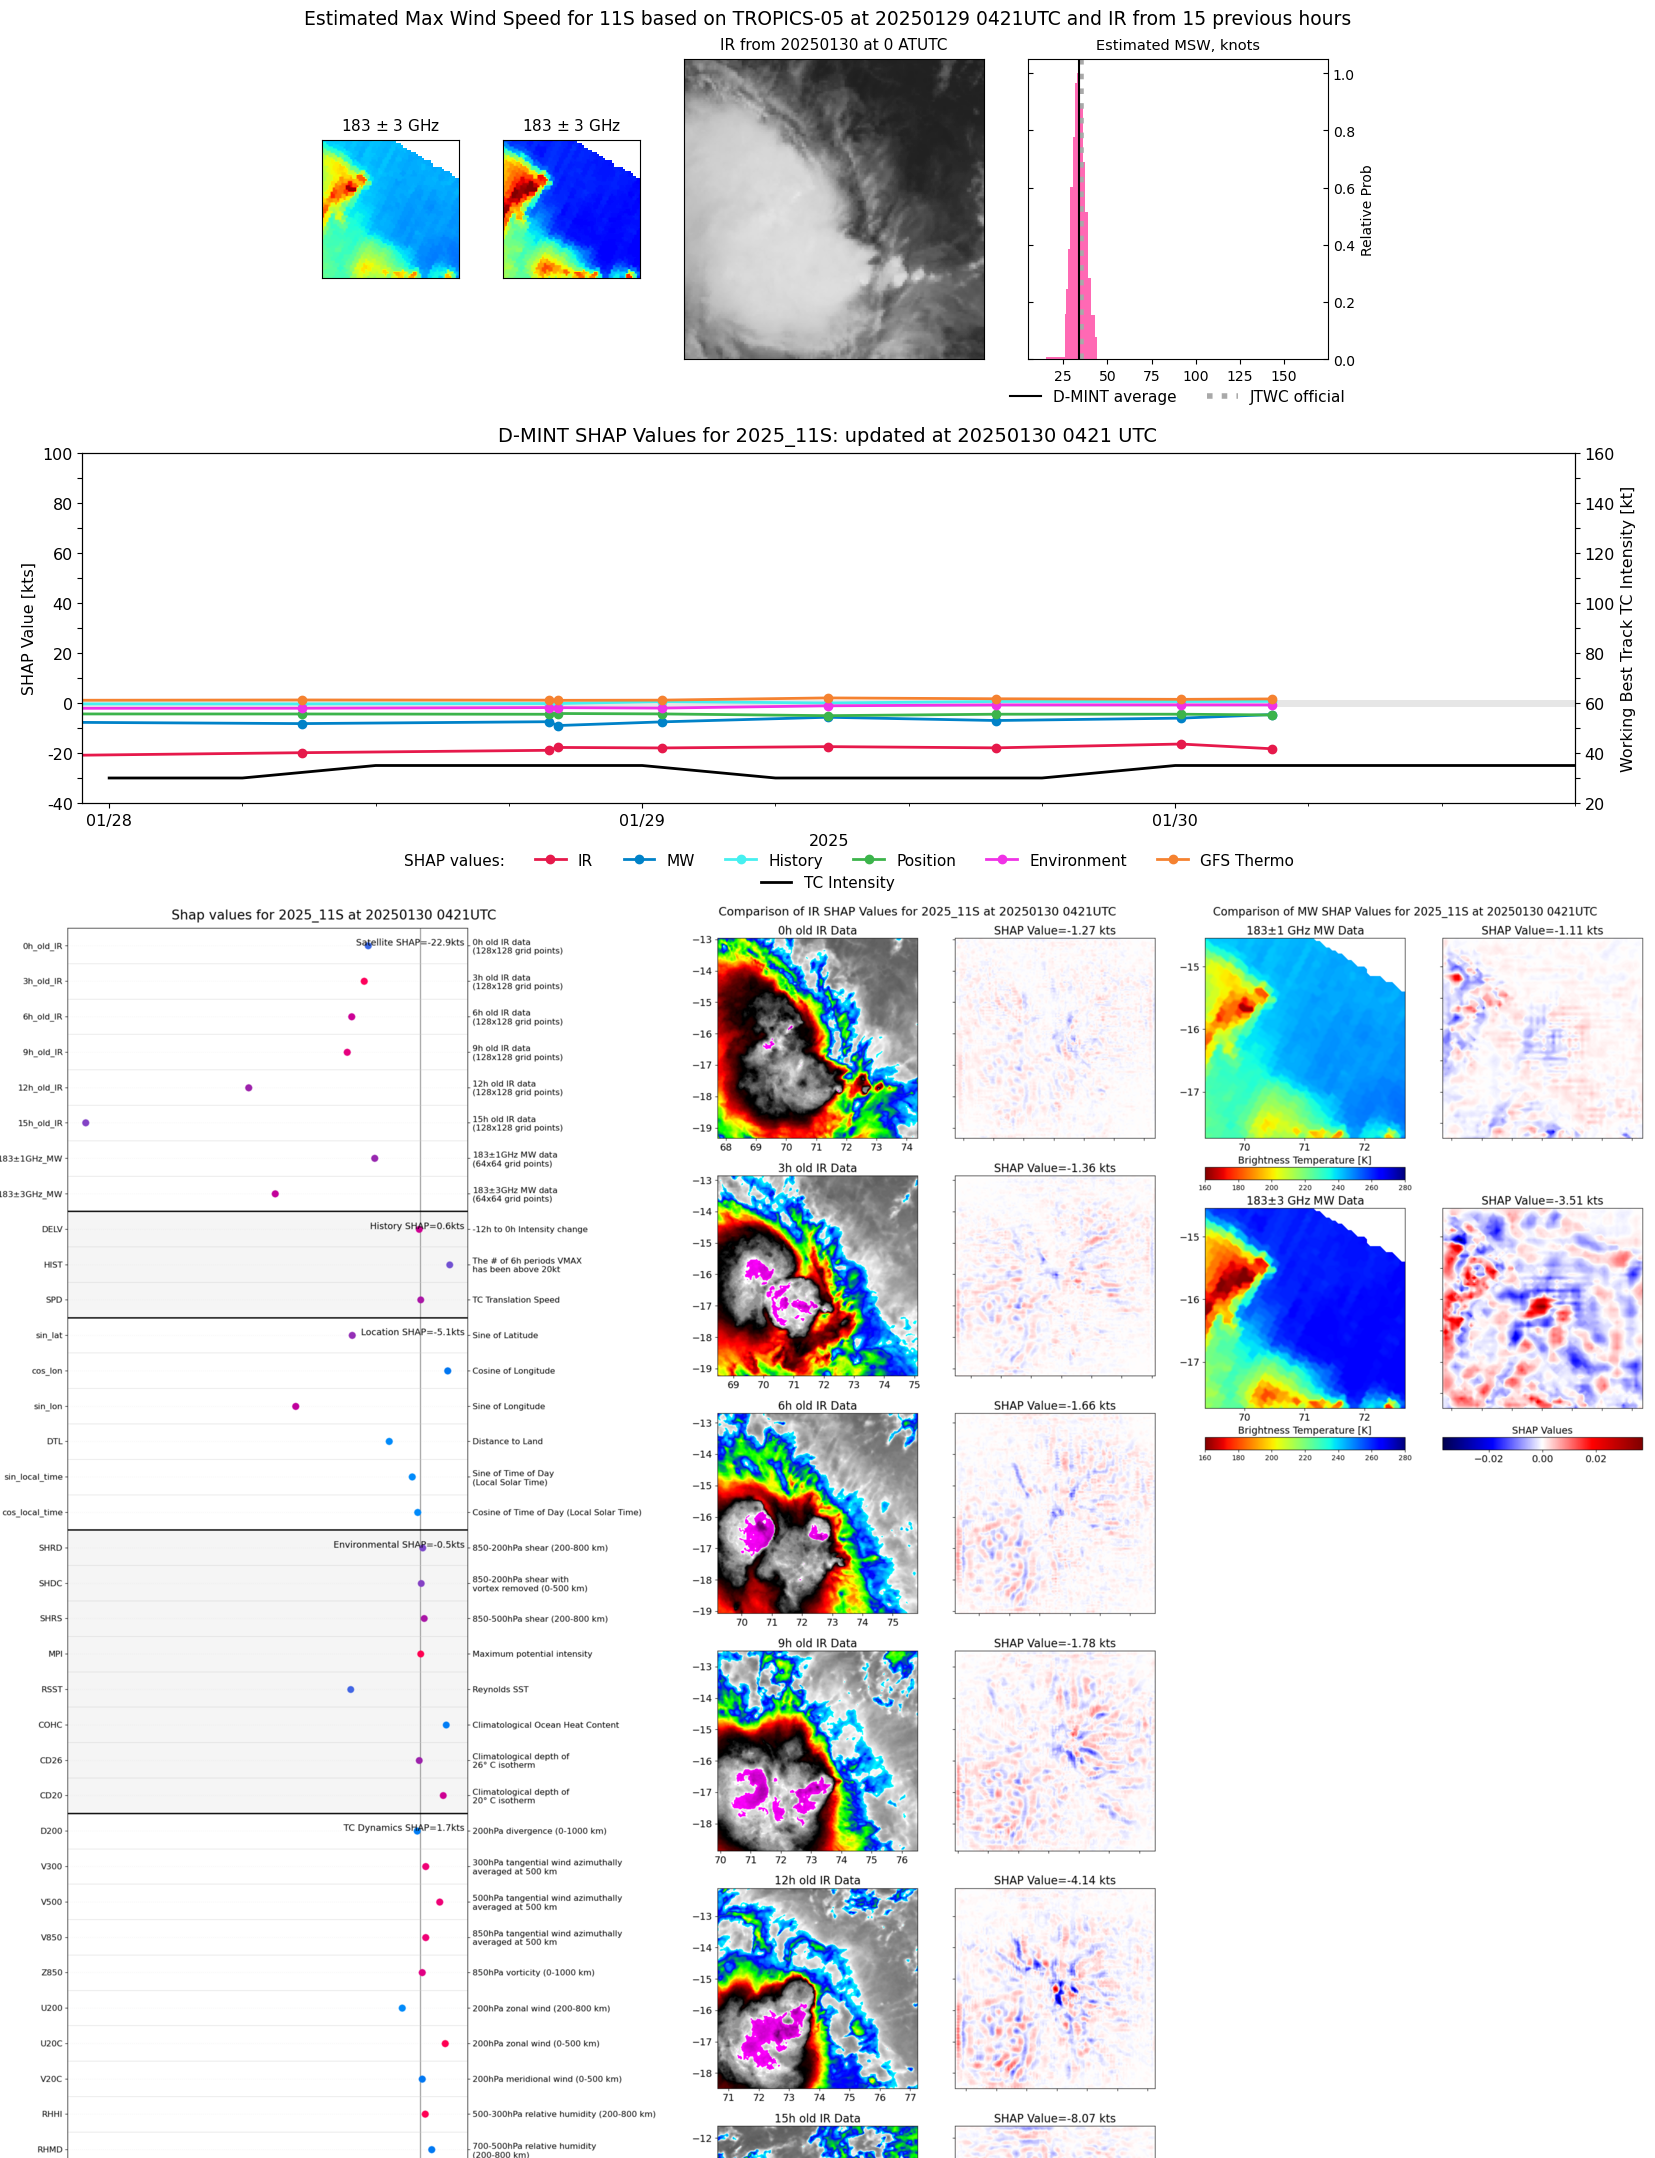 |
| 20250130 | 0121 UTC | SSMISF17 | 1001 hPa | 29 kts | 27 kts | 32 kts | 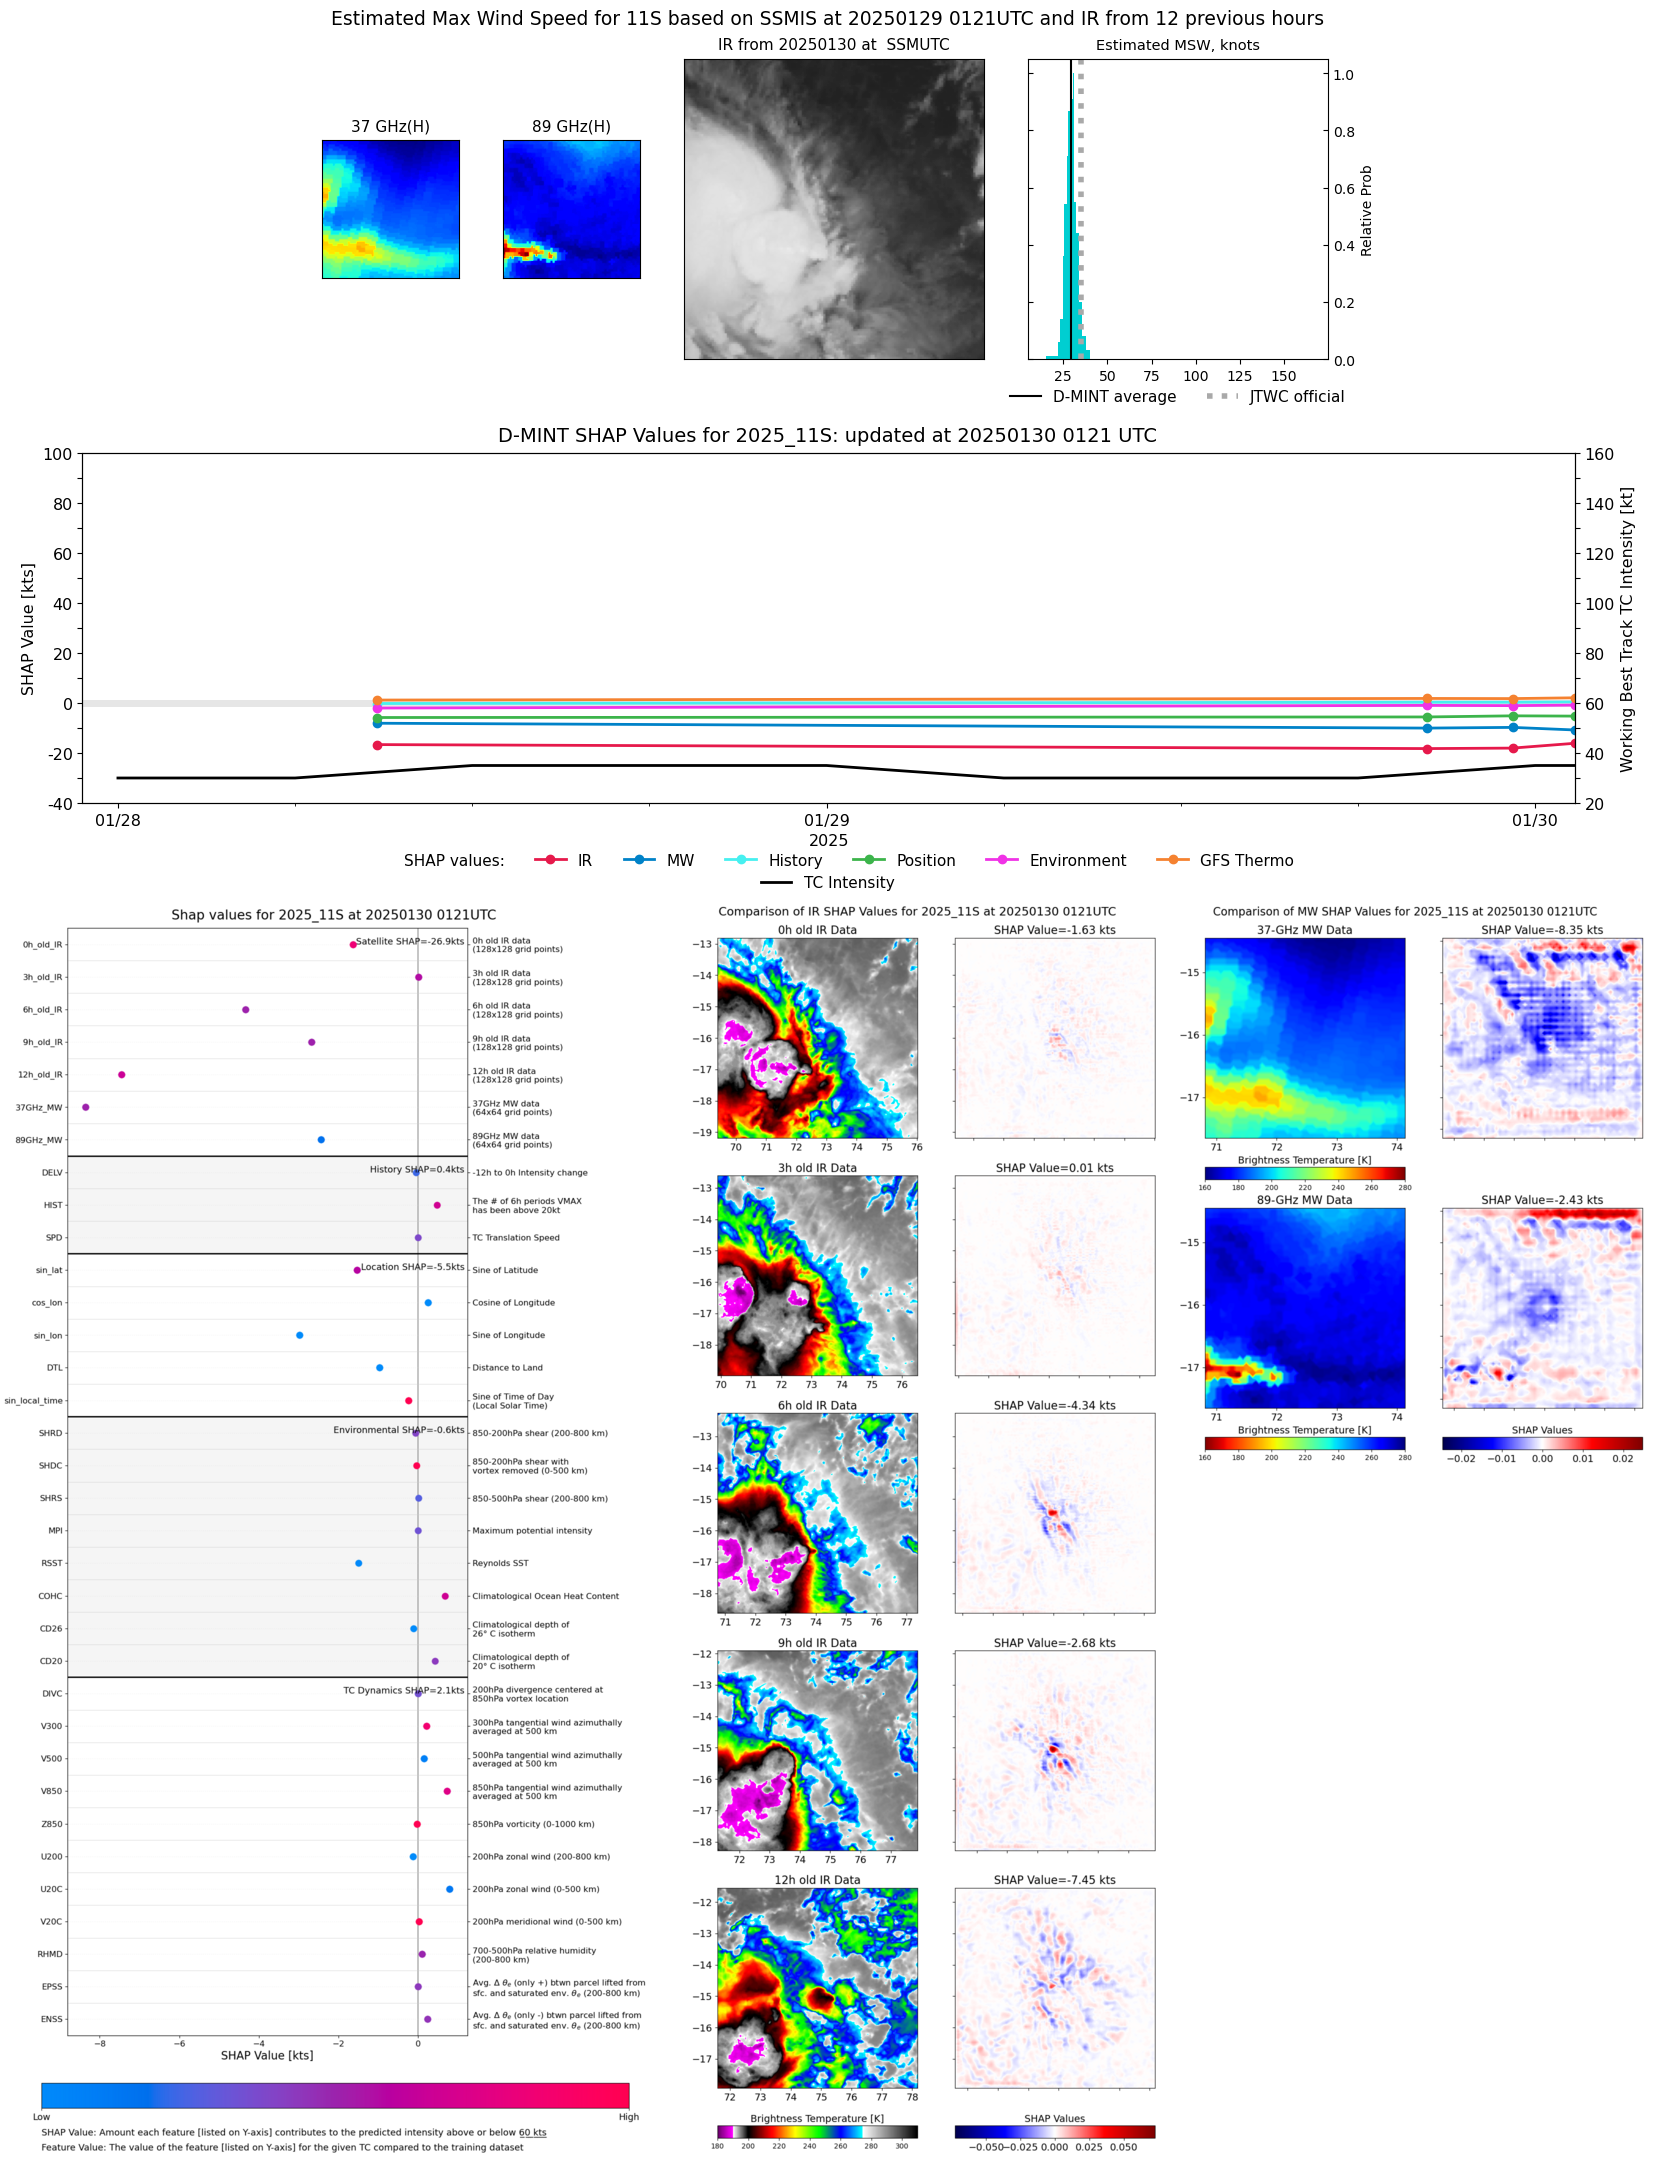 |
| 20250130 | 0015 UTC | TROPICS03 | 1000 hPa | 35 kts | 32 kts | 37 kts |  |
| 20250129 | 2314 UTC | SSMISF18 | 1003 hPa | 28 kts | 26 kts | 30 kts |  |
| 20250129 | 2021 UTC | AMSR2 | 1003 hPa | 27 kts | 26 kts | 29 kts | 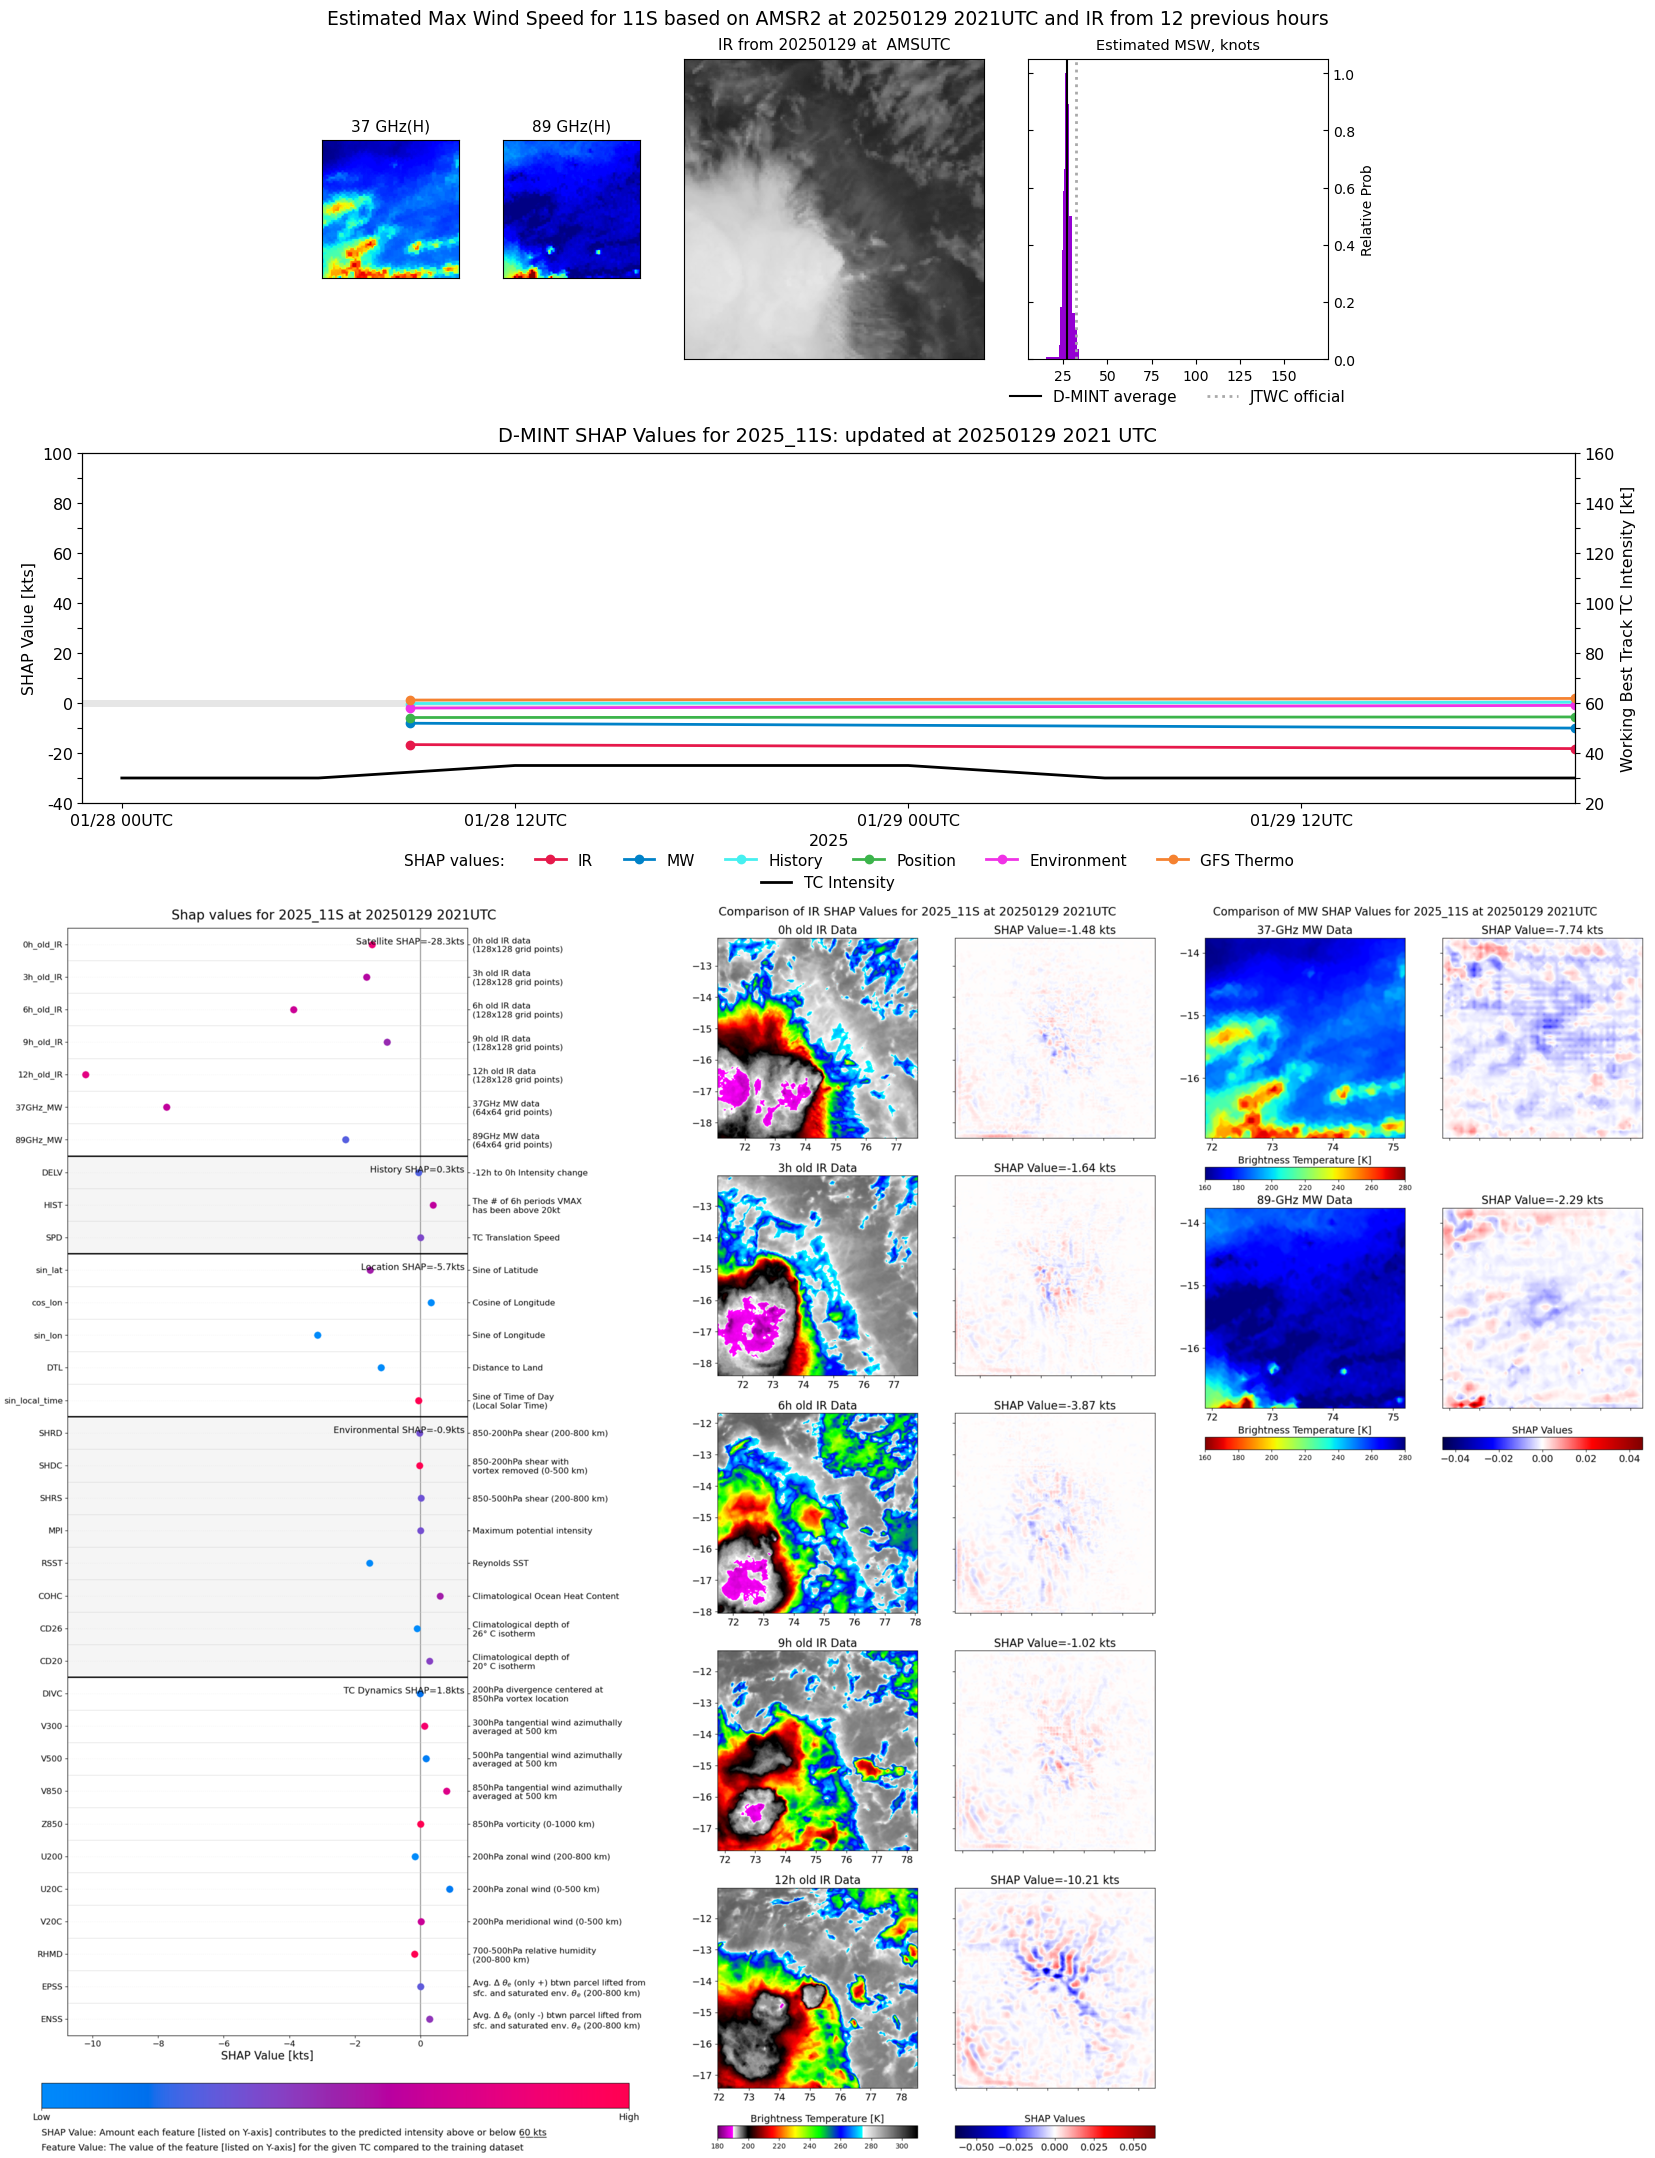 |
| 20250129 | 1556 UTC | TROPICS03 | 1001 hPa | 32 kts | 30 kts | 35 kts | 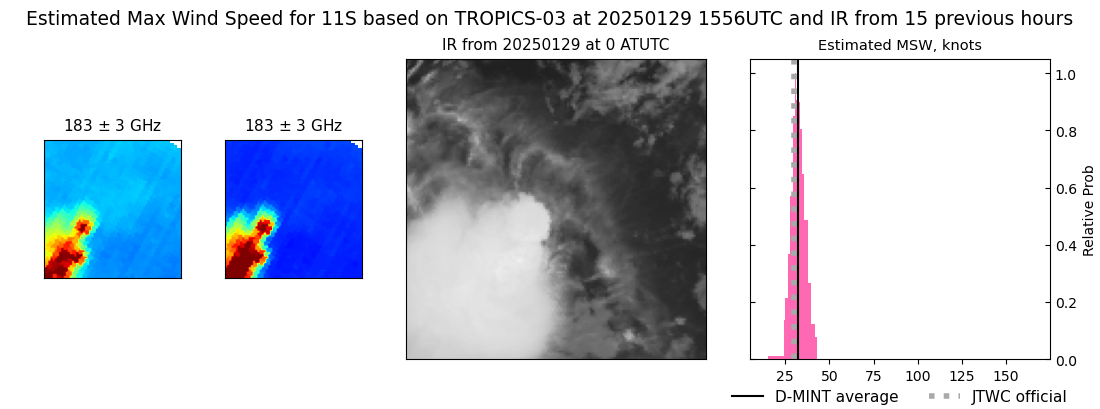 |
| 20250129 | 1303 UTC | SSMISF16 | NaN hPa | 27 kts | 26 kts | 30 kts |  |
| 20250129 | 1203 UTC | GMI | NaN hPa | 27 kts | 25 kts | 30 kts |  |
| 20250129 | 0821 UTC | ATMS-N20 | 1001 hPa | 33 kts | 30 kts | 36 kts | 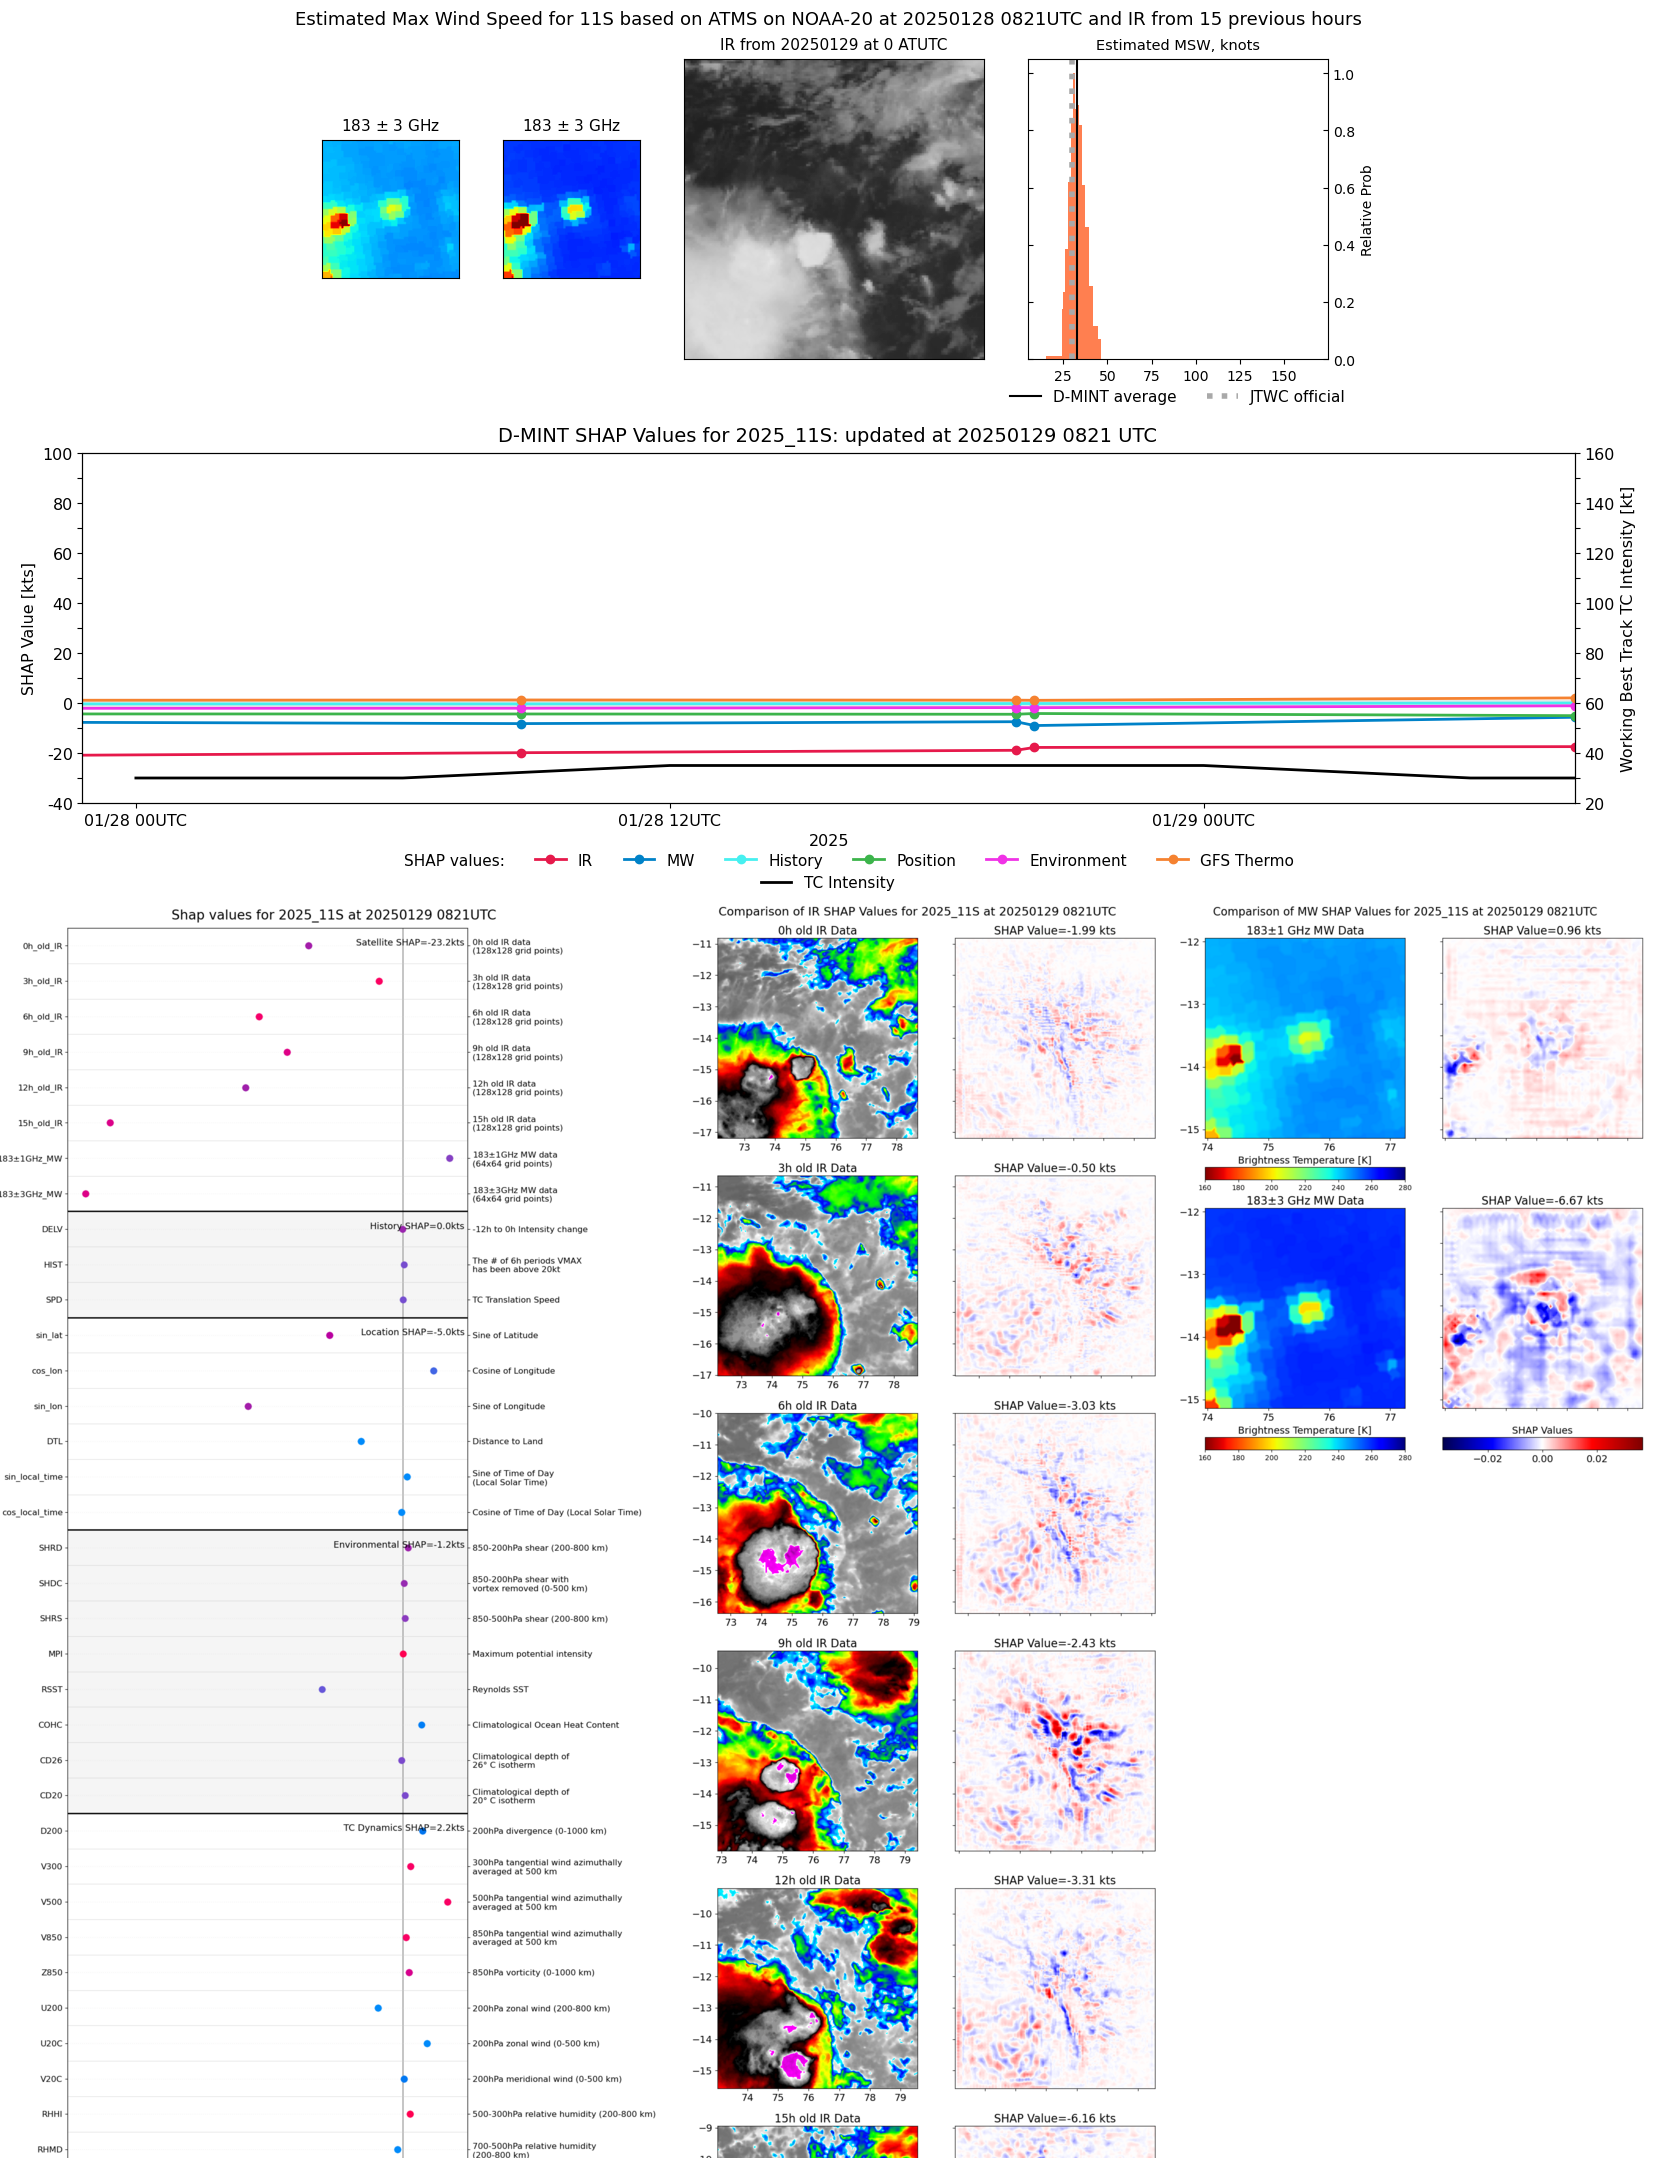 |
| 20250129 | 0053 UTC | TROPICS03 | 1002 hPa | 30 kts | 28 kts | 33 kts | 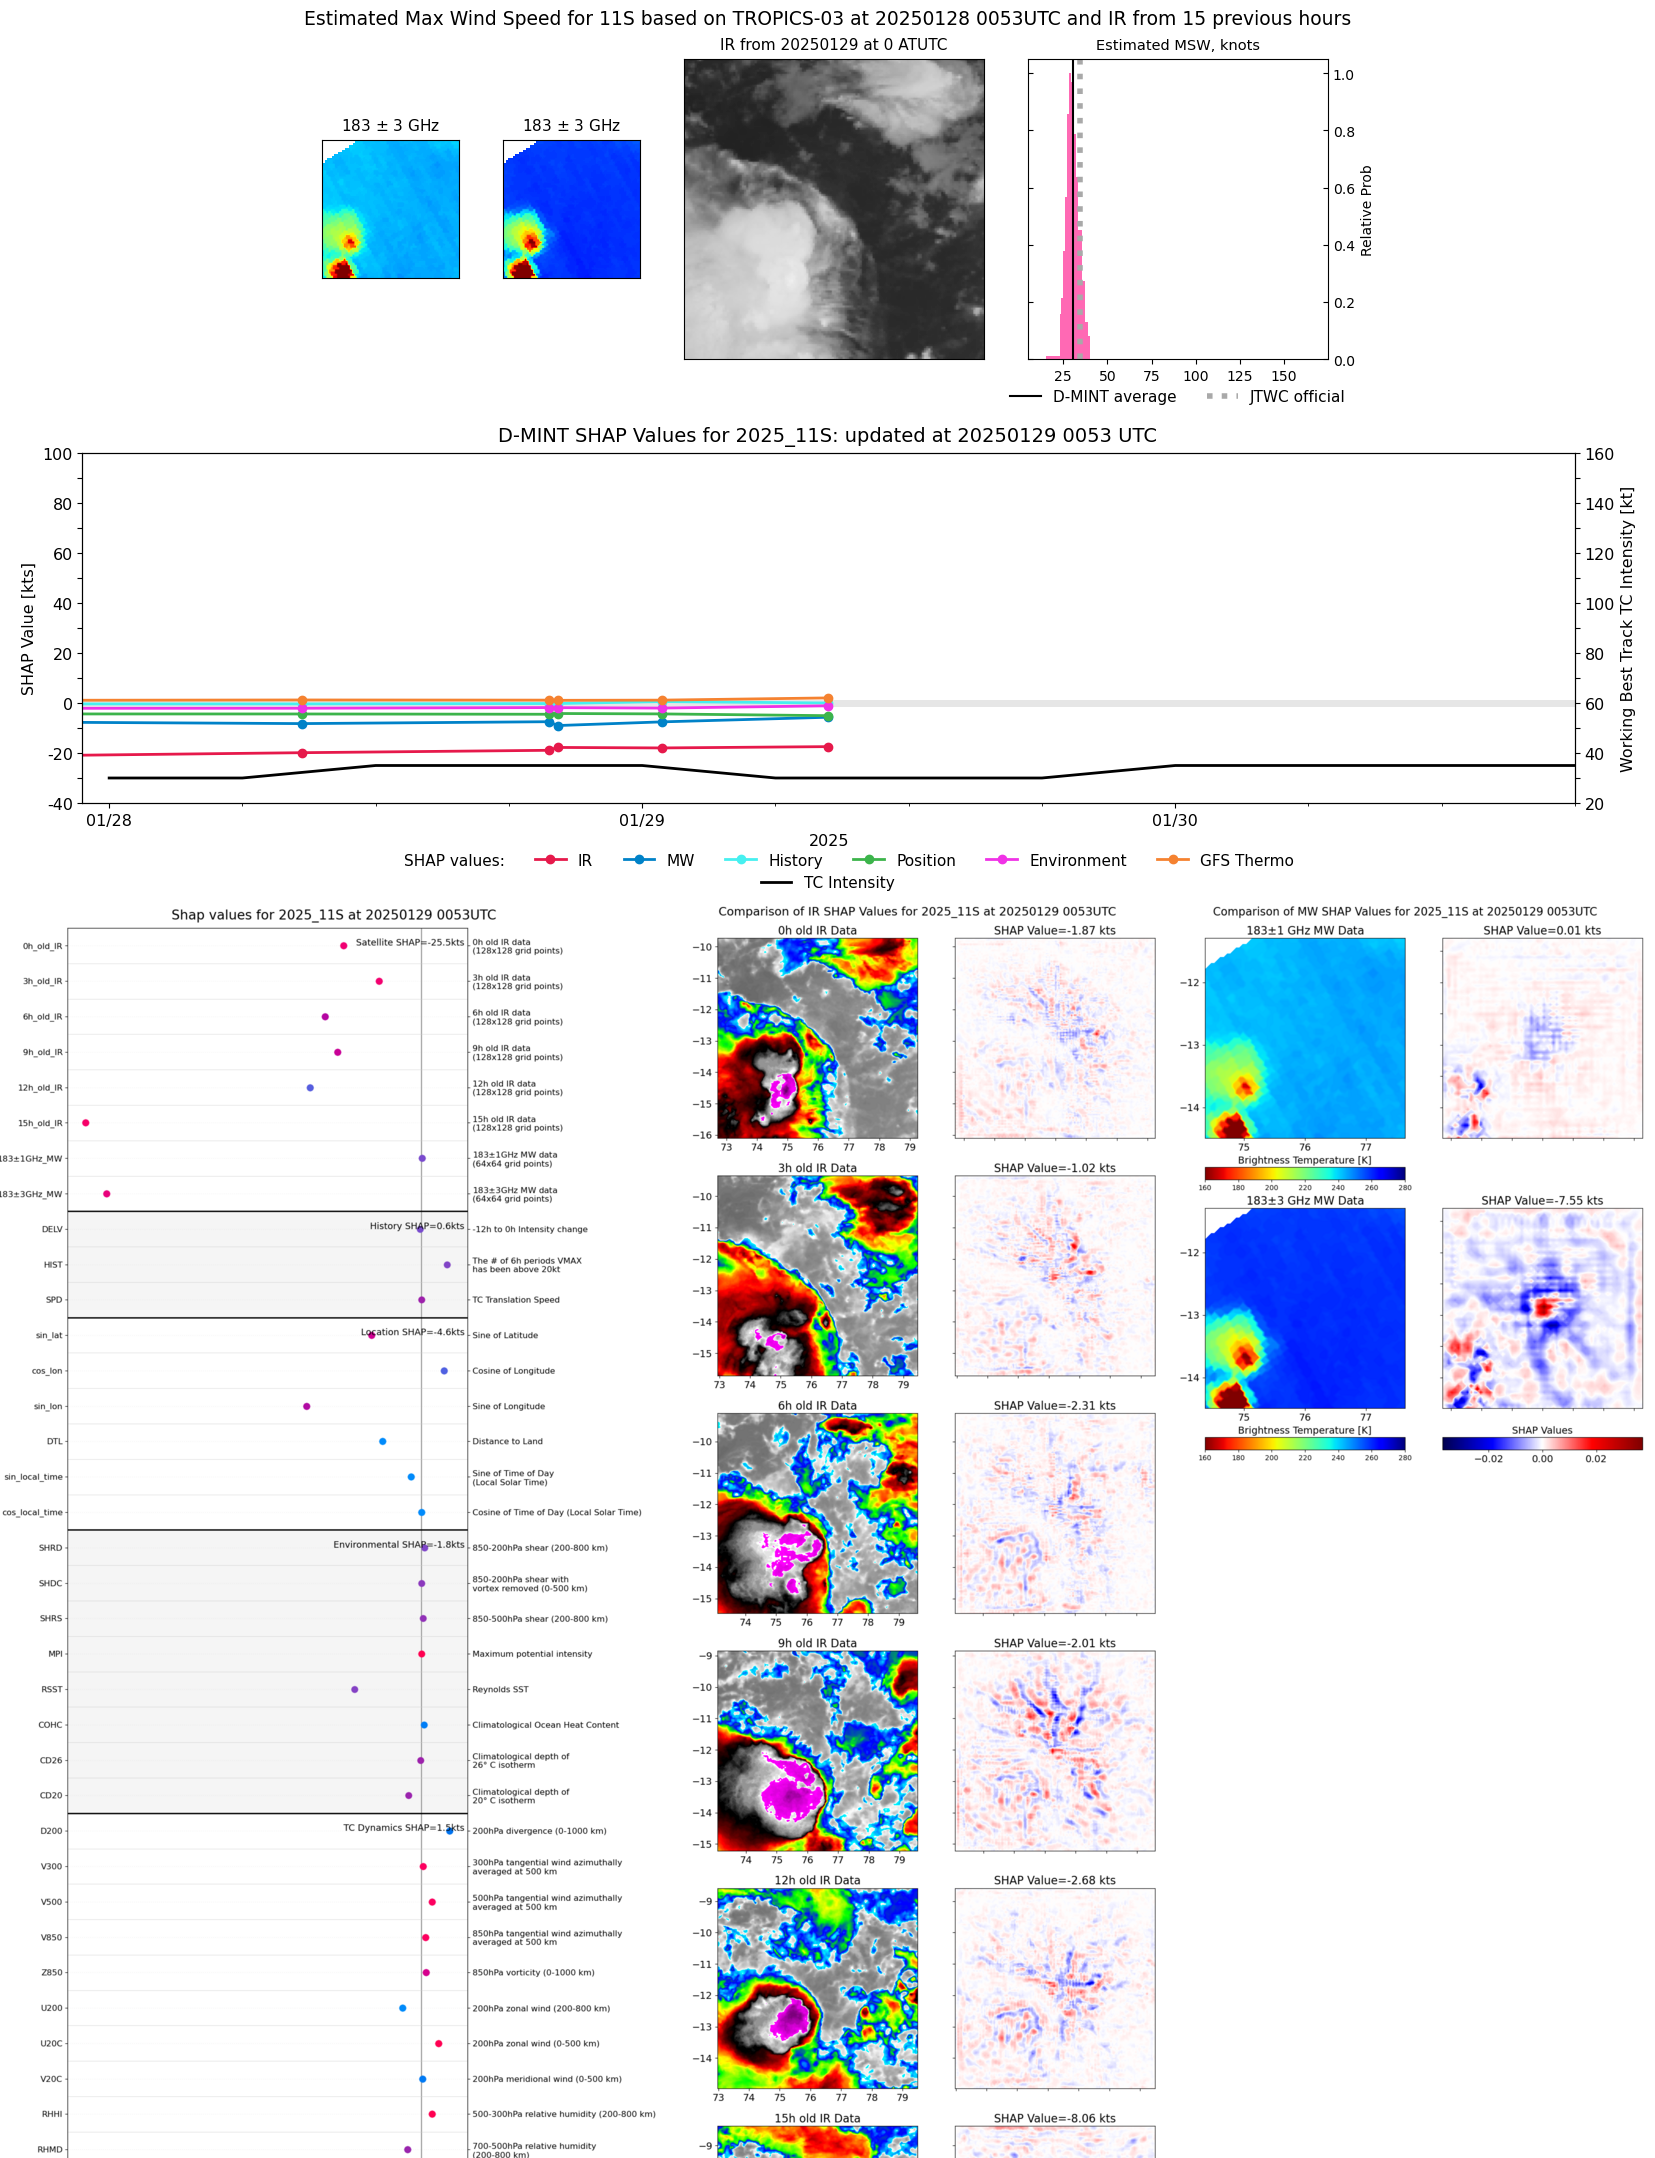 |
| 20250128 | 2012 UTC | ATMS-N2 | 1000 hPa | 28 kts | 26 kts | 31 kts | 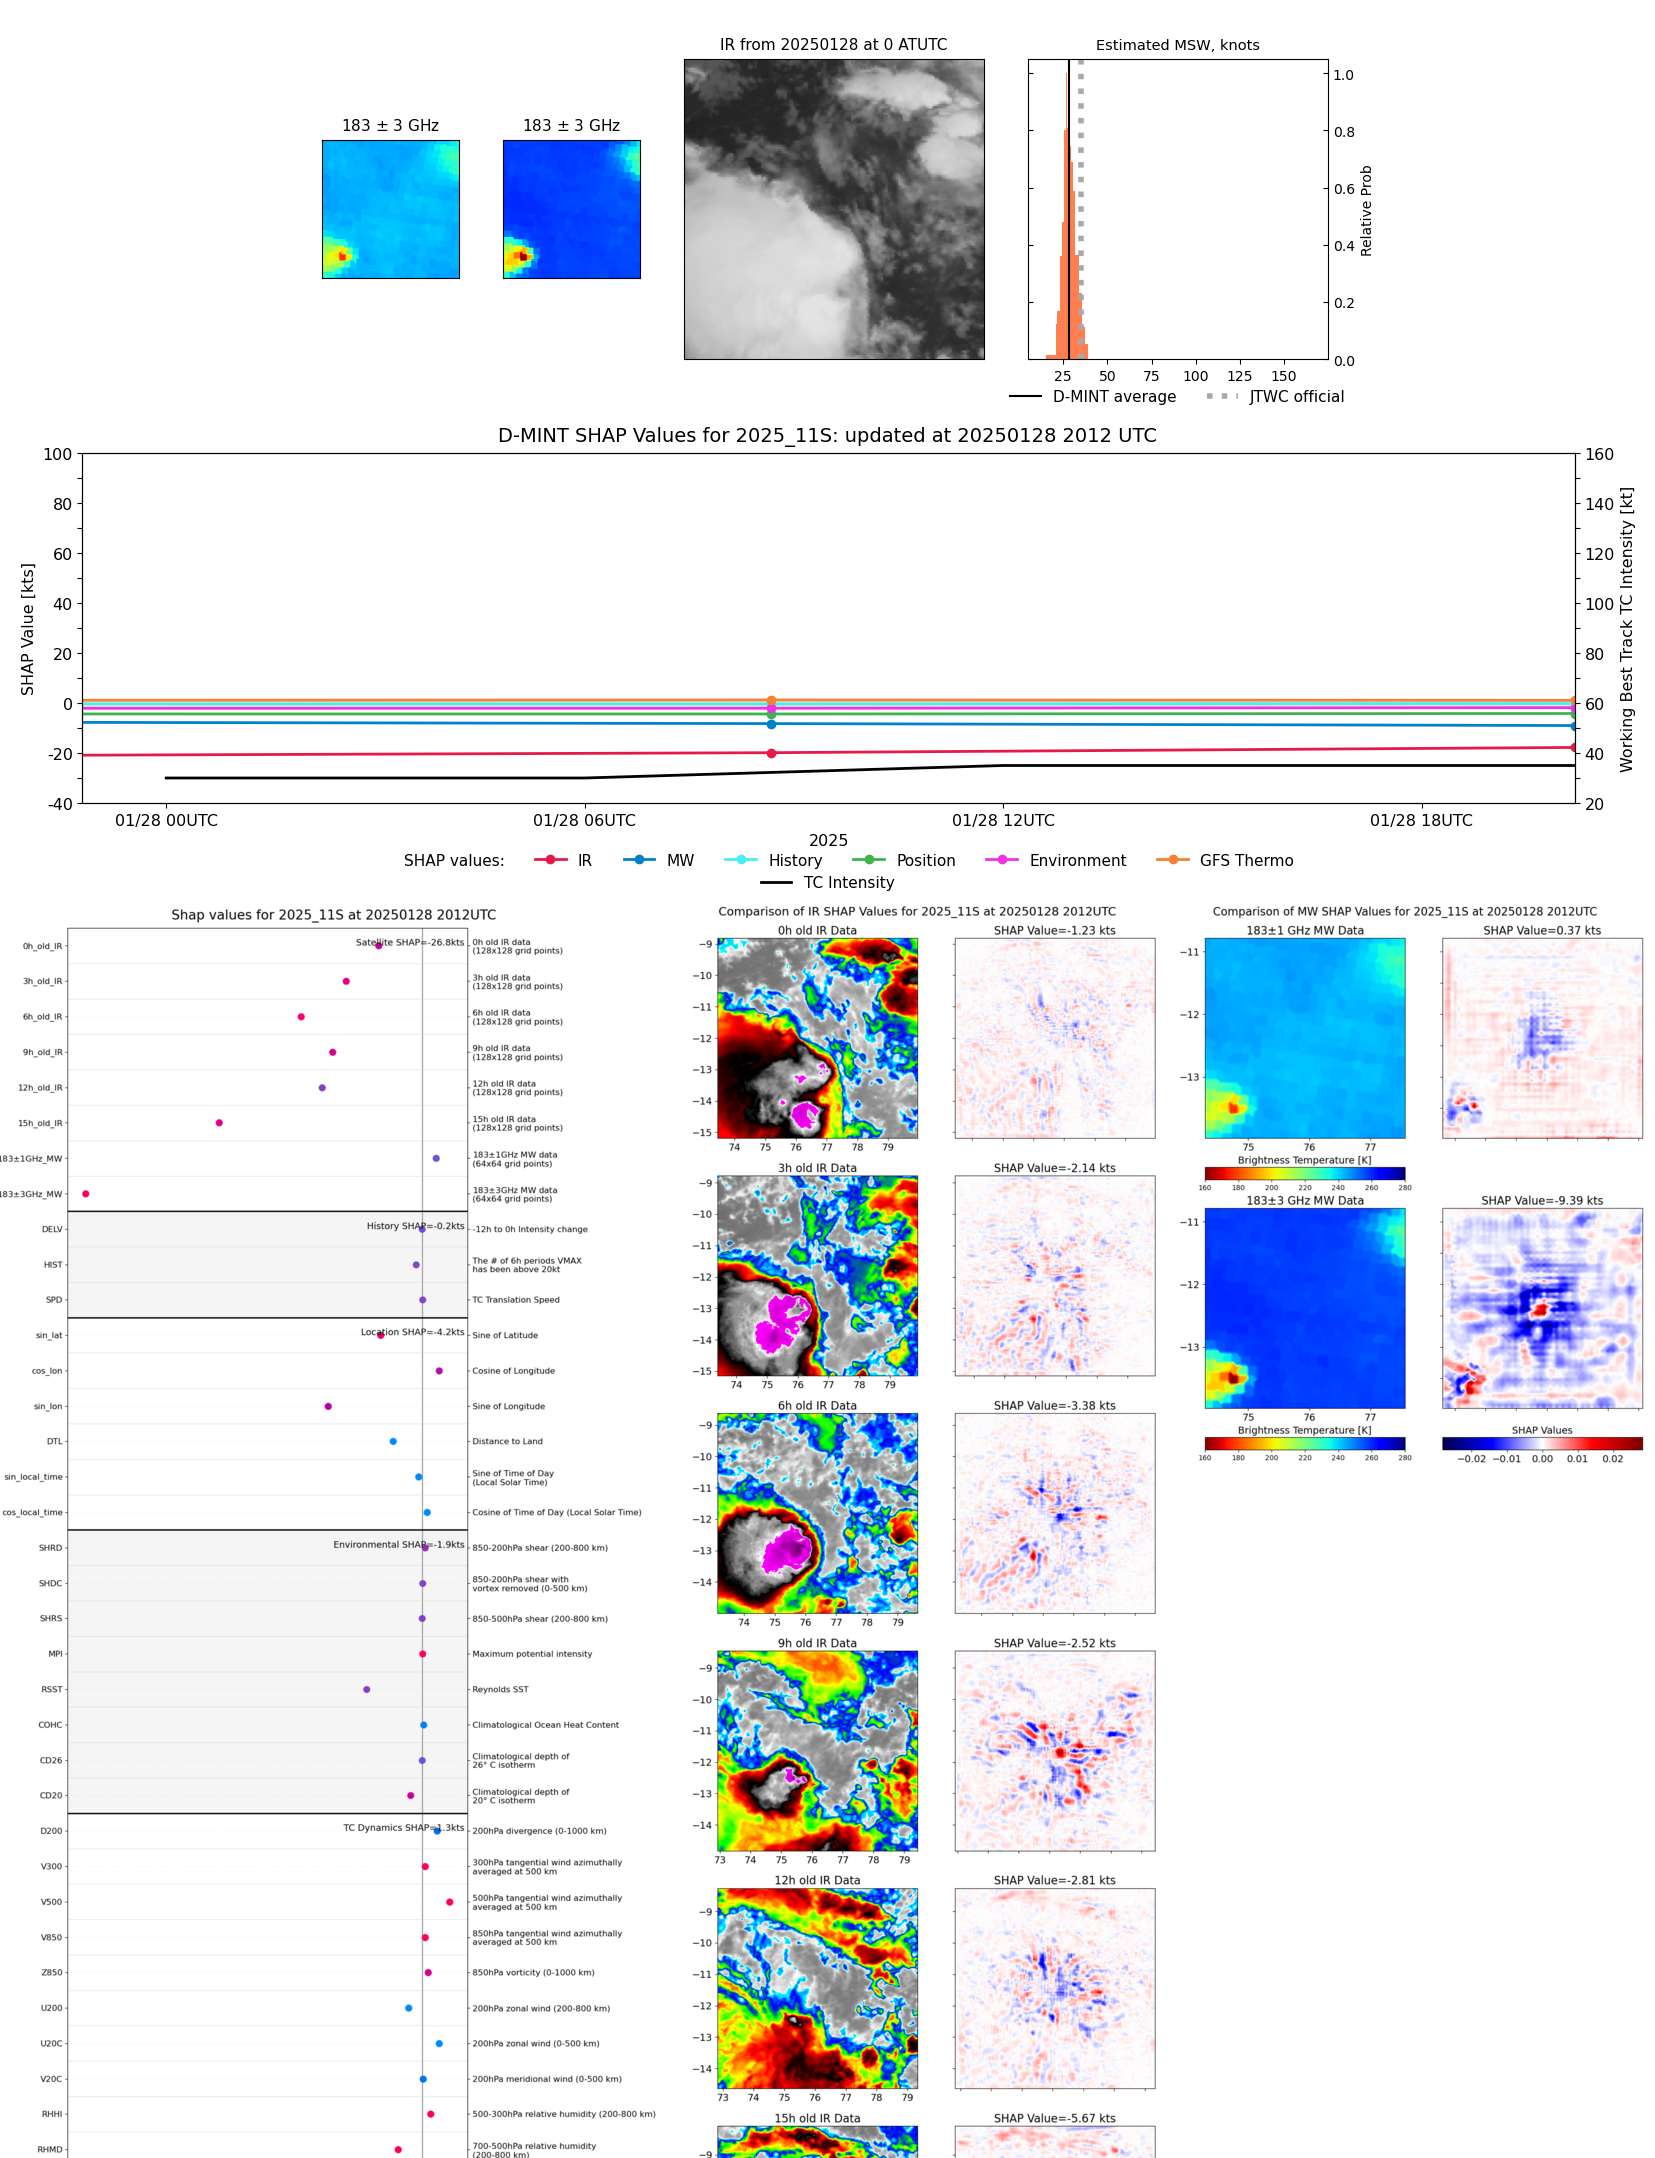 |
| 20250128 | 1947 UTC | ATMS-N20 | 999 hPa | 28 kts | 26 kts | 31 kts | 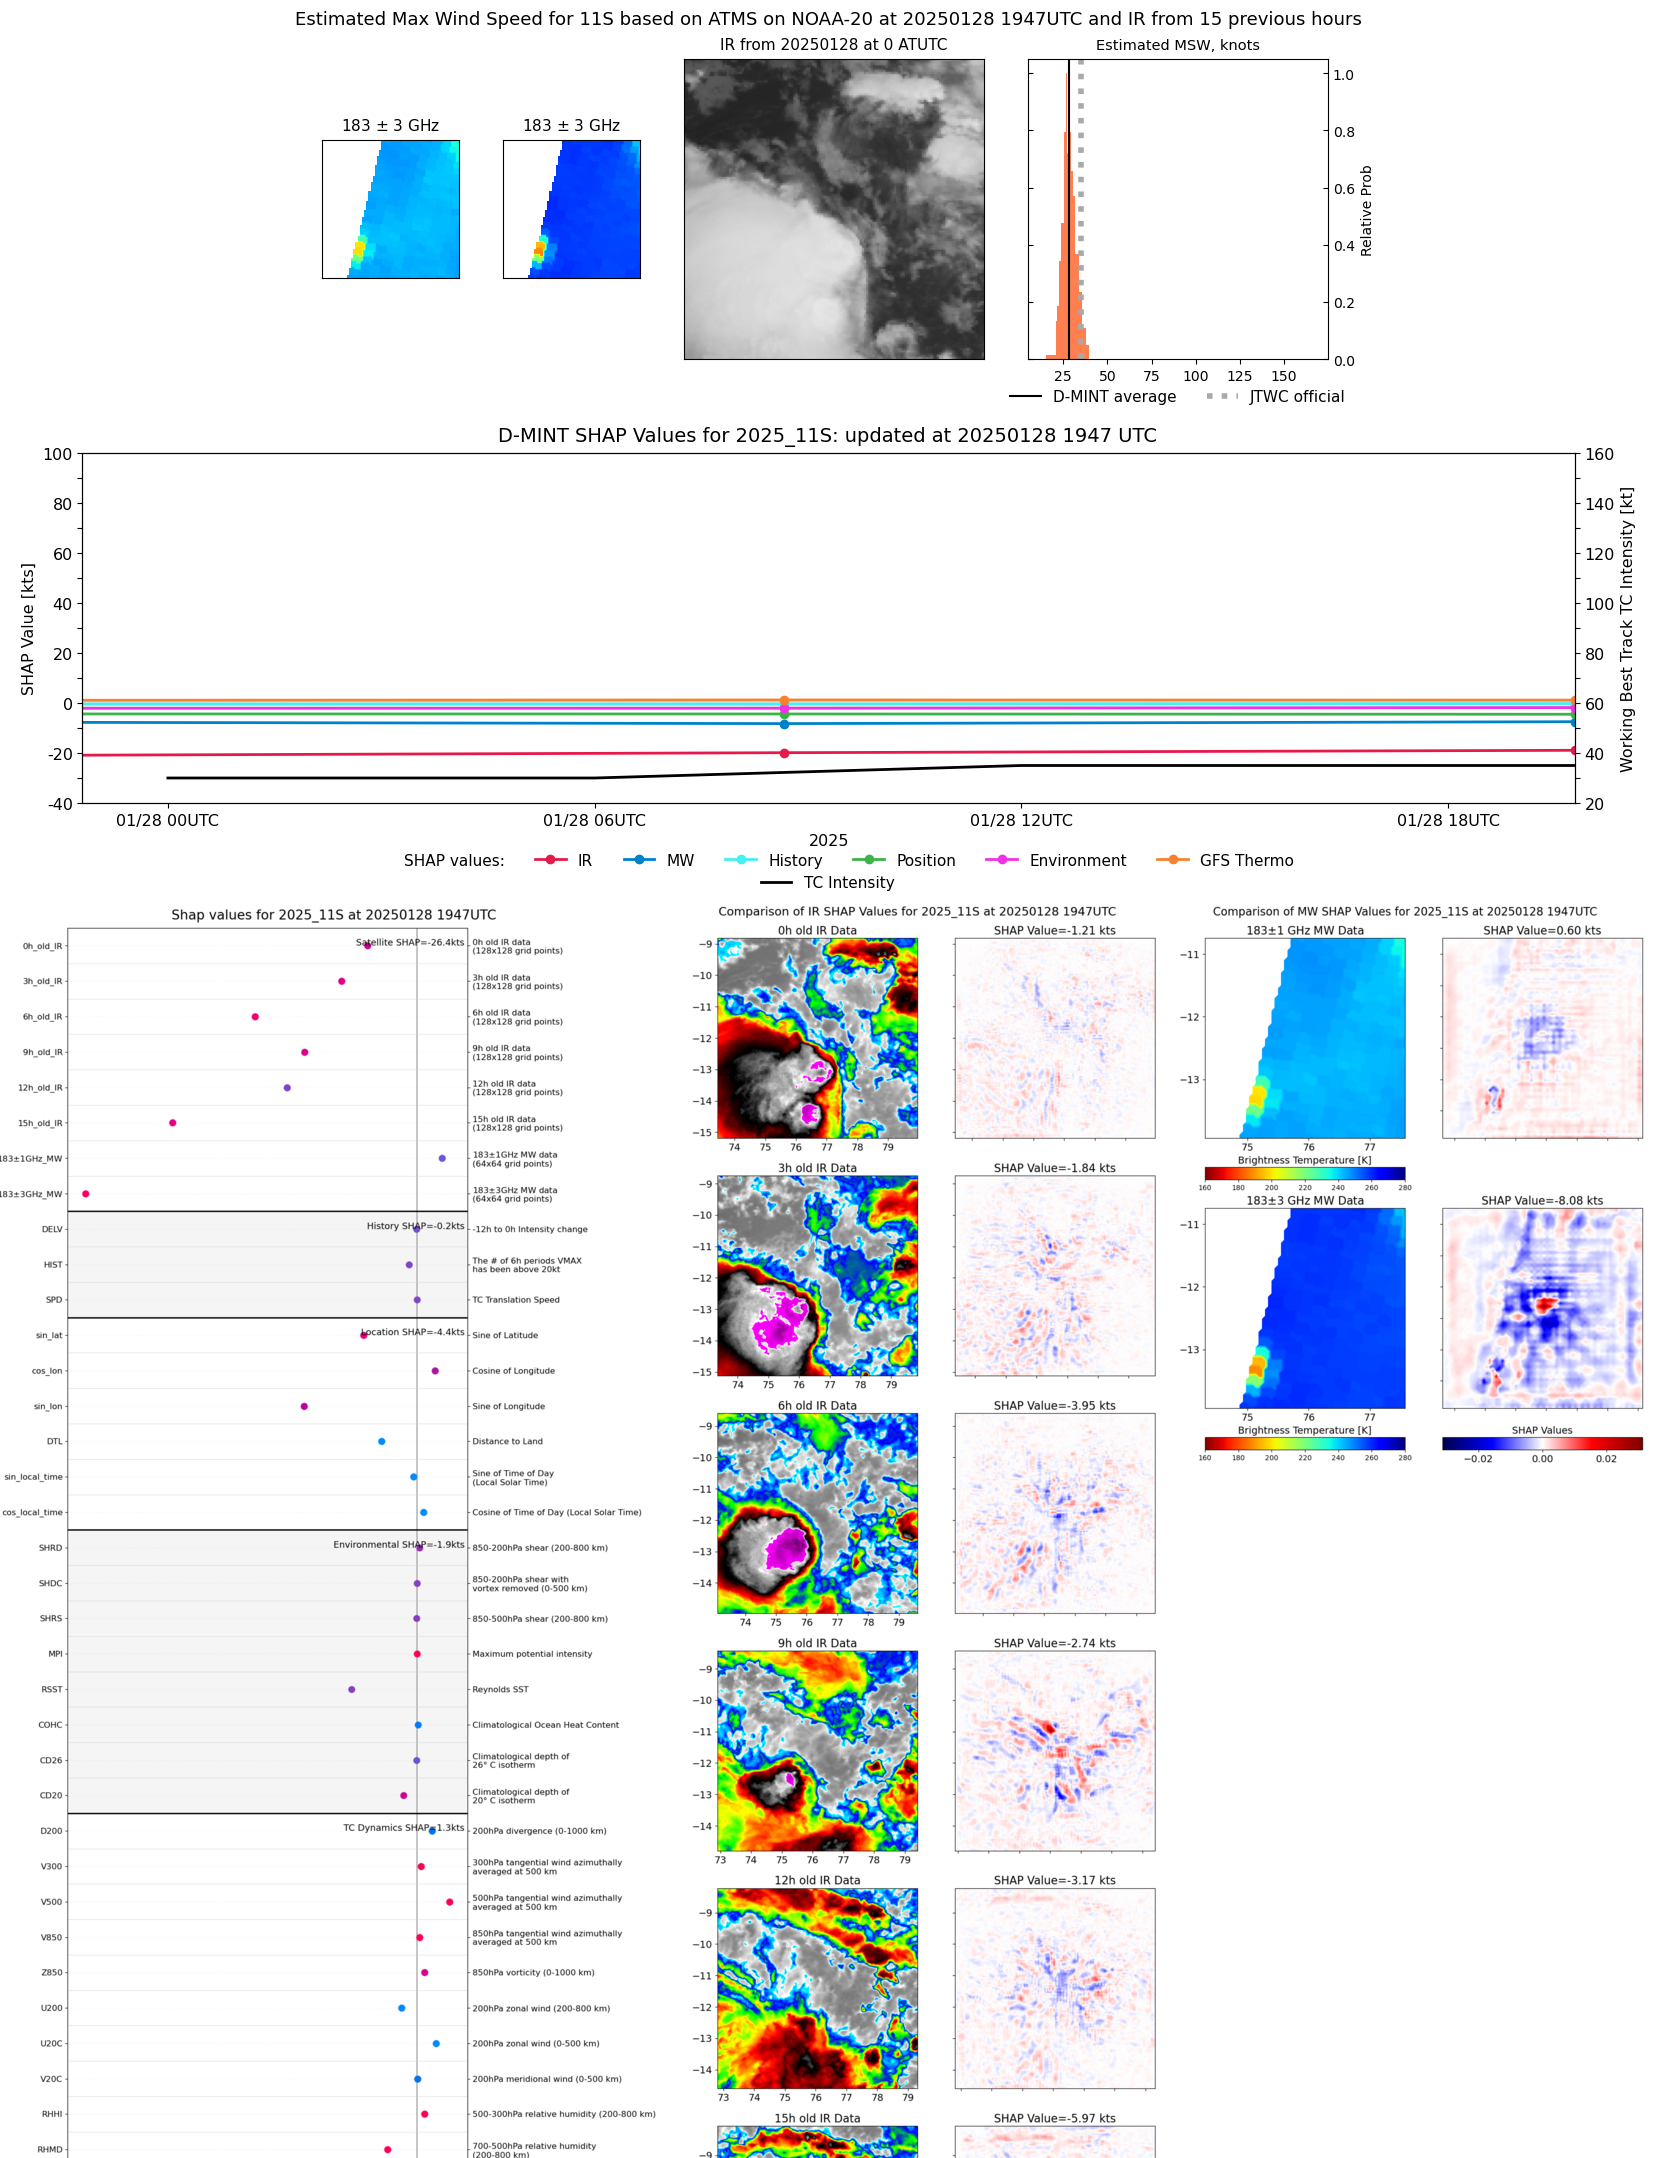 |
| 20250128 | 0847 UTC | AMSR2 | 999 hPa | 28 kts | 26 kts | 31 kts | 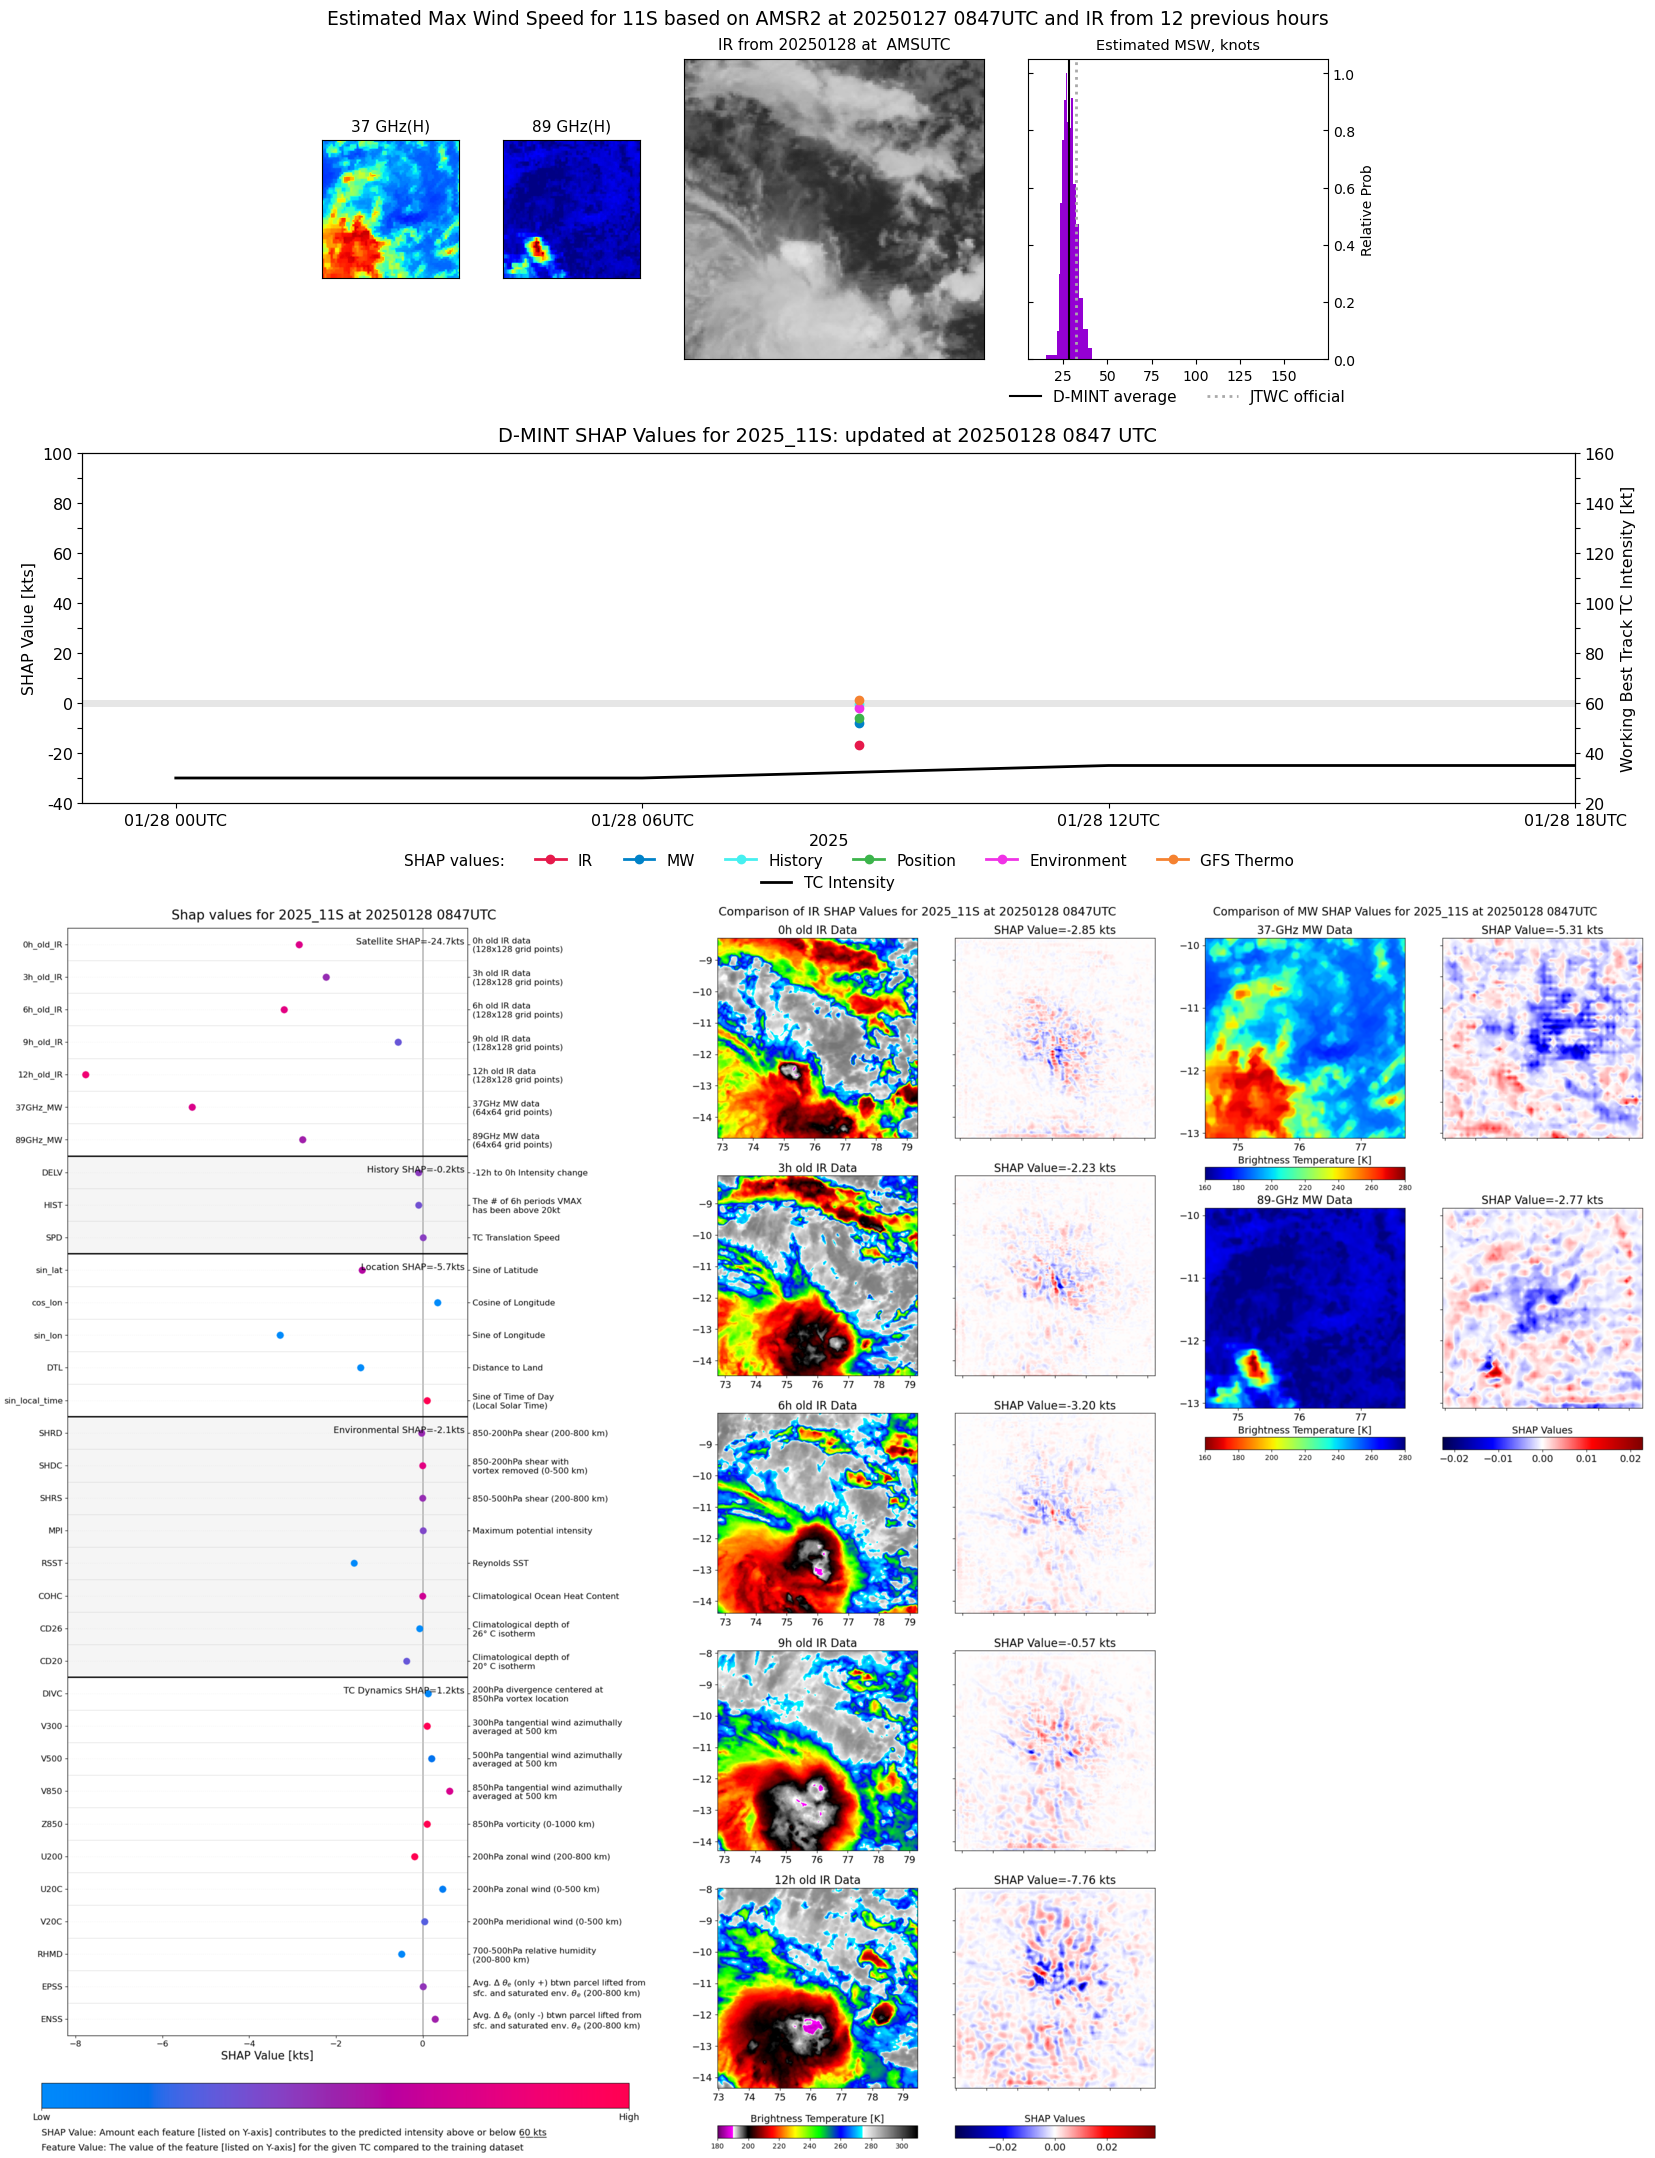 |
| 20250128 | 0840 UTC | ATMS-N20 | 1001 hPa | 27 kts | 25 kts | 29 kts | 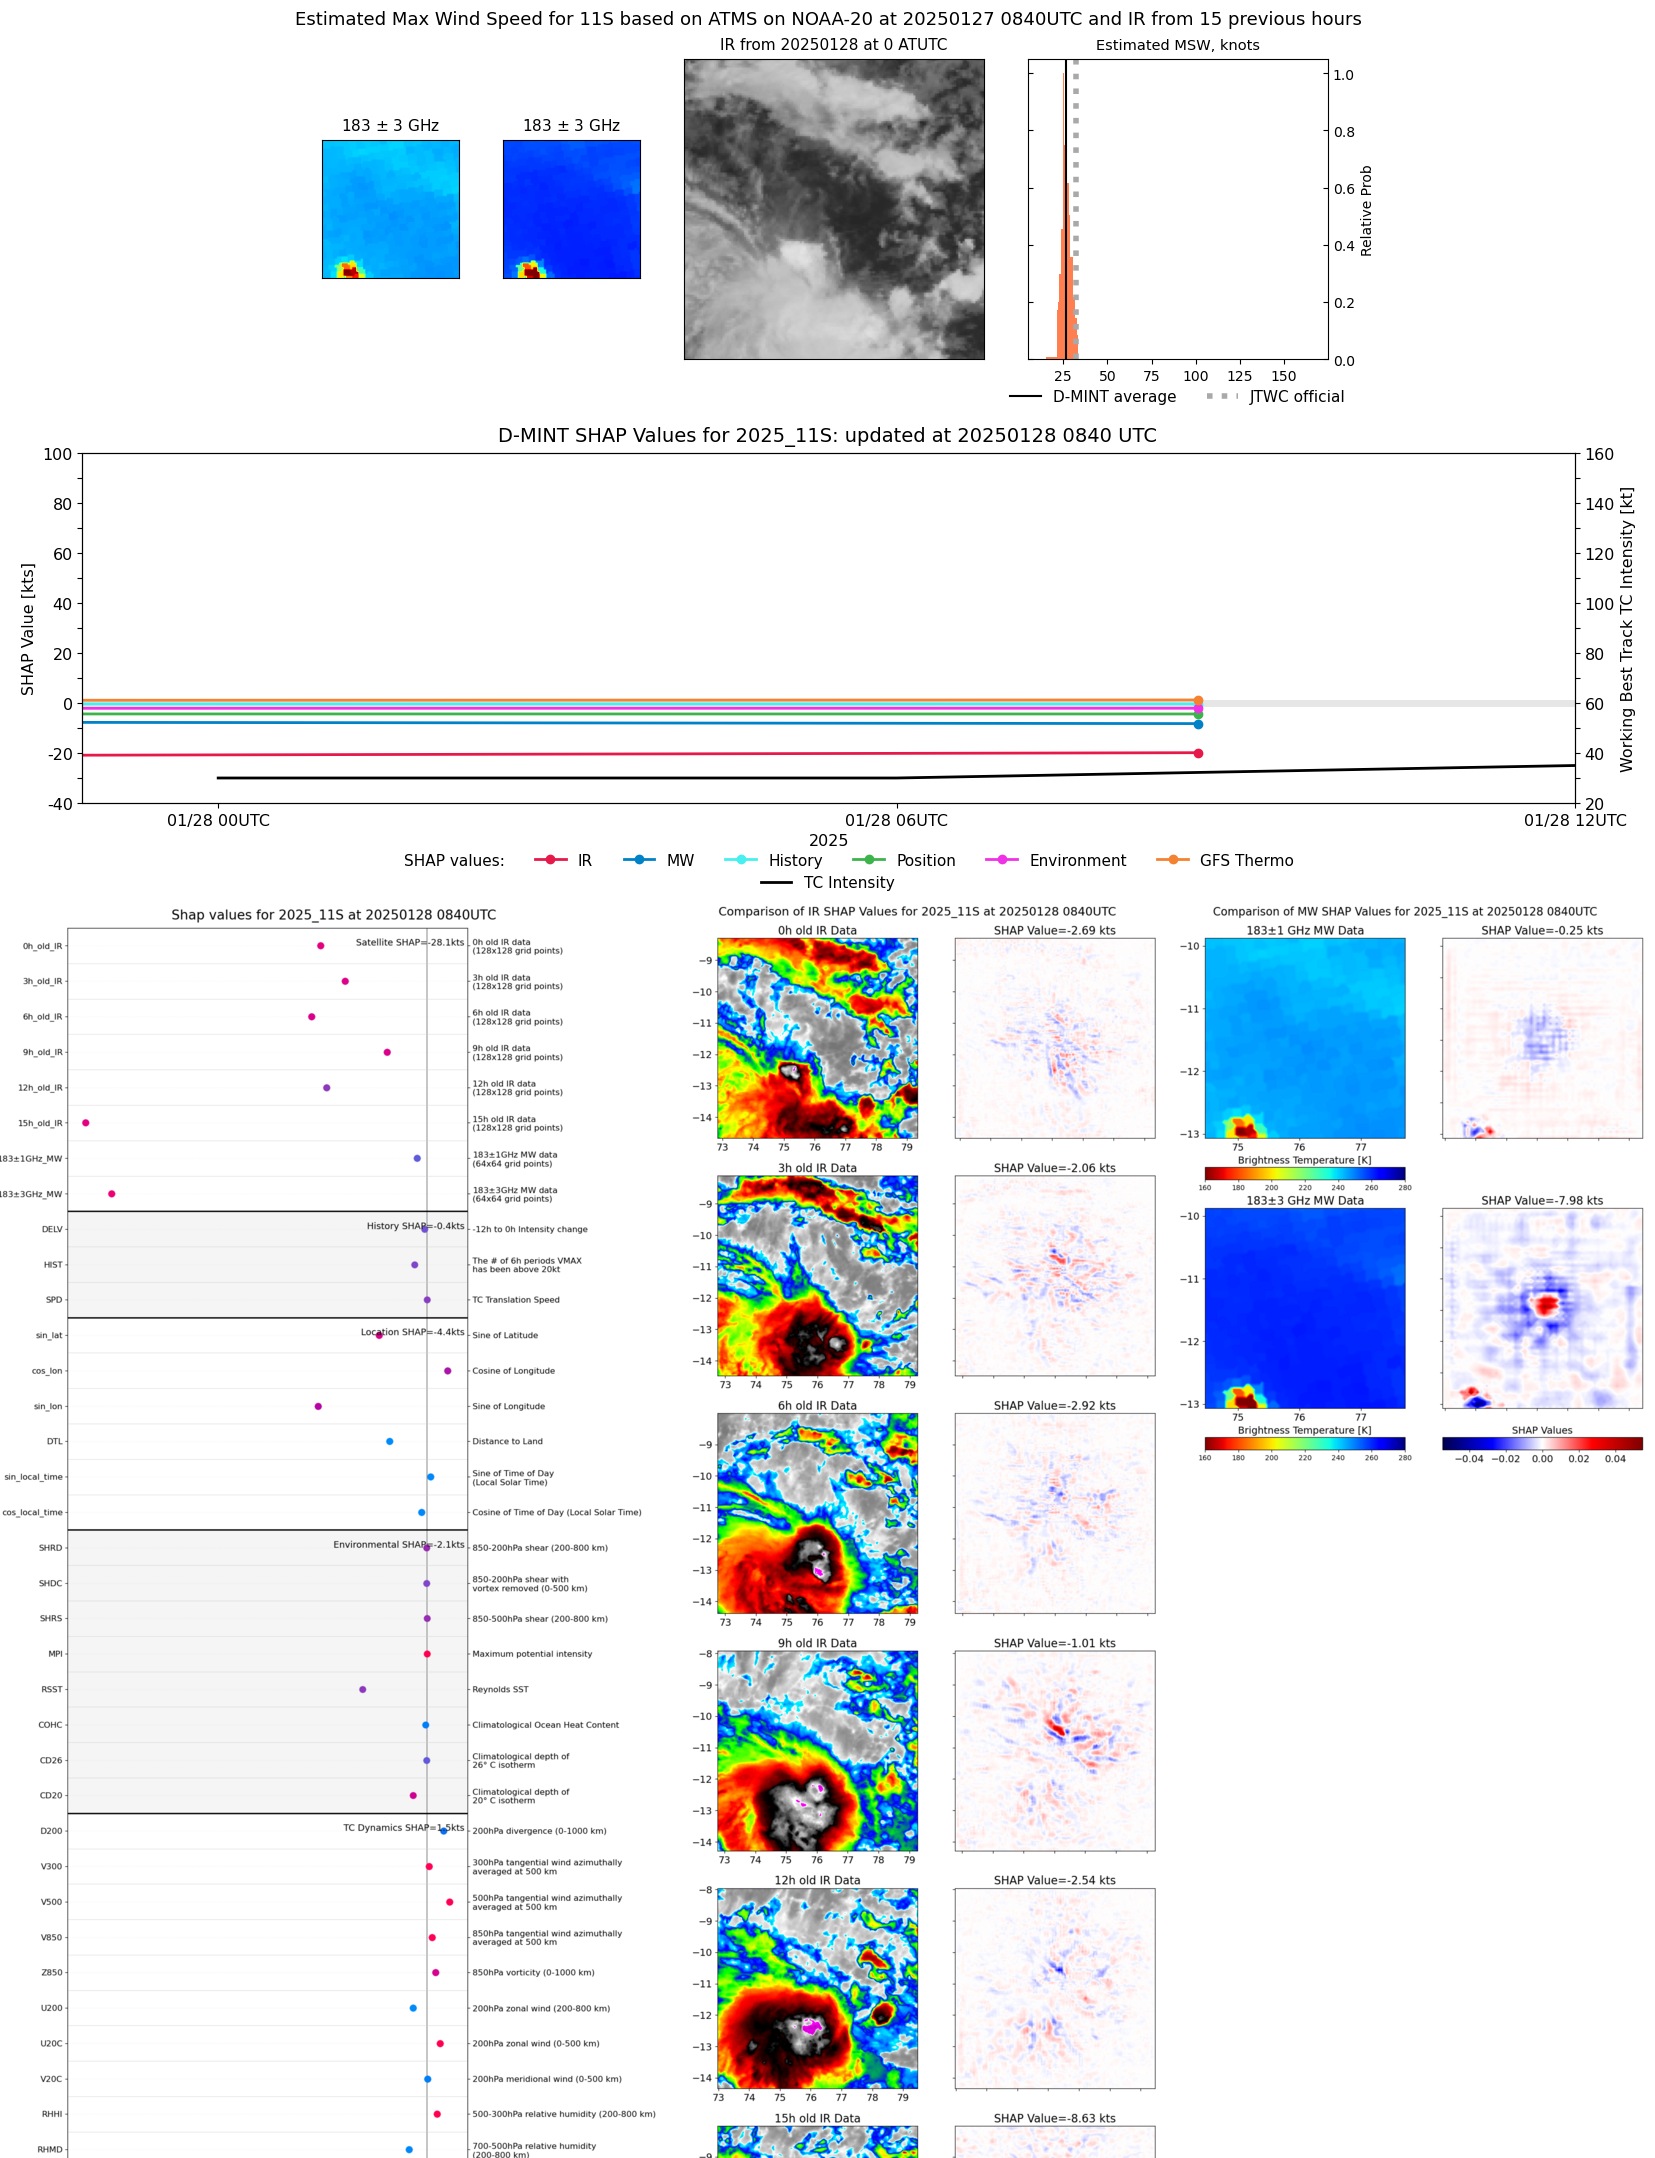 |
| 20250127 | 2006 UTC | ATMS-N20 | 1002 hPa | 26 kts | 25 kts | 27 kts |  |