|
||

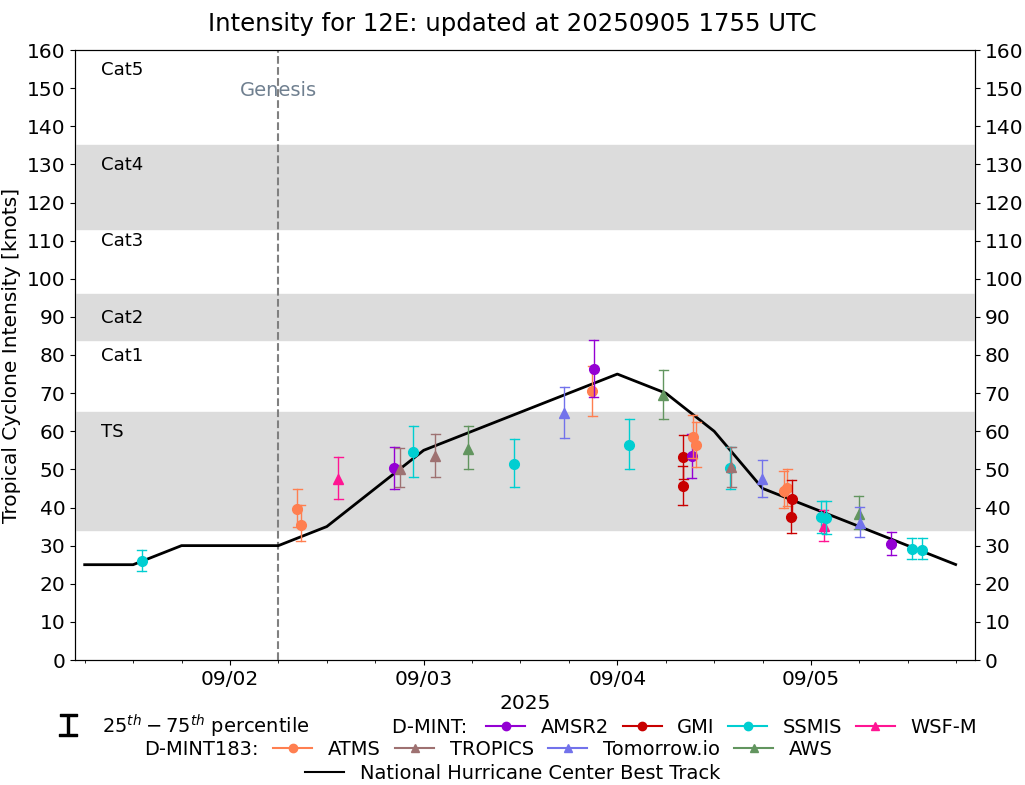 |
D-MINT HISTORY FILE for 2025_12E
| Date | Time | MW Sensor | MSLP | Vmax (30th-70th percentile average) | Vmax 25th percentile | Vmax 75th percentile | Image |
| 20250905 | 1346 UTC | SSMISF17 | 1002 hPa | 29 kts | 26 kts | 32 kts |  |
| 20250905 | 1227 UTC | SSMISF18 | 1001 hPa | 29 kts | 26 kts | 32 kts | 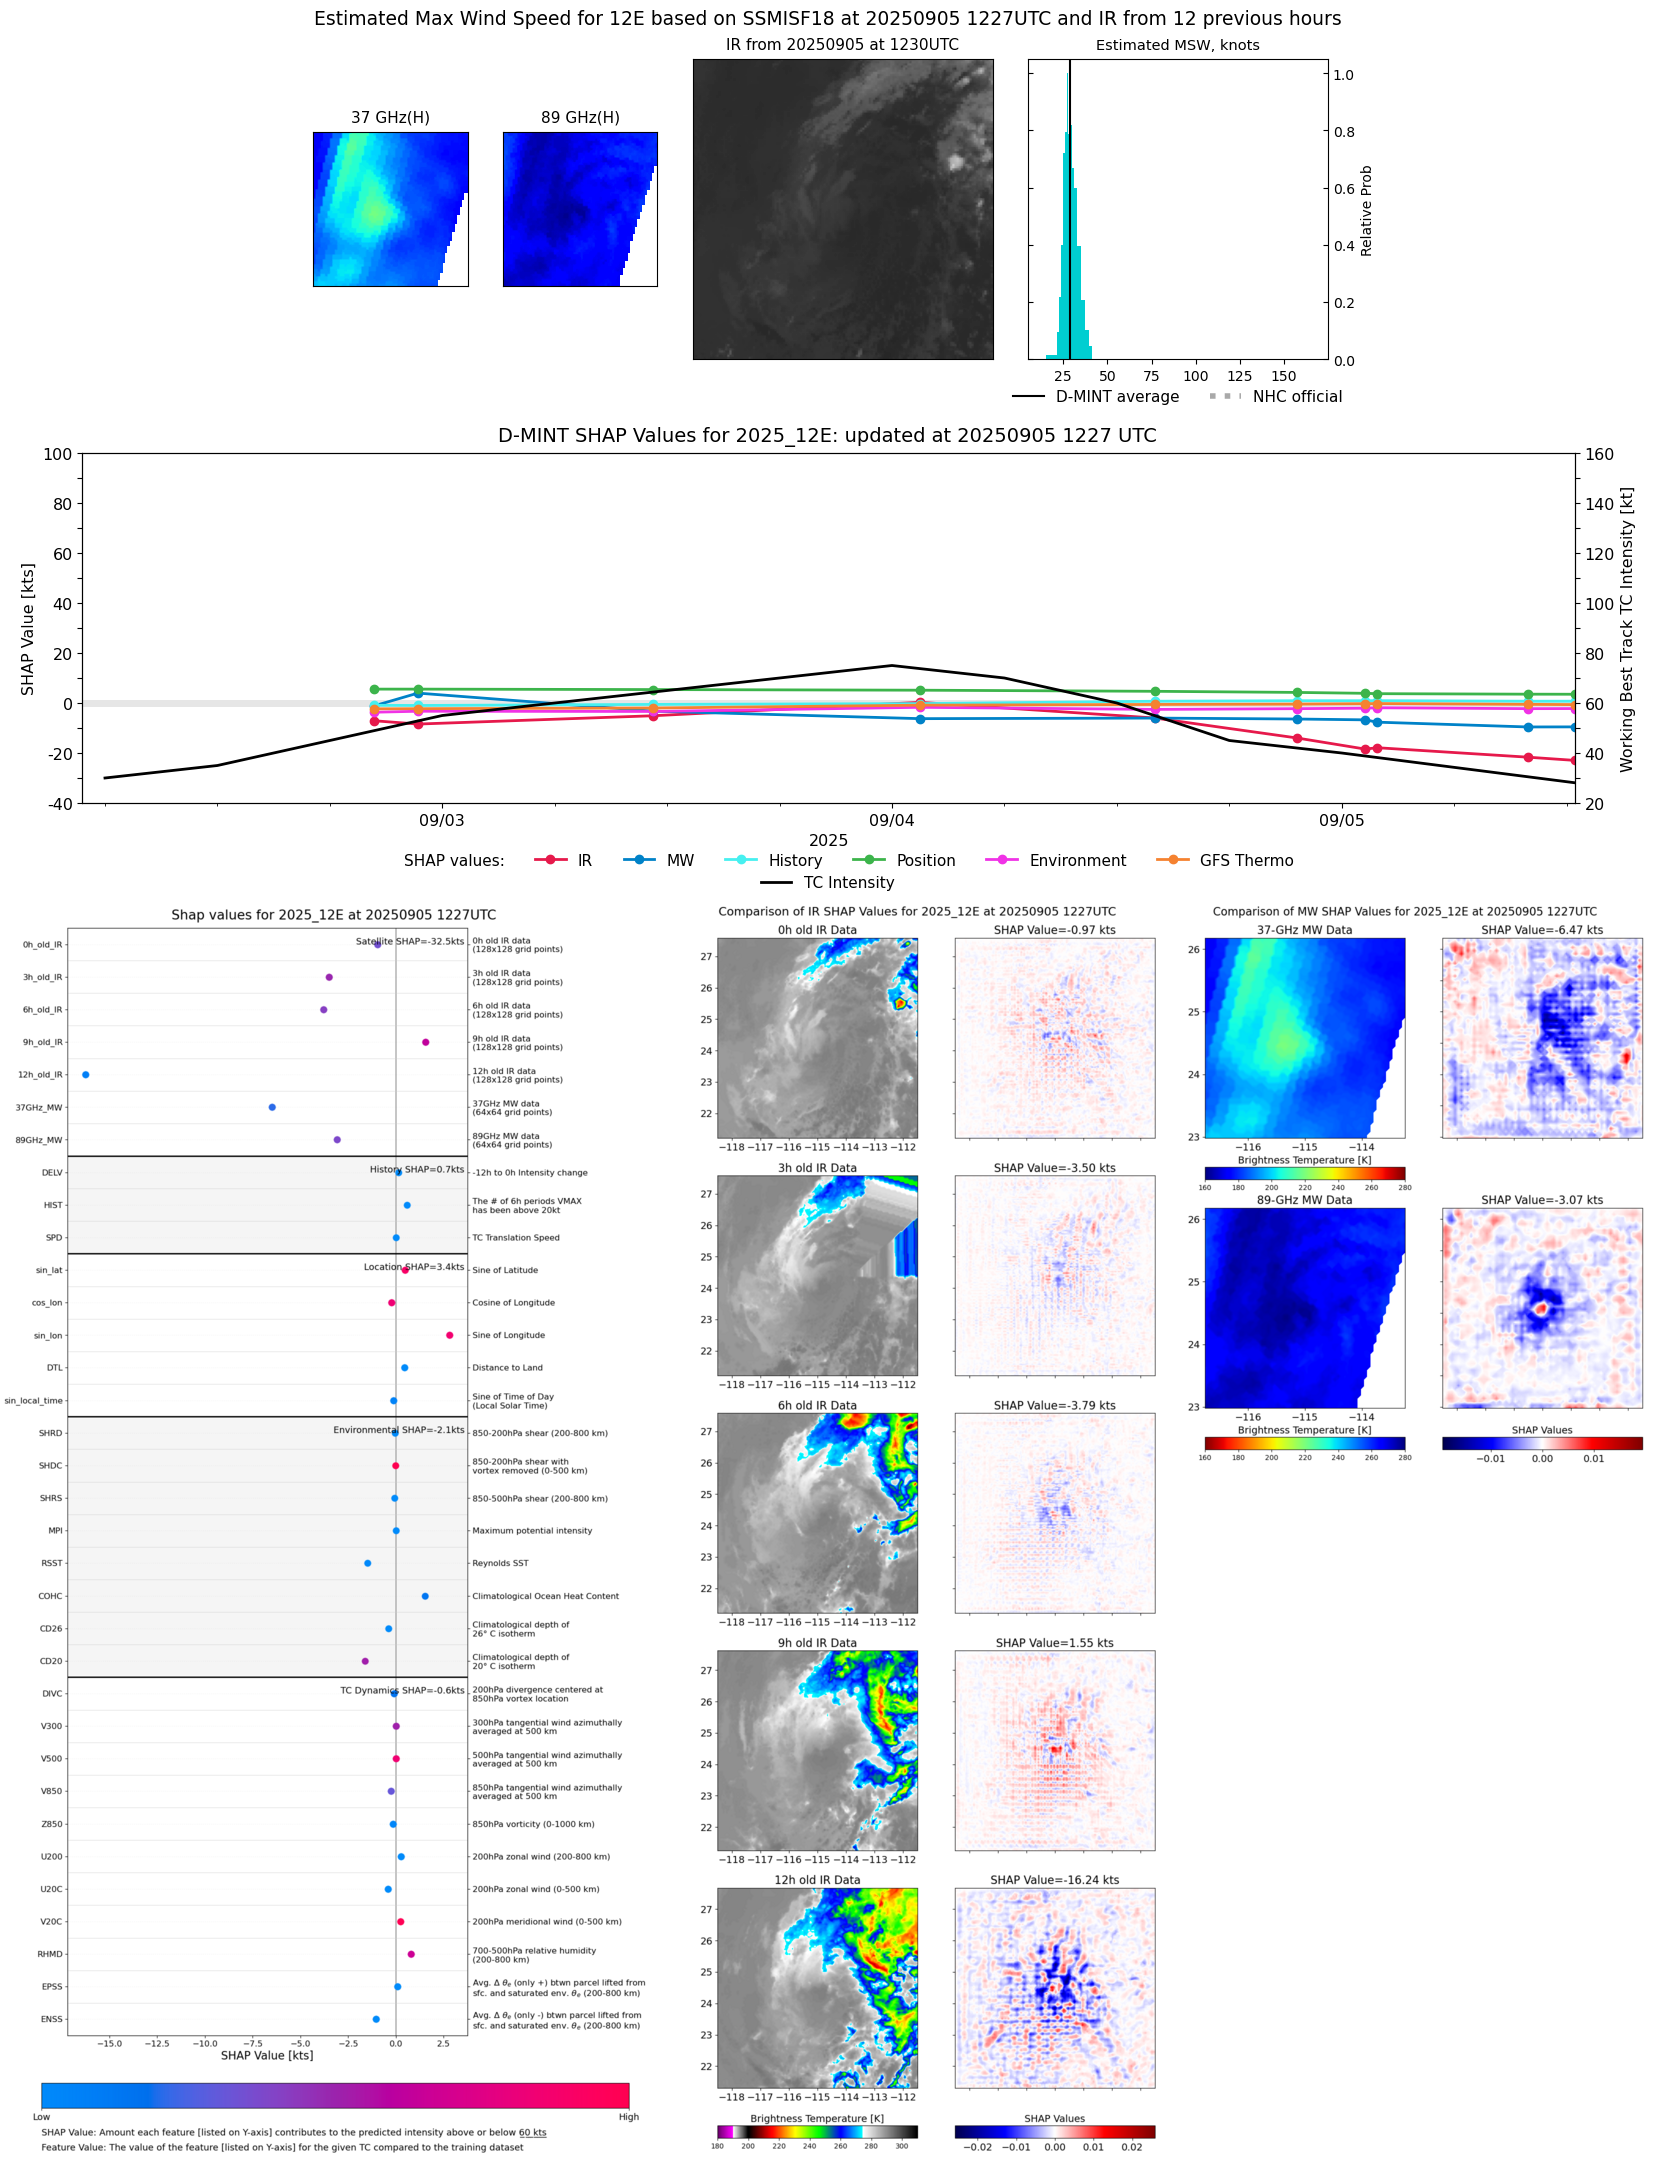 |
| 20250905 | 0956 UTC | AMSR2 | 1002 hPa | 30 kts | 27 kts | 34 kts | 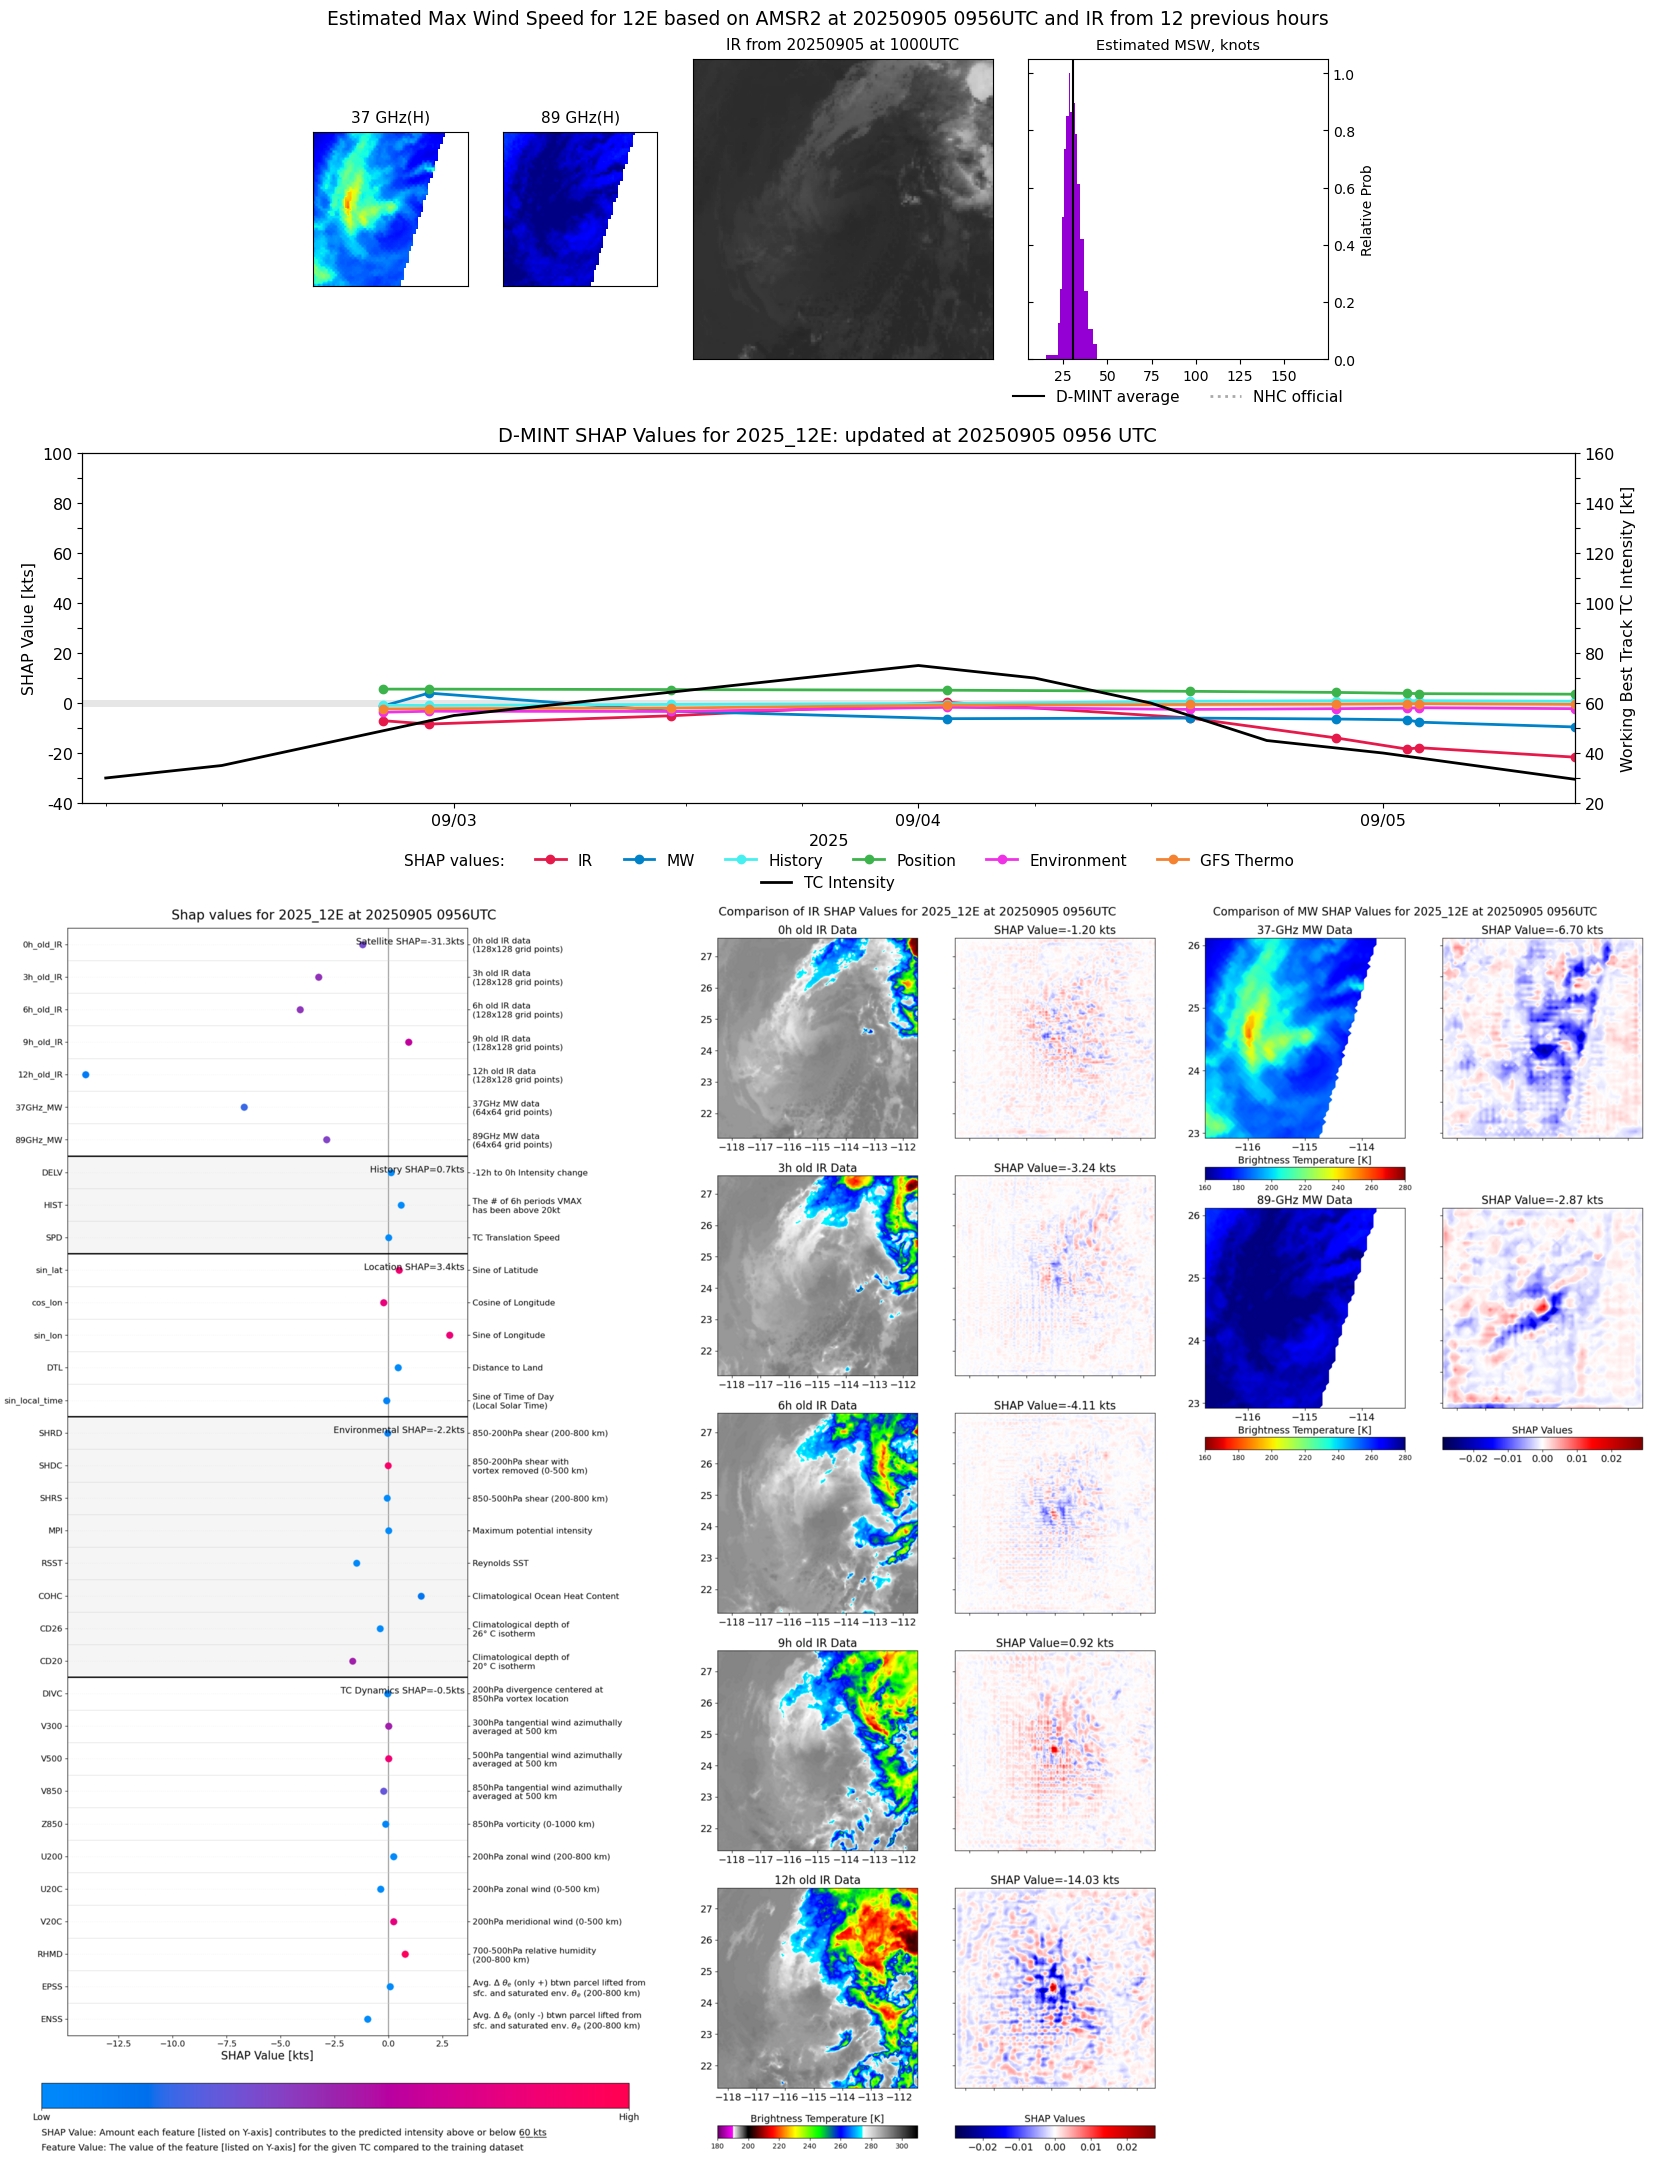 |
| 20250905 | 0602 UTC | TMS02 | 999 hPa | 36 kts | 32 kts | 40 kts | 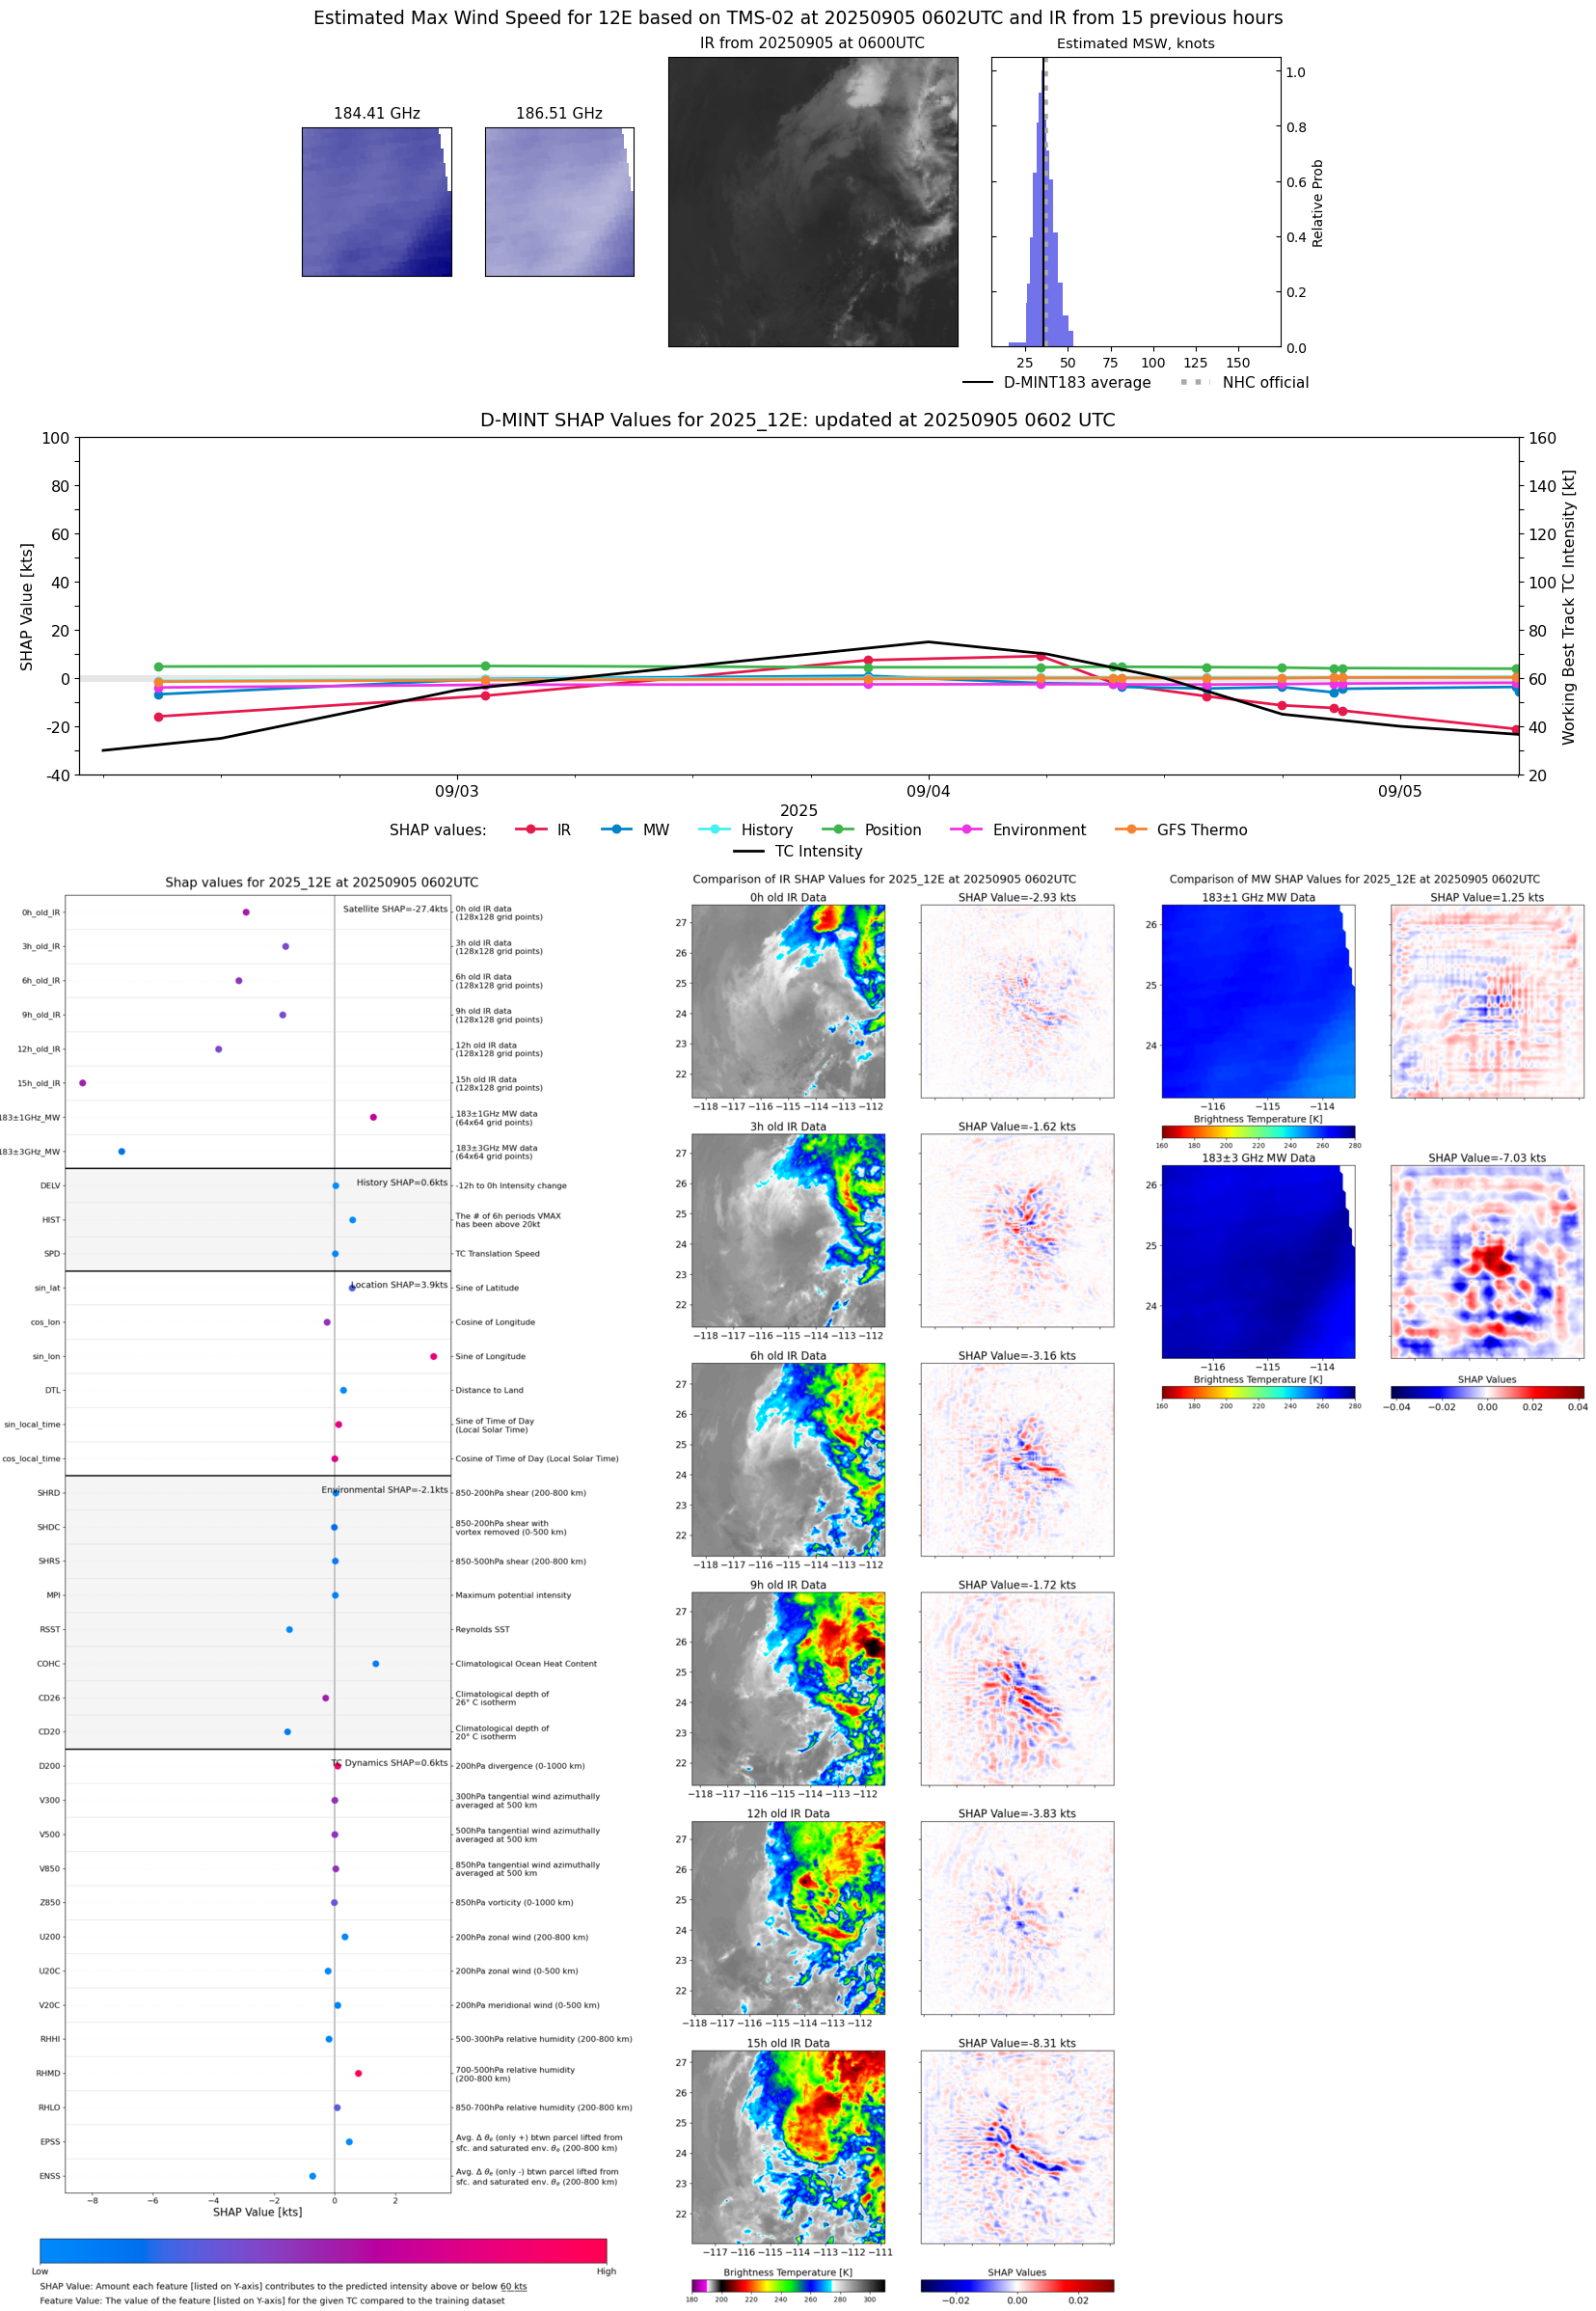 |
| 20250905 | 0554 UTC | AWS | 999 hPa | 38 kts | 34 kts | 43 kts | 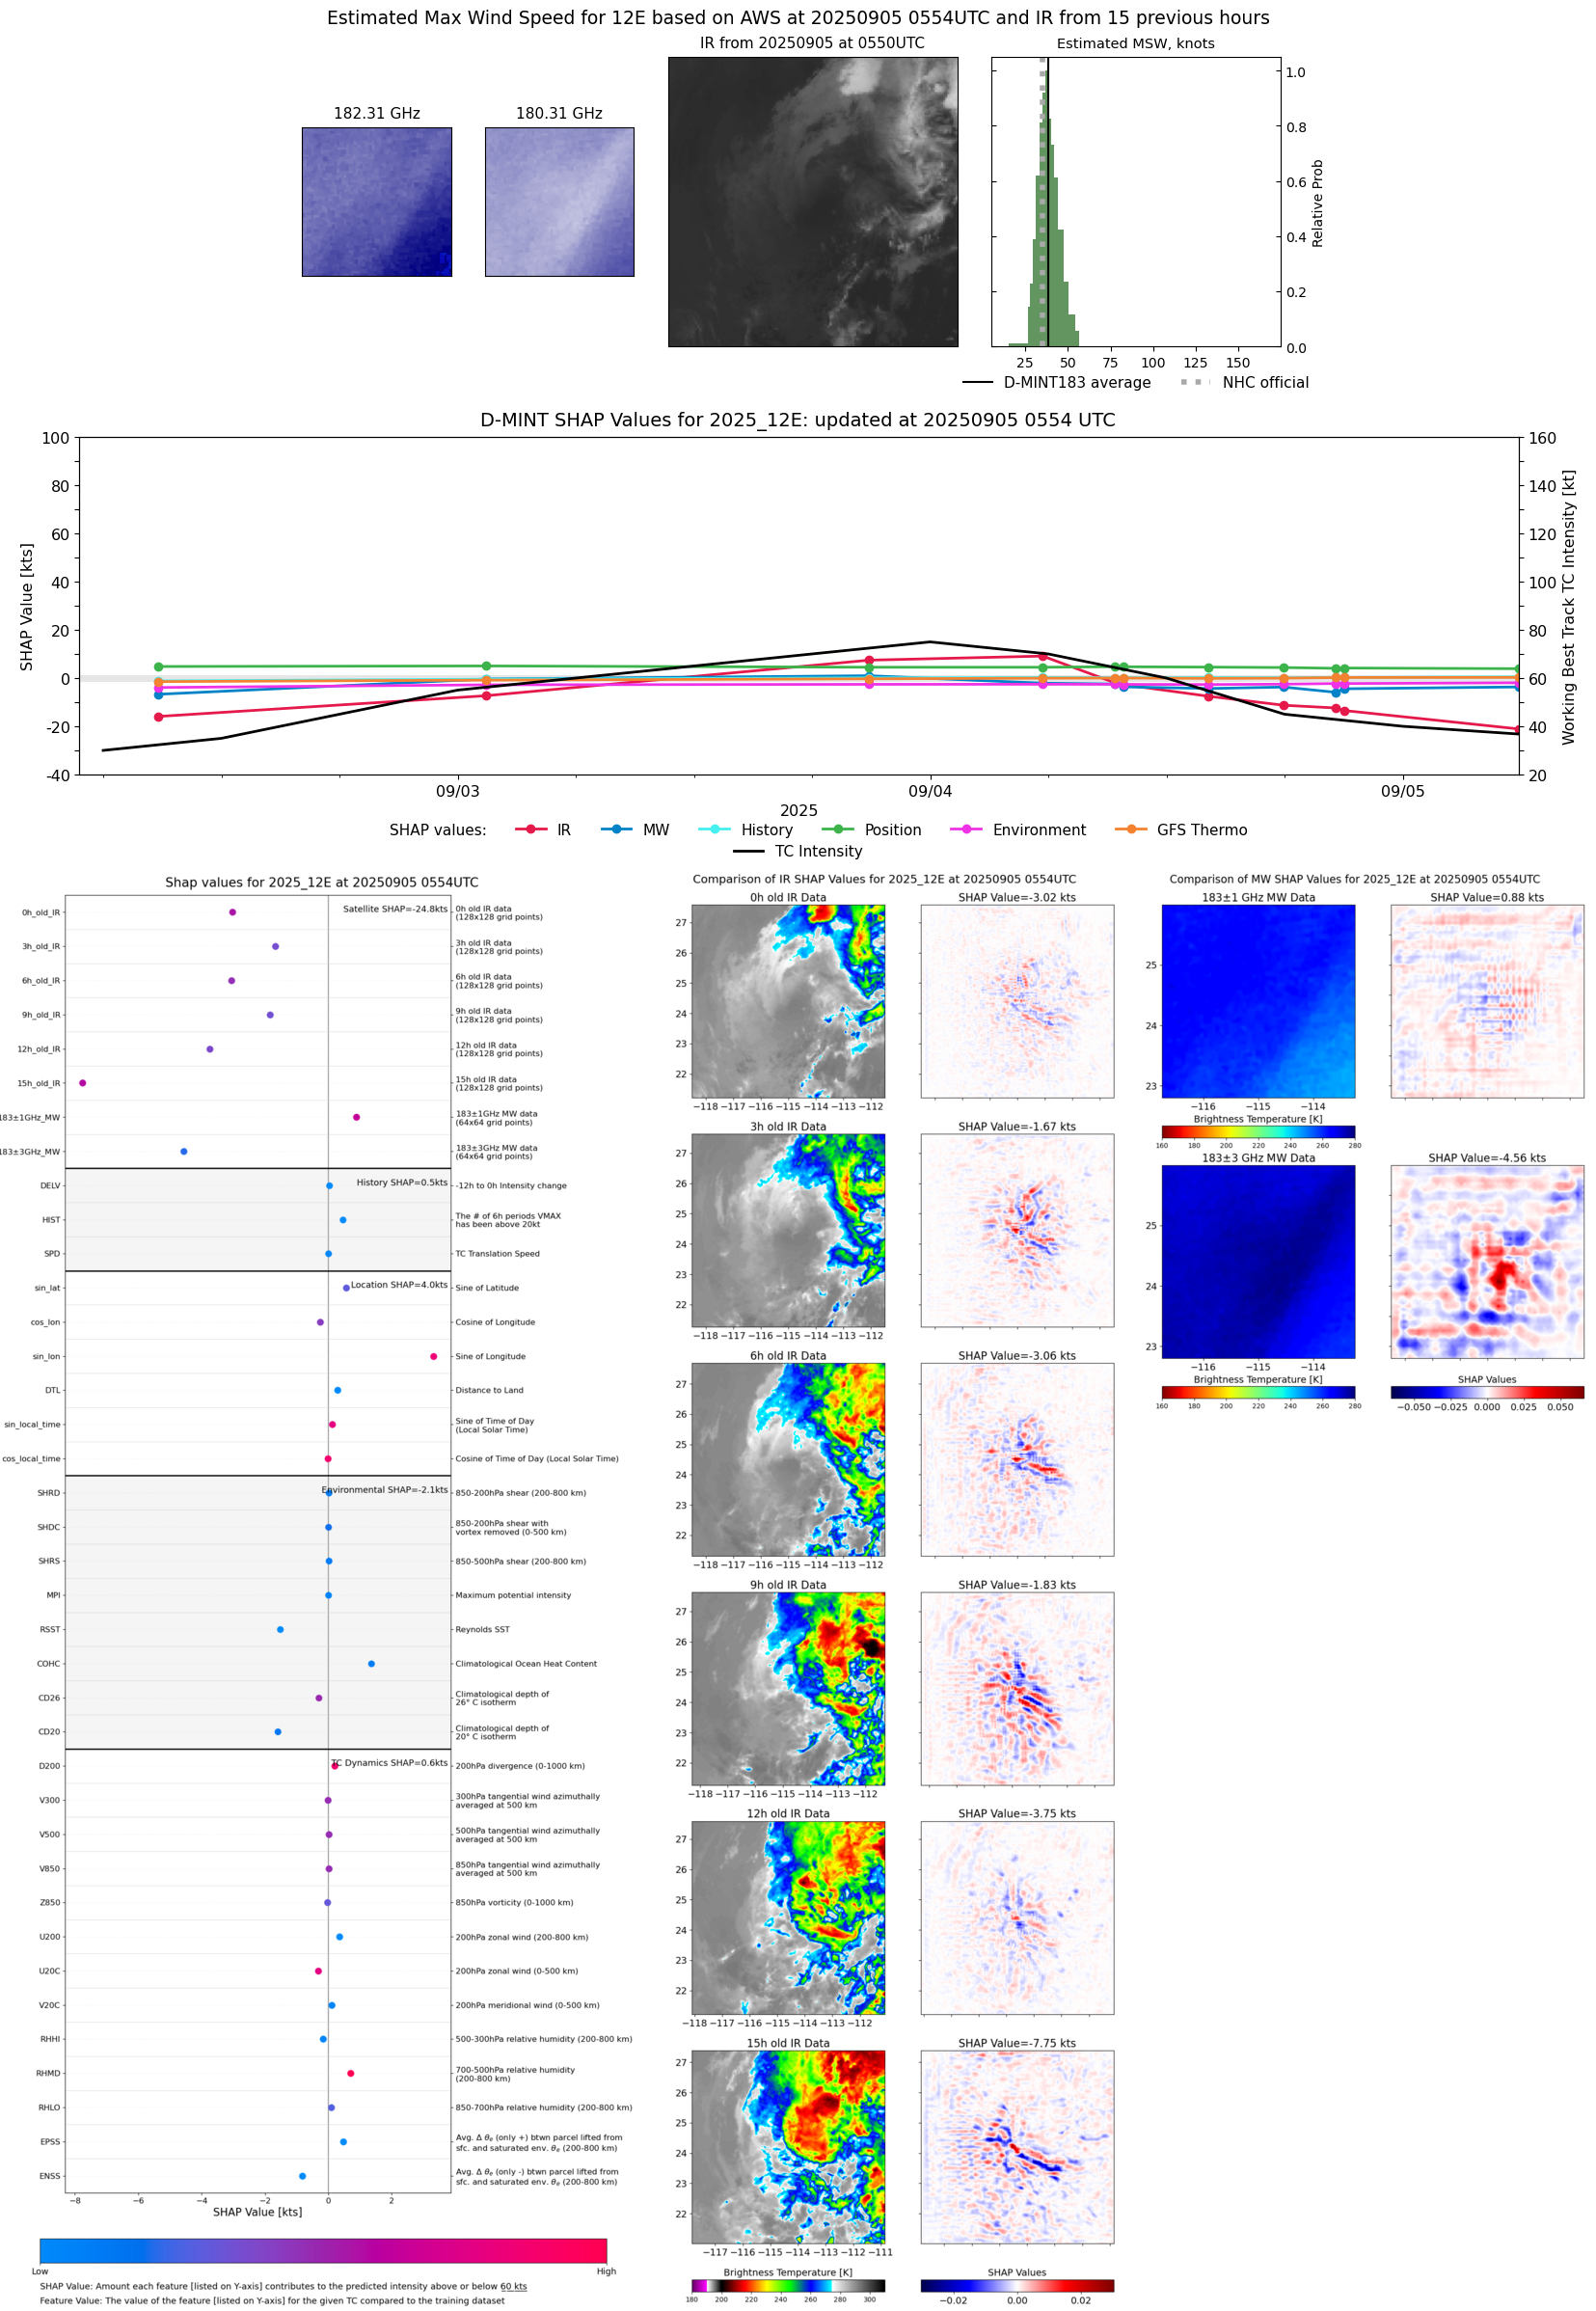 |
| 20250905 | 0153 UTC | SSMISF16 | 1002 hPa | 37 kts | 33 kts | 42 kts |  |
| 20250905 | 0136 UTC | WSFM01 | 999 hPa | 35 kts | 31 kts | 39 kts |  |
| 20250905 | 0116 UTC | SSMISF17 | 1001 hPa | 37 kts | 33 kts | 42 kts | 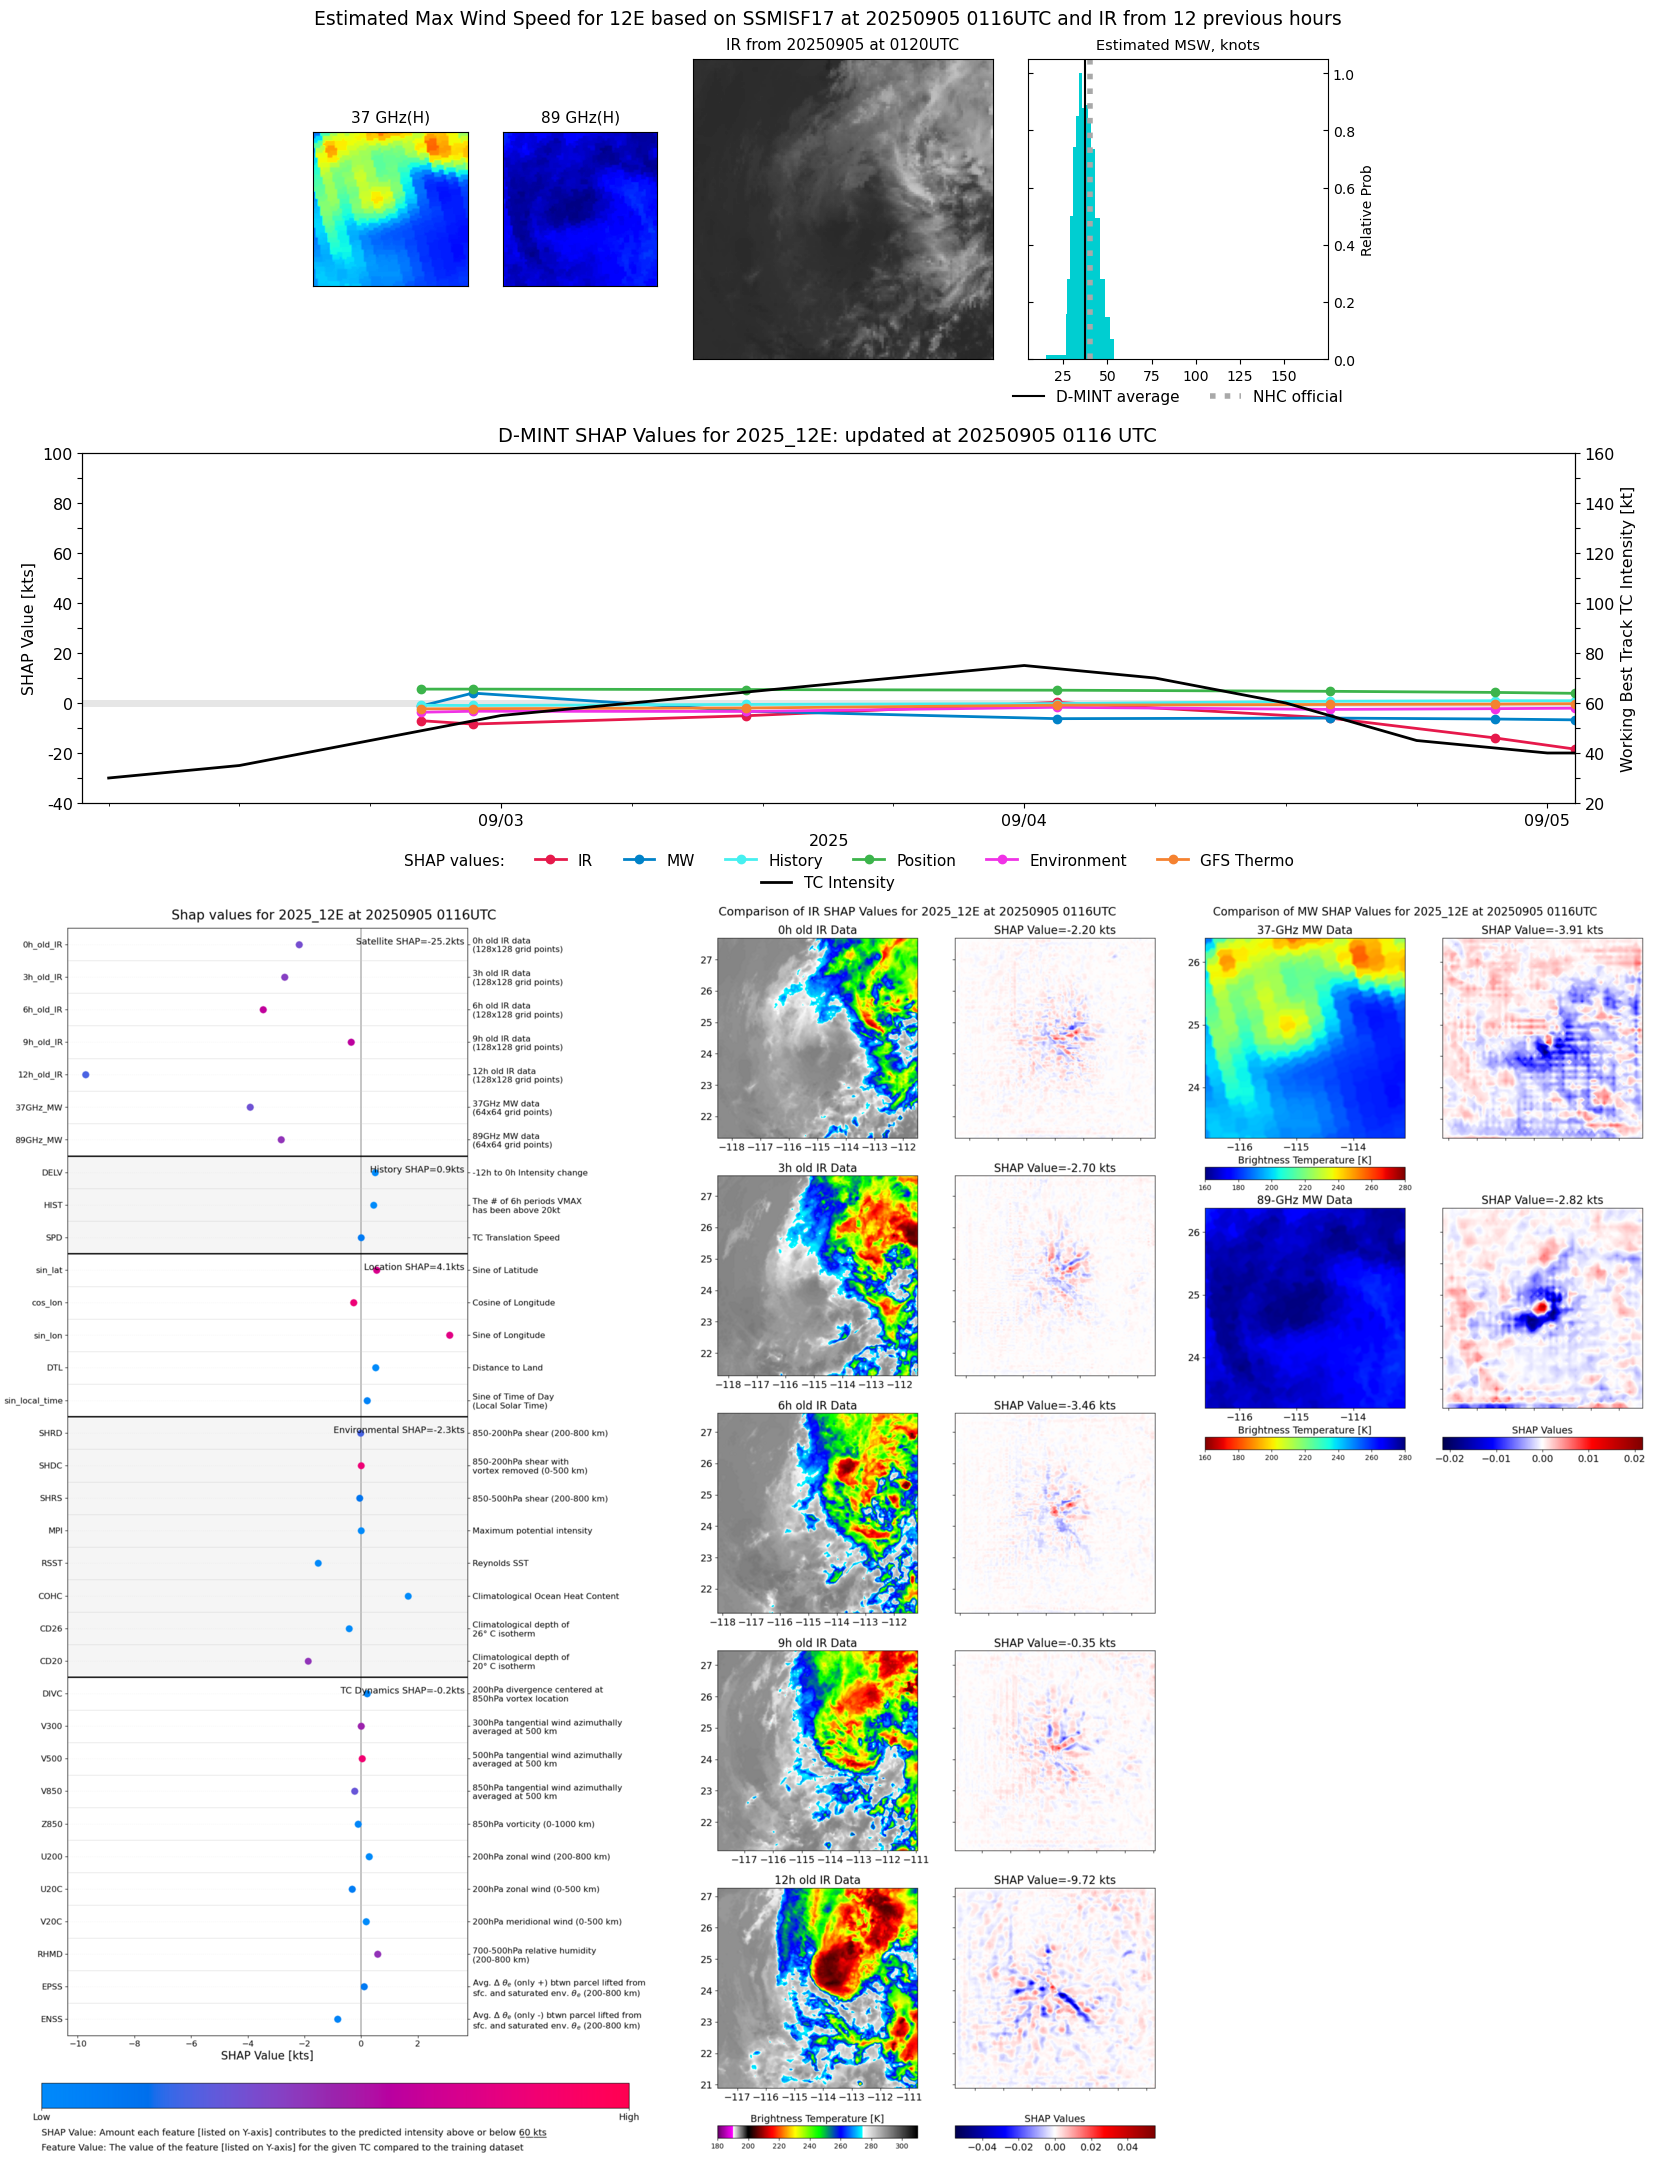 |
| 20250904 | 2136 UTC | GMI | 1000 hPa | 42 kts | 38 kts | 47 kts | 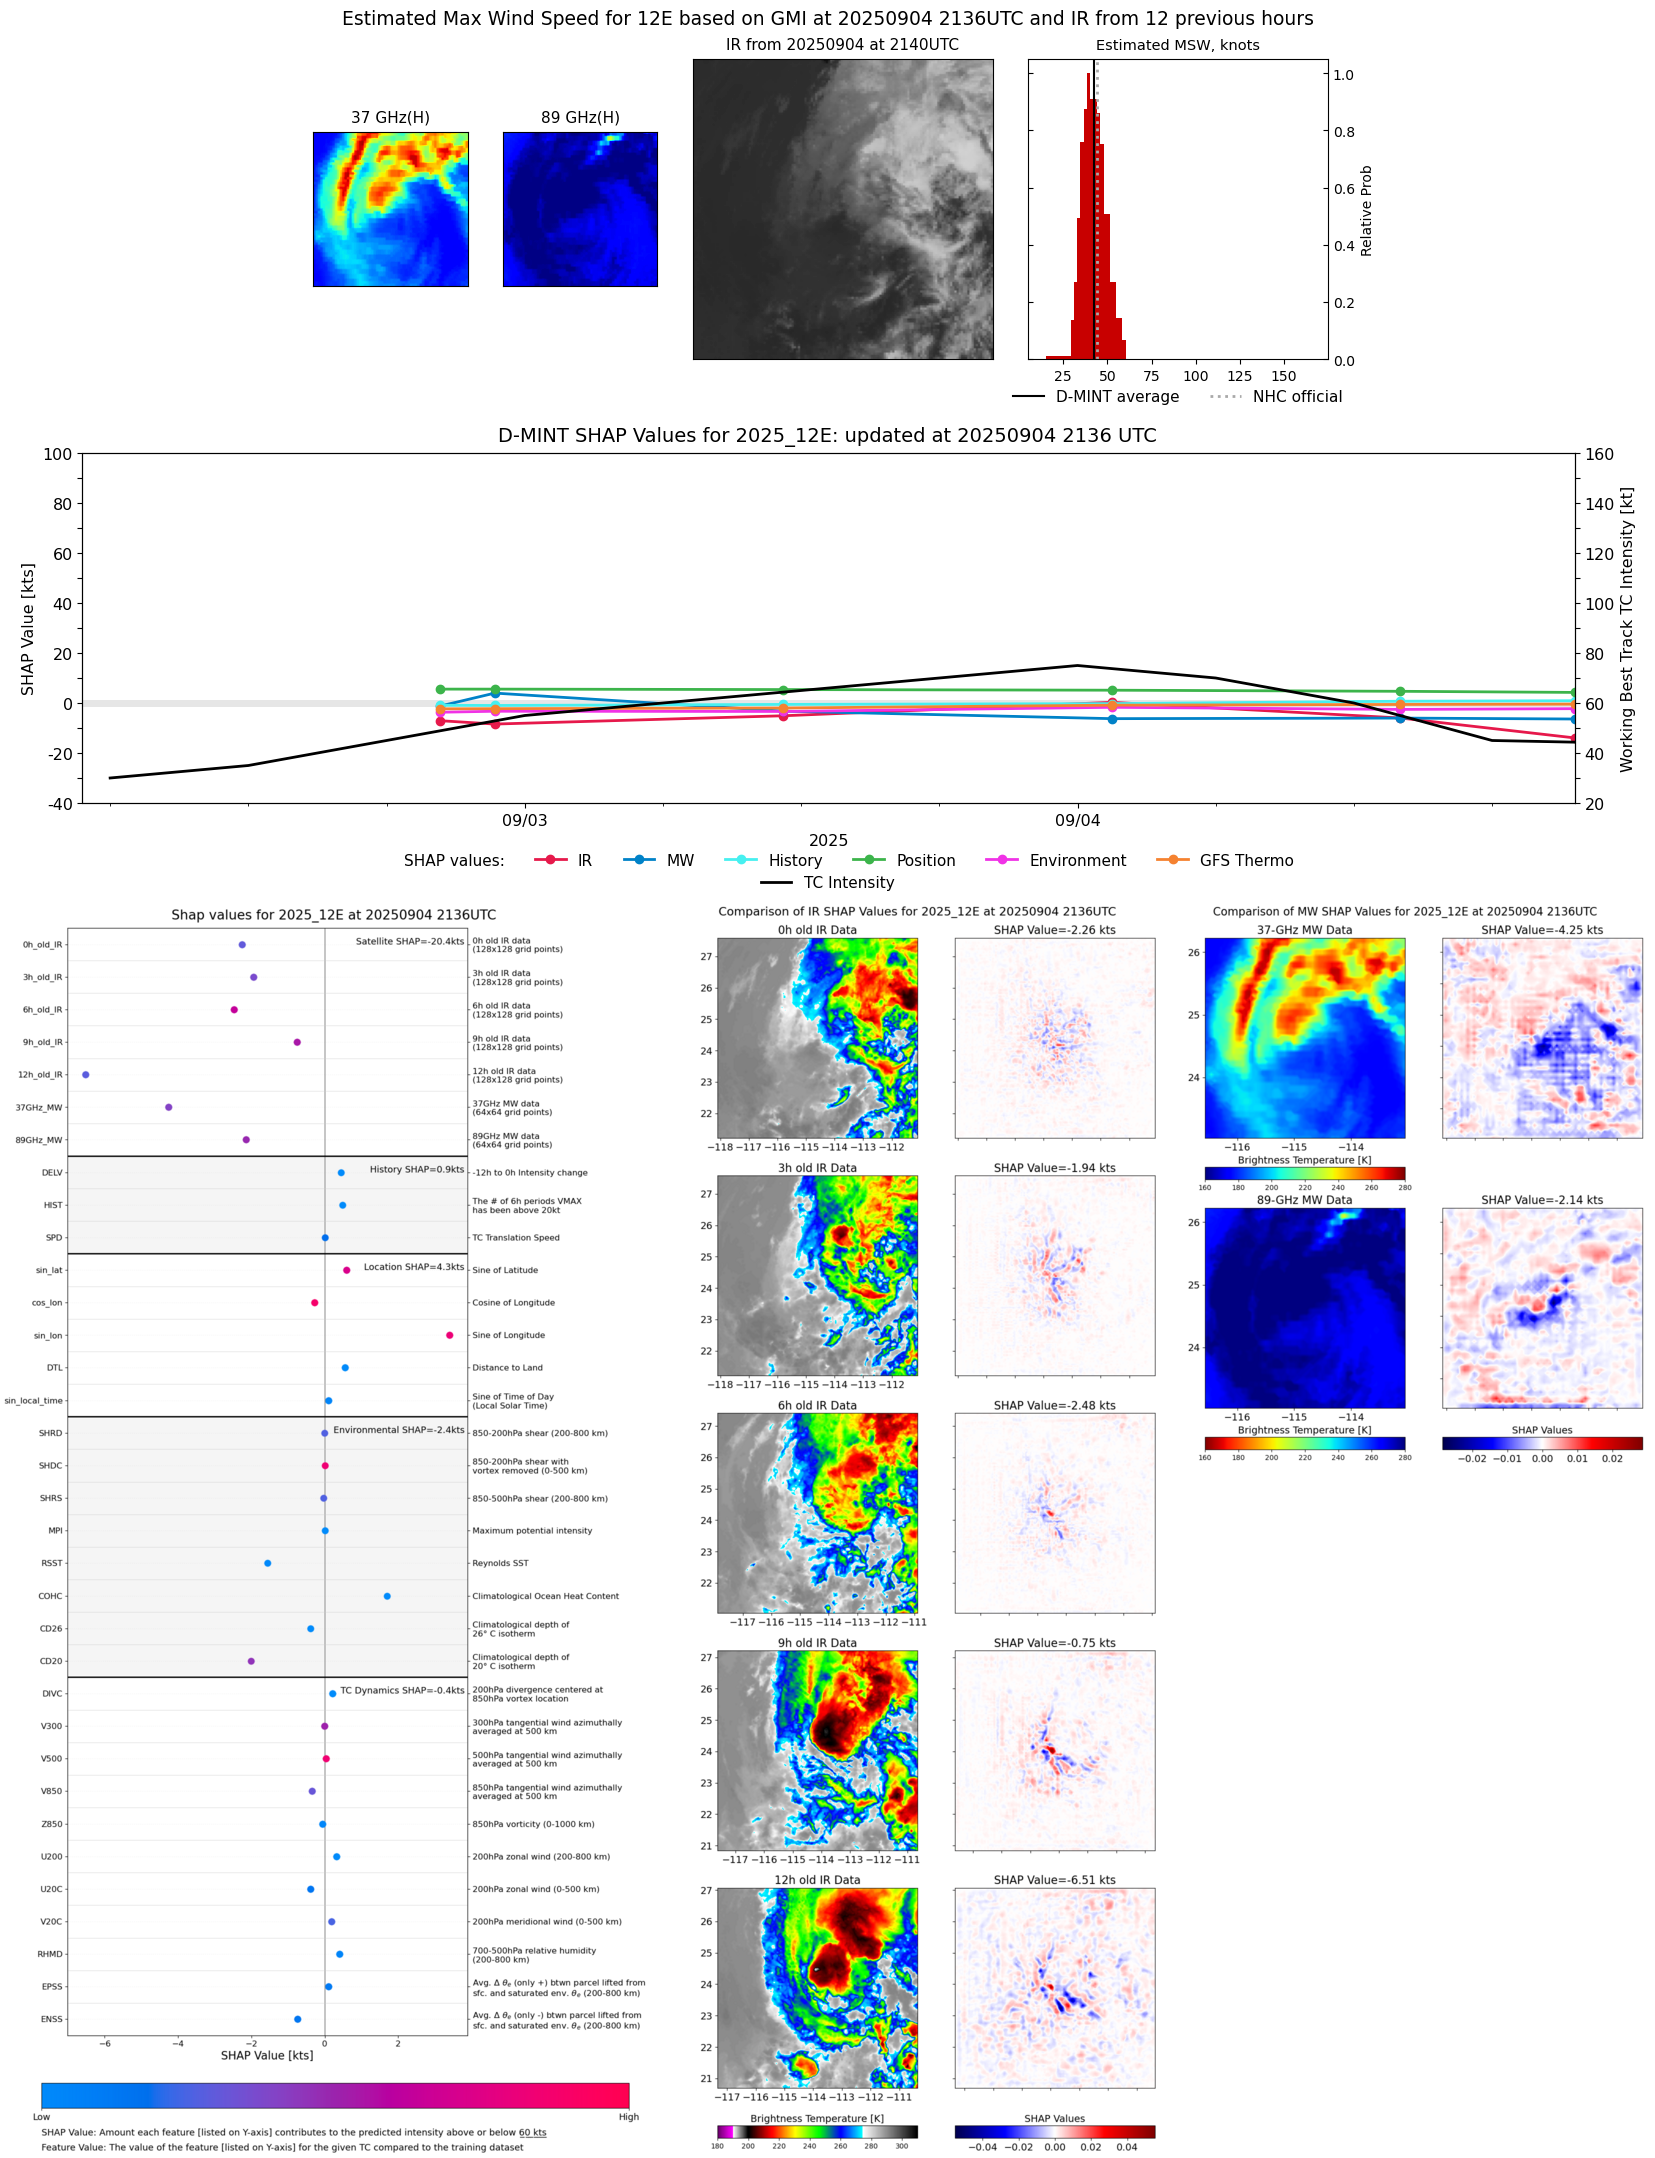 |
| 20250904 | 2133 UTC | GMI | 999 hPa | 38 kts | 33 kts | 43 kts | 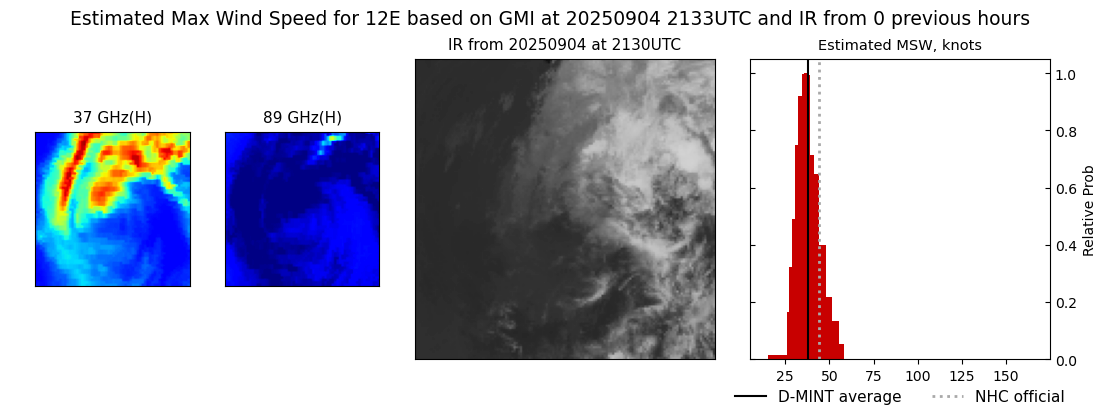 |
| 20250904 | 2102 UTC | ATMS-NPP | 999 hPa | 45 kts | 40 kts | 50 kts | 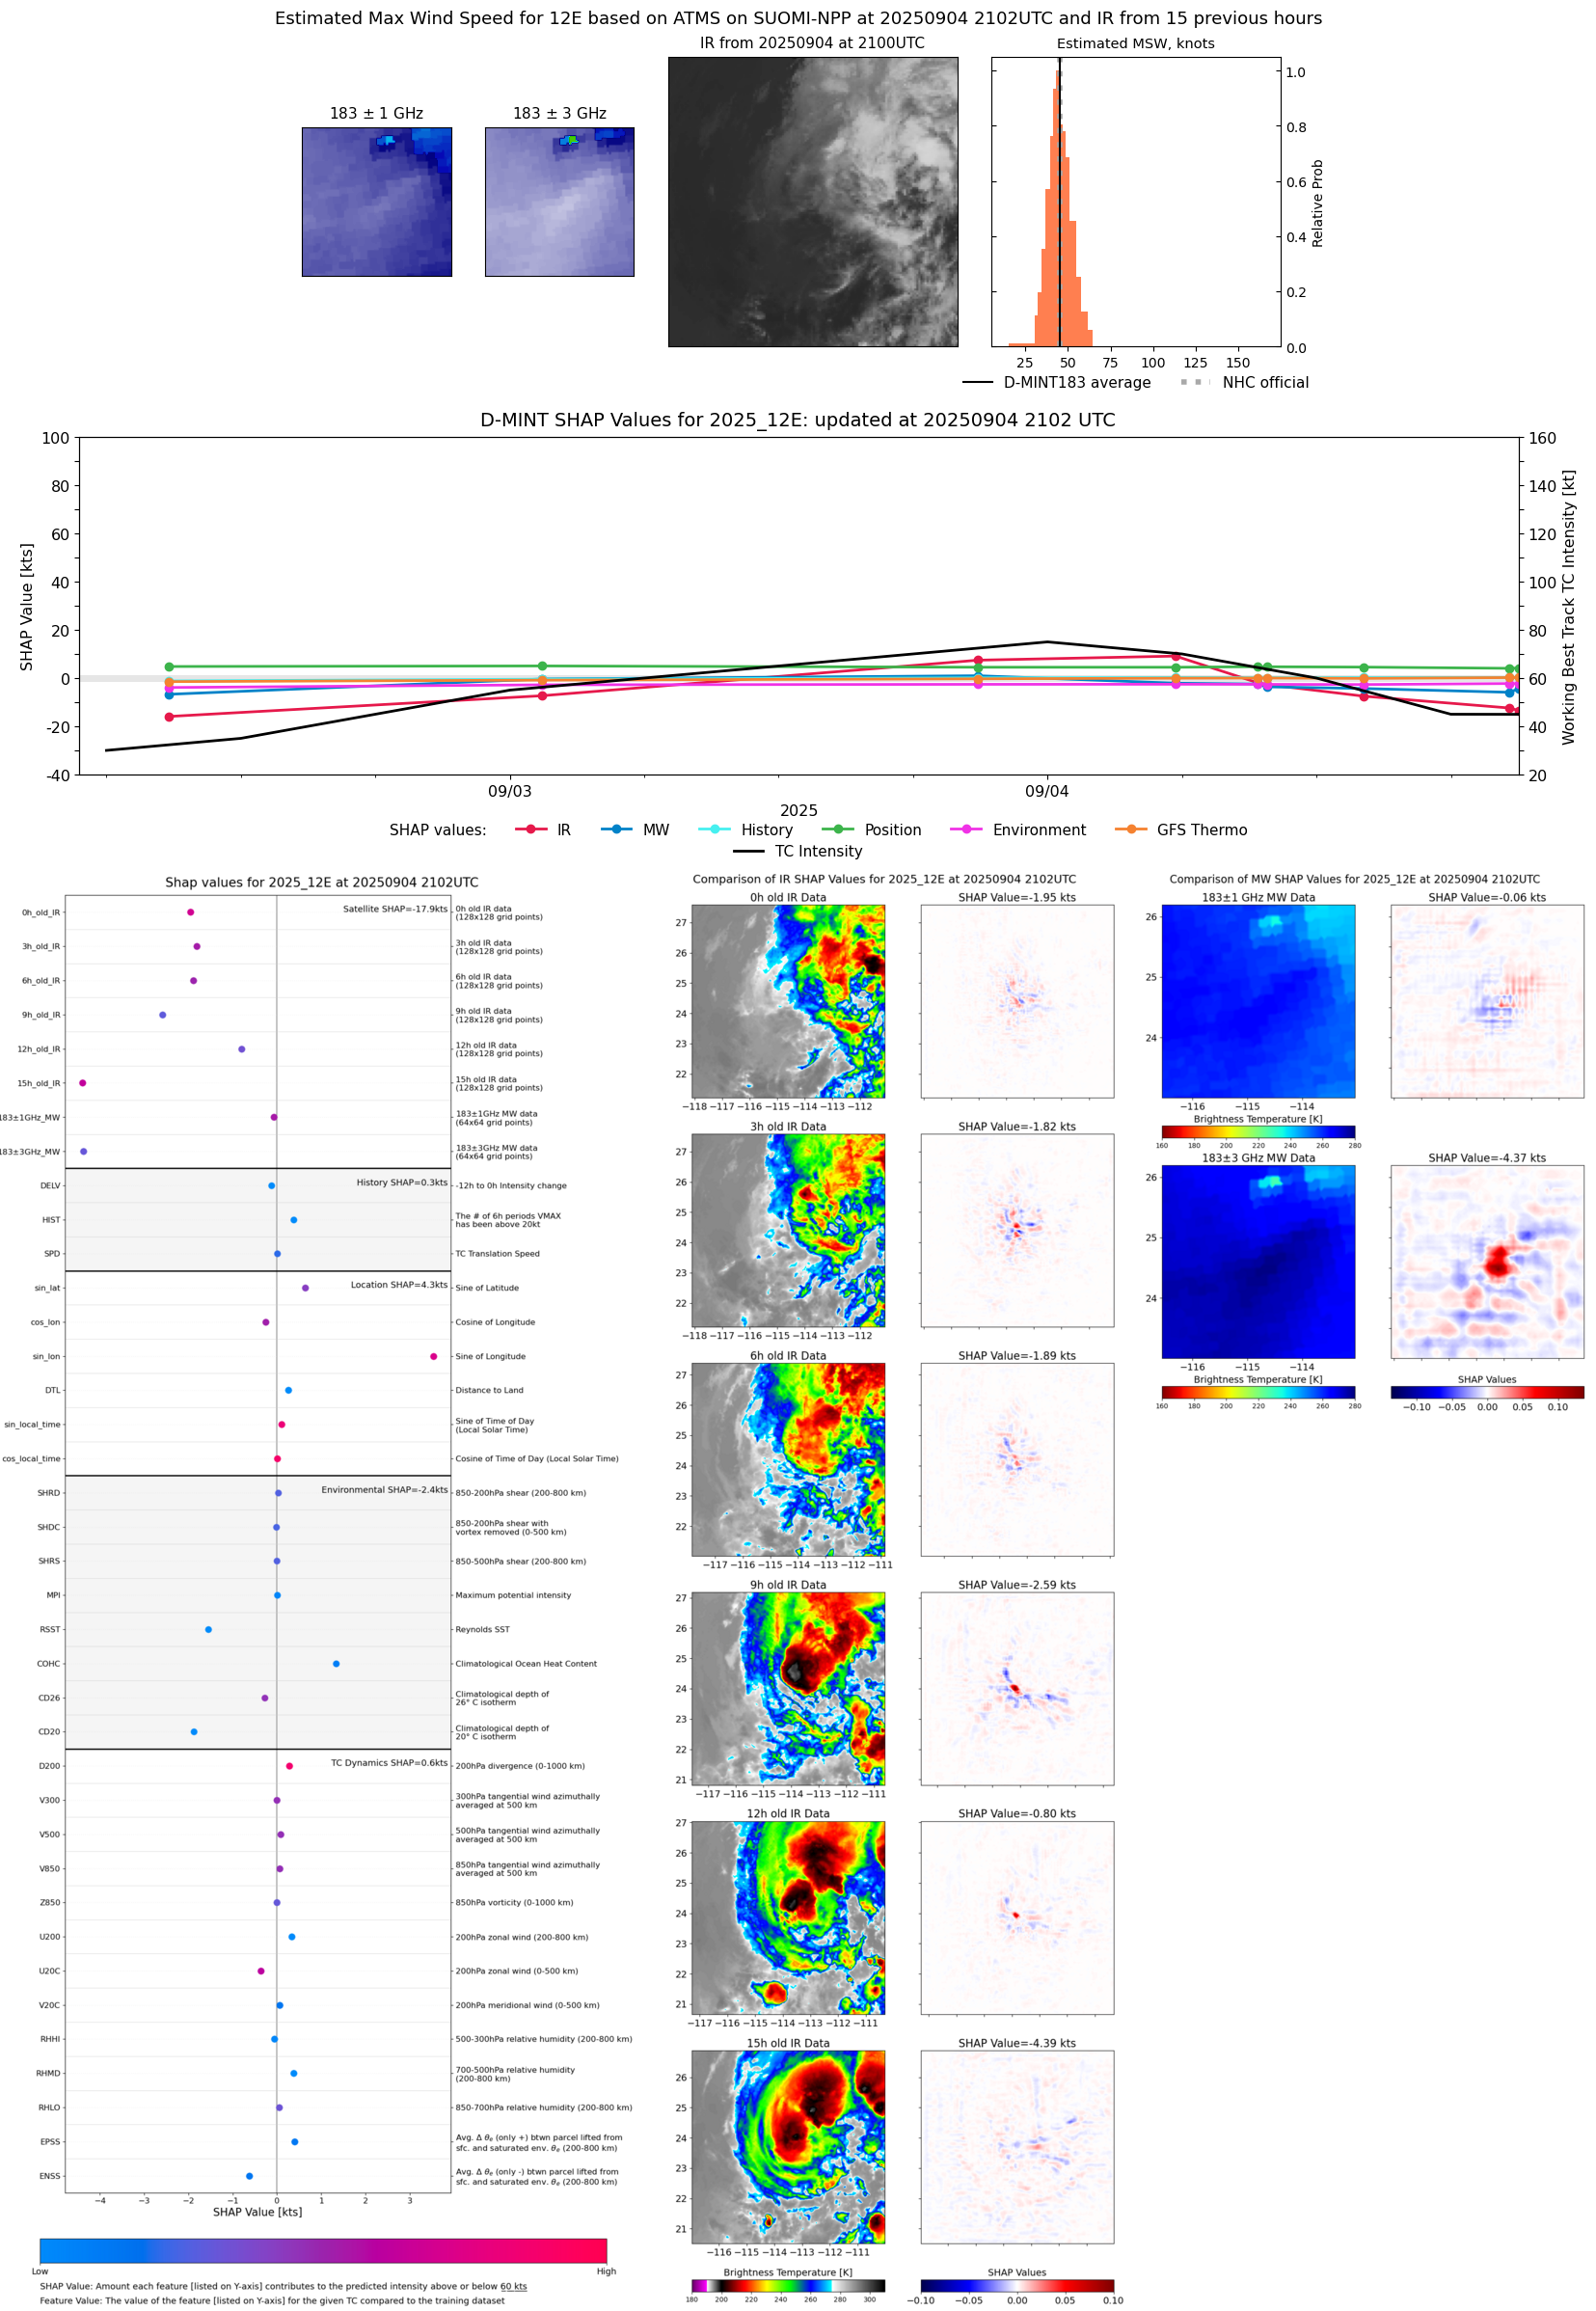 |
| 20250904 | 2036 UTC | ATMS-N21 | 1000 hPa | 44 kts | 40 kts | 49 kts |  |
| 20250904 | 1757 UTC | TMS02 | 996 hPa | 48 kts | 43 kts | 53 kts | 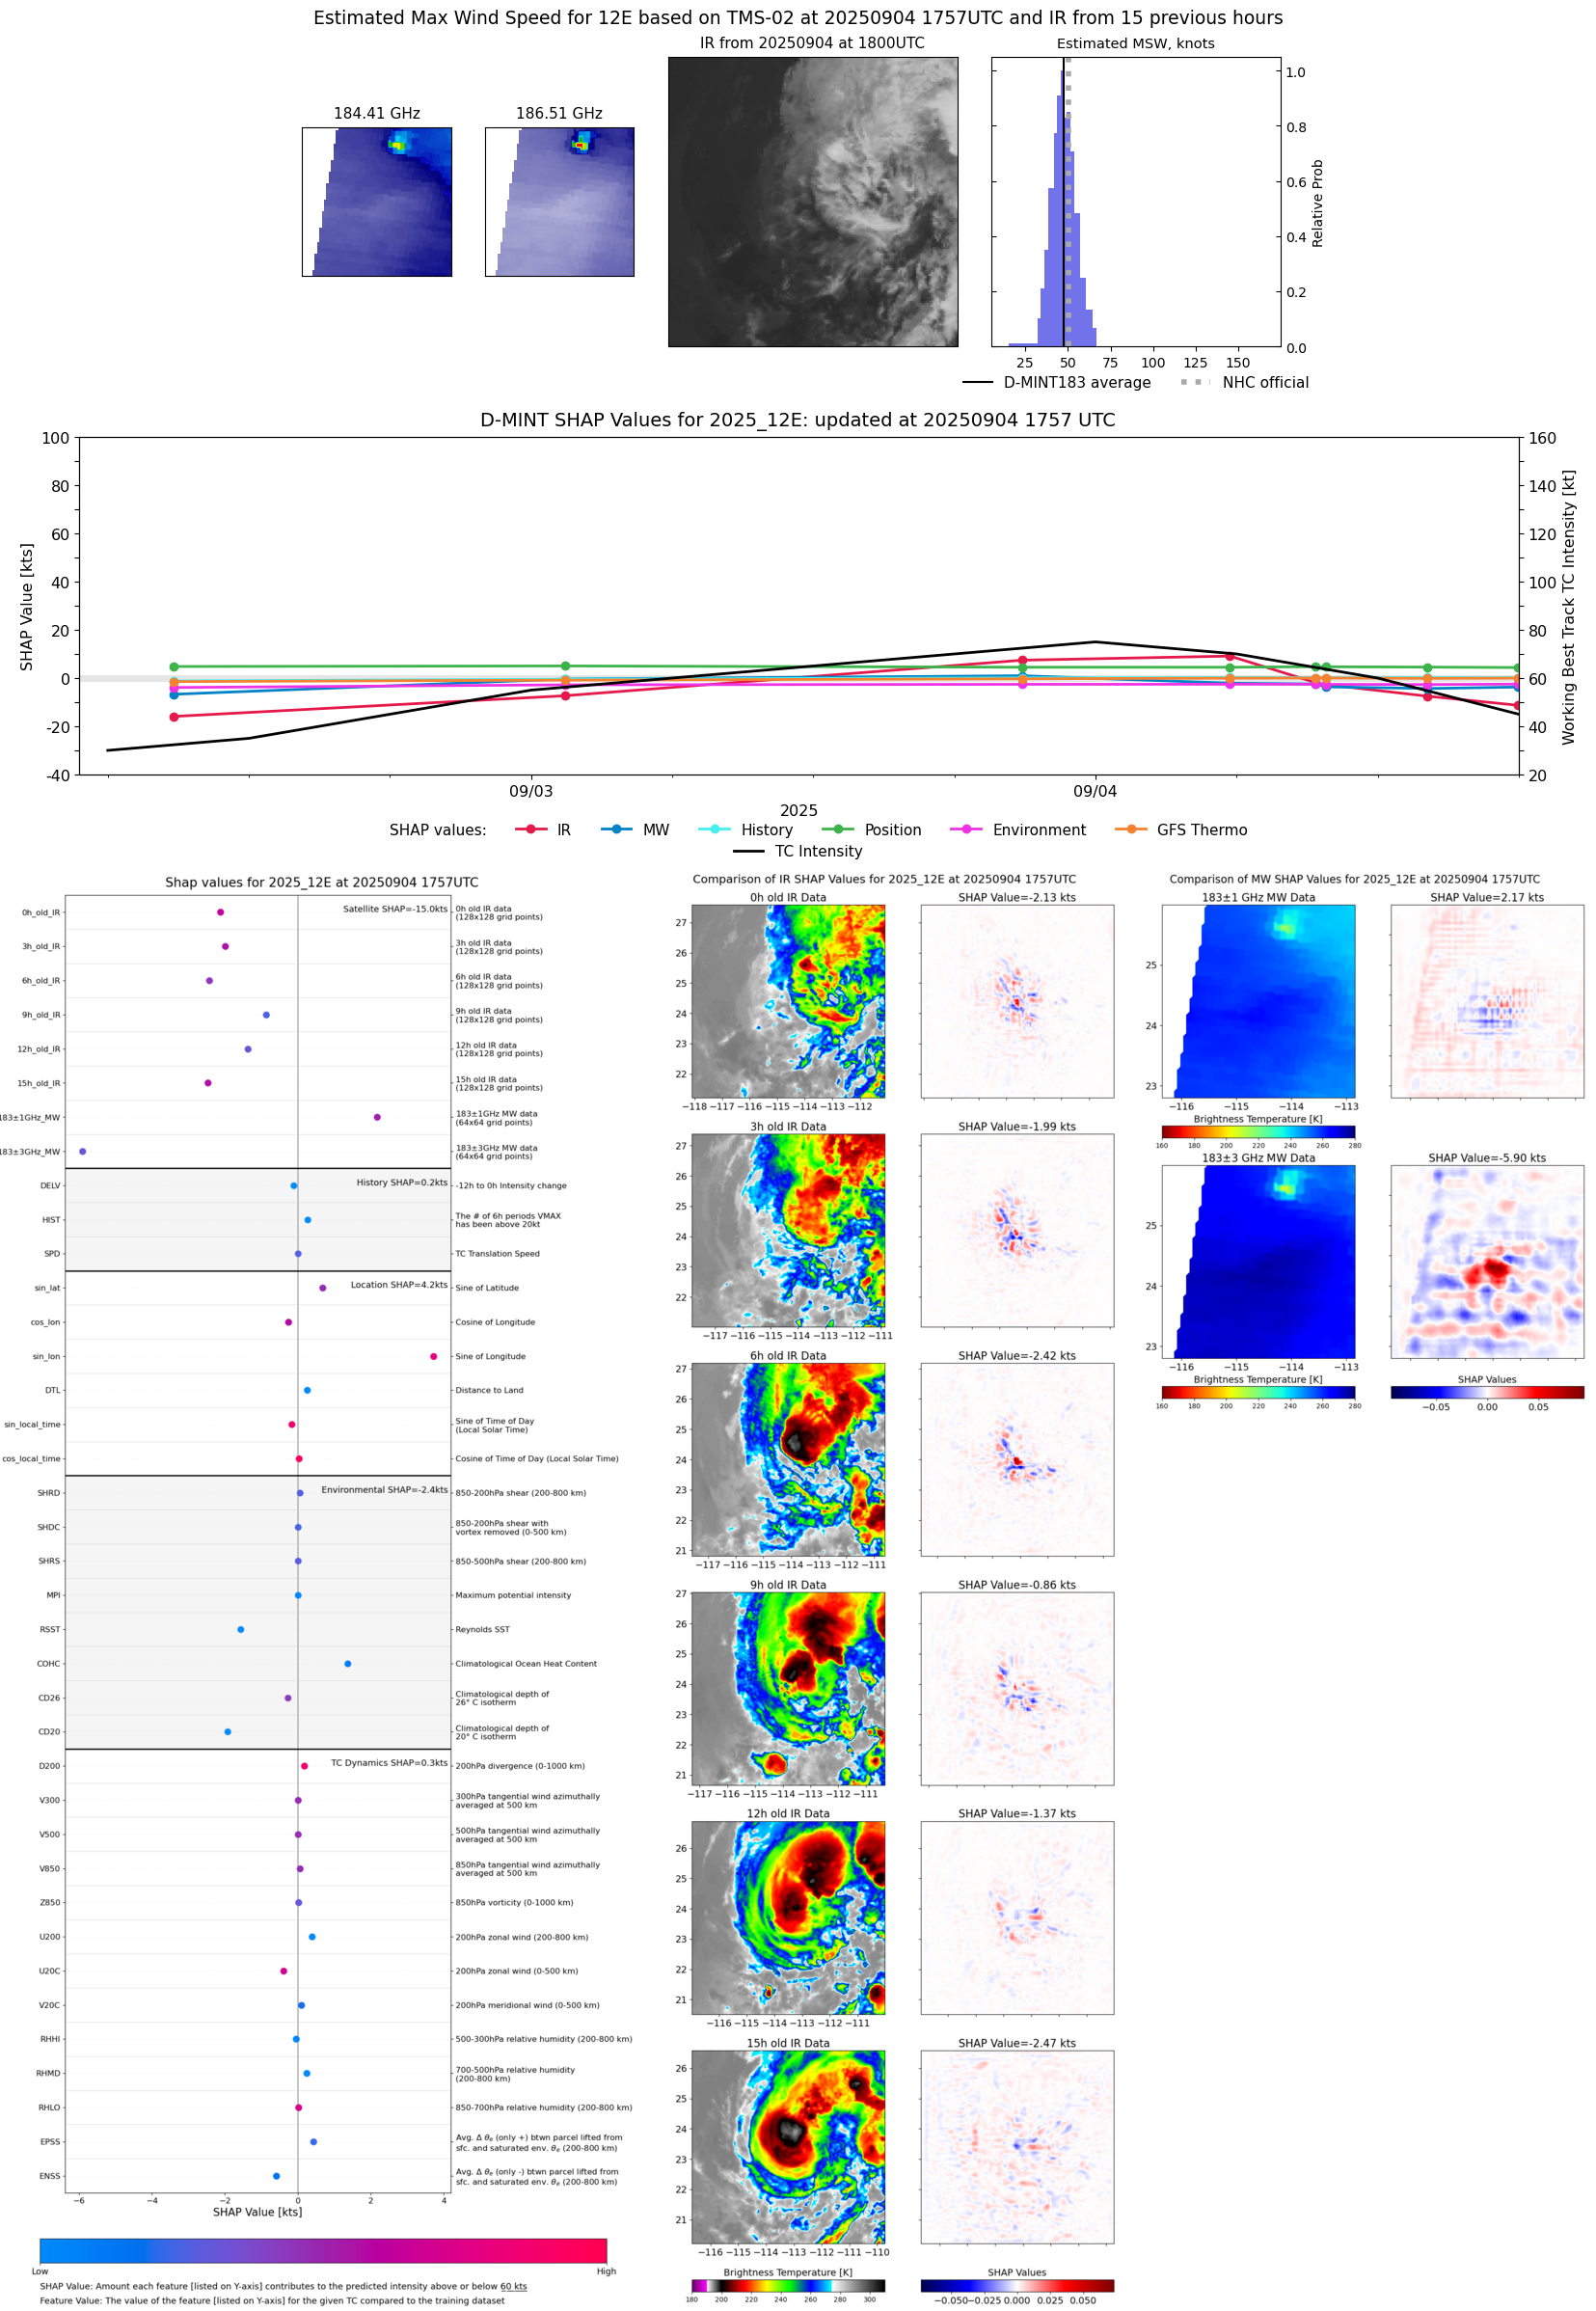 |
| 20250904 | 1407 UTC | TROPICS05 | 993 hPa | 51 kts | 45 kts | 56 kts | 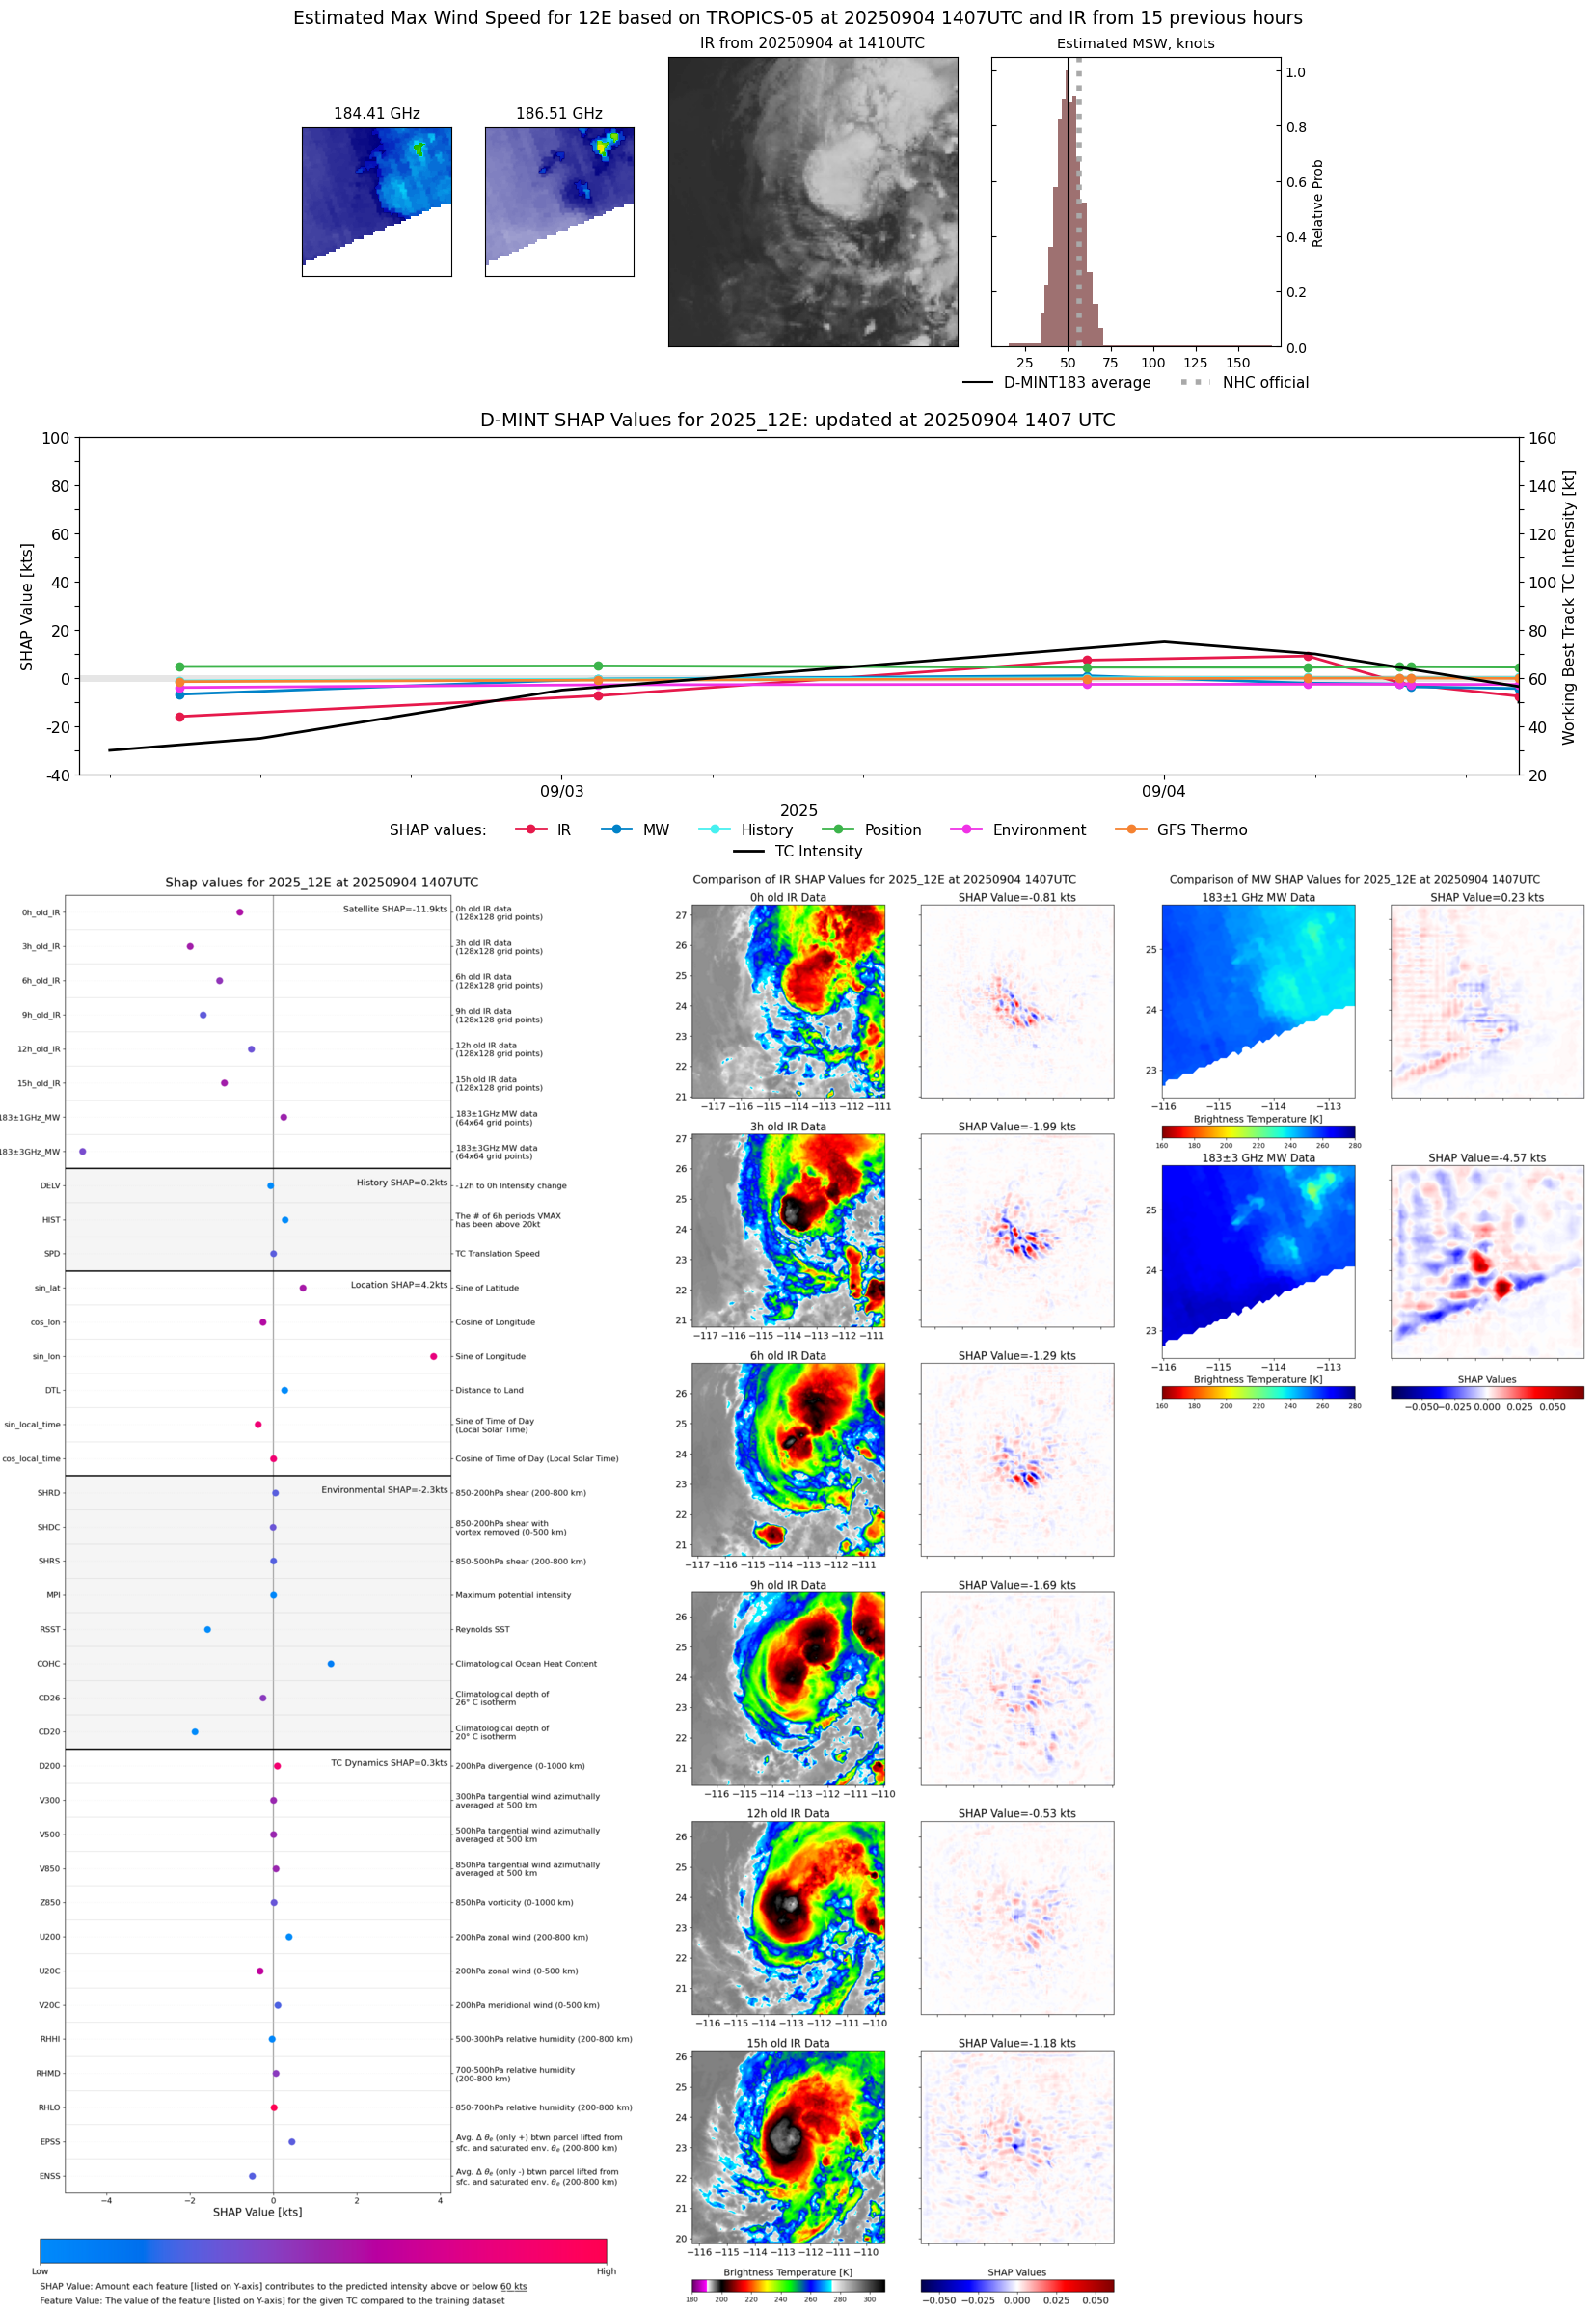 |
| 20250904 | 1401 UTC | SSMISF17 | 996 hPa | 50 kts | 45 kts | 56 kts | 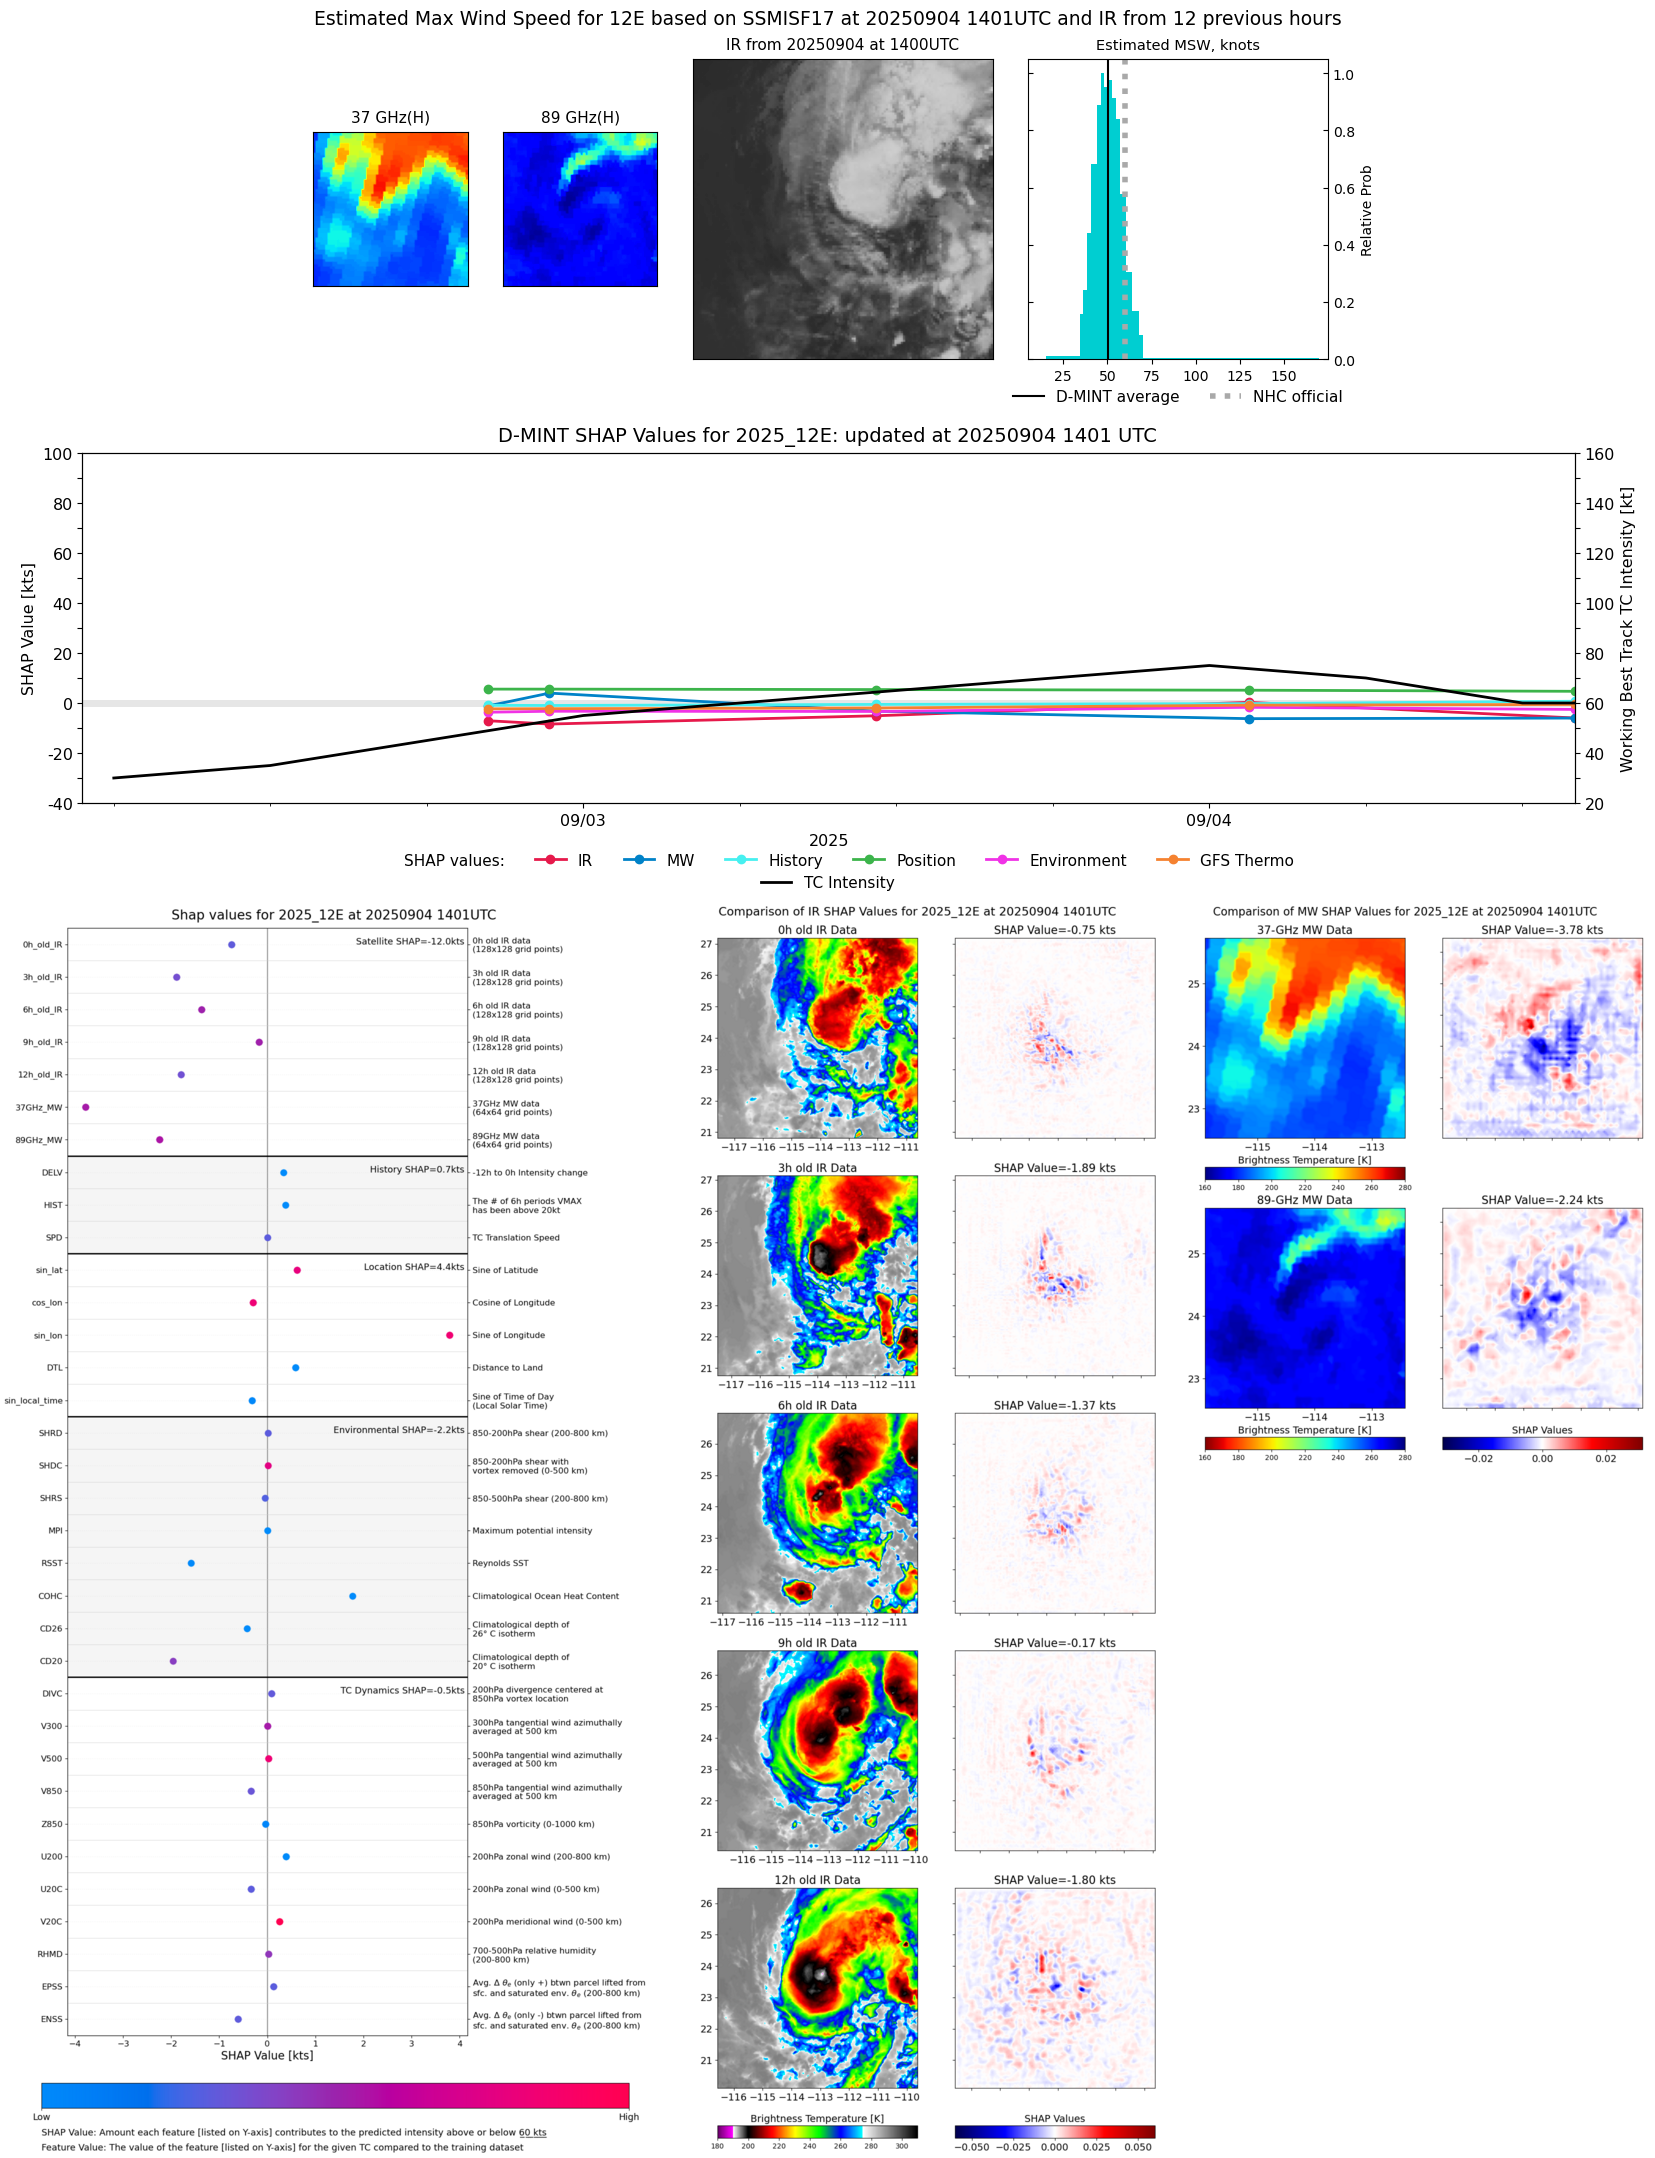 |
| 20250904 | 0948 UTC | ATMS- | 994 hPa | 56 kts | 51 kts | 62 kts |  |
| 20250904 | 0922 UTC | ATMS-N21 | 989 hPa | 58 kts | 53 kts | 64 kts | 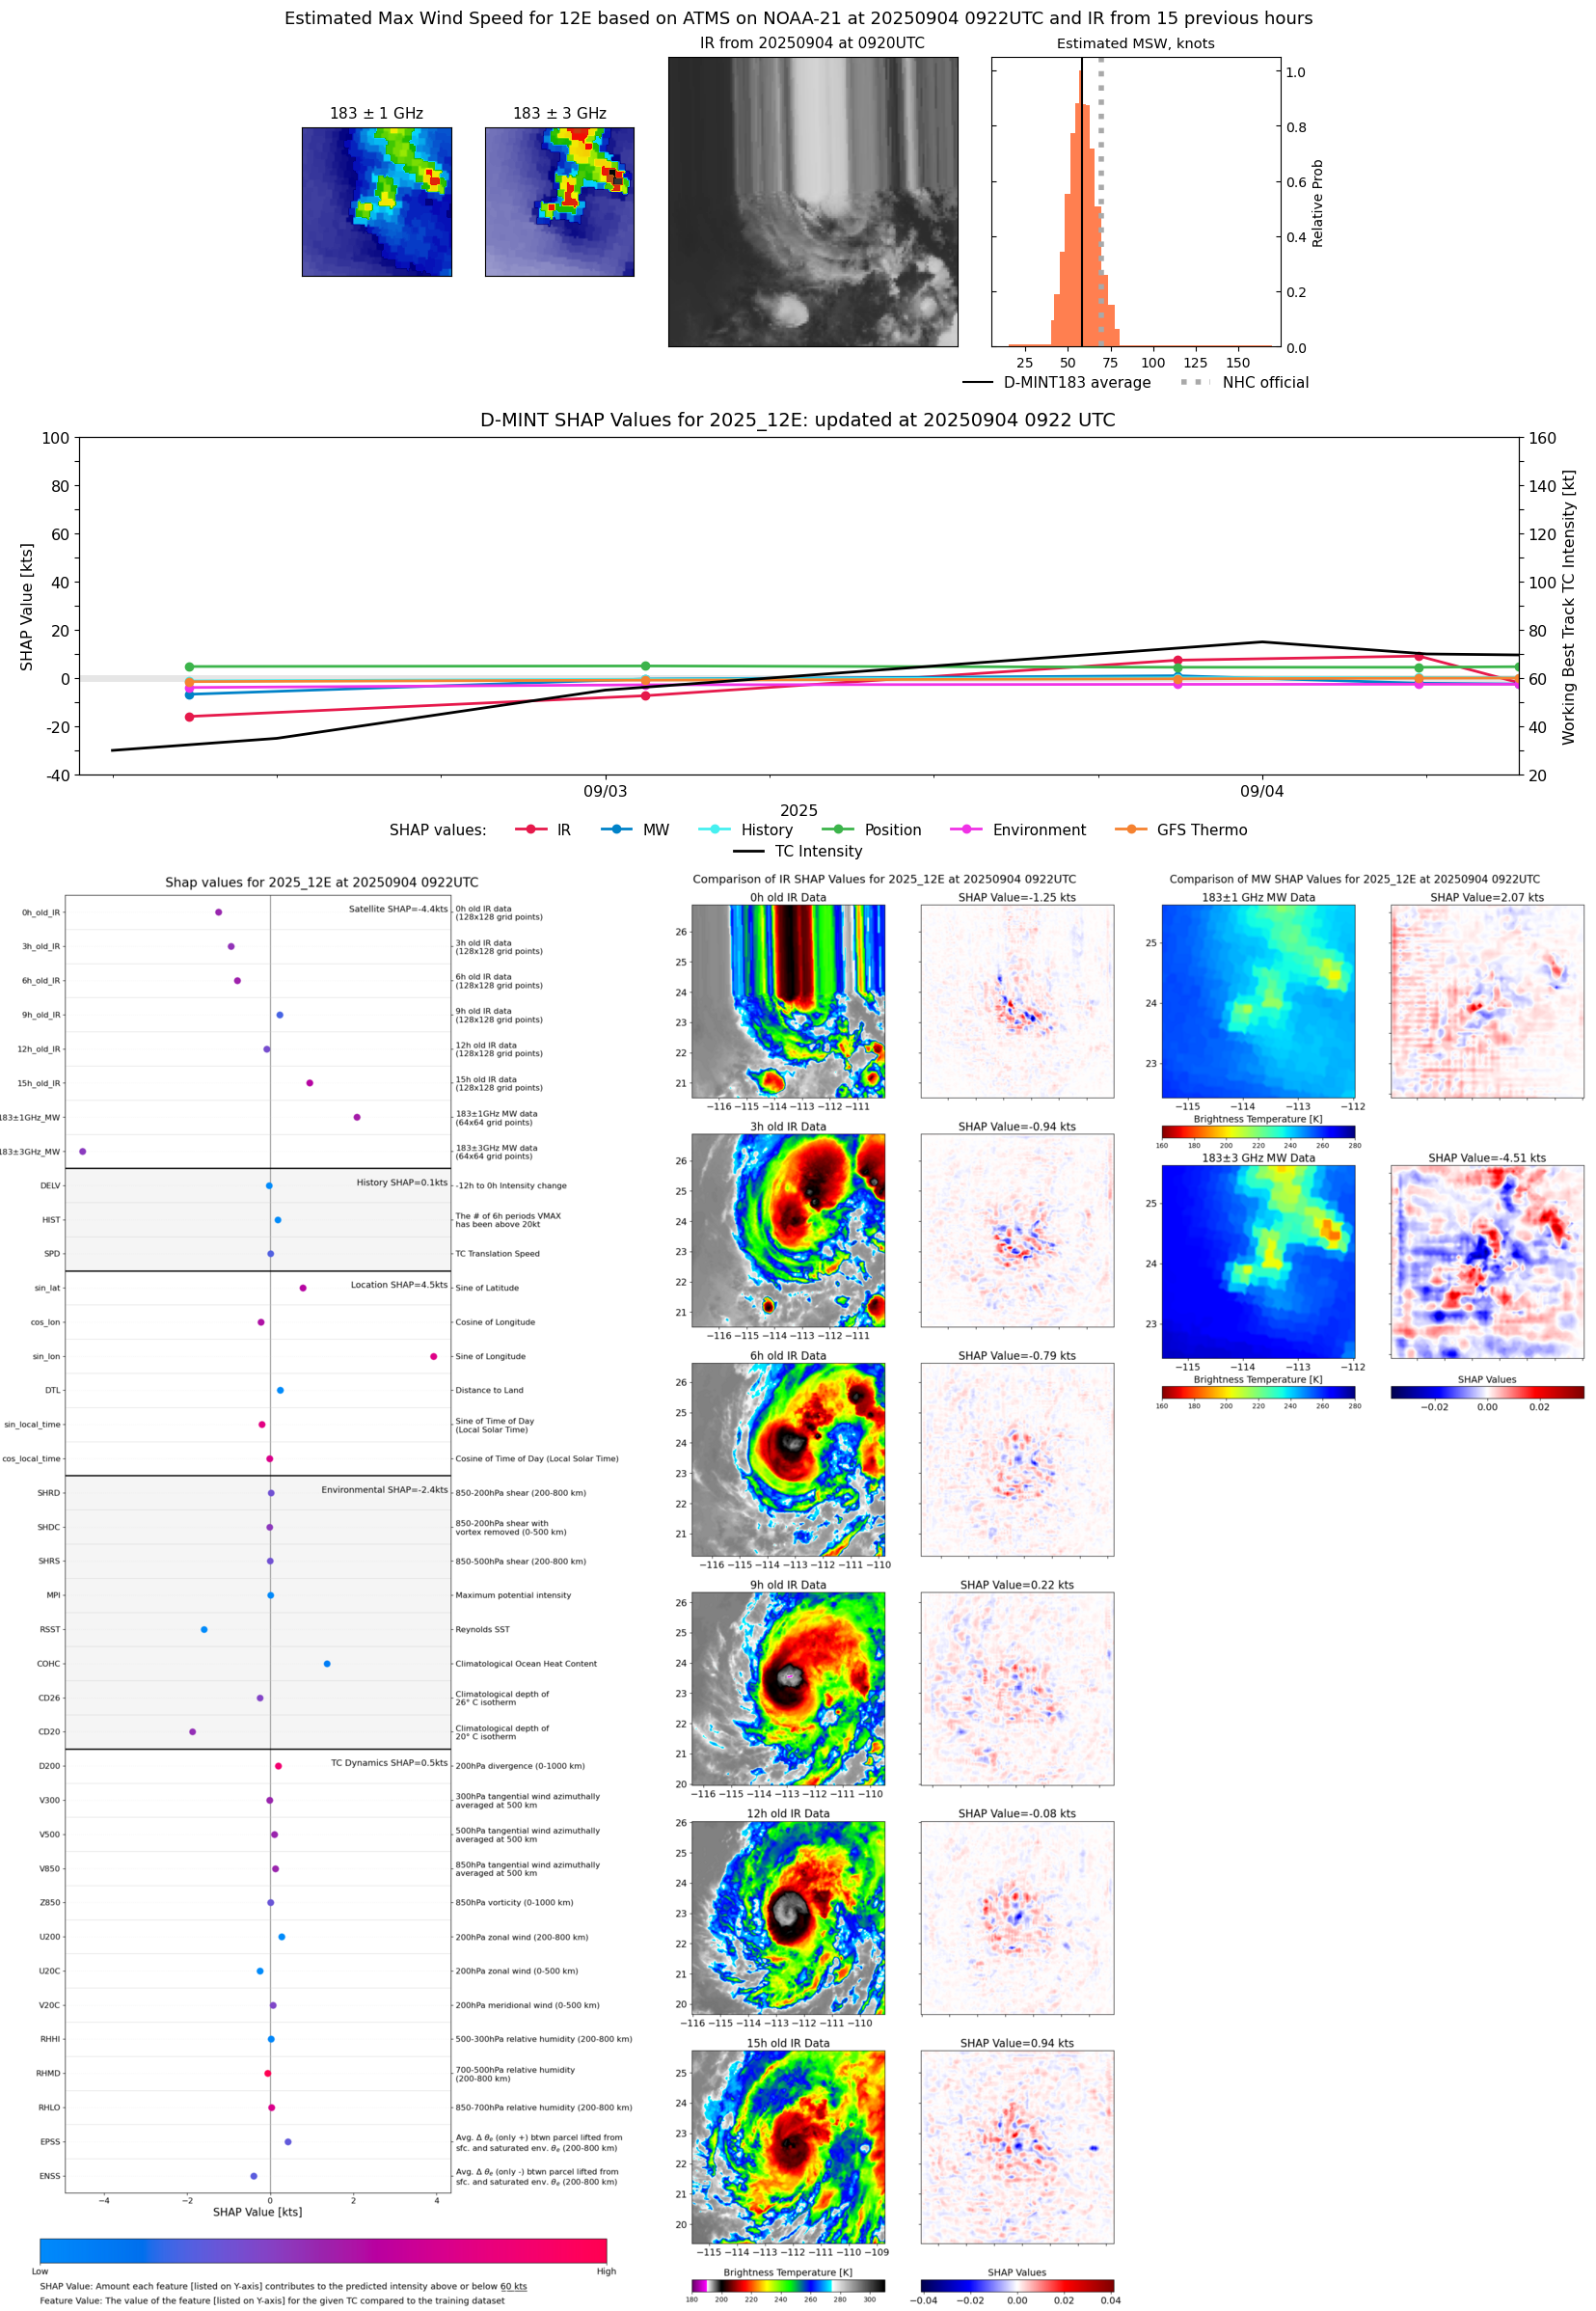 |
| 20250904 | 0912 UTC | AMSR2 | 995 hPa | 53 kts | 48 kts | 59 kts | 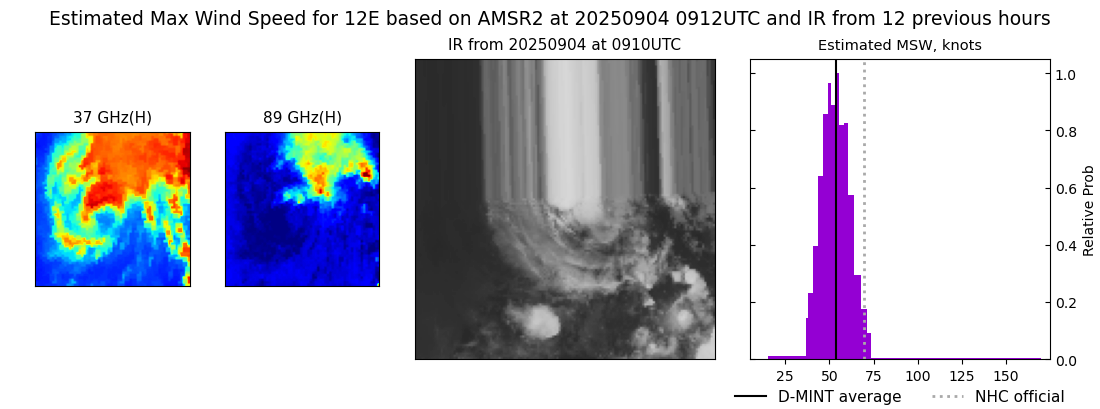 |
| 20250904 | 0810 UTC | GMI | 993 hPa | 53 kts | 48 kts | 59 kts | 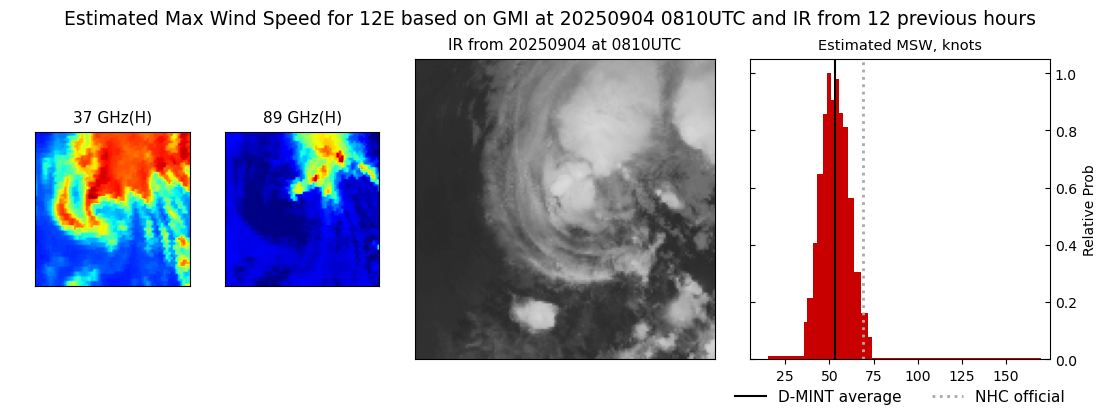 |
| 20250904 | 0808 UTC | GMI | 997 hPa | 46 kts | 41 kts | 51 kts | 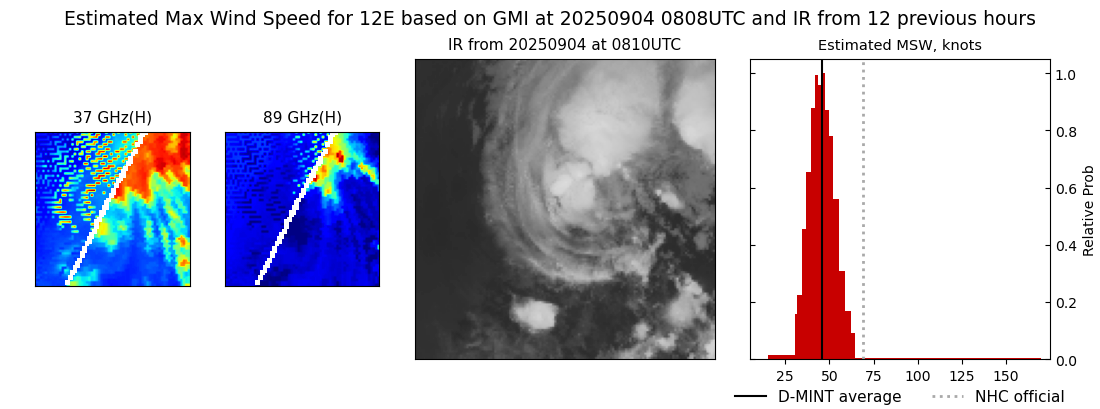 |
| 20250904 | 0543 UTC | AWS | 986 hPa | 70 kts | 63 kts | 76 kts |  |
| 20250904 | 0130 UTC | SSMISF17 | 994 hPa | 56 kts | 50 kts | 63 kts | 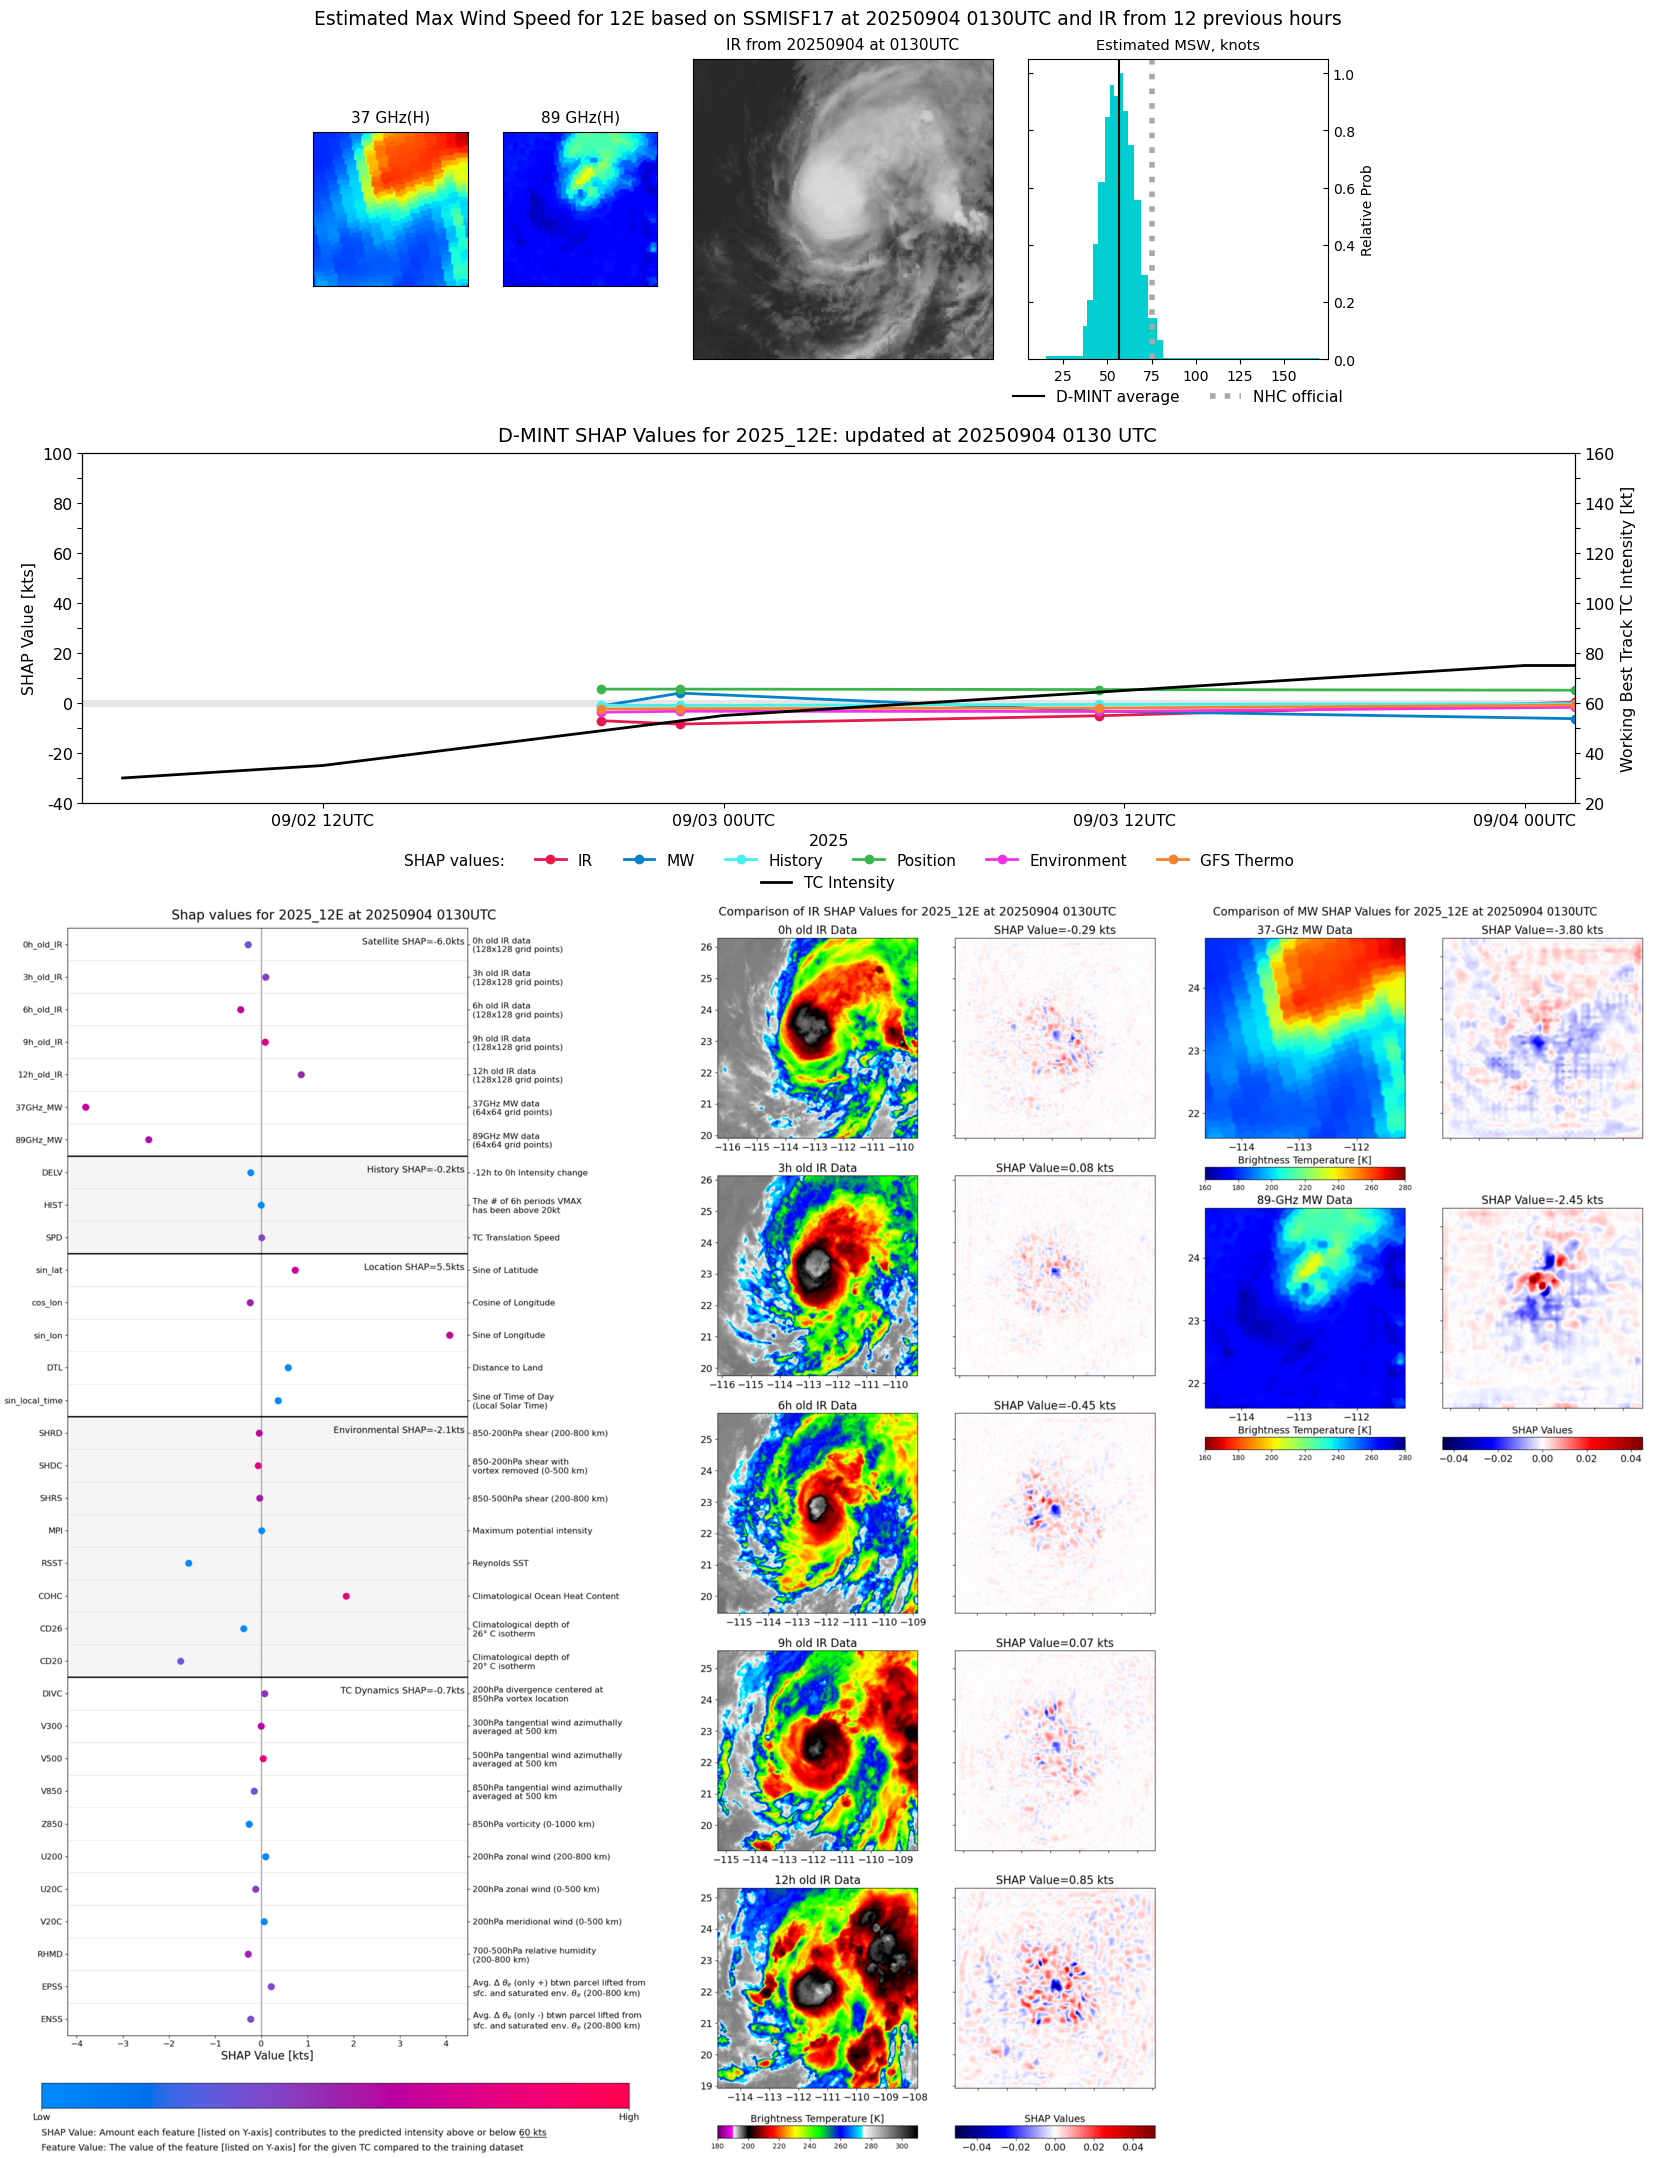 |
| 20250903 | 2104 UTC | AMSR2 | 982 hPa | 76 kts | 69 kts | 84 kts | 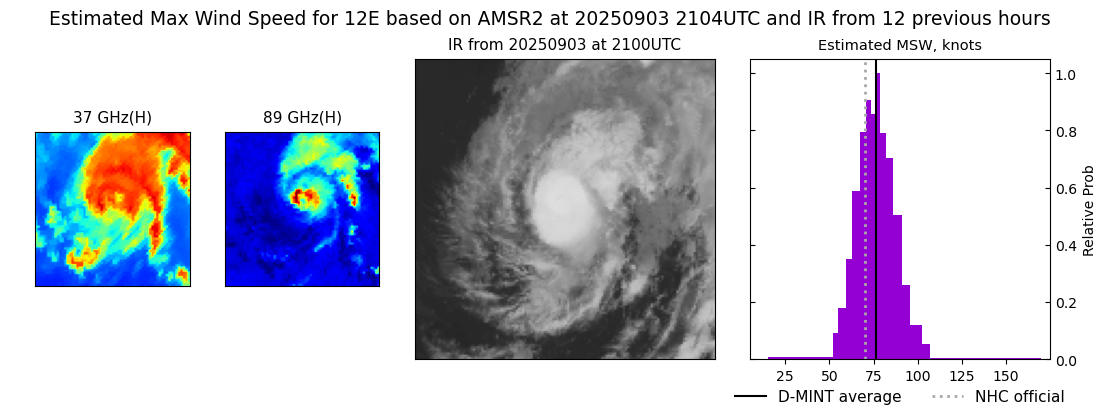 |
| 20250903 | 2054 UTC | ATMS-N21 | 981 hPa | 70 kts | 64 kts | 77 kts | 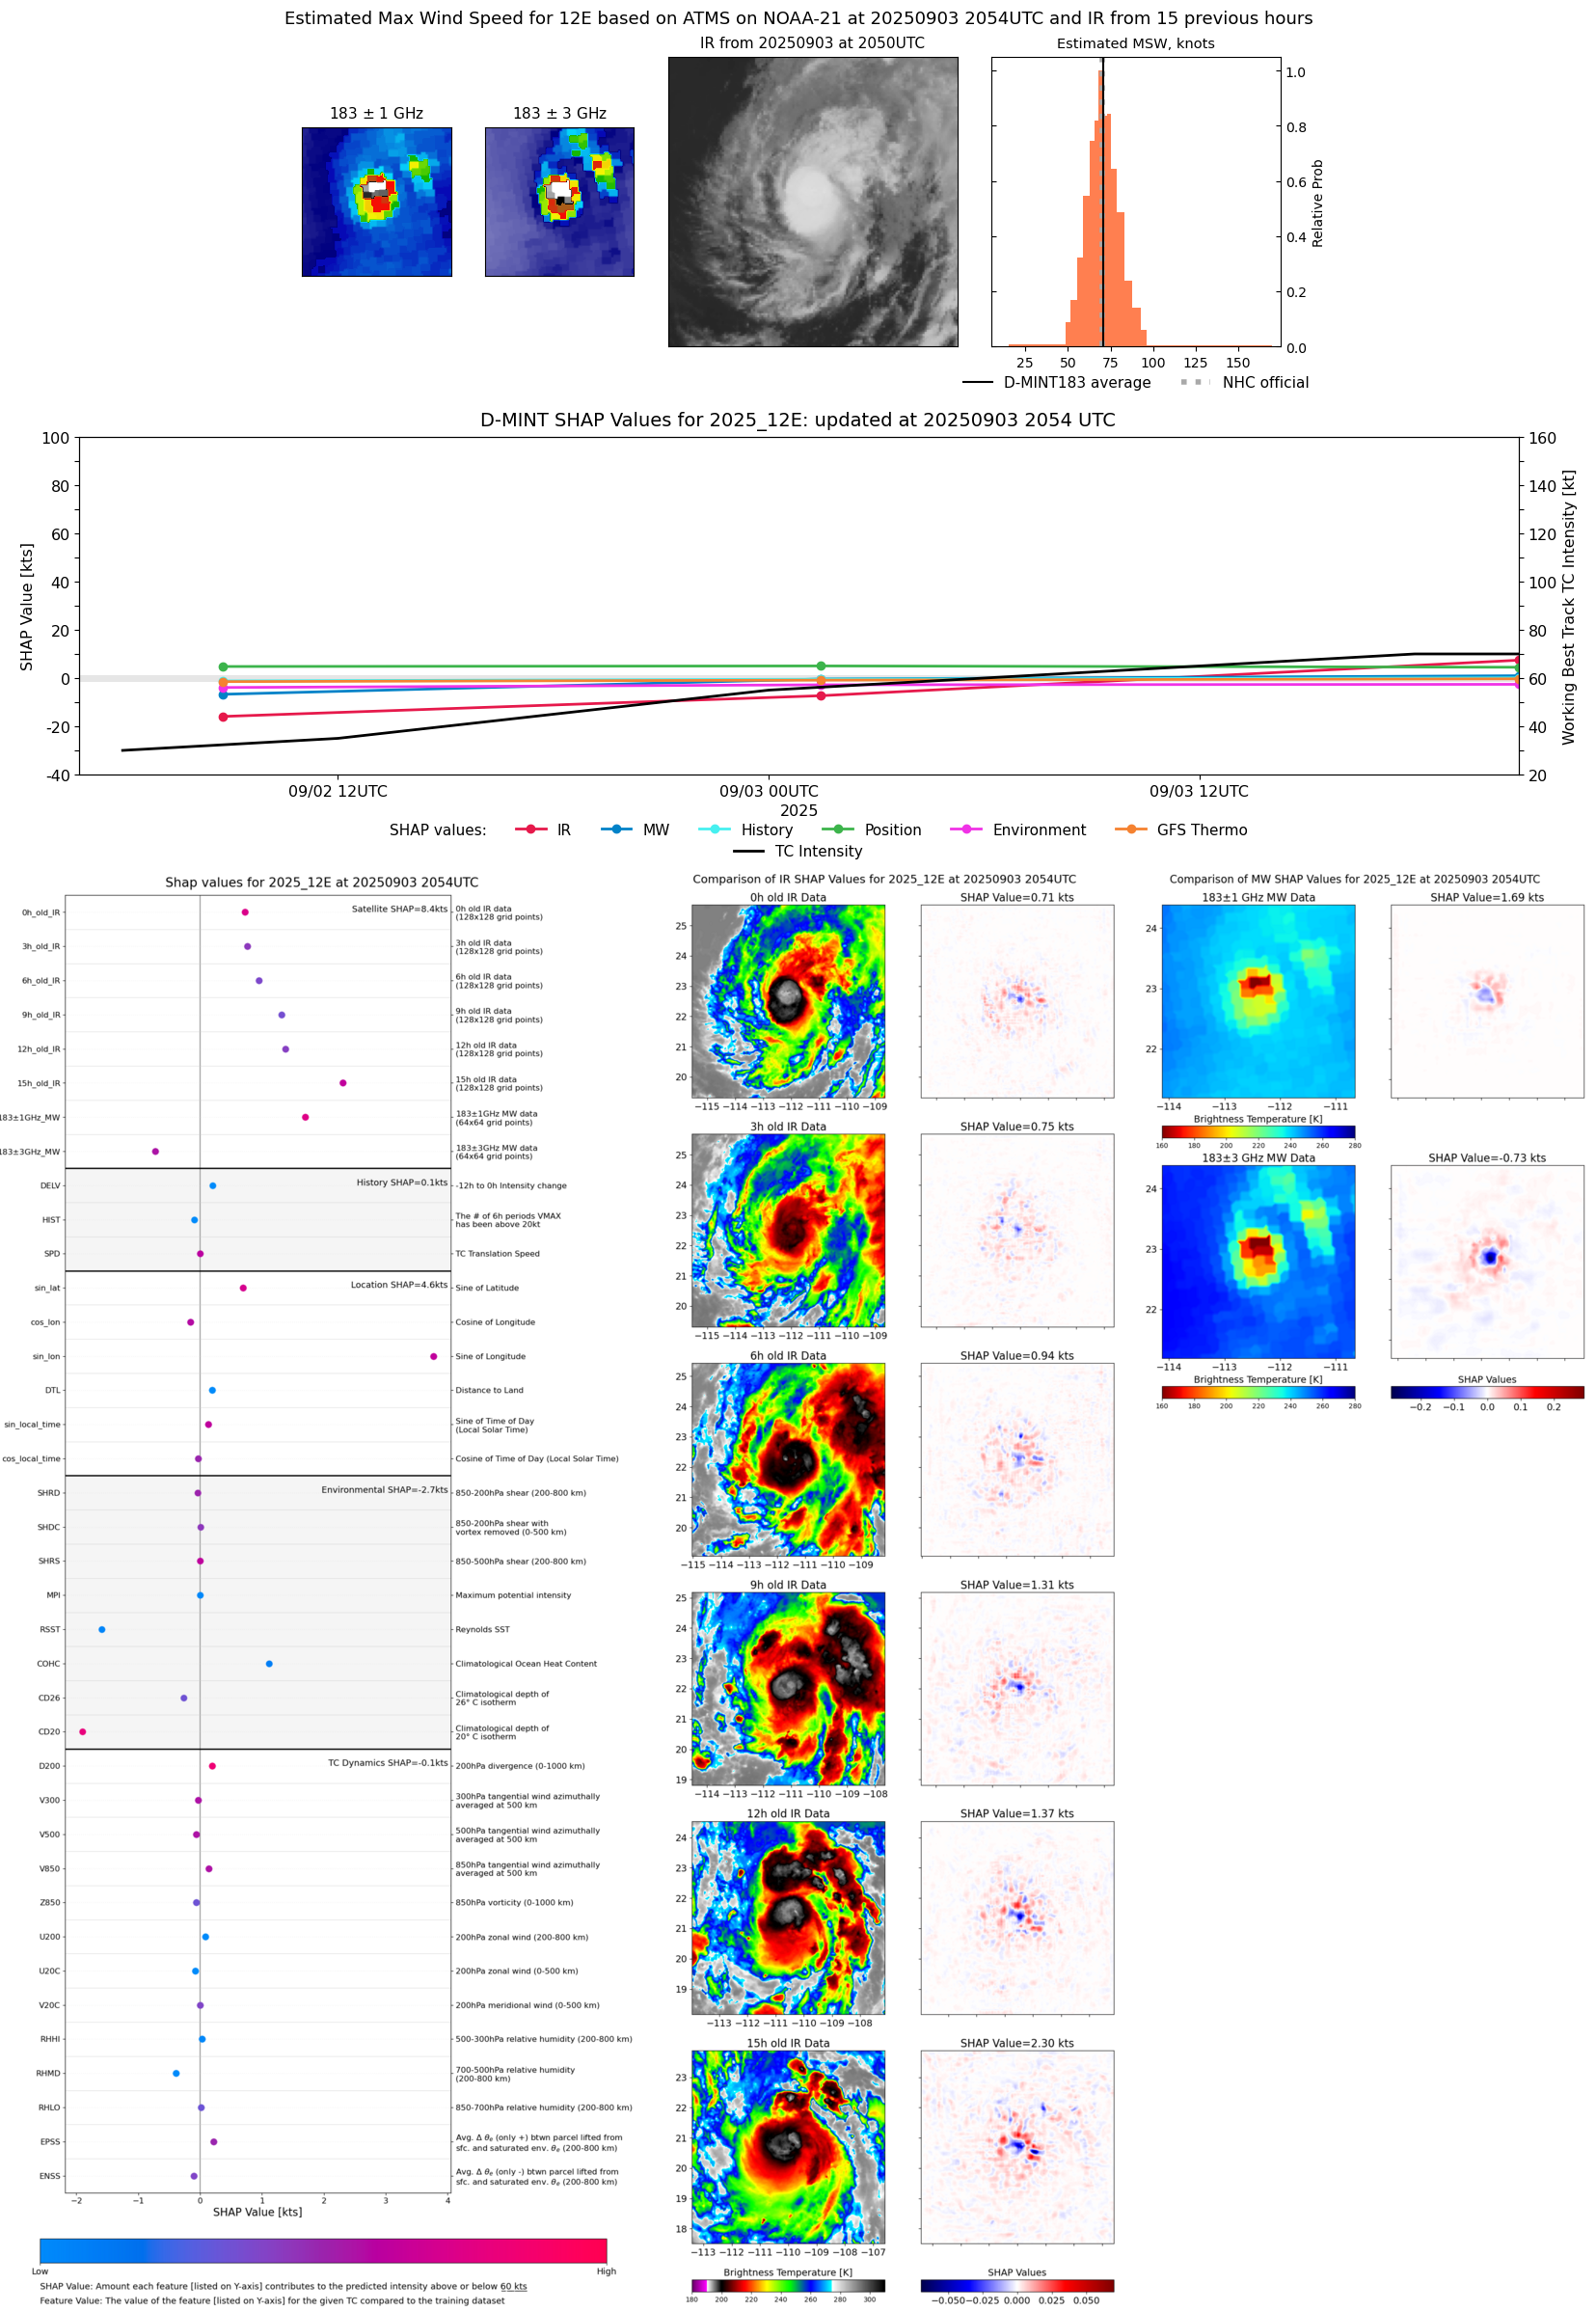 |
| 20250903 | 1727 UTC | TMS05 | 989 hPa | 65 kts | 58 kts | 72 kts | 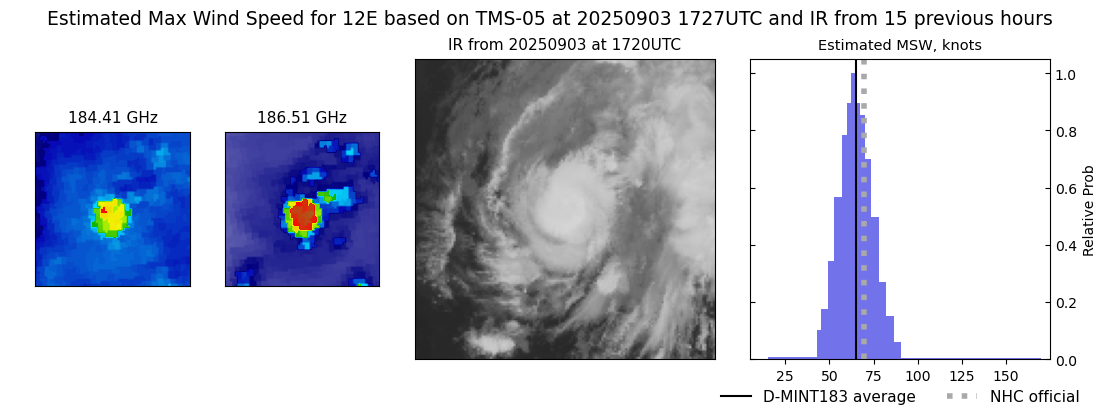 |
| 20250903 | 1114 UTC | SSMISF18 | 996 hPa | 51 kts | 45 kts | 58 kts | 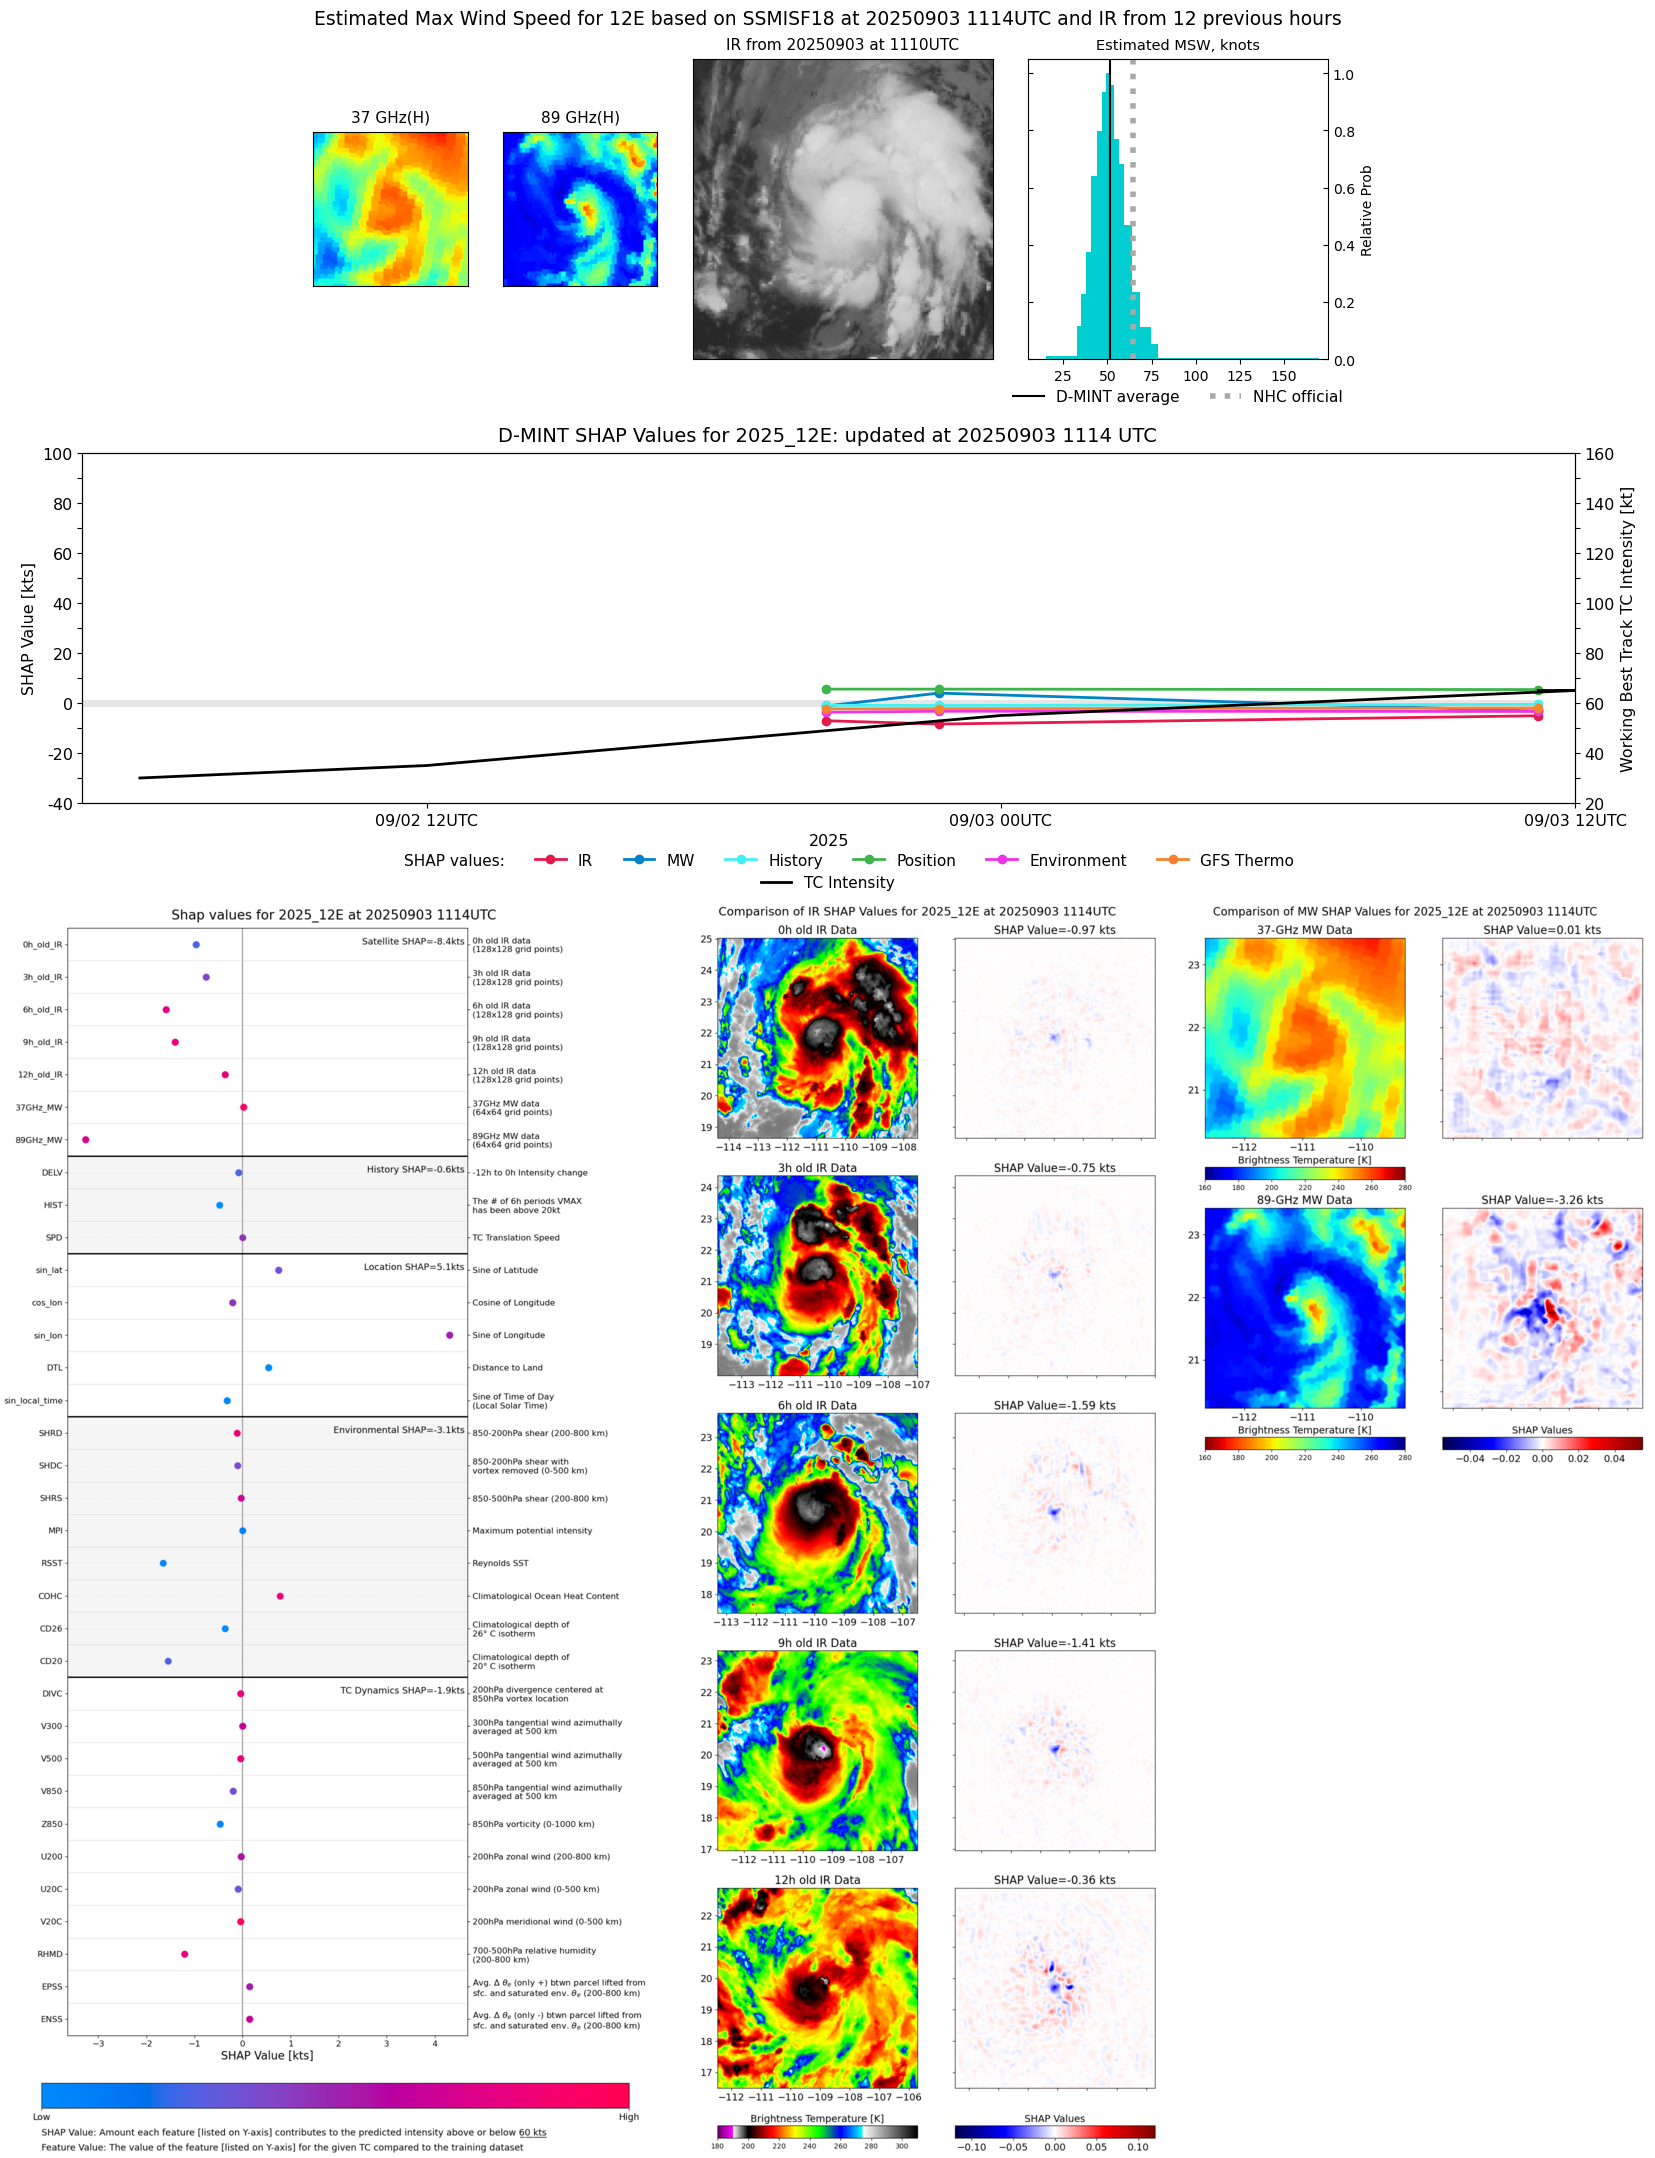 |
| 20250903 | 0532 UTC | AWS | 996 hPa | 55 kts | 50 kts | 61 kts | 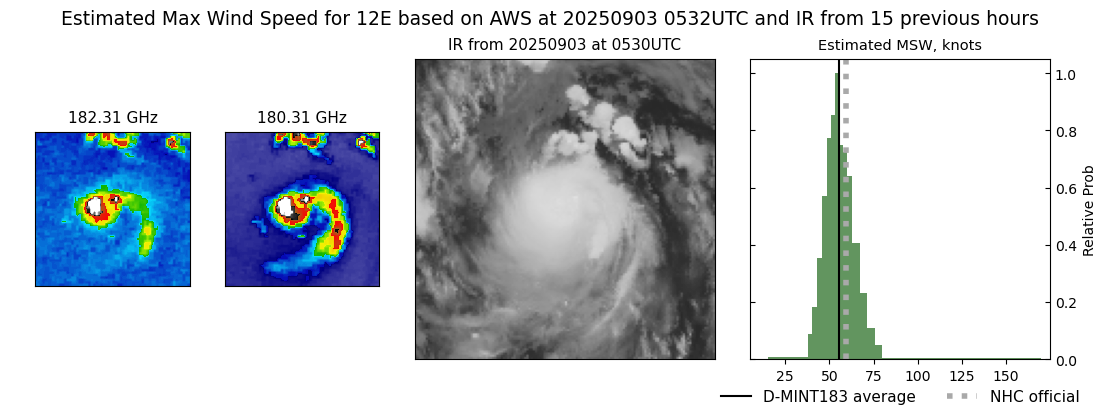 |
| 20250903 | 0127 UTC | TROPICS03 | 995 hPa | 53 kts | 48 kts | 59 kts | 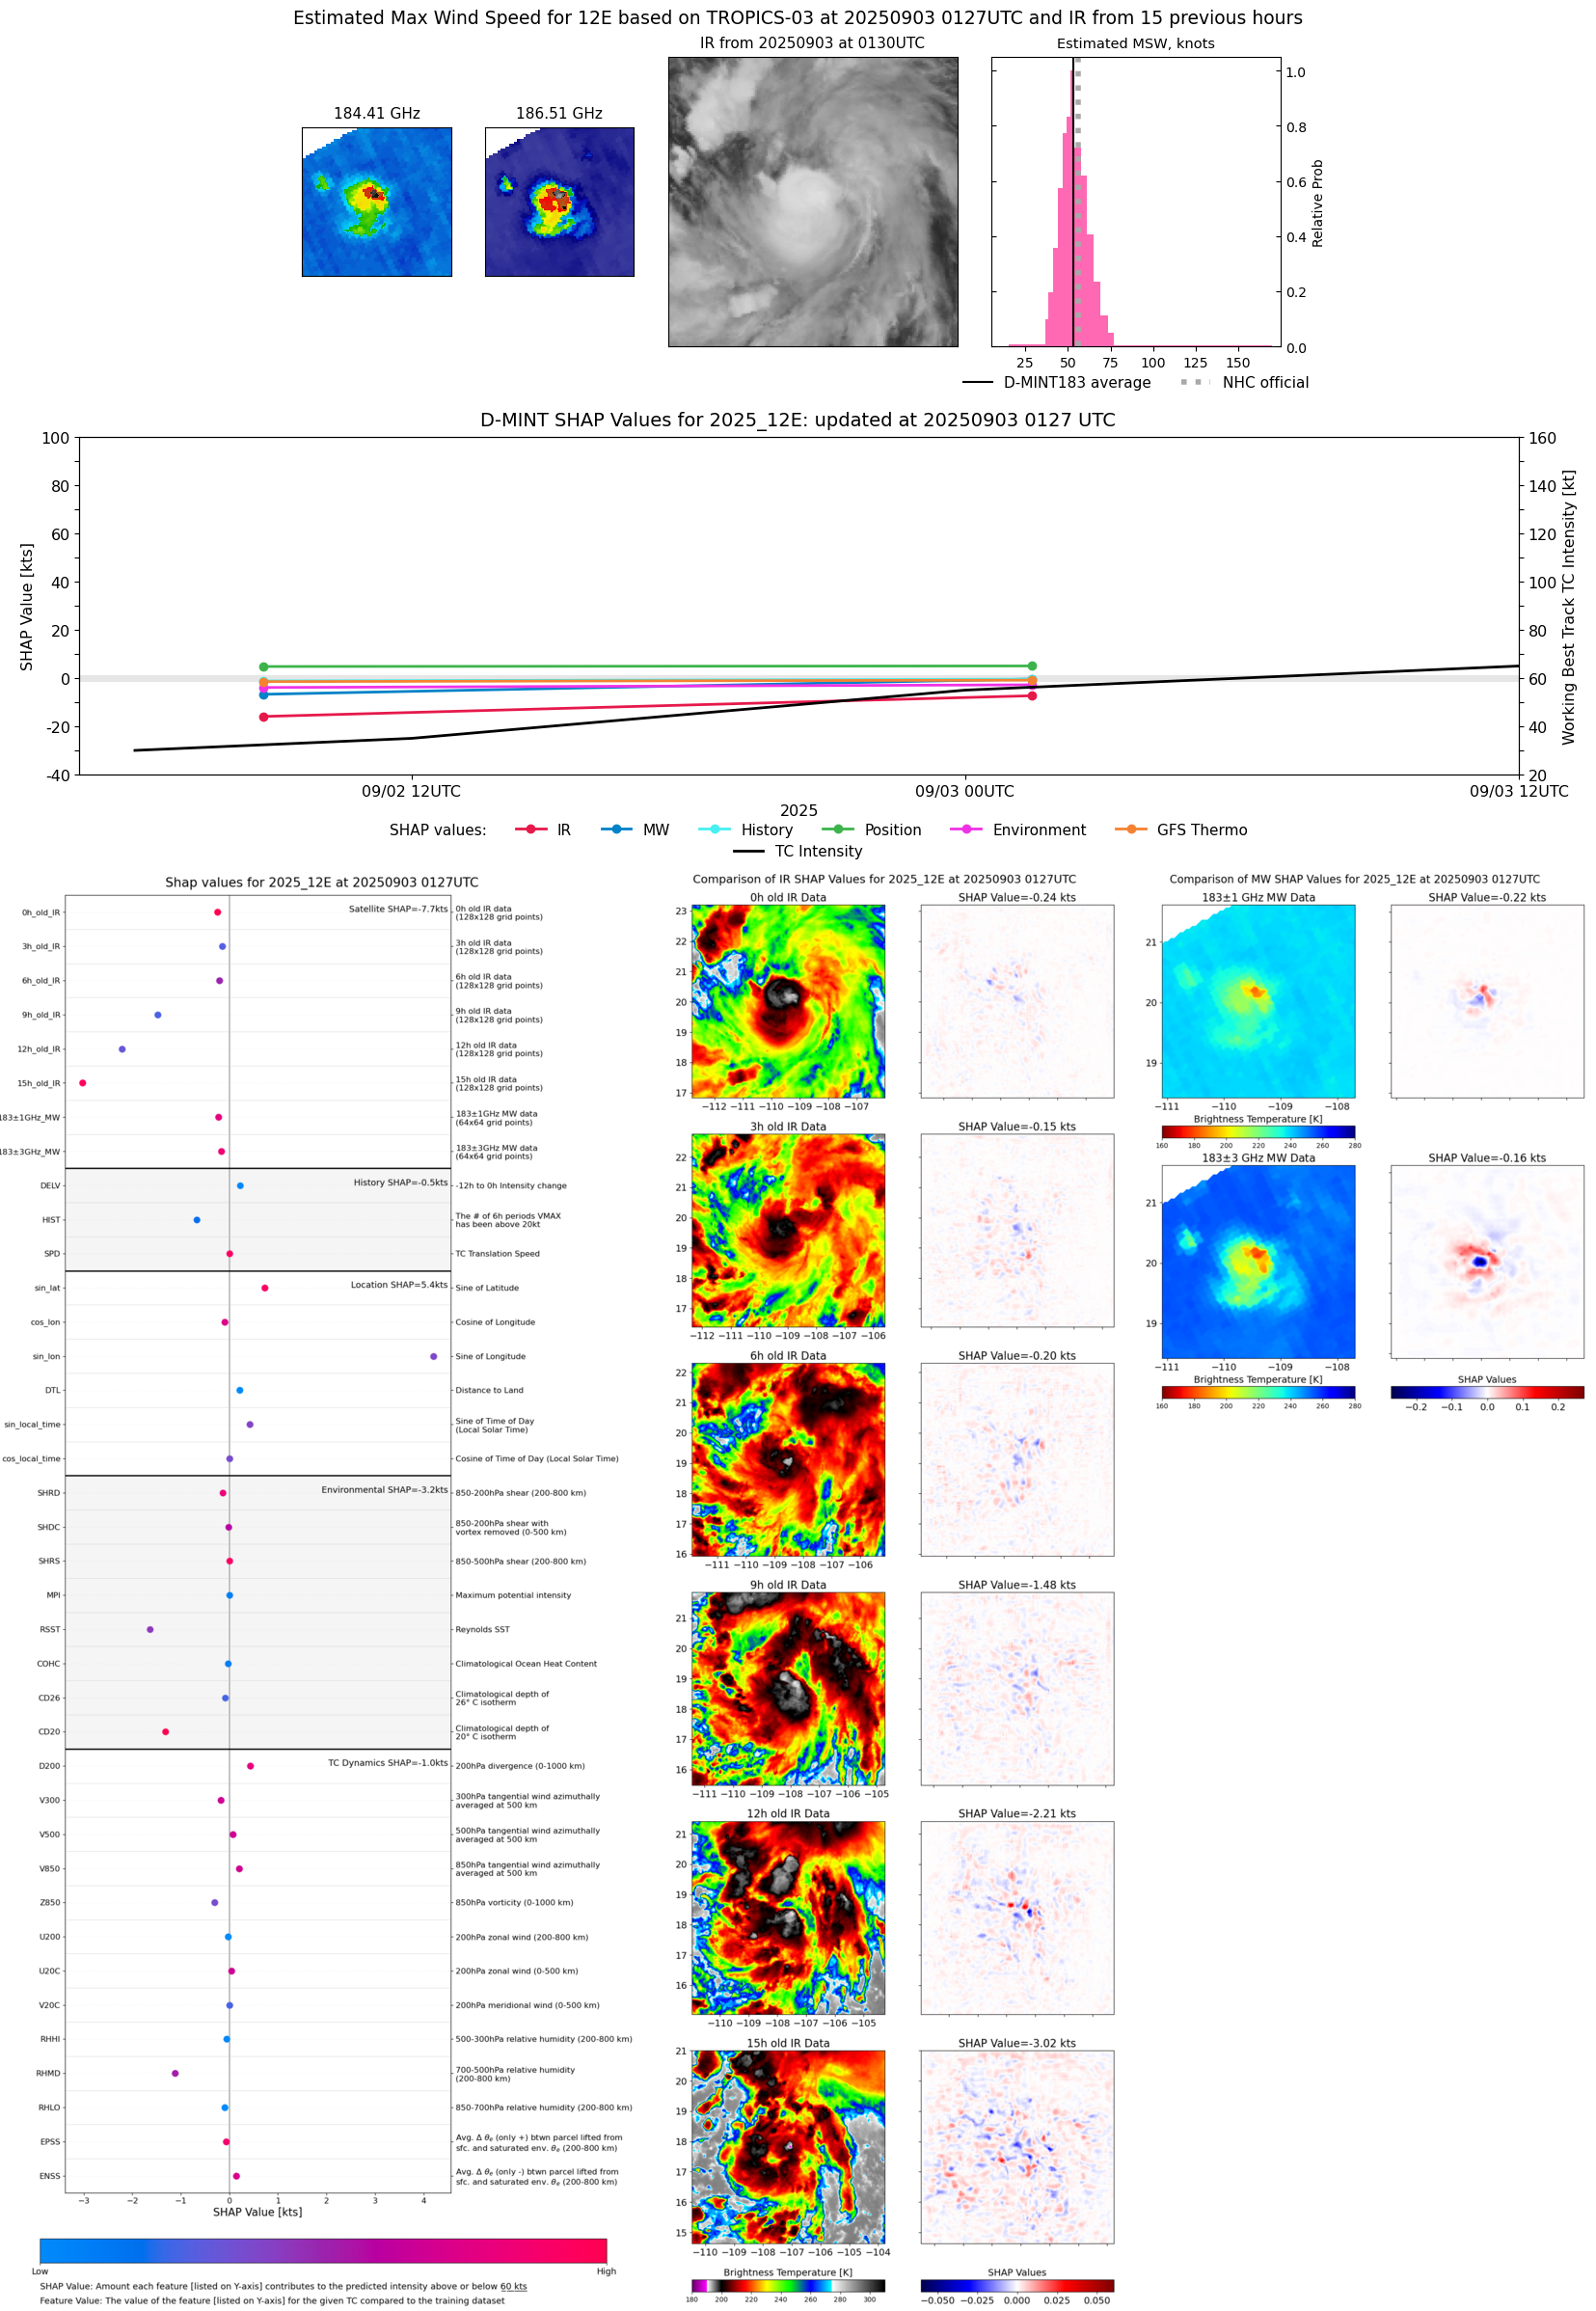 |
| 20250902 | 2242 UTC | SSMISF18 | 1000 hPa | 55 kts | 48 kts | 61 kts |  |
| 20250902 | 2242 UTC | SSMISF18 | 997 hPa | 56 kts | 49 kts | 63 kts | 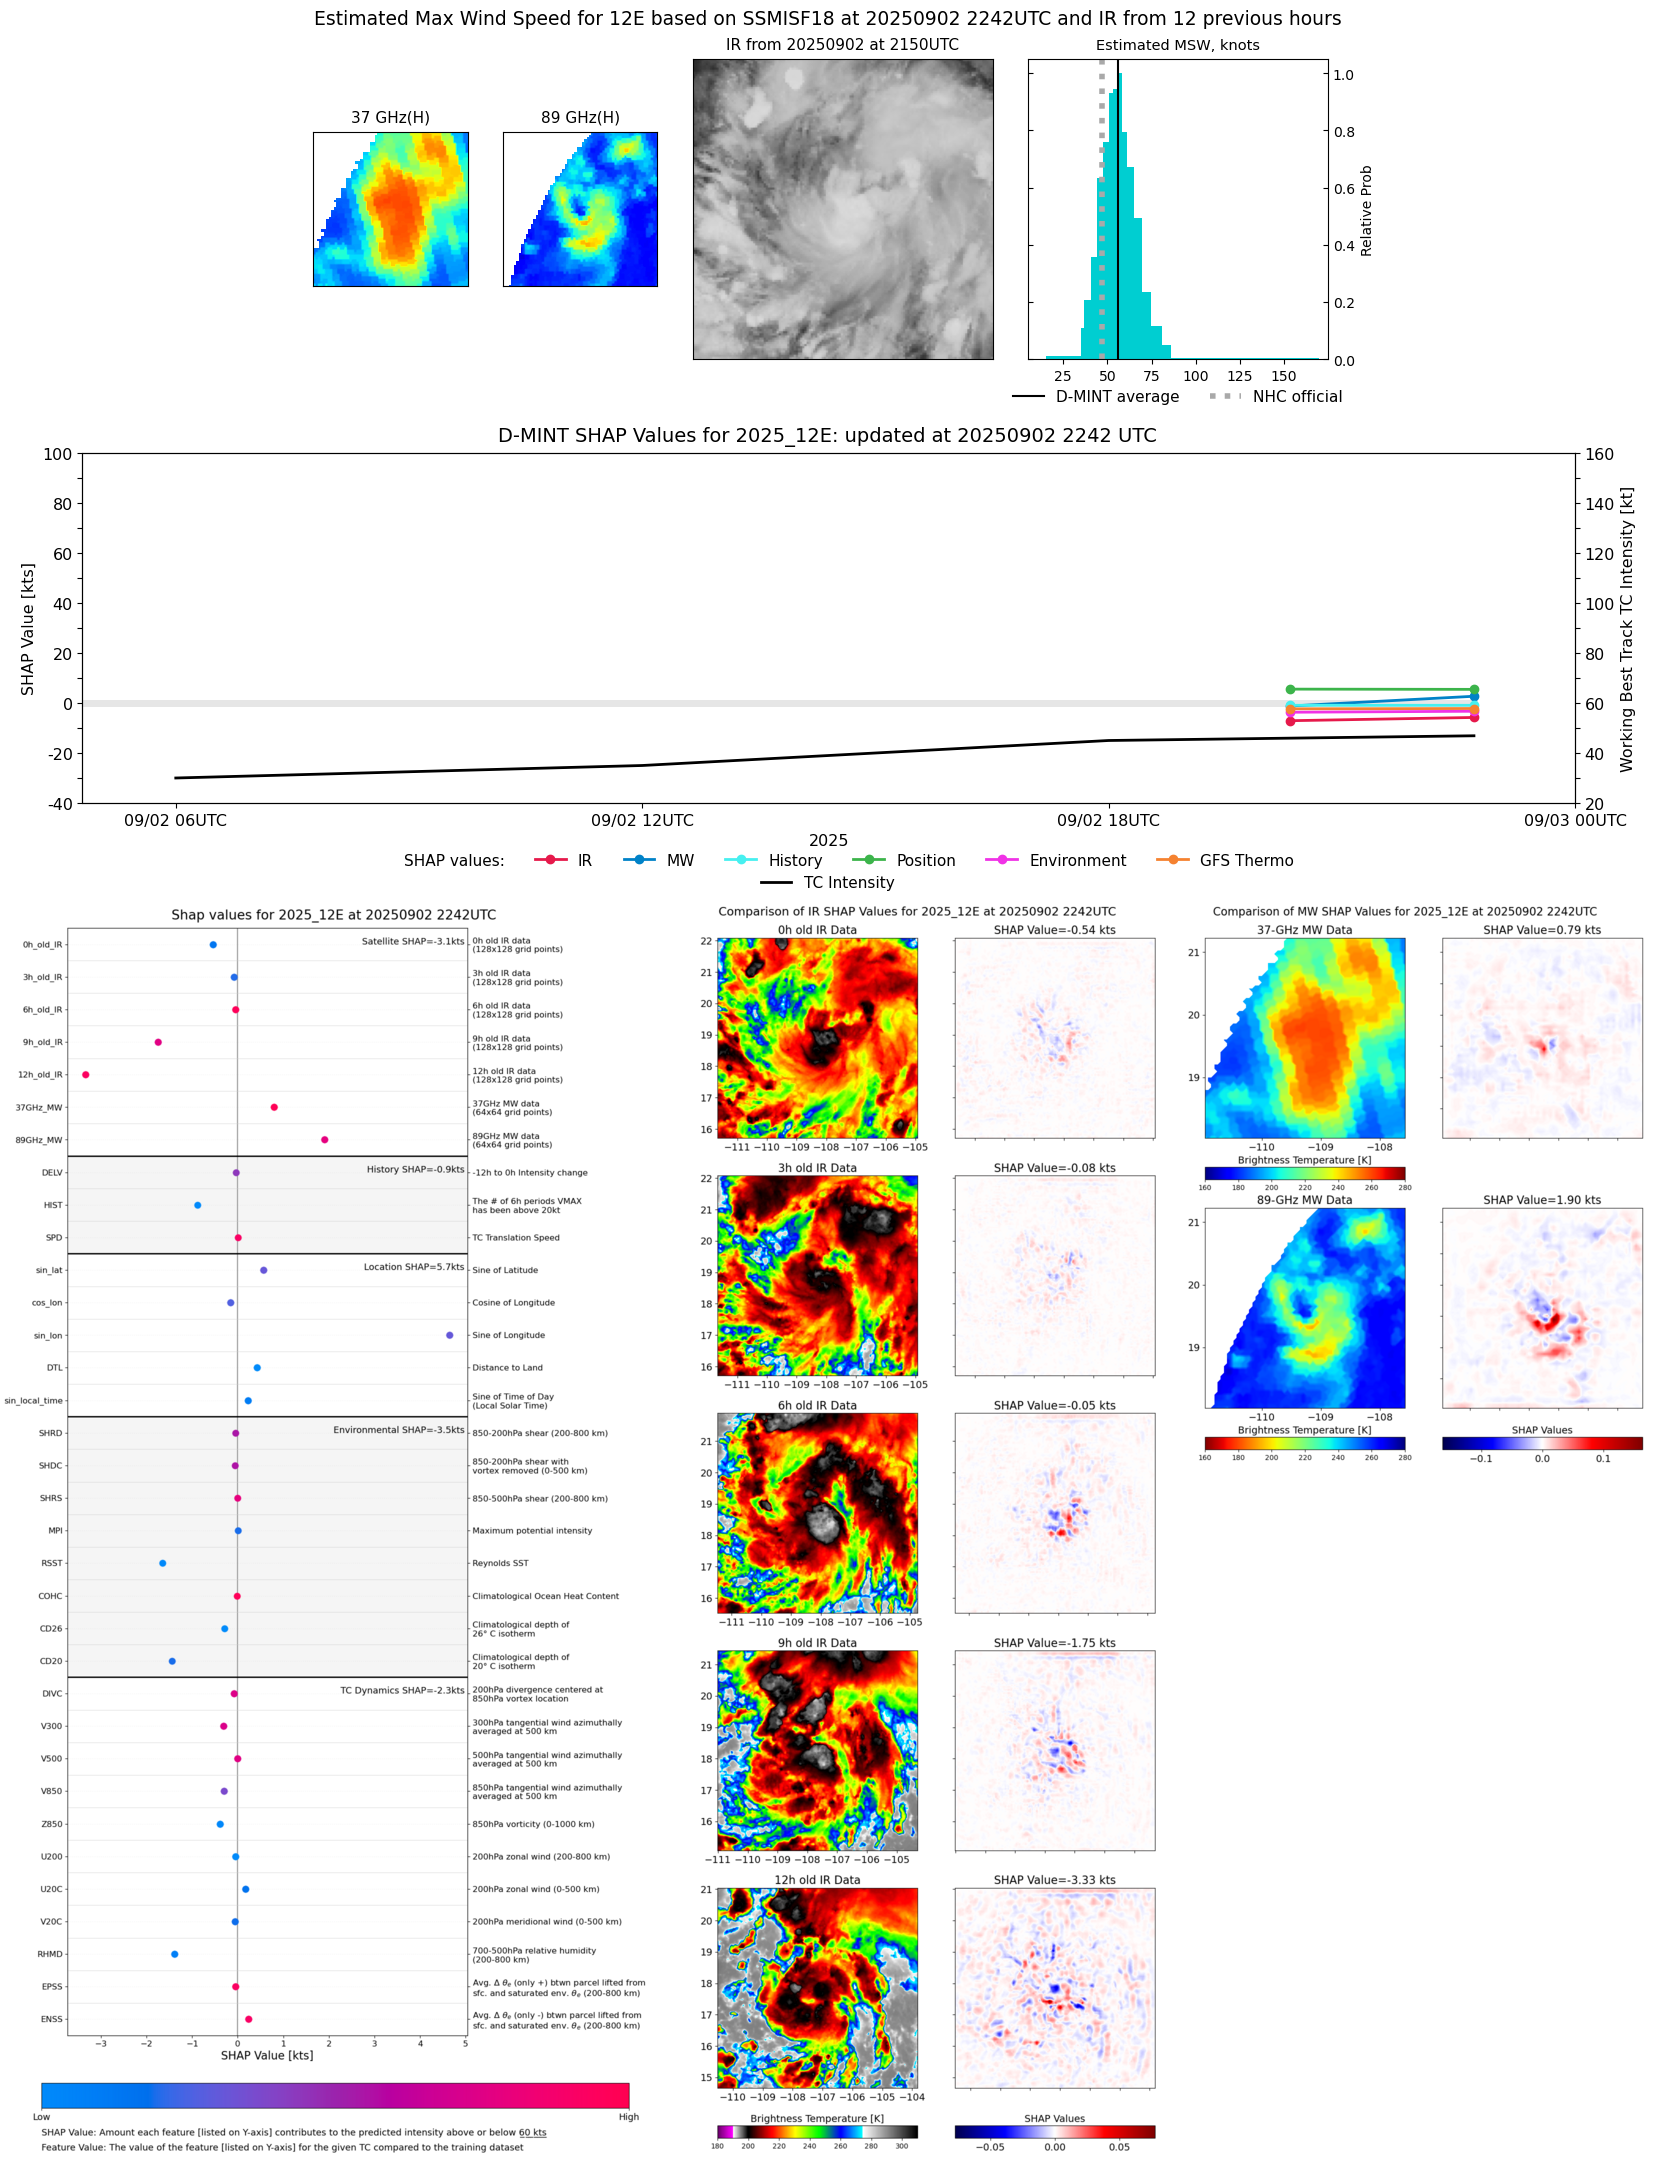 |
| 20250902 | 2102 UTC | TROPICS05 | 997 hPa | 50 kts | 45 kts | 56 kts | 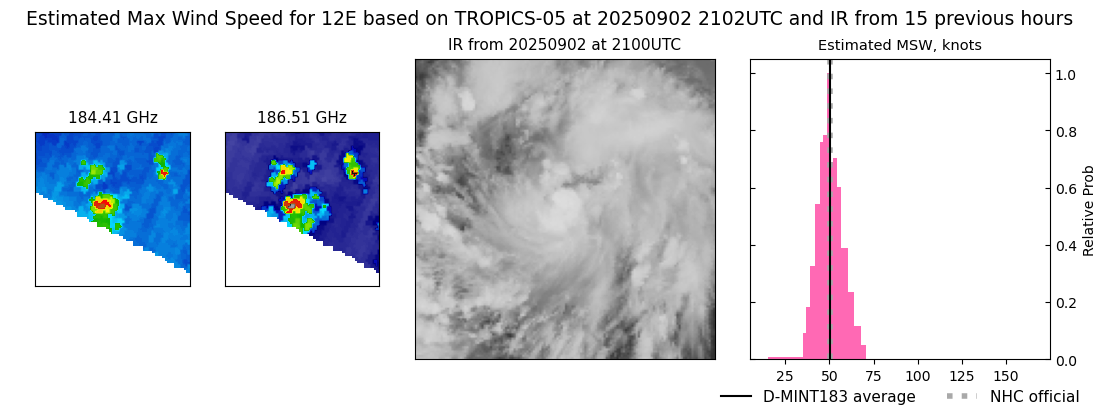 |
| 20250902 | 2020 UTC | AMSR2 | 1000 hPa | 50 kts | 45 kts | 56 kts | 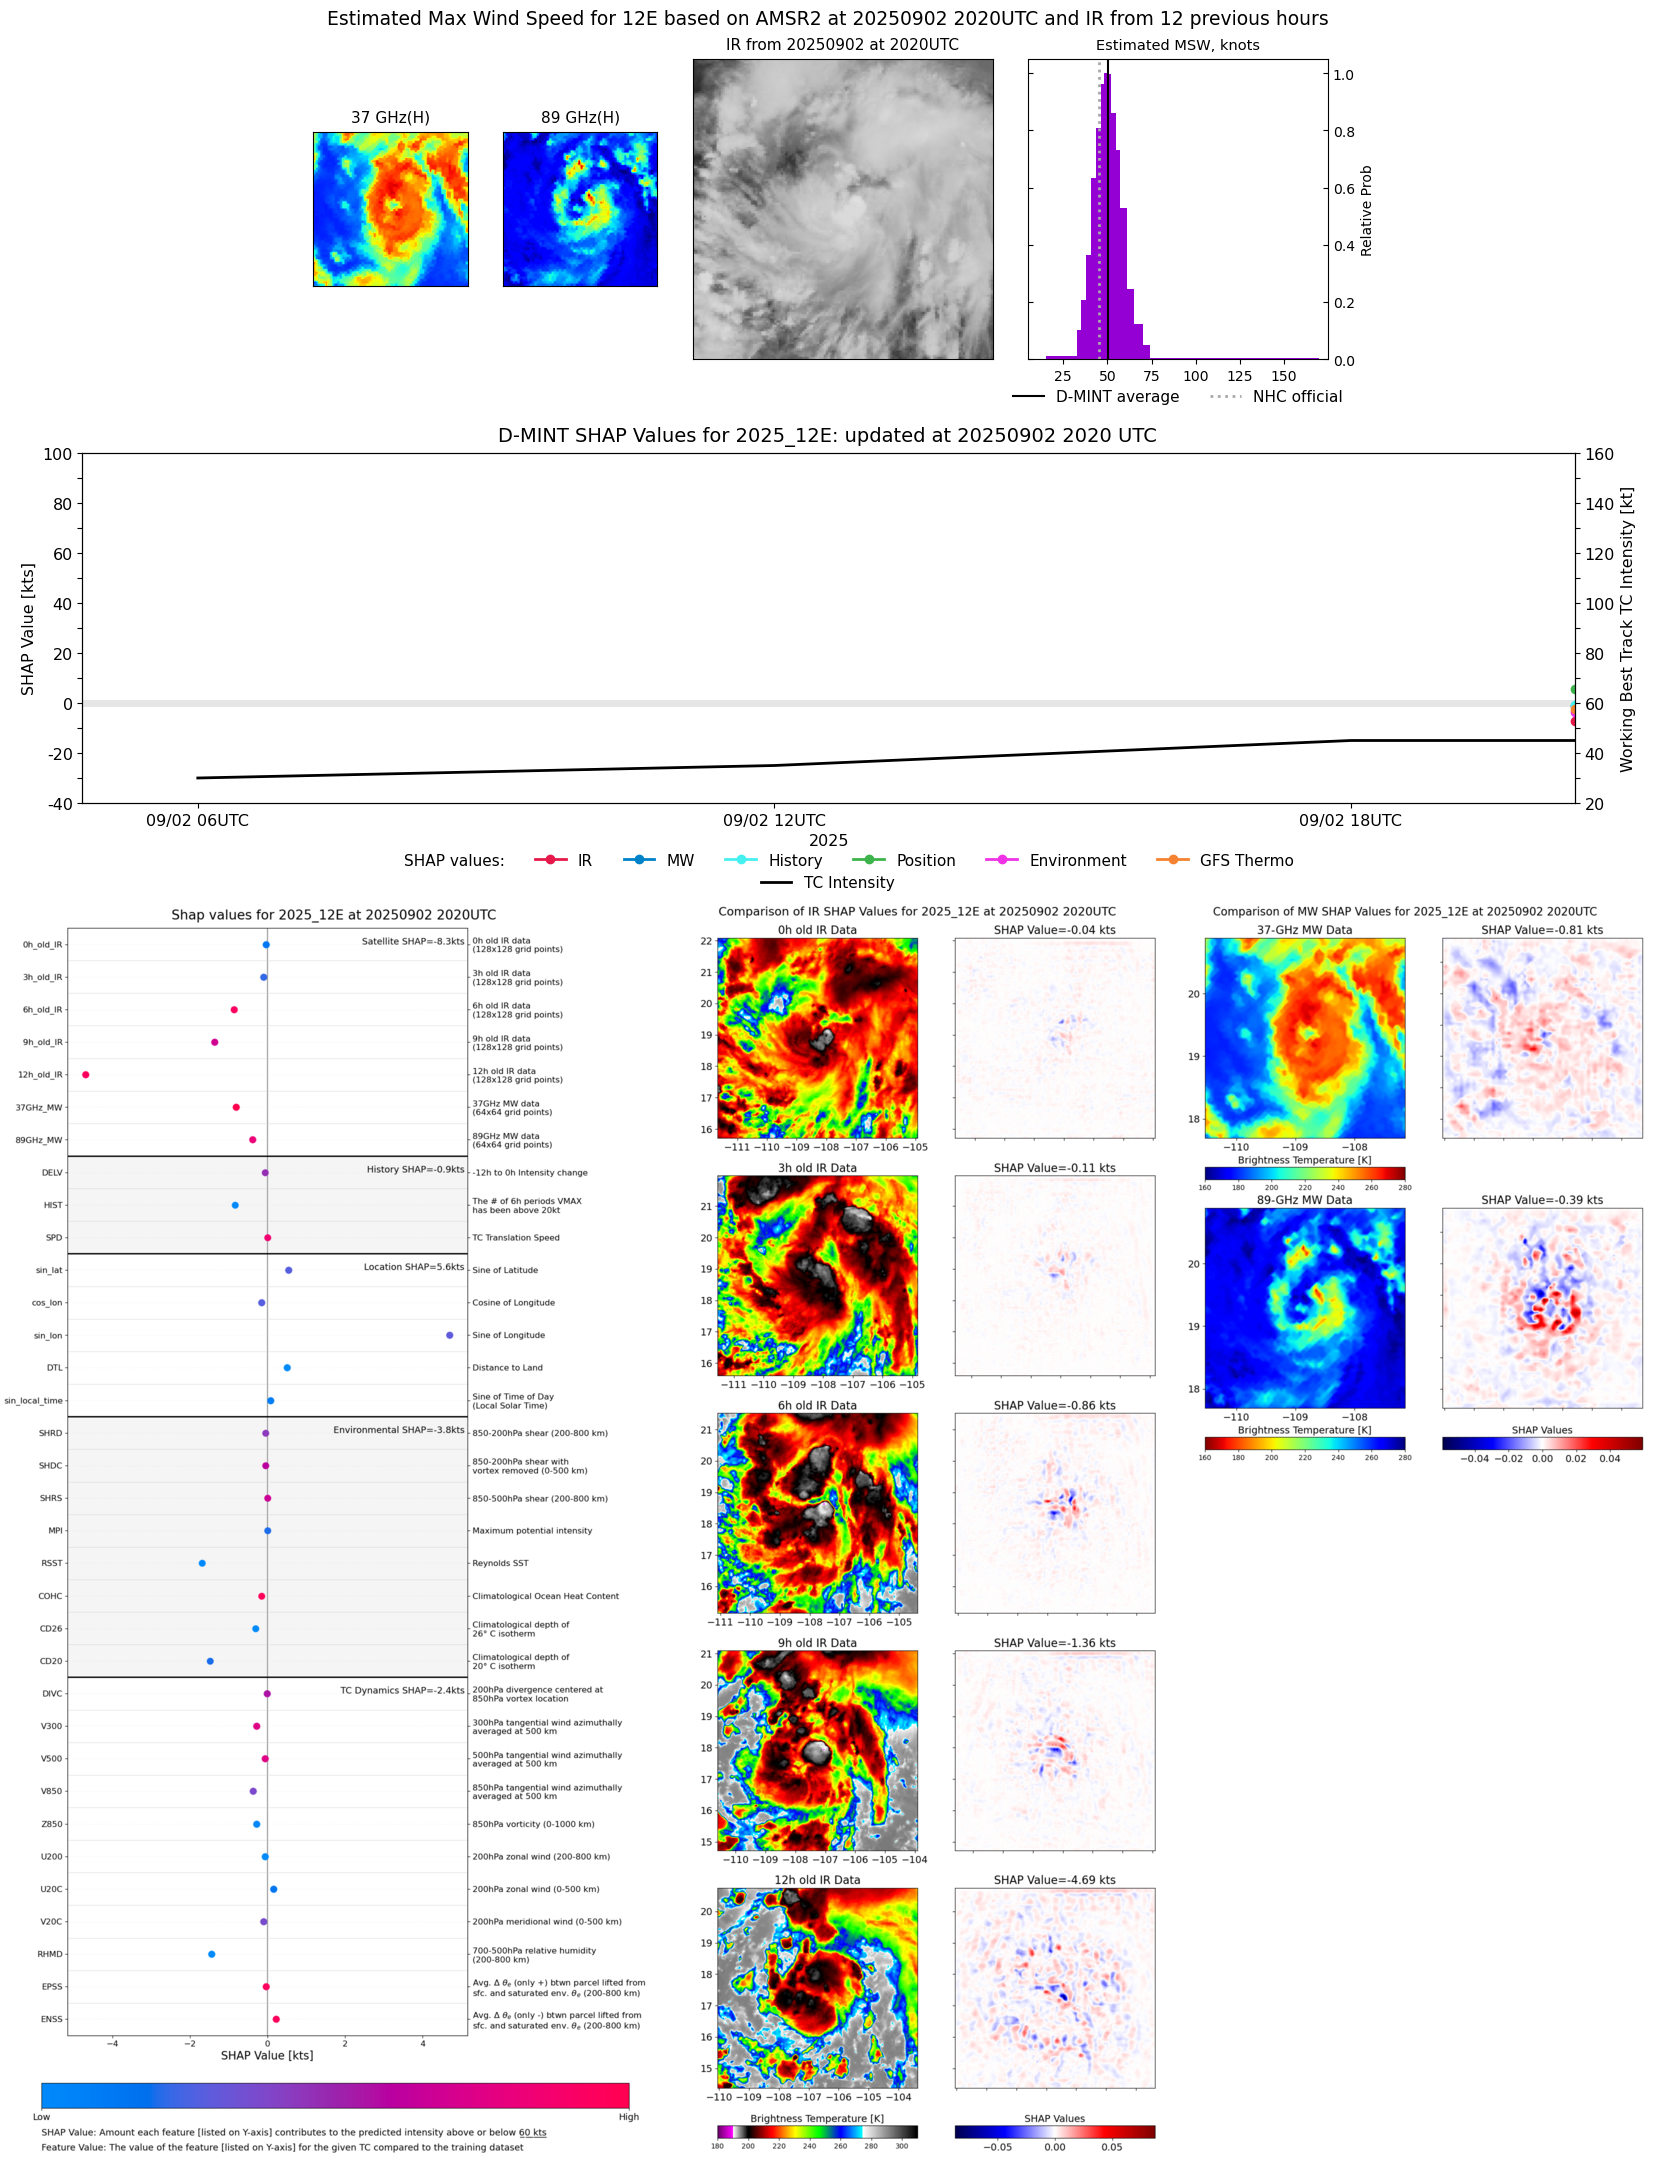 |
| 20250902 | 1324 UTC | WSFM01 | 998 hPa | 48 kts | 42 kts | 53 kts | 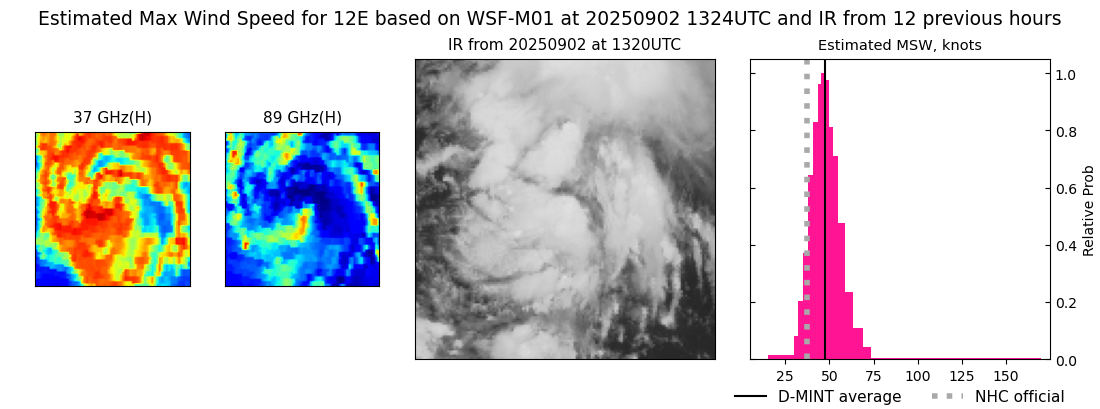 |
| 20250902 | 0847 UTC | ATMS-NPP | 1003 hPa | 36 kts | 31 kts | 41 kts | 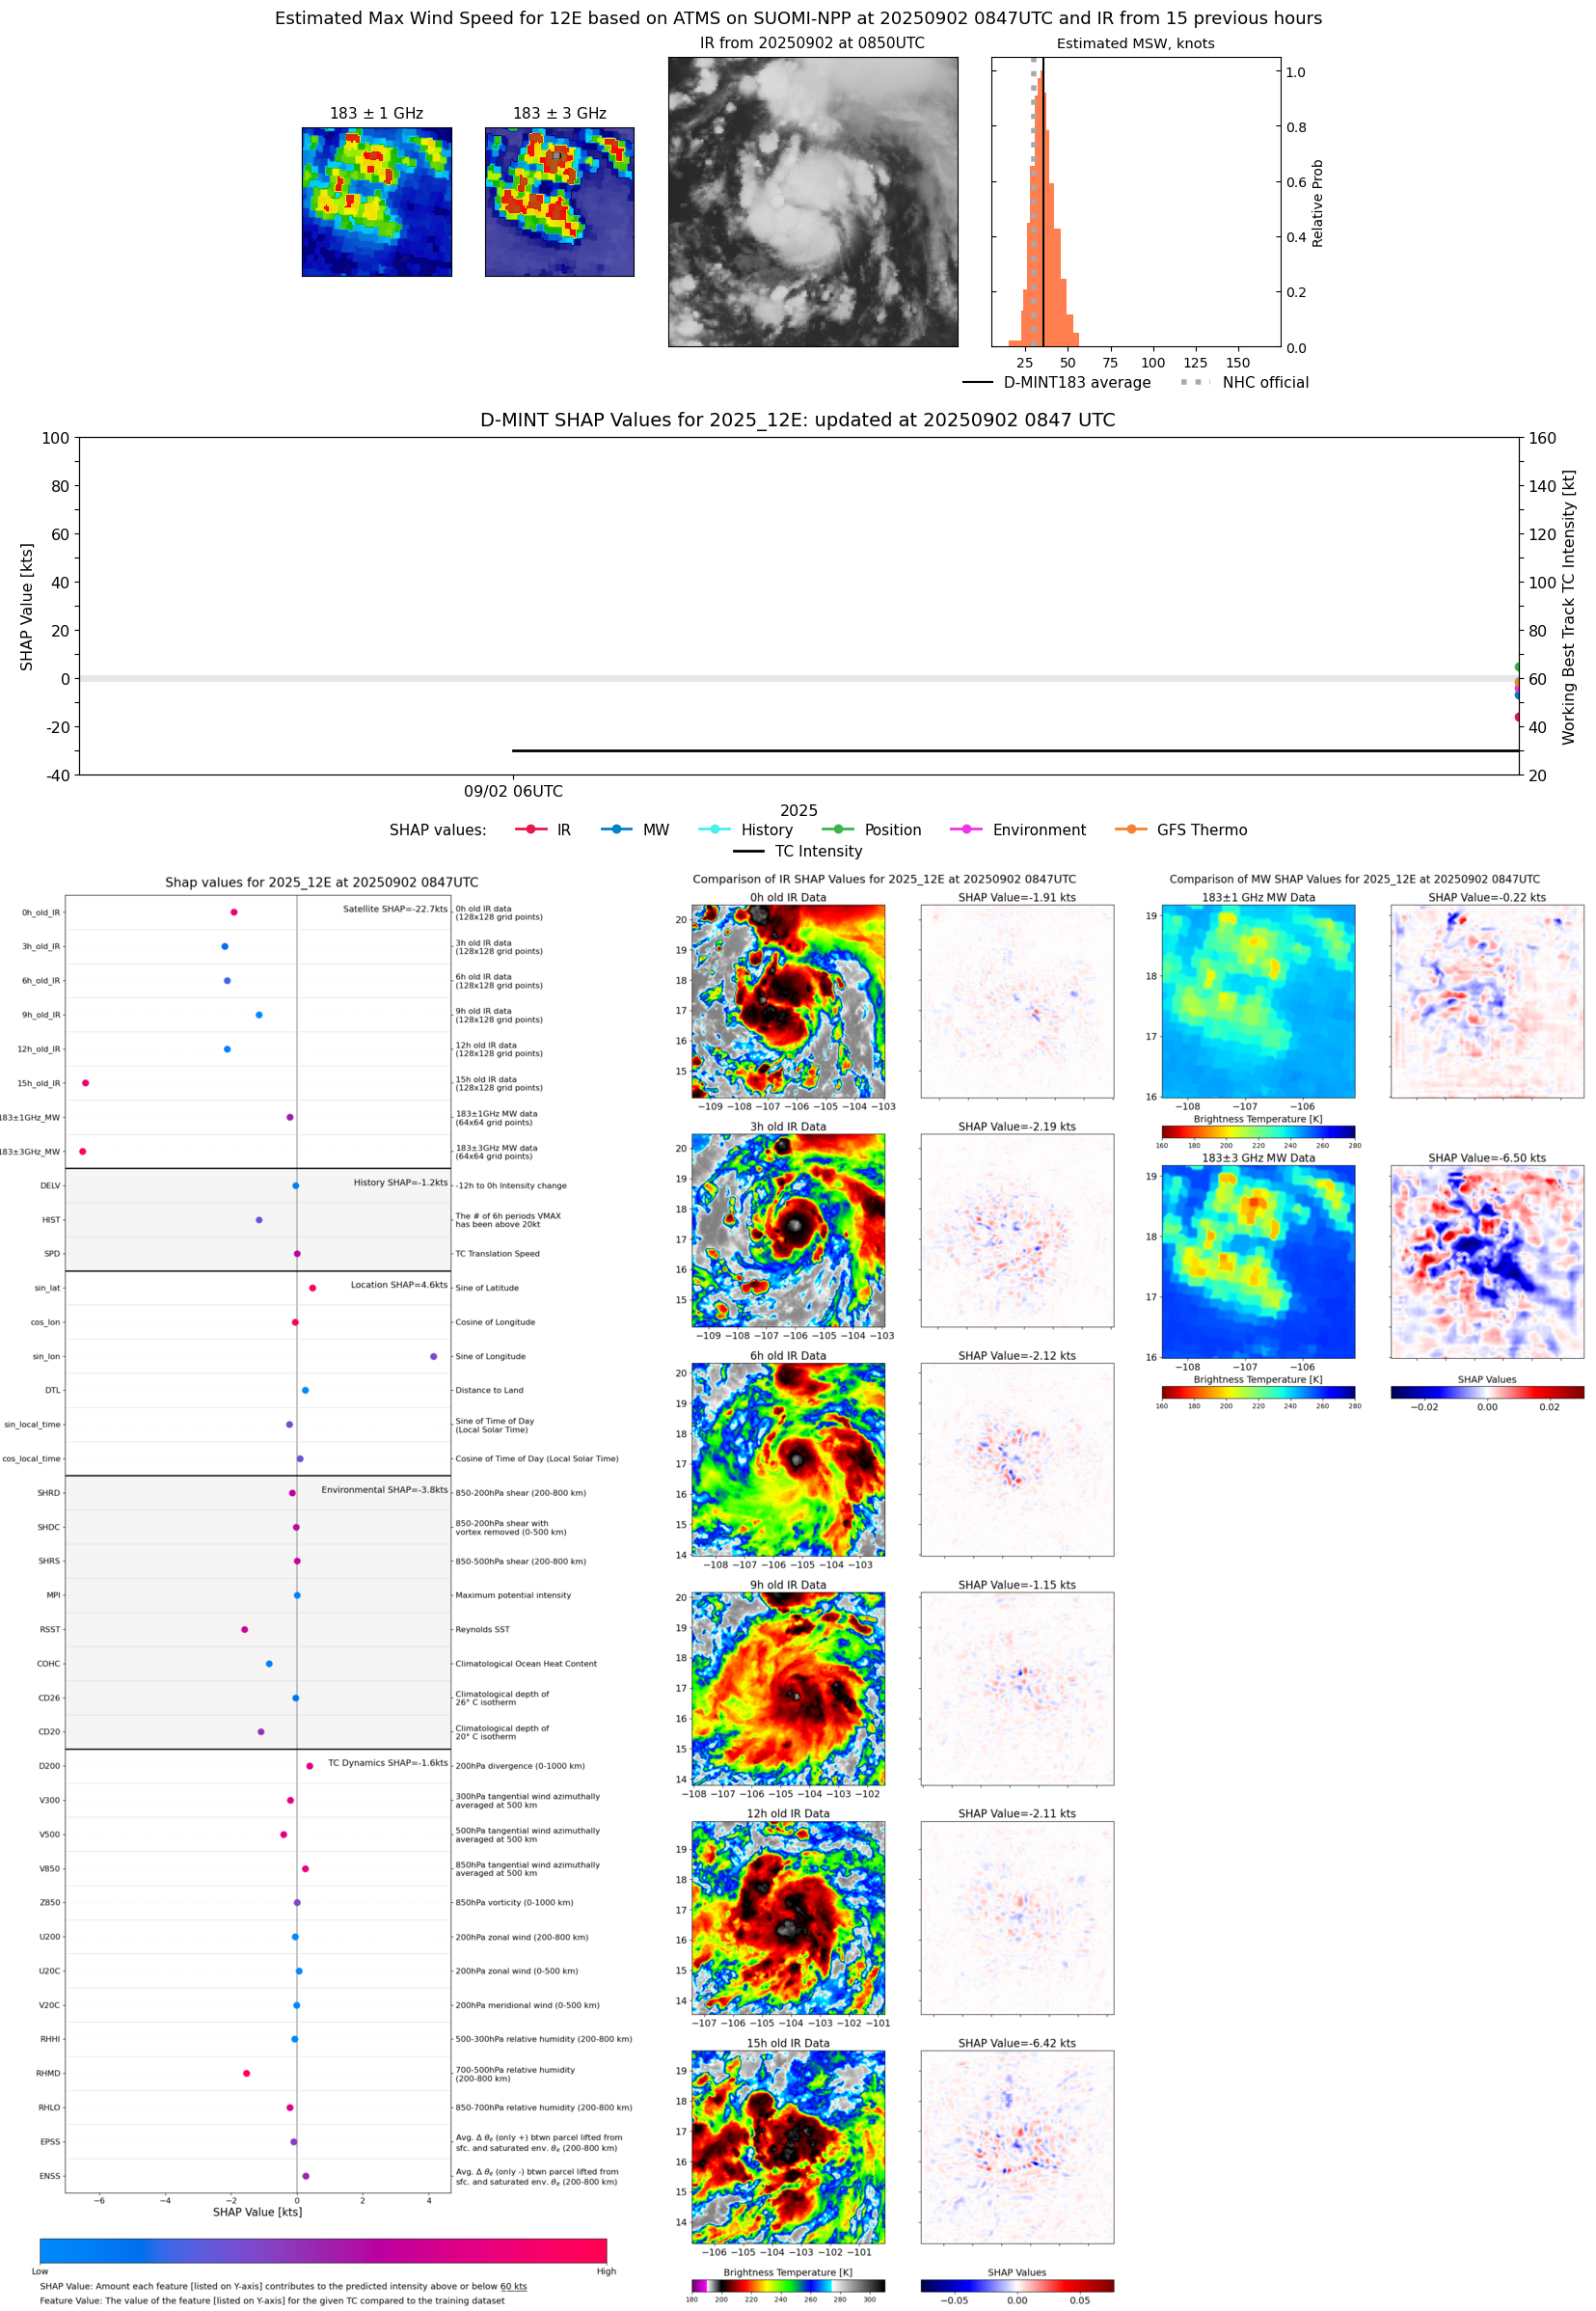 |
| 20250902 | 0820 UTC | ATMS-N21 | 1005 hPa | 40 kts | 35 kts | 45 kts | 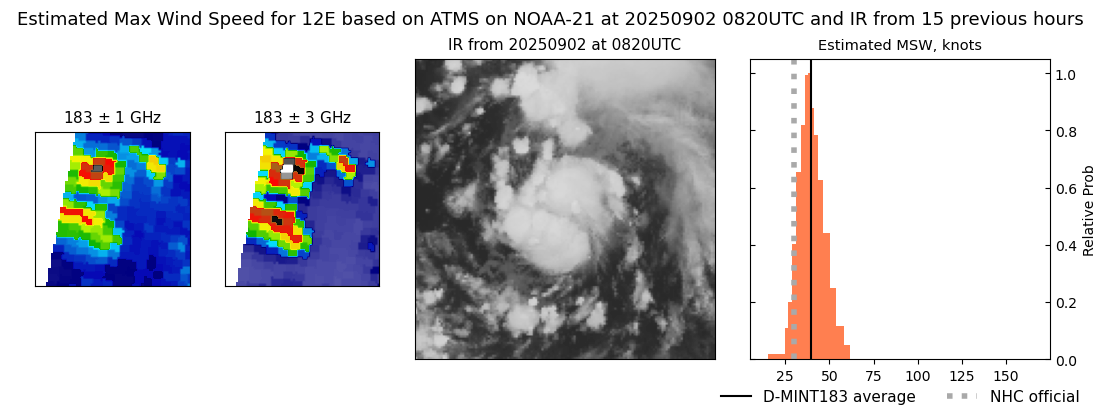 |
| 20250901 | 1304 UTC | SSMISF17 | NaN hPa | 26 kts | 23 kts | 29 kts | 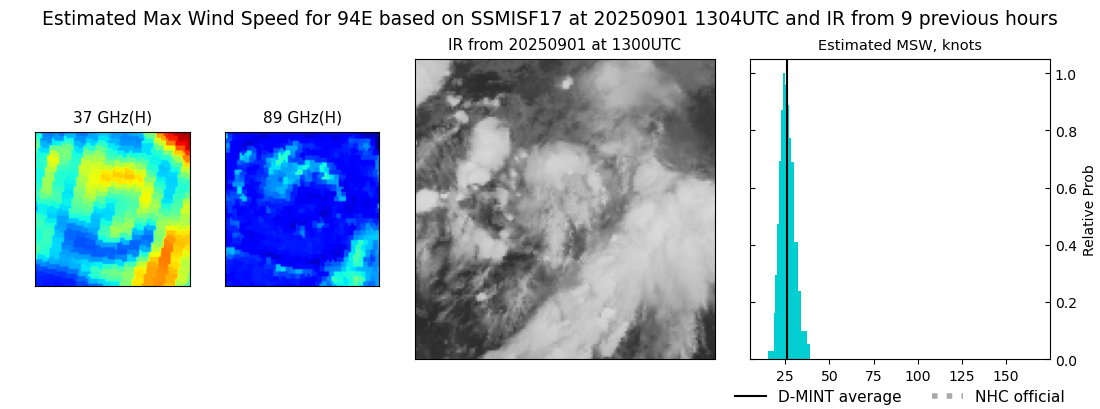 |