|
||

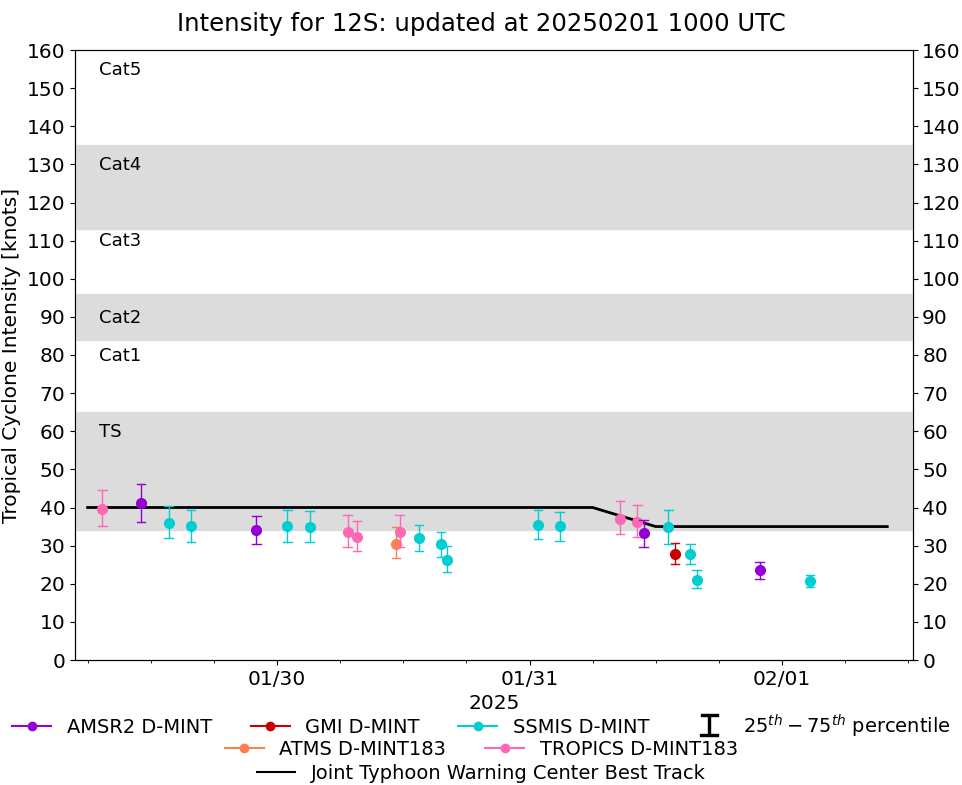 |
D-MINT HISTORY FILE for 2025_12S
| Date | Time | MW Sensor | MSLP | Vmax (30th-70th percentile average) | Vmax 25th percentile | Vmax 75th percentile | Image |
| 20250201 | 0240 UTC | SSMISF17 | 1001 hPa | 21 kts | 19 kts | 22 kts |  |
| 20250131 | 2152 UTC | AMSR2 | 999 hPa | 23 kts | 21 kts | 26 kts | 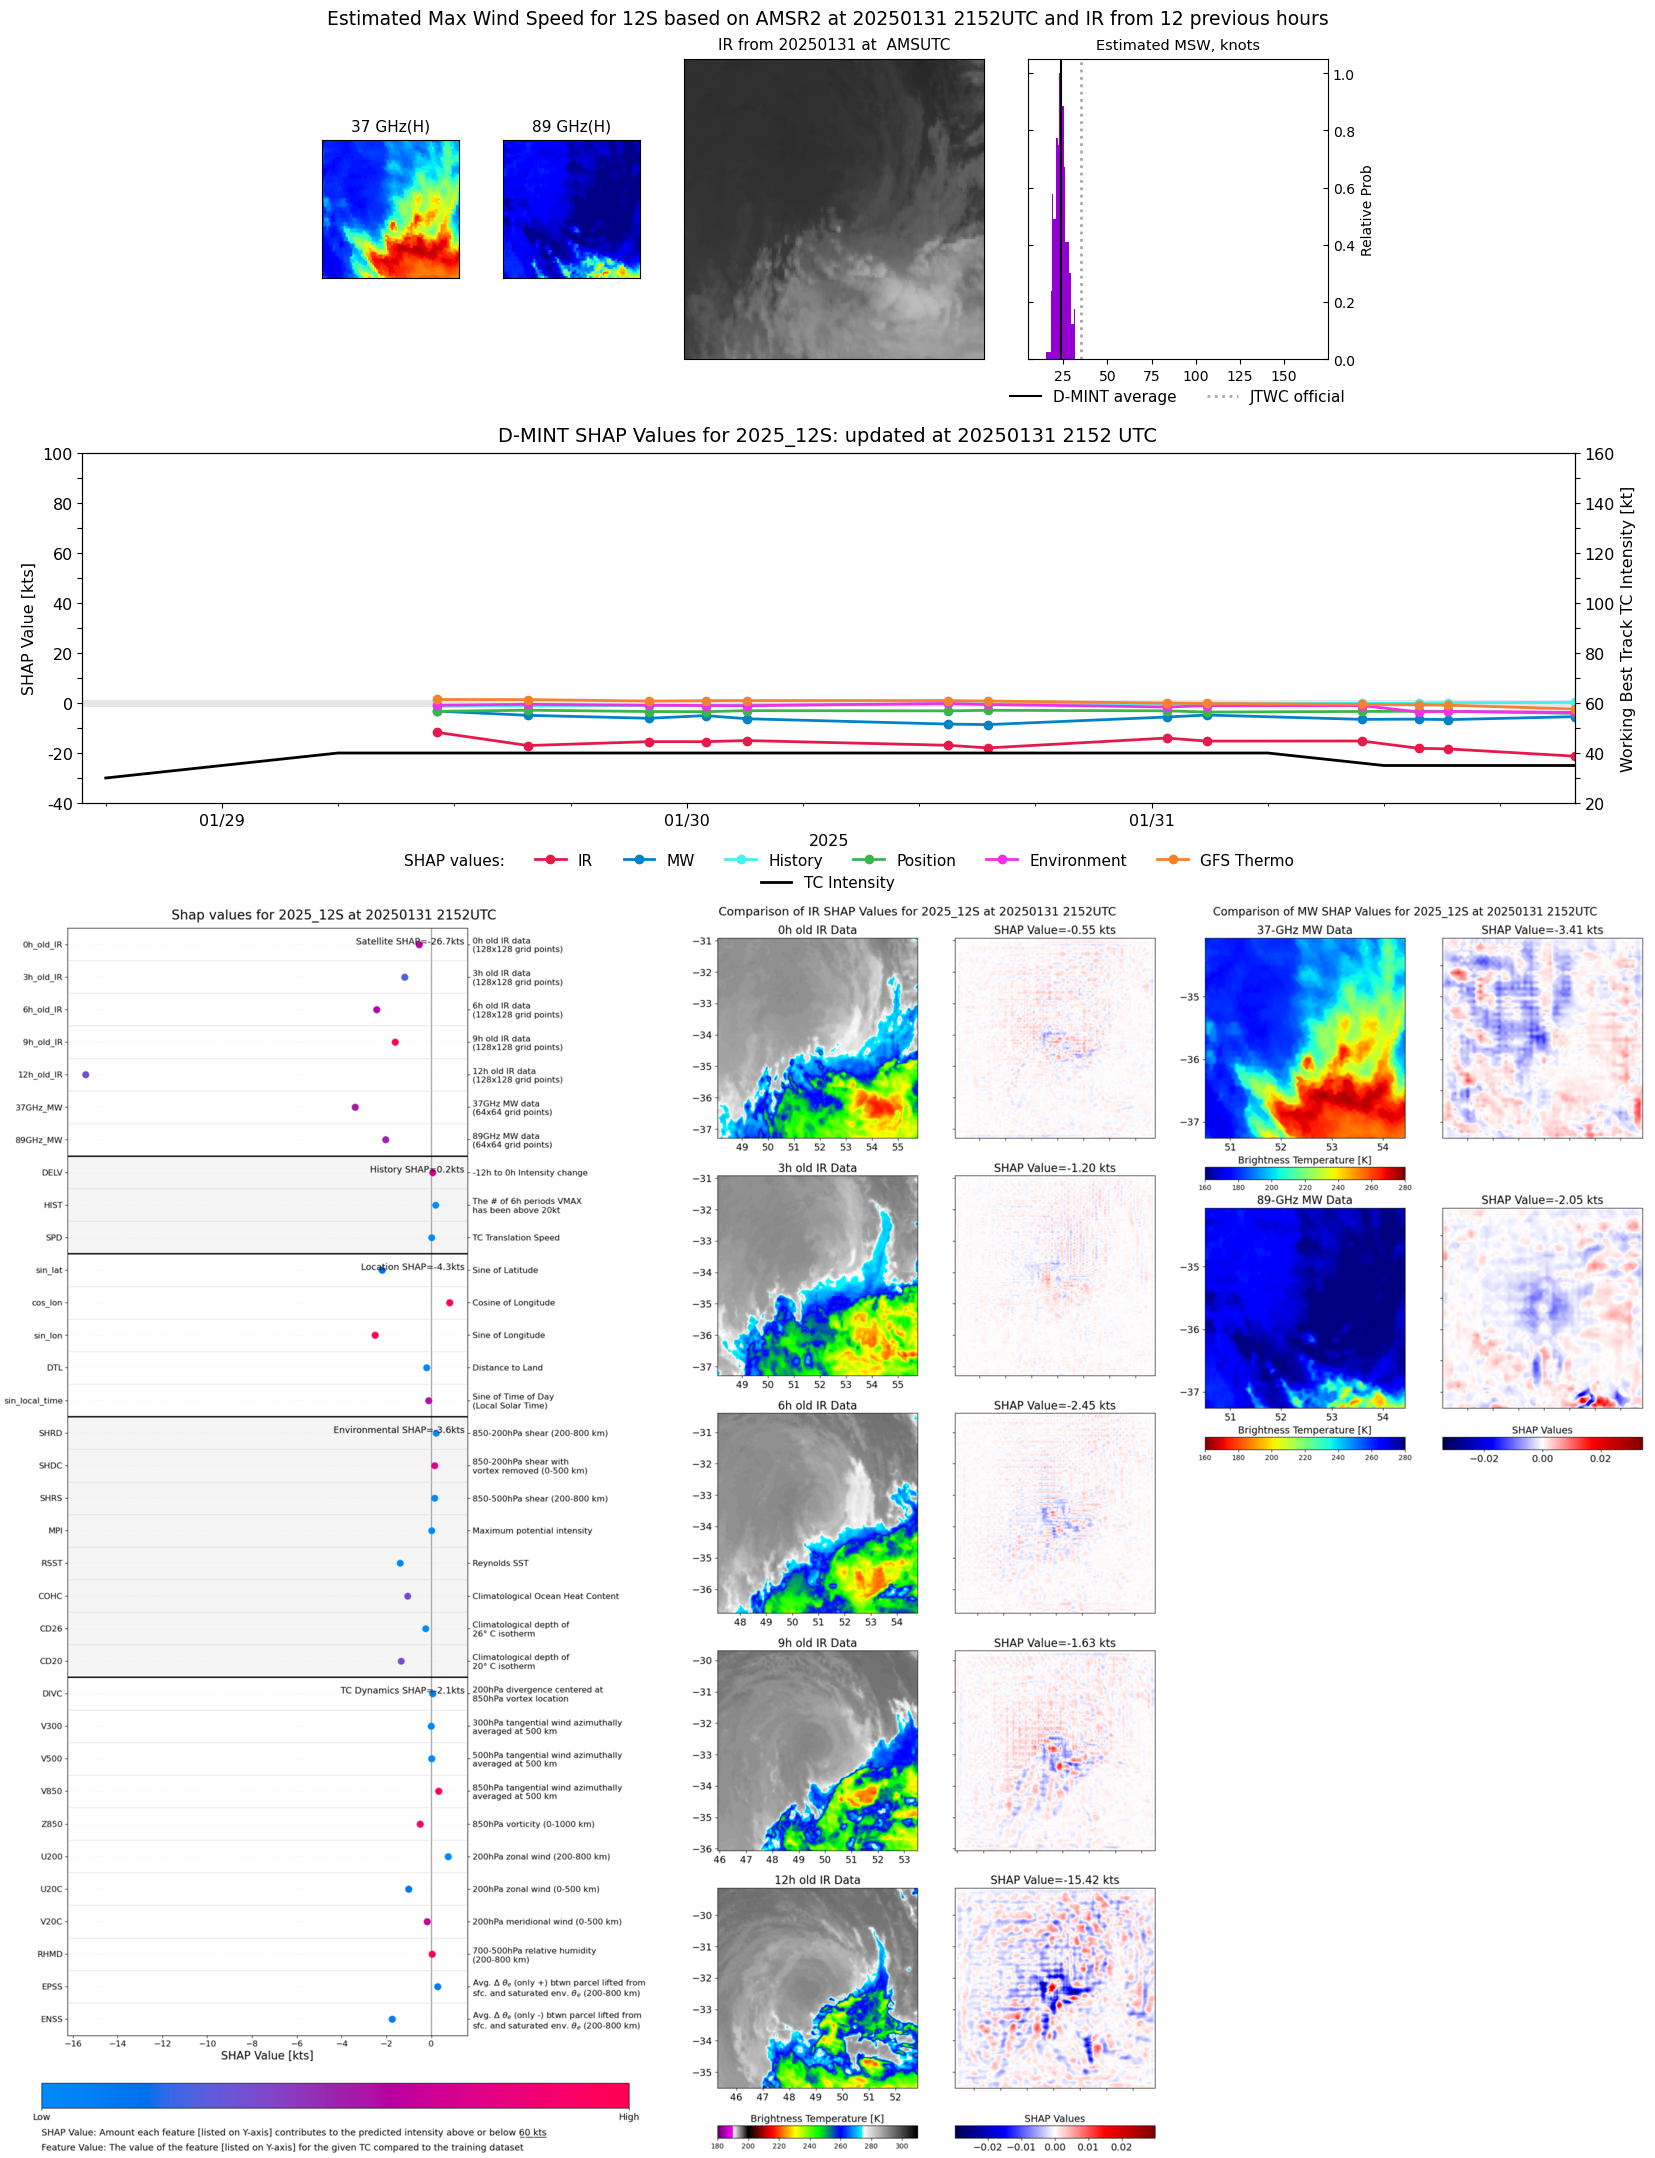 |
| 20250131 | 1553 UTC | SSMISF16 | 999 hPa | 21 kts | 19 kts | 24 kts | 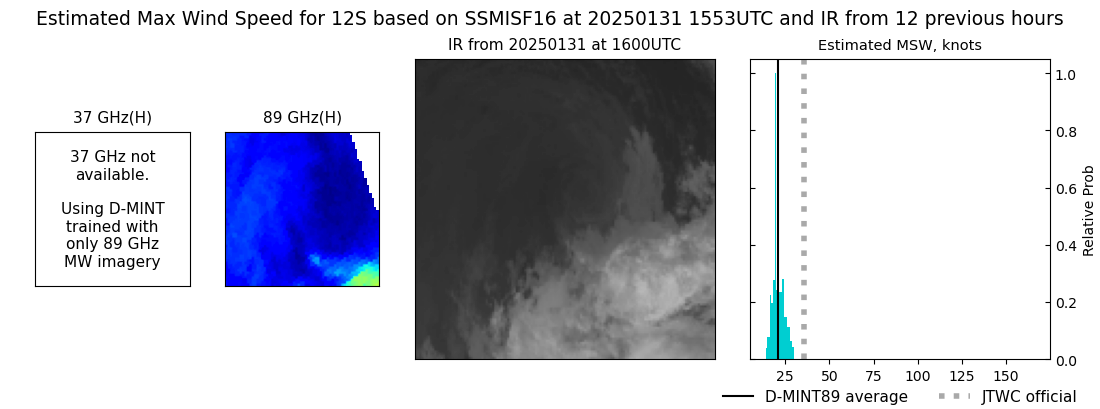 |
| 20250131 | 1518 UTC | SSMISF17 | 1000 hPa | 28 kts | 25 kts | 30 kts | 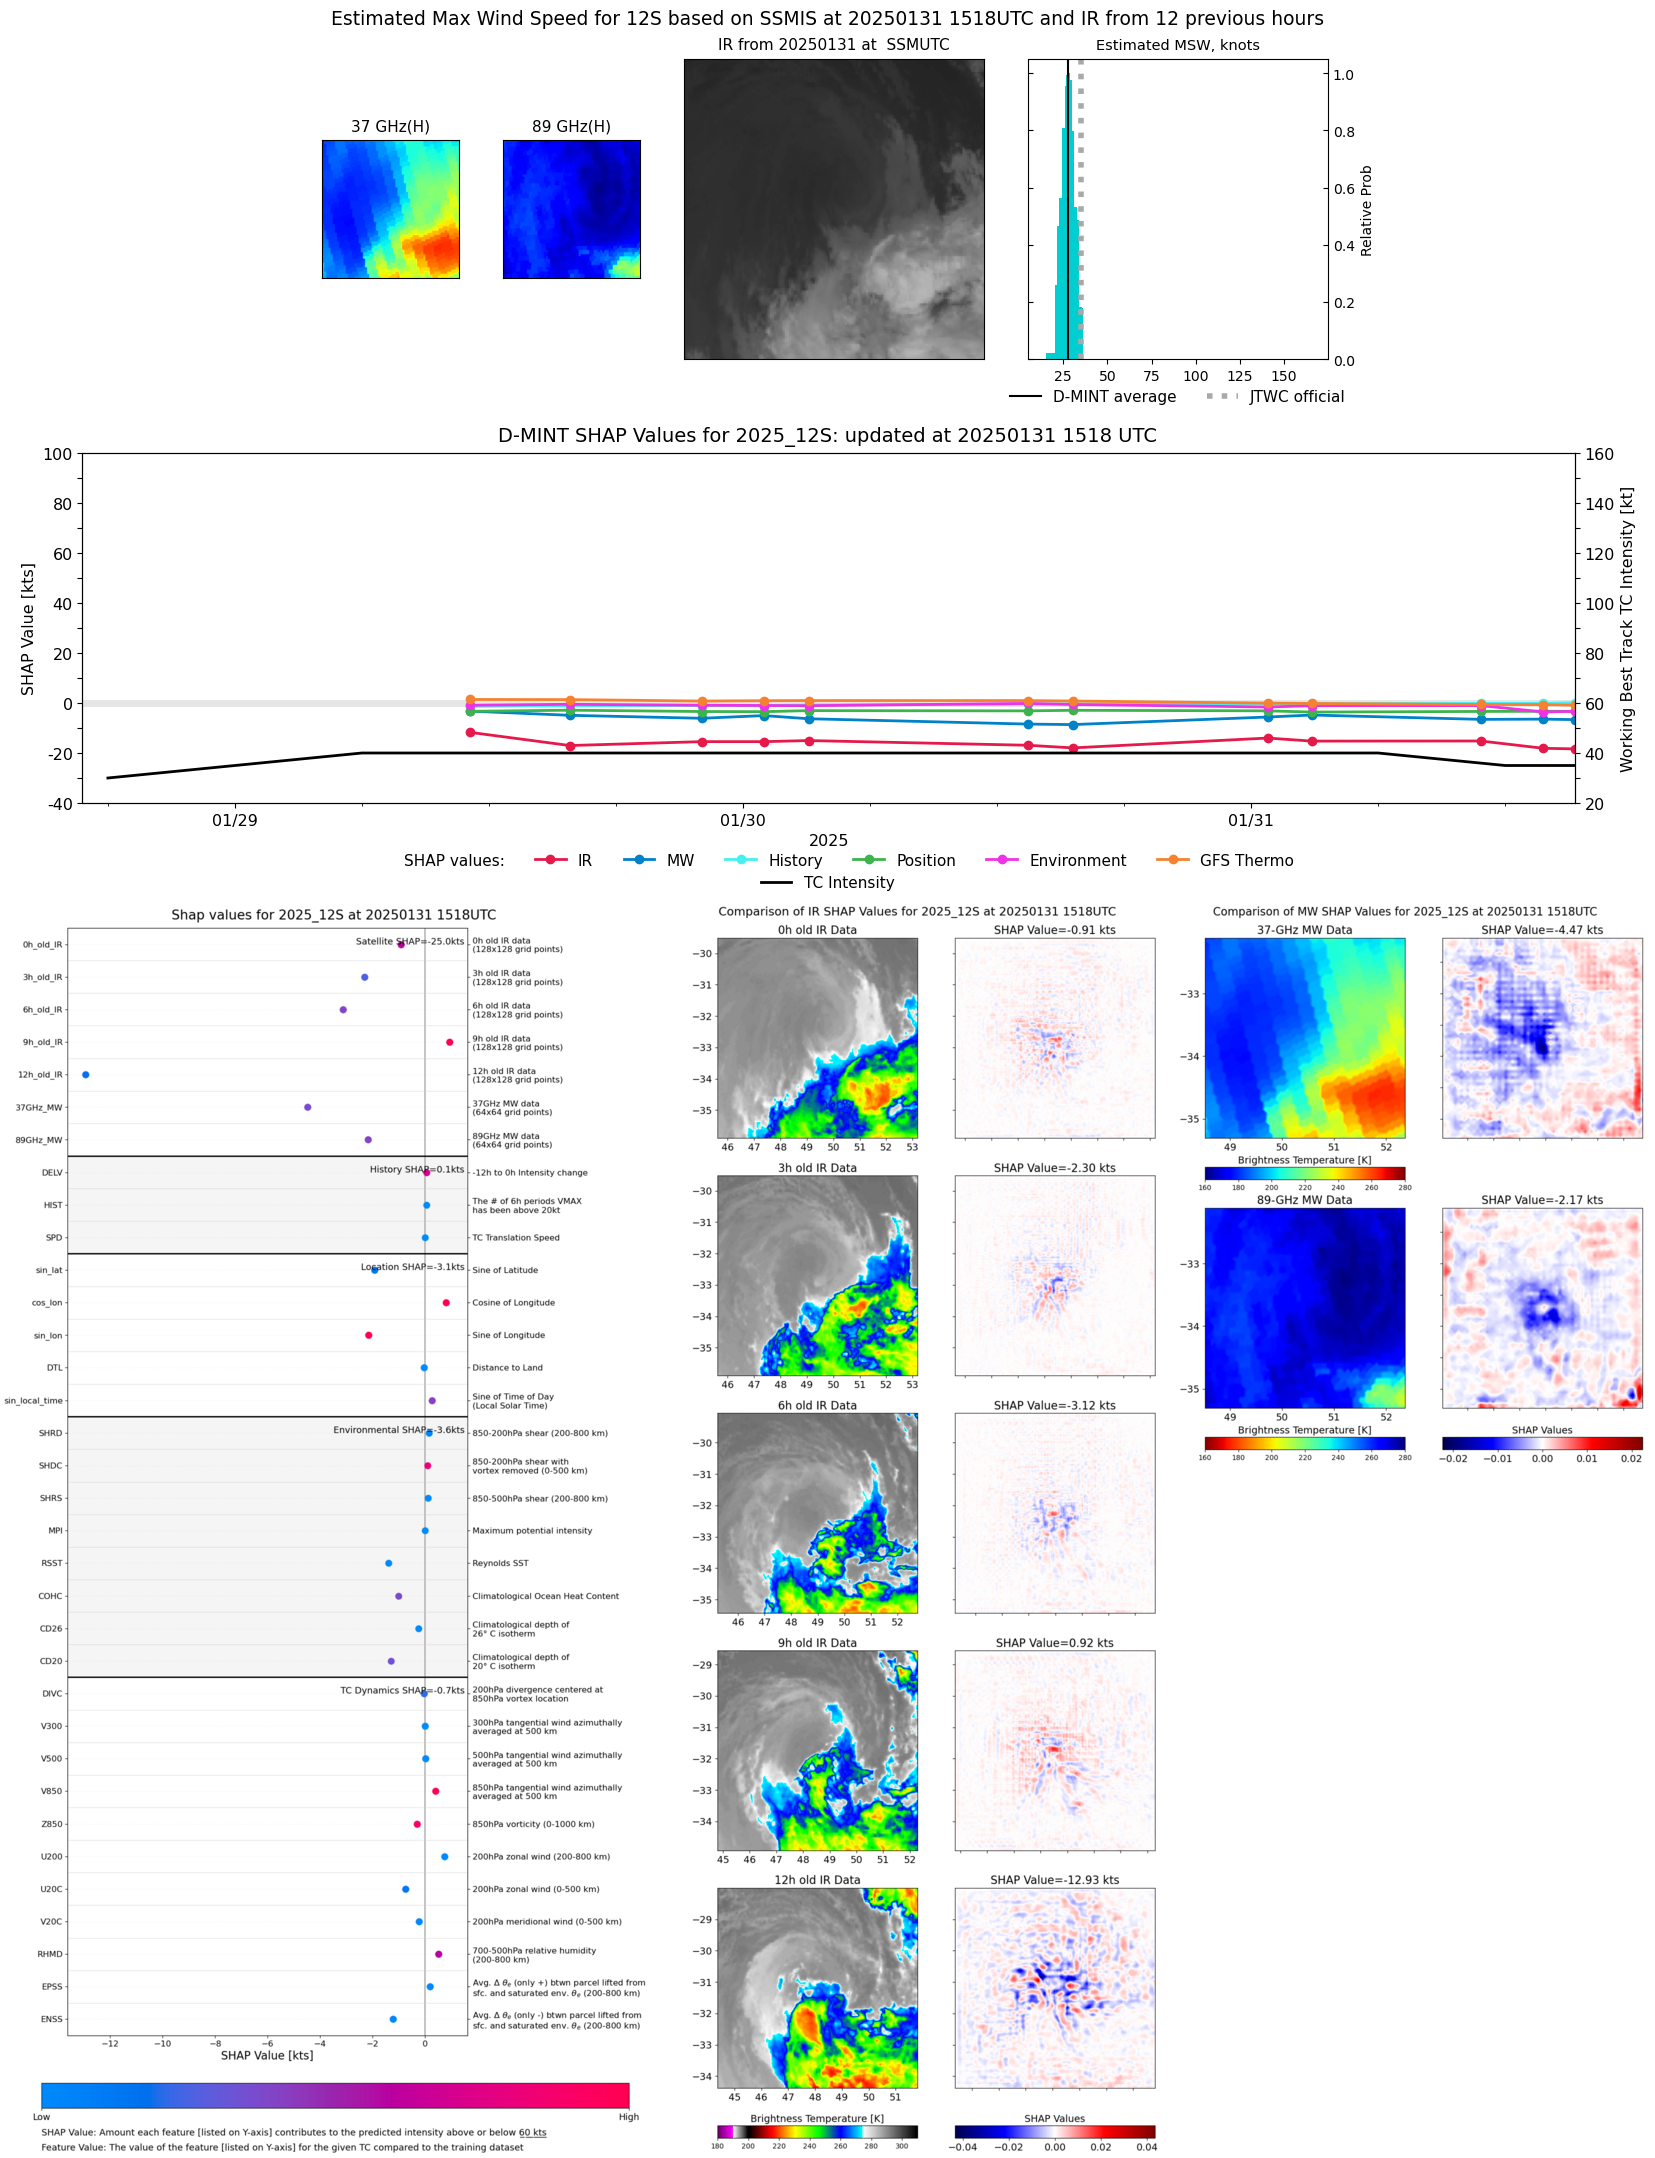 |
| 20250131 | 1348 UTC | GMI | 1001 hPa | 28 kts | 25 kts | 31 kts | 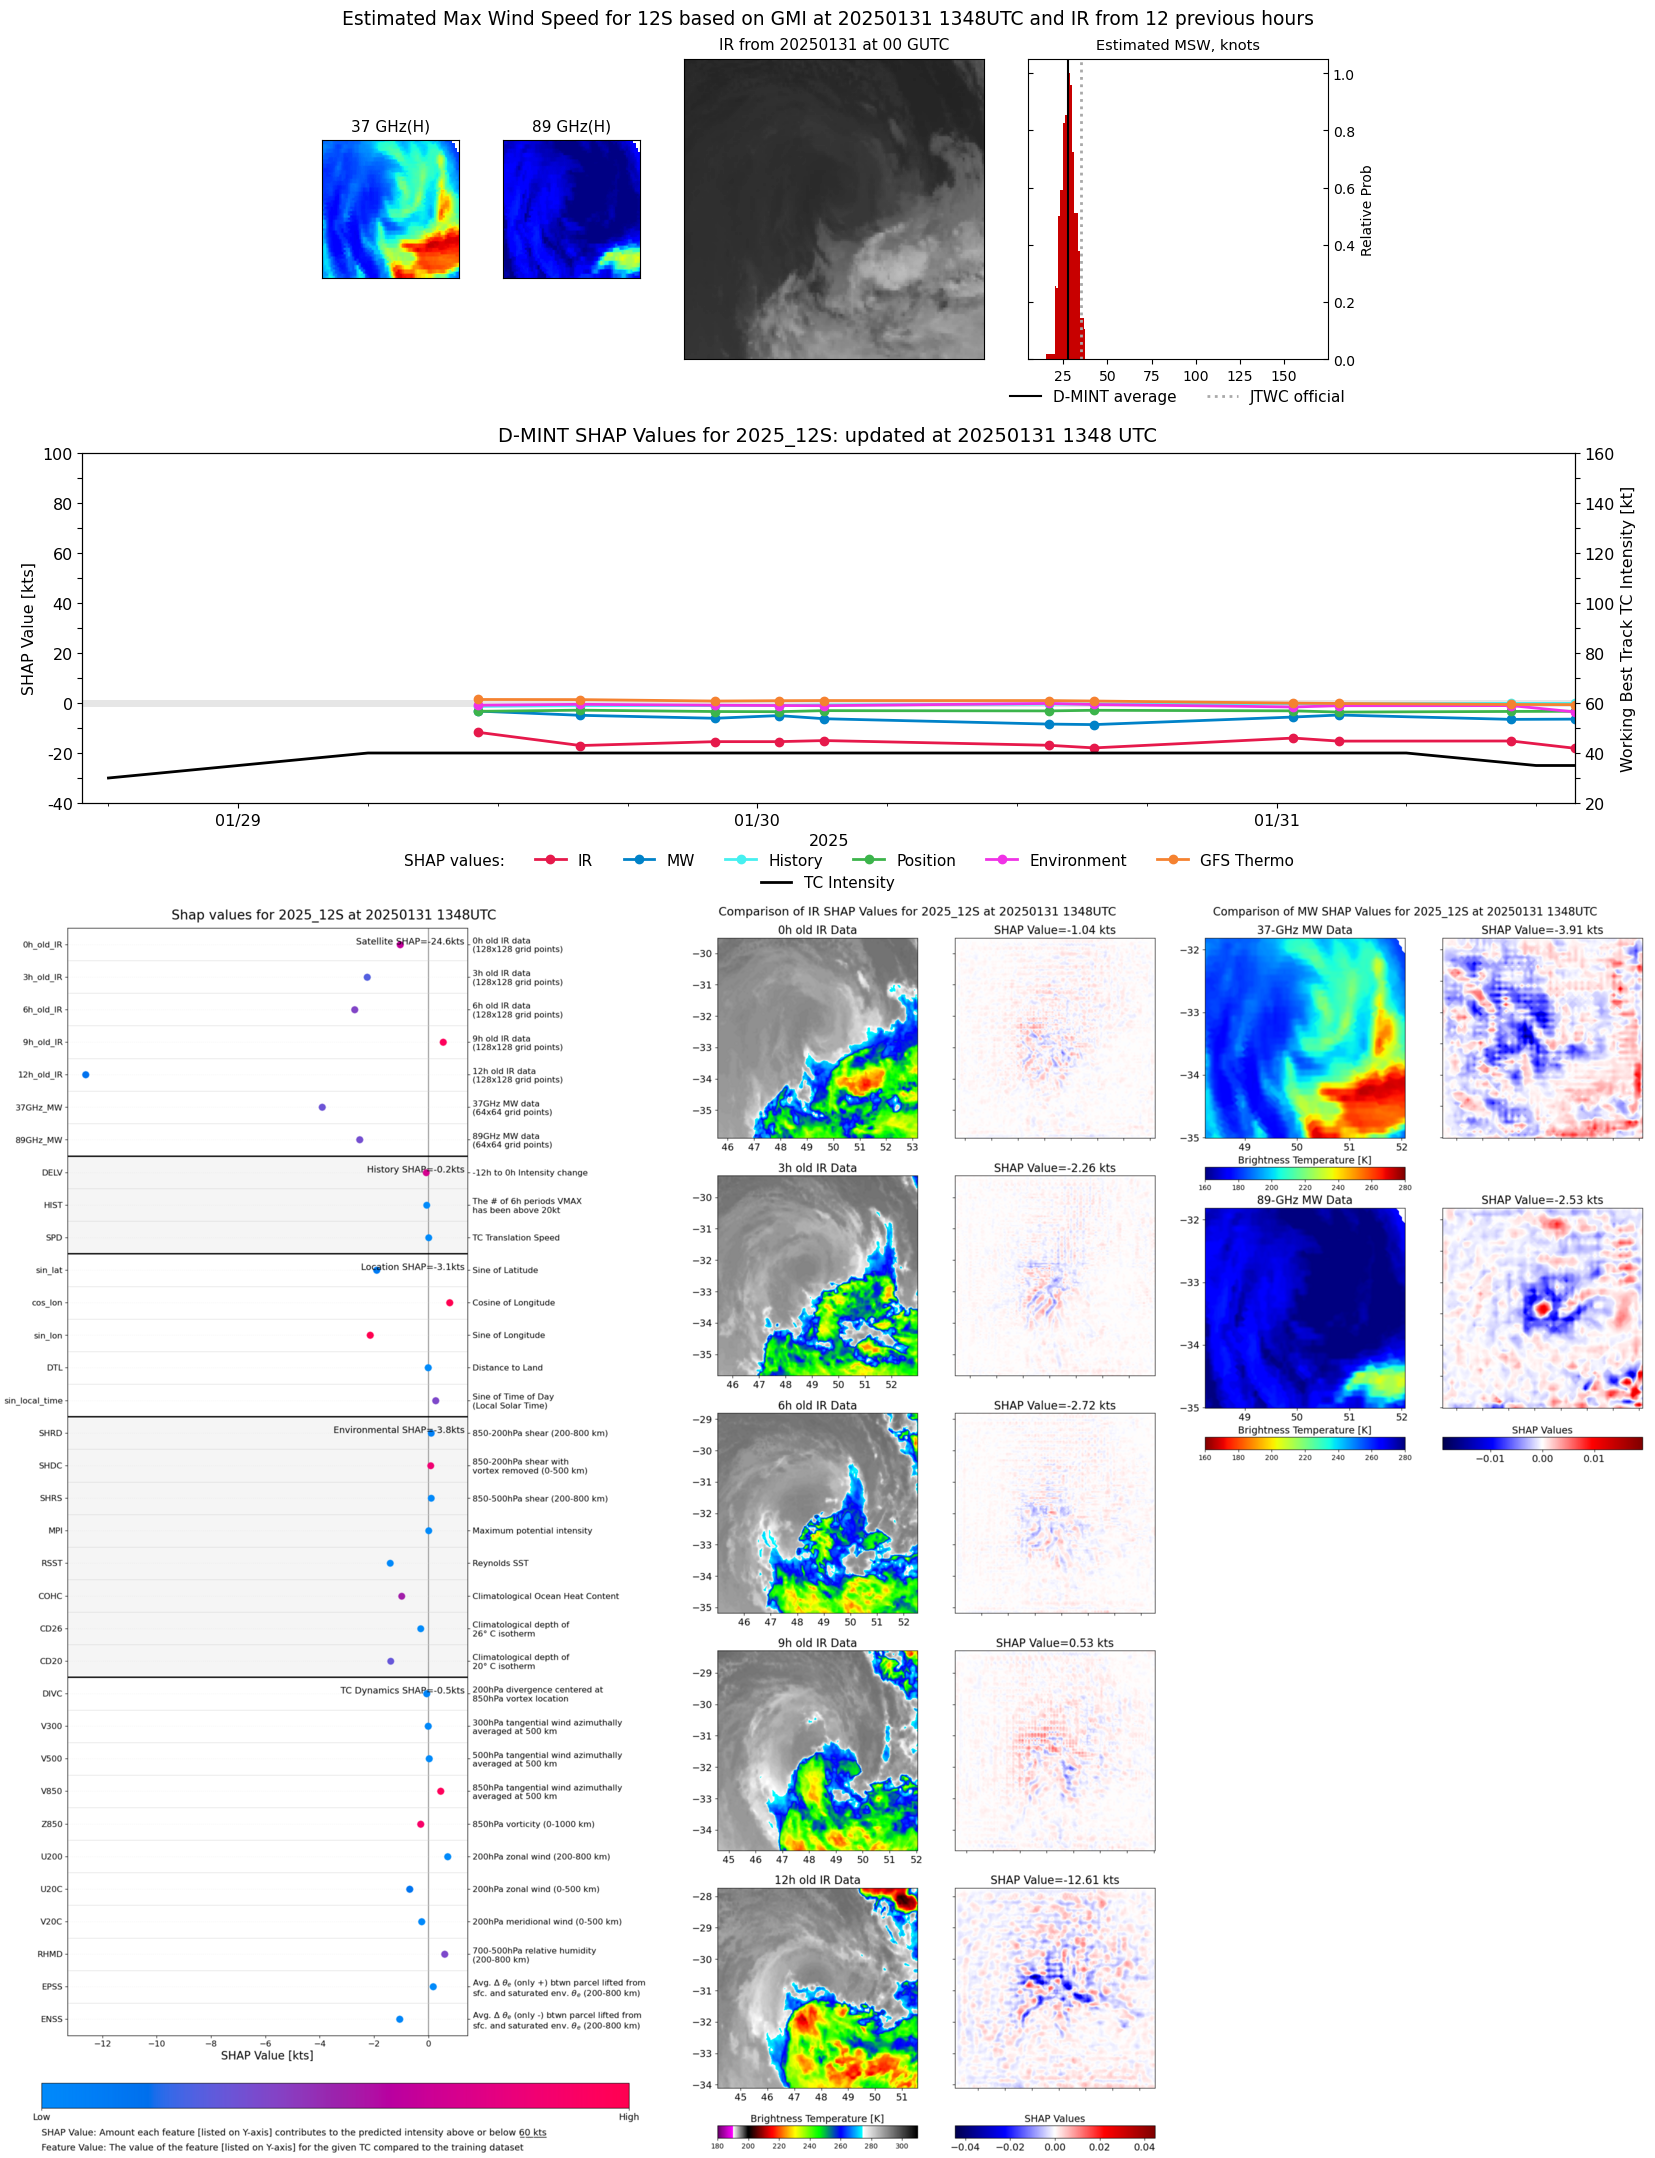 |
| 20250131 | 1312 UTC | SSMISF18 | NaN hPa | 35 kts | 31 kts | 39 kts | 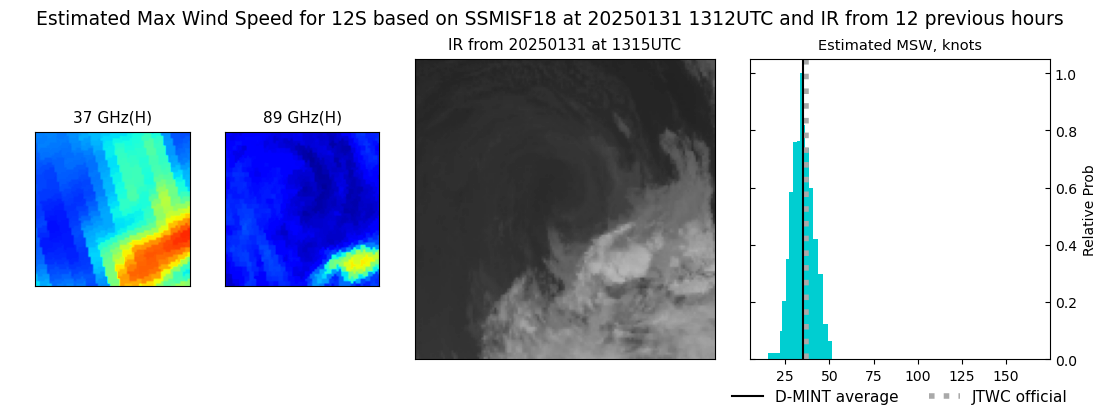 |
| 20250131 | 1051 UTC | AMSR2 | 996 hPa | 33 kts | 30 kts | 37 kts | 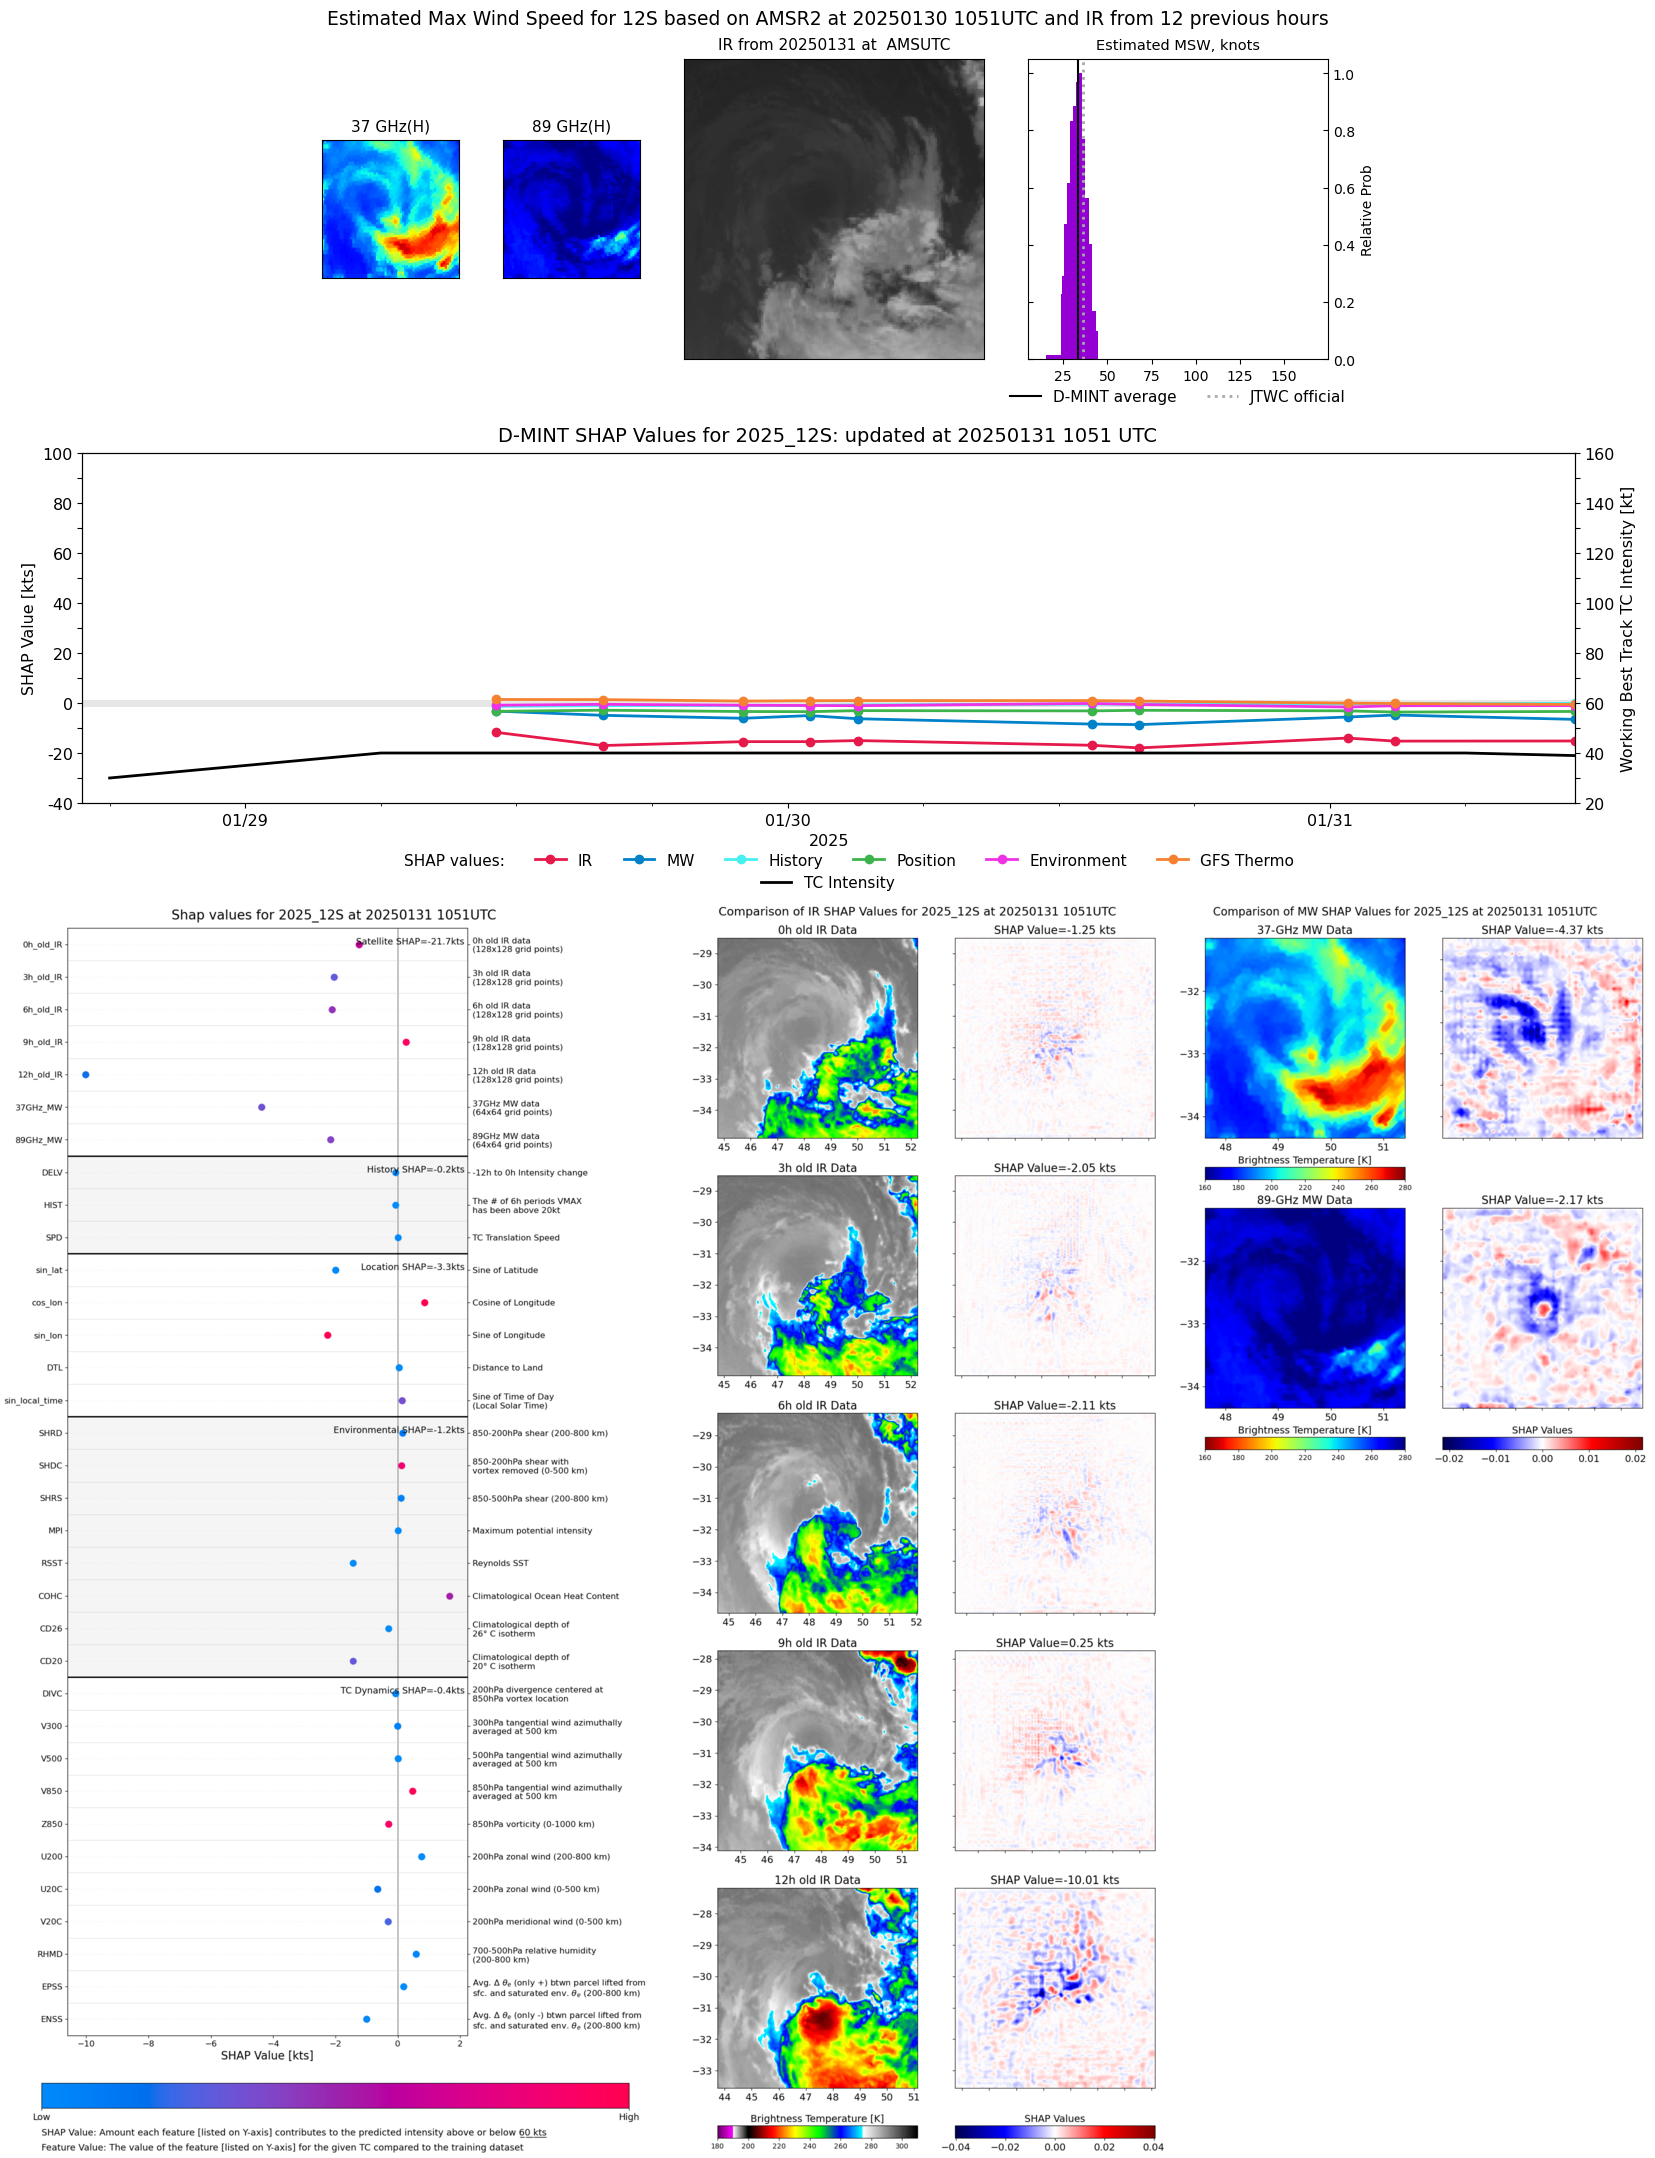 |
| 20250131 | 1015 UTC | TROPICS05 | 995 hPa | 36 kts | 32 kts | 41 kts | 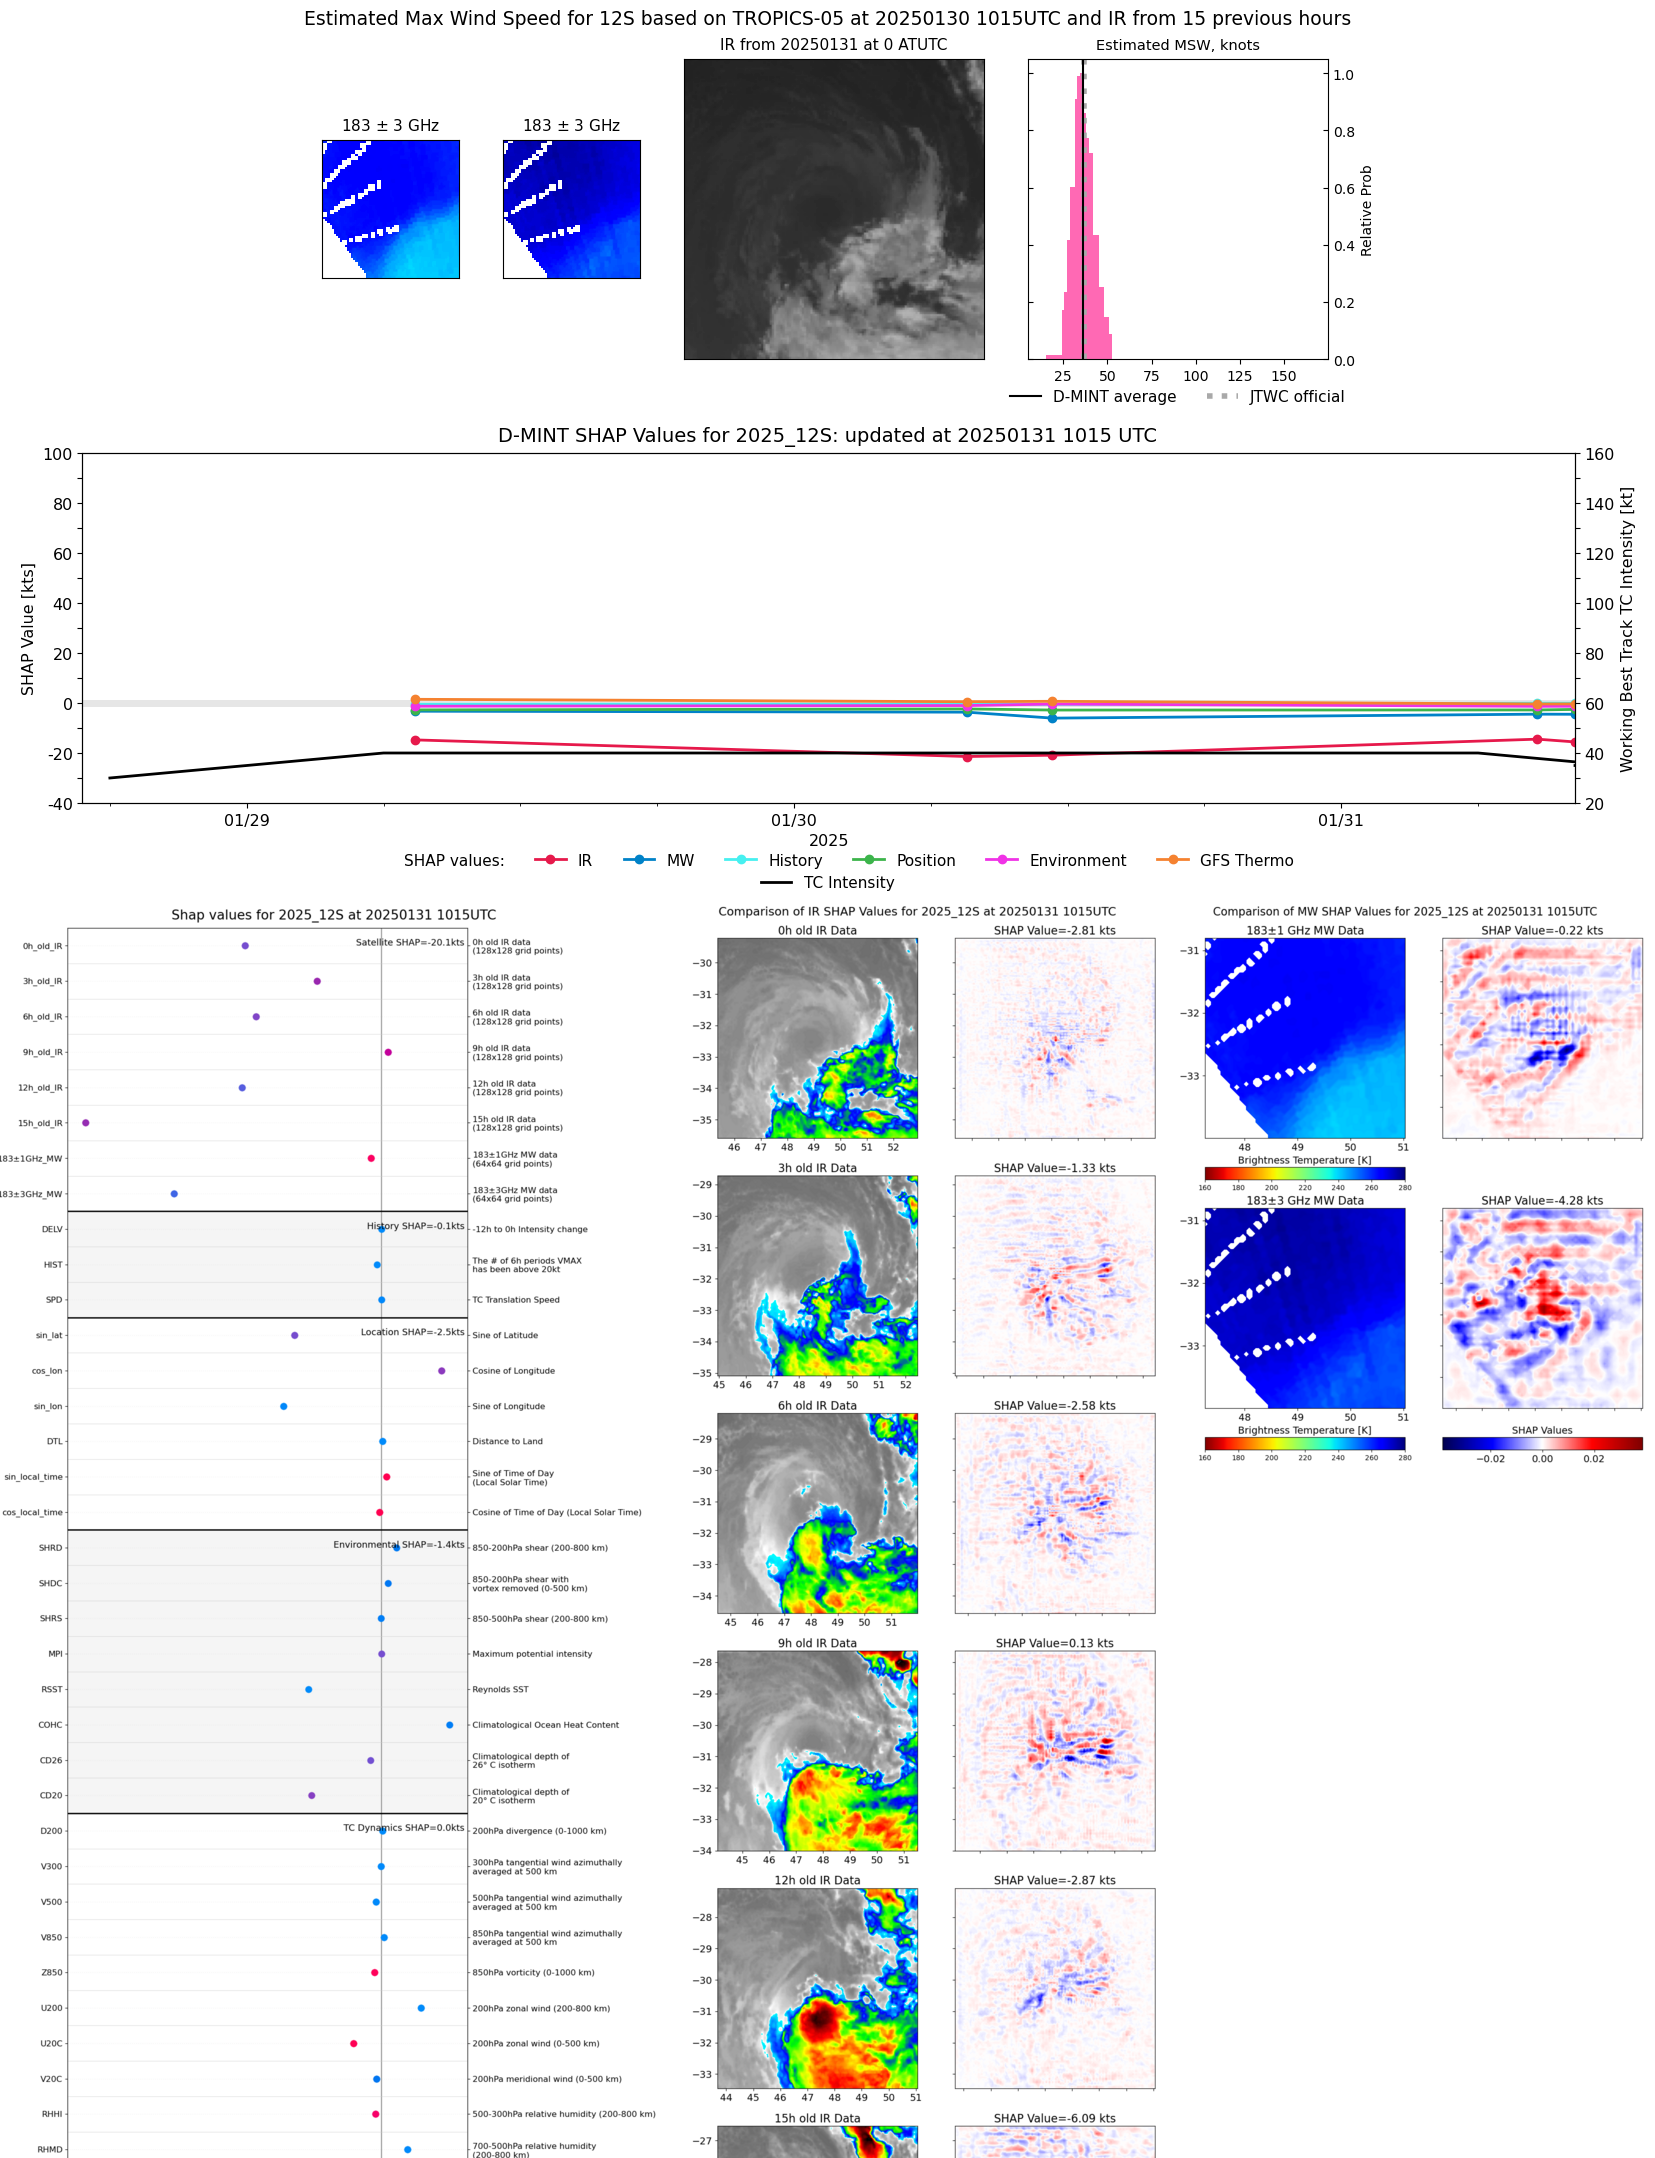 |
| 20250131 | 0836 UTC | TROPICS05 | 993 hPa | 37 kts | 33 kts | 42 kts | 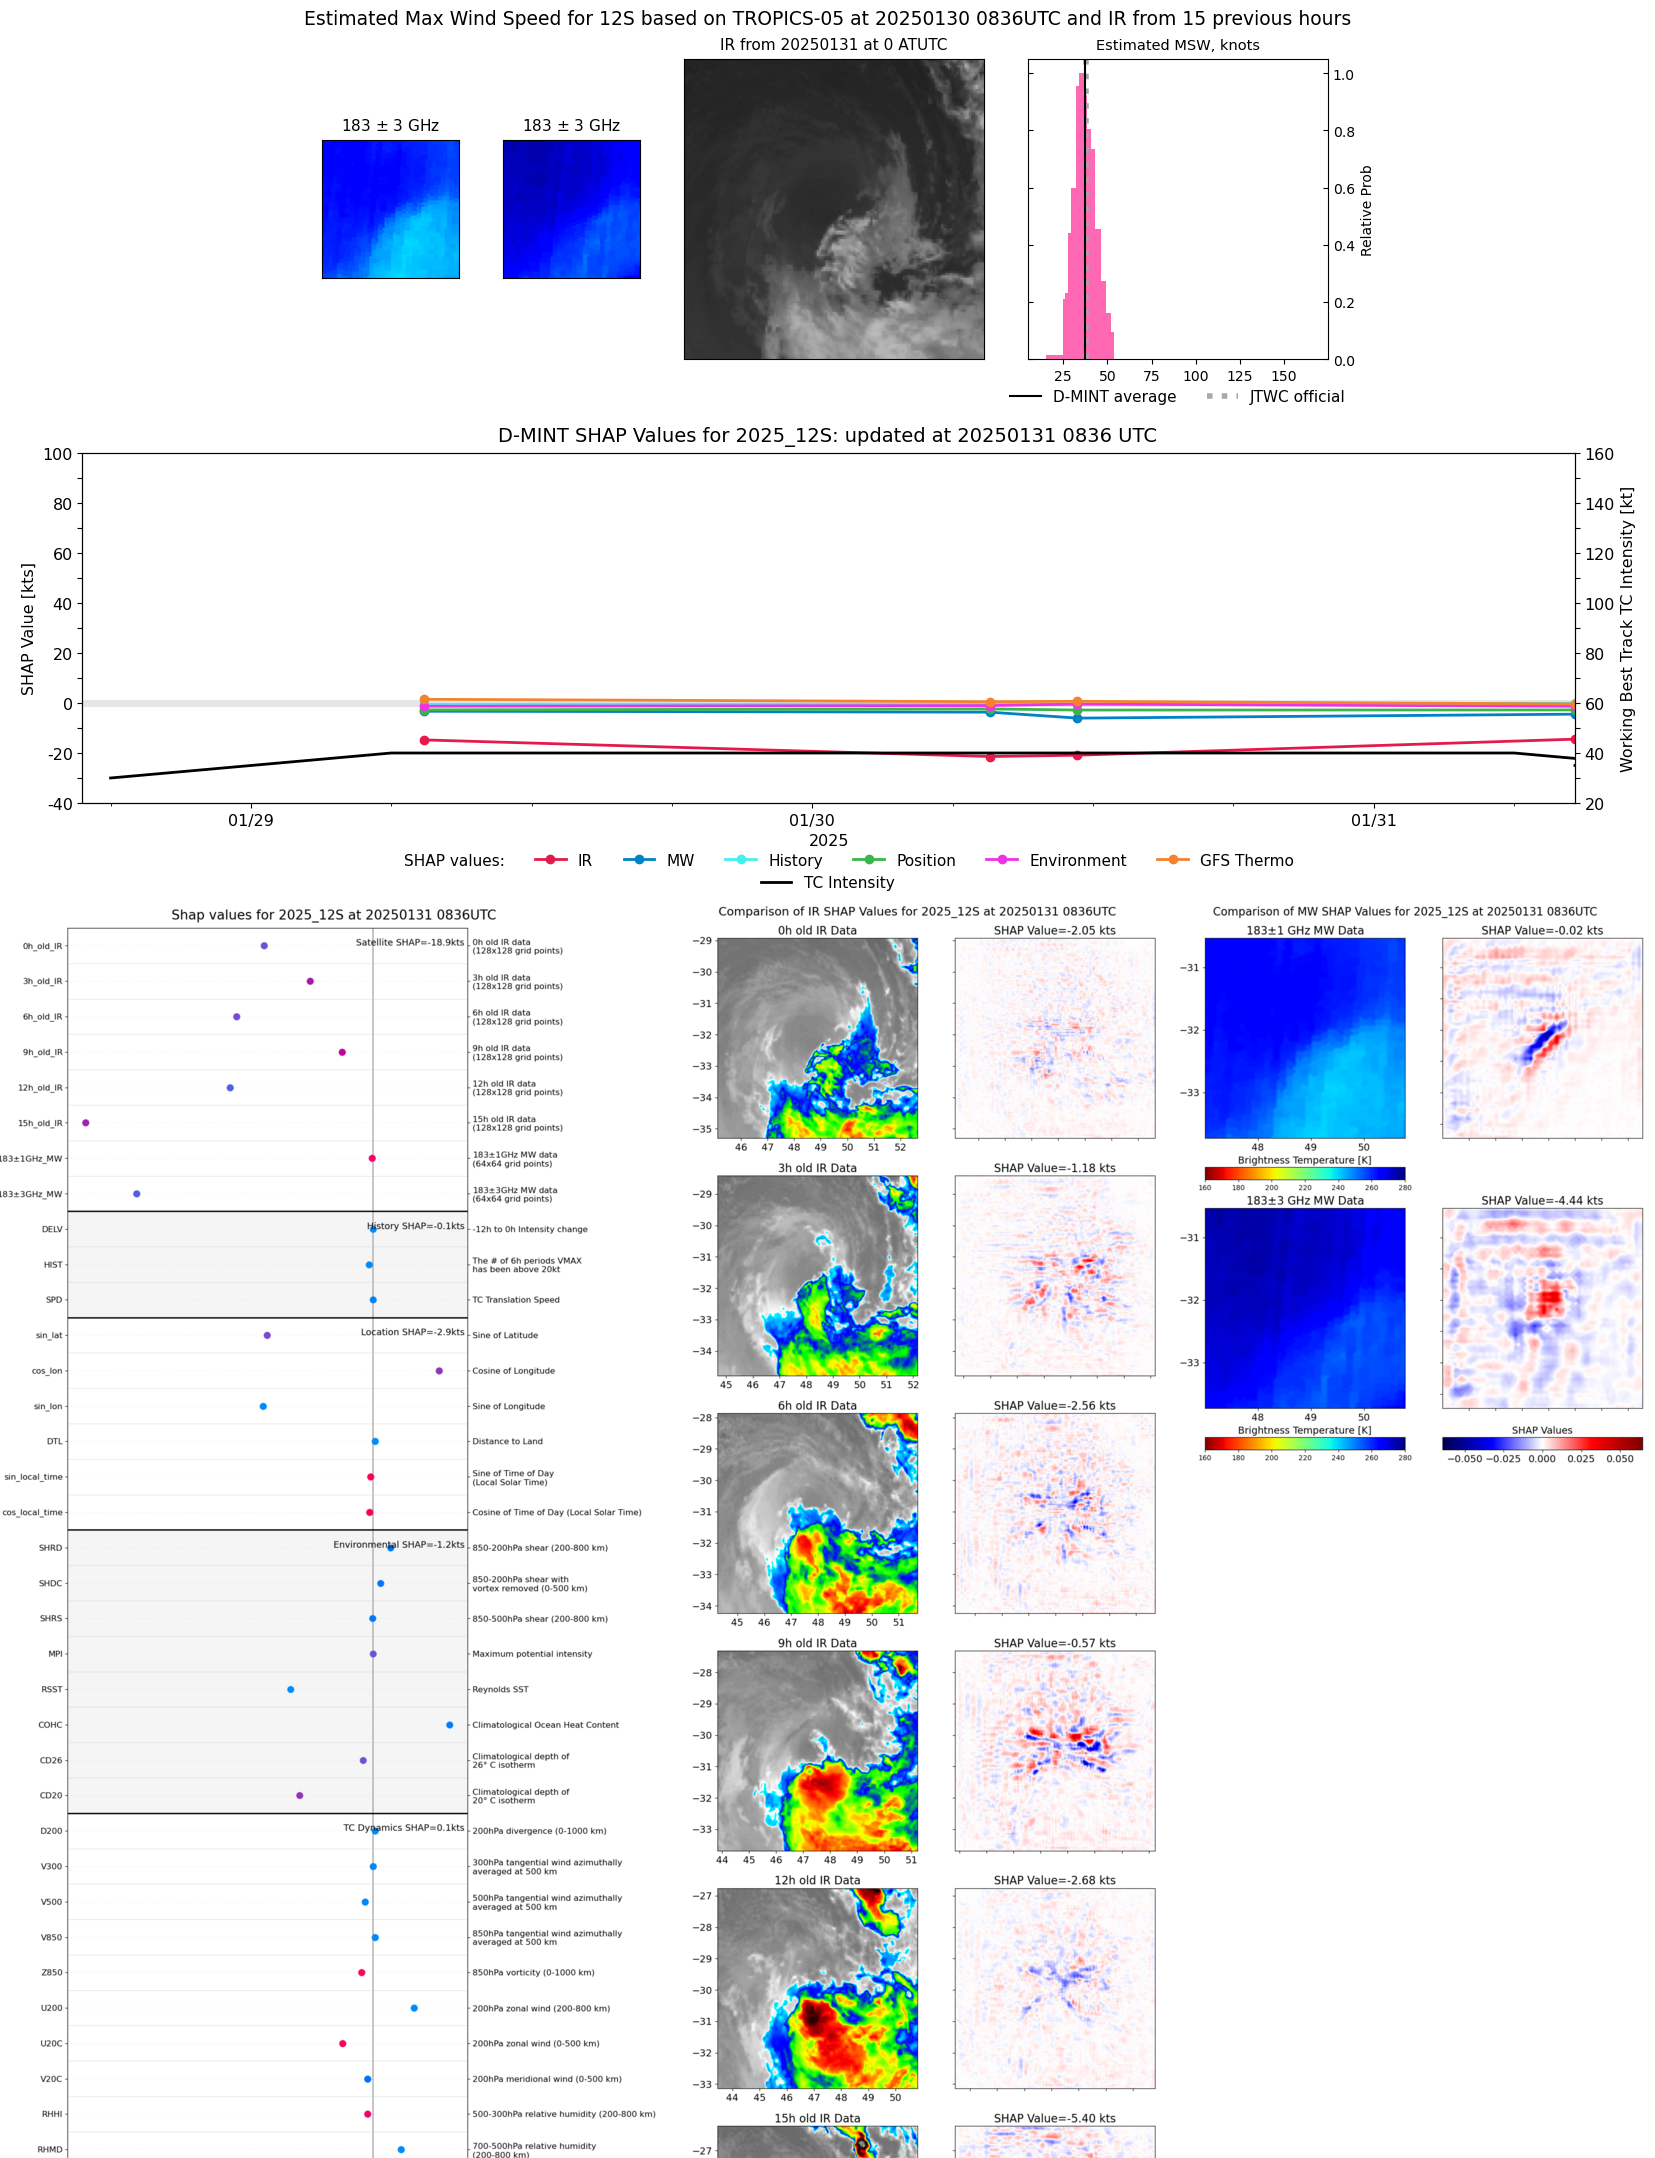 |
| 20250131 | 0252 UTC | SSMISF17 | 994 hPa | 35 kts | 31 kts | 39 kts |  |
| 20250131 | 0047 UTC | SSMISF18 | 994 hPa | 36 kts | 32 kts | 39 kts | 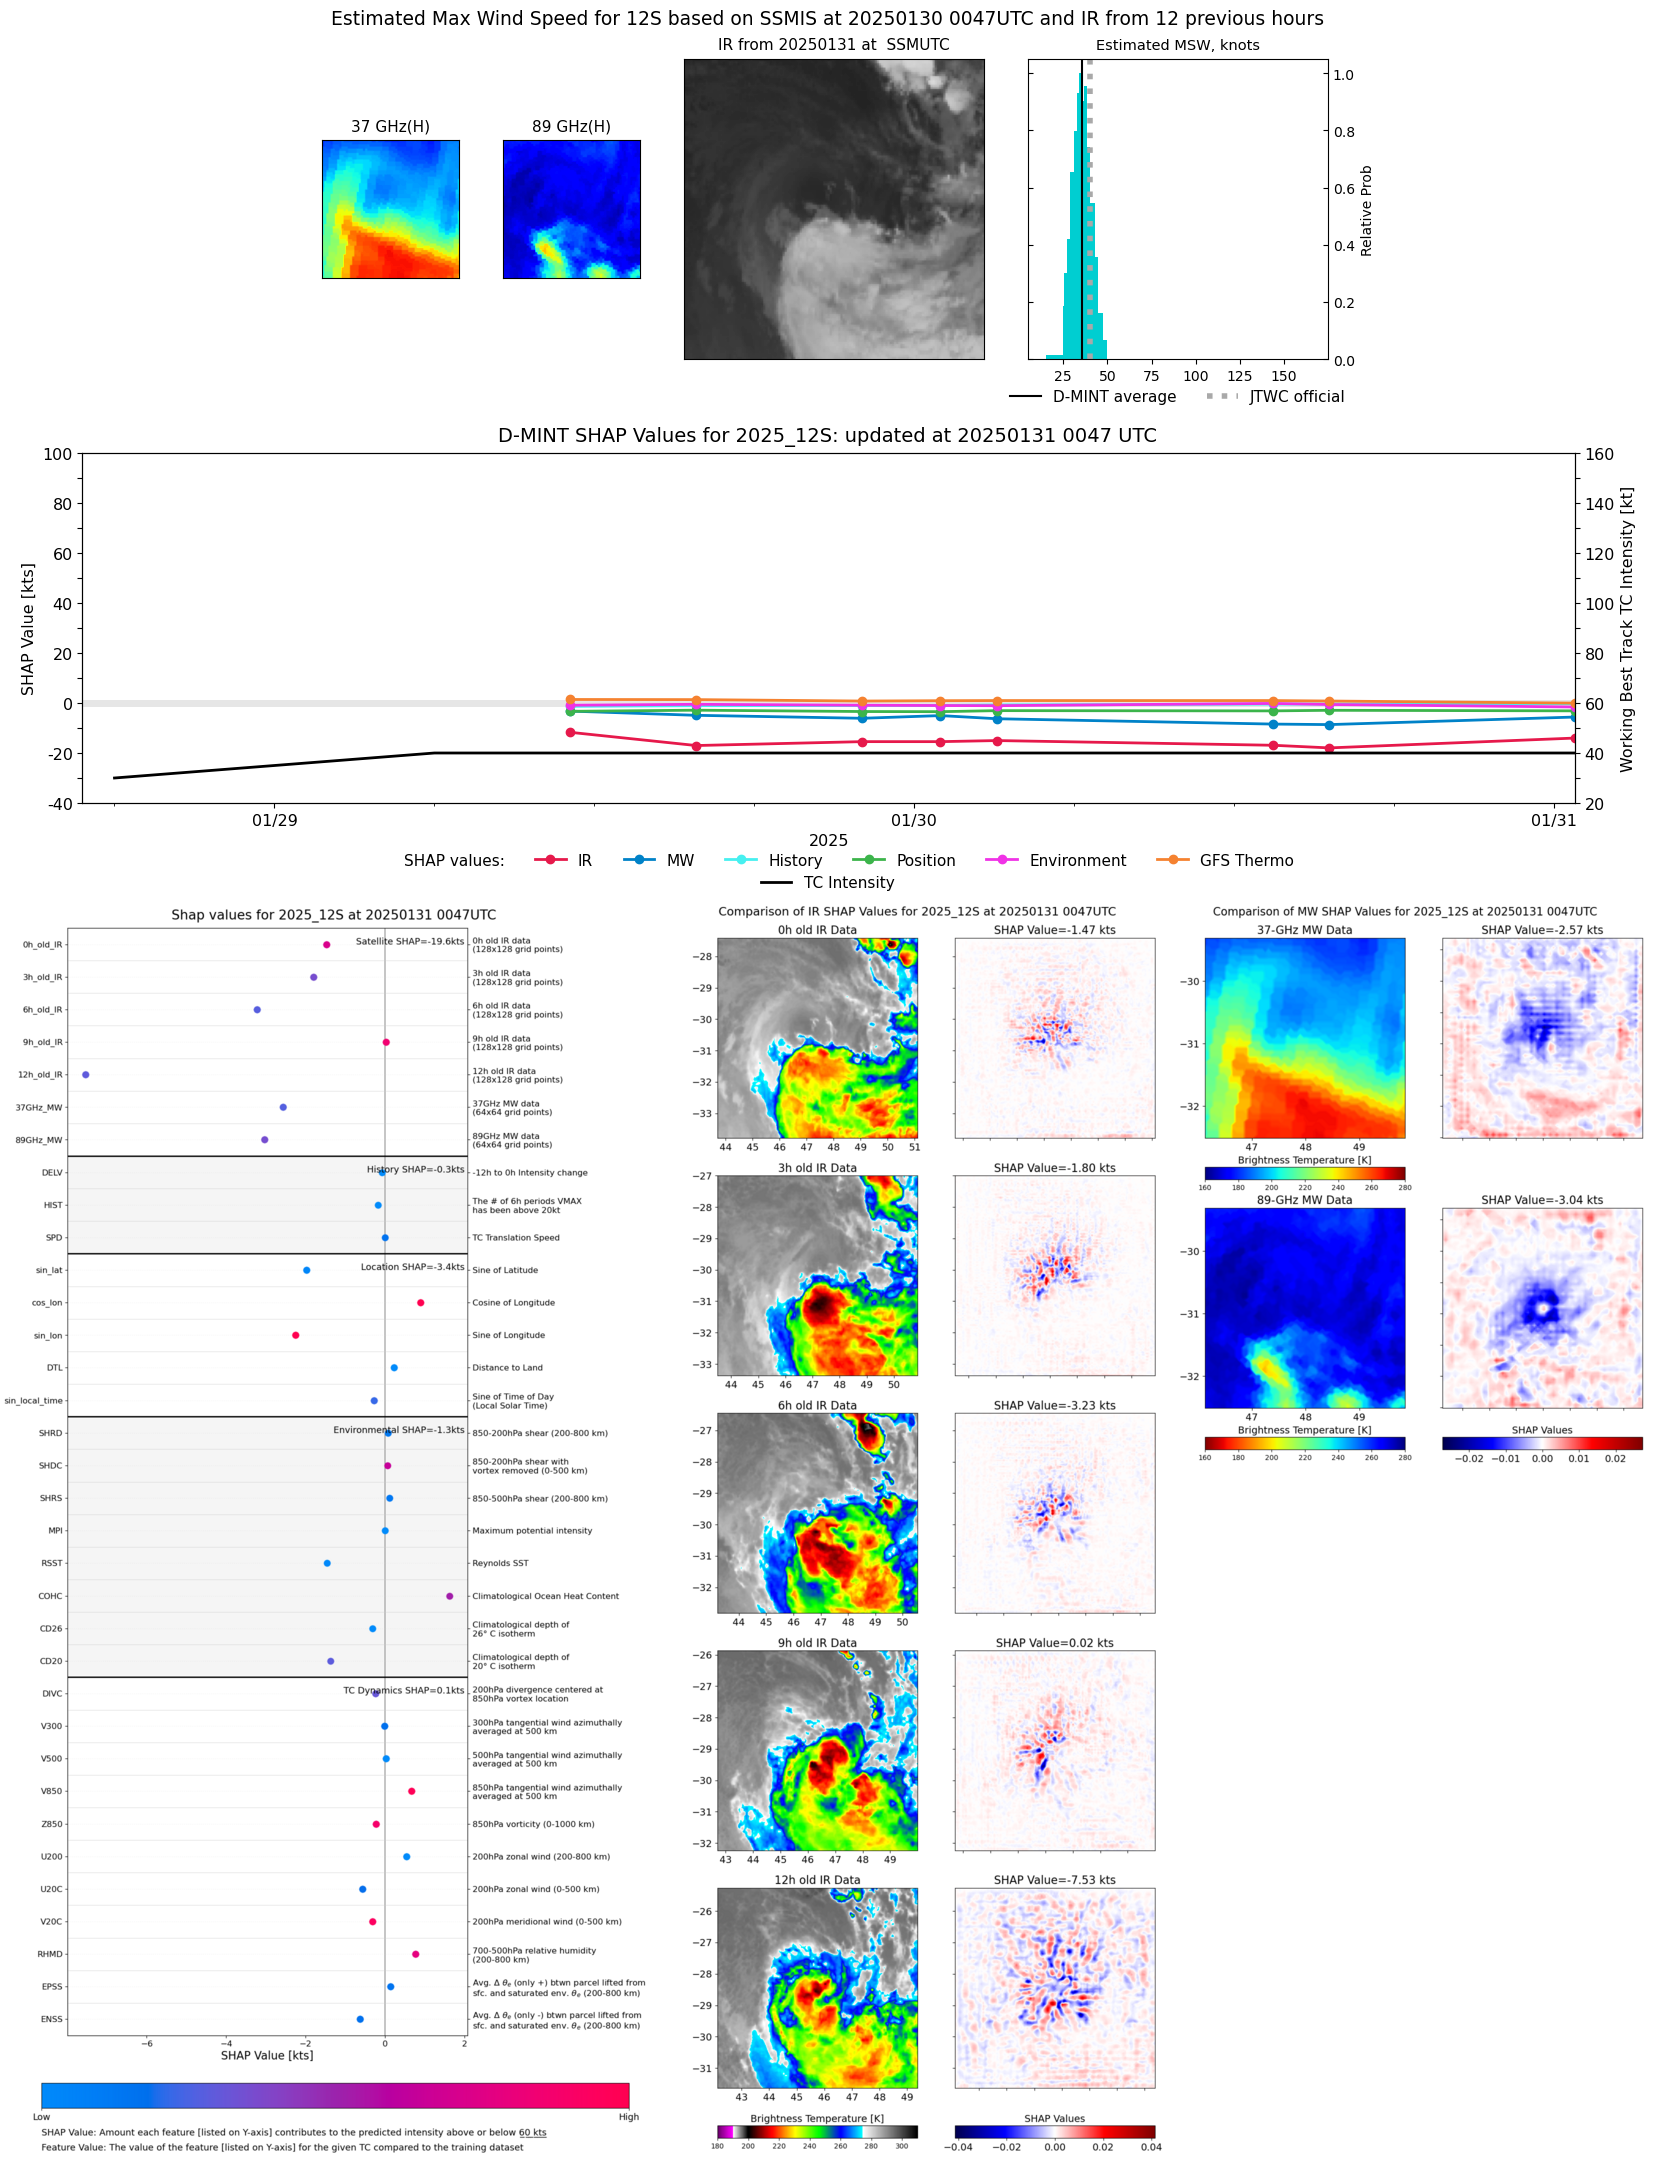 |
| 20250130 | 1608 UTC | SSMISF16 | 998 hPa | 26 kts | 23 kts | 30 kts | 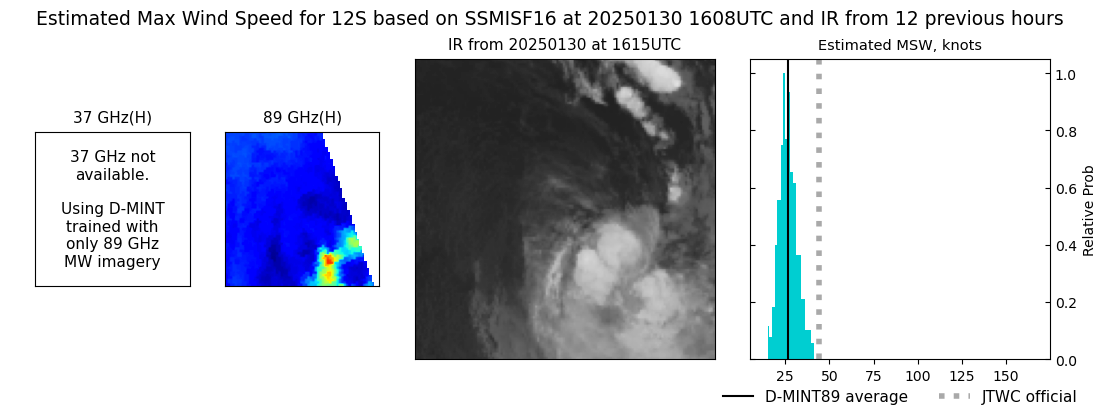 |
| 20250130 | 1534 UTC | SSMISF17 | 996 hPa | 30 kts | 27 kts | 34 kts |  |
| 20250130 | 1328 UTC | SSMISF18 | 993 hPa | 32 kts | 29 kts | 35 kts | 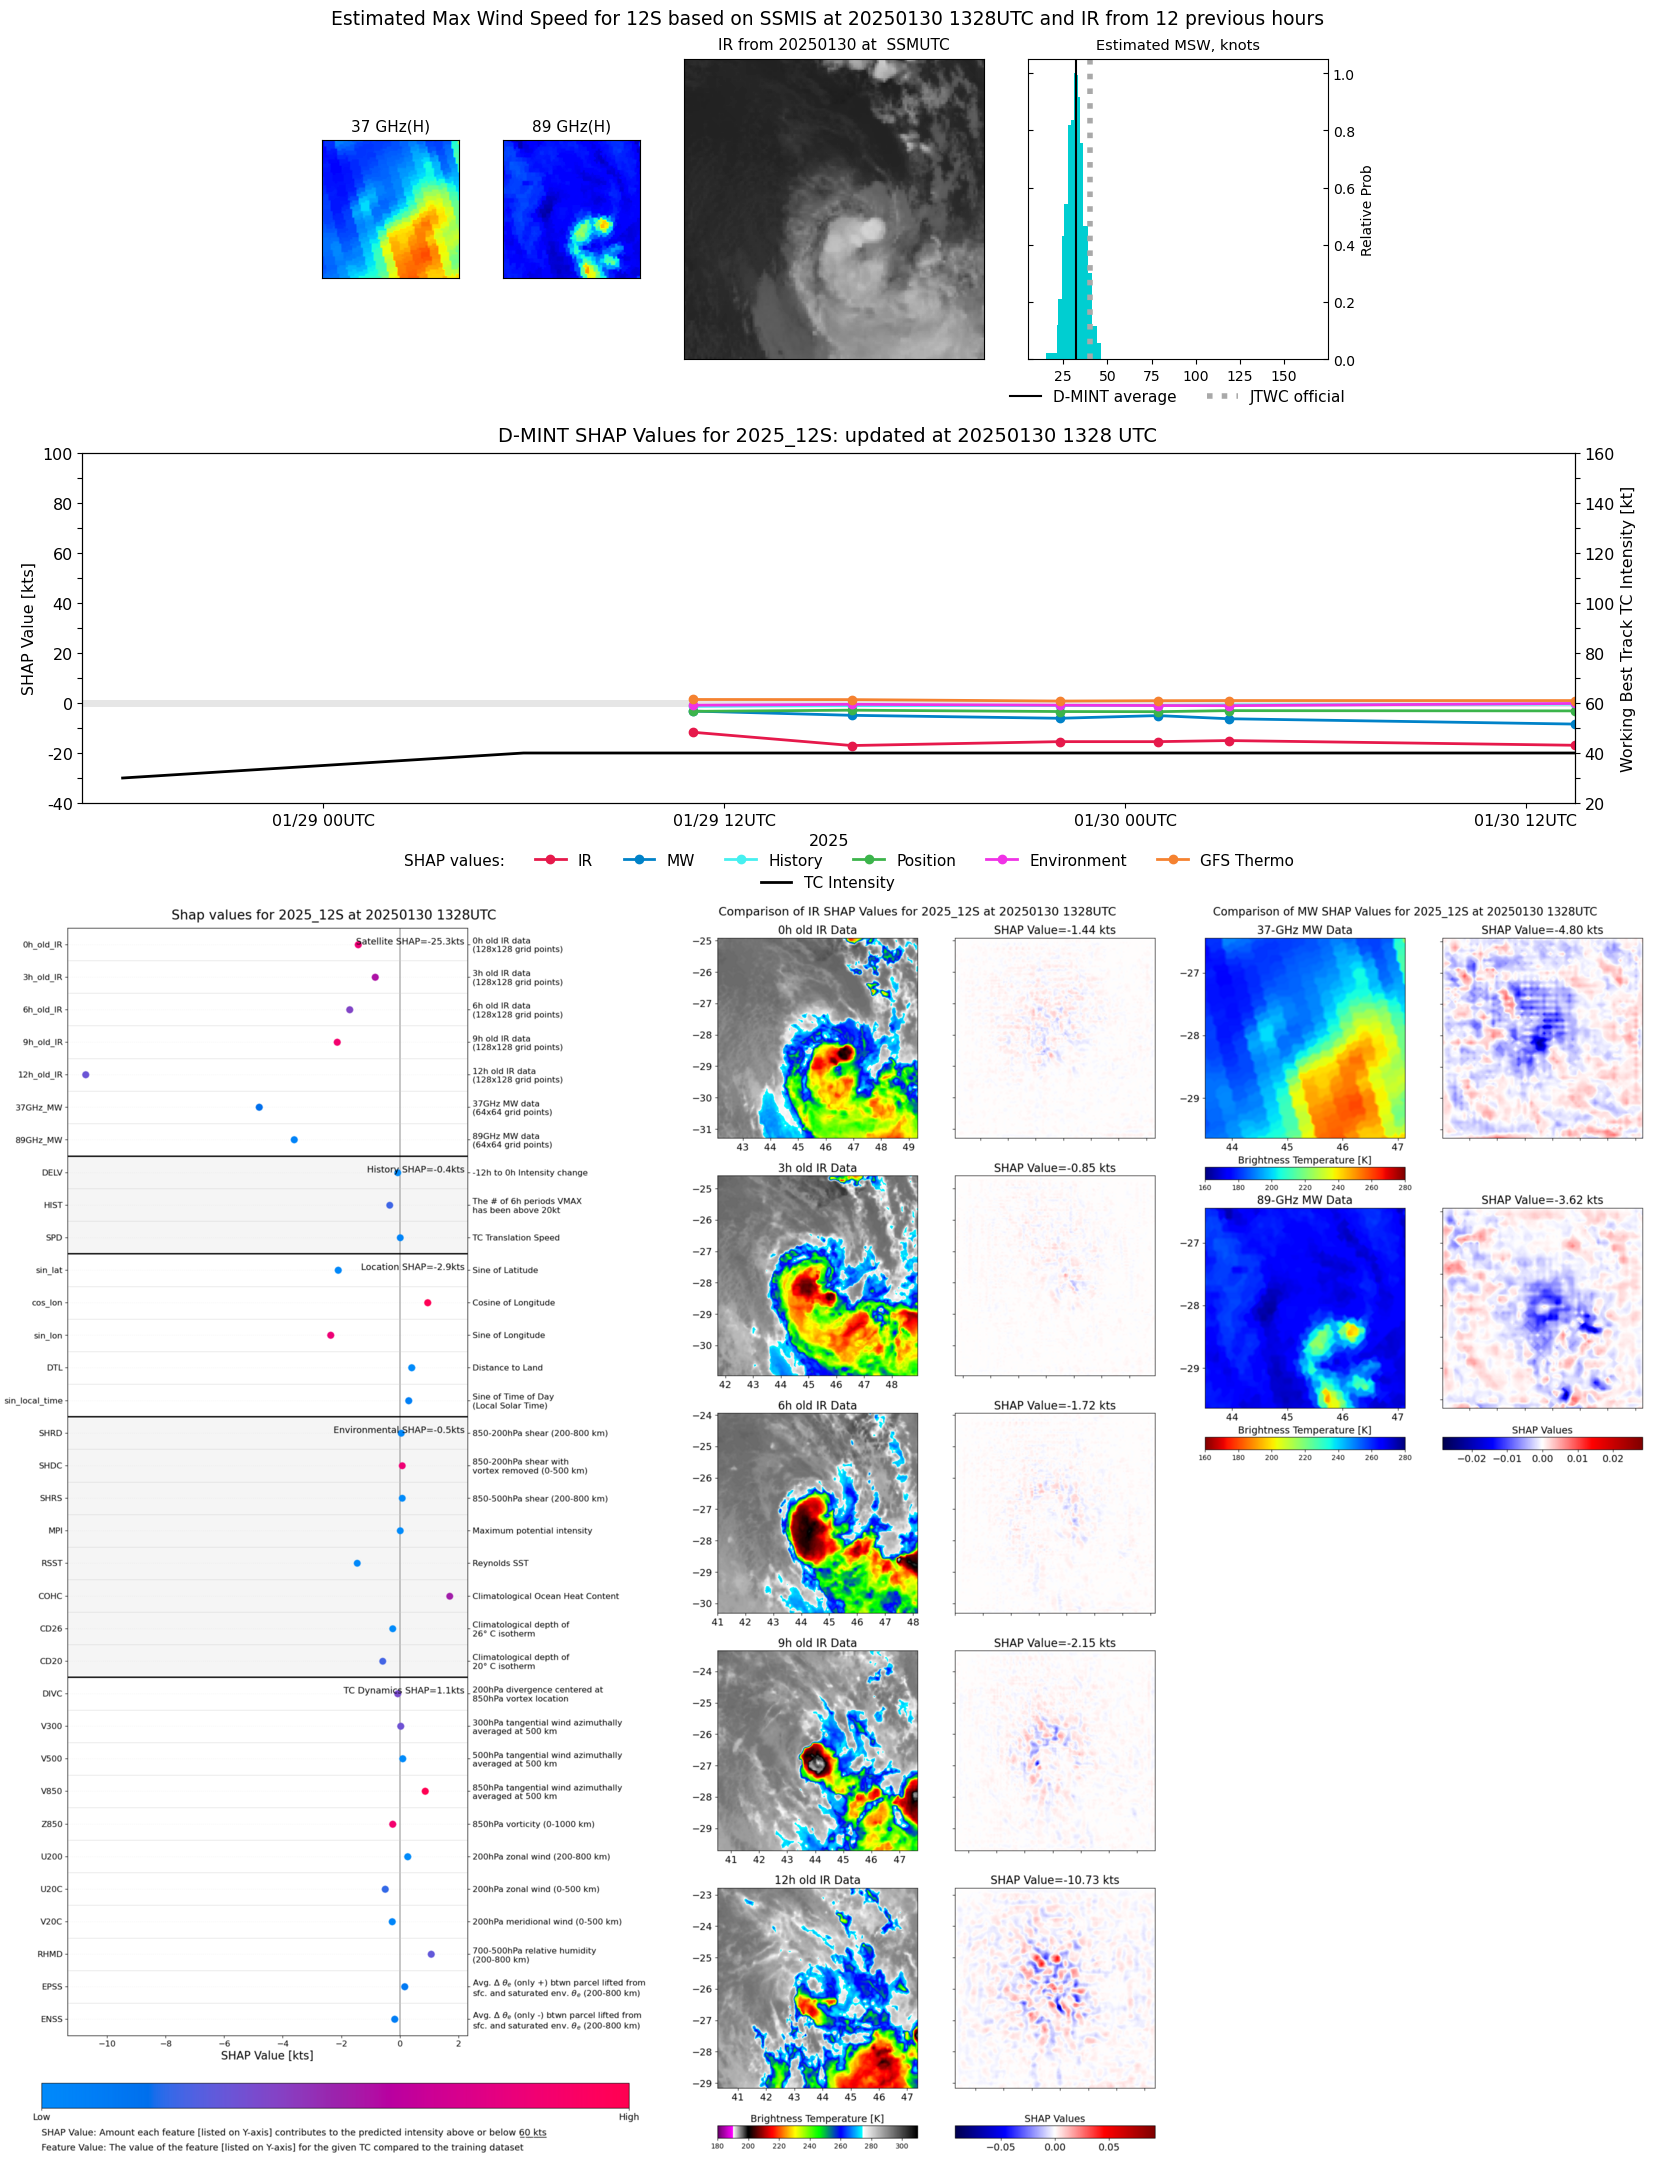 |
| 20250130 | 1139 UTC | TROPICS06 | 994 hPa | 34 kts | 30 kts | 38 kts | 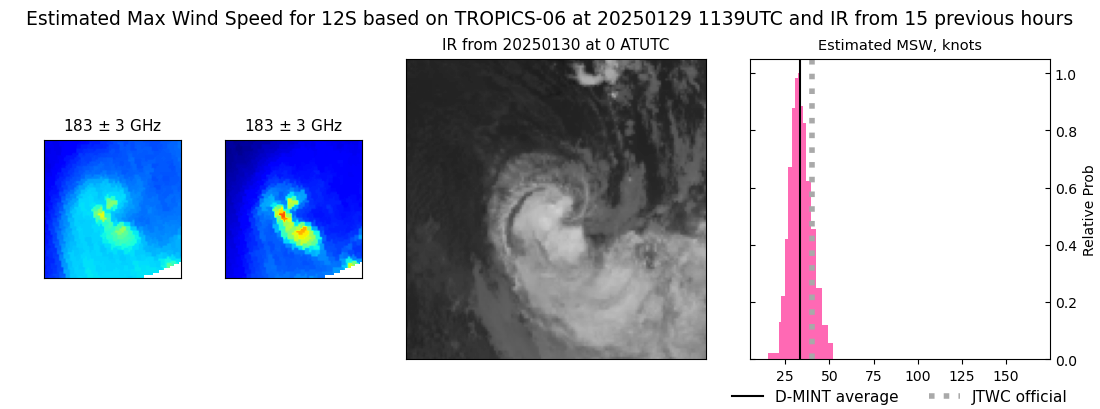 |
| 20250130 | 1120 UTC | ATMS-N20 | 996 hPa | 31 kts | 27 kts | 35 kts | 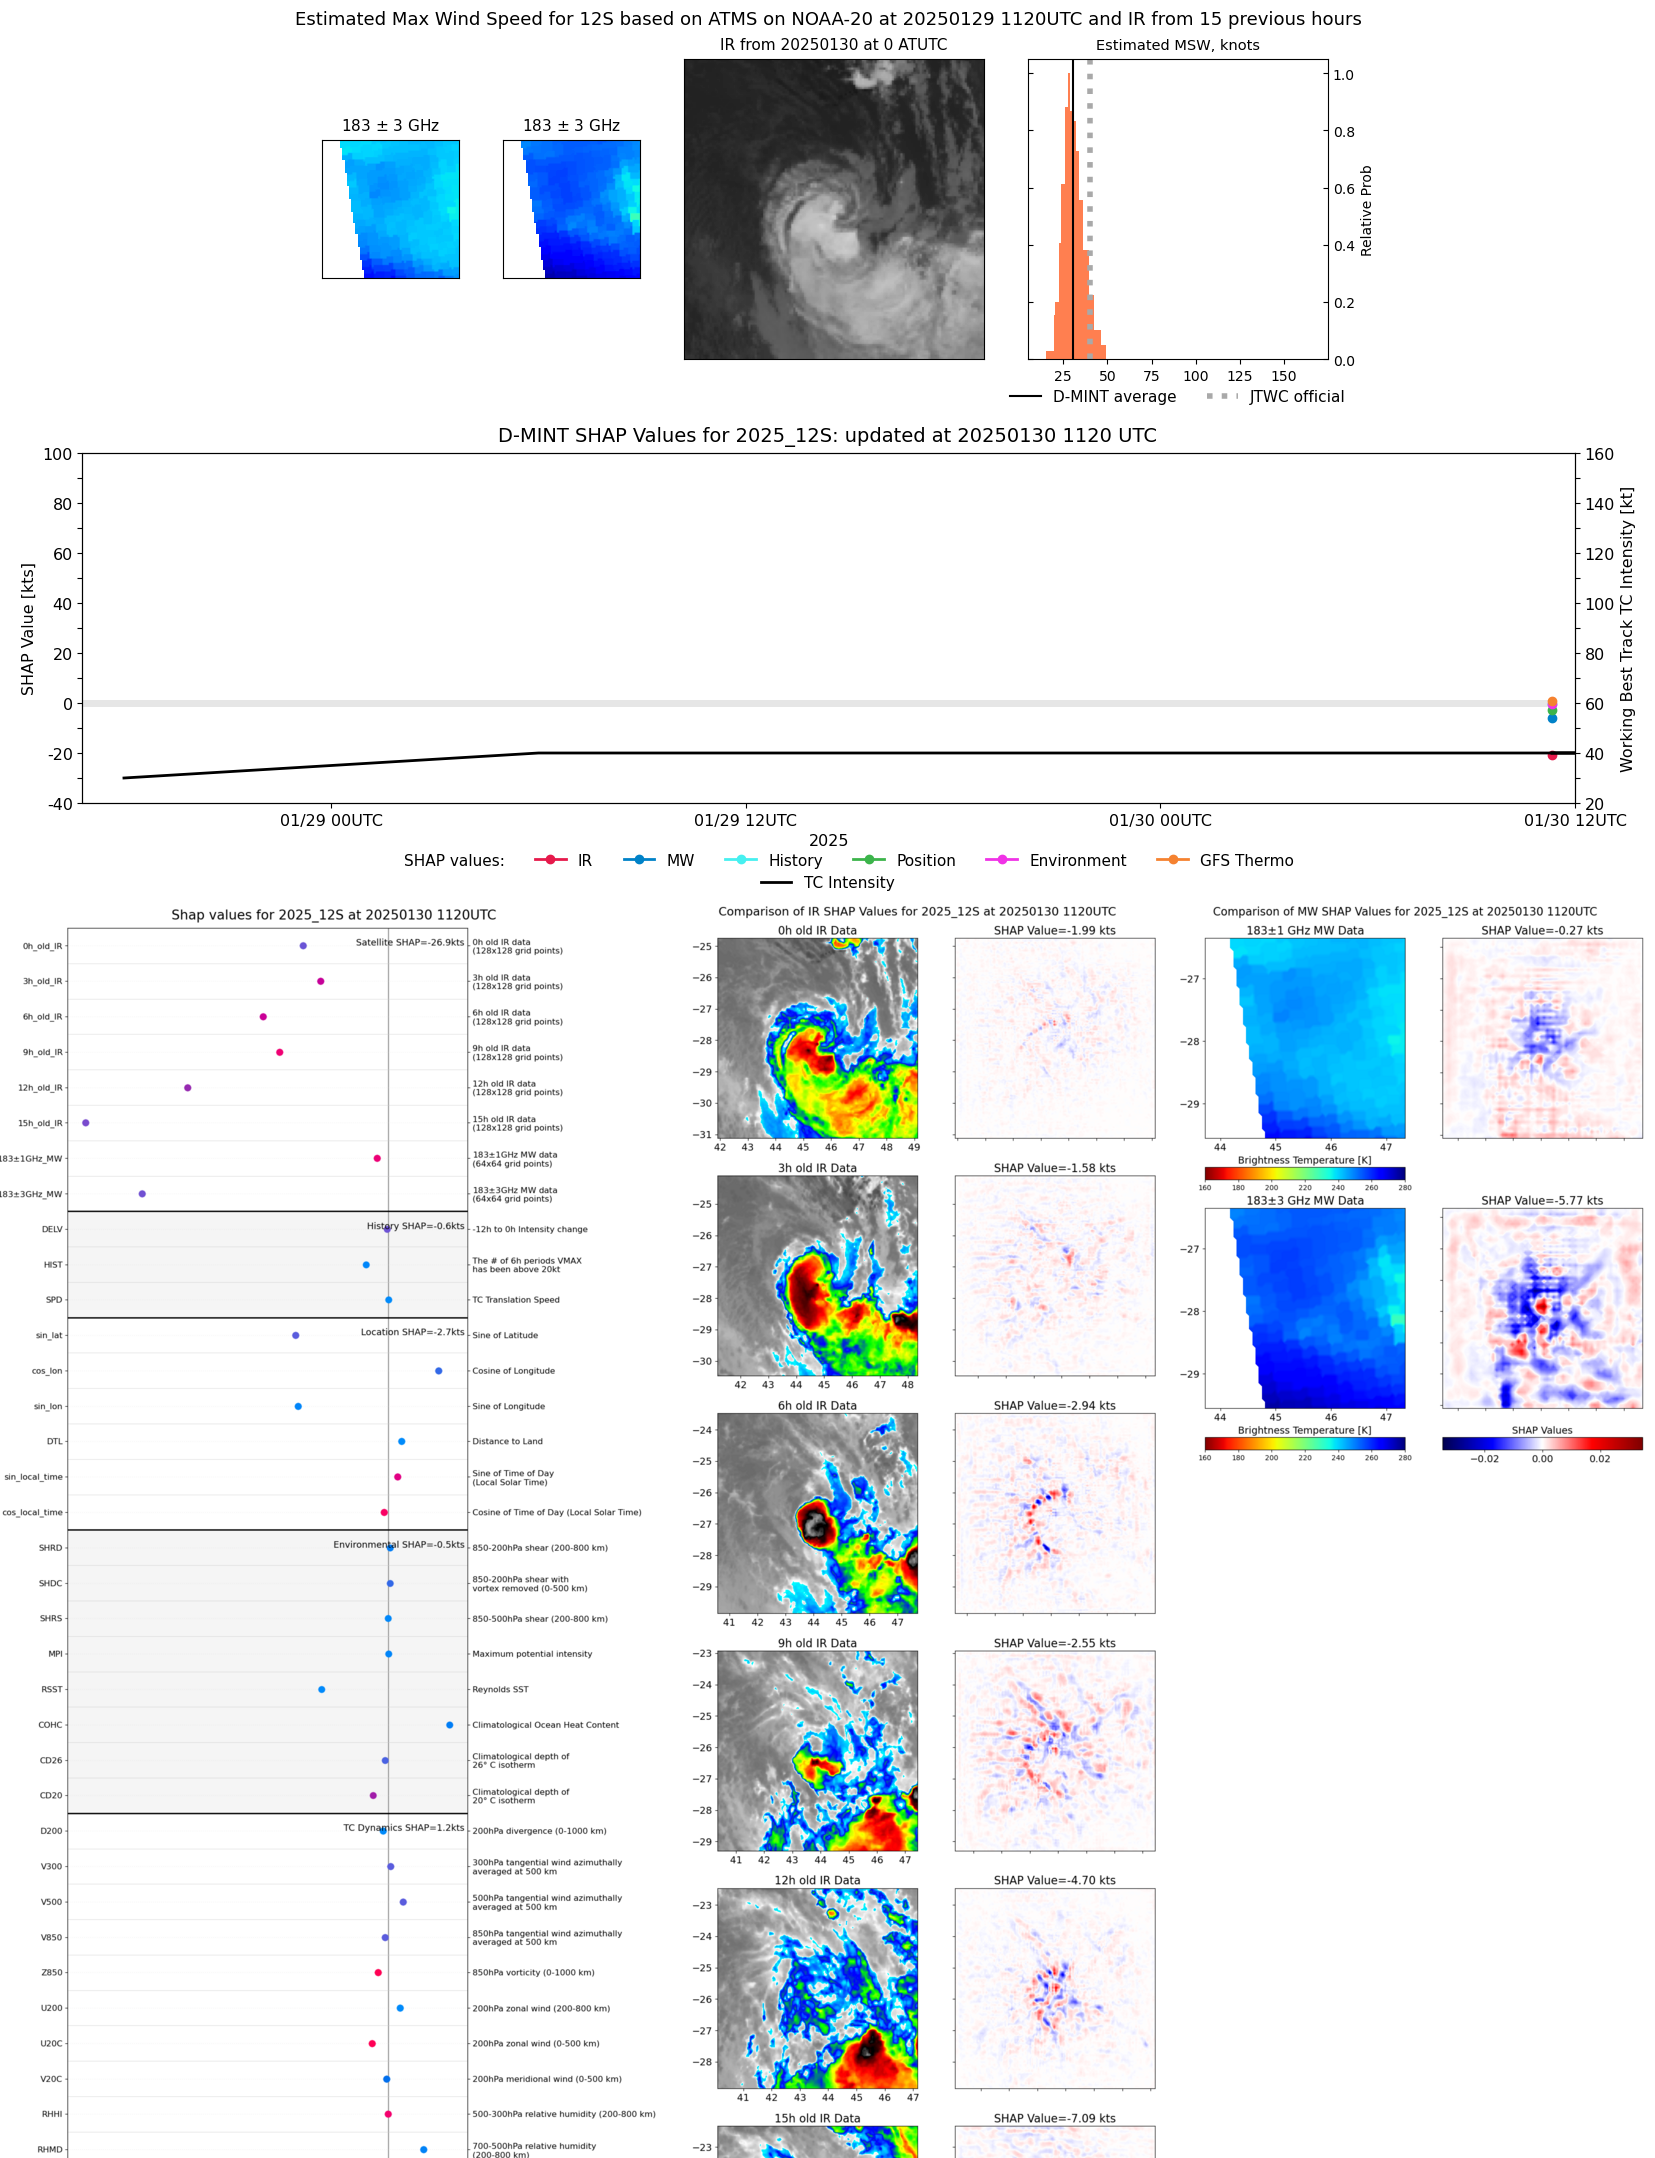 |
| 20250130 | 0735 UTC | TROPICS05 | 995 hPa | 32 kts | 29 kts | 36 kts | 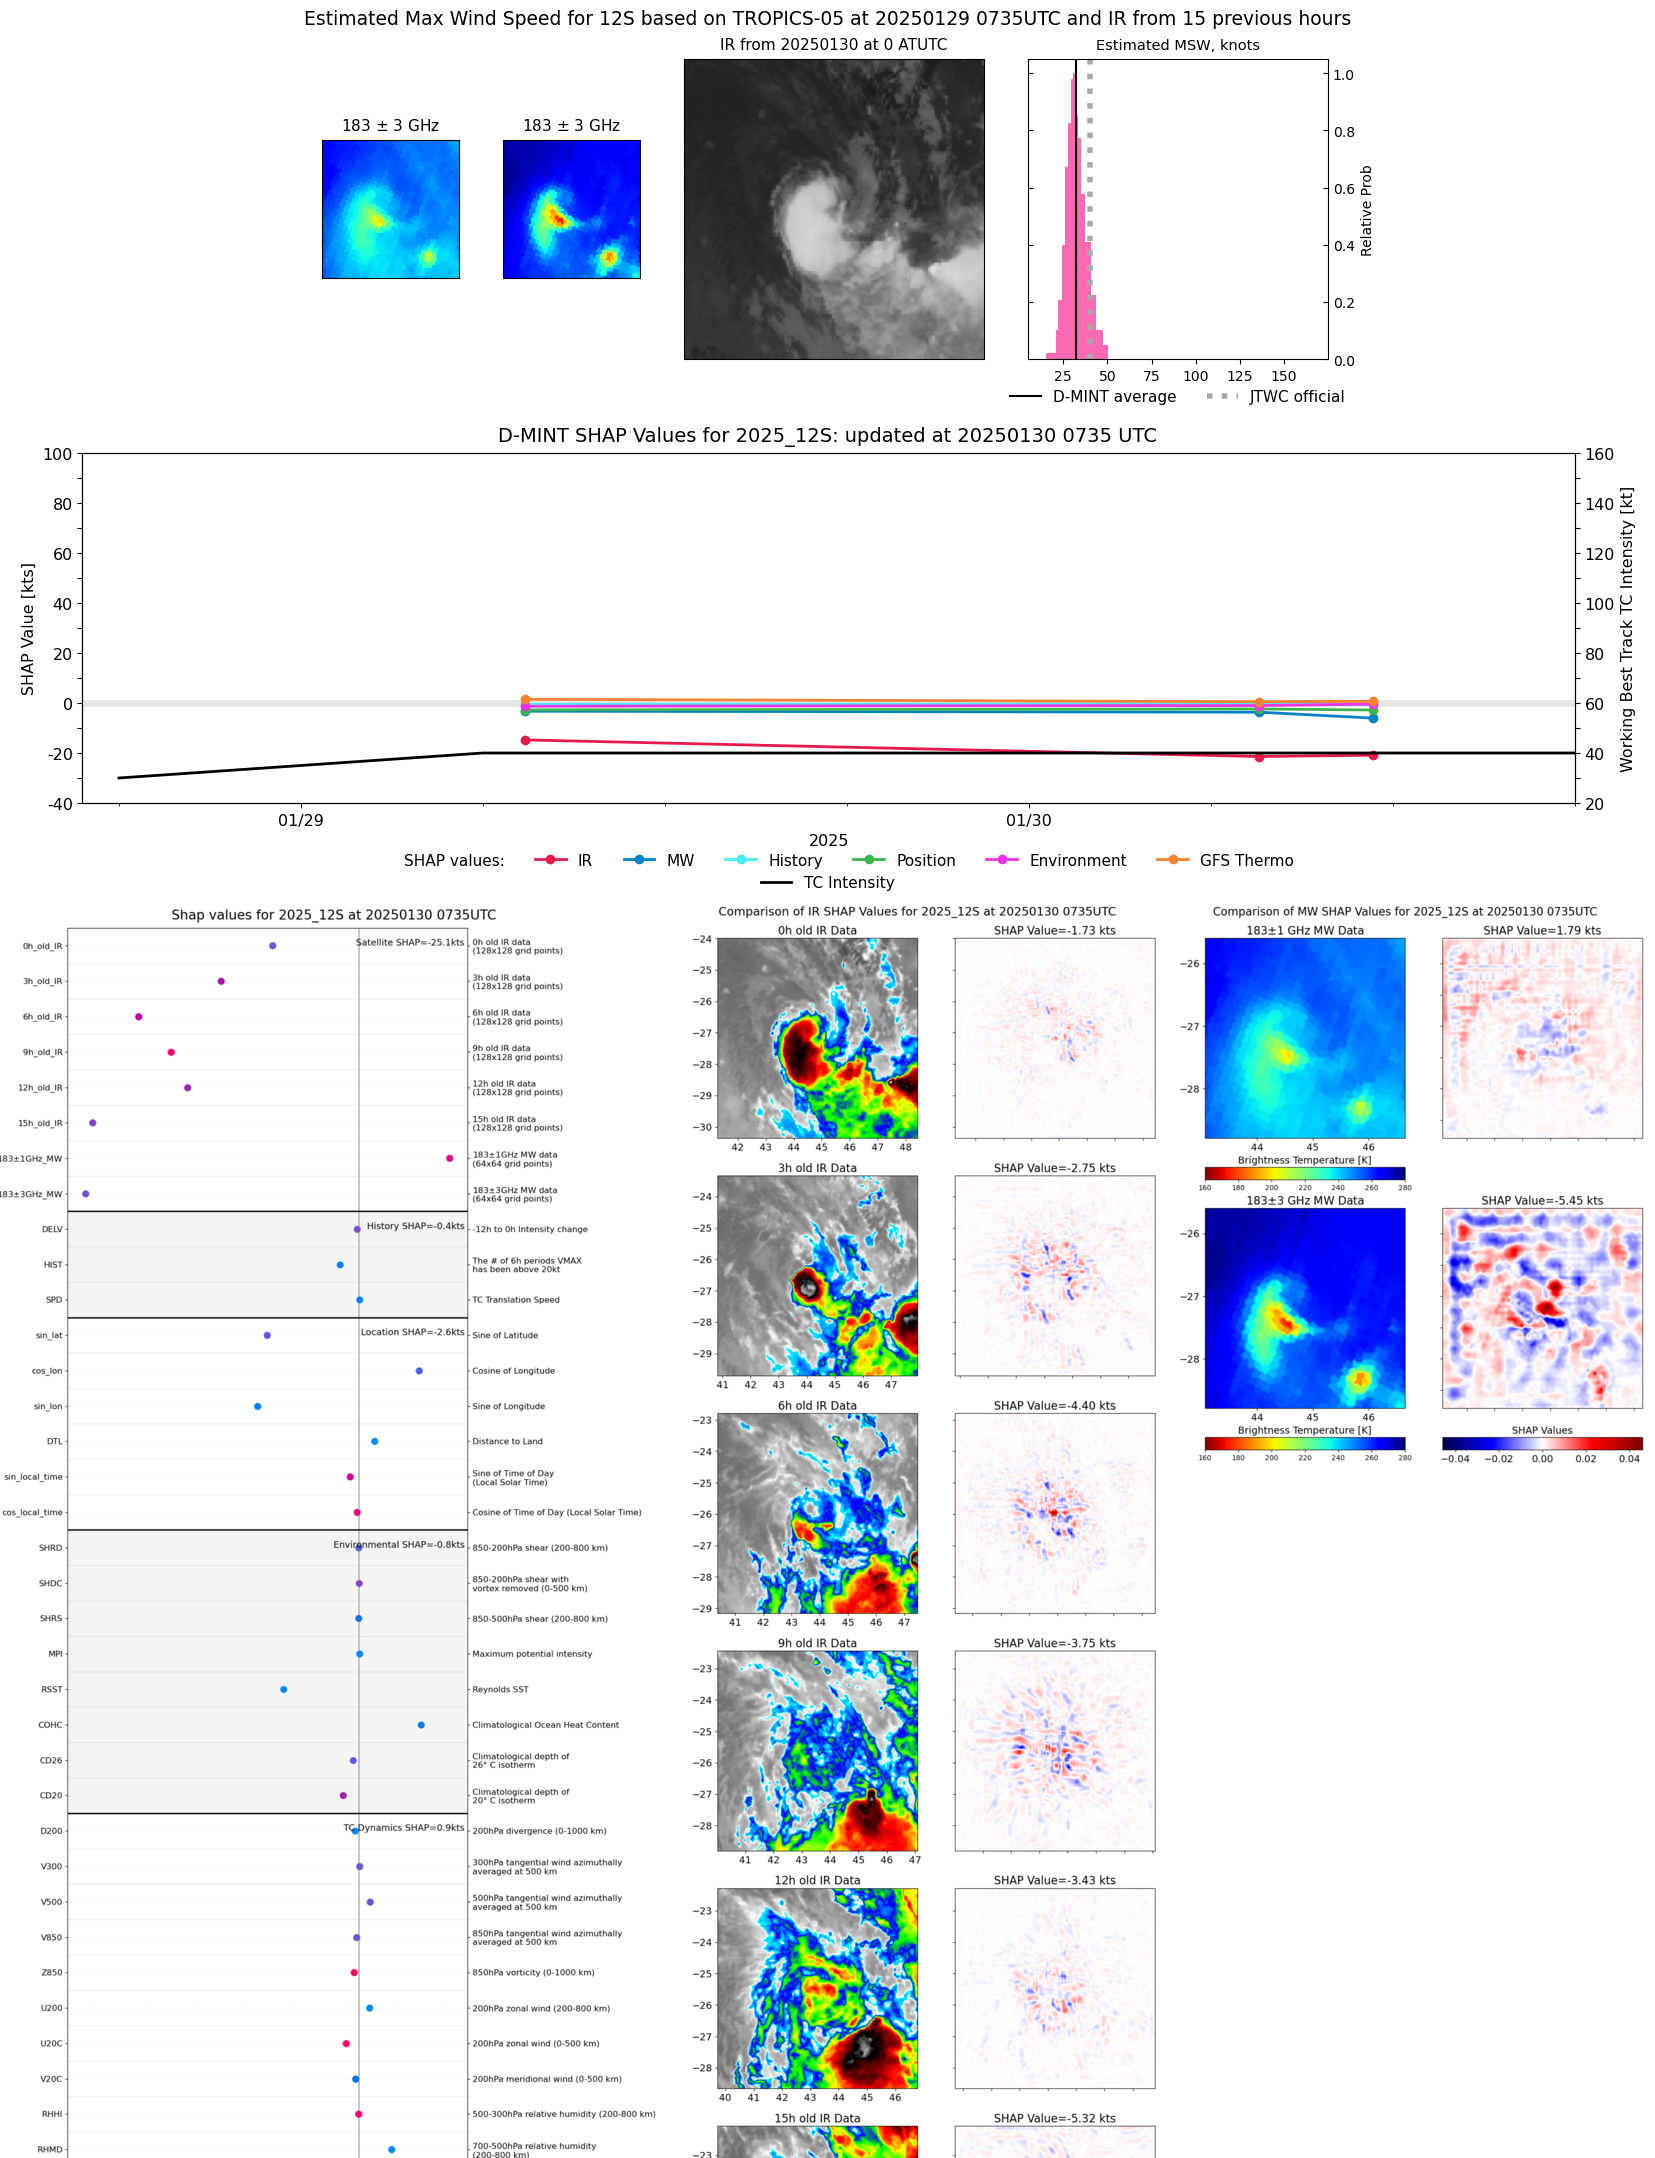 |
| 20250130 | 0643 UTC | TROPICS06 | 998 hPa | 34 kts | 30 kts | 38 kts | 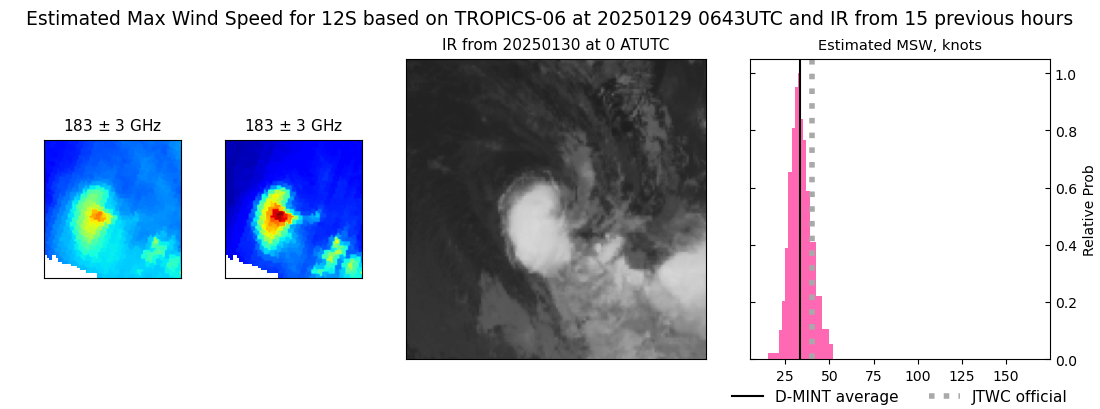 |
| 20250130 | 0306 UTC | SSMISF17 | 991 hPa | 35 kts | 31 kts | 39 kts |  |
| 20250130 | 0059 UTC | SSMISF18 | 994 hPa | 35 kts | 31 kts | 39 kts |  |
| 20250129 | 2203 UTC | AMSR2 | 992 hPa | 34 kts | 30 kts | 38 kts | 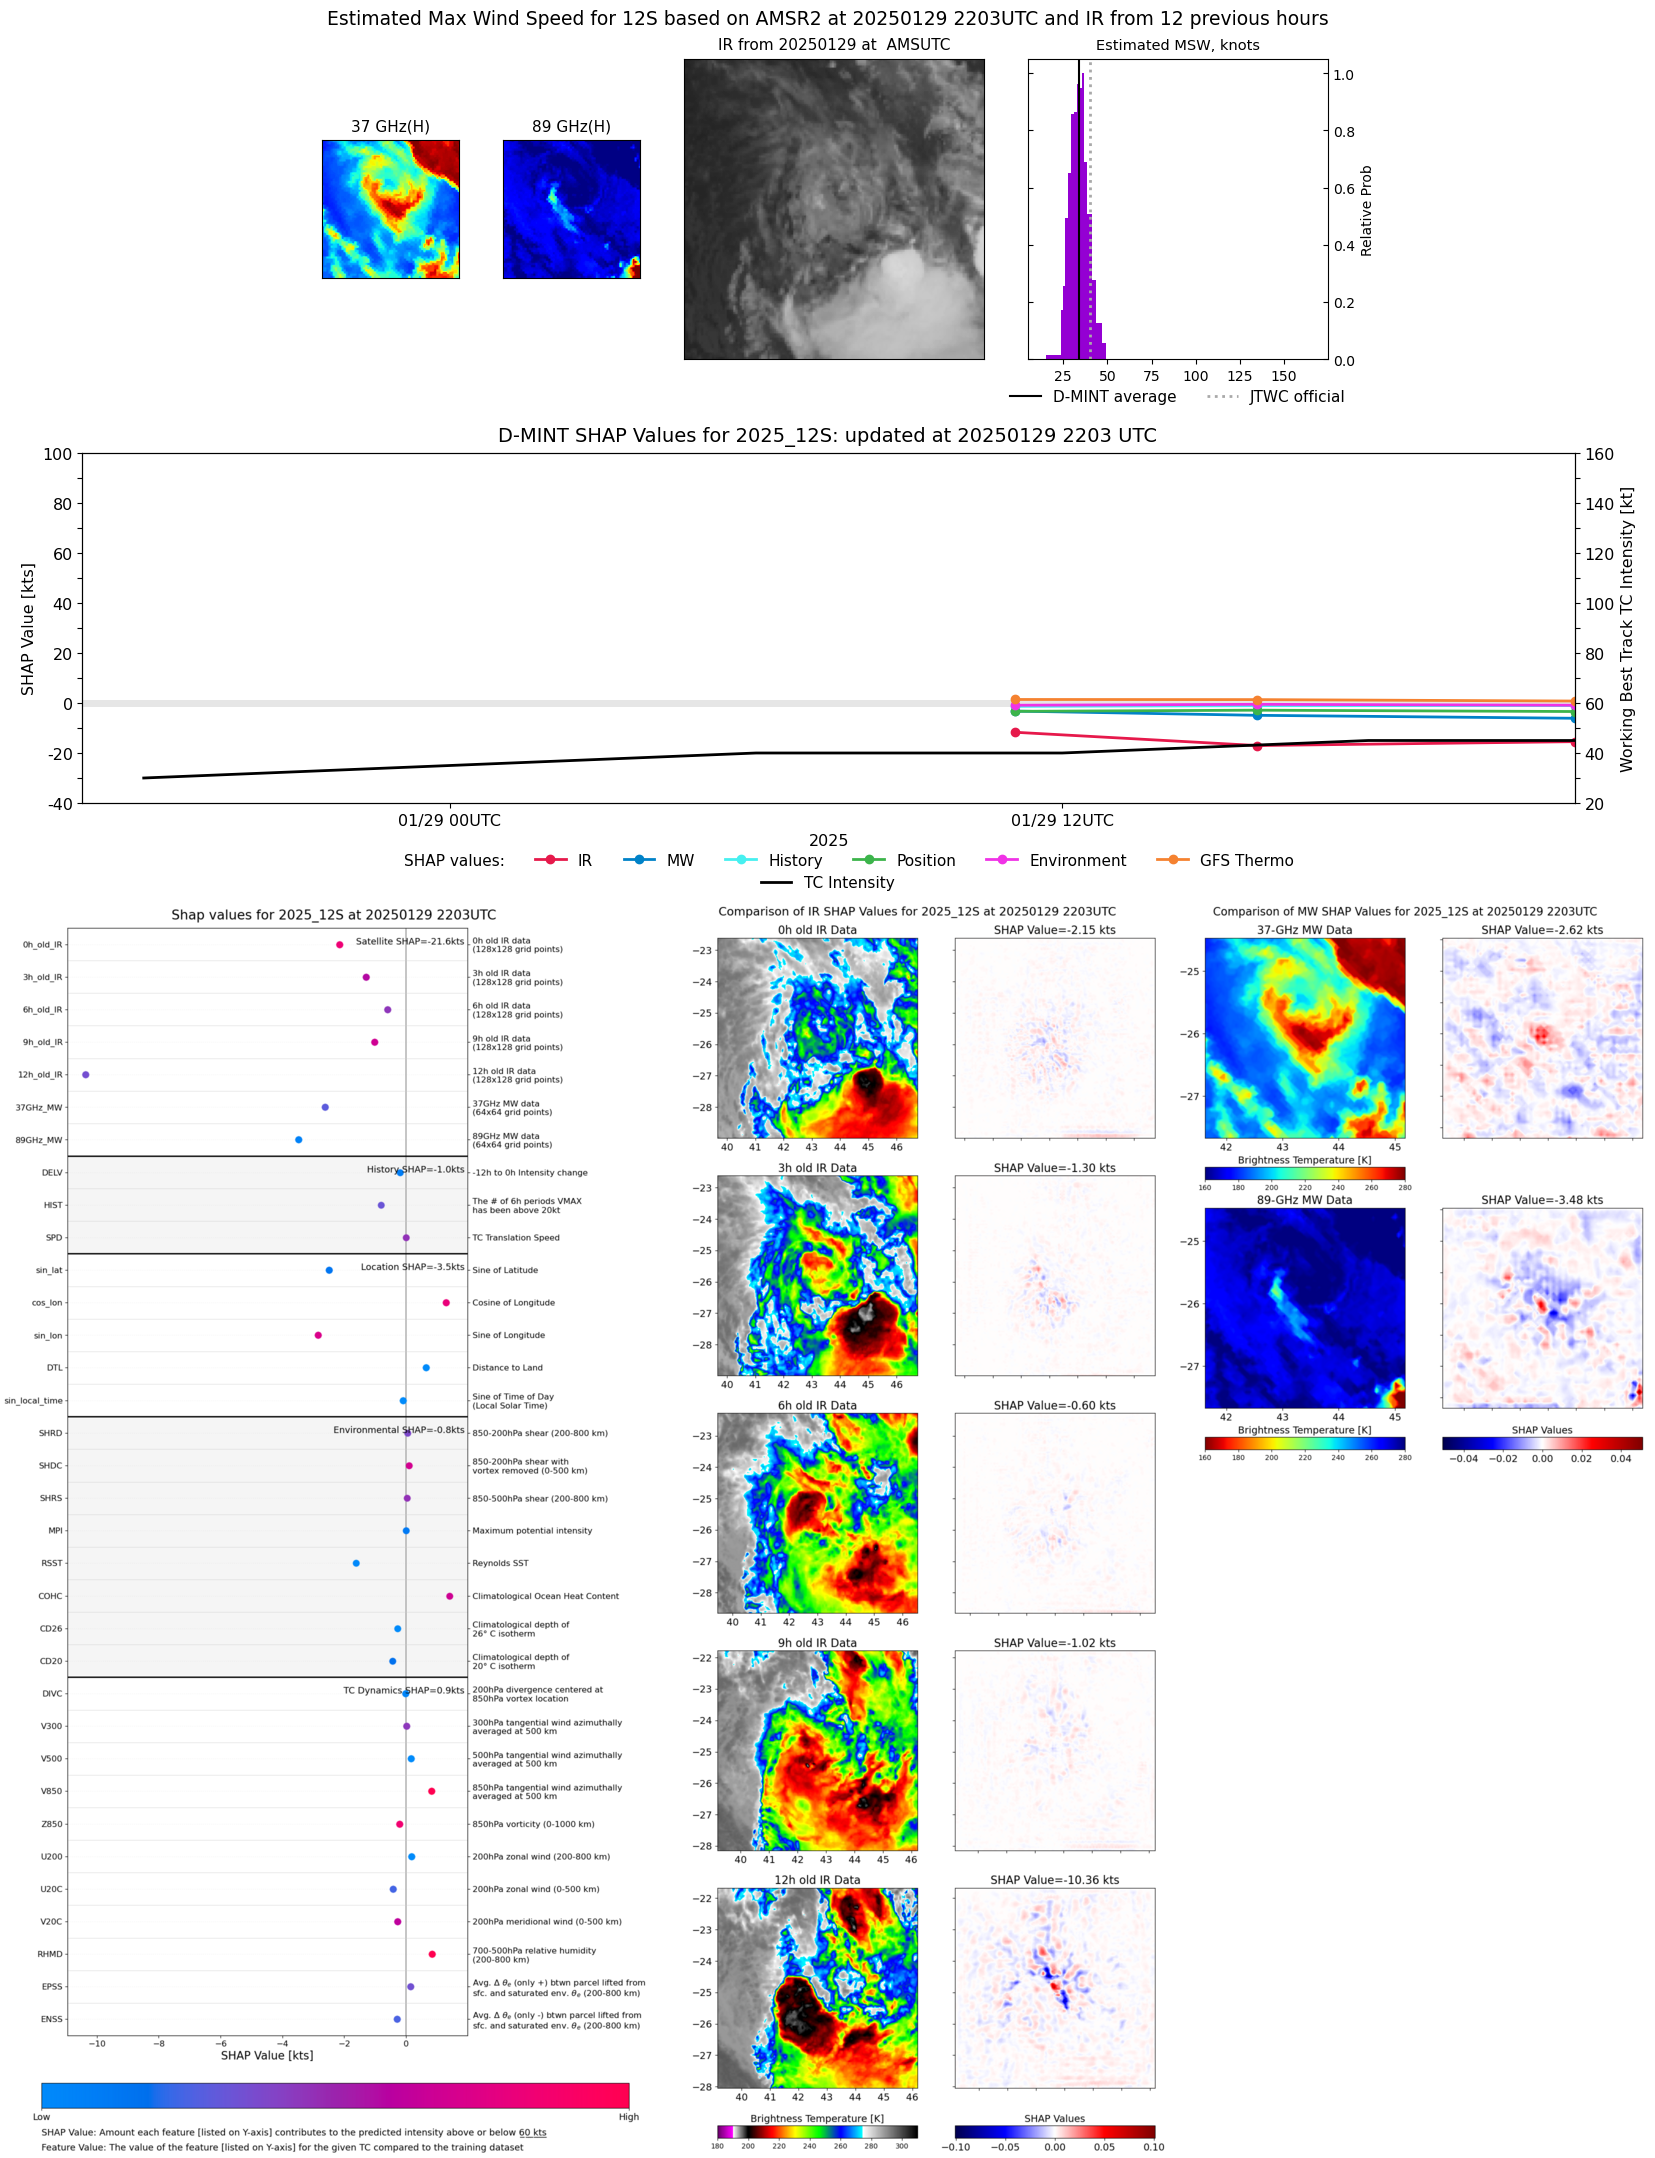 |
| 20250129 | 1549 UTC | SSMISF17 | 995 hPa | 35 kts | 31 kts | 39 kts | 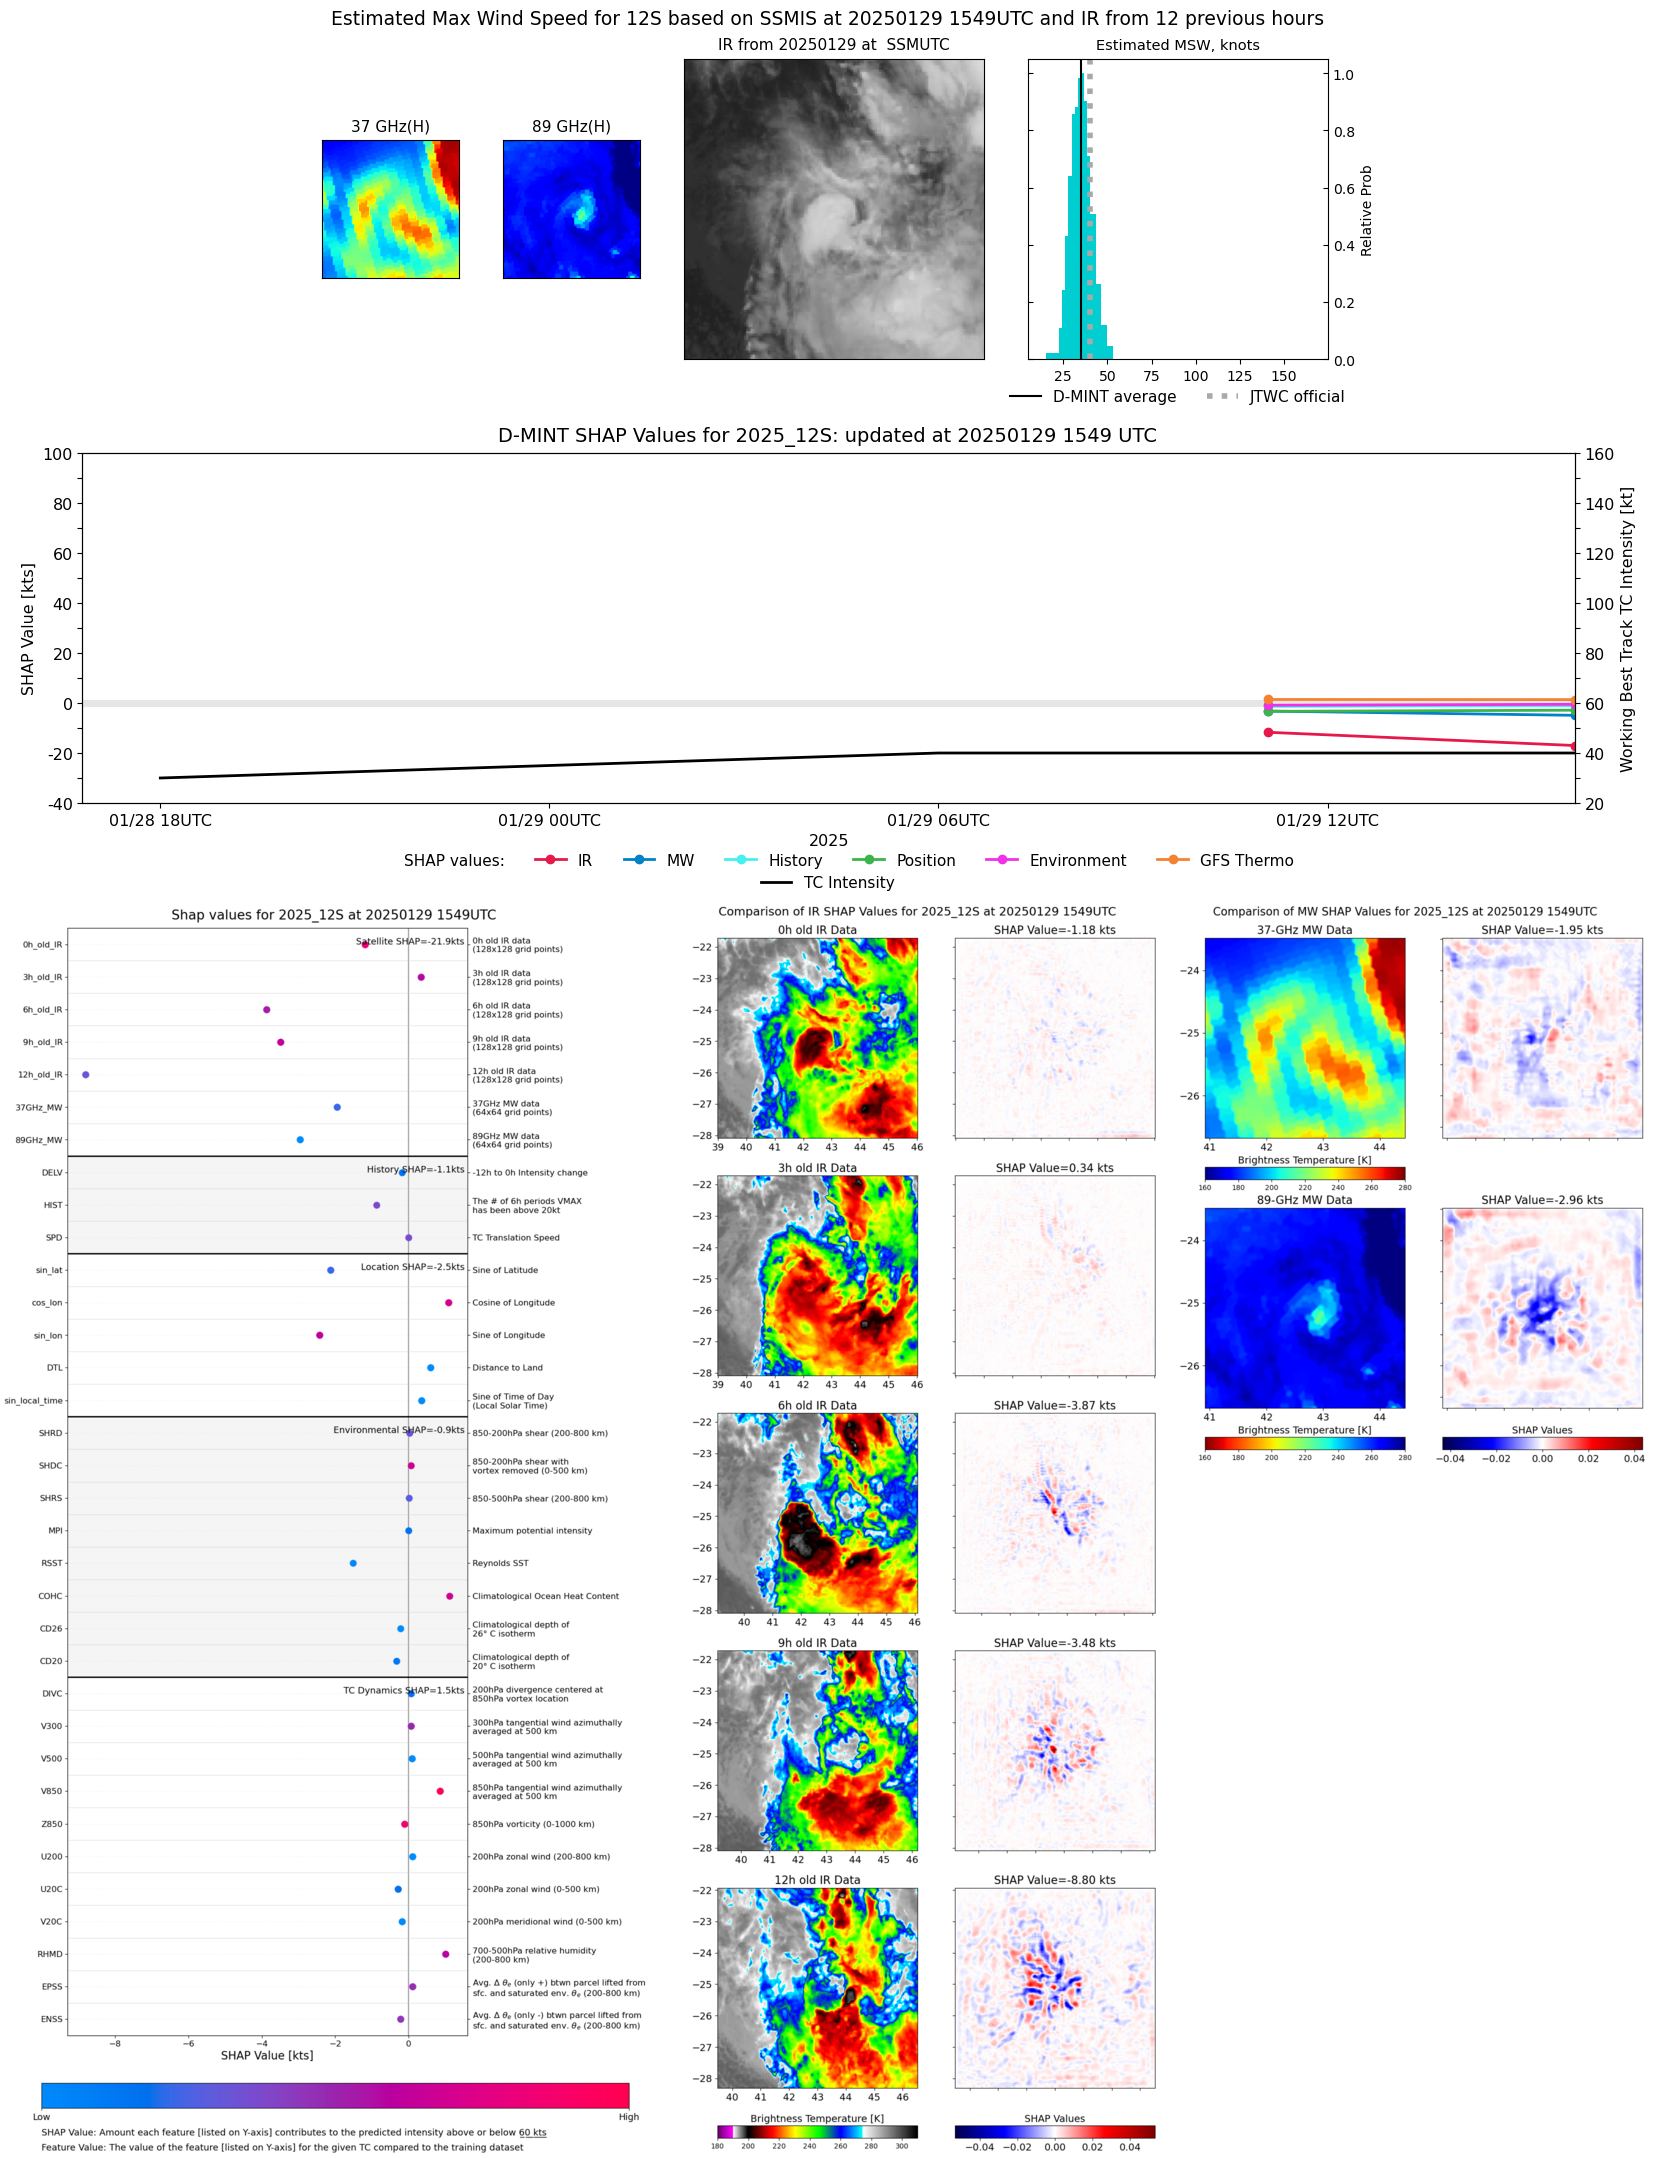 |
| 20250129 | 1342 UTC | SSMISF18 | 993 hPa | 36 kts | 32 kts | 40 kts |  |
| 20250129 | 1105 UTC | AMSR2 | 995 hPa | 41 kts | 36 kts | 46 kts | 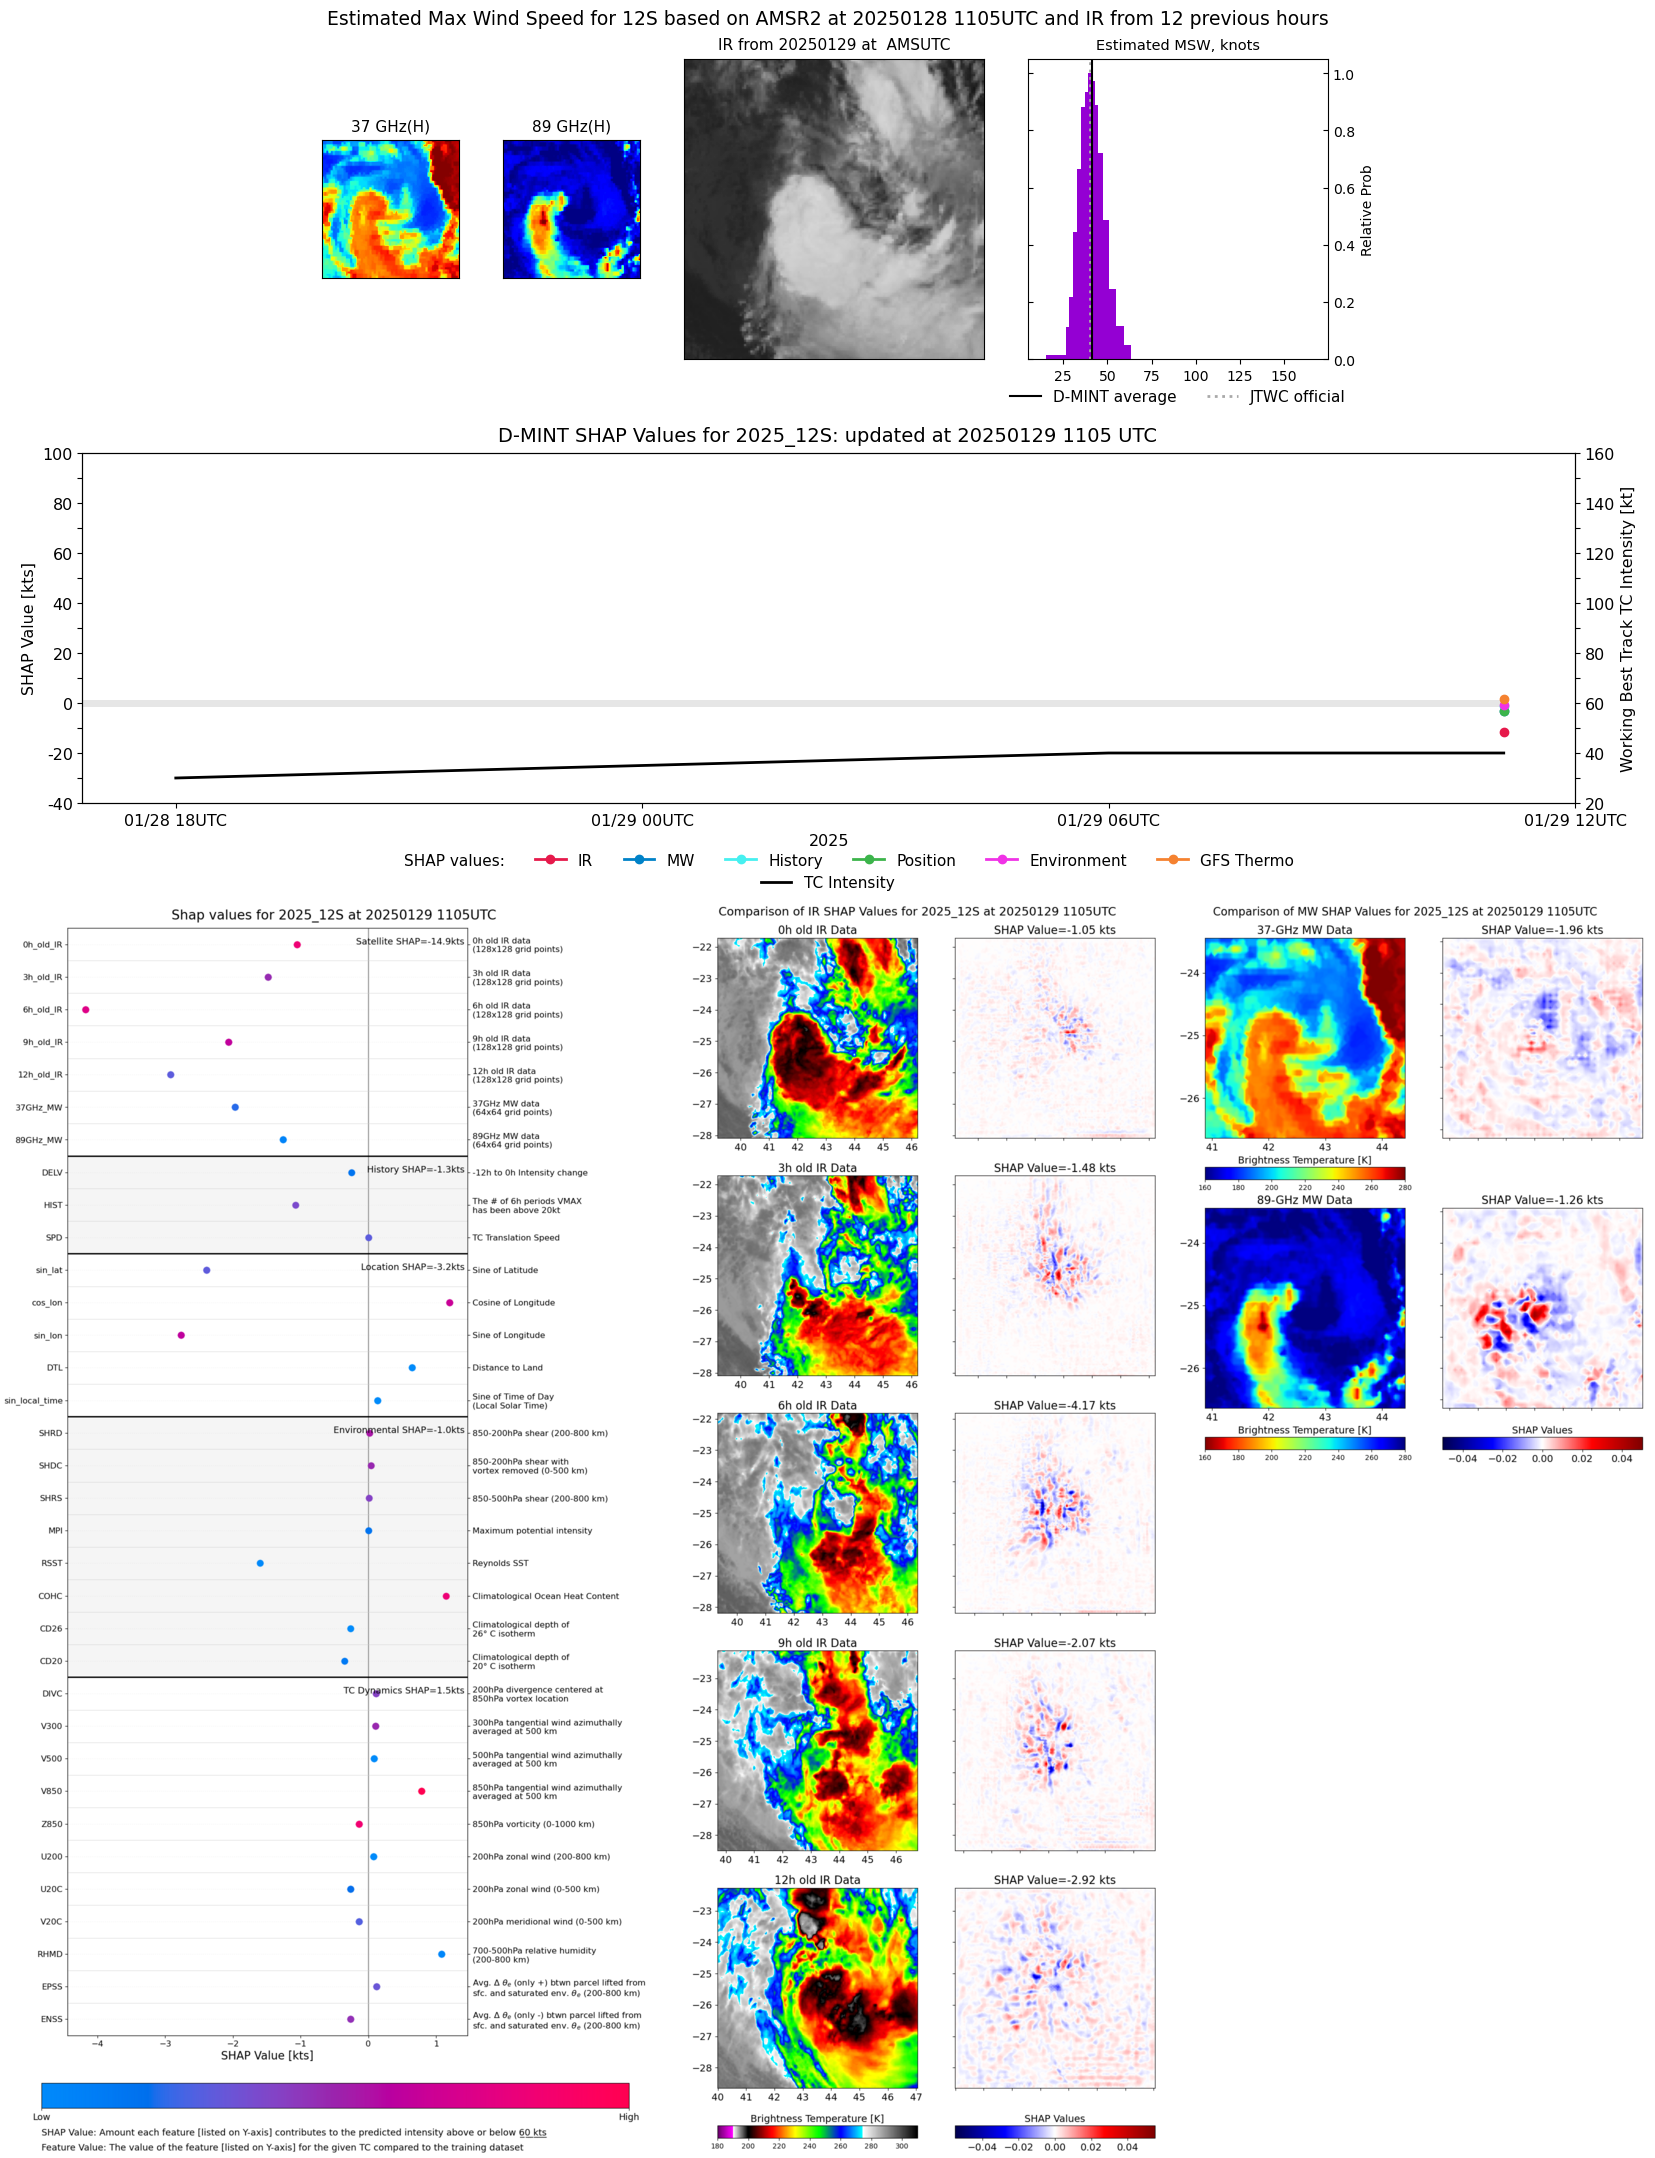 |
| 20250129 | 0724 UTC | TROPICS06 | 993 hPa | 40 kts | 35 kts | 44 kts | 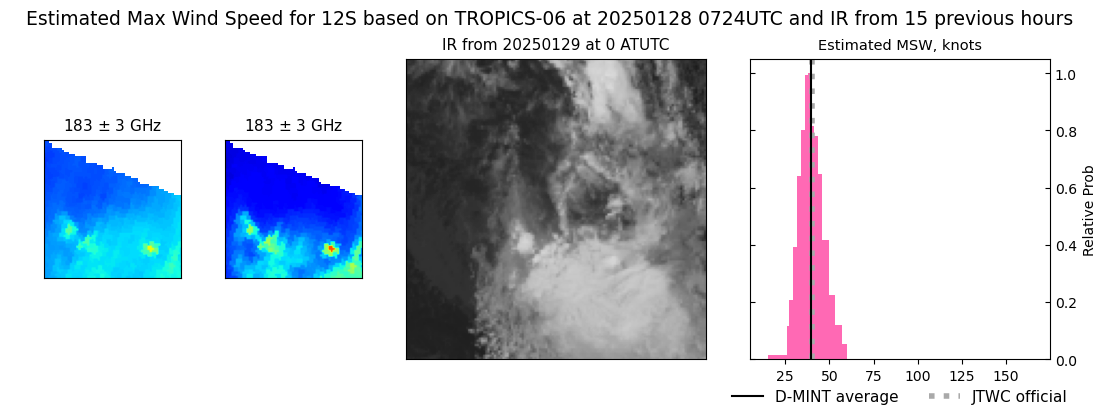 |
| 20250128 | 1018 UTC | ATMS-N20 | NaN hPa | 27 kts | 24 kts | 30 kts | 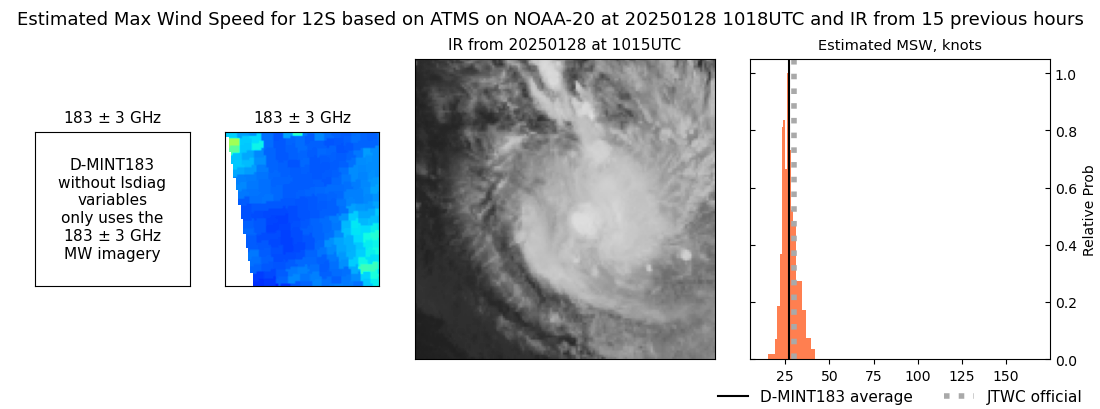 |