|
||

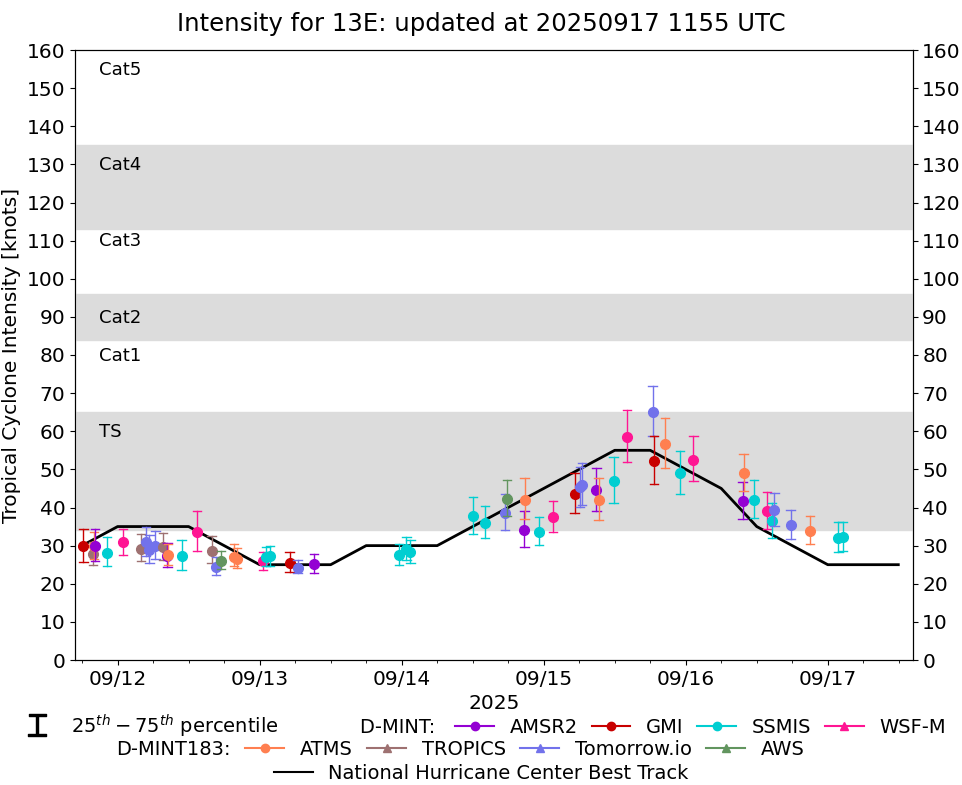 |
D-MINT HISTORY FILE for 2025_13E
| Date | Time | MW Sensor | MSLP | Vmax (30th-70th percentile average) | Vmax 25th percentile | Vmax 75th percentile | Image |
| 20250917 | 0230 UTC | SSMISF16 | 1005 hPa | 32 kts | 29 kts | 36 kts | 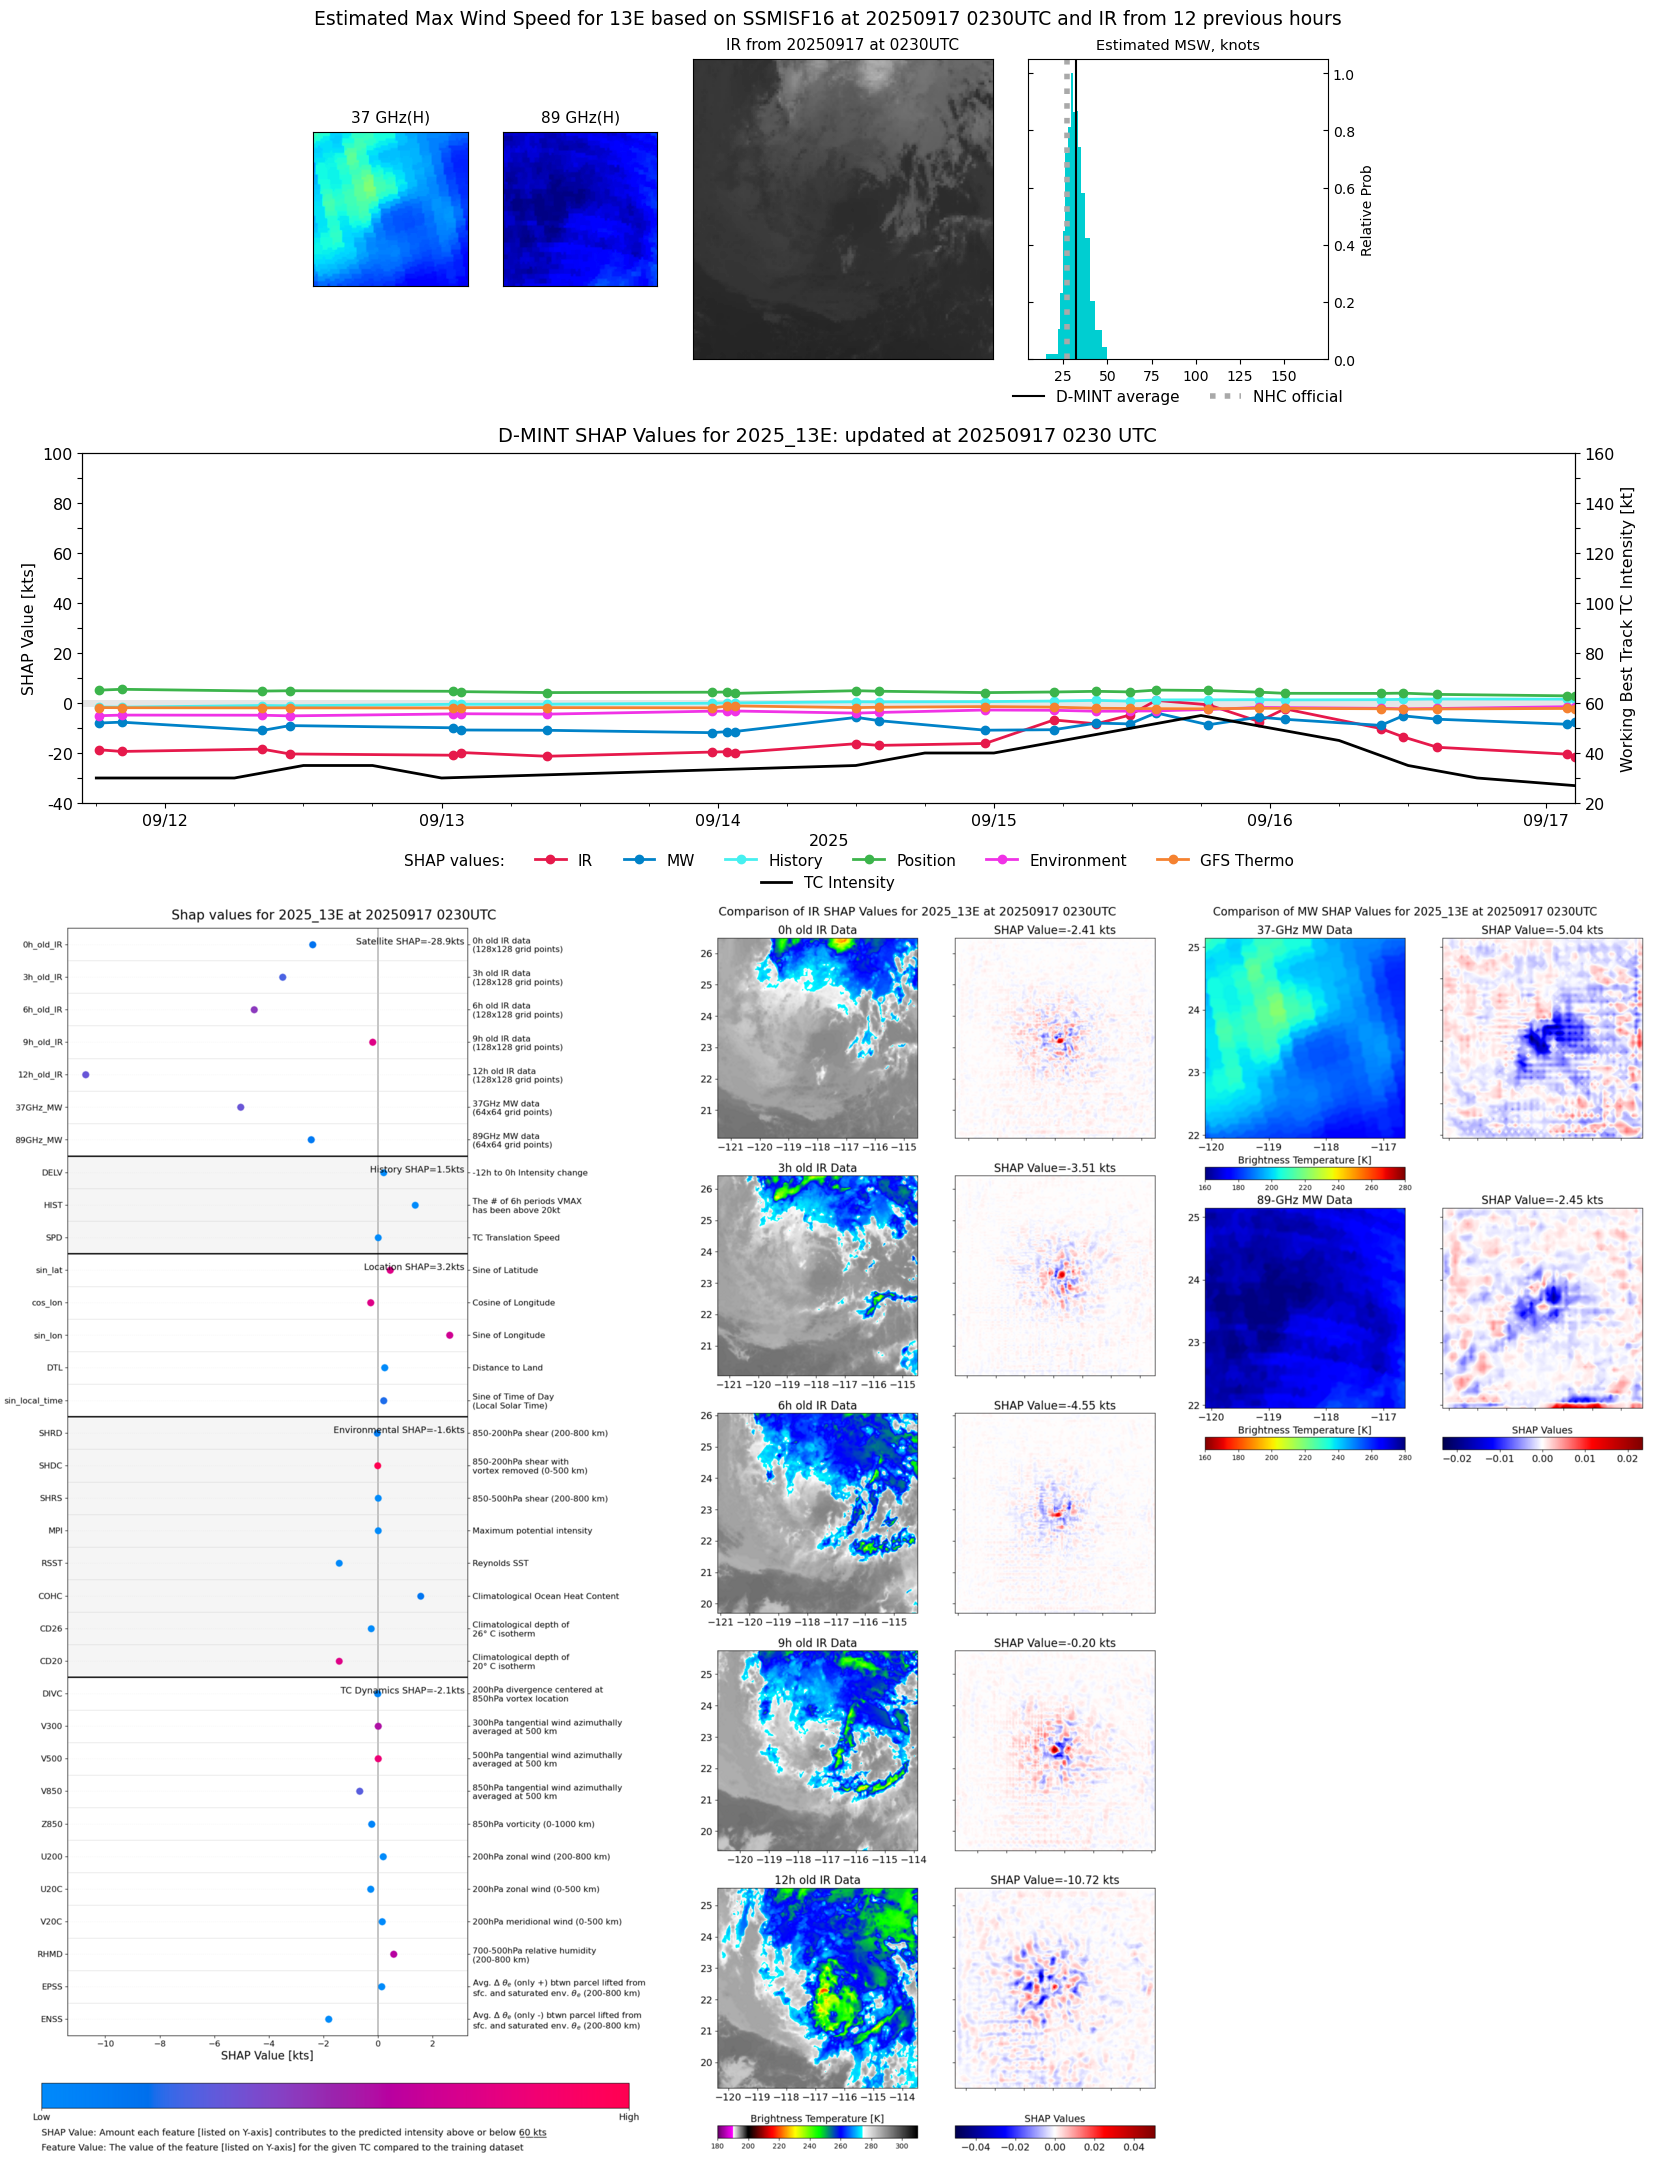 |
| 20250917 | 0148 UTC | SSMISF17 | 1004 hPa | 32 kts | 28 kts | 36 kts | 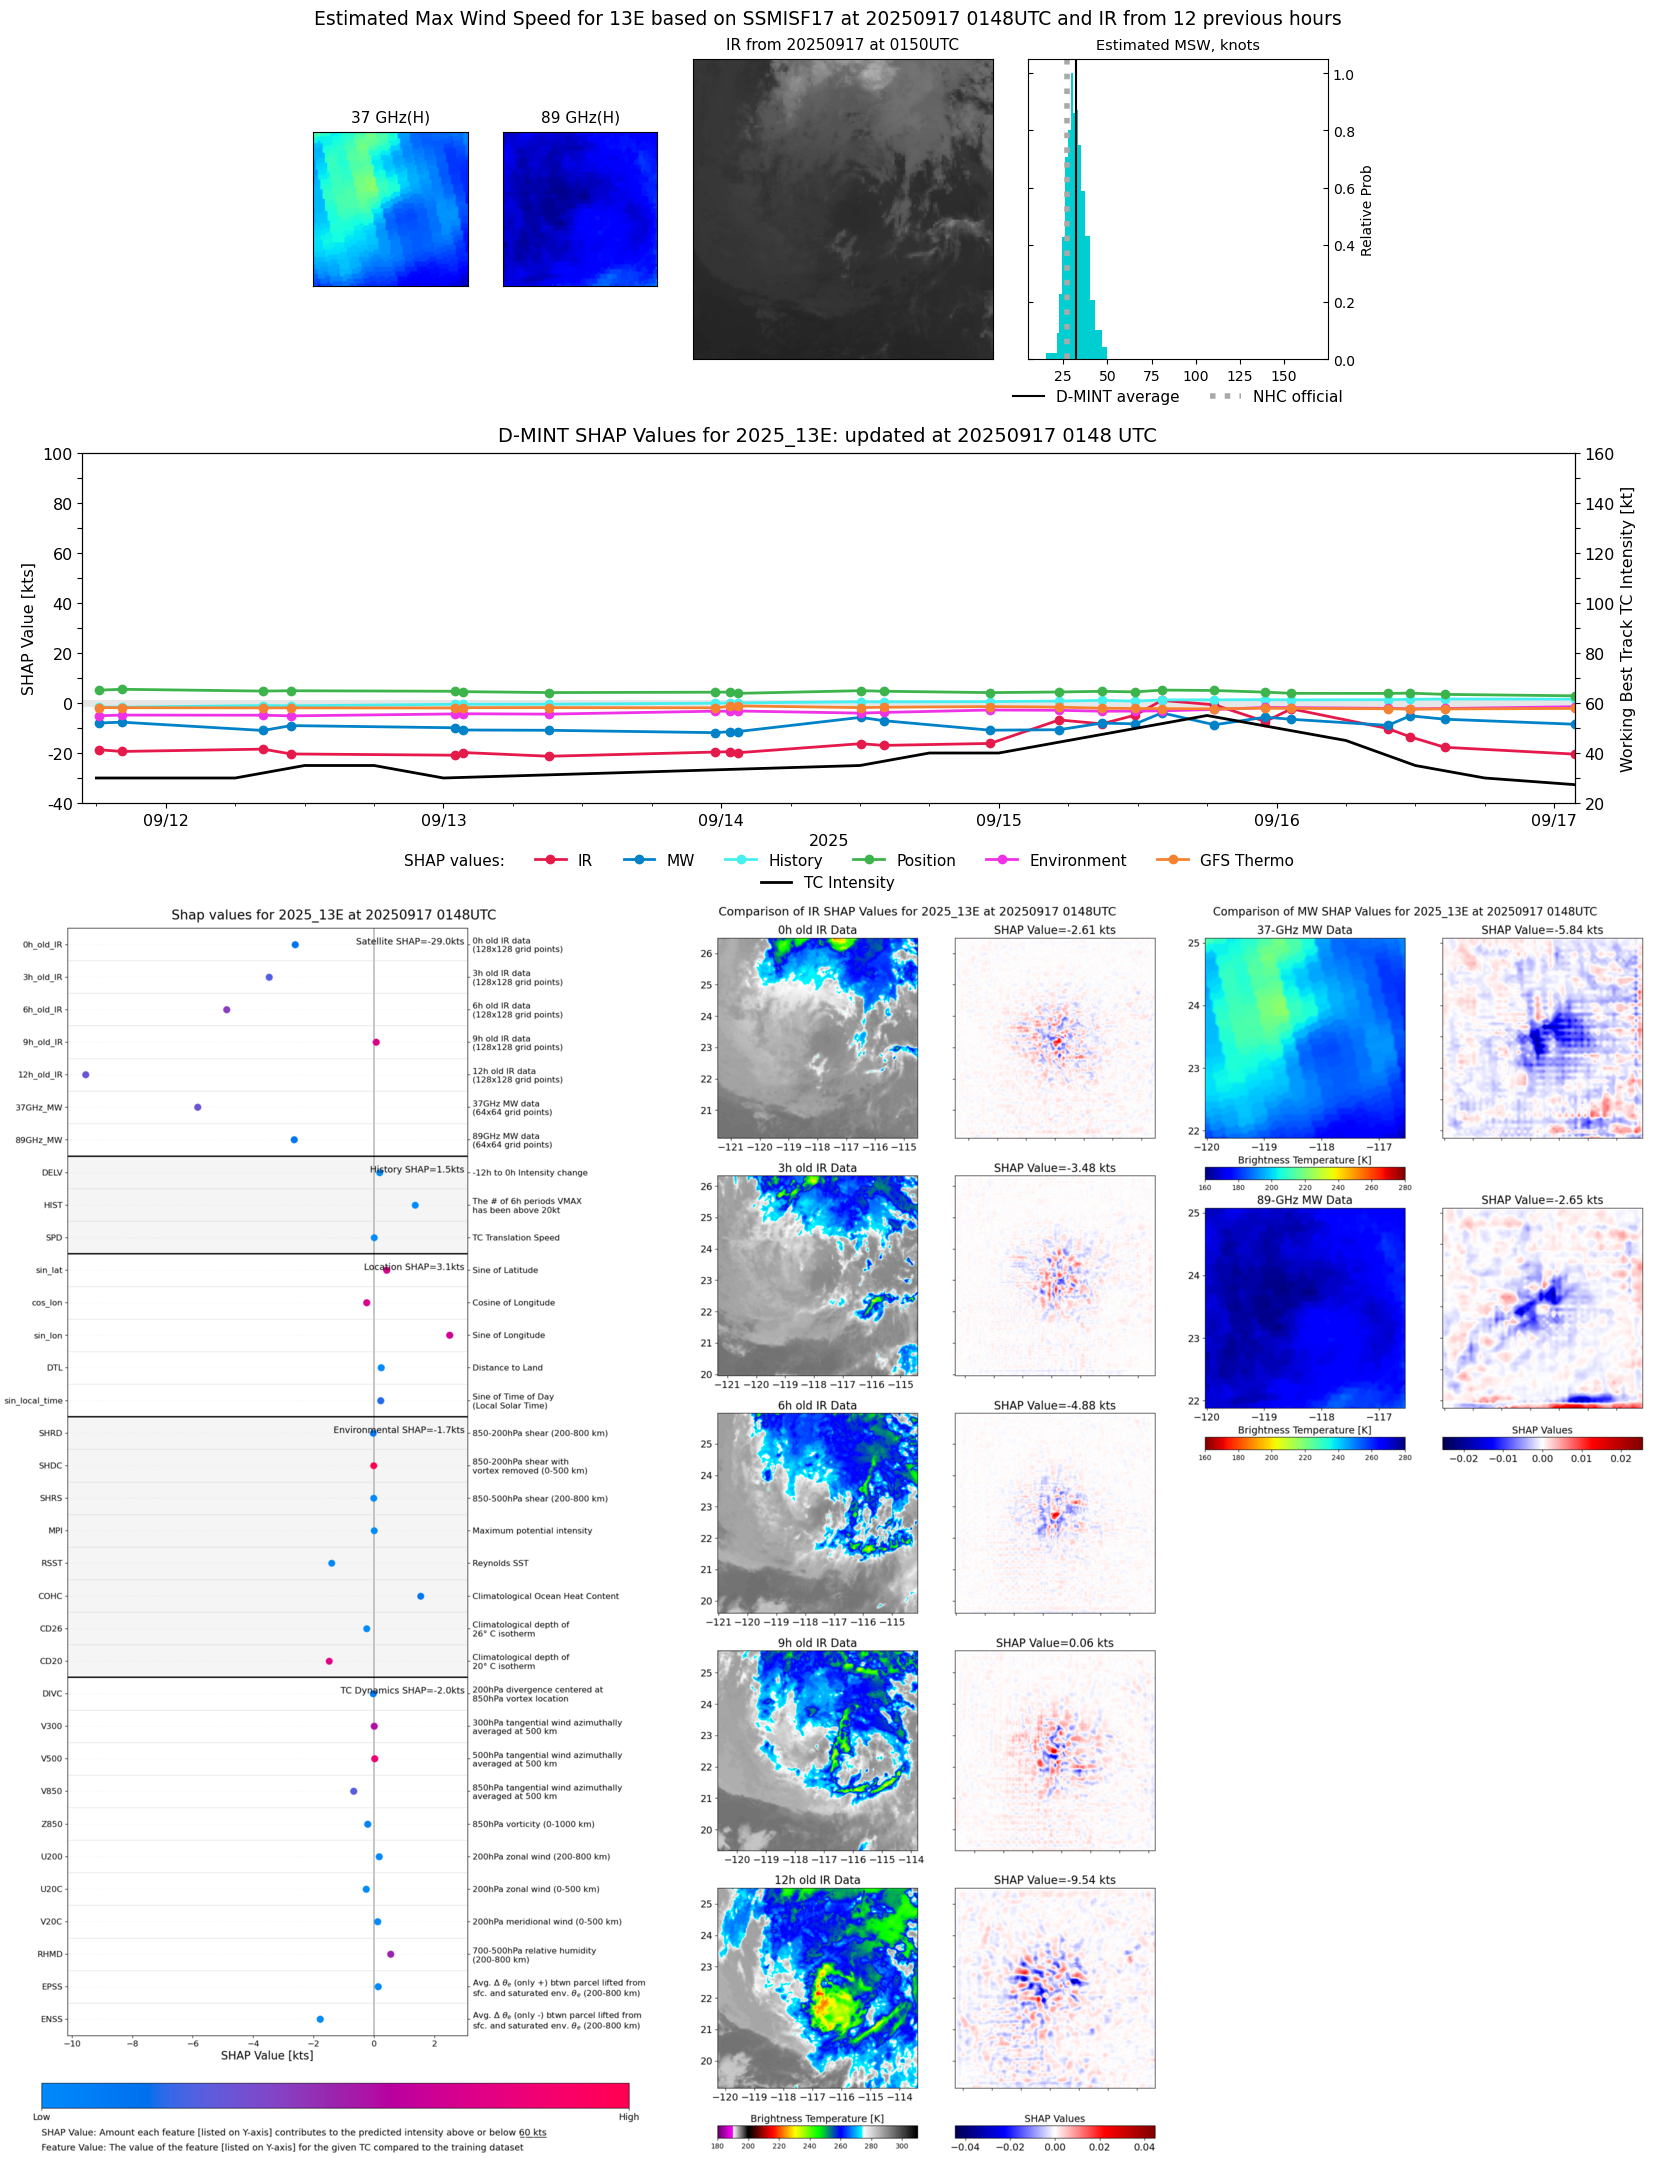 |
| 20250916 | 2059 UTC | ATMS-N20 | 1002 hPa | 34 kts | 30 kts | 38 kts | 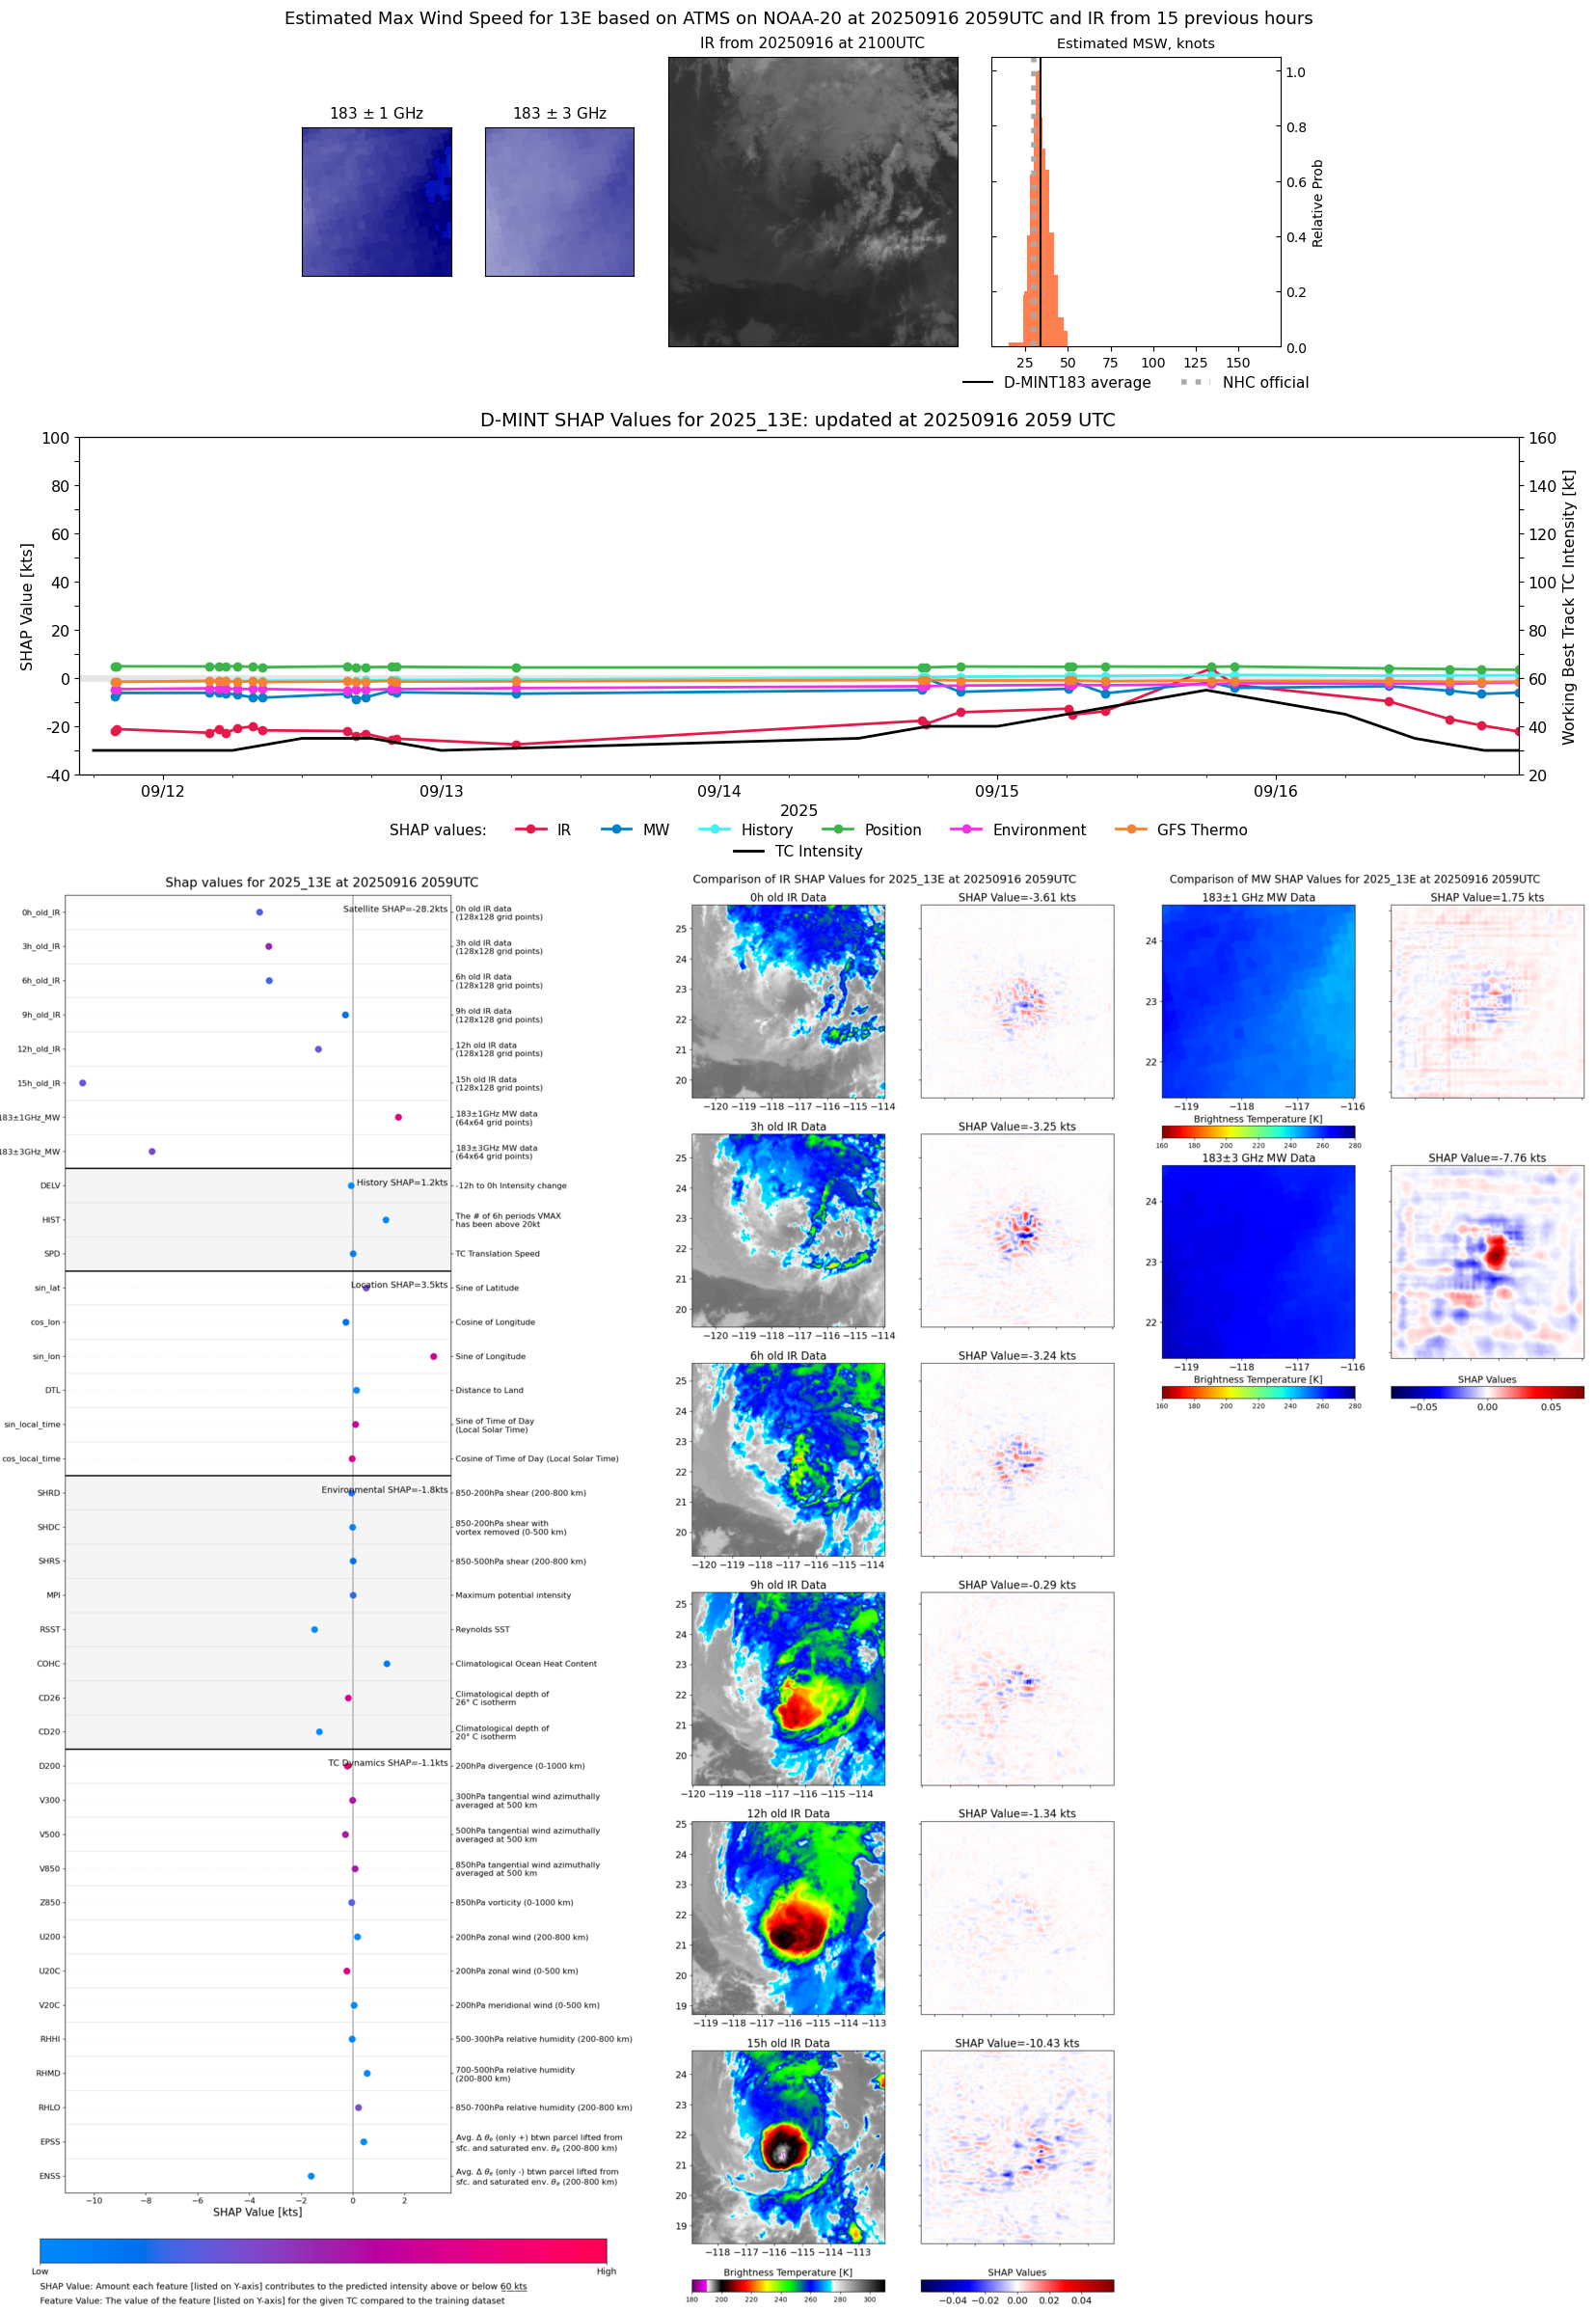 |
| 20250916 | 1744 UTC | TMS06 | 1002 hPa | 35 kts | 32 kts | 39 kts | 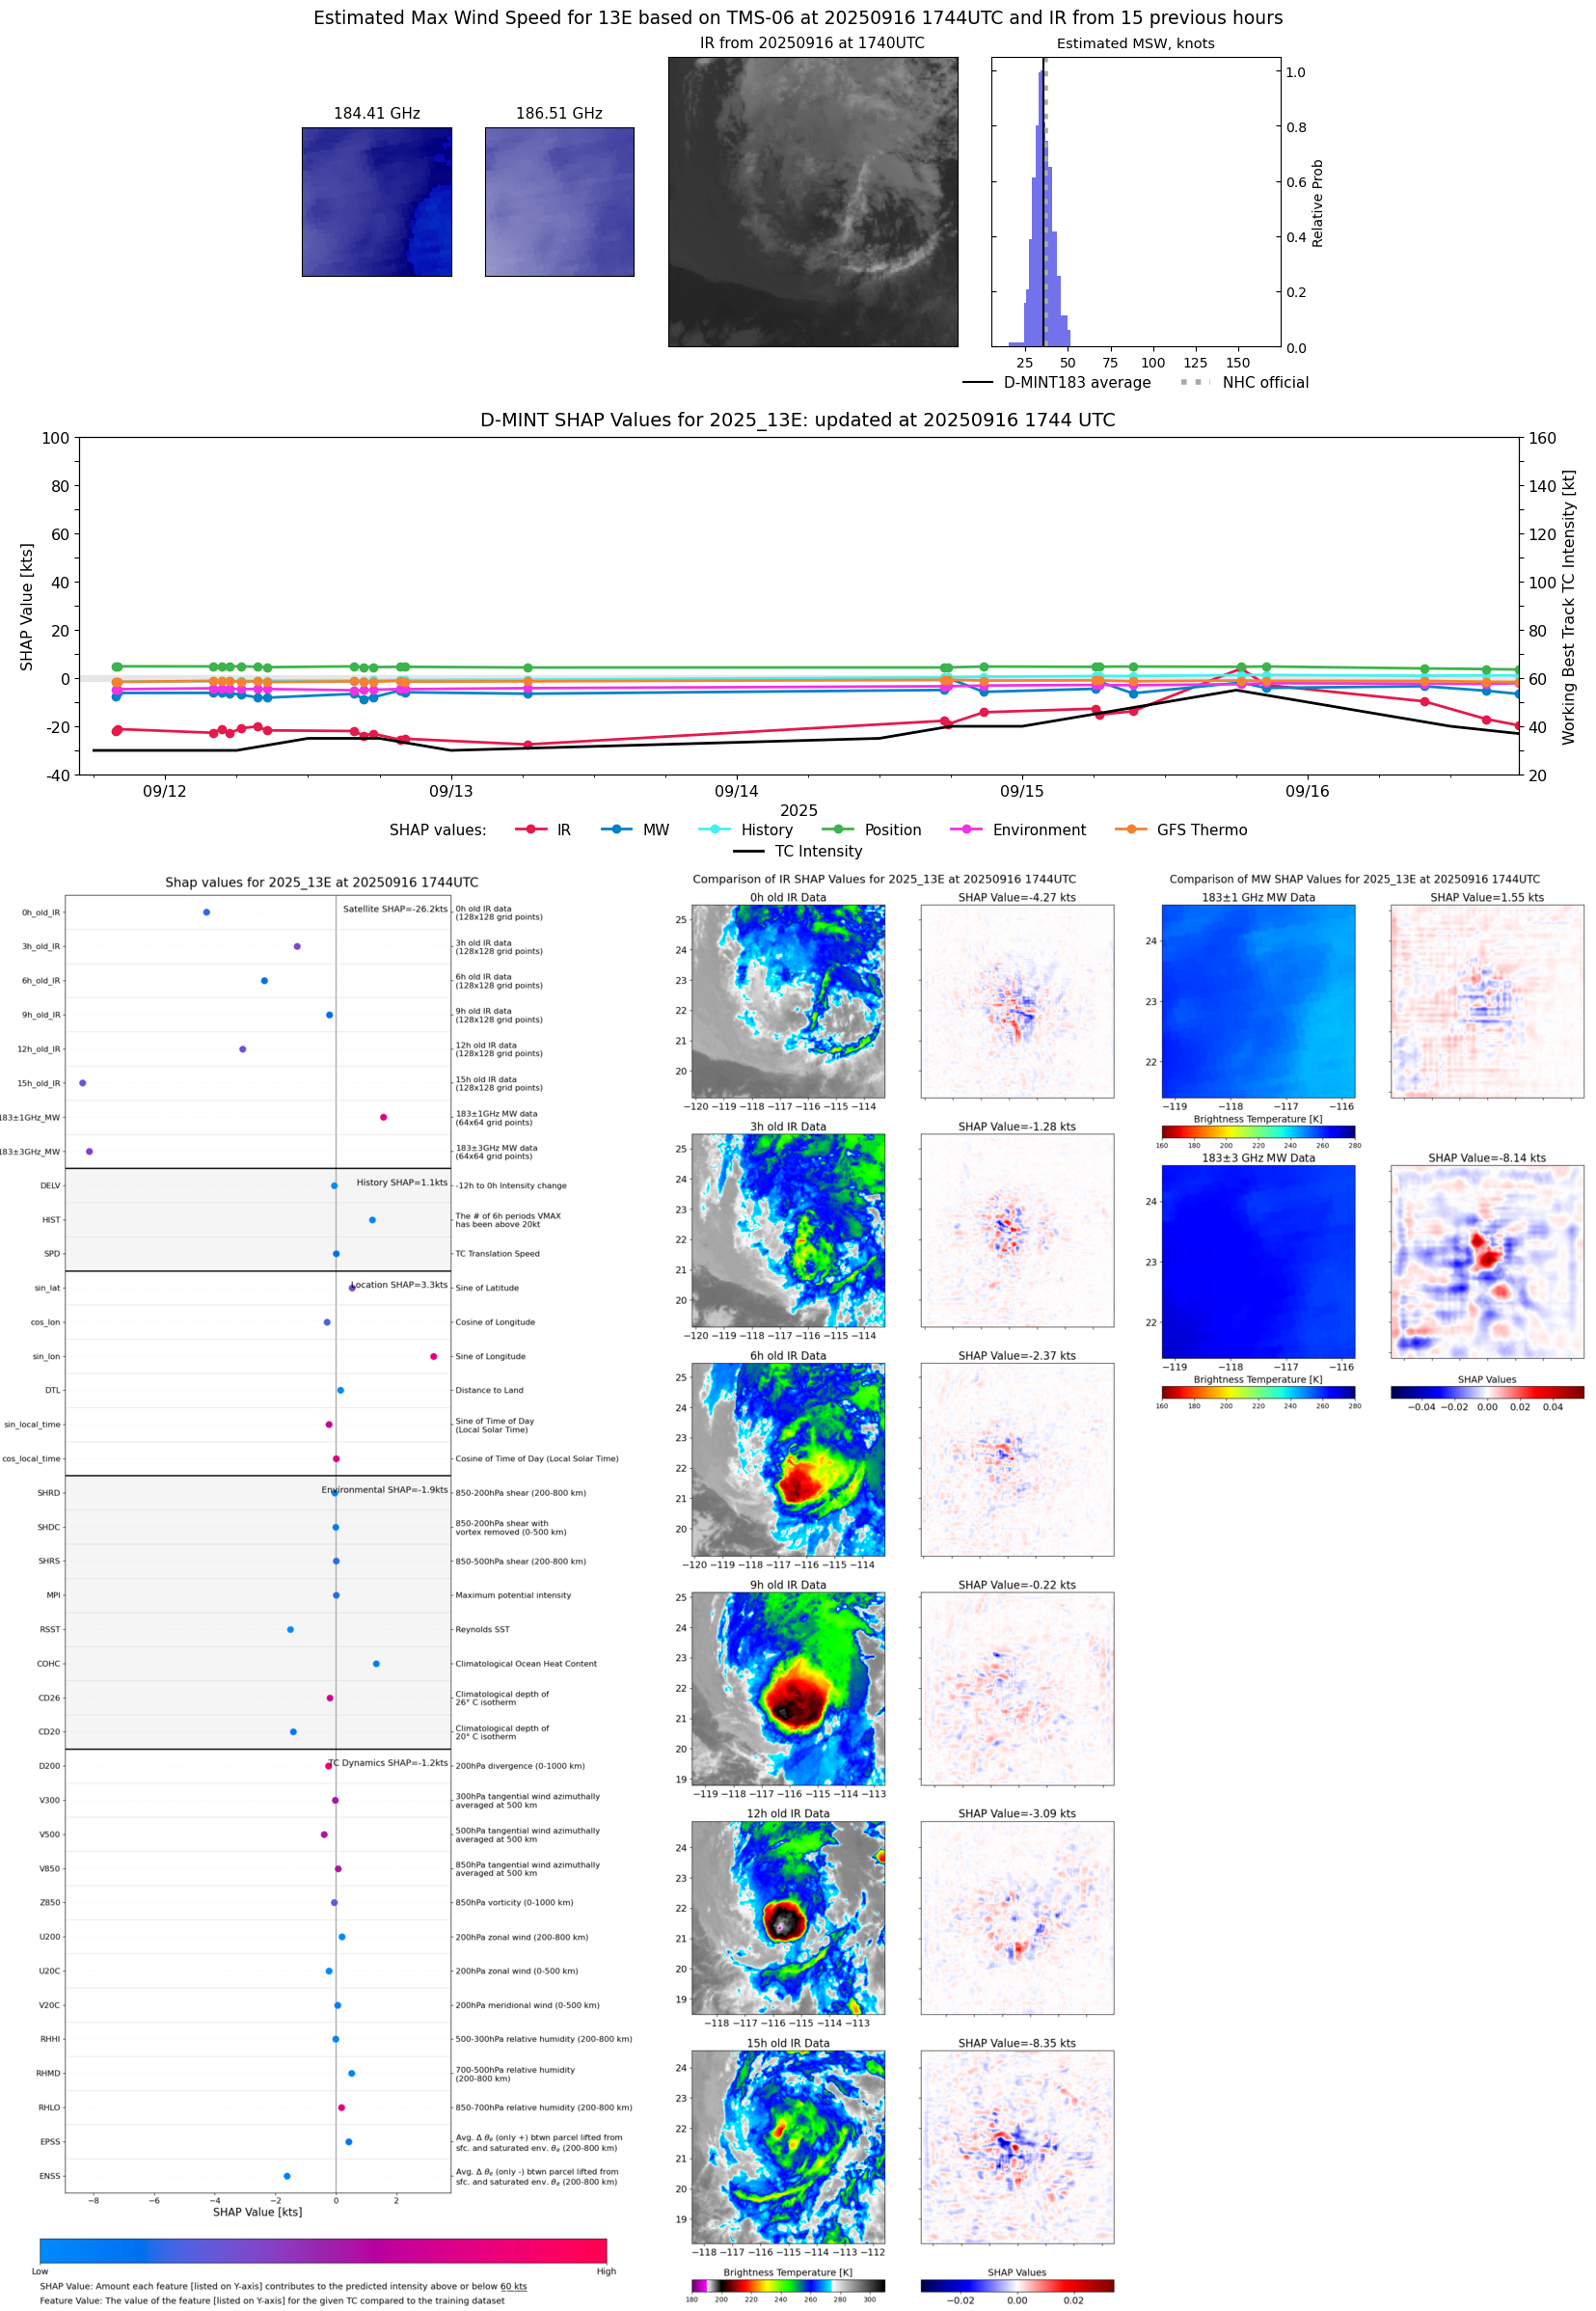 |
| 20250916 | 1459 UTC | TMS07 | 1000 hPa | 39 kts | 35 kts | 44 kts | 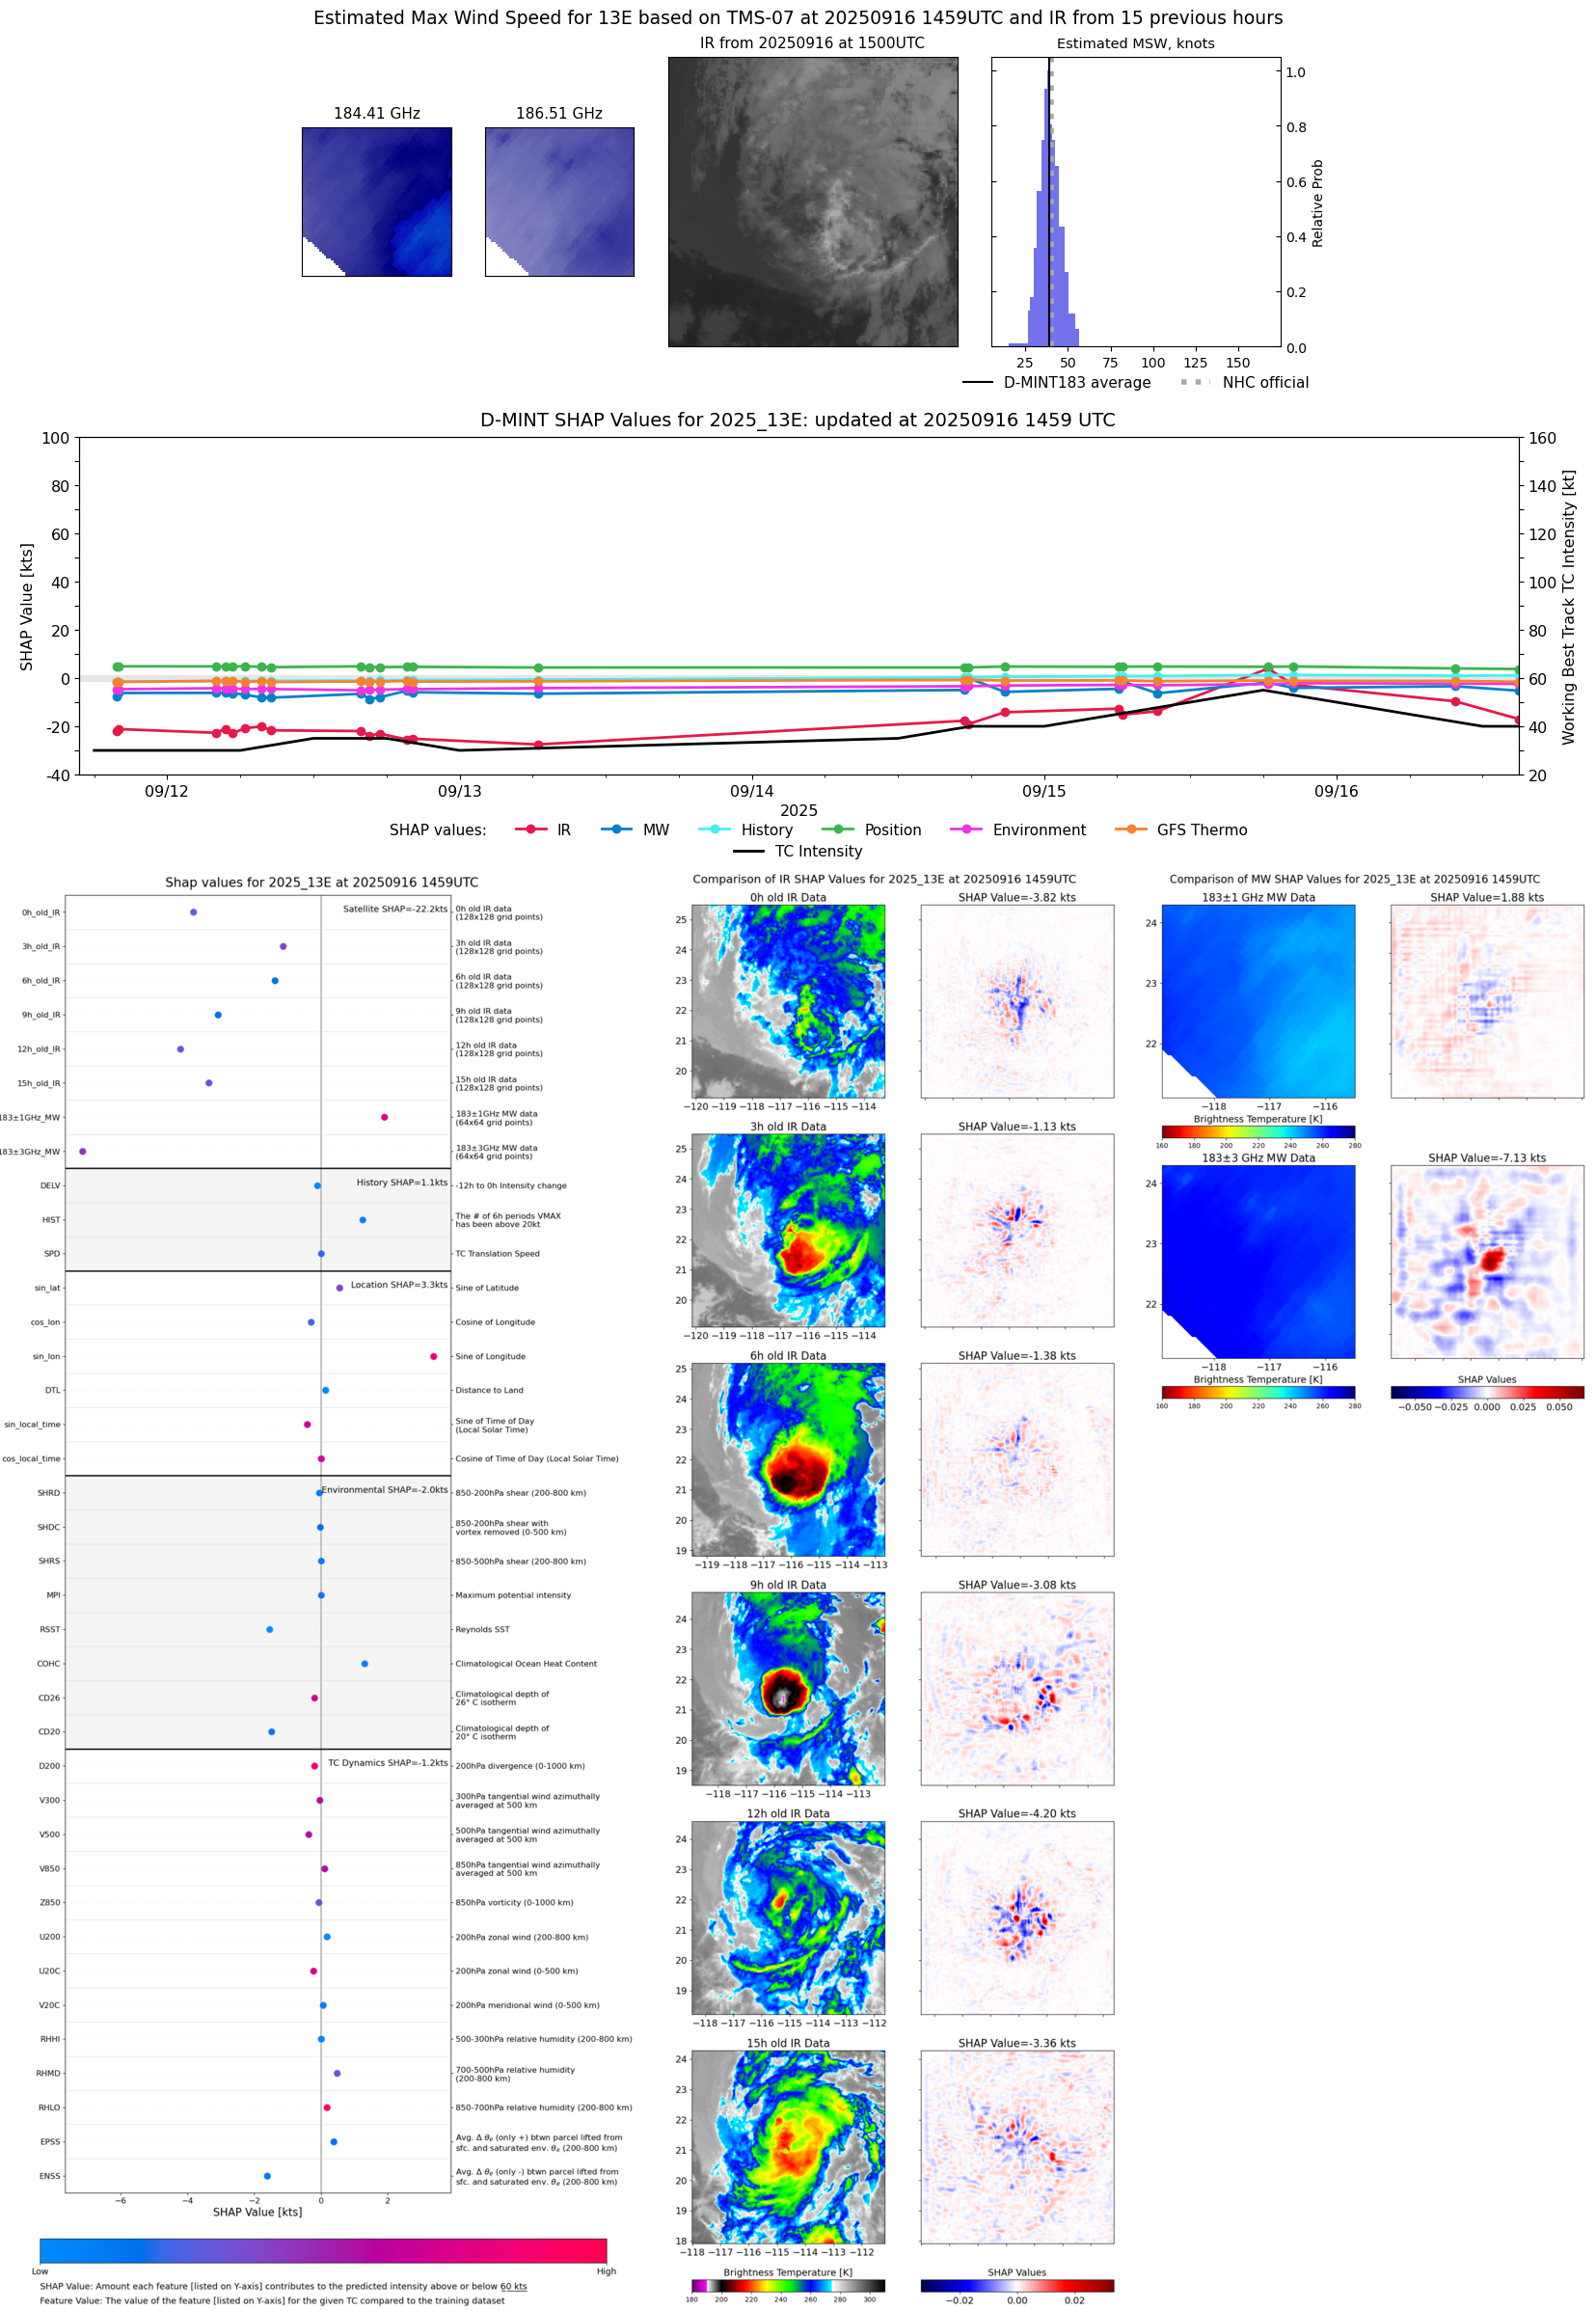 |
| 20250916 | 1433 UTC | SSMISF17 | 1003 hPa | 36 kts | 32 kts | 41 kts | 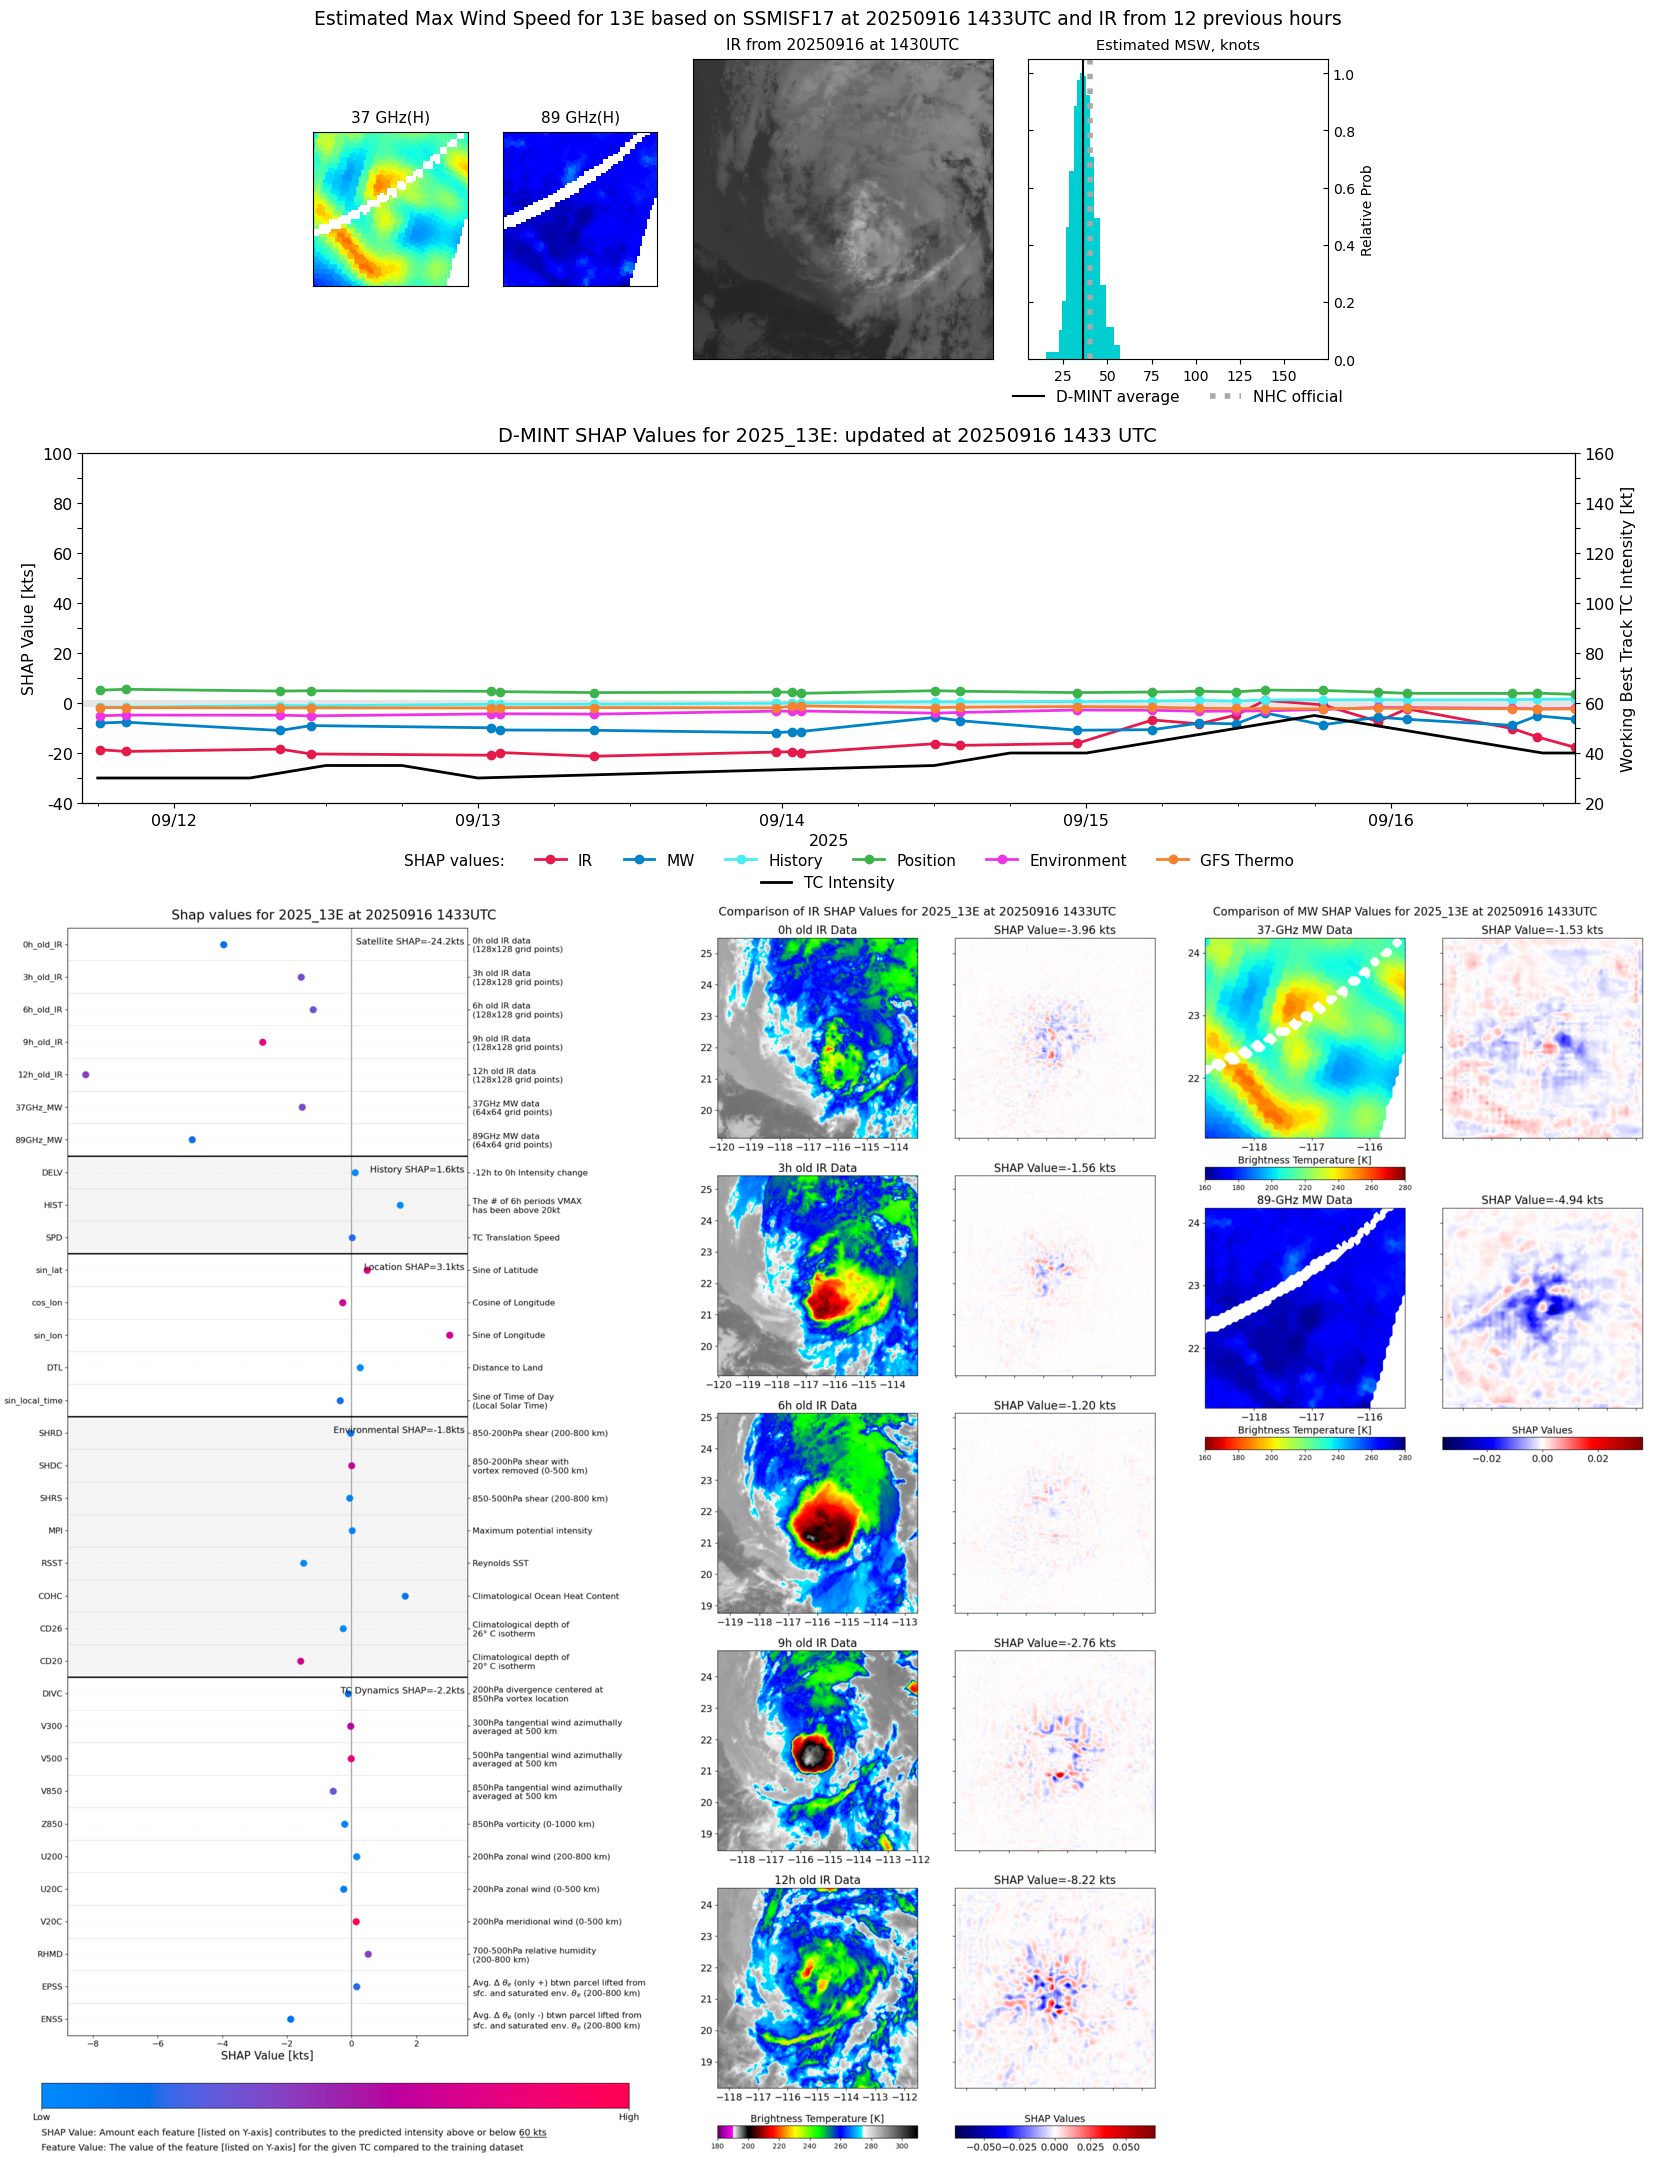 |
| 20250916 | 1345 UTC | WSFM01 | 1004 hPa | 39 kts | 34 kts | 44 kts | 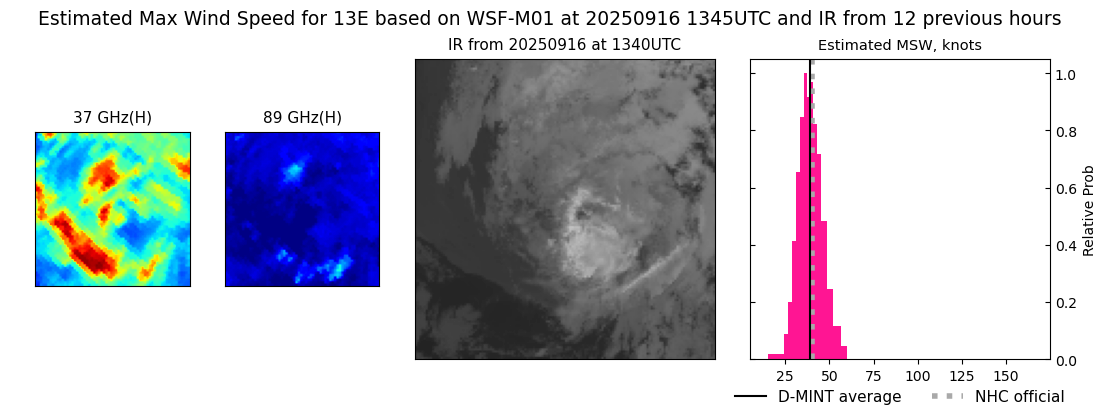 |
| 20250916 | 1134 UTC | SSMISF18 | 1000 hPa | 42 kts | 37 kts | 47 kts | 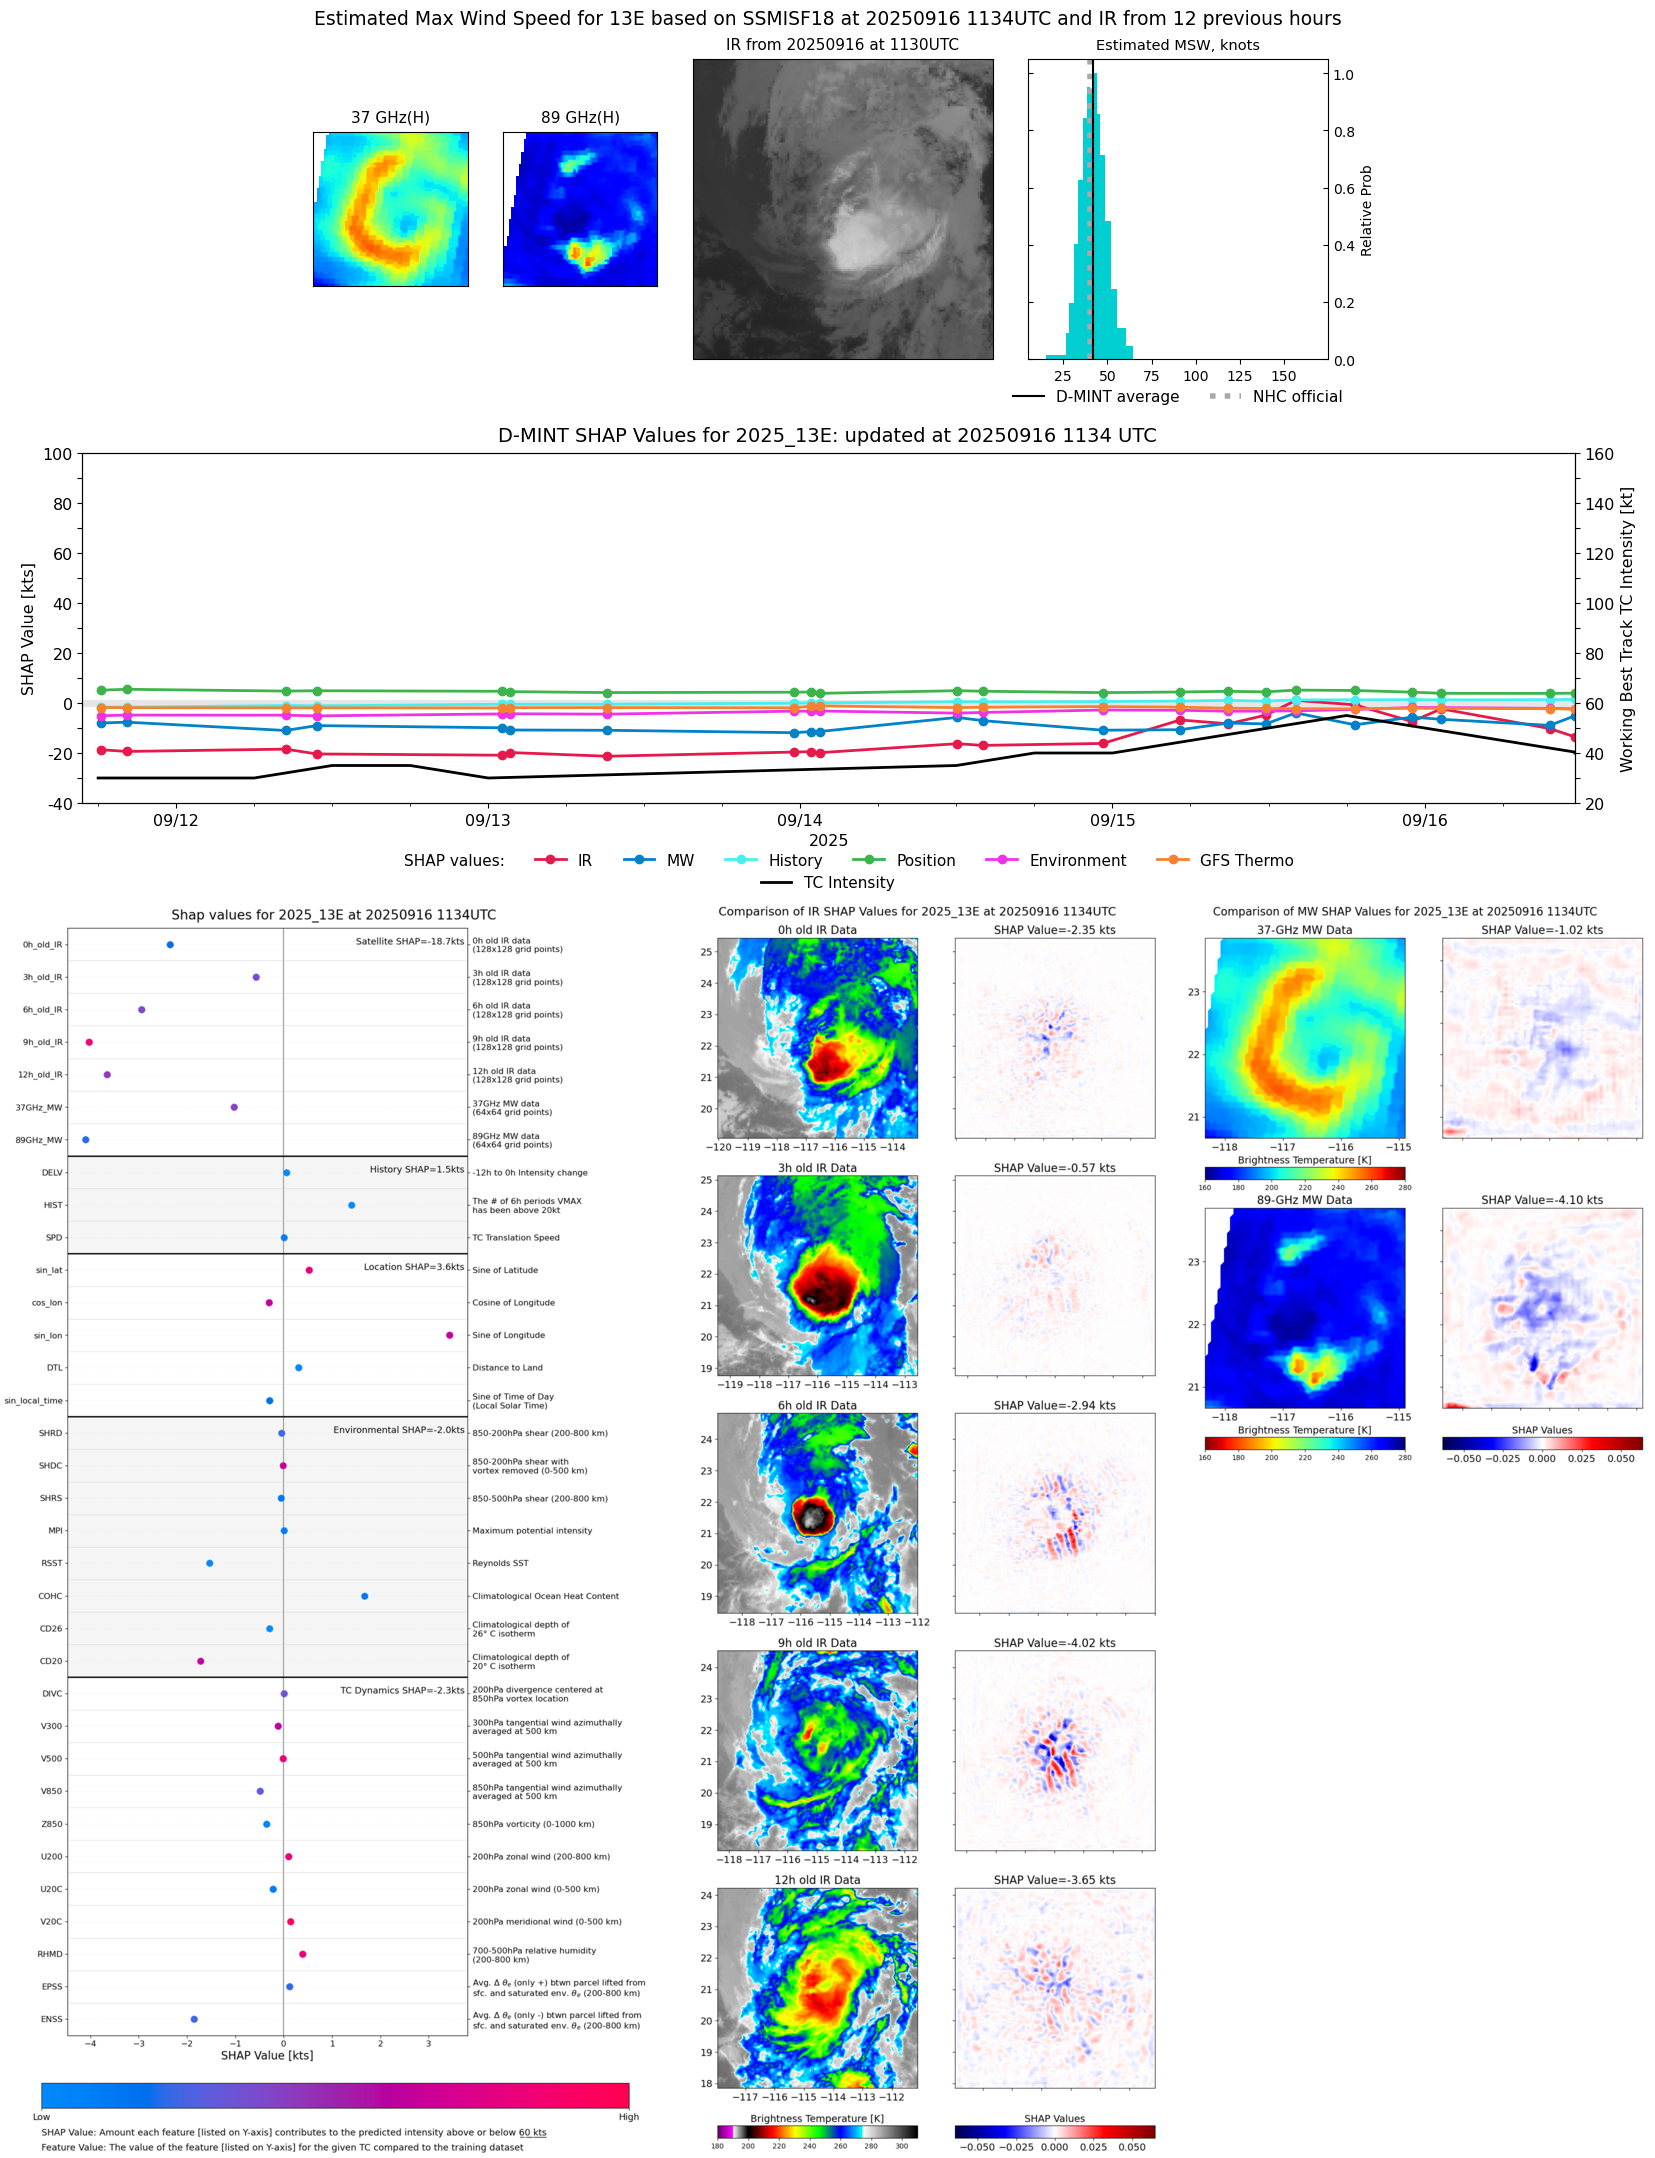 |
| 20250916 | 0946 UTC | ATMS-N20 | 999 hPa | 49 kts | 44 kts | 54 kts | 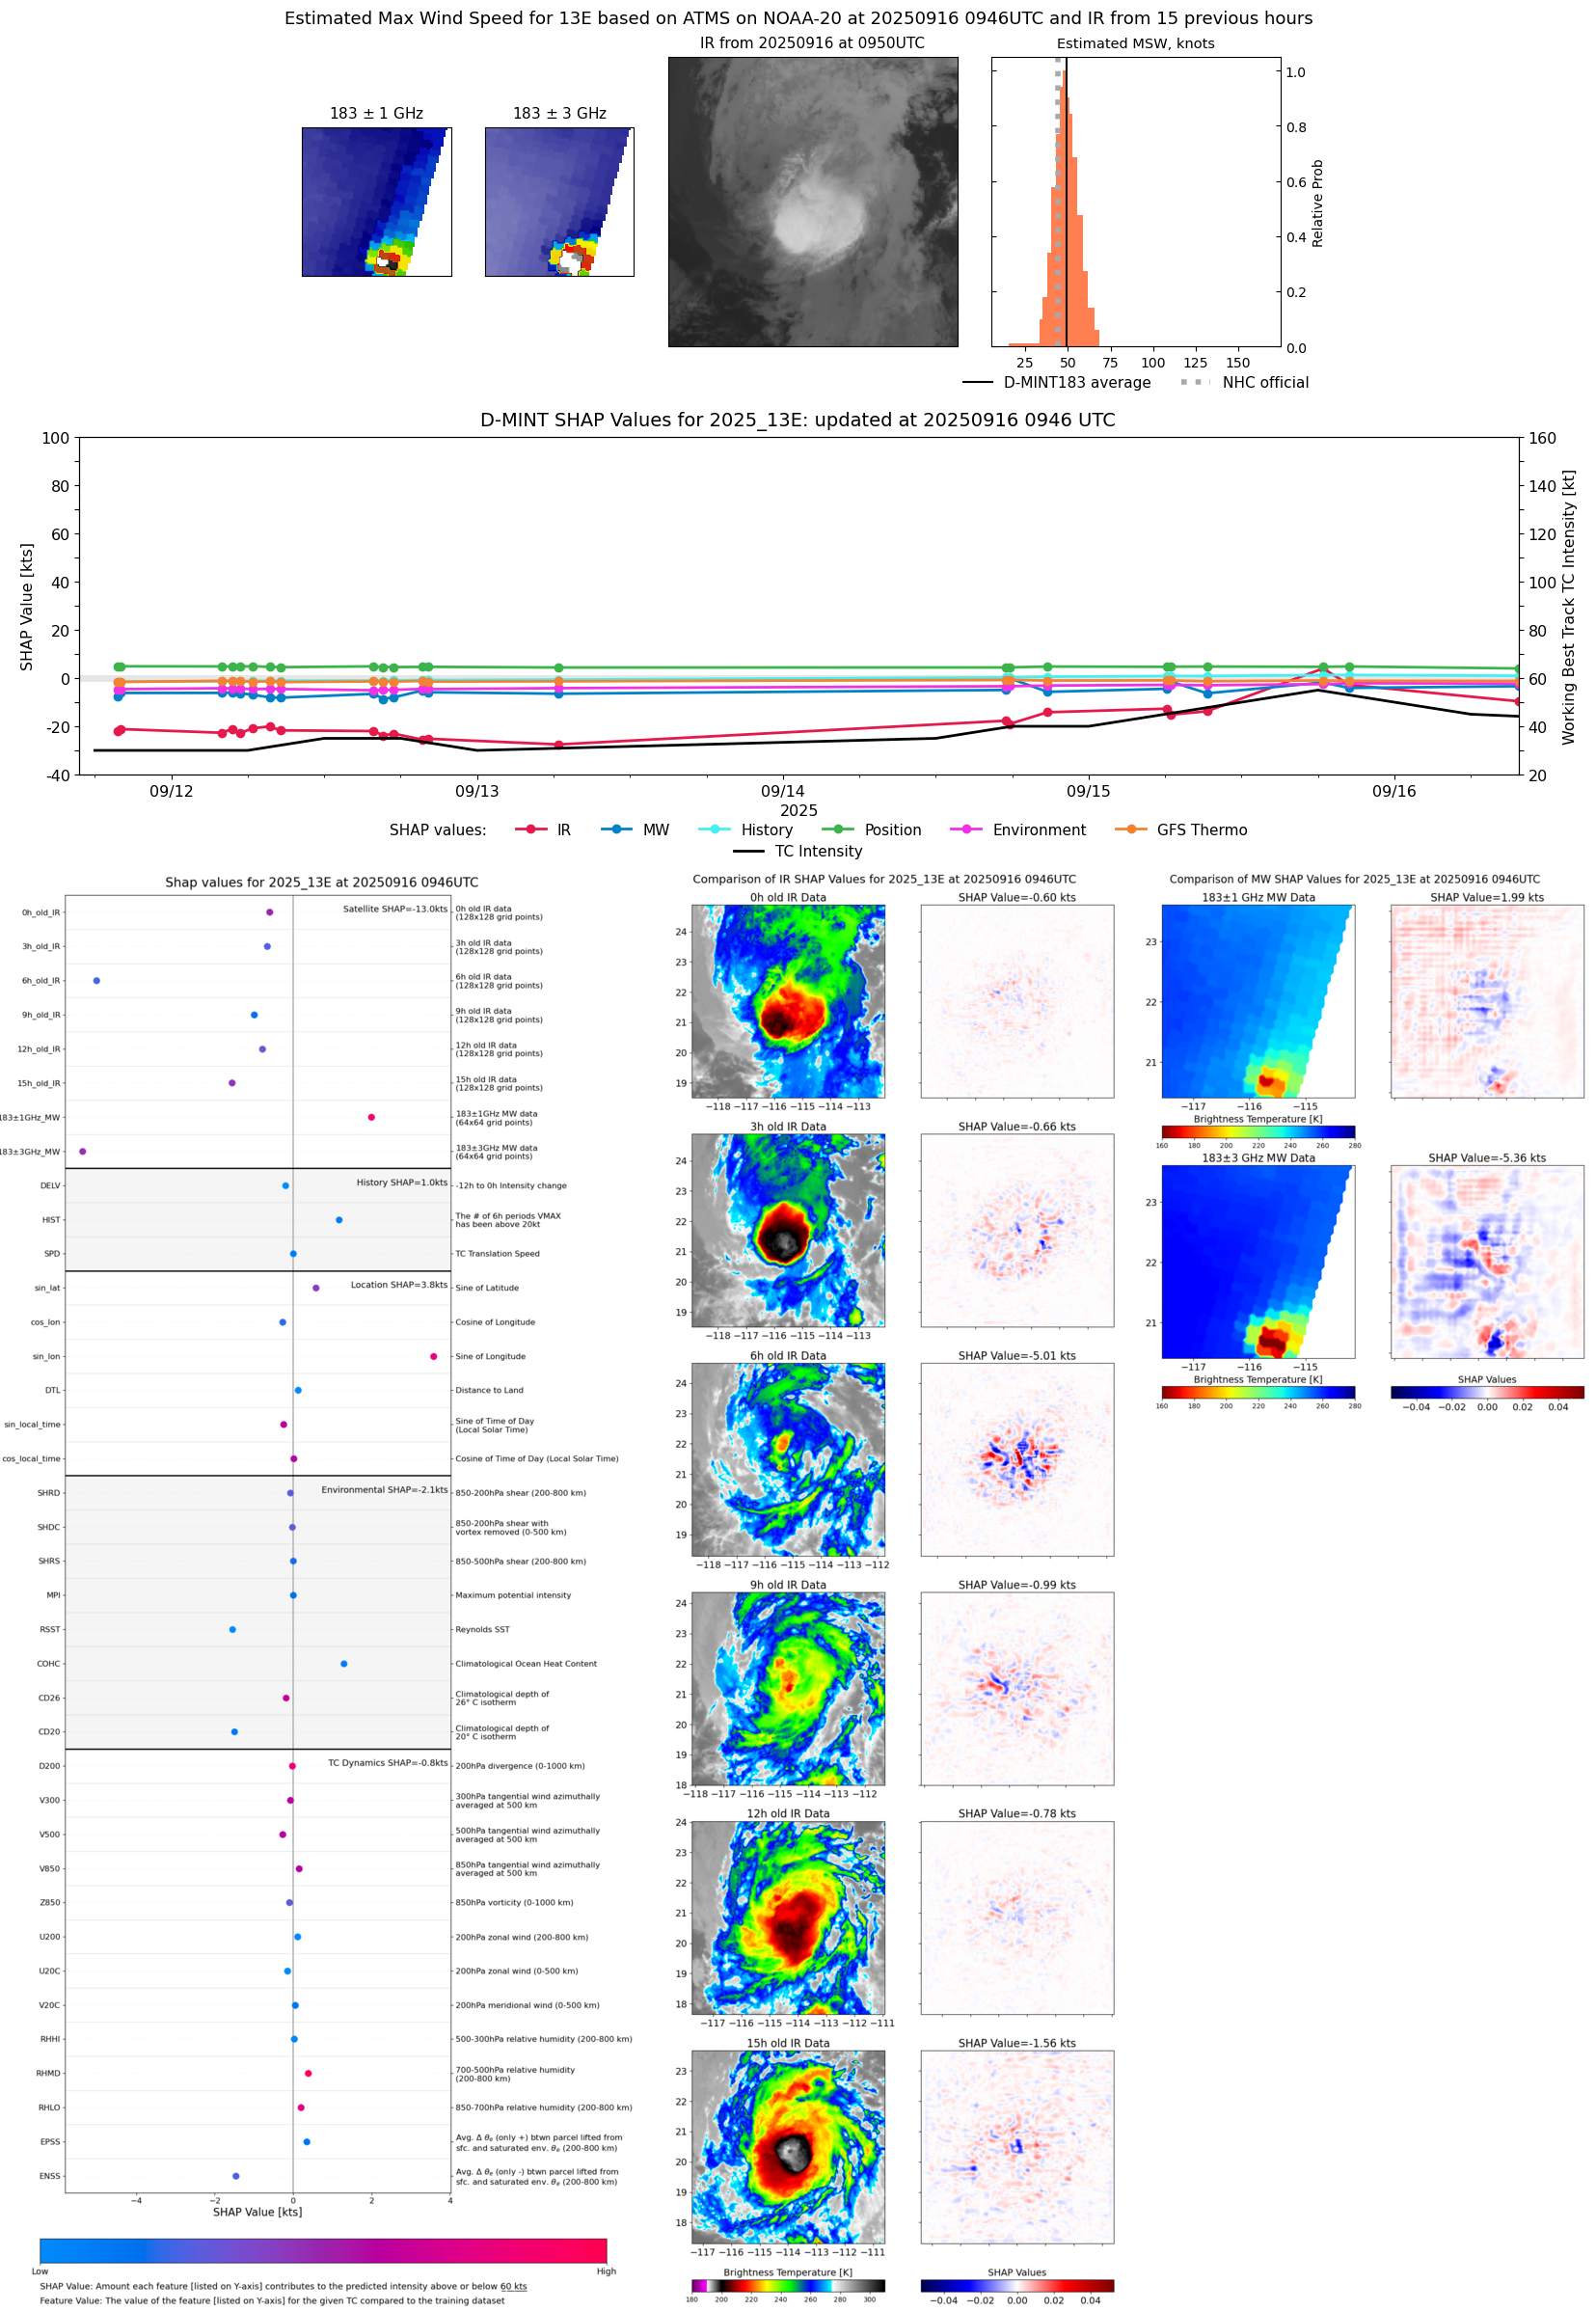 |
| 20250916 | 0937 UTC | AMSR2 | 998 hPa | 42 kts | 37 kts | 47 kts | 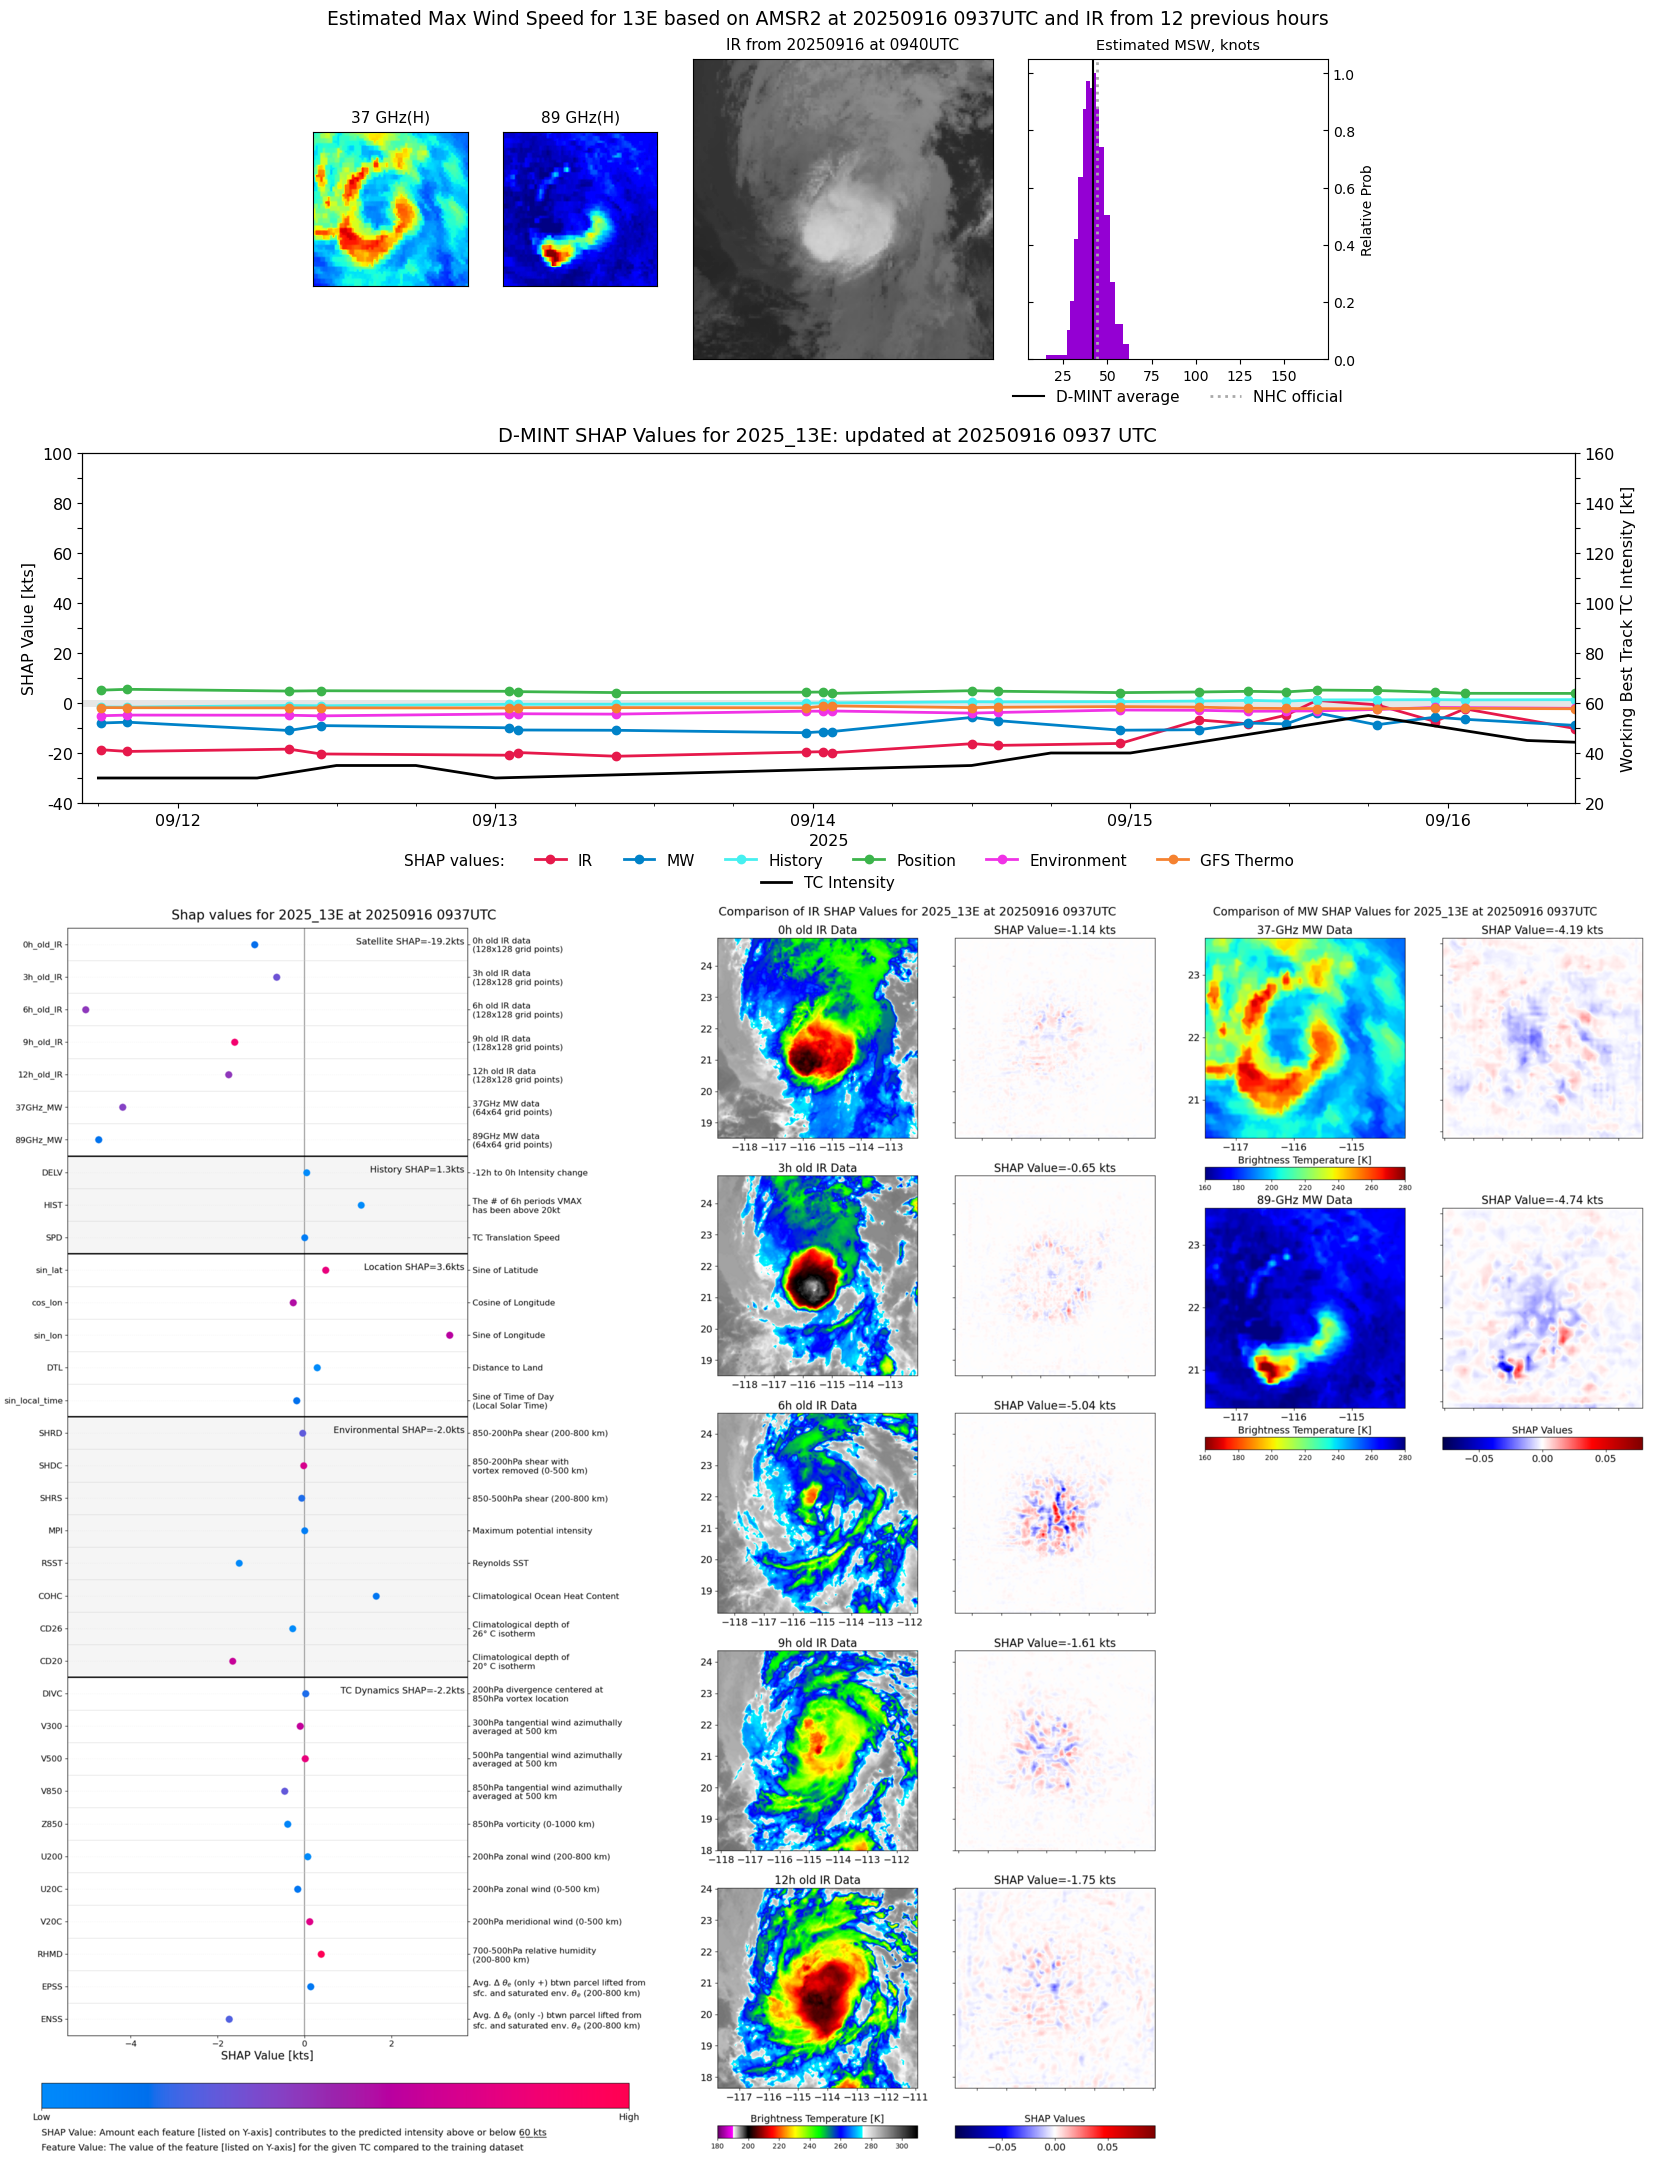 |
| 20250916 | 0117 UTC | WSFM01 | 992 hPa | 53 kts | 47 kts | 59 kts | 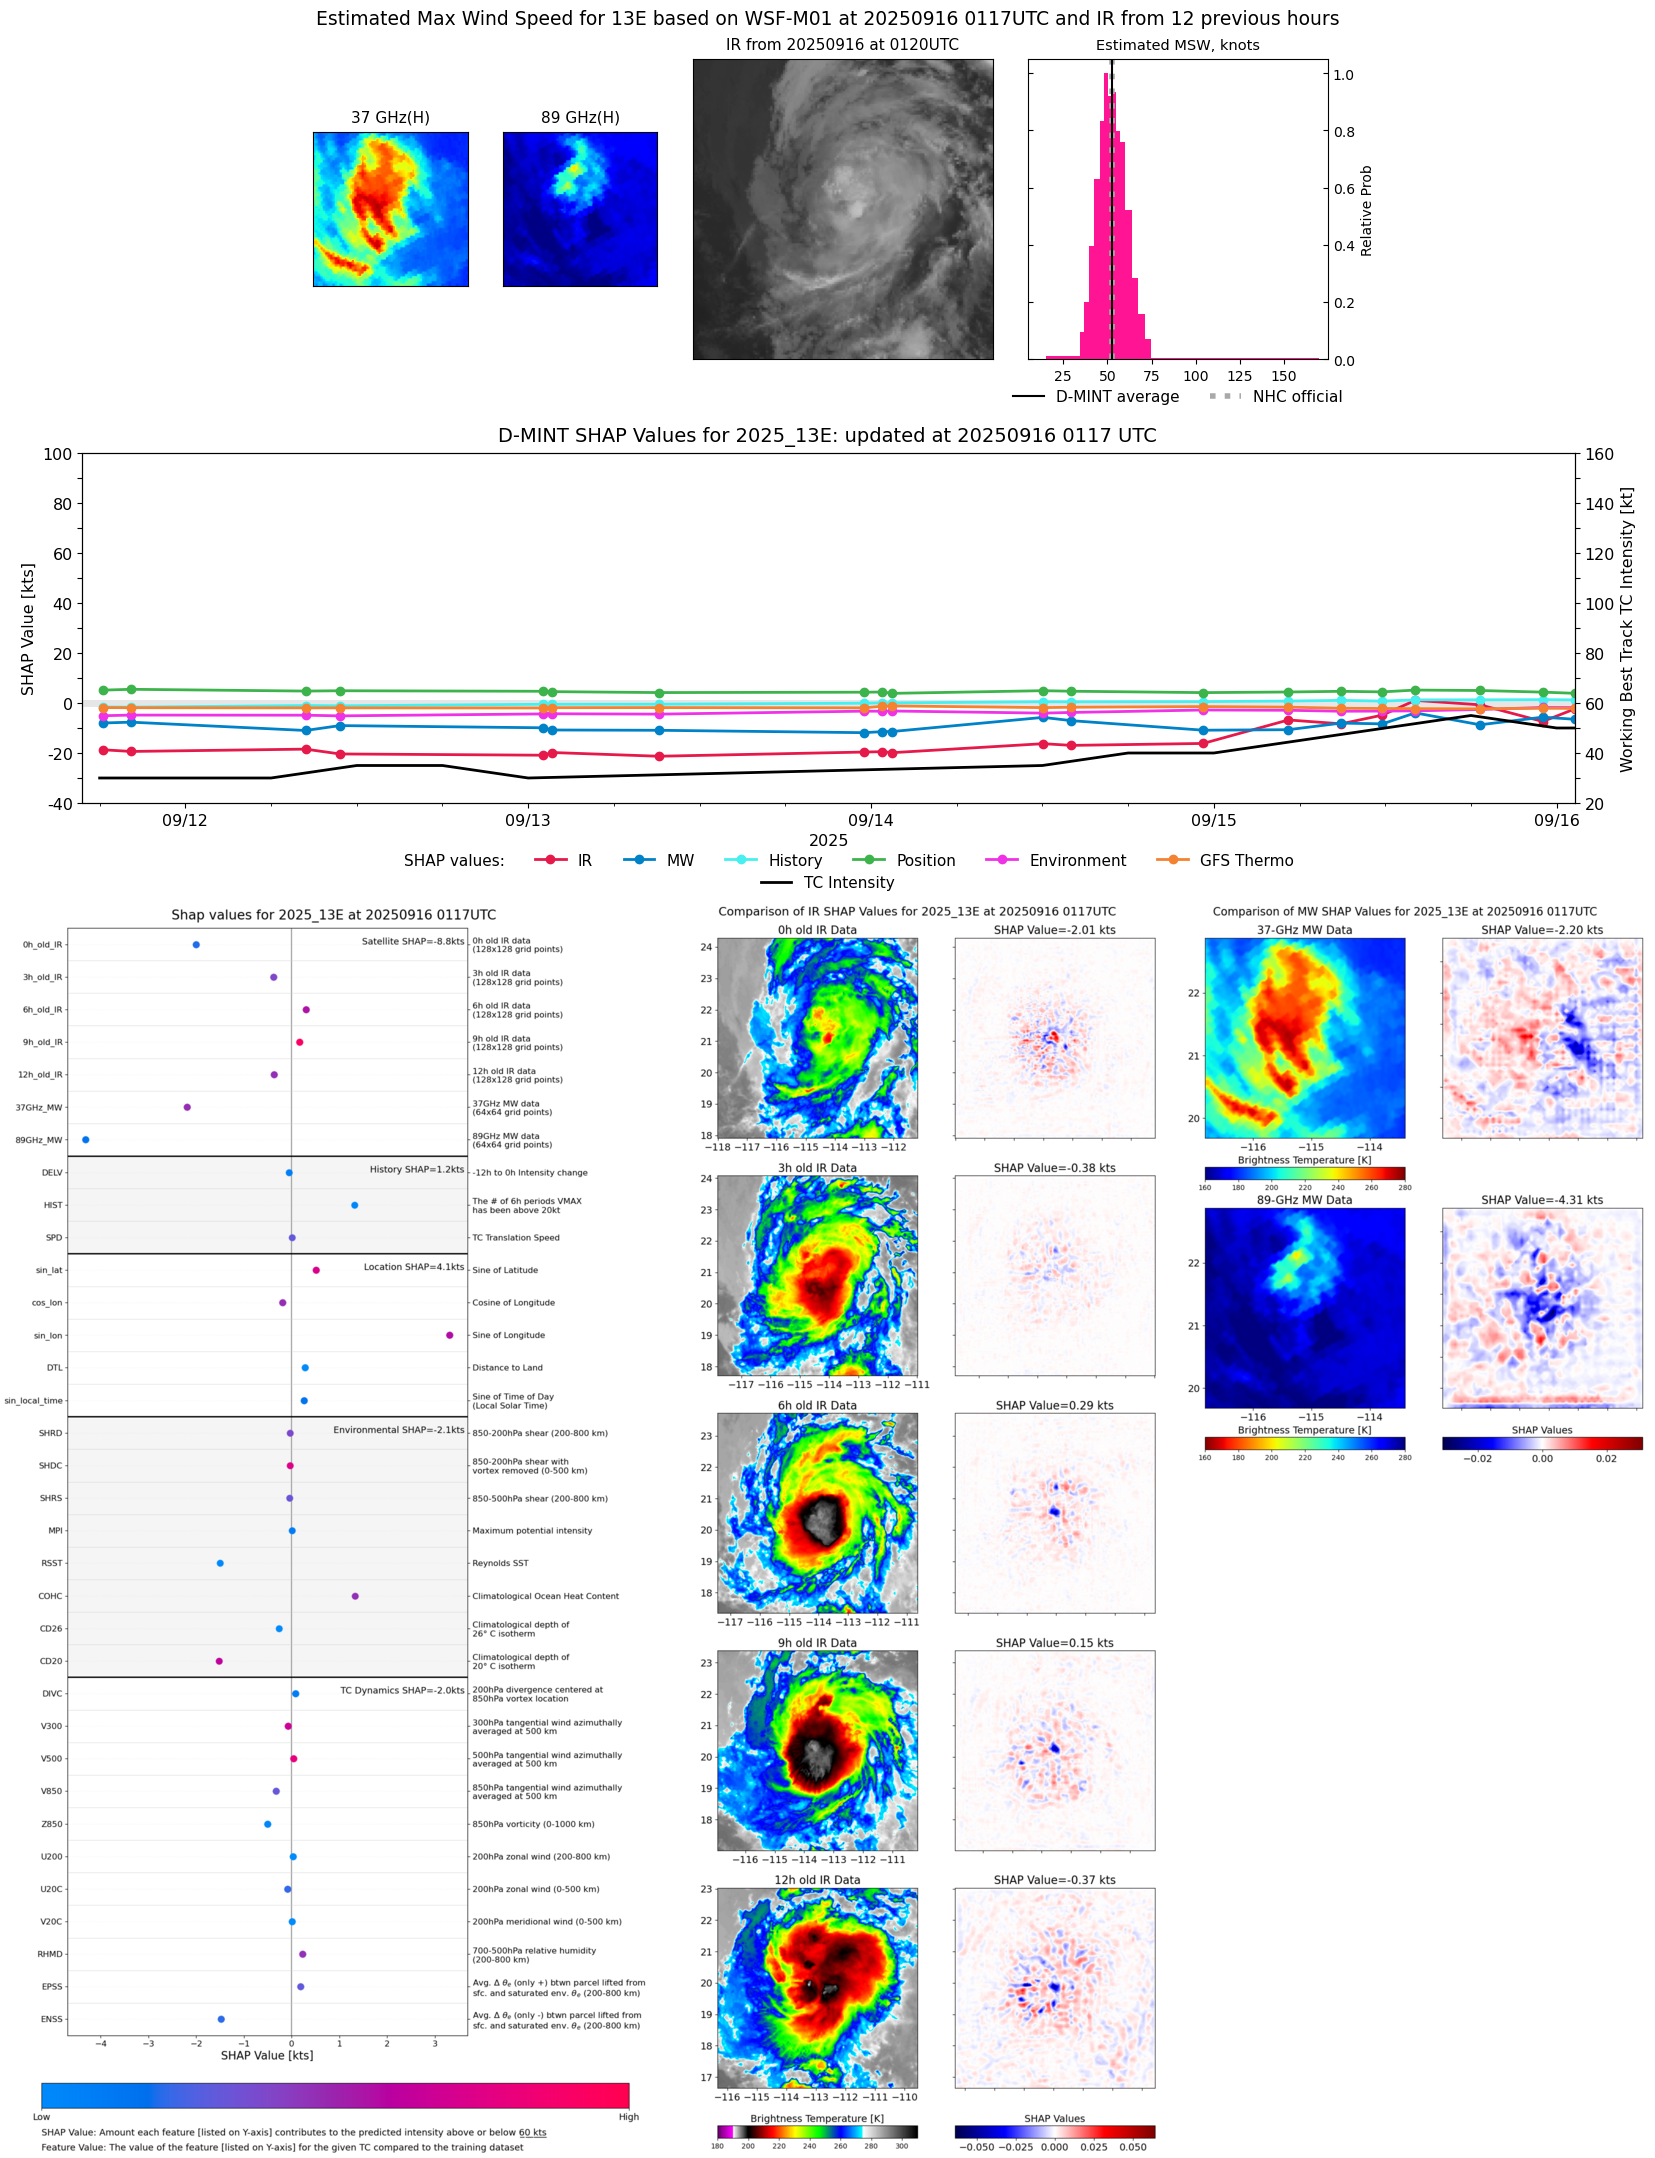 |
| 20250915 | 2302 UTC | SSMISF18 | 997 hPa | 49 kts | 43 kts | 55 kts |  |
| 20250915 | 2028 UTC | ATMS-N21 | 992 hPa | 57 kts | 50 kts | 64 kts | 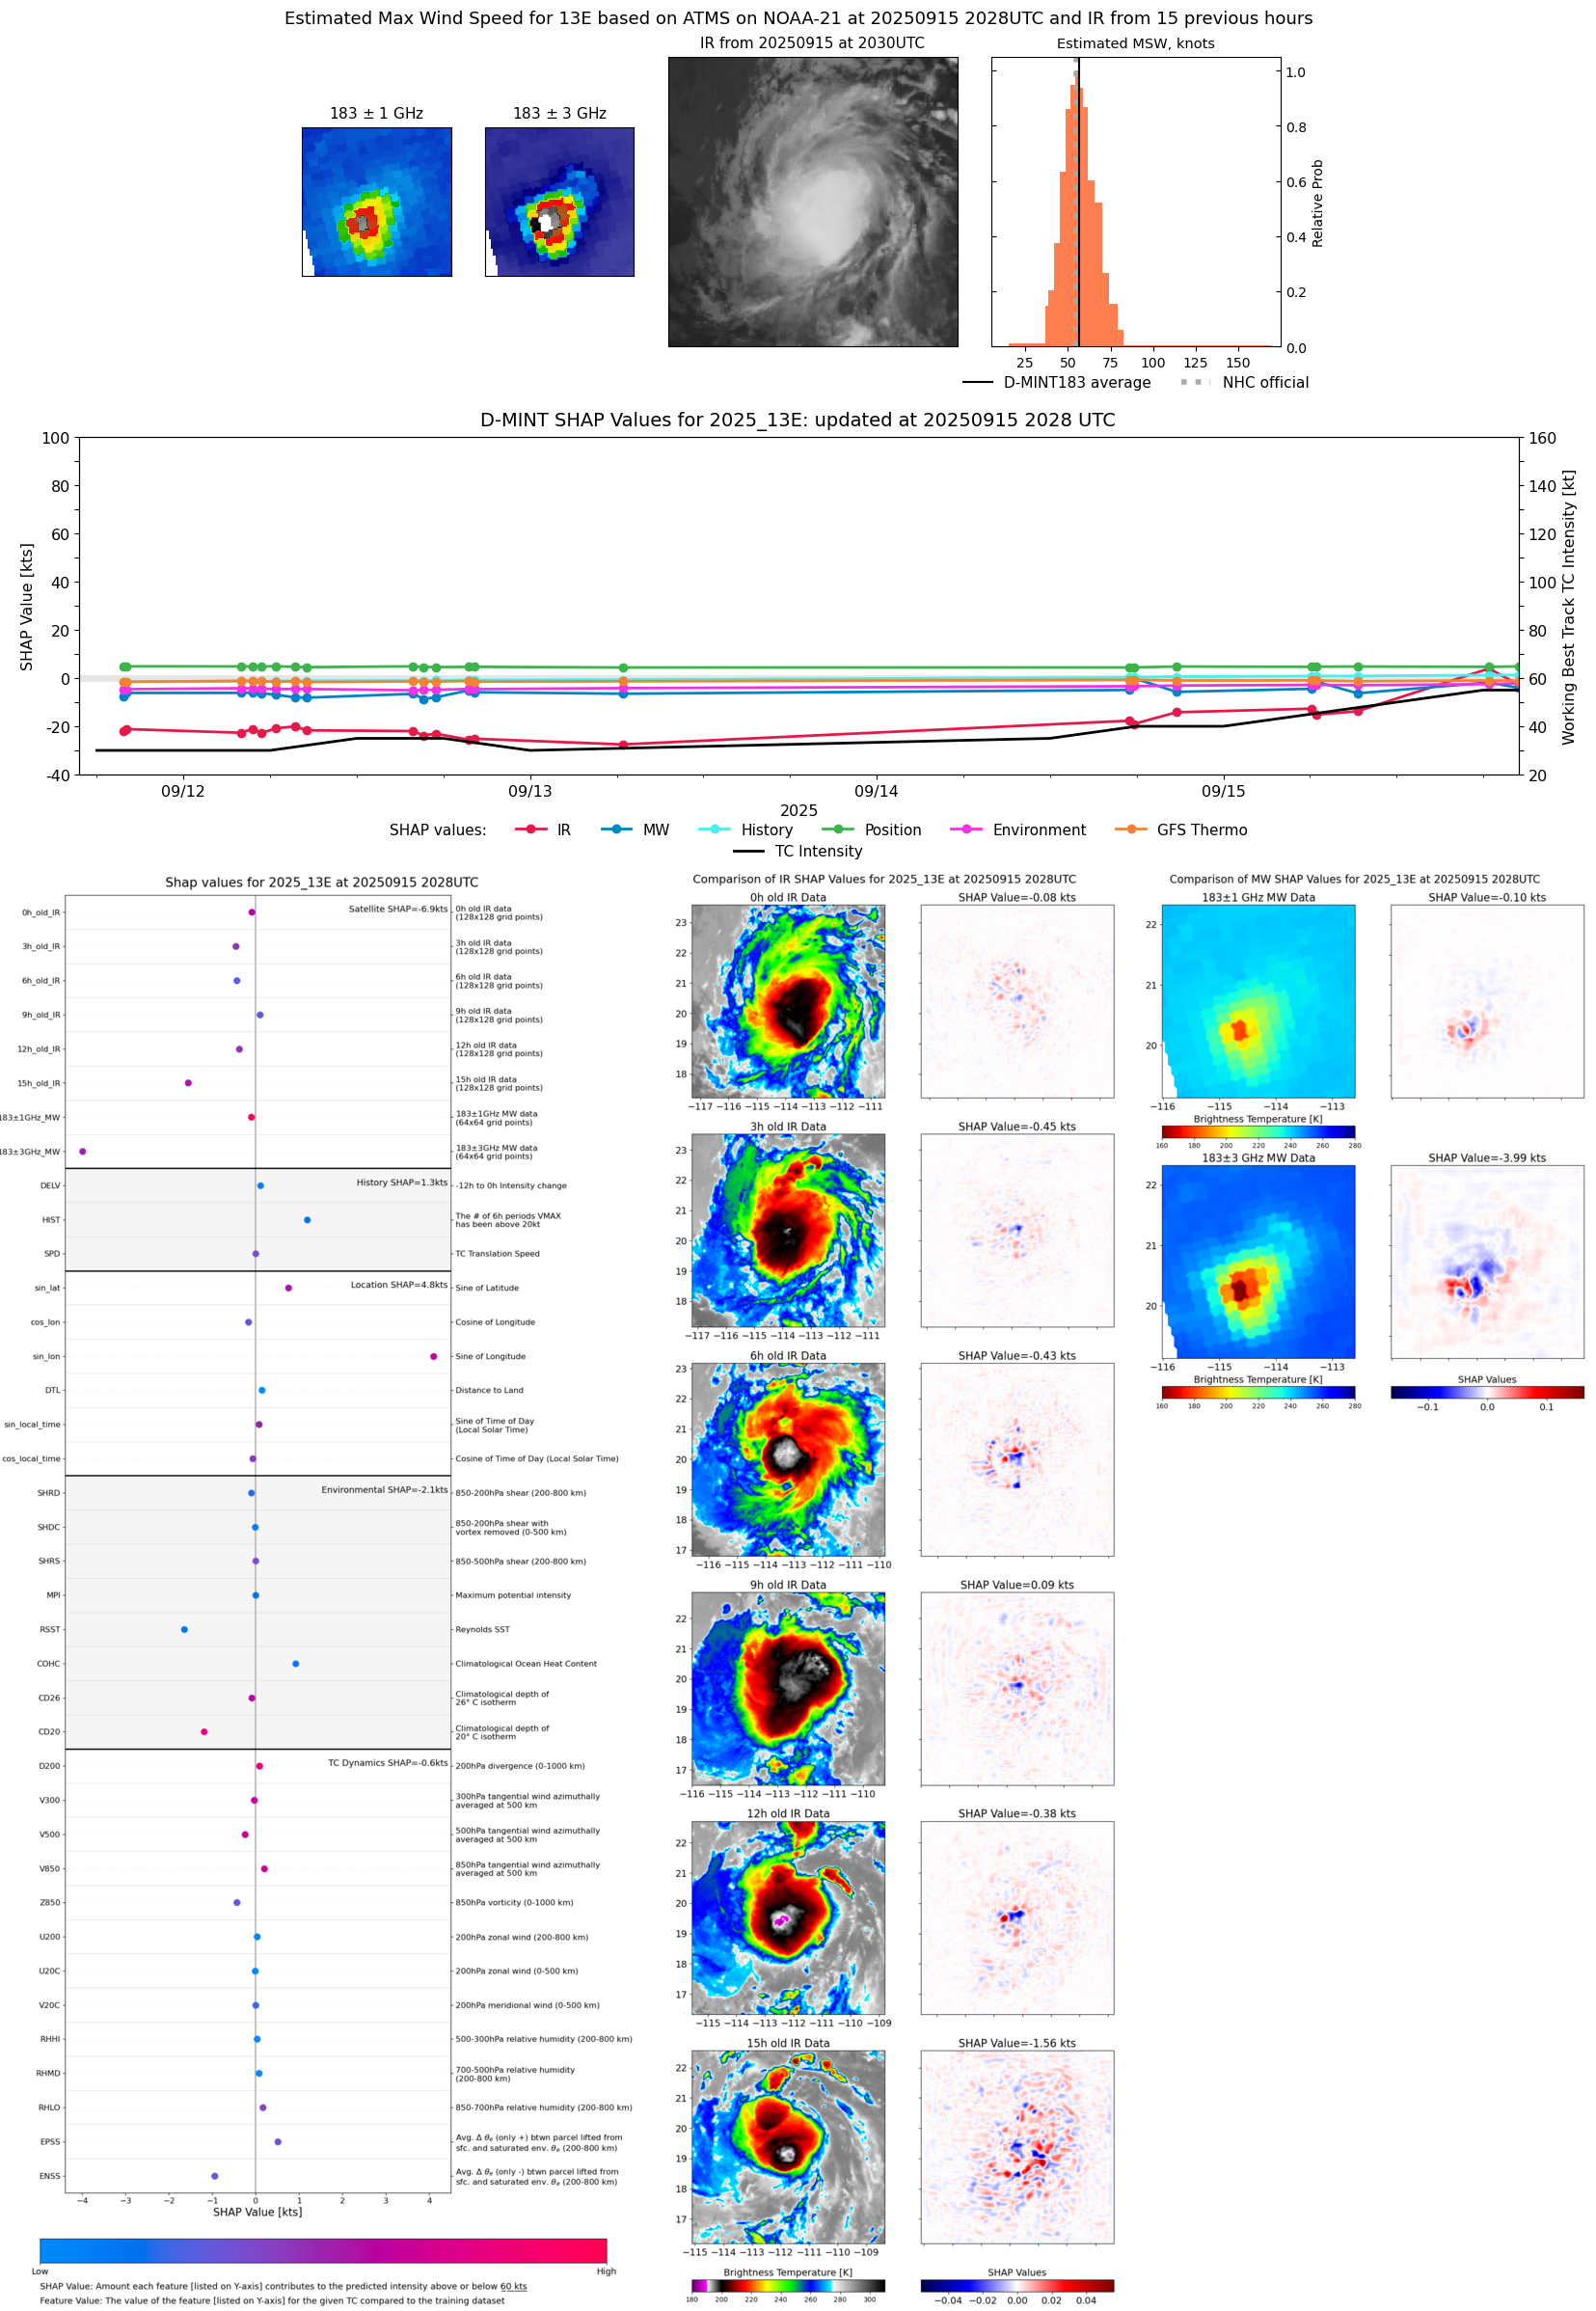 |
| 20250915 | 1838 UTC | GMI | 994 hPa | 52 kts | 46 kts | 59 kts | 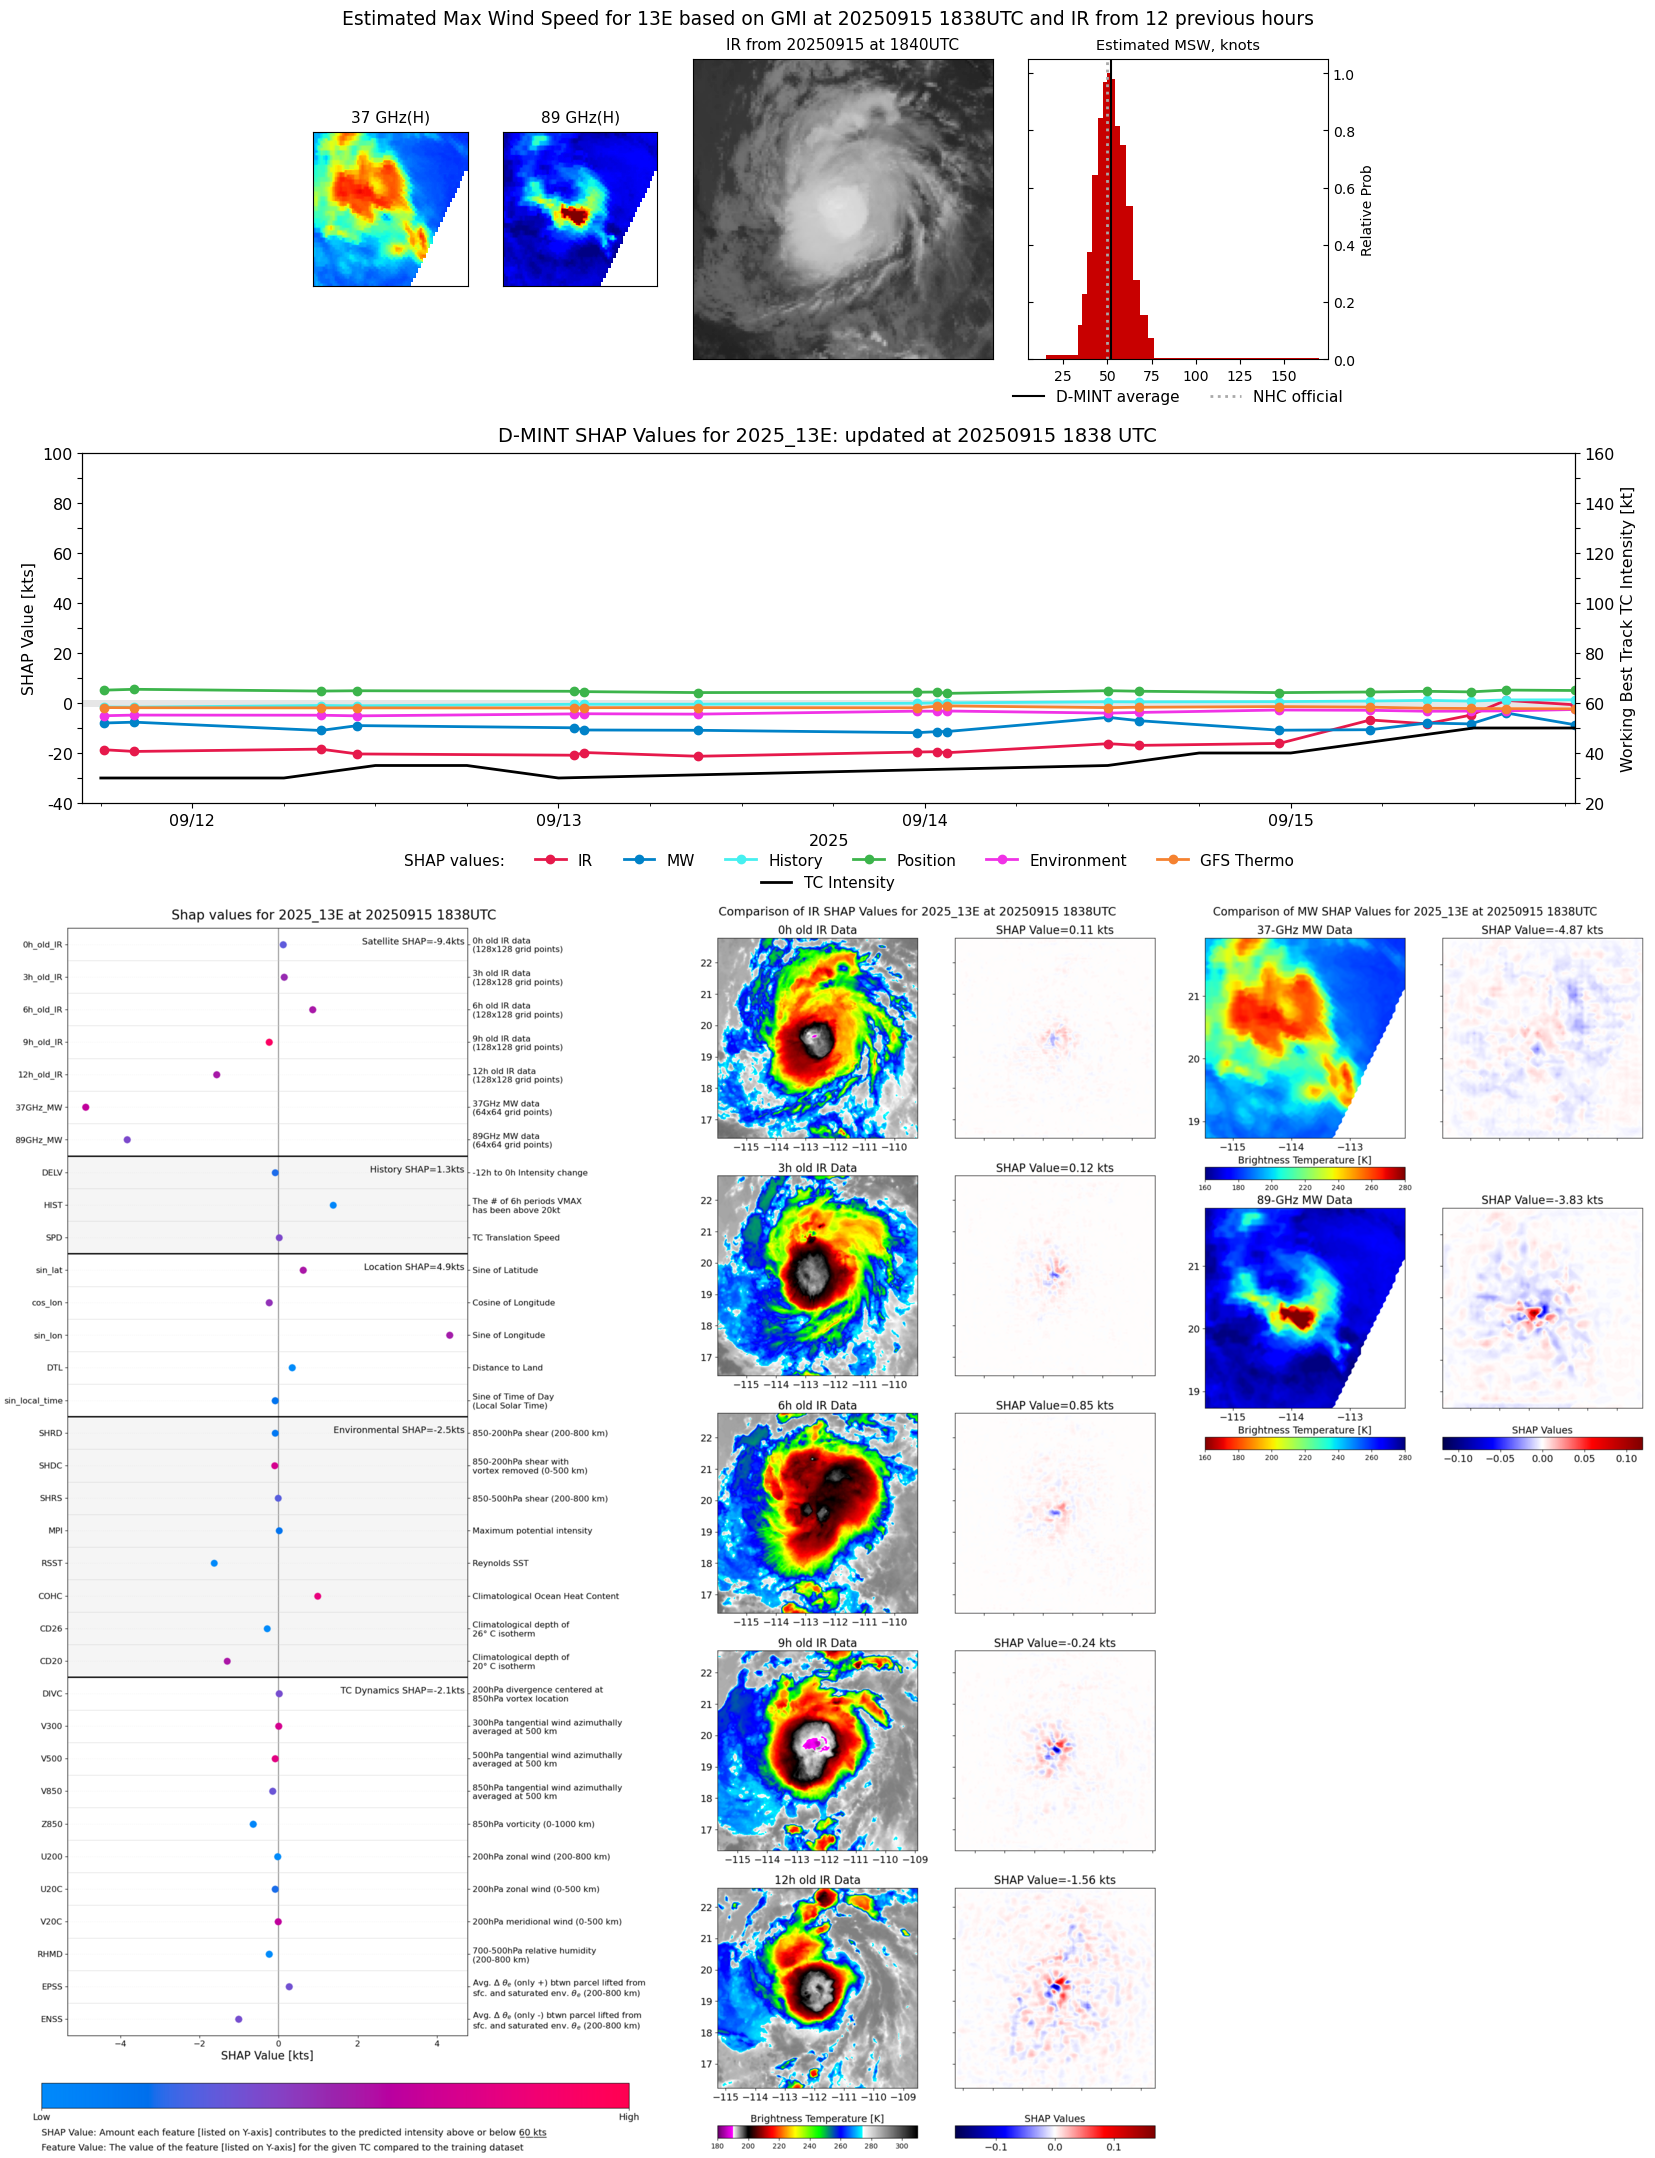 |
| 20250915 | 1824 UTC | TMS02 | 988 hPa | 65 kts | 59 kts | 72 kts | 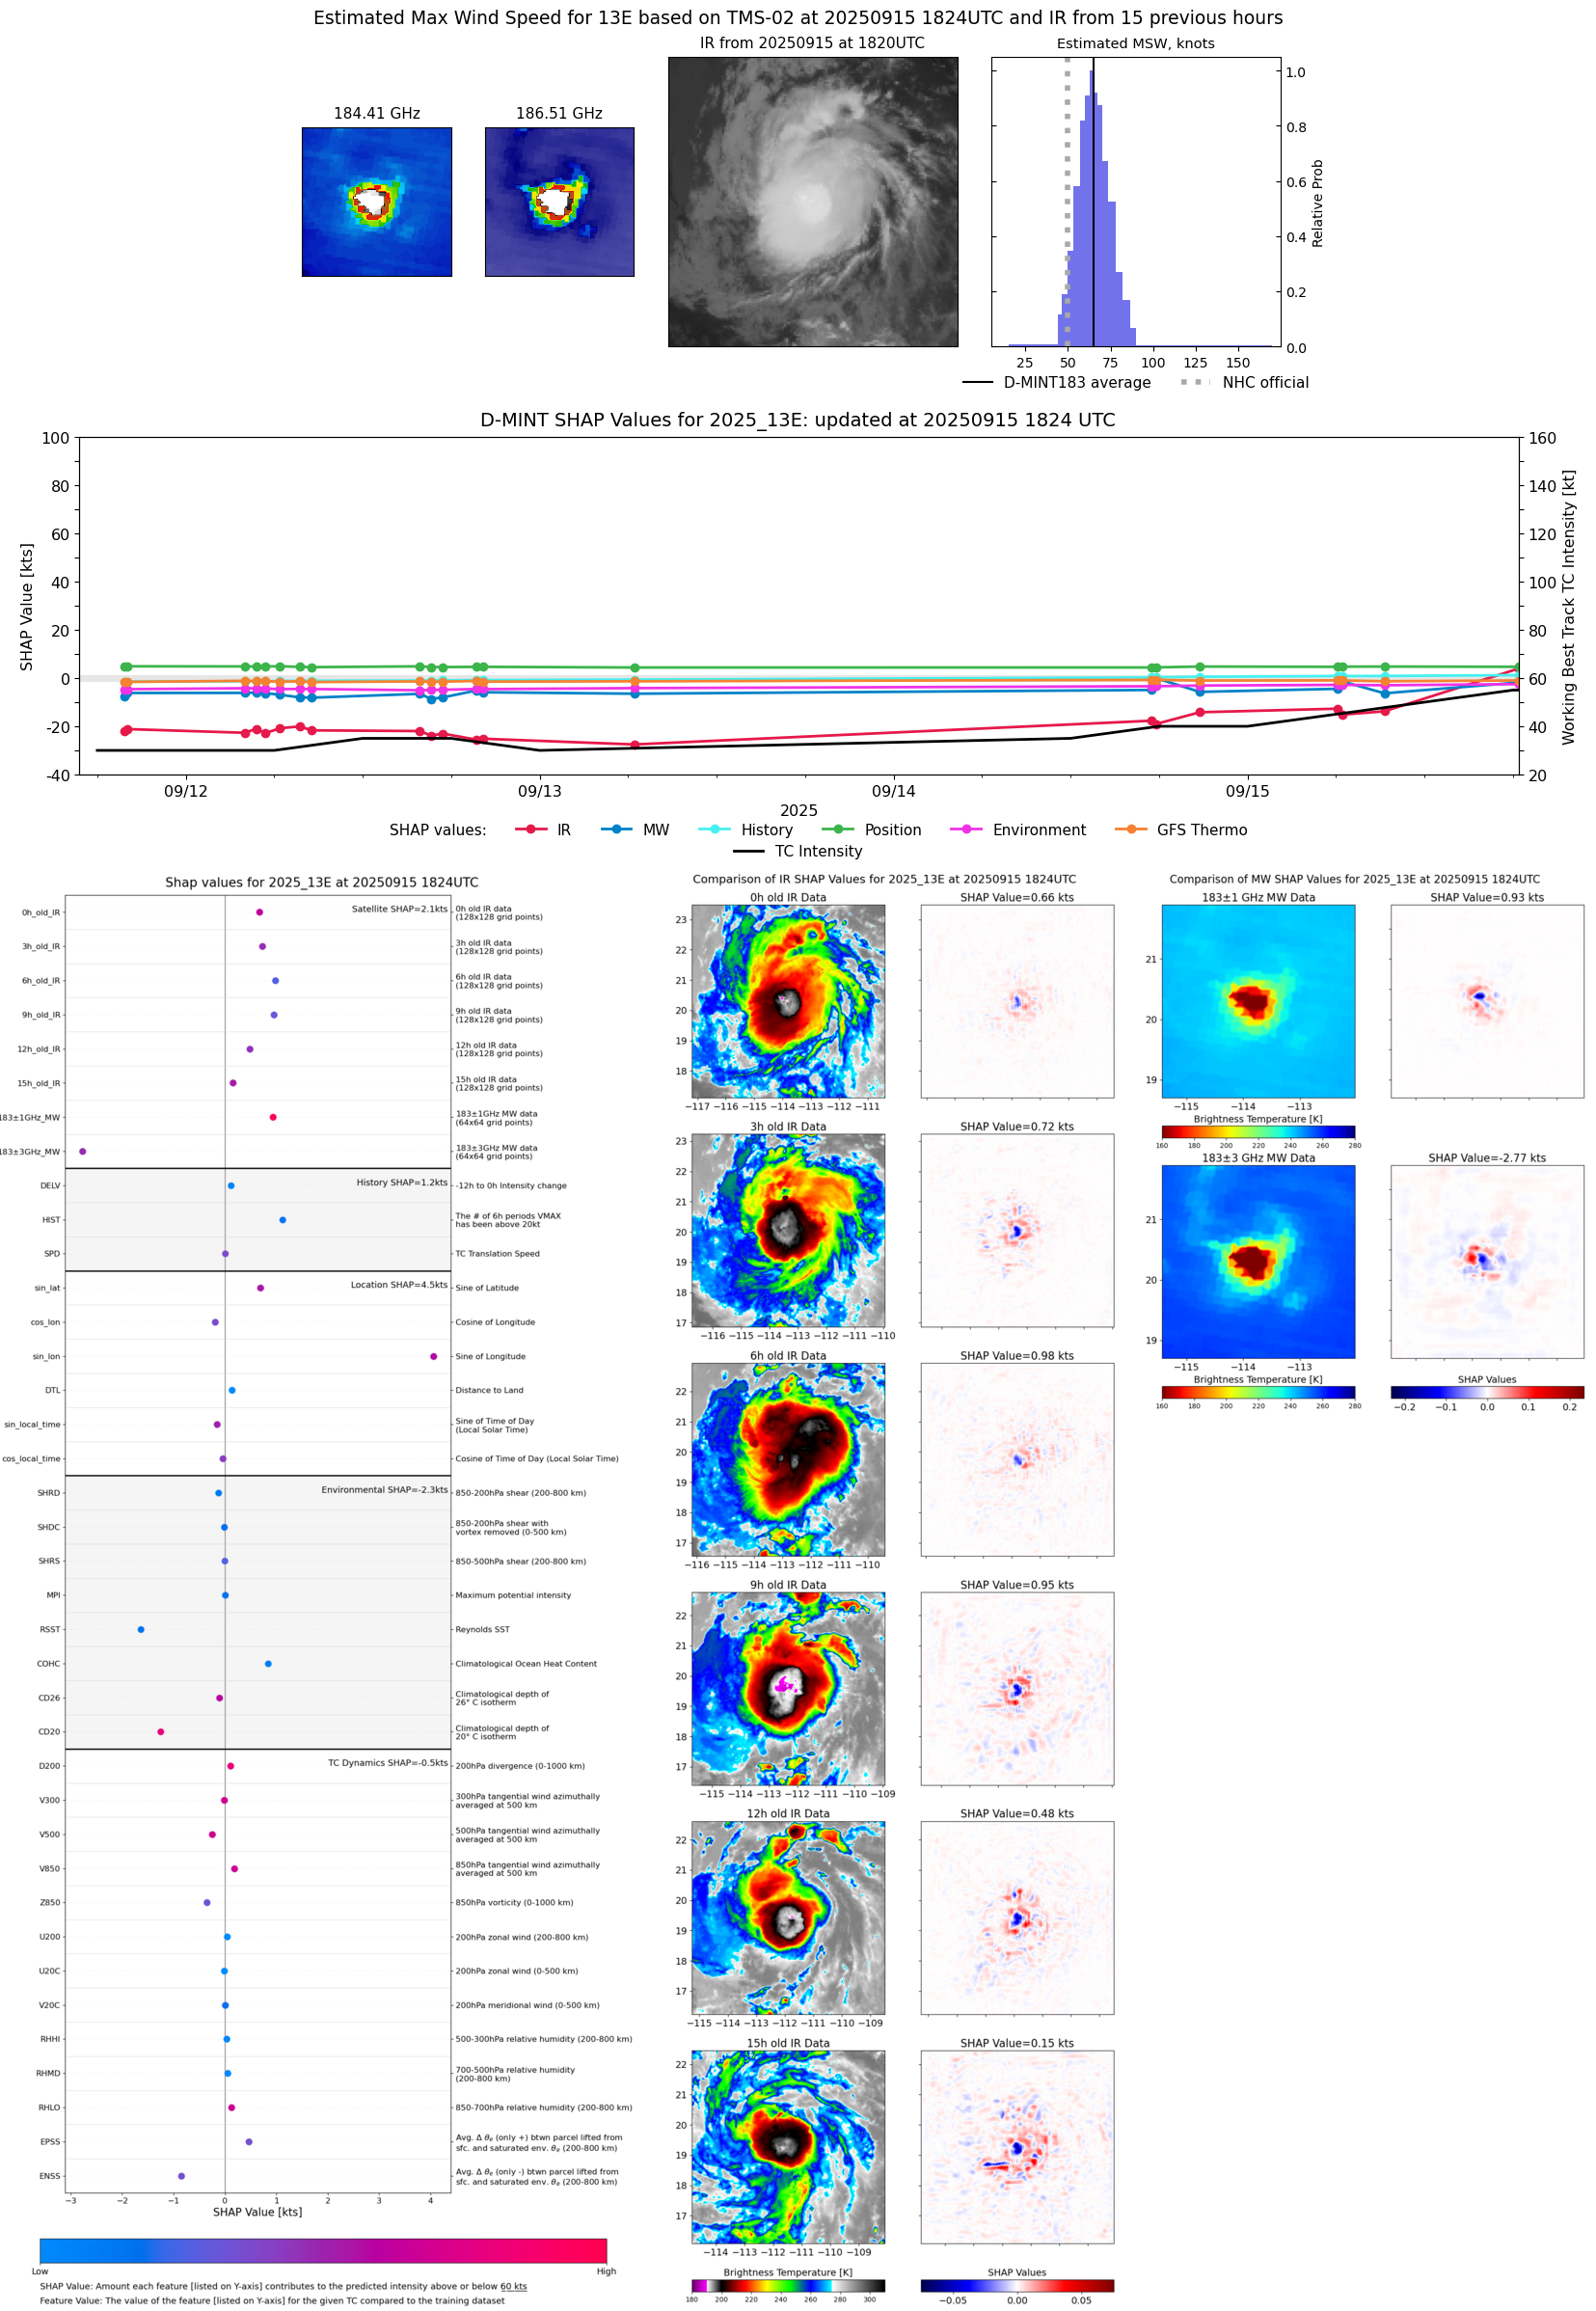 |
| 20250915 | 1406 UTC | WSFM01 | 994 hPa | 59 kts | 52 kts | 66 kts | 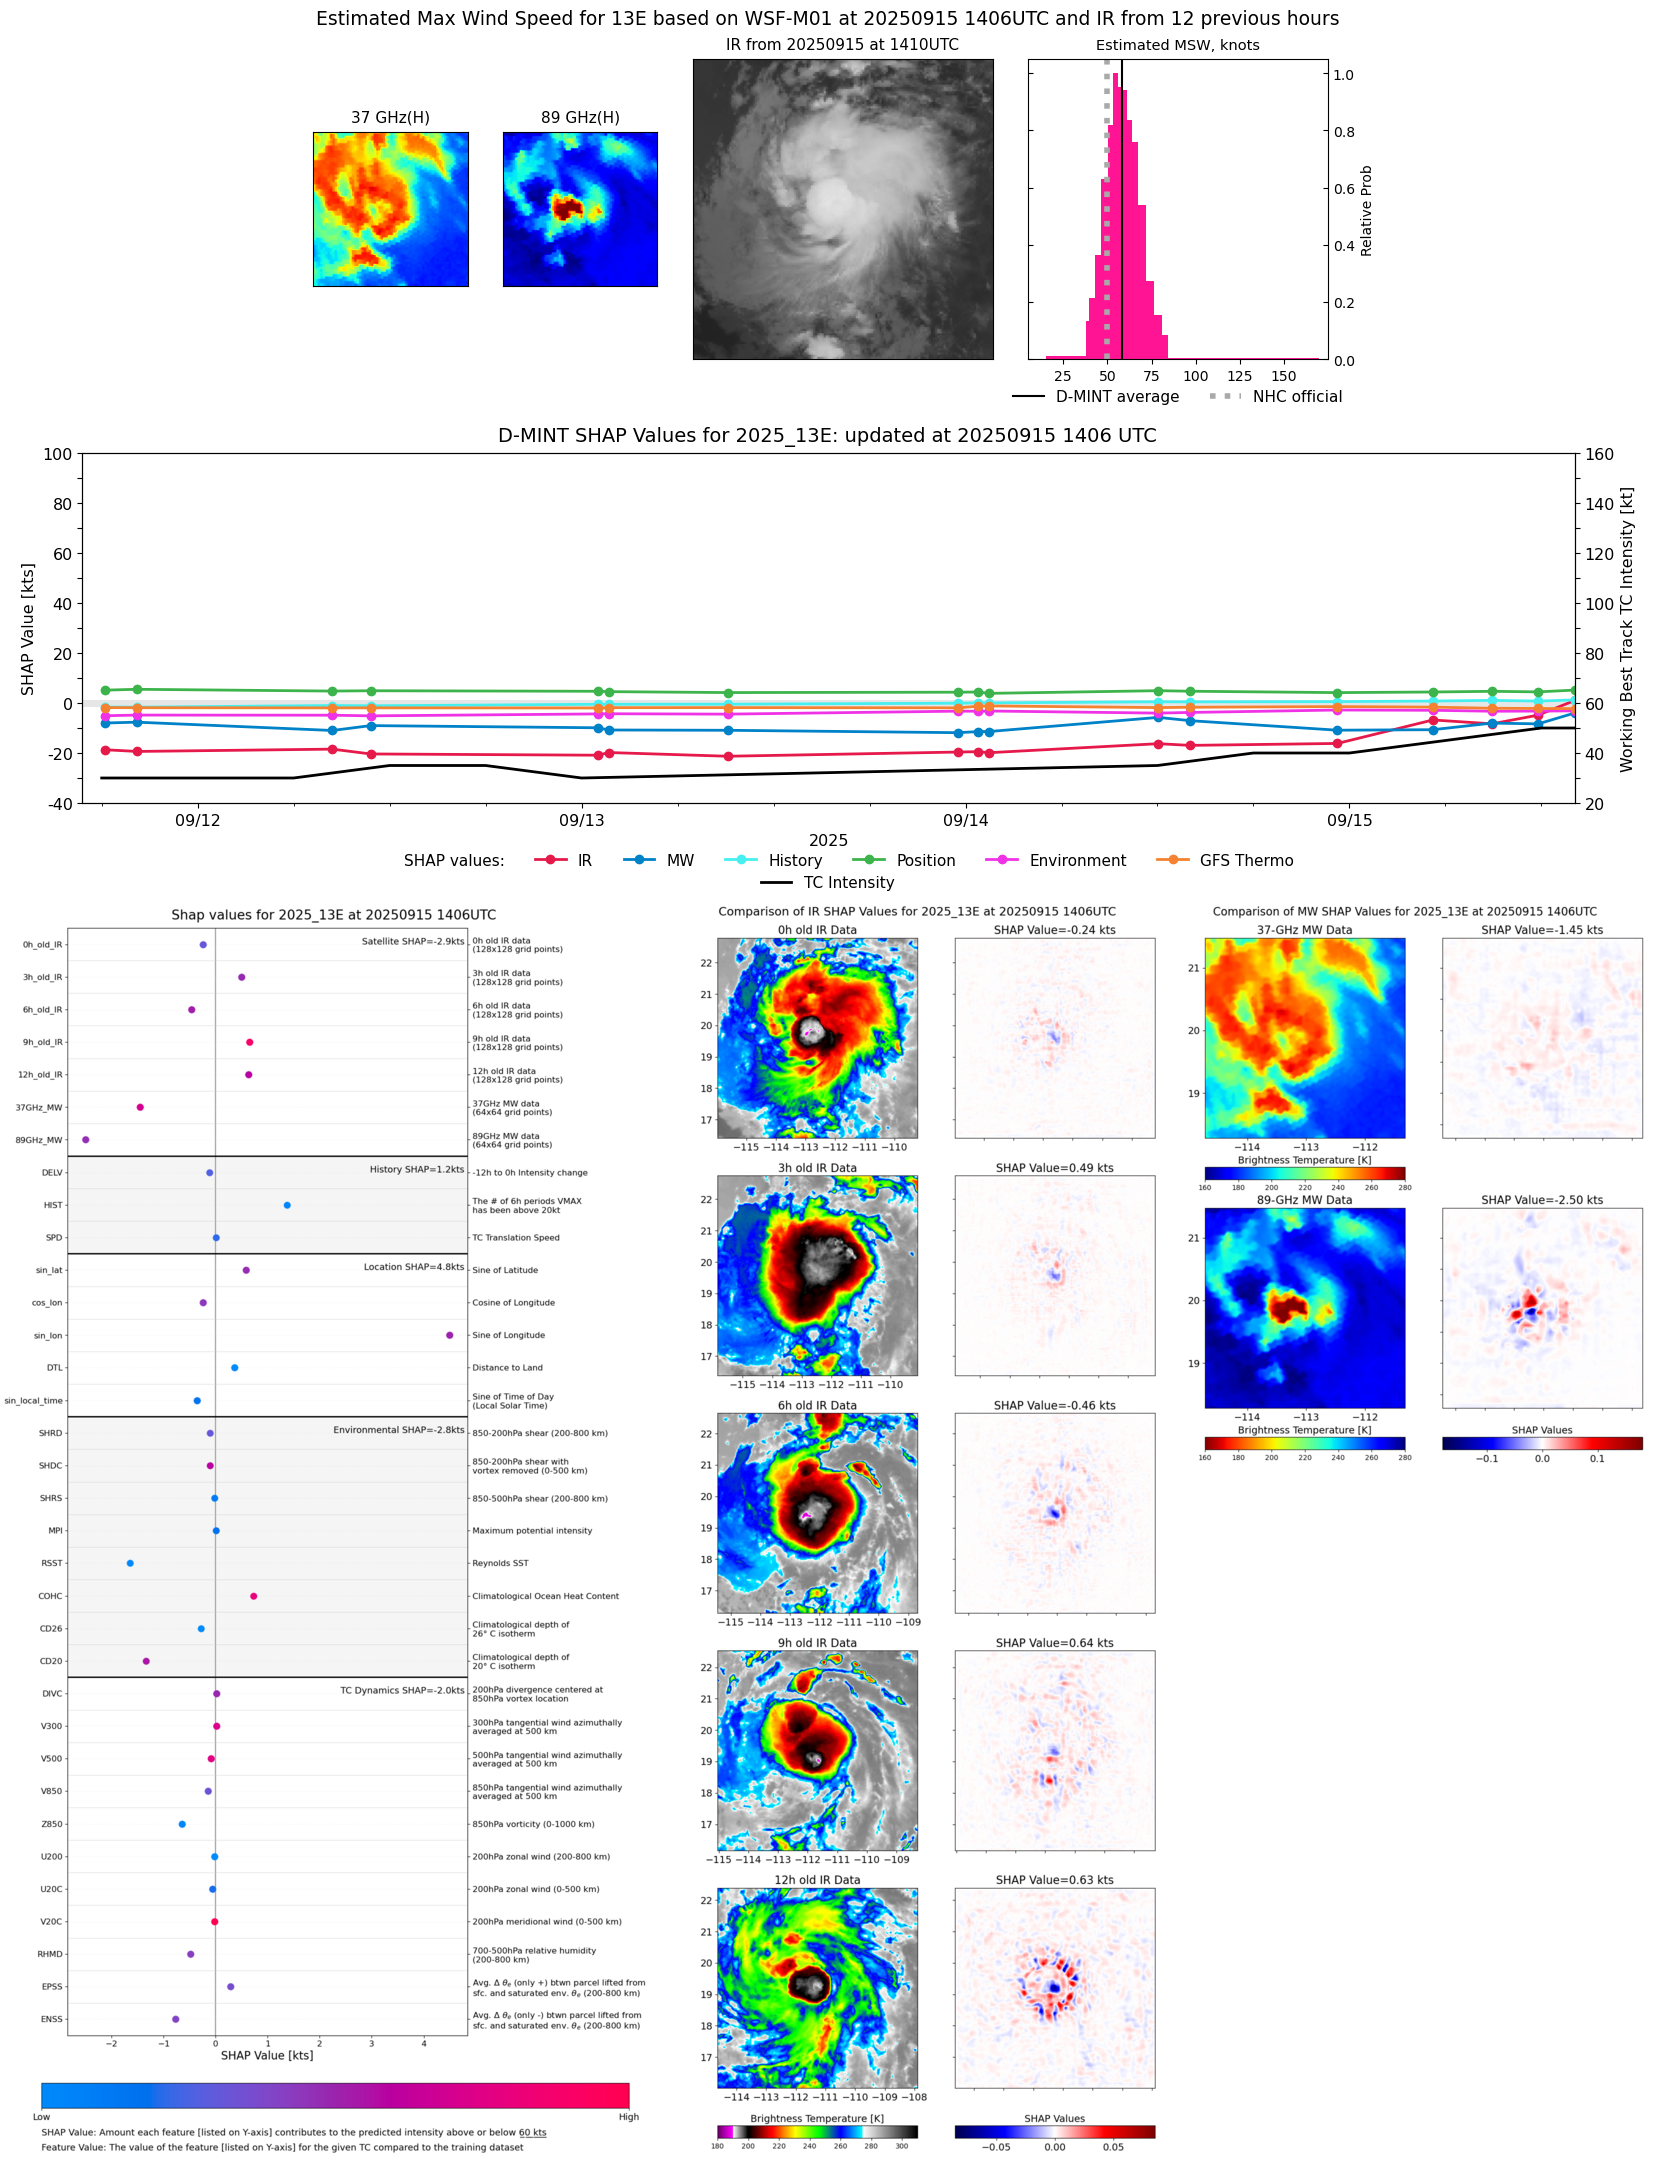 |
| 20250915 | 1148 UTC | SSMISF18 | 999 hPa | 47 kts | 41 kts | 53 kts | 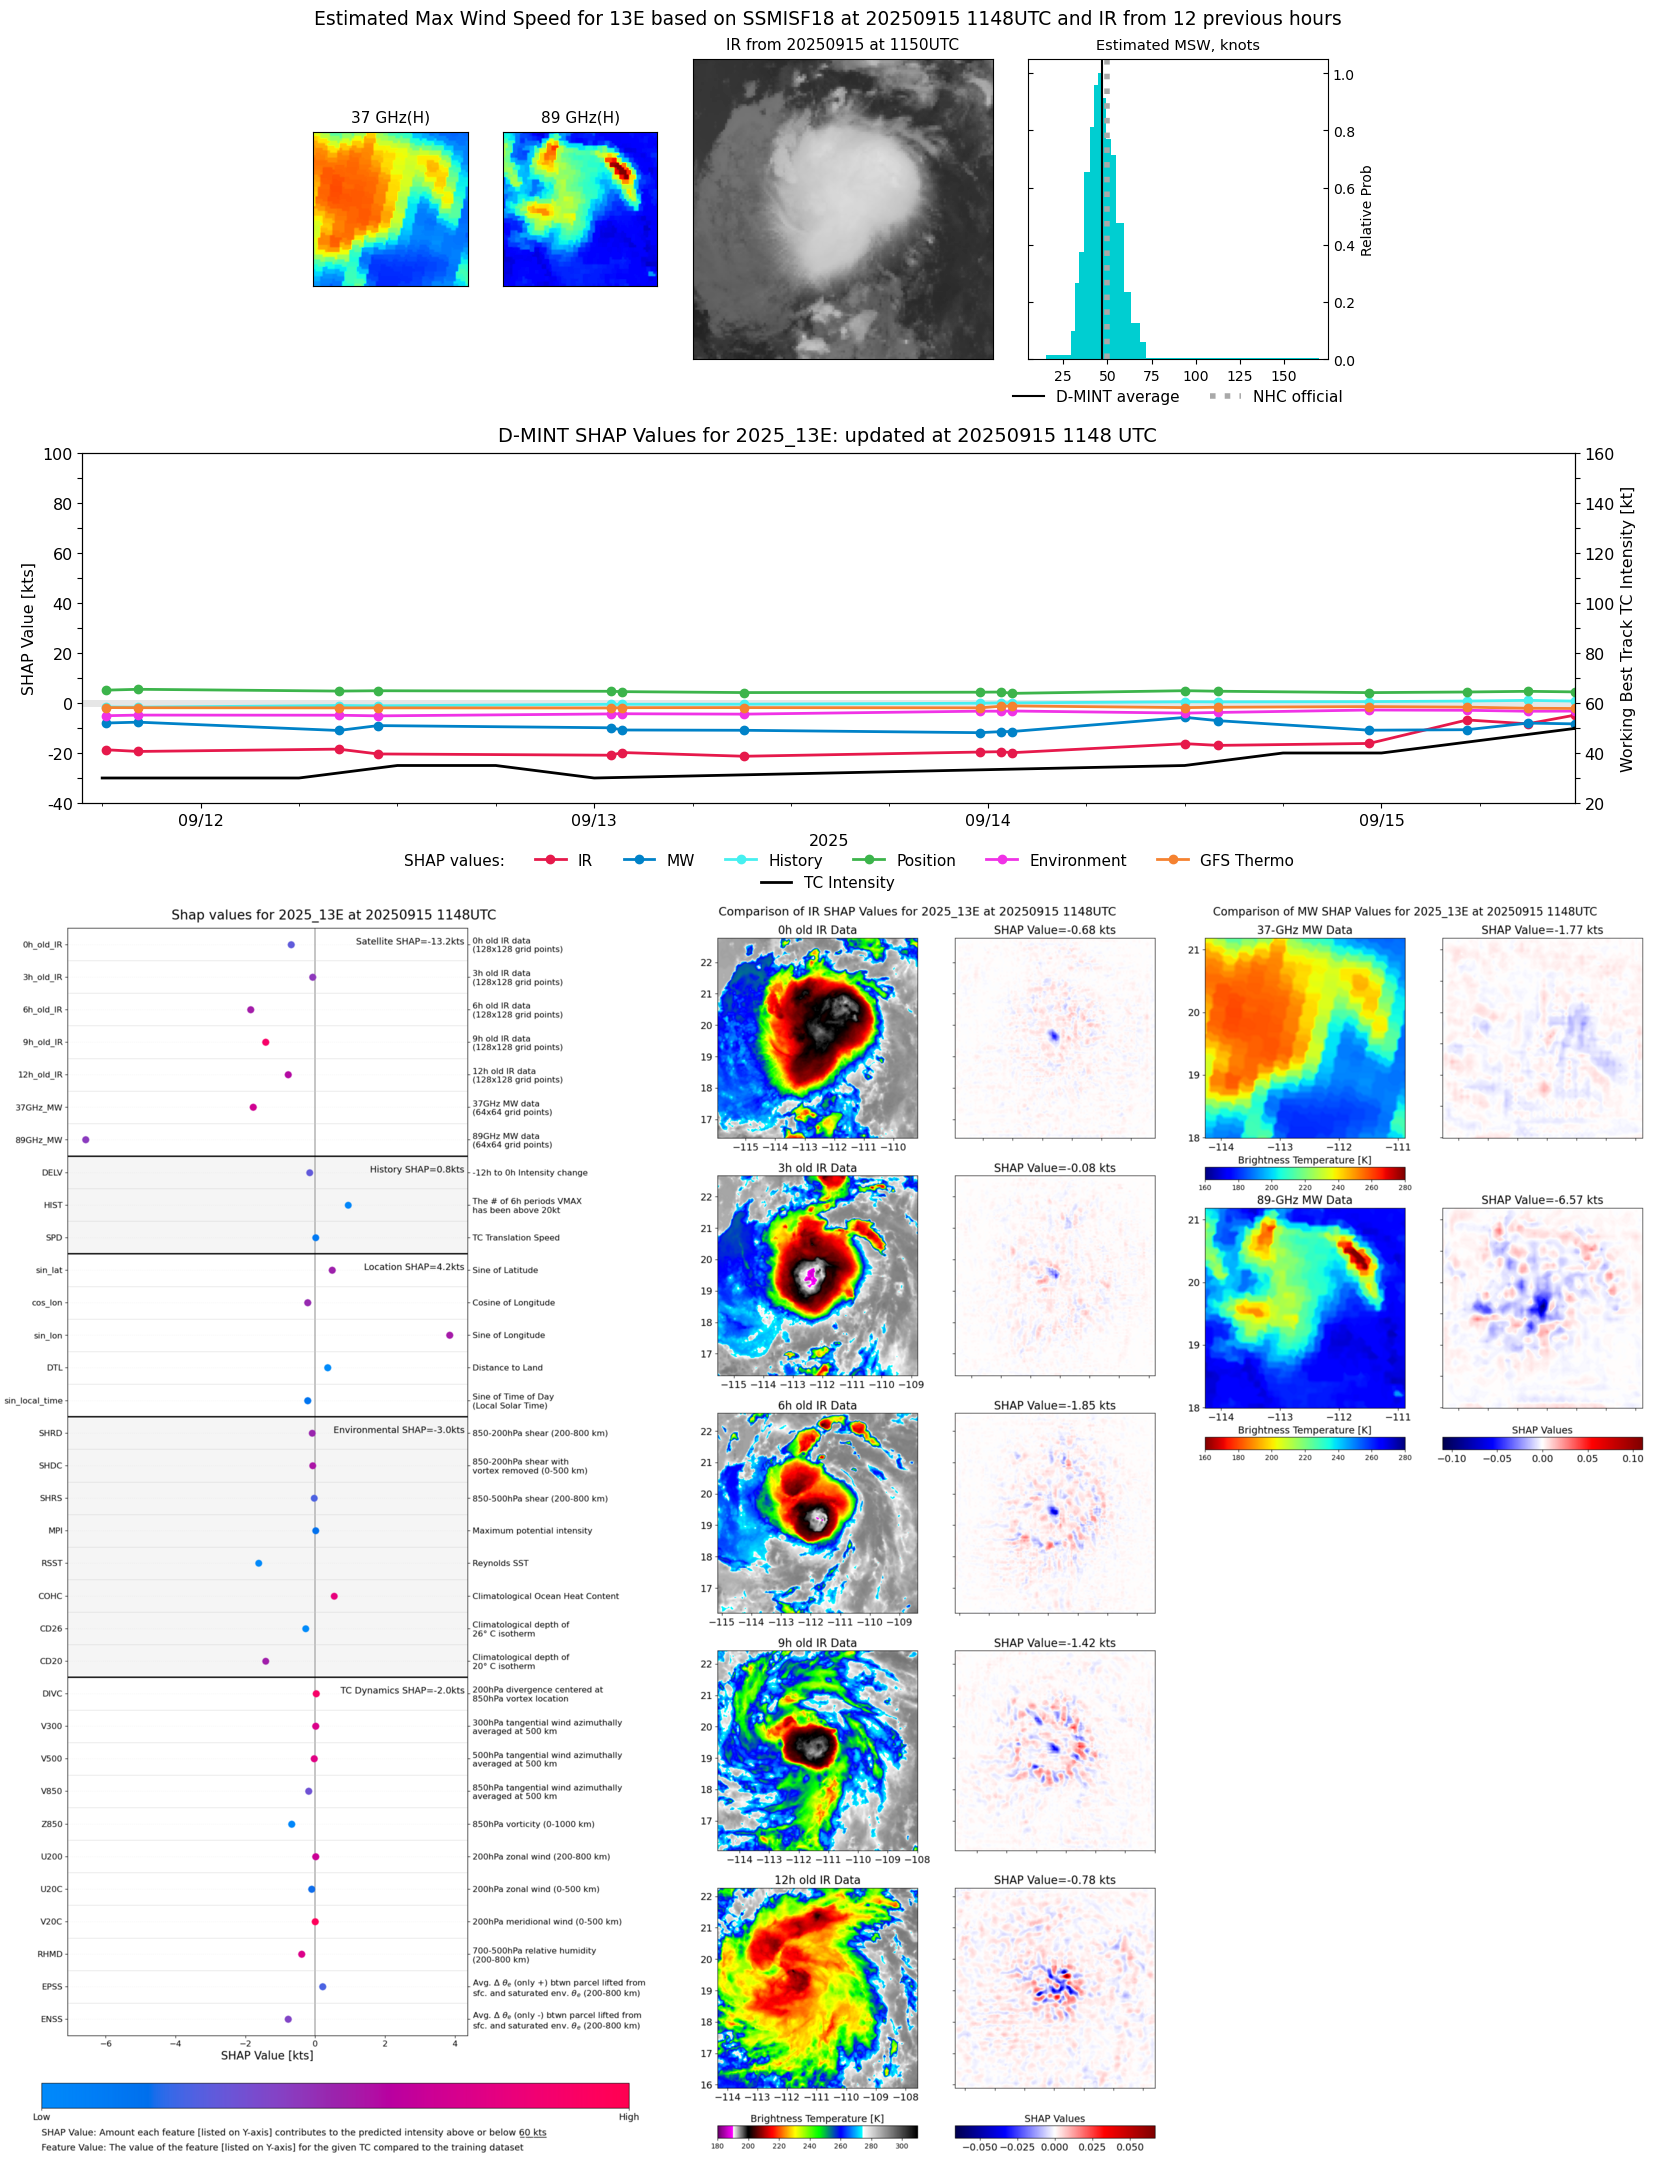 |
| 20250915 | 0917 UTC | ATMS-N21 | 999 hPa | 42 kts | 37 kts | 48 kts | 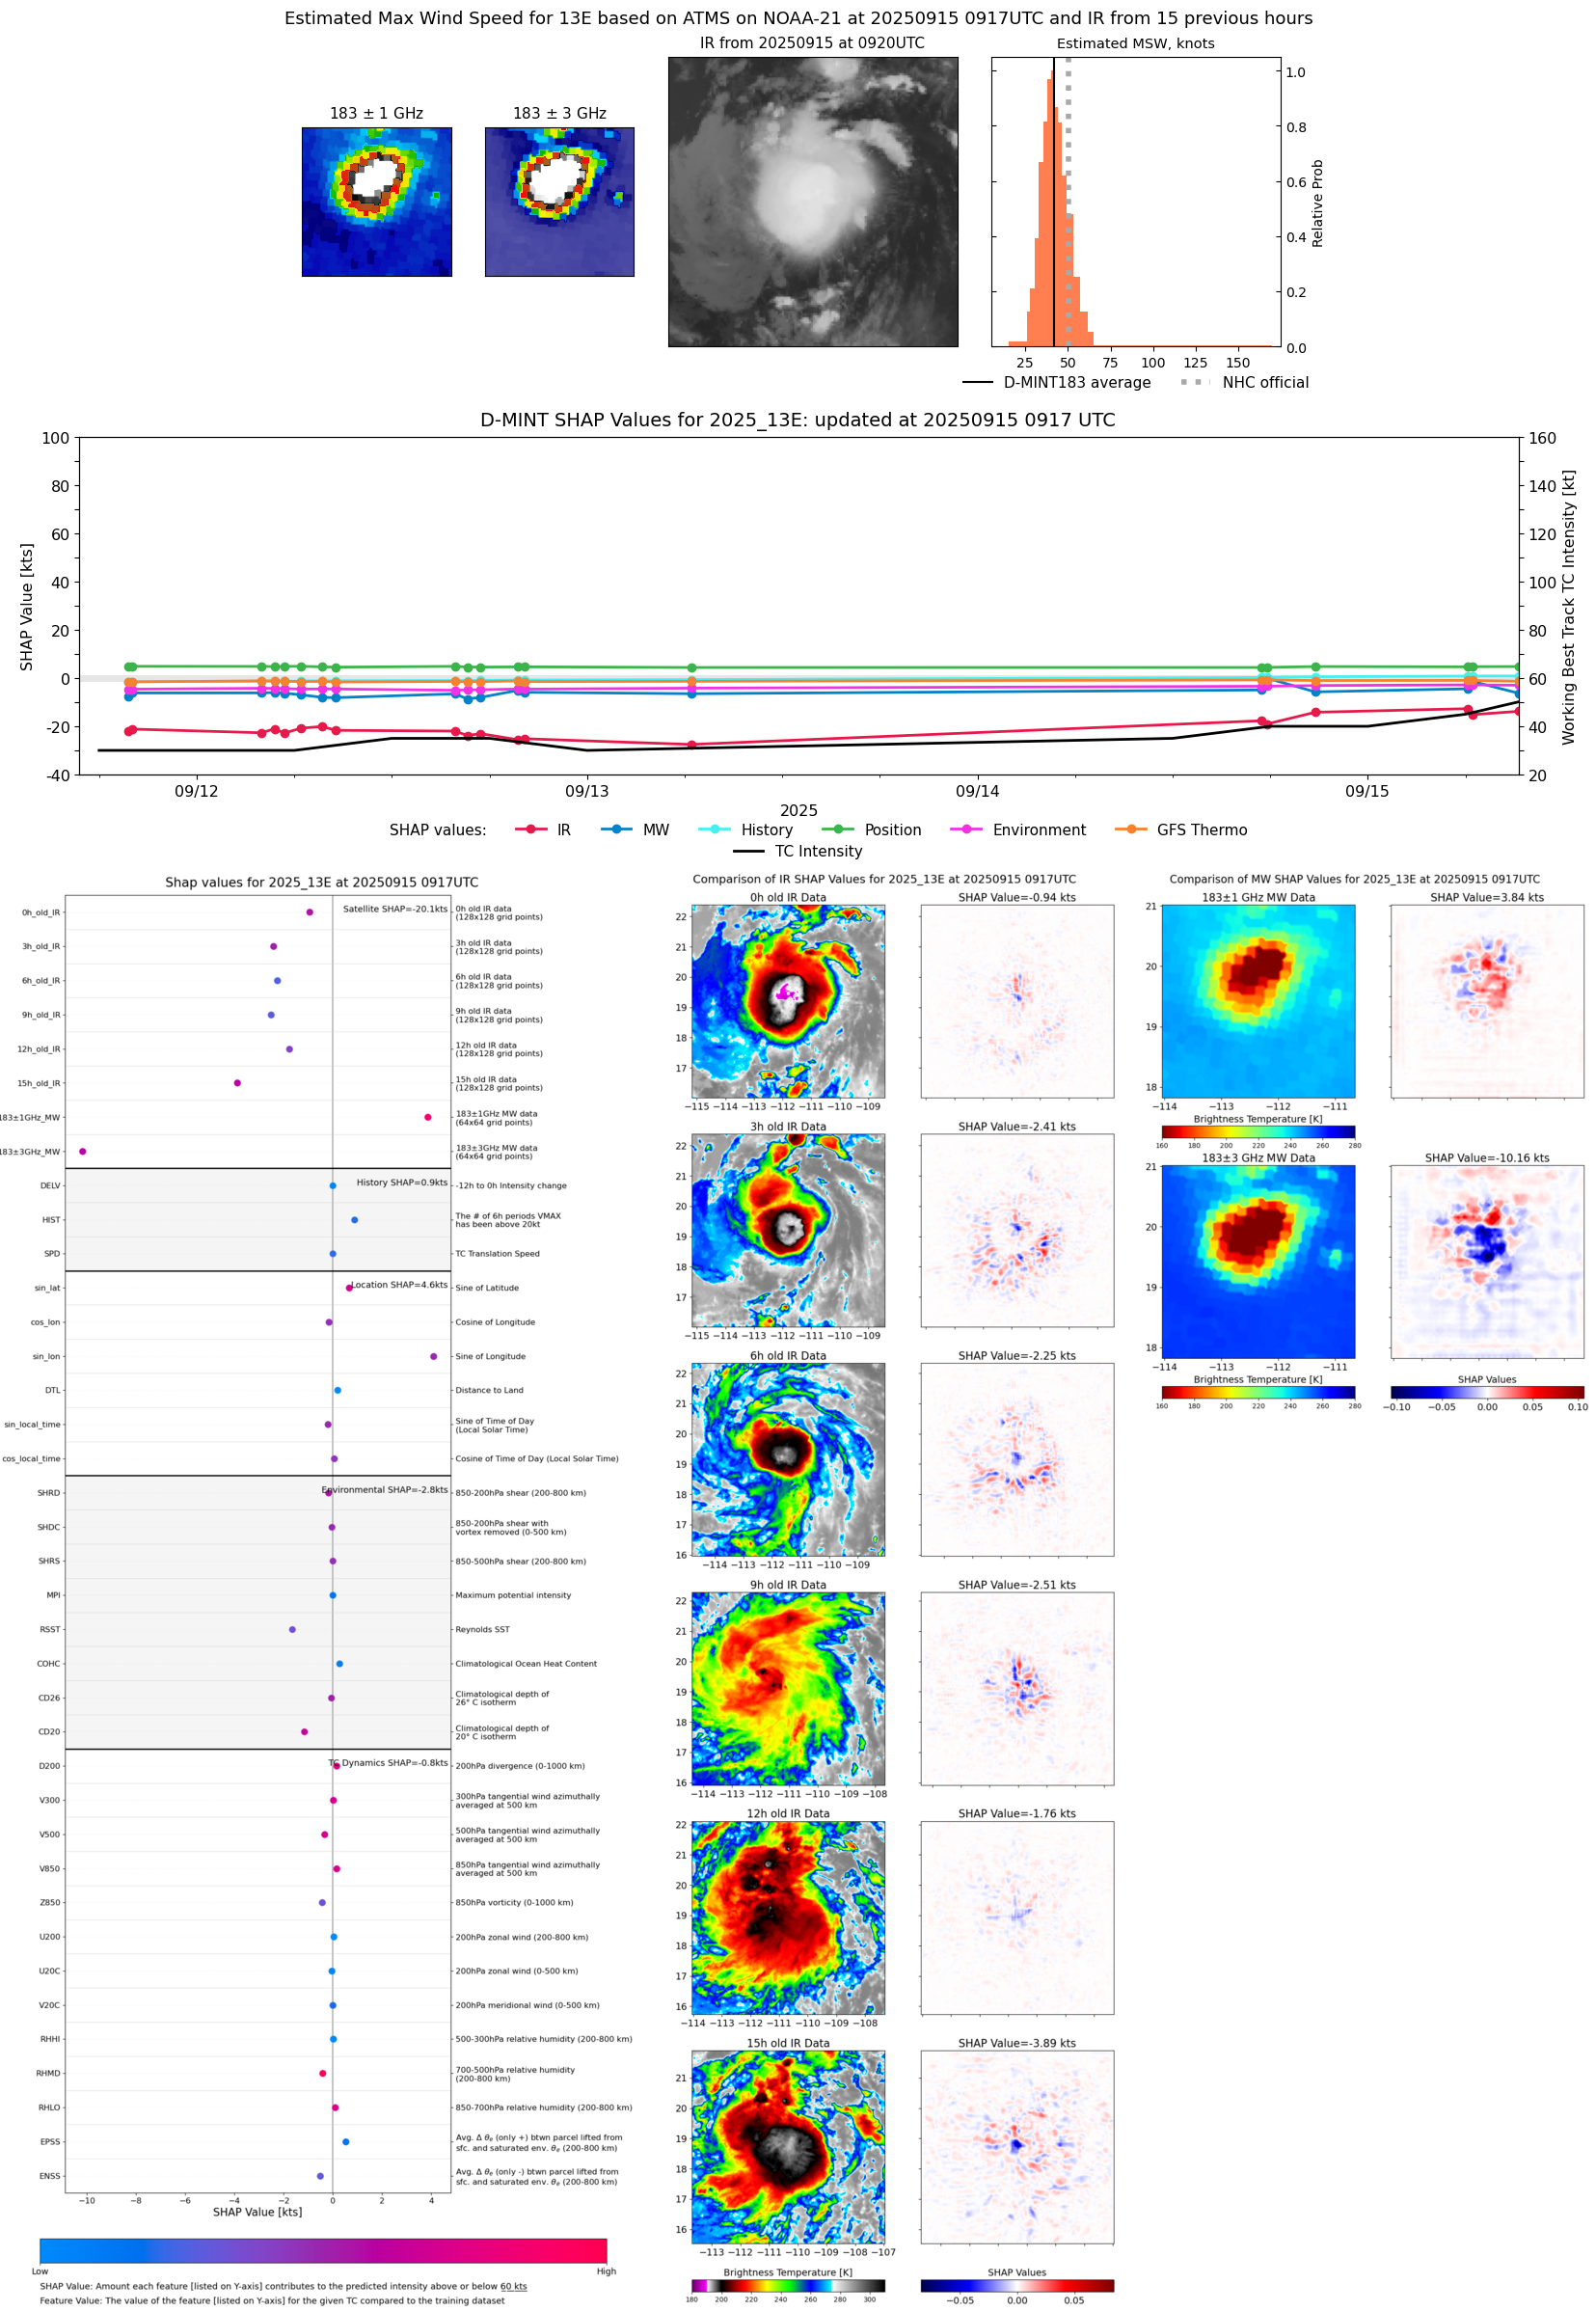 |
| 20250915 | 0855 UTC | AMSR2 | 996 hPa | 44 kts | 39 kts | 50 kts | 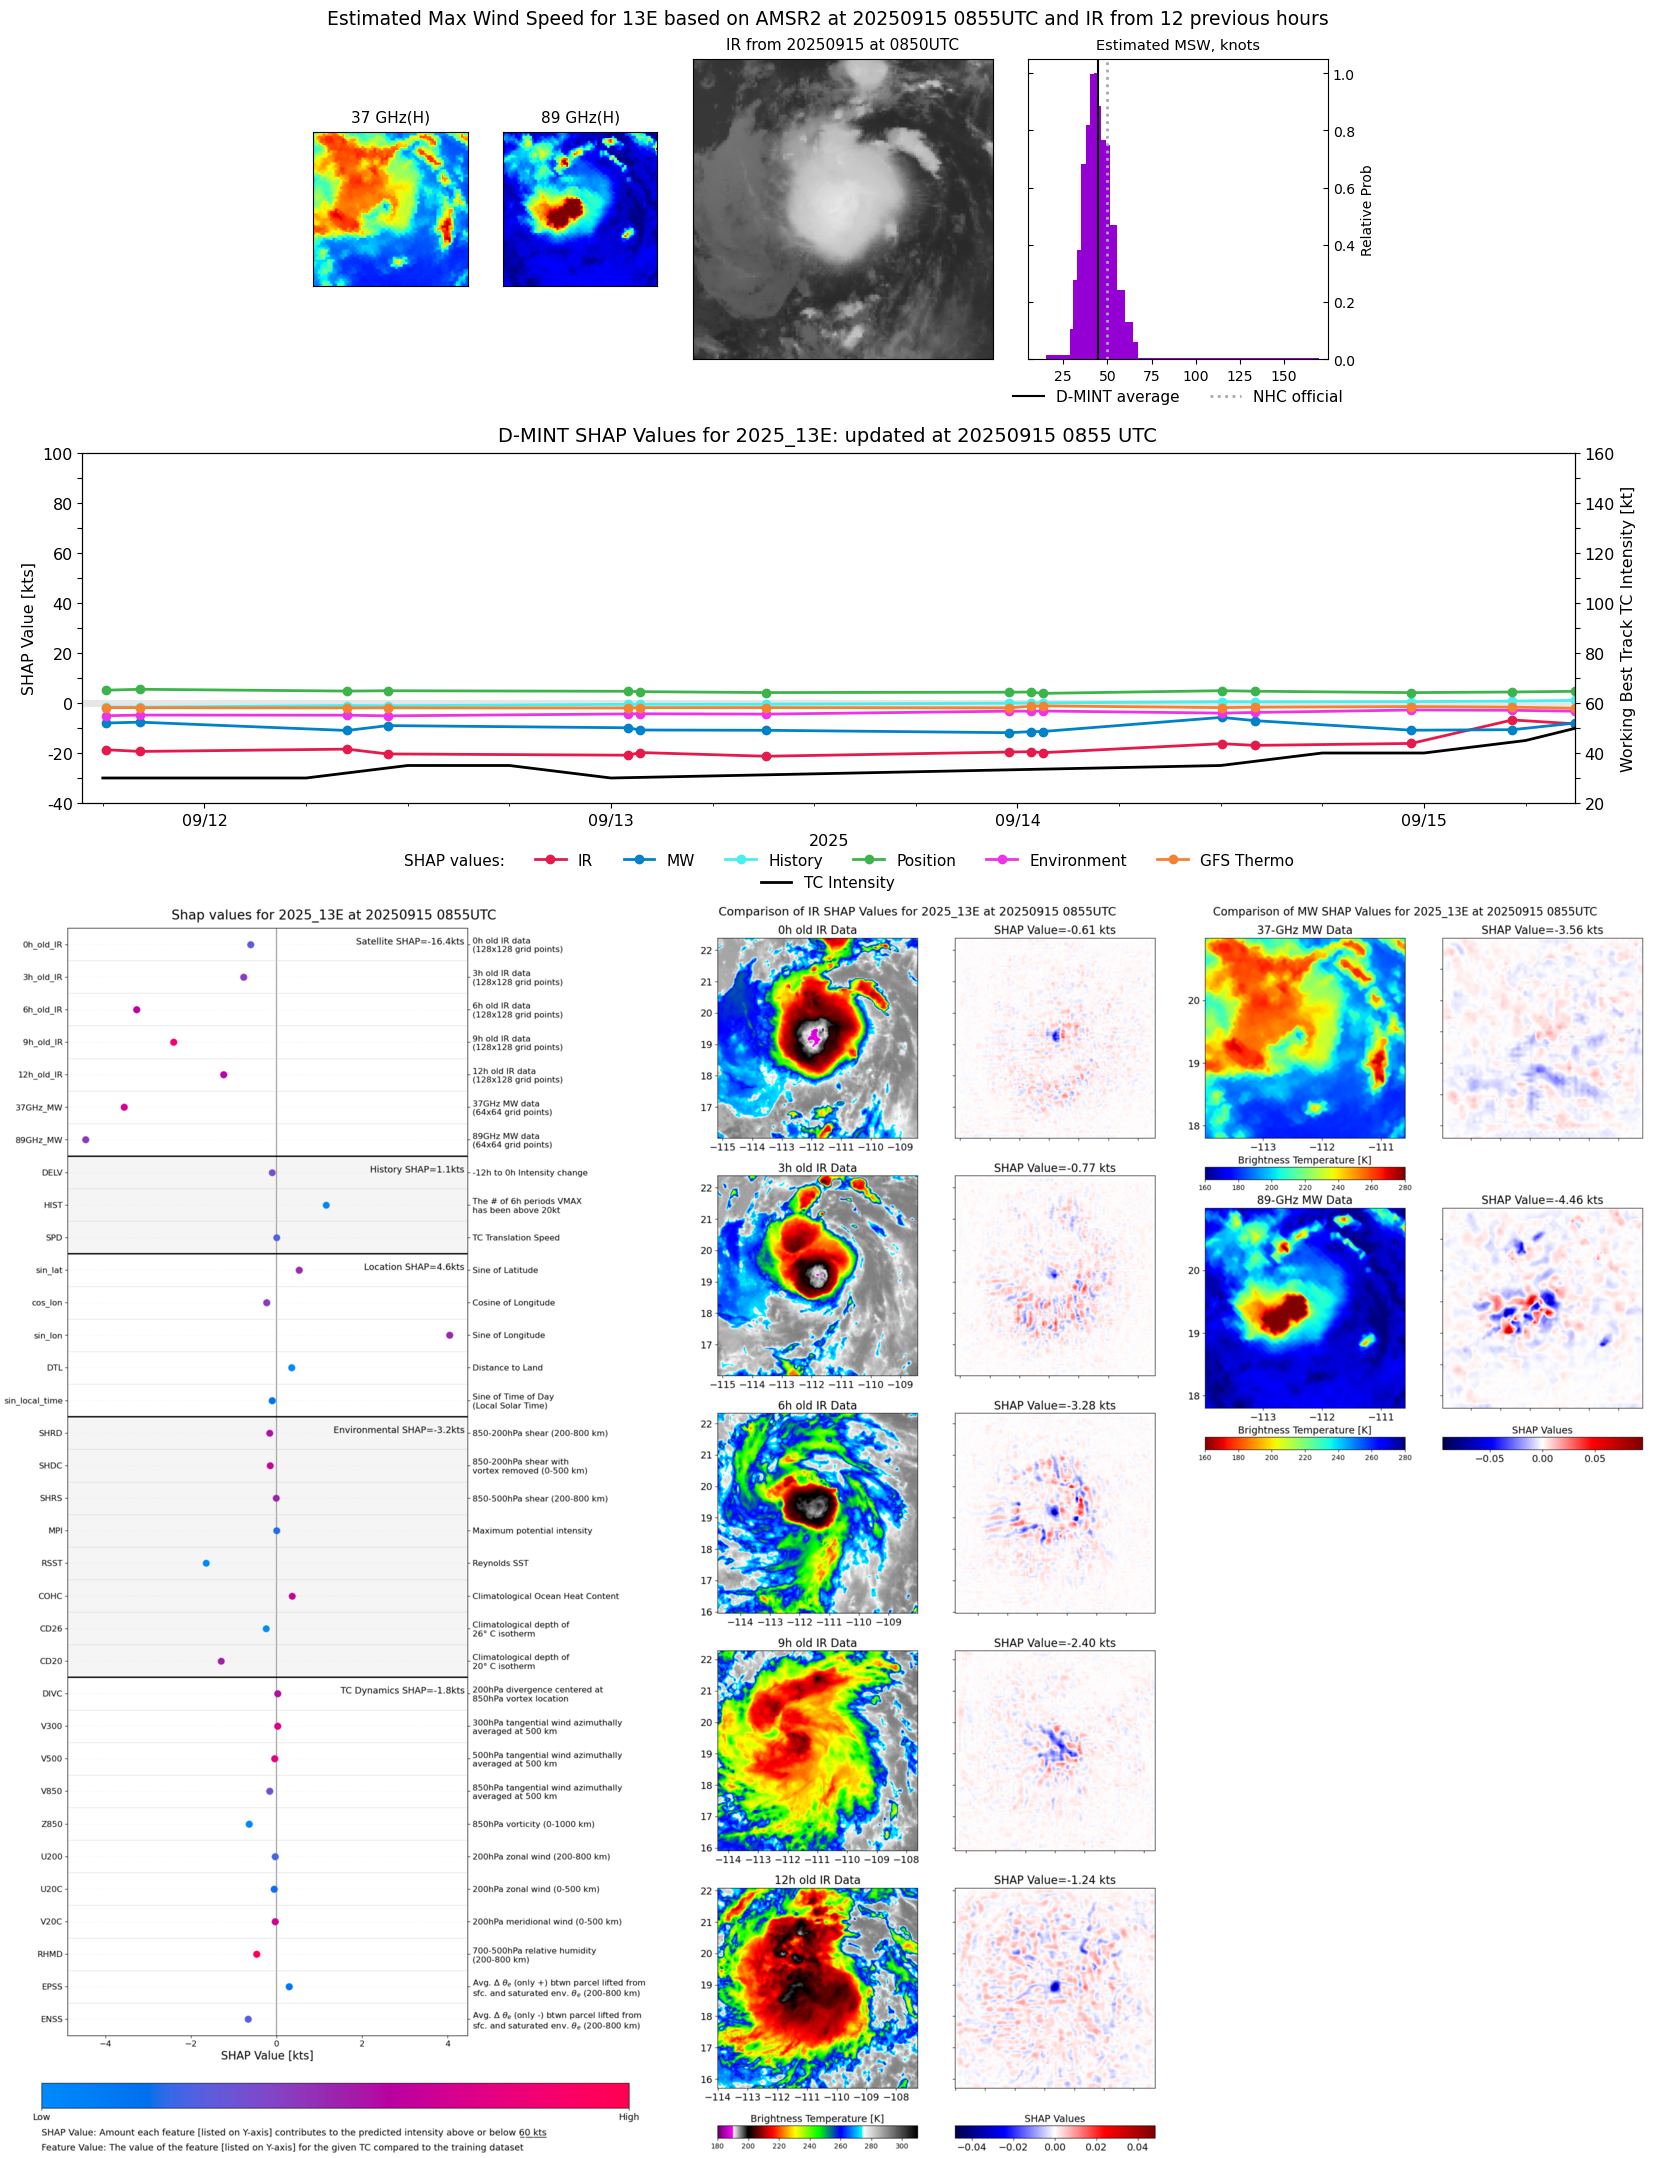 |
| 20250915 | 0627 UTC | TMS07 | 998 hPa | 46 kts | 41 kts | 52 kts | 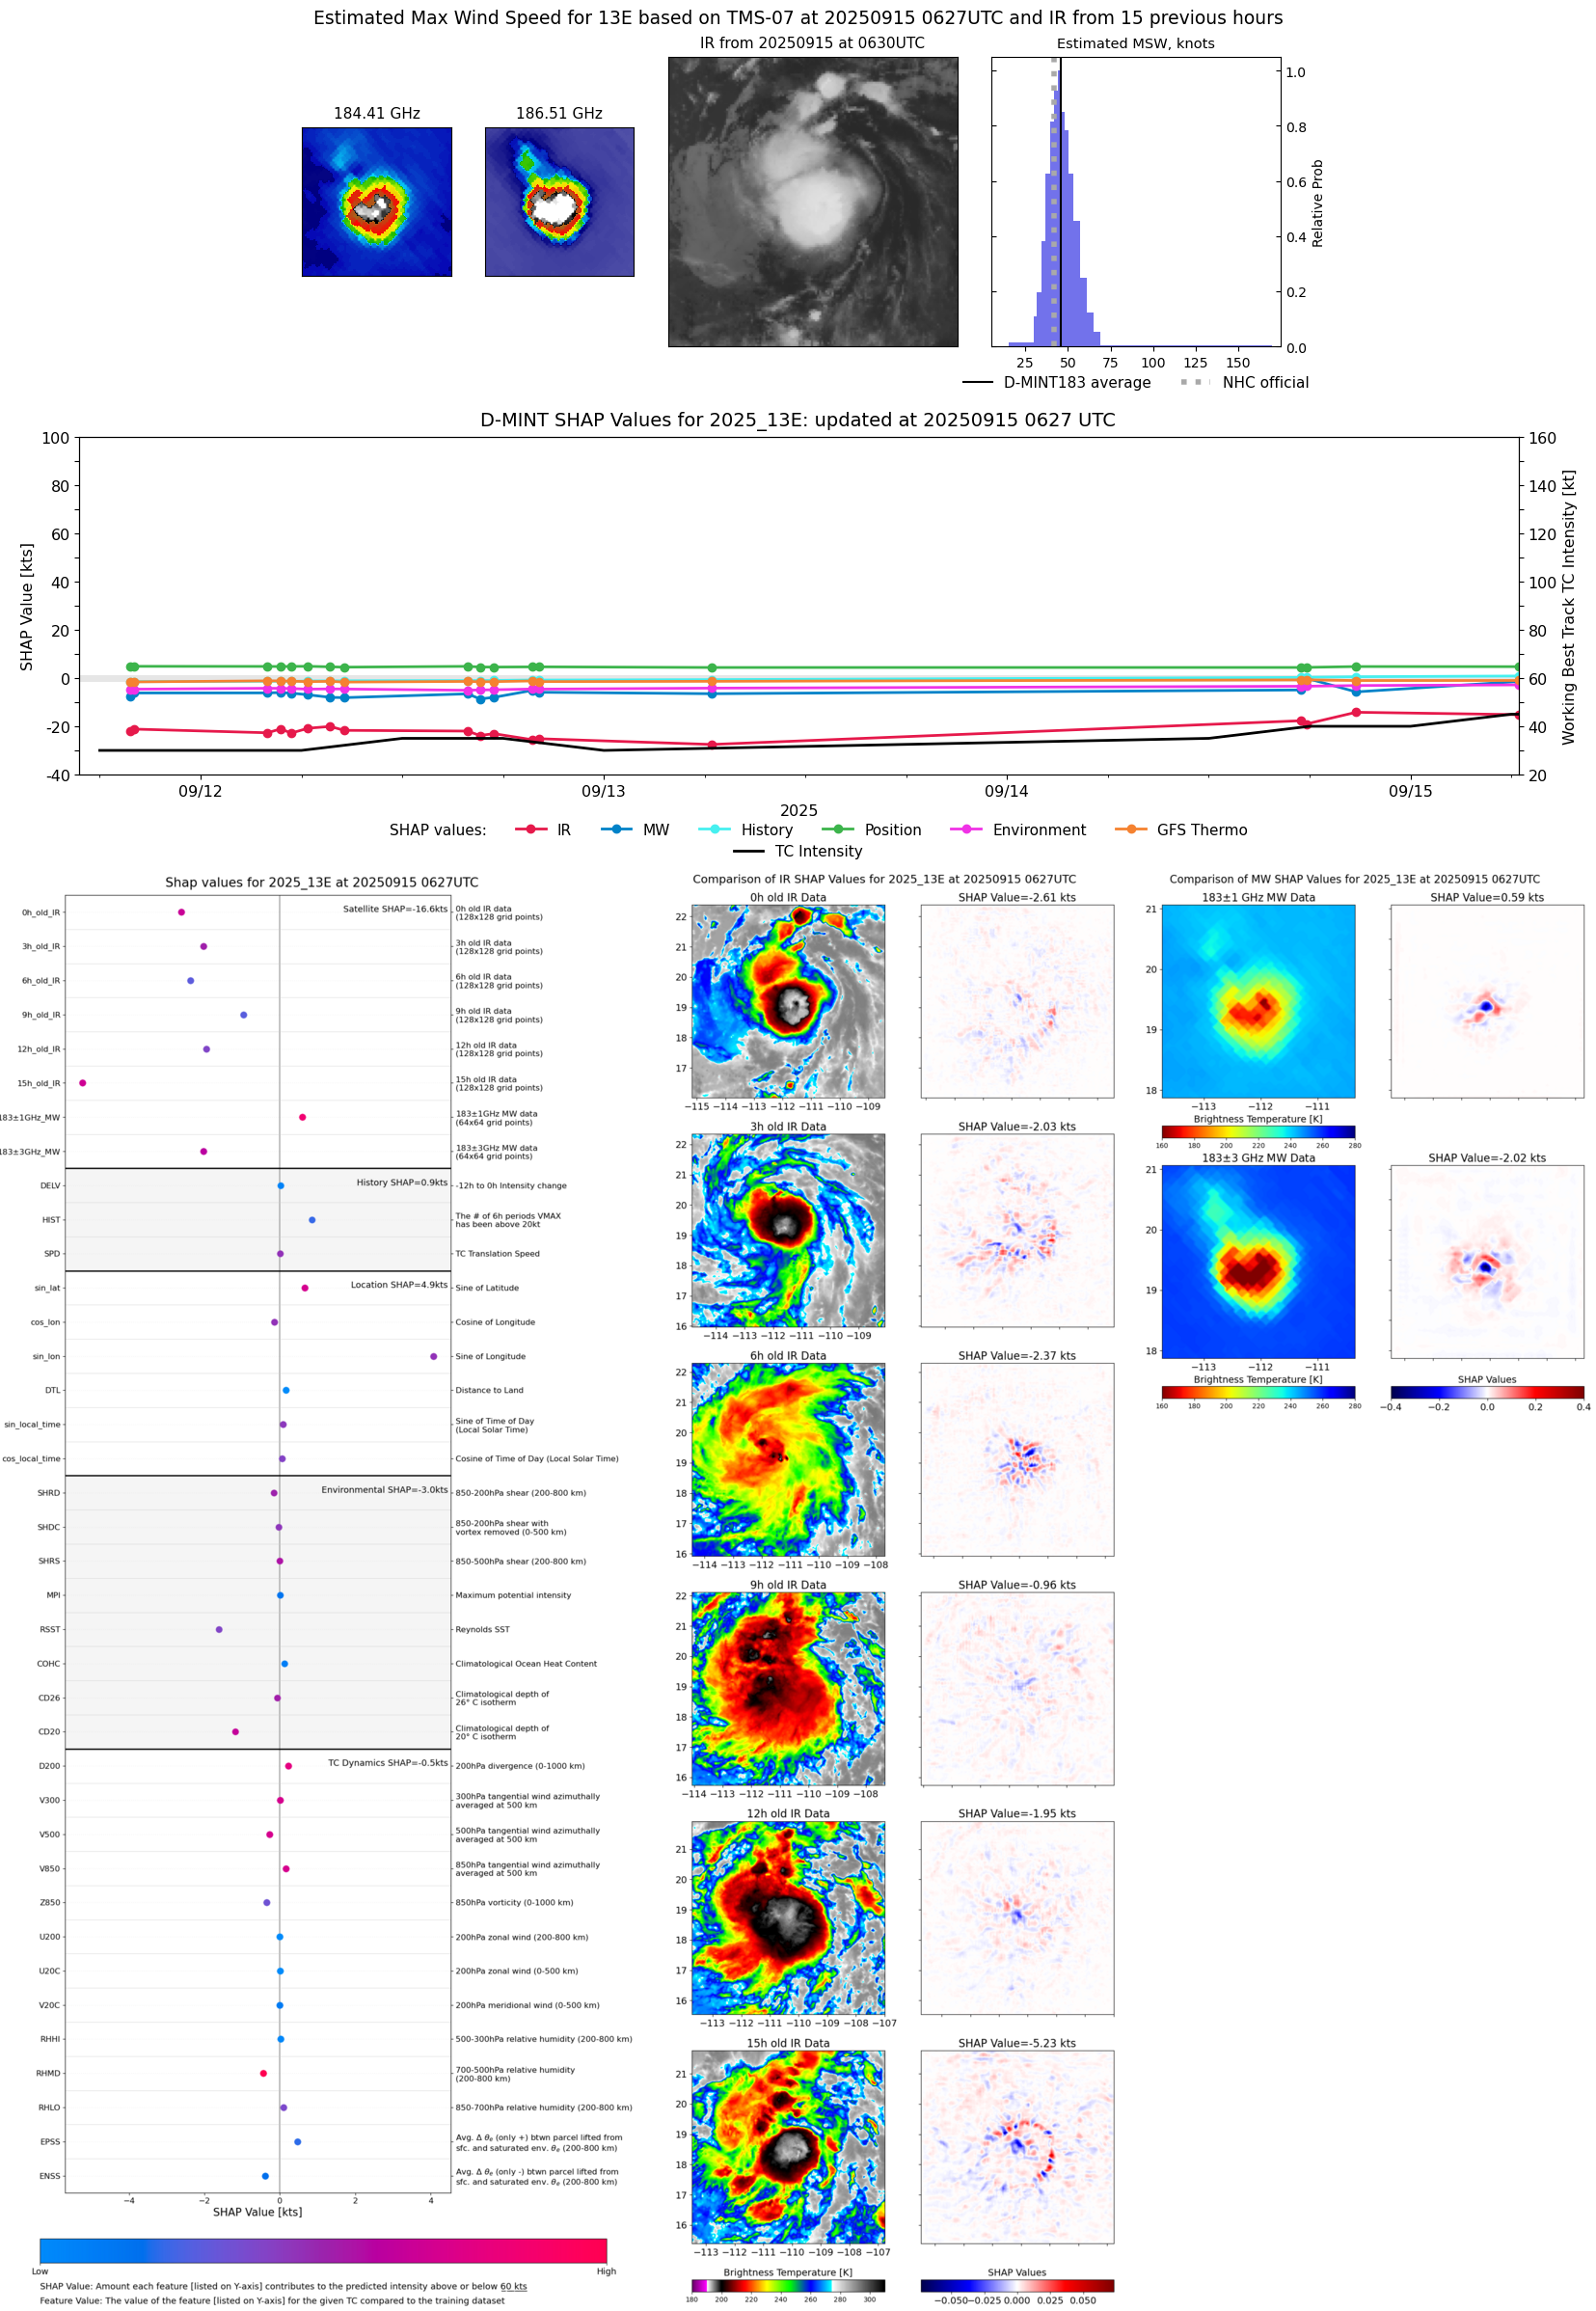 |
| 20250915 | 0608 UTC | TMS06 | 998 hPa | 45 kts | 40 kts | 51 kts |  |
| 20250915 | 0513 UTC | GMI | 998 hPa | 44 kts | 39 kts | 49 kts |  |
| 20250915 | 0136 UTC | WSFM01 | 1000 hPa | 37 kts | 33 kts | 42 kts |  |
| 20250914 | 2315 UTC | SSMISF18 | 1004 hPa | 34 kts | 31 kts | 39 kts | 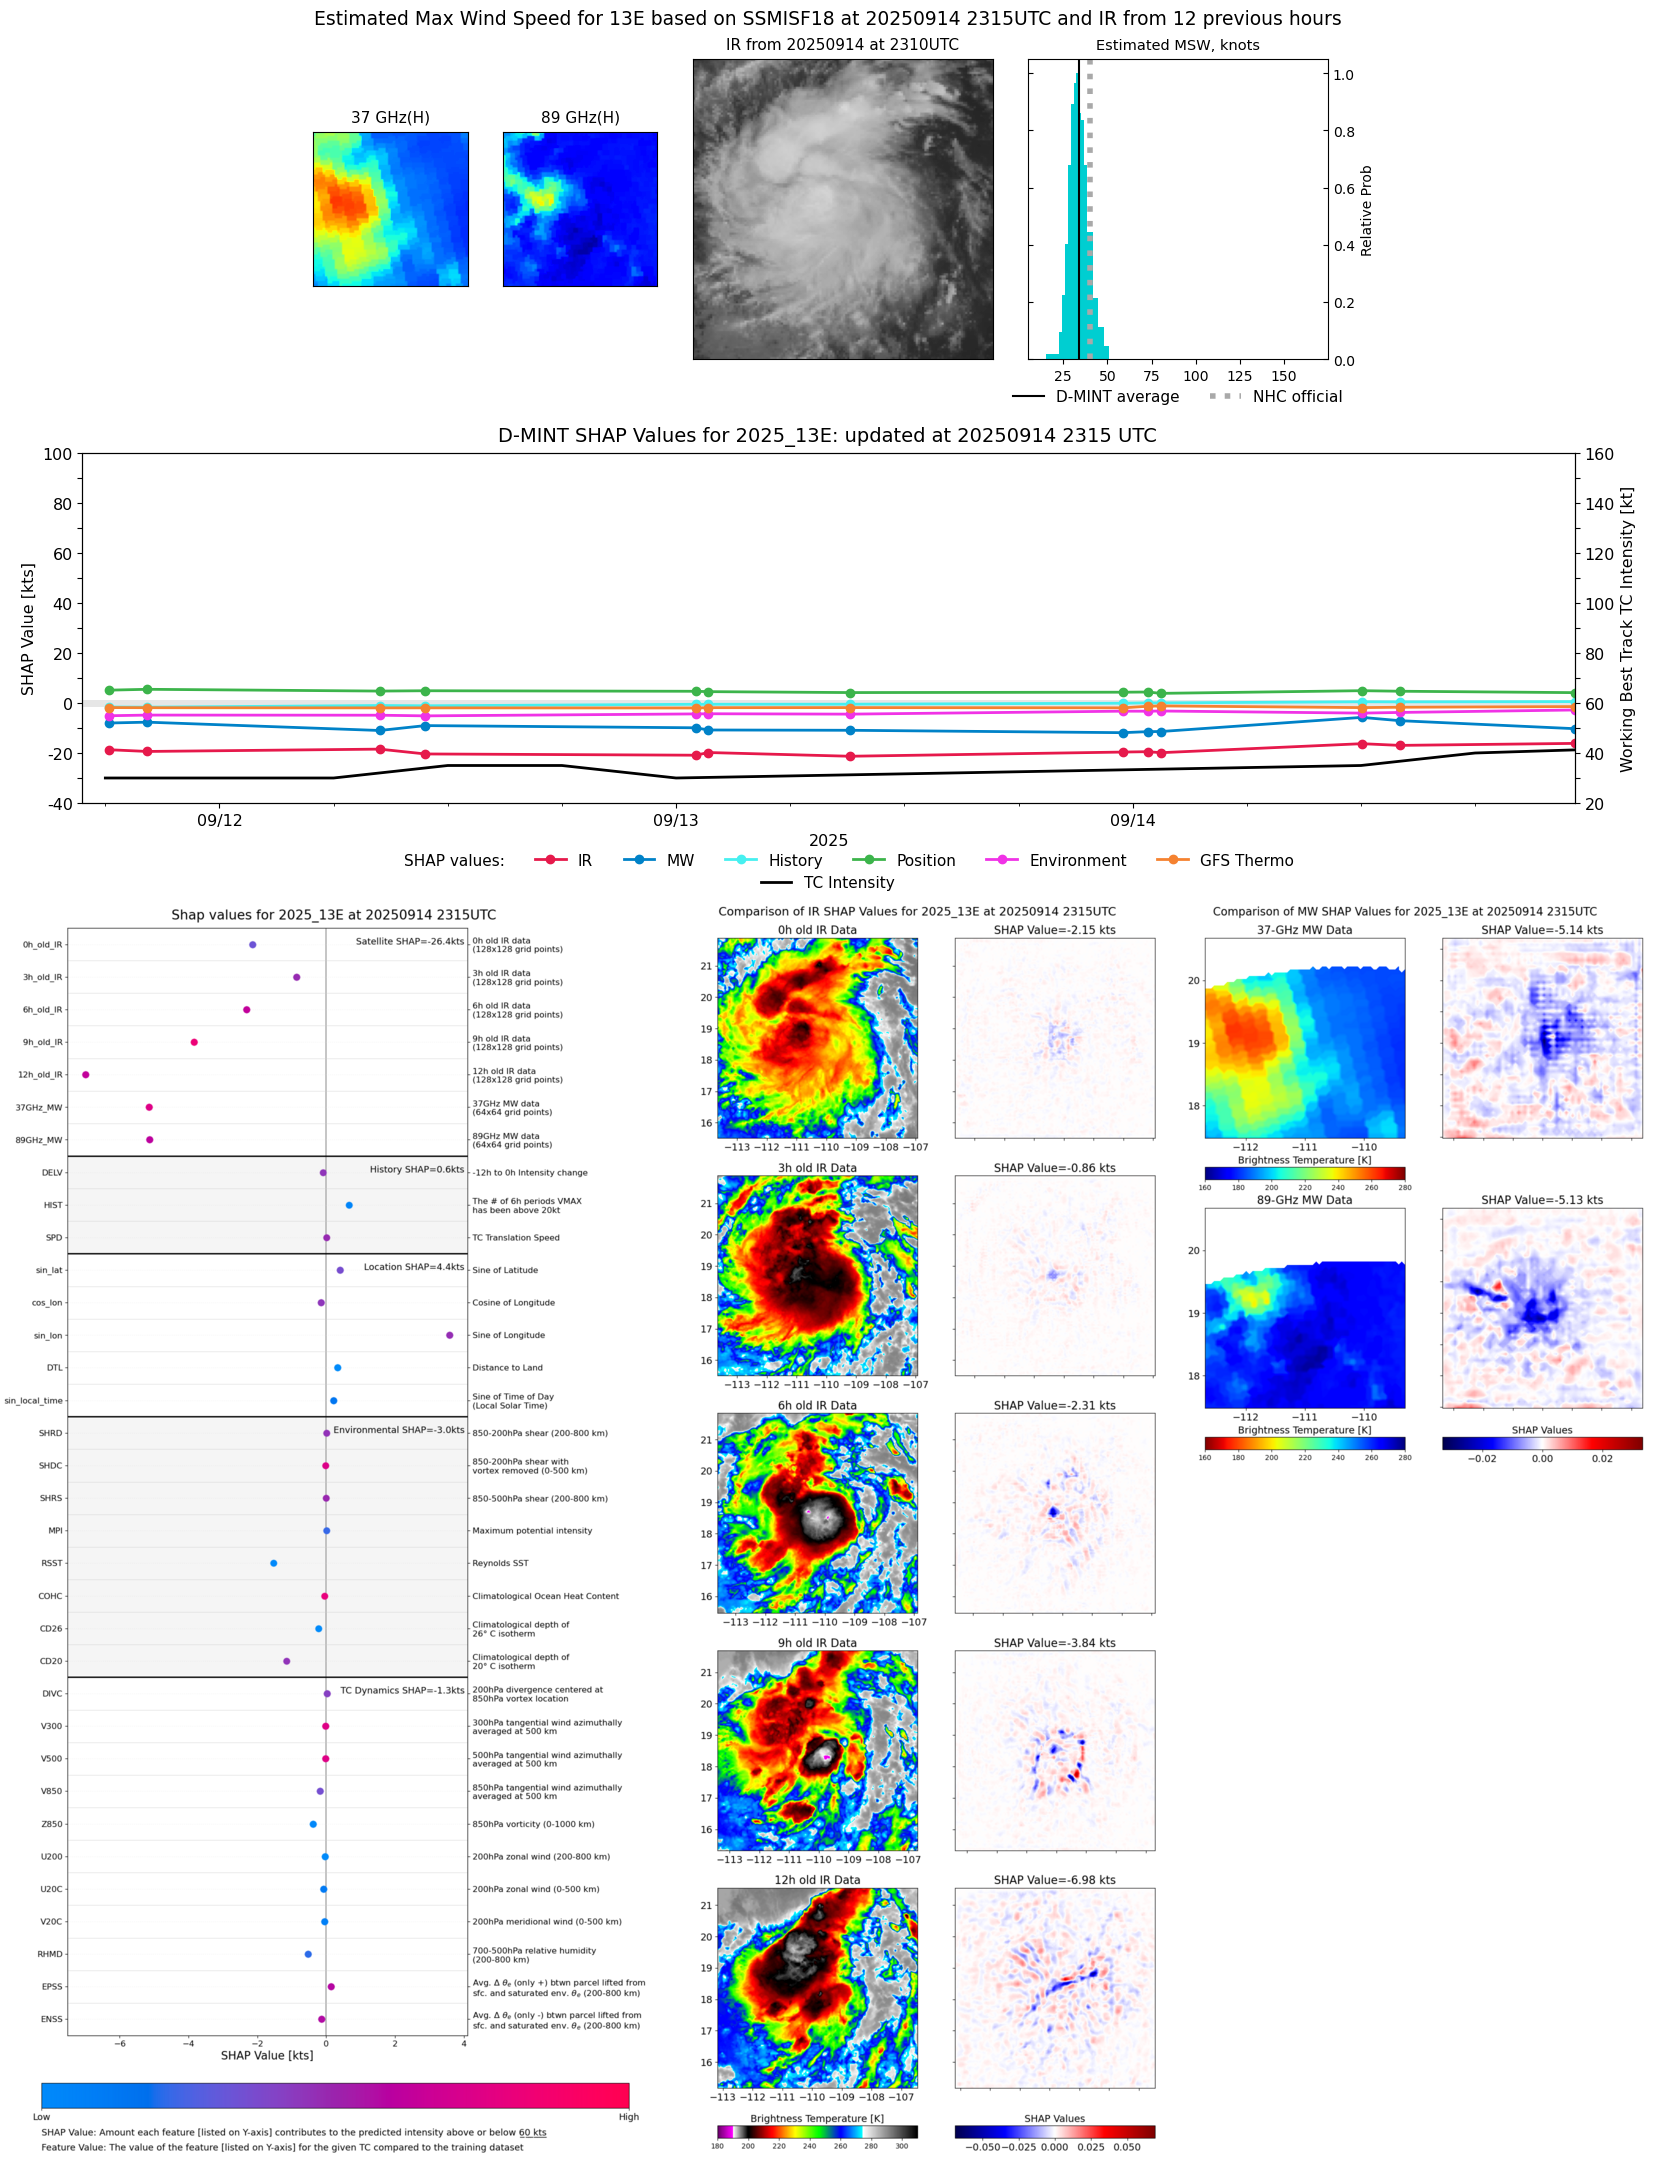 |
| 20250914 | 2315 UTC | SSMISF18 | 1004 hPa | 34 kts | 31 kts | 39 kts | 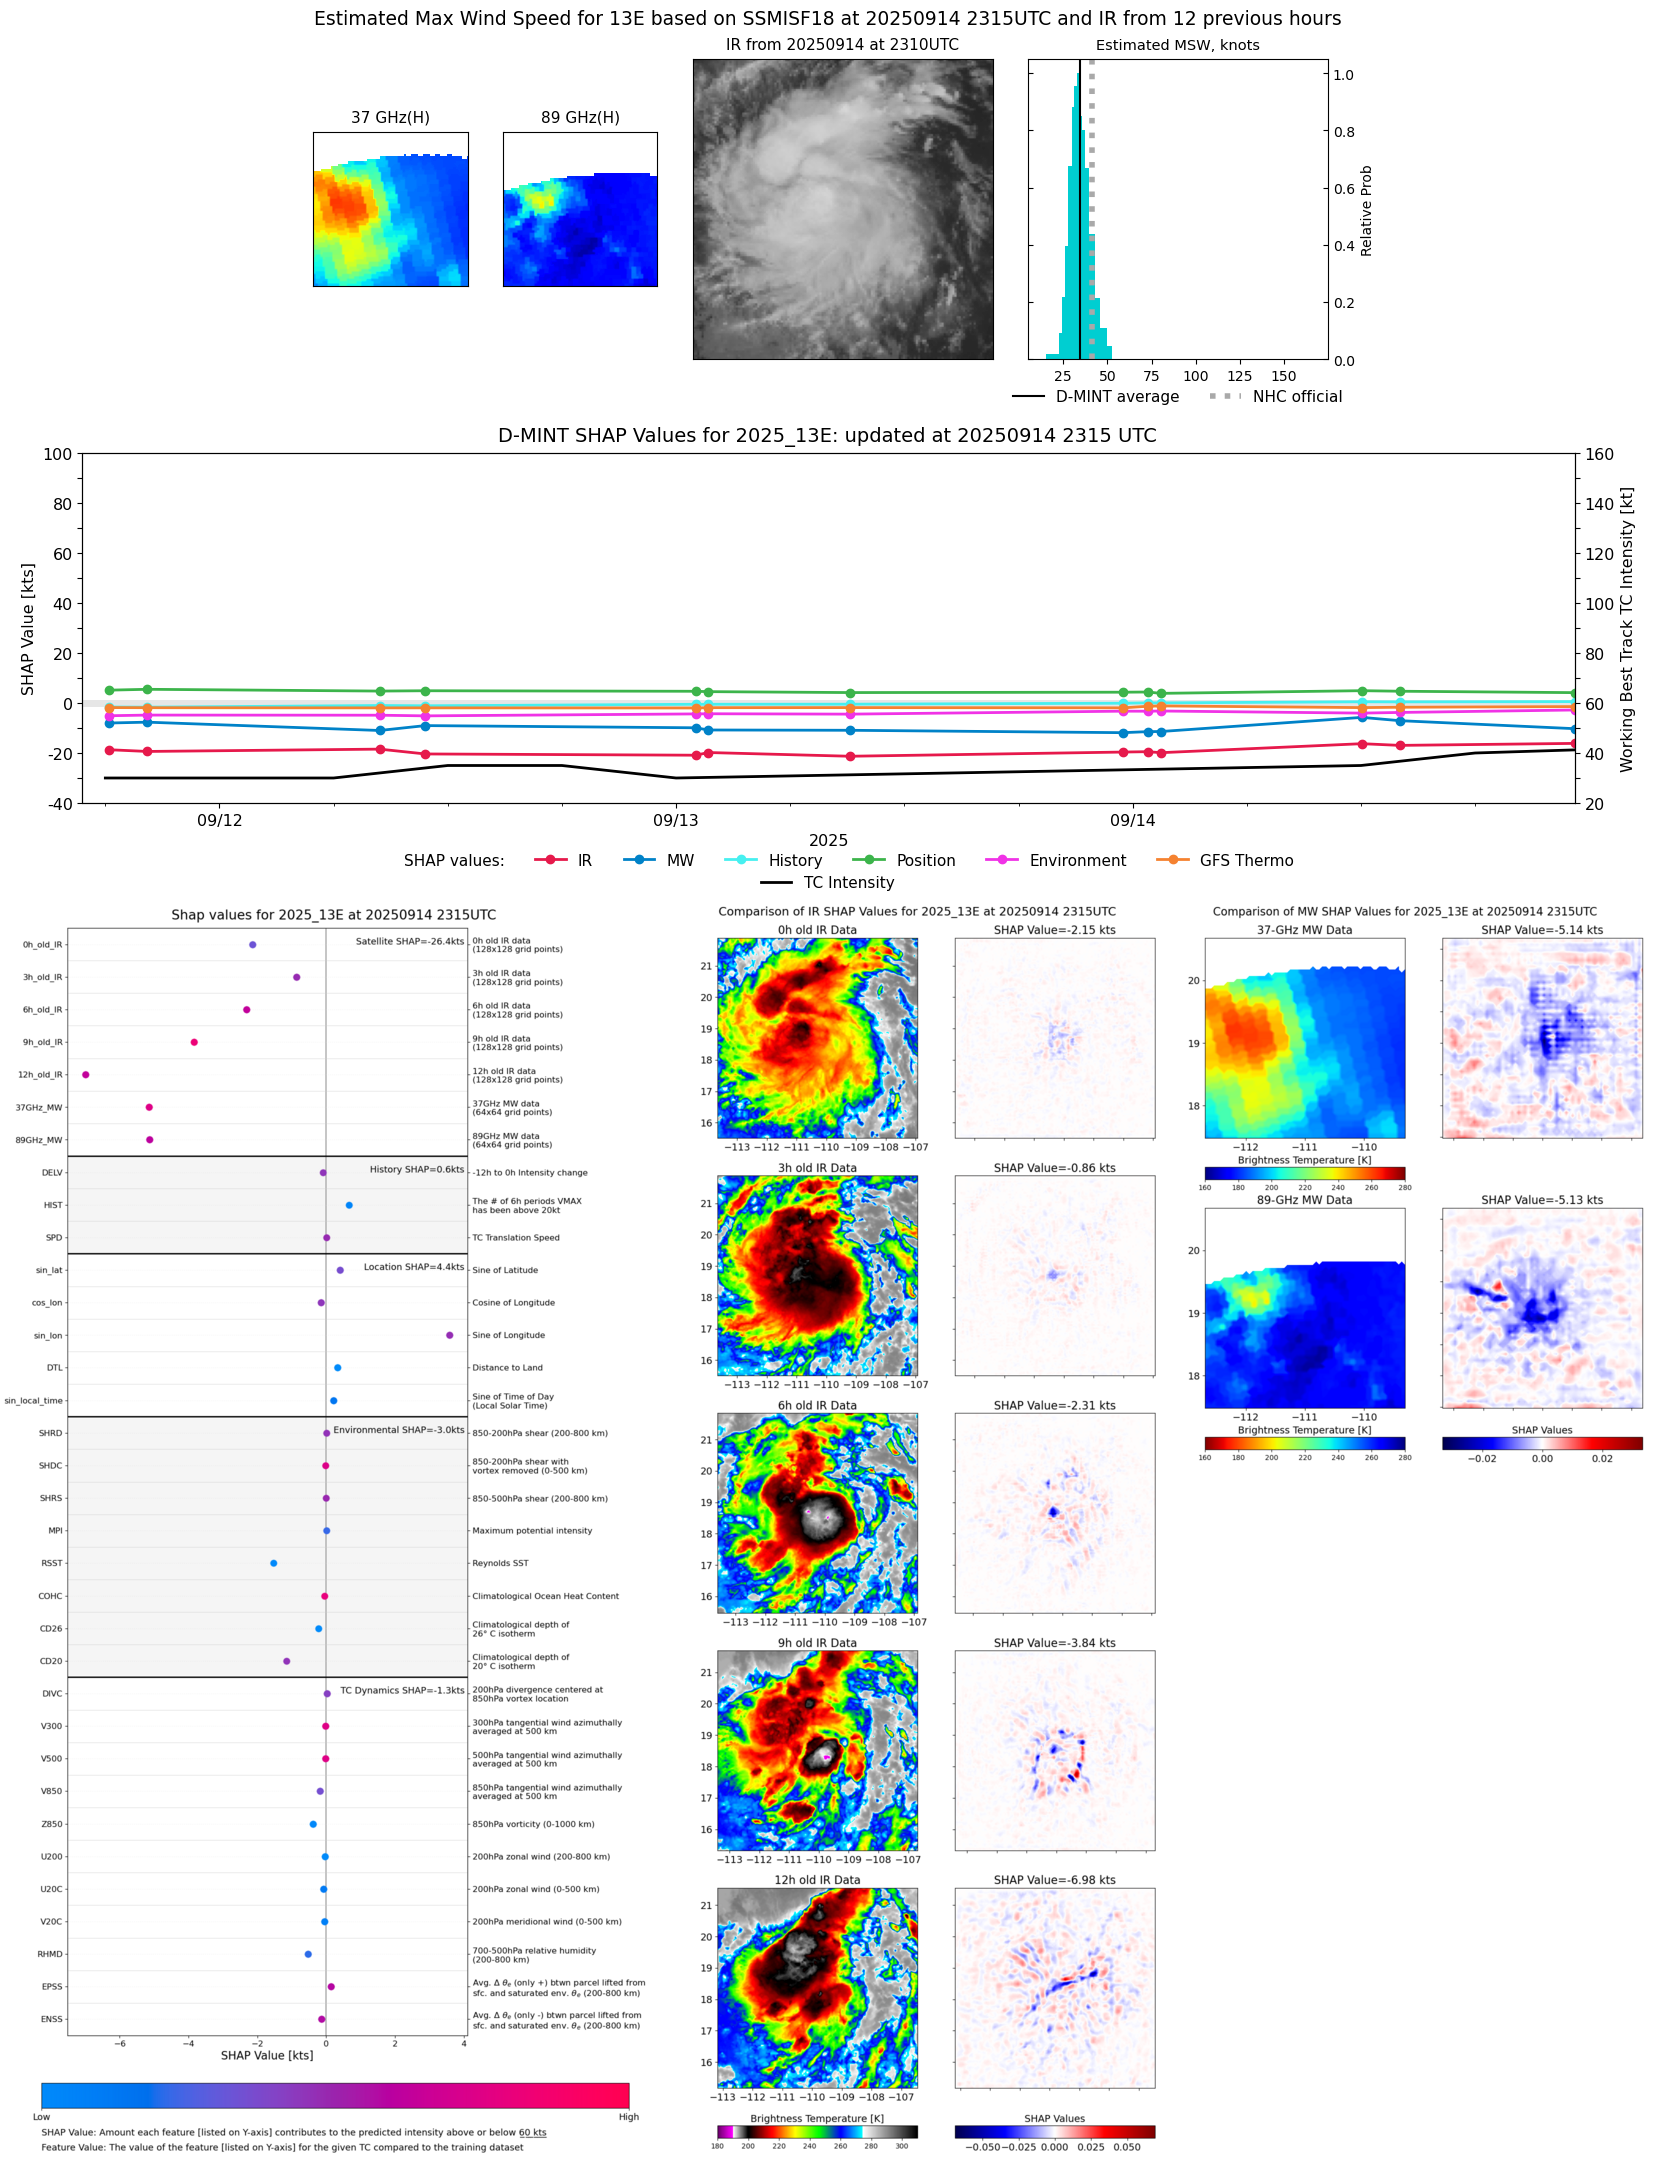 |
| 20250914 | 2046 UTC | ATMS-N21 | 999 hPa | 42 kts | 37 kts | 48 kts | 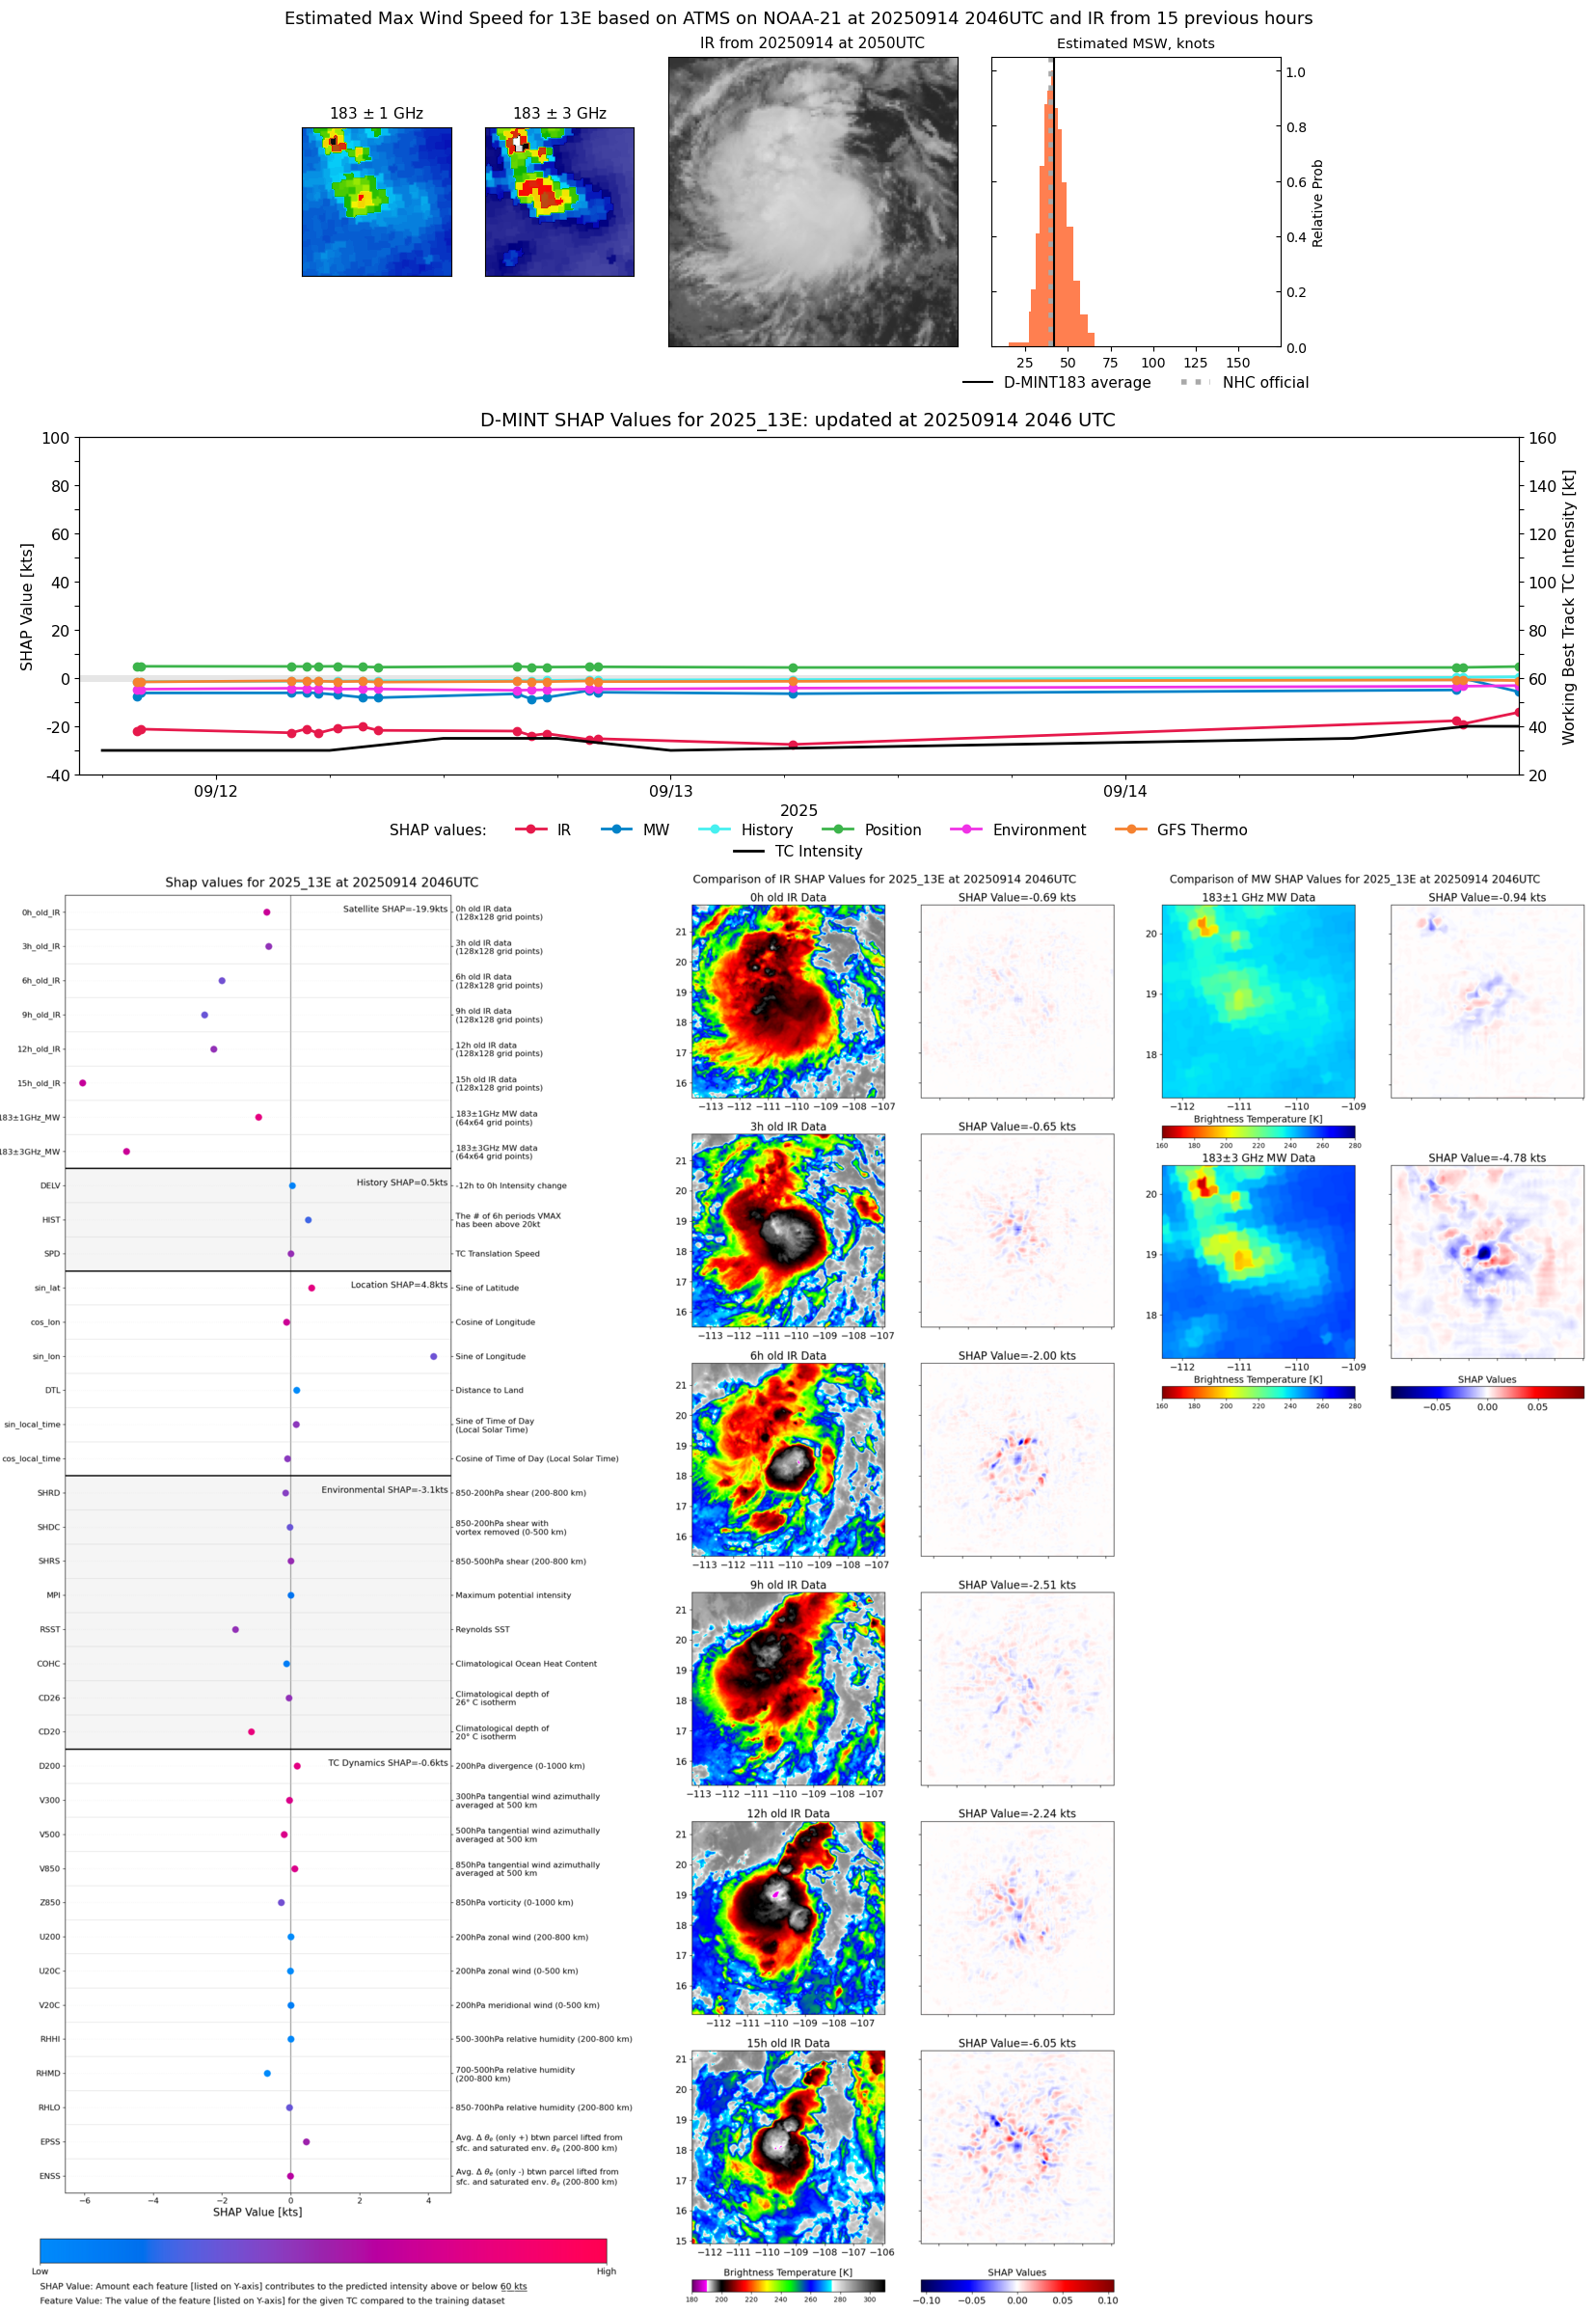 |
| 20250914 | 2044 UTC | AMSR2 | 1003 hPa | 34 kts | 30 kts | 39 kts | 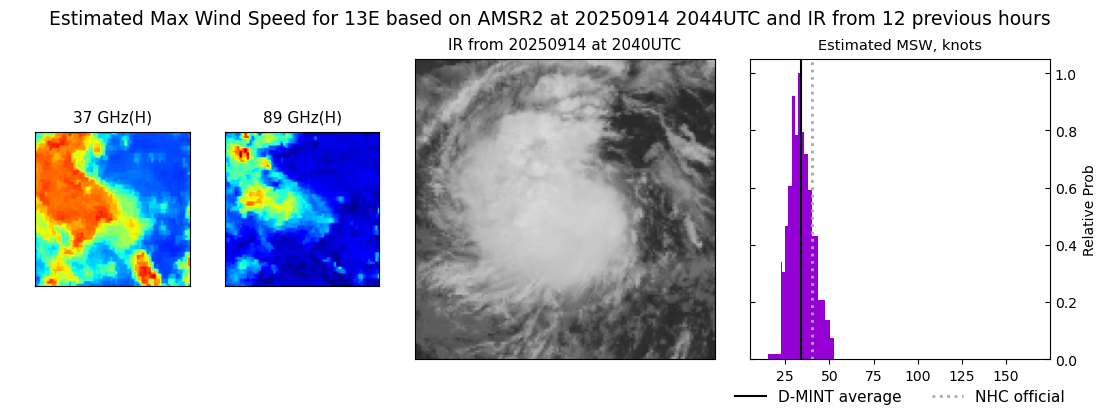 |
| 20250914 | 1748 UTC | AWS | 997 hPa | 42 kts | 38 kts | 47 kts | 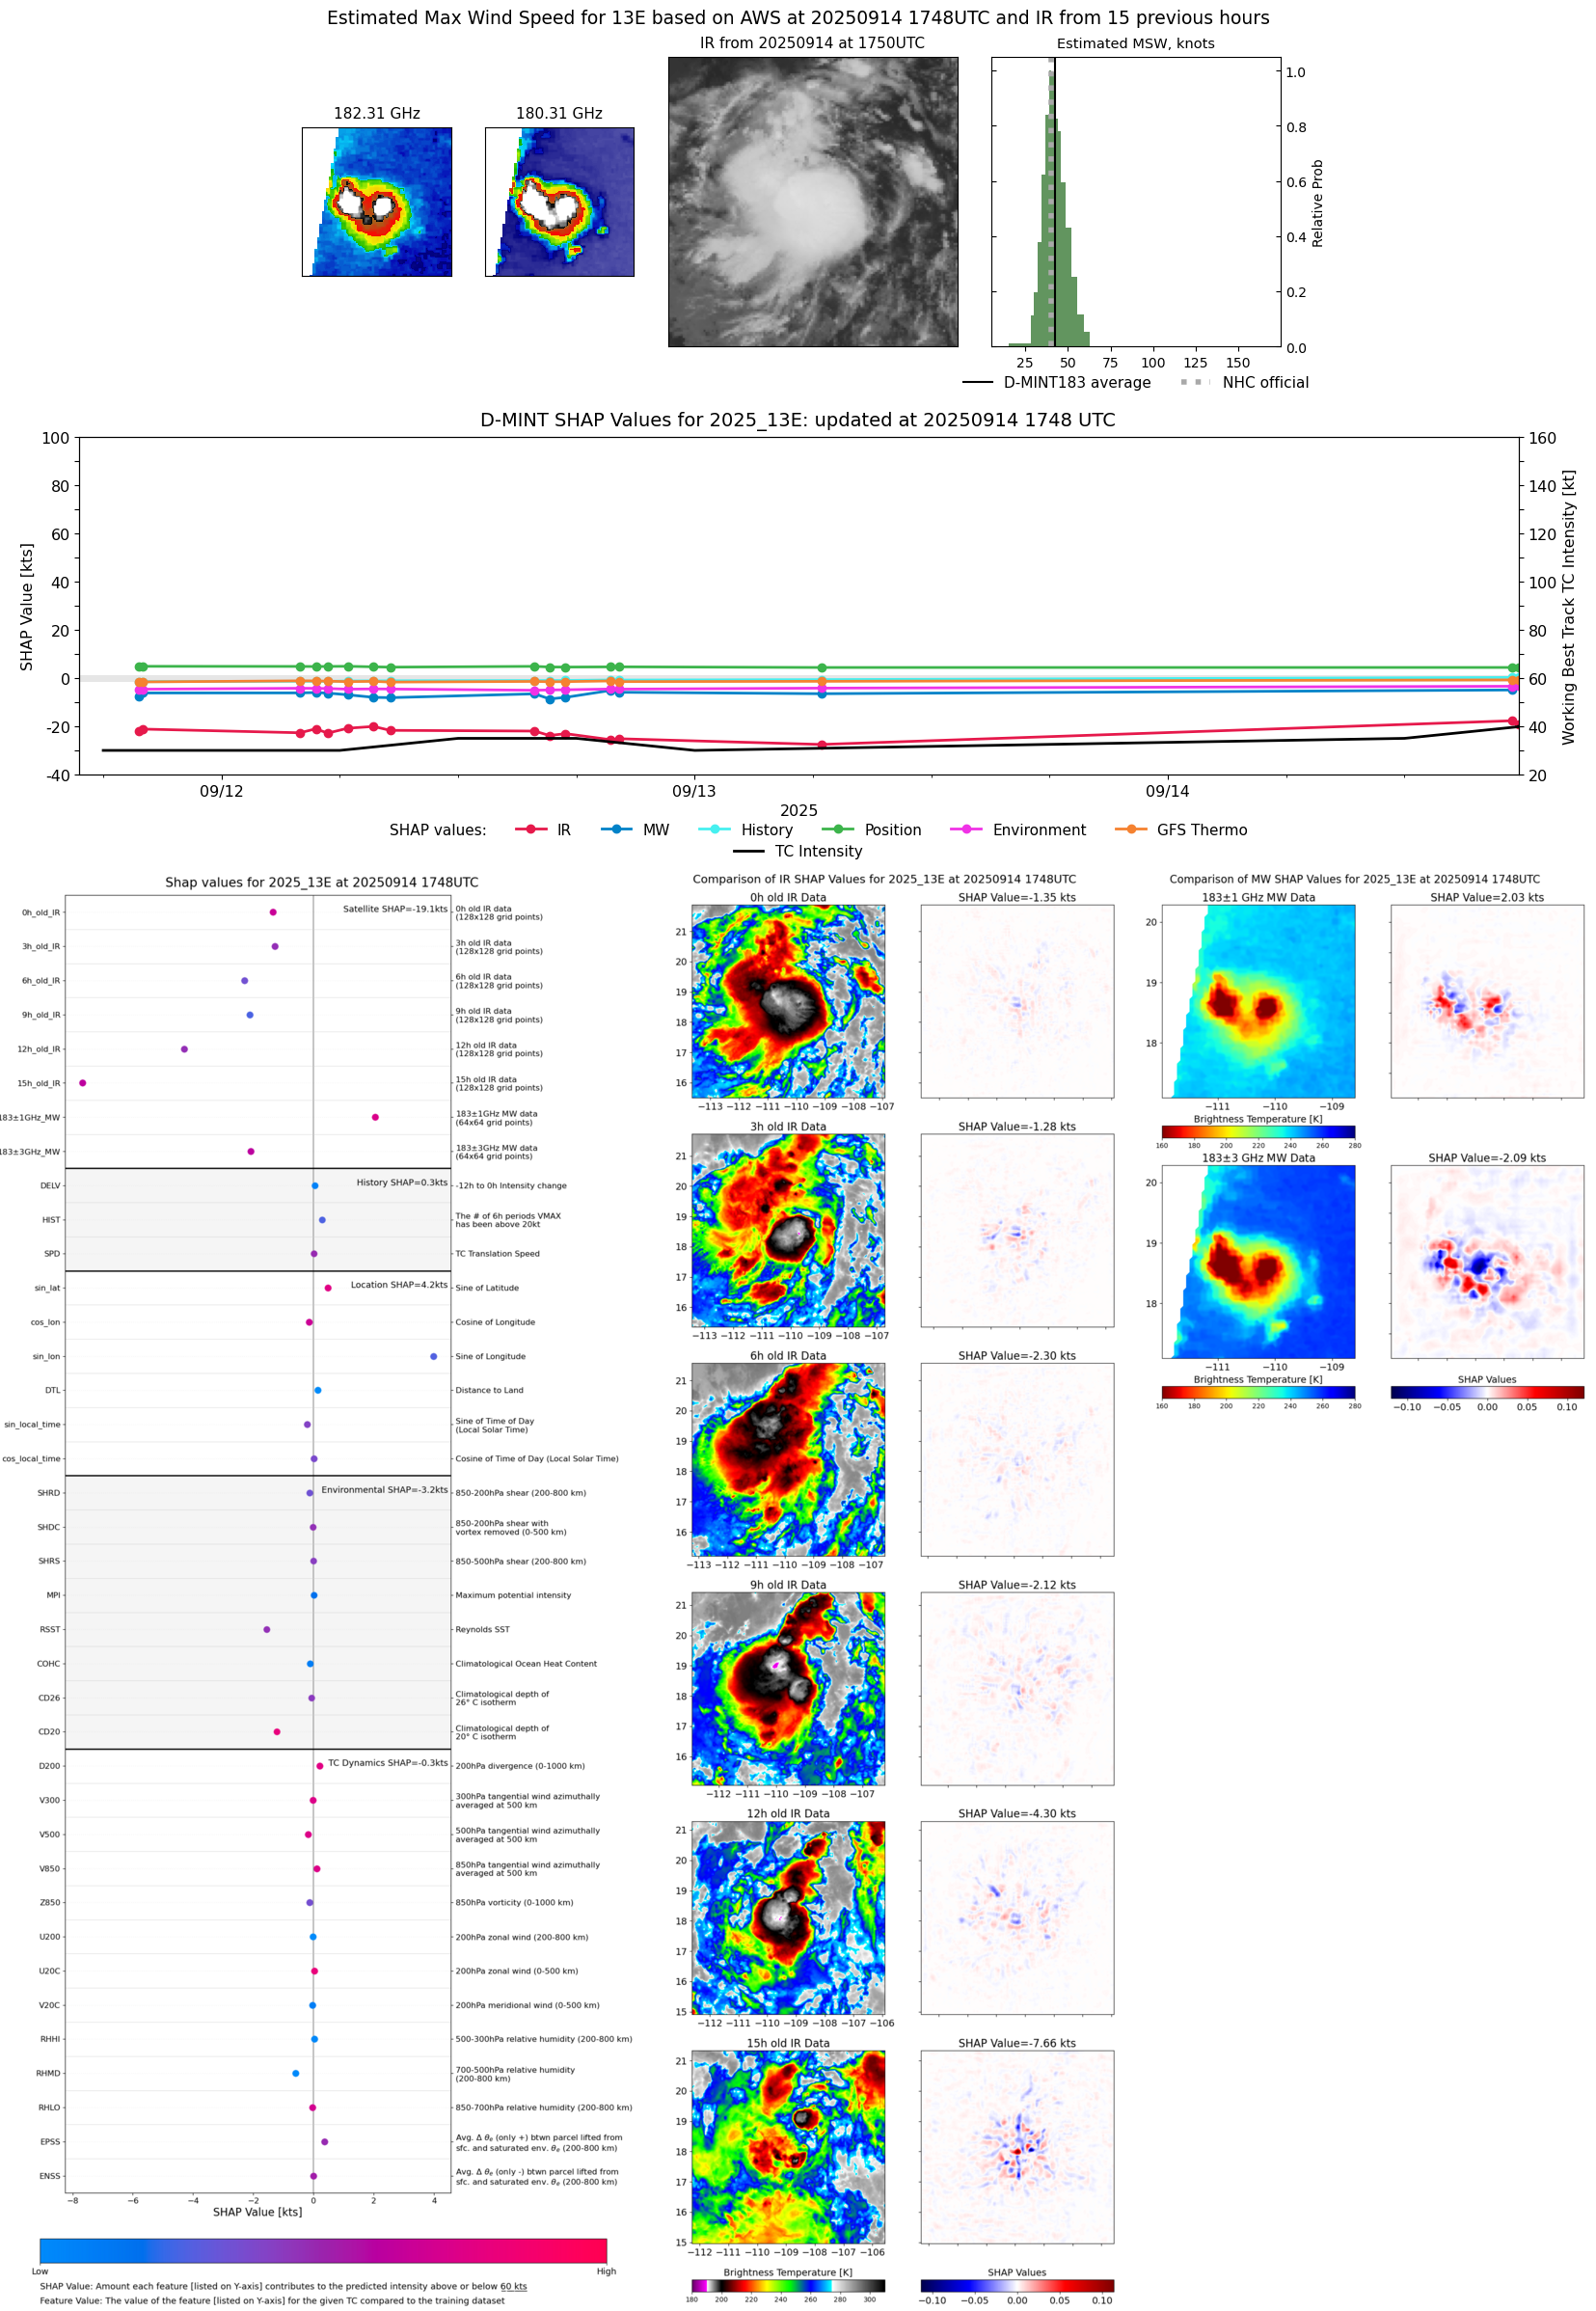 |
| 20250914 | 1728 UTC | TMS05 | 1003 hPa | 38 kts | 34 kts | 43 kts | 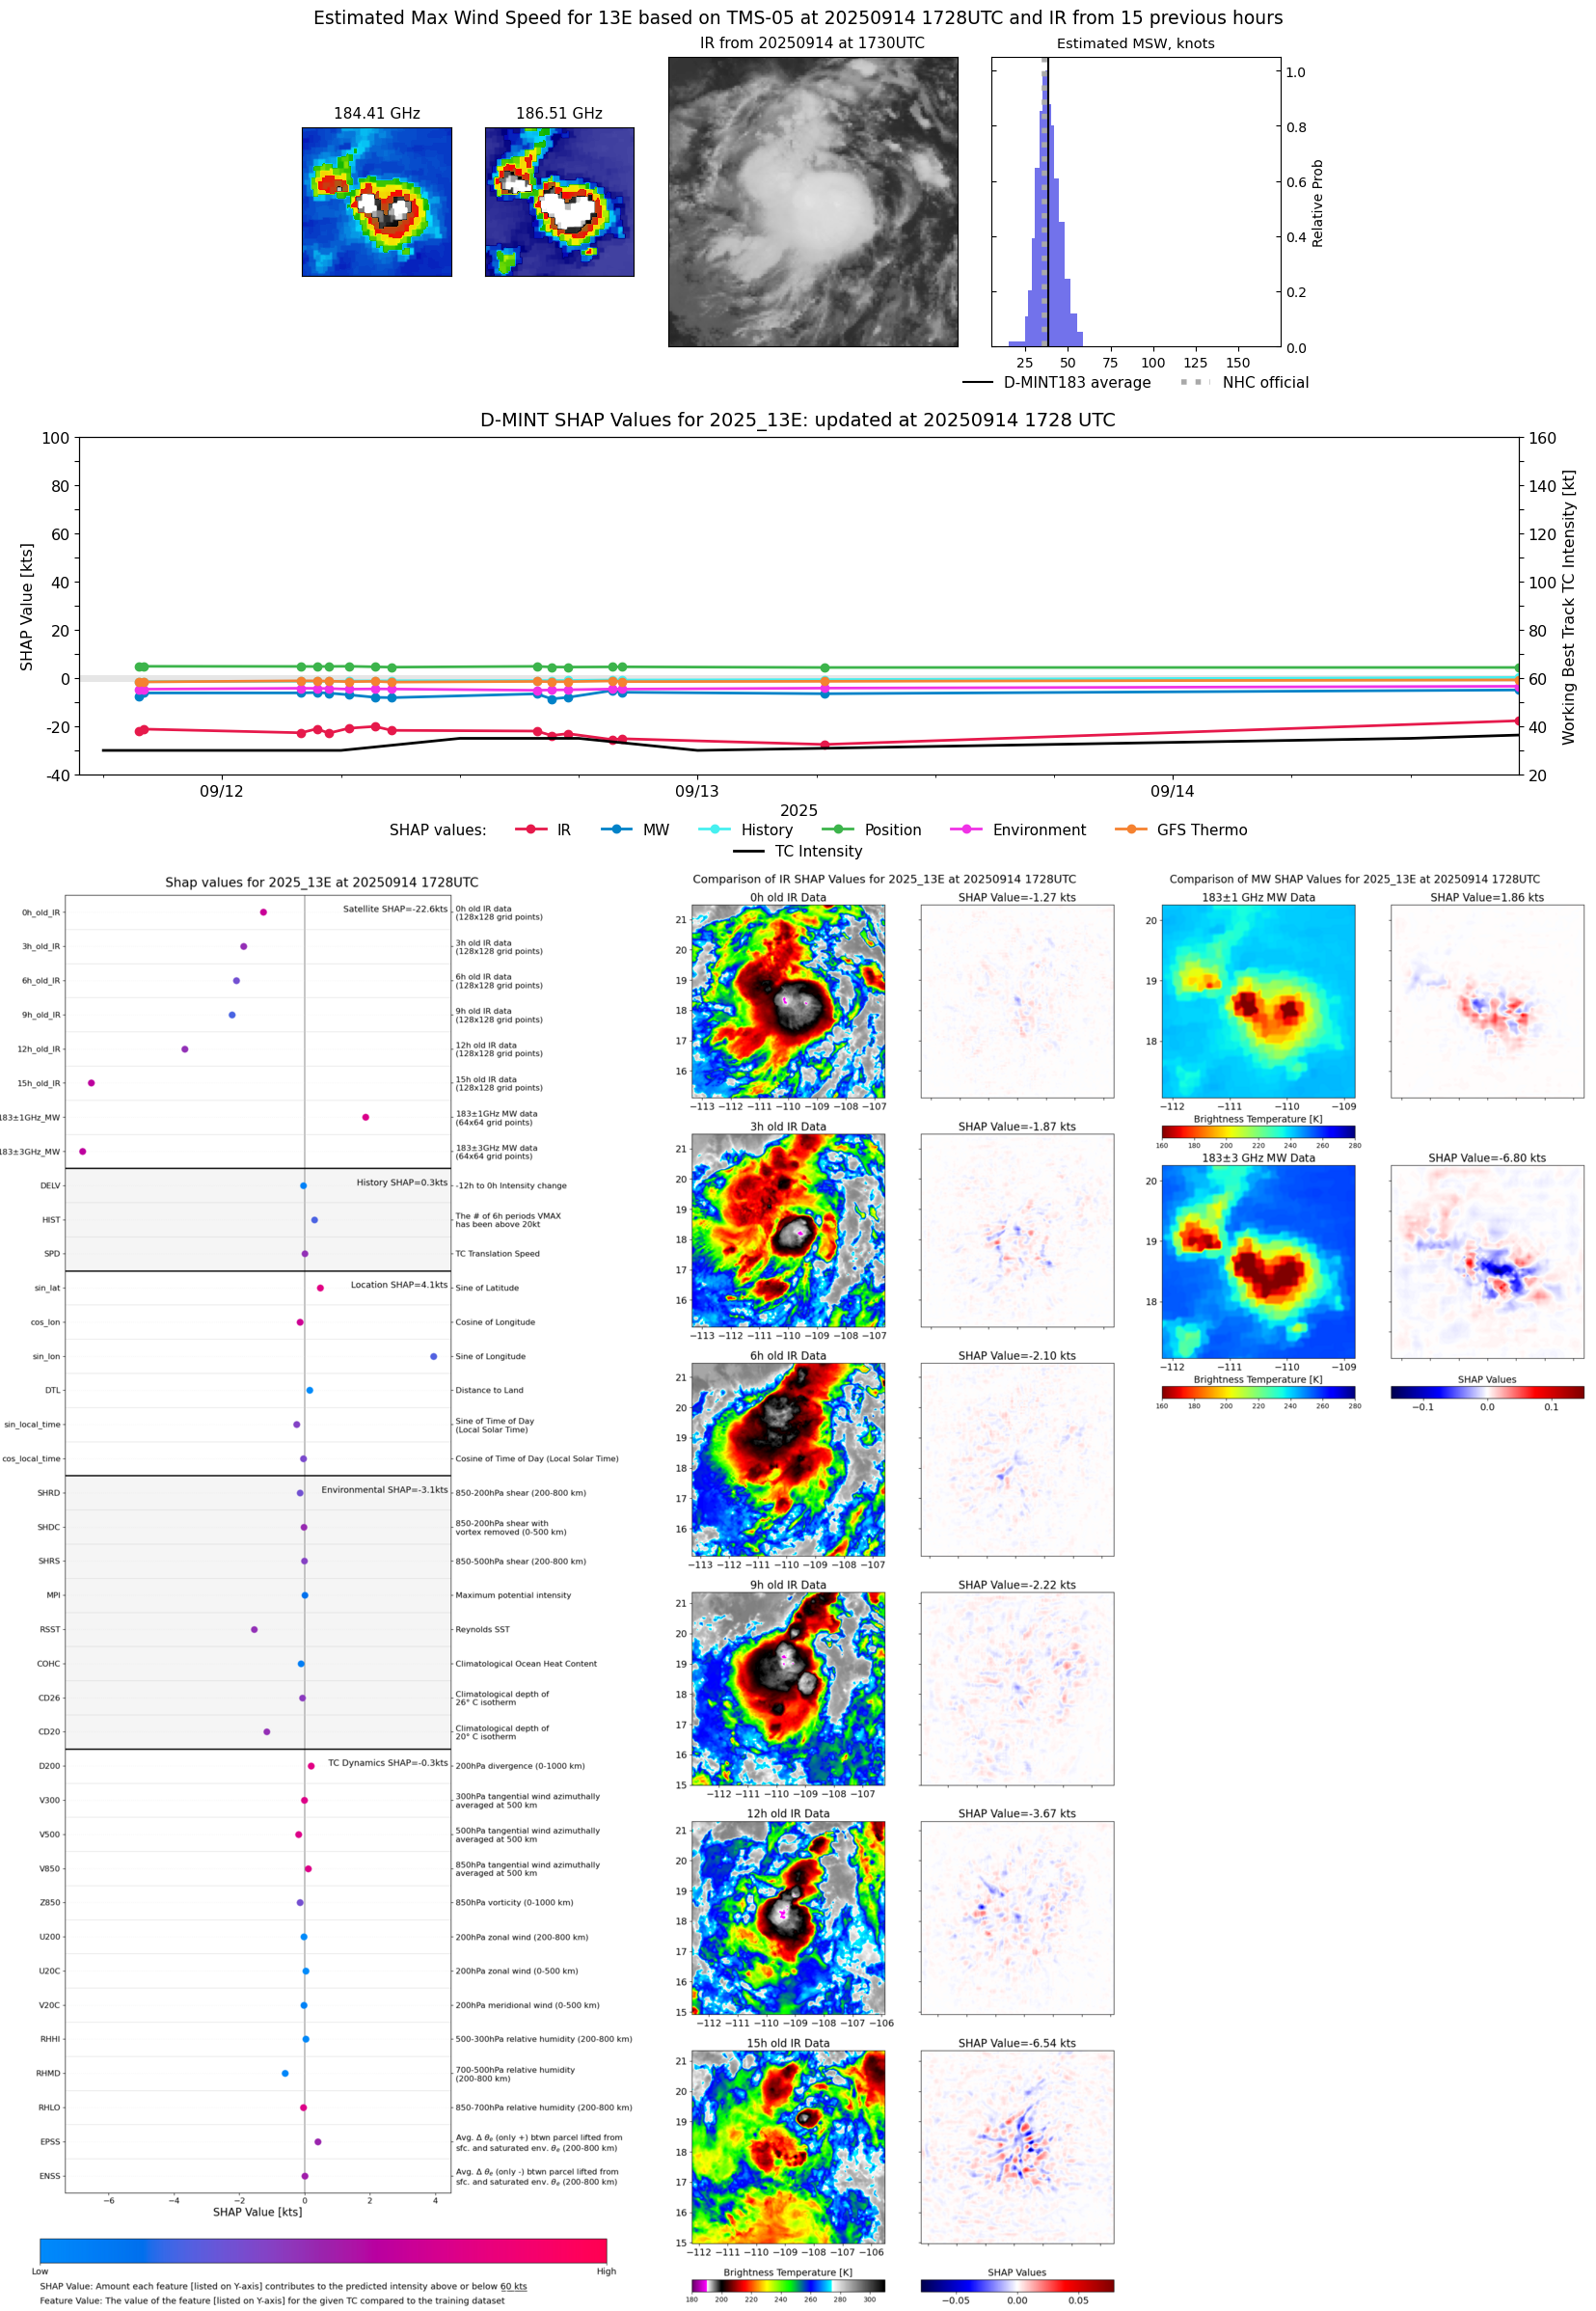 |
| 20250914 | 1402 UTC | SSMISF16 | 1007 hPa | 36 kts | 32 kts | 40 kts | 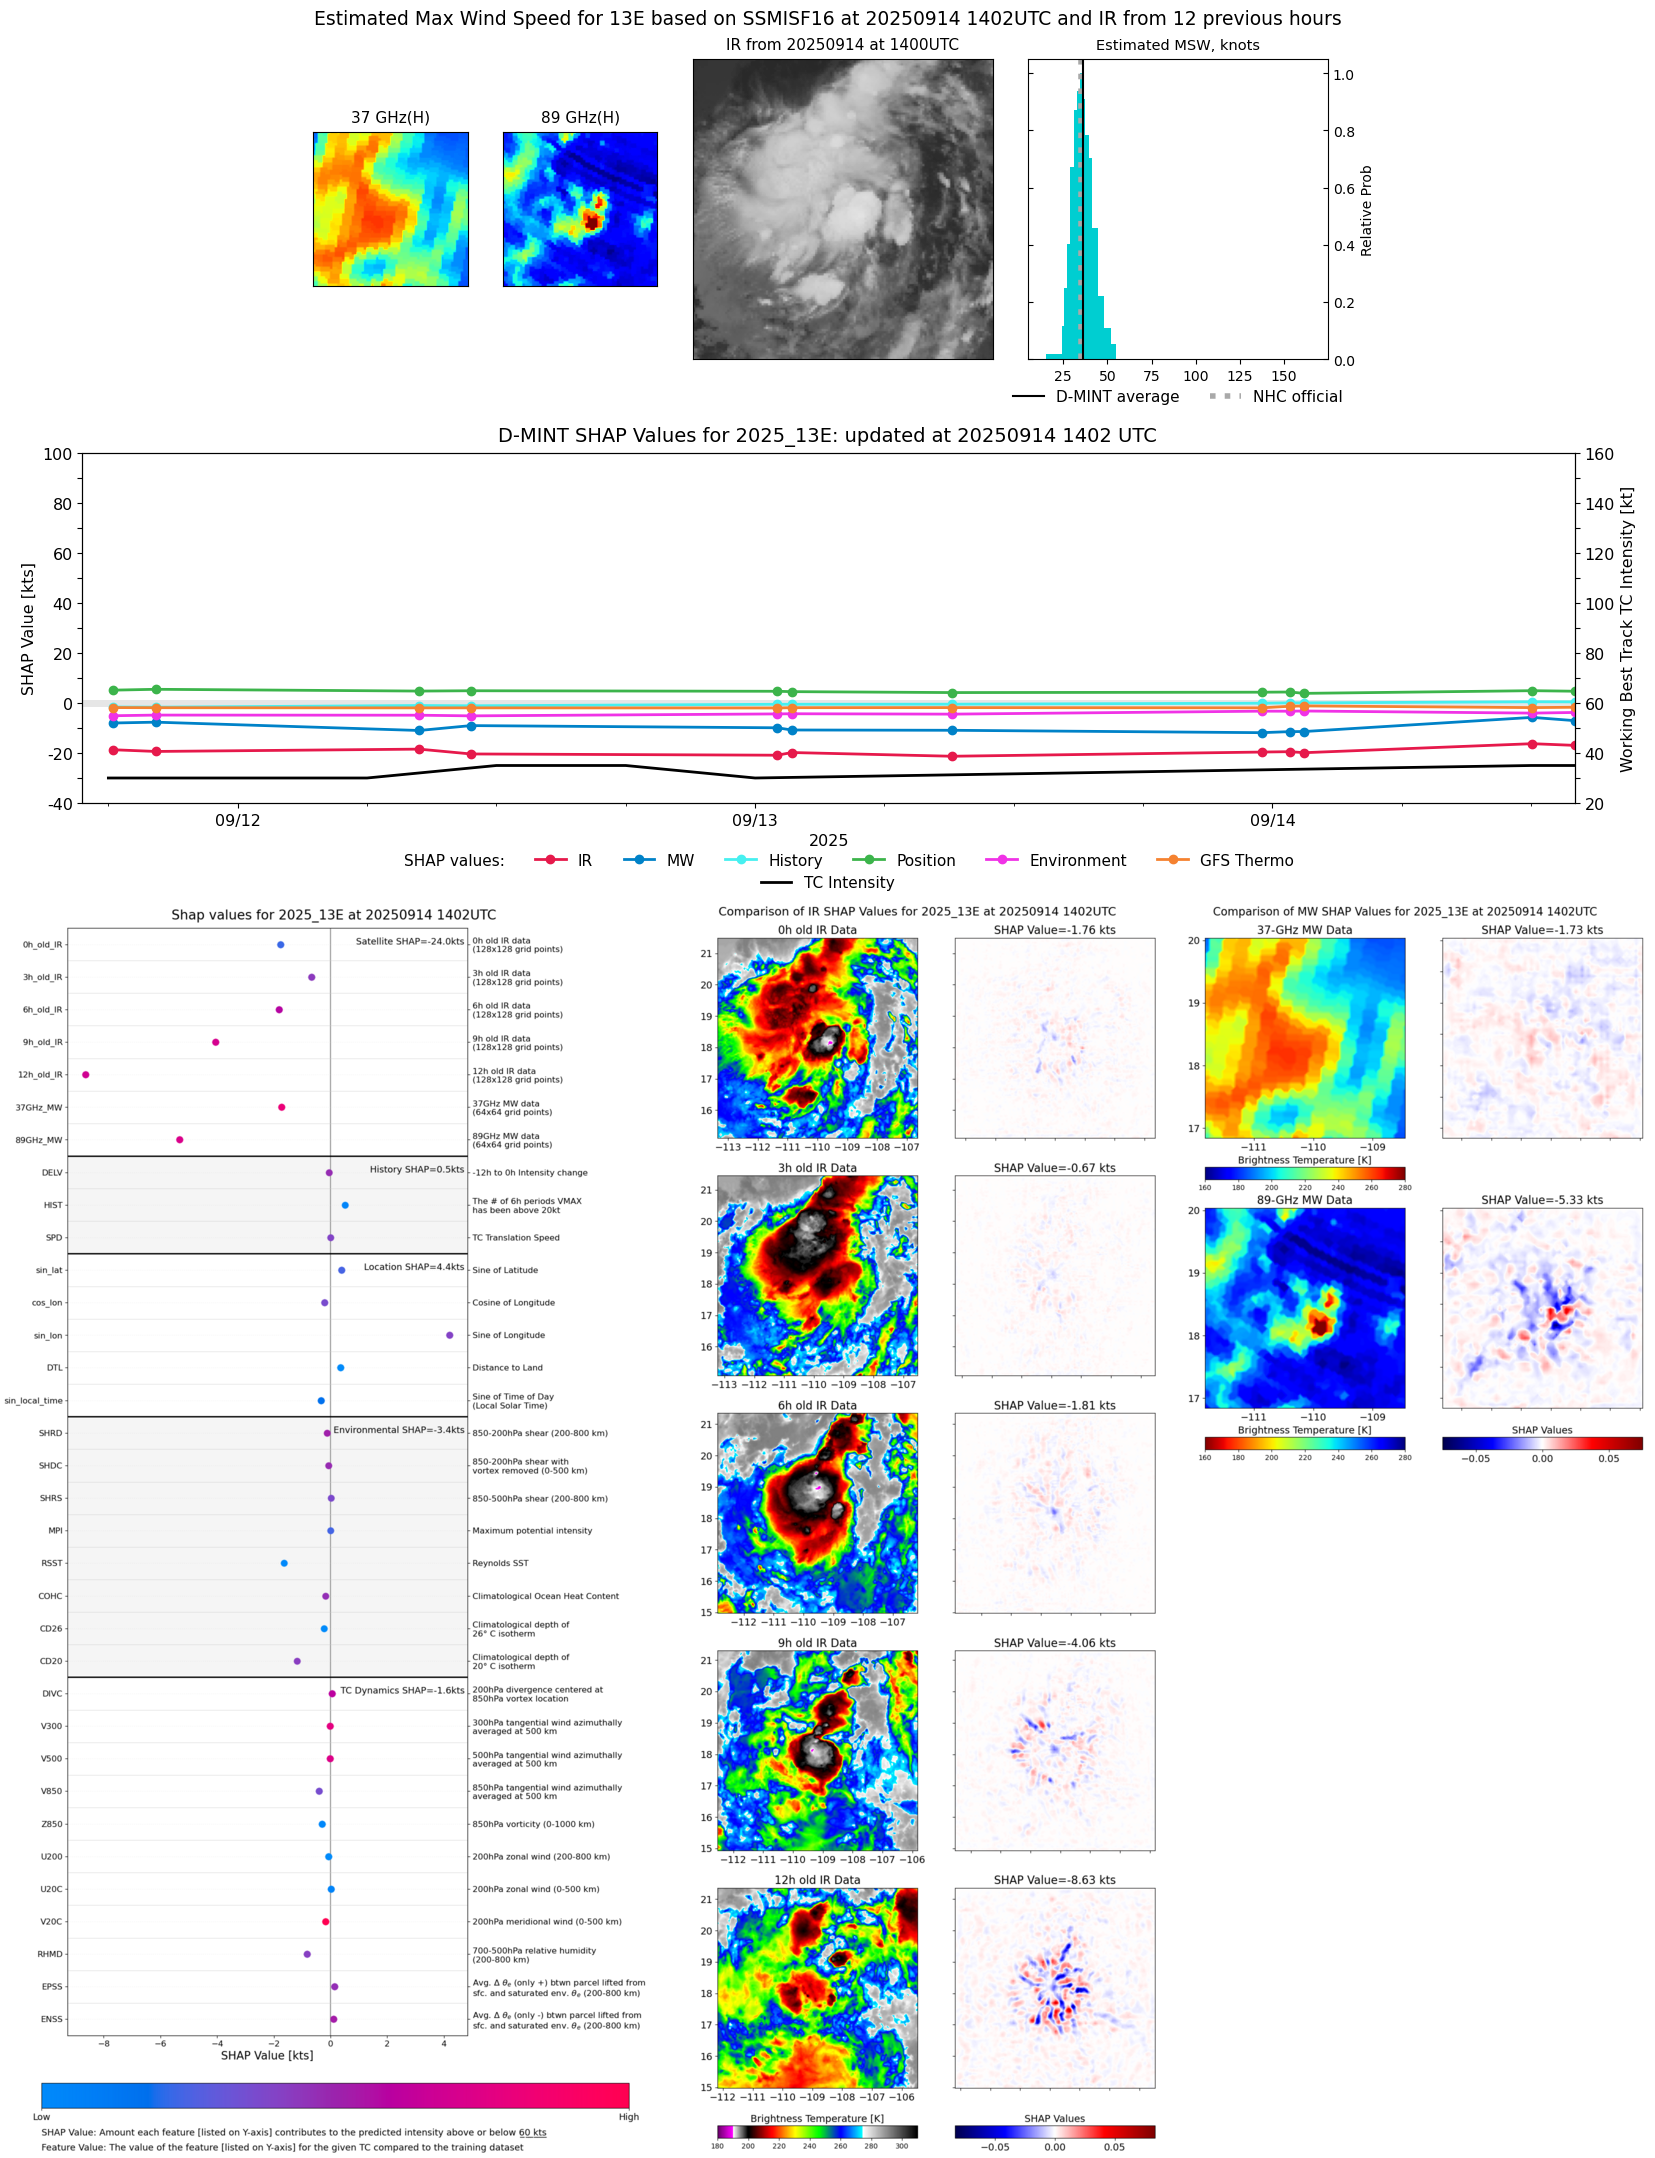 |
| 20250914 | 1203 UTC | SSMISF18 | 1007 hPa | 38 kts | 33 kts | 43 kts | 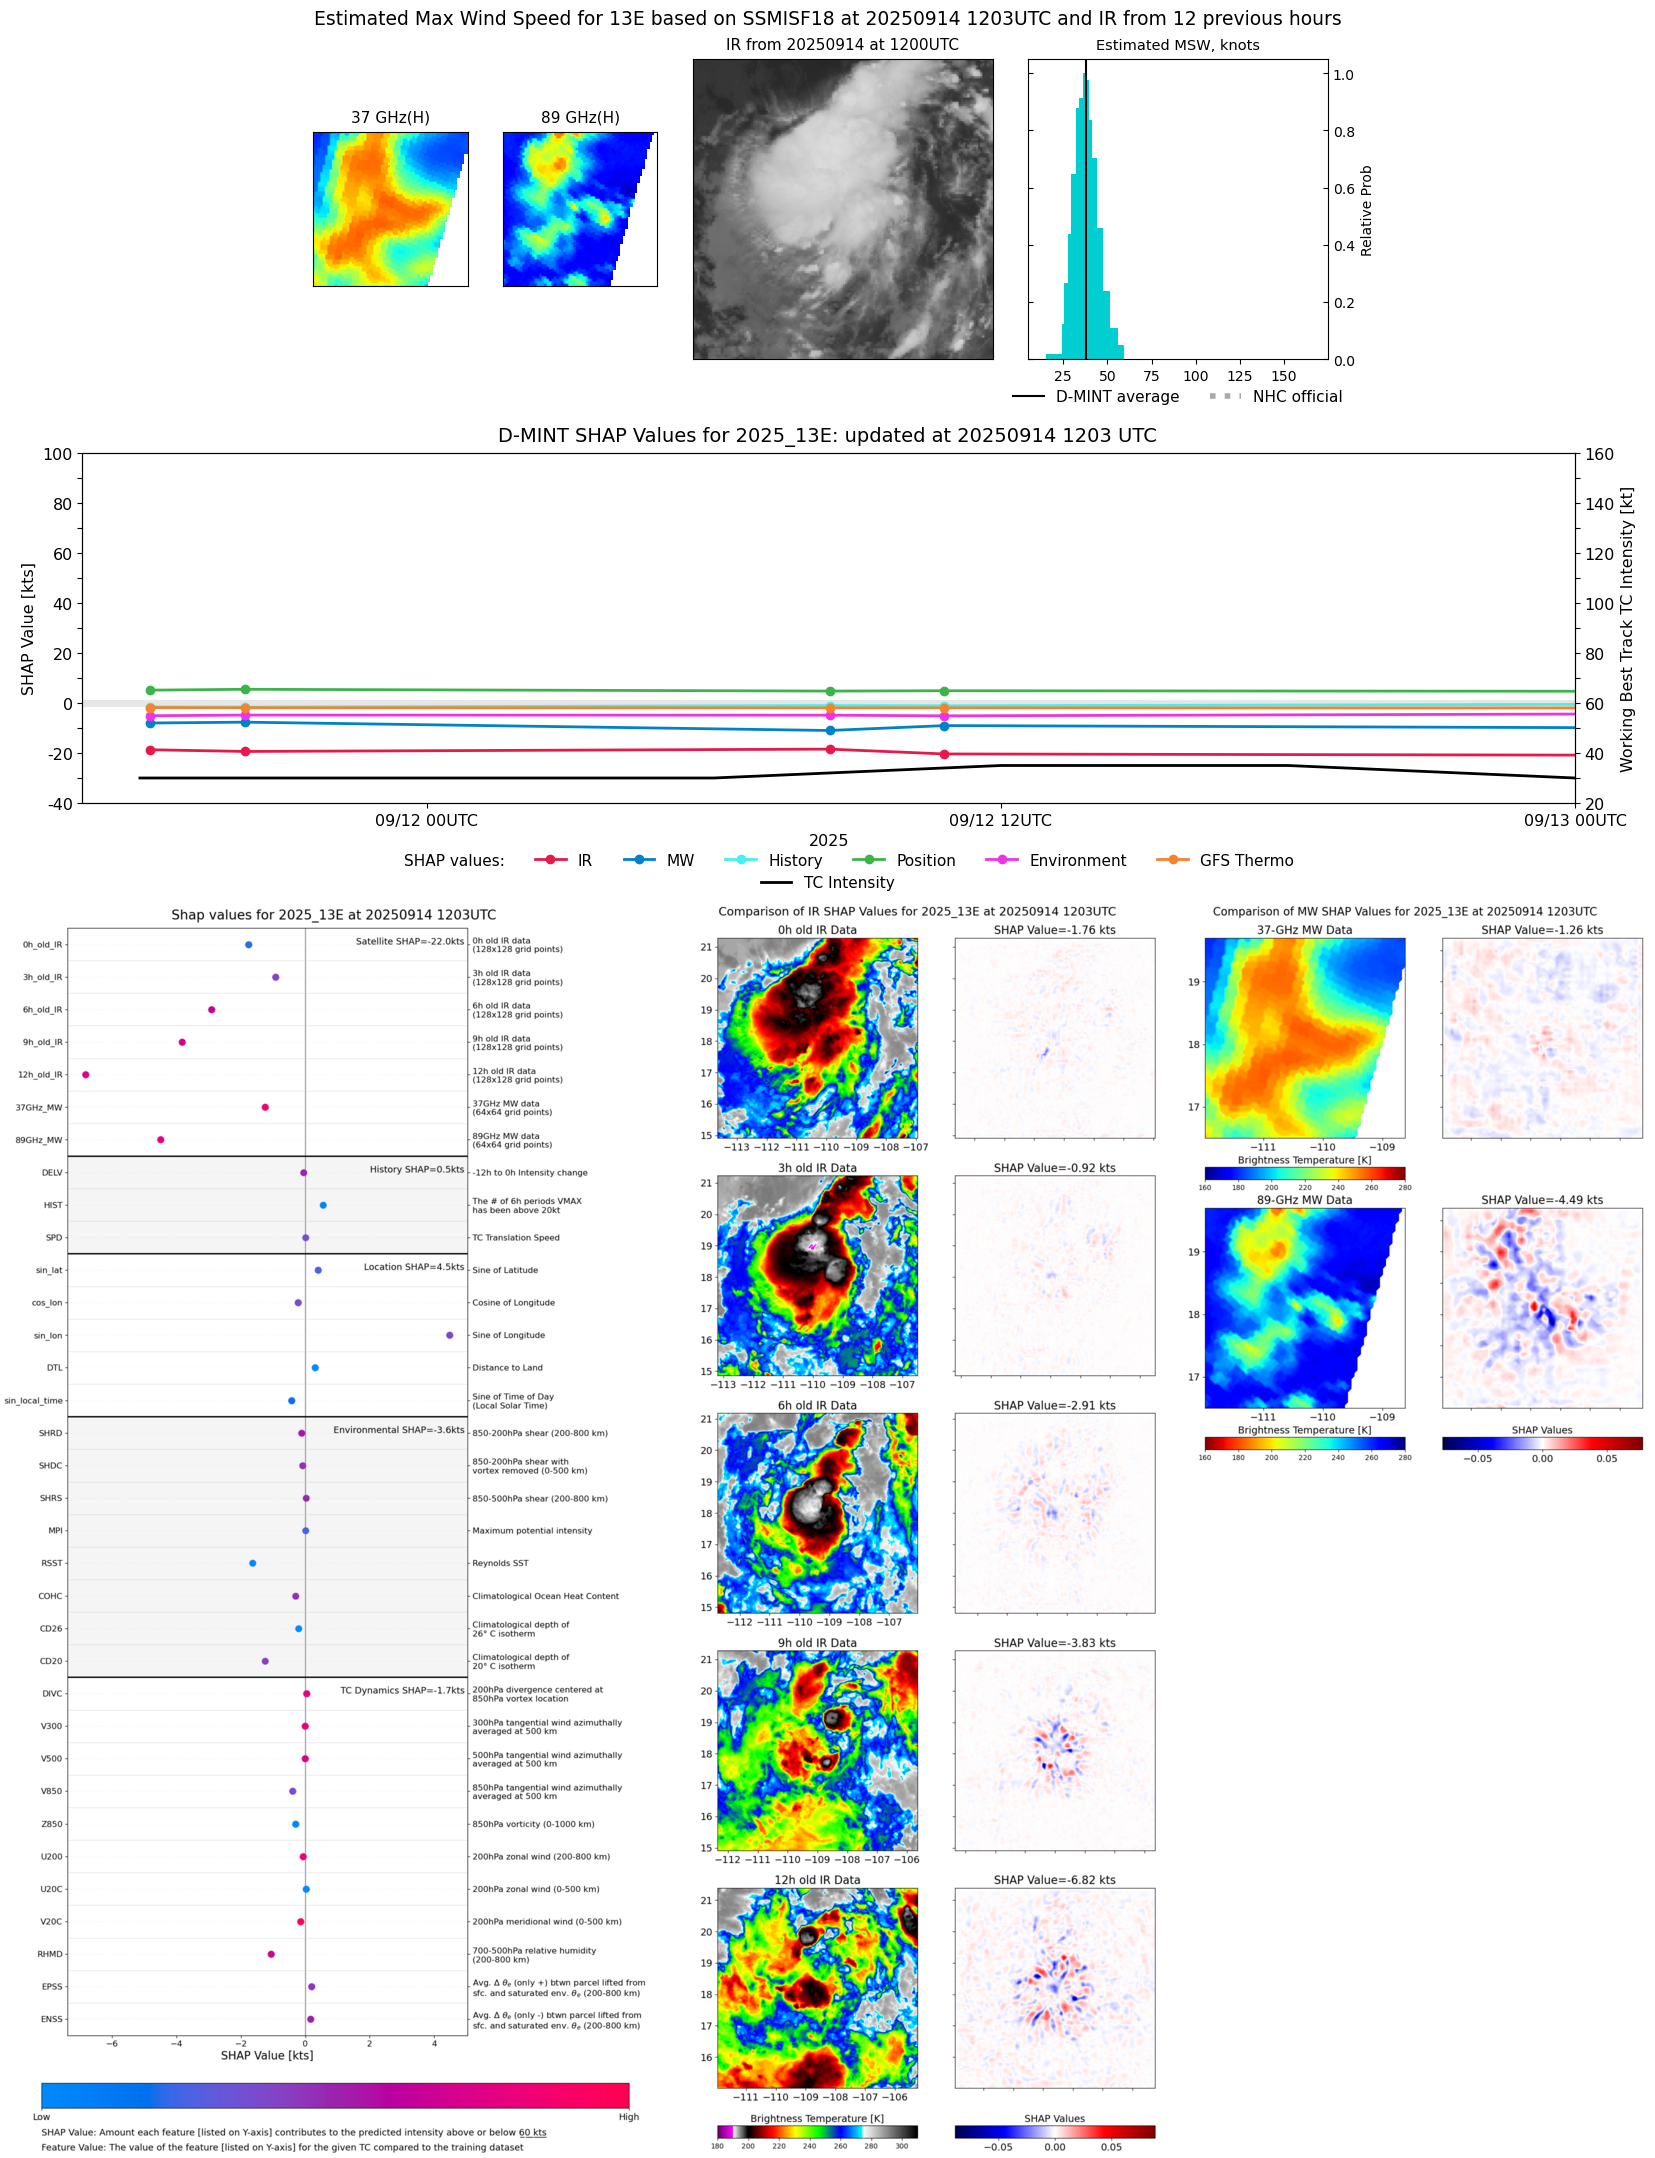 |
| 20250914 | 0129 UTC | SSMISF16 | 1007 hPa | 28 kts | 26 kts | 32 kts |  |
| 20250914 | 0048 UTC | SSMISF17 | 1007 hPa | 29 kts | 26 kts | 32 kts | 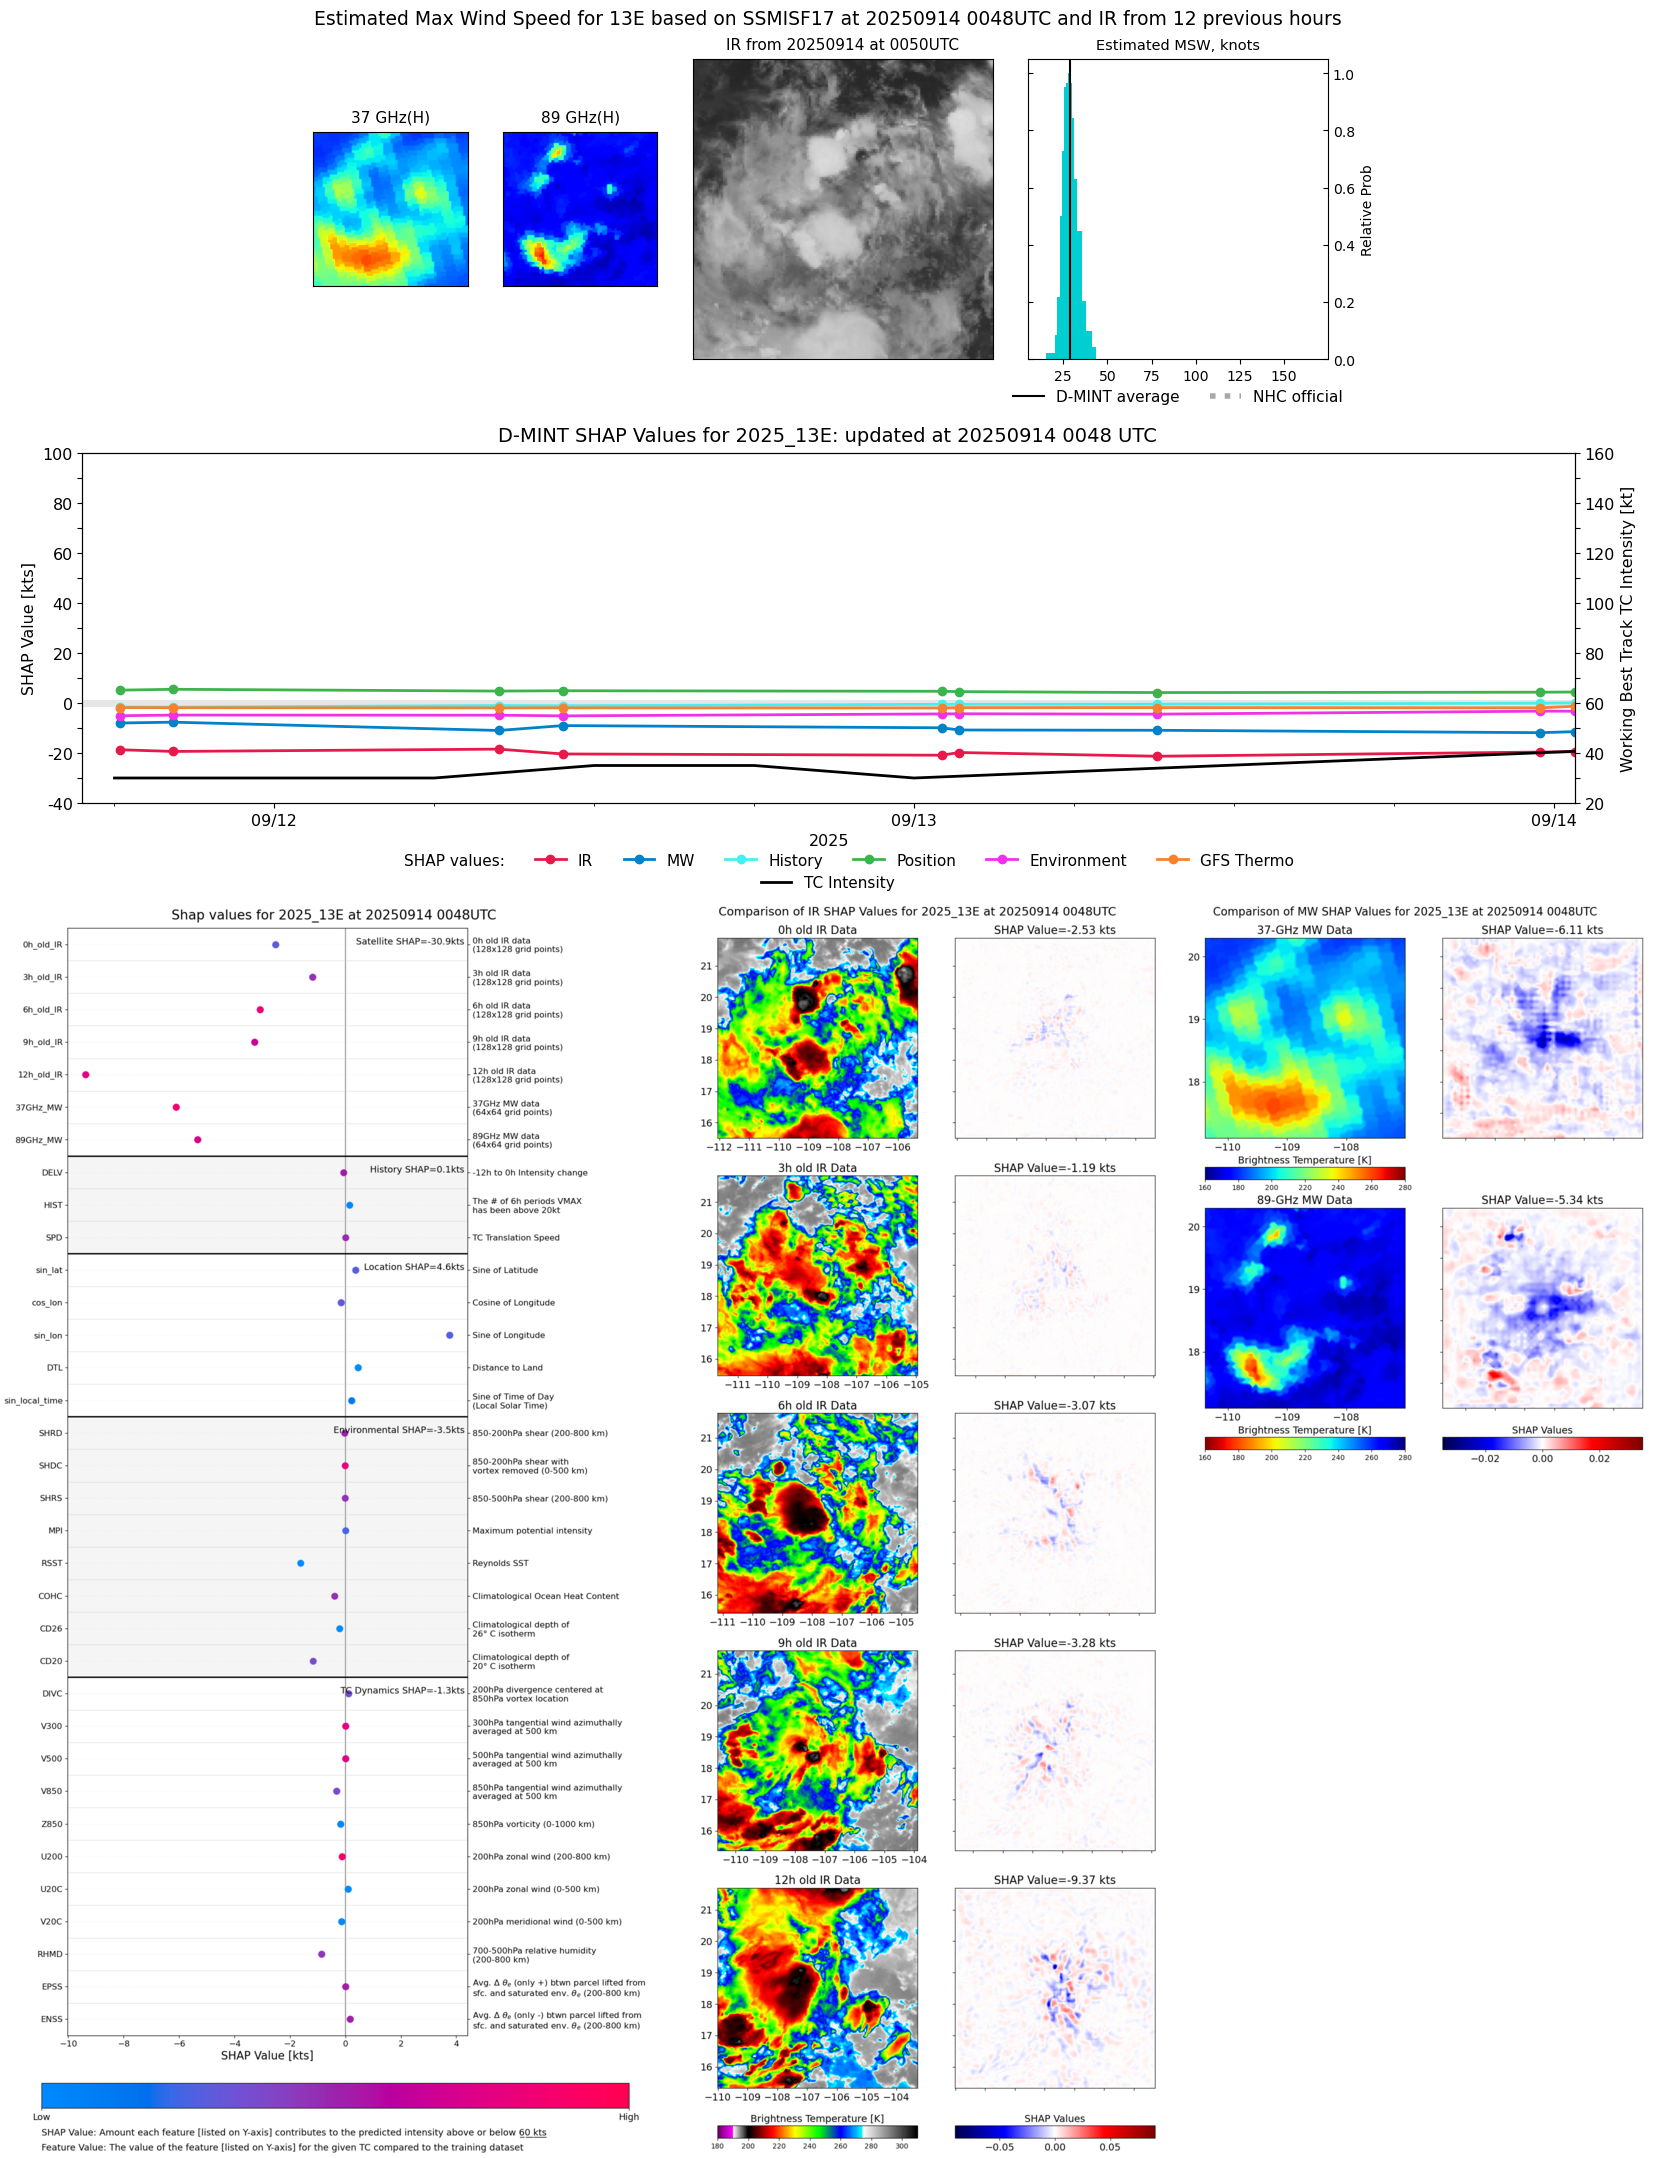 |
| 20250913 | 2330 UTC | SSMISF18 | 1007 hPa | 28 kts | 25 kts | 31 kts |  |
| 20250913 | 0908 UTC | AMSR2 | 1008 hPa | 25 kts | 23 kts | 28 kts | 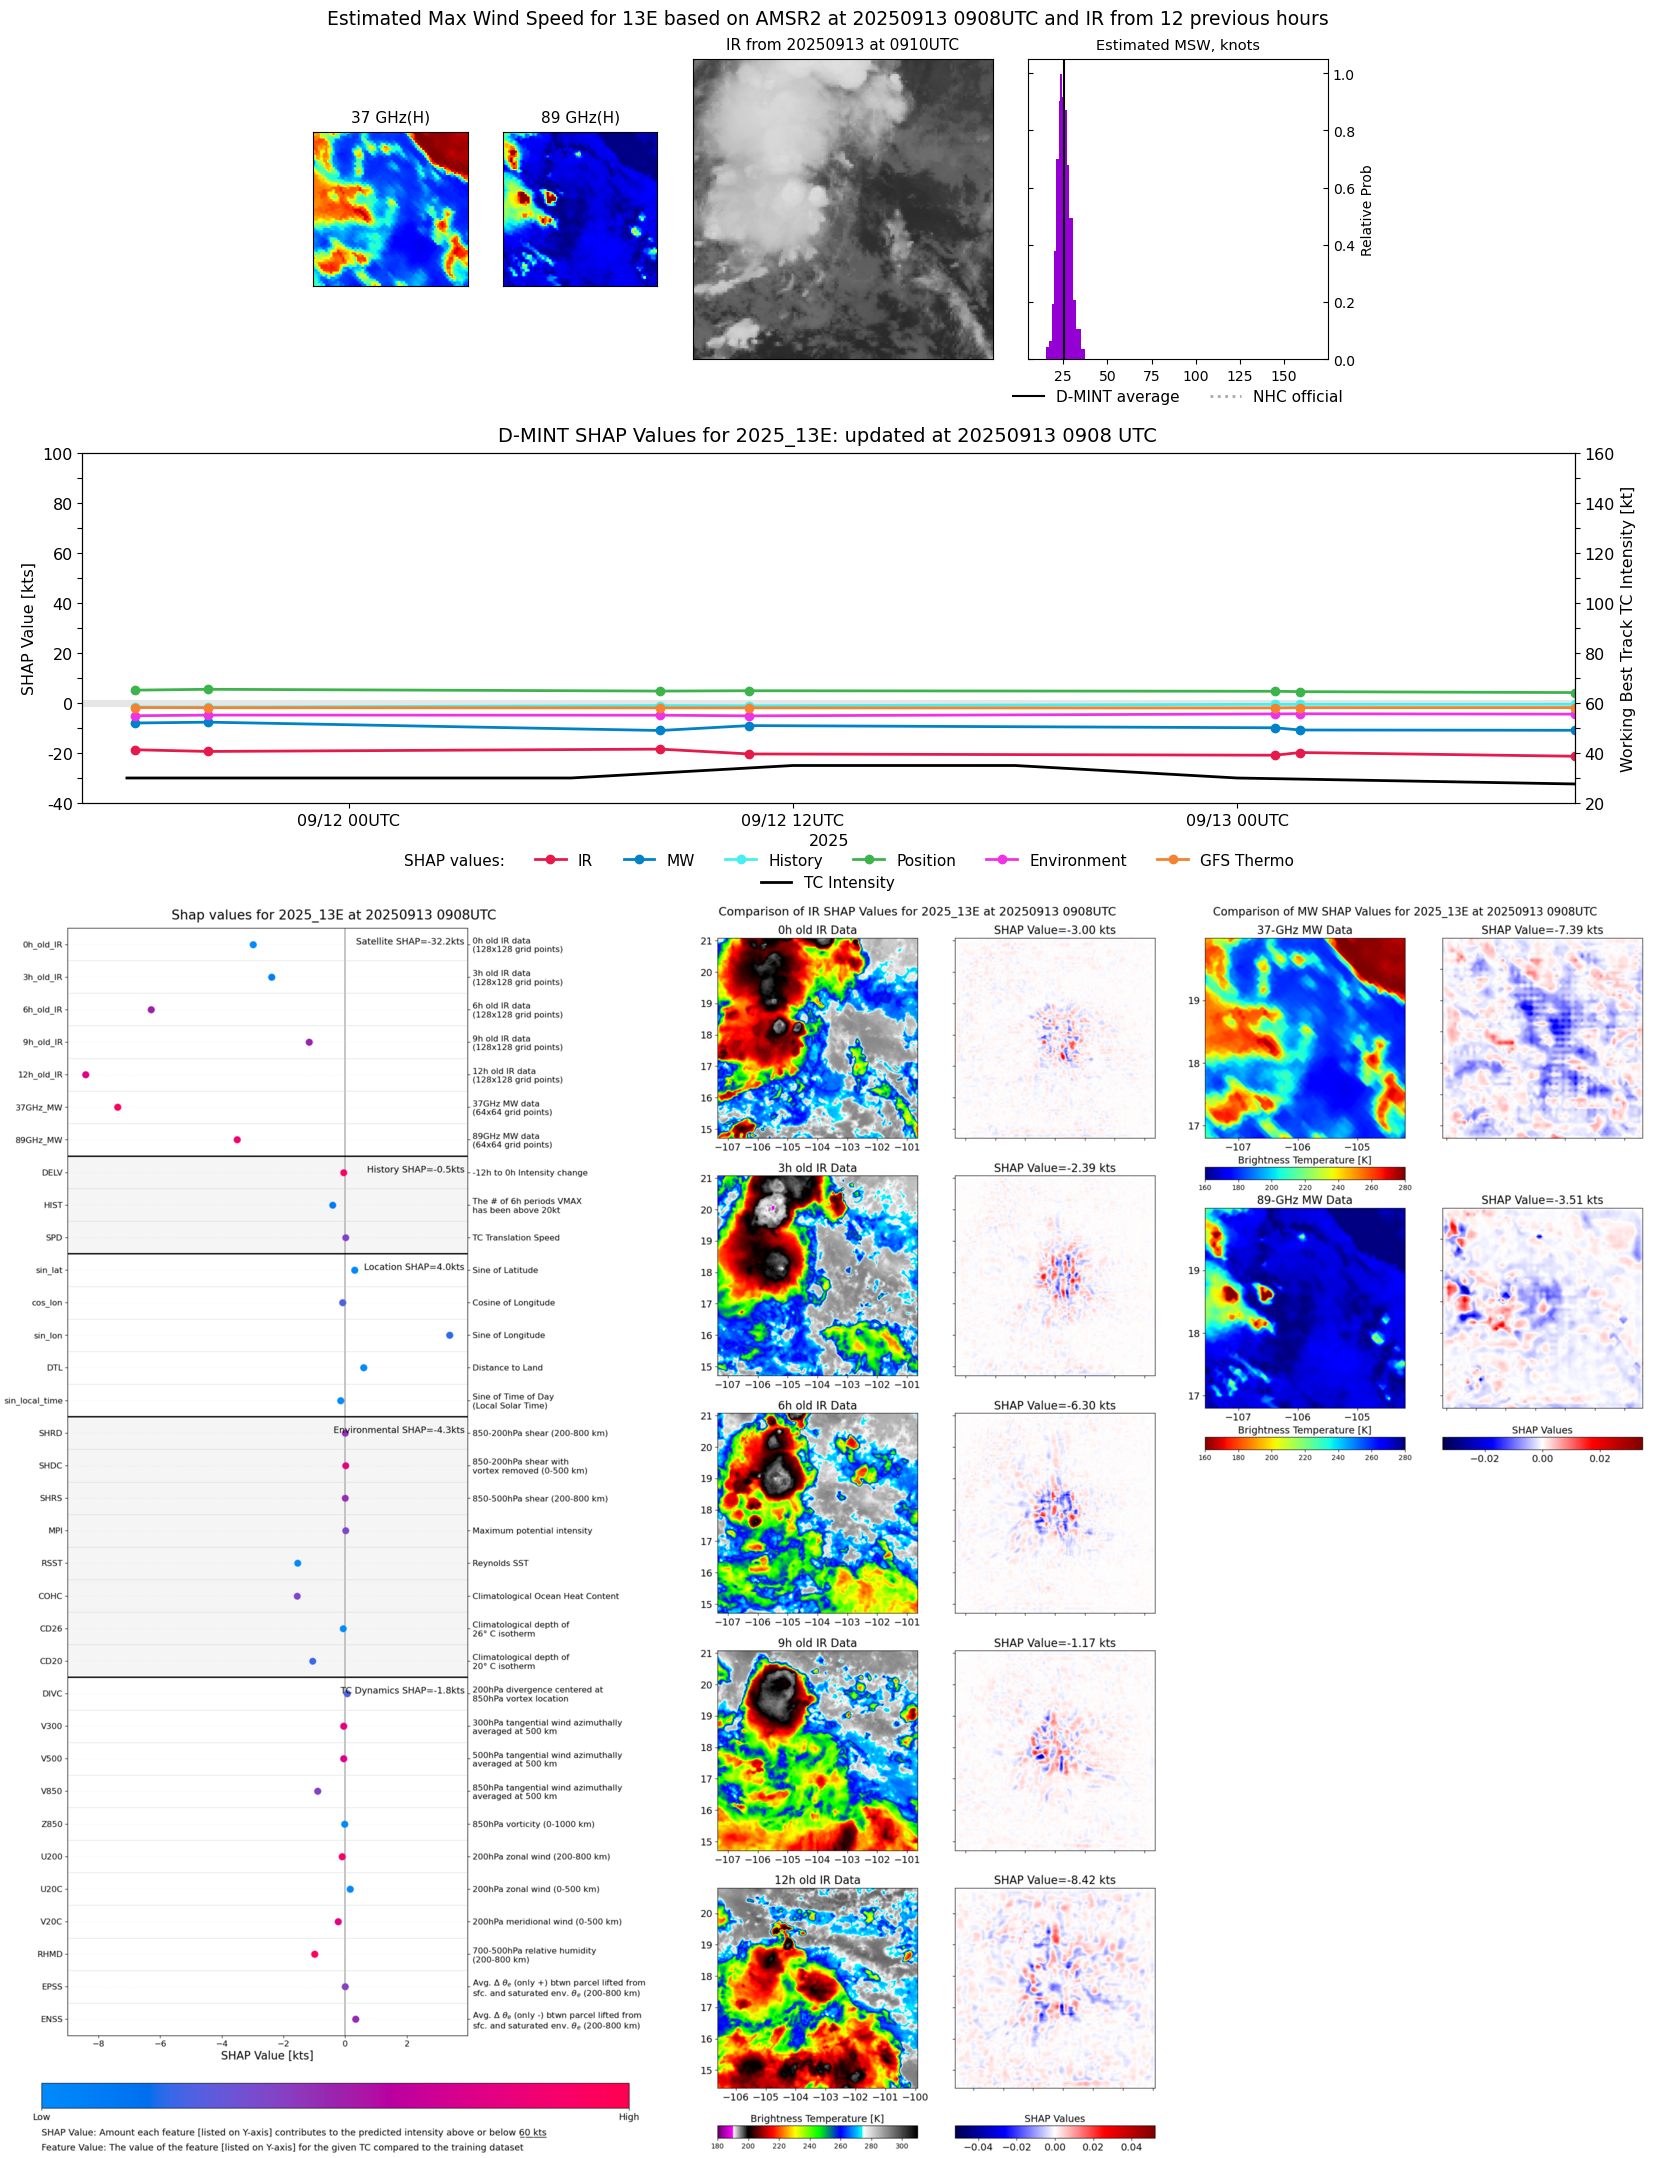 |
| 20250913 | 0625 UTC | TMS07 | 1008 hPa | 24 kts | 23 kts | 26 kts |  |
| 20250913 | 0503 UTC | GMI | 1008 hPa | 25 kts | 23 kts | 28 kts | 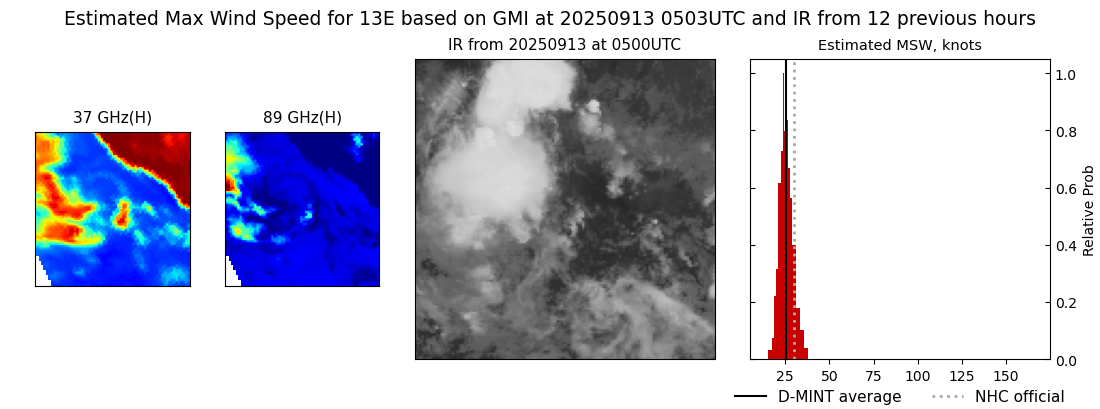 |
| 20250913 | 0142 UTC | SSMISF16 | 1008 hPa | 27 kts | 25 kts | 30 kts |  |
| 20250913 | 0102 UTC | SSMISF17 | 1008 hPa | 27 kts | 25 kts | 30 kts |  |
| 20250913 | 0035 UTC | WSFM01 | 1008 hPa | 26 kts | 24 kts | 28 kts |  |
| 20250912 | 2010 UTC | ATMS-NPP | 1008 hPa | 26 kts | 24 kts | 29 kts | 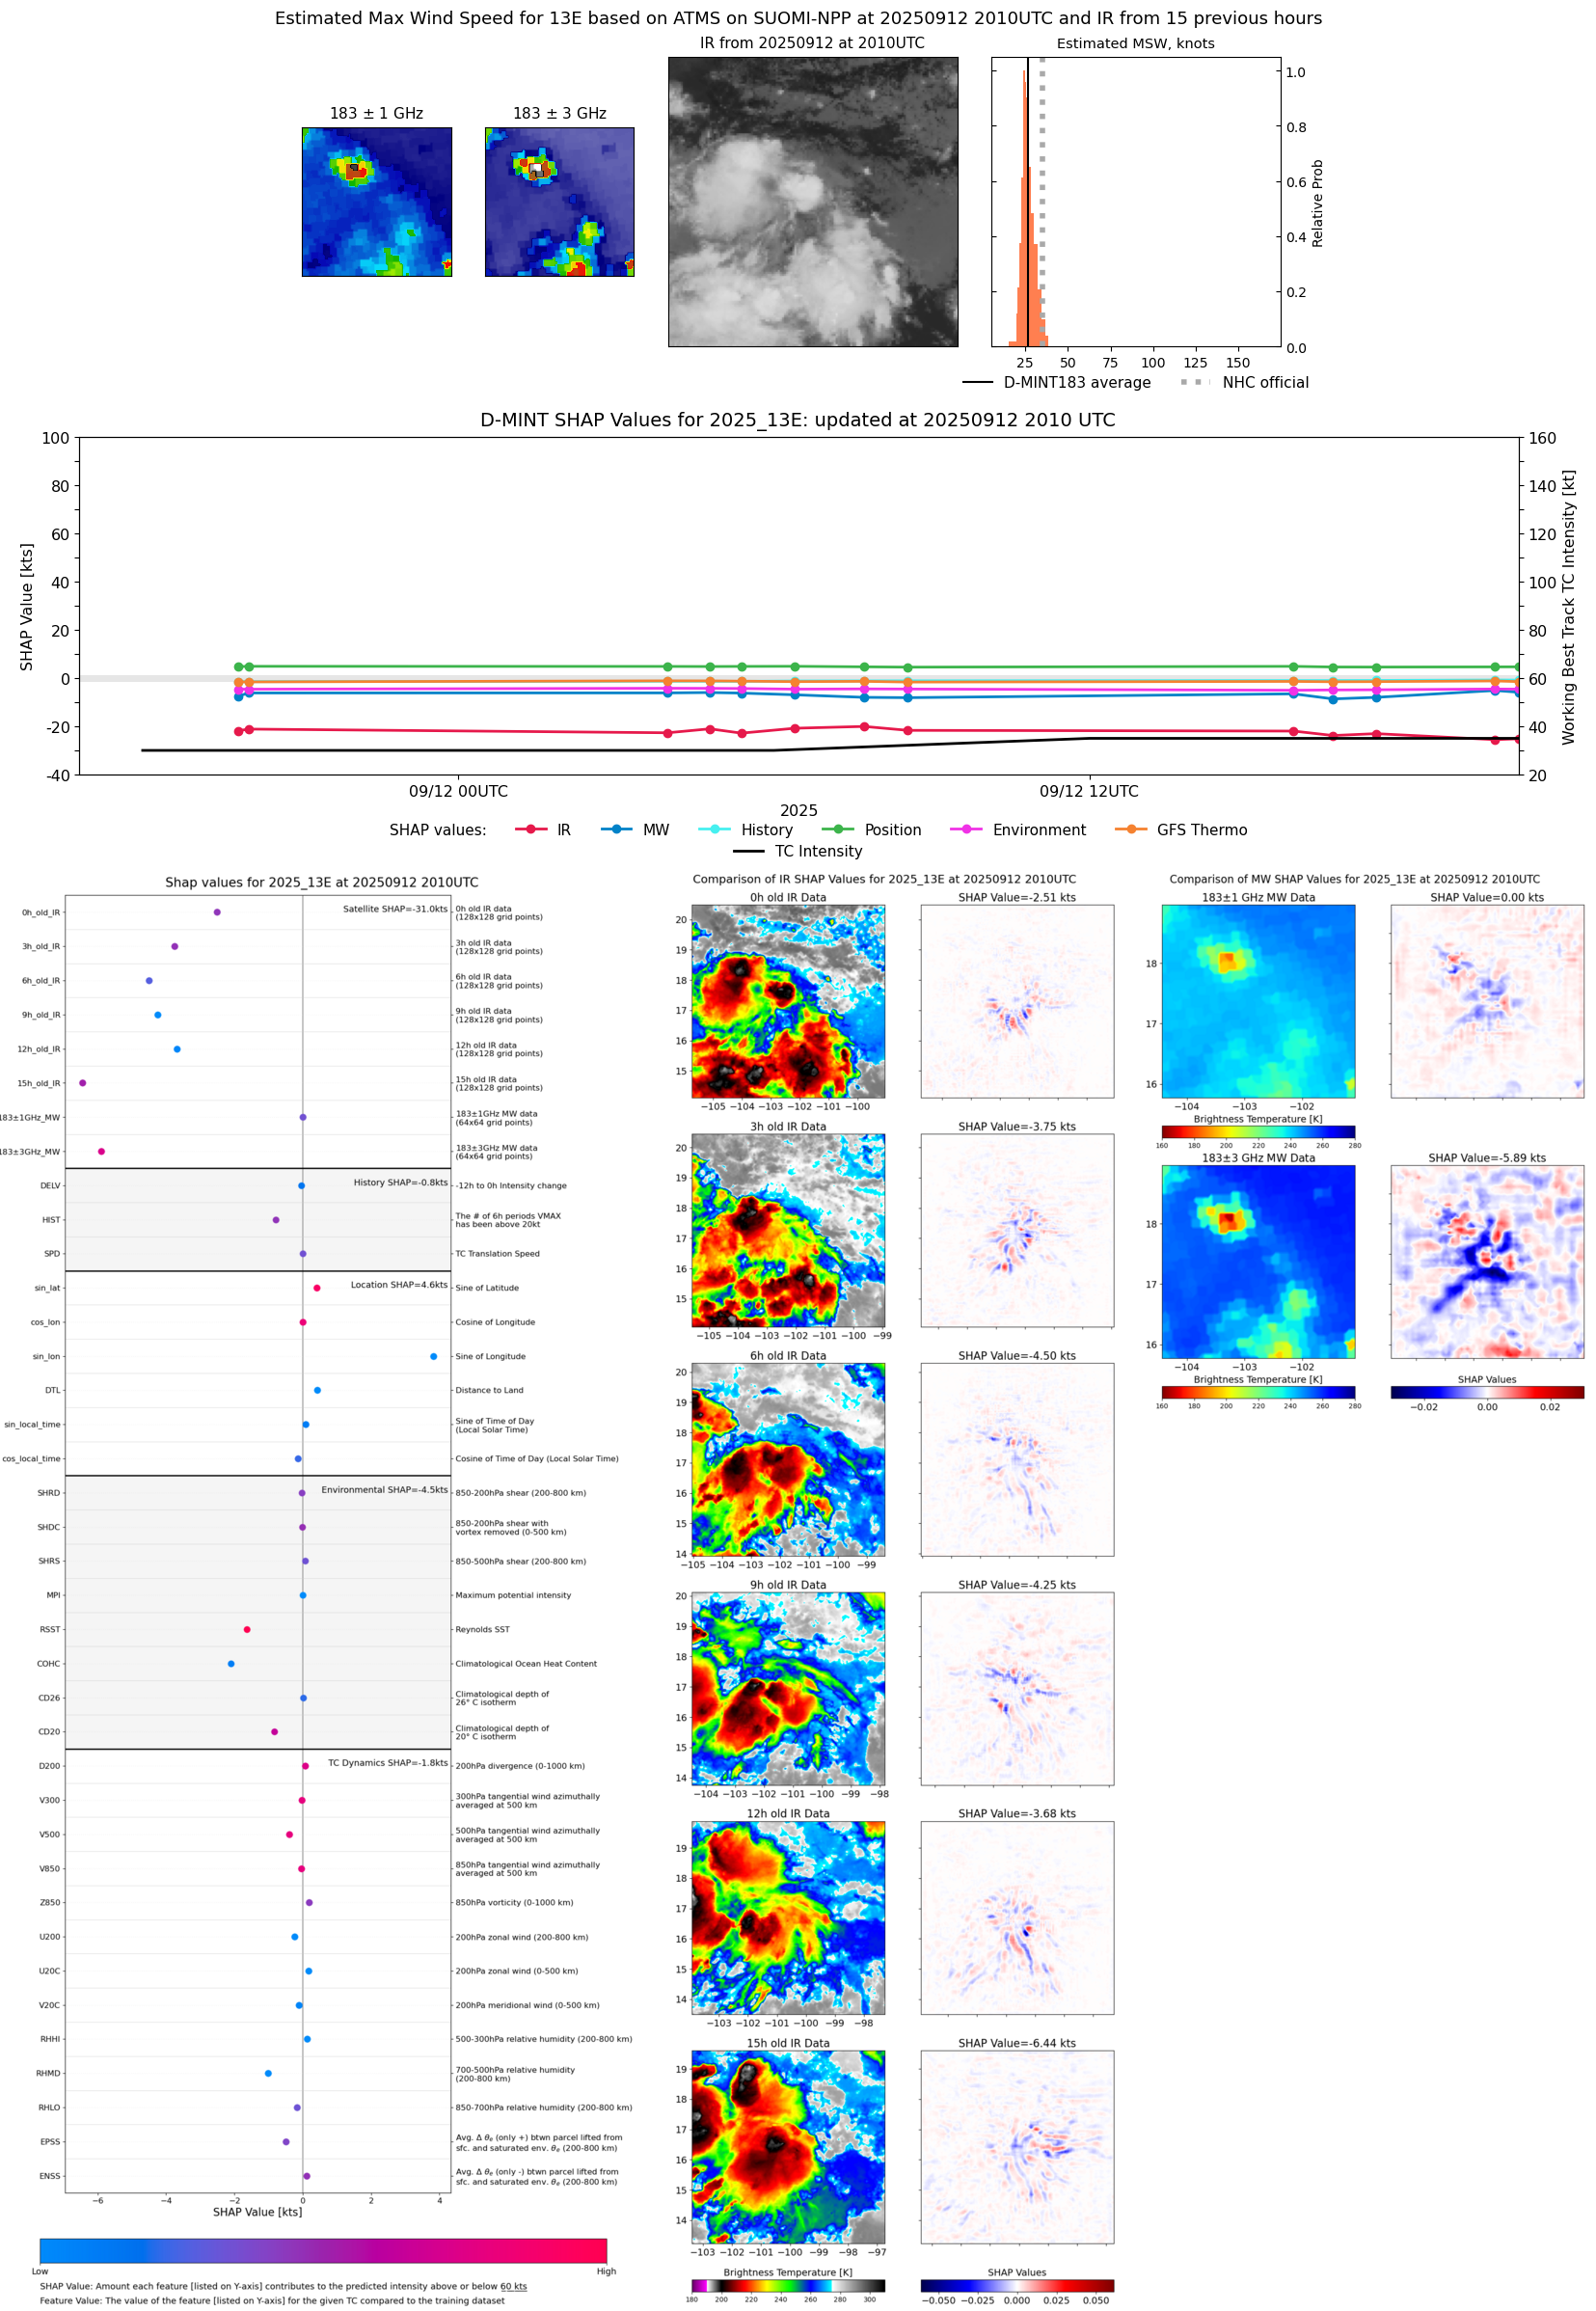 |
| 20250912 | 1943 UTC | ATMS-N21 | 1007 hPa | 27 kts | 25 kts | 30 kts |  |
| 20250912 | 1727 UTC | AWS | 1008 hPa | 26 kts | 24 kts | 29 kts | 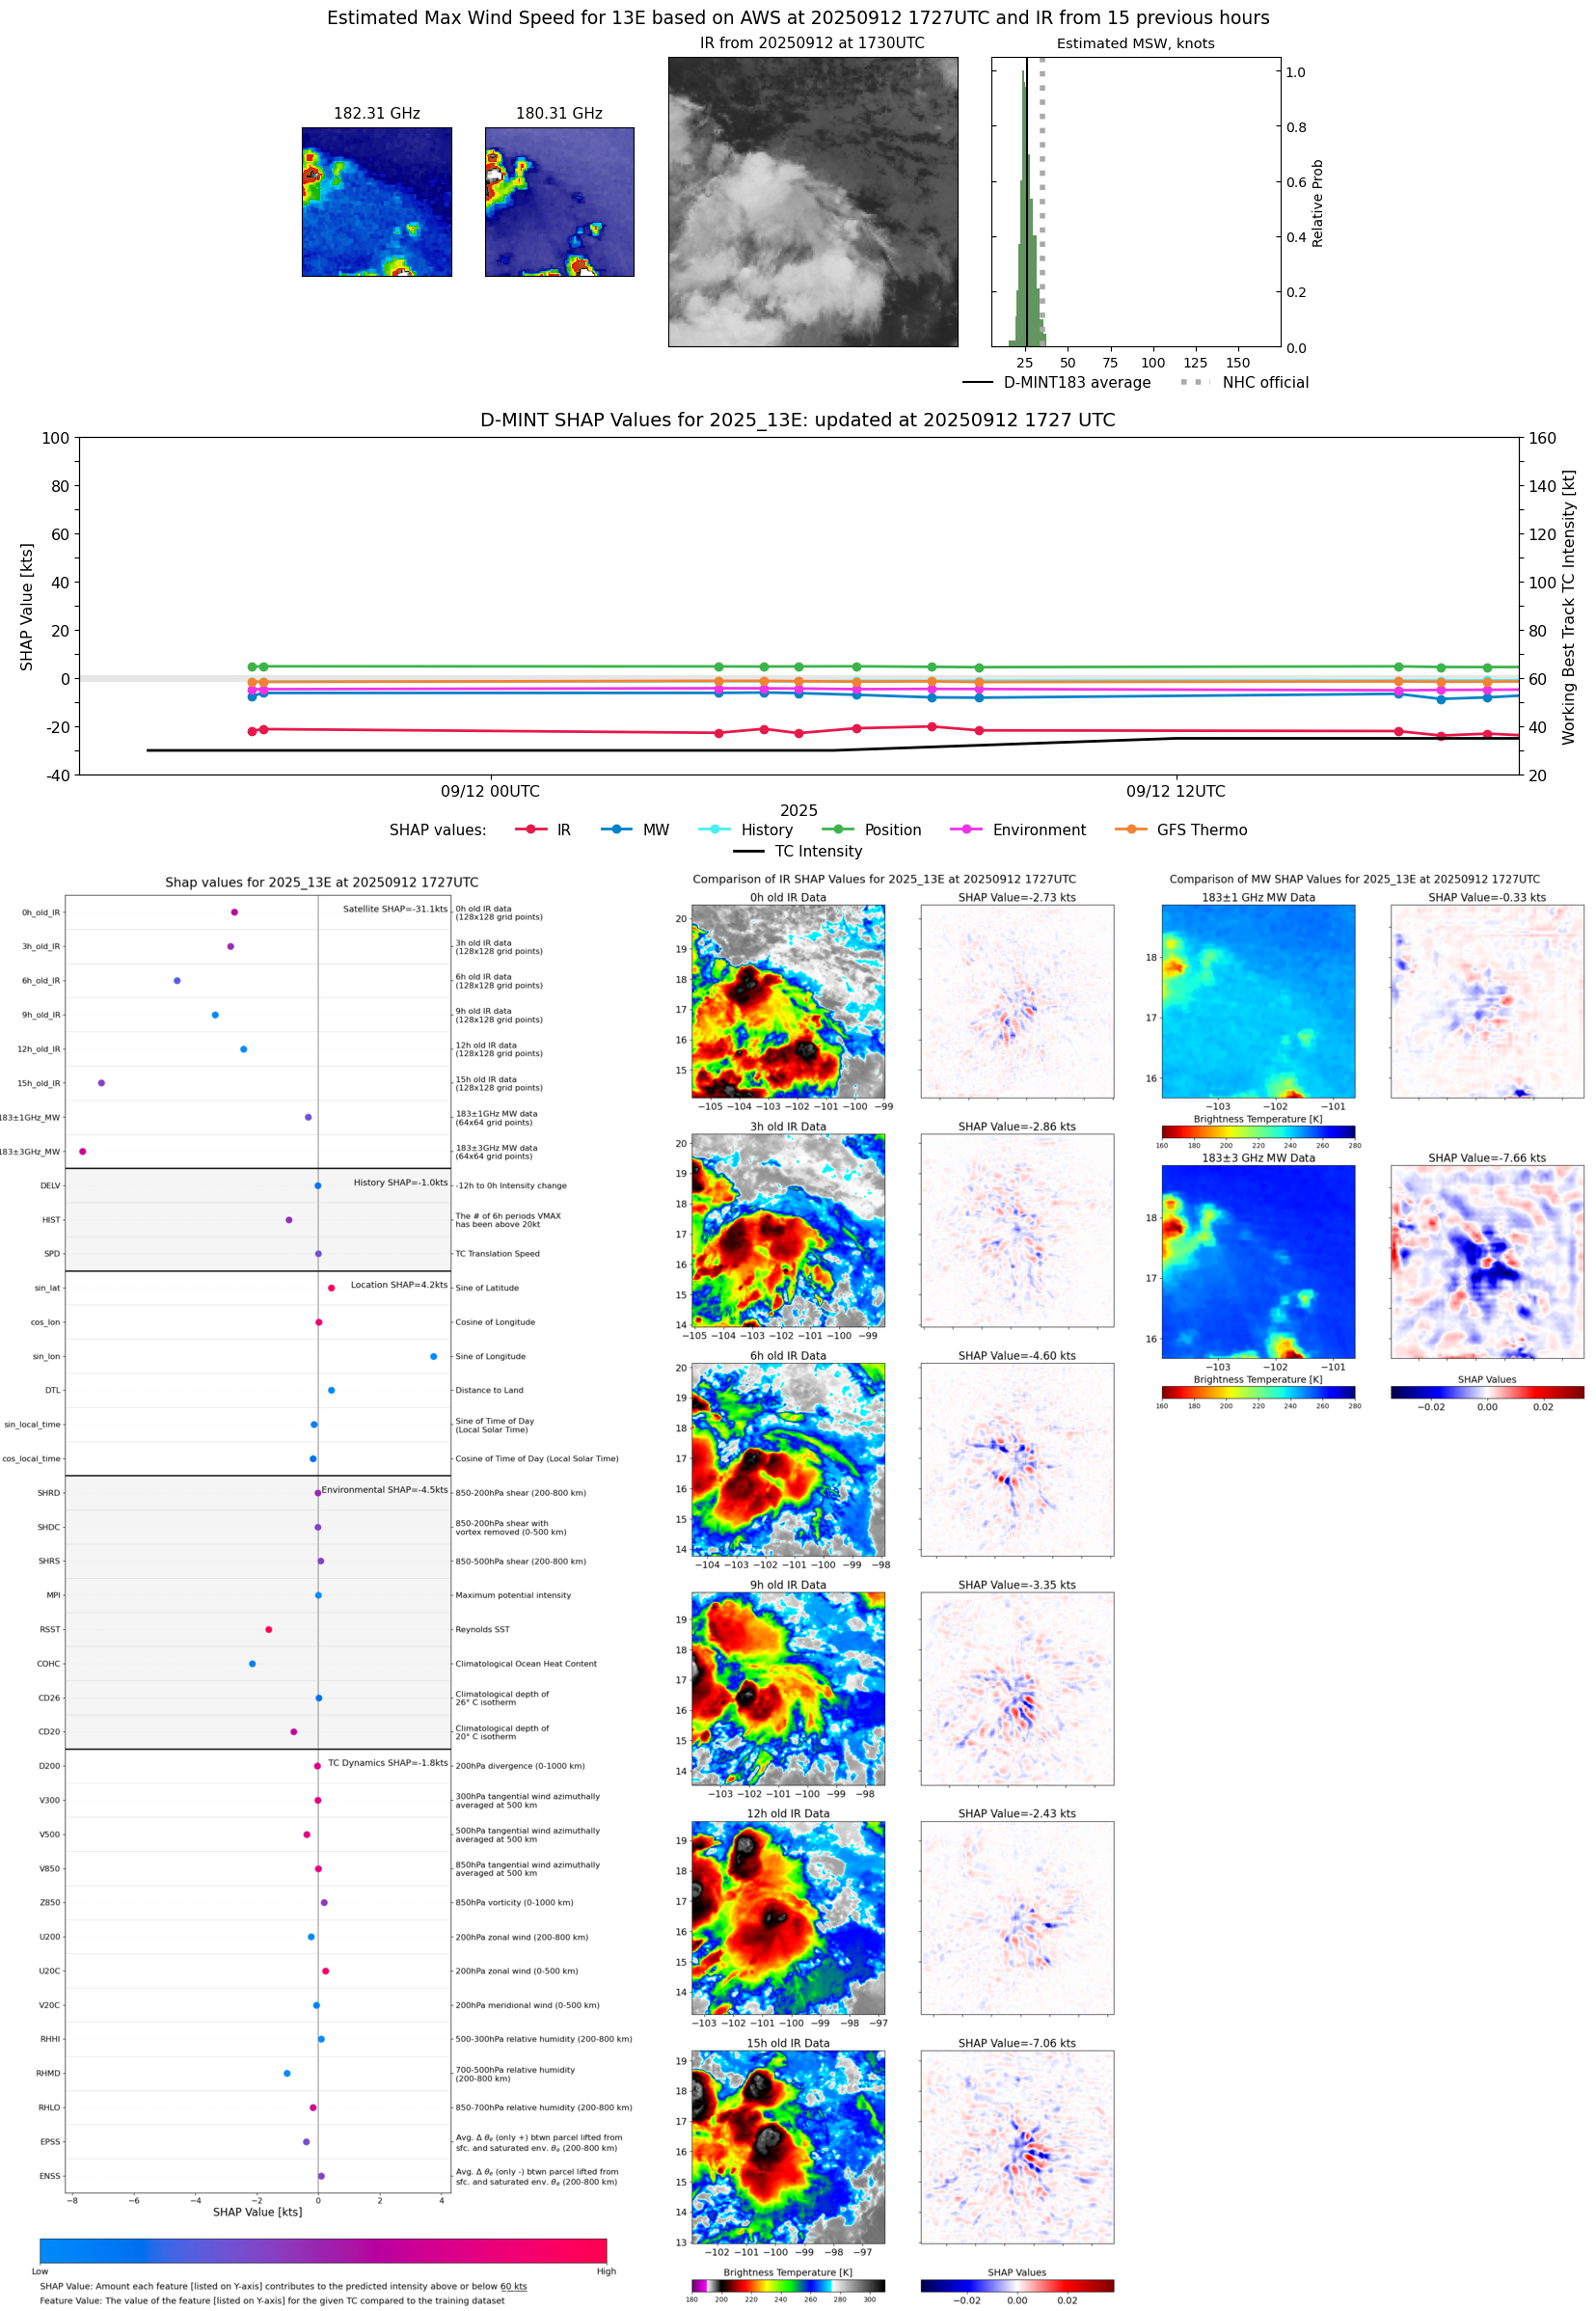 |
| 20250912 | 1638 UTC | TMS07 | 1007 hPa | 24 kts | 22 kts | 27 kts | 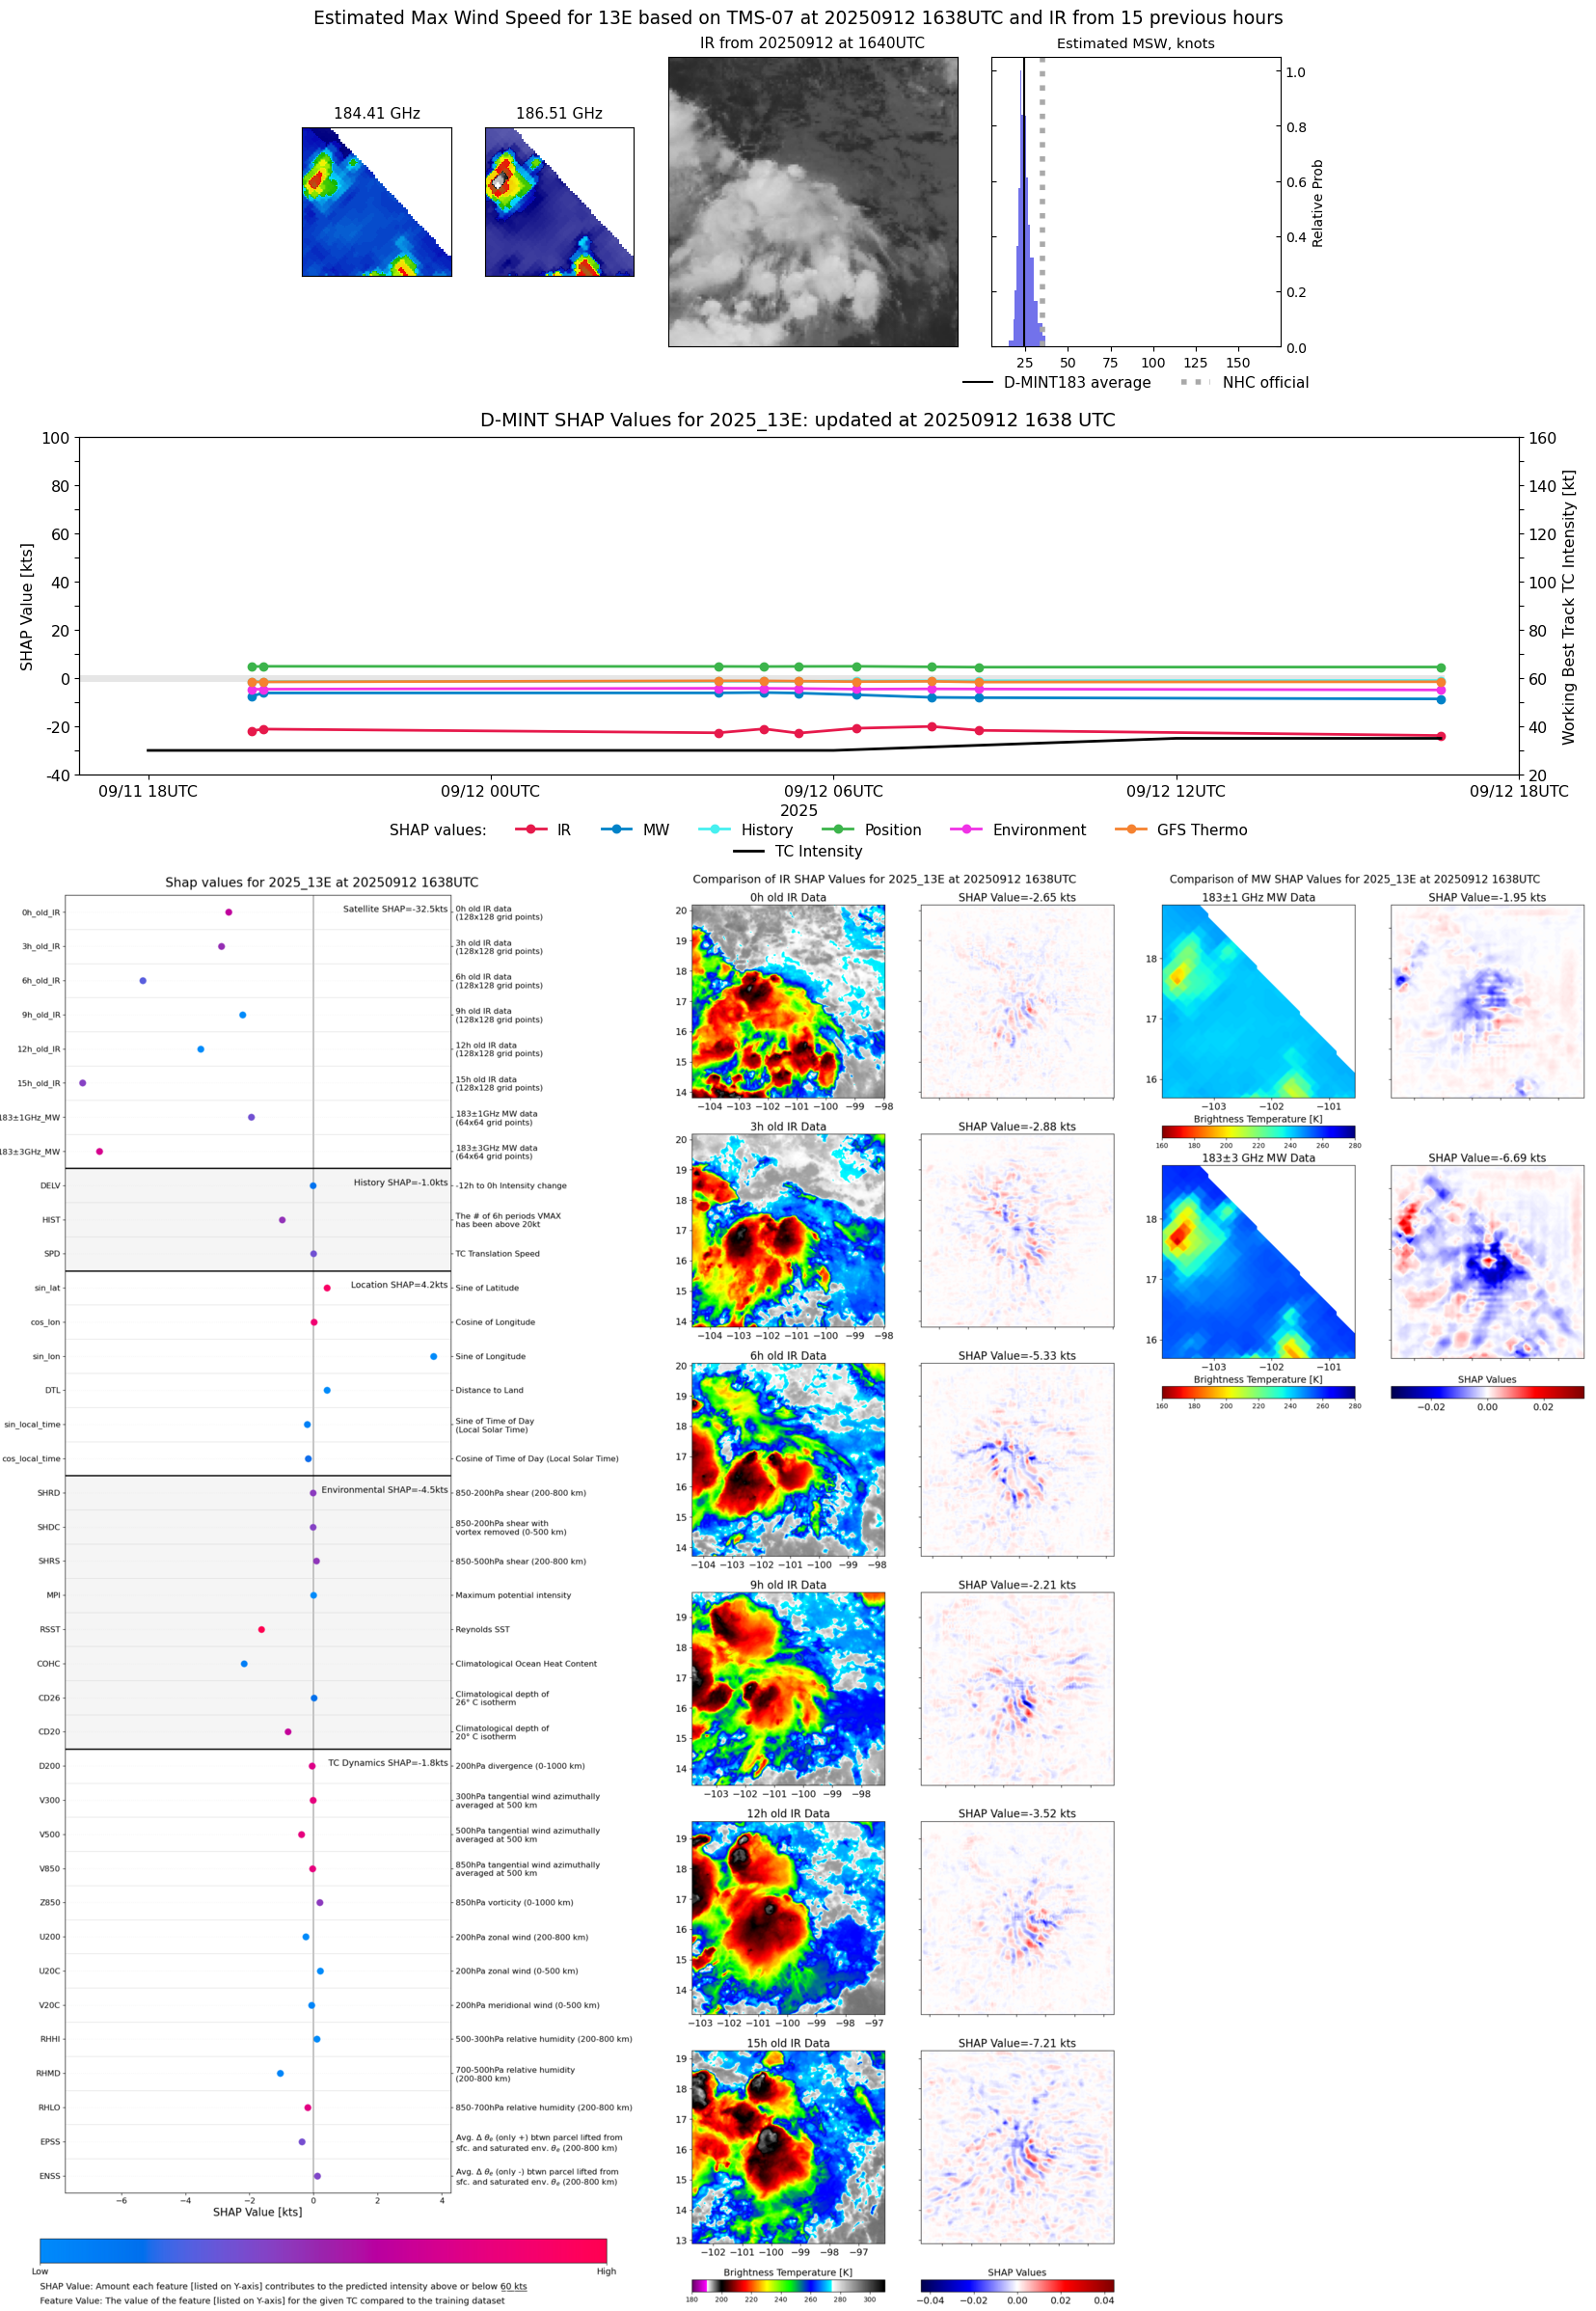 |
| 20250912 | 1553 UTC | TROPICS05 | 1008 hPa | 29 kts | 26 kts | 33 kts | 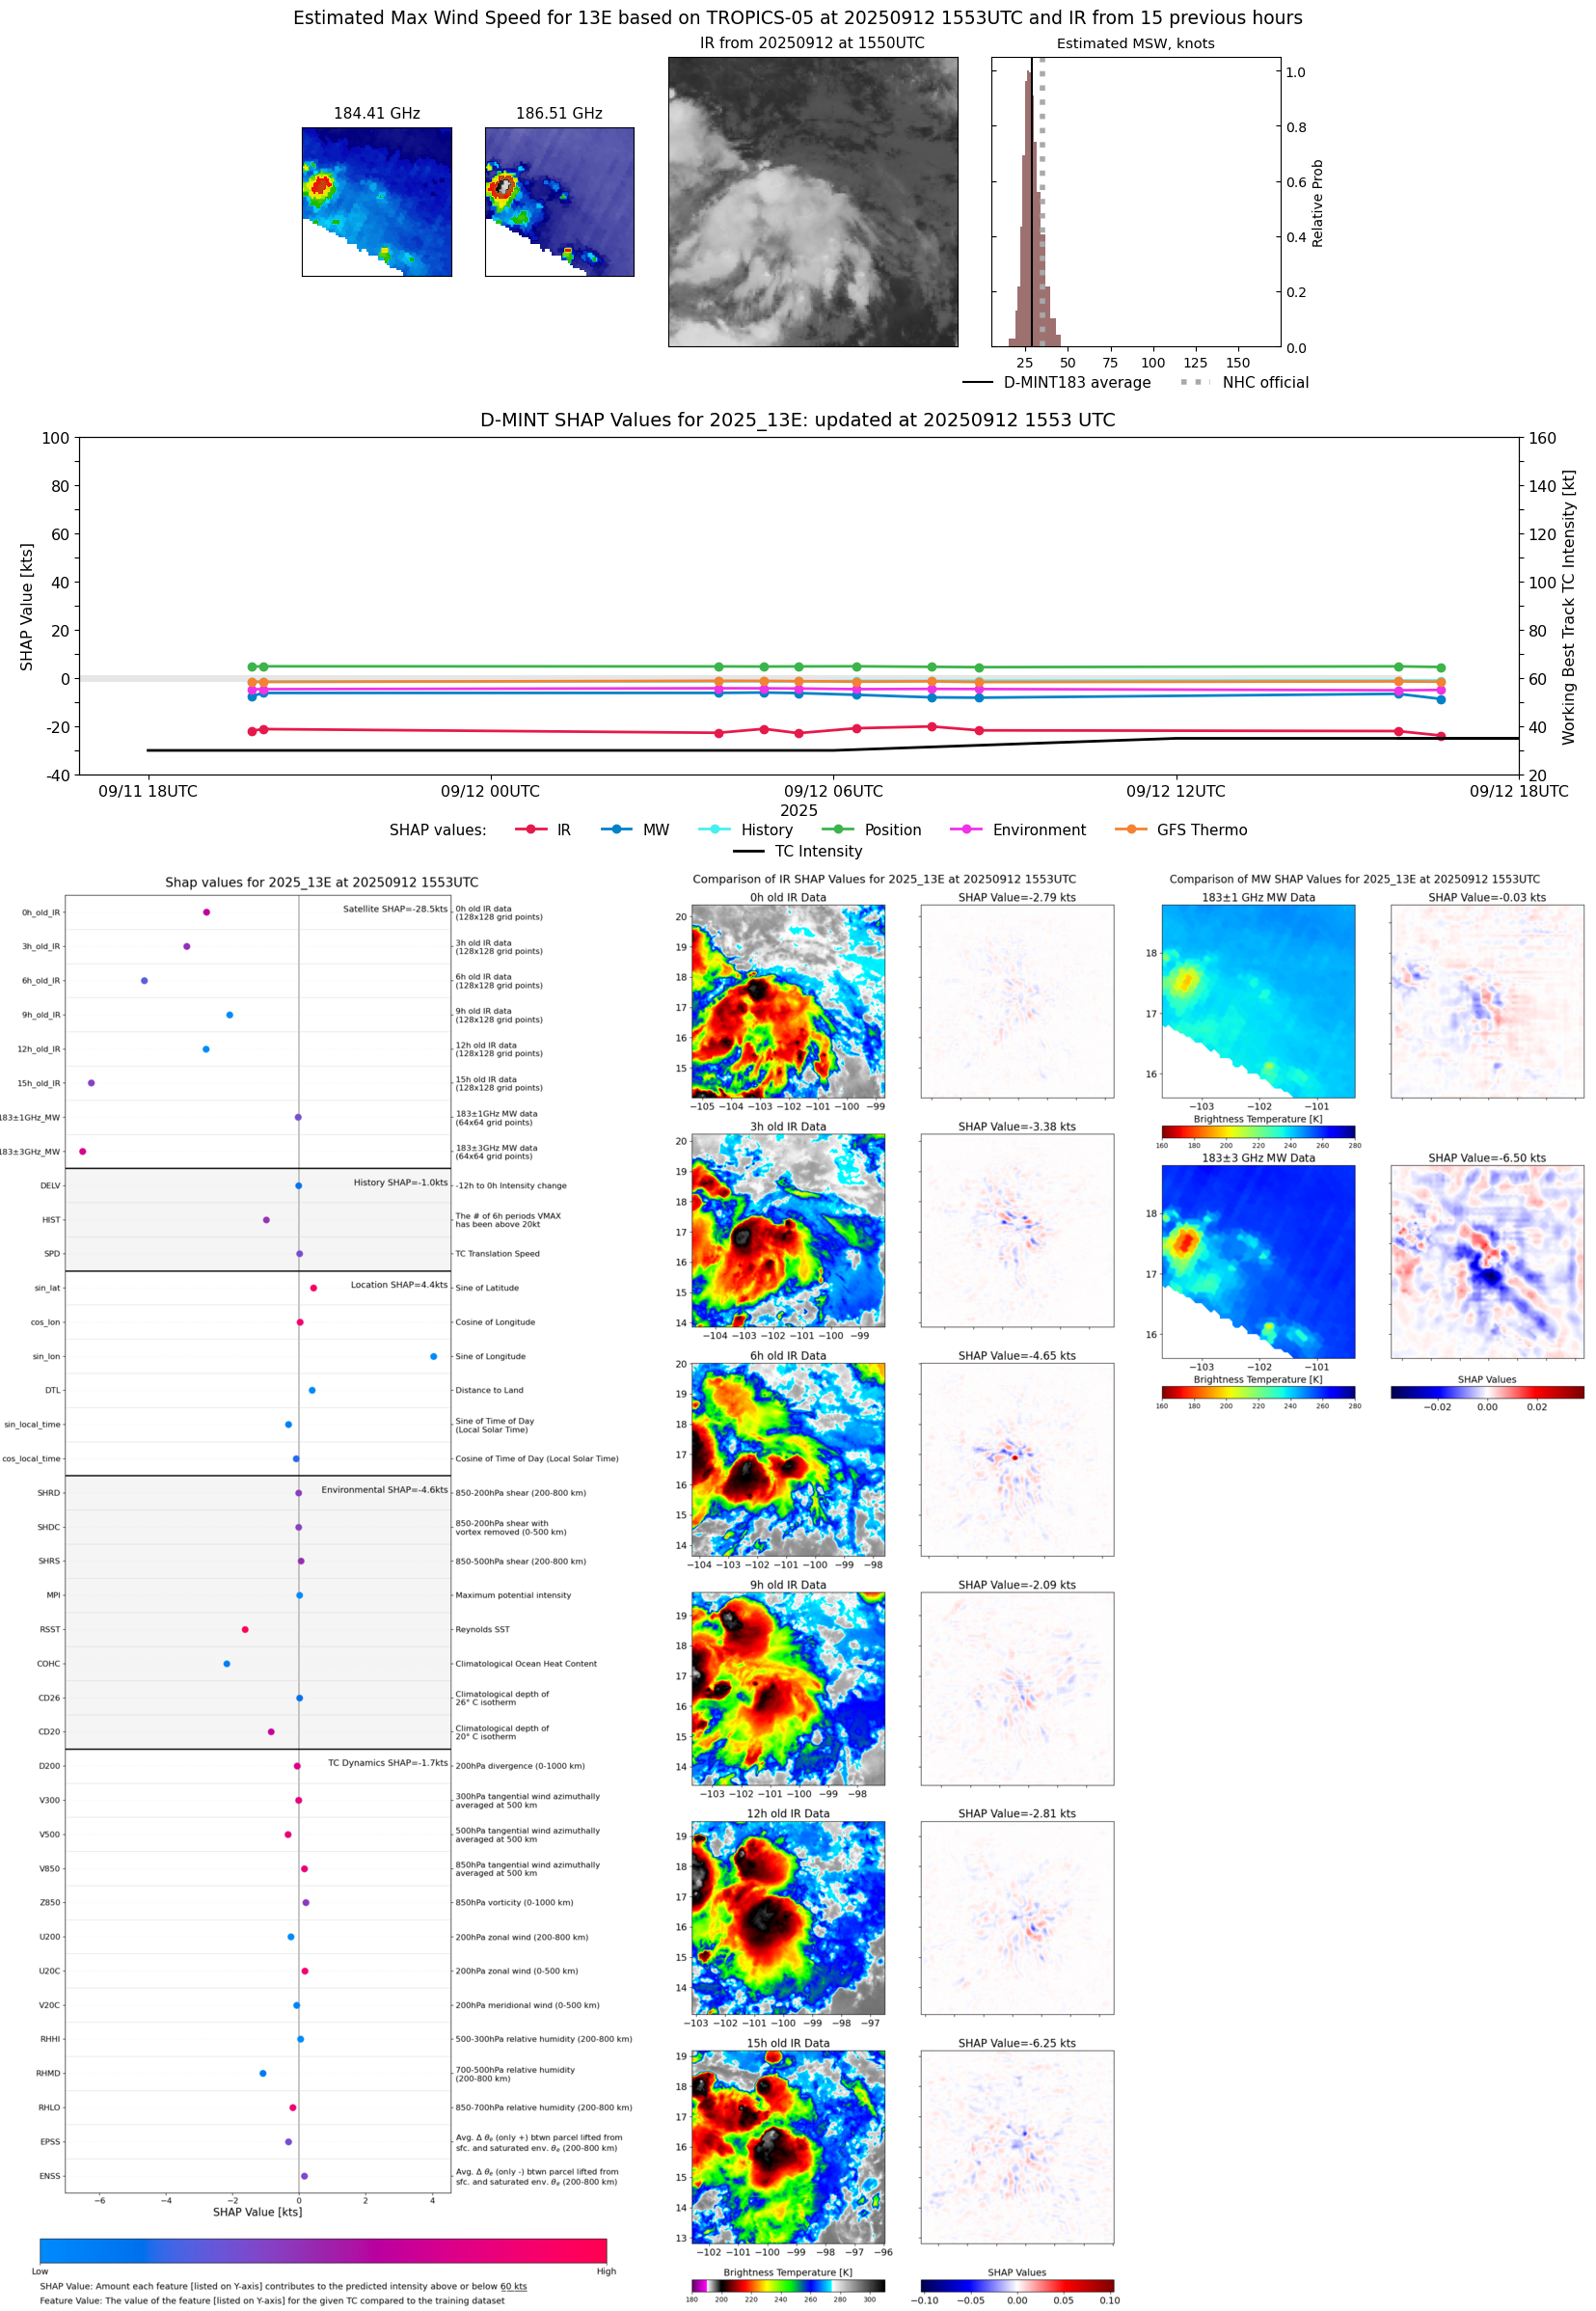 |
| 20250912 | 1326 UTC | WSFM01 | 1007 hPa | 34 kts | 29 kts | 39 kts | 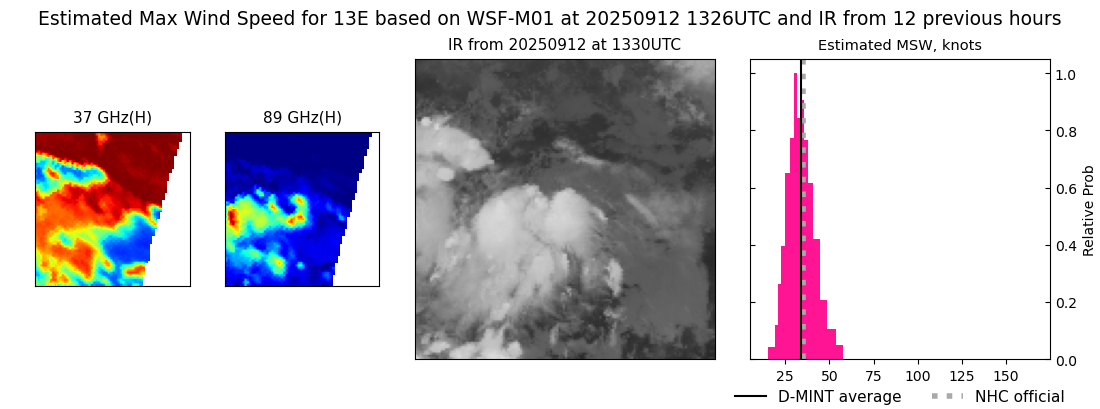 |
| 20250912 | 1049 UTC | SSMISF18 | 1008 hPa | 27 kts | 24 kts | 31 kts | 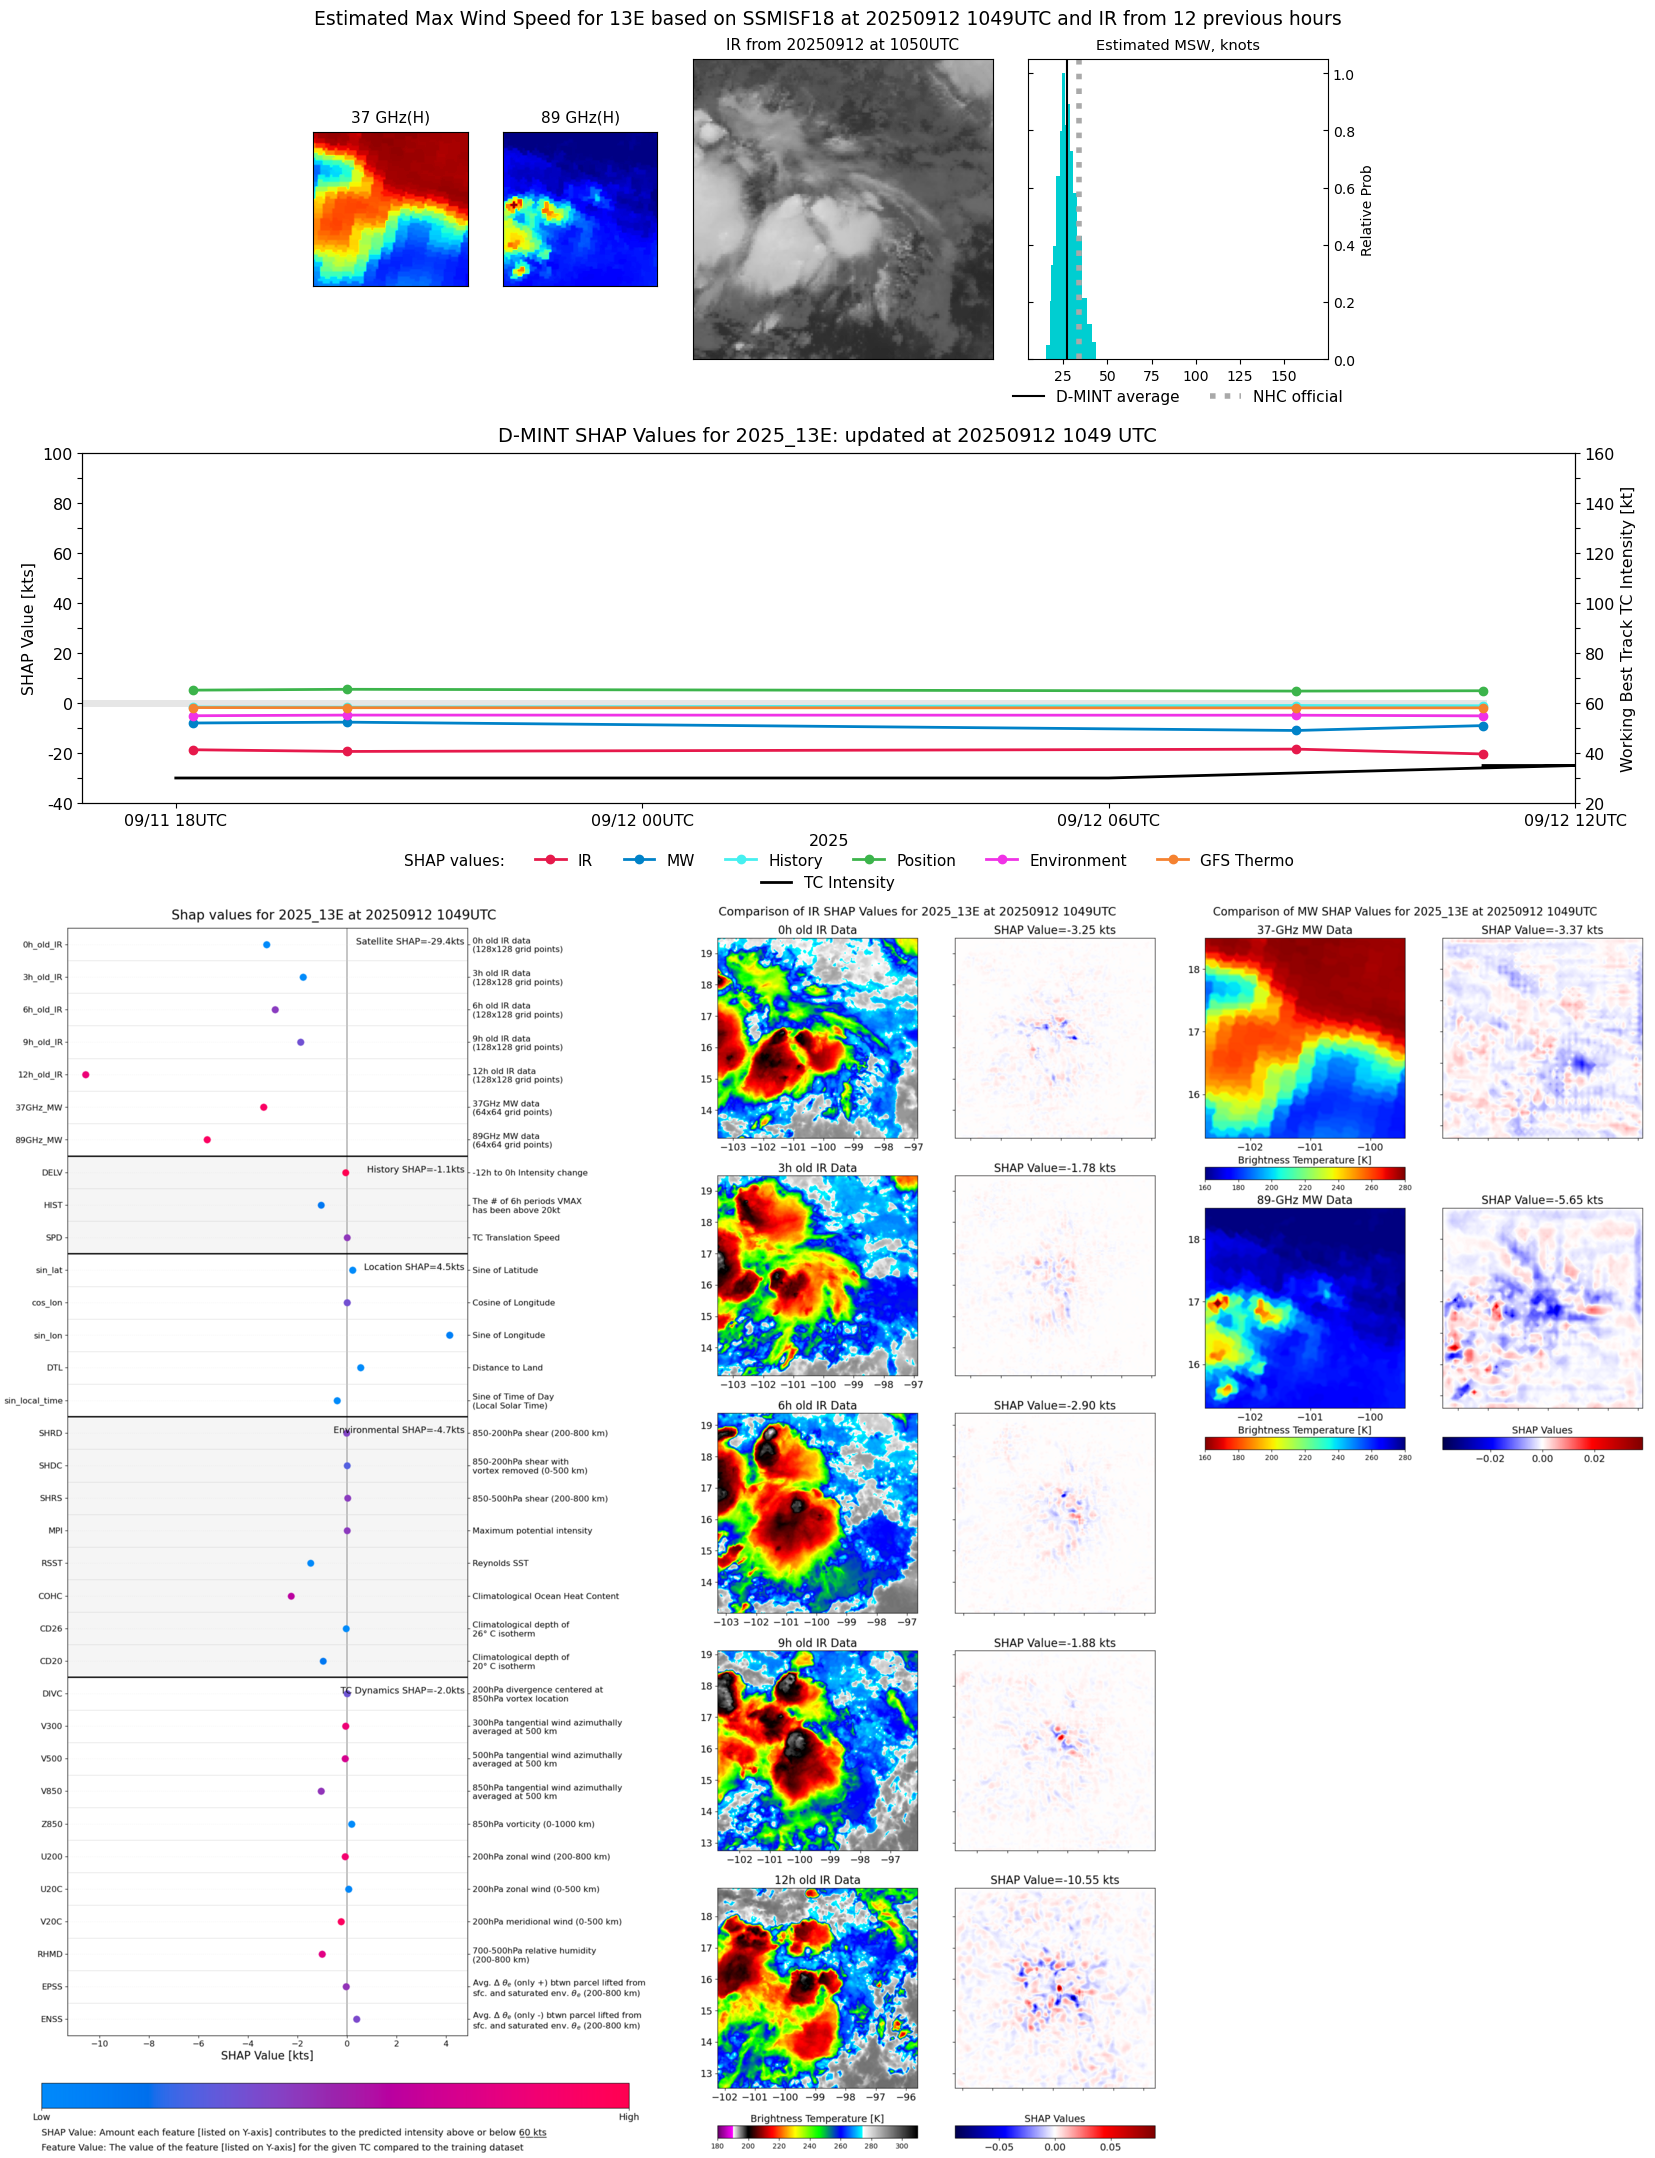 |
| 20250912 | 0833 UTC | ATMS-N21 | 1008 hPa | 27 kts | 25 kts | 31 kts | 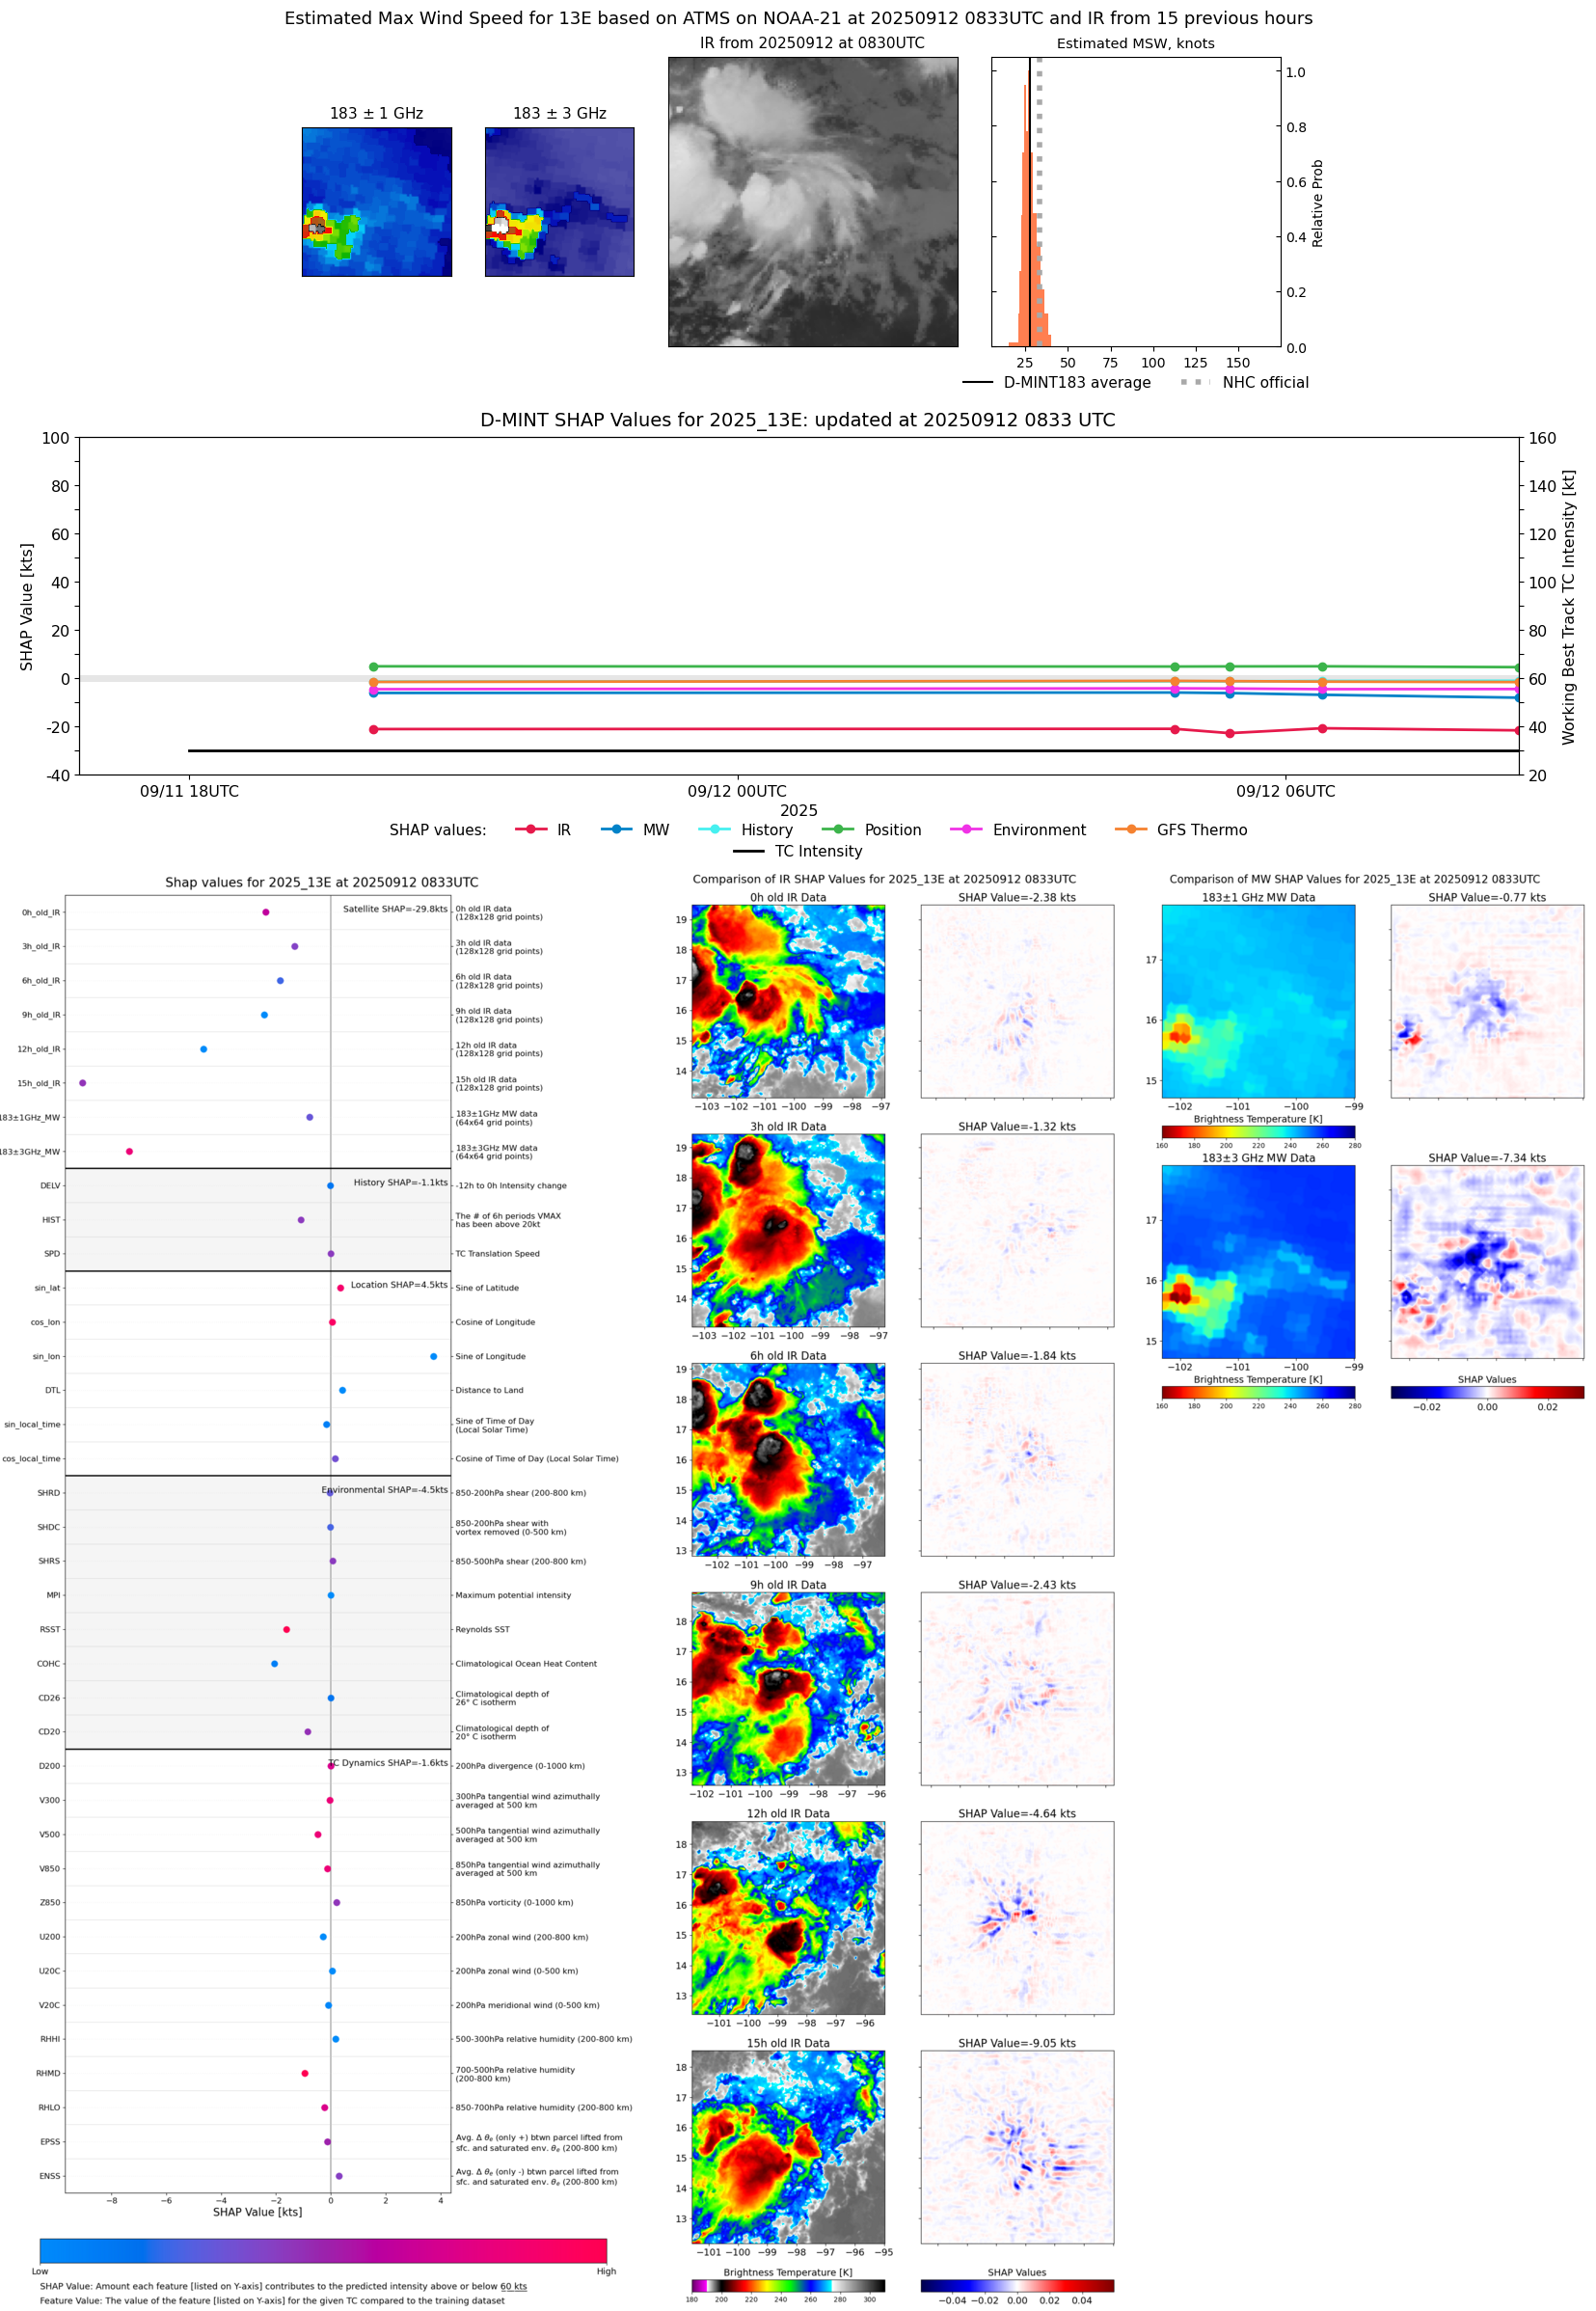 |
| 20250912 | 0825 UTC | AMSR2 | 1007 hPa | 27 kts | 25 kts | 31 kts | 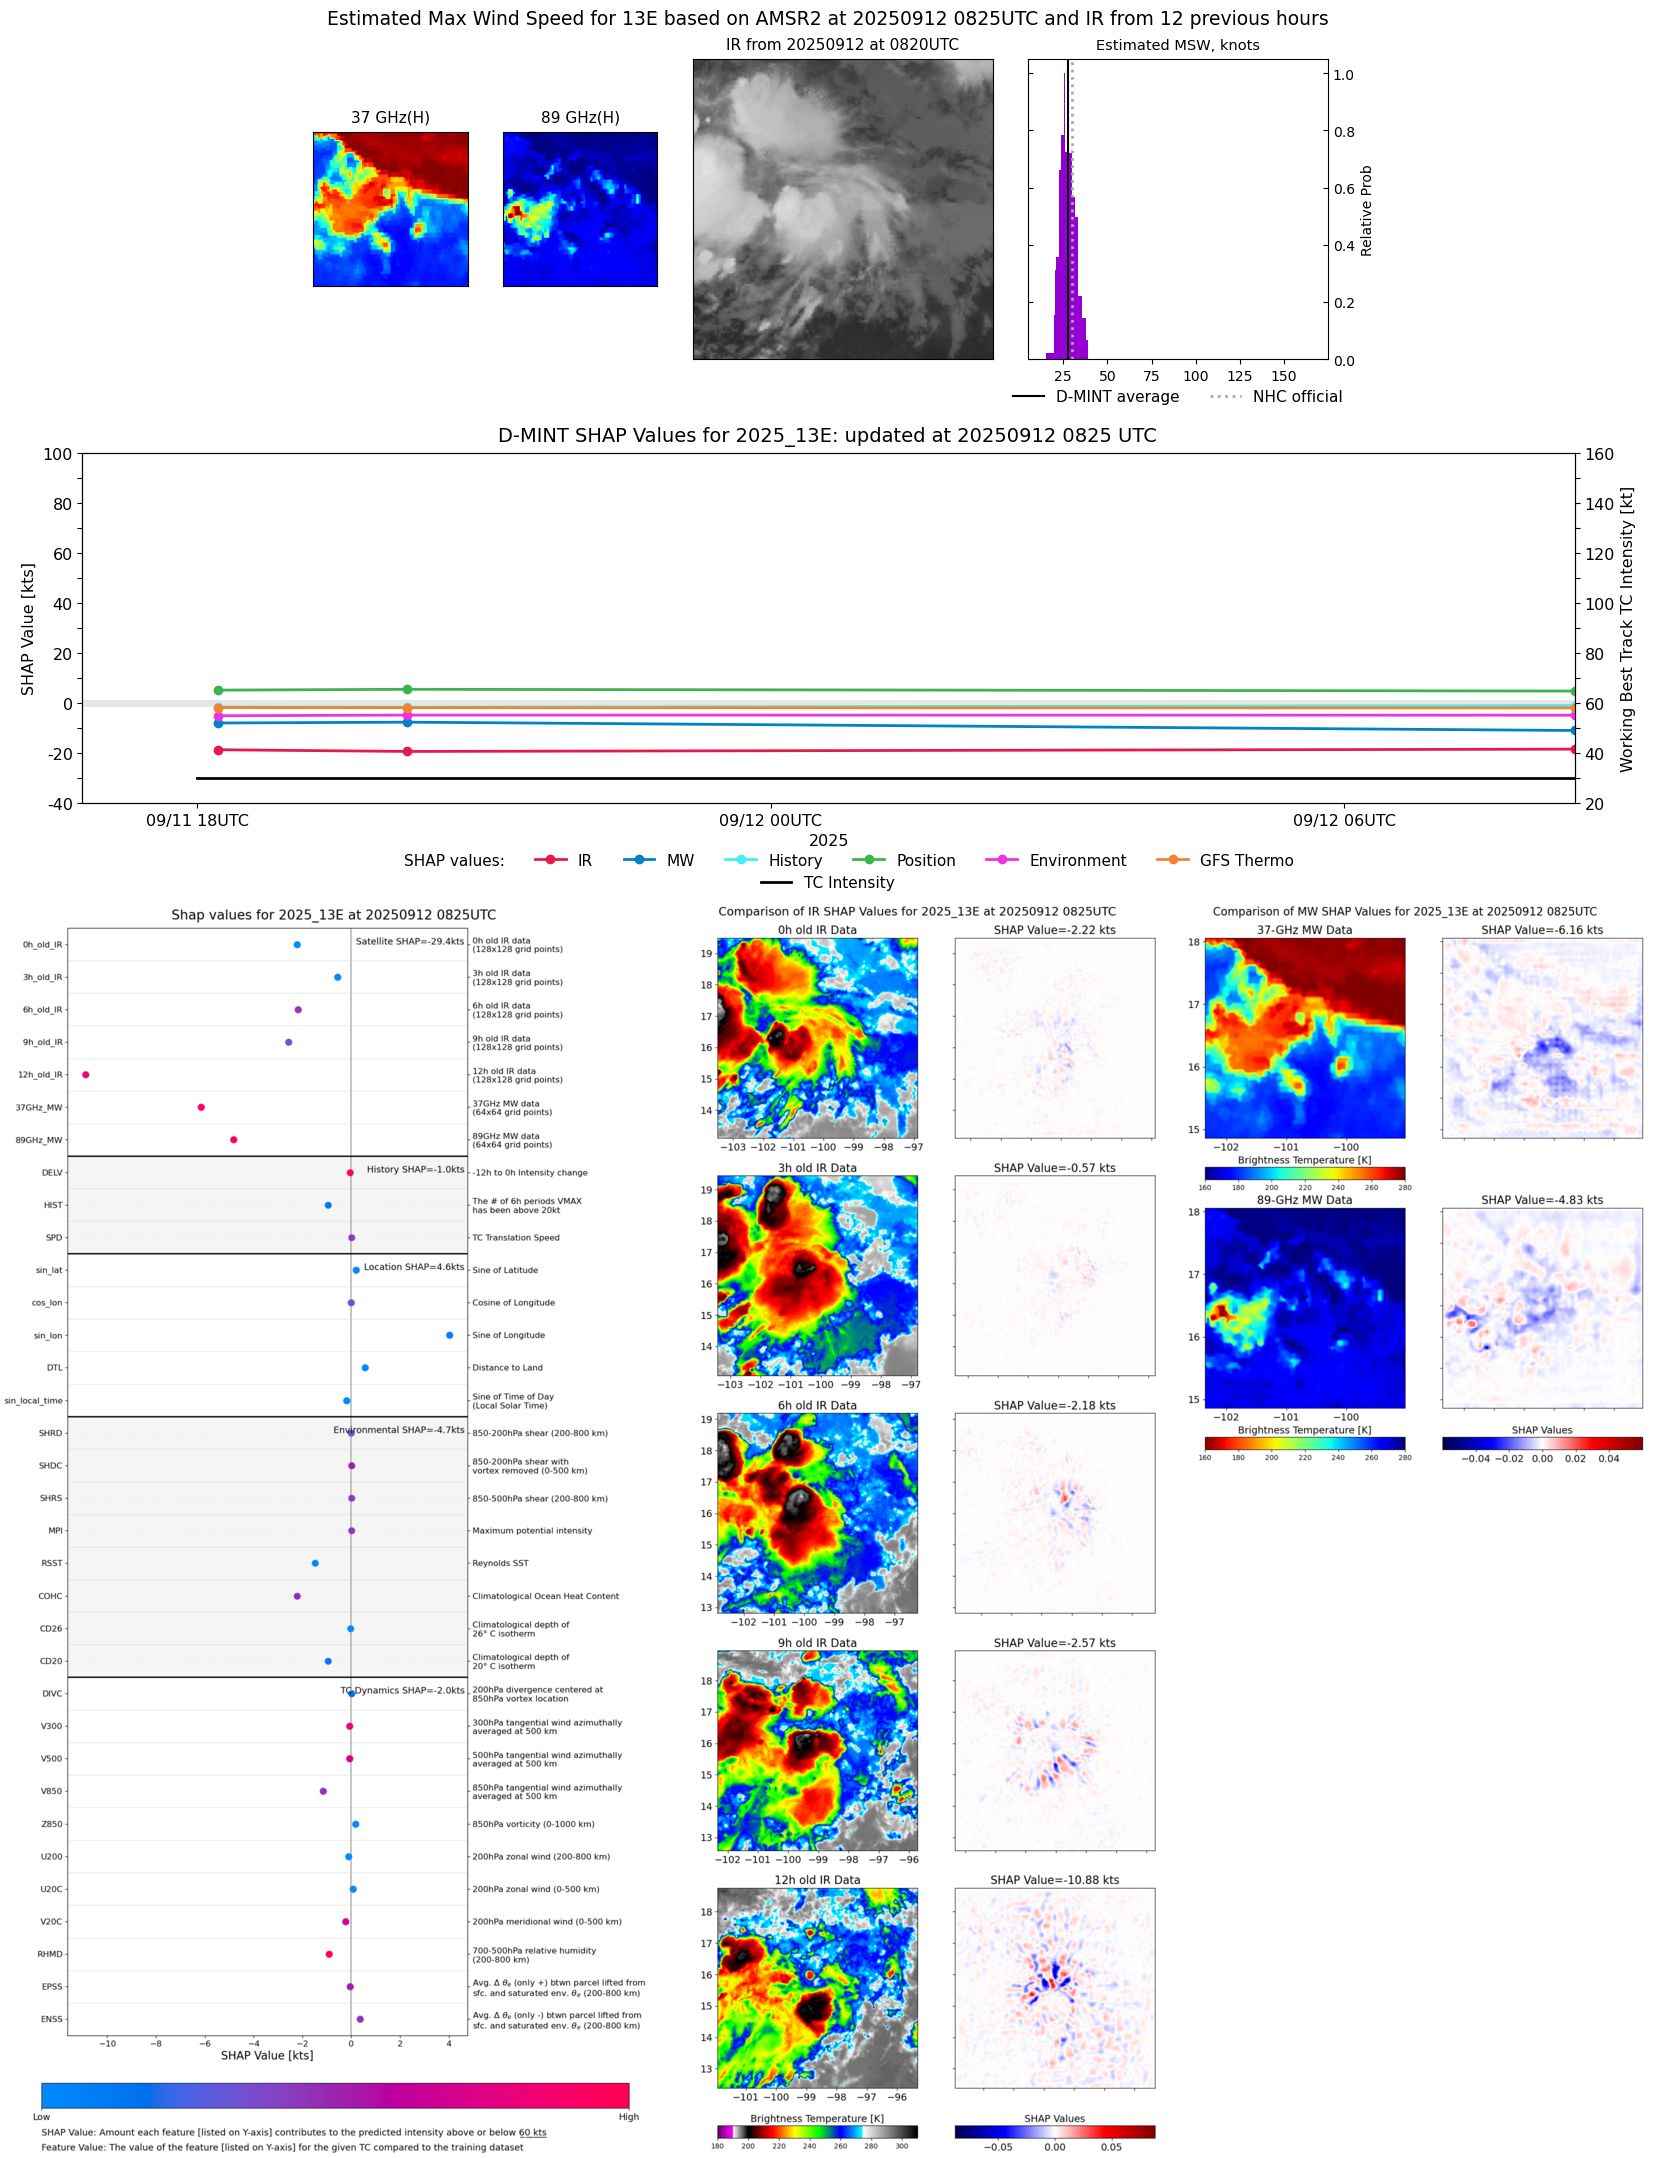 |
| 20250912 | 0743 UTC | TROPICS05 | 1007 hPa | 30 kts | 26 kts | 33 kts | 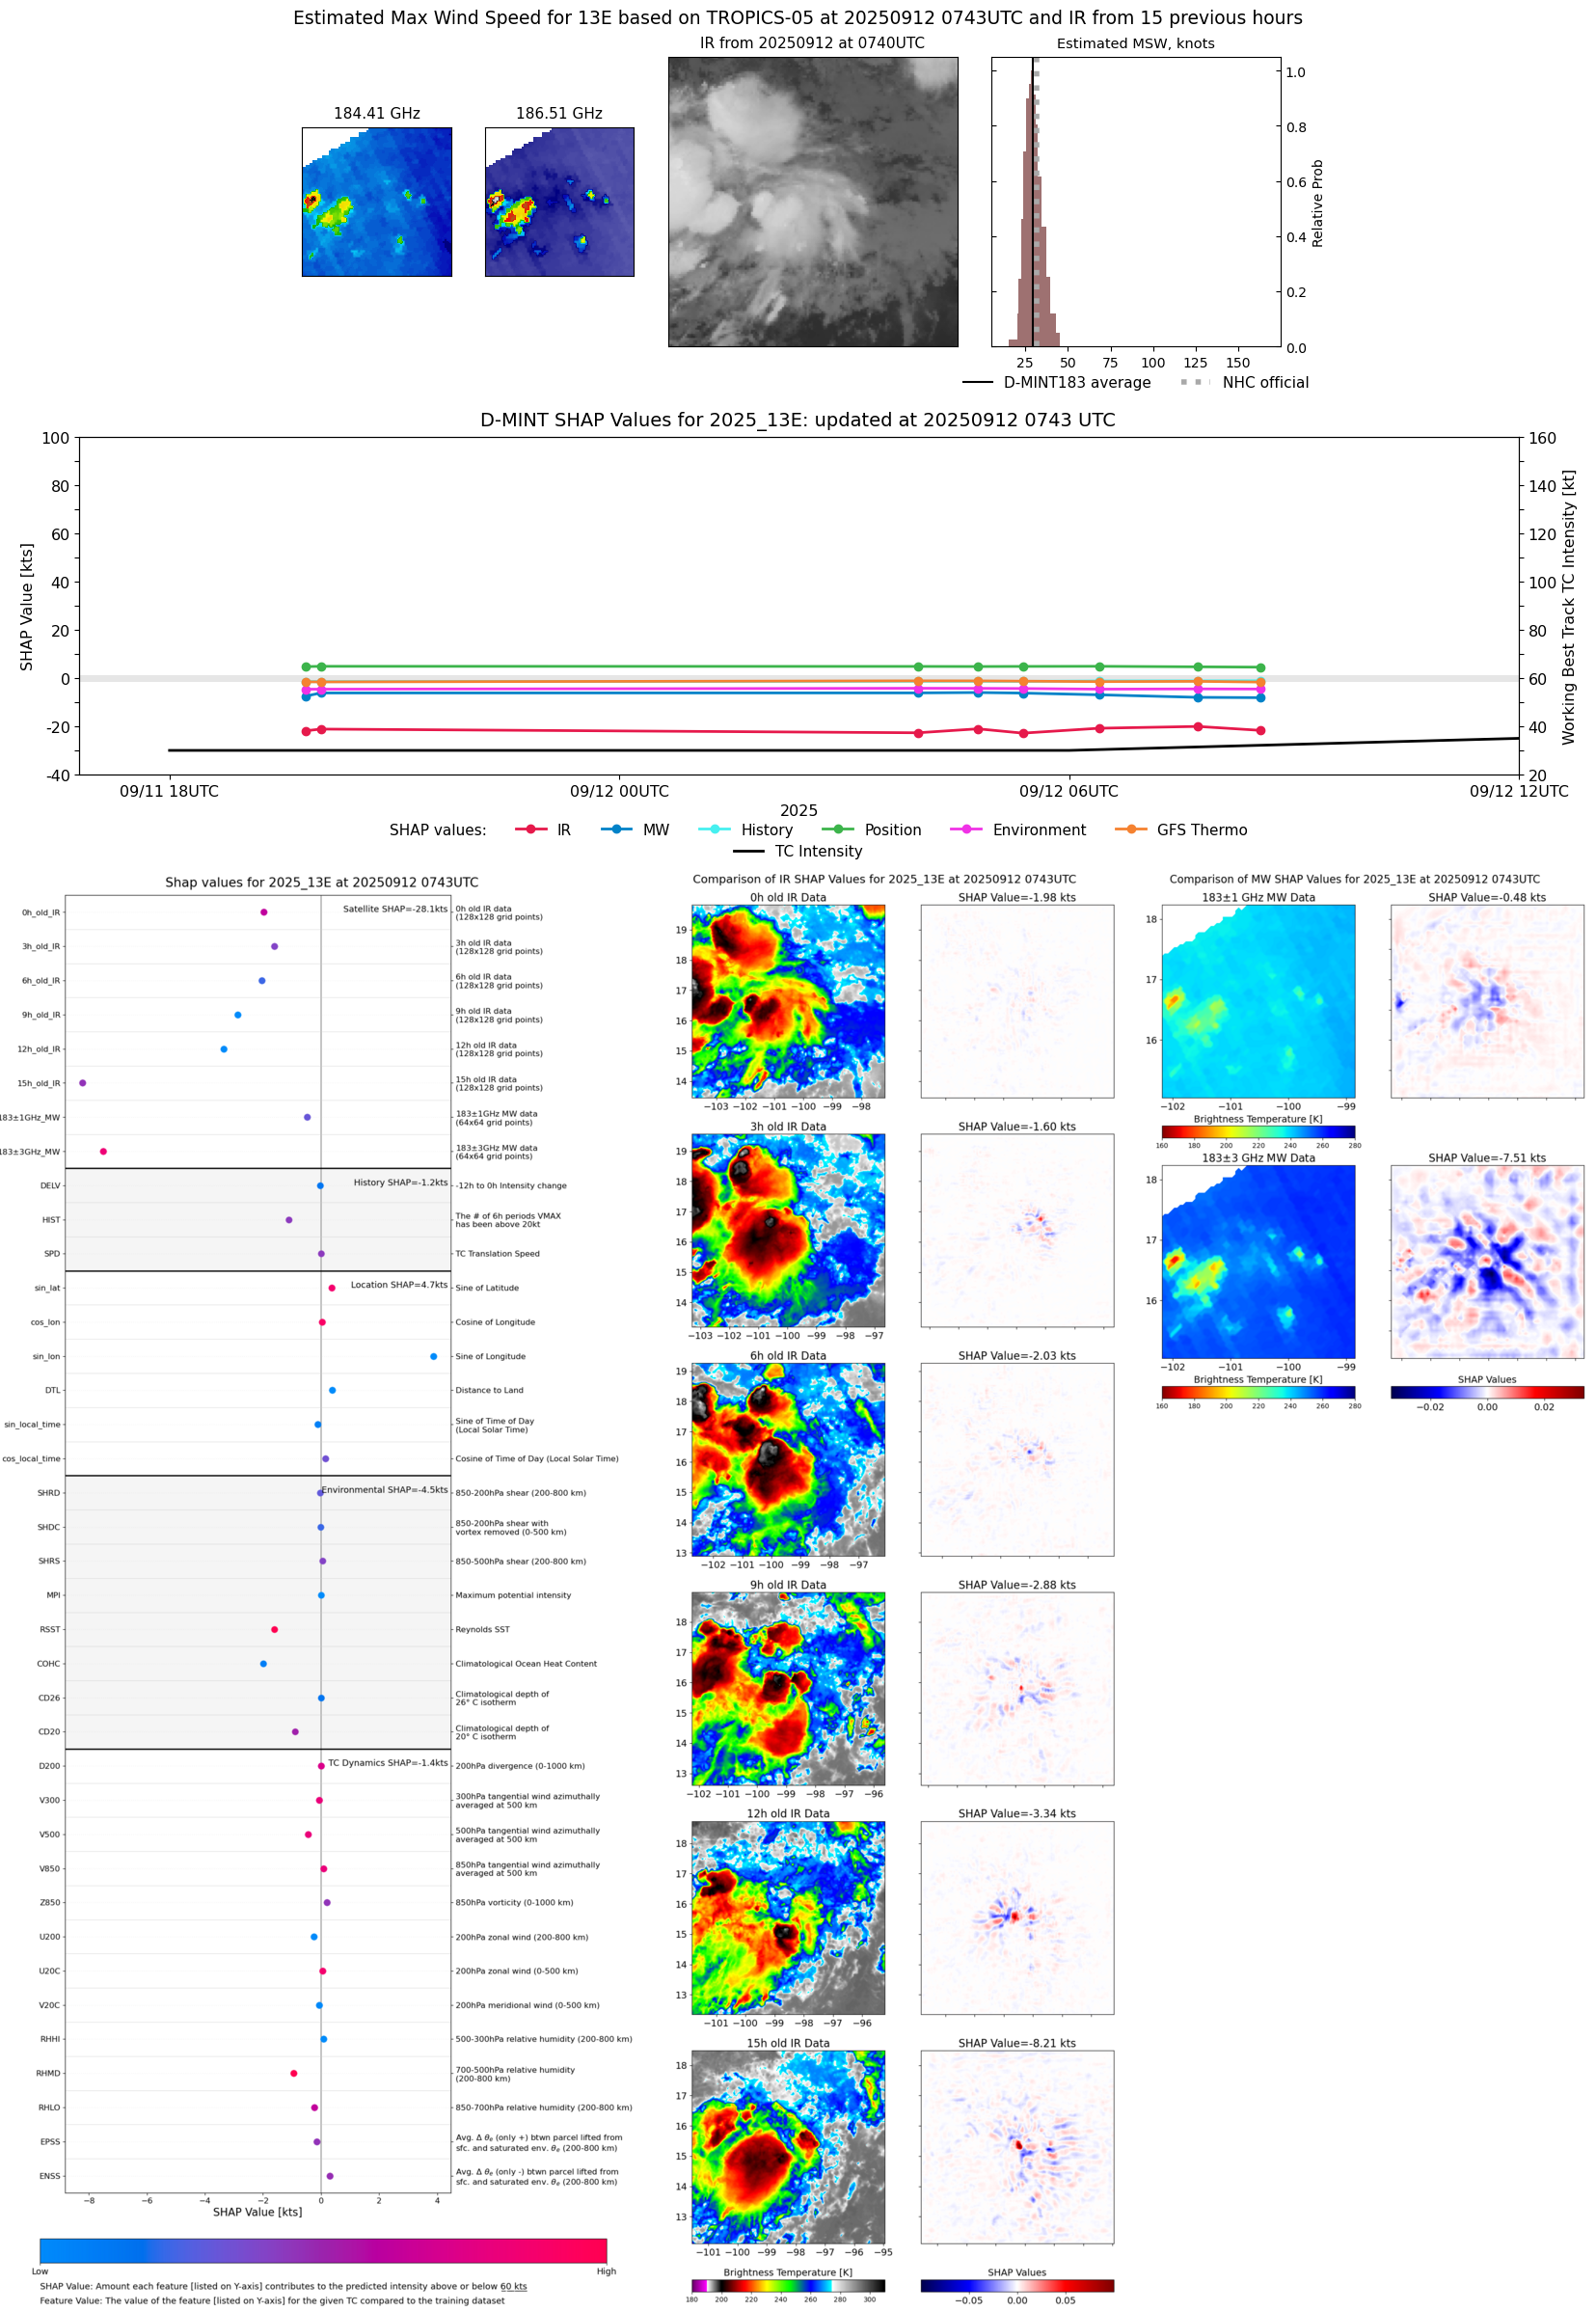 |
| 20250912 | 0624 UTC | TMS07 | 1008 hPa | 30 kts | 26 kts | 34 kts | 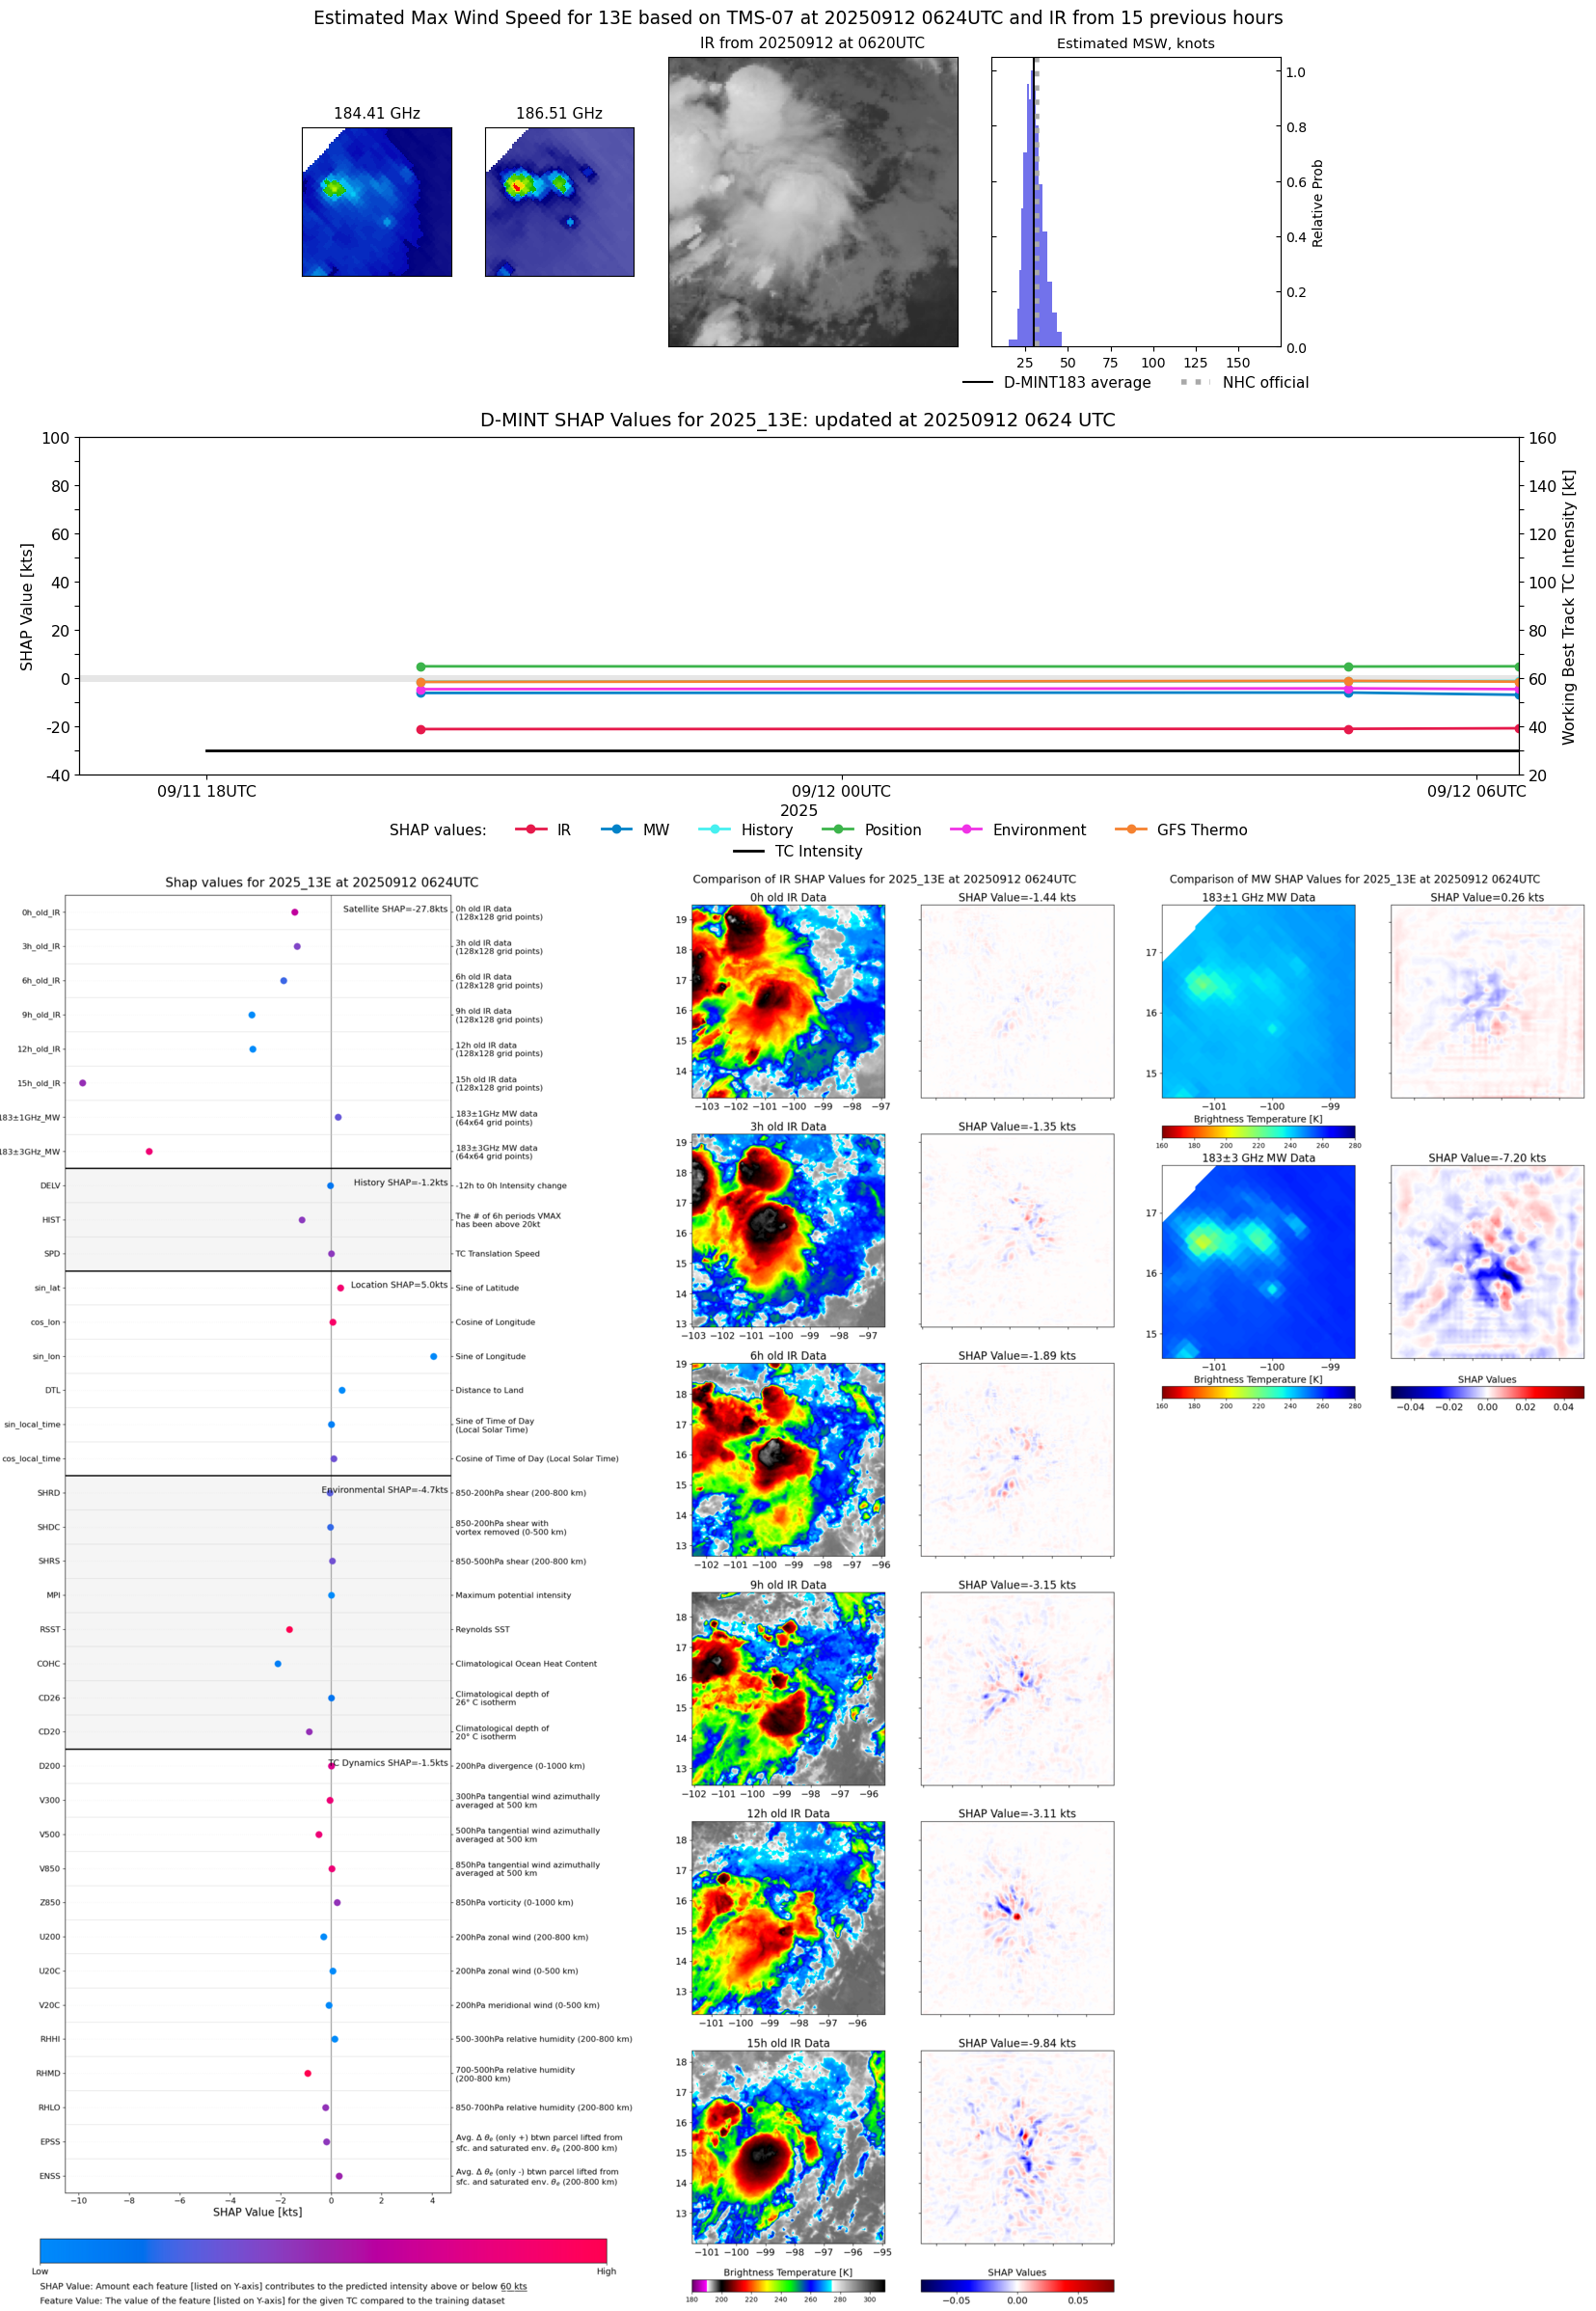 |
| 20250912 | 0523 UTC | TMS06 | 1006 hPa | 29 kts | 25 kts | 33 kts | 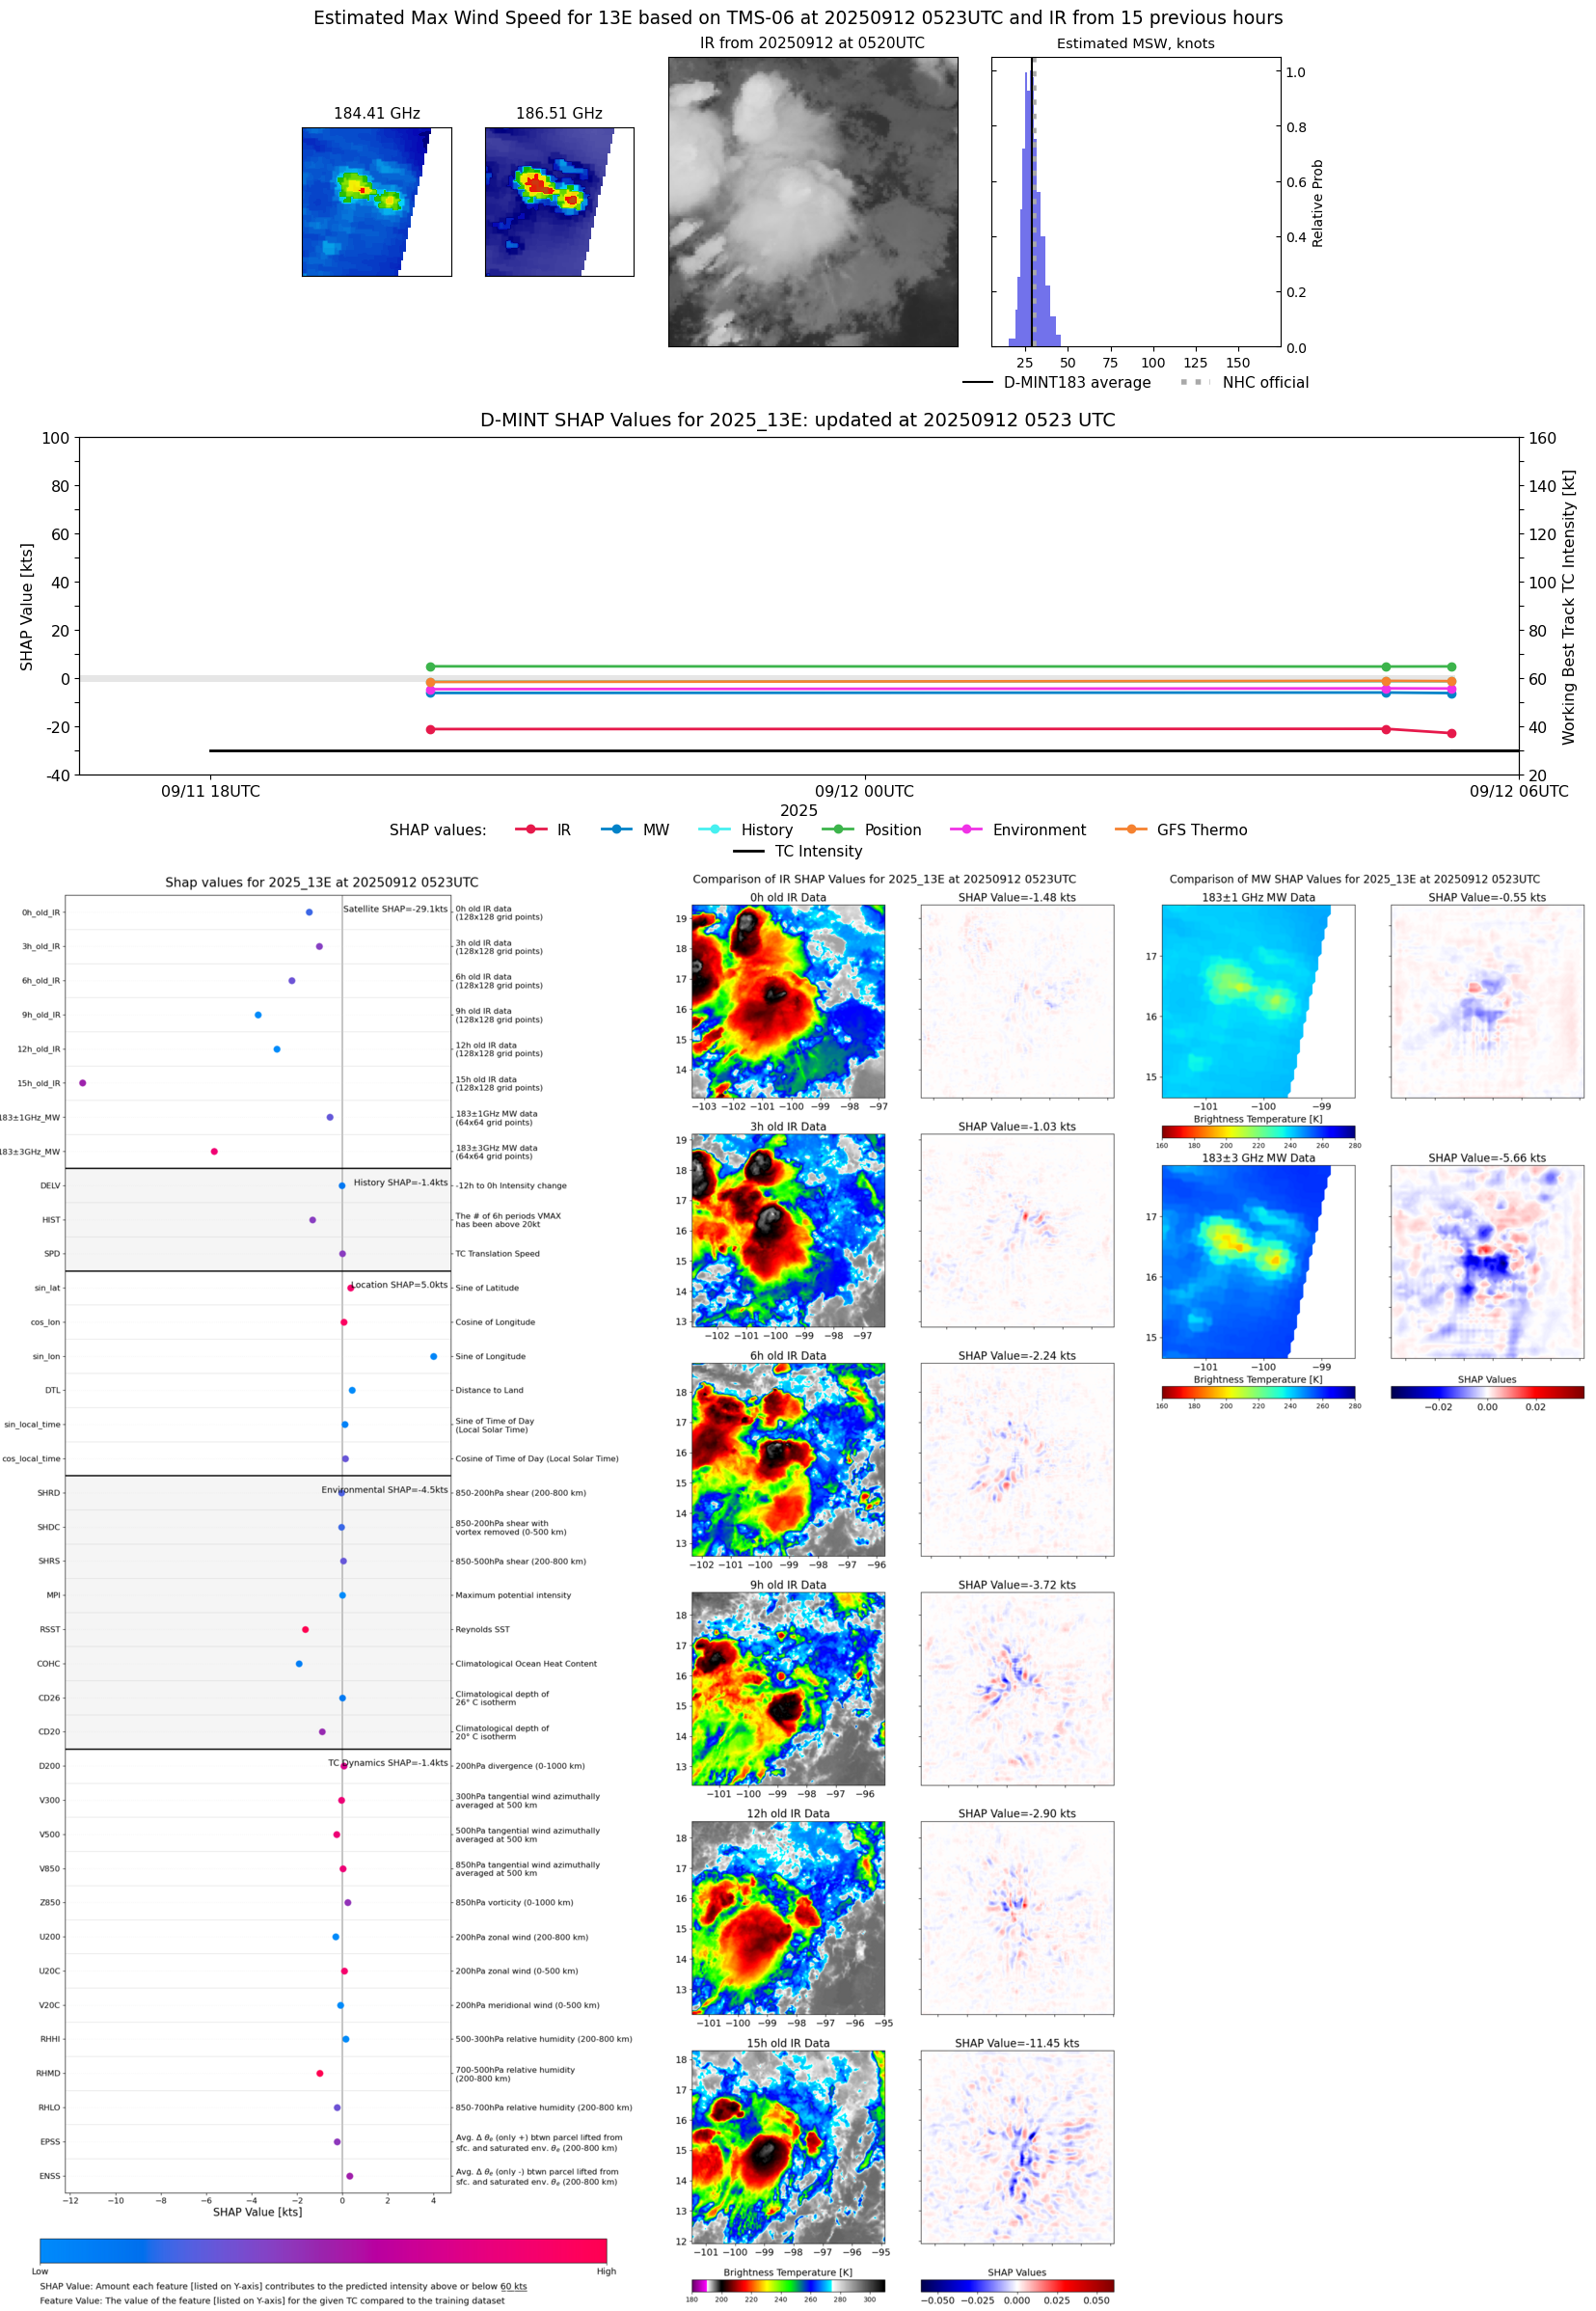 |
| 20250912 | 0447 UTC | TMS02 | 1005 hPa | 31 kts | 27 kts | 35 kts | 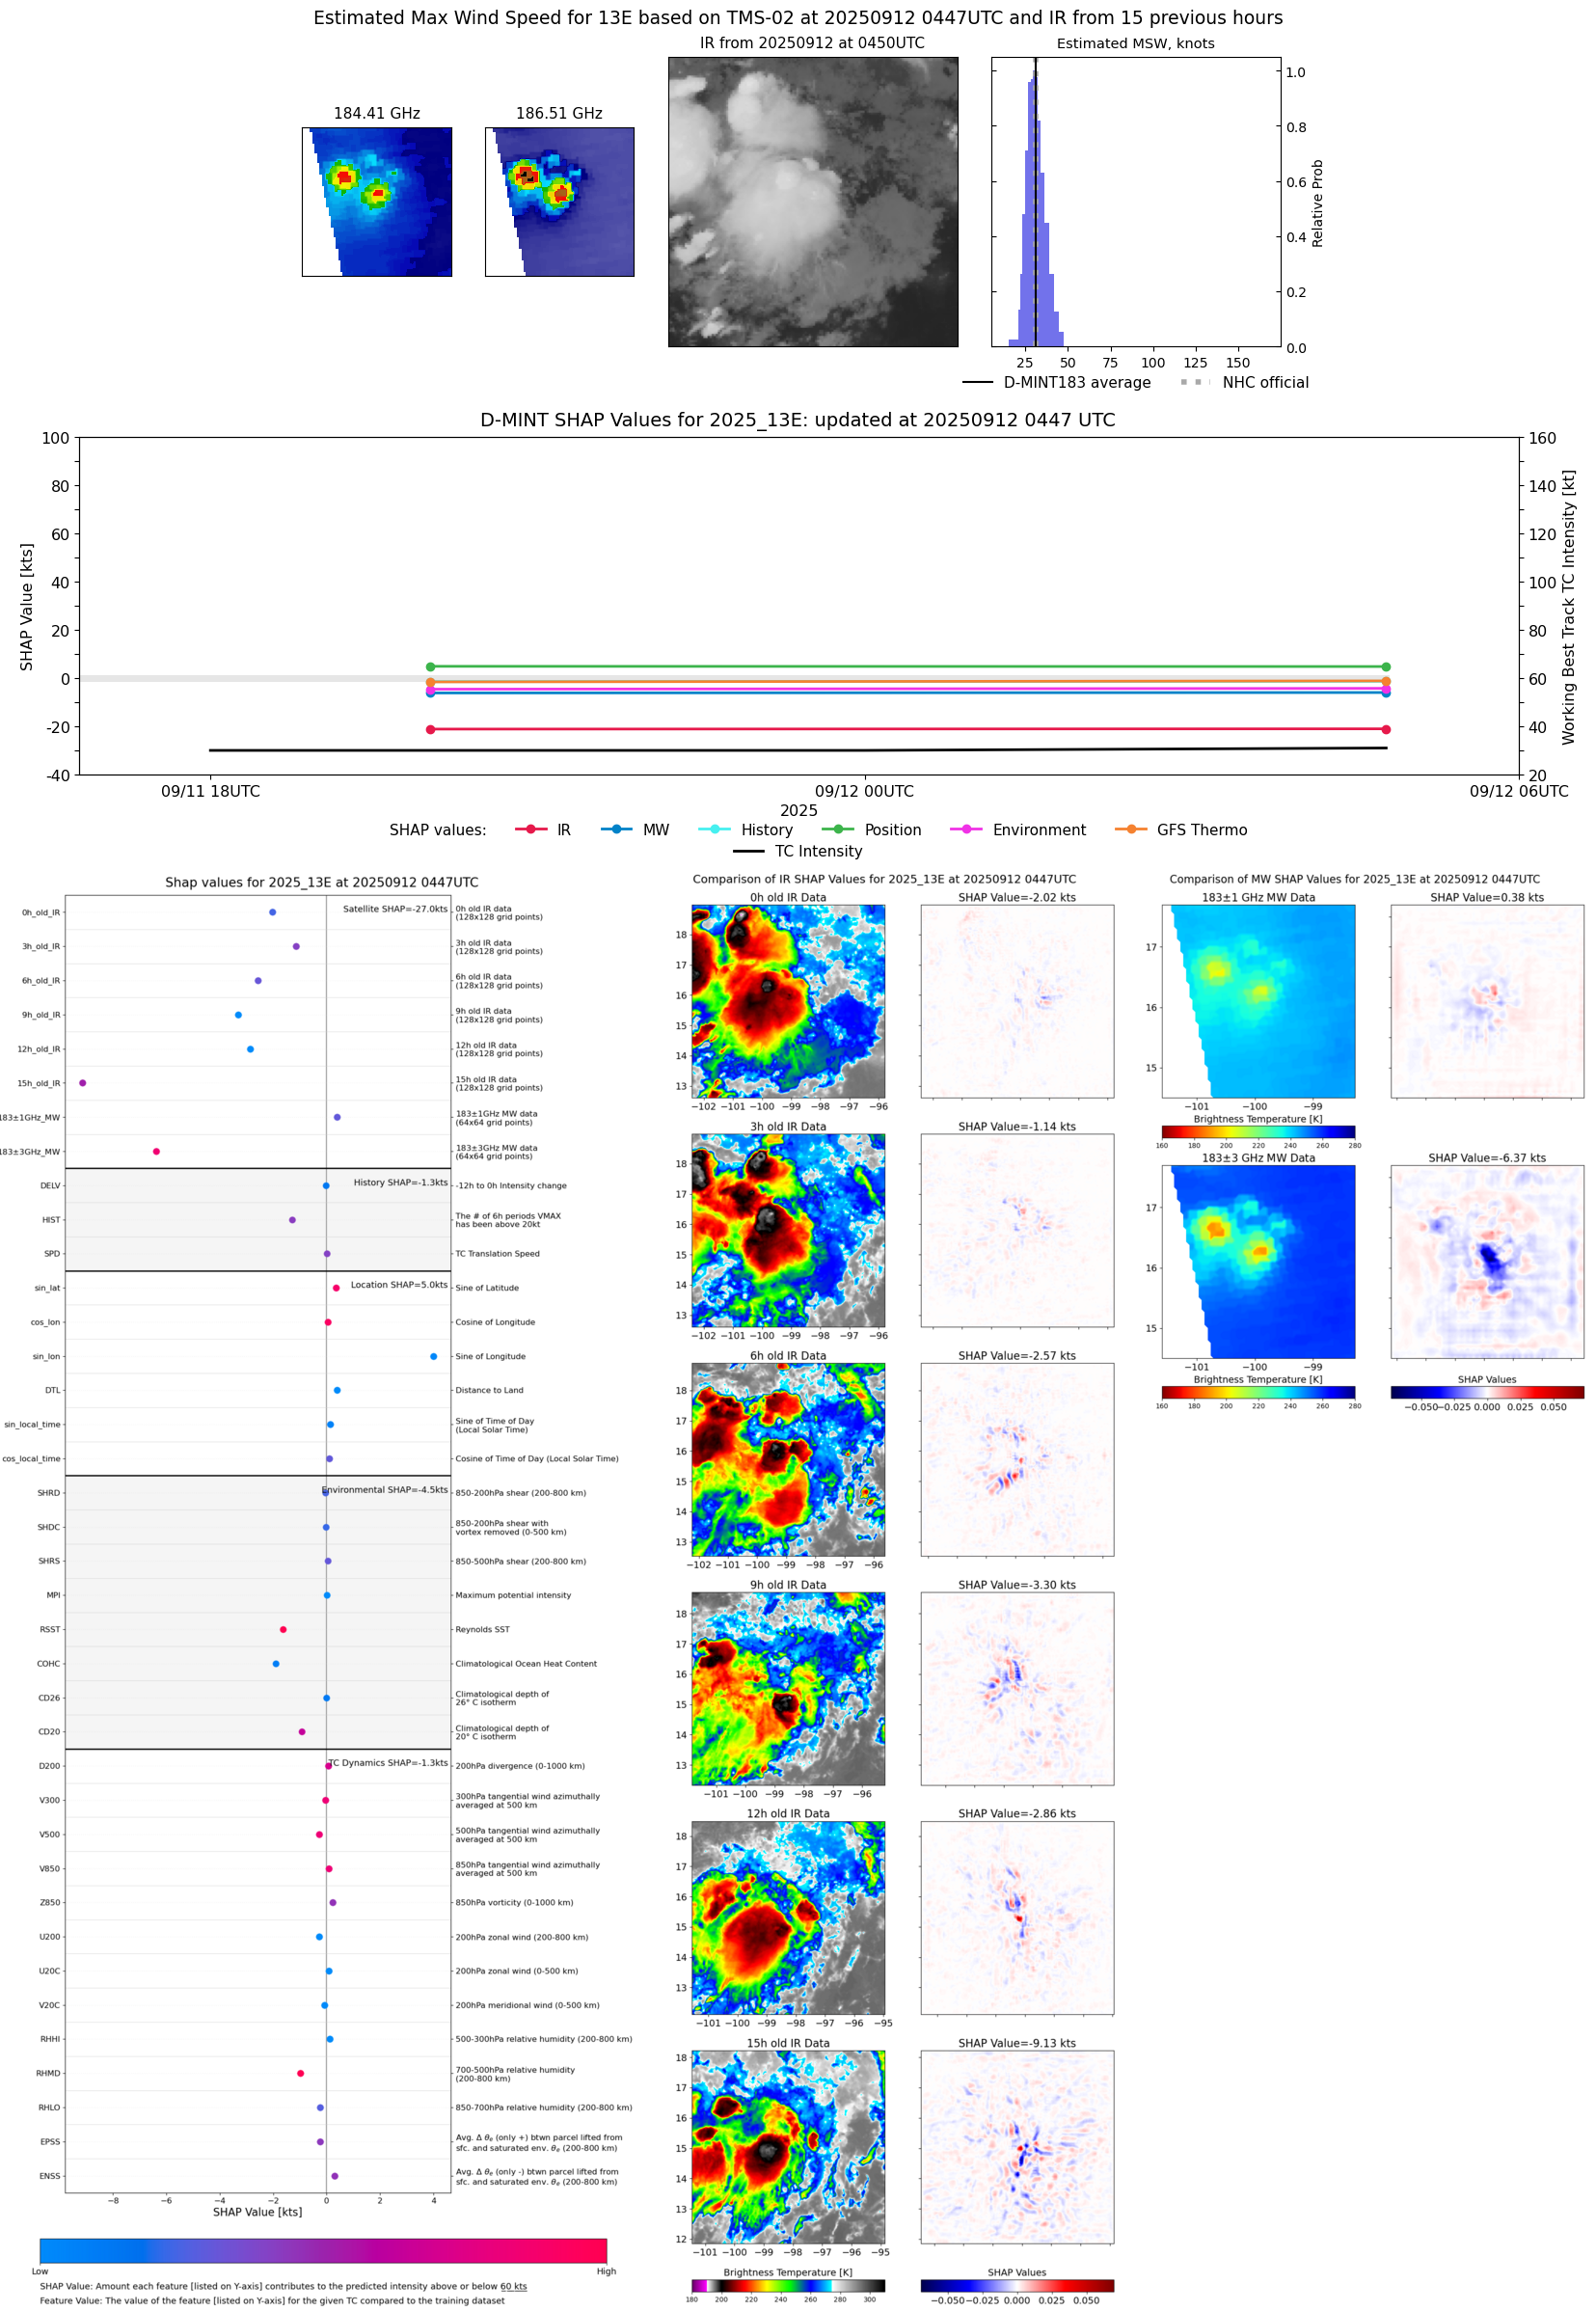 |
| 20250912 | 0359 UTC | TROPICS03 | 1007 hPa | 29 kts | 26 kts | 33 kts |  |
| 20250912 | 0055 UTC | WSFM01 | 1006 hPa | 31 kts | 28 kts | 34 kts |  |
| 20250911 | 1303 UTC | SSMISF16 | NaN hPa | 31 kts | 26 kts | 36 kts |  |
| 20250911 | 1223 UTC | SSMISF17 | NaN hPa | 32 kts | 28 kts | 38 kts |  |
| 20250911 | 2214 UTC | SSMISF18 | 1009 hPa | 28 kts | 25 kts | 32 kts |  |
| 20250911 | 2012 UTC | AMSR2 | 1009 hPa | 30 kts | 26 kts | 34 kts | 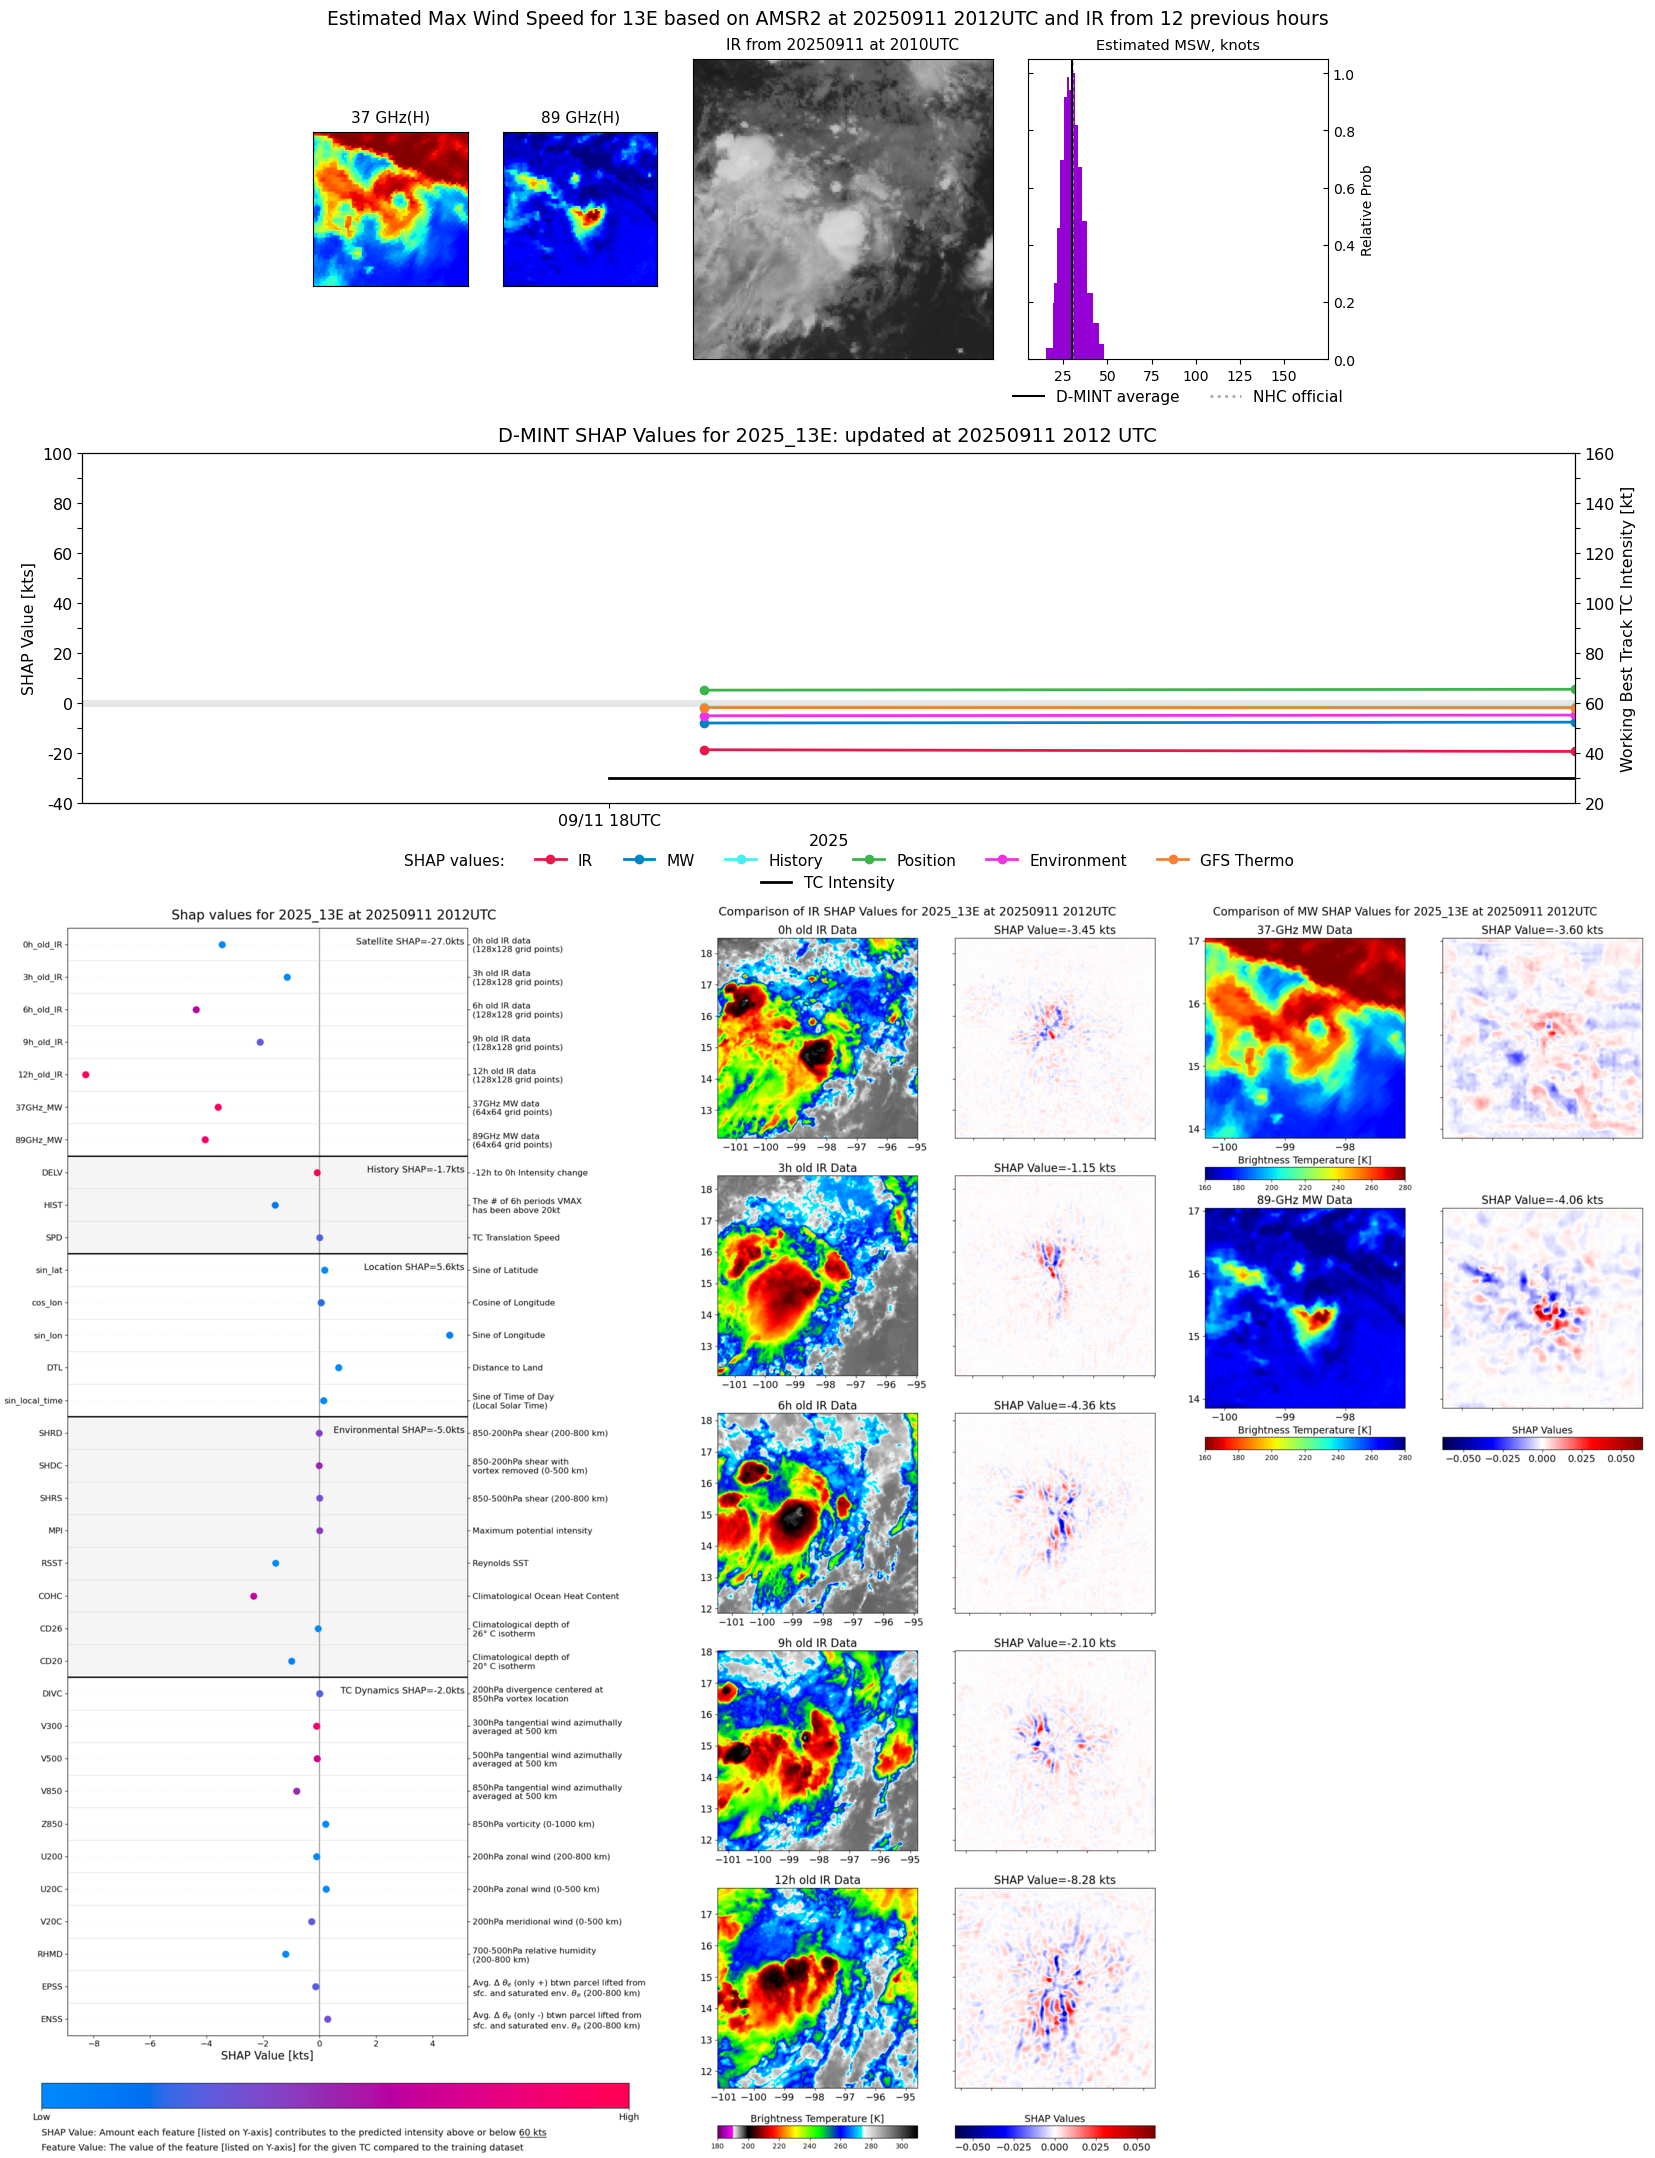 |
| 20250911 | 2001 UTC | ATMS-N21 | 1009 hPa | 30 kts | 27 kts | 34 kts | 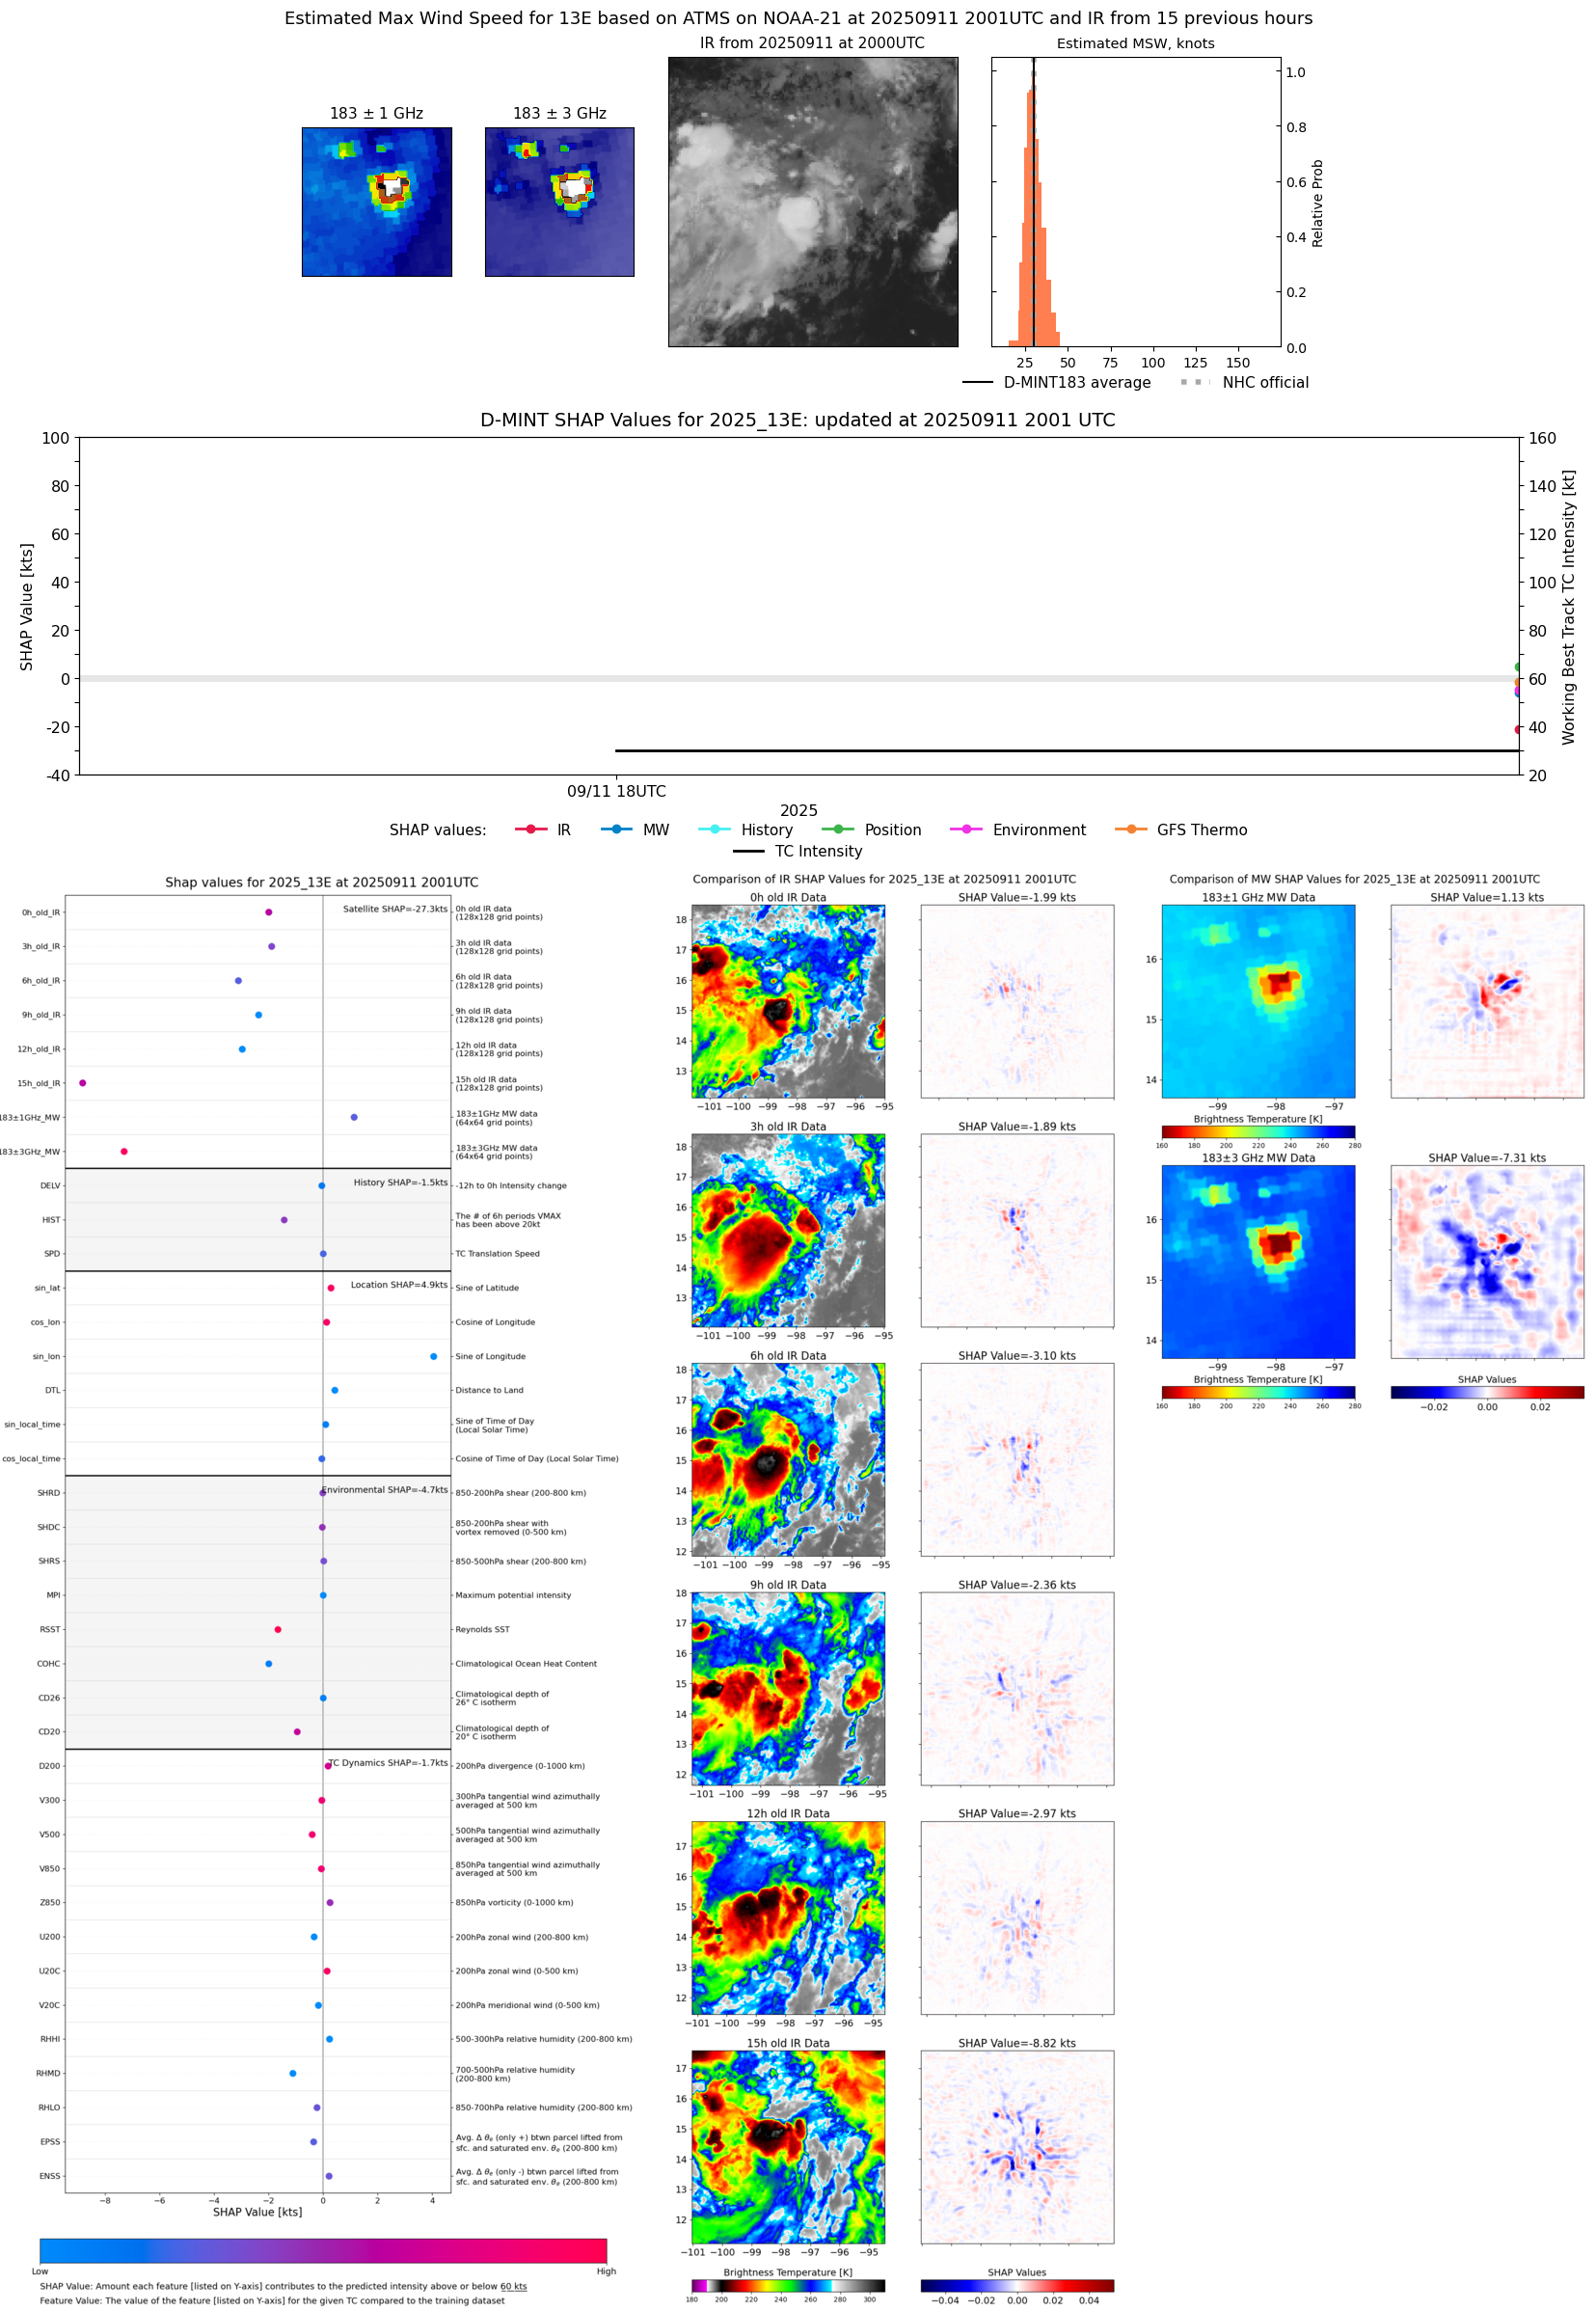 |
| 20250911 | 1949 UTC | TROPICS03 | 1008 hPa | 28 kts | 25 kts | 31 kts | 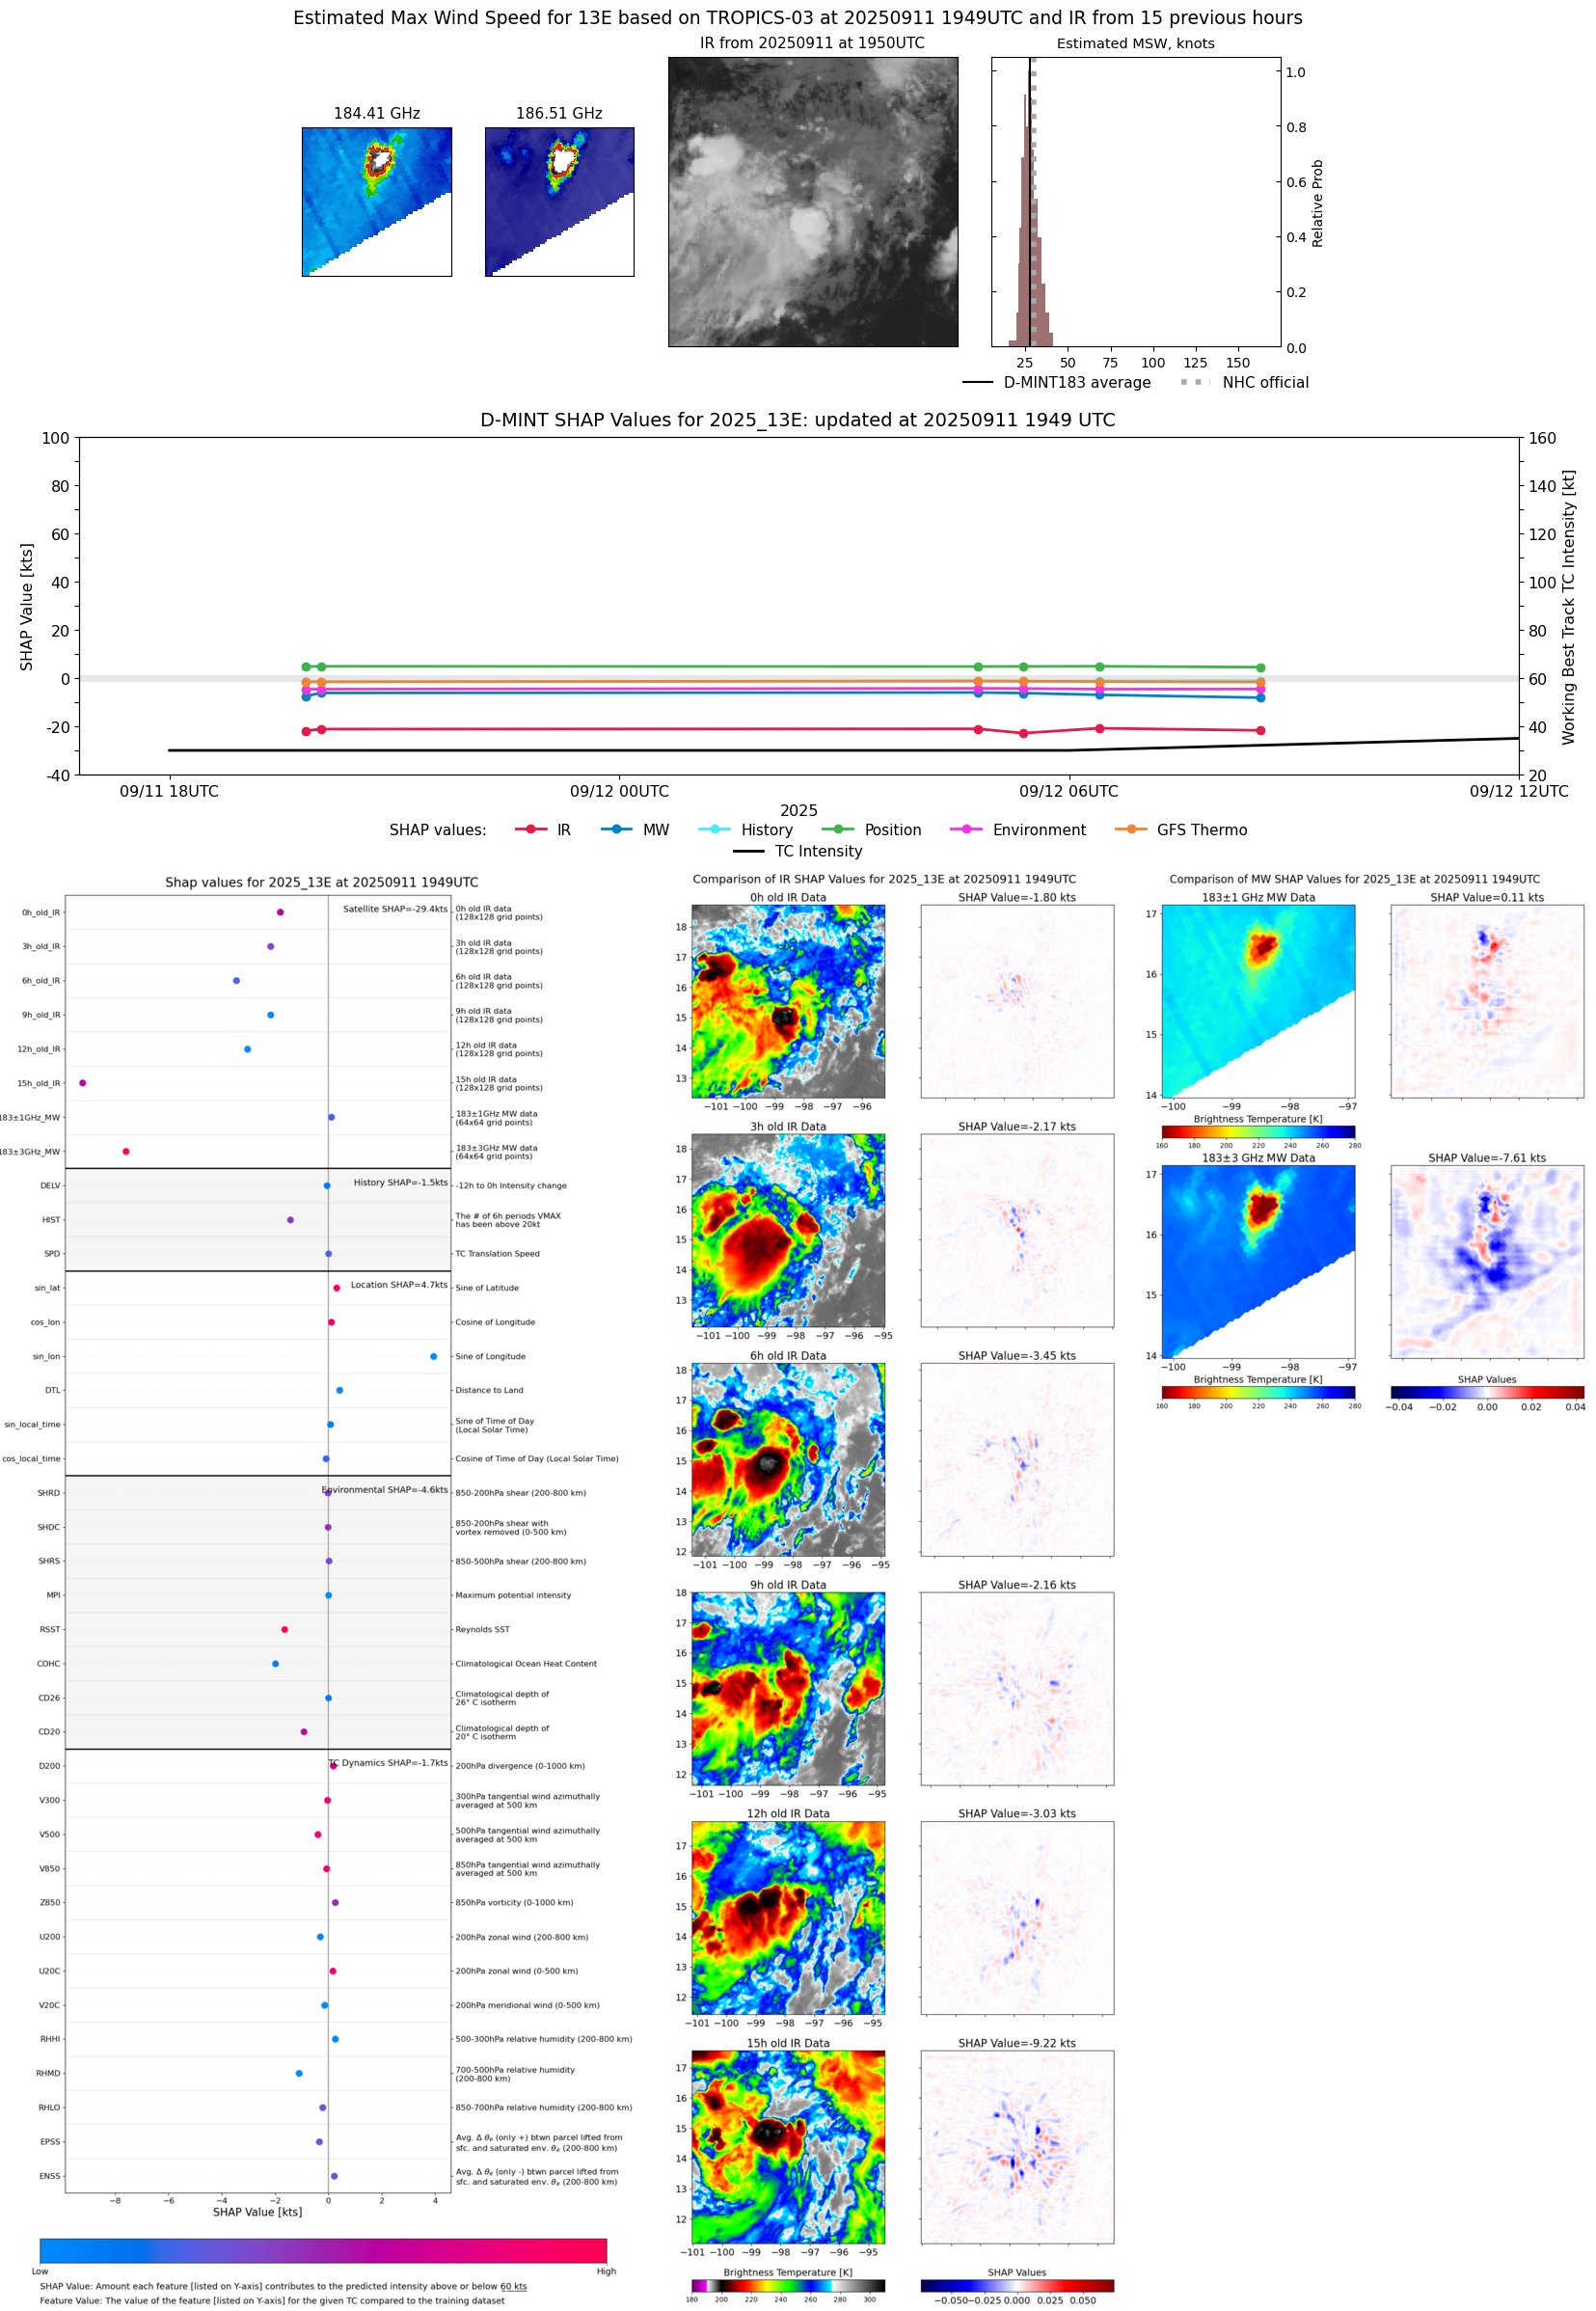 |
| 20250911 | 1813 UTC | GMI | 1008 hPa | 30 kts | 26 kts | 34 kts | 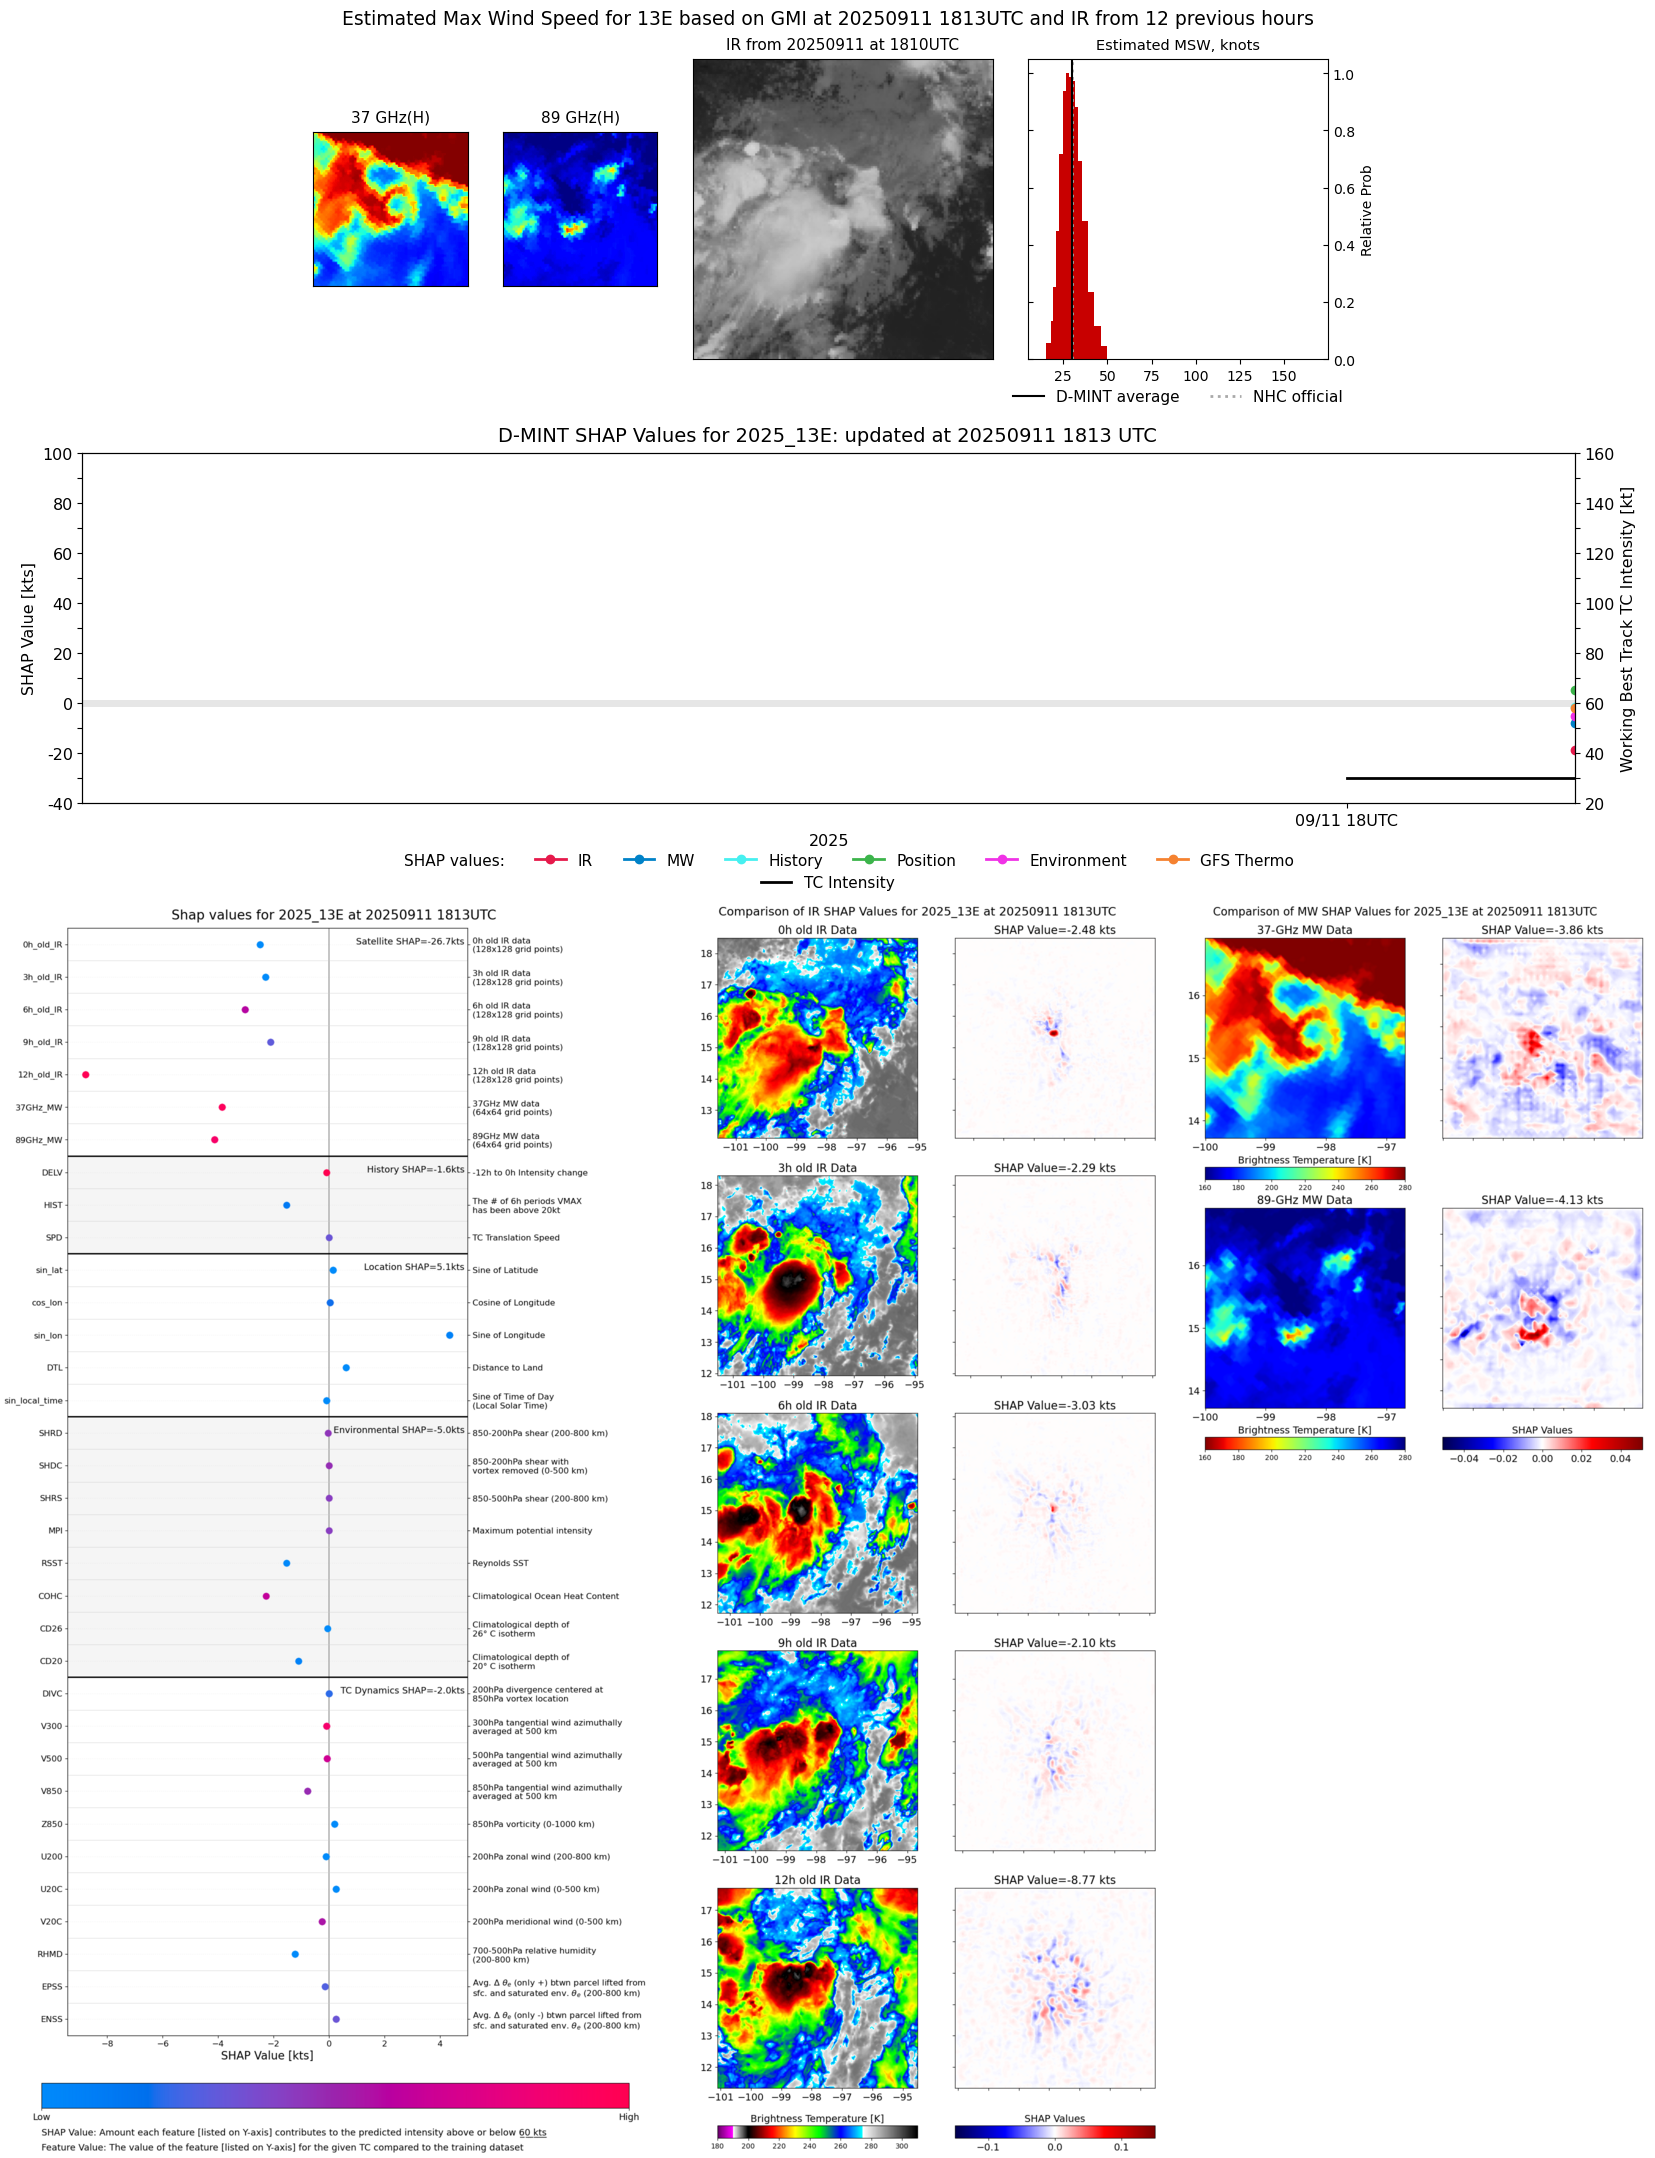 |
| 20250910 | 2228 UTC | SSMISF18 | NaN hPa | 29 kts | 26 kts | 32 kts |  |
| 20250910 | 1929 UTC | AMSR2 | NaN hPa | 25 kts | 22 kts | 28 kts |  |
| 20250910 | 1317 UTC | SSMISF16 | NaN hPa | 25 kts | 23 kts | 28 kts | 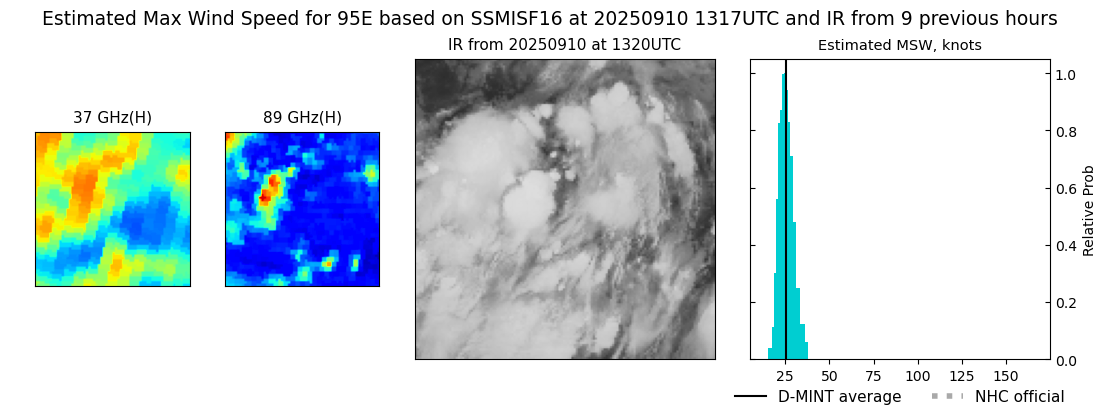 |
| 20250910 | 1238 UTC | SSMISF17 | NaN hPa | 25 kts | 22 kts | 28 kts |  |
| 20250910 | 0540 UTC | GMI | NaN hPa | 22 kts | 19 kts | 24 kts | 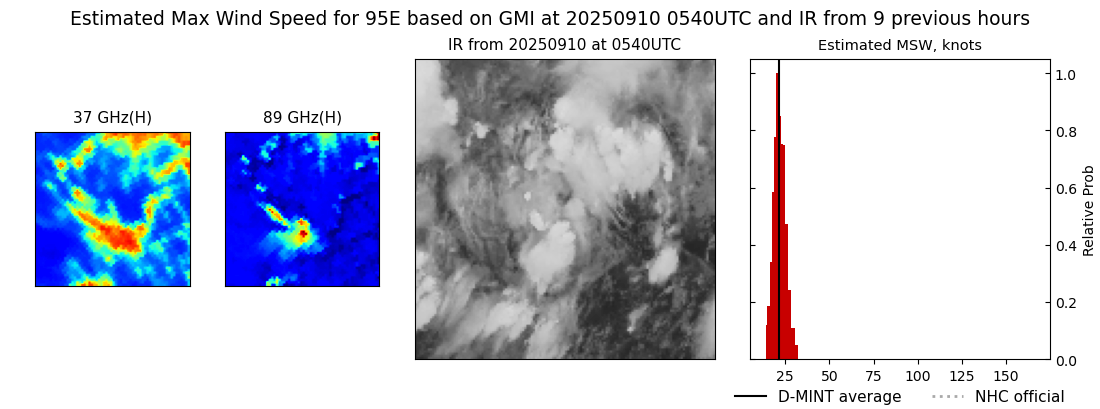 |
| 20250910 | 0040 UTC | SSMISF16 | NaN hPa | 25 kts | 23 kts | 28 kts |  |