|
||

 |
D-MINT HISTORY FILE for 2025_13L
| Date | Time | MW Sensor | MSLP | Vmax (30th-70th percentile average) | Vmax 25th percentile | Vmax 75th percentile | Image |
| 20251031 | 2119 UTC | SSMISF16 | 965 hPa | 56 kts | 49 kts | 62 kts | 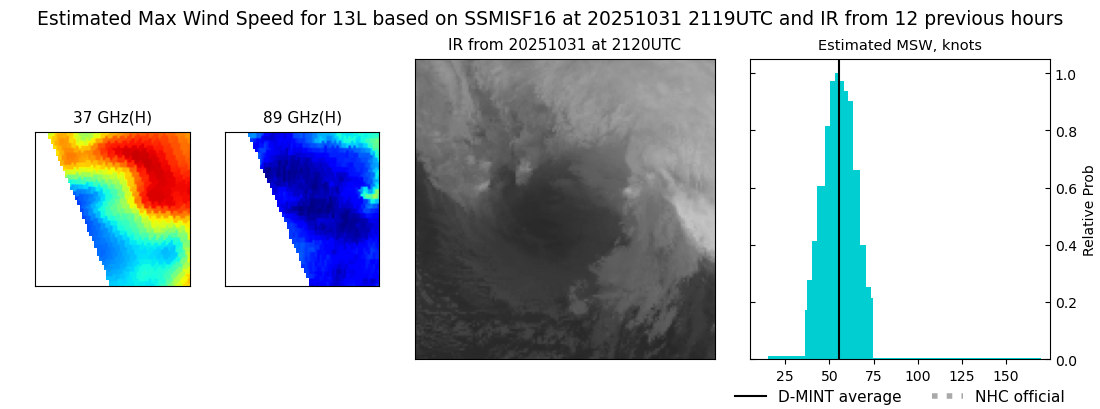 |
| 20251031 | 1902 UTC | SSMISF18 | 970 hPa | 63 kts | 56 kts | 71 kts | 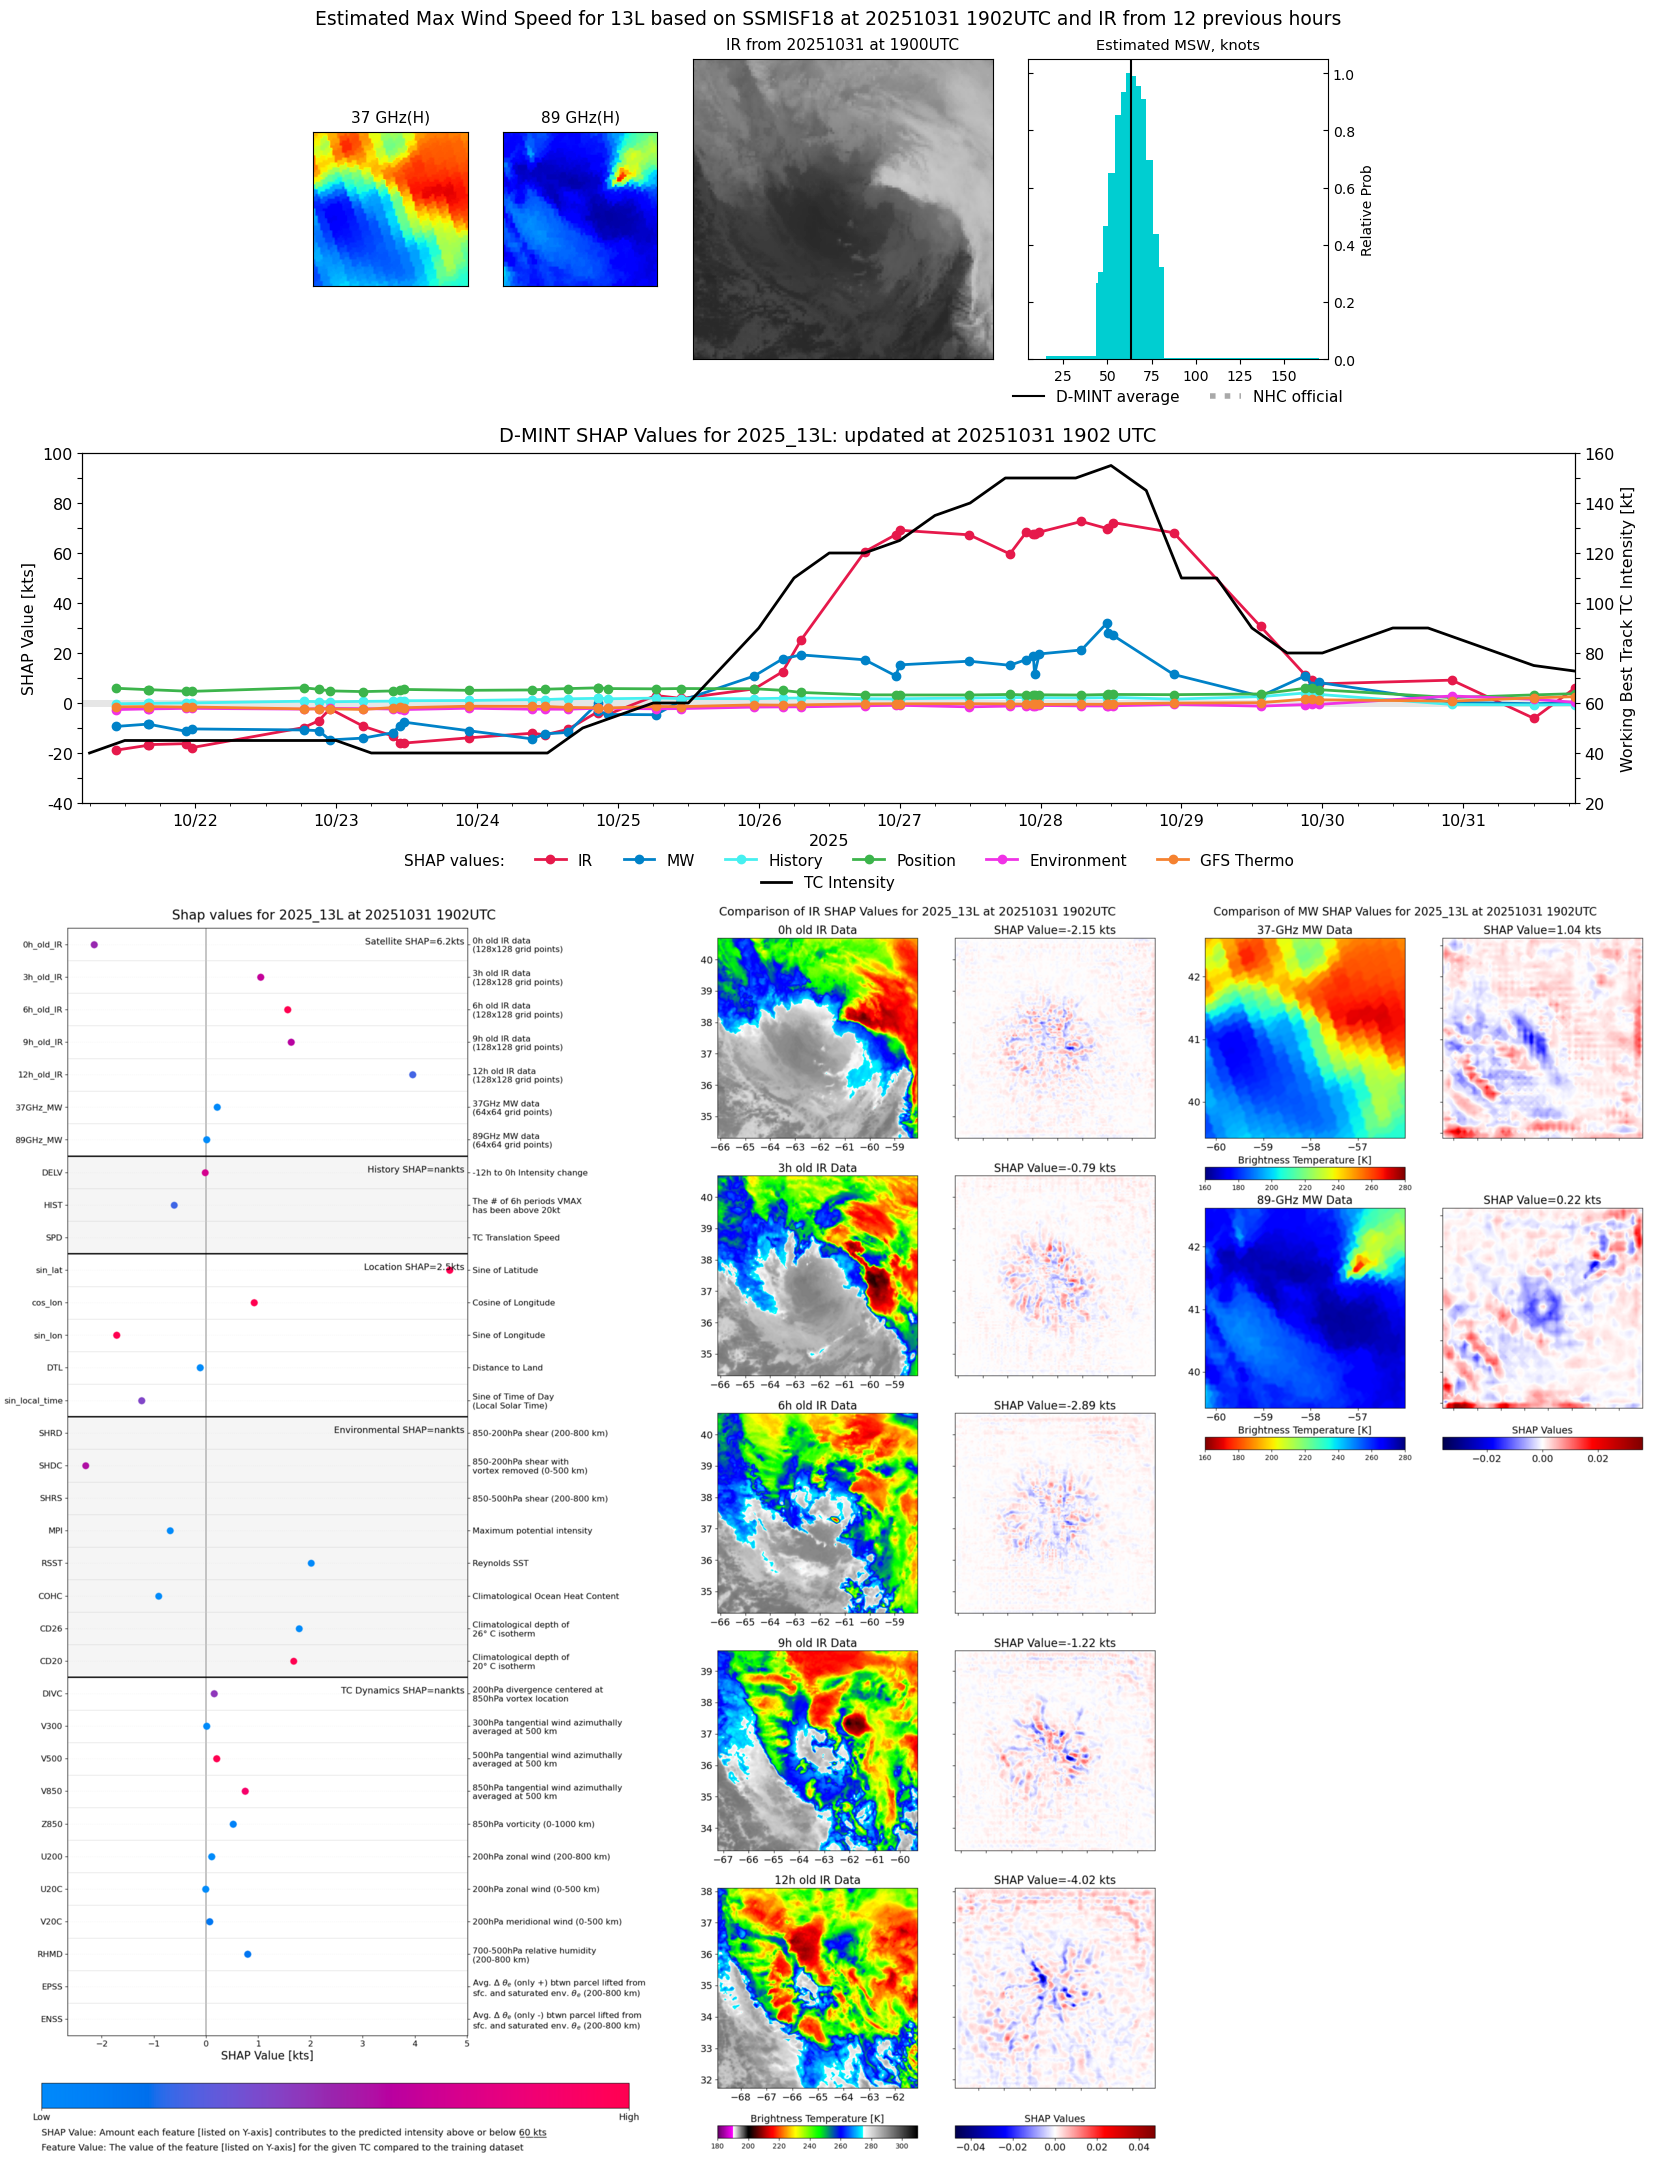 |
| 20251031 | 1649 UTC | AMSR2 | 972 hPa | 58 kts | 51 kts | 65 kts | 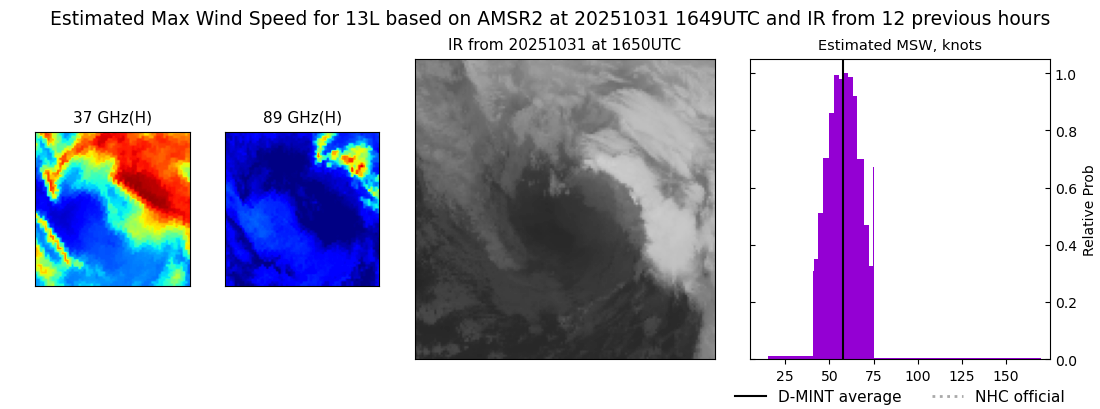 |
| 20251031 | 1636 UTC | ATMS-NPP | 964 hPa | 55 kts | 50 kts | 60 kts | 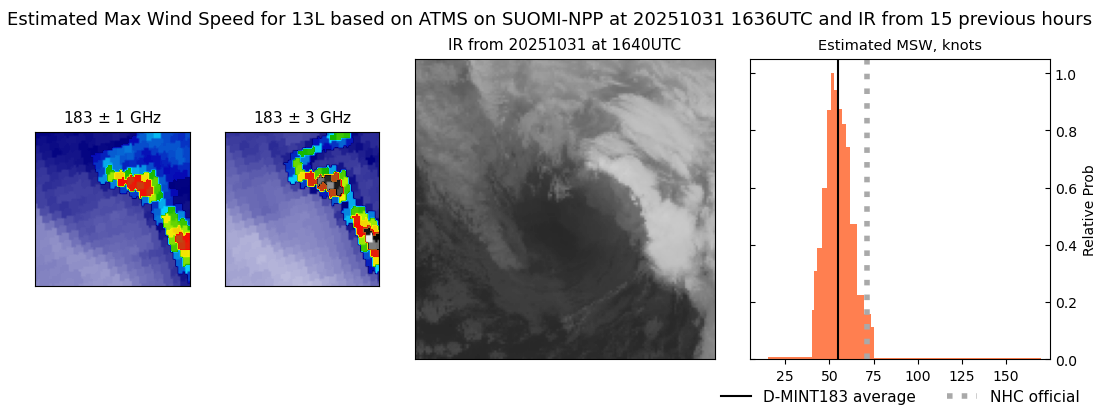 |
| 20251031 | 1513 UTC | TMS07 | 963 hPa | 58 kts | 52 kts | 64 kts | 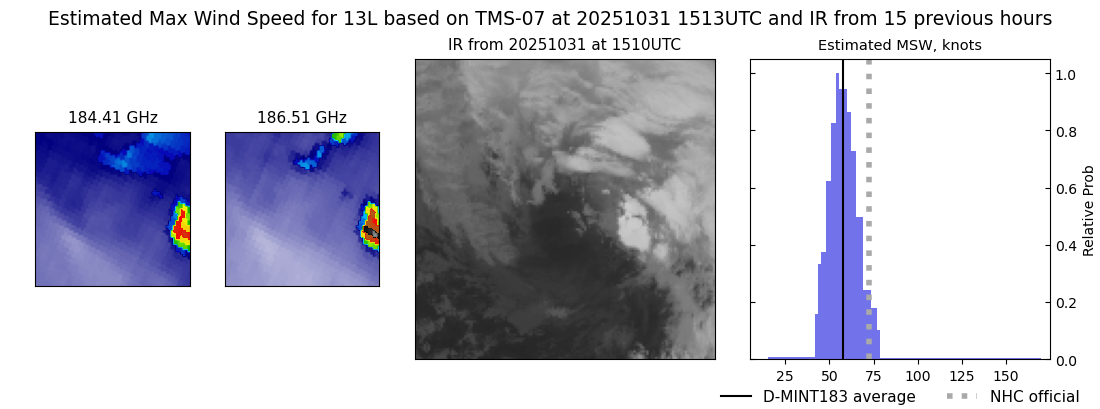 |
| 20251031 | 1451 UTC | AWS | 967 hPa | 56 kts | 51 kts | 62 kts |  |
| 20251031 | 1443 UTC | TMS02 | 968 hPa | 56 kts | 50 kts | 61 kts |  |
| 20251031 | 1203 UTC | GMI | 981 hPa | 51 kts | 46 kts | 57 kts | 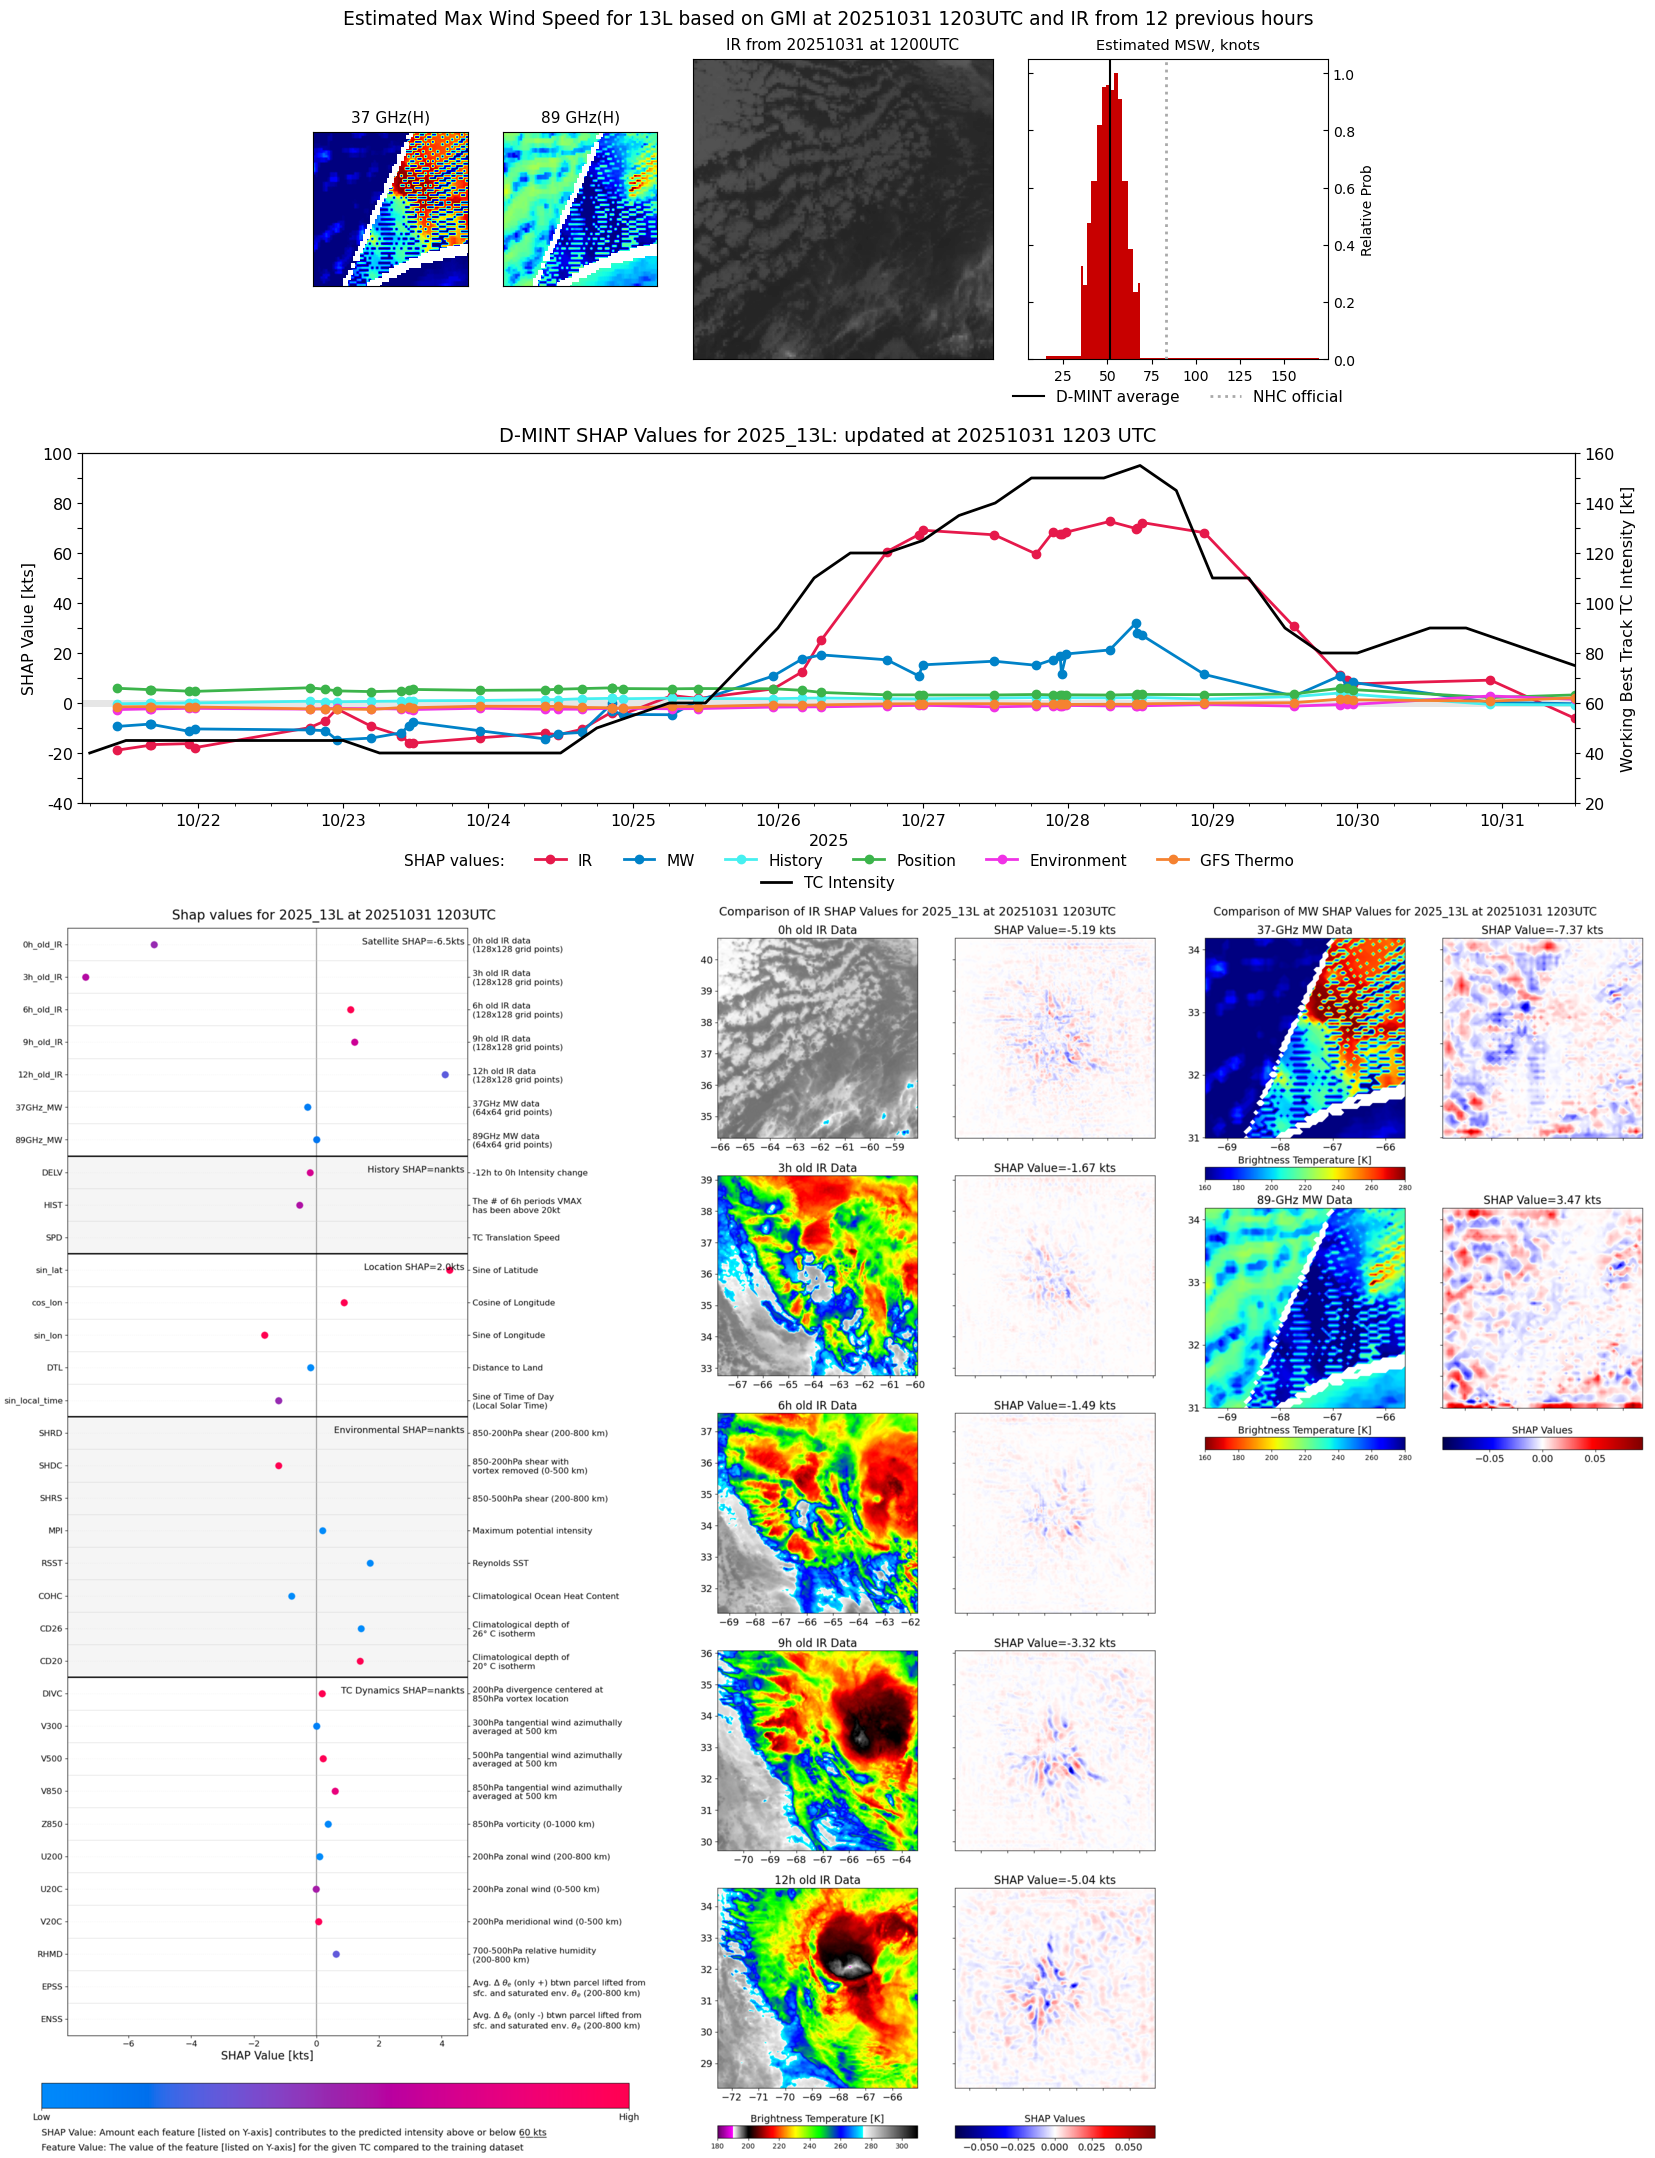 |
| 20251031 | 1024 UTC | WSFM01 | 963 hPa | 70 kts | 63 kts | 77 kts |  |
| 20251031 | 0958 UTC | TMS07 | 967 hPa | 61 kts | 55 kts | 66 kts |  |
| 20251031 | 0627 UTC | ATMS-N21 | 973 hPa | 64 kts | 58 kts | 69 kts | 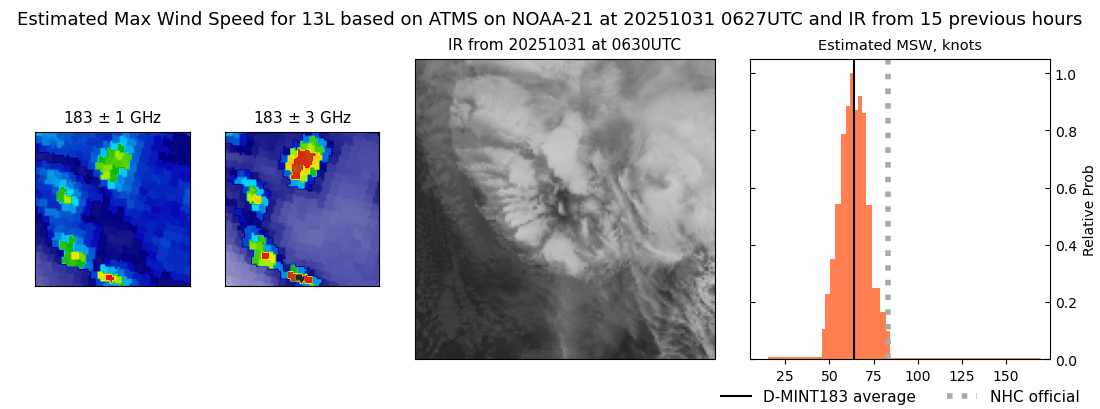 |
| 20251031 | 0547 UTC | AMSR2 | 967 hPa | 77 kts | 70 kts | 84 kts | 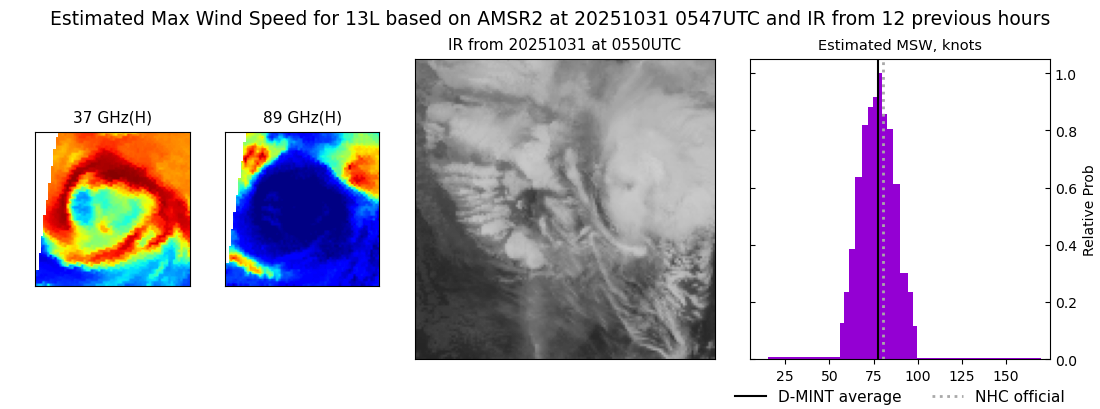 |
| 20251031 | 0234 UTC | TMS05 | 970 hPa | 66 kts | 61 kts | 72 kts | 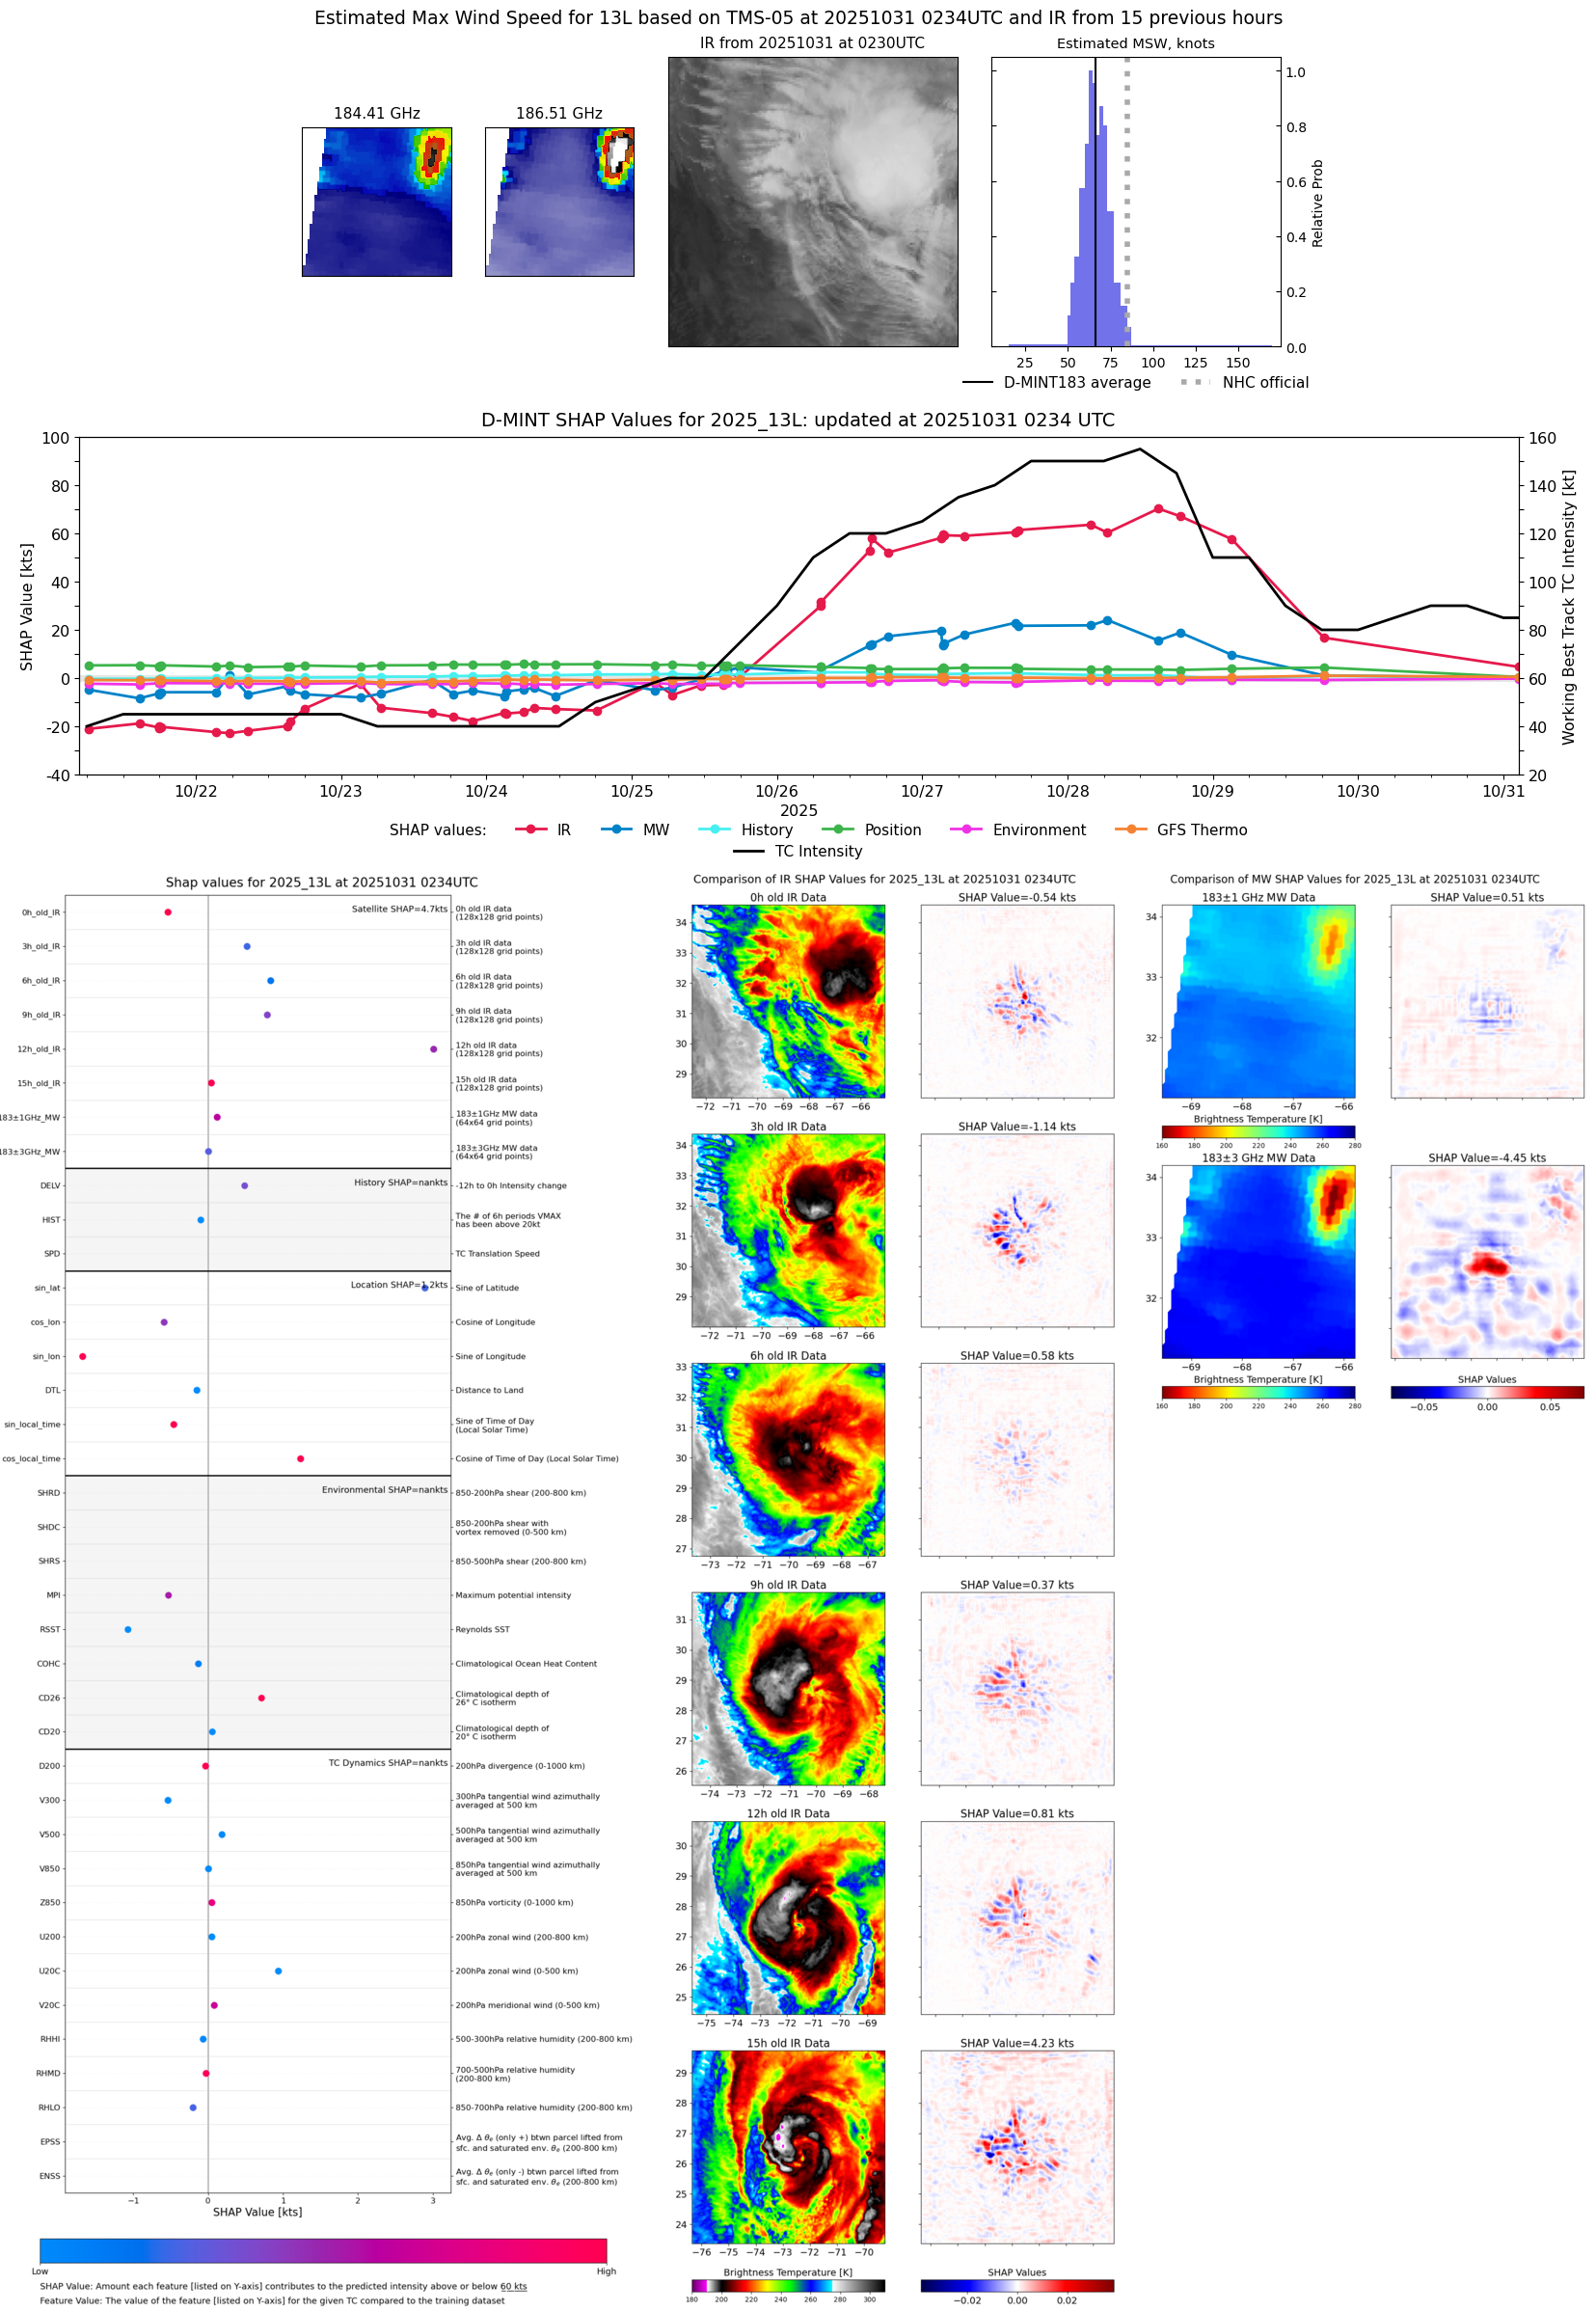 |
| 20251030 | 2310 UTC | SSMISF16 | 960 hPa | 89 kts | 82 kts | 96 kts | 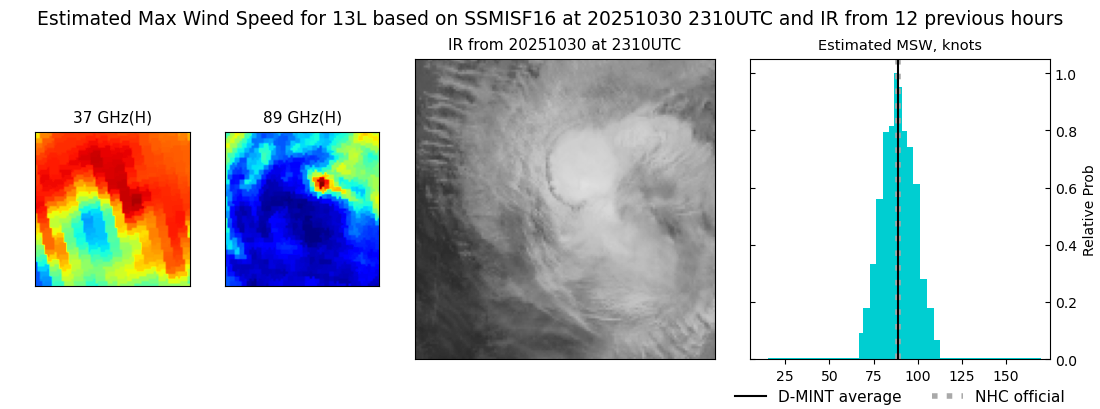 |
| 20251030 | 2206 UTC | SSMISF17 | 963 hPa | 85 kts | 78 kts | 92 kts |  |
| 20251030 | 2203 UTC | WSFM01 | 965 hPa | 81 kts | 74 kts | 88 kts |  |
| 20251030 | 2203 UTC | WSFM01 | 965 hPa | 81 kts | 74 kts | 88 kts |  |
| 20251030 | 2055 UTC | SSMISF18 | 970 hPa | 87 kts | 80 kts | 95 kts |  |
| 20251030 | 1803 UTC | ATMS-N21 | 969 hPa | 75 kts | 69 kts | 81 kts | 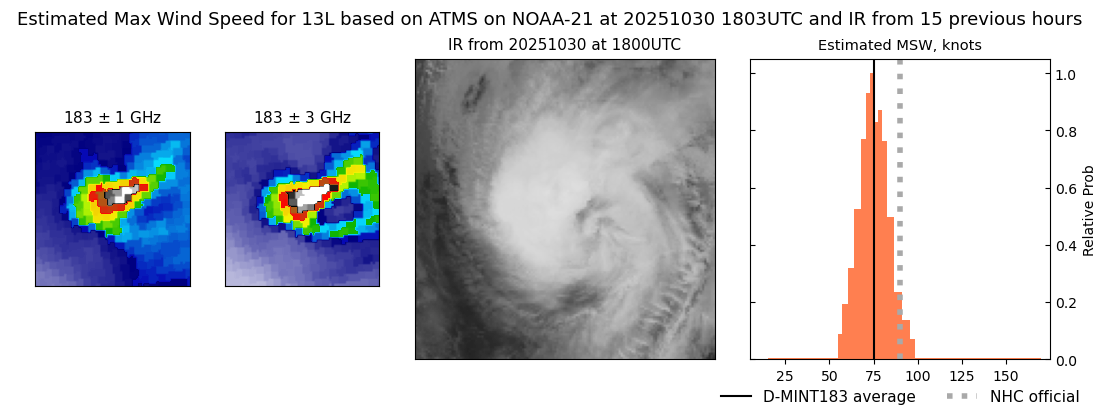 |
| 20251030 | 1742 UTC | AMSR2 | 969 hPa | 83 kts | 76 kts | 90 kts | 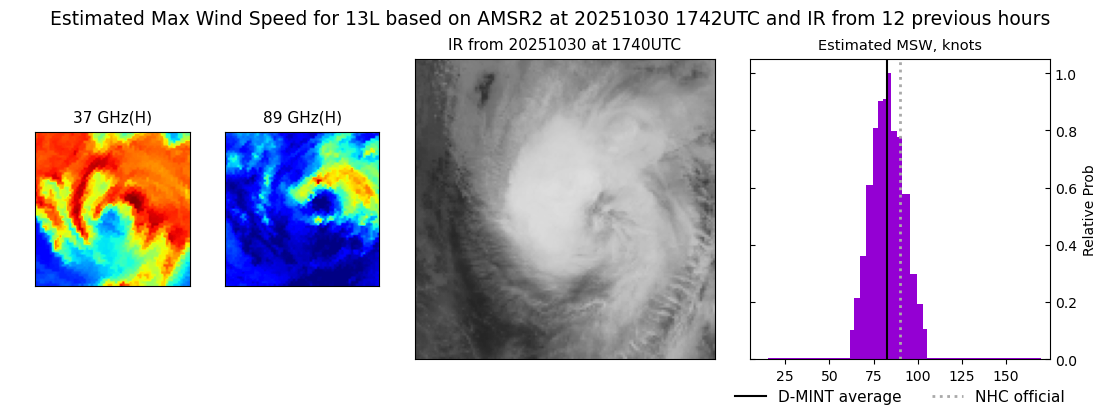 |
| 20251030 | 1421 UTC | TMS06 | 972 hPa | 78 kts | 72 kts | 85 kts |  |
| 20251030 | 1243 UTC | GMI | 973 hPa | 81 kts | 75 kts | 87 kts | 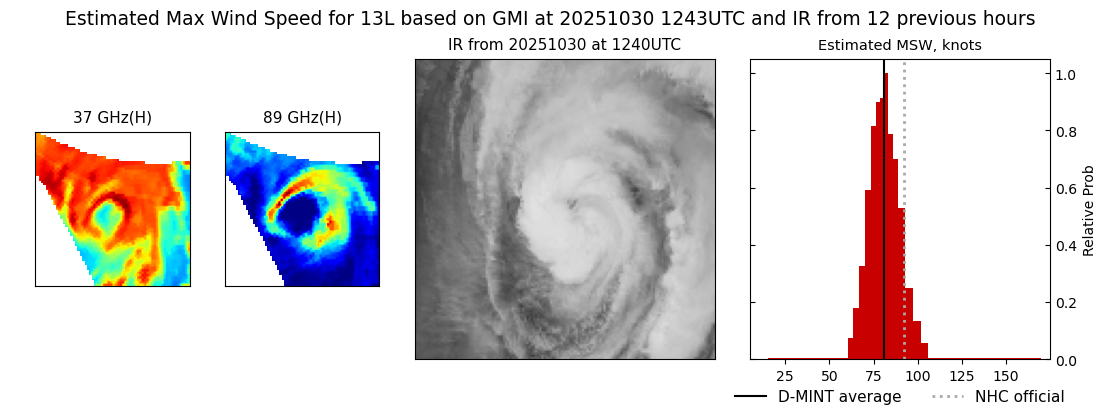 |
| 20251030 | 0936 UTC | TMS07 | 976 hPa | 76 kts | 70 kts | 82 kts |  |
| 20251030 | 0648 UTC | ATMS-N21 | 973 hPa | 77 kts | 72 kts | 83 kts | 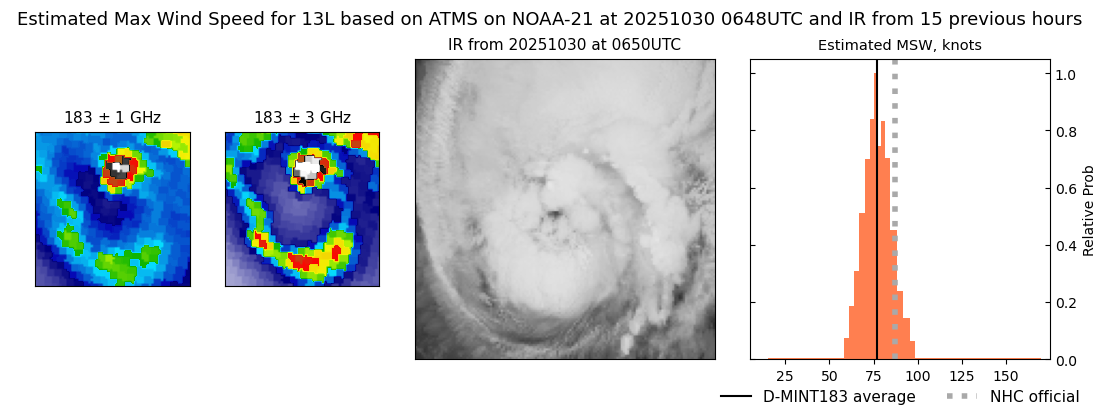 |
| 20251030 | 0644 UTC | AMSR2 | 971 hPa | 75 kts | 69 kts | 81 kts |  |
| 20251030 | 0548 UTC | TROPICS05 | 977 hPa | 75 kts | 69 kts | 81 kts | 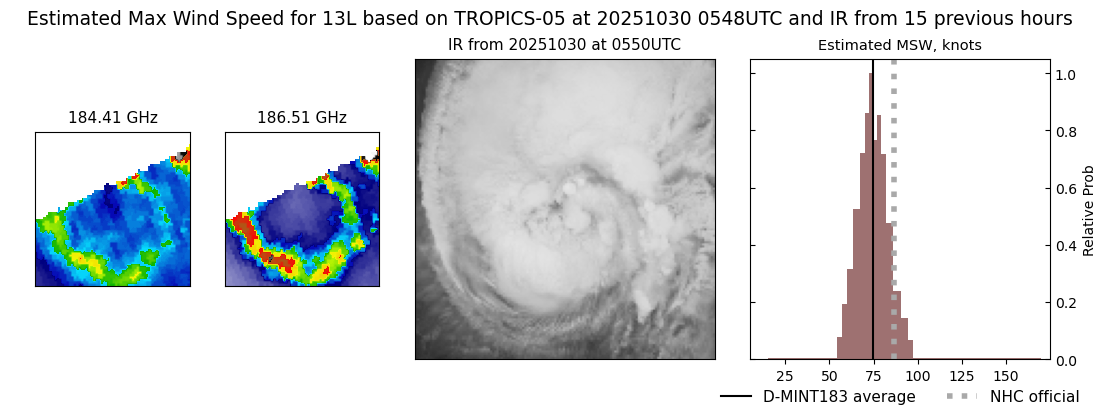 |
| 20251030 | 0317 UTC | TMS05 | 972 hPa | 75 kts | 70 kts | 81 kts | 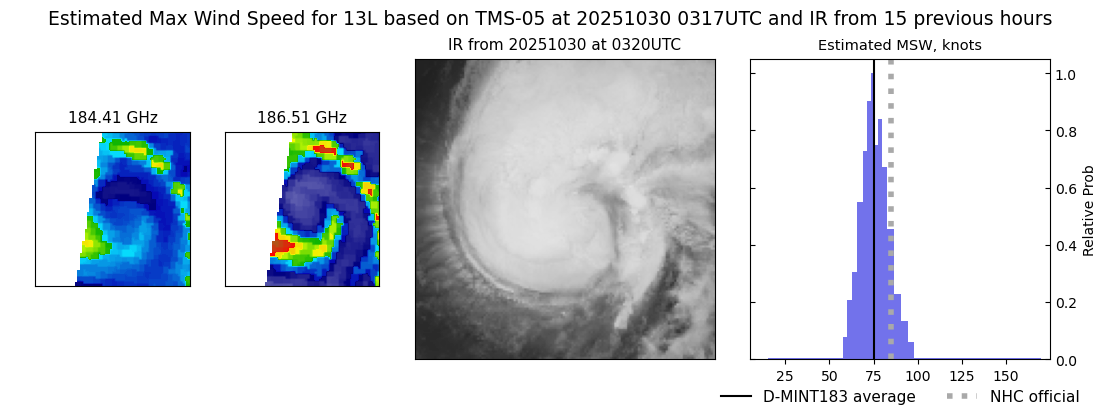 |
| 20251030 | 0253 UTC | GMI | 971 hPa | 82 kts | 75 kts | 89 kts |  |
| 20251029 | 2321 UTC | SSMISF16 | 962 hPa | 85 kts | 79 kts | 92 kts | 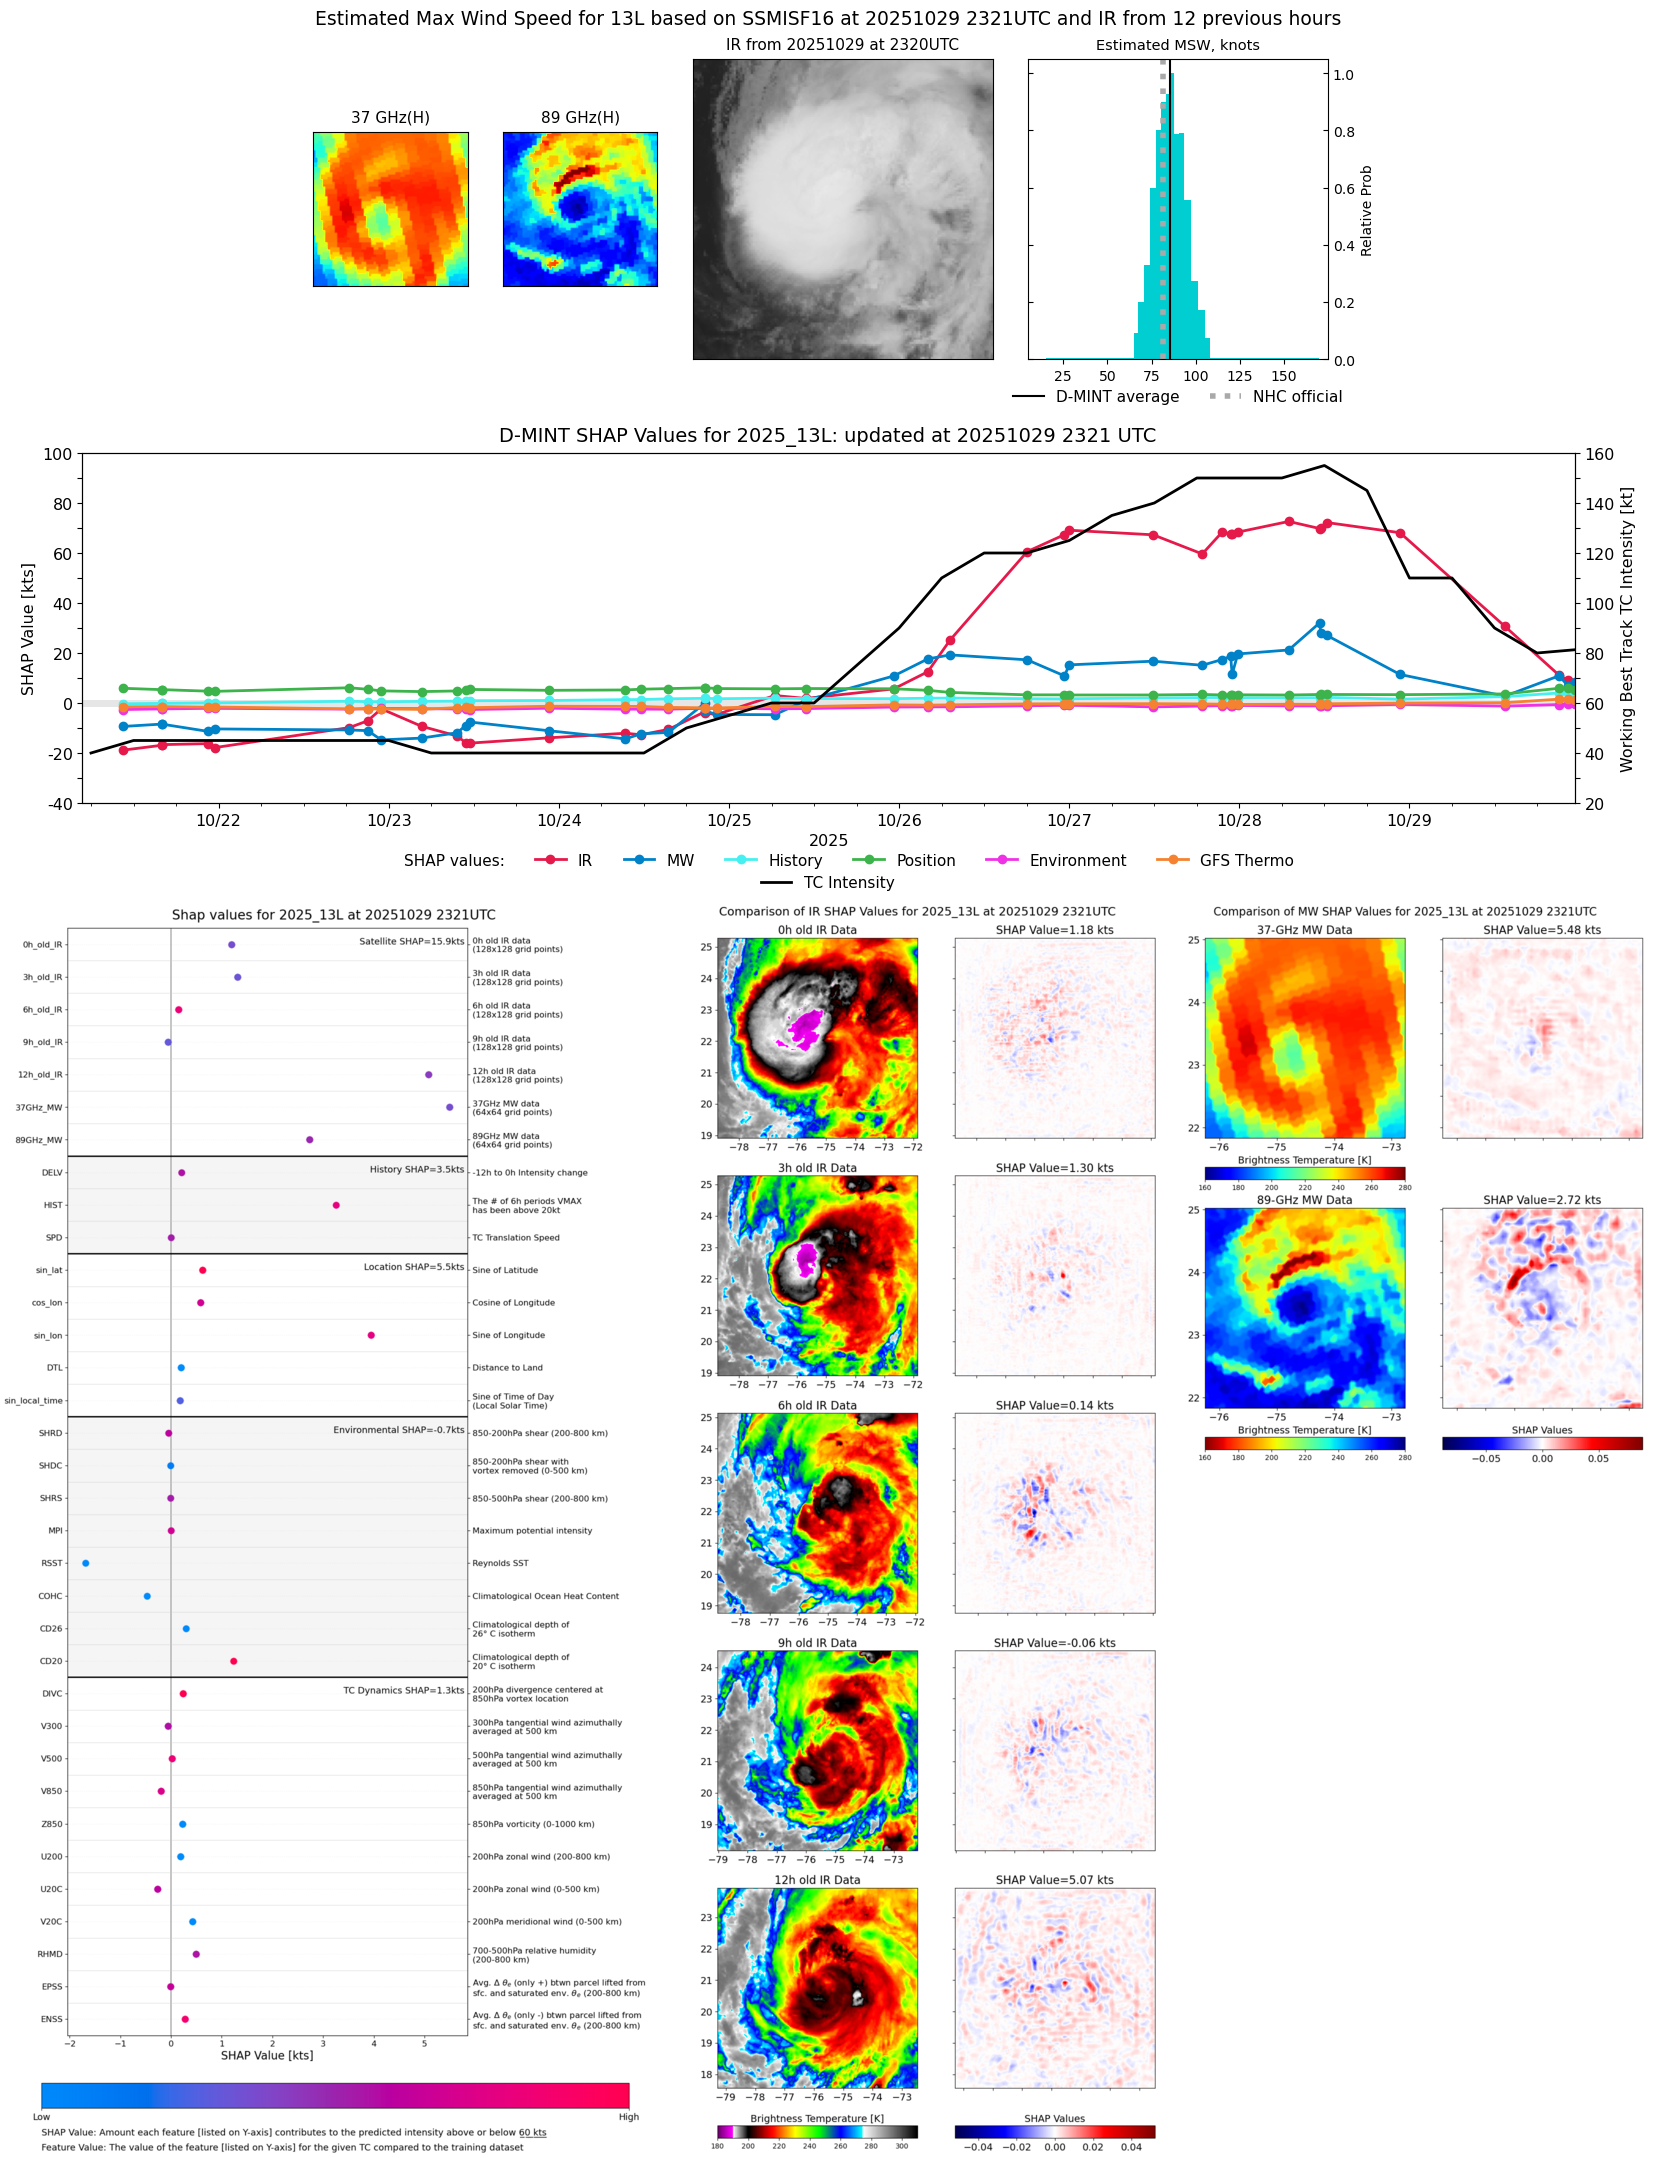 |
| 20251029 | 2221 UTC | WSFM01 | 966 hPa | 88 kts | 81 kts | 94 kts | 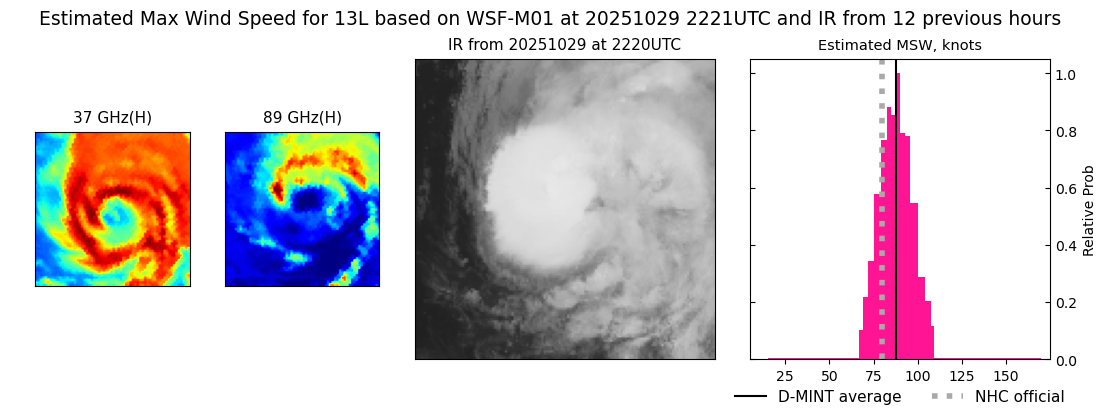 |
| 20251029 | 2219 UTC | SSMISF17 | 963 hPa | 87 kts | 80 kts | 94 kts | 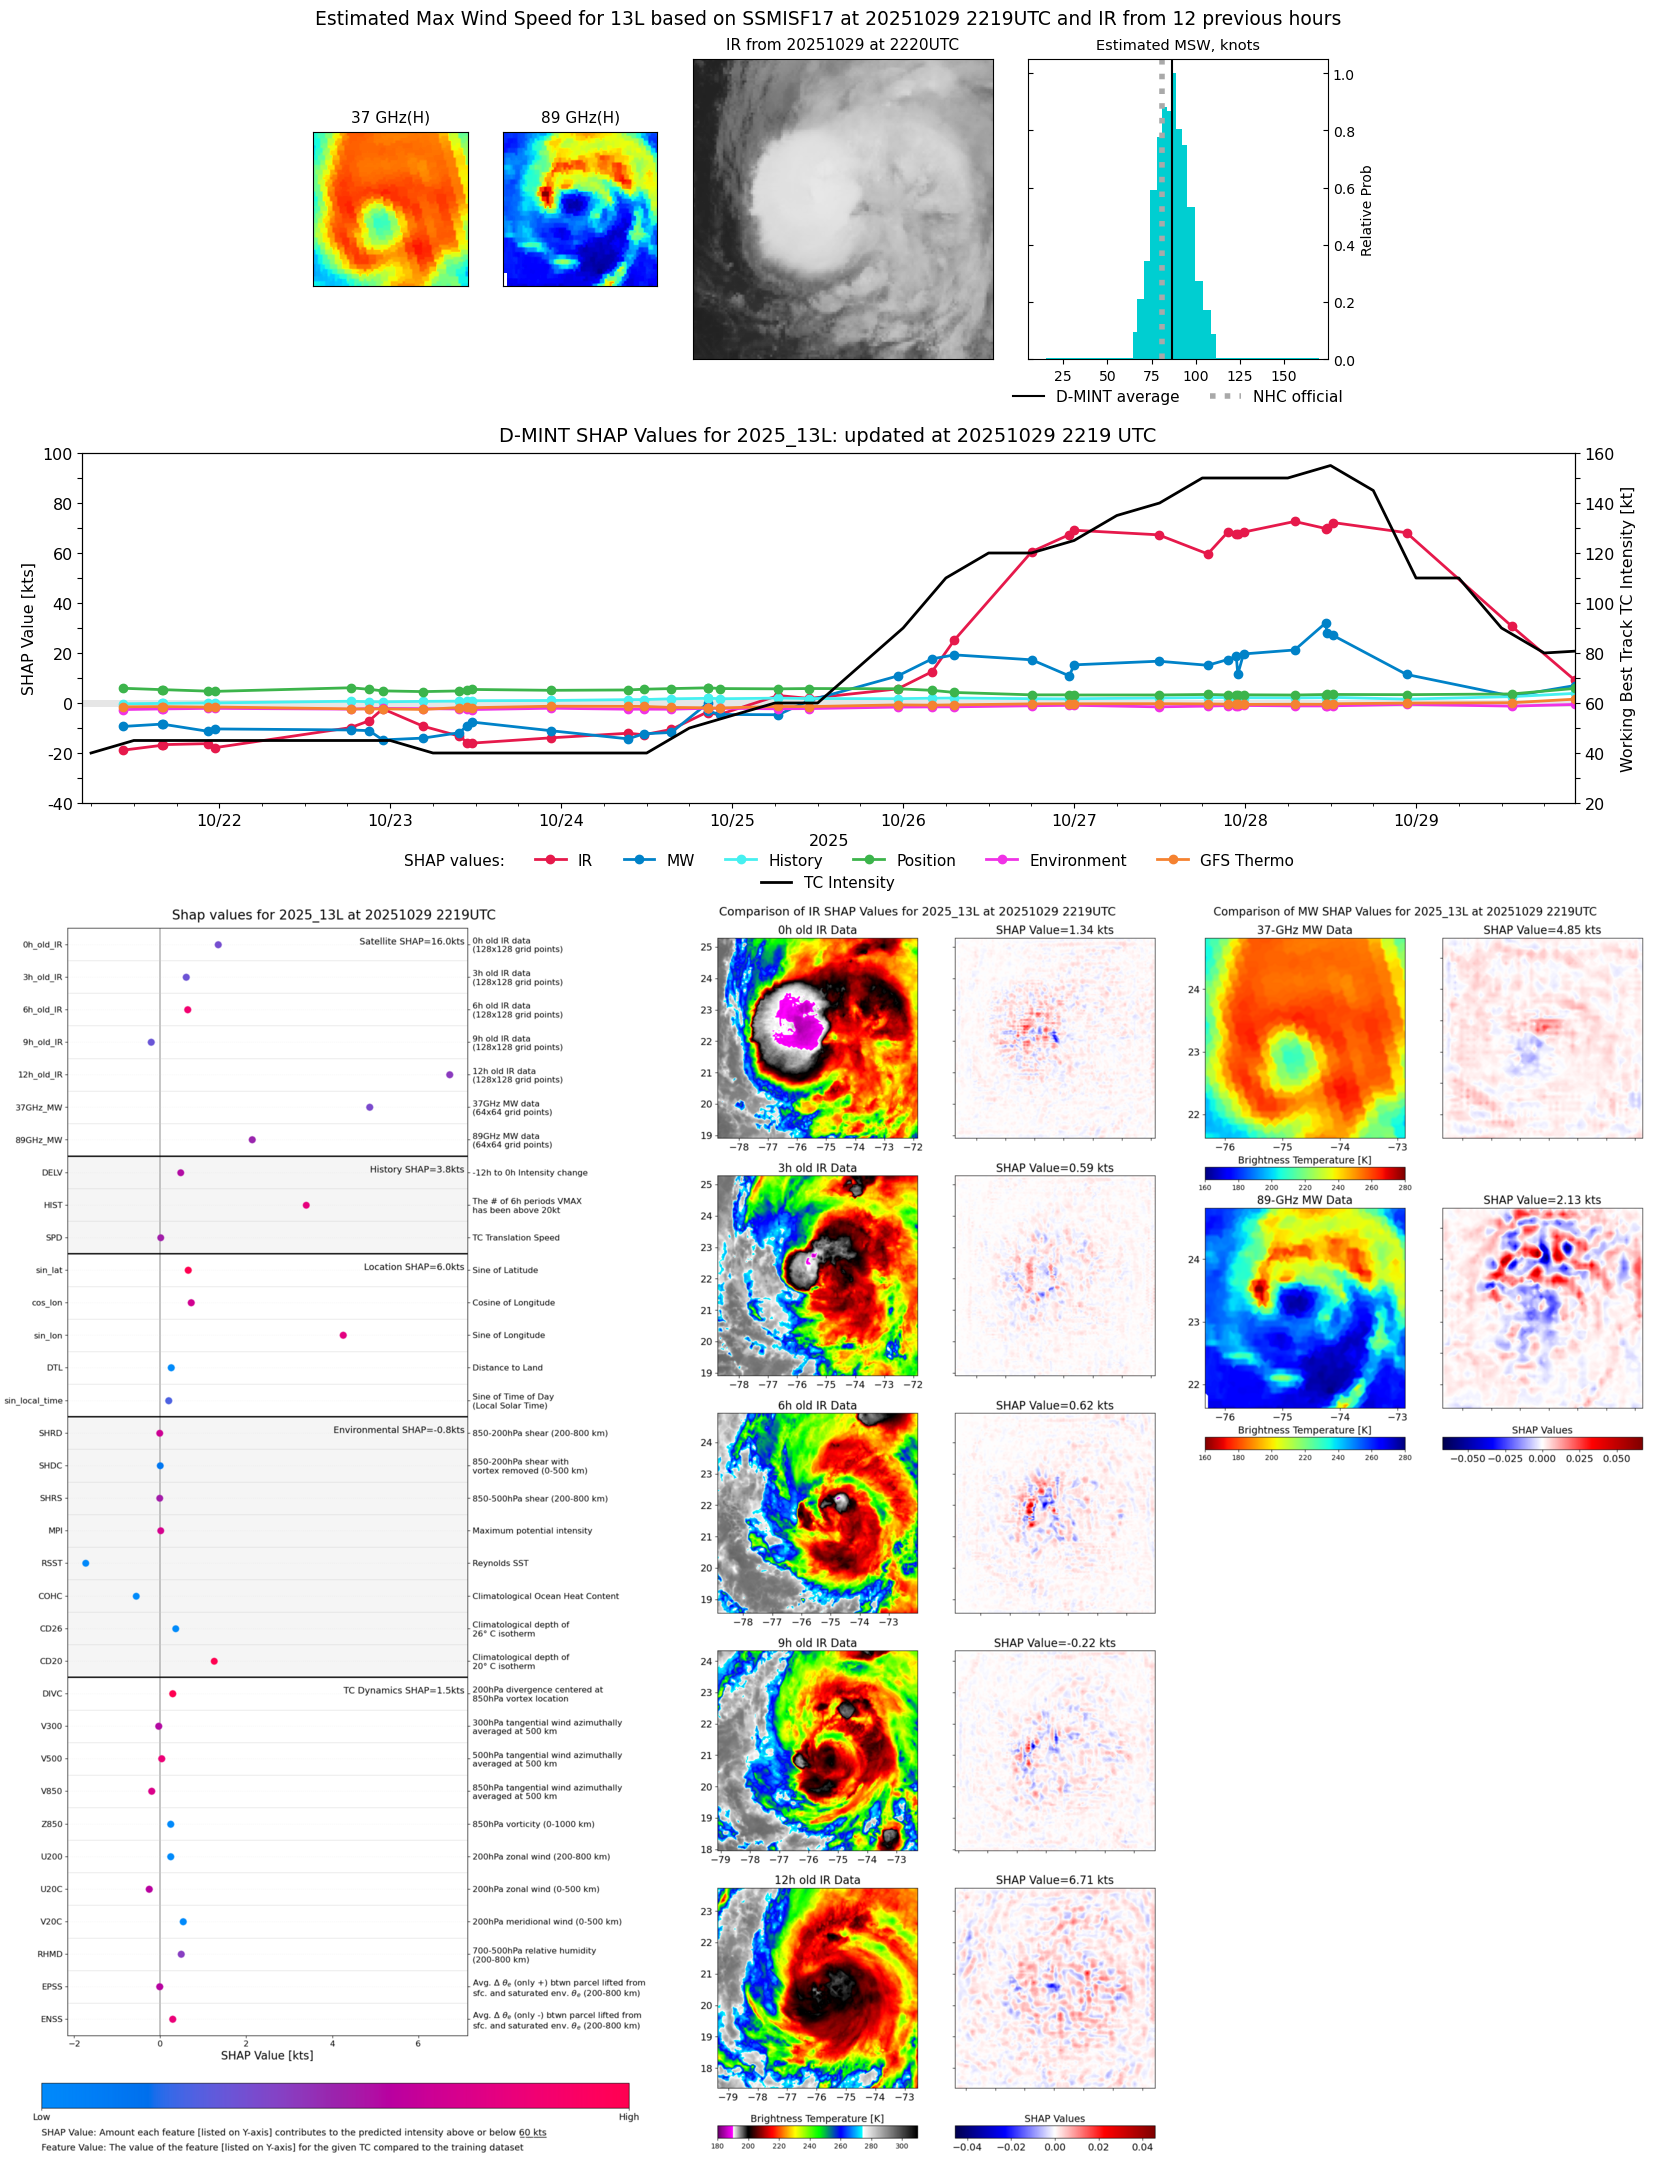 |
| 20251029 | 2107 UTC | SSMISF18 | 961 hPa | 93 kts | 85 kts | 100 kts | 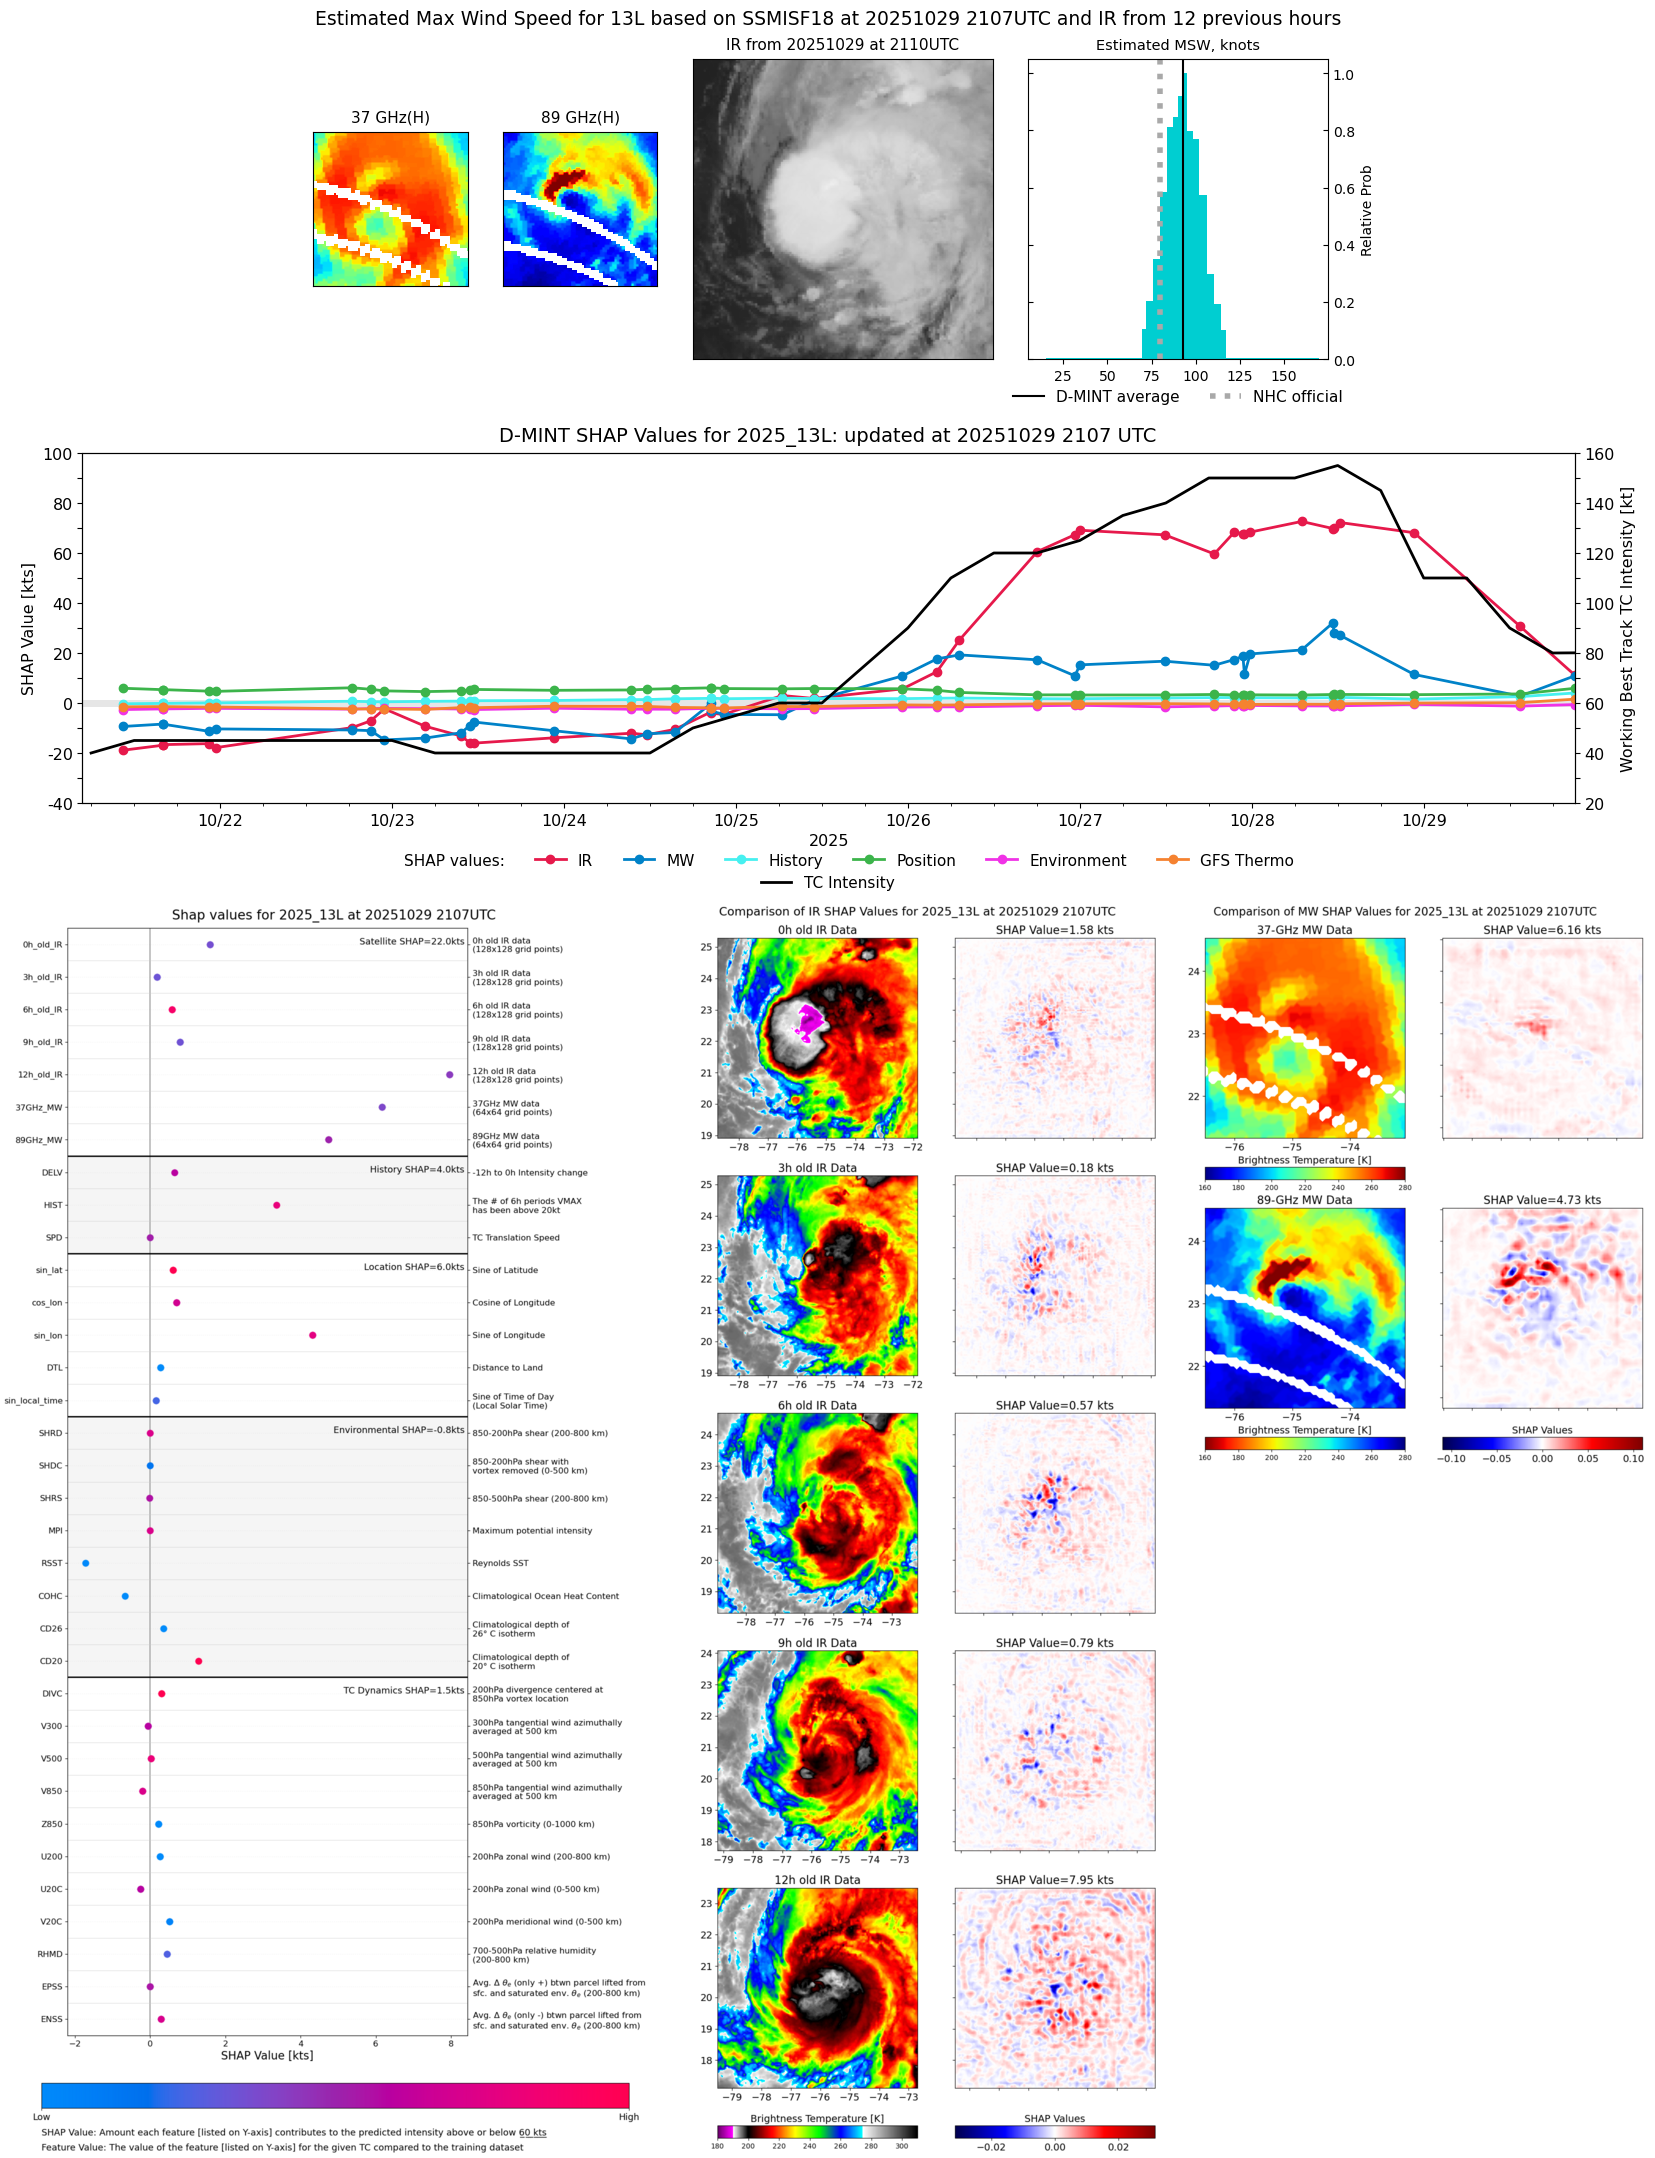 |
| 20251029 | 1835 UTC | AMSR2 | 969 hPa | 90 kts | 83 kts | 98 kts | 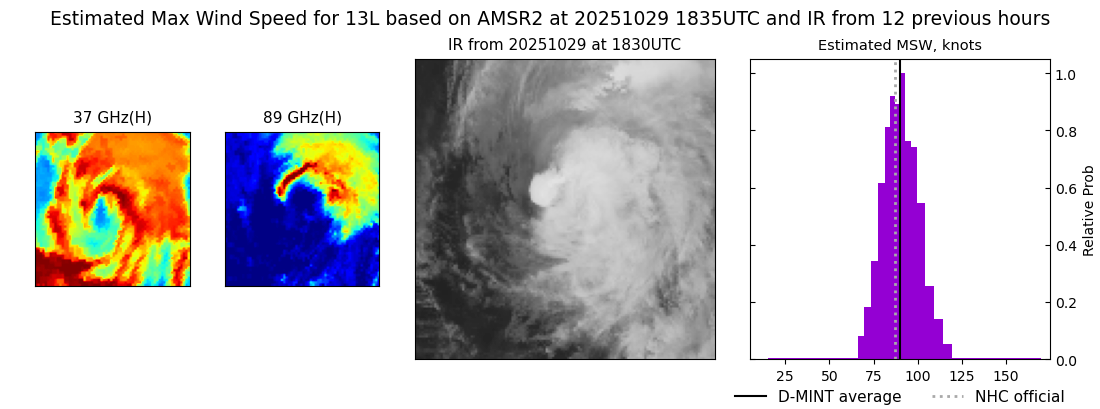 |
| 20251029 | 1820 UTC | ATMS-N21 | 965 hPa | 84 kts | 78 kts | 90 kts |  |
| 20251029 | 1535 UTC | TMS02 | 959 hPa | 92 kts | 86 kts | 98 kts | 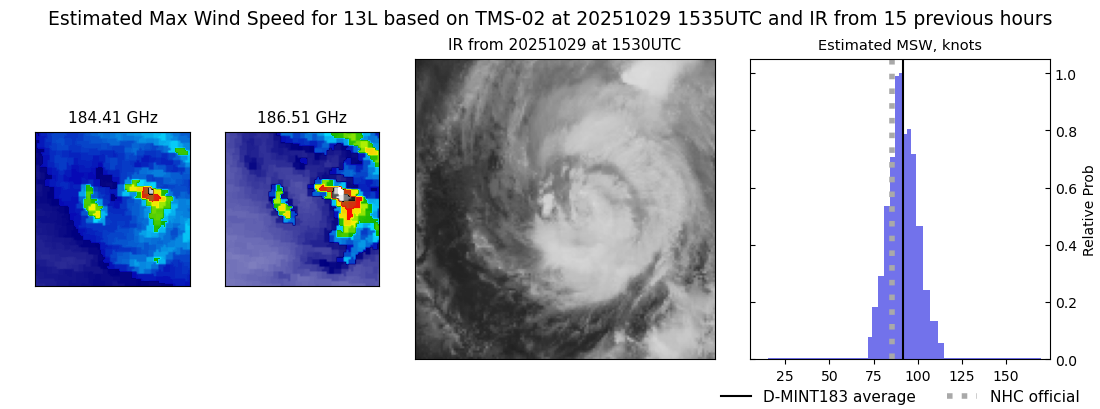 |
| 20251029 | 1328 UTC | GMI | 956 hPa | 98 kts | 91 kts | 106 kts | 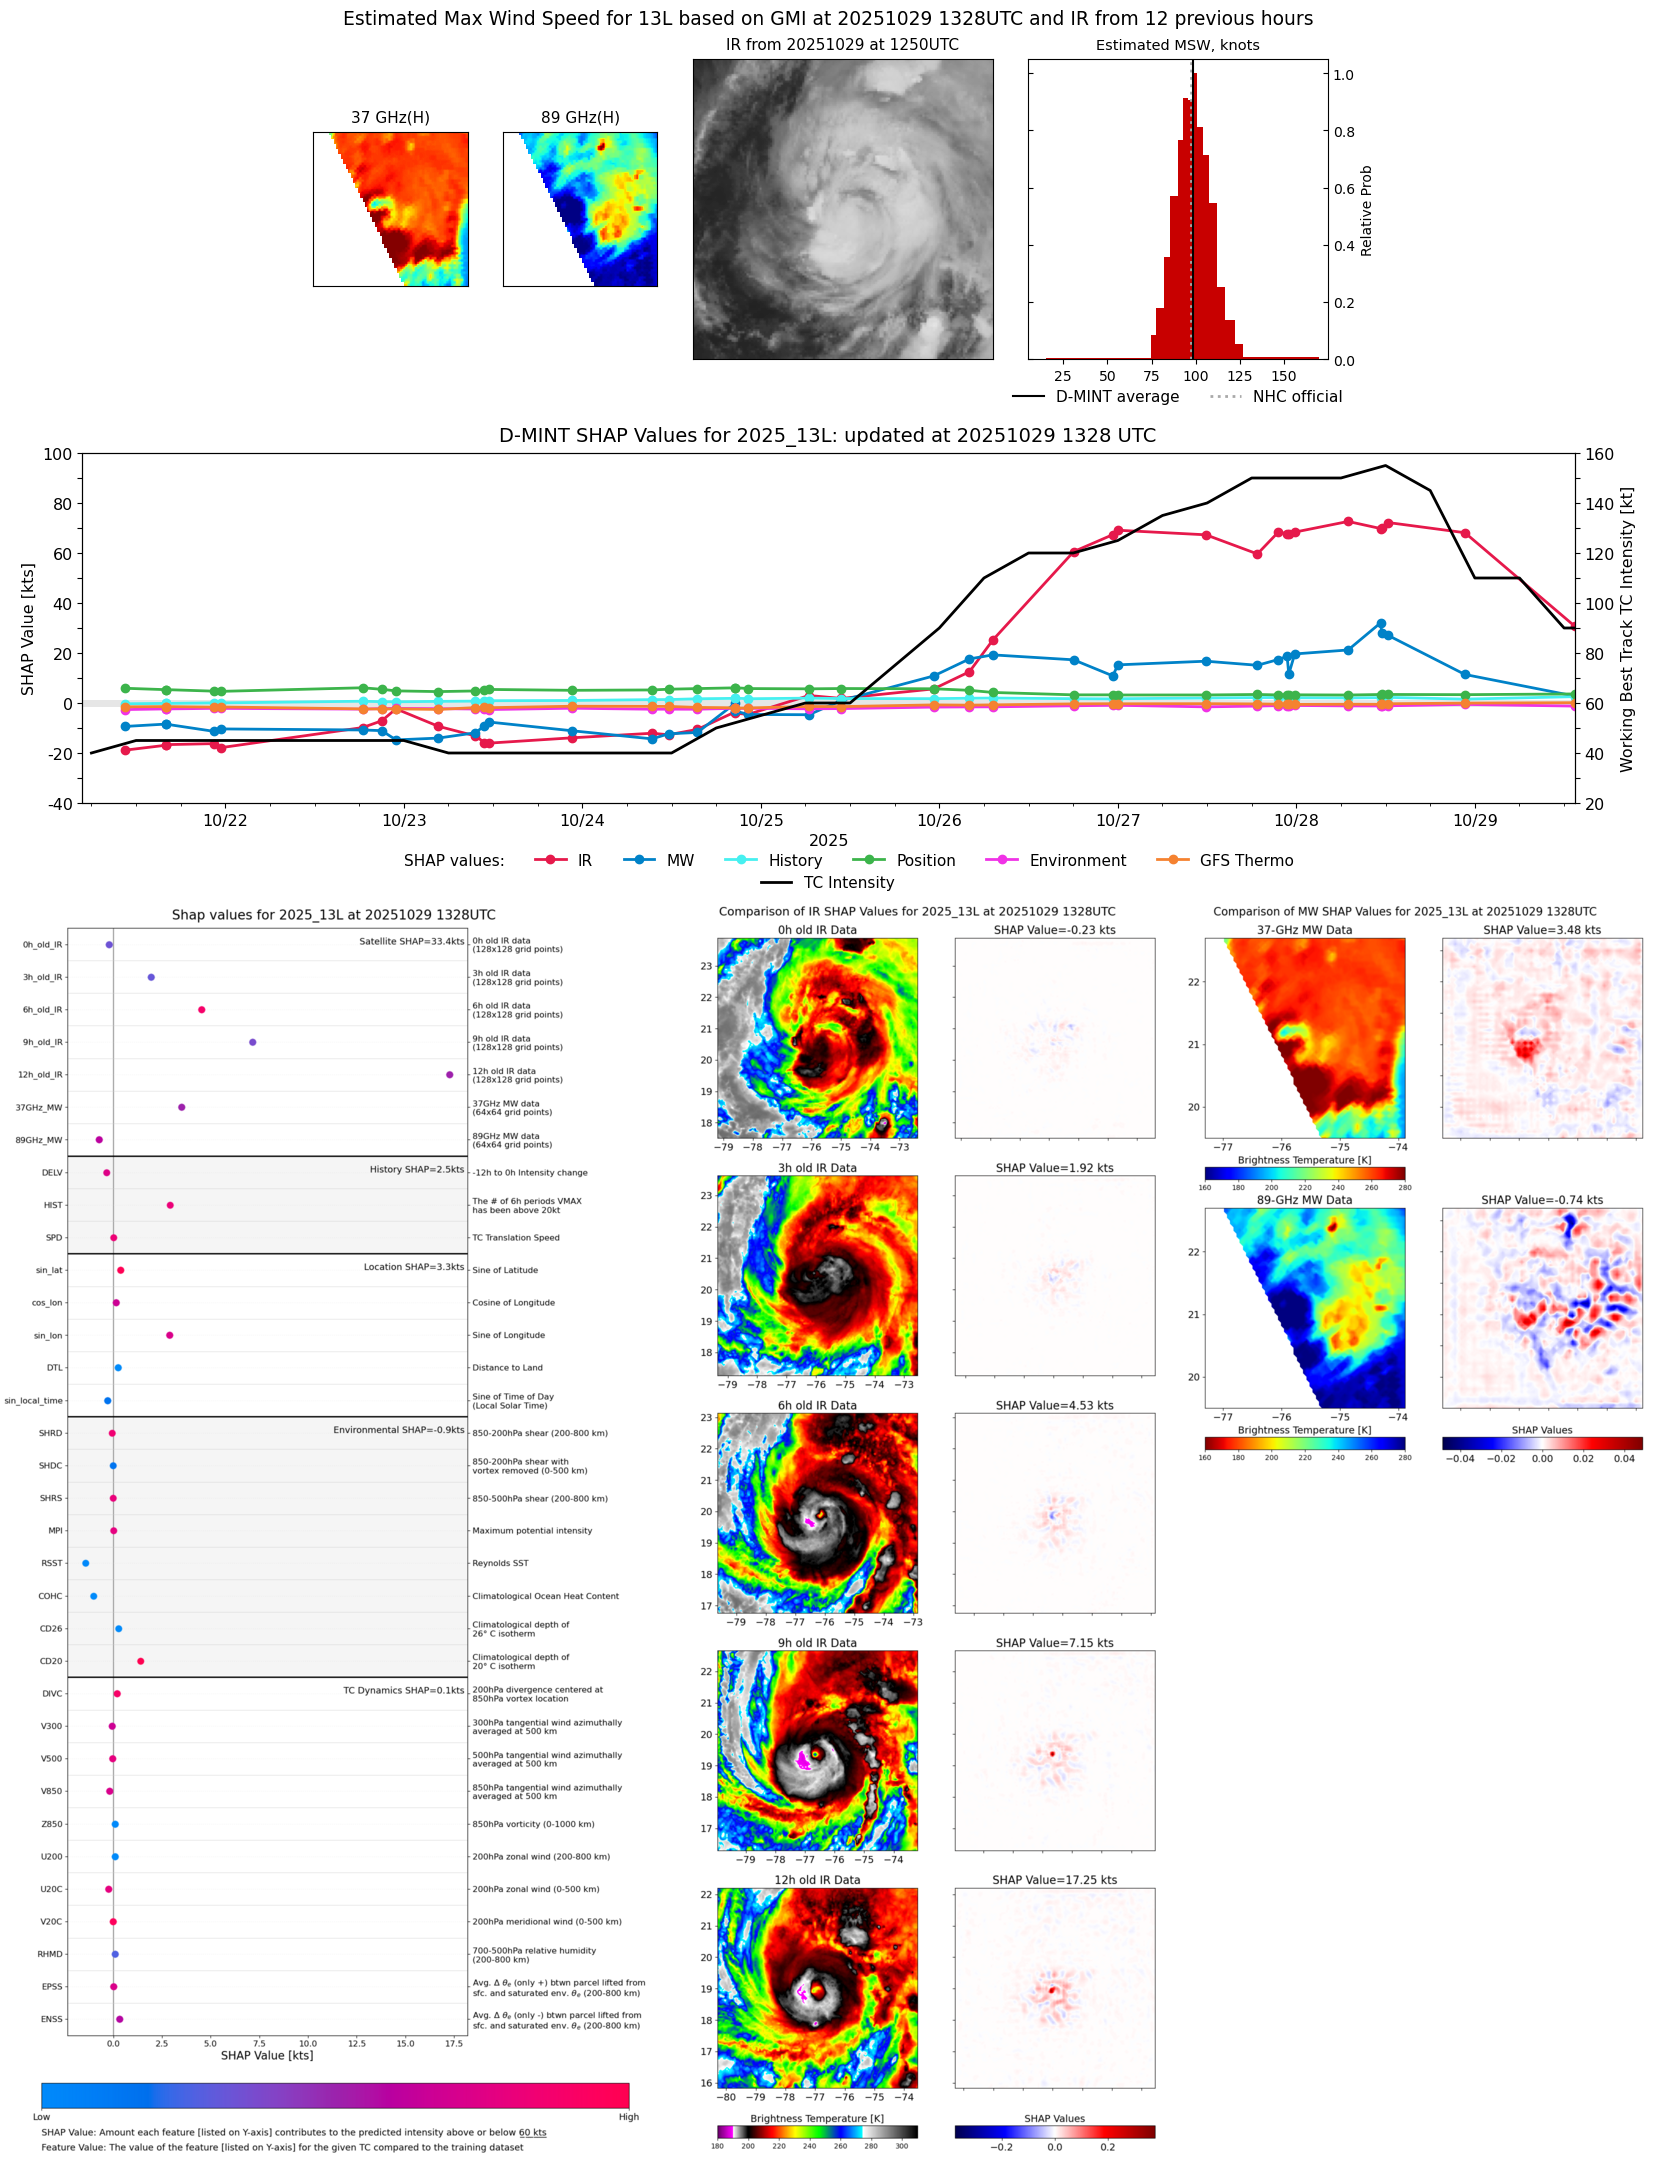 |
| 20251029 | 1109 UTC | WSFM01 | 952 hPa | 107 kts | 100 kts | 115 kts | 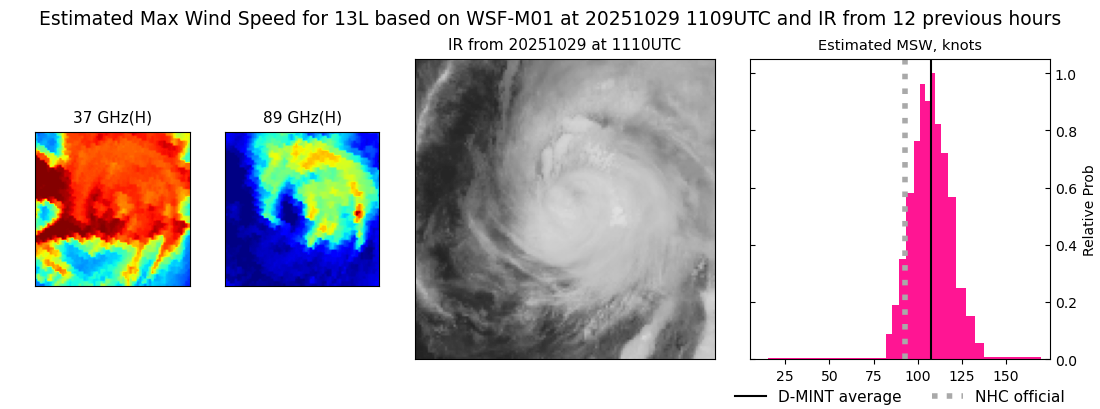 |
| 20251029 | 0935 UTC | TMS07 | 947 hPa | 111 kts | 104 kts | 118 kts | 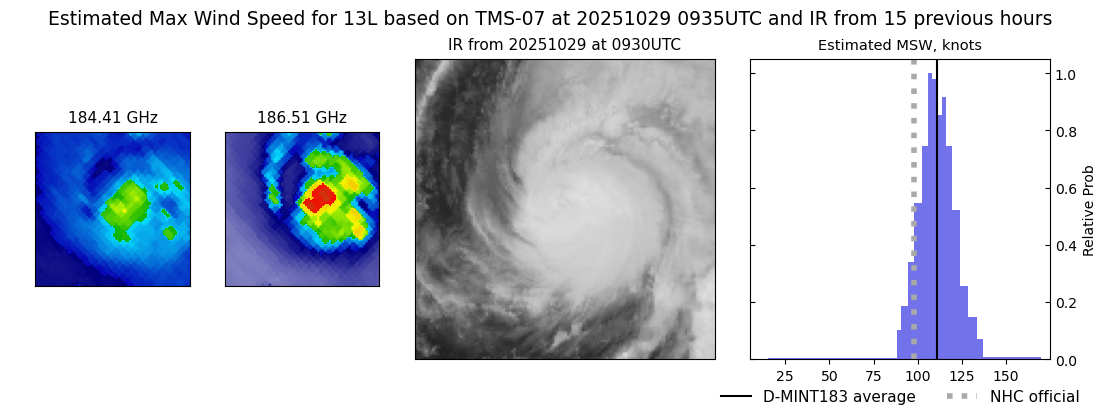 |
| 20251029 | 0309 UTC | TMS05 | 924 hPa | 130 kts | 124 kts | 138 kts | 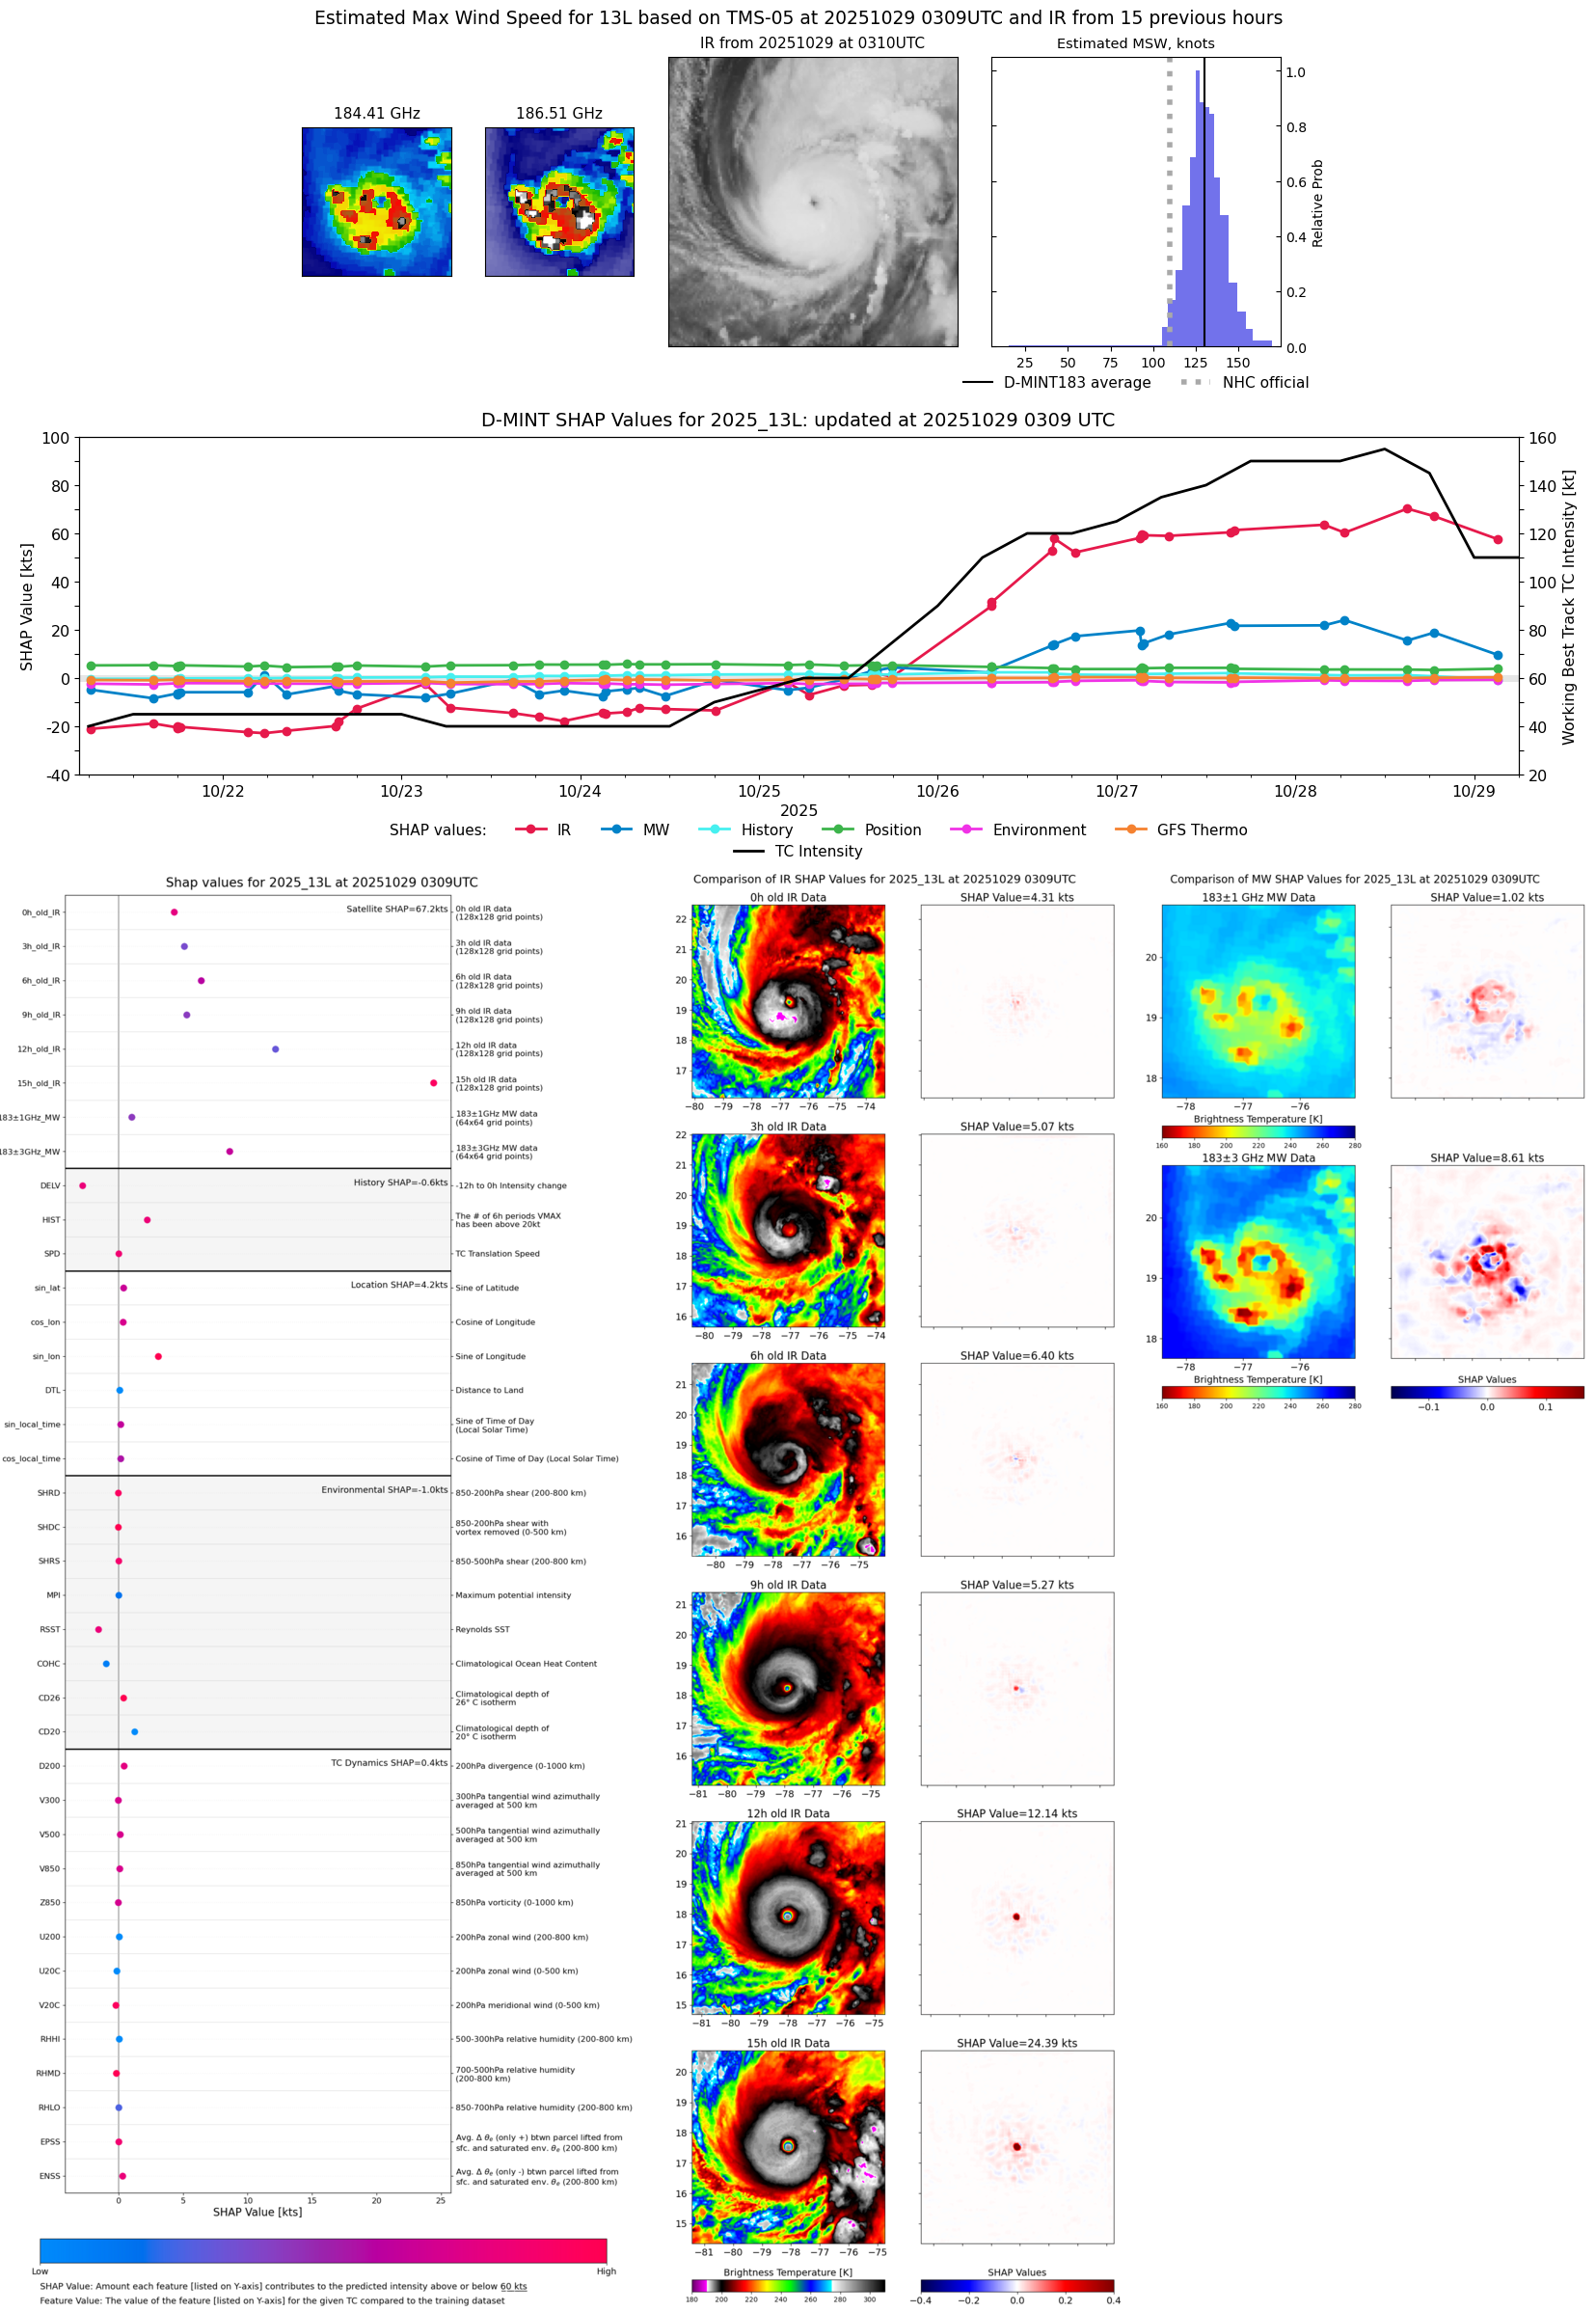 |
| 20251028 | 2240 UTC | WSFM01 | 926 hPa | 144 kts | 136 kts | 151 kts |  |
| 20251028 | 2240 UTC | WSFM01 | 926 hPa | 144 kts | 136 kts | 151 kts |  |
| 20251028 | 1838 UTC | ATMS-N21 | 916 hPa | 150 kts | 143 kts | 157 kts |  |
| 20251028 | 1502 UTC | TMS06 | 914 hPa | 150 kts | 144 kts | 156 kts |  |
| 20251028 | 1408 UTC | GMI | 912 hPa | 157 kts | 149 kts | 164 kts | 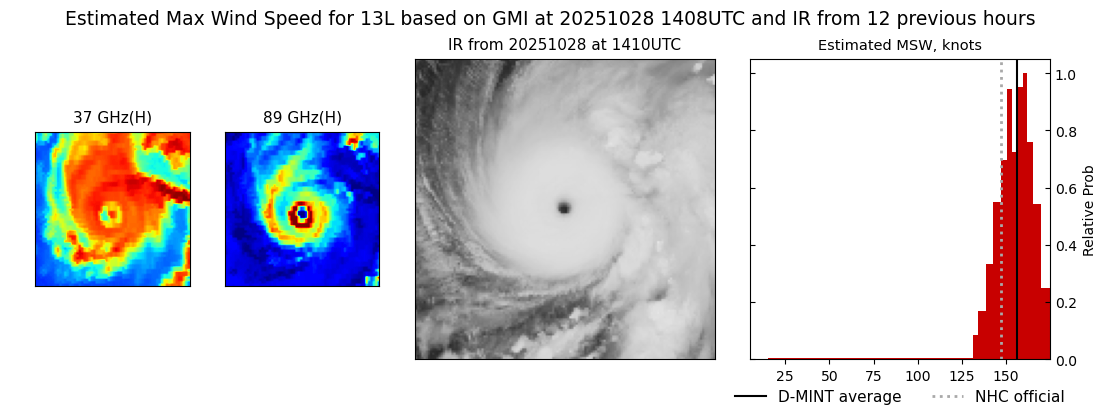 |
| 20251028 | 1221 UTC | SSMISF16 | 911 hPa | 163 kts | 155 kts | 170 kts | 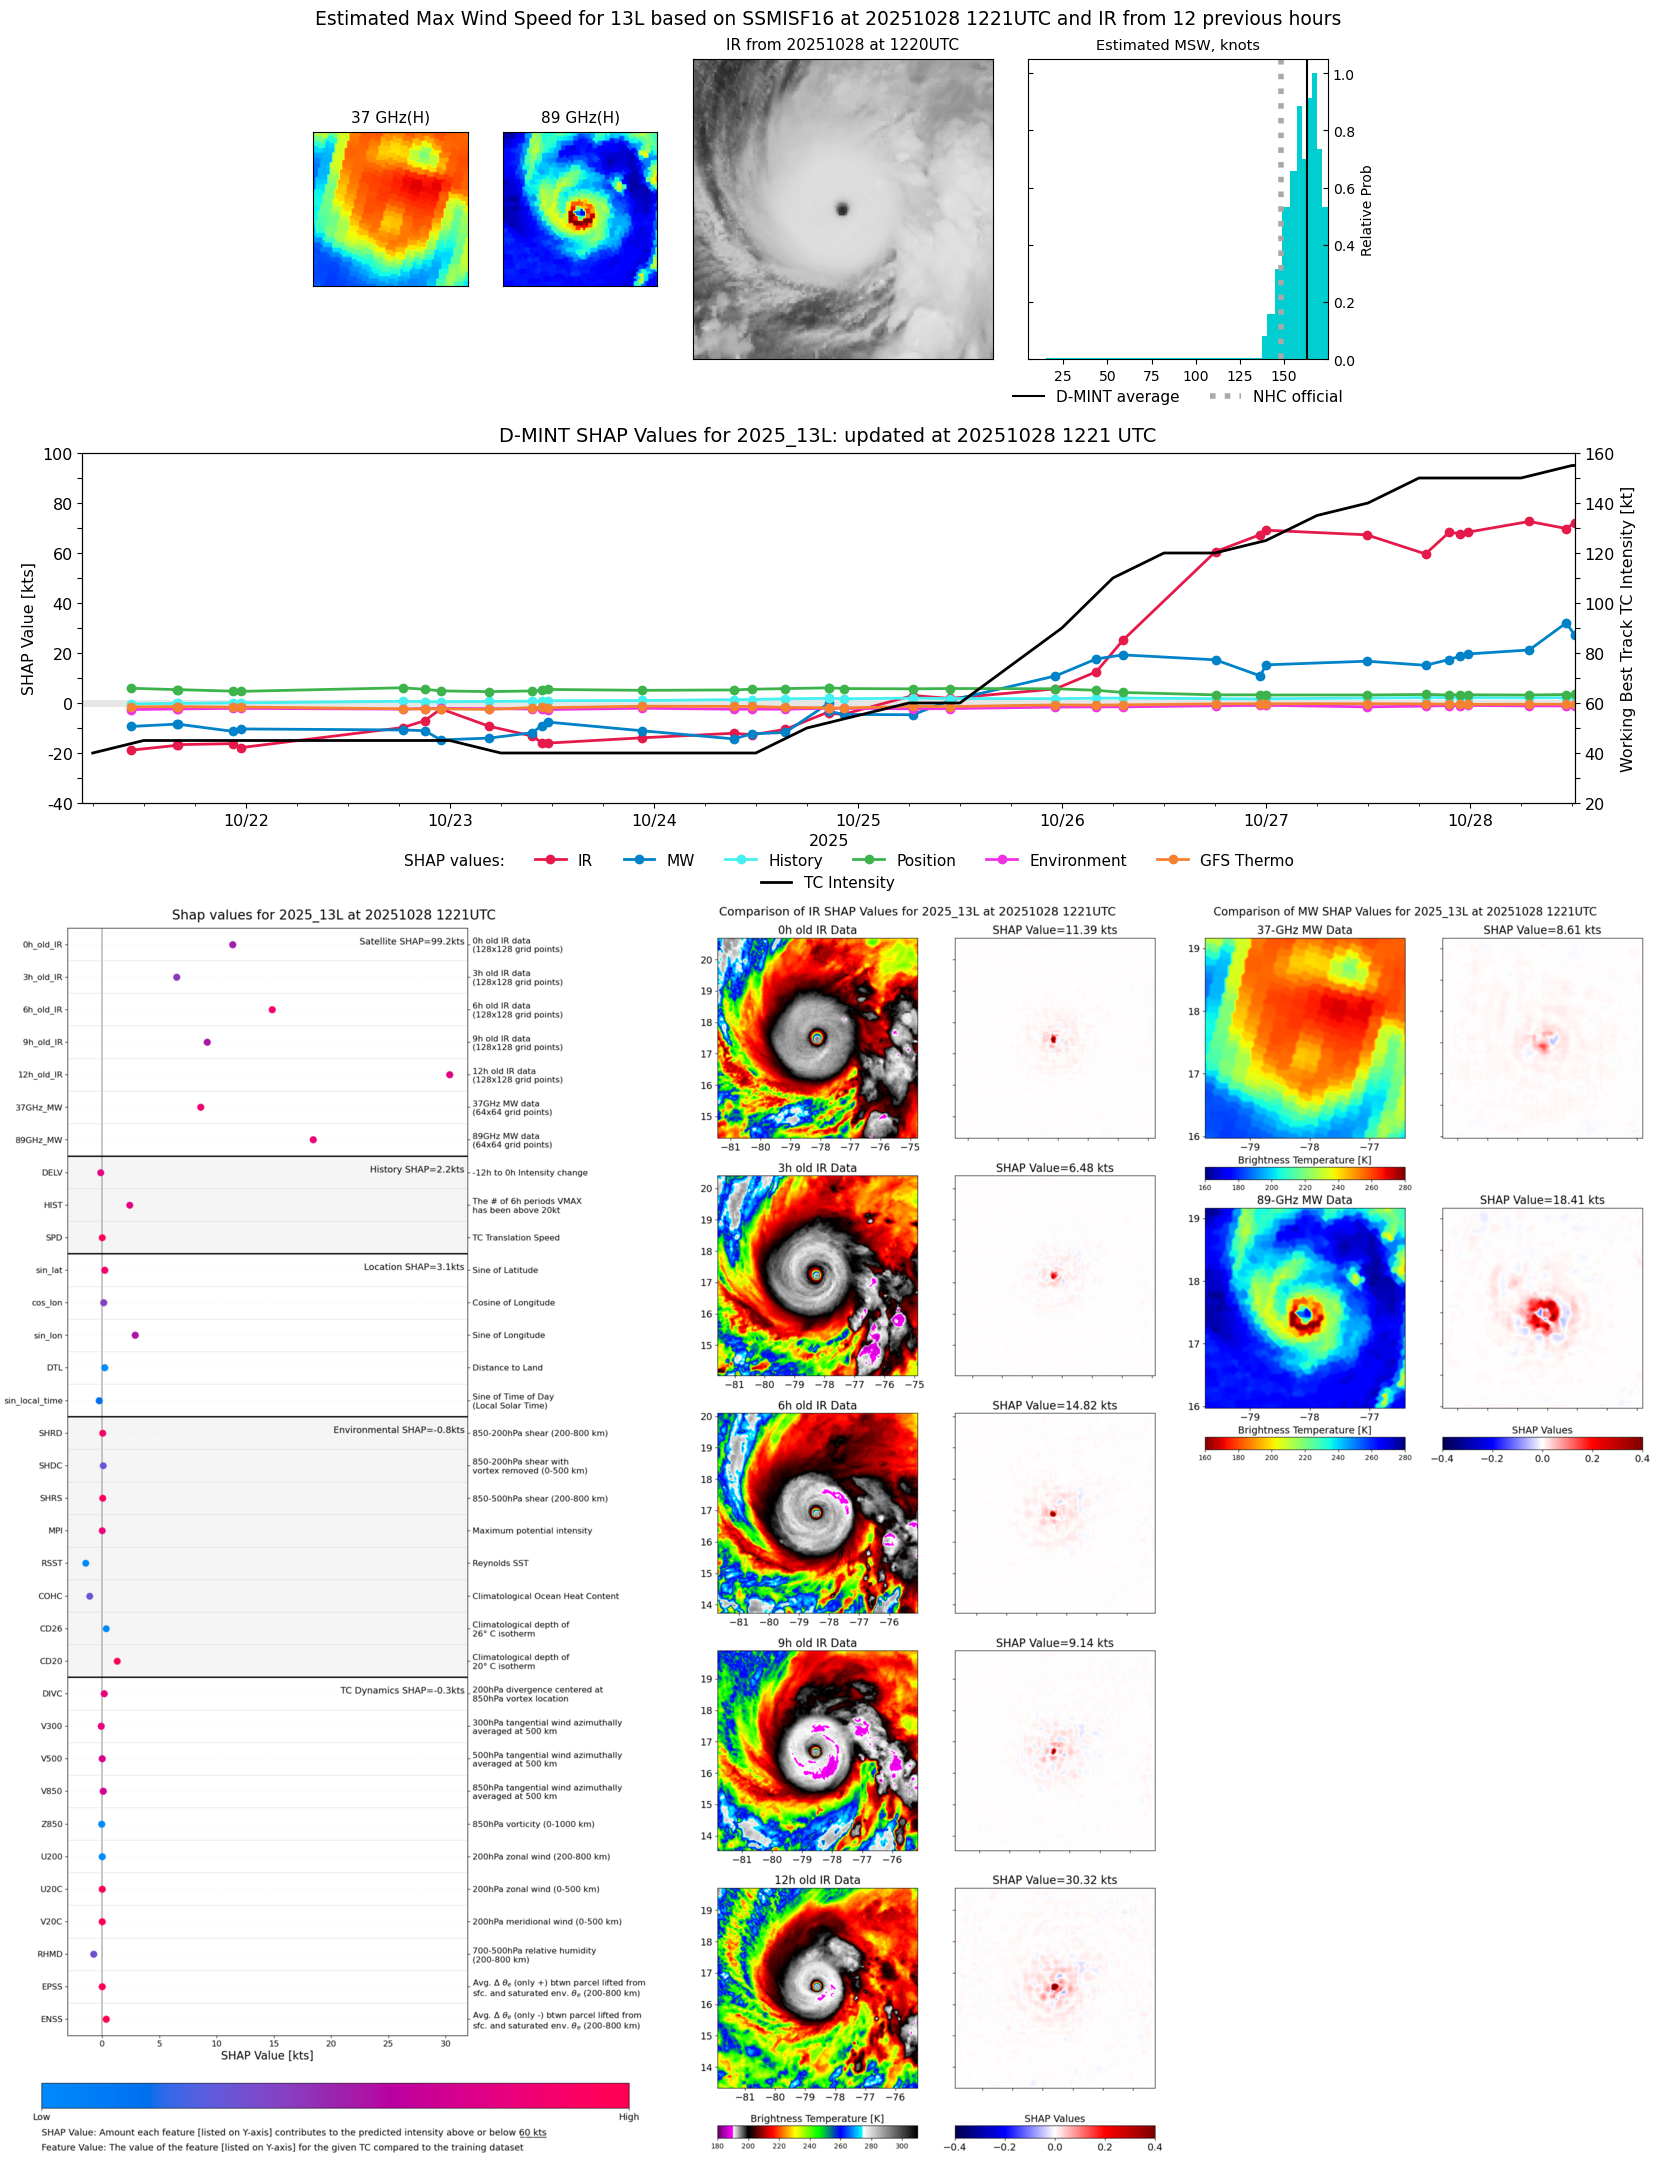 |
| 20251028 | 1130 UTC | WSFM01 | 911 hPa | 162 kts | 154 kts | 169 kts |  |
| 20251028 | 1119 UTC | SSMISF17 | 913 hPa | 165 kts | 157 kts | 173 kts | 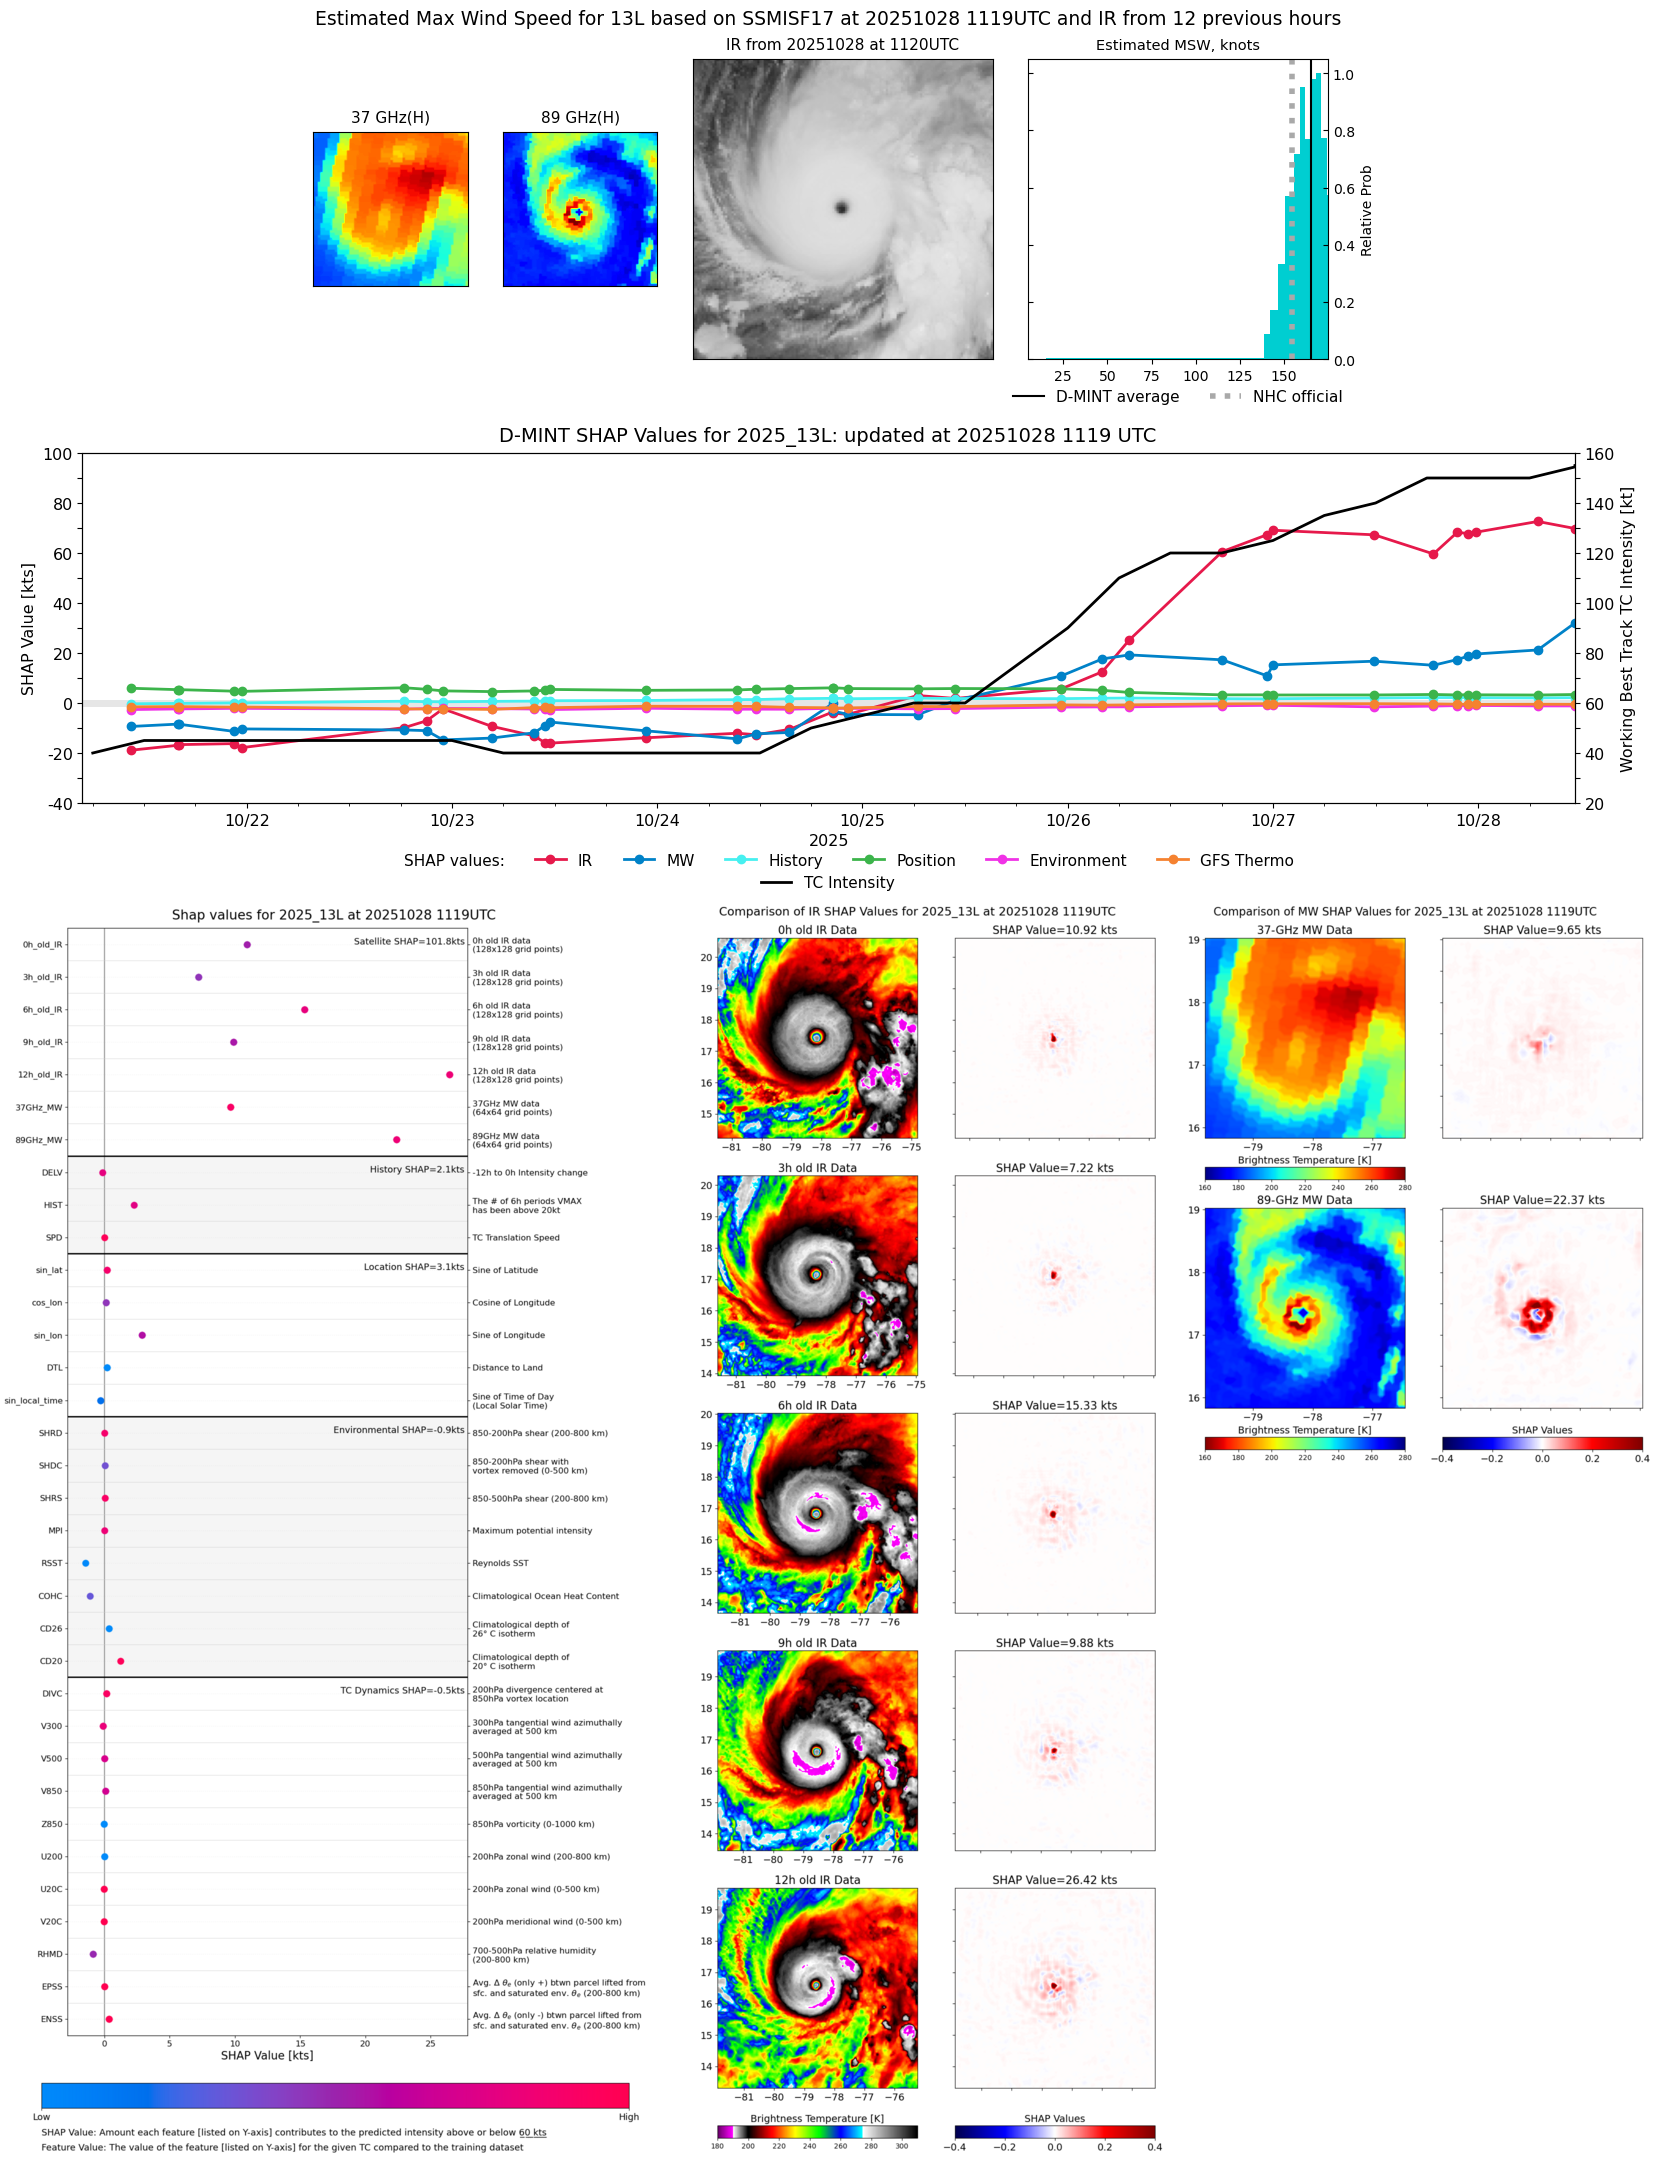 |
| 20251028 | 0658 UTC | AMSR2 | 915 hPa | 157 kts | 149 kts | 164 kts |  |
| 20251028 | 0637 UTC | ATMS-N20 | 915 hPa | 148 kts | 142 kts | 155 kts | 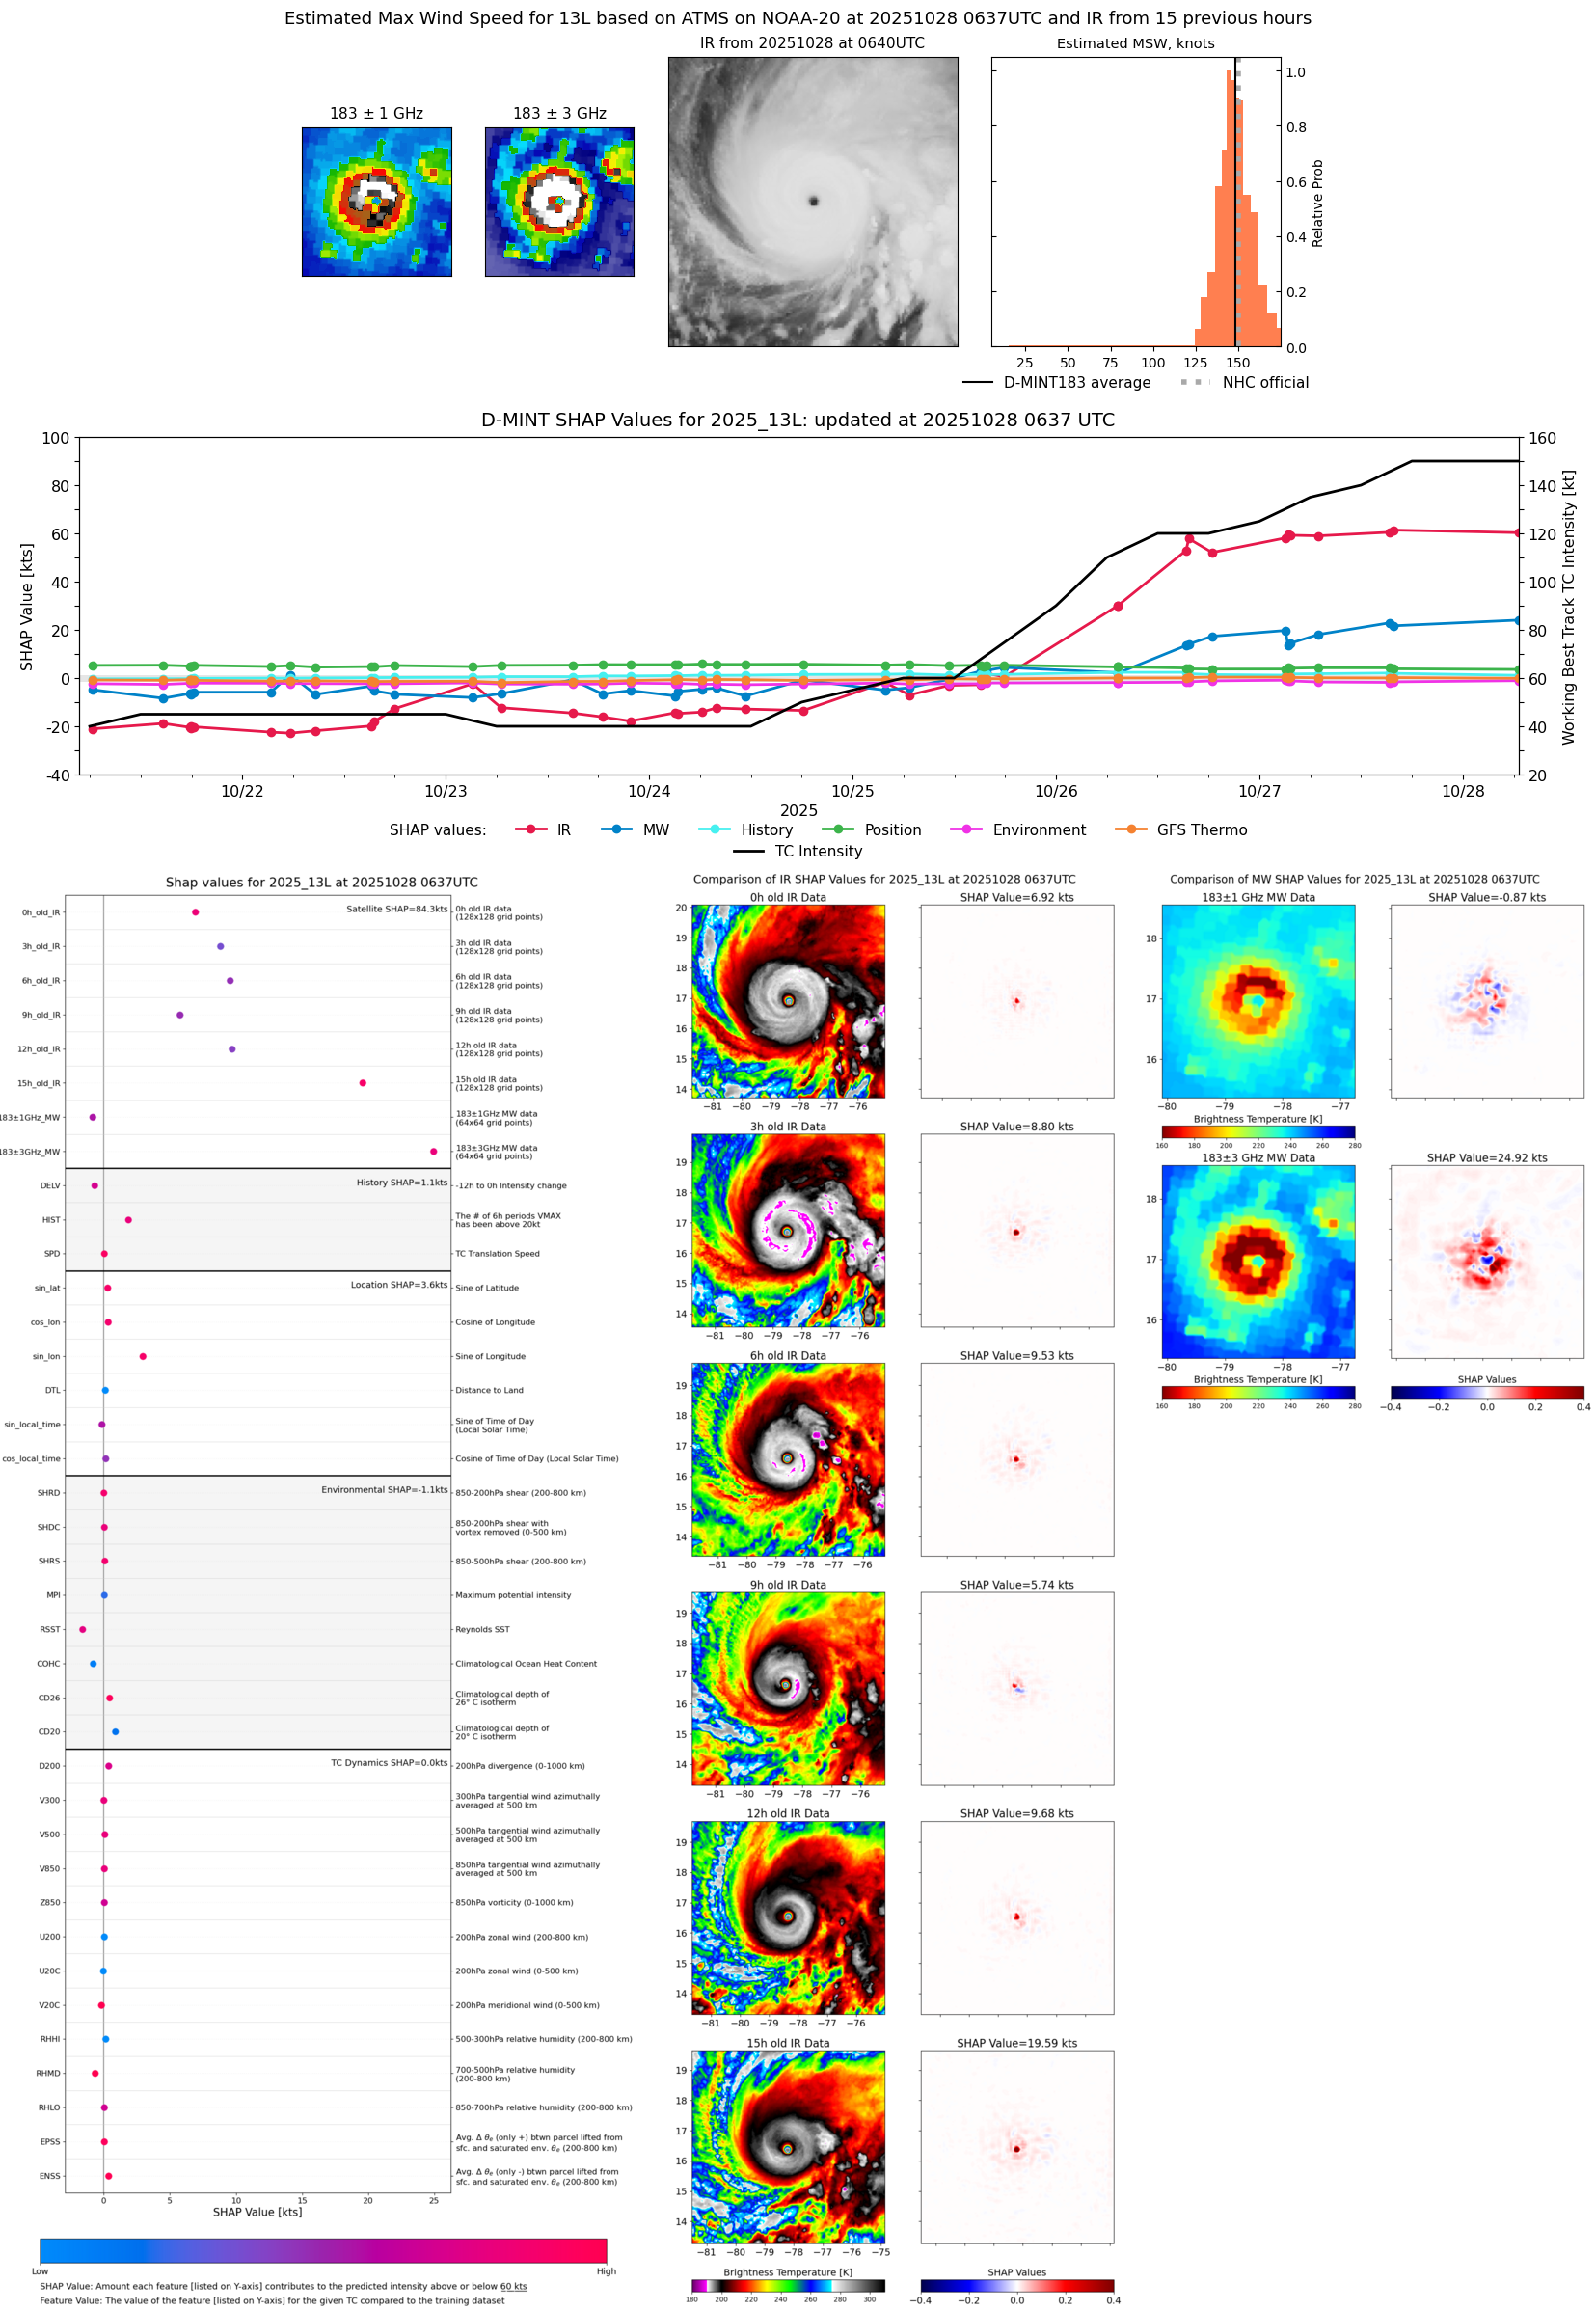 |
| 20251028 | 0352 UTC | TMS05 | 918 hPa | 150 kts | 143 kts | 156 kts |  |
| 20251027 | 2347 UTC | SSMISF16 | 923 hPa | 152 kts | 143 kts | 160 kts |  |
| 20251027 | 2259 UTC | WSFM01 | 925 hPa | 142 kts | 134 kts | 150 kts |  |
| 20251027 | 2259 UTC | WSFM01 | 925 hPa | 142 kts | 134 kts | 150 kts |  |
| 20251027 | 2246 UTC | SSMISF17 | 921 hPa | 150 kts | 141 kts | 159 kts | 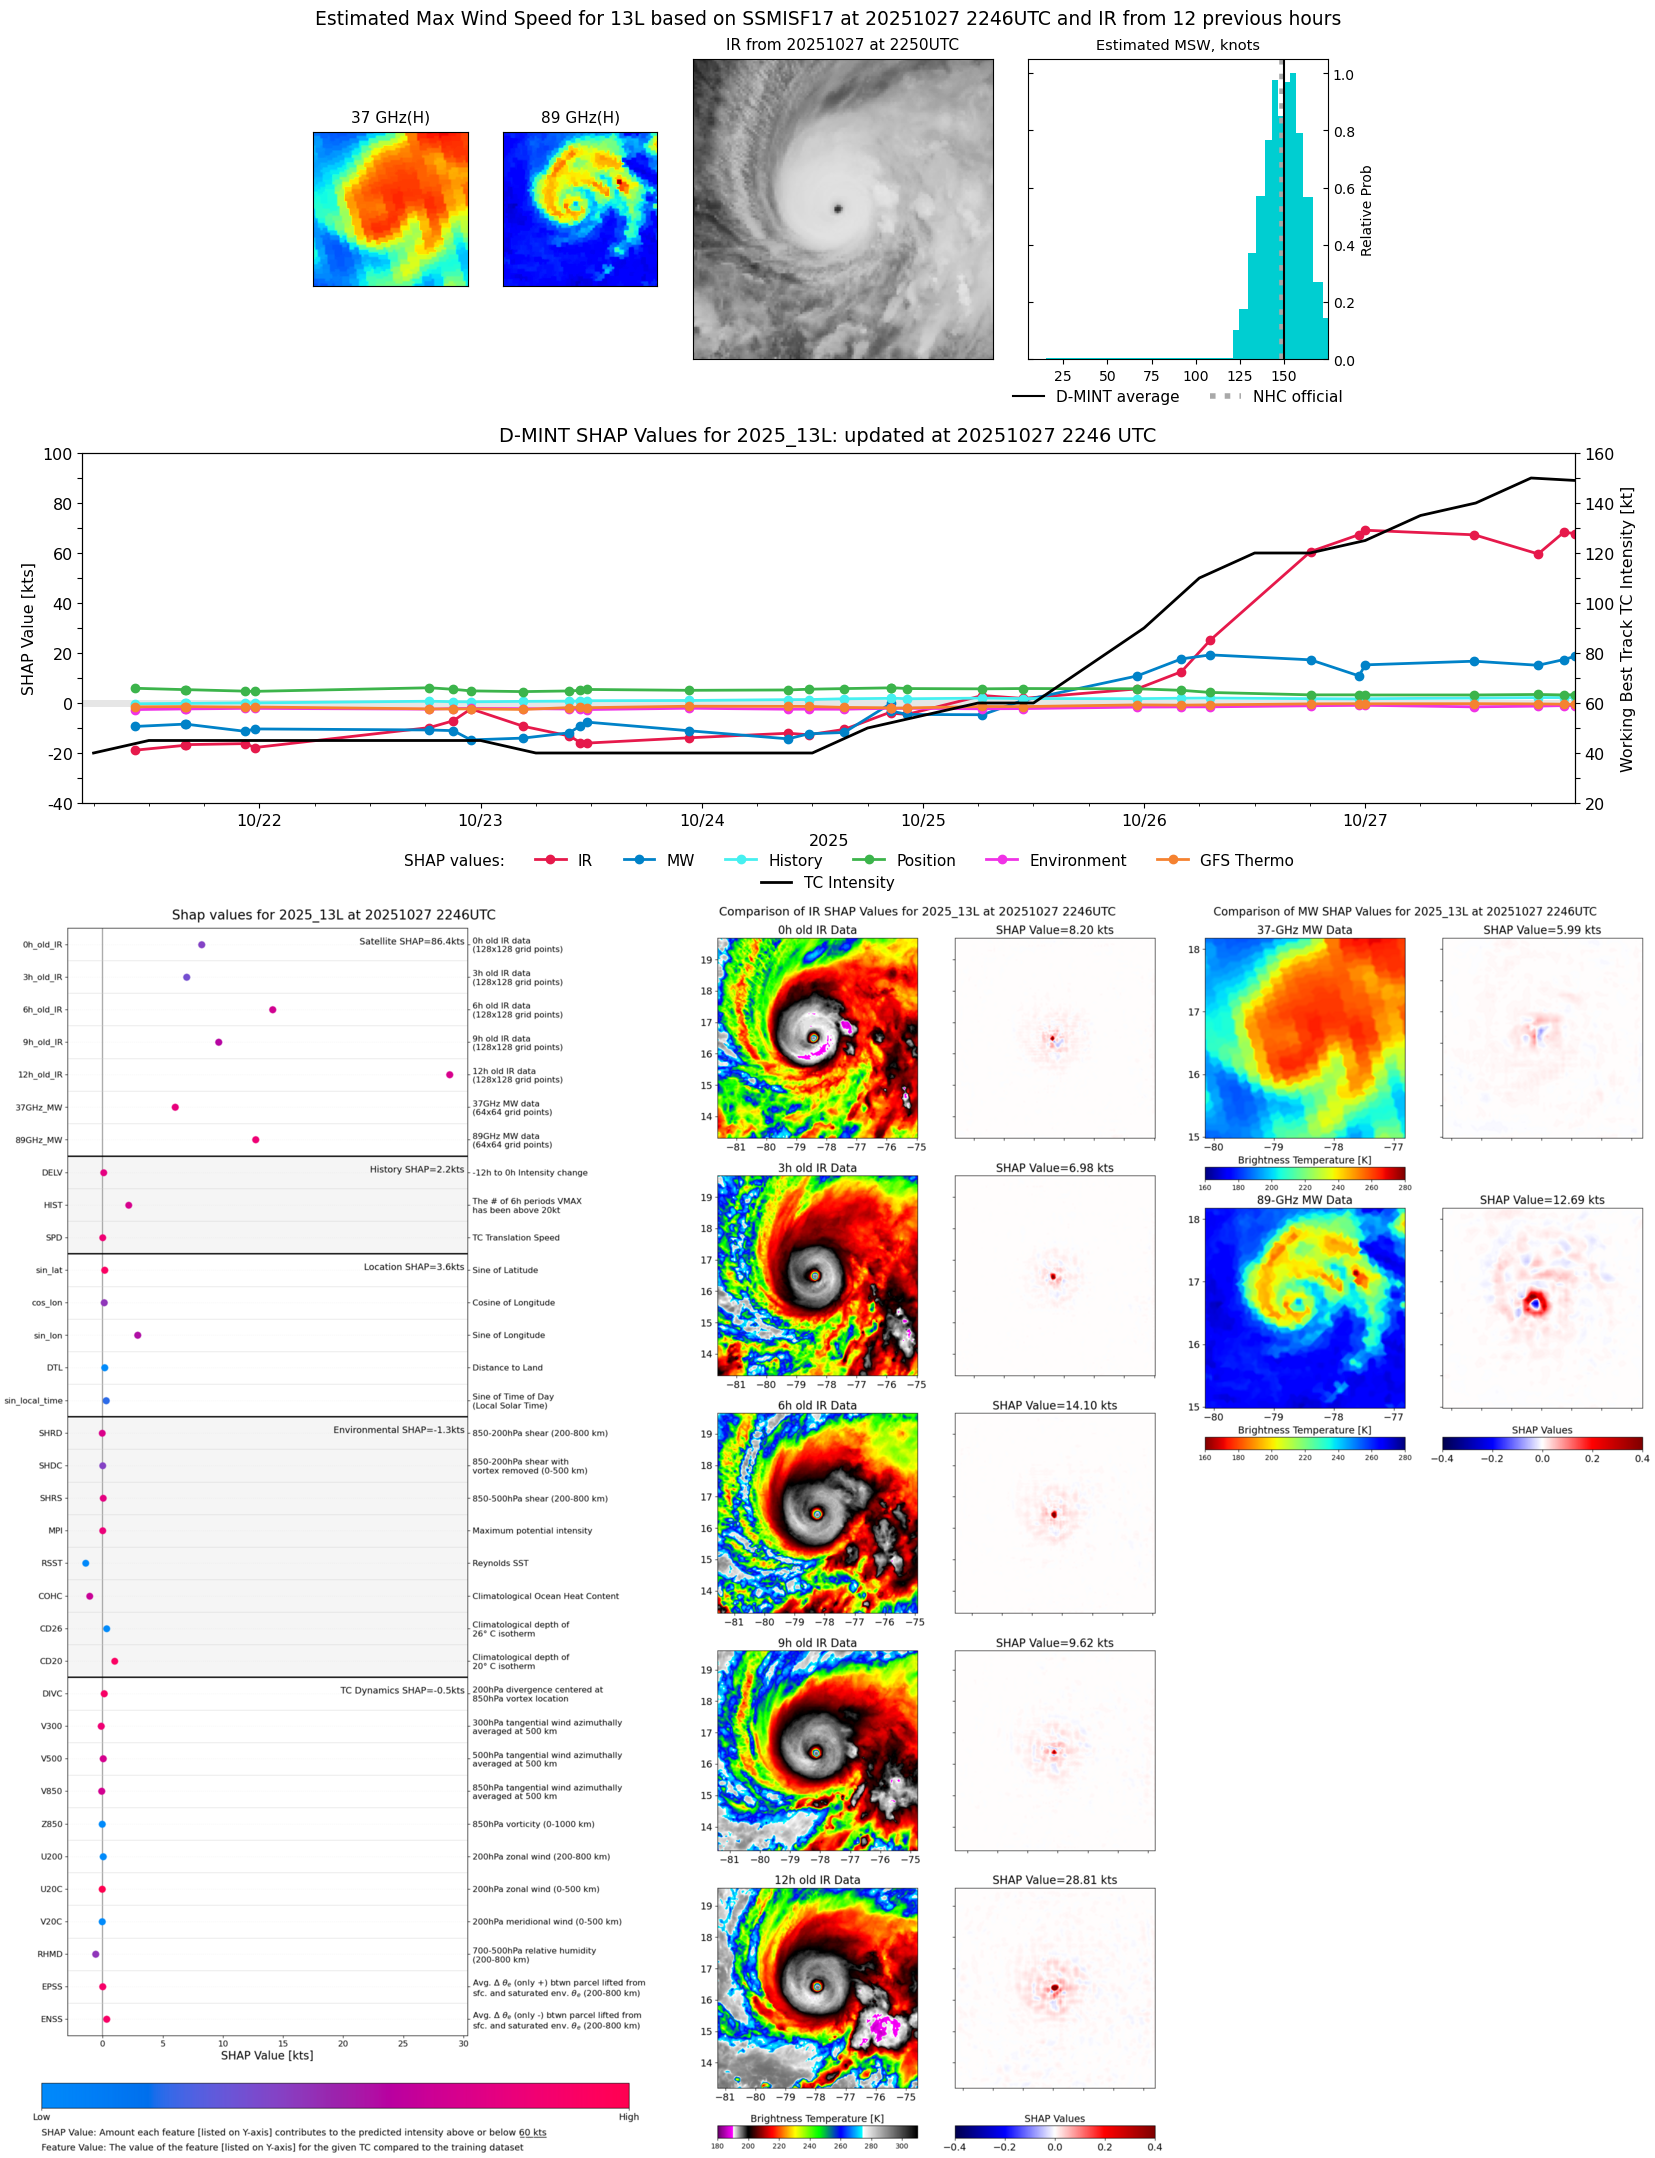 |
| 20251027 | 2134 UTC | SSMISF18 | 925 hPa | 149 kts | 141 kts | 157 kts |  |
| 20251027 | 1846 UTC | AMSR2 | 928 hPa | 138 kts | 131 kts | 145 kts |  |
| 20251027 | 1551 UTC | AWS | 927 hPa | 147 kts | 141 kts | 154 kts |  |
| 20251027 | 1521 UTC | TMS06 | 925 hPa | 148 kts | 141 kts | 155 kts |  |
| 20251027 | 1453 UTC | GMI | 921 hPa | 149 kts | 142 kts | 156 kts |  |
| 20251027 | 1151 UTC | WSFM01 | 925 hPa | 147 kts | 140 kts | 154 kts |  |
| 20251027 | 0657 UTC | ATMS-N20 | 929 hPa | 142 kts | 134 kts | 149 kts |  |
| 20251027 | 0338 UTC | TMS02 | 929 hPa | 138 kts | 131 kts | 146 kts | 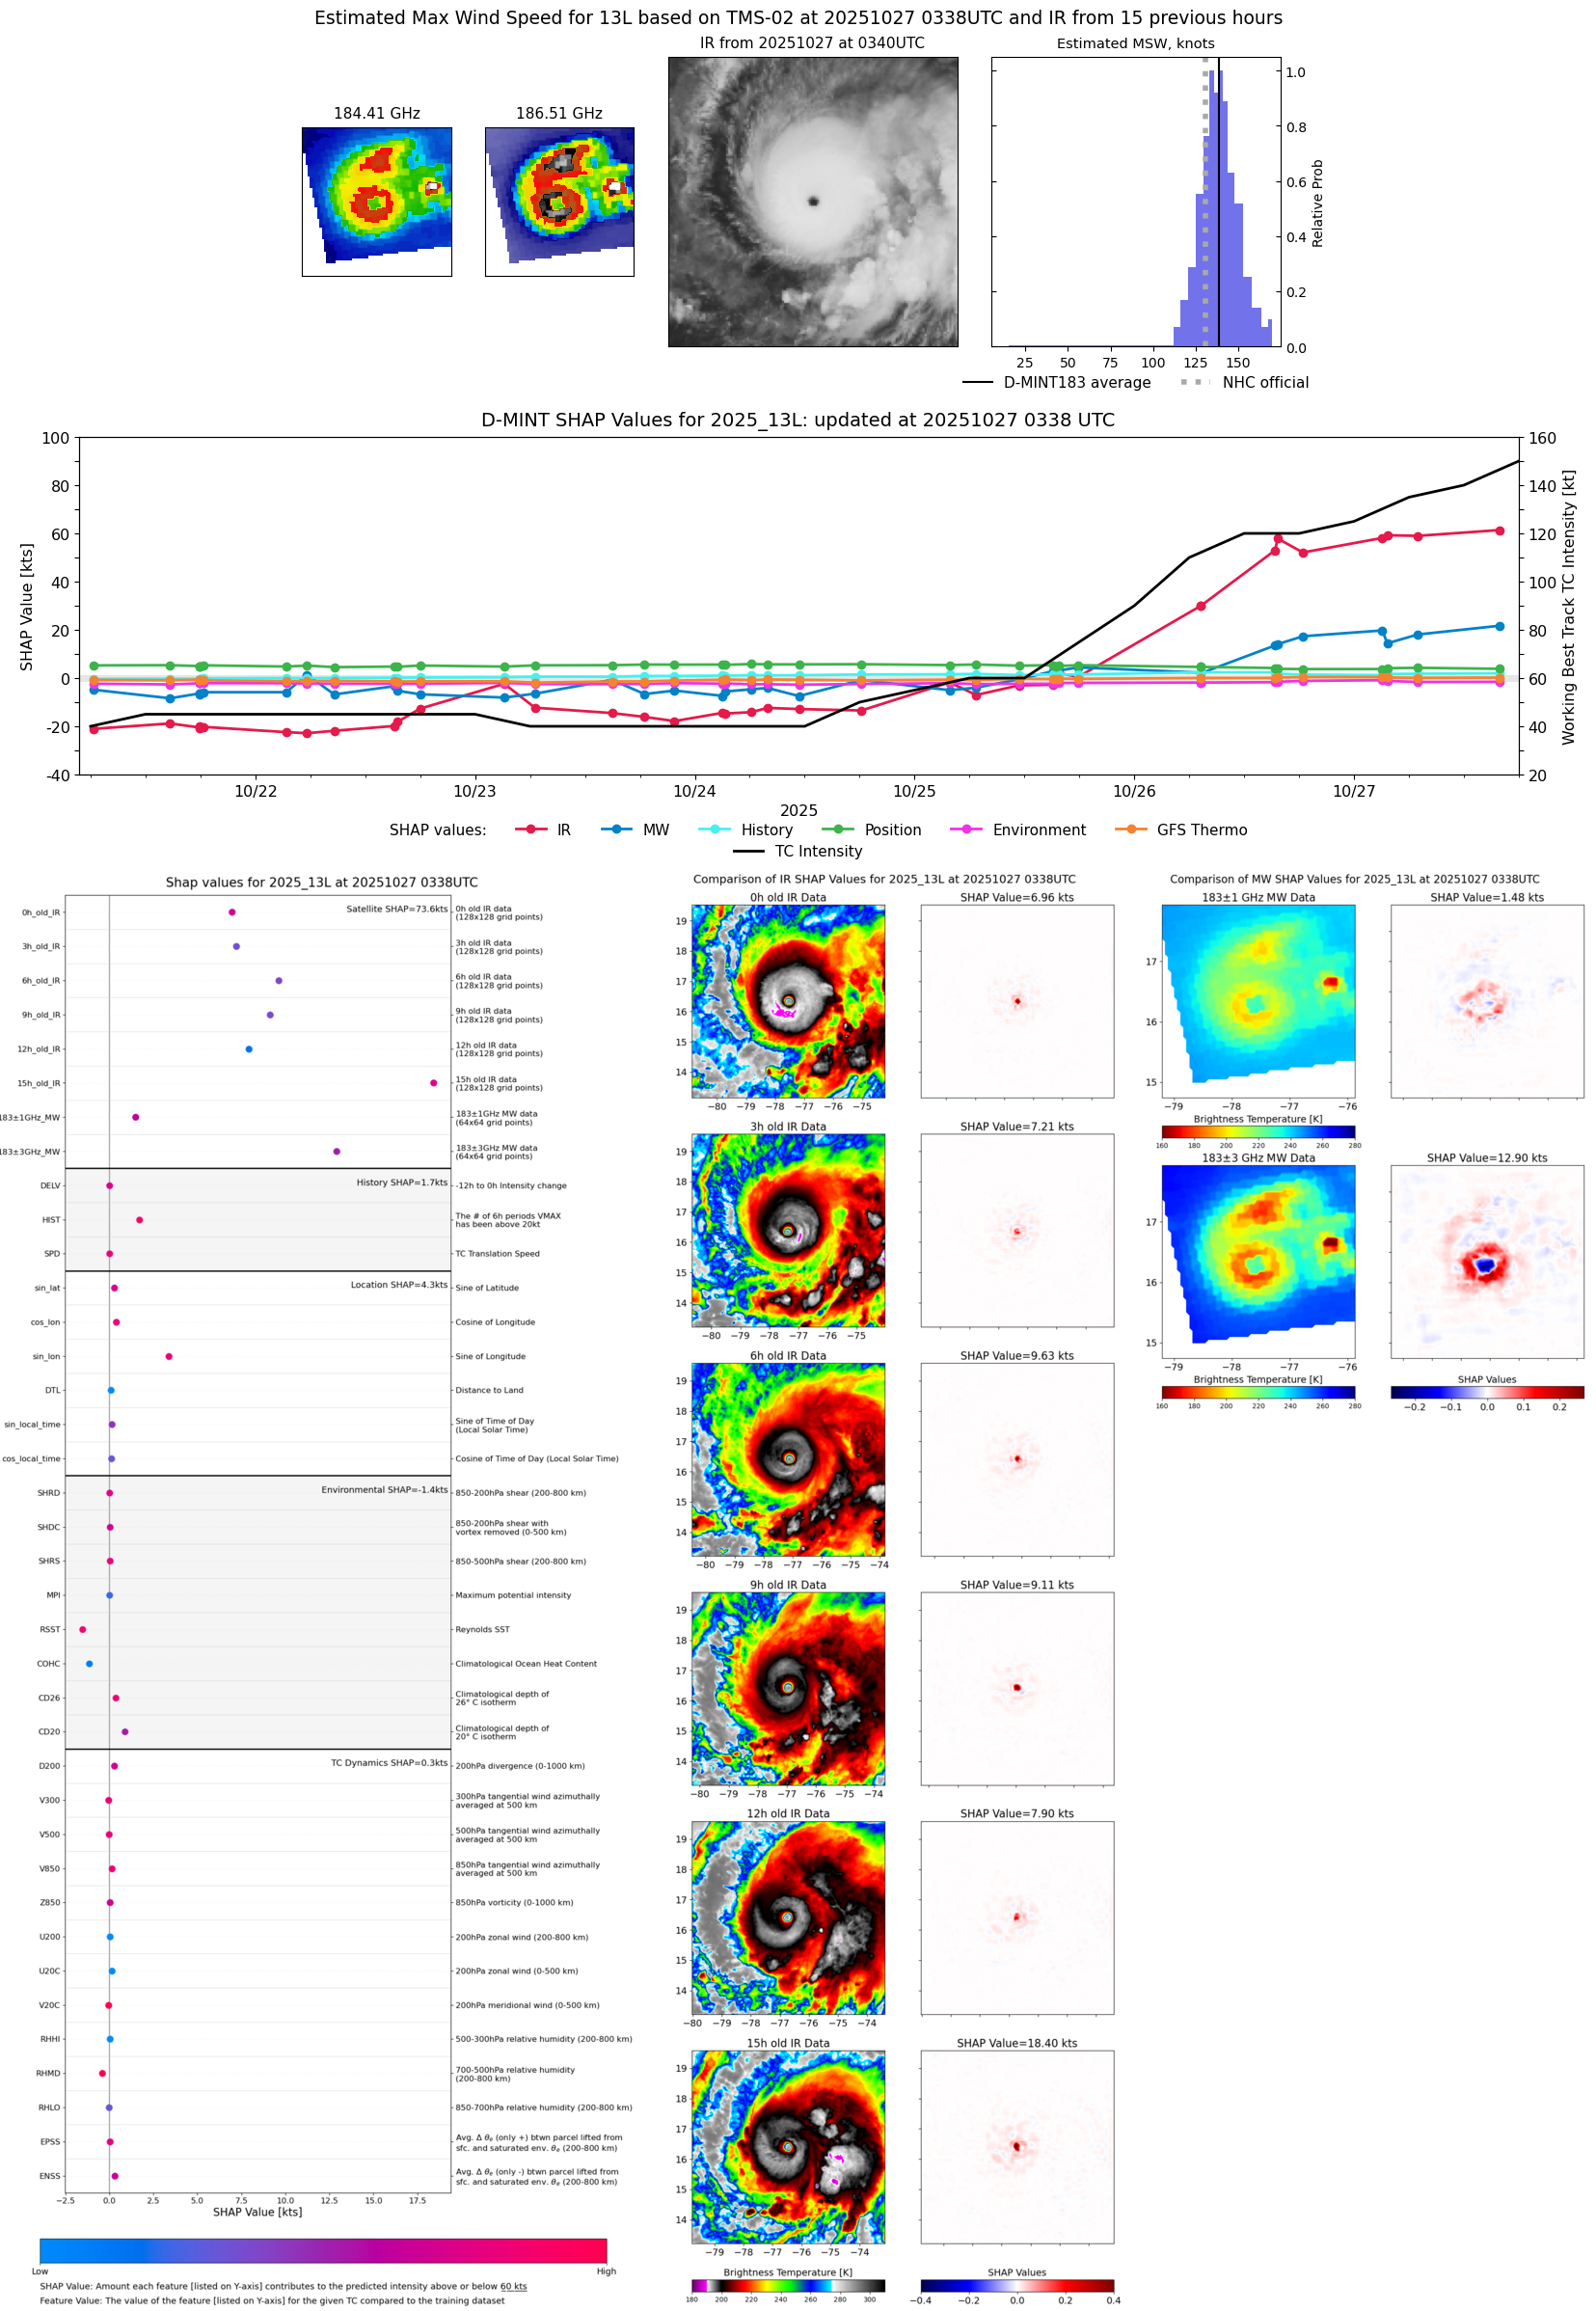 |
| 20251027 | 0323 UTC | TMS06 | 928 hPa | 138 kts | 131 kts | 145 kts |  |
| 20251027 | 0305 UTC | TROPICS03 | 924 hPa | 142 kts | 136 kts | 149 kts | 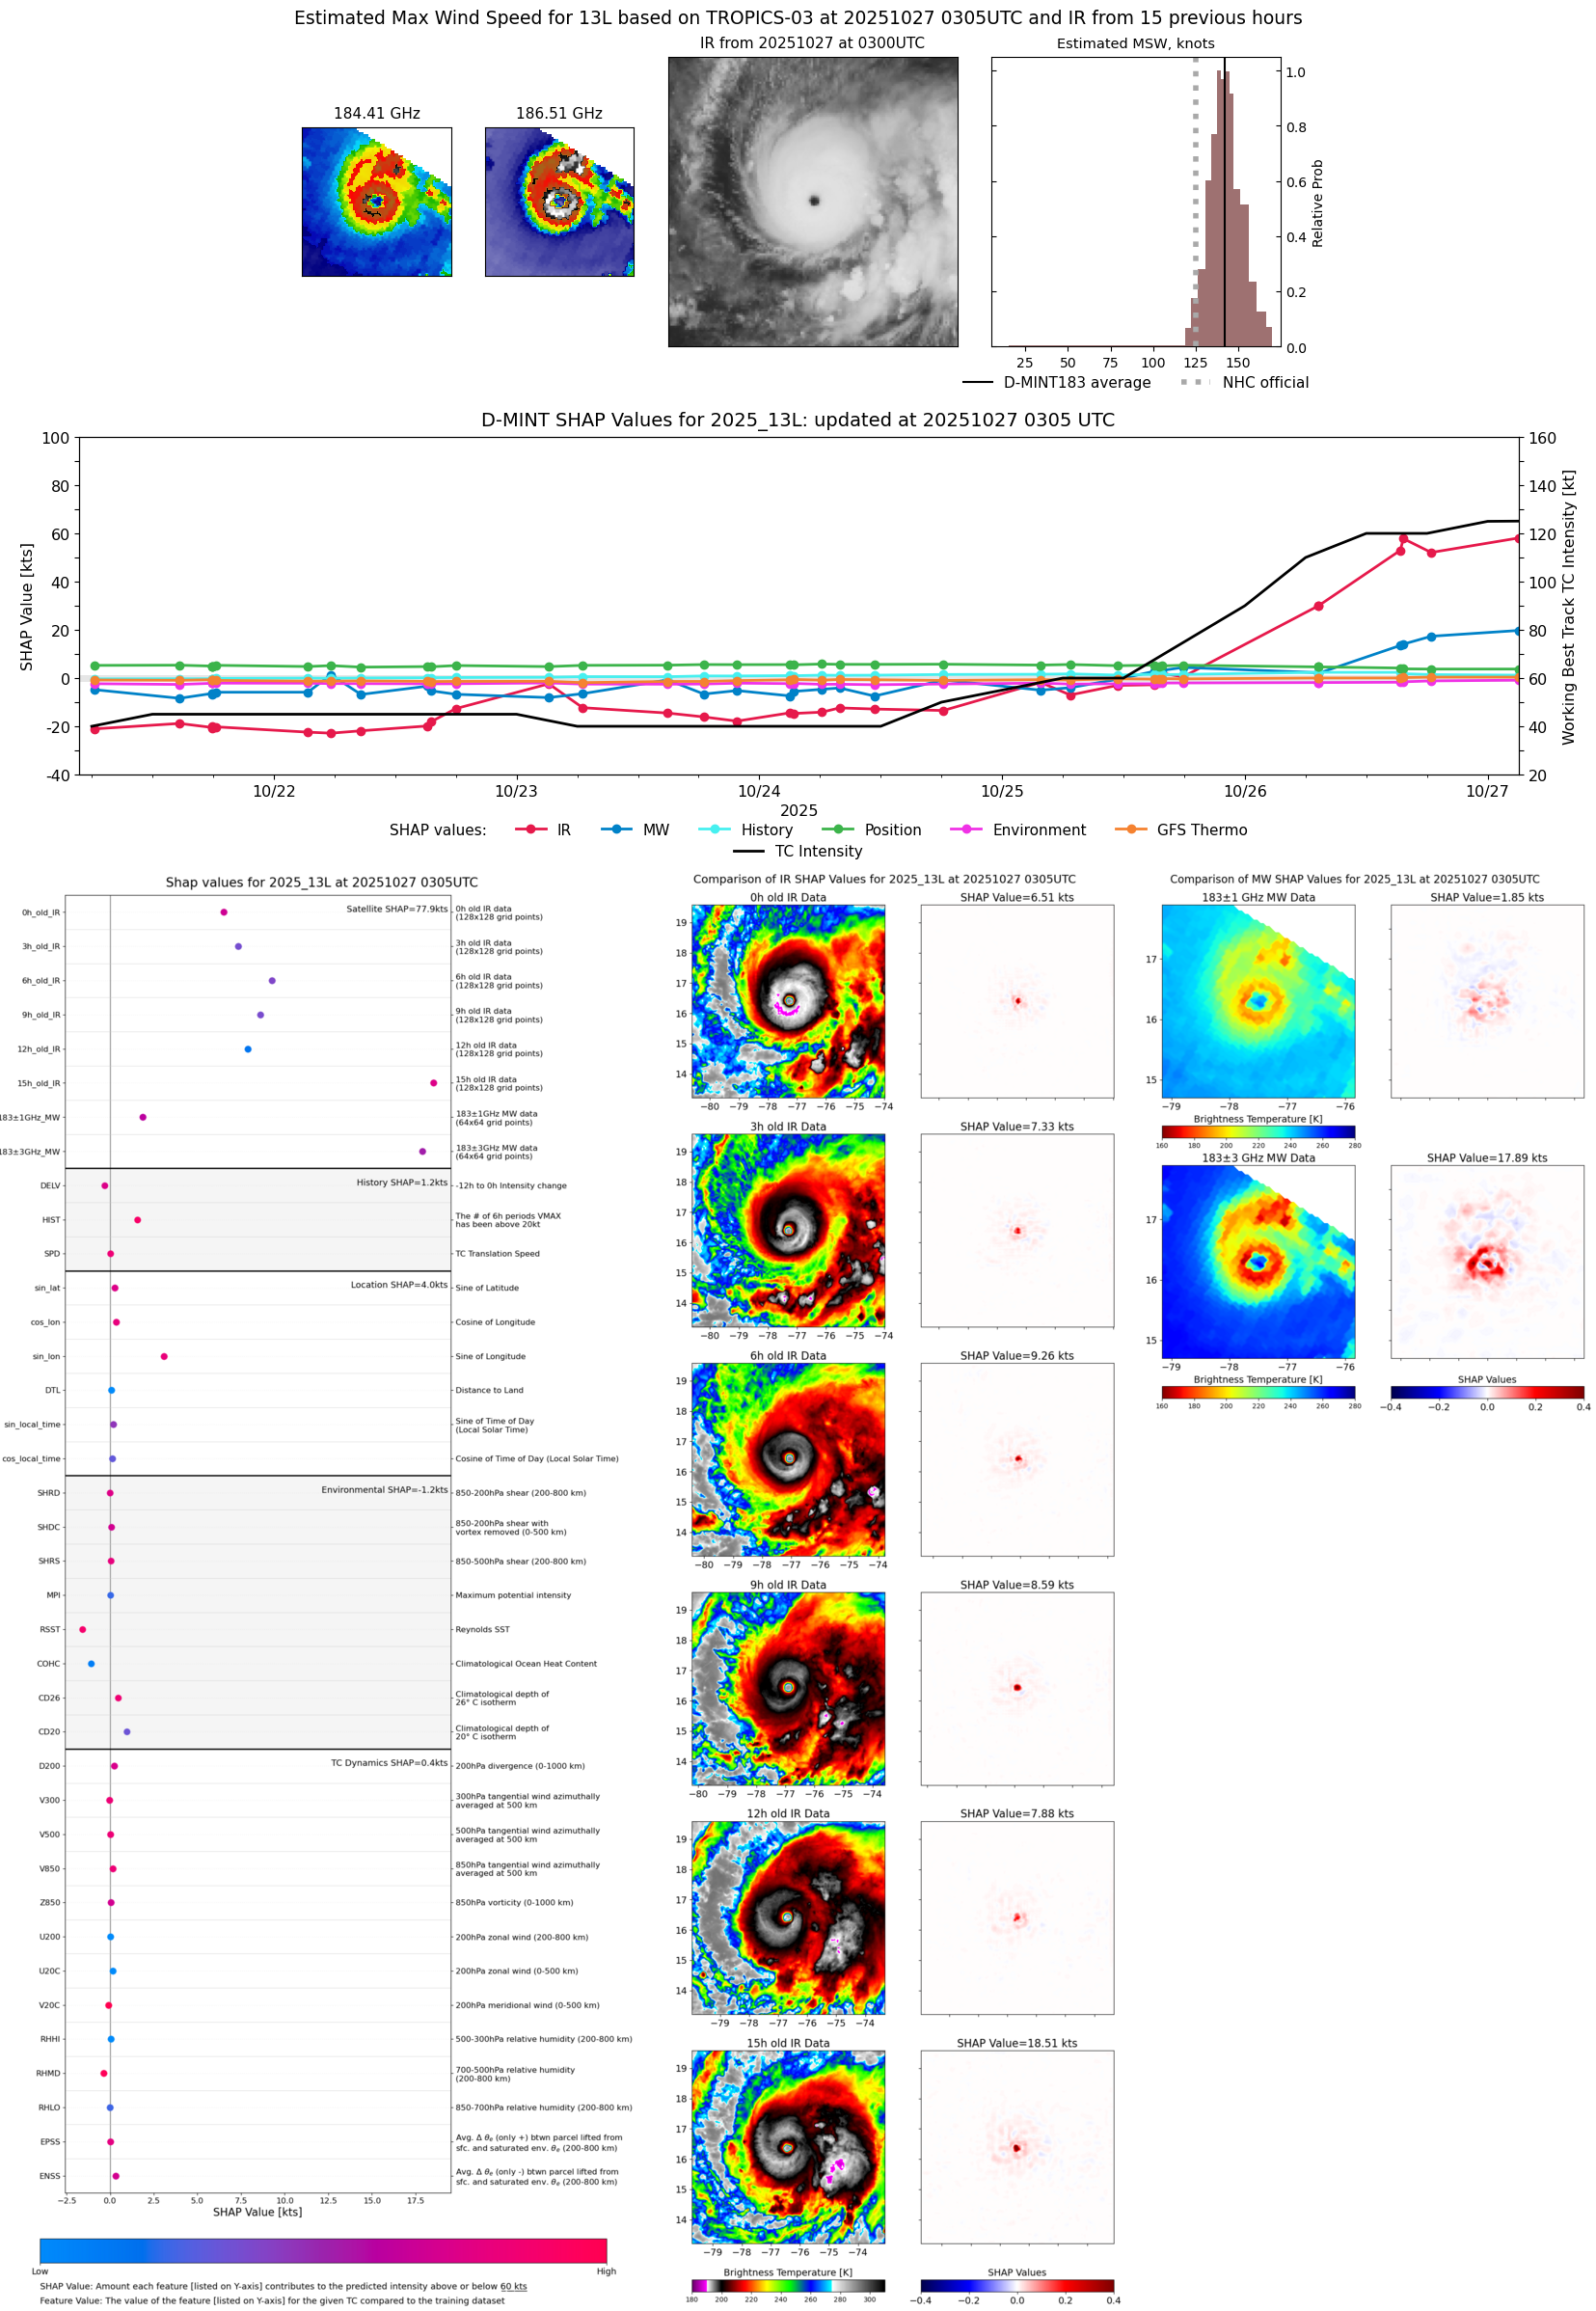 |
| 20251027 | 0001 UTC | SSMISF16 | 928 hPa | 148 kts | 140 kts | 156 kts | 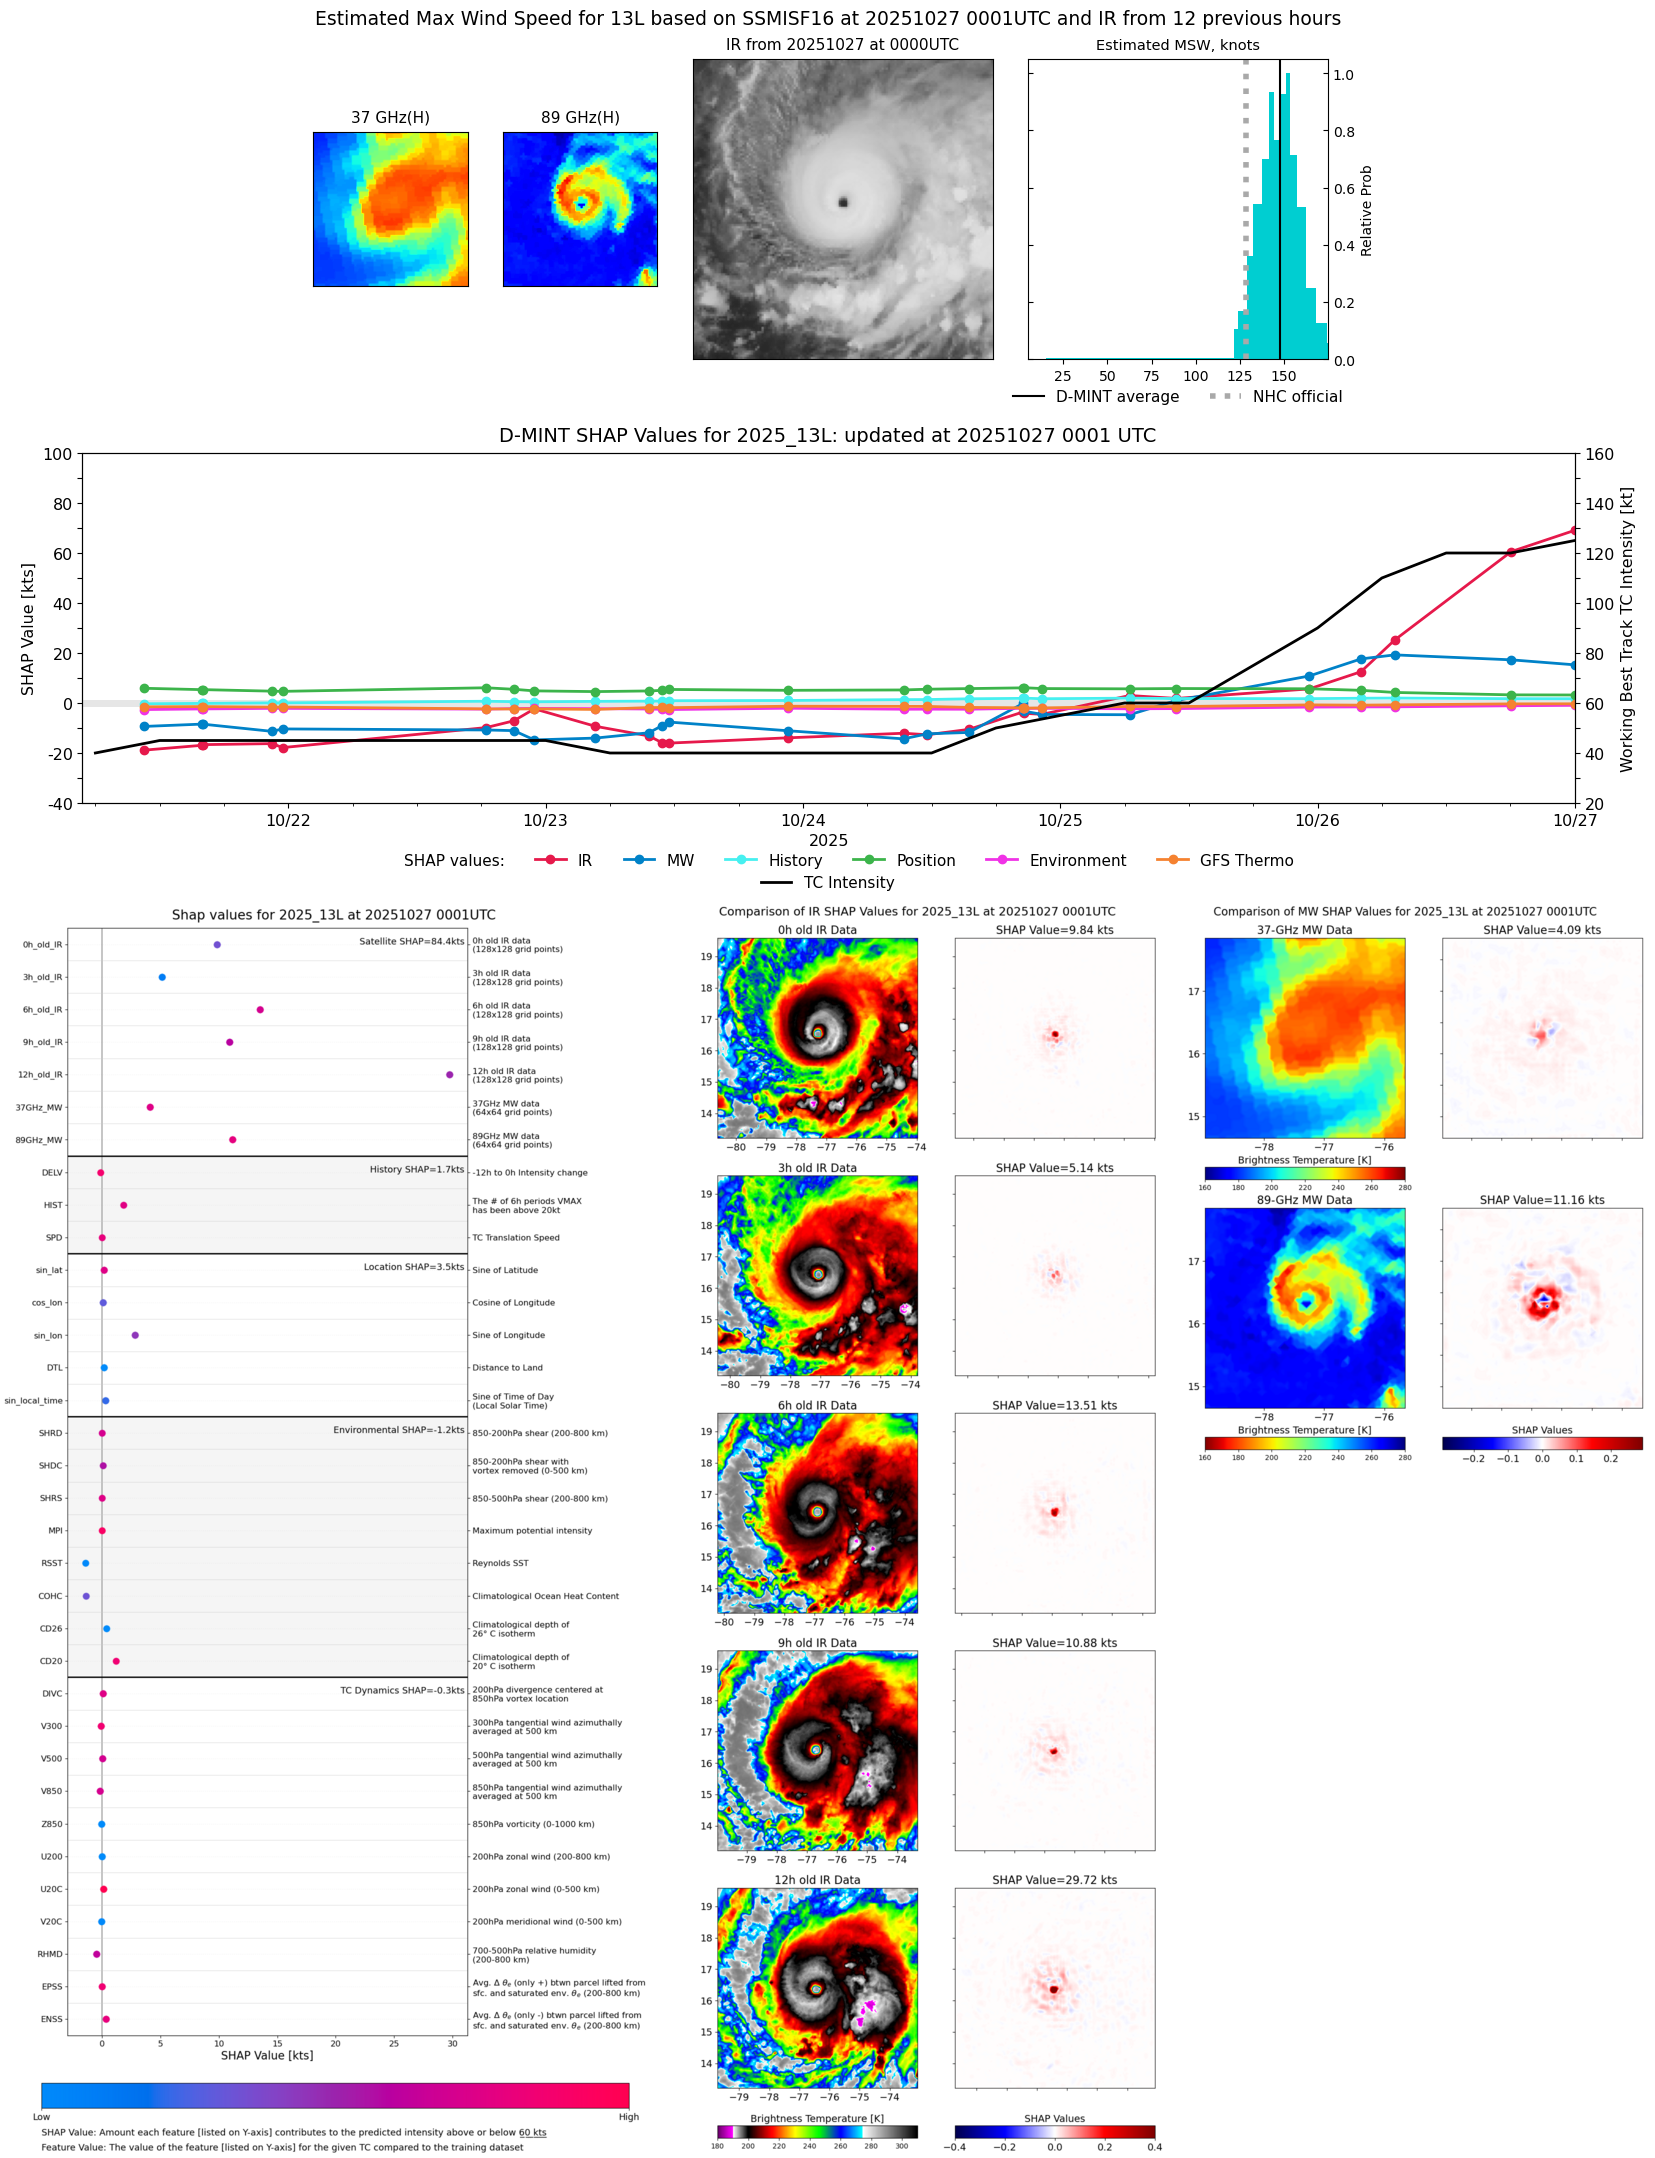 |
| 20251026 | 2319 UTC | WSFM01 | 928 hPa | 141 kts | 133 kts | 149 kts |  |
| 20251026 | 2319 UTC | WSFM01 | 928 hPa | 141 kts | 133 kts | 149 kts |  |
| 20251026 | 1825 UTC | ATMS-N20 | 926 hPa | 134 kts | 128 kts | 141 kts | 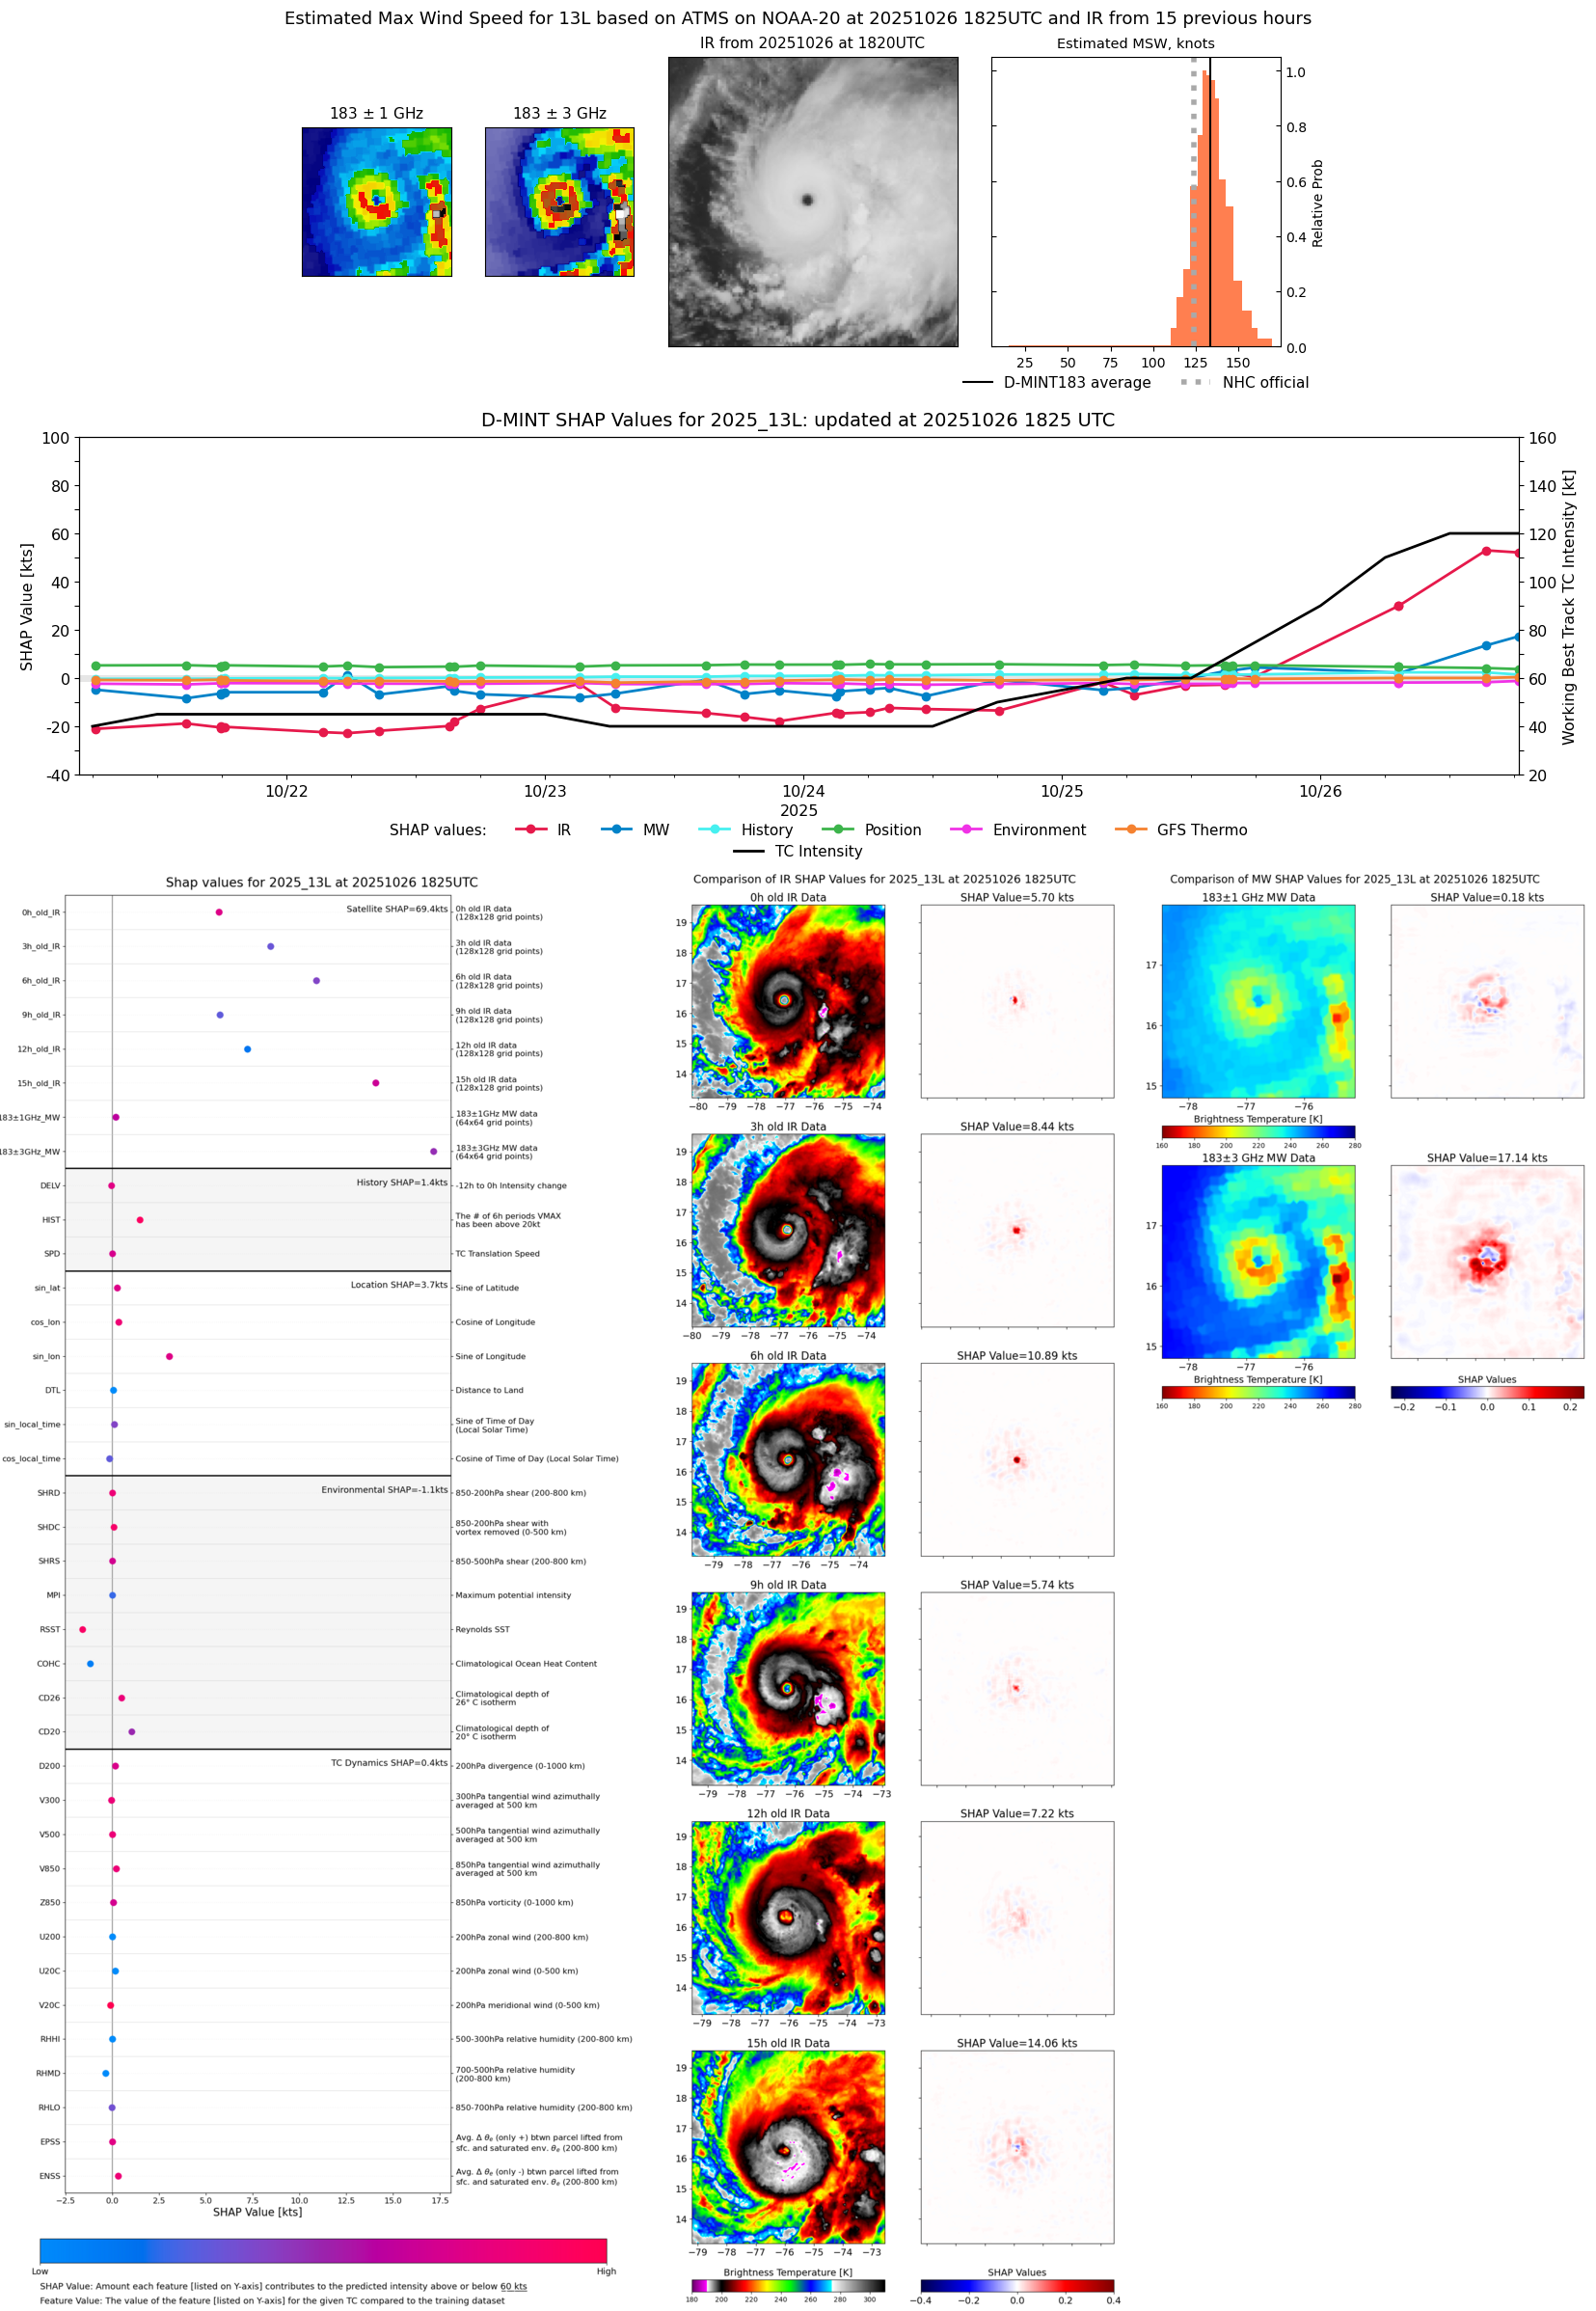 |
| 20251026 | 1804 UTC | AMSR2 | 931 hPa | 142 kts | 134 kts | 150 kts |  |
| 20251026 | 1540 UTC | AWS | 928 hPa | 136 kts | 130 kts | 143 kts |  |
| 20251026 | 1522 UTC | TROPICS05 | 937 hPa | 131 kts | 126 kts | 137 kts |  |
| 20251026 | 0715 UTC | TROPICS05 | 961 hPa | 100 kts | 92 kts | 108 kts | 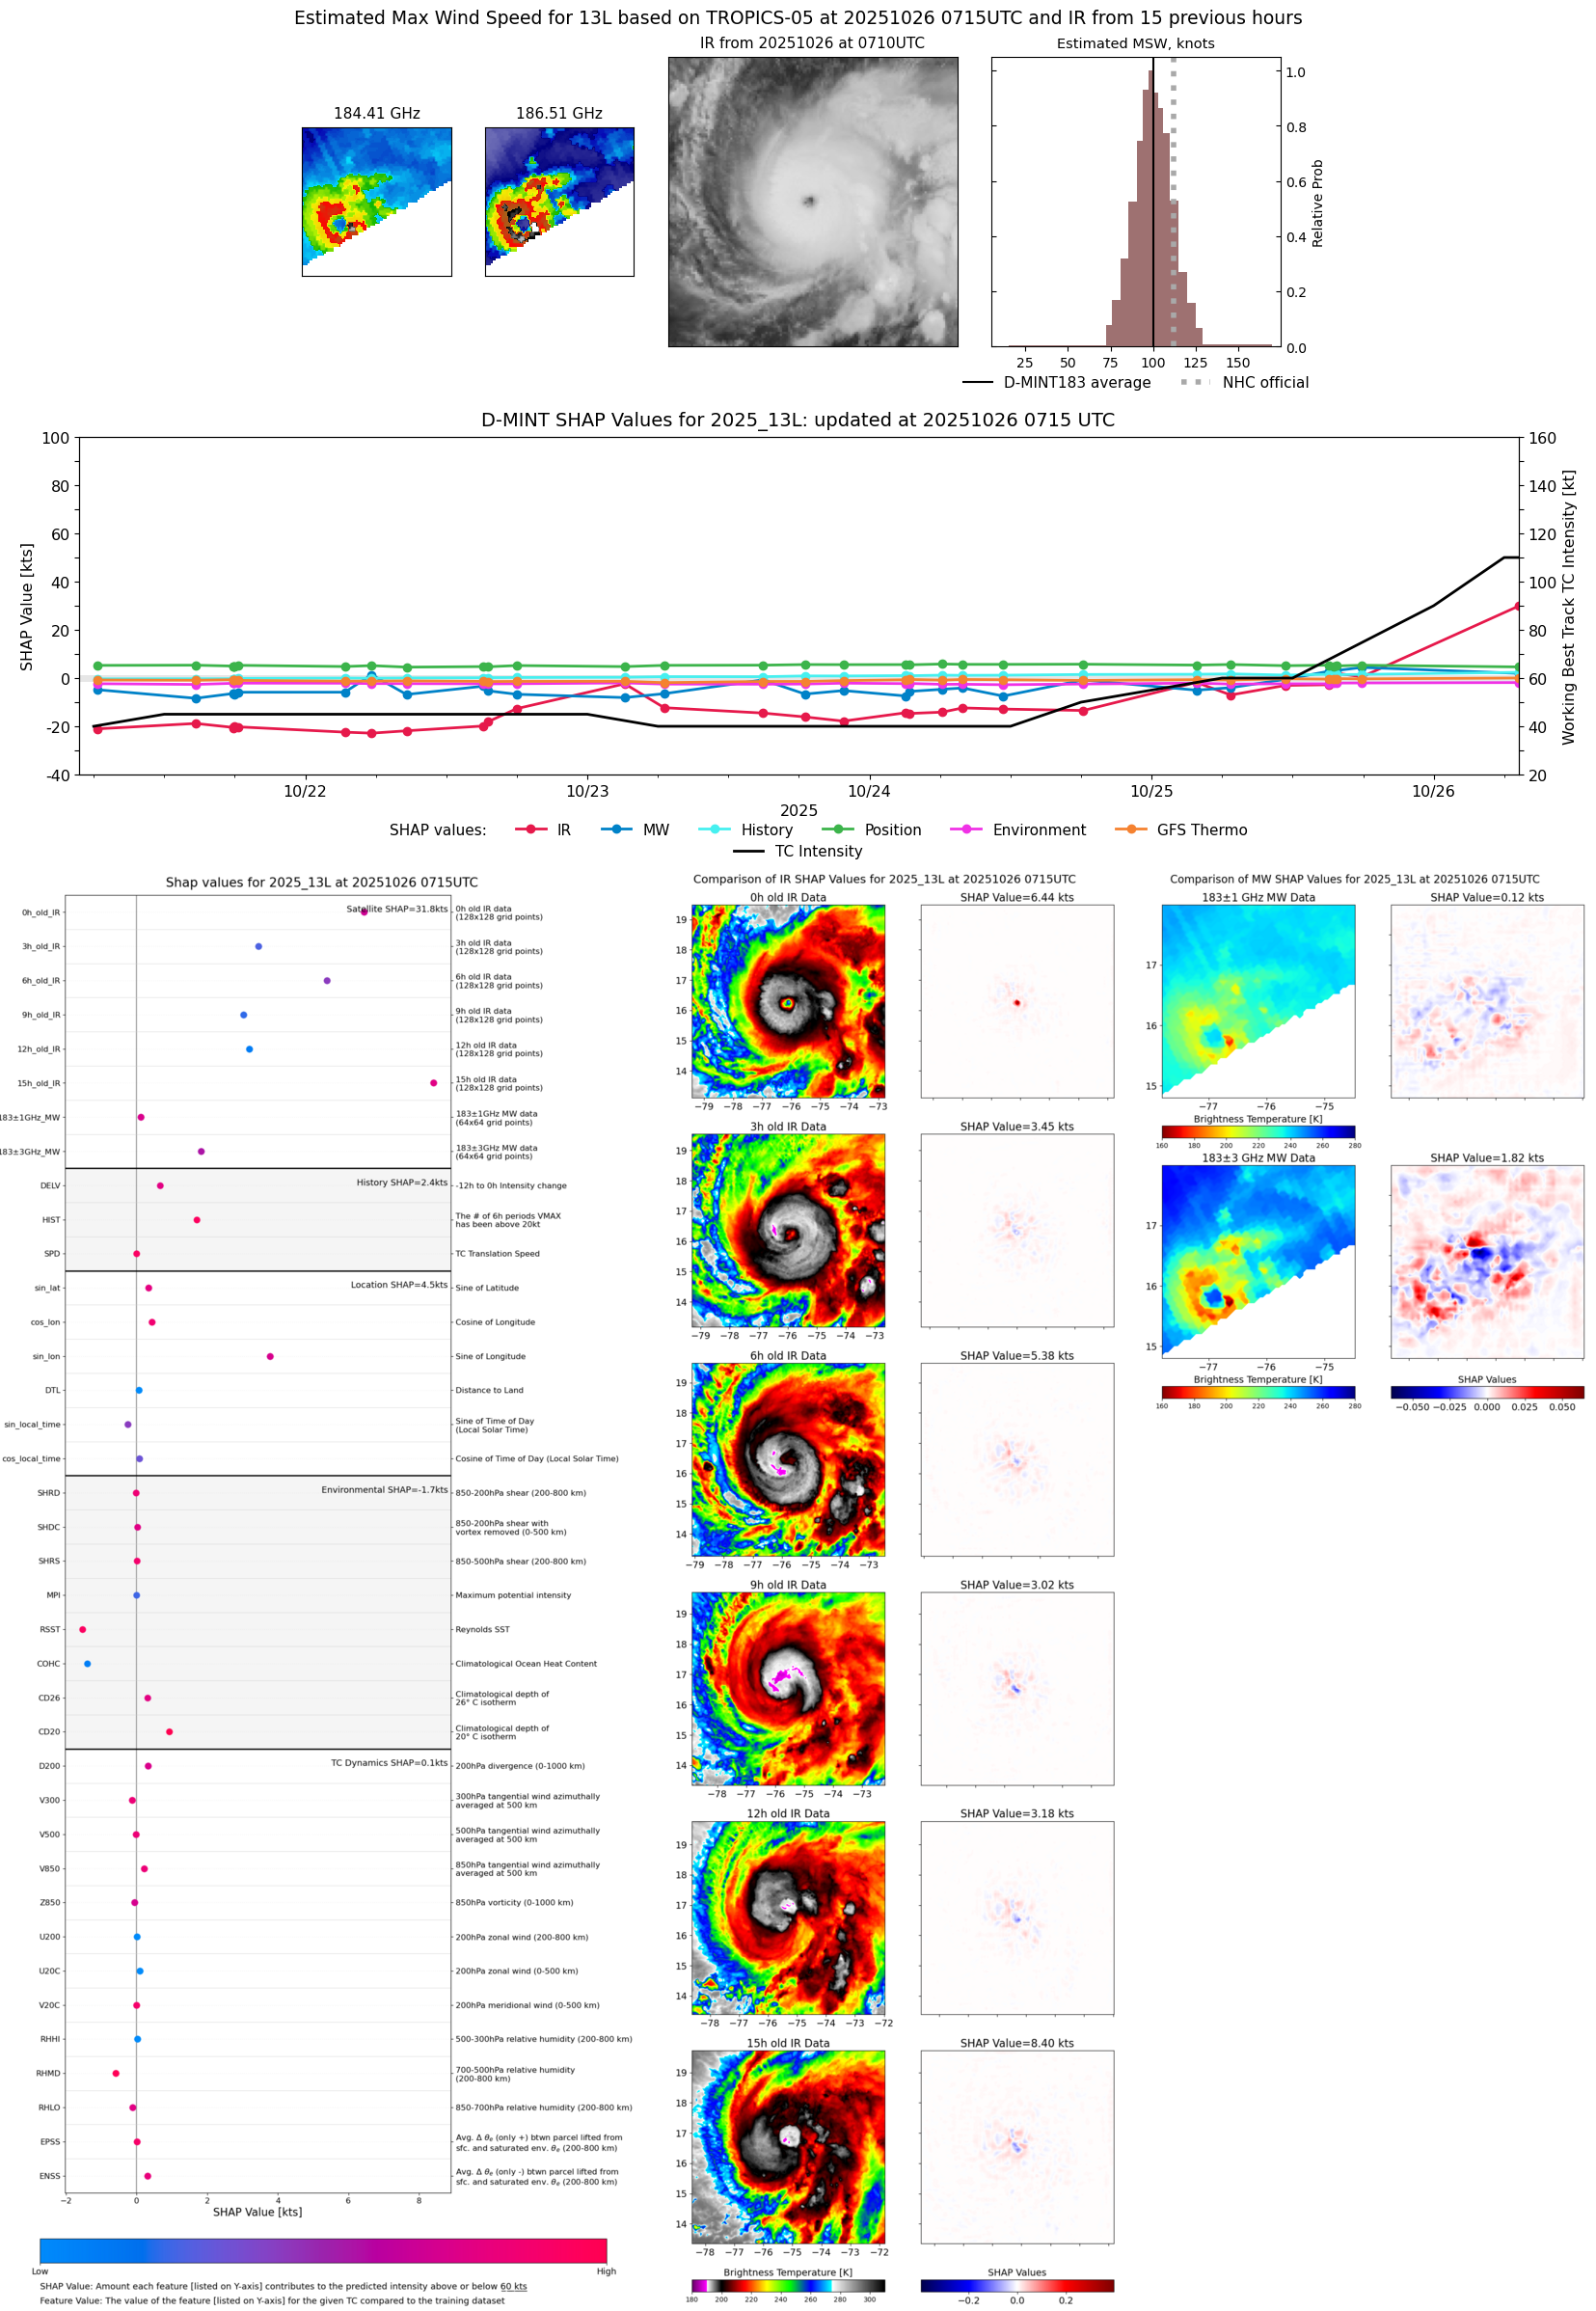 |
| 20251026 | 0712 UTC | AMSR2 | 948 hPa | 108 kts | 102 kts | 115 kts |  |
| 20251026 | 0626 UTC | ATMS-N21 | 946 hPa | 112 kts | 106 kts | 119 kts |  |
| 20251026 | 0403 UTC | GMI | 957 hPa | 98 kts | 91 kts | 105 kts | 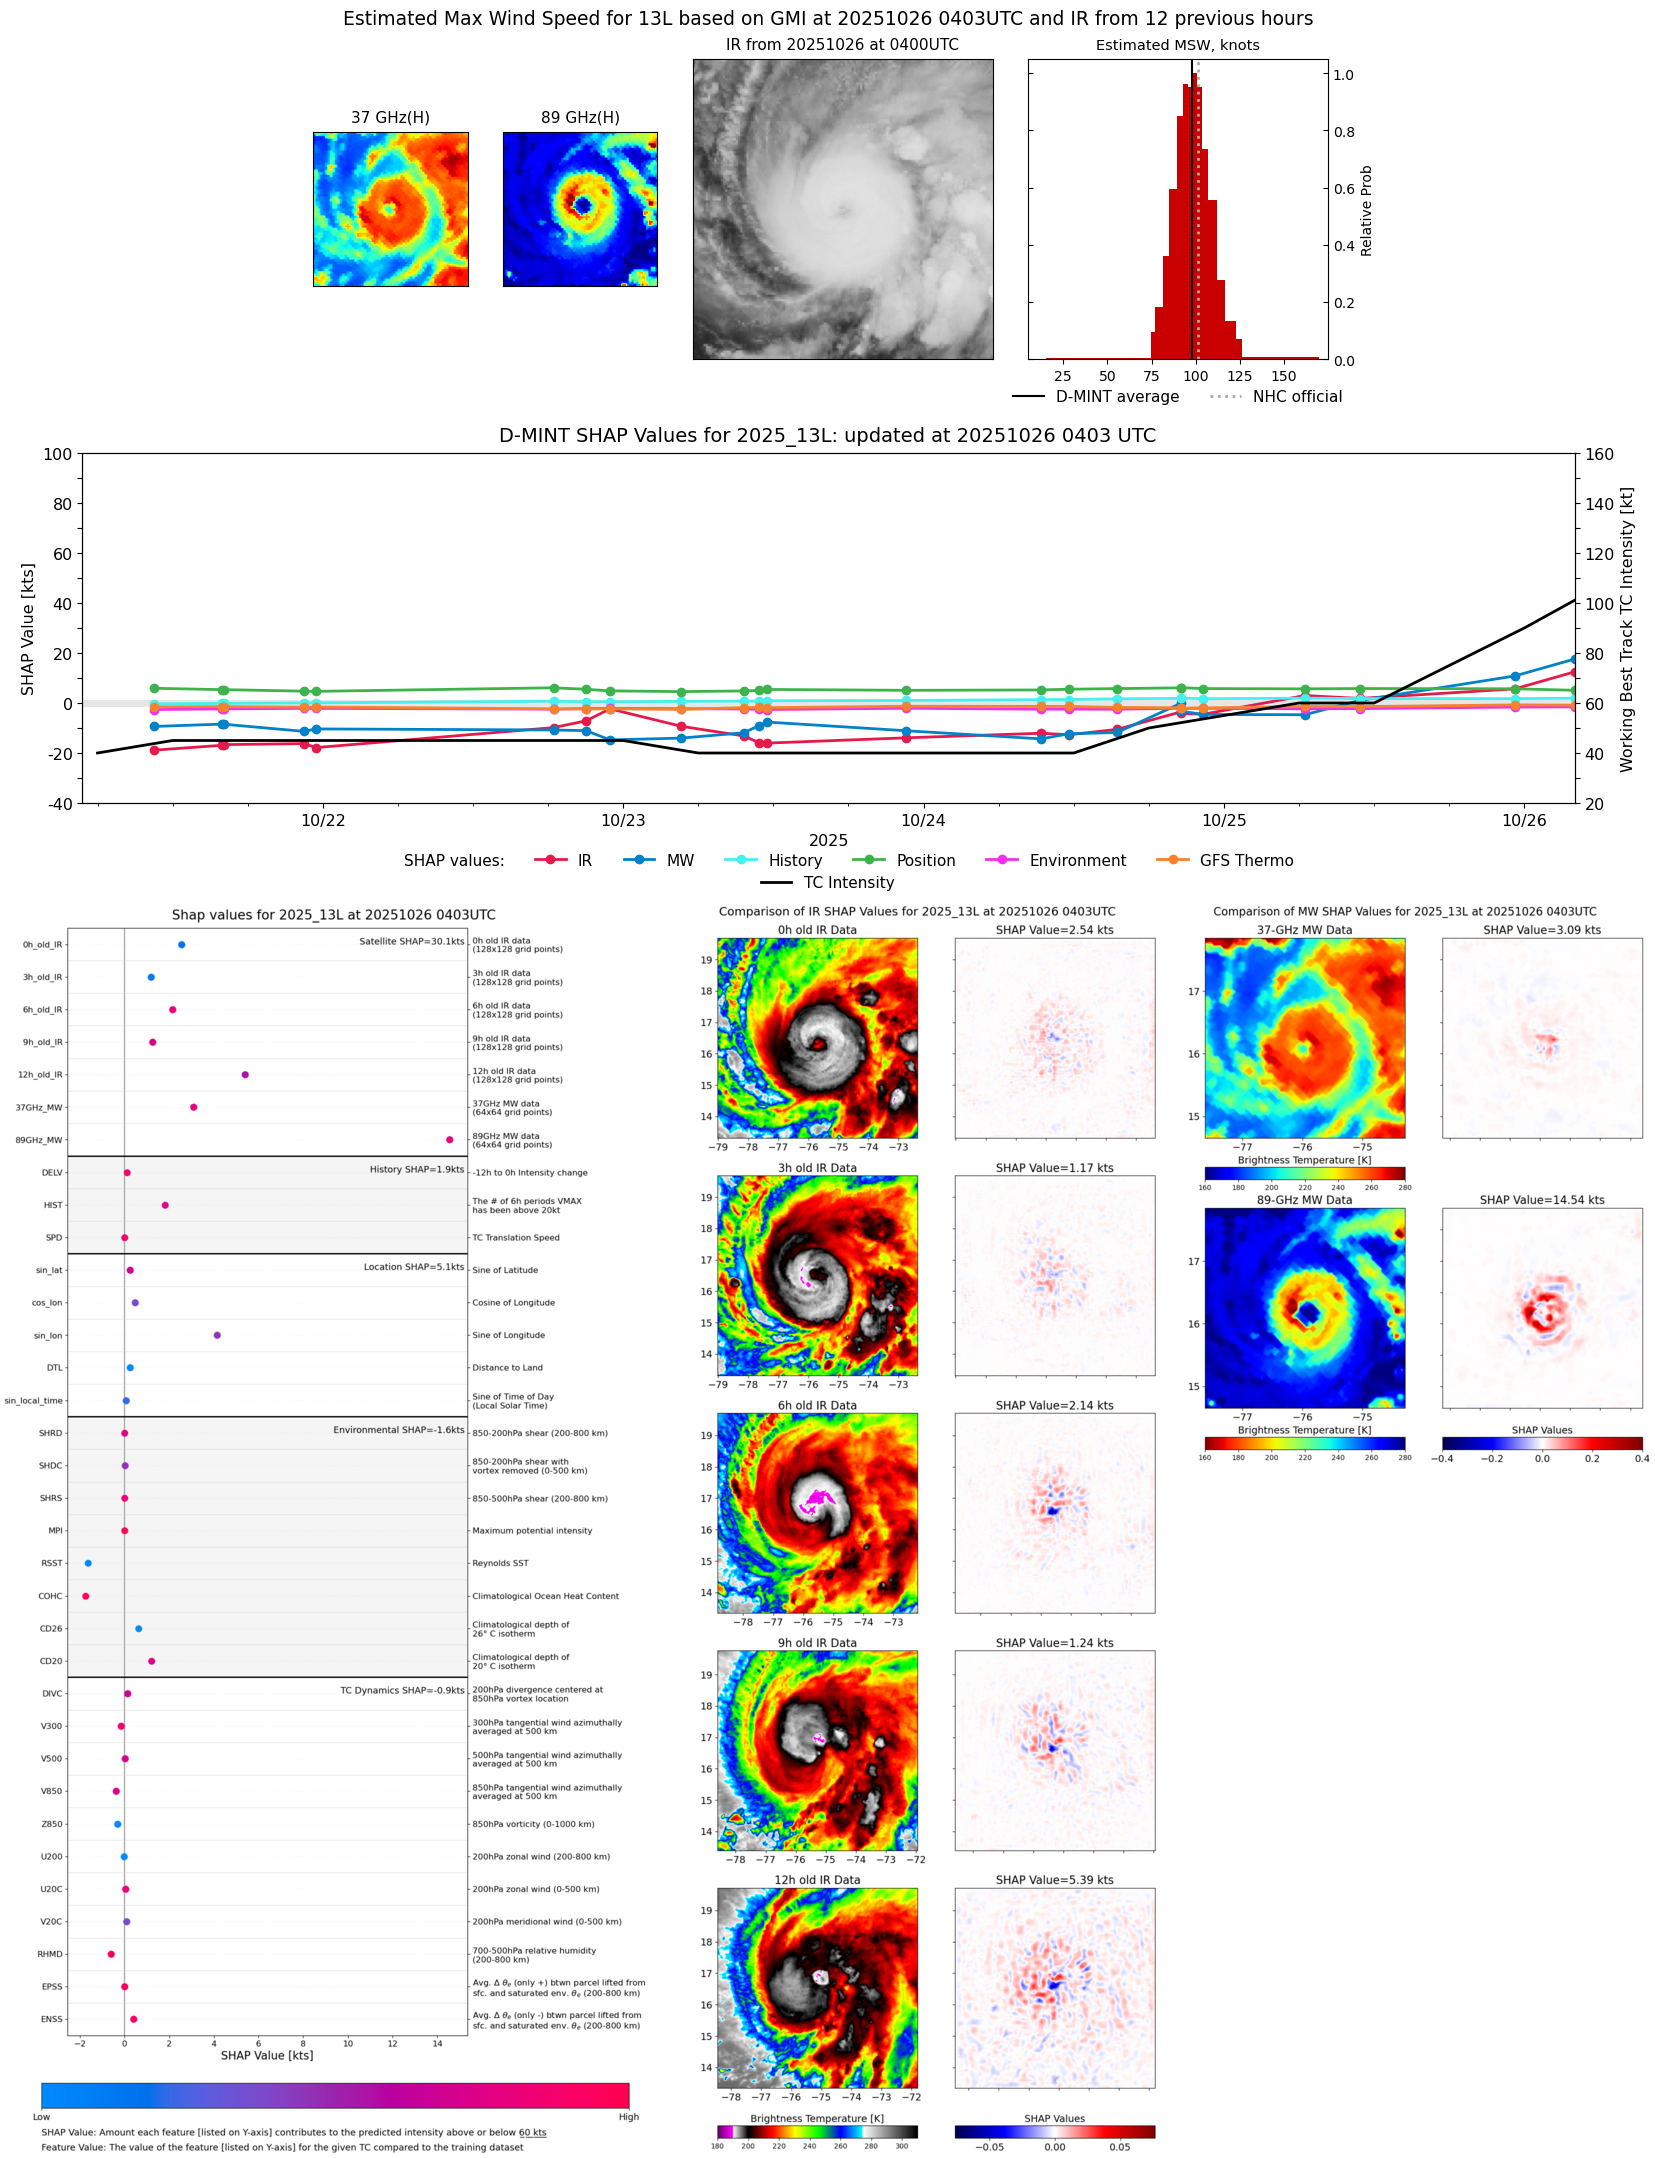 |
| 20251025 | 2314 UTC | SSMISF17 | 972 hPa | 81 kts | 74 kts | 89 kts | 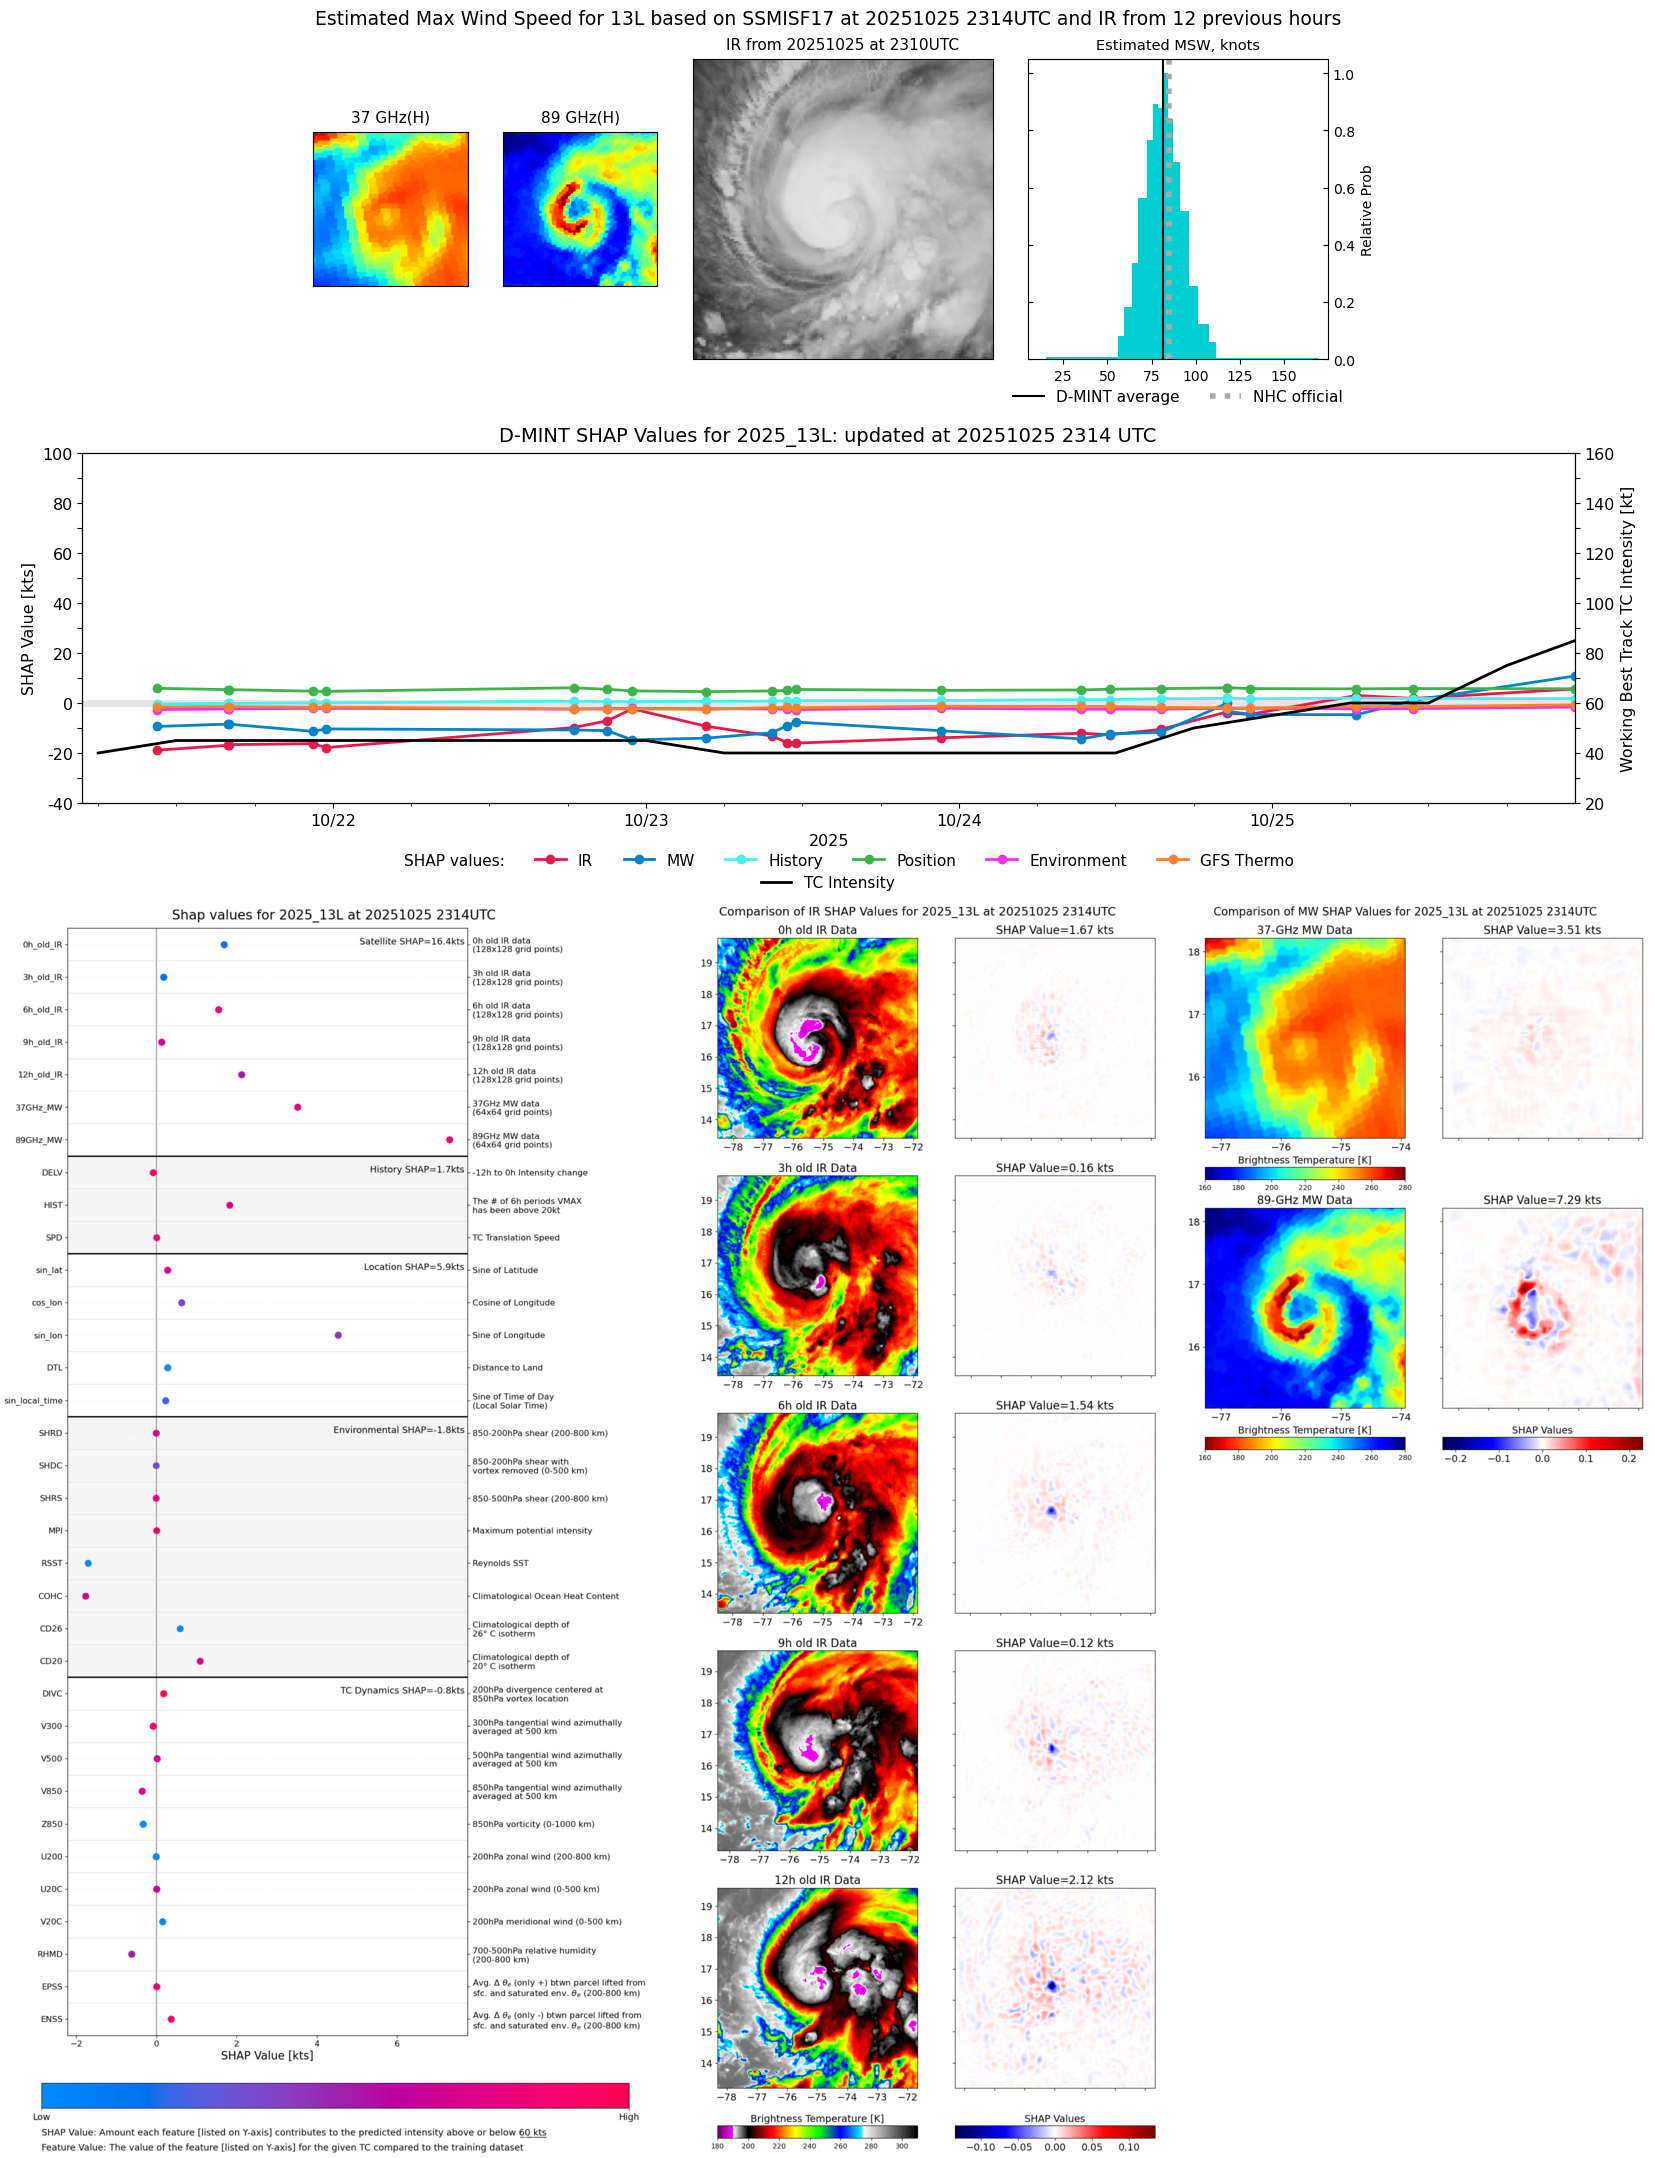 |
| 20251025 | 1754 UTC | ATMS-N21 | 983 hPa | 70 kts | 63 kts | 76 kts |  |
| 20251025 | 1547 UTC | TMS02 | 987 hPa | 70 kts | 64 kts | 76 kts |  |
| 20251025 | 1529 UTC | AWS | 987 hPa | 64 kts | 59 kts | 70 kts |  |
| 20251025 | 1505 UTC | TMS05 | 988 hPa | 64 kts | 59 kts | 70 kts | 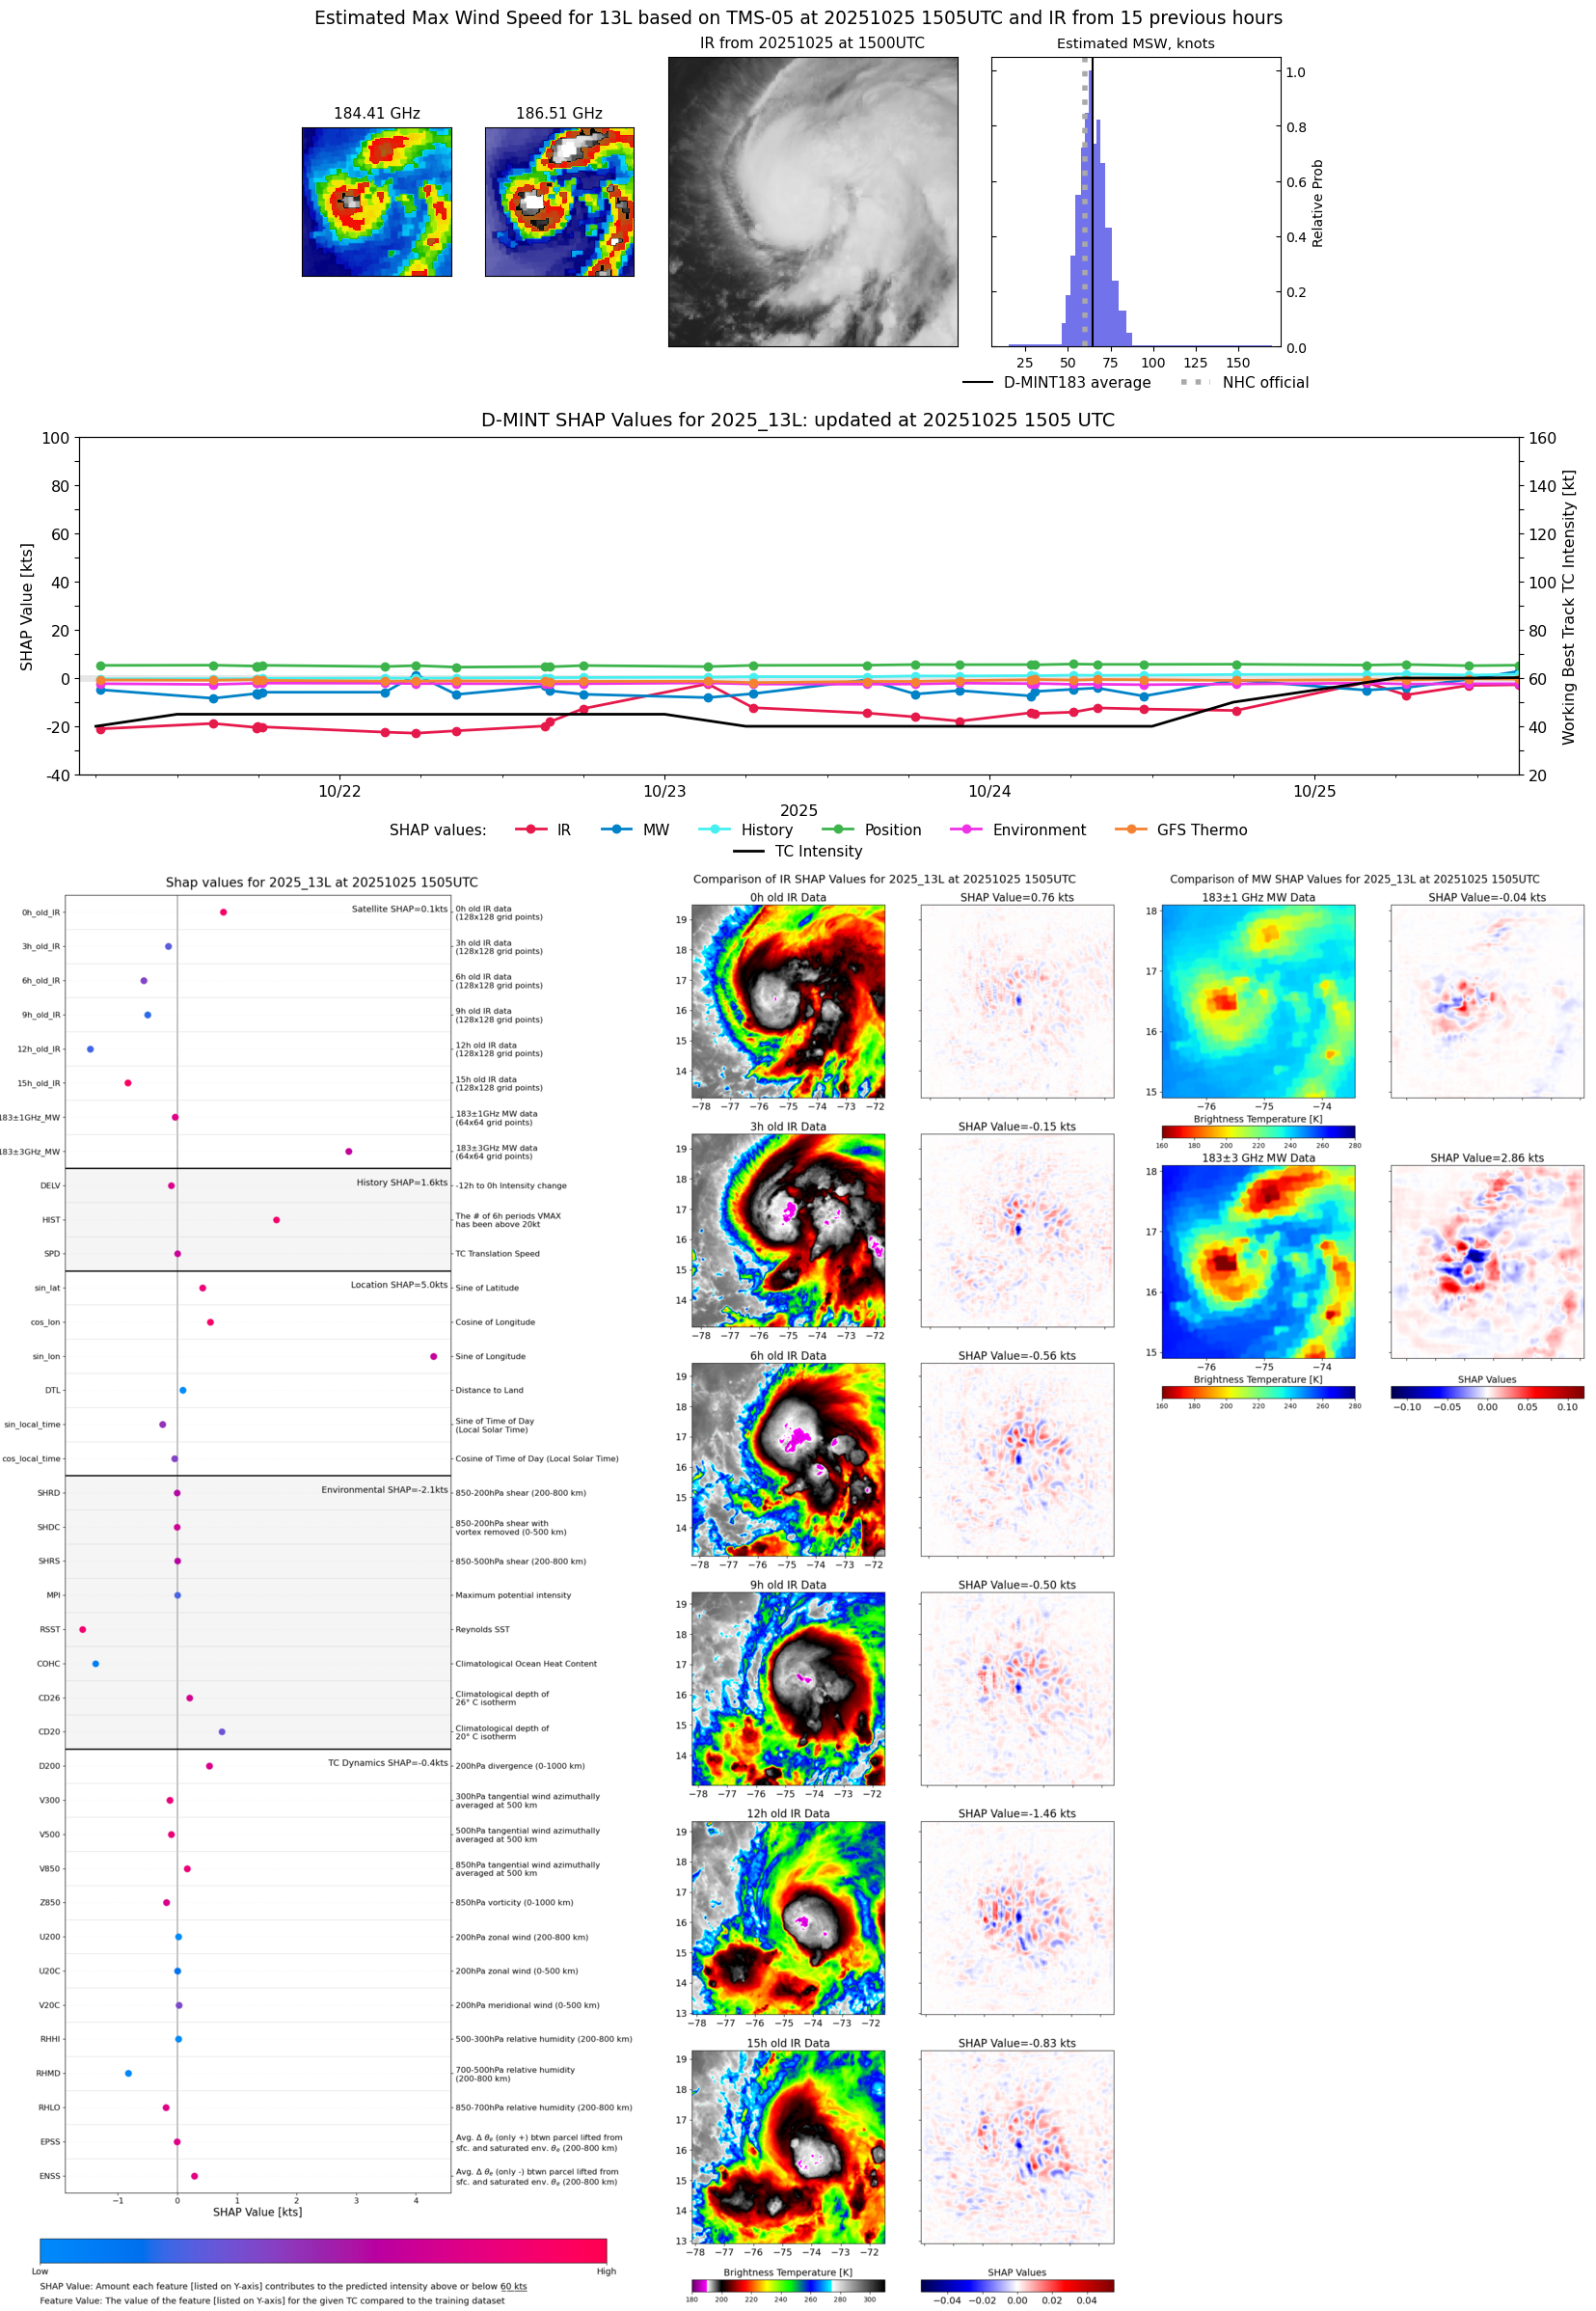 |
| 20251025 | 1124 UTC | TMS07 | 985 hPa | 60 kts | 55 kts | 67 kts | 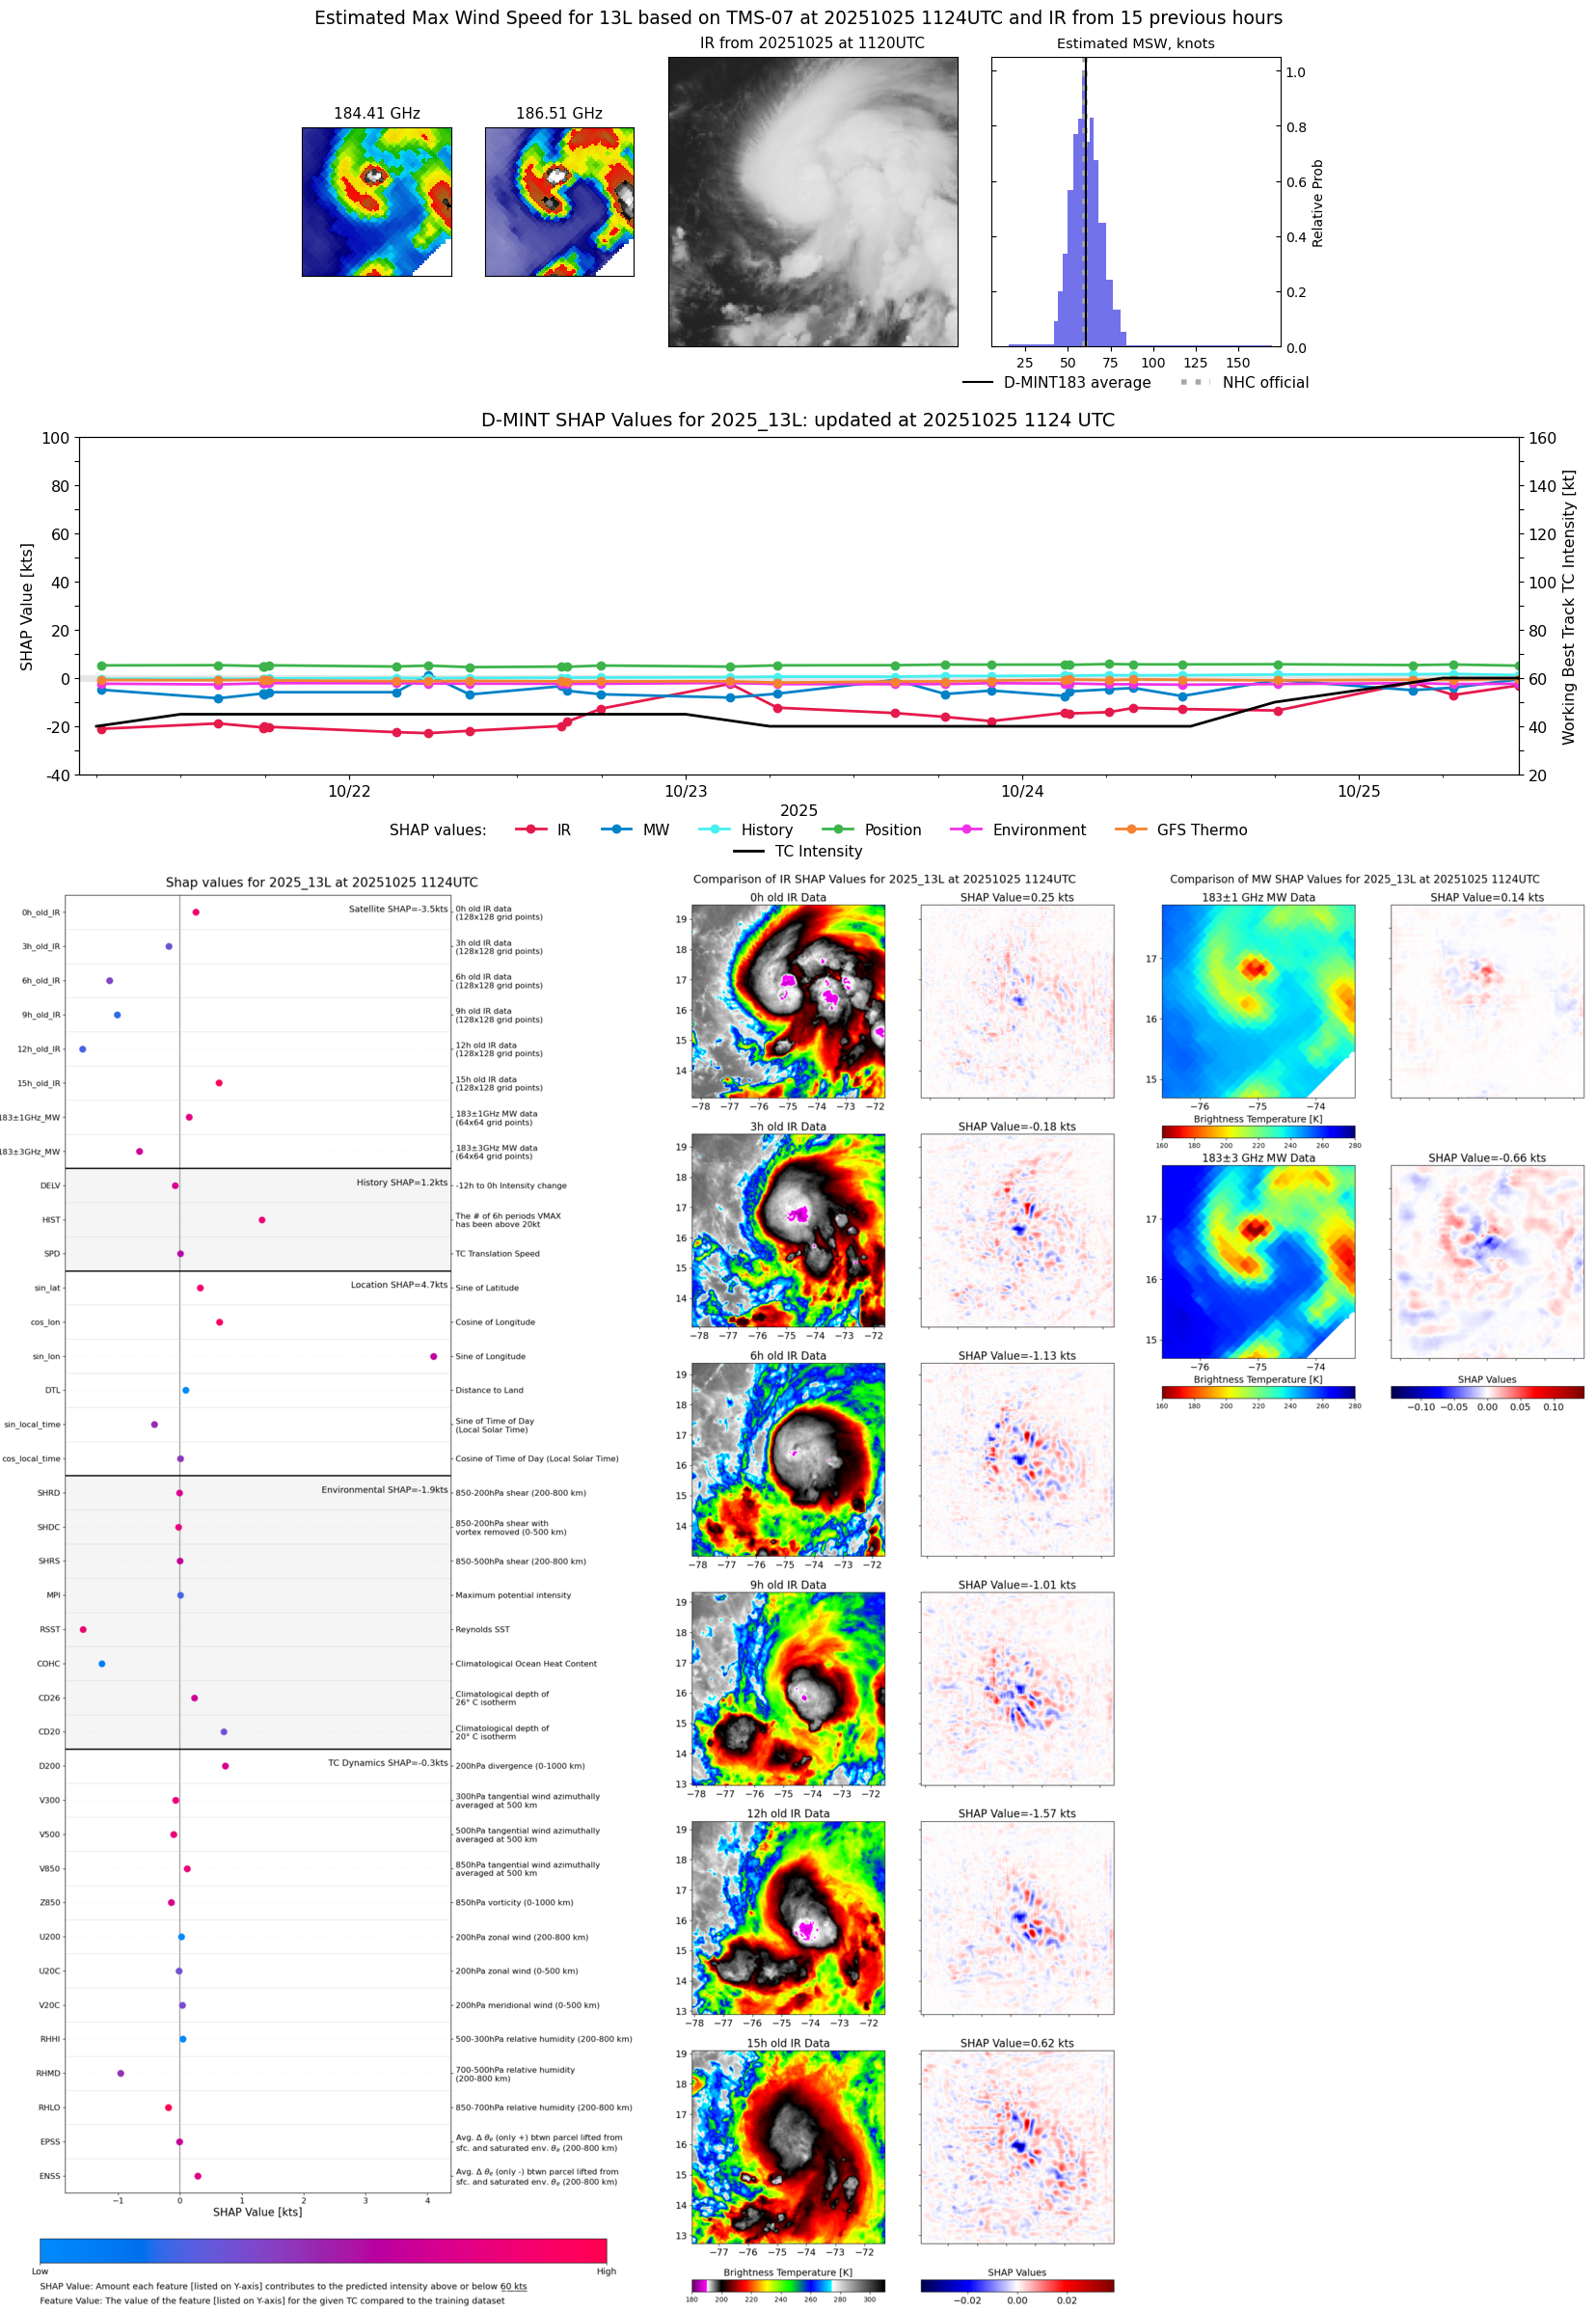 |
| 20251025 | 1050 UTC | WSFM01 | 991 hPa | 67 kts | 60 kts | 74 kts |  |
| 20251025 | 0644 UTC | ATMS-N21 | 995 hPa | 53 kts | 47 kts | 60 kts |  |
| 20251025 | 0628 UTC | AMSR2 | 992 hPa | 62 kts | 56 kts | 69 kts | 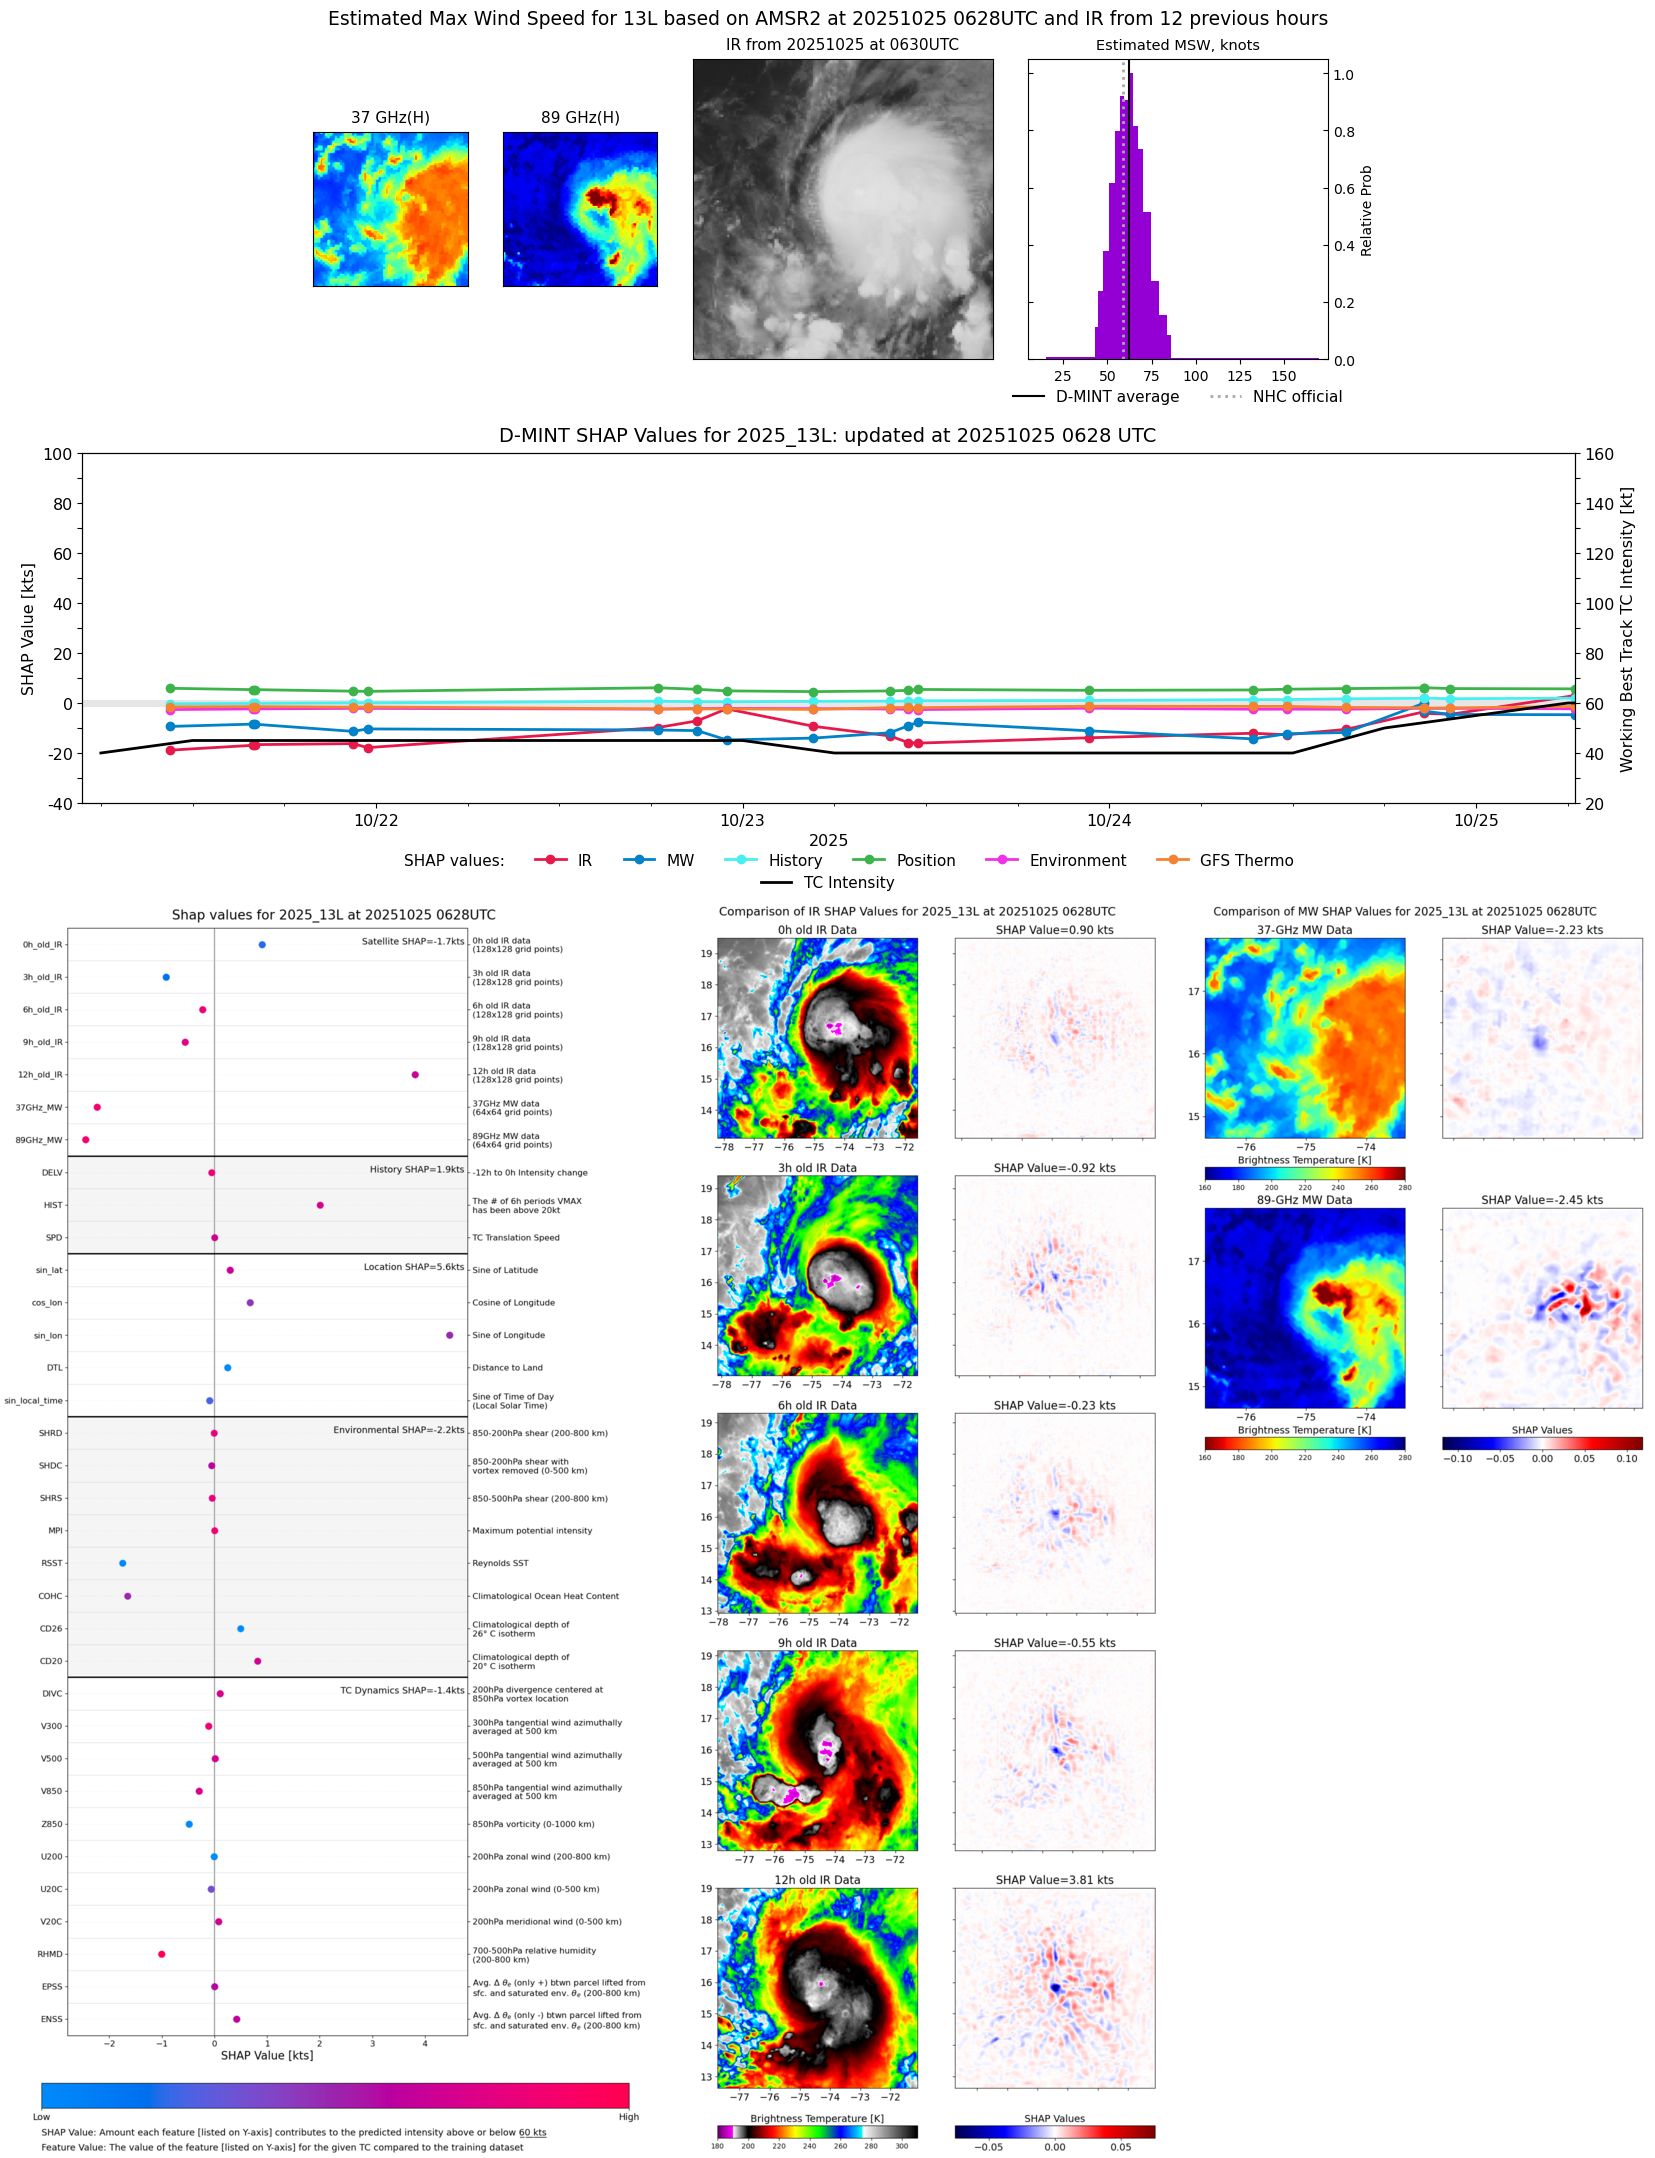 |
| 20251025 | 0349 UTC | TROPICS03 | 992 hPa | 58 kts | 52 kts | 64 kts |  |
| 20251024 | 2219 UTC | WSFM01 | 993 hPa | 54 kts | 48 kts | 60 kts |  |
| 20251024 | 2219 UTC | WSFM01 | 993 hPa | 54 kts | 48 kts | 60 kts |  |
| 20251024 | 2035 UTC | SSMISF18 | 993 hPa | 57 kts | 50 kts | 63 kts | 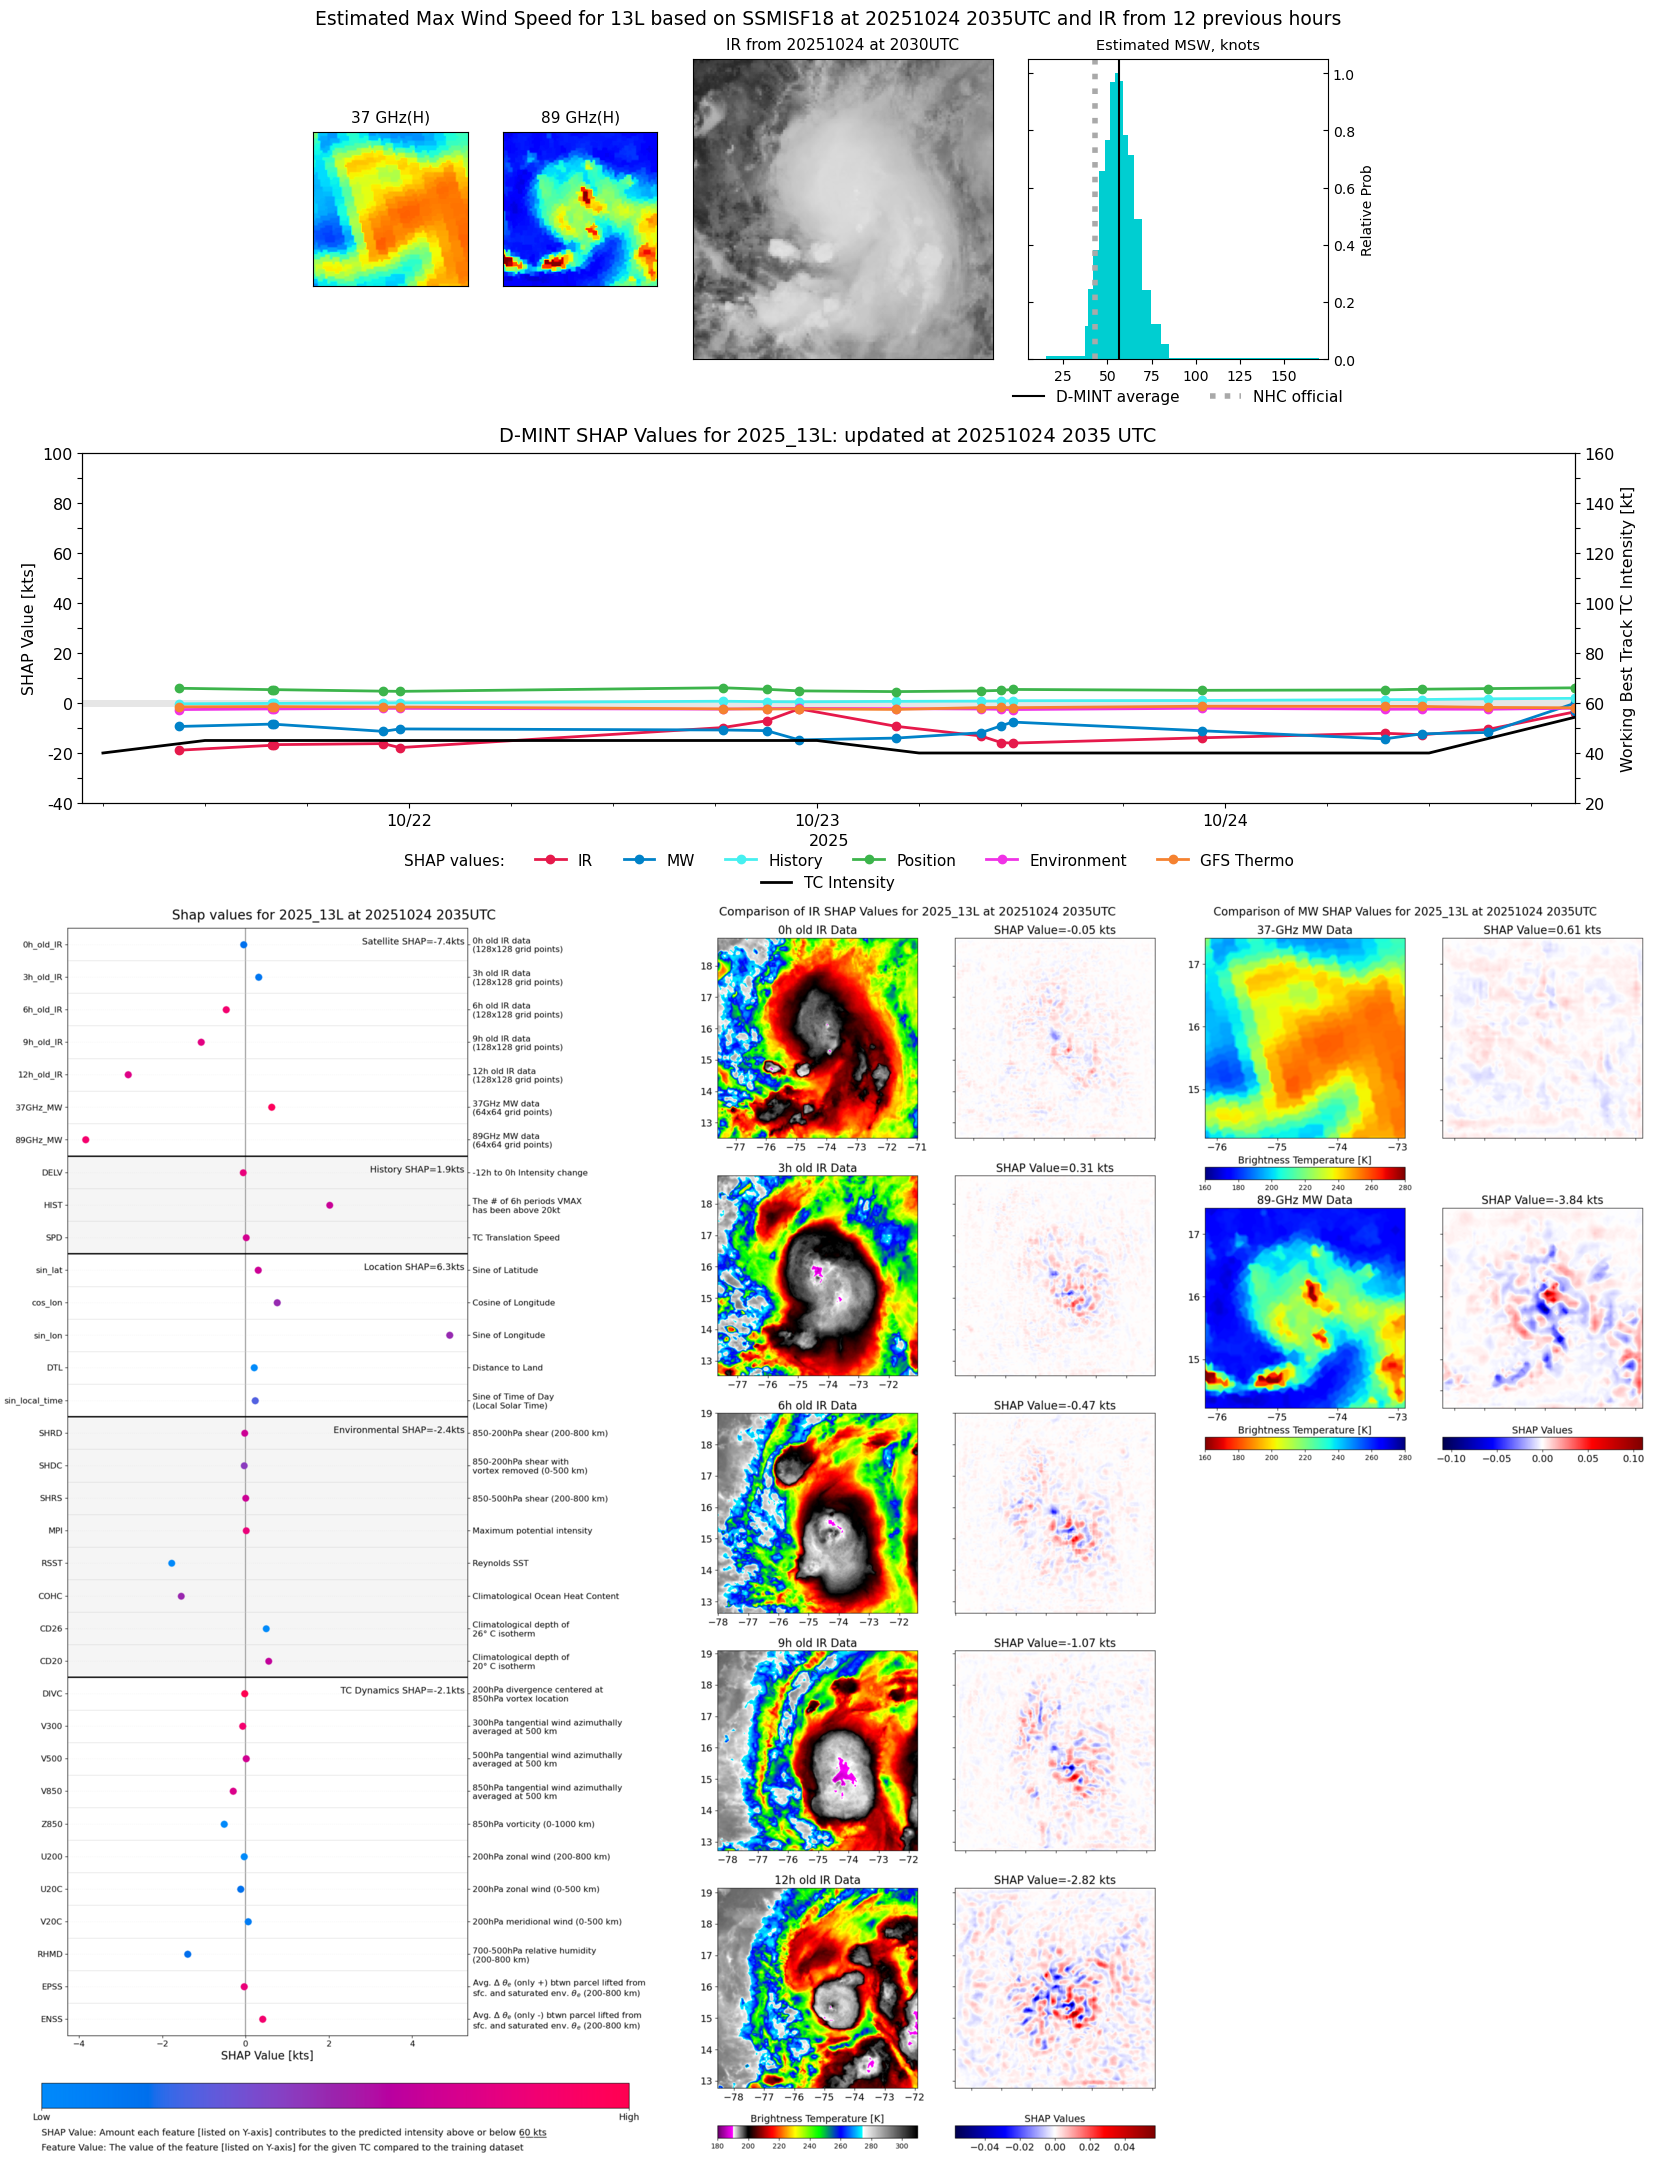 |
| 20251024 | 1815 UTC | AMSR2 | 996 hPa | 49 kts | 44 kts | 55 kts | 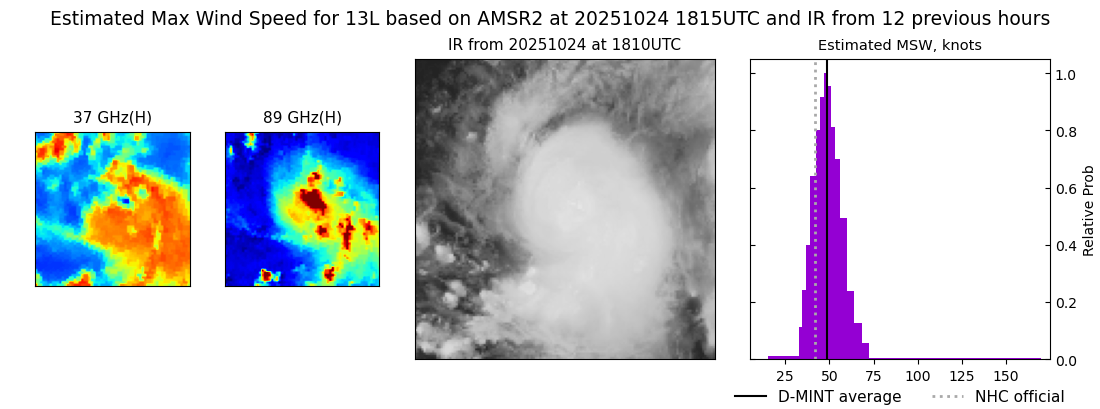 |
| 20251024 | 1812 UTC | ATMS-N21 | 995 hPa | 49 kts | 44 kts | 55 kts |  |
| 20251024 | 1528 UTC | GMI | 999 hPa | 41 kts | 36 kts | 46 kts |  |
| 20251024 | 1136 UTC | SSMISF16 | 1002 hPa | 38 kts | 34 kts | 42 kts | 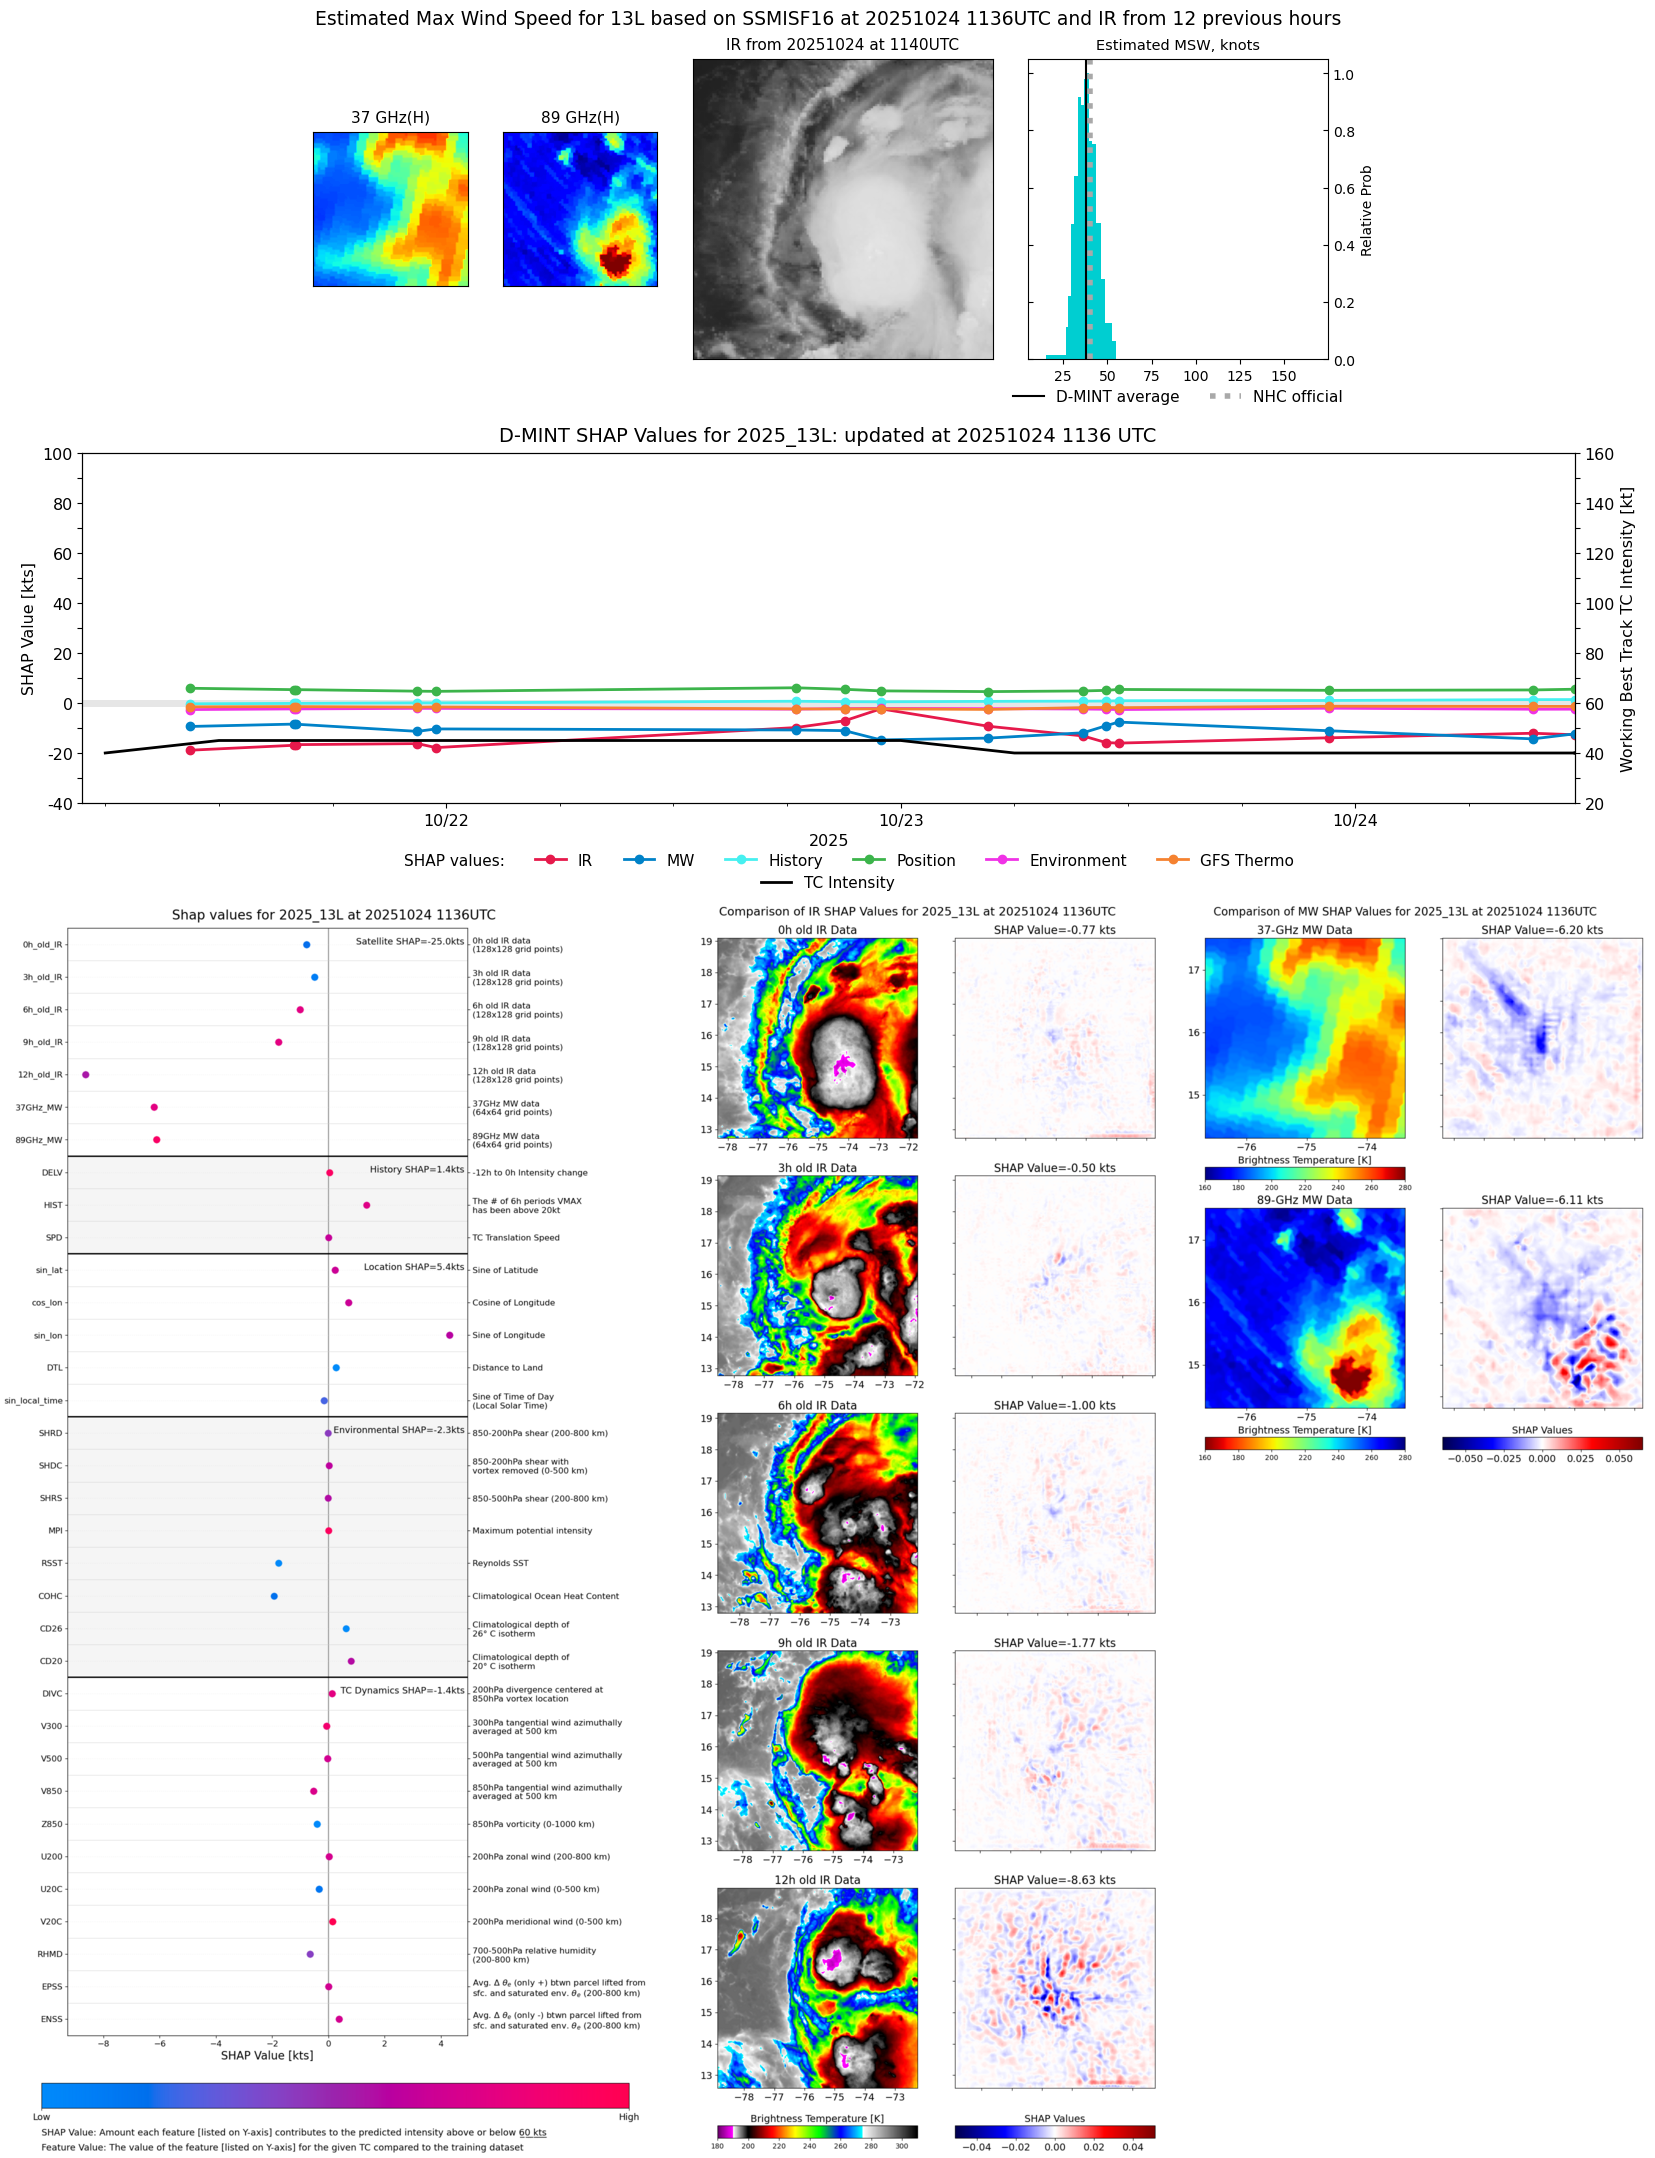 |
| 20251024 | 1123 UTC | TMS07 | 999 hPa | 43 kts | 38 kts | 48 kts |  |
| 20251024 | 1109 UTC | WSFM01 | 1003 hPa | 38 kts | 34 kts | 42 kts |  |
| 20251024 | 1109 UTC | WSFM01 | 1003 hPa | 38 kts | 34 kts | 42 kts |  |
| 20251024 | 0923 UTC | SSMISF18 | 1003 hPa | 36 kts | 33 kts | 41 kts | 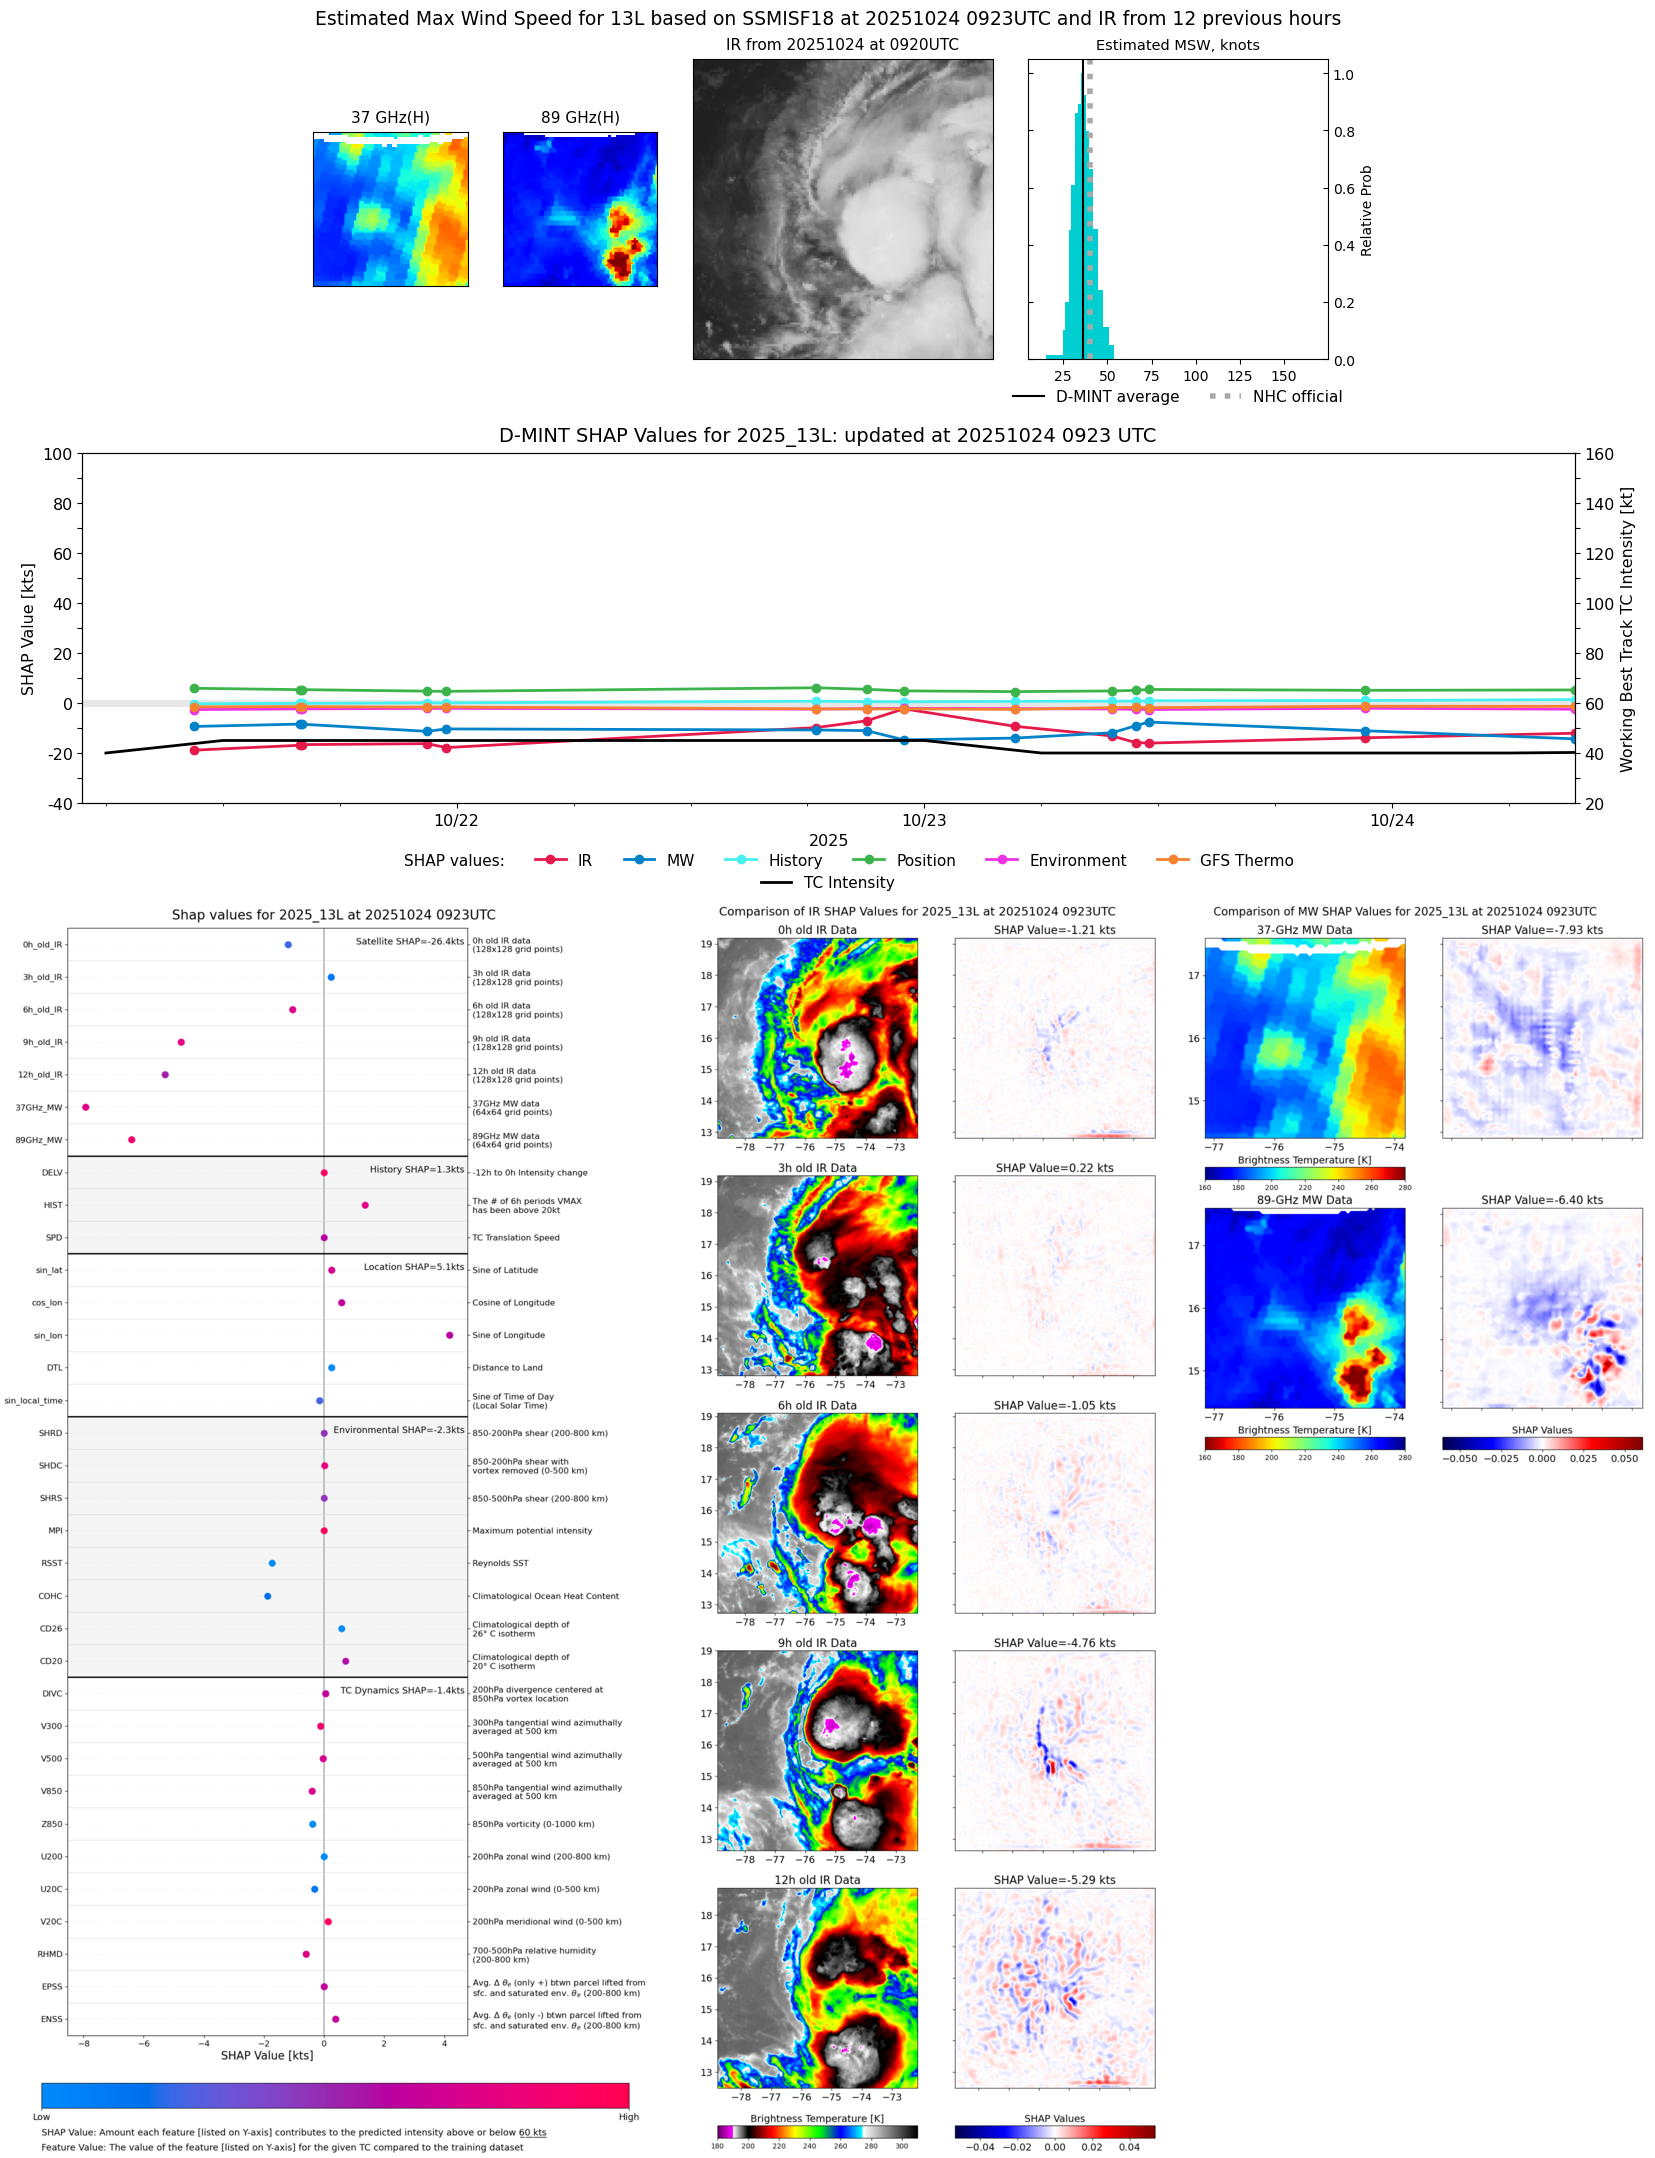 |
| 20251024 | 0756 UTC | TROPICS05 | 998 hPa | 47 kts | 43 kts | 52 kts | 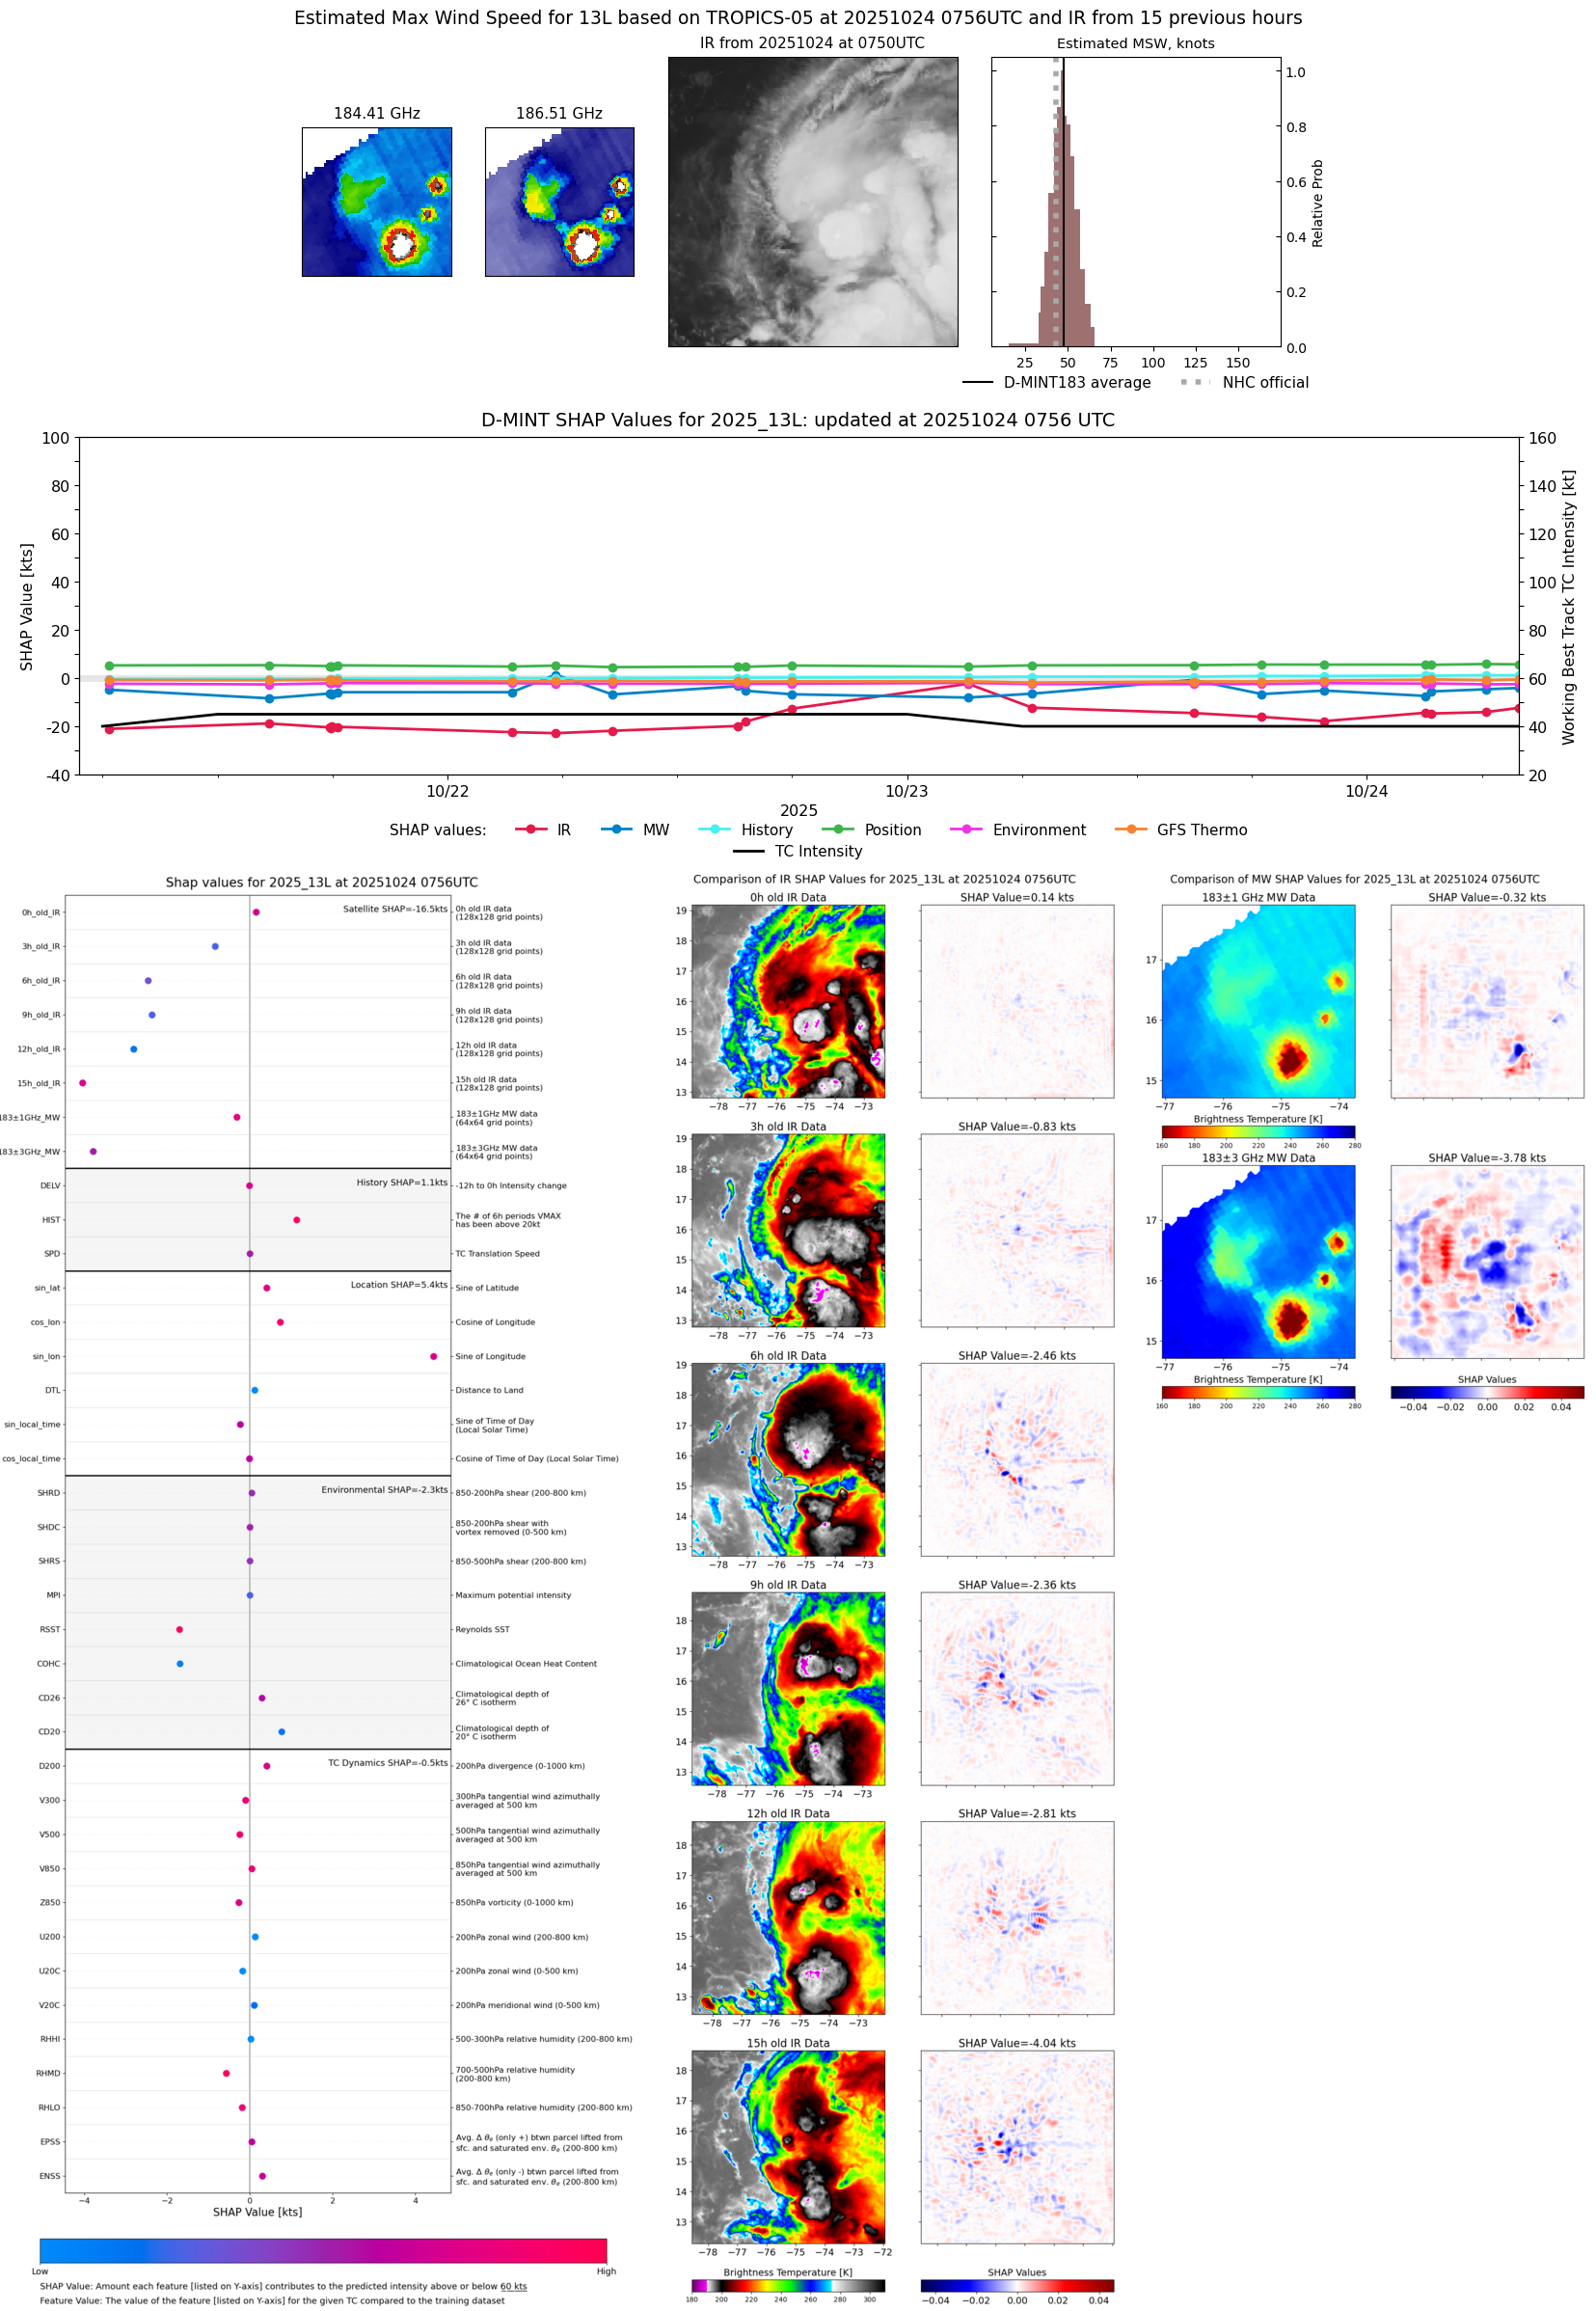 |
| 20251024 | 0612 UTC | ATMS-N20 | 999 hPa | 45 kts | 40 kts | 50 kts |  |
| 20251024 | 0322 UTC | AWS | 1001 hPa | 44 kts | 39 kts | 49 kts | 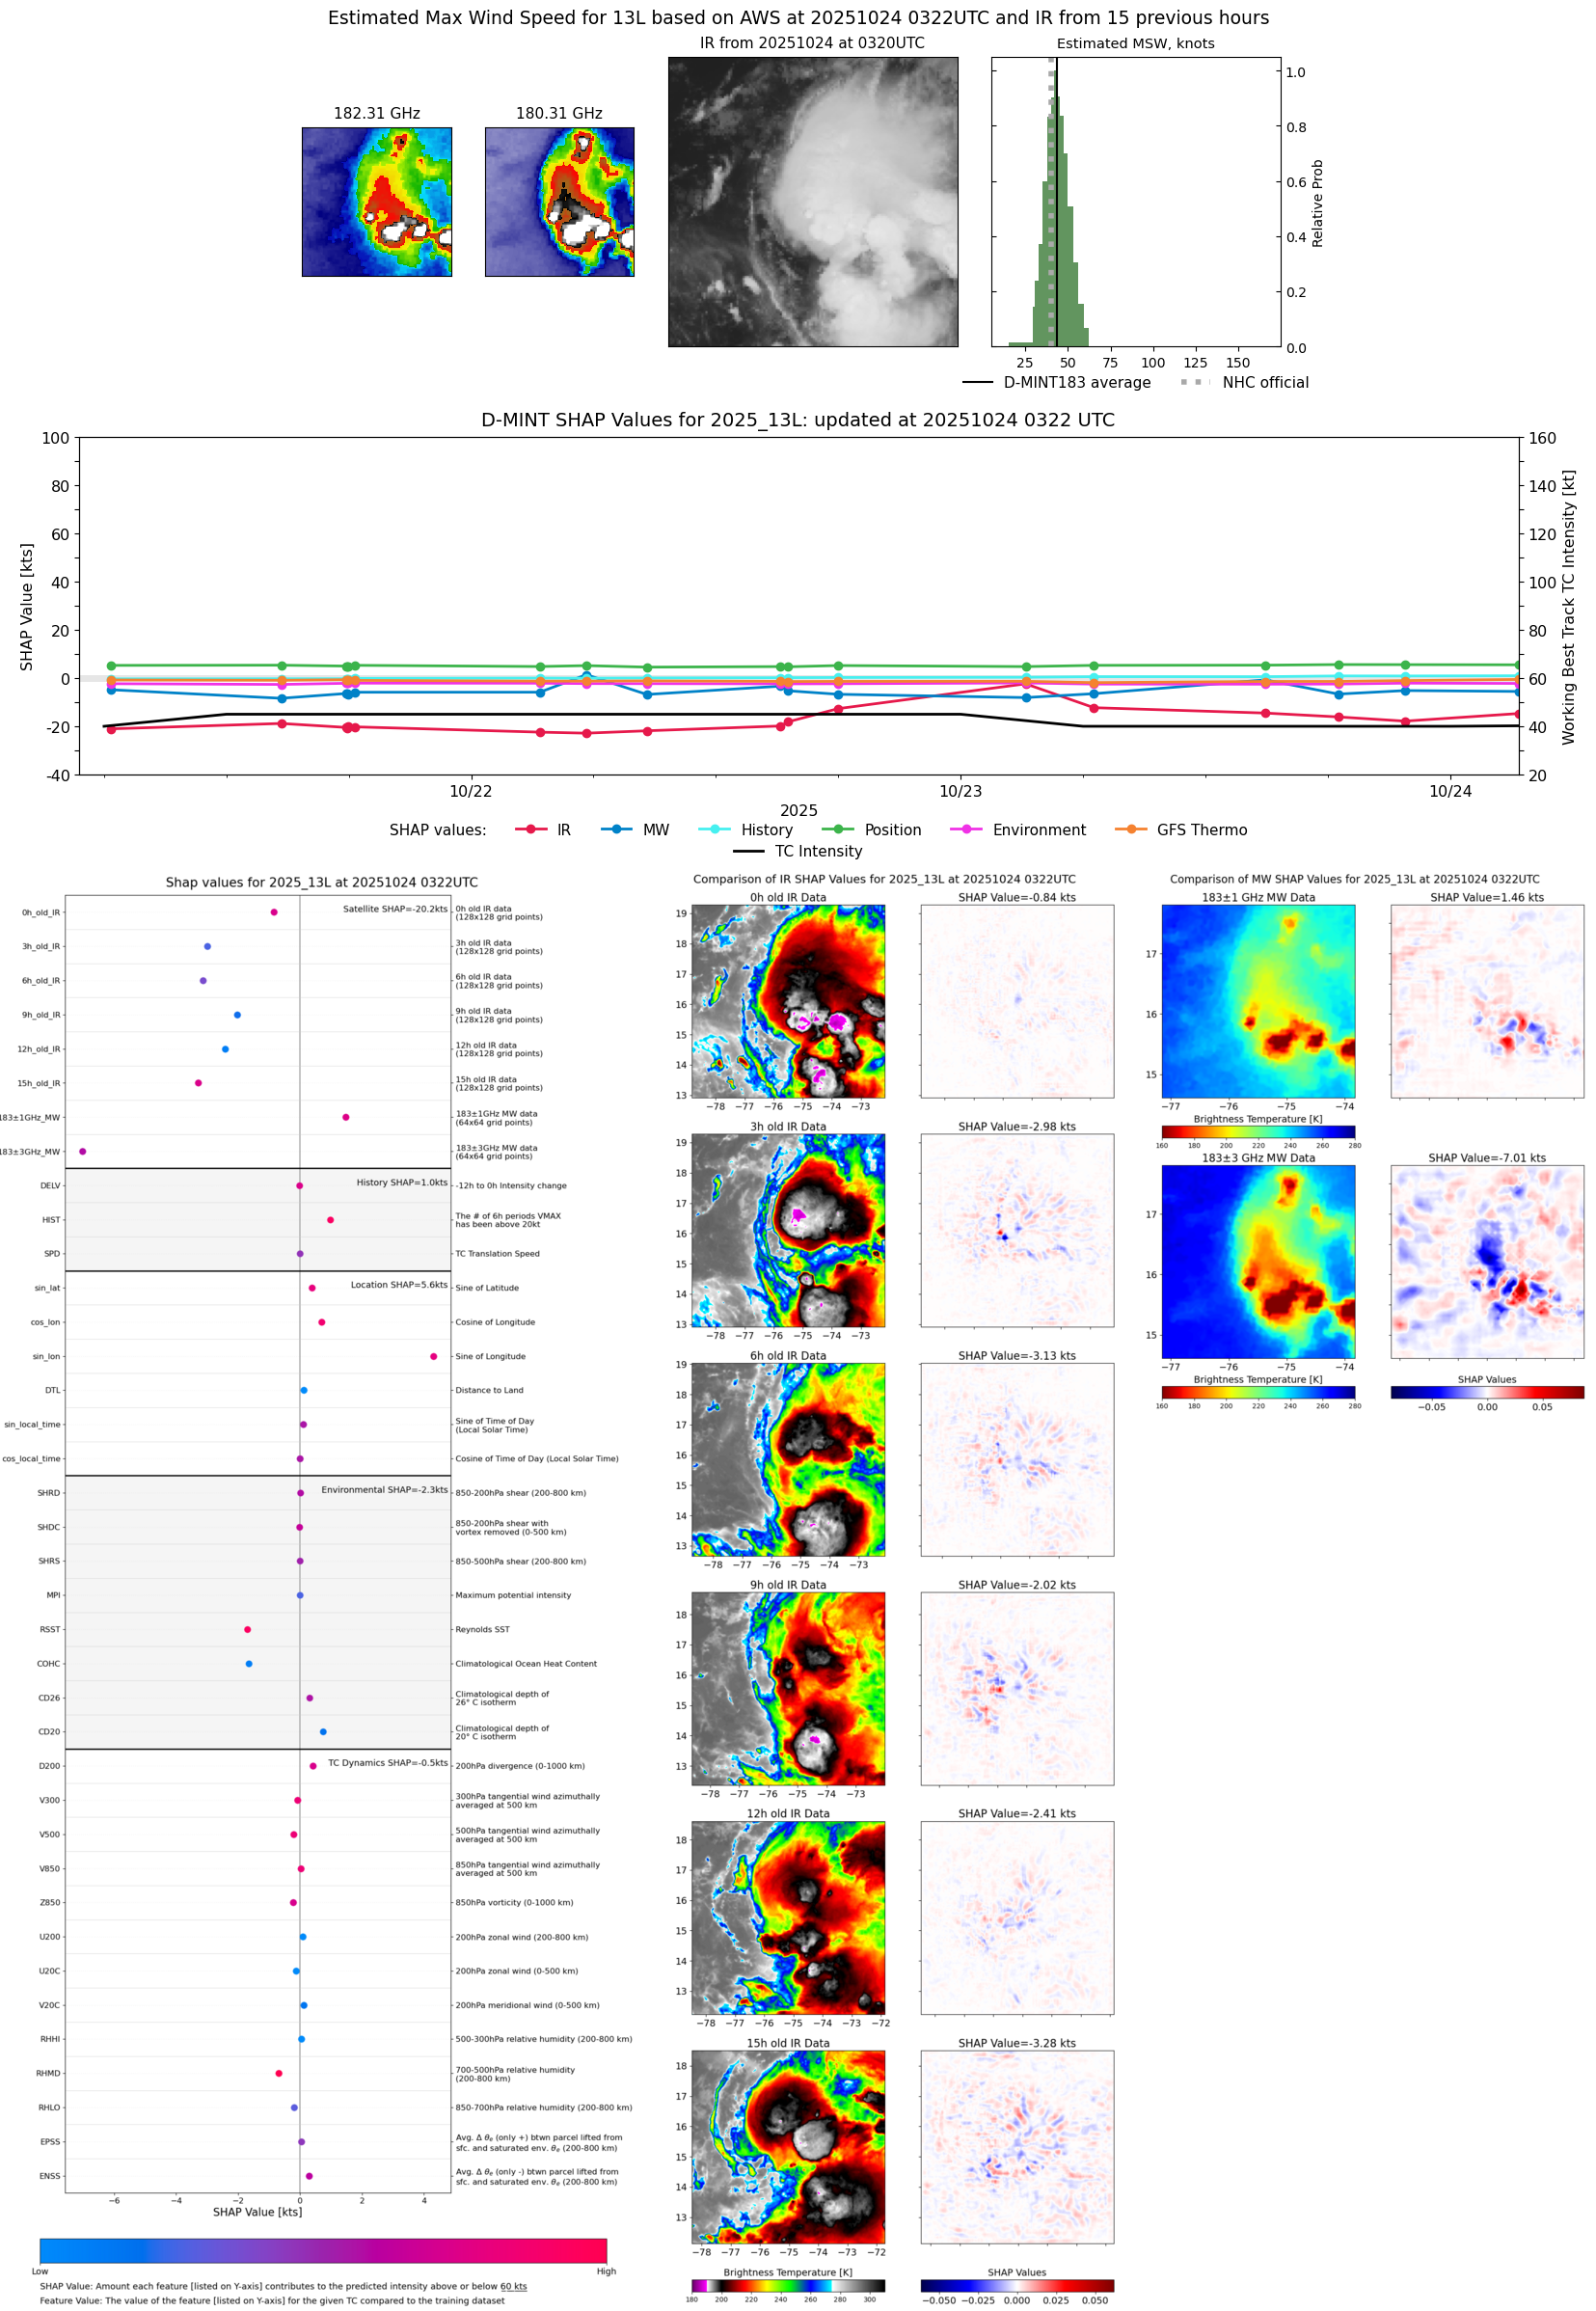 |
| 20251024 | 0303 UTC | TMS05 | 1002 hPa | 42 kts | 37 kts | 47 kts |  |
| 20251023 | 2238 UTC | WSFM01 | 1004 hPa | 38 kts | 34 kts | 43 kts |  |
| 20251023 | 2238 UTC | WSFM01 | 1004 hPa | 38 kts | 34 kts | 43 kts | 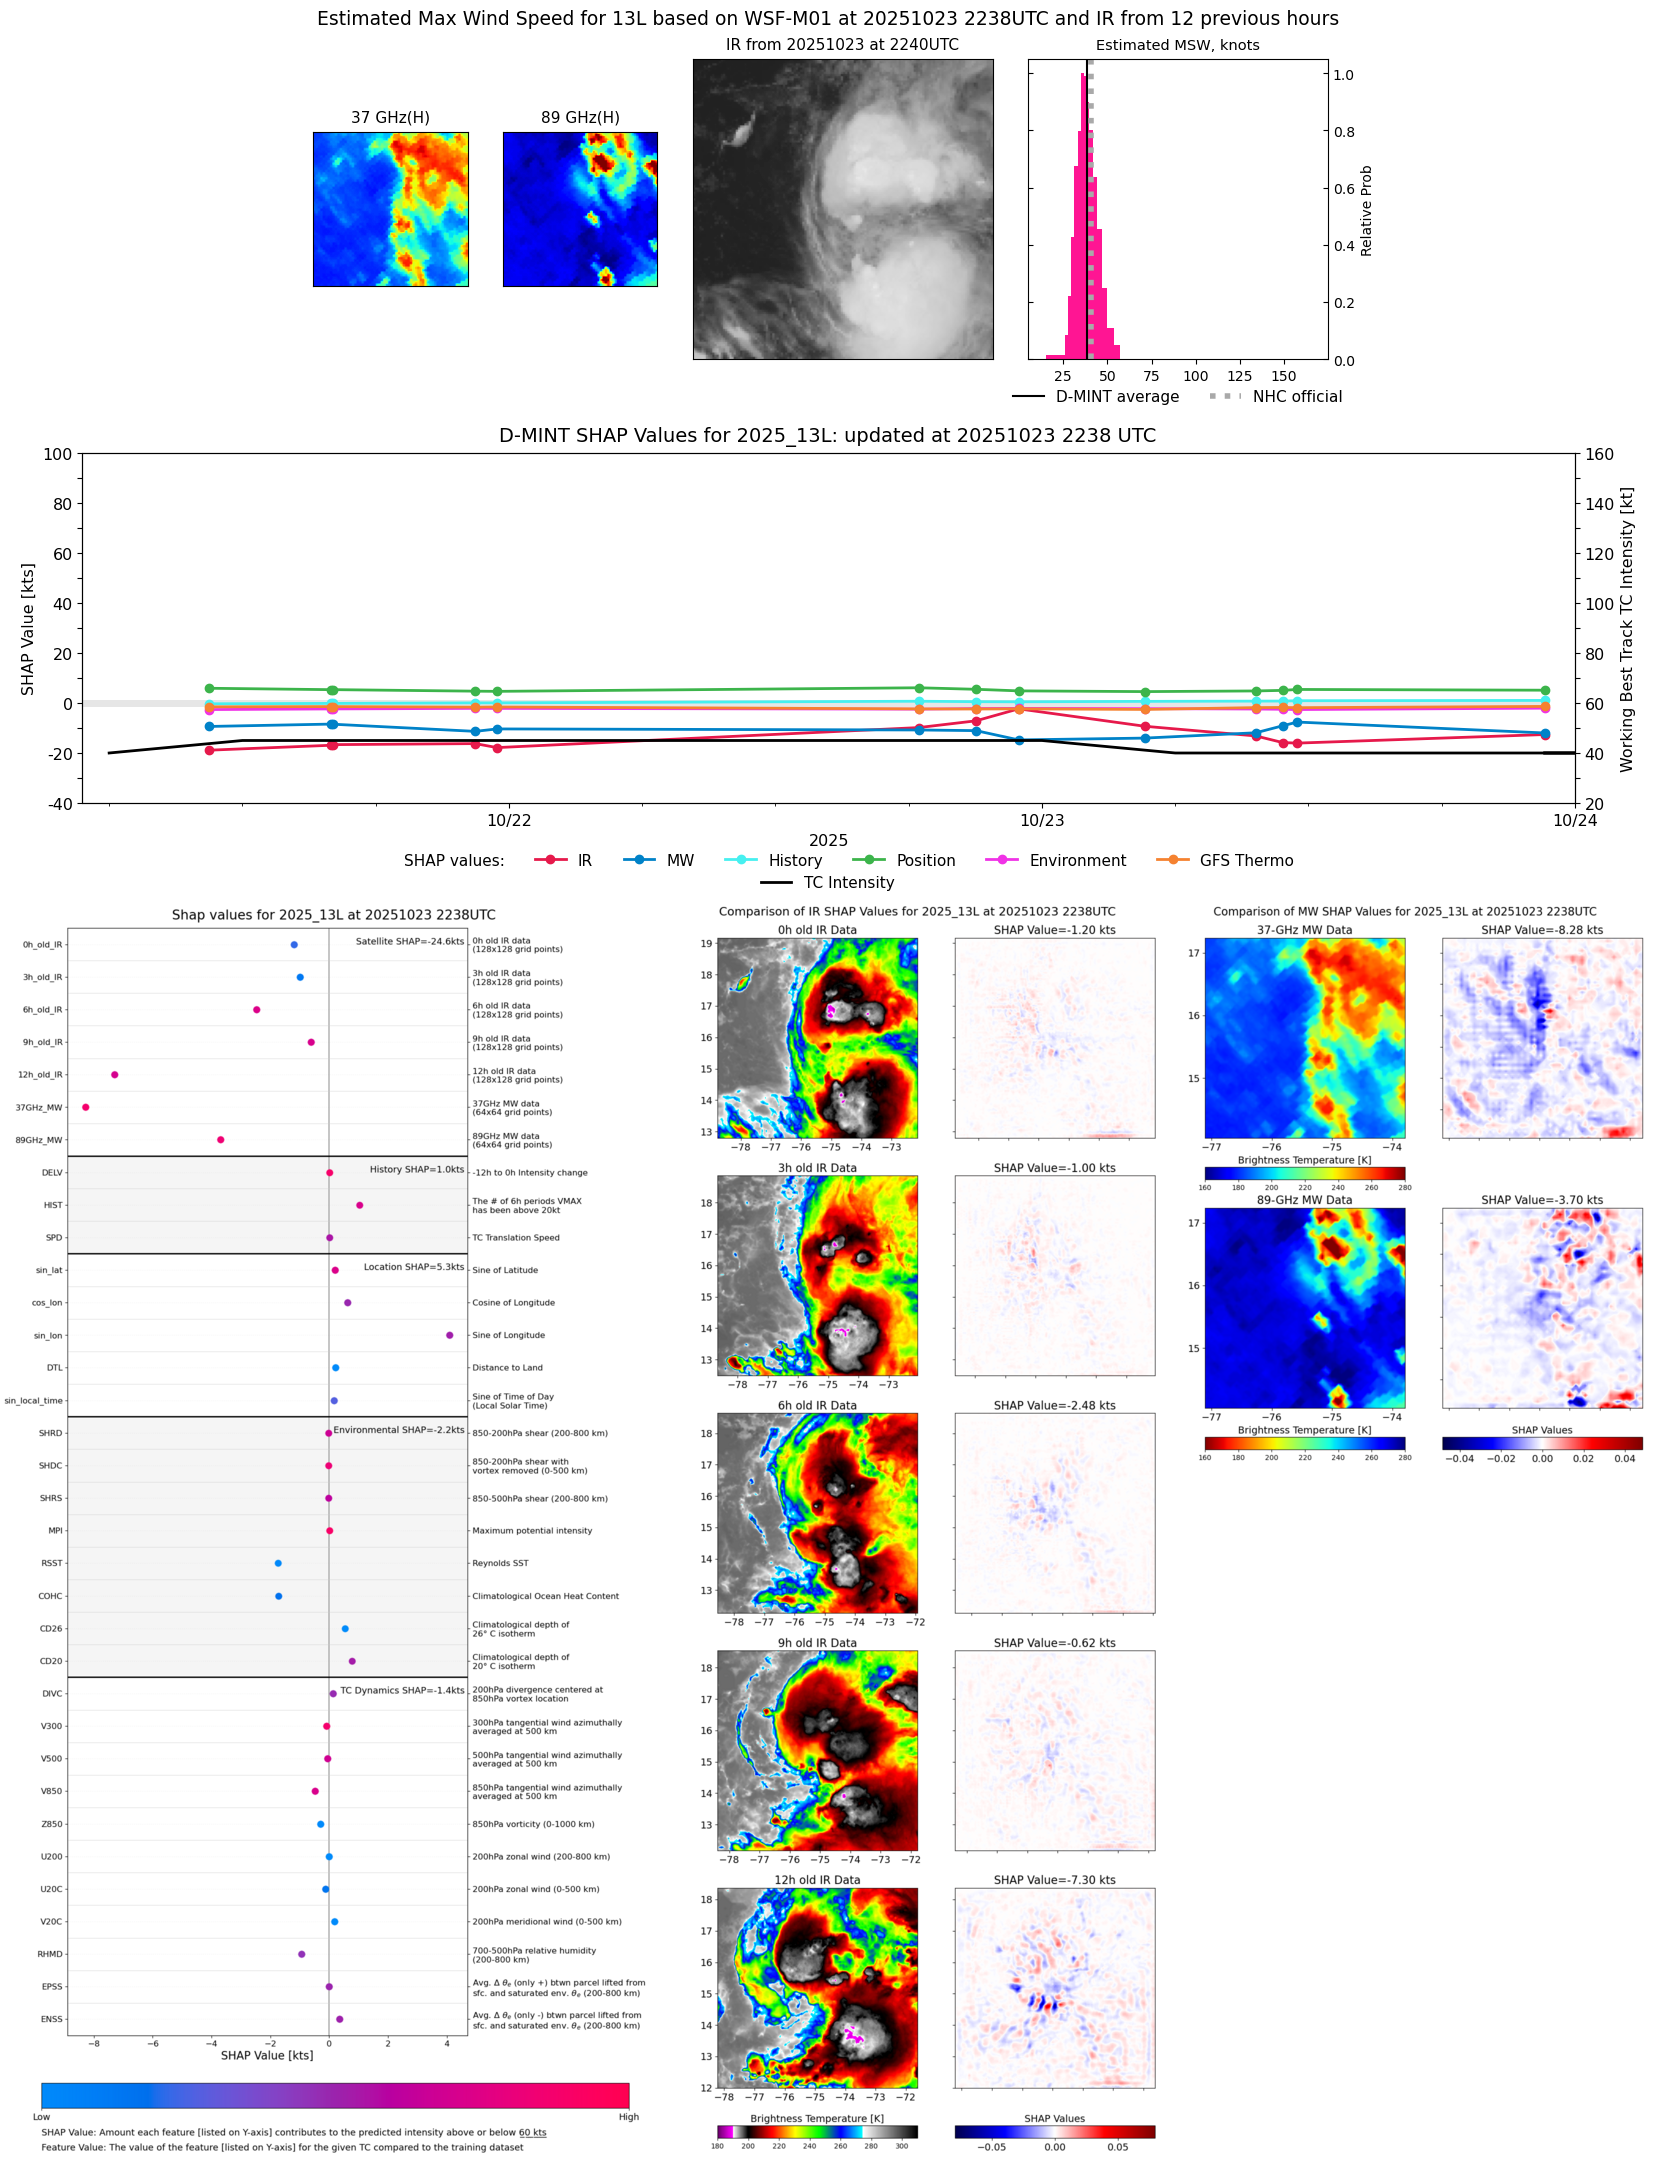 |
| 20251023 | 2147 UTC | TMS07 | 1001 hPa | 40 kts | 36 kts | 45 kts |  |
| 20251023 | 2048 UTC | SSMISF18 | 1003 hPa | 38 kts | 34 kts | 42 kts | 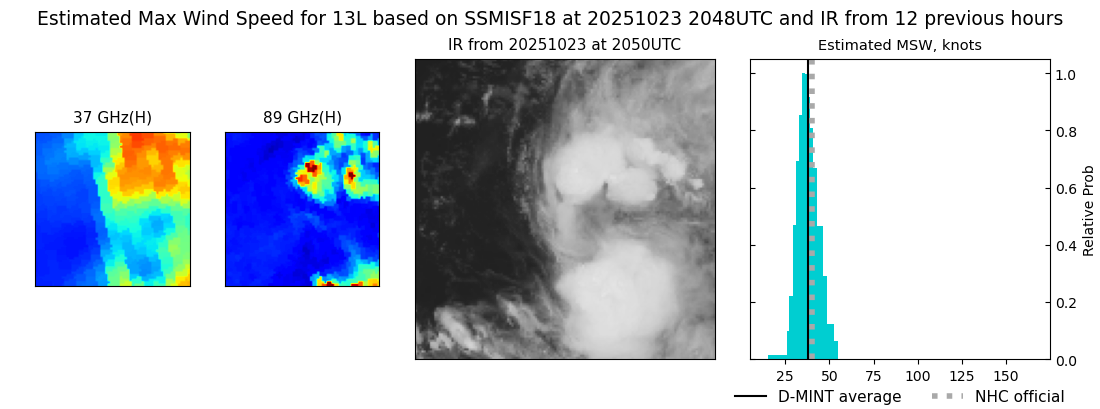 |
| 20251023 | 1831 UTC | ATMS-N21 | 1001 hPa | 40 kts | 36 kts | 44 kts | 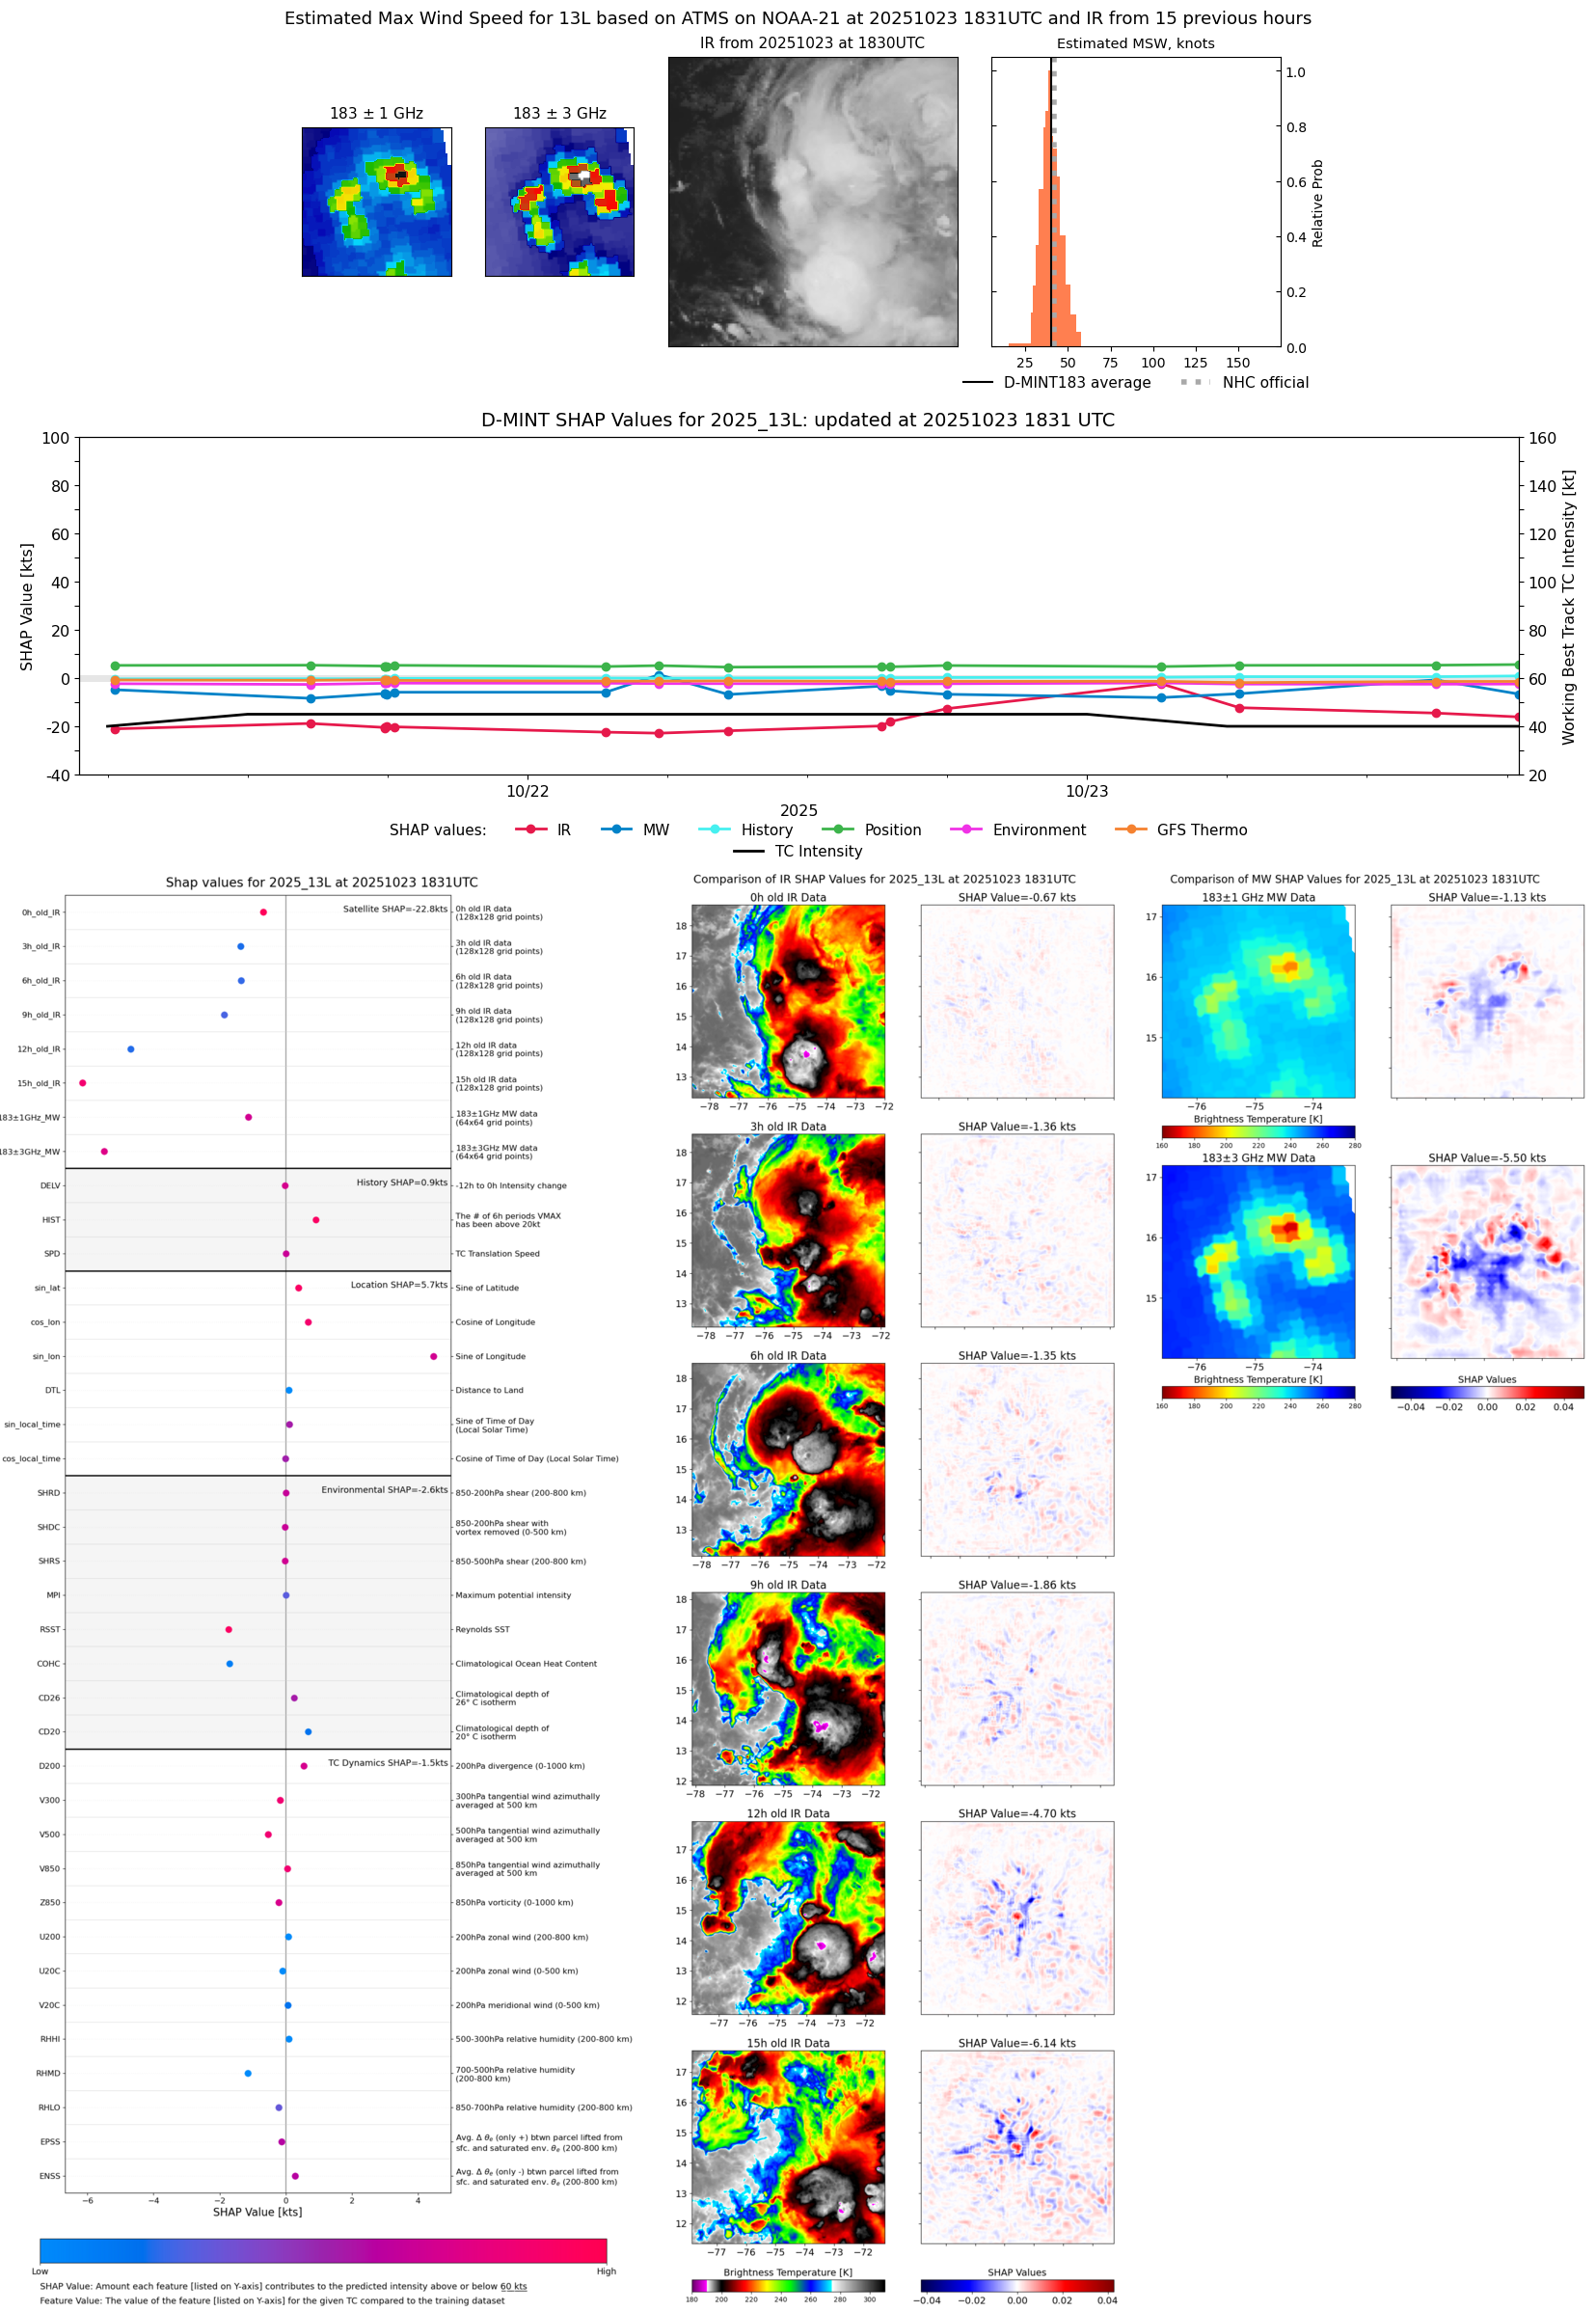 |
| 20251023 | 1457 UTC | TMS06 | 1000 hPa | 47 kts | 43 kts | 51 kts | 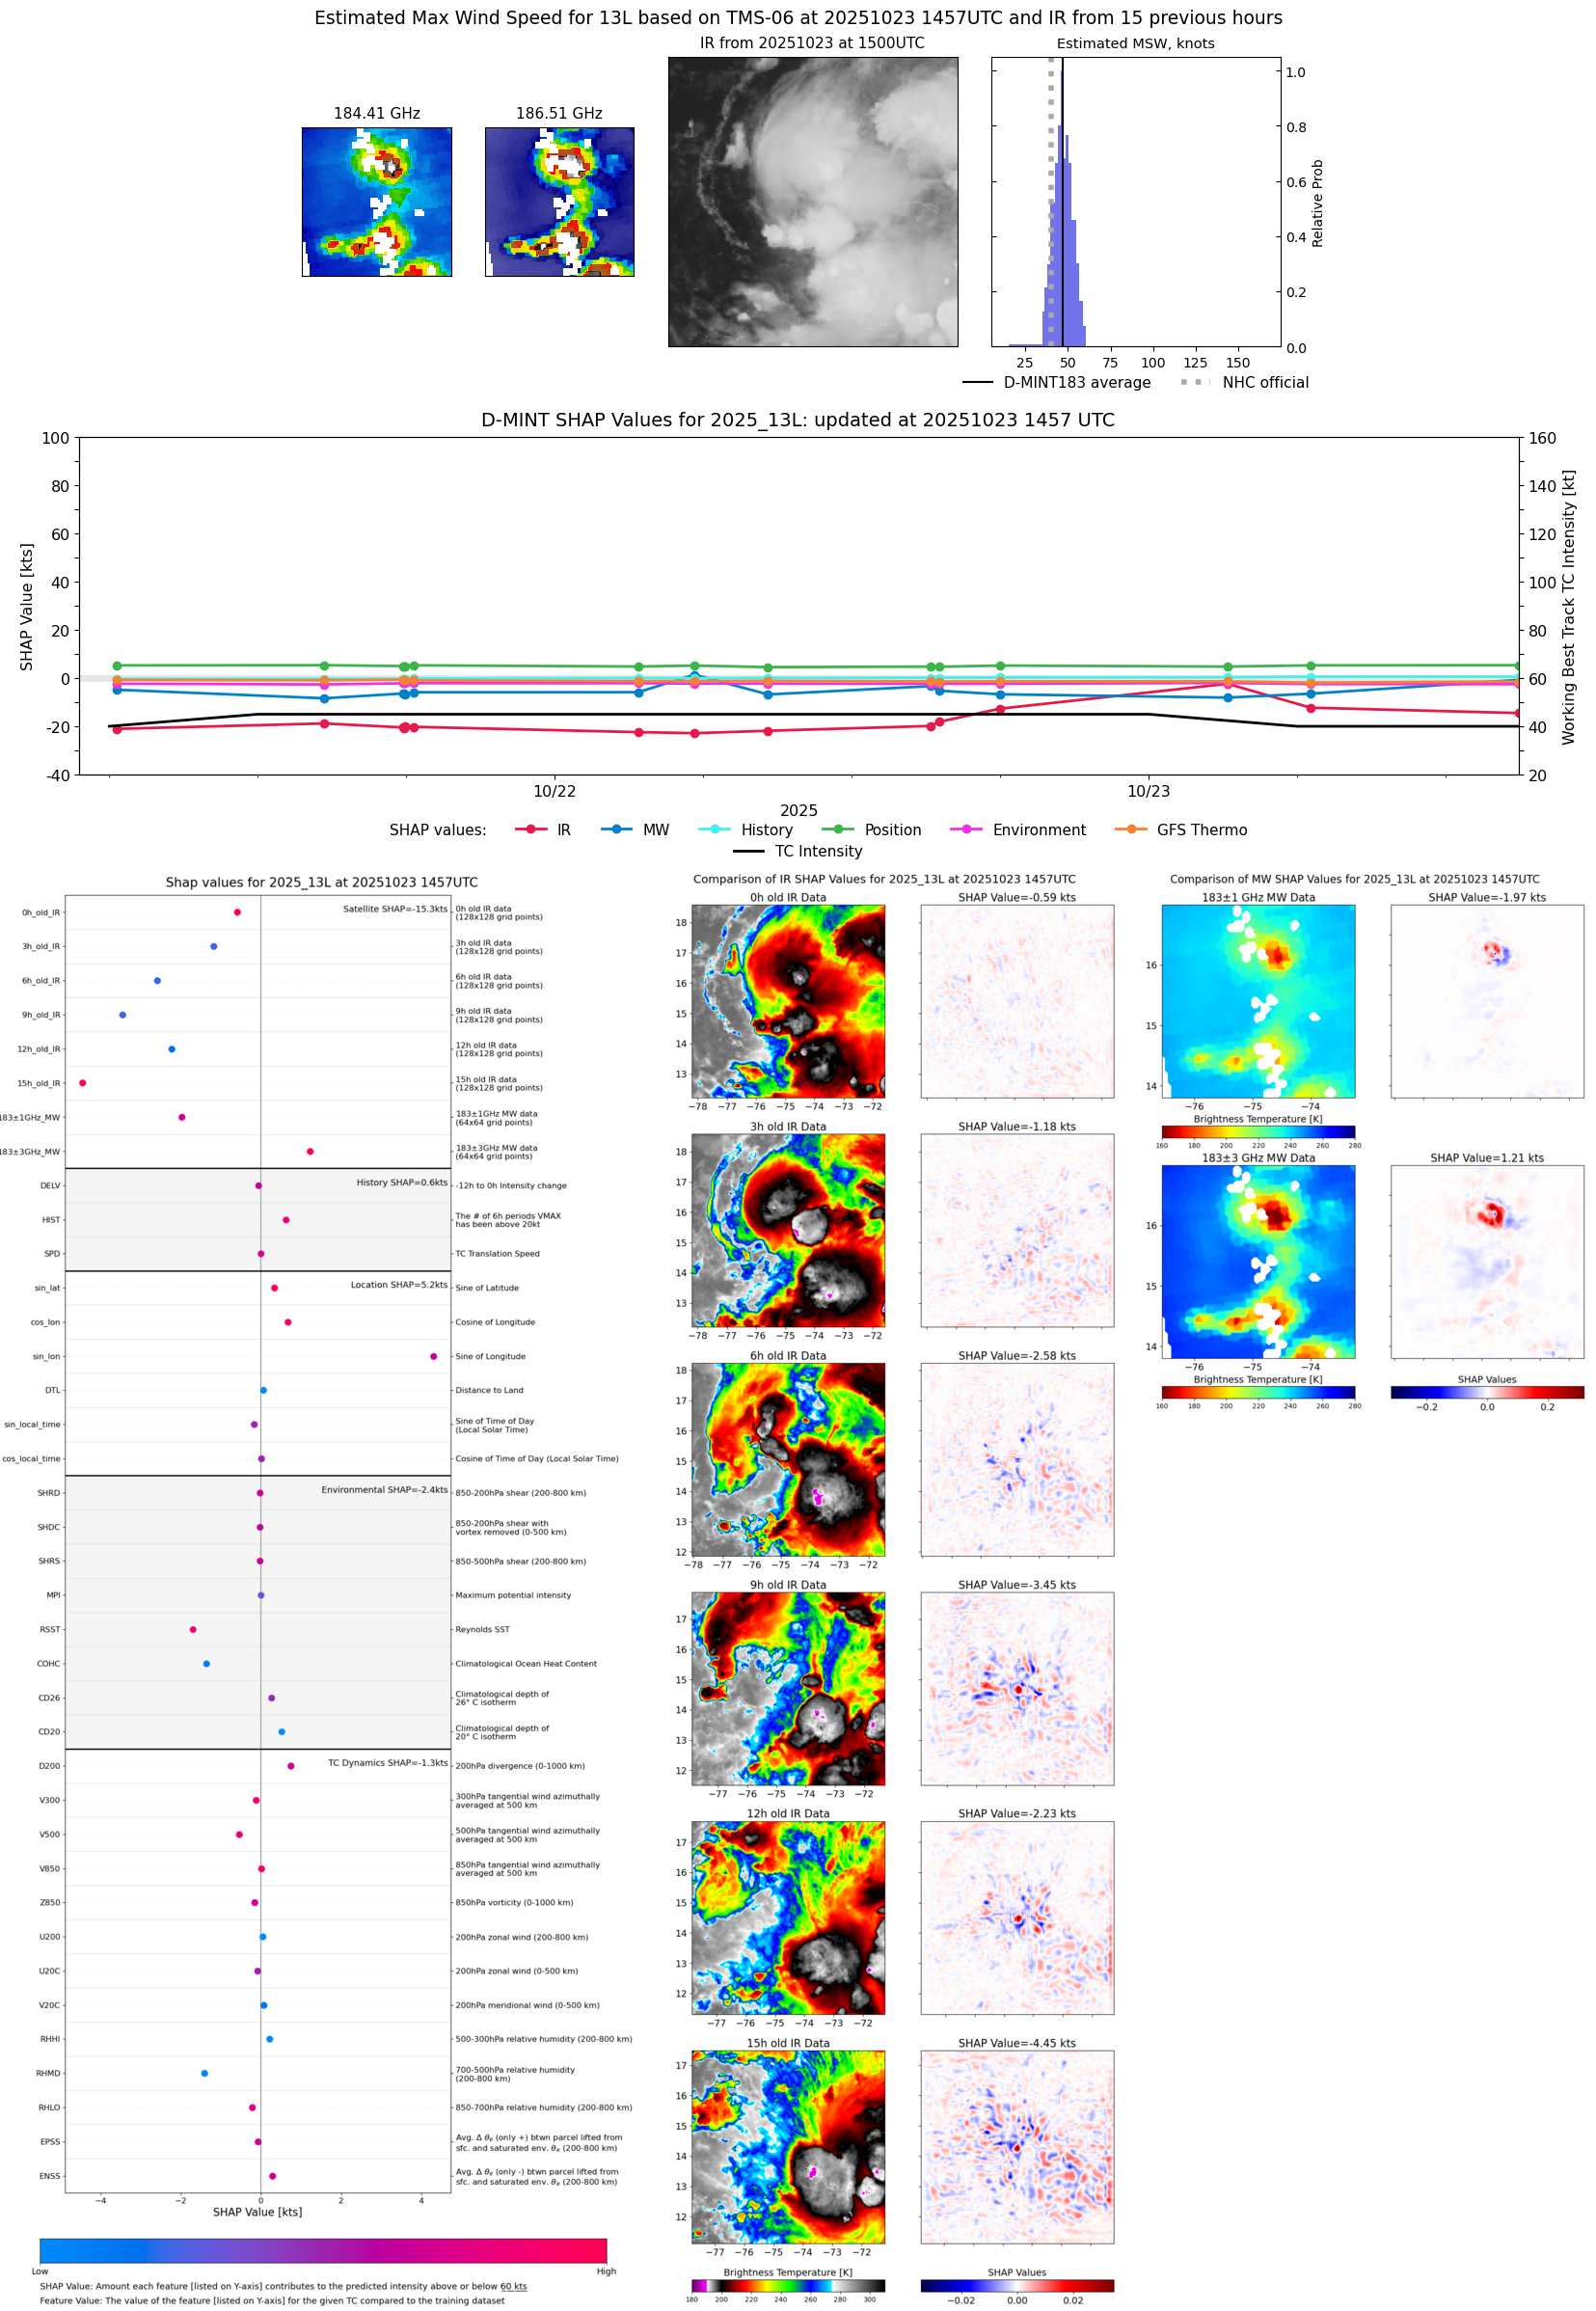 |
| 20251023 | 1150 UTC | SSMISF16 | 1000 hPa | 39 kts | 35 kts | 43 kts | 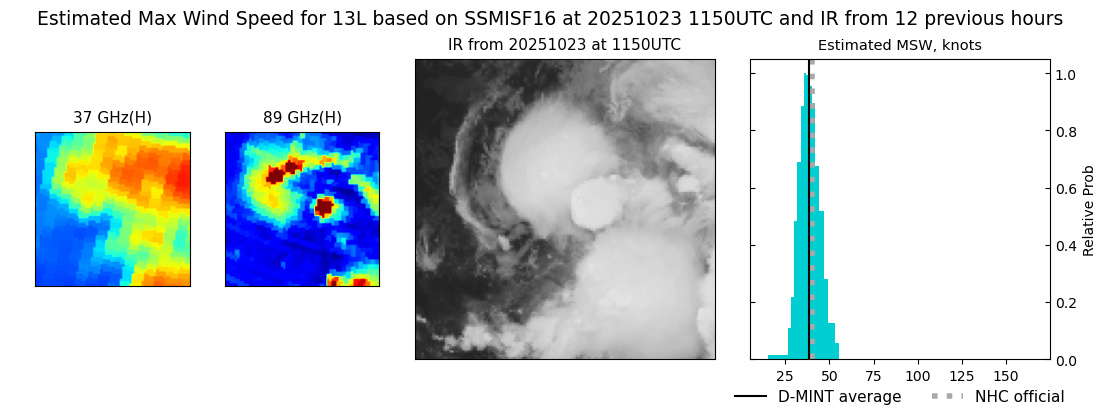 |
| 20251023 | 1130 UTC | WSFM01 | 1000 hPa | 38 kts | 34 kts | 42 kts |  |
| 20251023 | 1050 UTC | SSMISF17 | 1000 hPa | 37 kts | 33 kts | 41 kts |  |
| 20251023 | 0938 UTC | SSMISF18 | 1001 hPa | 36 kts | 33 kts | 40 kts | 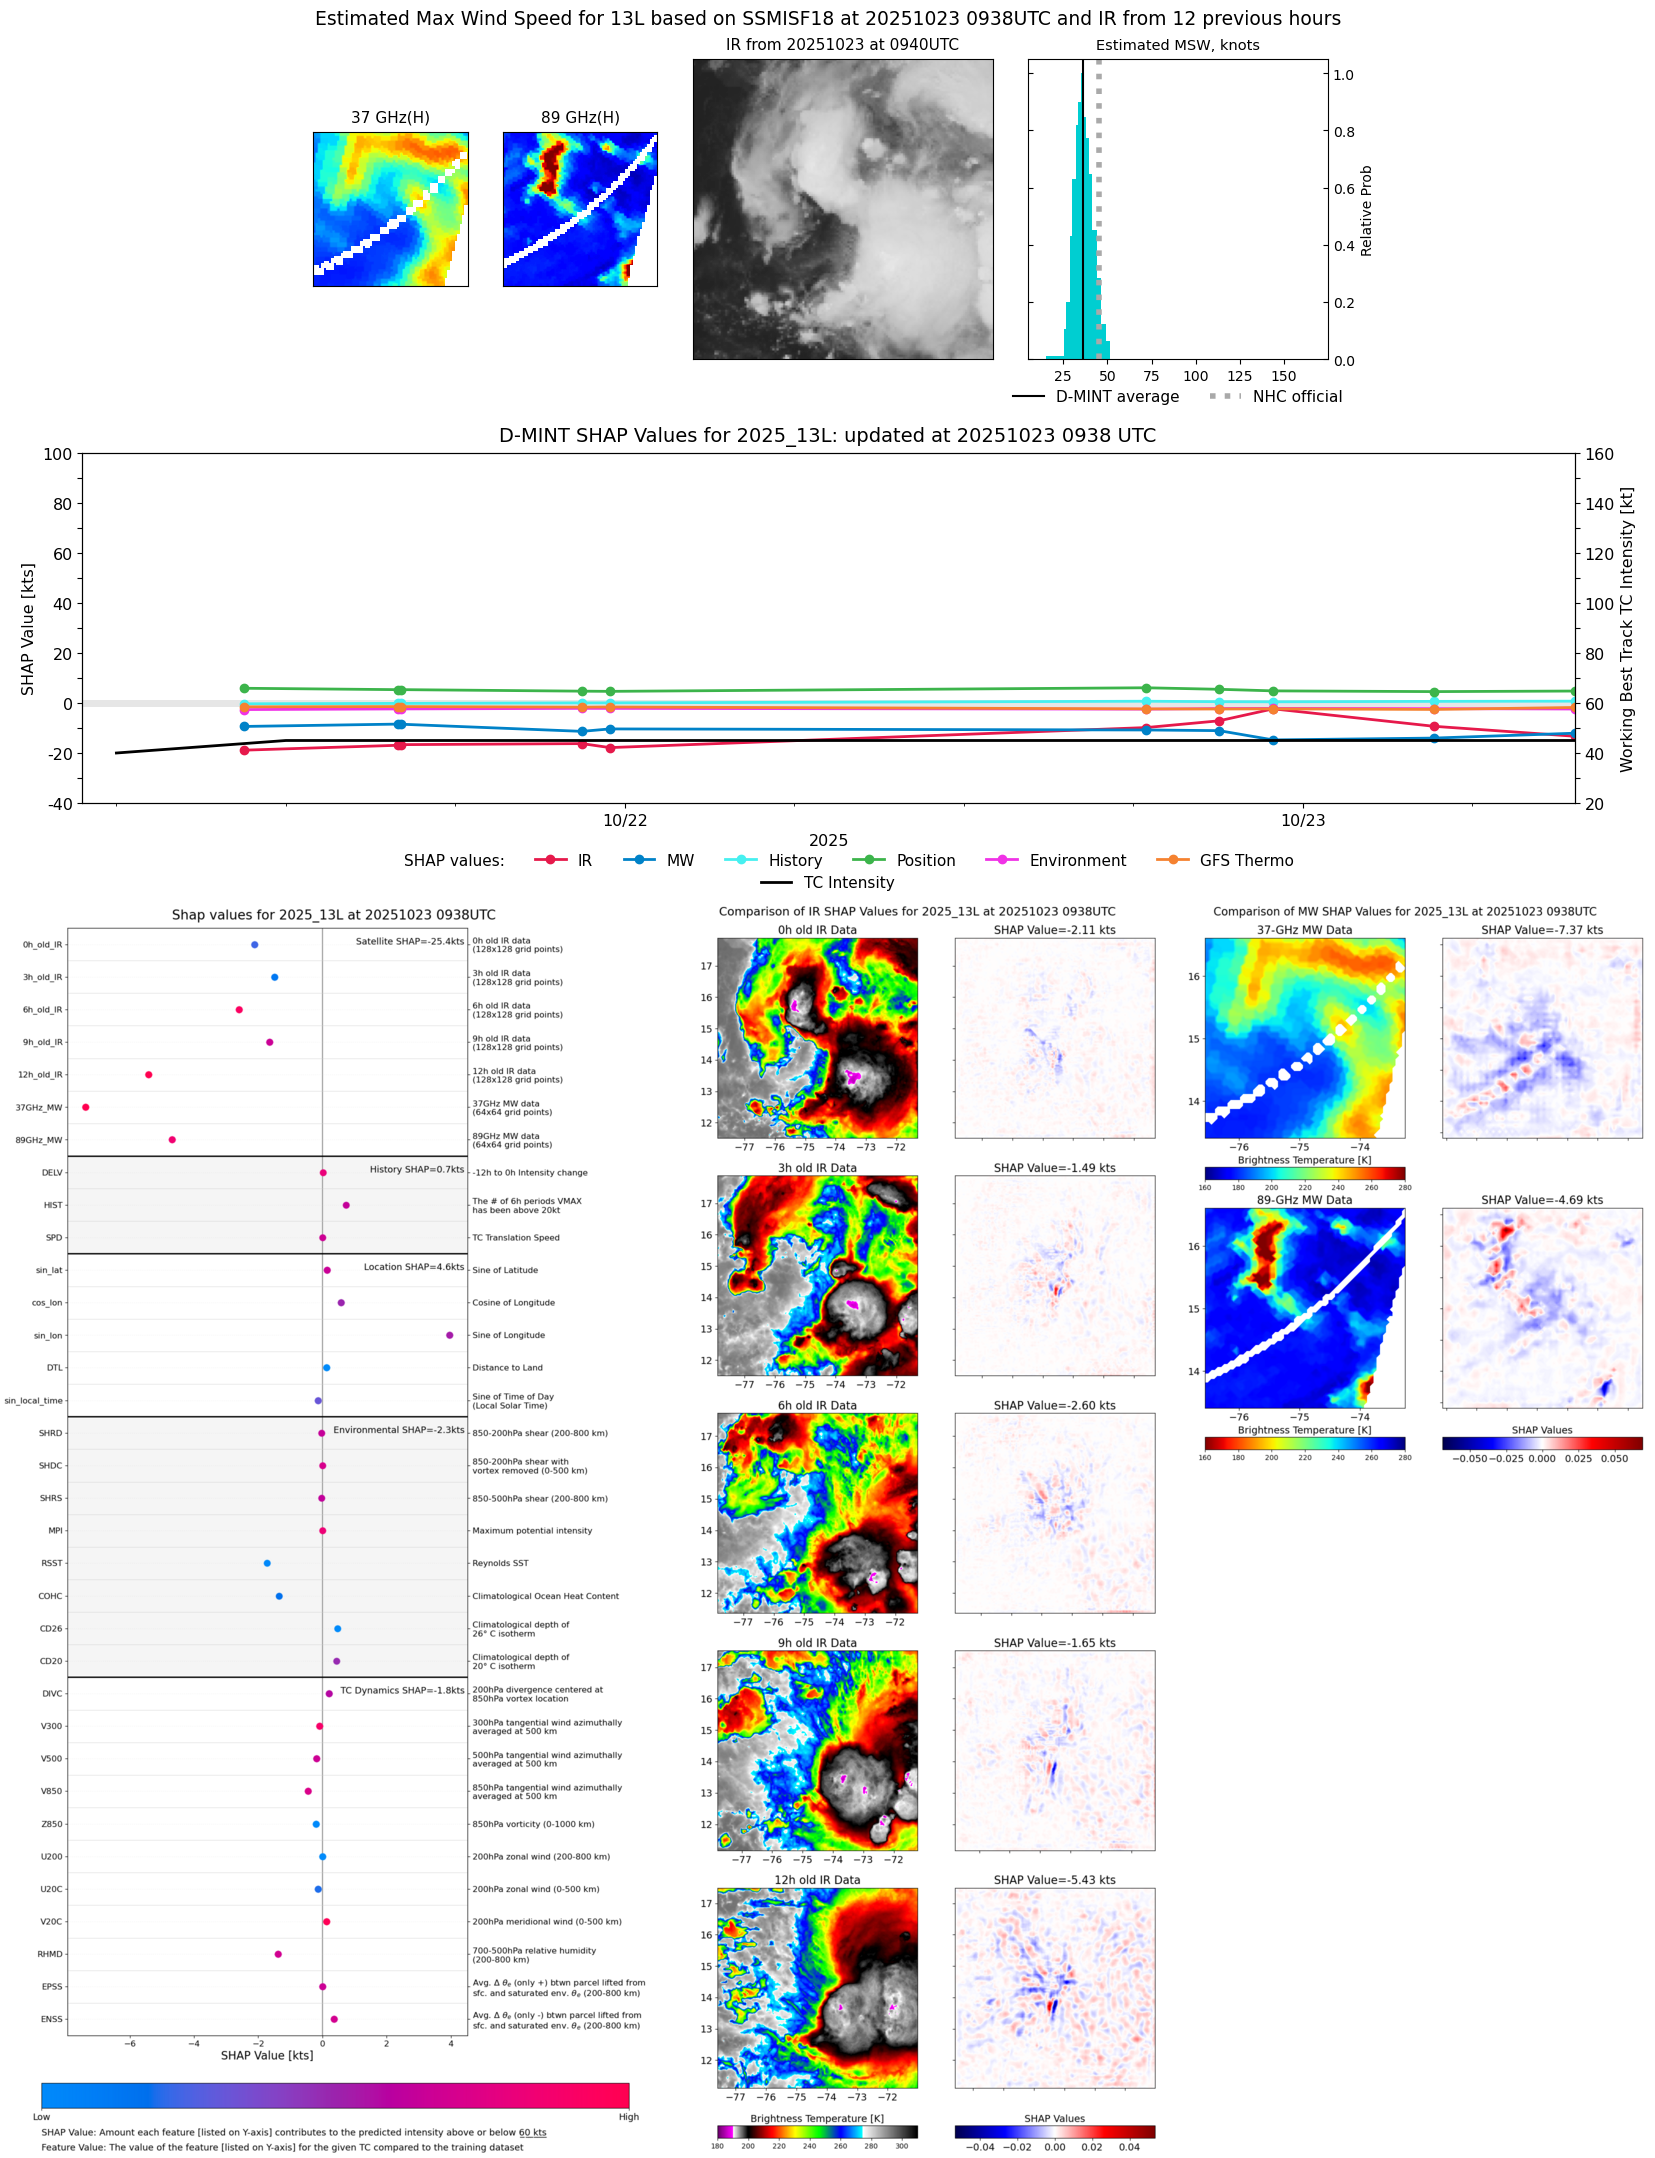 |
| 20251023 | 0640 UTC | AMSR2 | 1003 hPa | 39 kts | 35 kts | 44 kts | 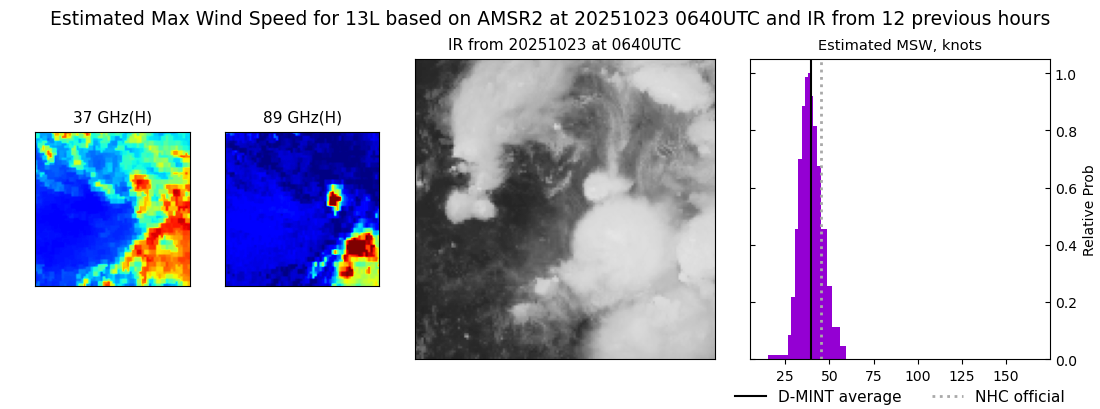 |
| 20251023 | 0632 UTC | ATMS-N20 | 1000 hPa | 43 kts | 38 kts | 48 kts |  |
| 20251023 | 0438 UTC | GMI | 1005 hPa | 37 kts | 33 kts | 42 kts |  |
| 20251023 | 0334 UTC | TMS02 | 998 hPa | 52 kts | 47 kts | 58 kts | 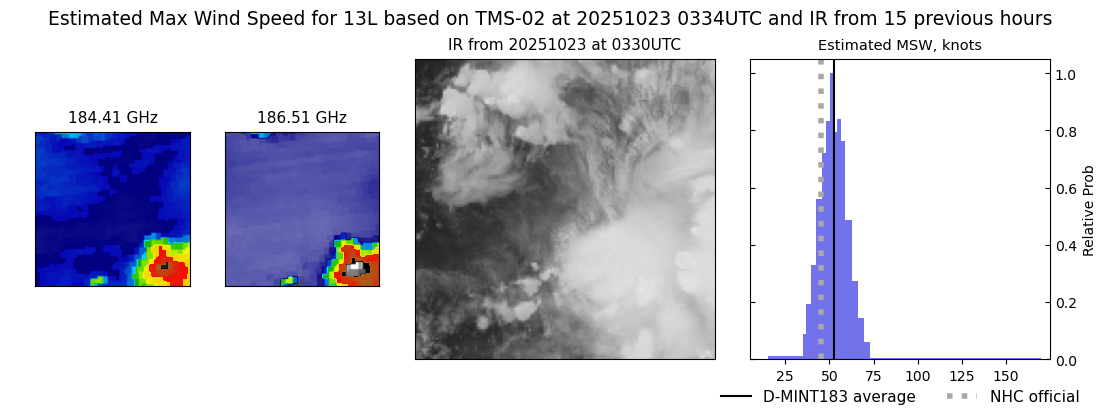 |
| 20251023 | 0311 UTC | AWS | 997 hPa | 51 kts | 46 kts | 57 kts | 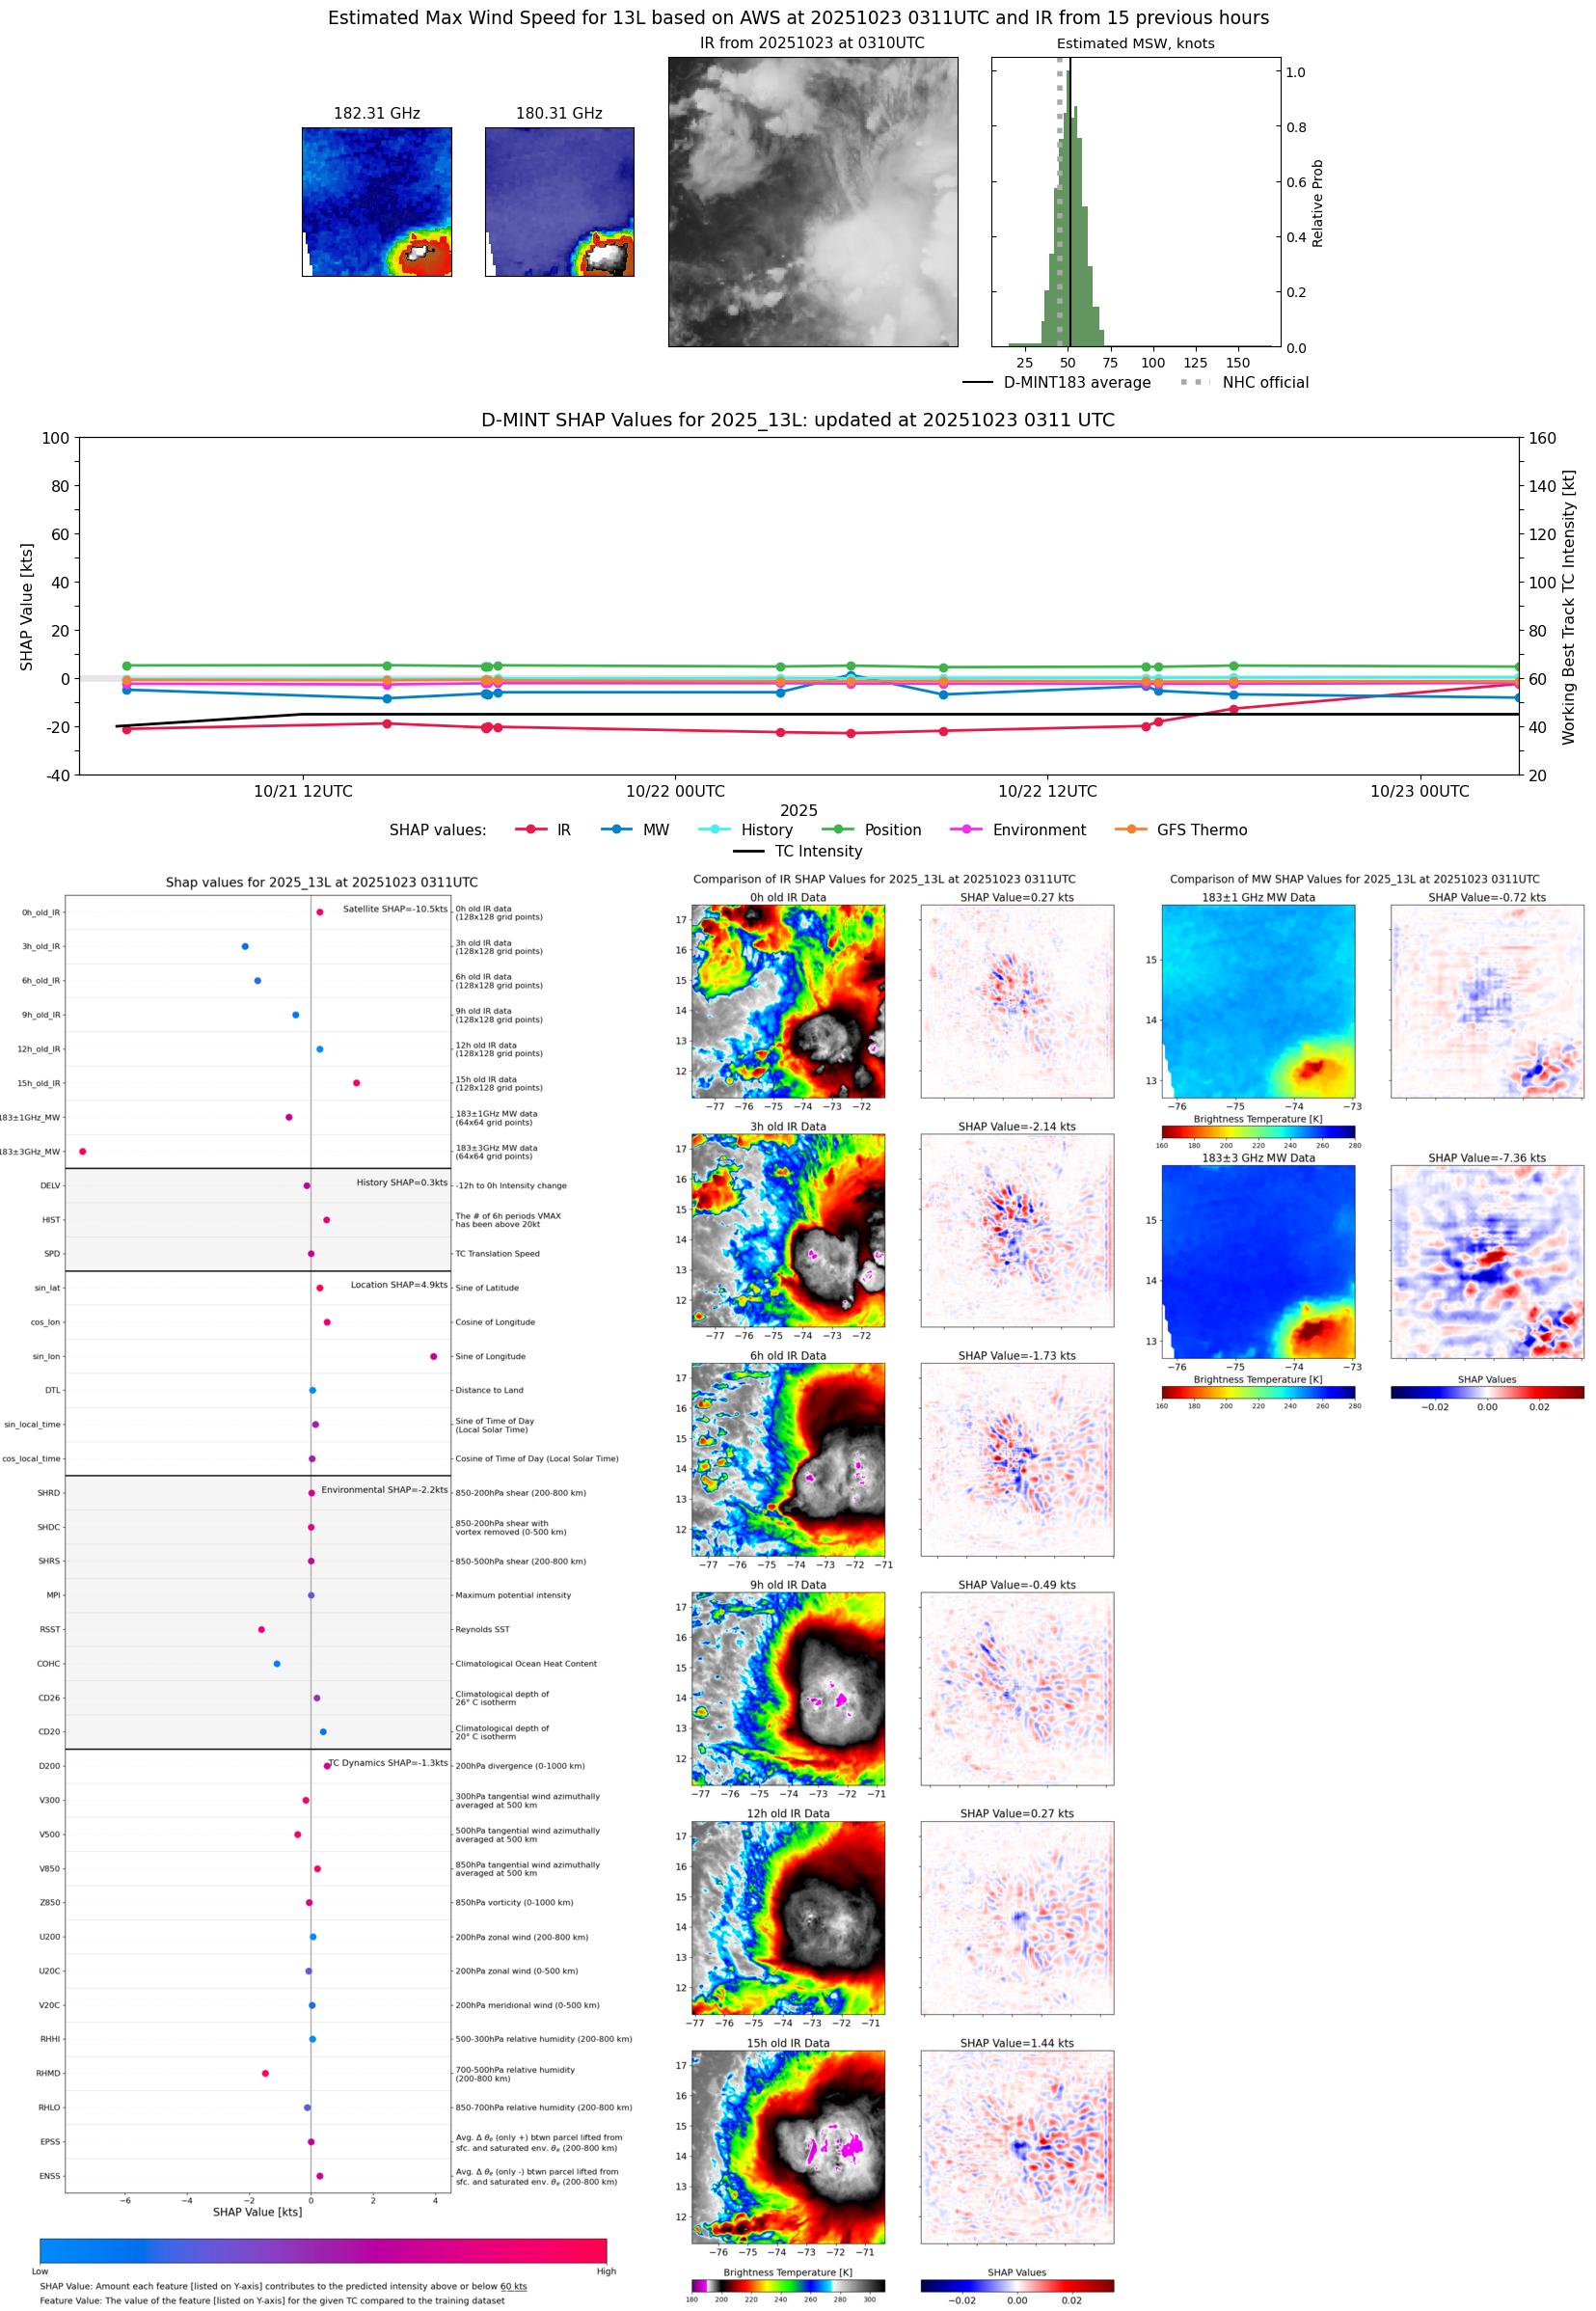 |
| 20251022 | 2314 UTC | SSMISF16 | 1003 hPa | 43 kts | 38 kts | 48 kts |  |
| 20251022 | 2257 UTC | WSFM01 | 1002 hPa | 44 kts | 39 kts | 49 kts |  |
| 20251022 | 2102 UTC | SSMISF18 | 1001 hPa | 43 kts | 38 kts | 49 kts | 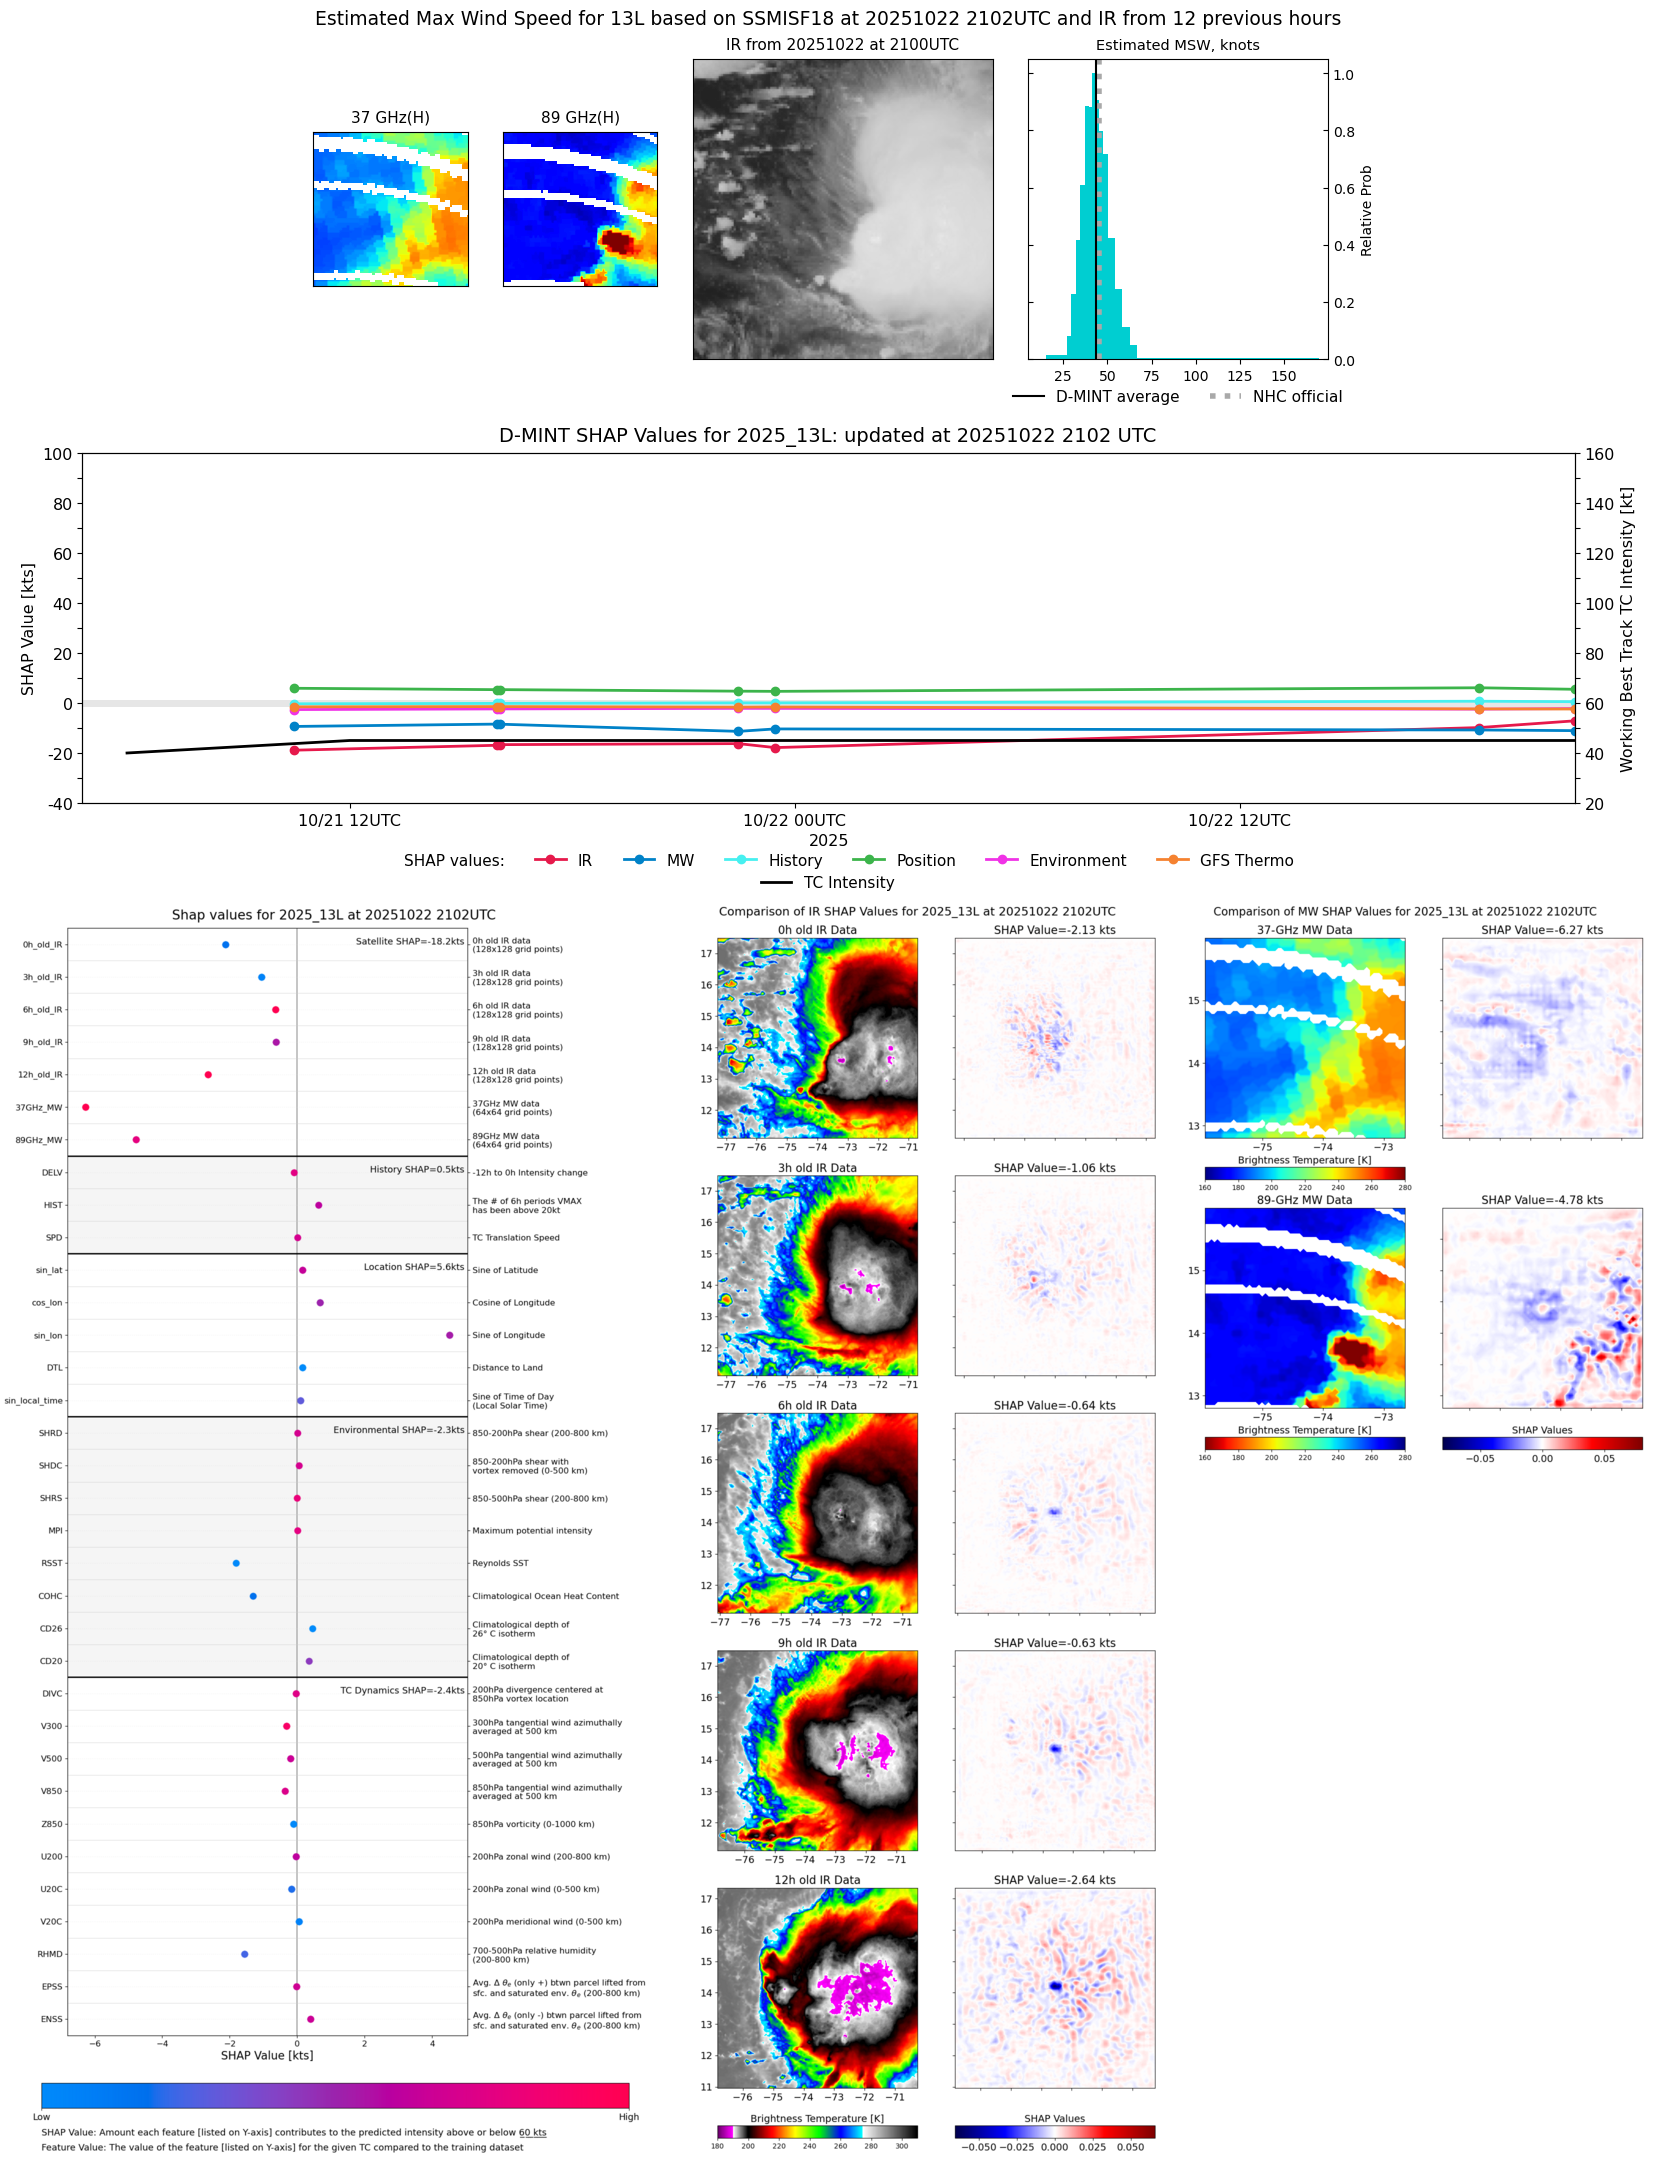 |
| 20251022 | 1827 UTC | AMSR2 | 999 hPa | 42 kts | 37 kts | 46 kts |  |
| 20251022 | 1759 UTC | ATMS-N20 | 1000 hPa | 42 kts | 38 kts | 47 kts | 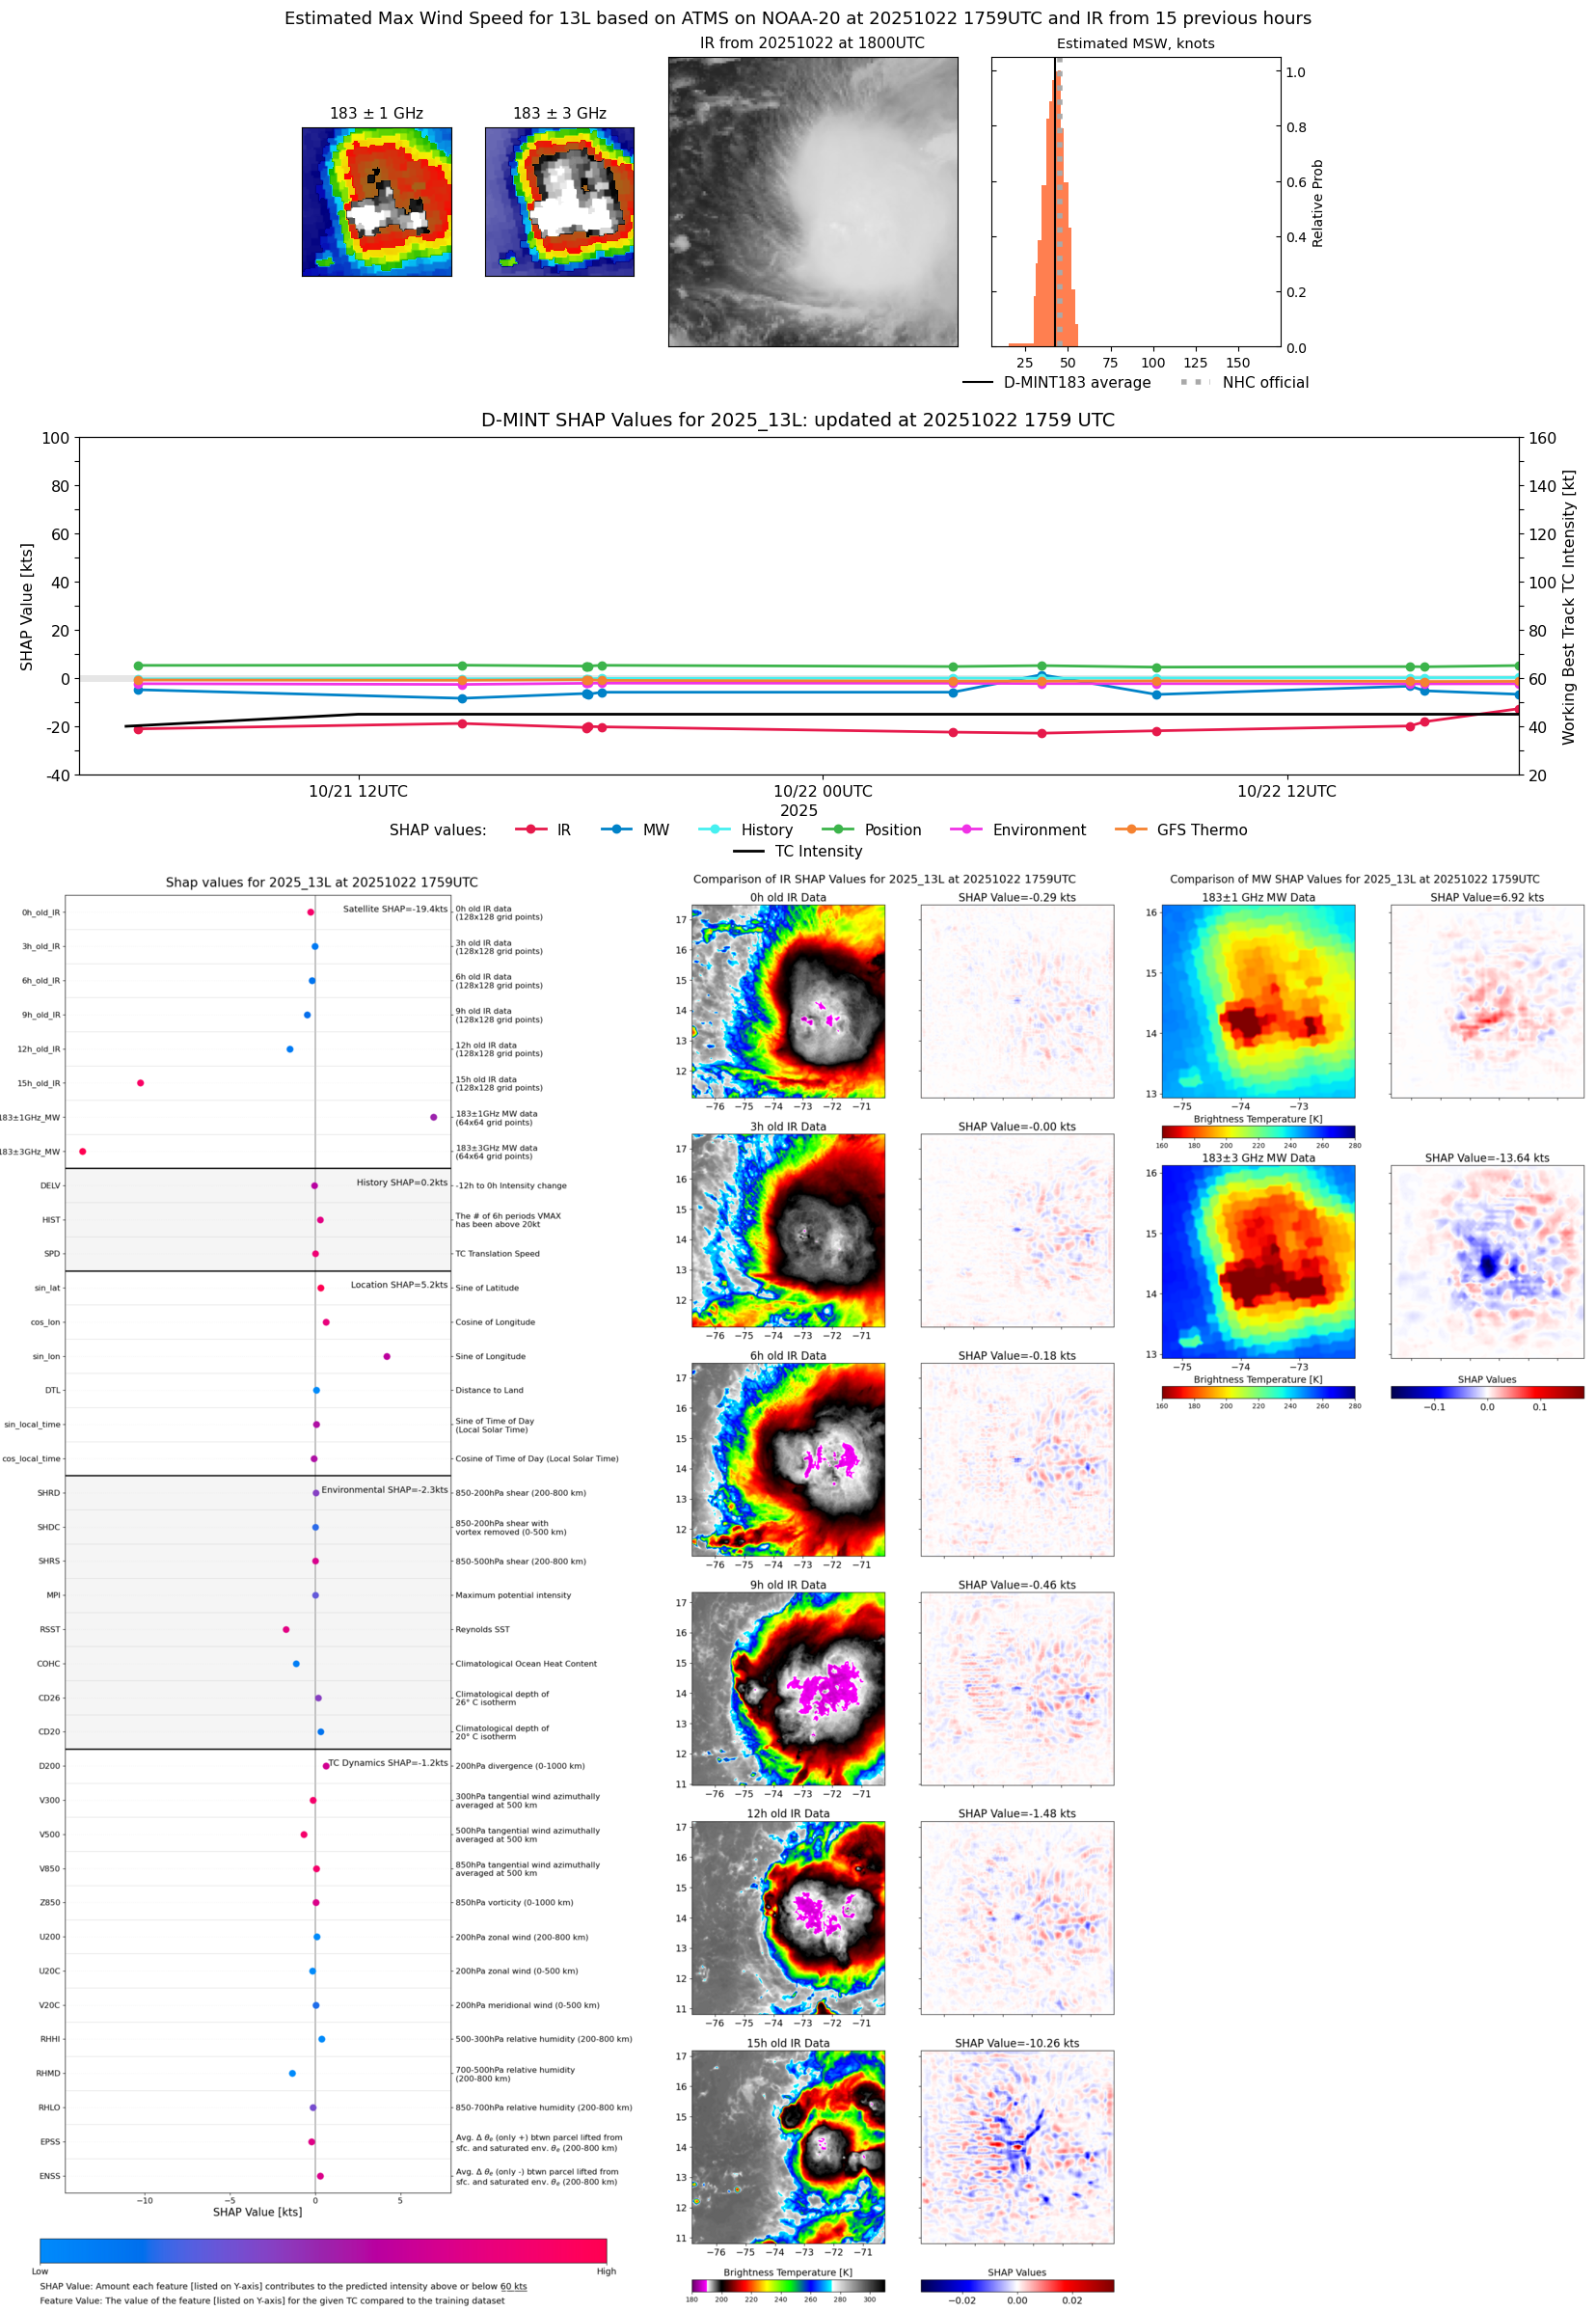 |
| 20251022 | 1533 UTC | TMS02 | 1001 hPa | 38 kts | 34 kts | 42 kts | 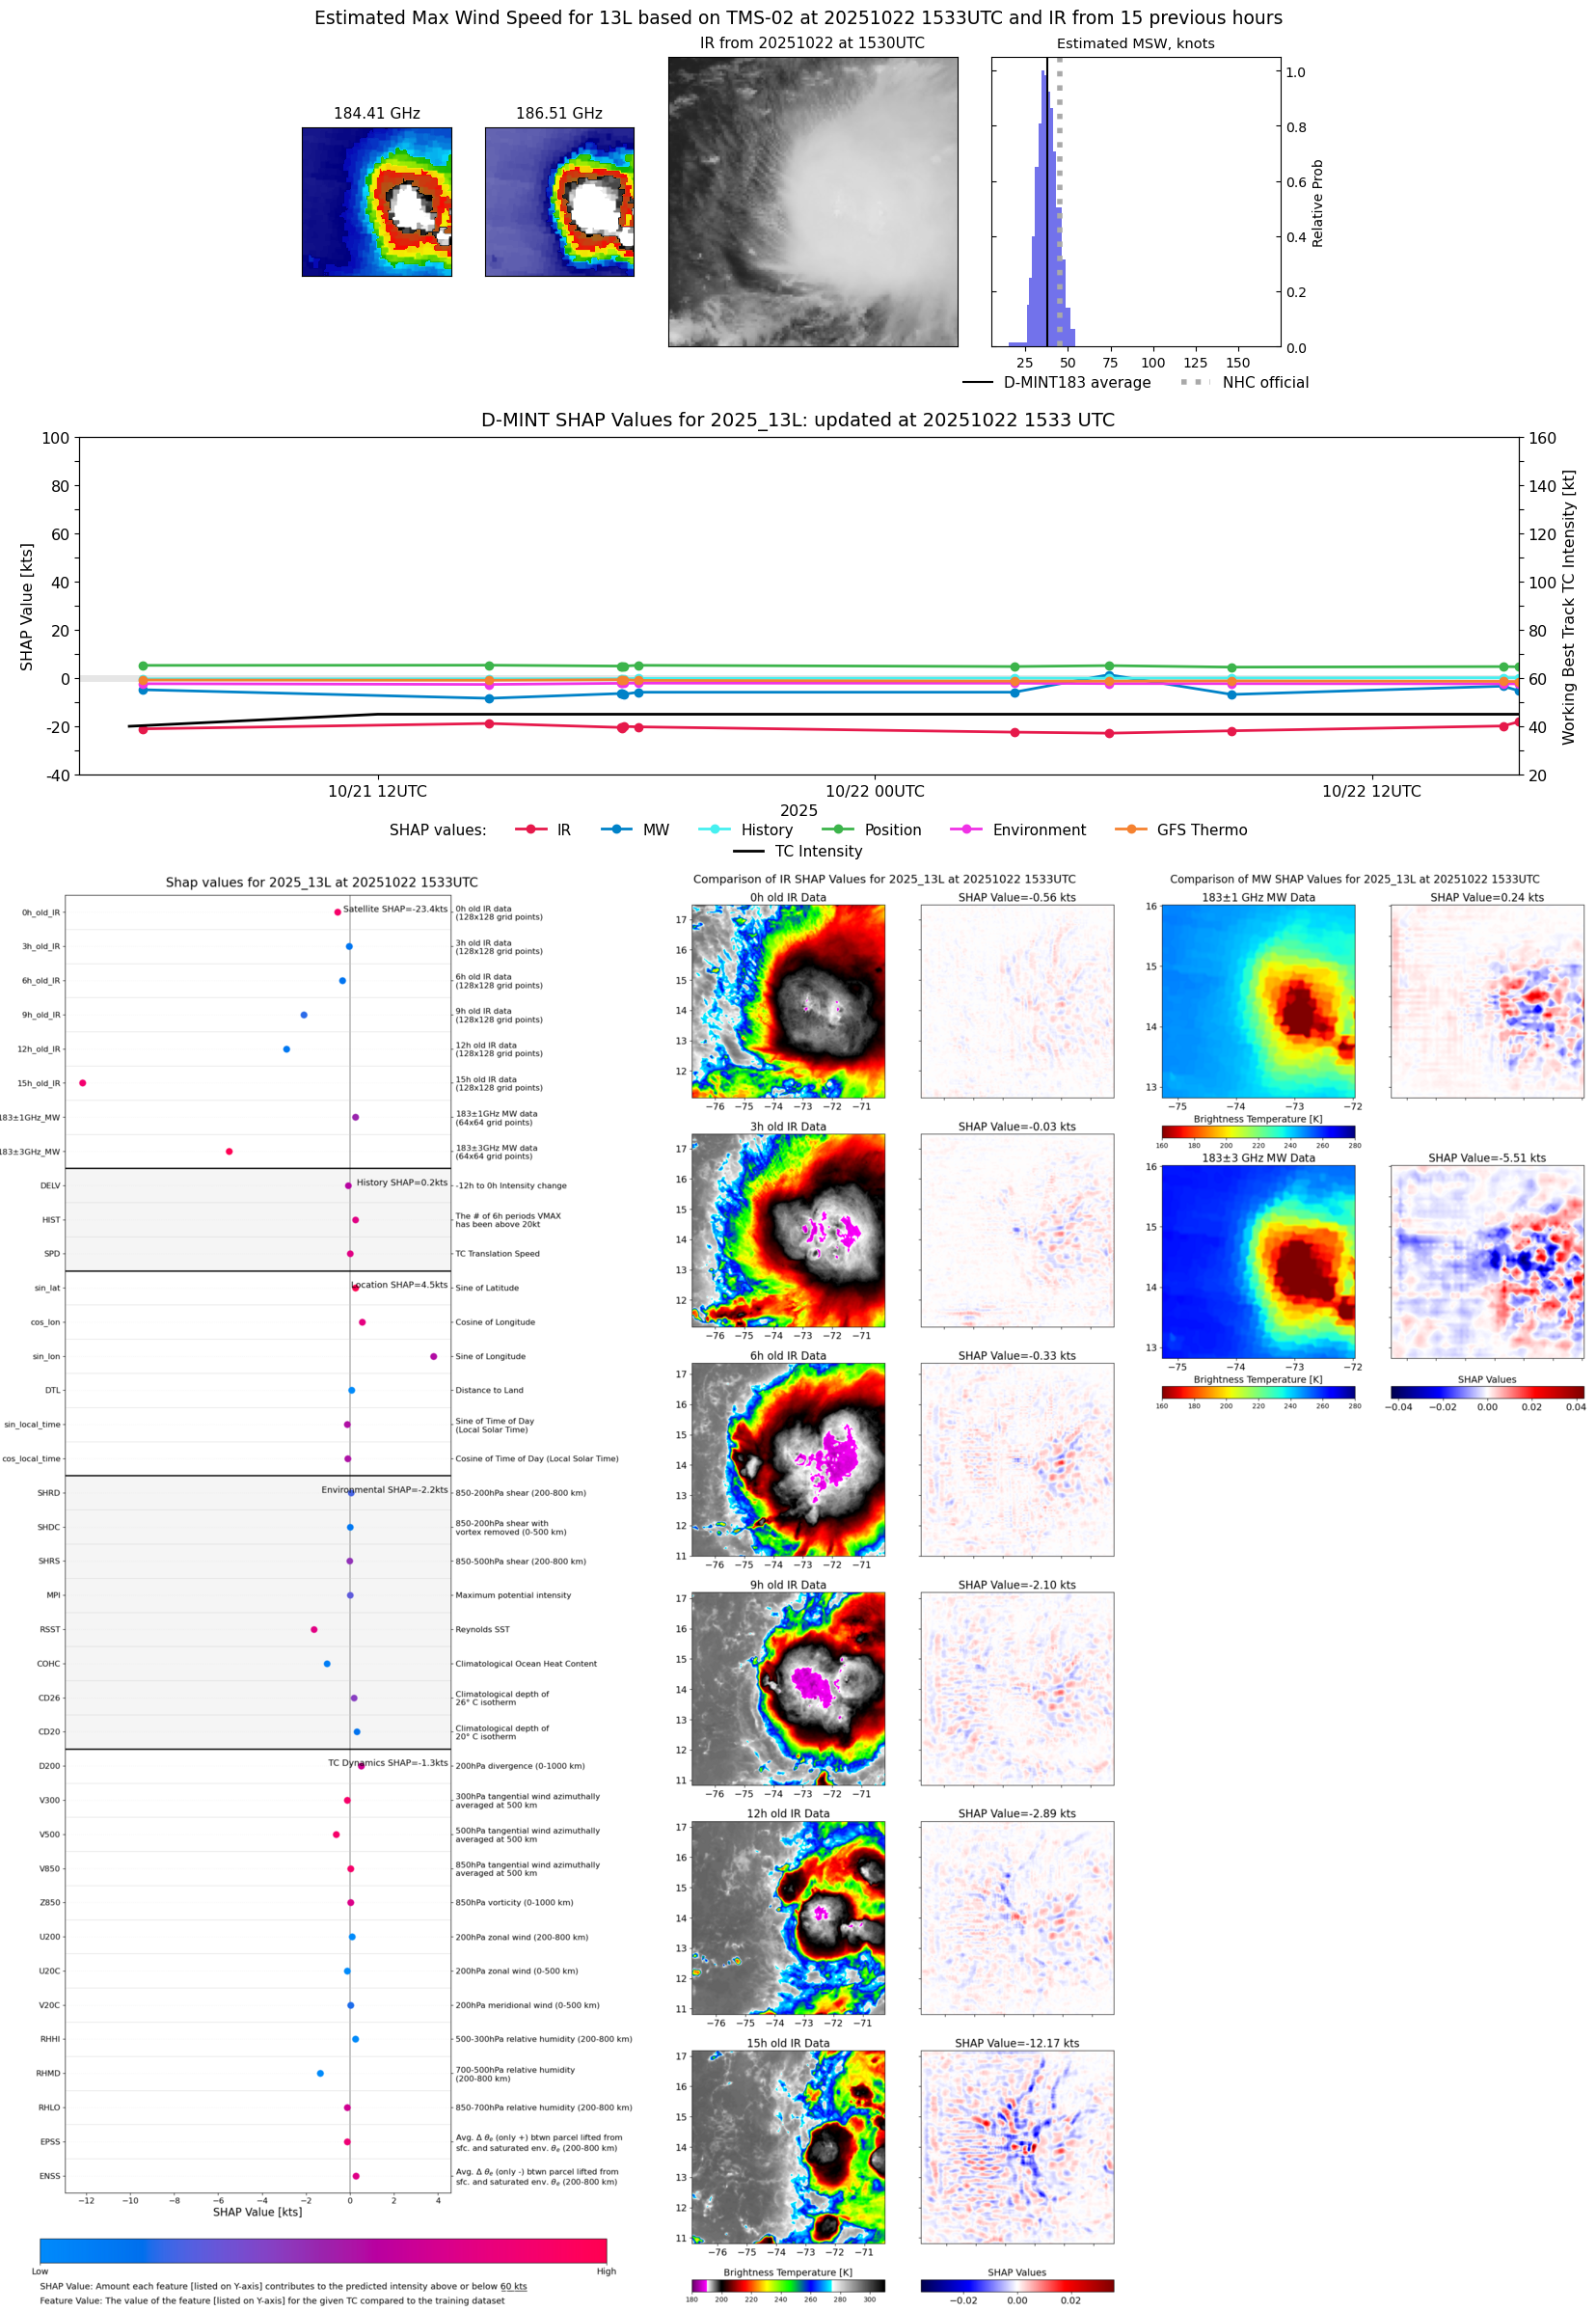 |
| 20251022 | 1510 UTC | TMS06 | 1000 hPa | 38 kts | 34 kts | 43 kts | 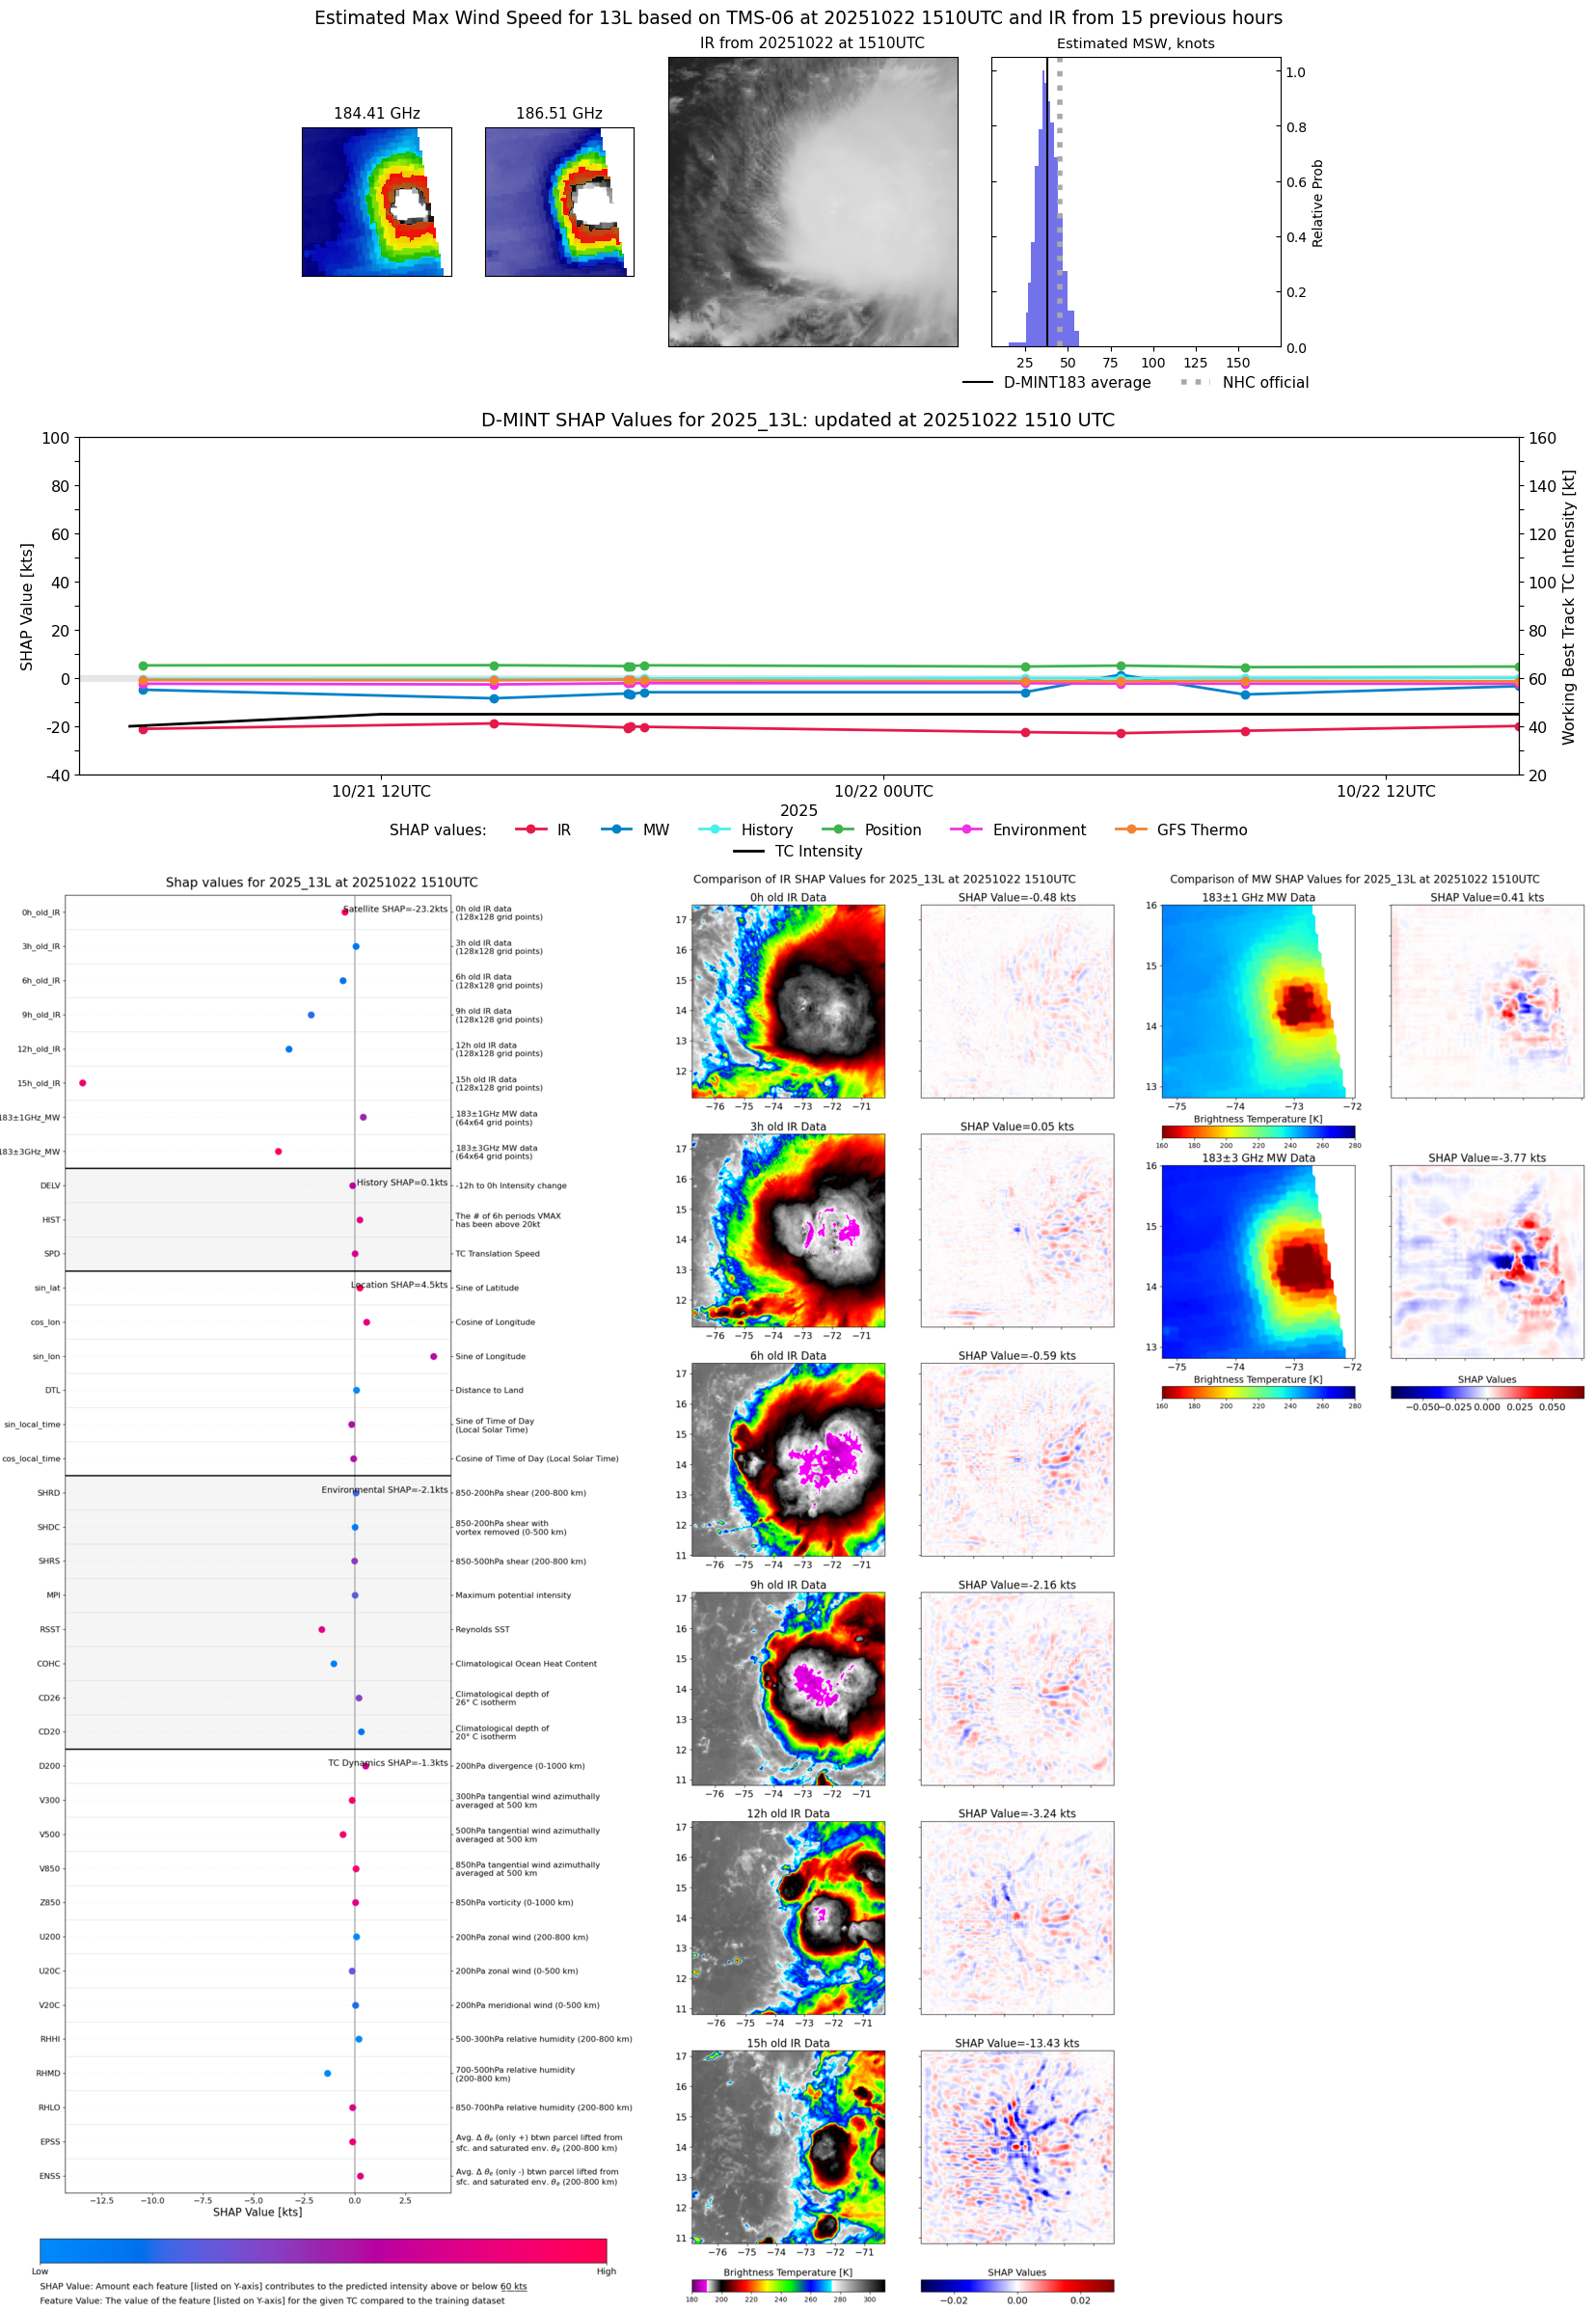 |
| 20251022 | 1104 UTC | SSMISF17 | 1003 hPa | 46 kts | 41 kts | 51 kts | 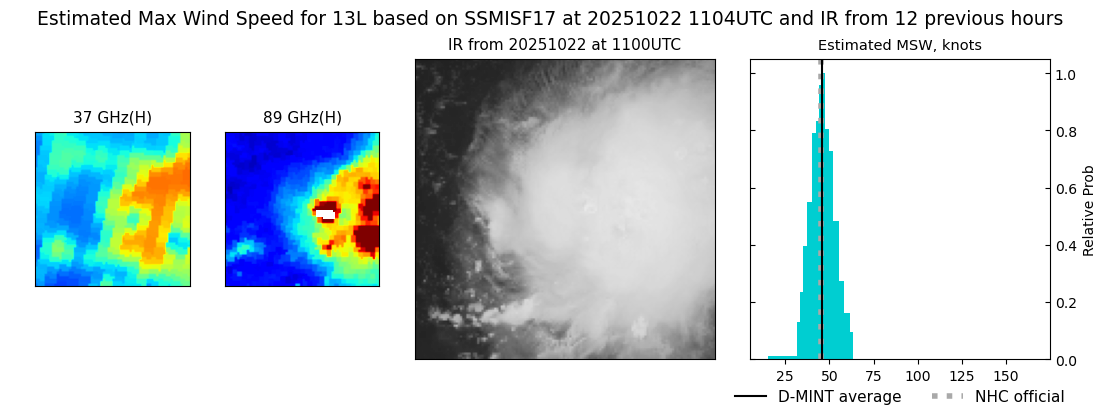 |
| 20251022 | 0837 UTC | TROPICS05 | 1005 hPa | 33 kts | 29 kts | 37 kts |  |
| 20251022 | 0539 UTC | TROPICS03 | 1003 hPa | 40 kts | 36 kts | 45 kts | 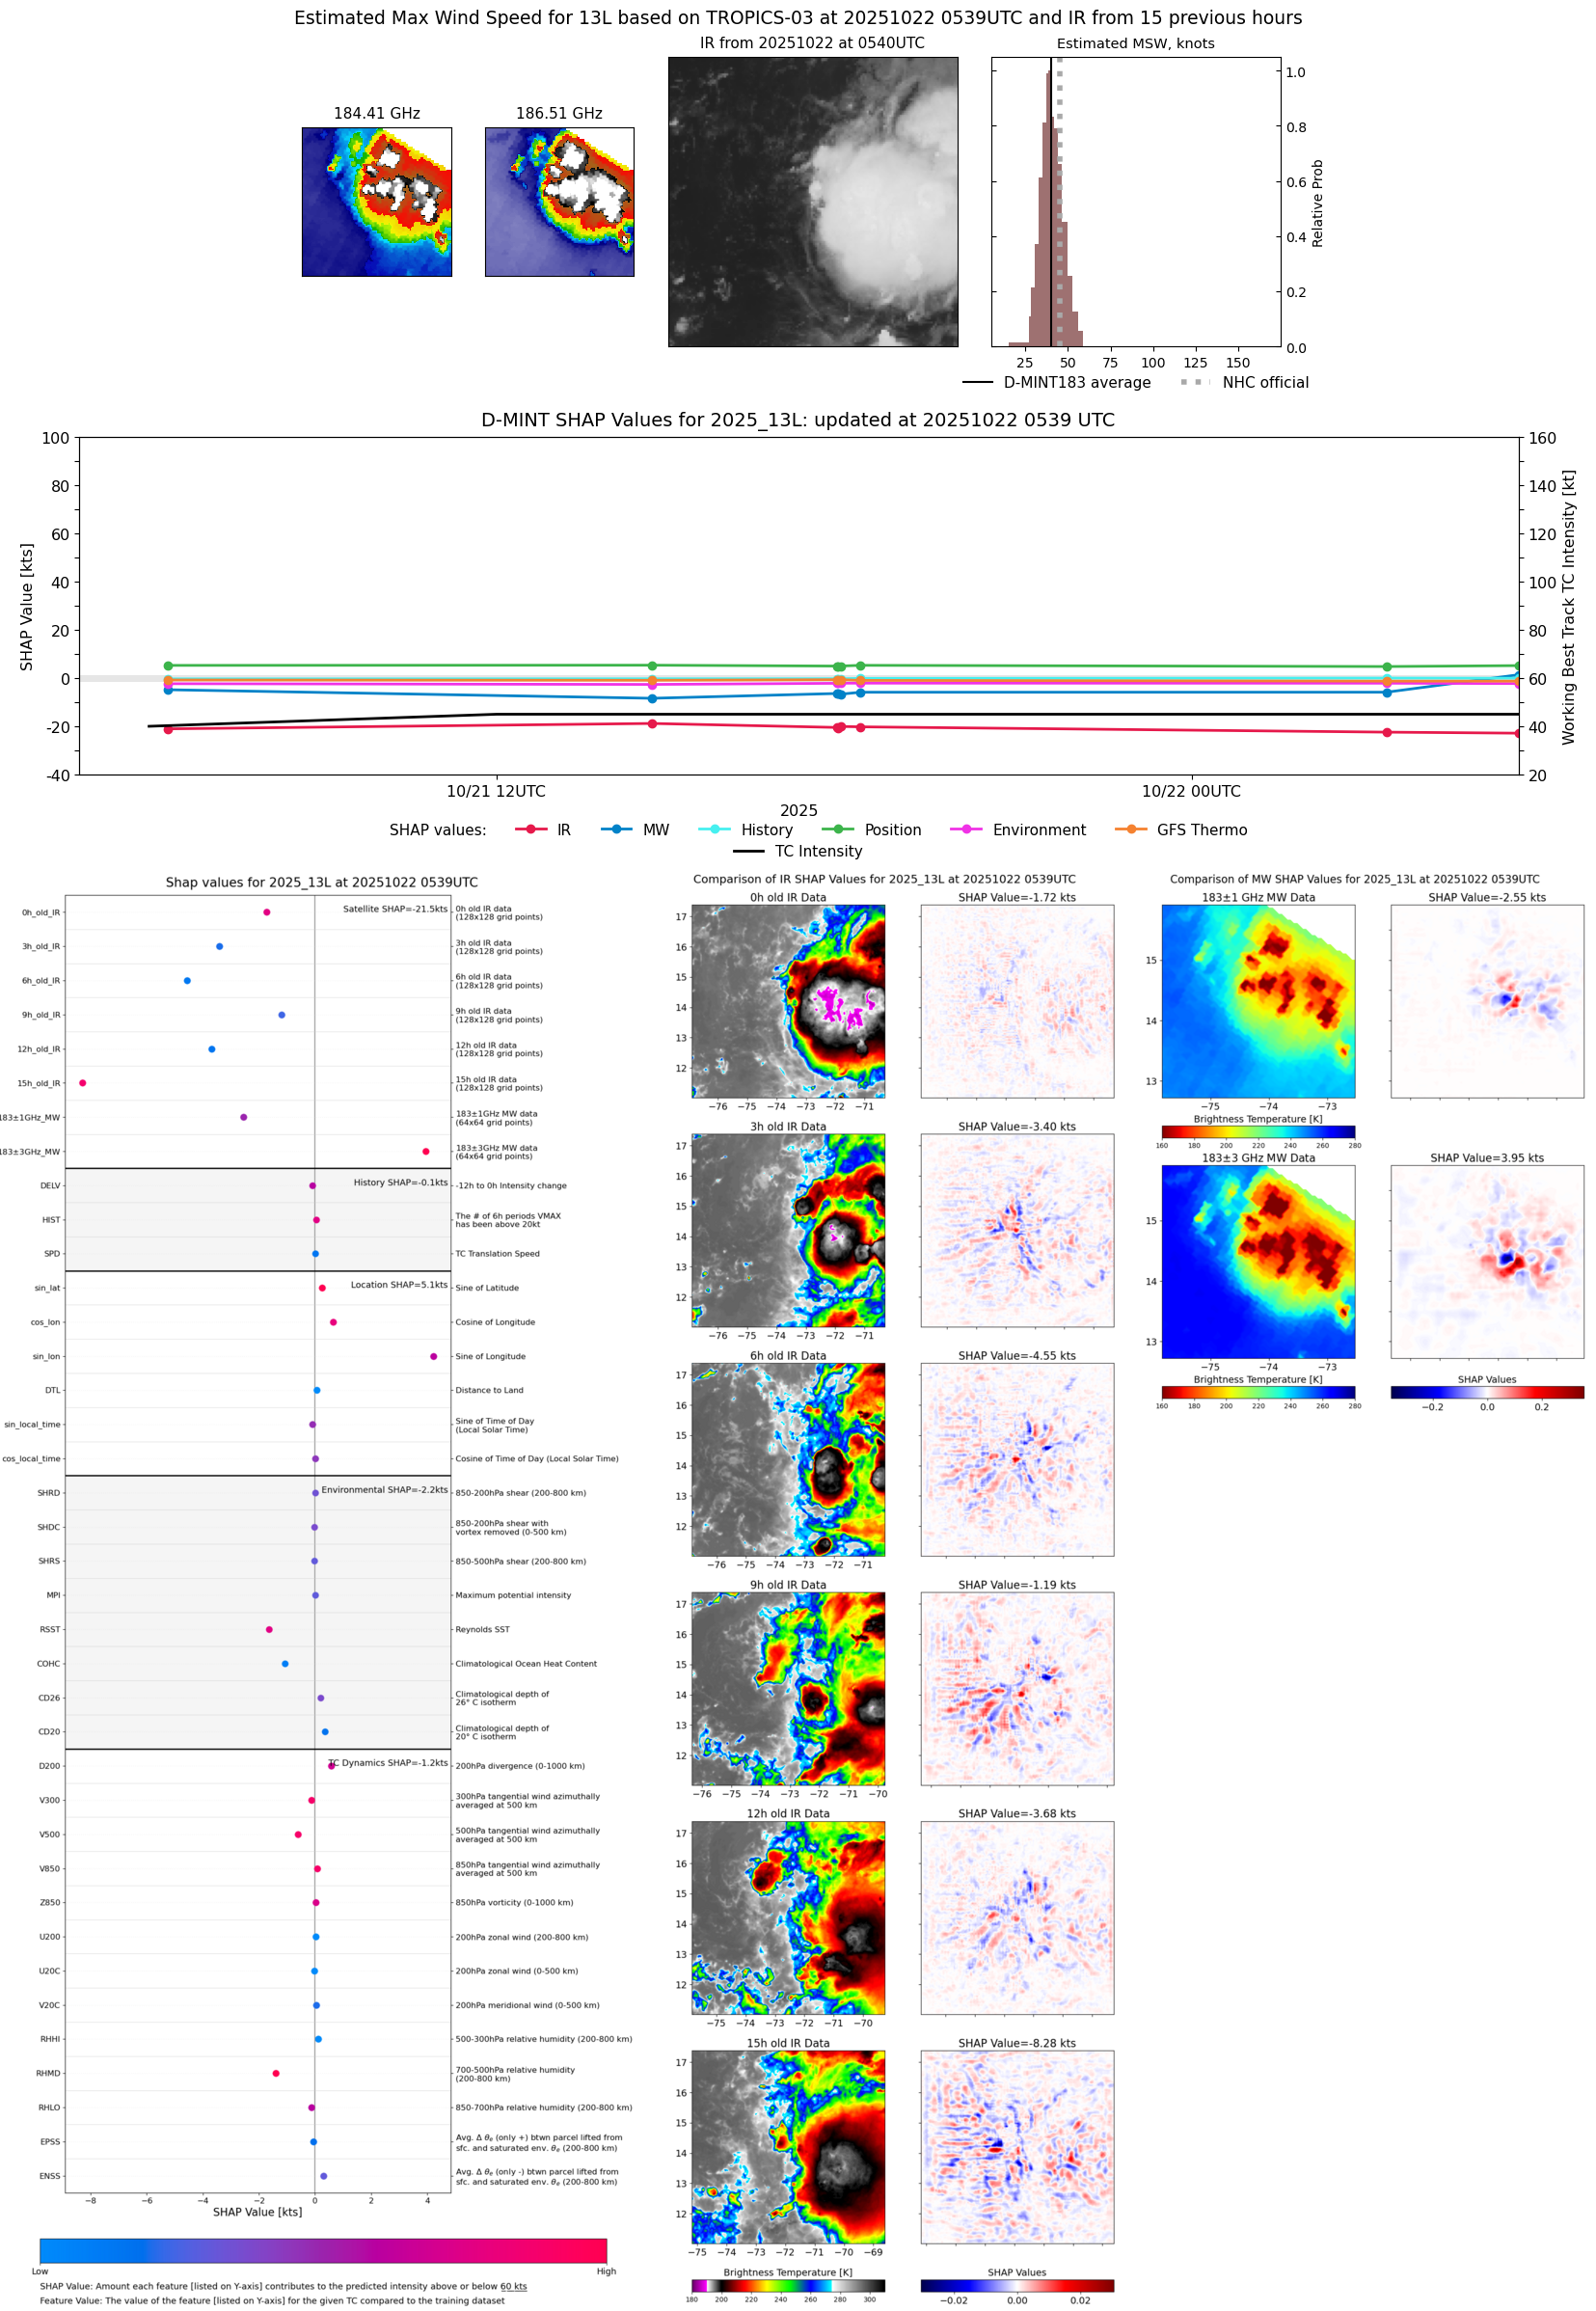 |
| 20251022 | 0322 UTC | TMS06 | 1005 hPa | 33 kts | 30 kts | 37 kts | 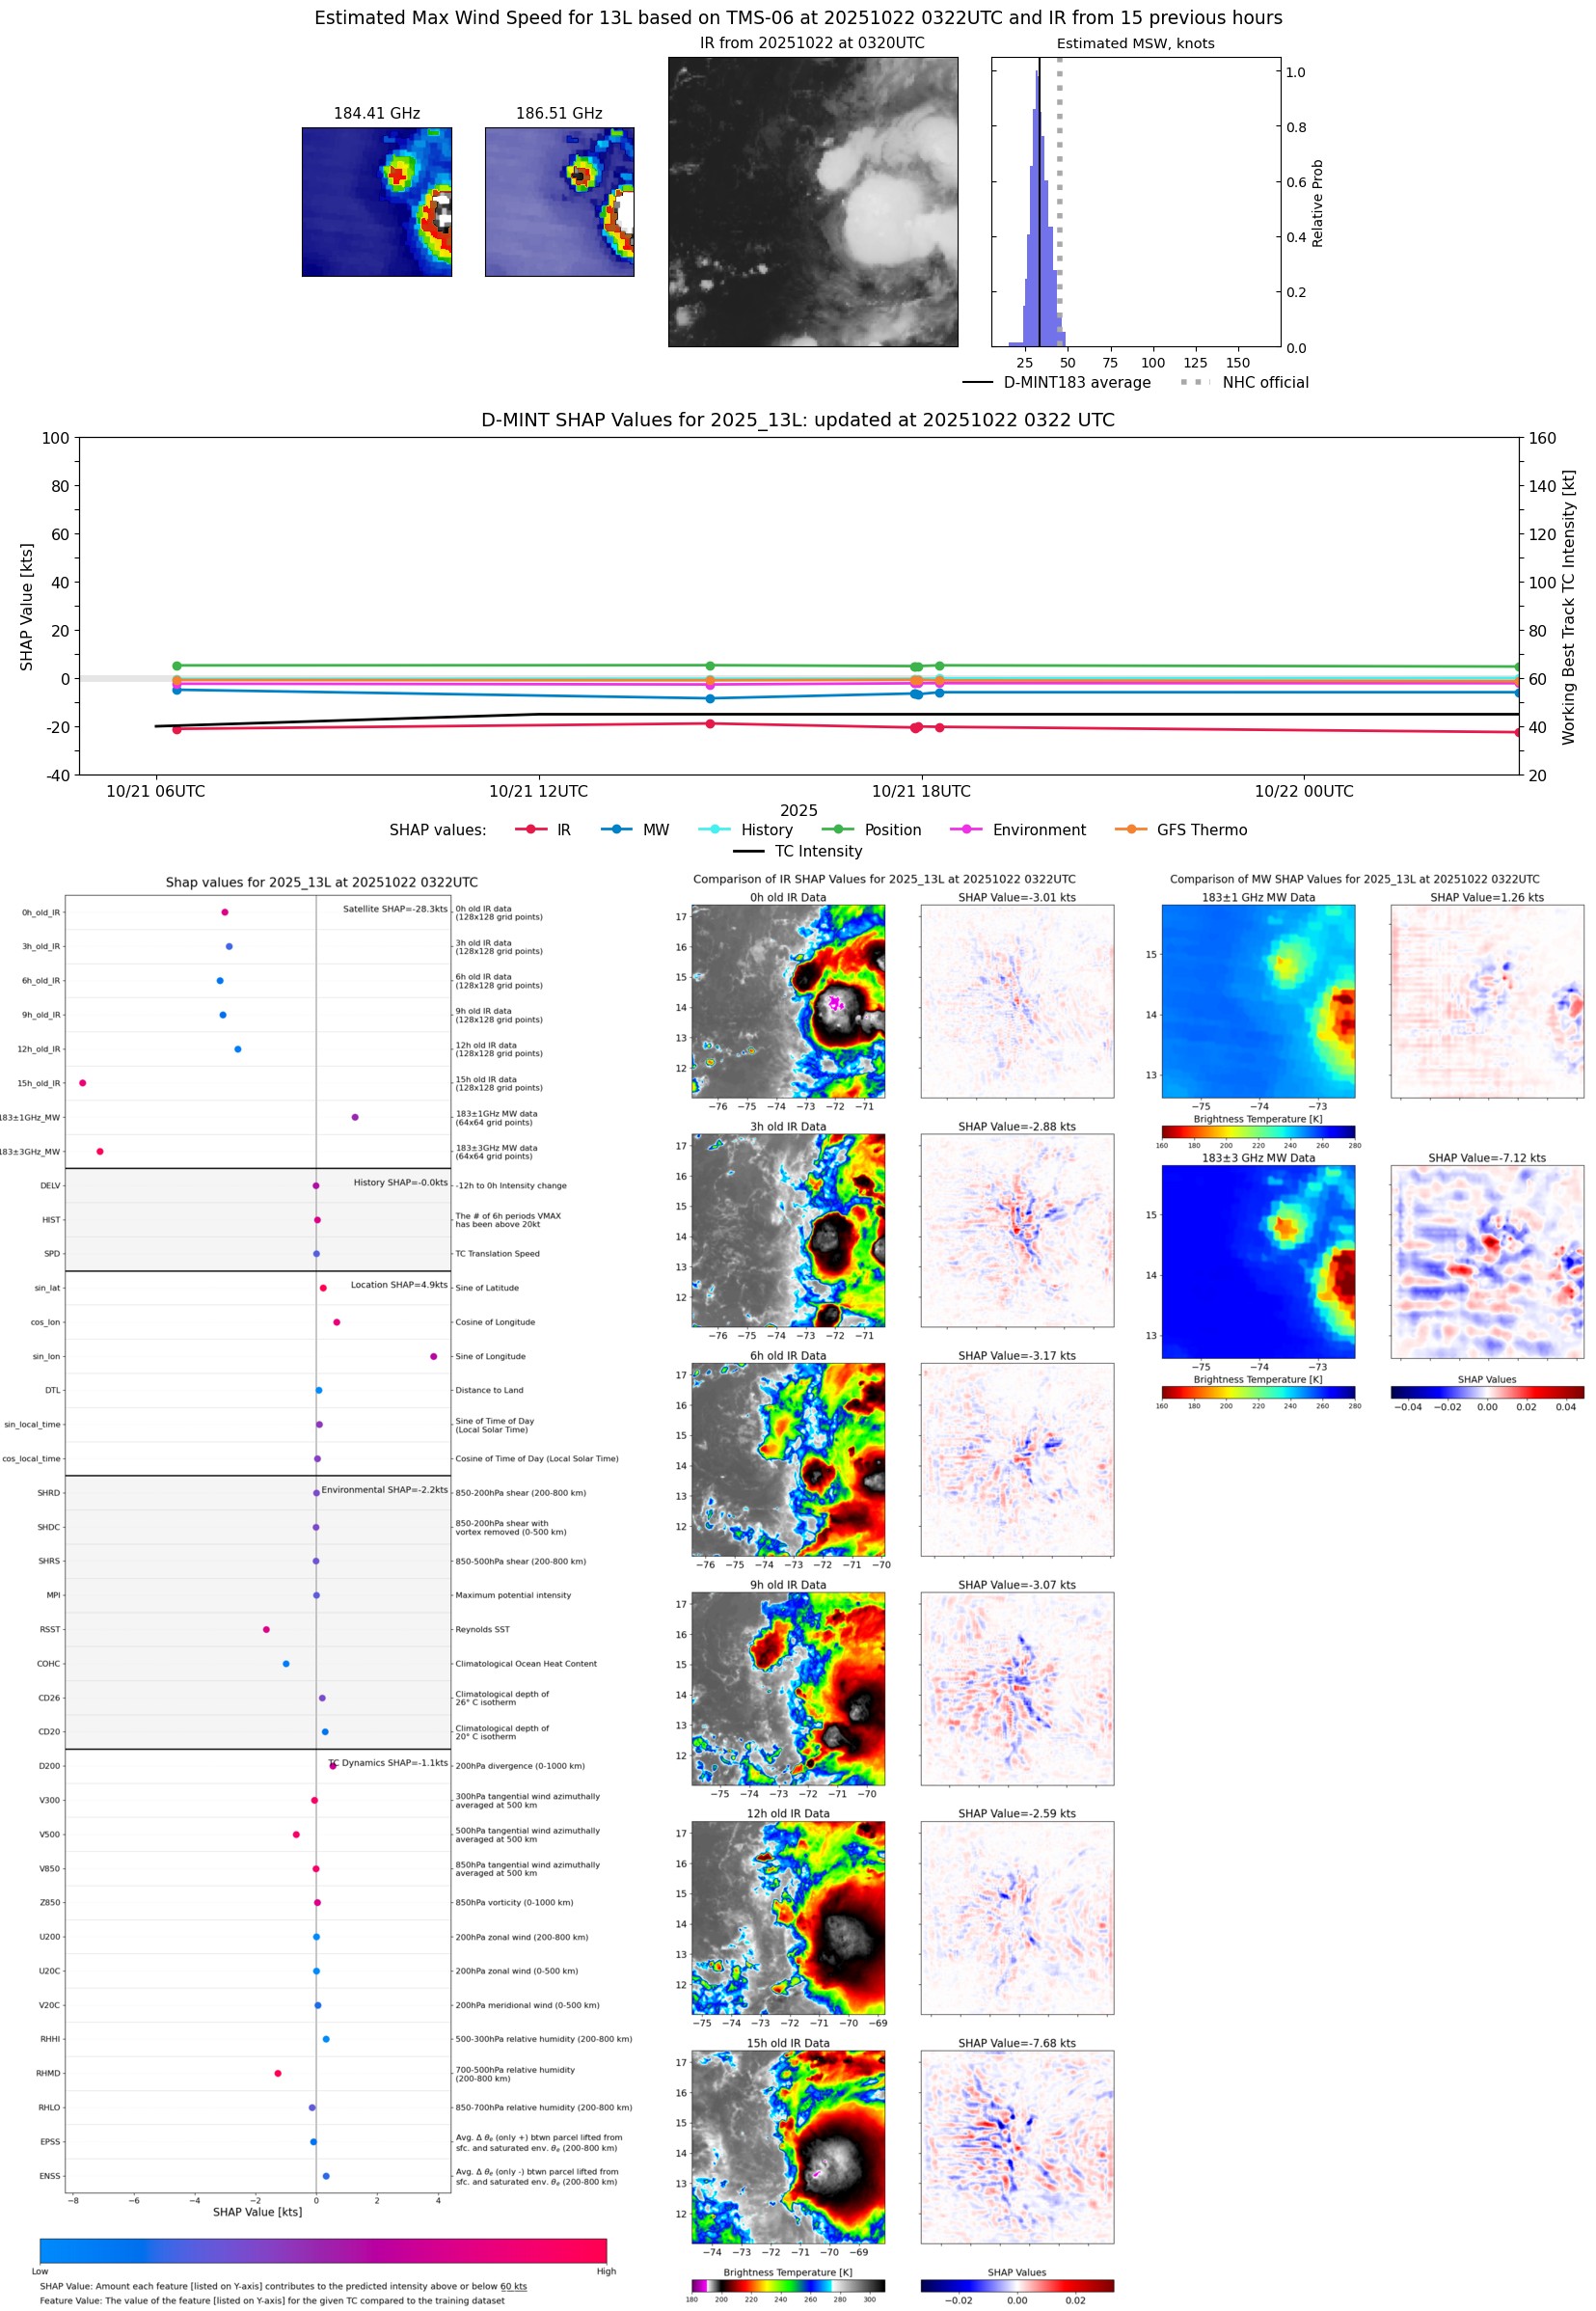 |
| 20251021 | 2328 UTC | SSMISF16 | 1005 hPa | 33 kts | 29 kts | 37 kts |  |
| 20251021 | 2229 UTC | SSMISF17 | 1005 hPa | 33 kts | 30 kts | 37 kts |  |
| 20251021 | 1817 UTC | ATMS-N20 | 1004 hPa | 36 kts | 33 kts | 40 kts |  |
| 20251021 | 1757 UTC | ATMS-NPP | 1005 hPa | 35 kts | 32 kts | 39 kts |  |
| 20251021 | 1754 UTC | TROPICS05 | 1005 hPa | 35 kts | 32 kts | 38 kts |  |
| 20251021 | 1753 UTC | TROPICS05 | 1005 hPa | 35 kts | 32 kts | 39 kts | 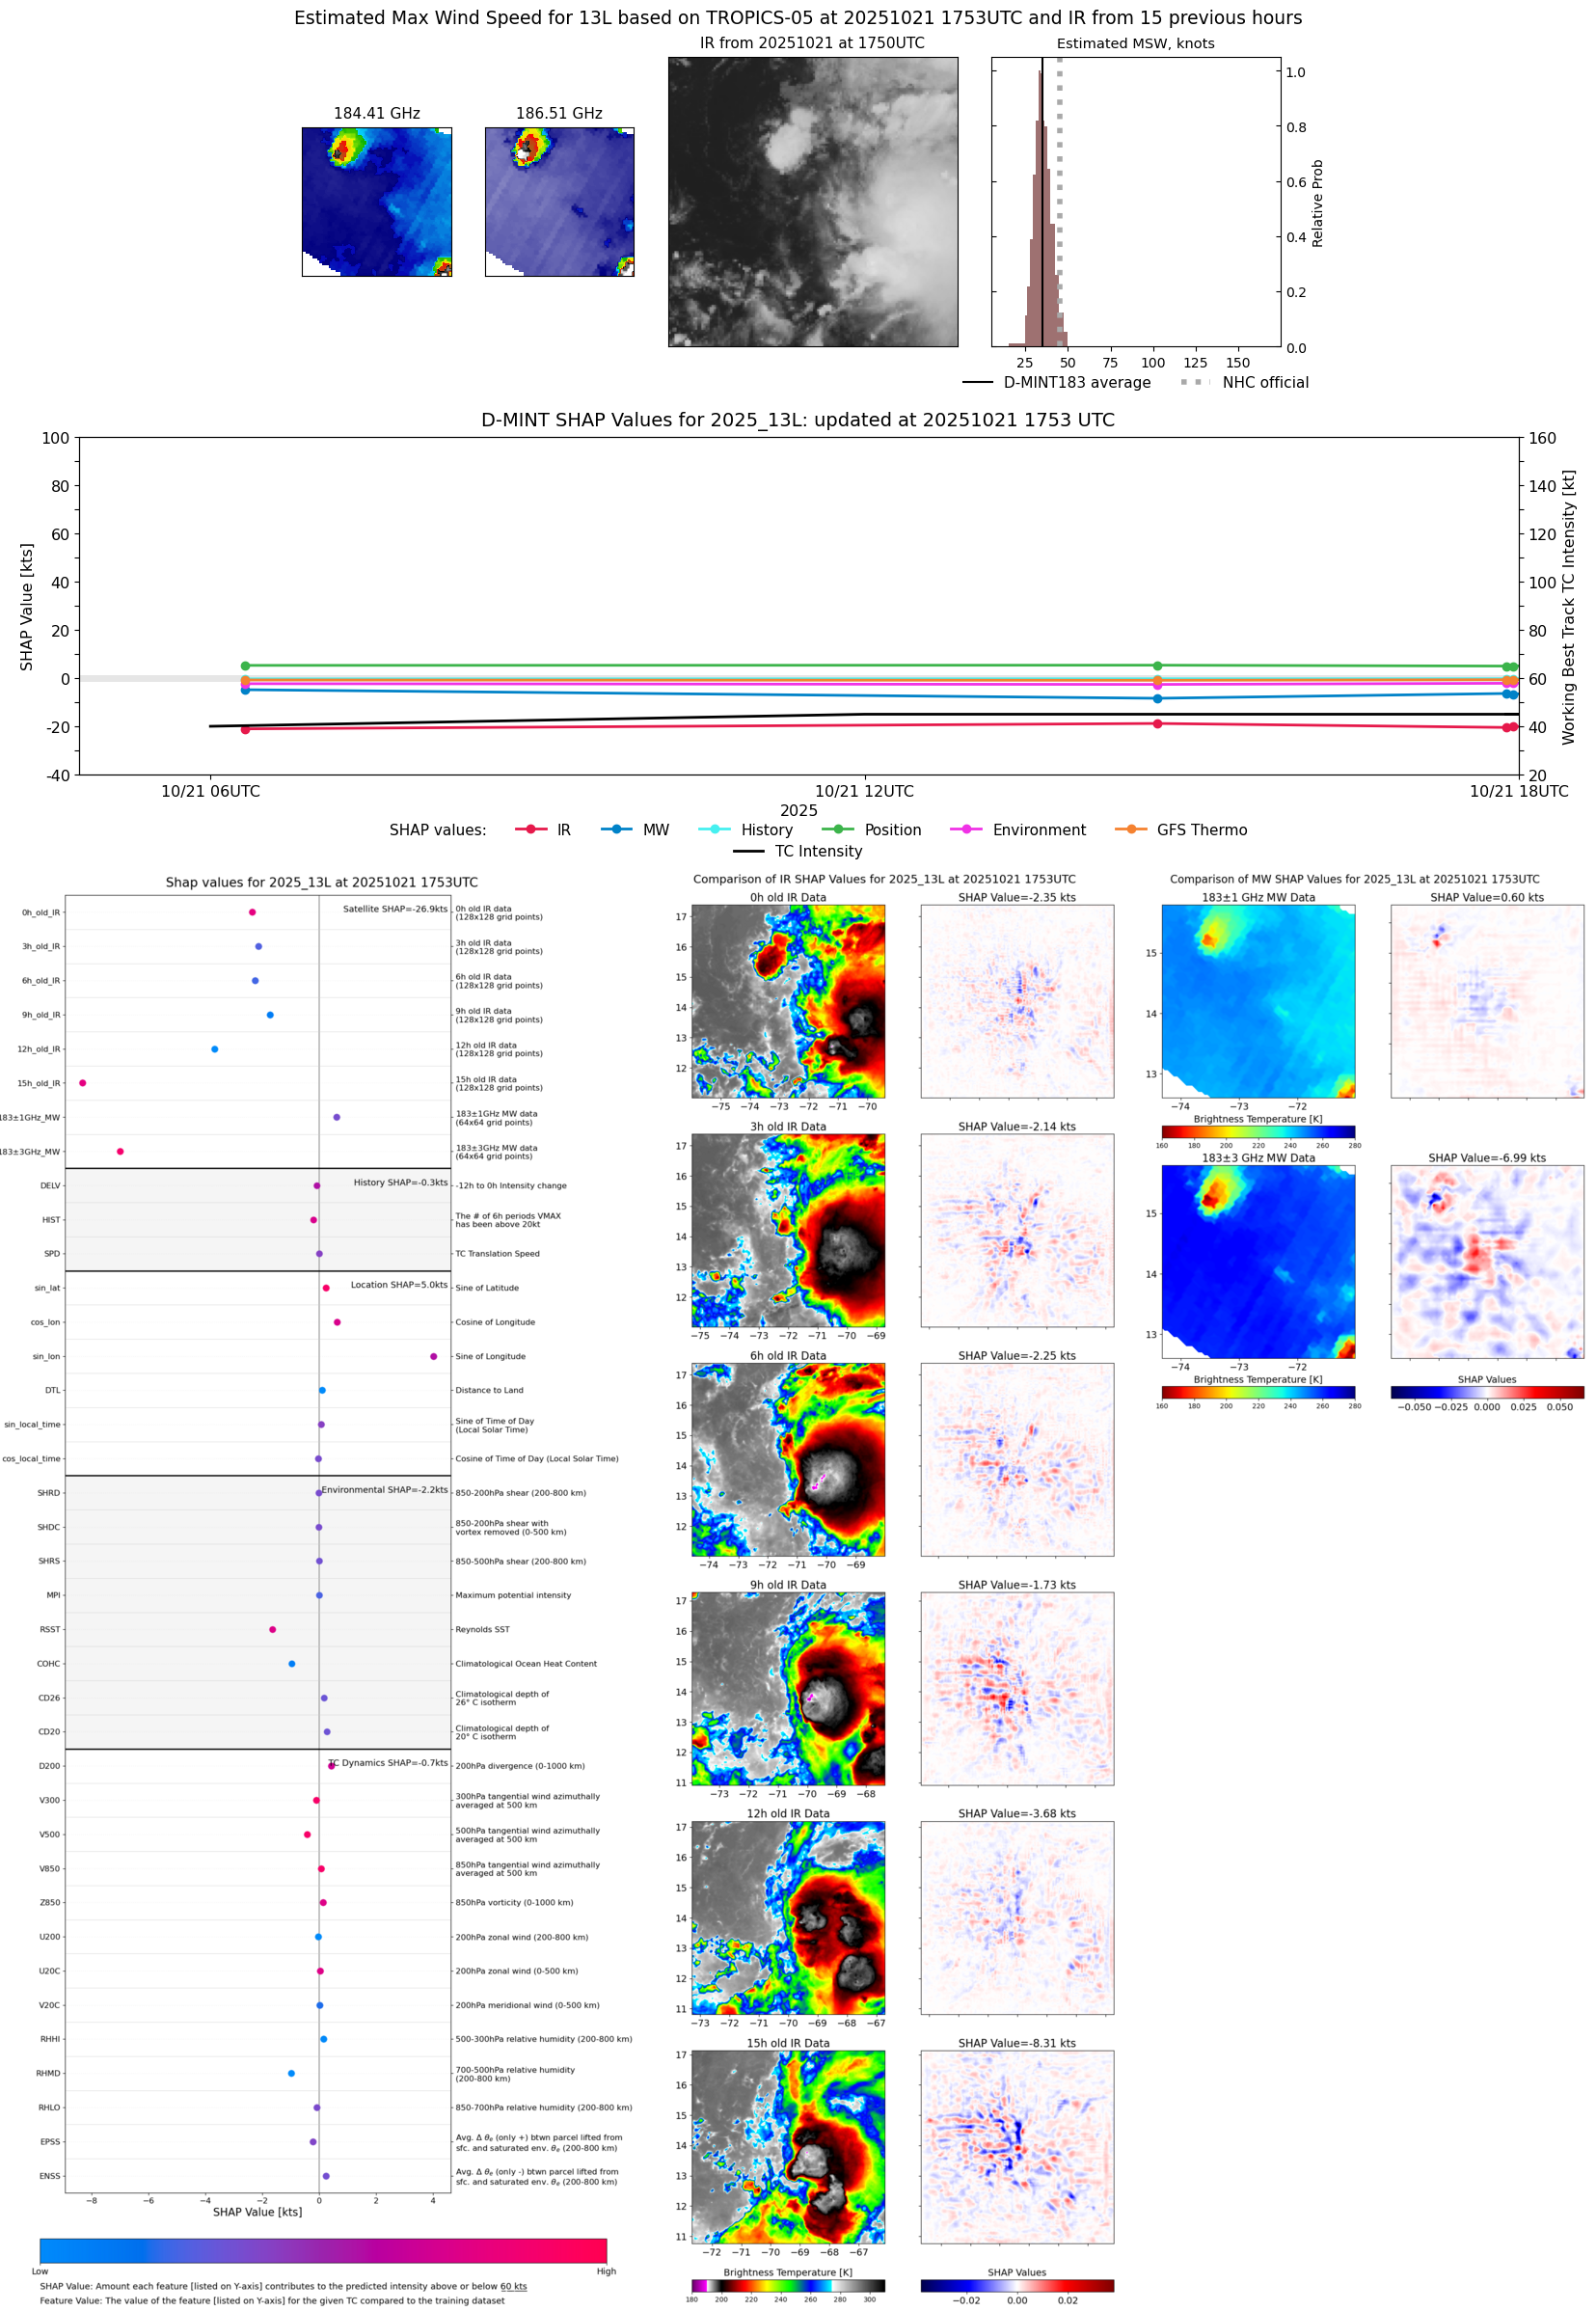 |
| 20251021 | 1604 UTC | GMI | 1005 hPa | 36 kts | 33 kts | 40 kts |  |
| 20251021 | 1558 UTC | GMI | 1005 hPa | 36 kts | 33 kts | 40 kts | 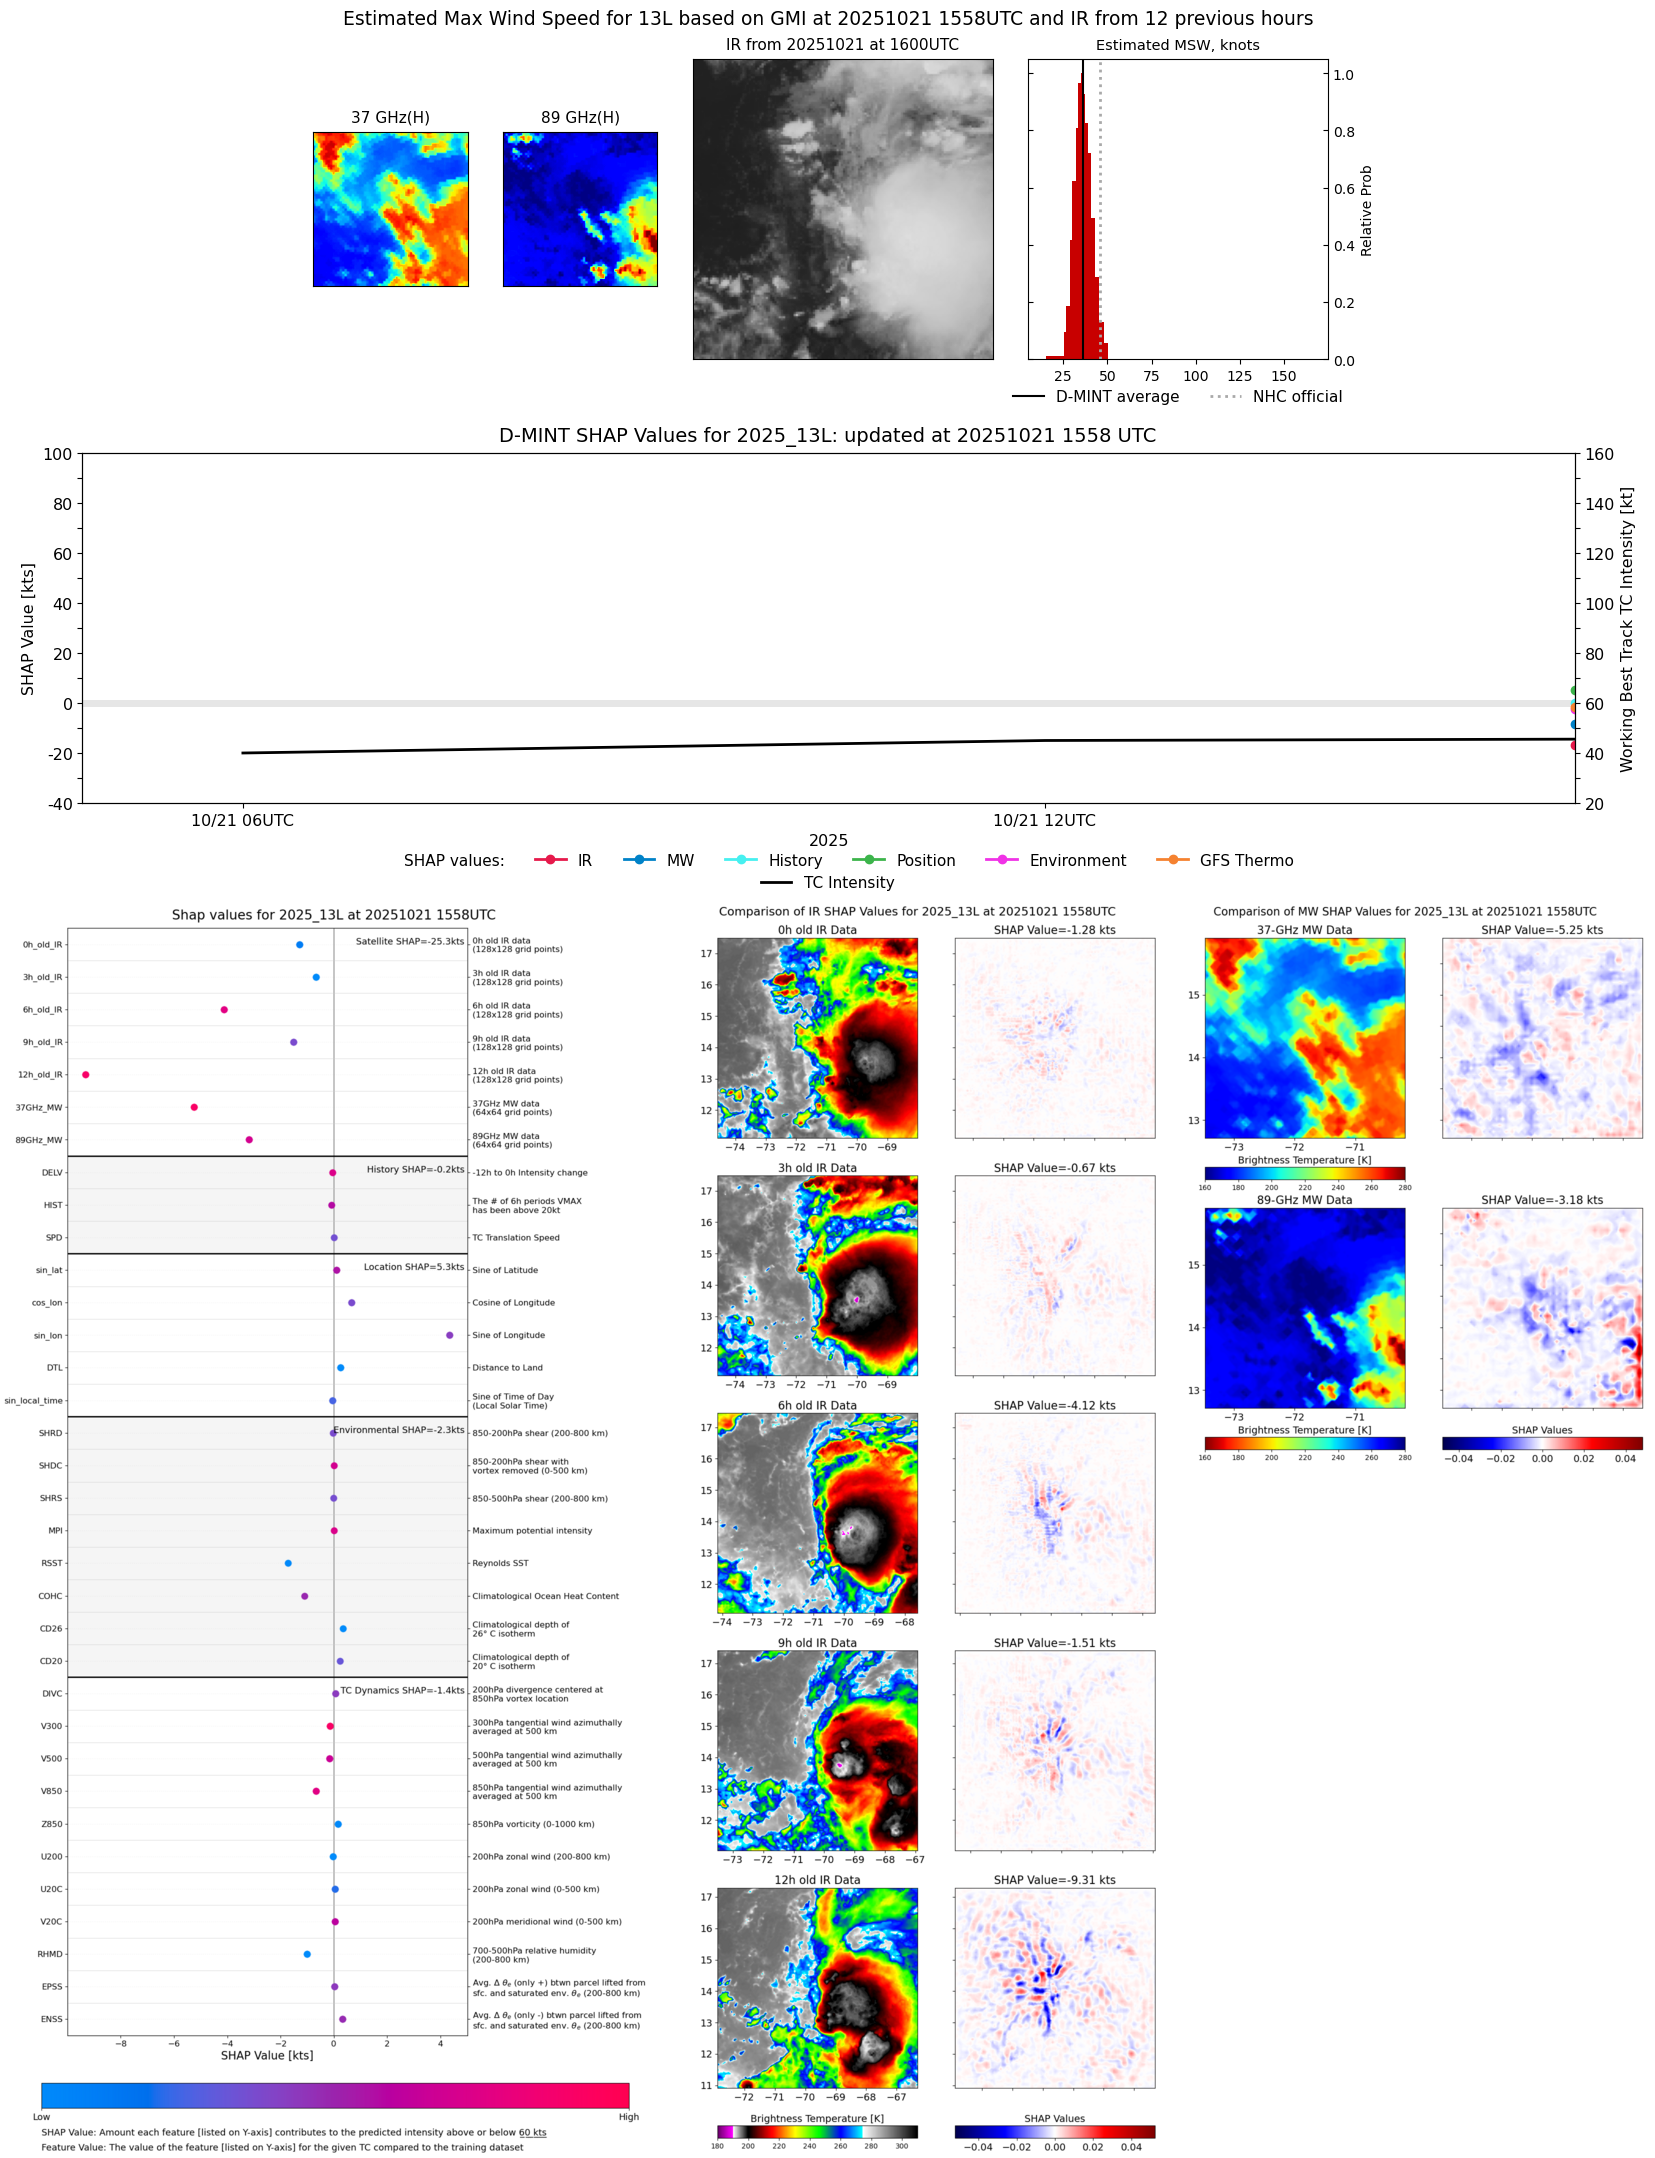 |
| 20251021 | 1441 UTC | TMS05 | 1004 hPa | 34 kts | 31 kts | 39 kts | 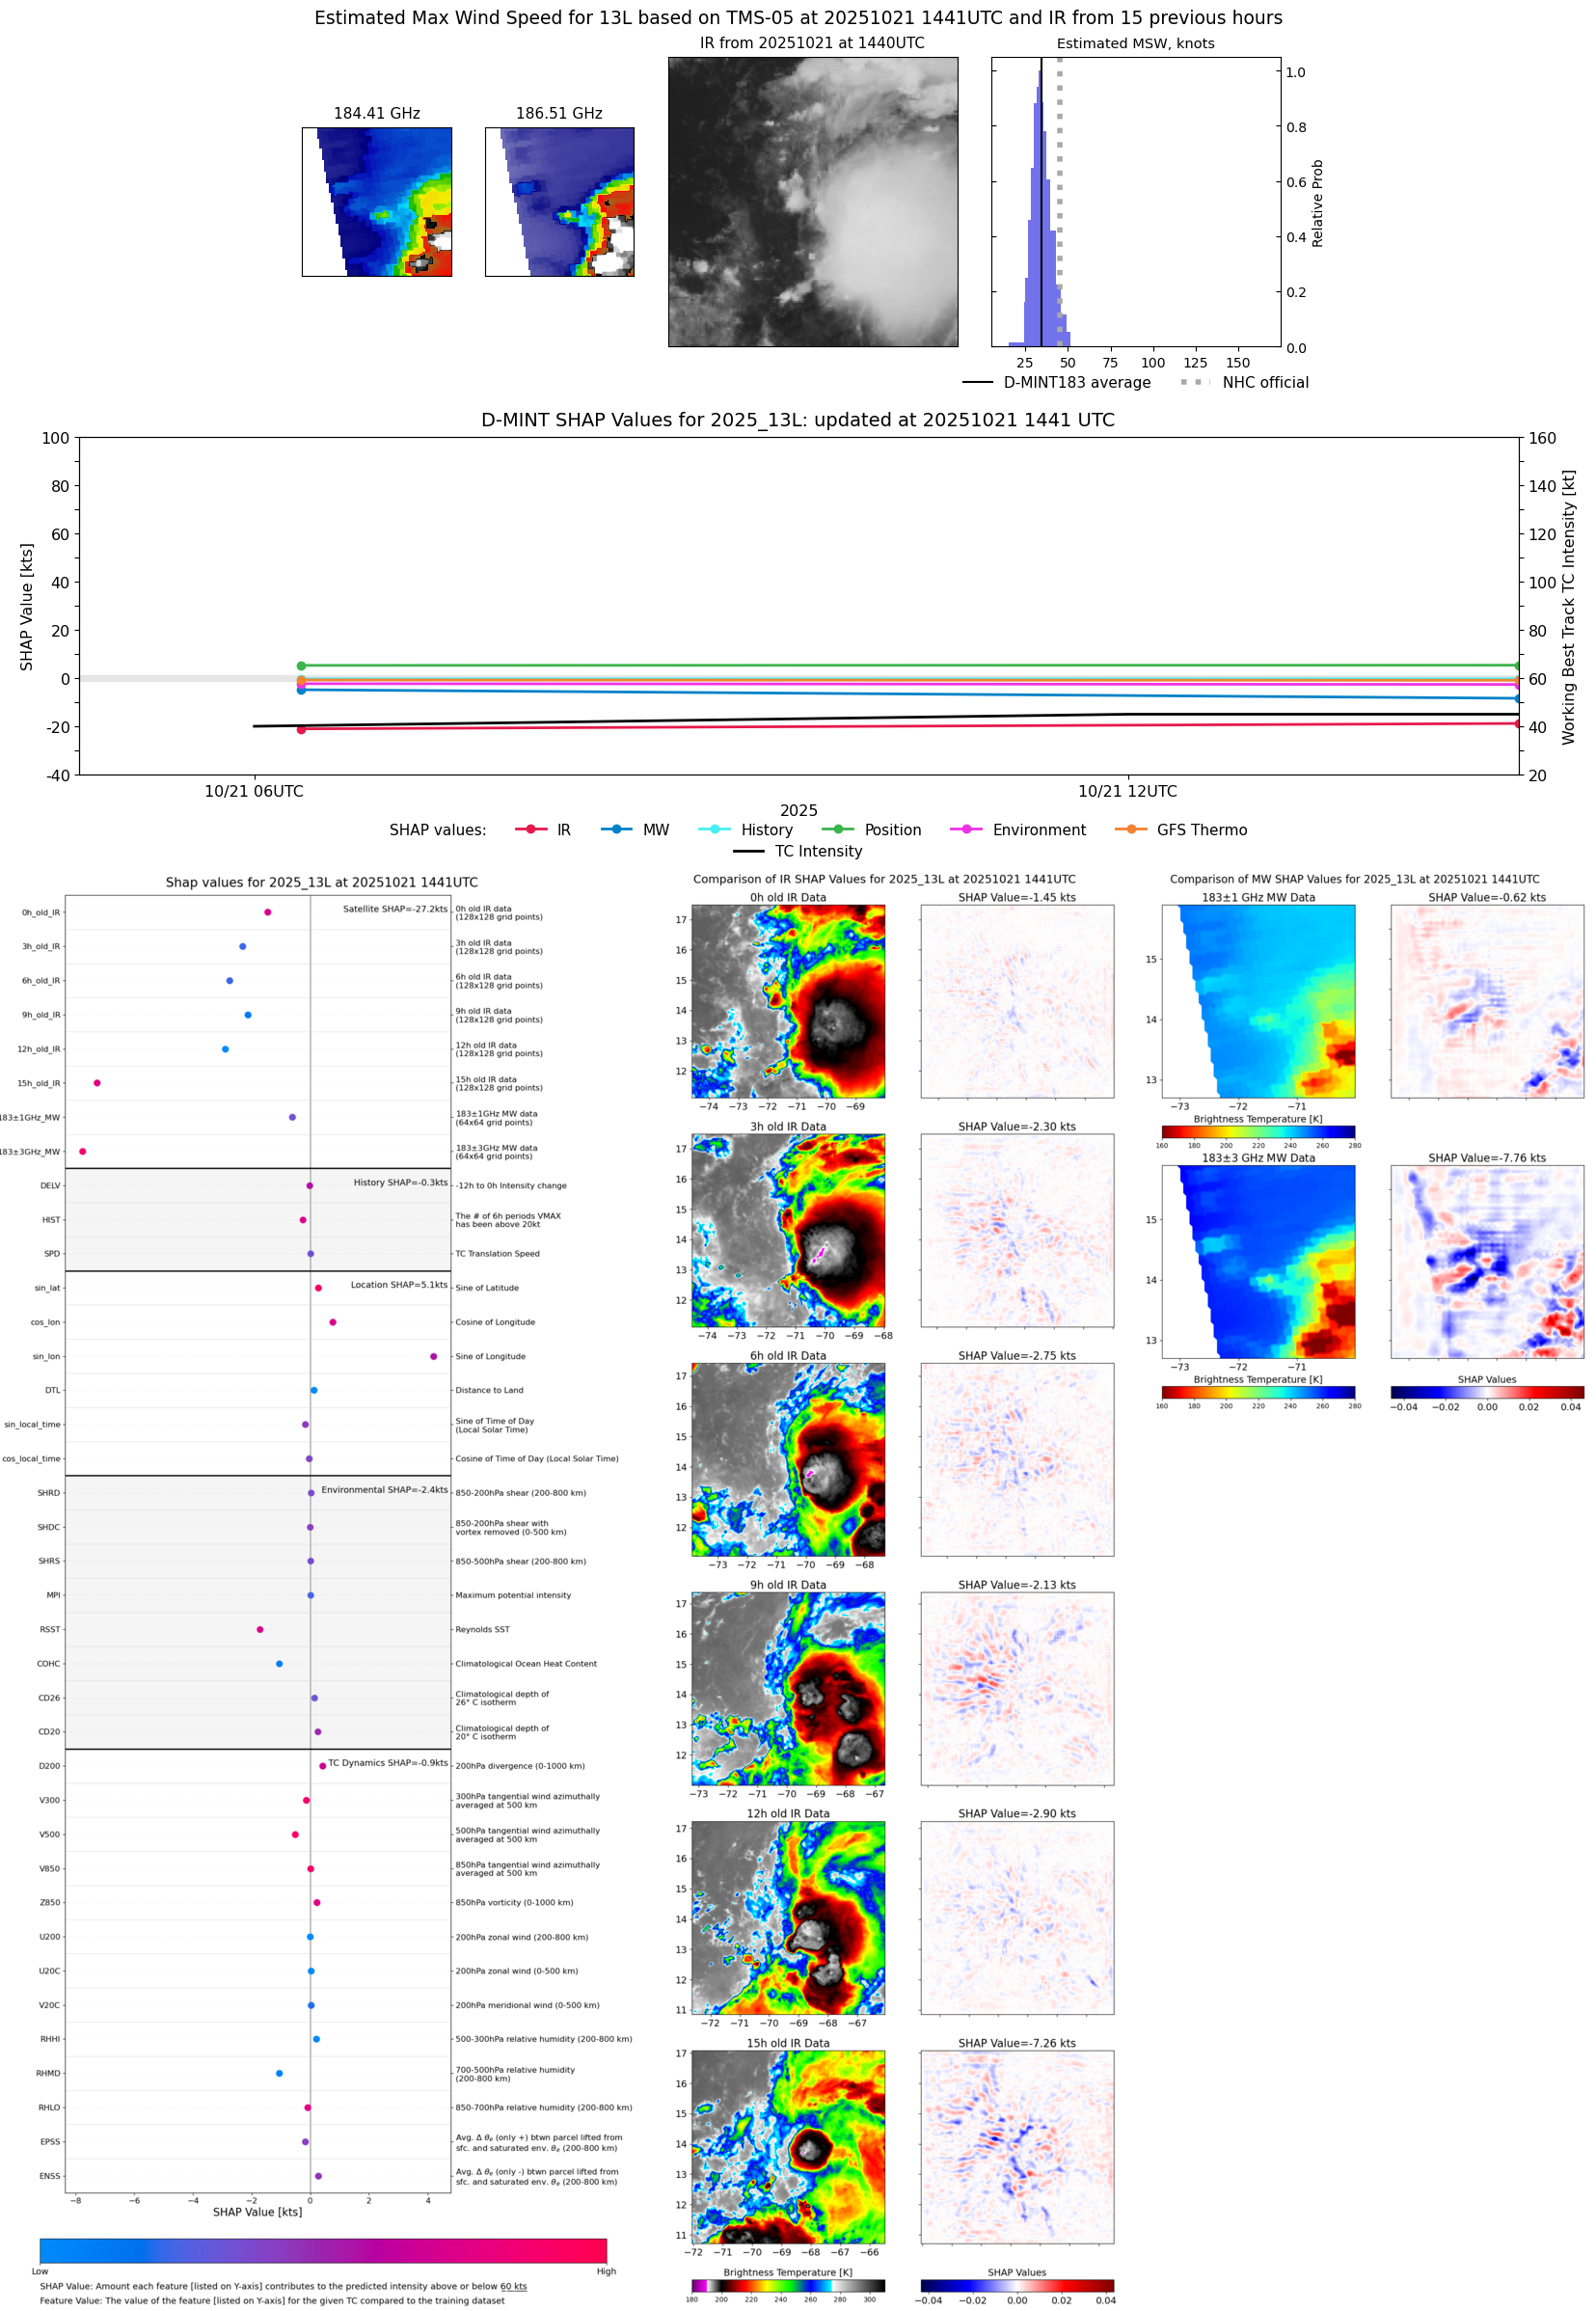 |
| 20251021 | 1030 UTC | WSFM01 | 1005 hPa | 33 kts | 29 kts | 38 kts |  |
| 20251021 | 0619 UTC | ATMS-N21 | 1004 hPa | 36 kts | 33 kts | 40 kts | 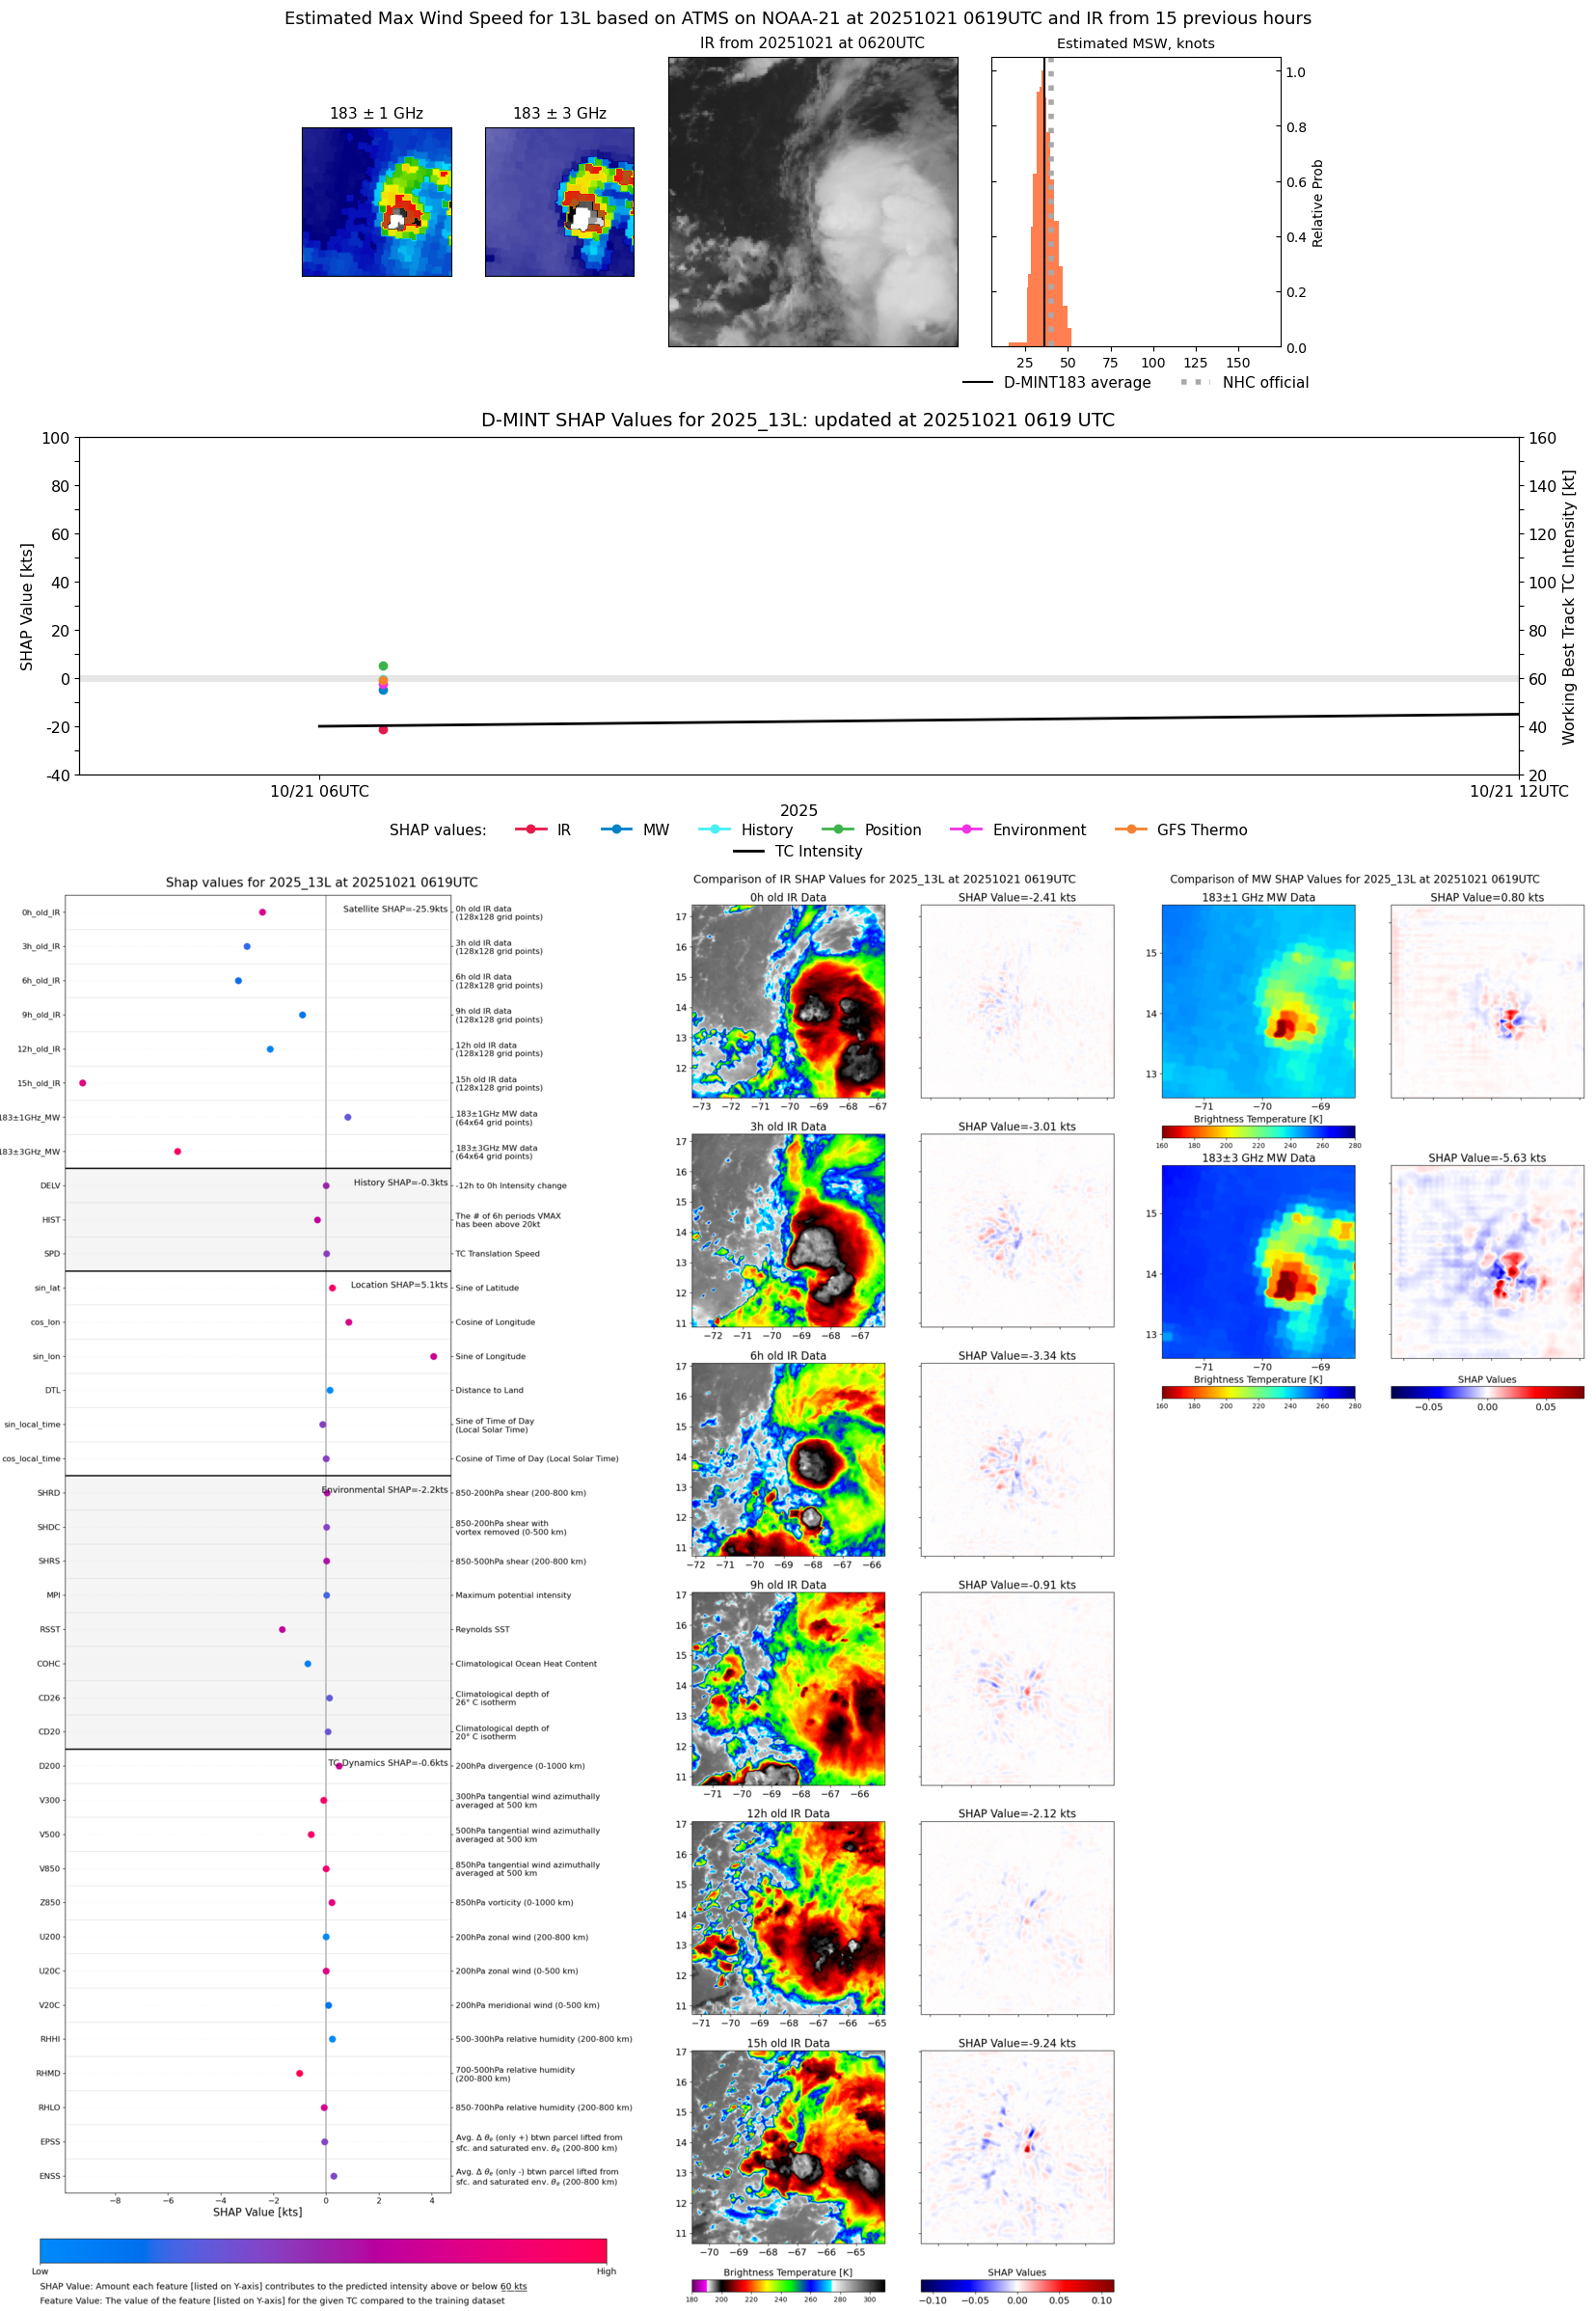 |
| 20251020 | 2243 UTC | SSMISF17 | NaN hPa | 33 kts | 29 kts | 38 kts |  |
| 20251019 | 1555 UTC | GMI | NaN hPa | 27 kts | 24 kts | 31 kts |  |
| 20251019 | 1104 UTC | SSMISF16 | NaN hPa | 33 kts | 29 kts | 38 kts |  |
| 20251019 | 0527 UTC | AMSR2 | NaN hPa | 32 kts | 28 kts | 36 kts |  |
| 20251018 | 2228 UTC | SSMISF16 | NaN hPa | 33 kts | 29 kts | 38 kts | 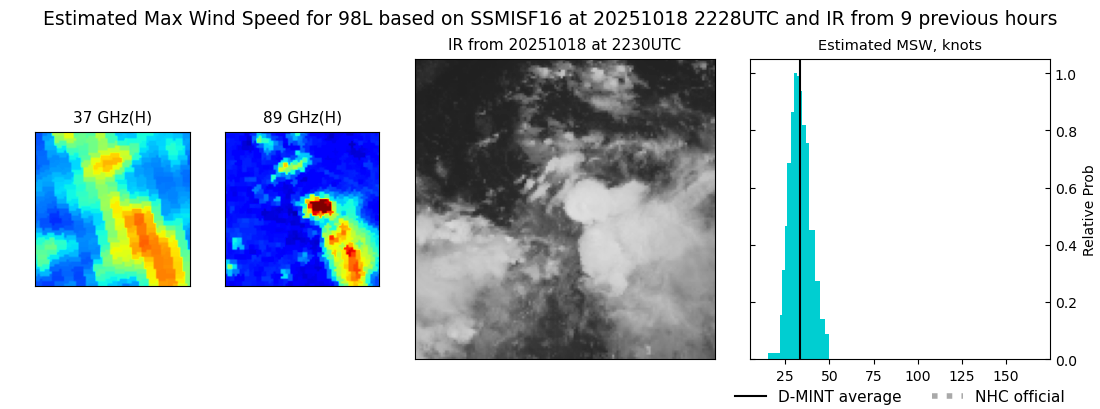 |
| 20251018 | 2129 UTC | SSMISF17 | NaN hPa | 34 kts | 30 kts | 38 kts |  |
| 20251018 | 1712 UTC | AMSR2 | NaN hPa | 27 kts | 24 kts | 30 kts | 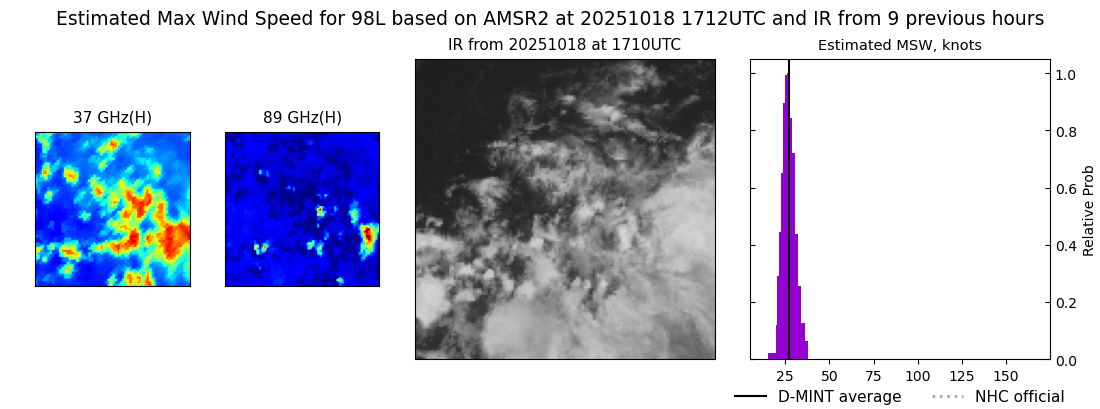 |