|
||

 |
D-MINT HISTORY FILE for 2025_13S
| Date | Time | MW Sensor | MSLP | Vmax (30th-70th percentile average) | Vmax 25th percentile | Vmax 75th percentile | Image |
| 20250212 | 2036 UTC | ATMS-N20 | 998 hPa | 22 kts | 20 kts | 25 kts | 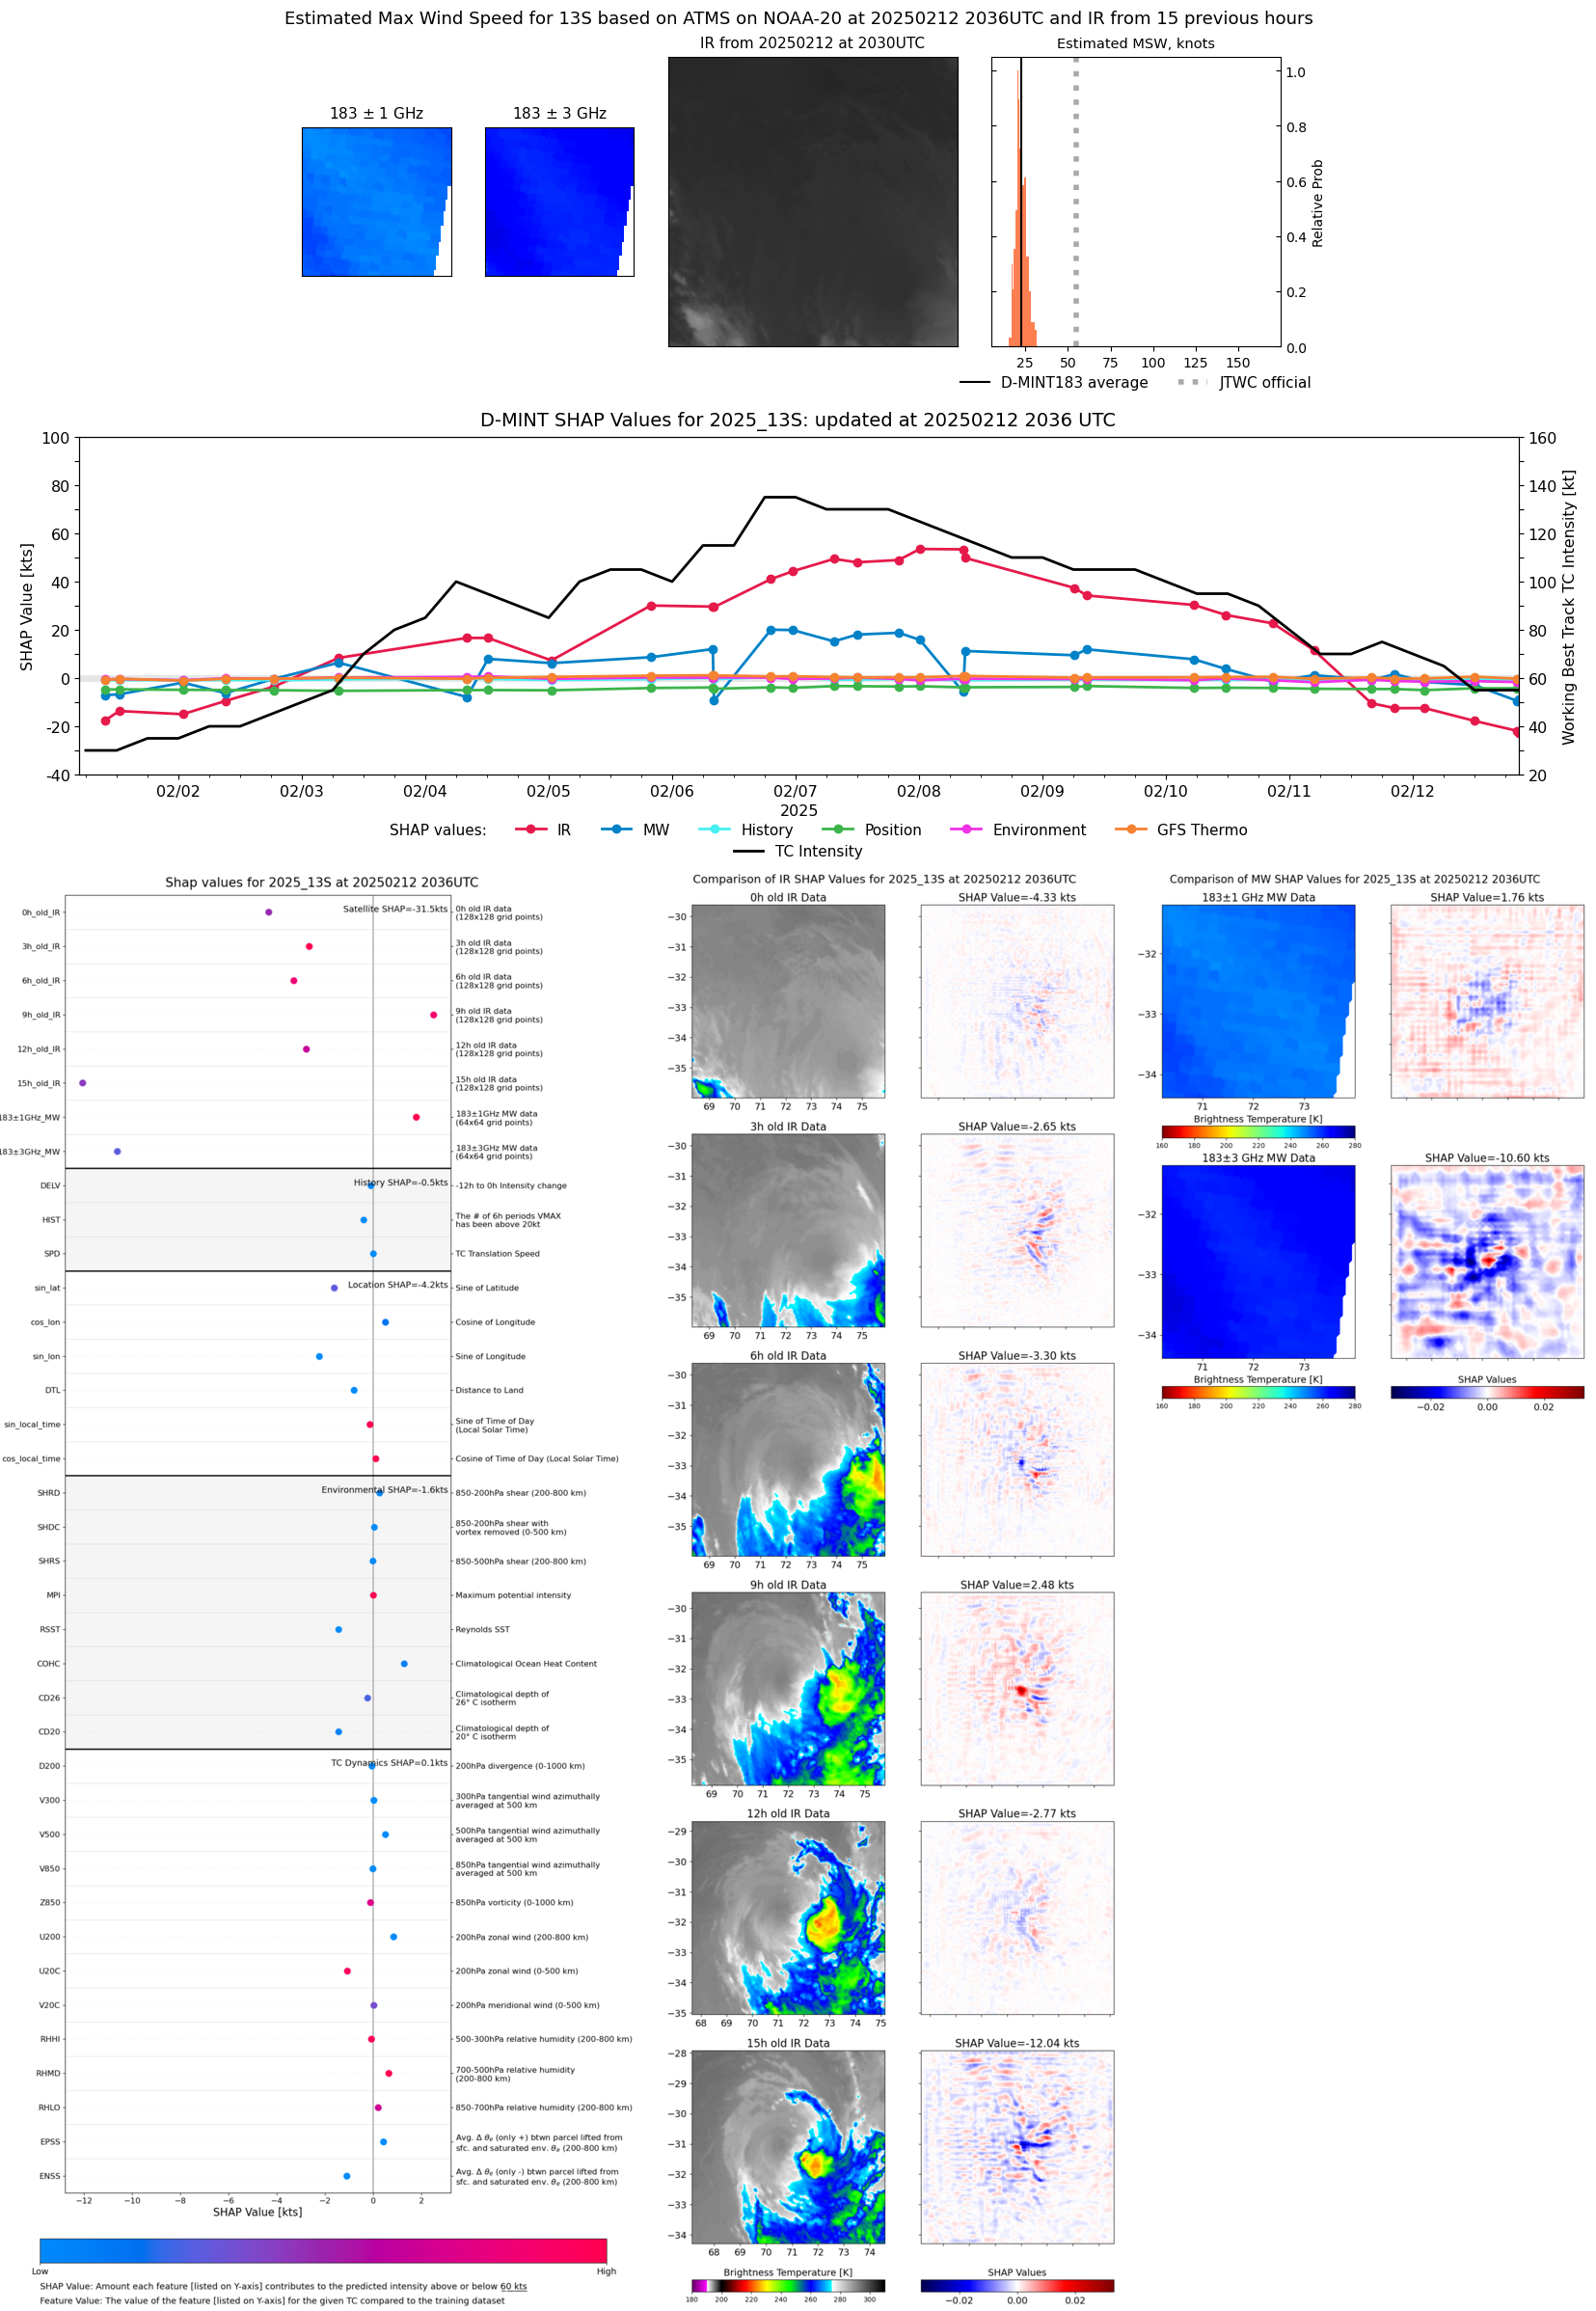 |
| 20250212 | 2012 UTC | ATMS-N20 | 999 hPa | 23 kts | 21 kts | 25 kts | 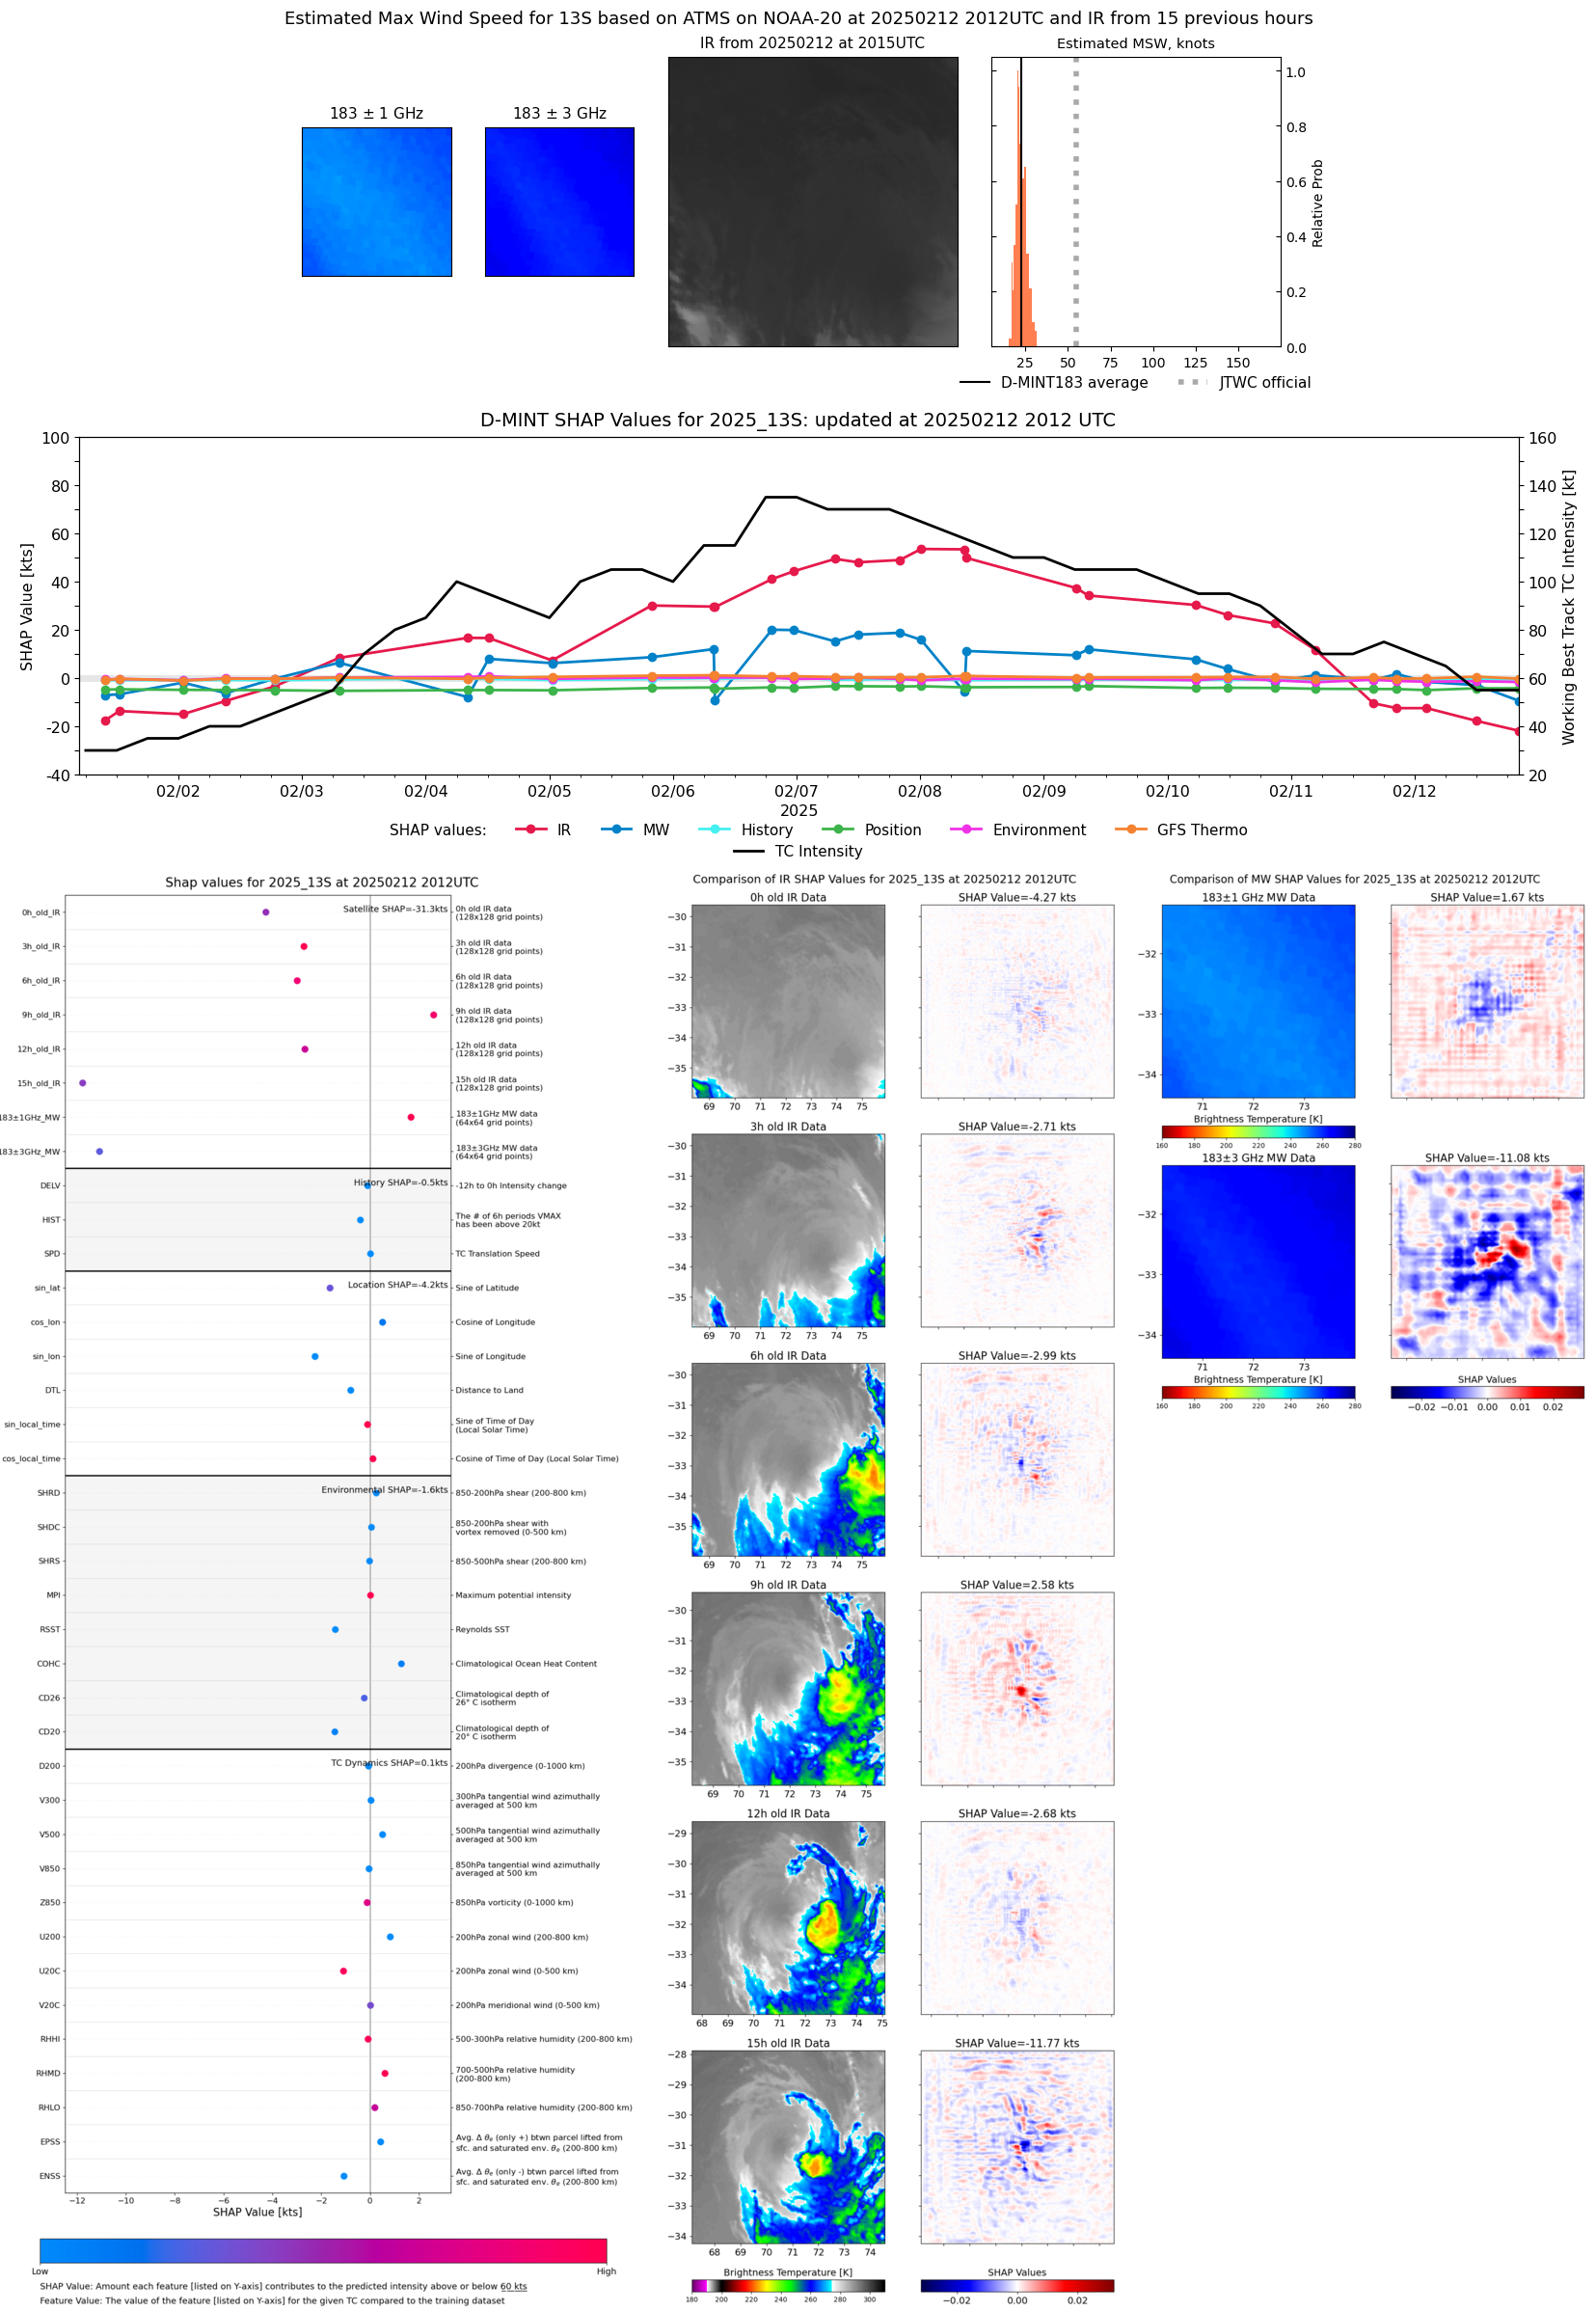 |
| 20250212 | 1159 UTC | TROPICS03 | 992 hPa | 34 kts | 31 kts | 39 kts | 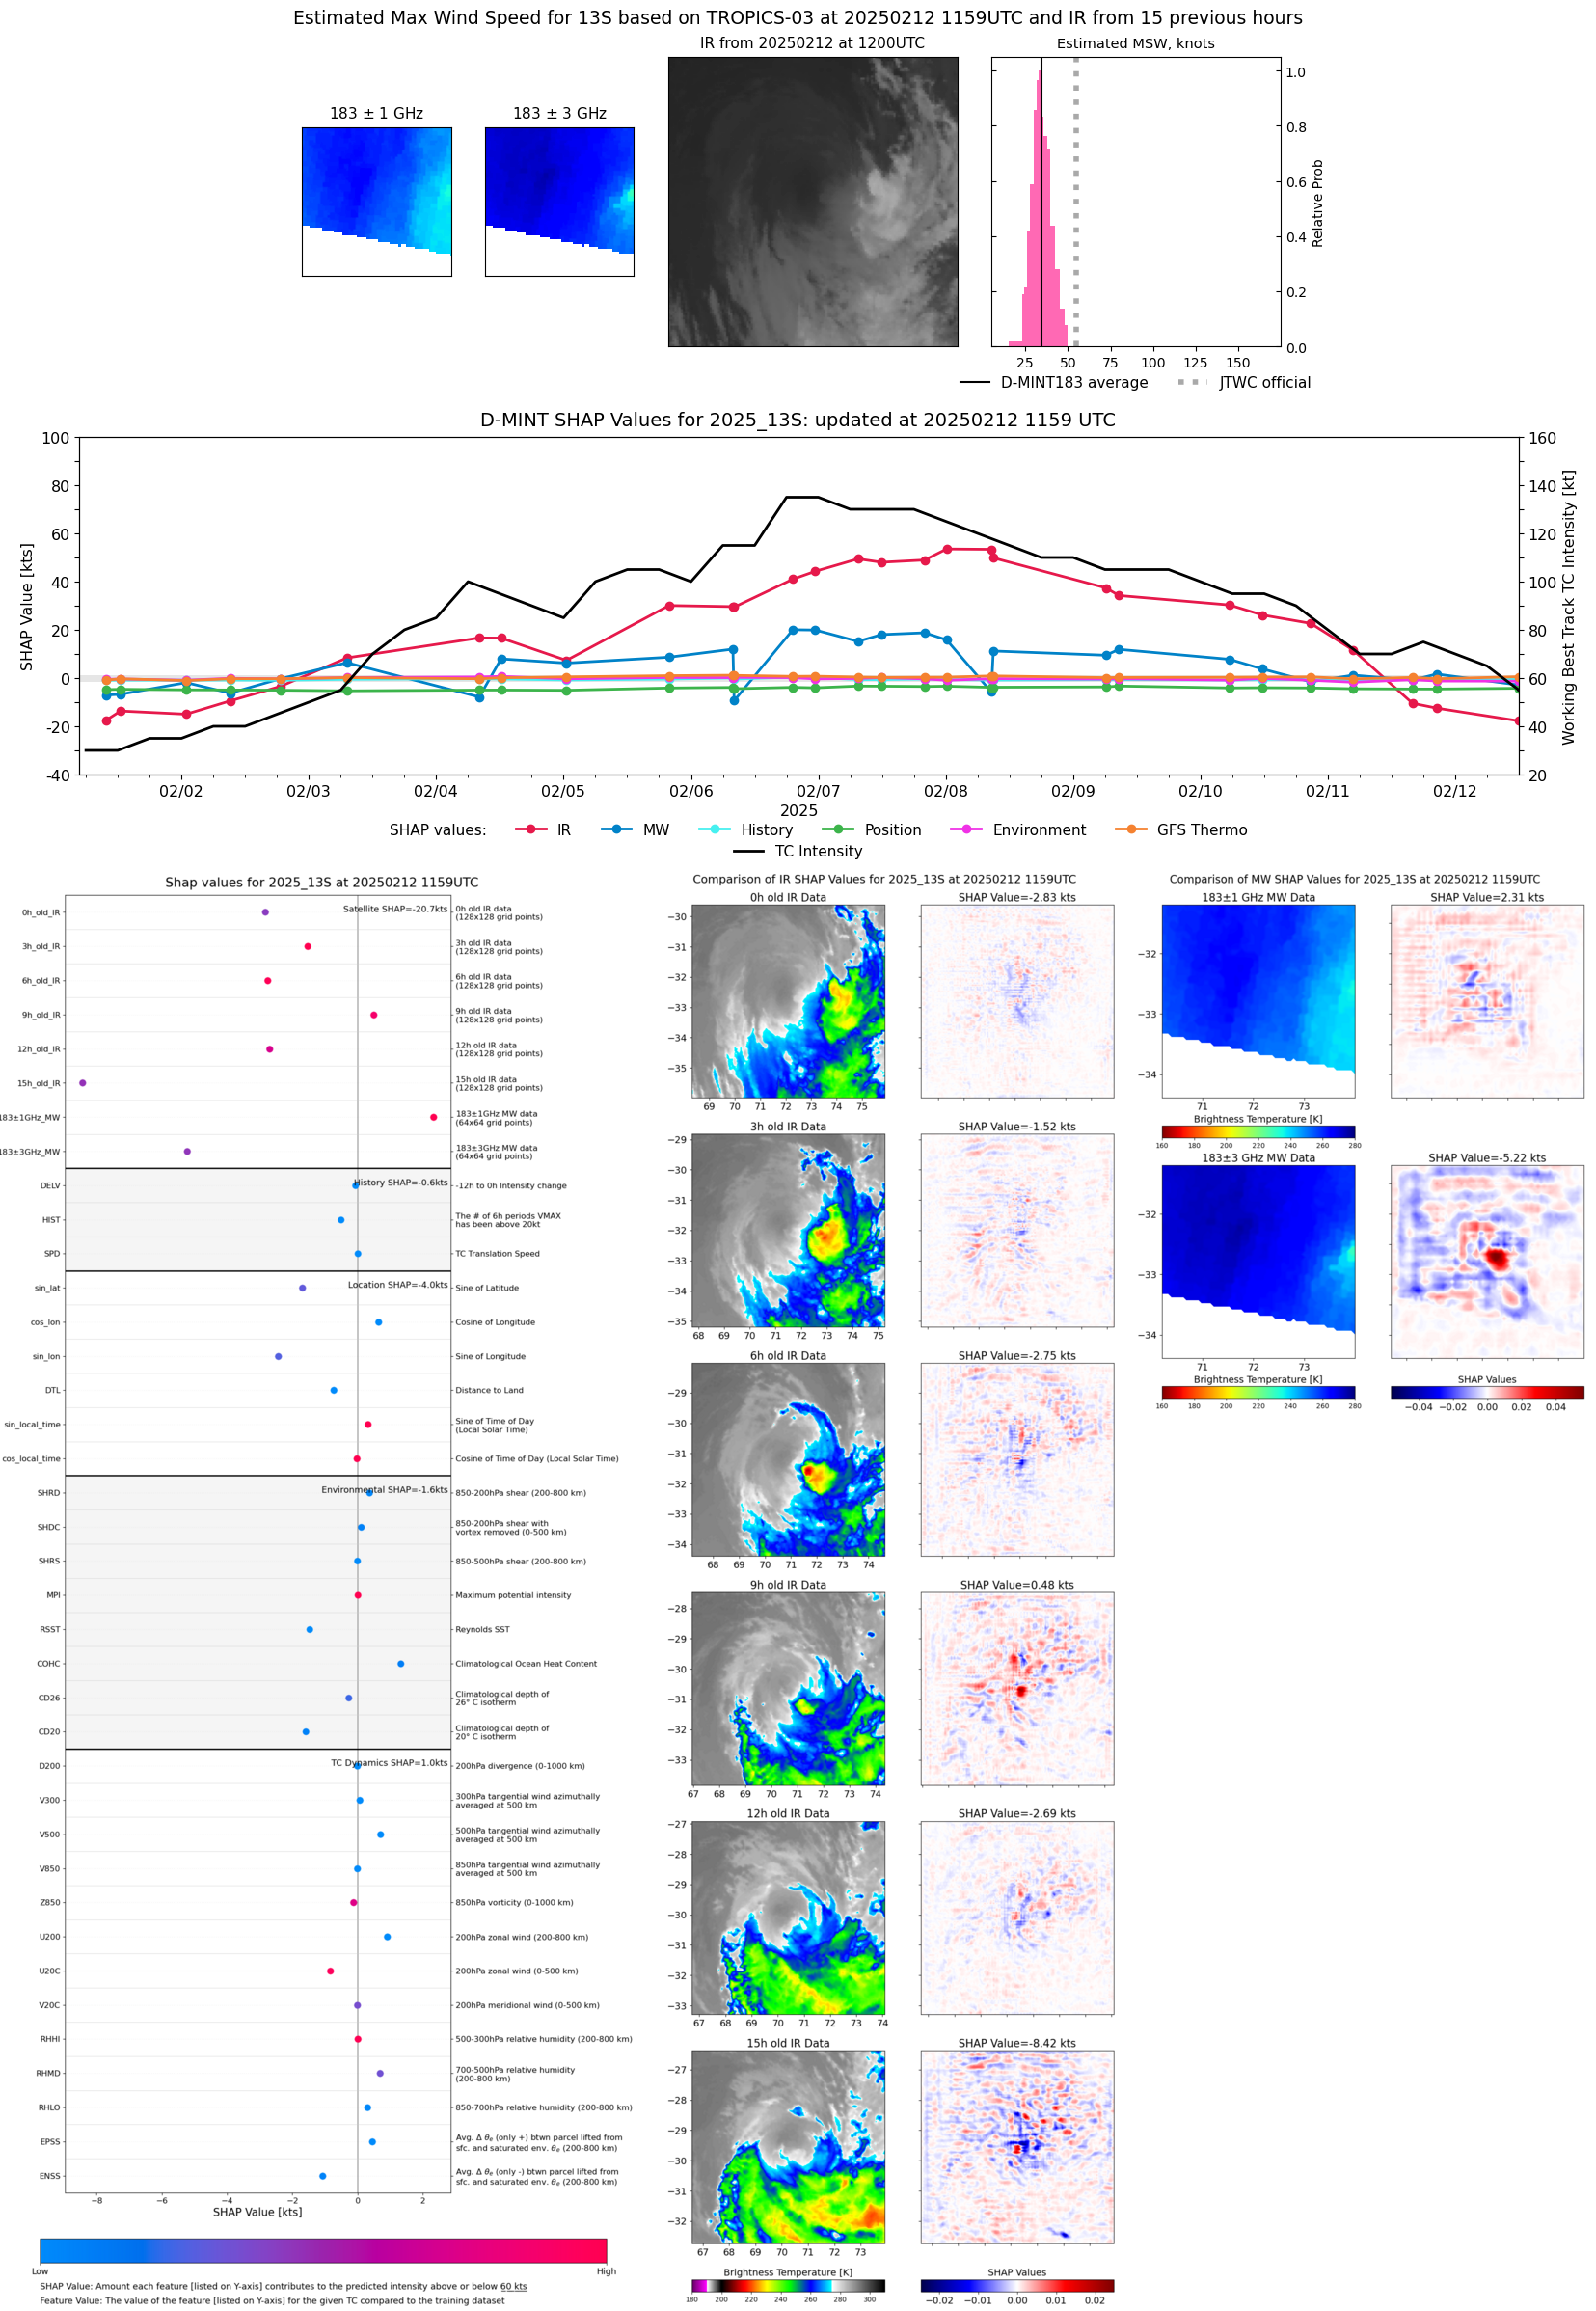 |
| 20250212 | 0855 UTC | ATMS-N20 | 994 hPa | 33 kts | 29 kts | 37 kts |  |
| 20250212 | 0219 UTC | TROPICS06 | 993 hPa | 39 kts | 35 kts | 44 kts | 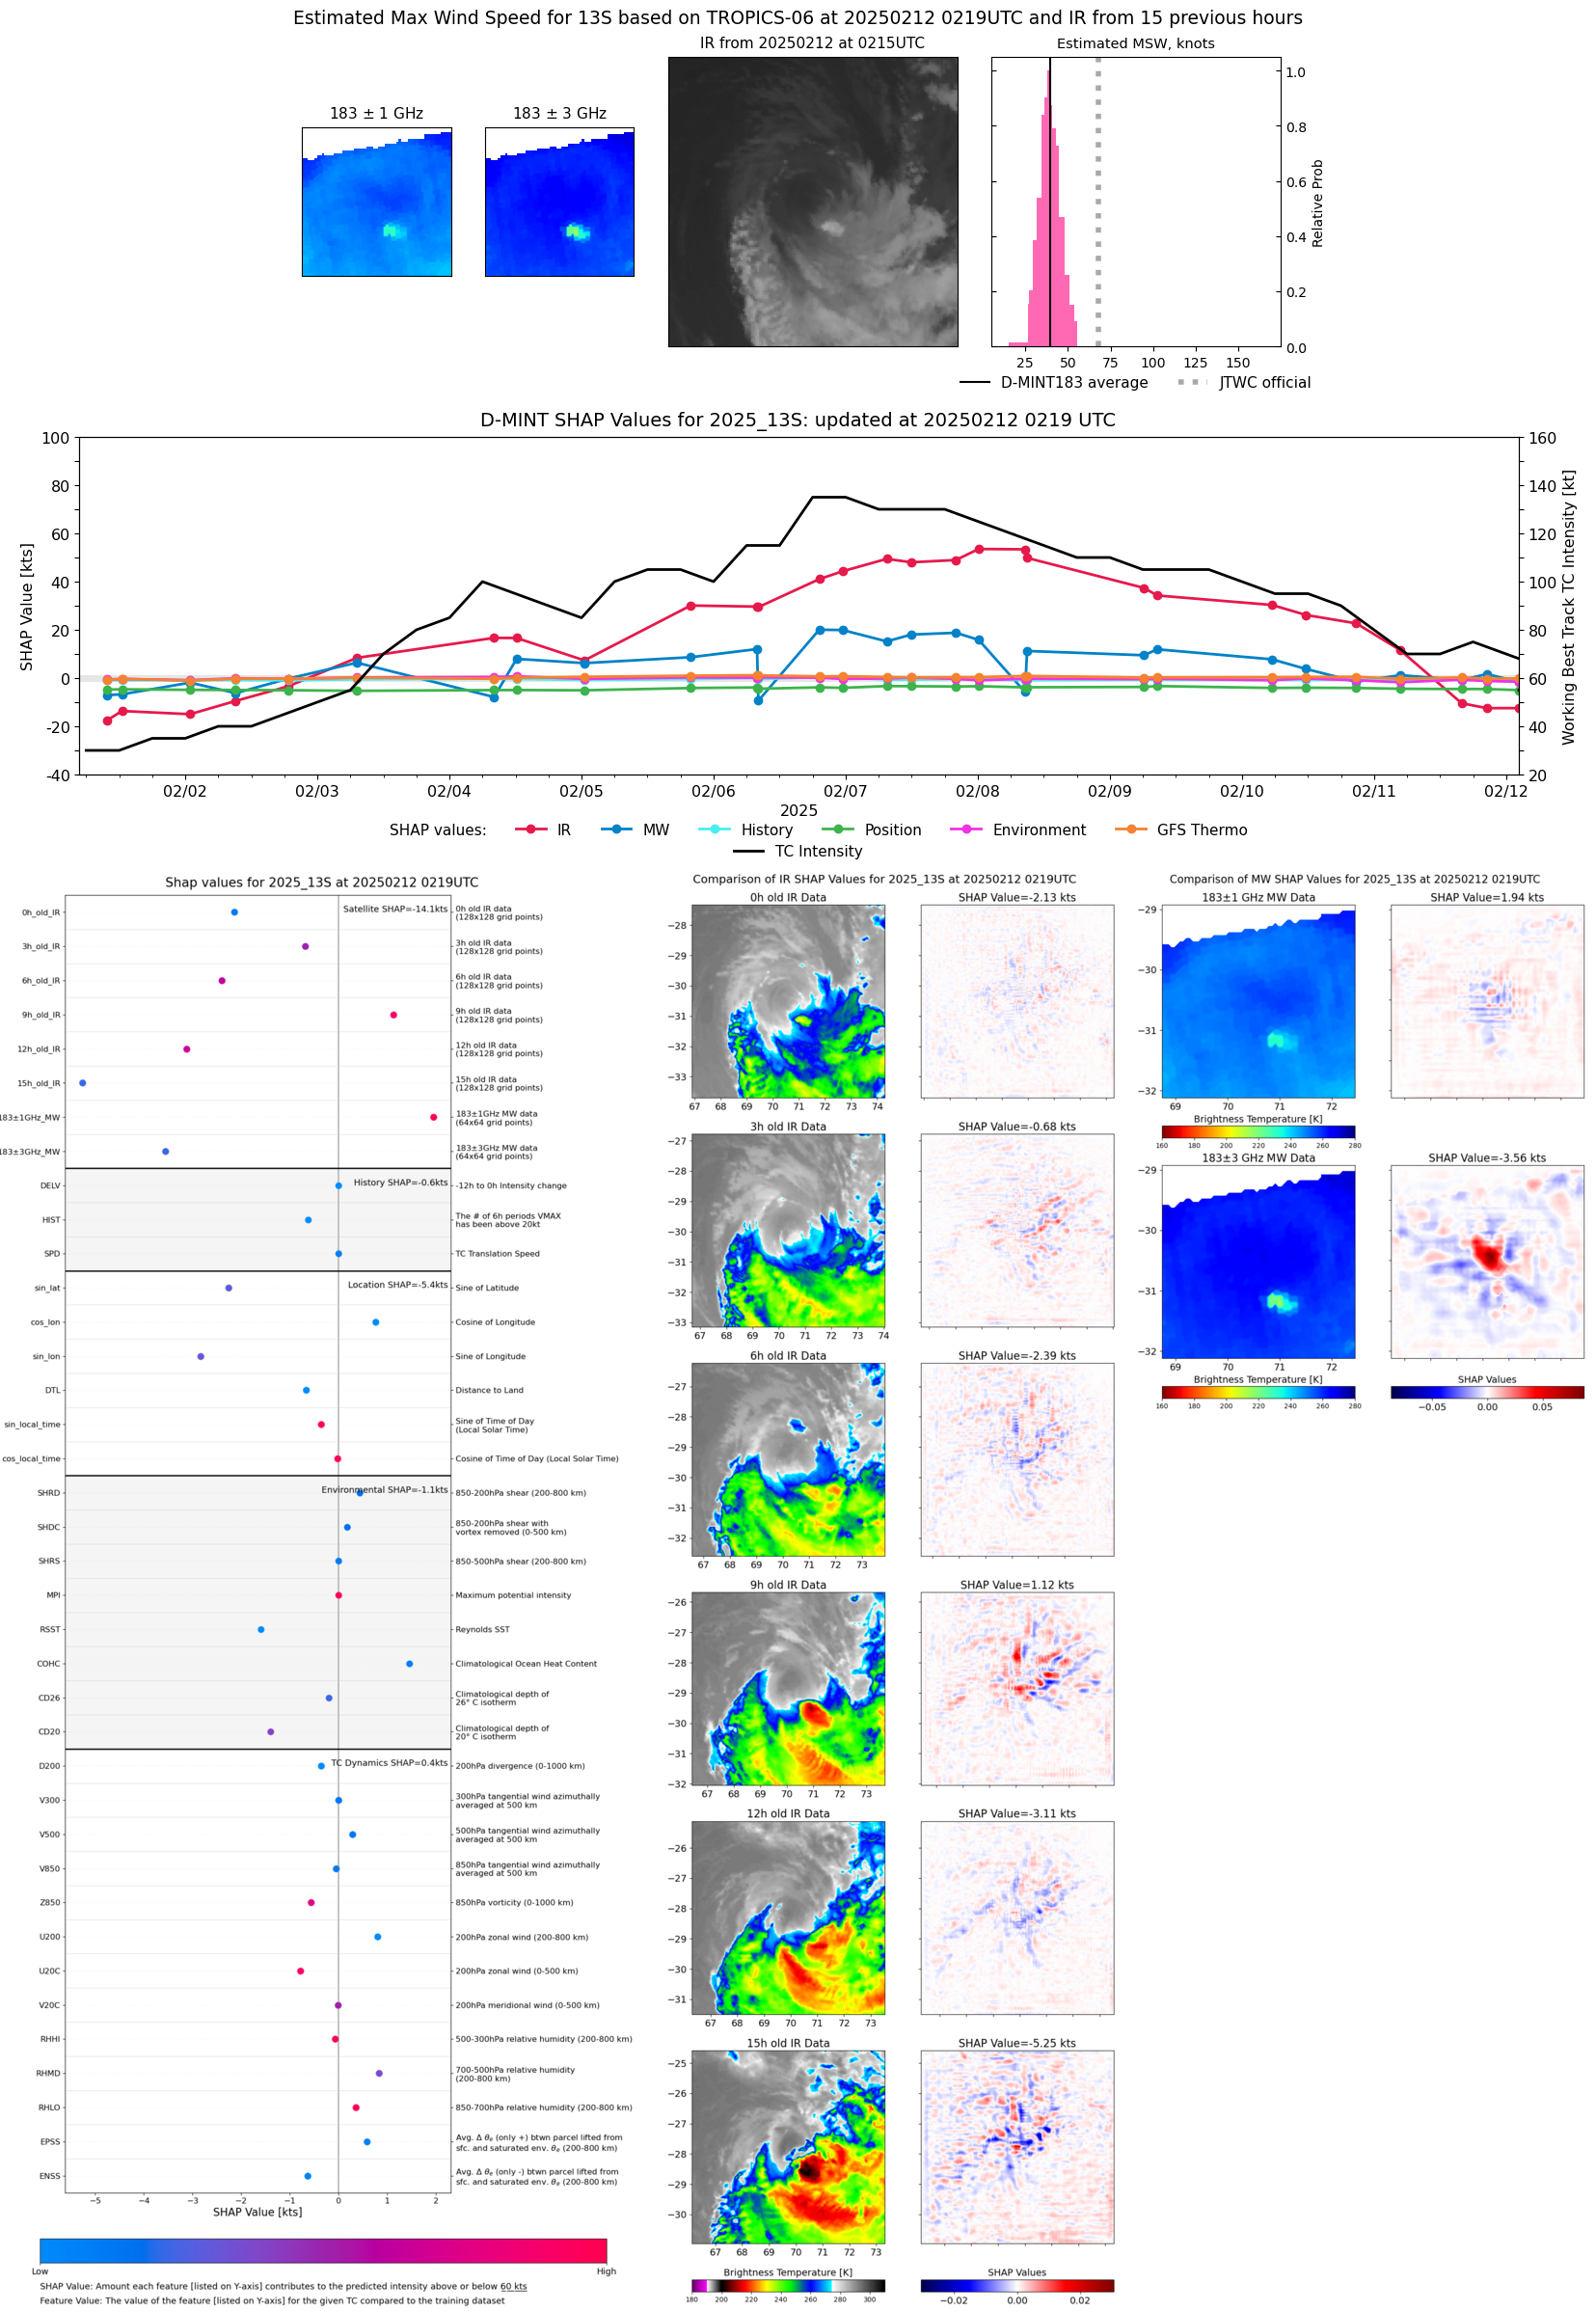 |
| 20250212 | 0044 UTC | SSMISF16 | 993 hPa | 31 kts | 27 kts | 35 kts | 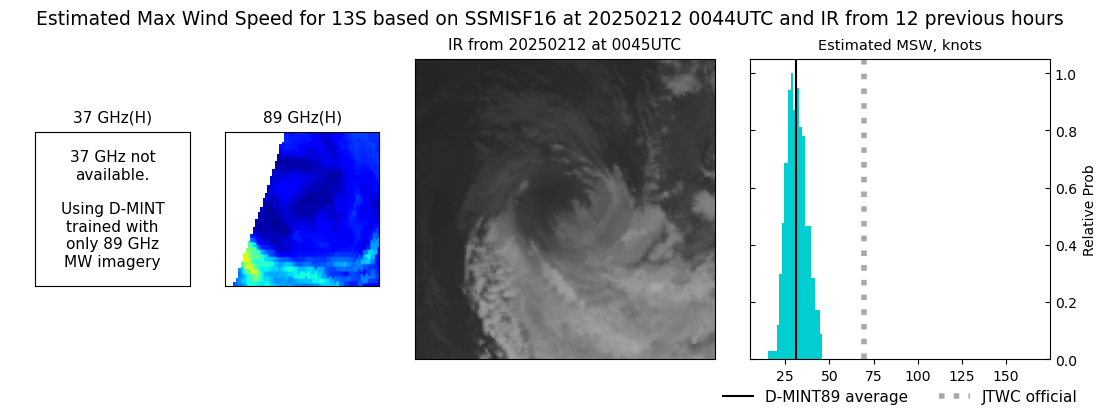 |
| 20250211 | 2030 UTC | ATMS-N20 | 988 hPa | 43 kts | 39 kts | 48 kts |  |
| 20250211 | 1556 UTC | TROPICS03 | 987 hPa | 44 kts | 39 kts | 49 kts | 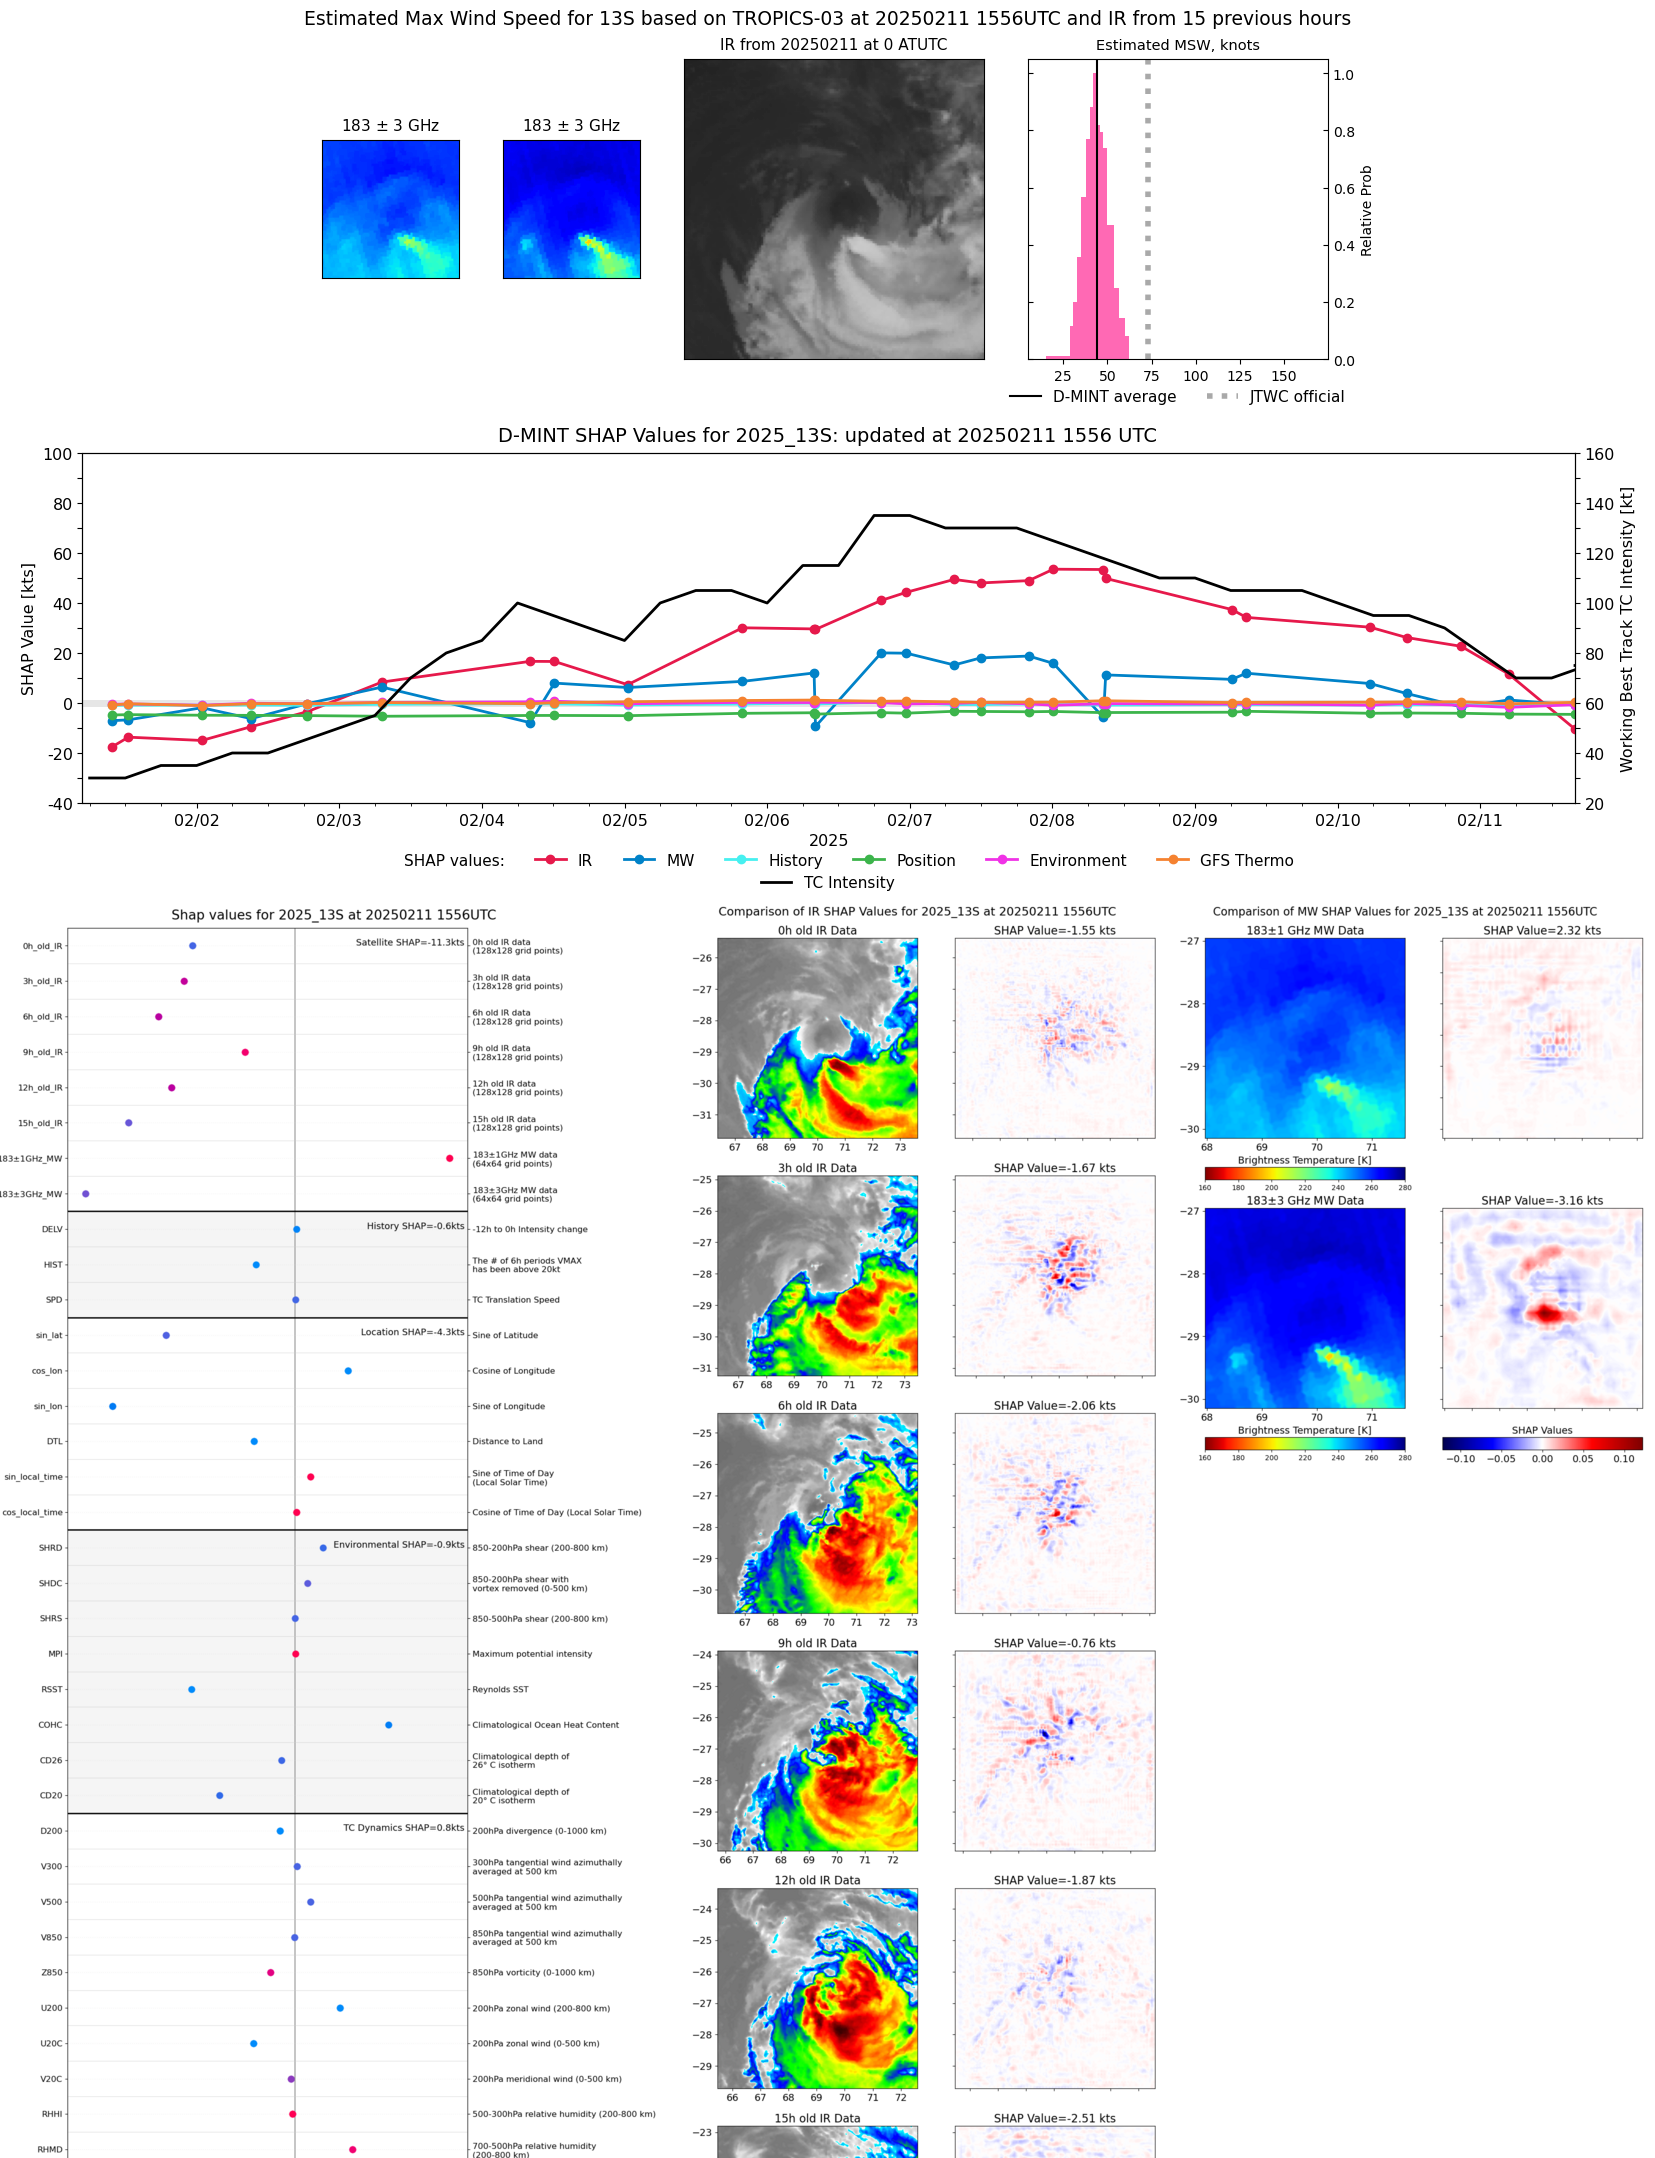 |
| 20250211 | 0855 UTC | AMSR2 | 981 hPa | 53 kts | 47 kts | 58 kts | 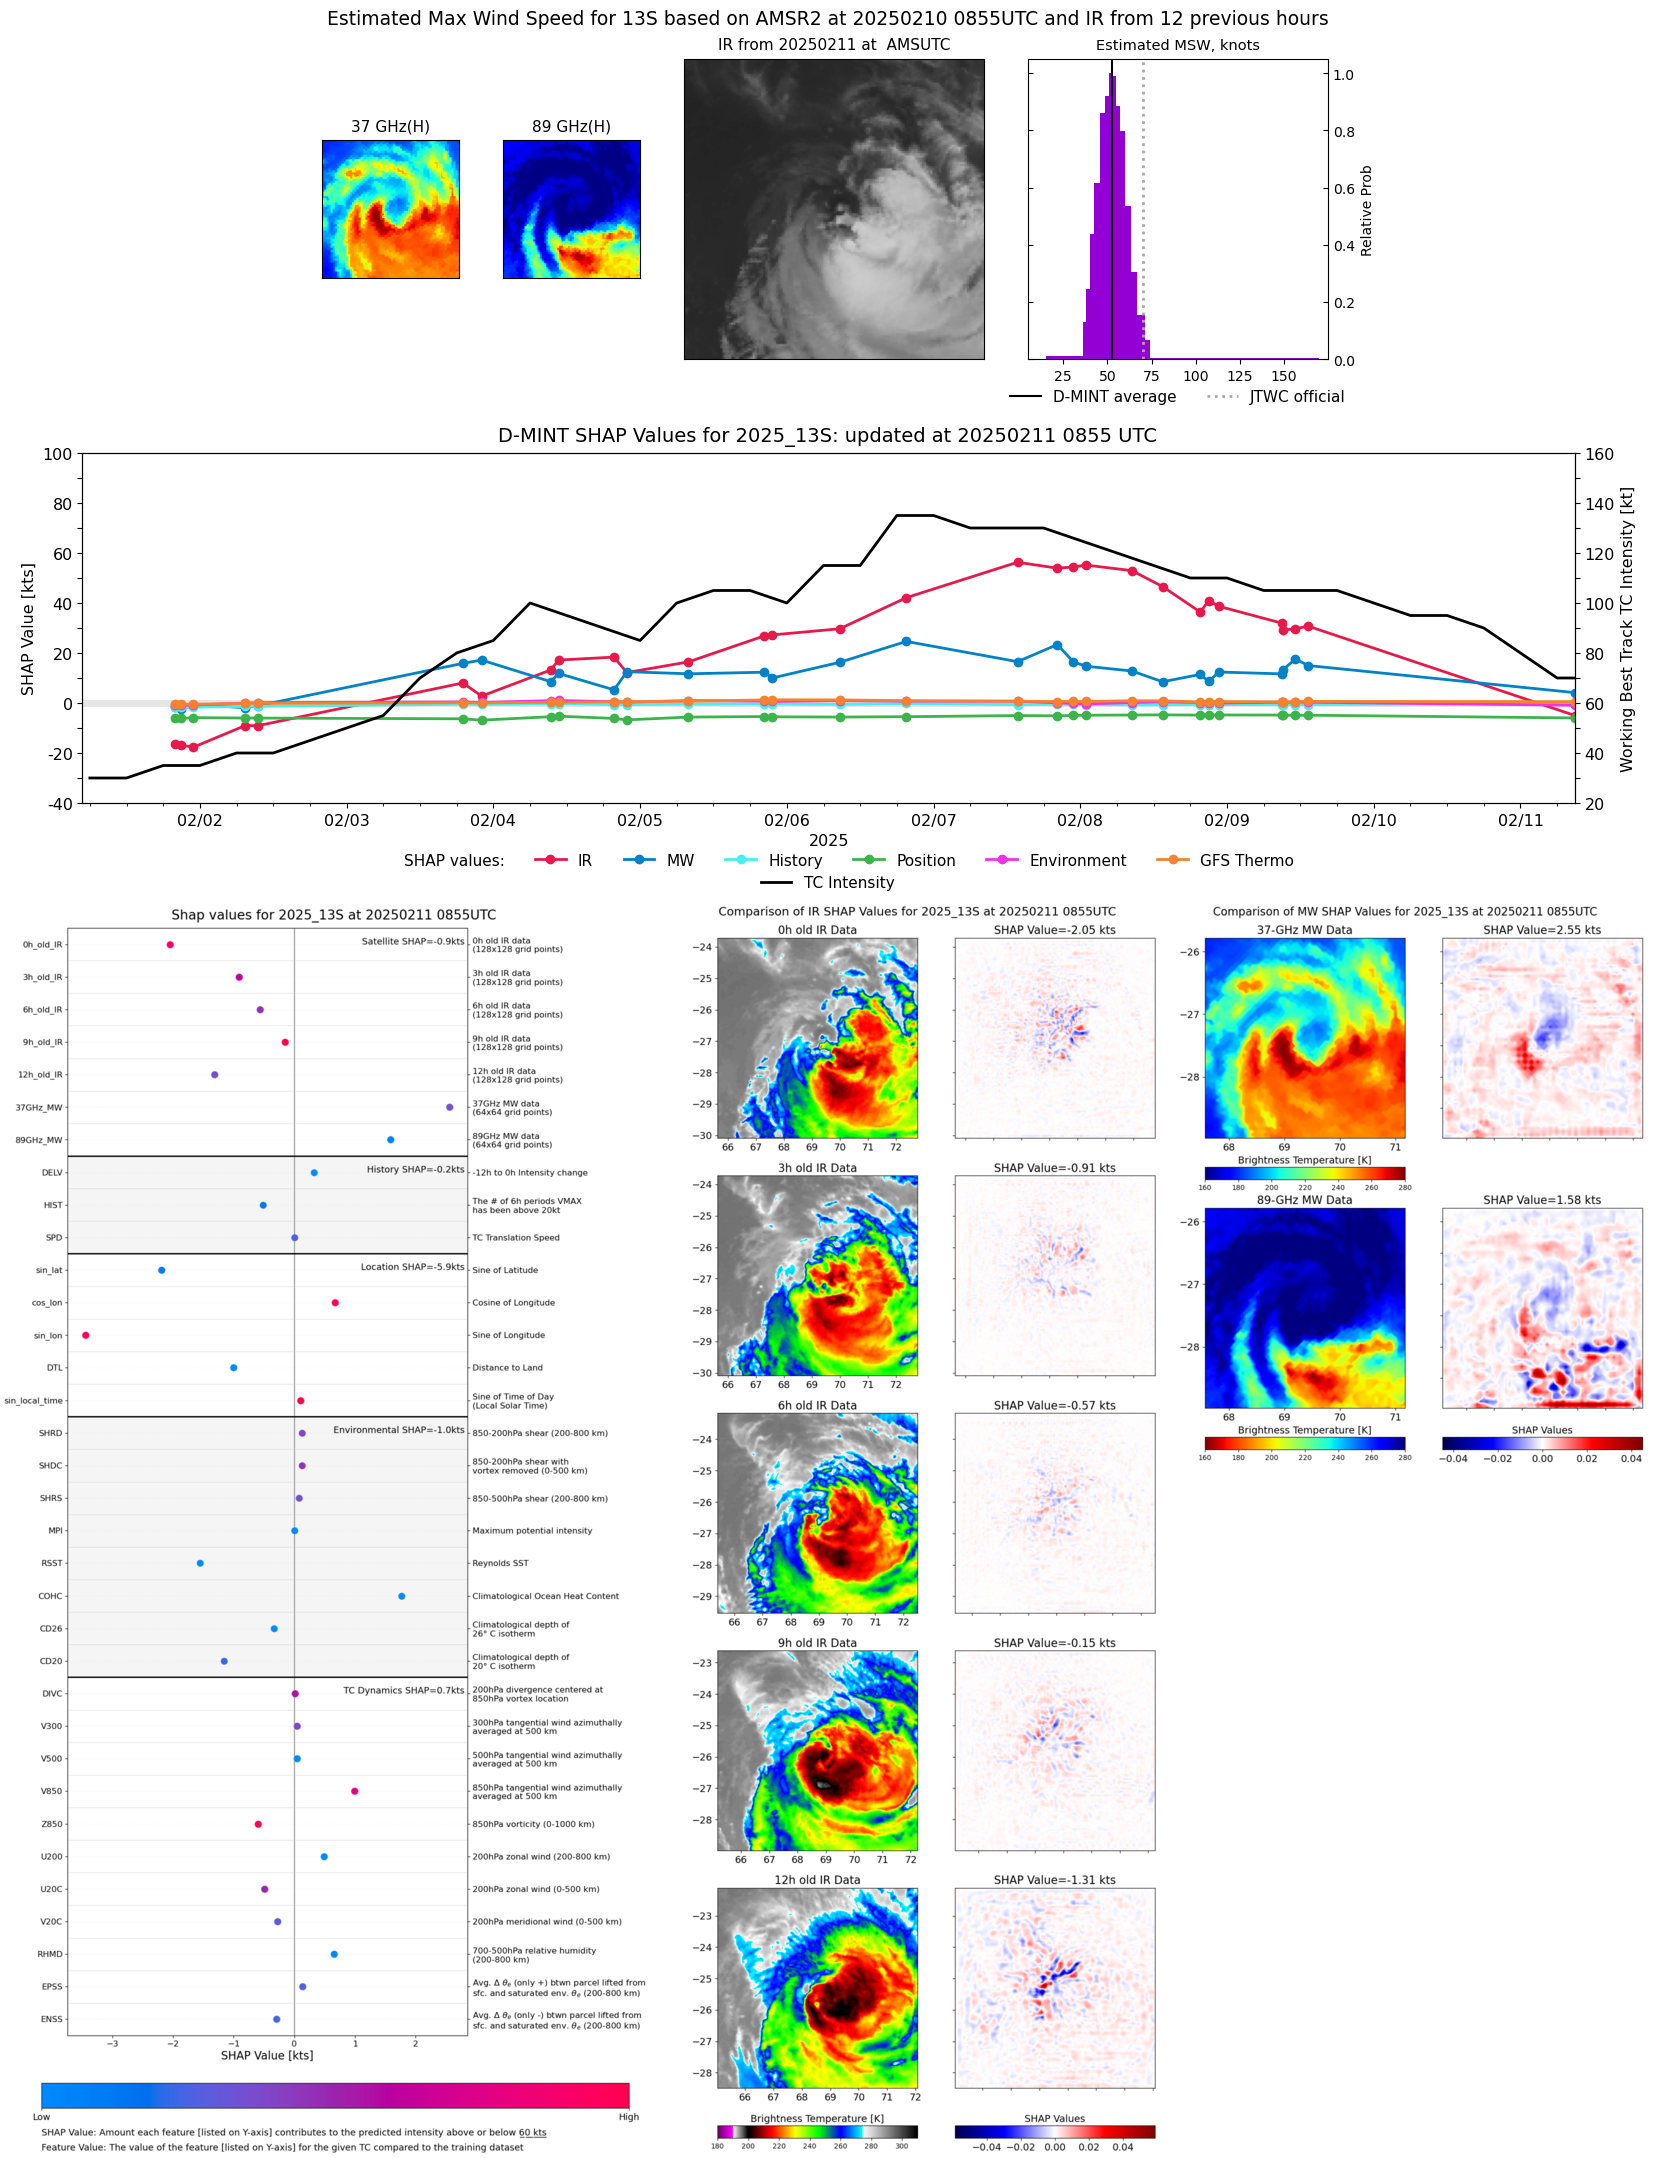 |
| 20250211 | 0446 UTC | TROPICS05 | 977 hPa | 66 kts | 60 kts | 71 kts | 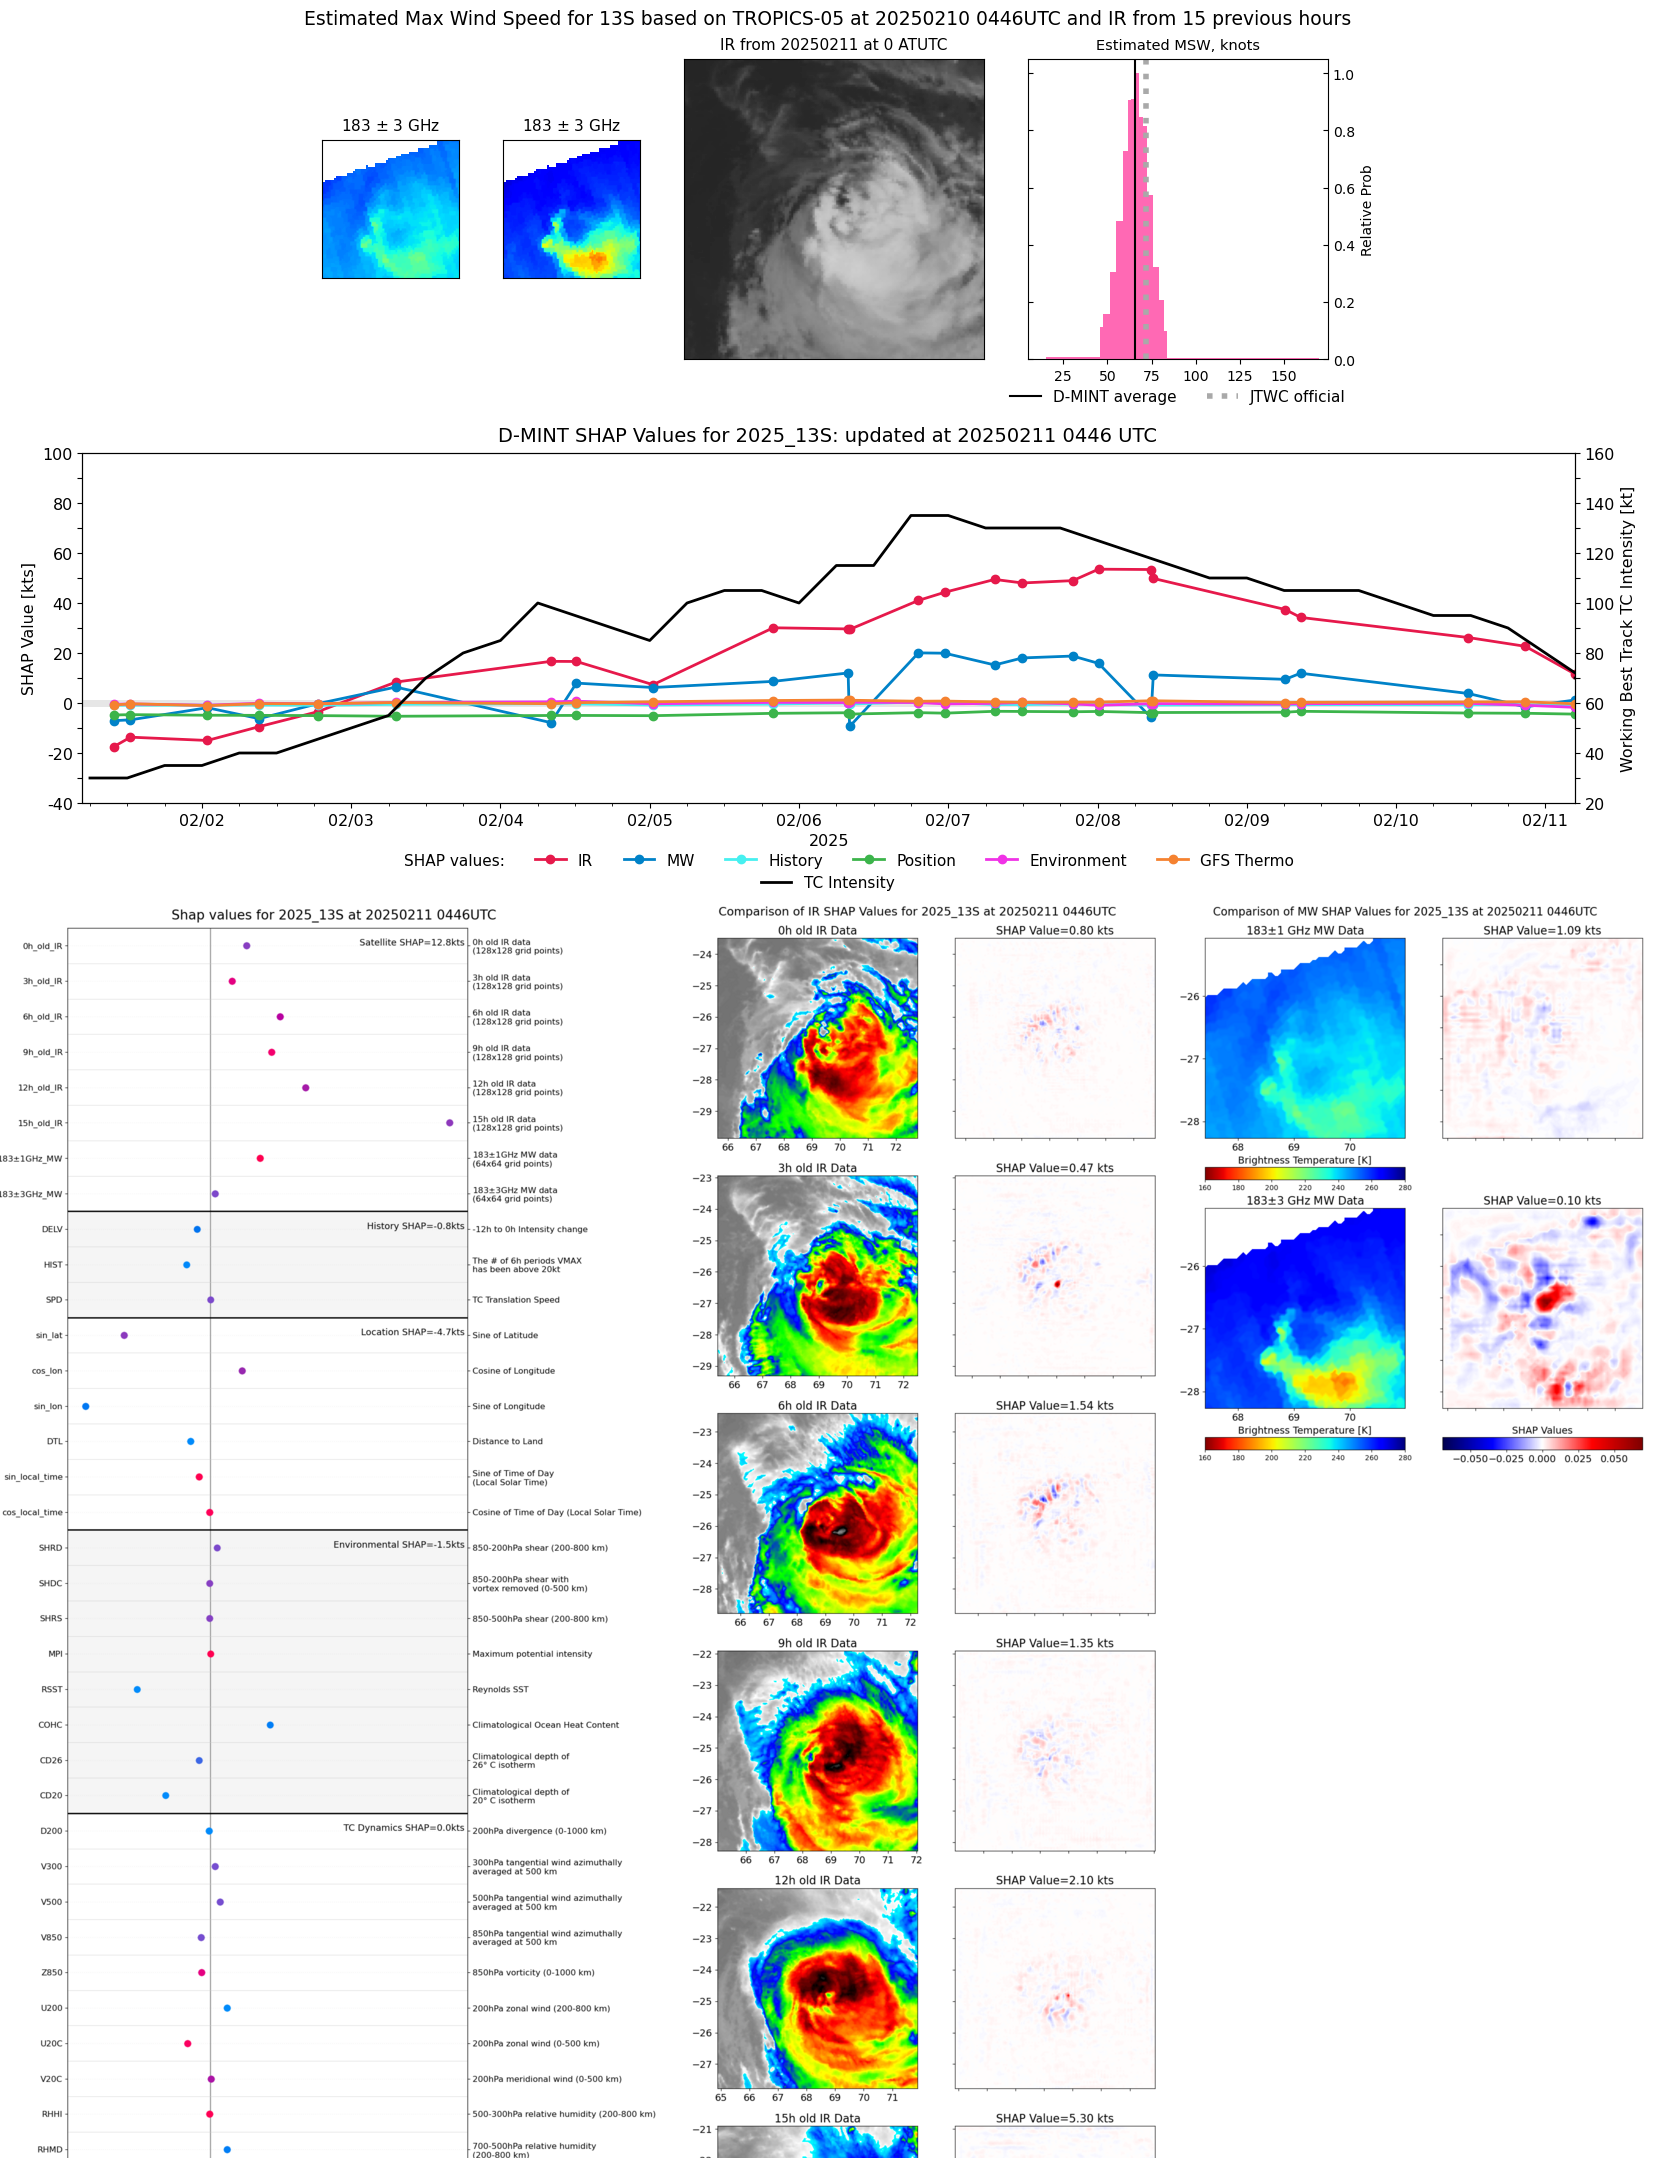 |
| 20250211 | 0056 UTC | SSMISF16 | 969 hPa | 69 kts | 63 kts | 74 kts | 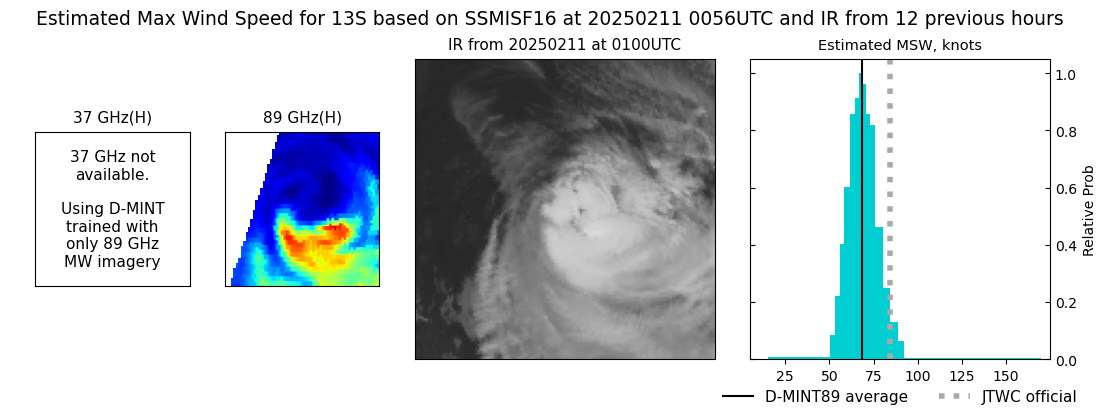 |
| 20250210 | 2047 UTC | AMSR2 | 966 hPa | 76 kts | 71 kts | 81 kts | 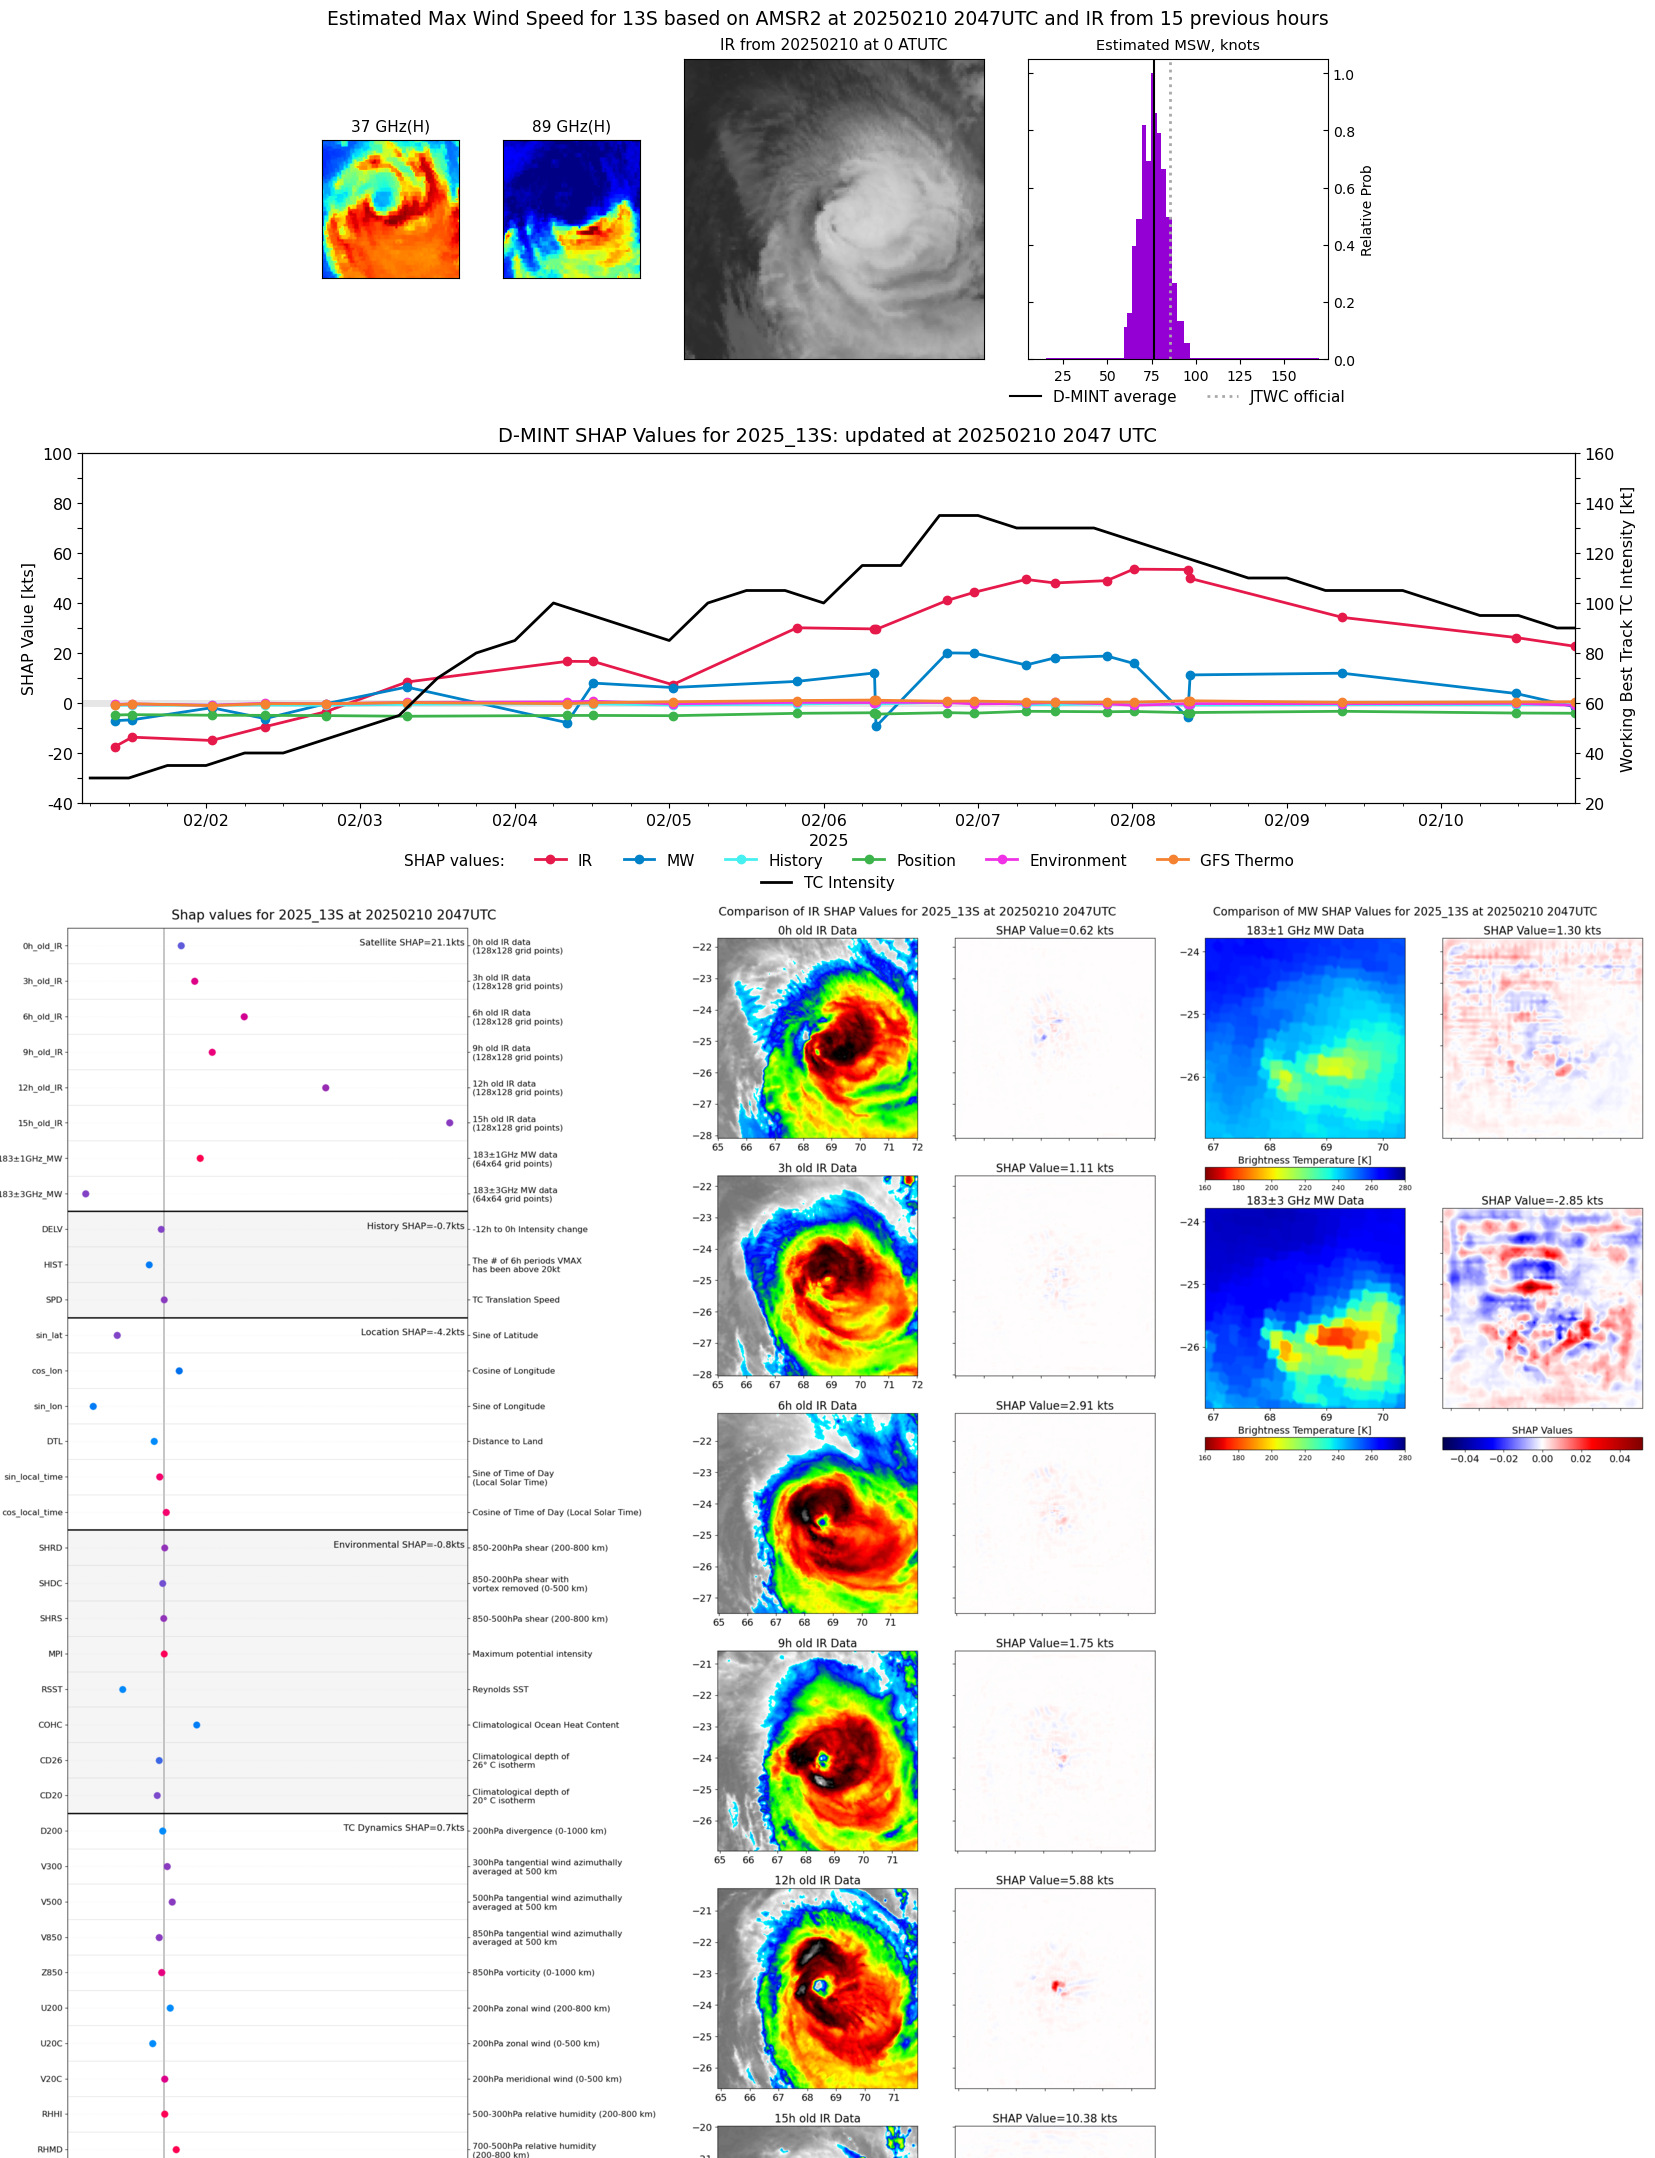 |
| 20250210 | 2047 UTC | ATMS-N20 | 966 hPa | 76 kts | 71 kts | 81 kts |  |
| 20250210 | 1339 UTC | SSMISF16 | 961 hPa | 82 kts | 76 kts | 87 kts | 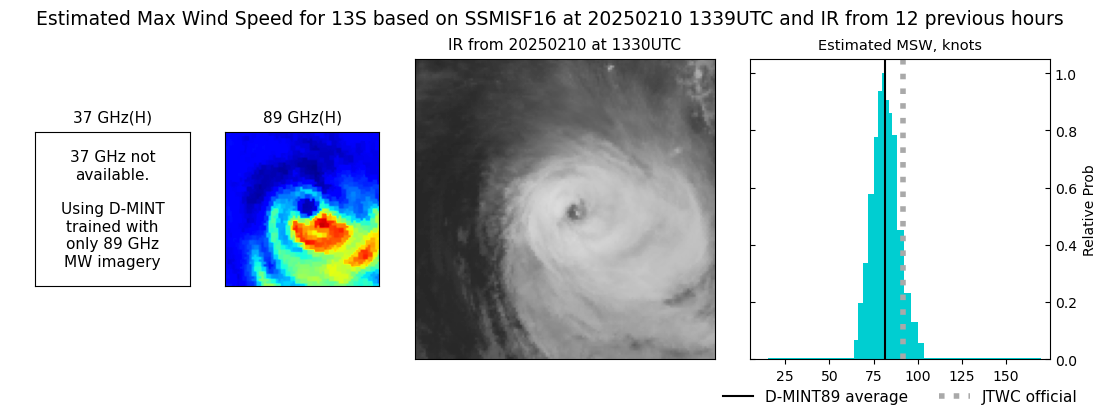 |
| 20250210 | 1136 UTC | TROPICS03 | 962 hPa | 86 kts | 81 kts | 90 kts | 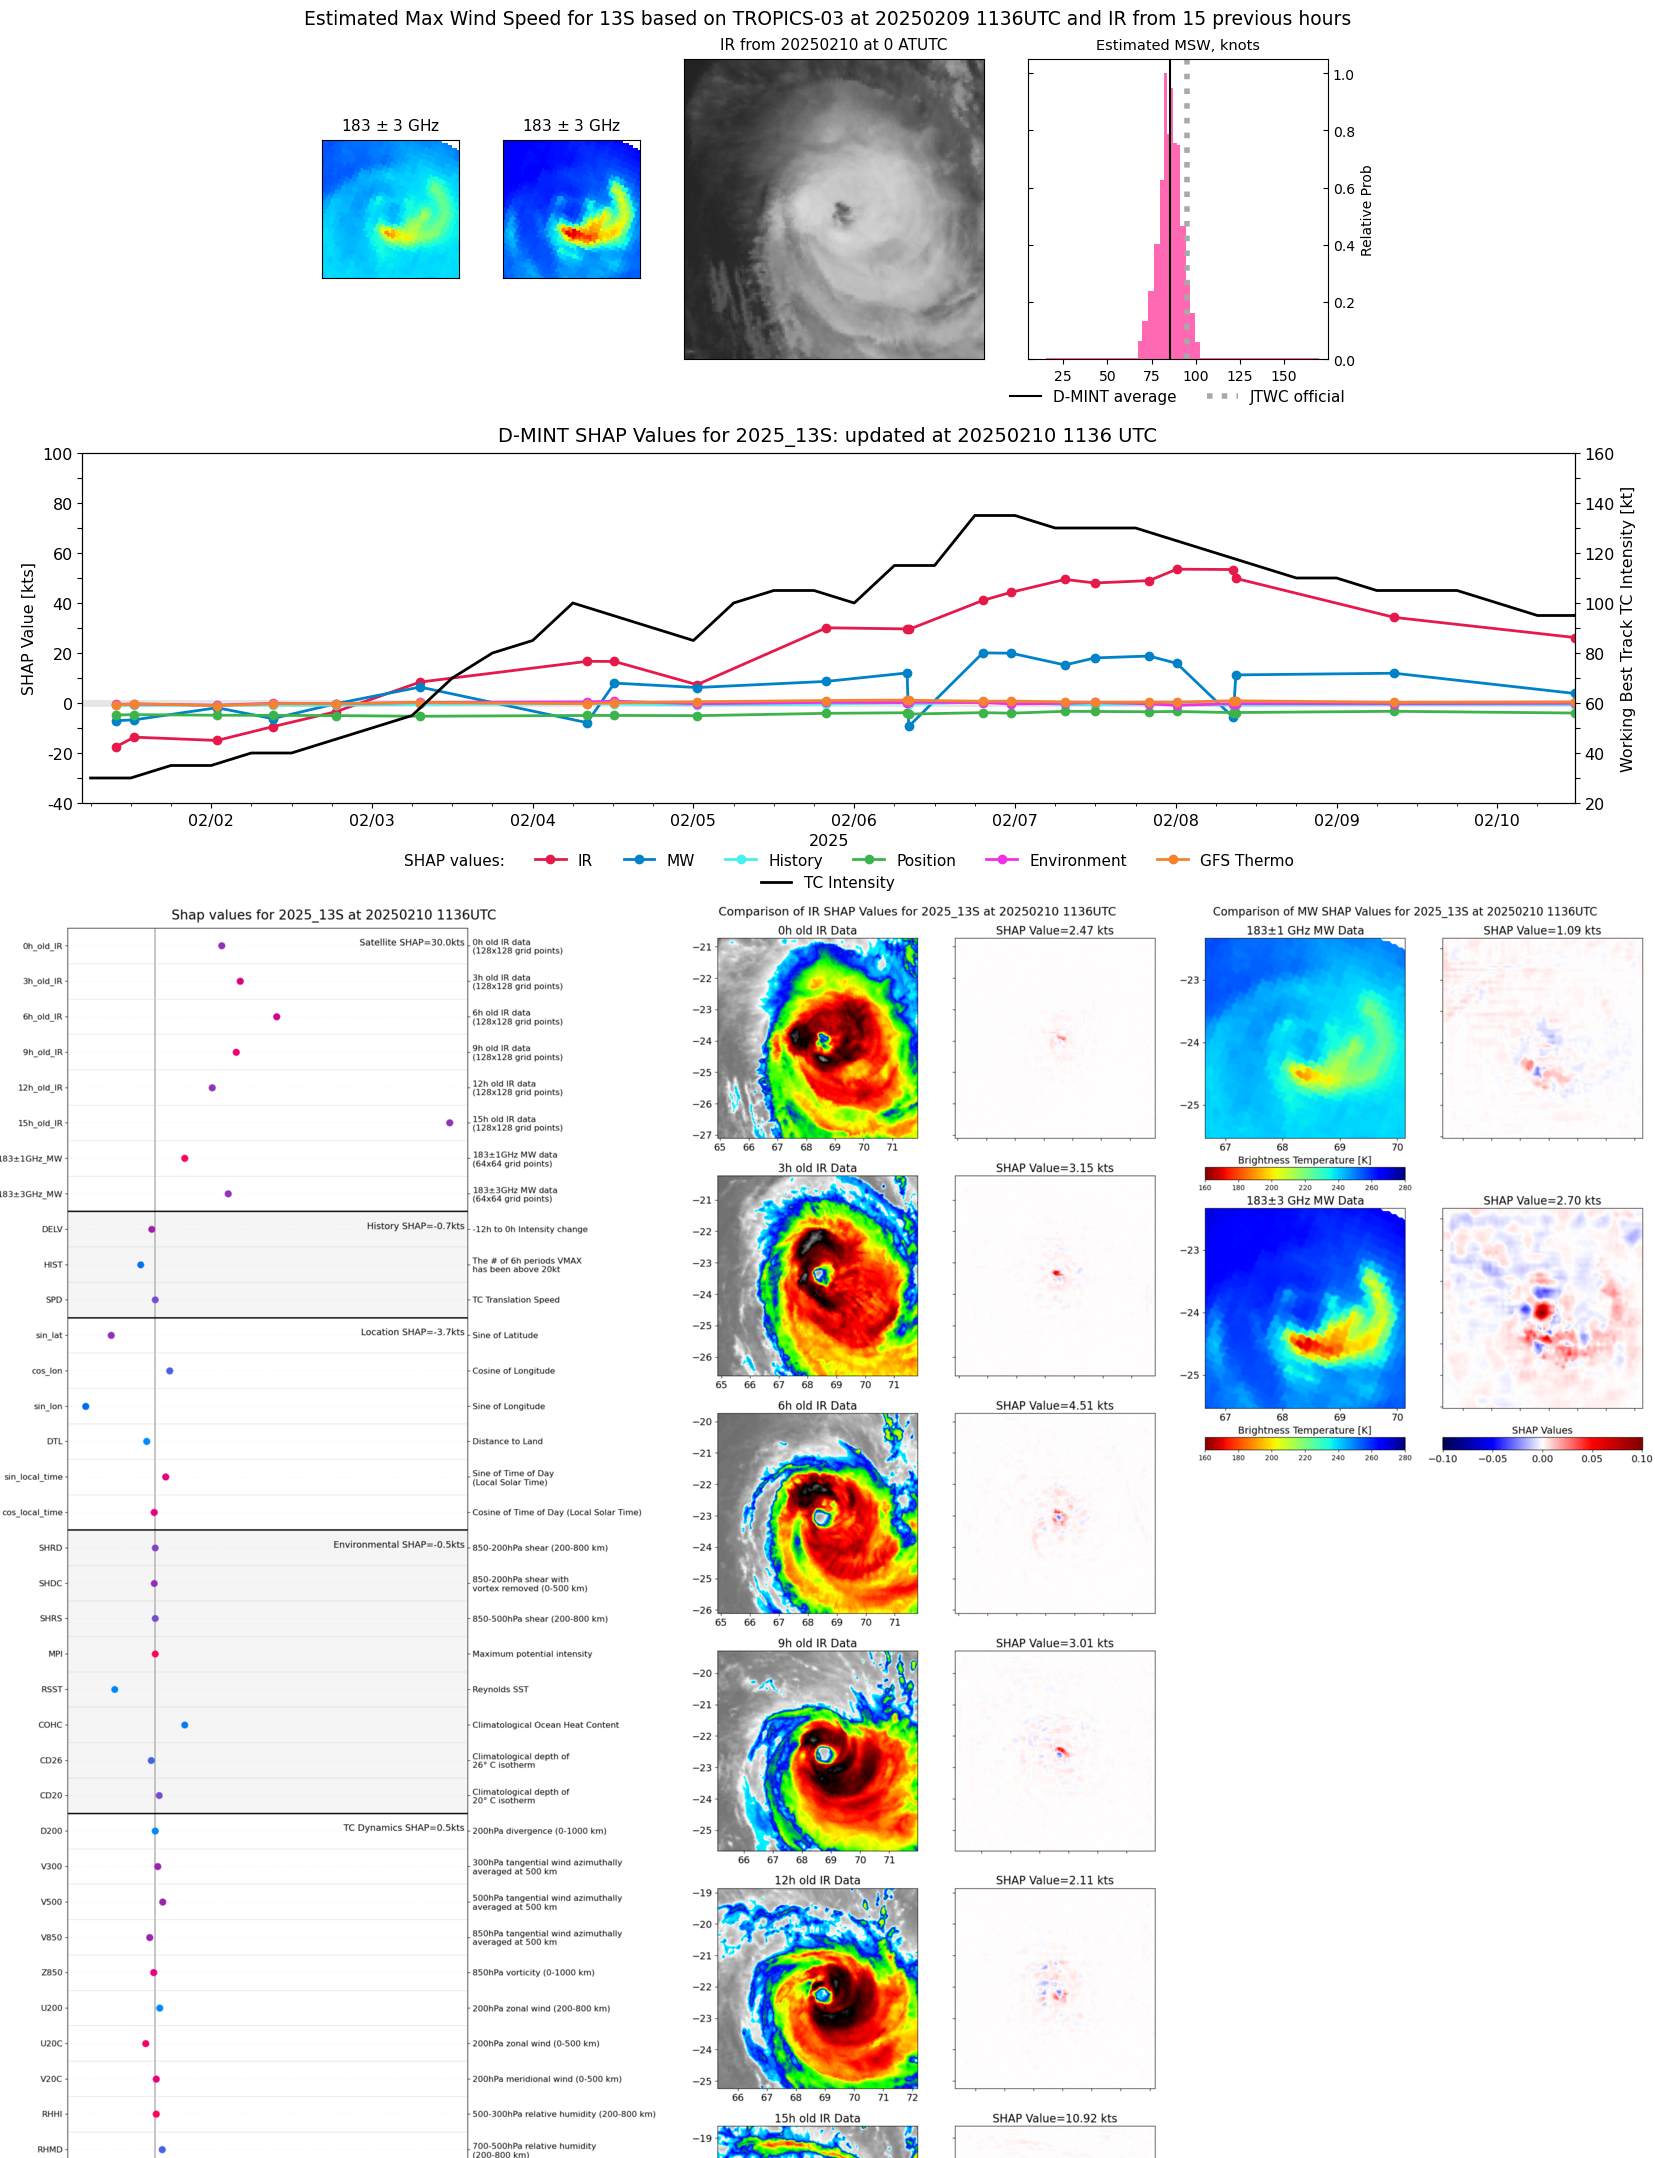 |
| 20250210 | 0527 UTC | TROPICS06 | 954 hPa | 93 kts | 88 kts | 98 kts | 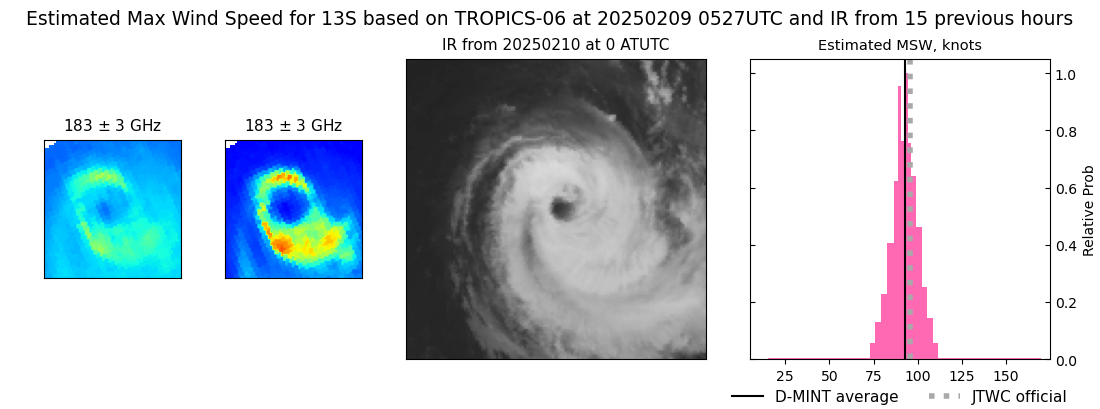 |
| 20250210 | 0108 UTC | SSMISF16 | 947 hPa | 92 kts | 87 kts | 98 kts | 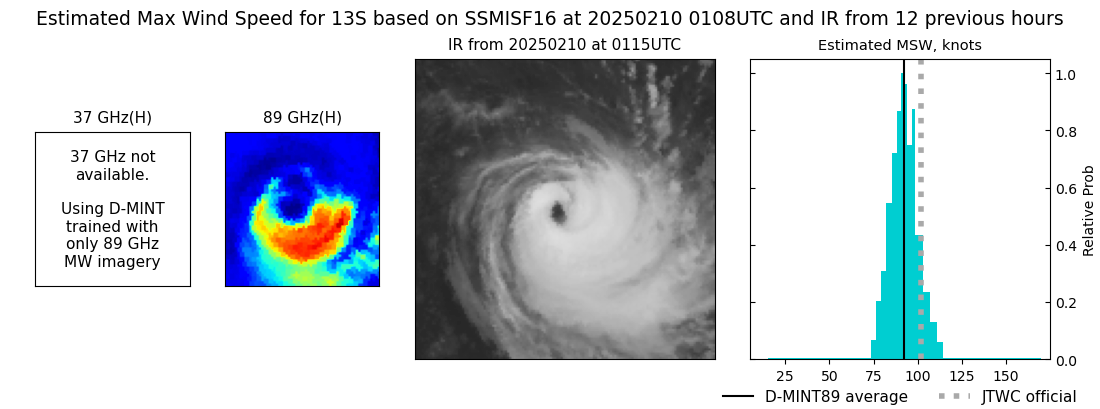 |
| 20250209 | 1353 UTC | SSMISF16 | 944 hPa | 101 kts | 95 kts | 107 kts | 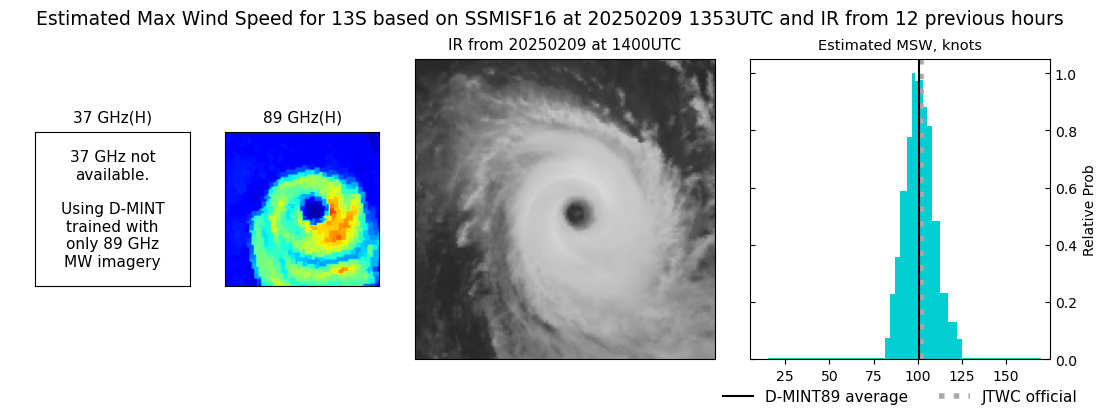 |
| 20250209 | 1315 UTC | SSMISF17 | 944 hPa | 101 kts | 96 kts | 106 kts | 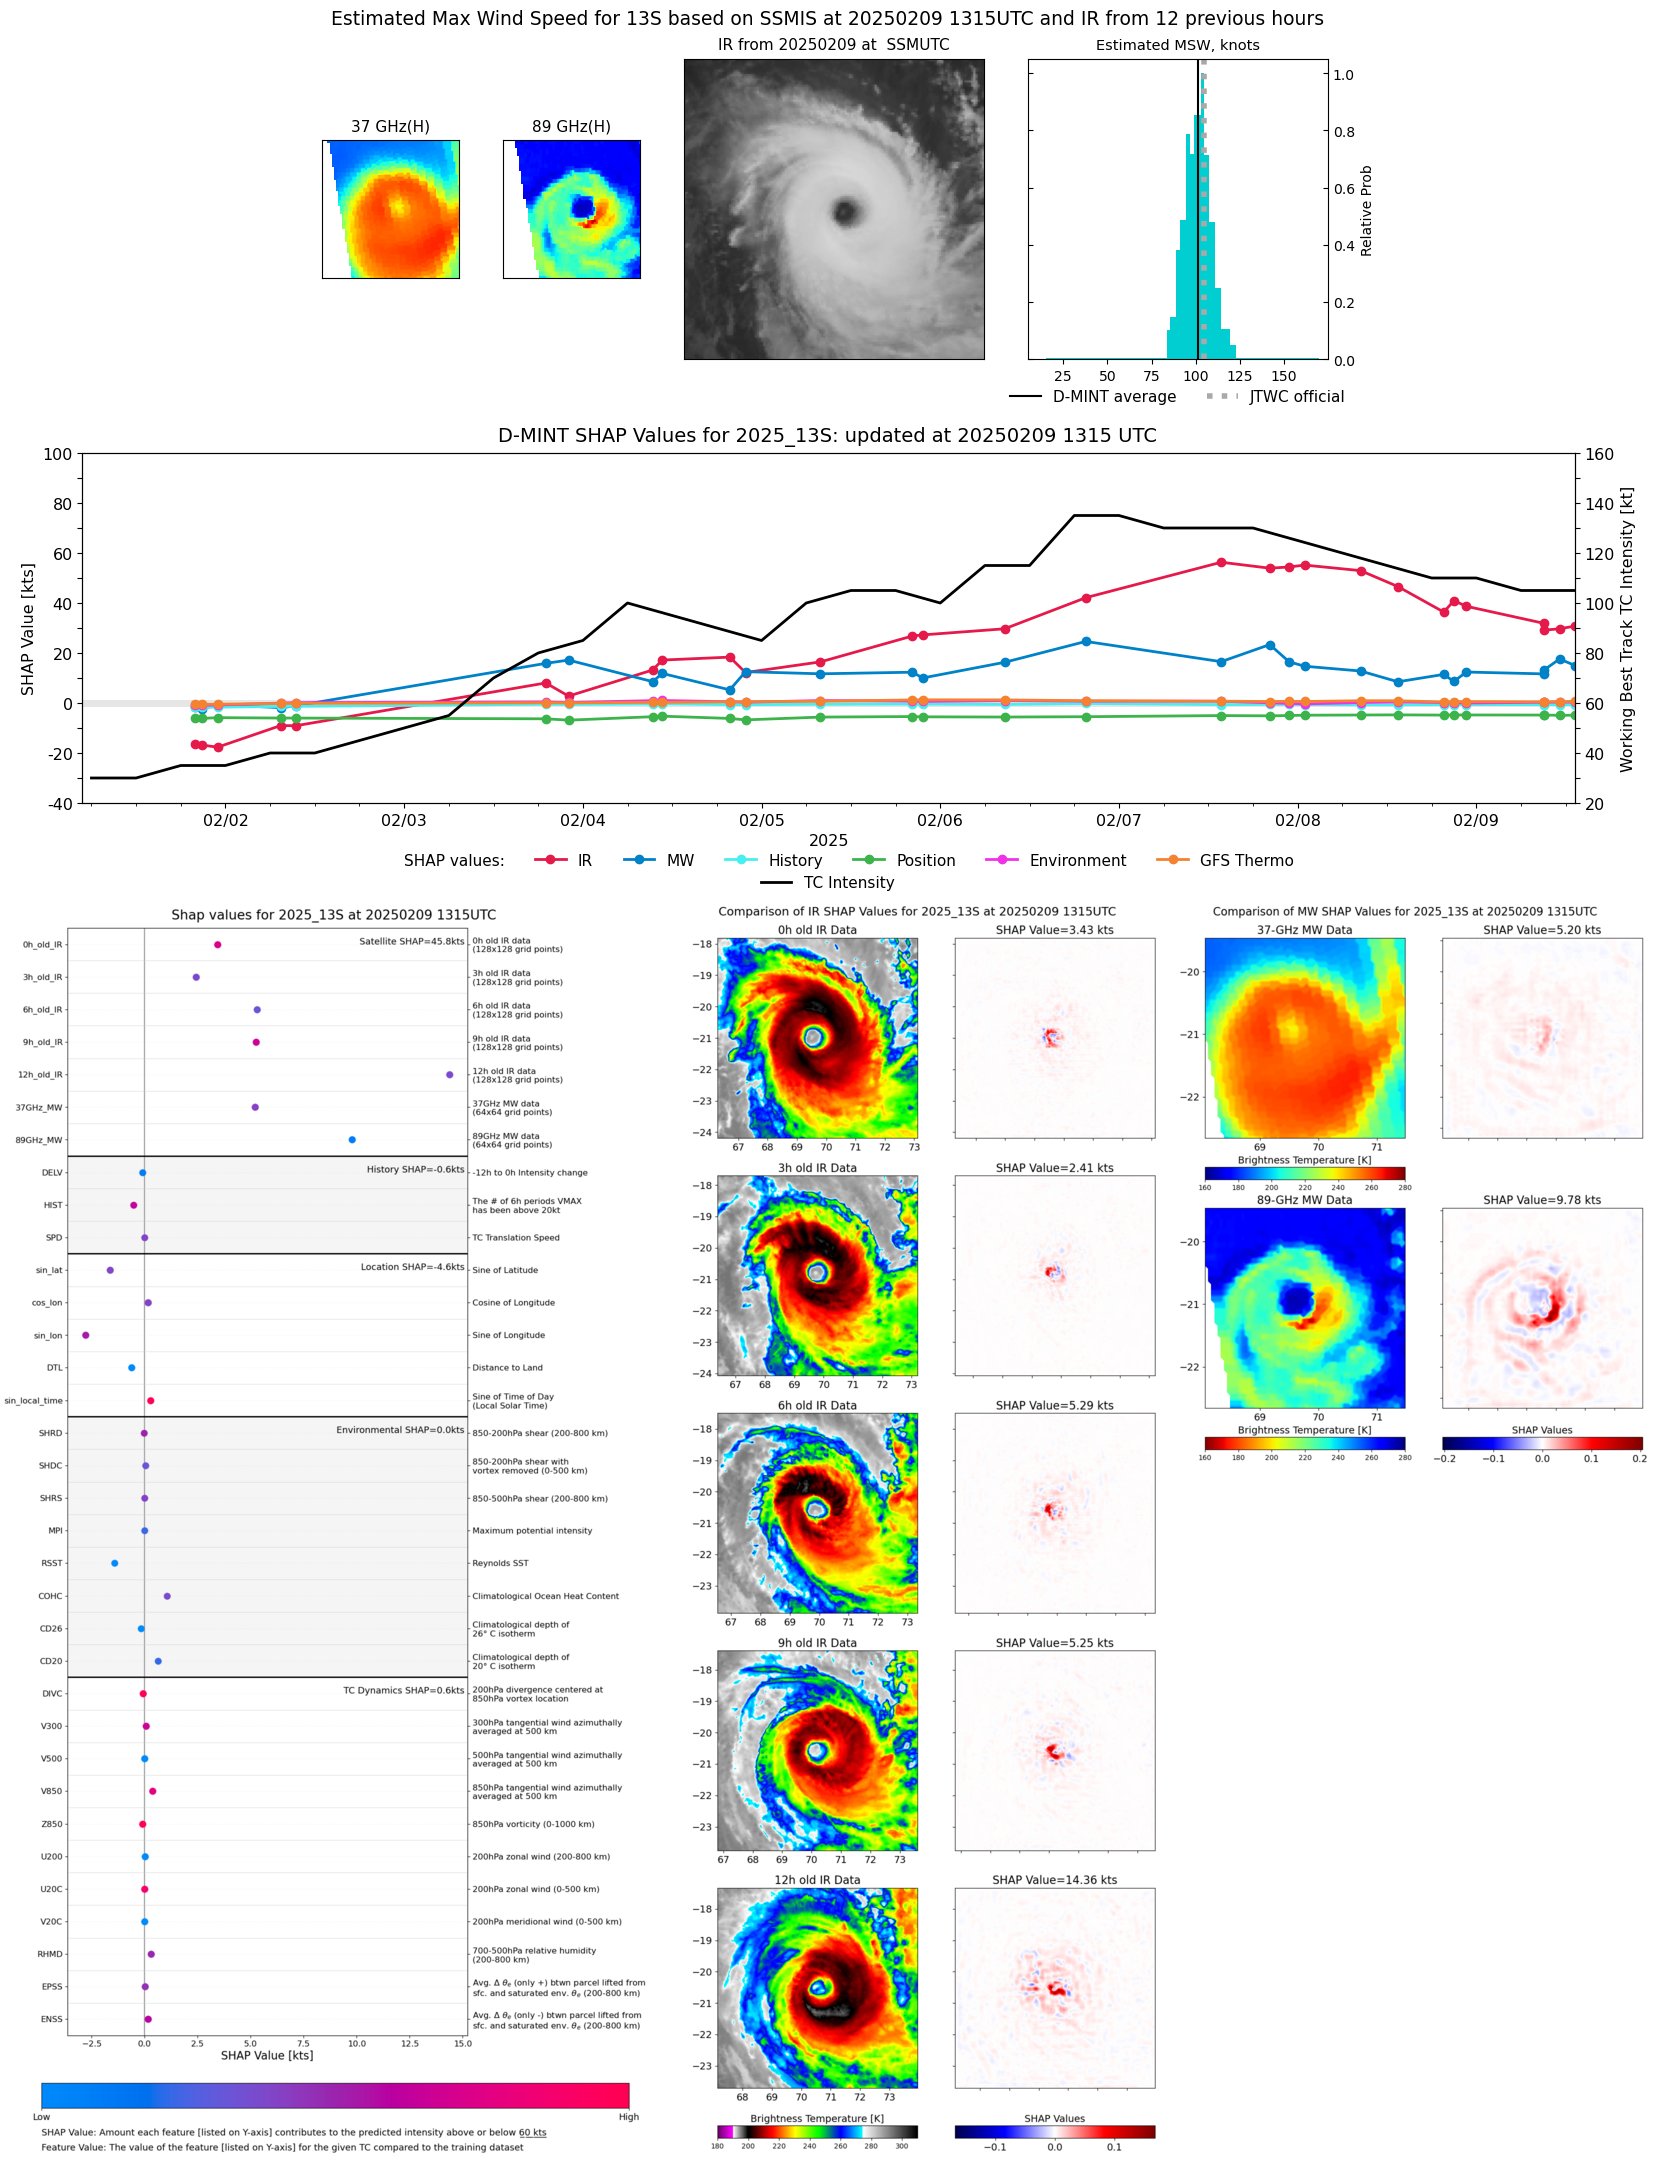 |
| 20250209 | 1111 UTC | SSMISF18 | 941 hPa | 102 kts | 97 kts | 108 kts | 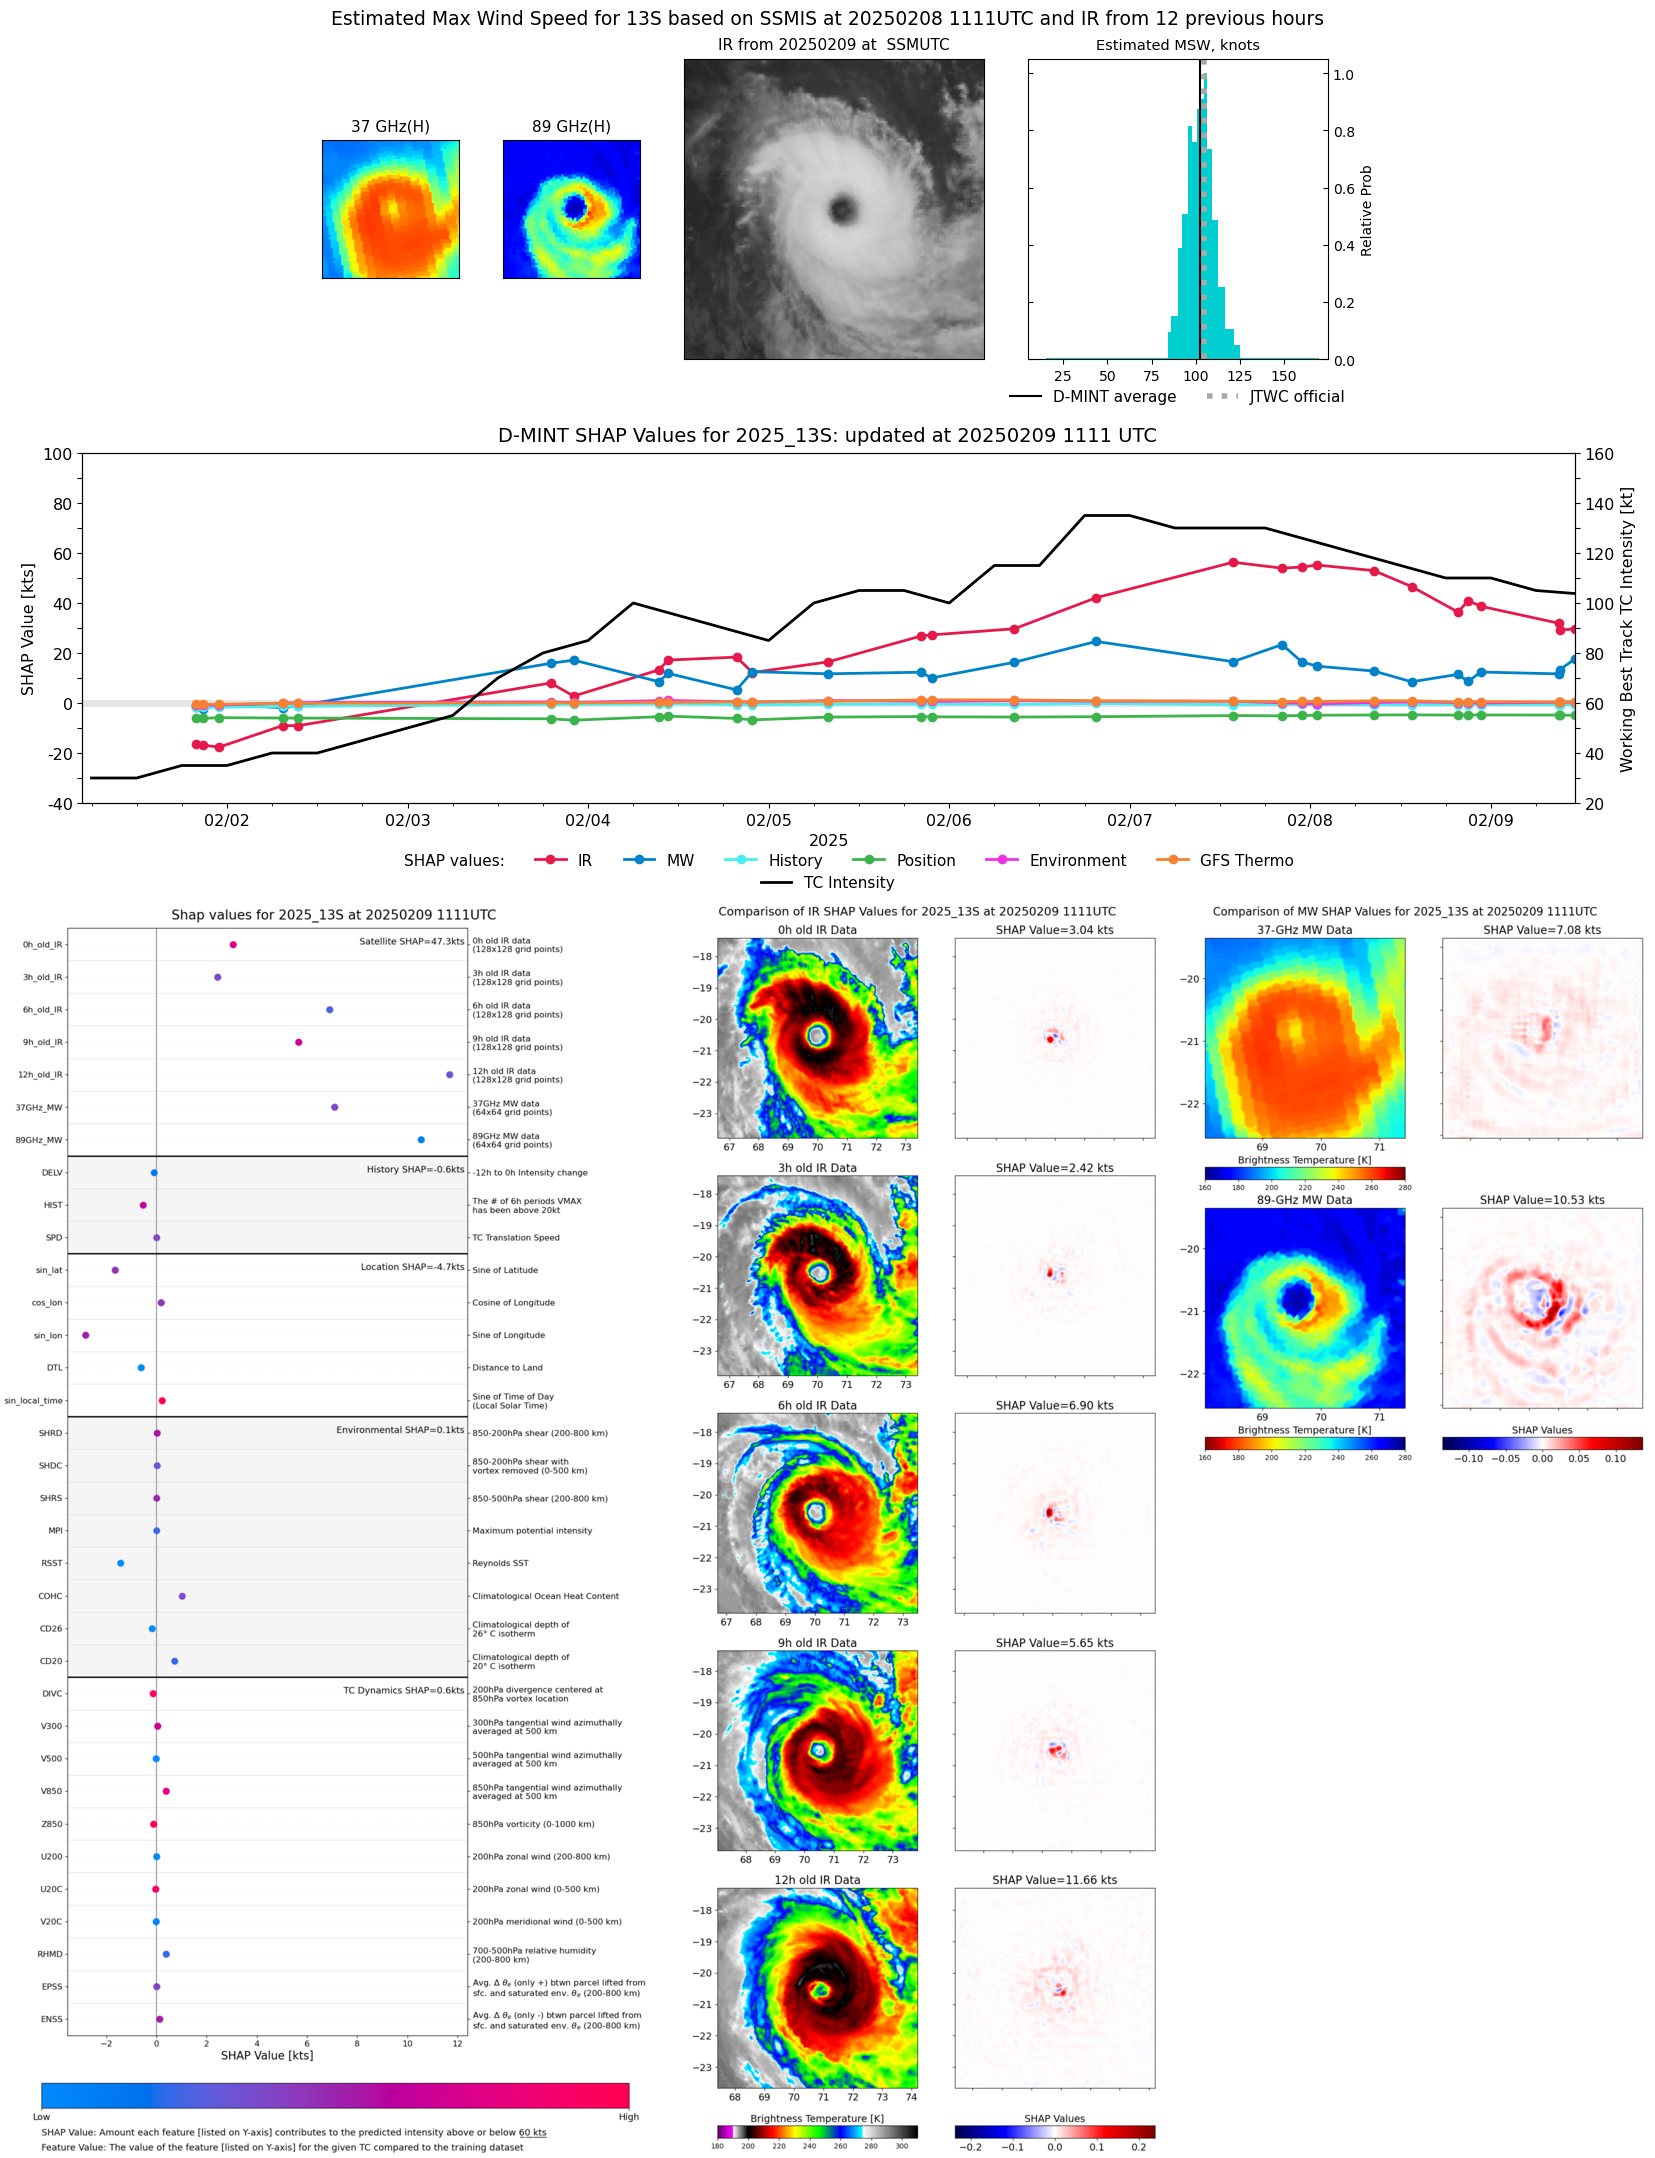 |
| 20250209 | 0909 UTC | AMSR2 | 946 hPa | 98 kts | 93 kts | 102 kts | 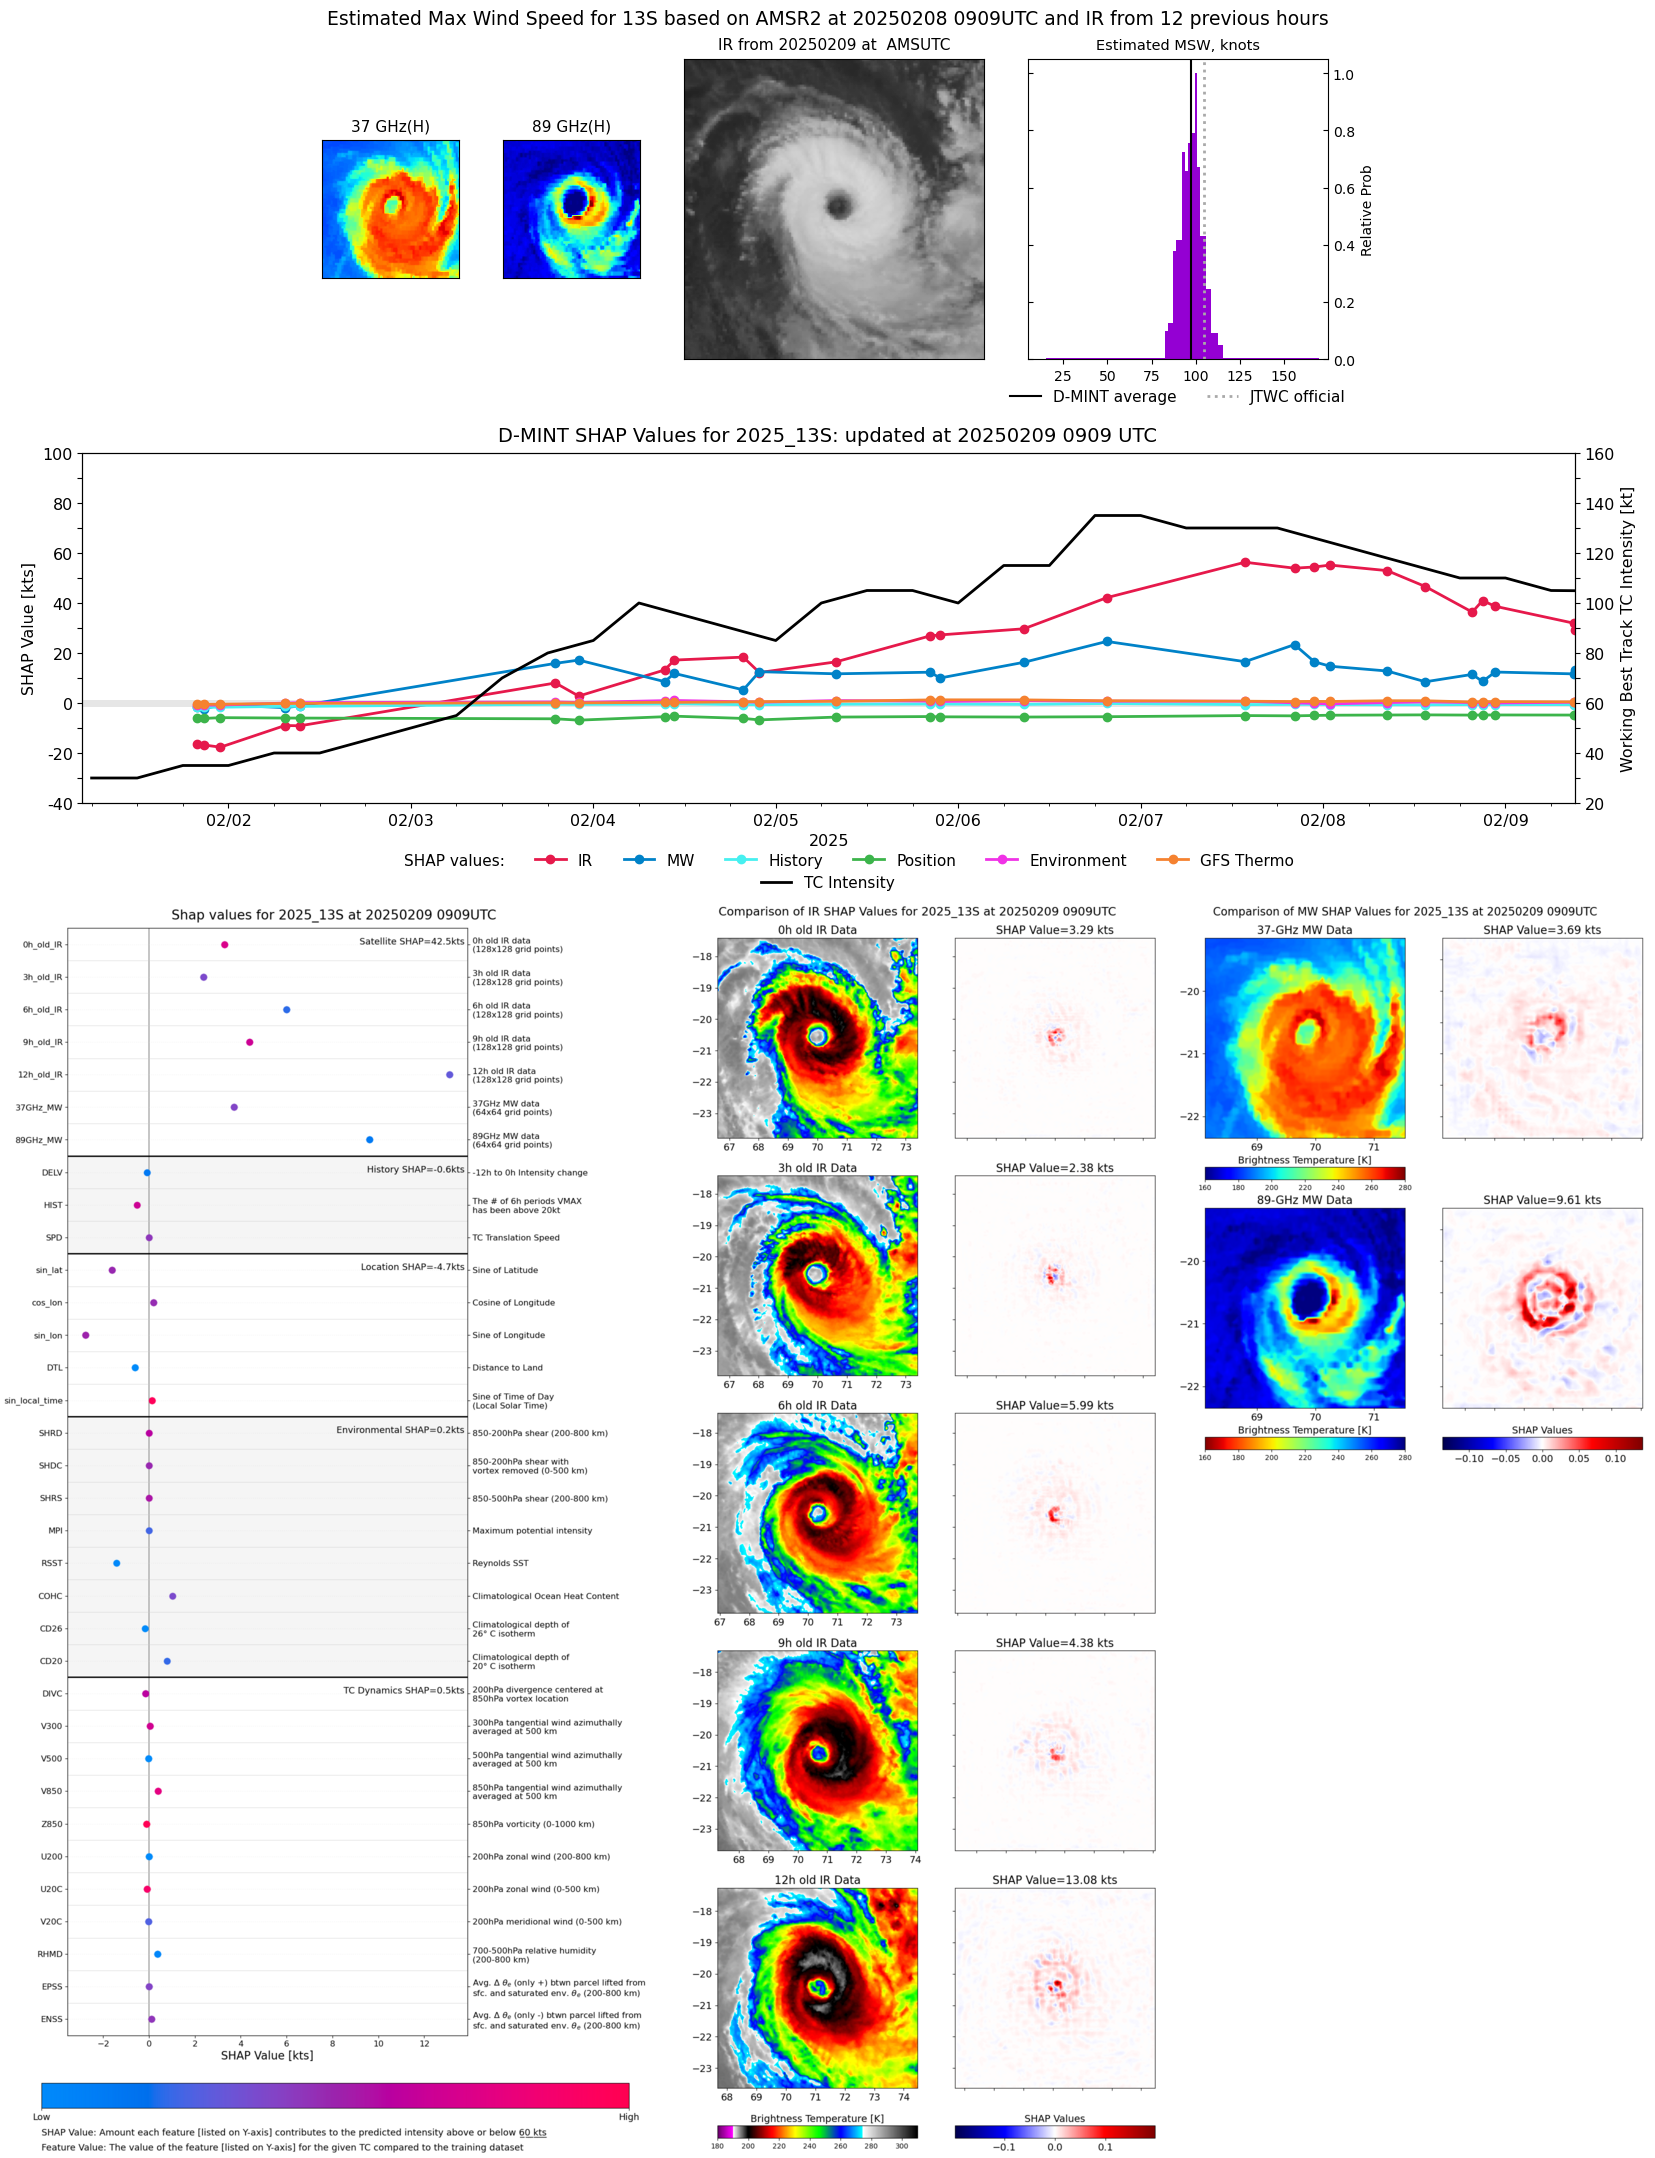 |
| 20250209 | 0903 UTC | GMI | 943 hPa | 99 kts | 94 kts | 103 kts | 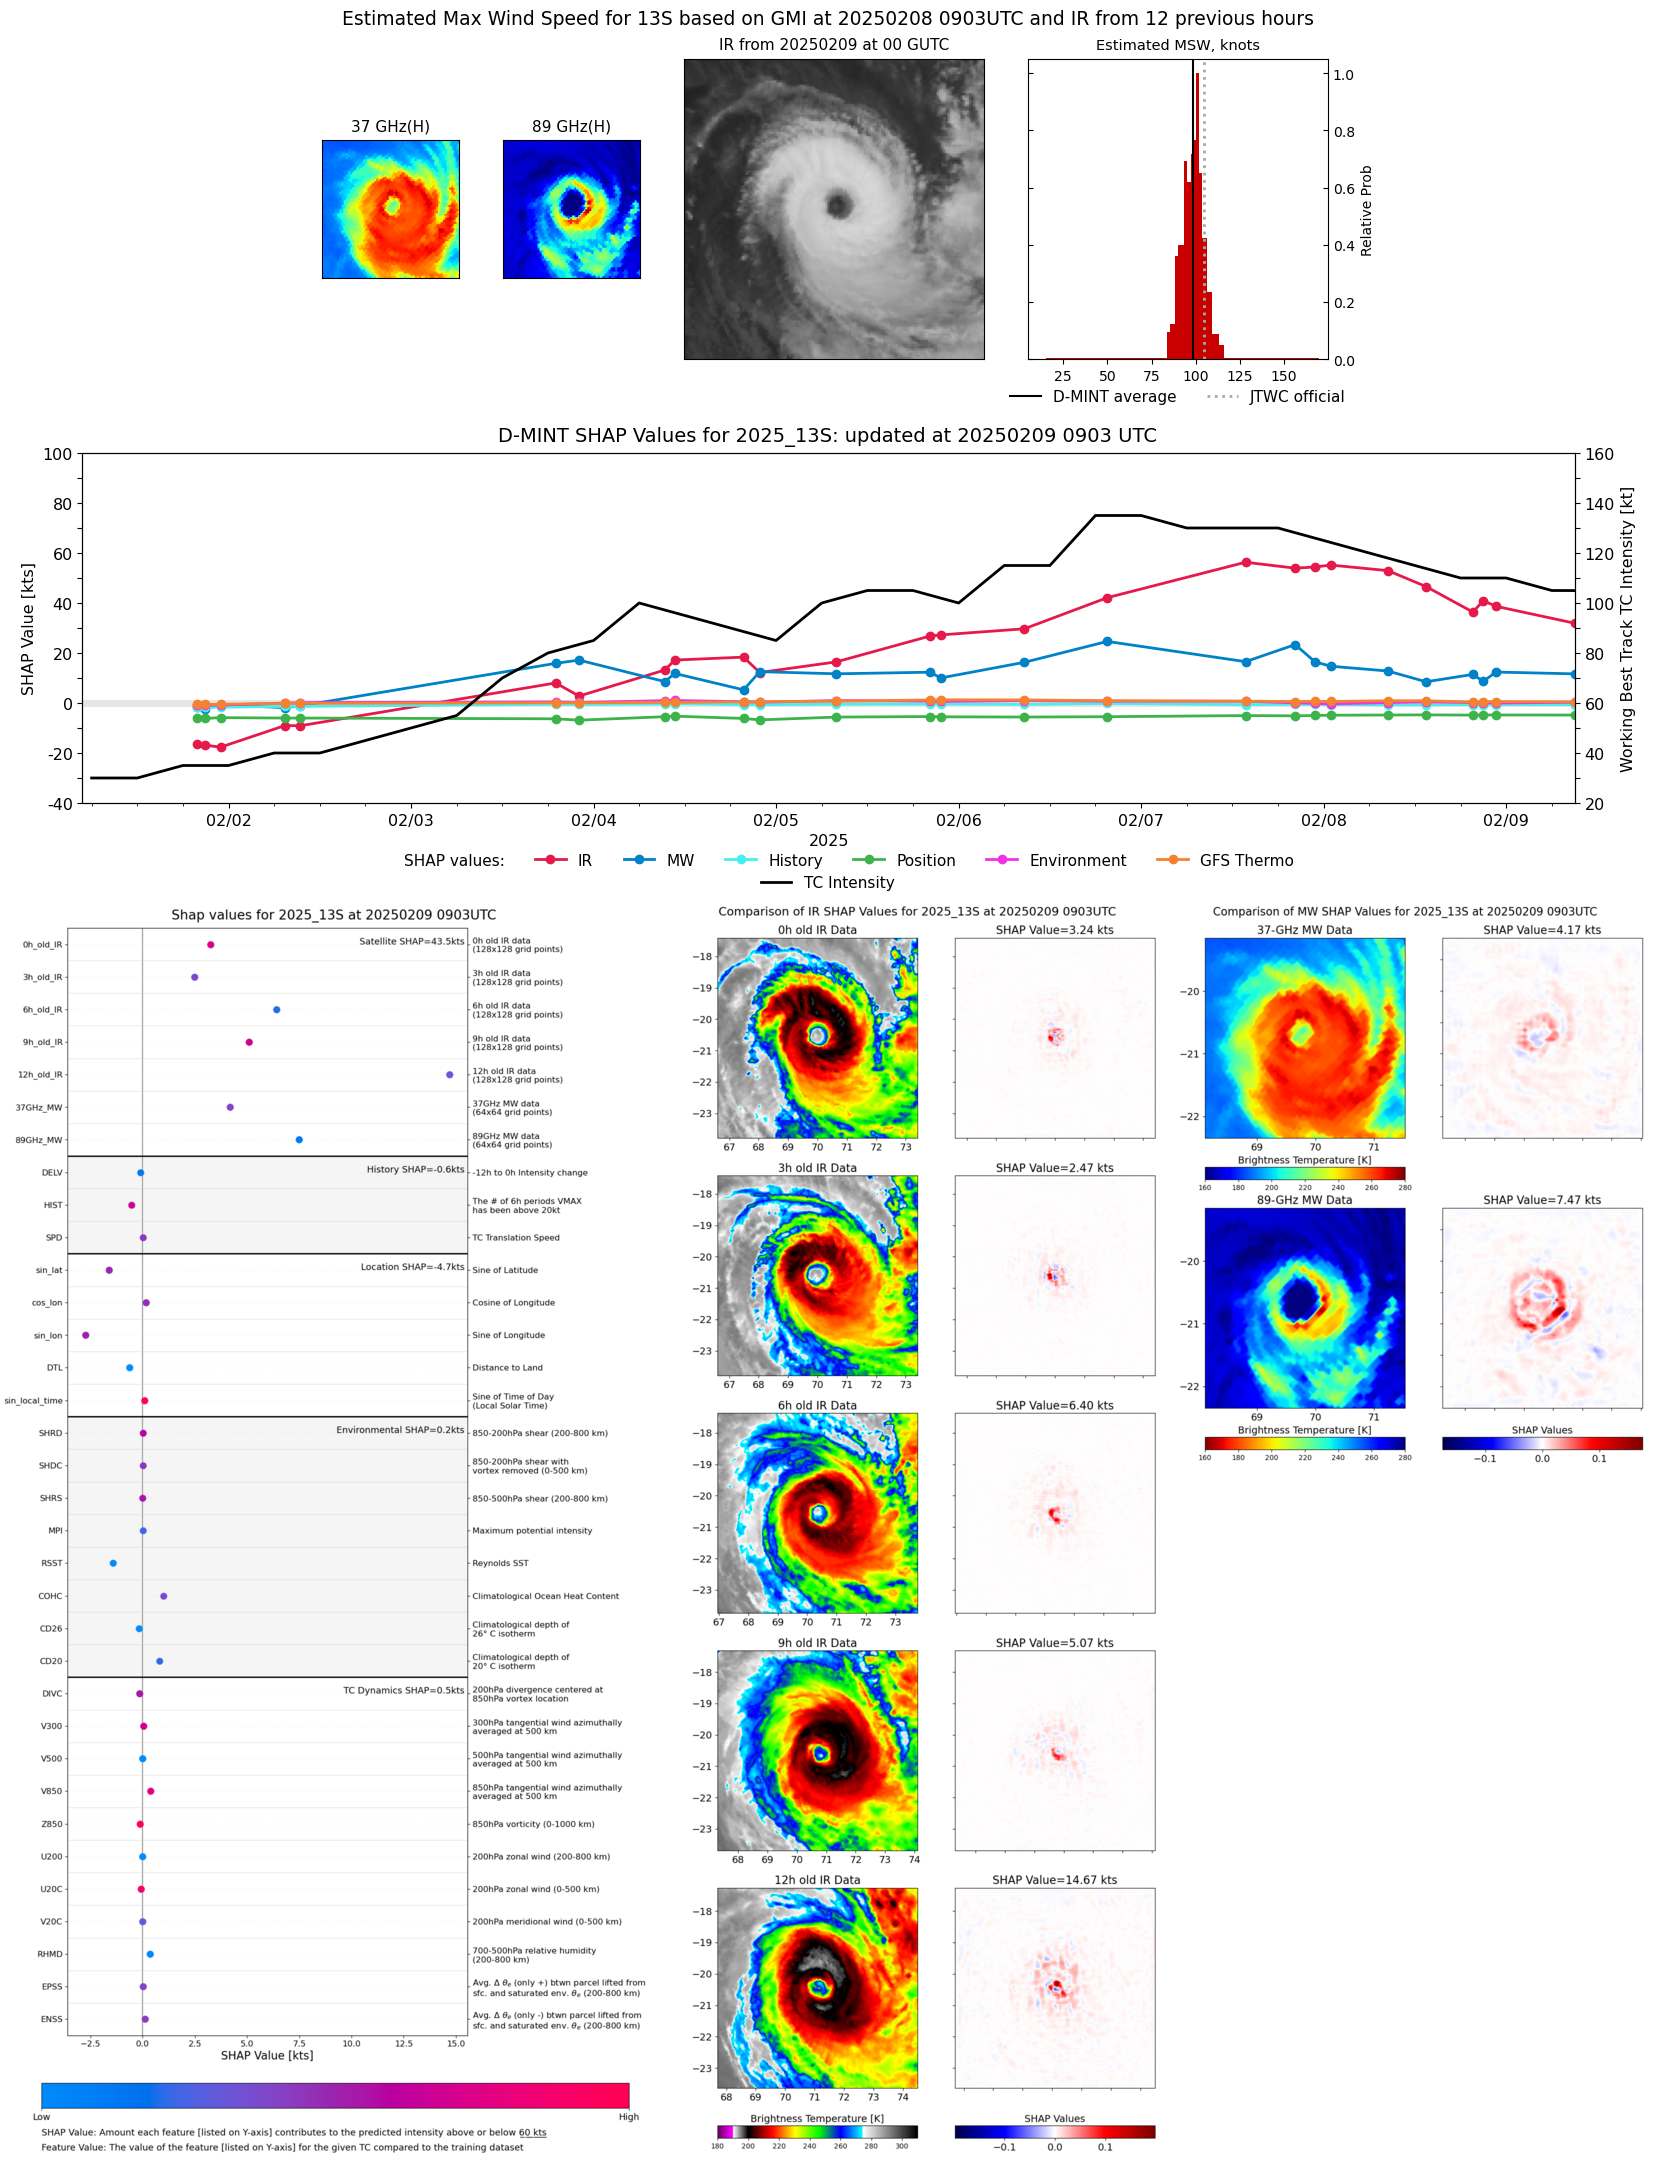 |
| 20250209 | 0838 UTC | ATMS-N20 | 948 hPa | 102 kts | 97 kts | 107 kts |  |
| 20250209 | 0611 UTC | TROPICS06 | 951 hPa | 102 kts | 97 kts | 108 kts | 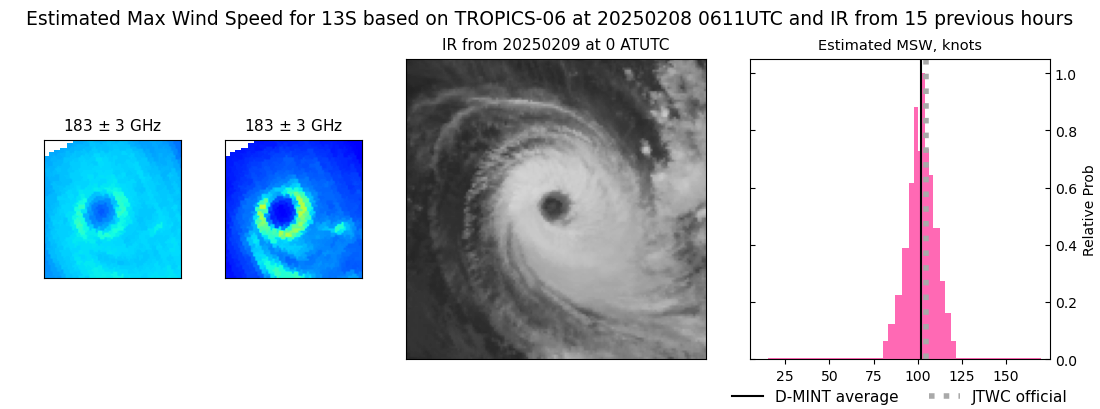 |
| 20250209 | 0120 UTC | SSMISF16 | 942 hPa | 108 kts | 103 kts | 113 kts | 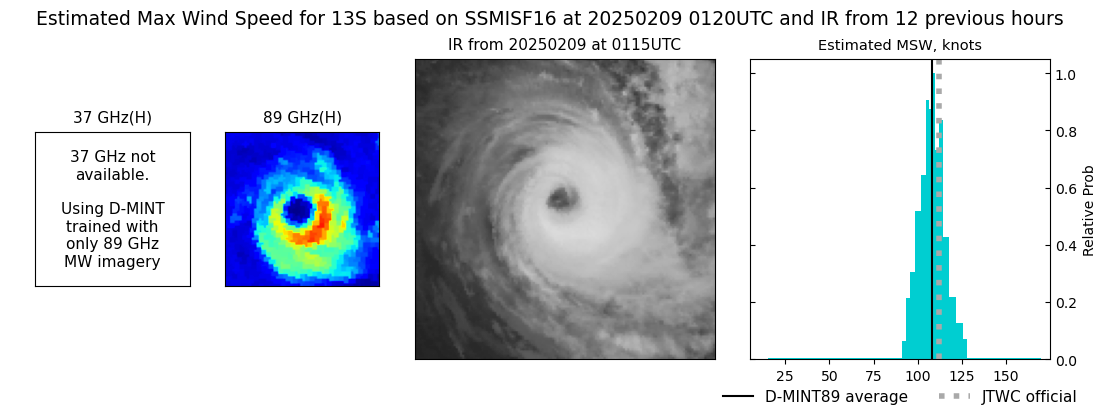 |
| 20250209 | 0043 UTC | SSMISF17 | NaN hPa | 107 kts | 102 kts | 113 kts | 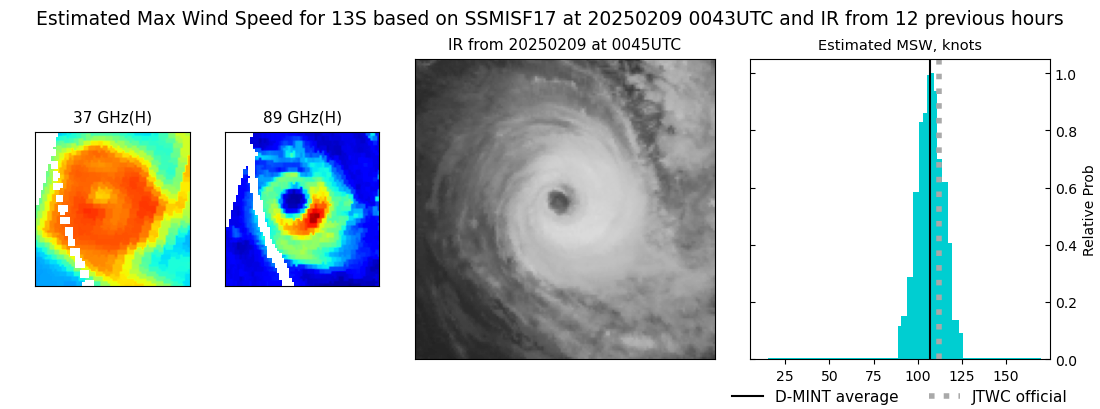 |
| 20250208 | 2239 UTC | SSMISF18 | 946 hPa | 106 kts | 101 kts | 110 kts | 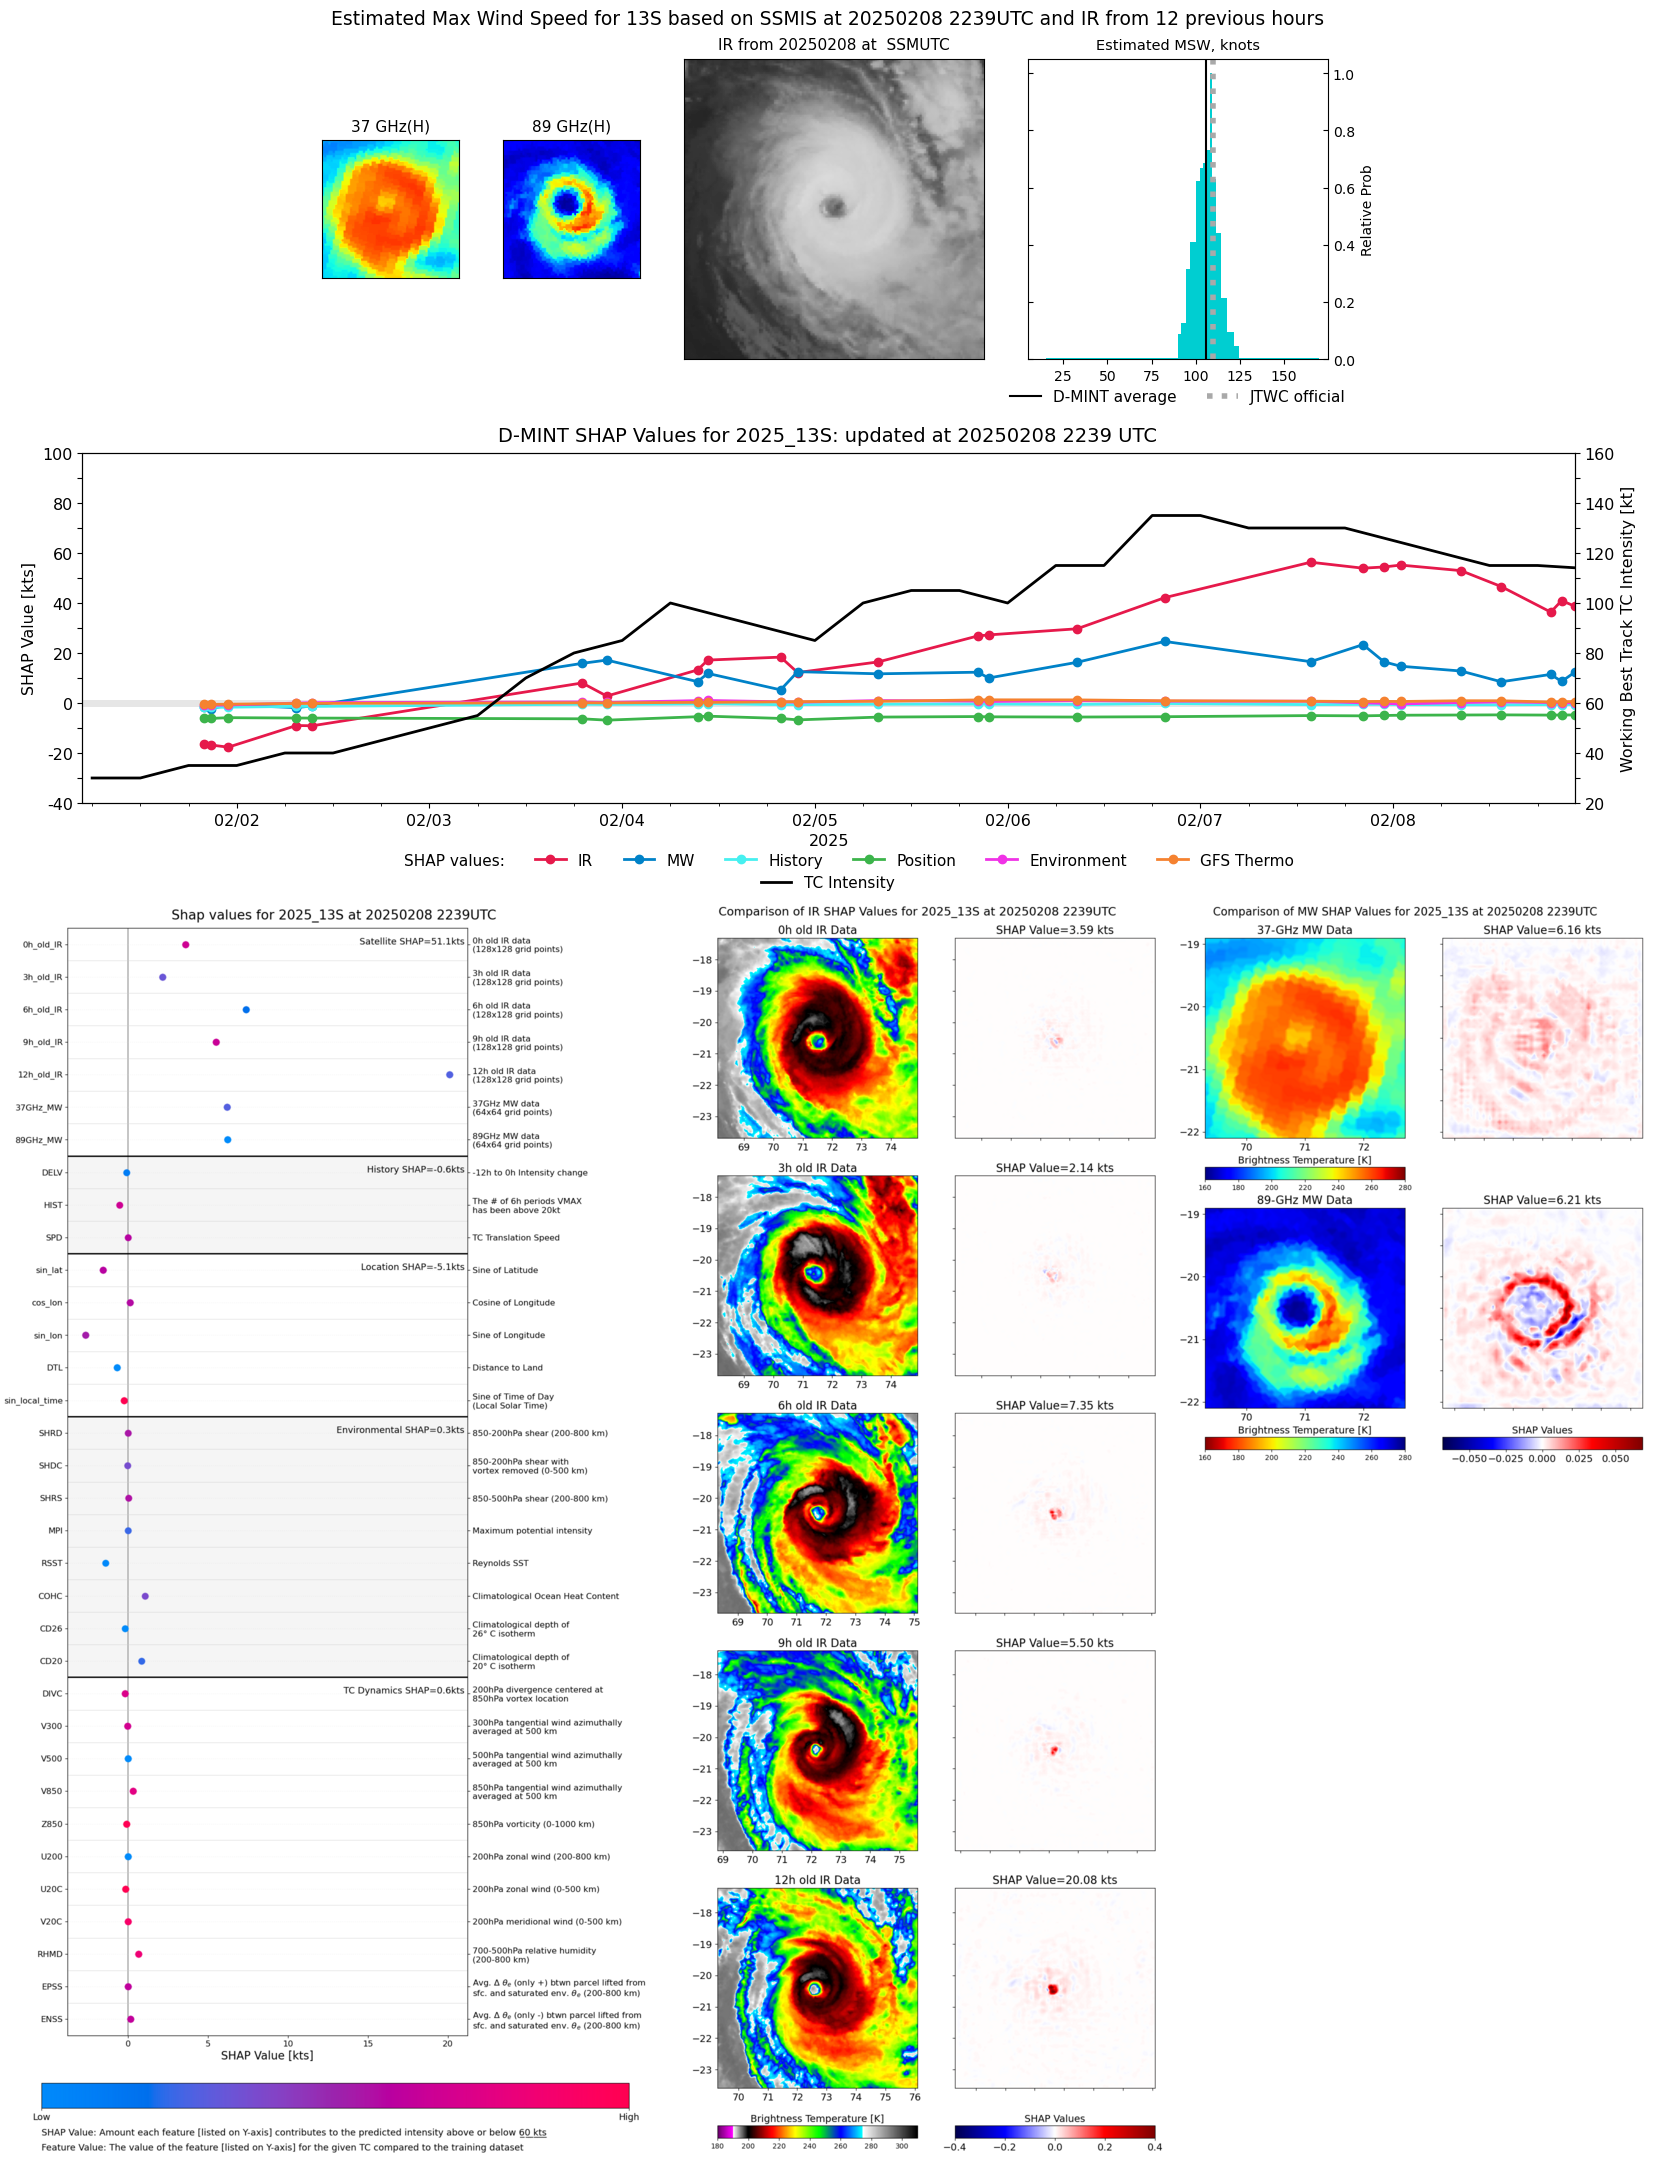 |
| 20250208 | 2059 UTC | AMSR2 | 944 hPa | 105 kts | 100 kts | 109 kts | 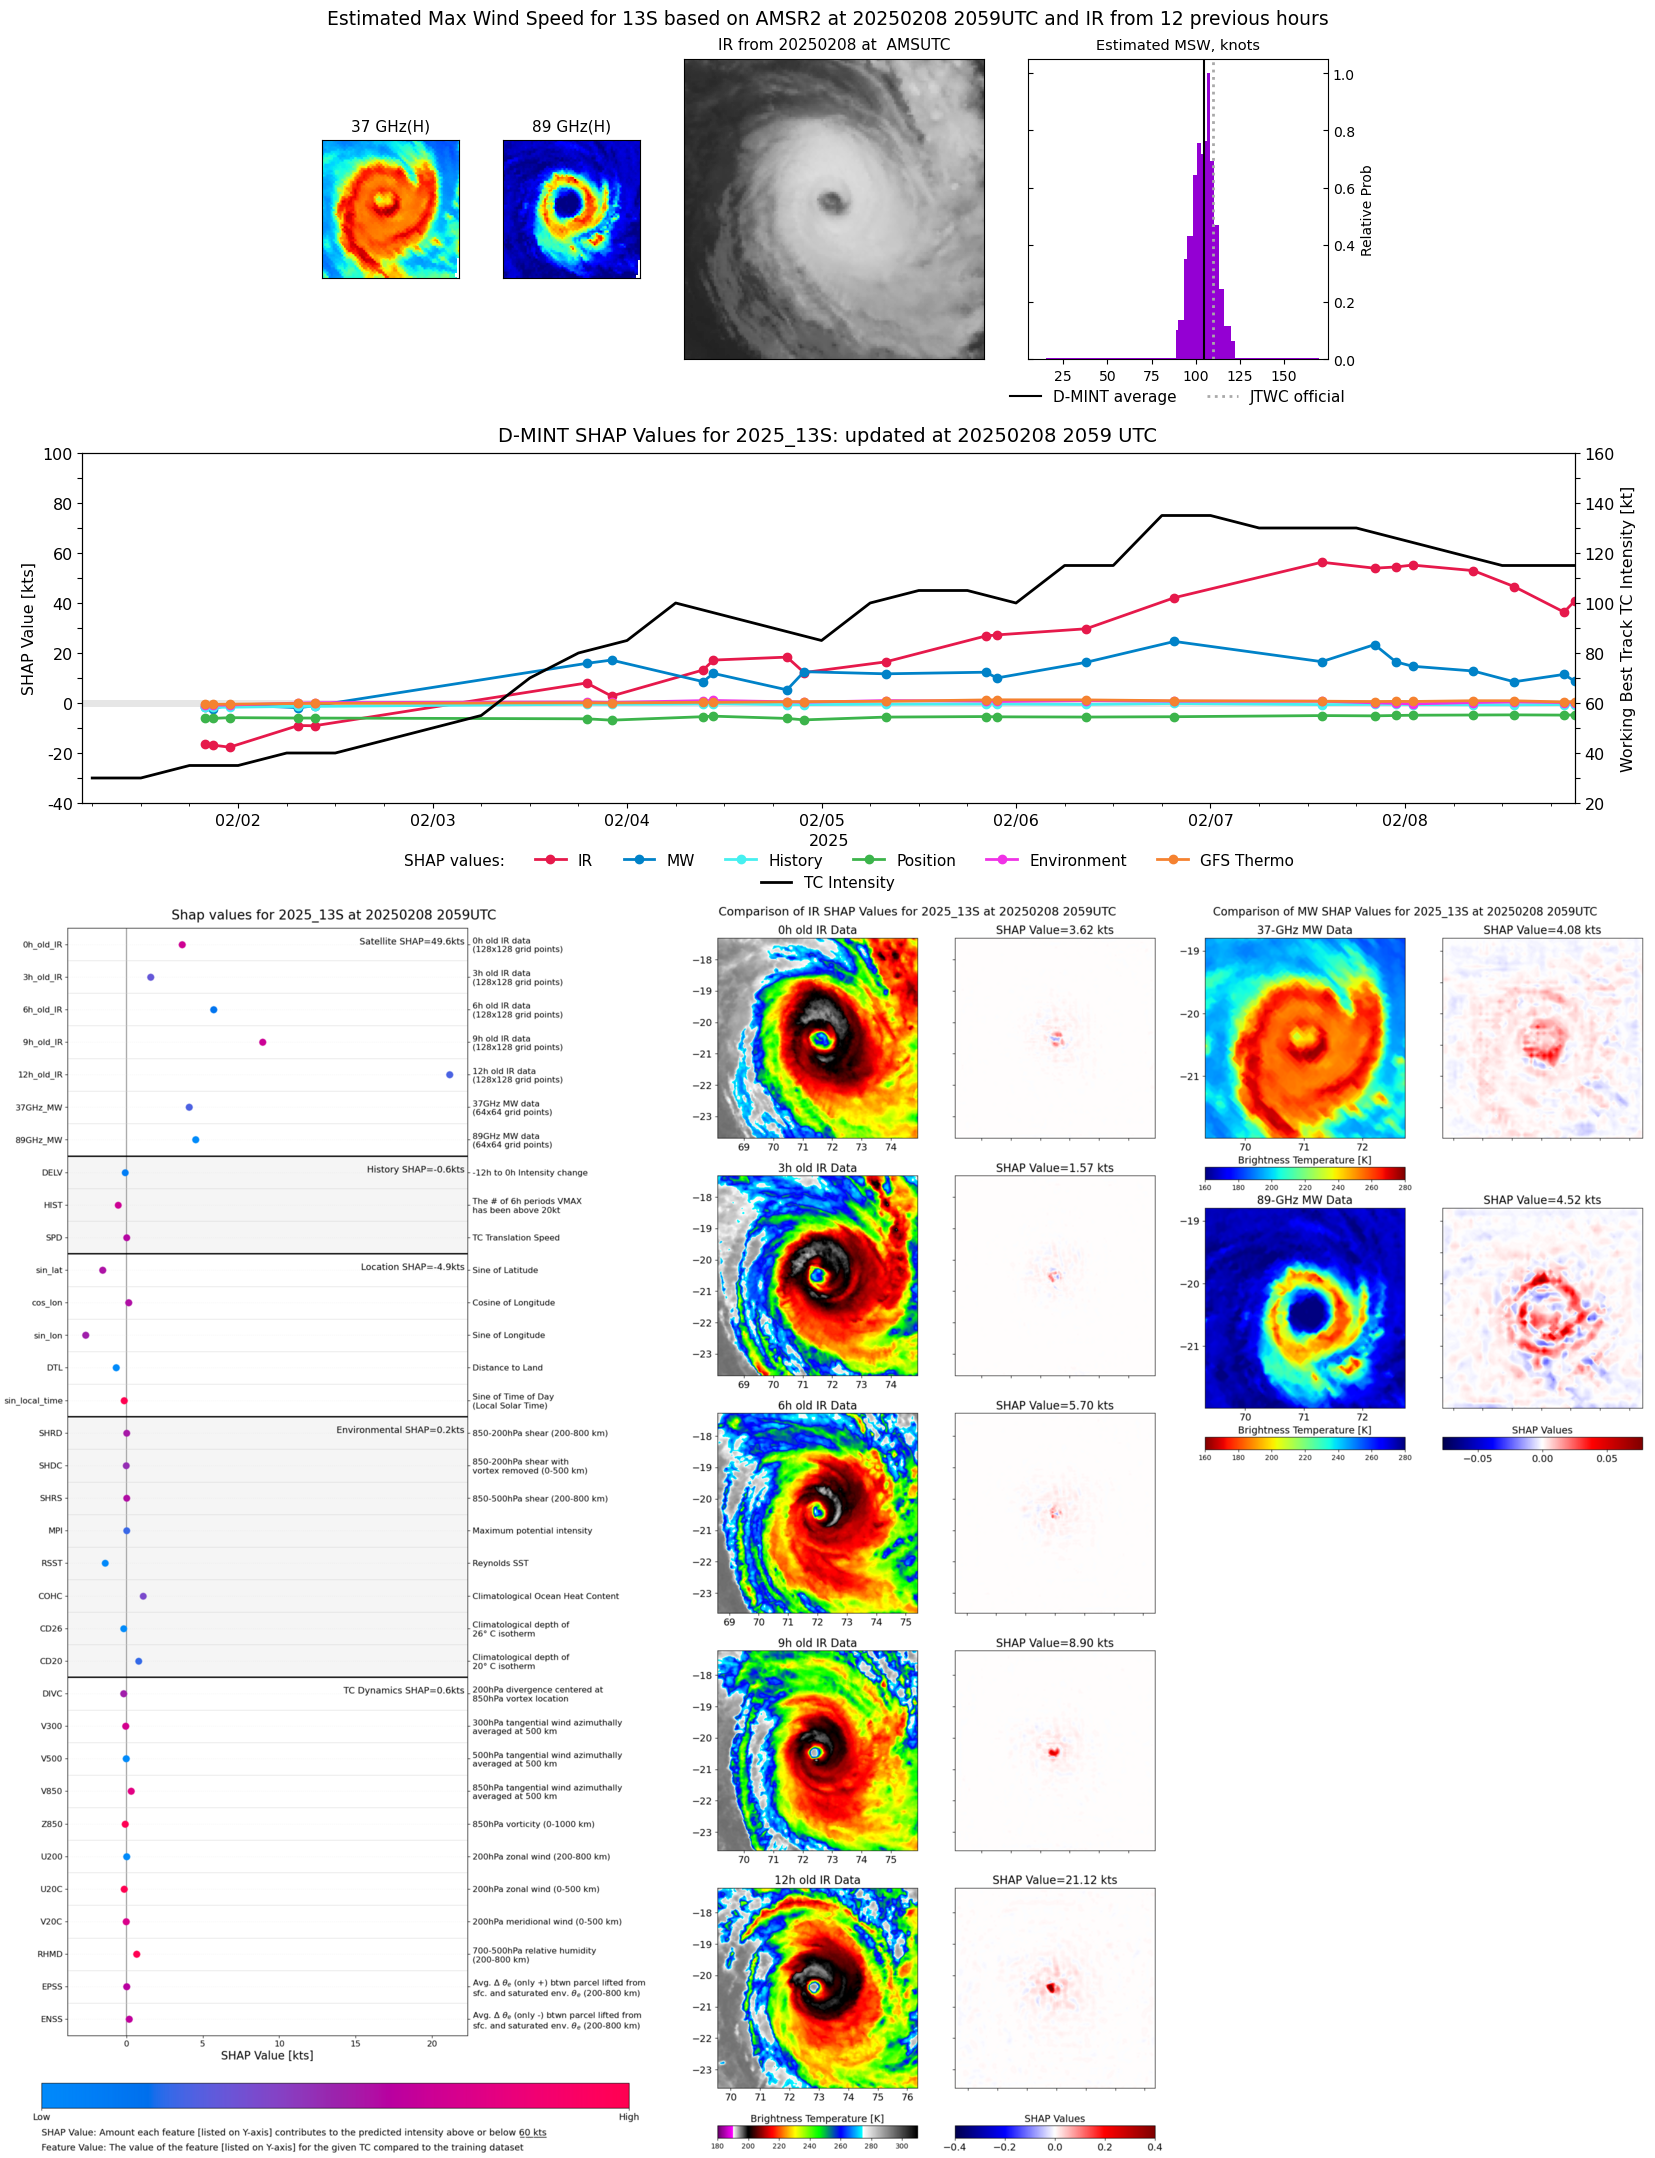 |
| 20250208 | 1938 UTC | GMI | 945 hPa | 103 kts | 98 kts | 108 kts | 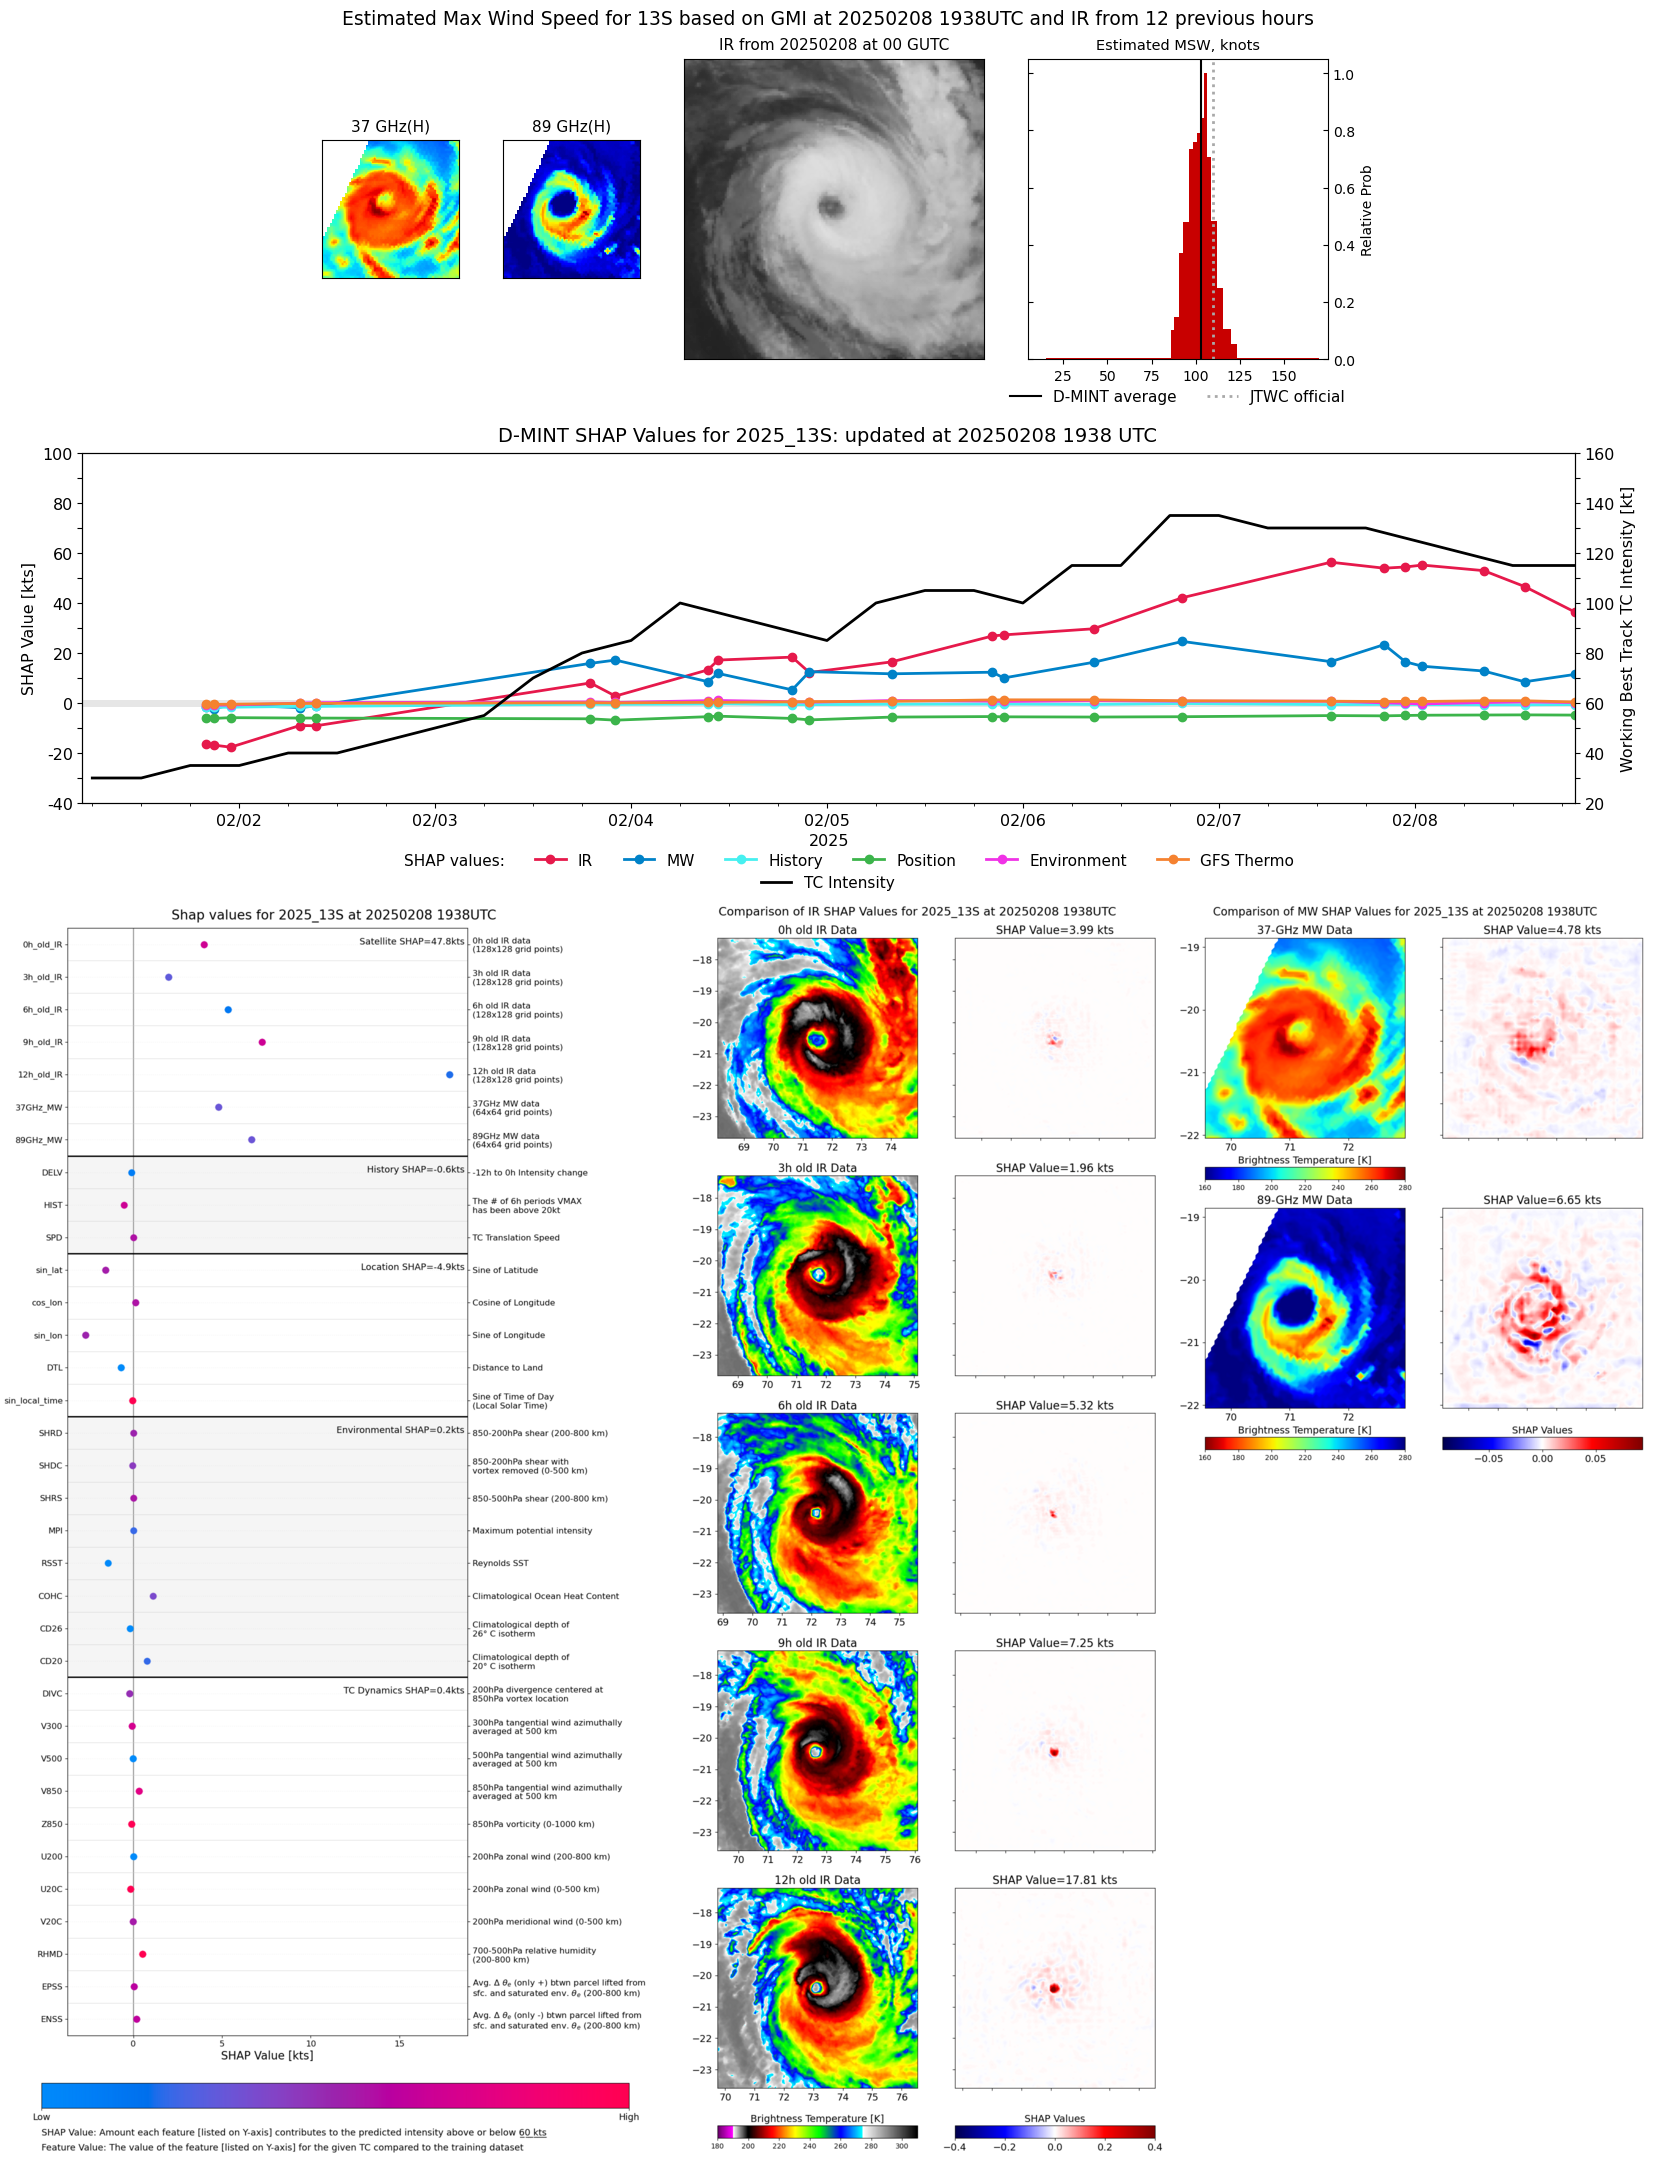 |
| 20250208 | 1328 UTC | SSMISF17 | 939 hPa | 111 kts | 105 kts | 116 kts | 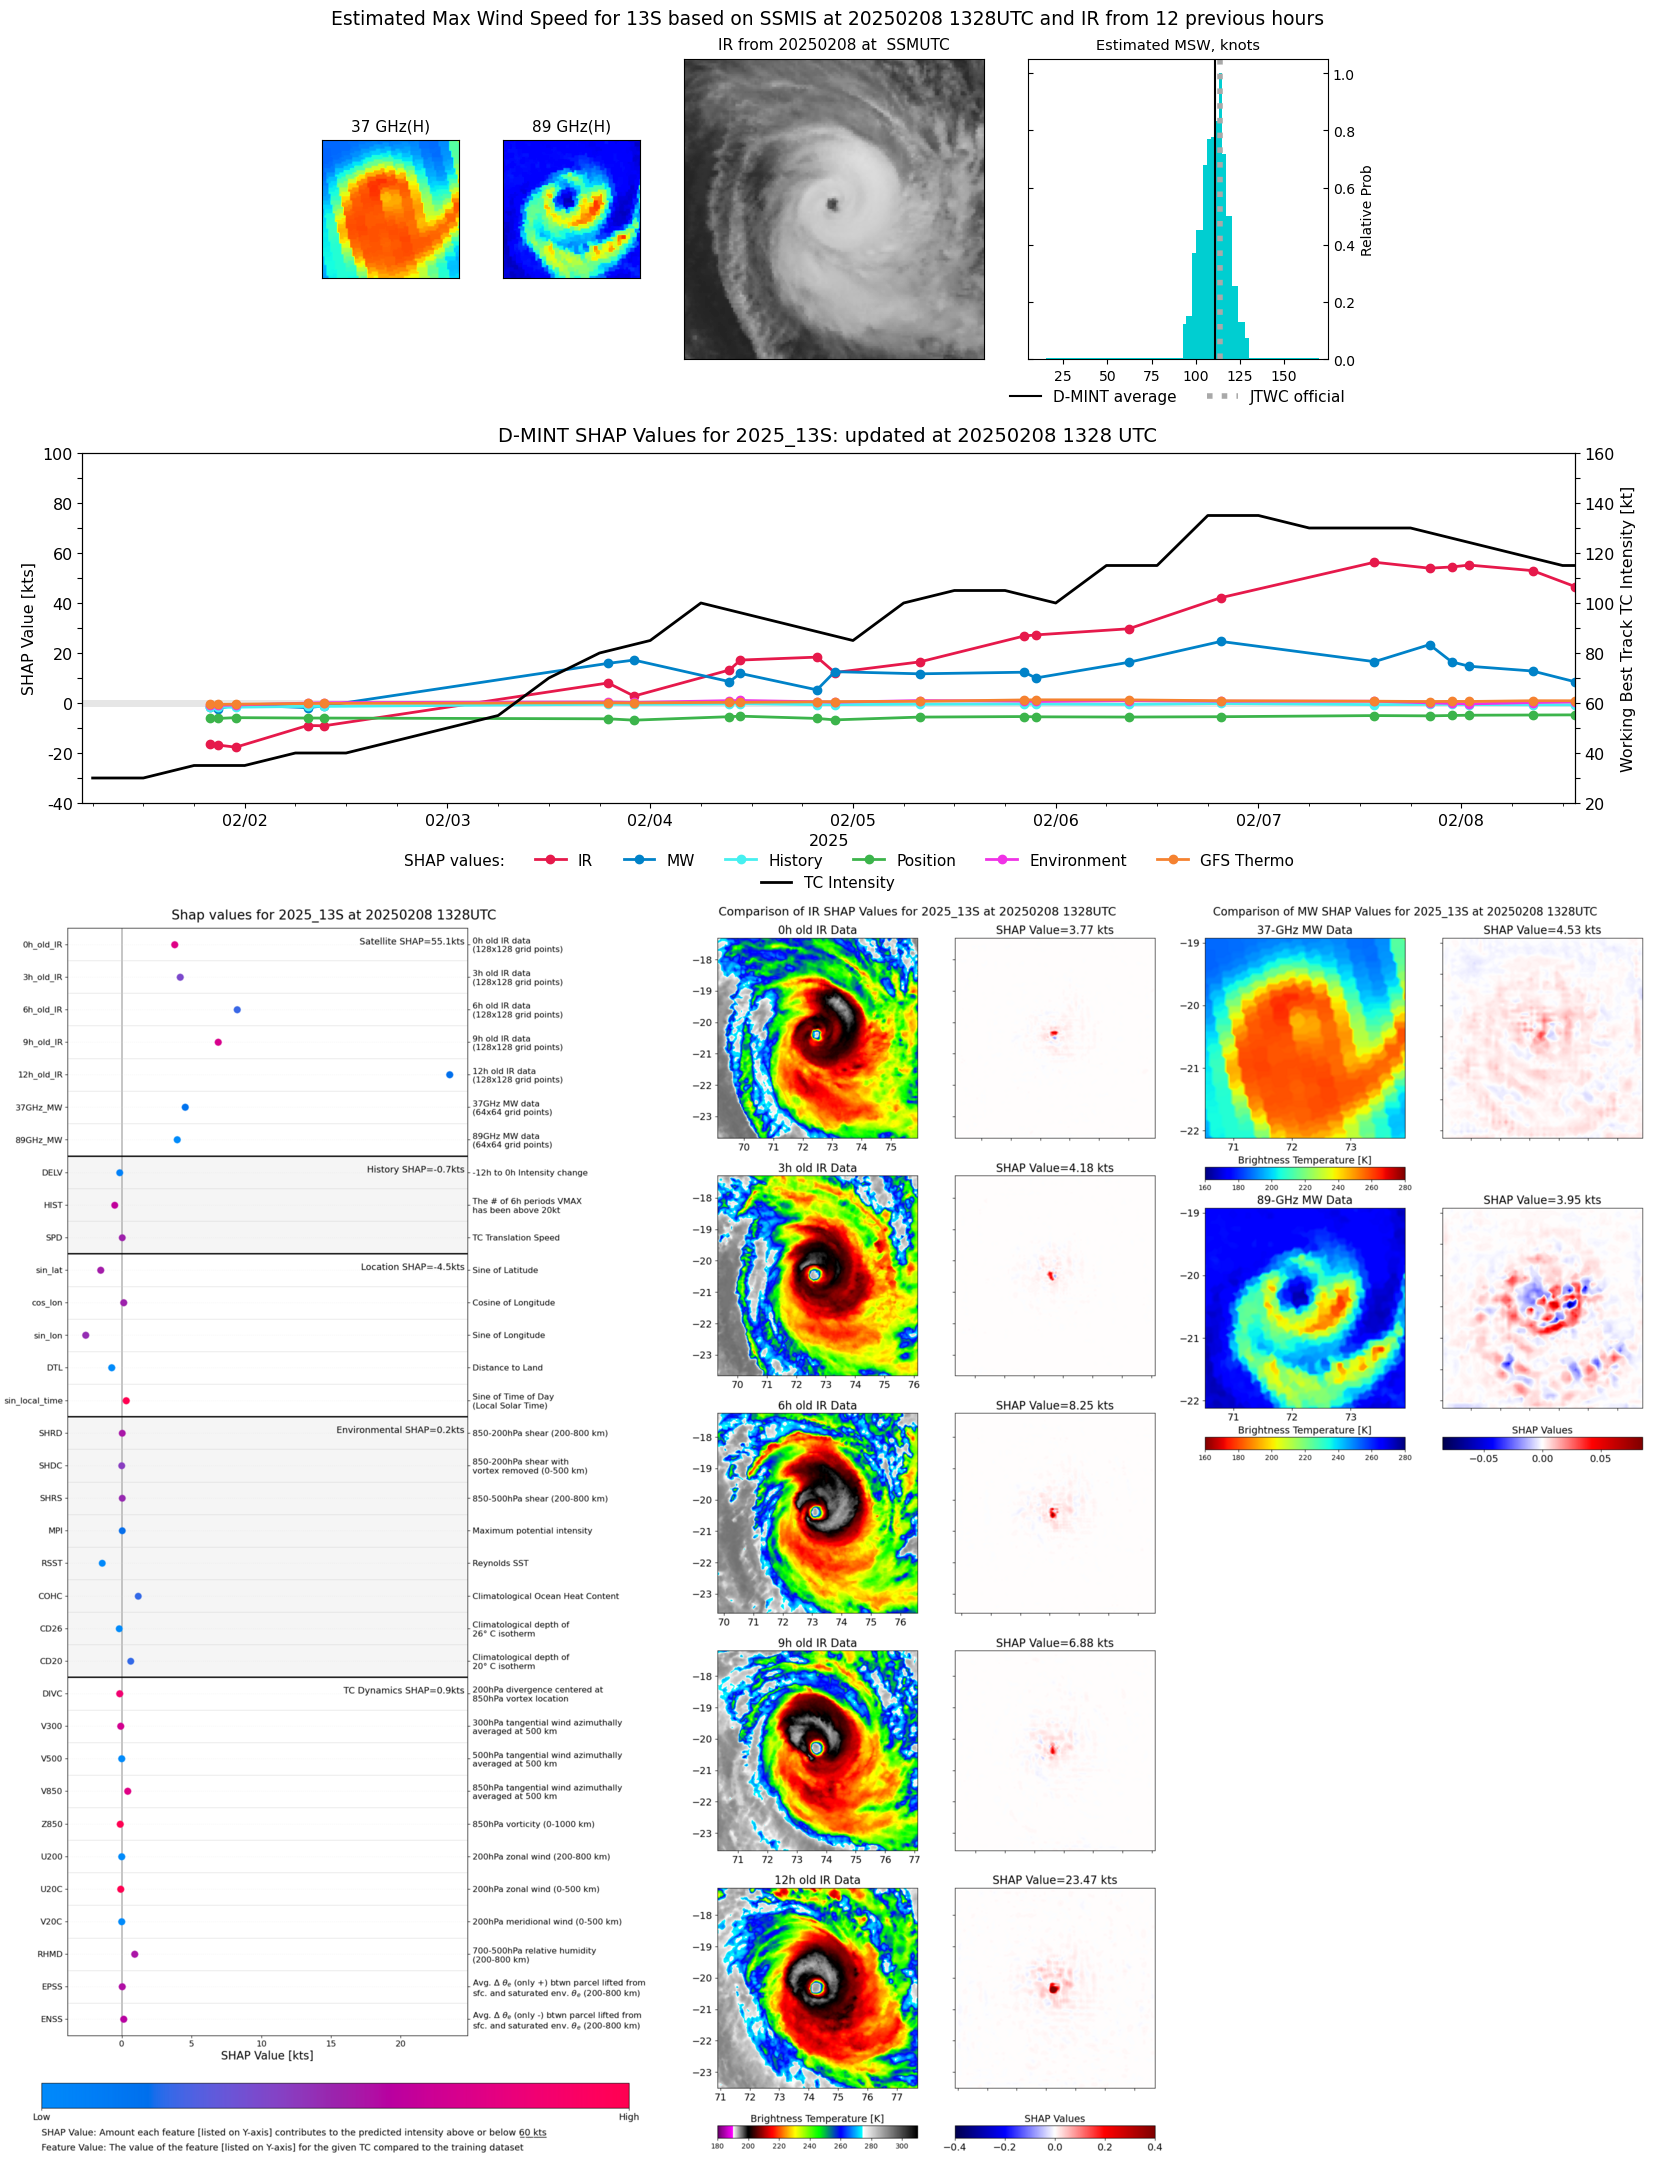 |
| 20250208 | 1124 UTC | SSMISF18 | 938 hPa | 114 kts | 108 kts | 120 kts | 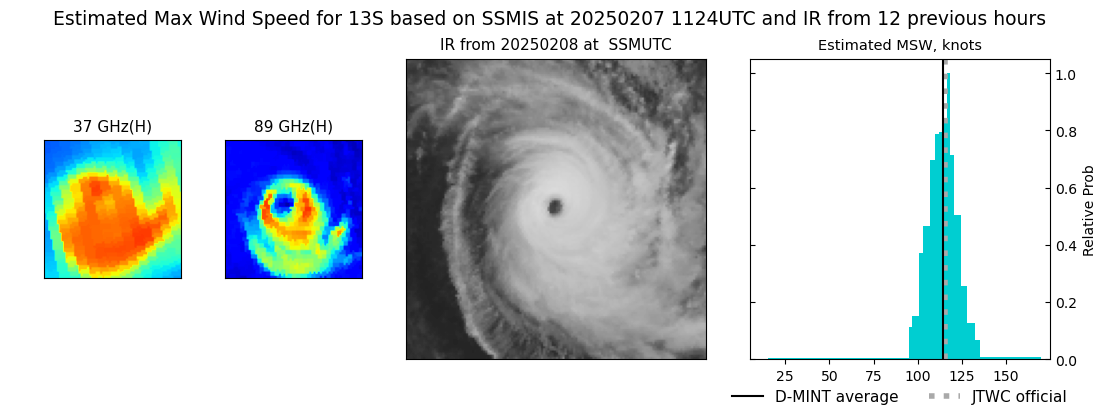 |
| 20250208 | 0858 UTC | ATMS-N20 | 934 hPa | 117 kts | 112 kts | 122 kts |  |
| 20250208 | 0835 UTC | ATMS-N20 | 950 hPa | 103 kts | 99 kts | 108 kts |  |
| 20250208 | 0827 UTC | AMSR2 | 938 hPa | 121 kts | 115 kts | 127 kts | 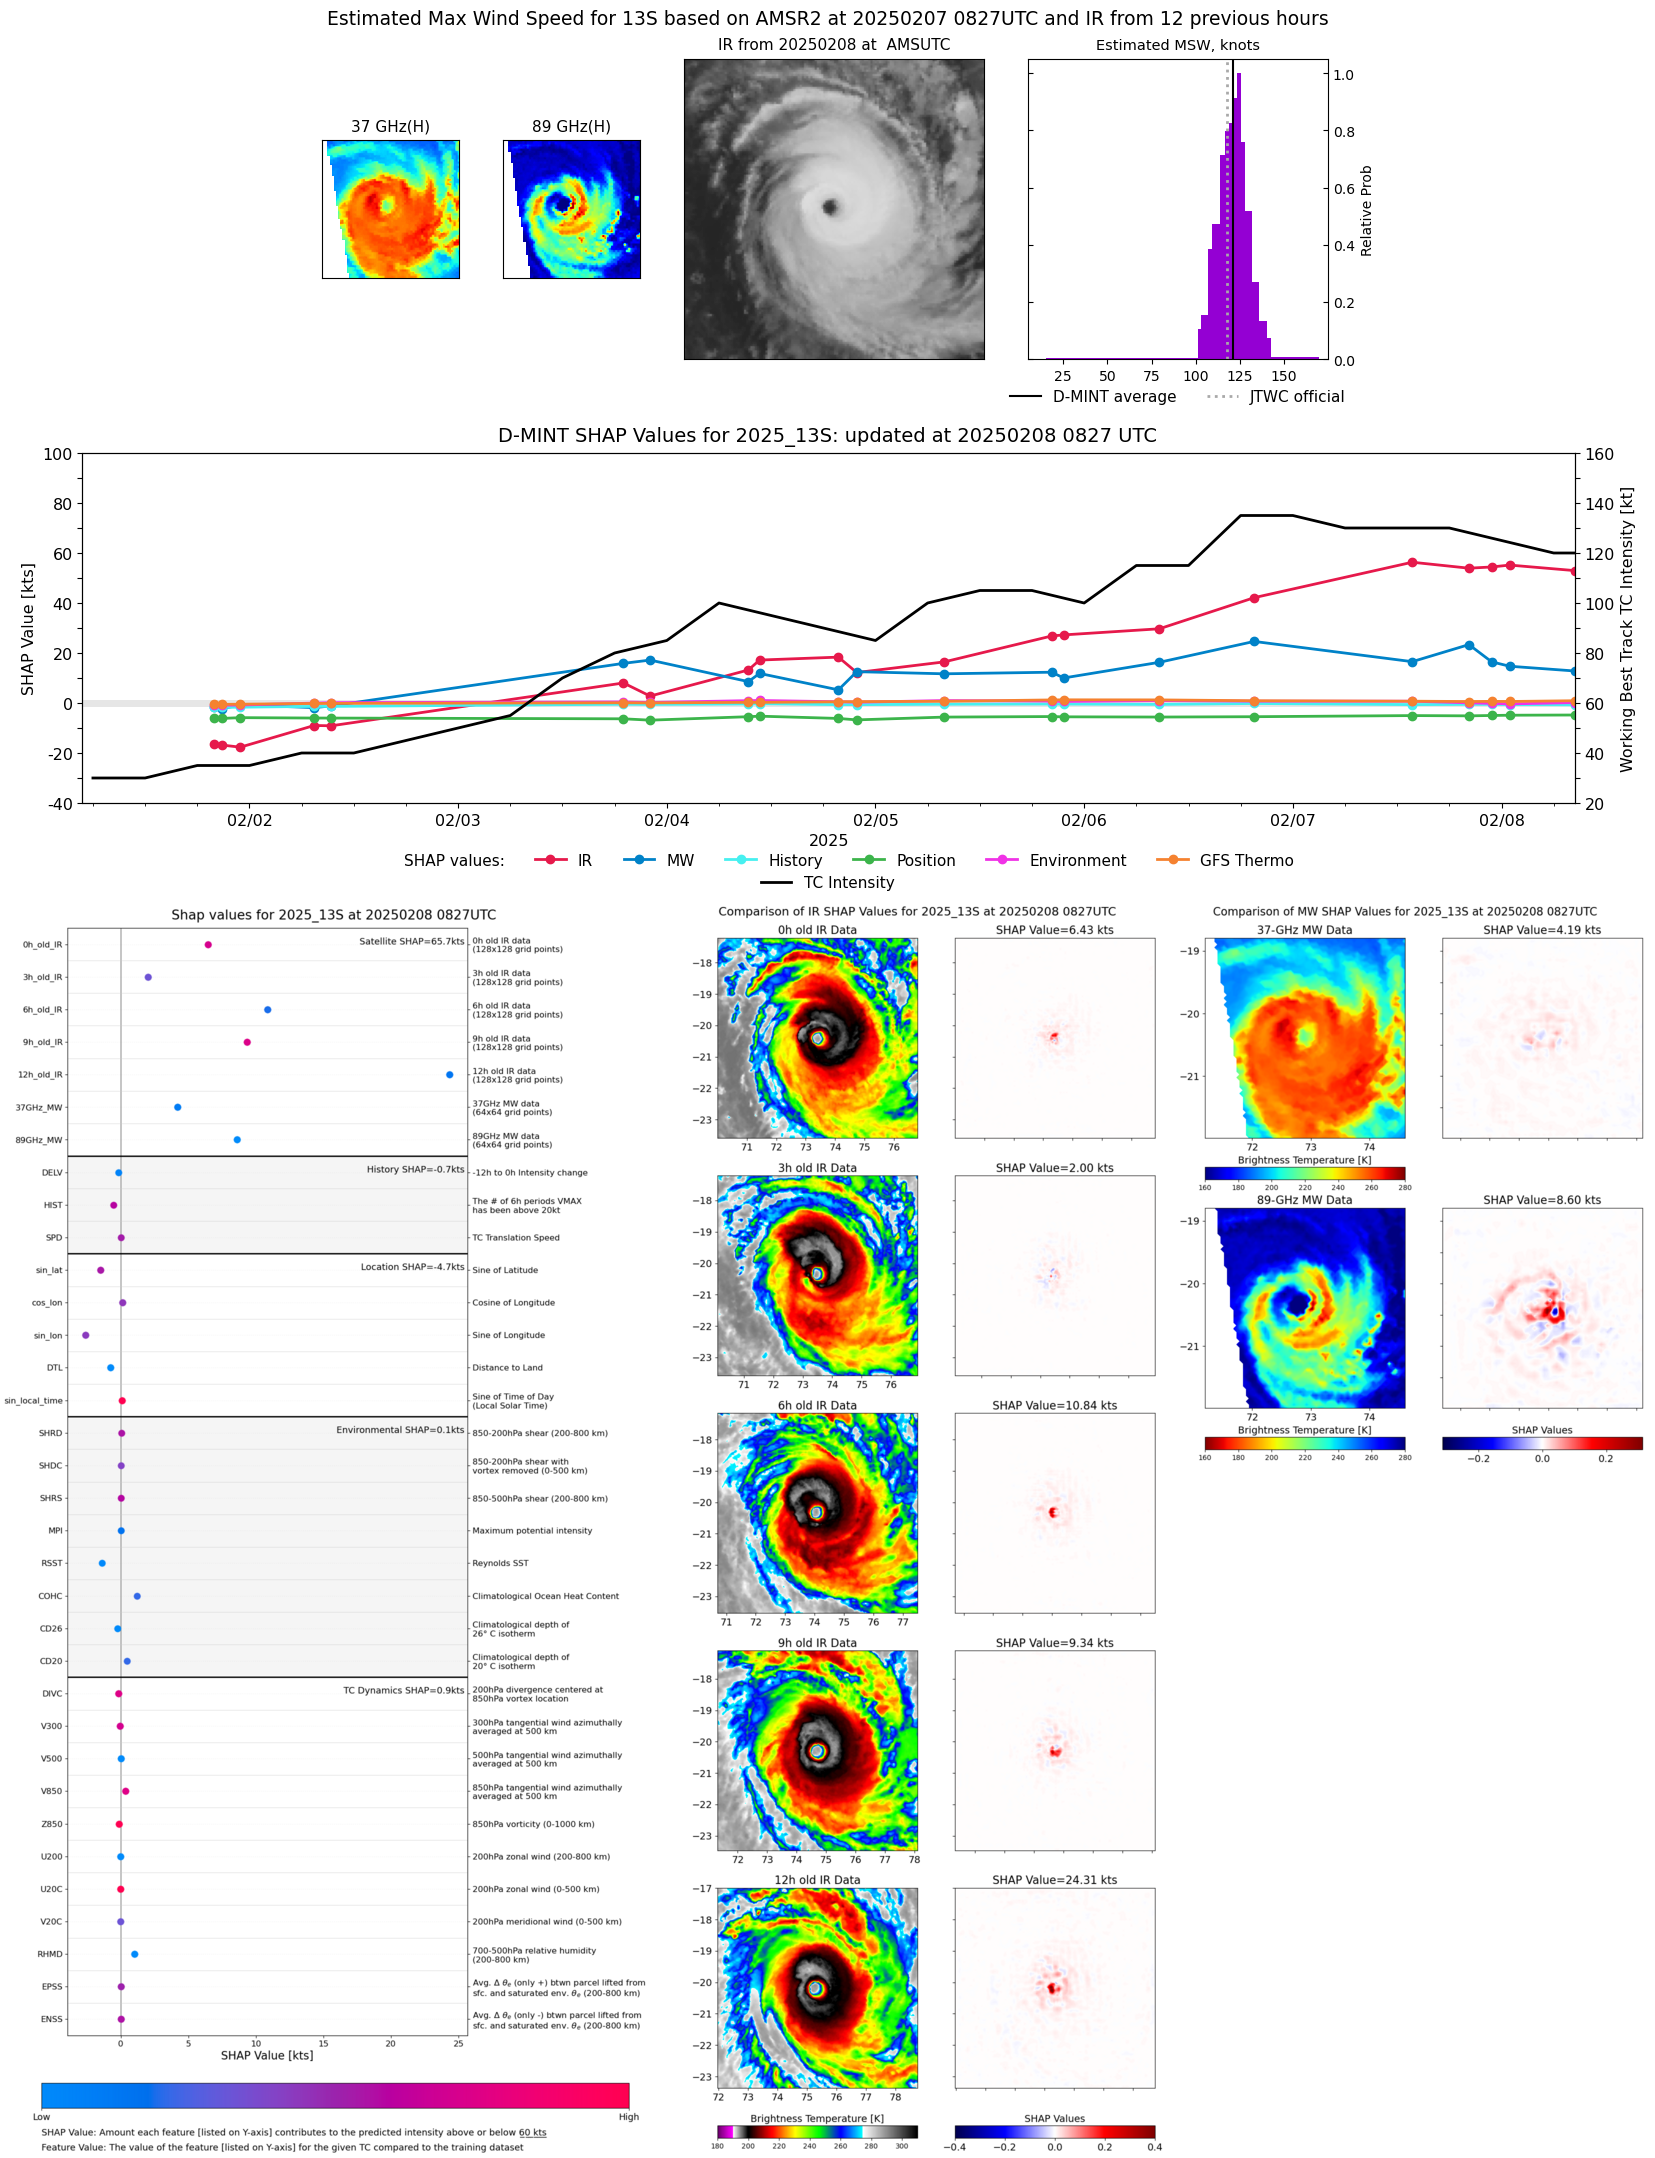 |
| 20250208 | 0134 UTC | SSMISF16 | 929 hPa | 130 kts | 124 kts | 135 kts | 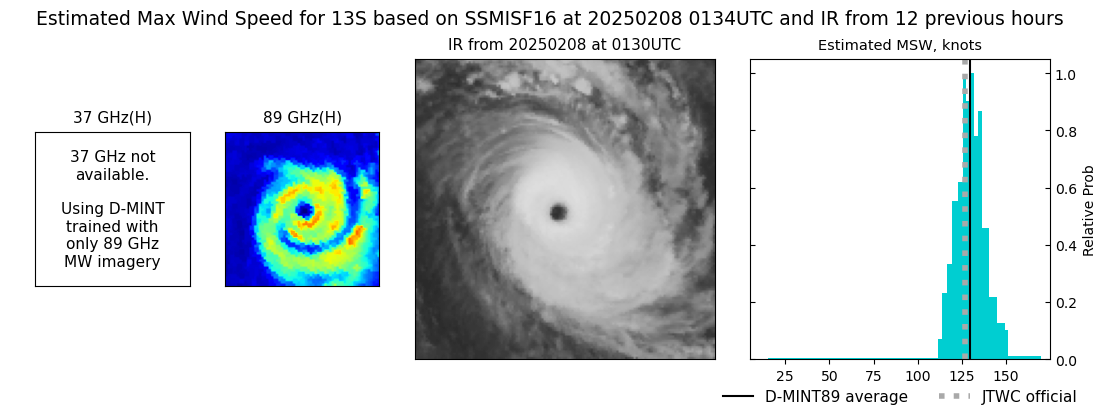 |
| 20250208 | 0056 UTC | SSMISF17 | 924 hPa | 124 kts | 119 kts | 129 kts | 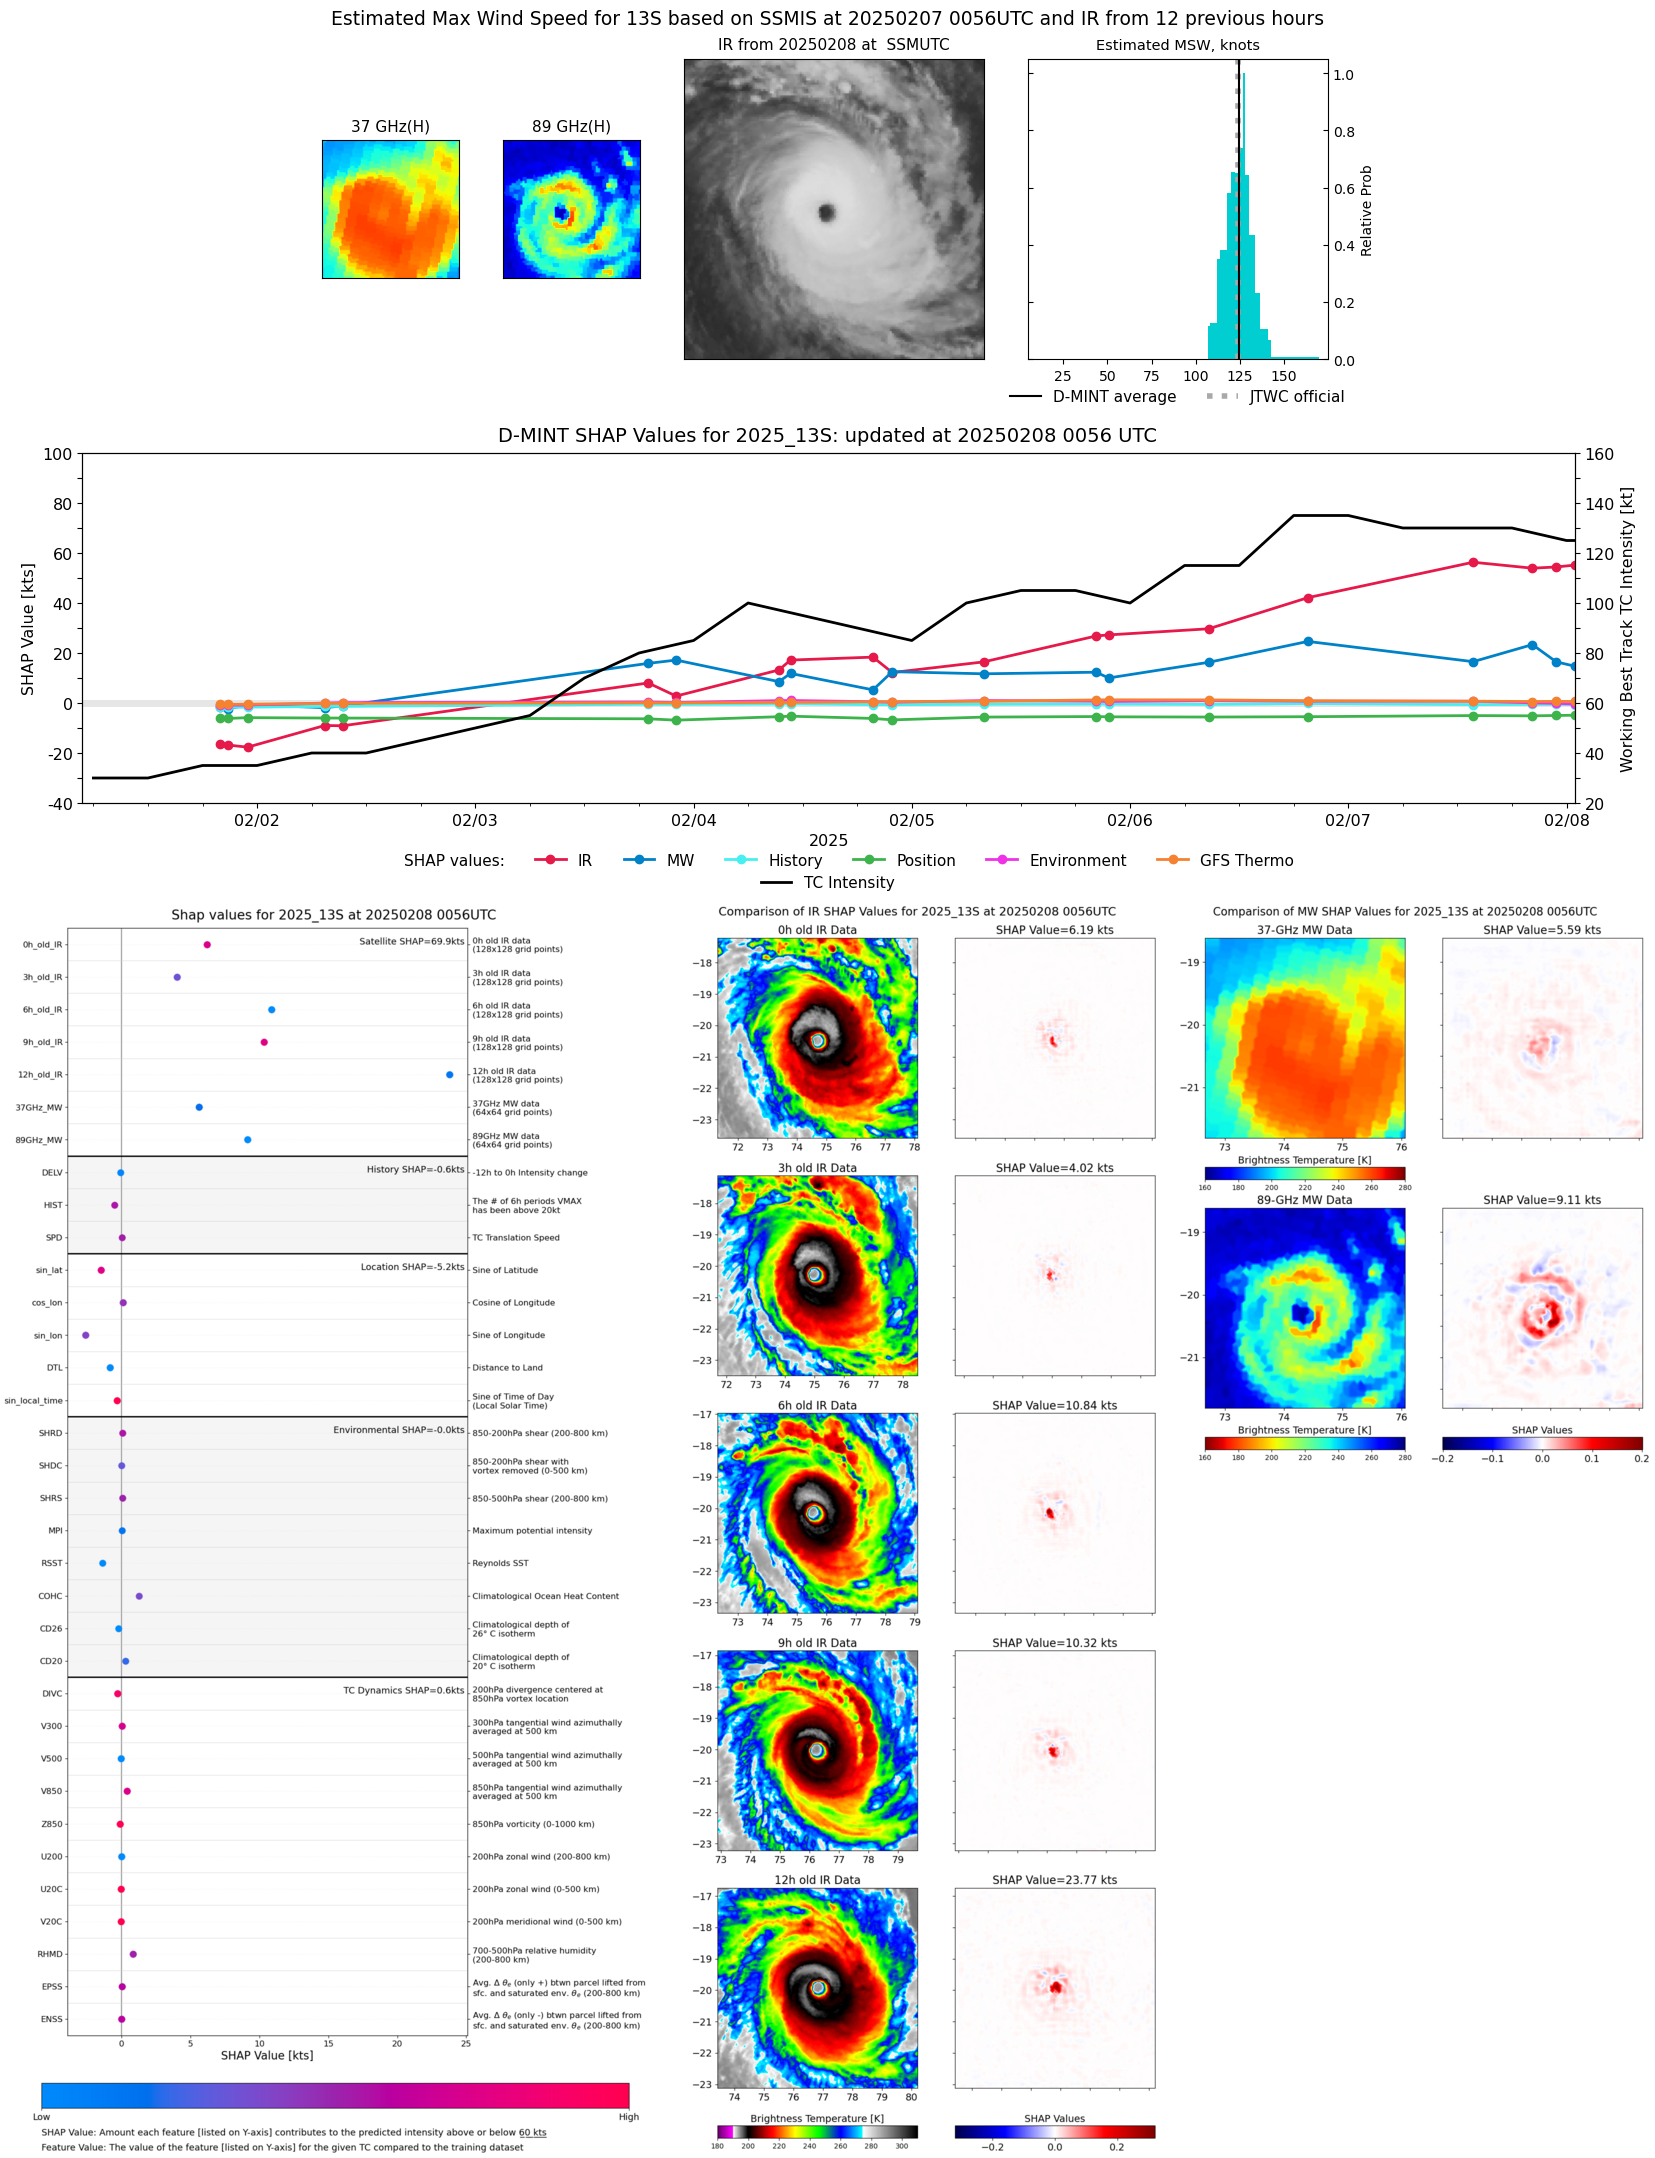 |
| 20250208 | 0010 UTC | TROPICS05 | 928 hPa | 125 kts | 120 kts | 130 kts | 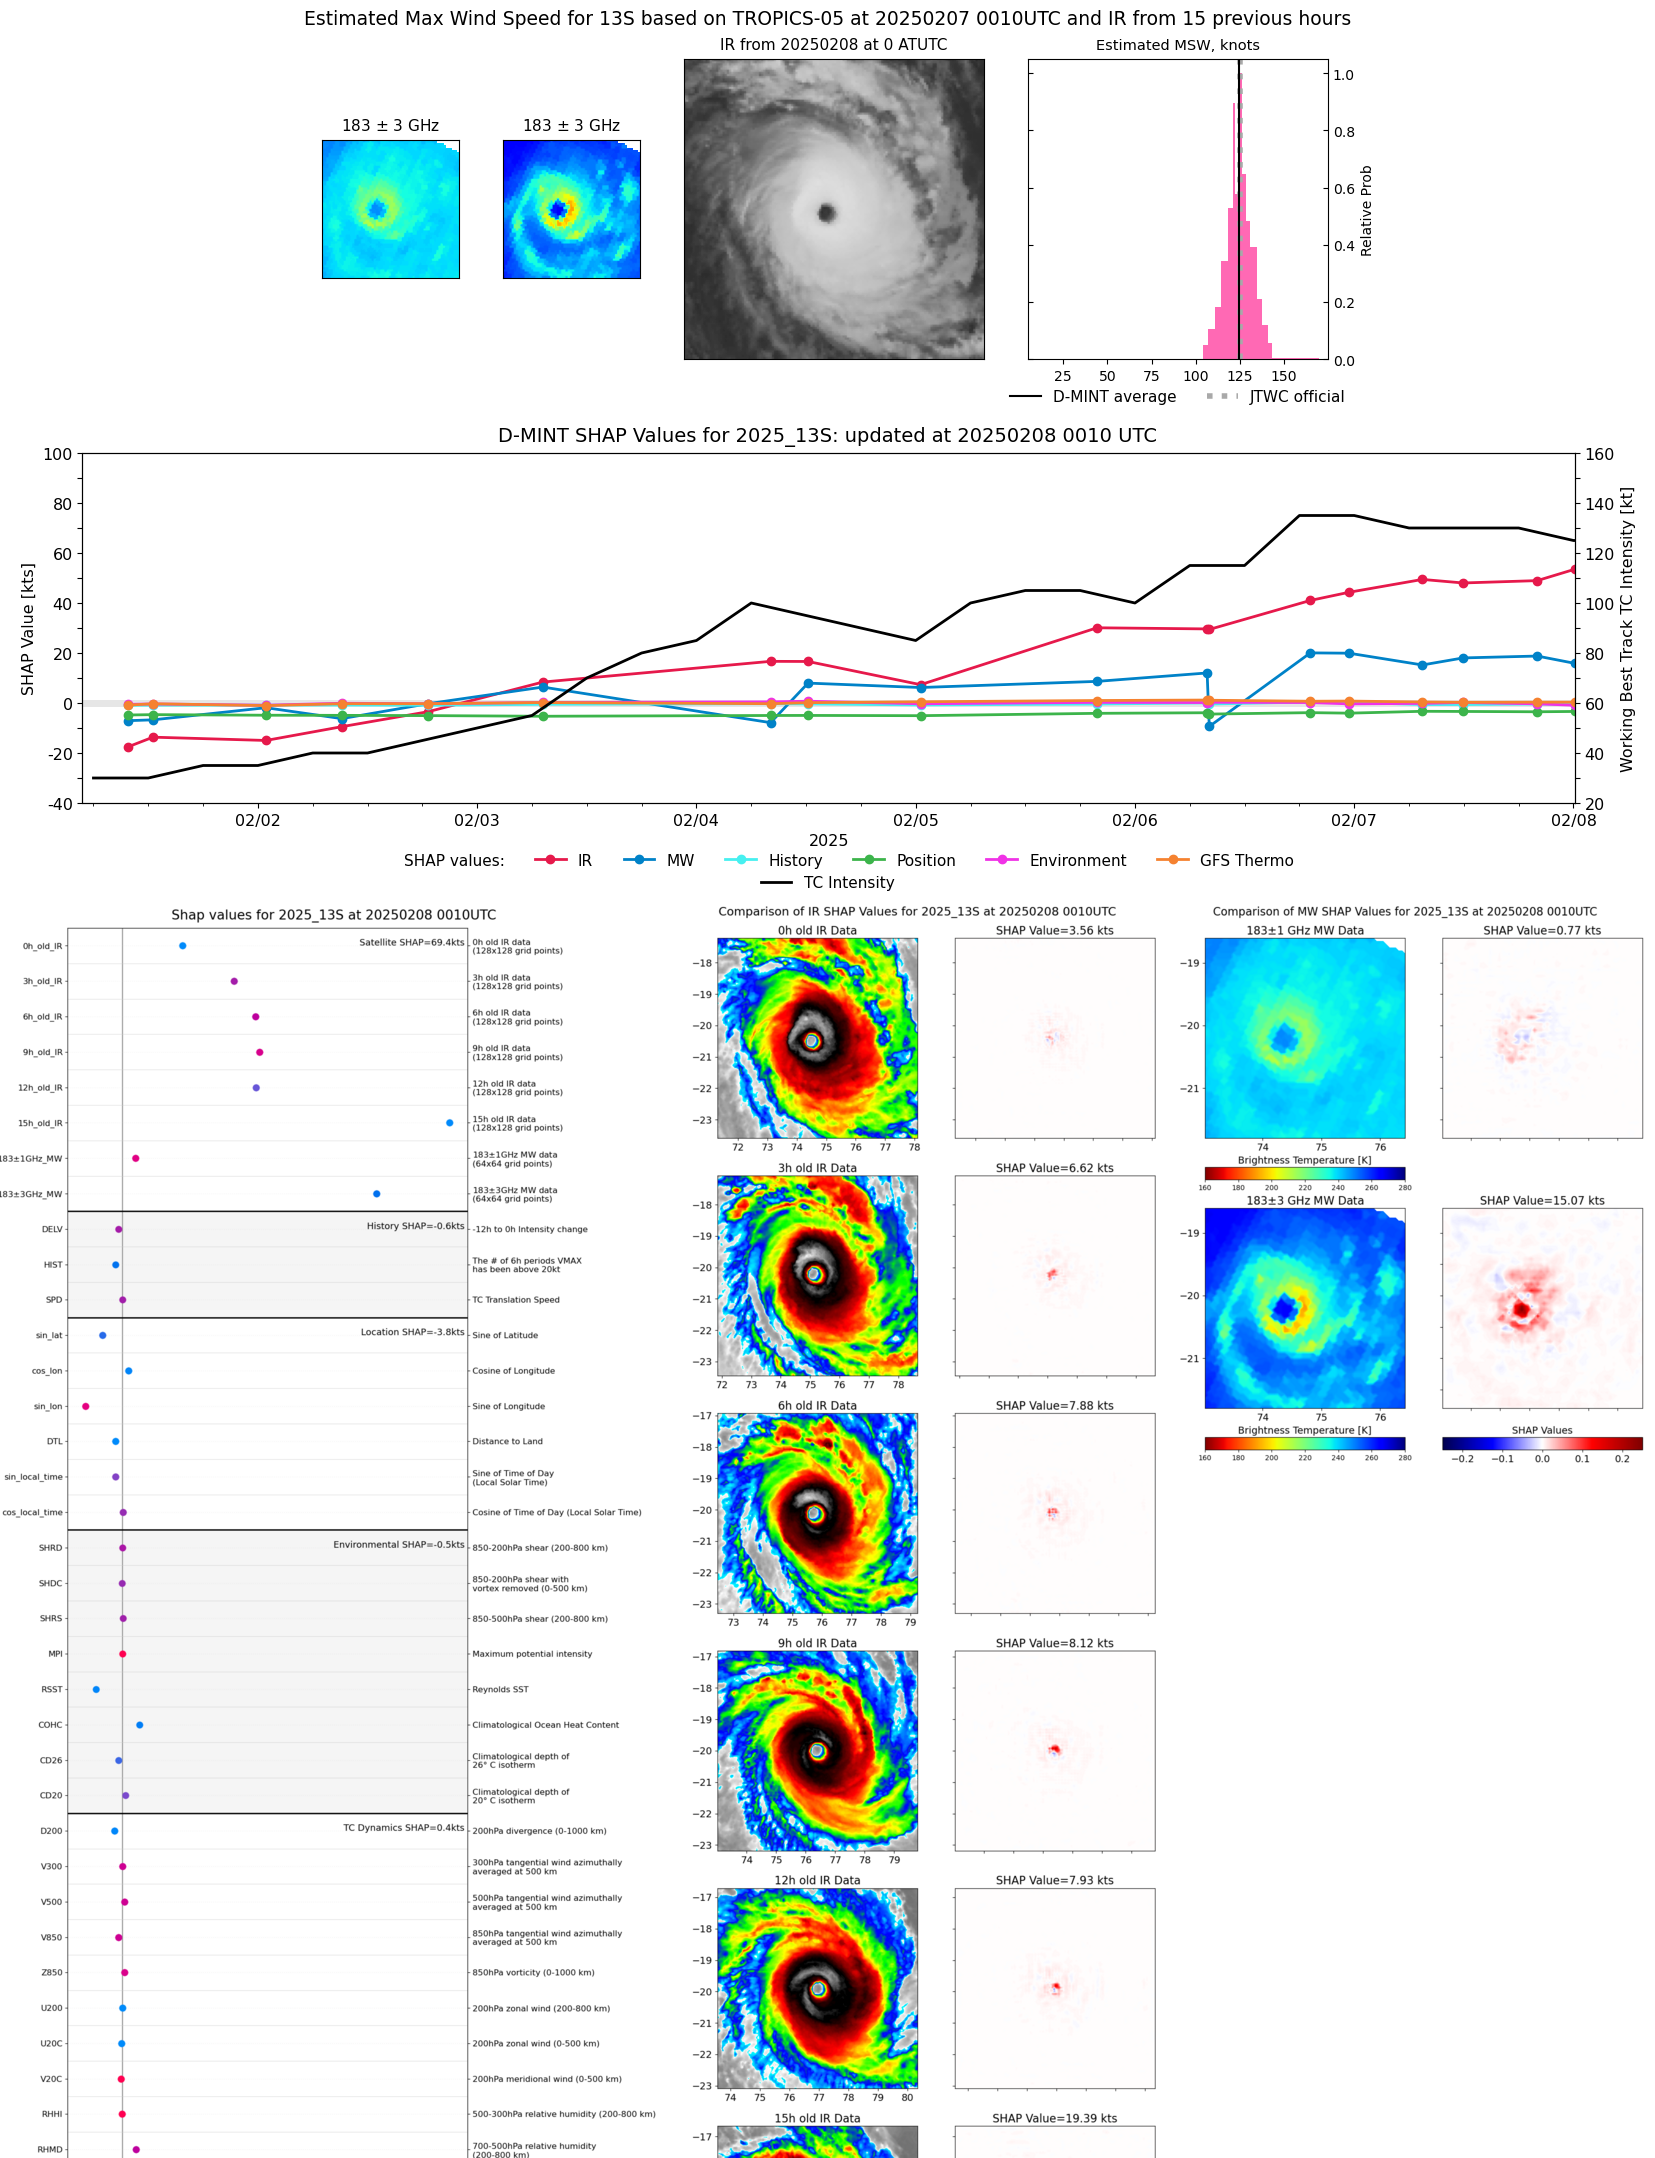 |
| 20250207 | 2252 UTC | SSMISF18 | 925 hPa | 126 kts | 120 kts | 131 kts | 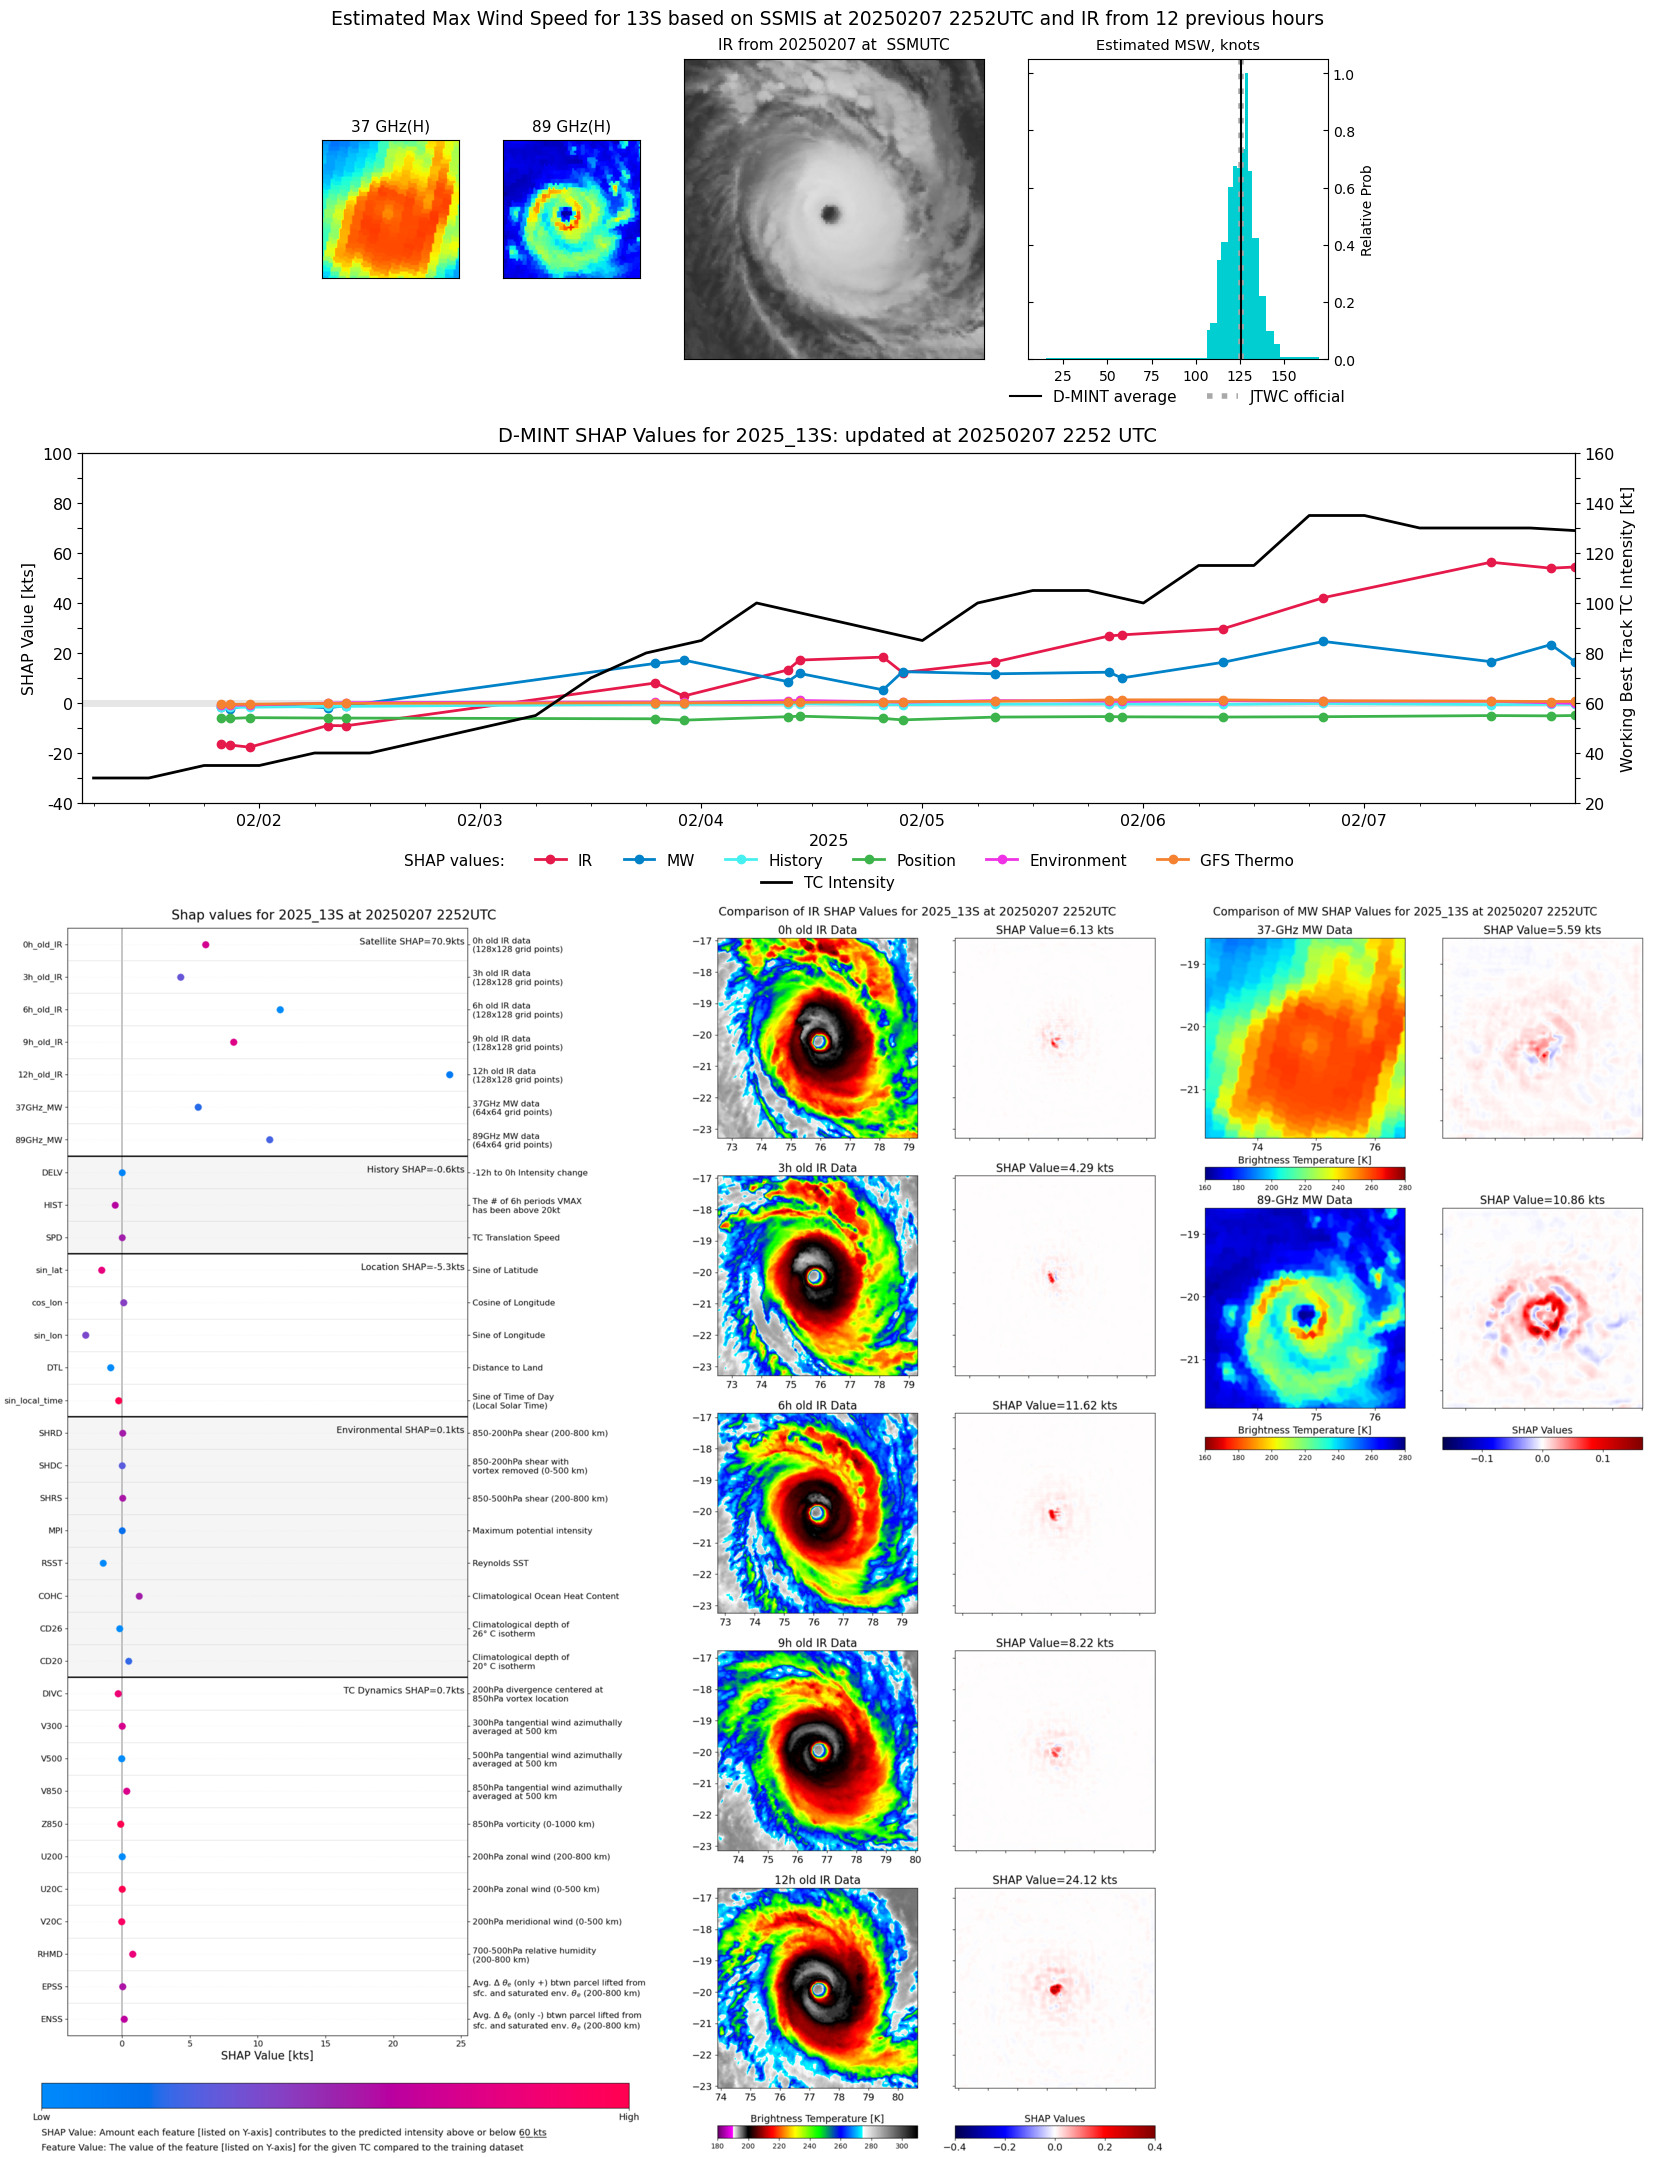 |
| 20250207 | 2015 UTC | AMSR2 | 923 hPa | 132 kts | 127 kts | 137 kts | 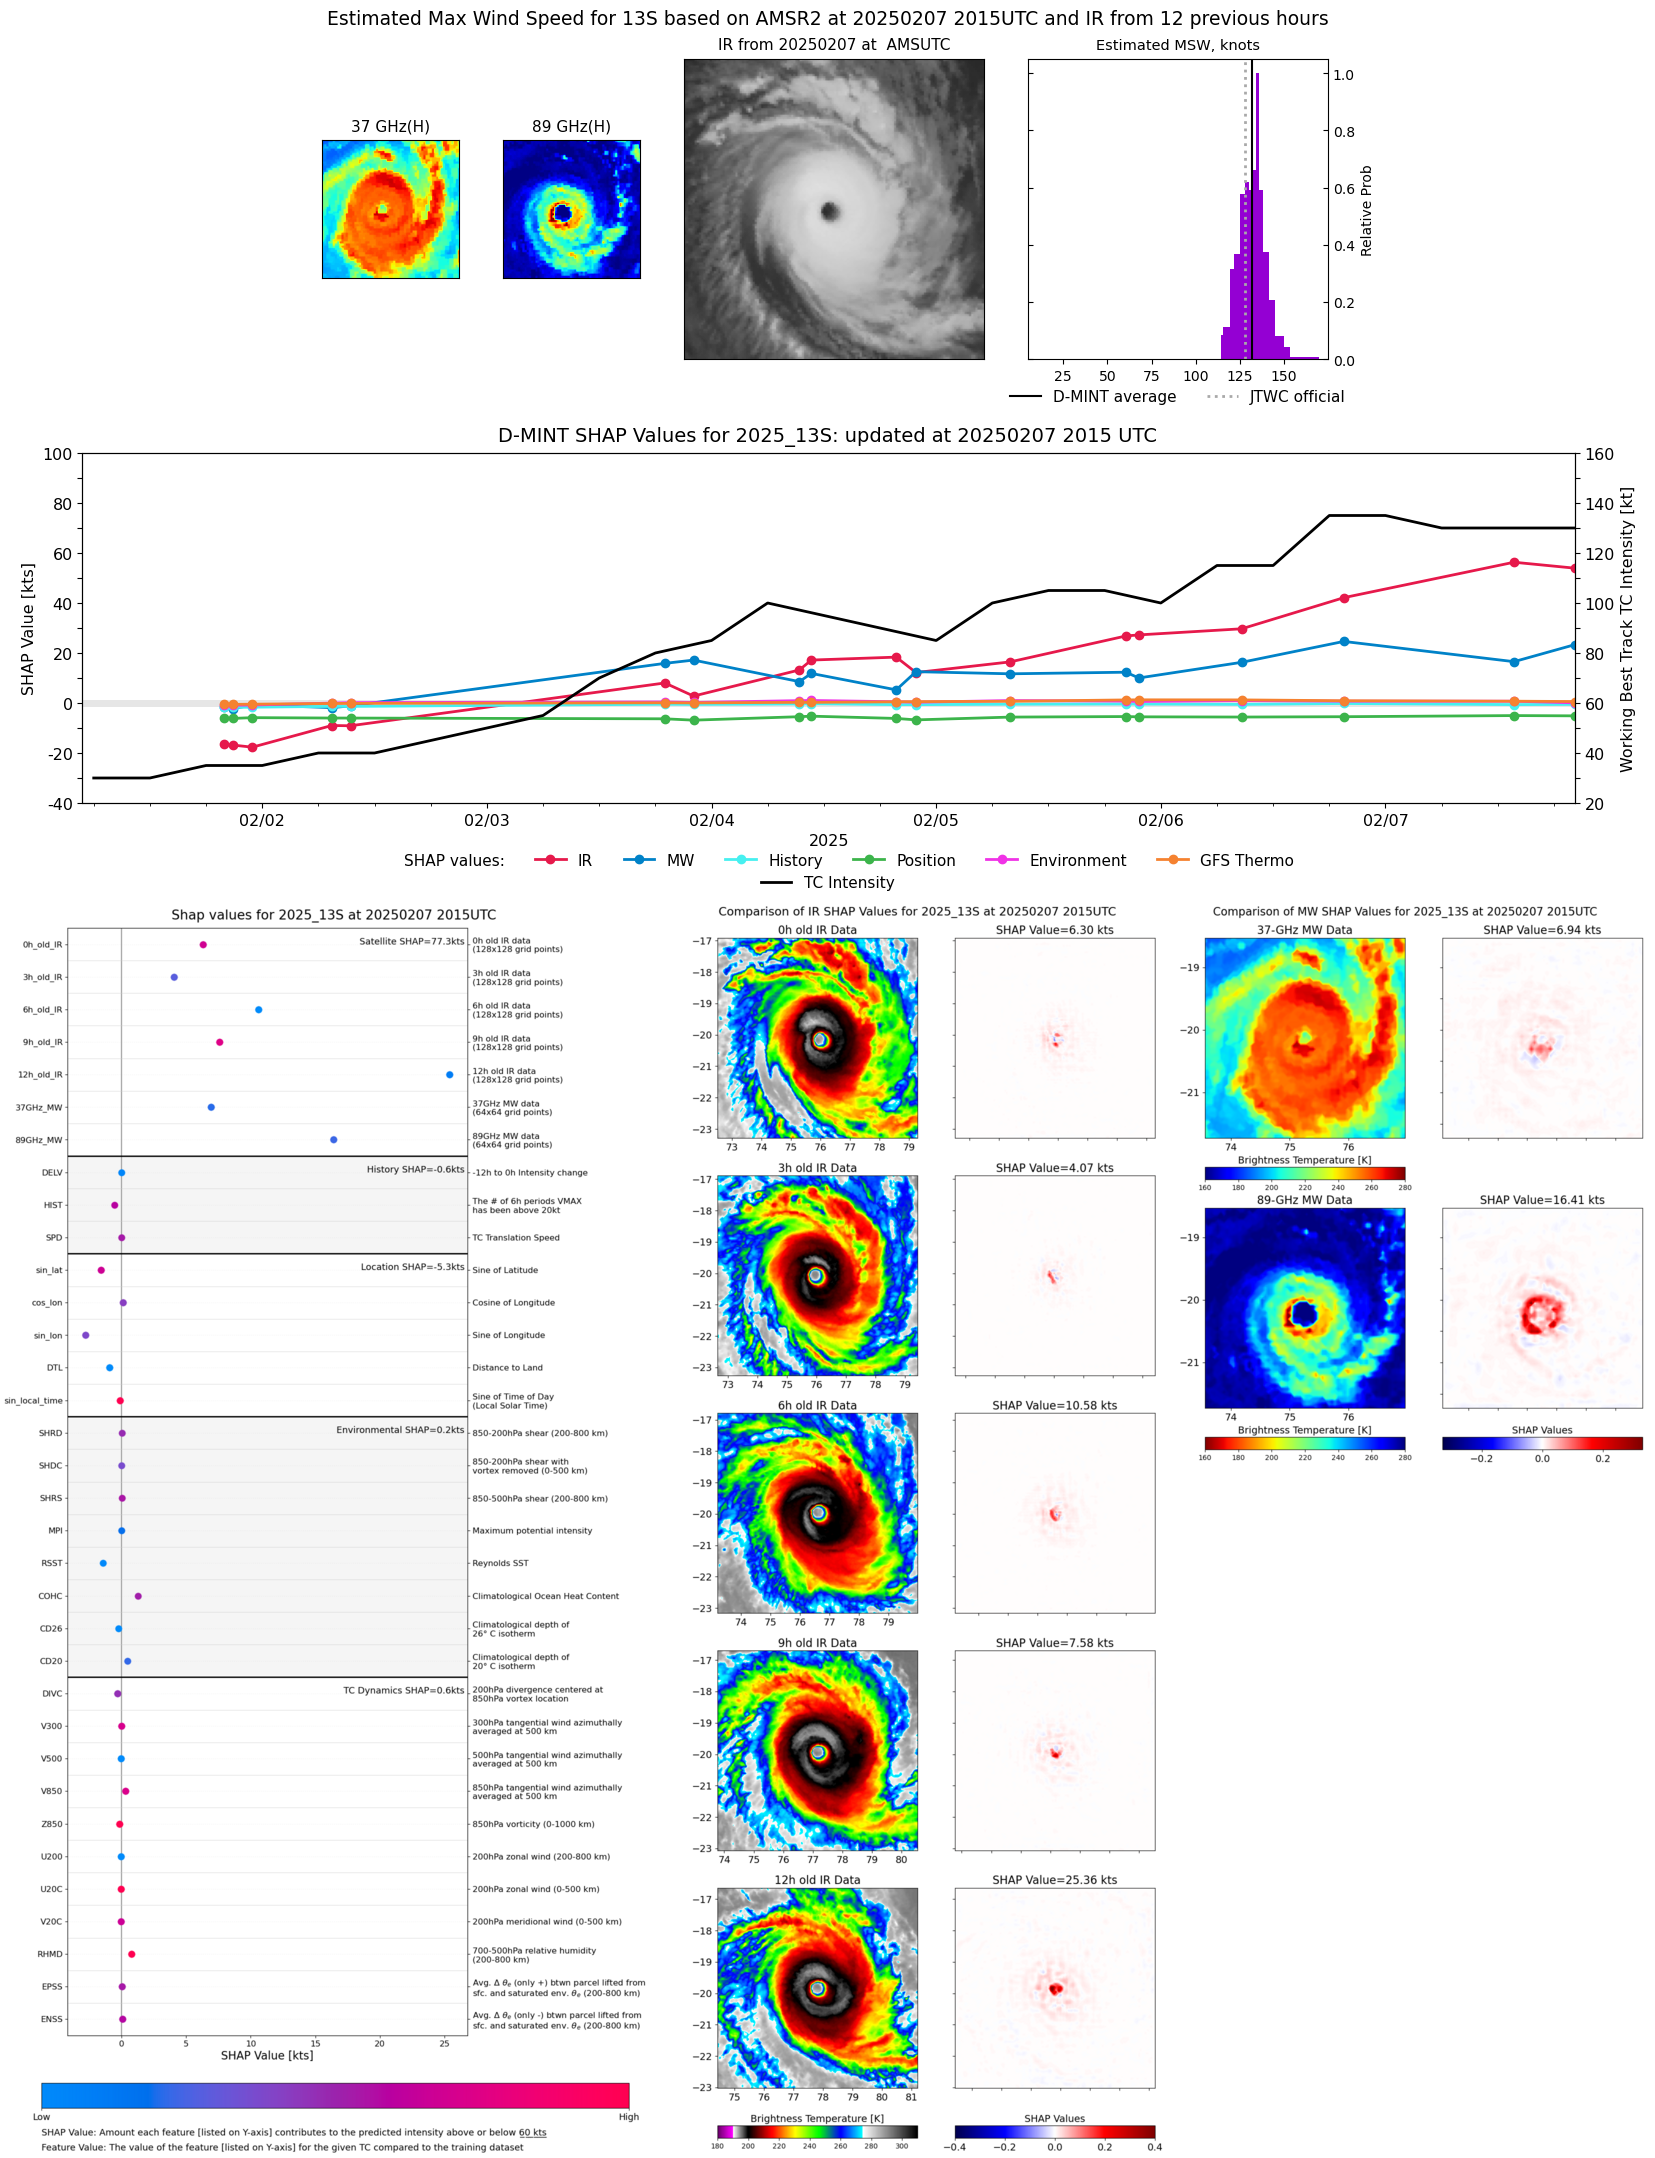 |
| 20250207 | 2002 UTC | ATMS-N20 | 925 hPa | 124 kts | 118 kts | 129 kts |  |
| 20250207 | 1344 UTC | SSMISF17 | 923 hPa | 128 kts | 123 kts | 133 kts | 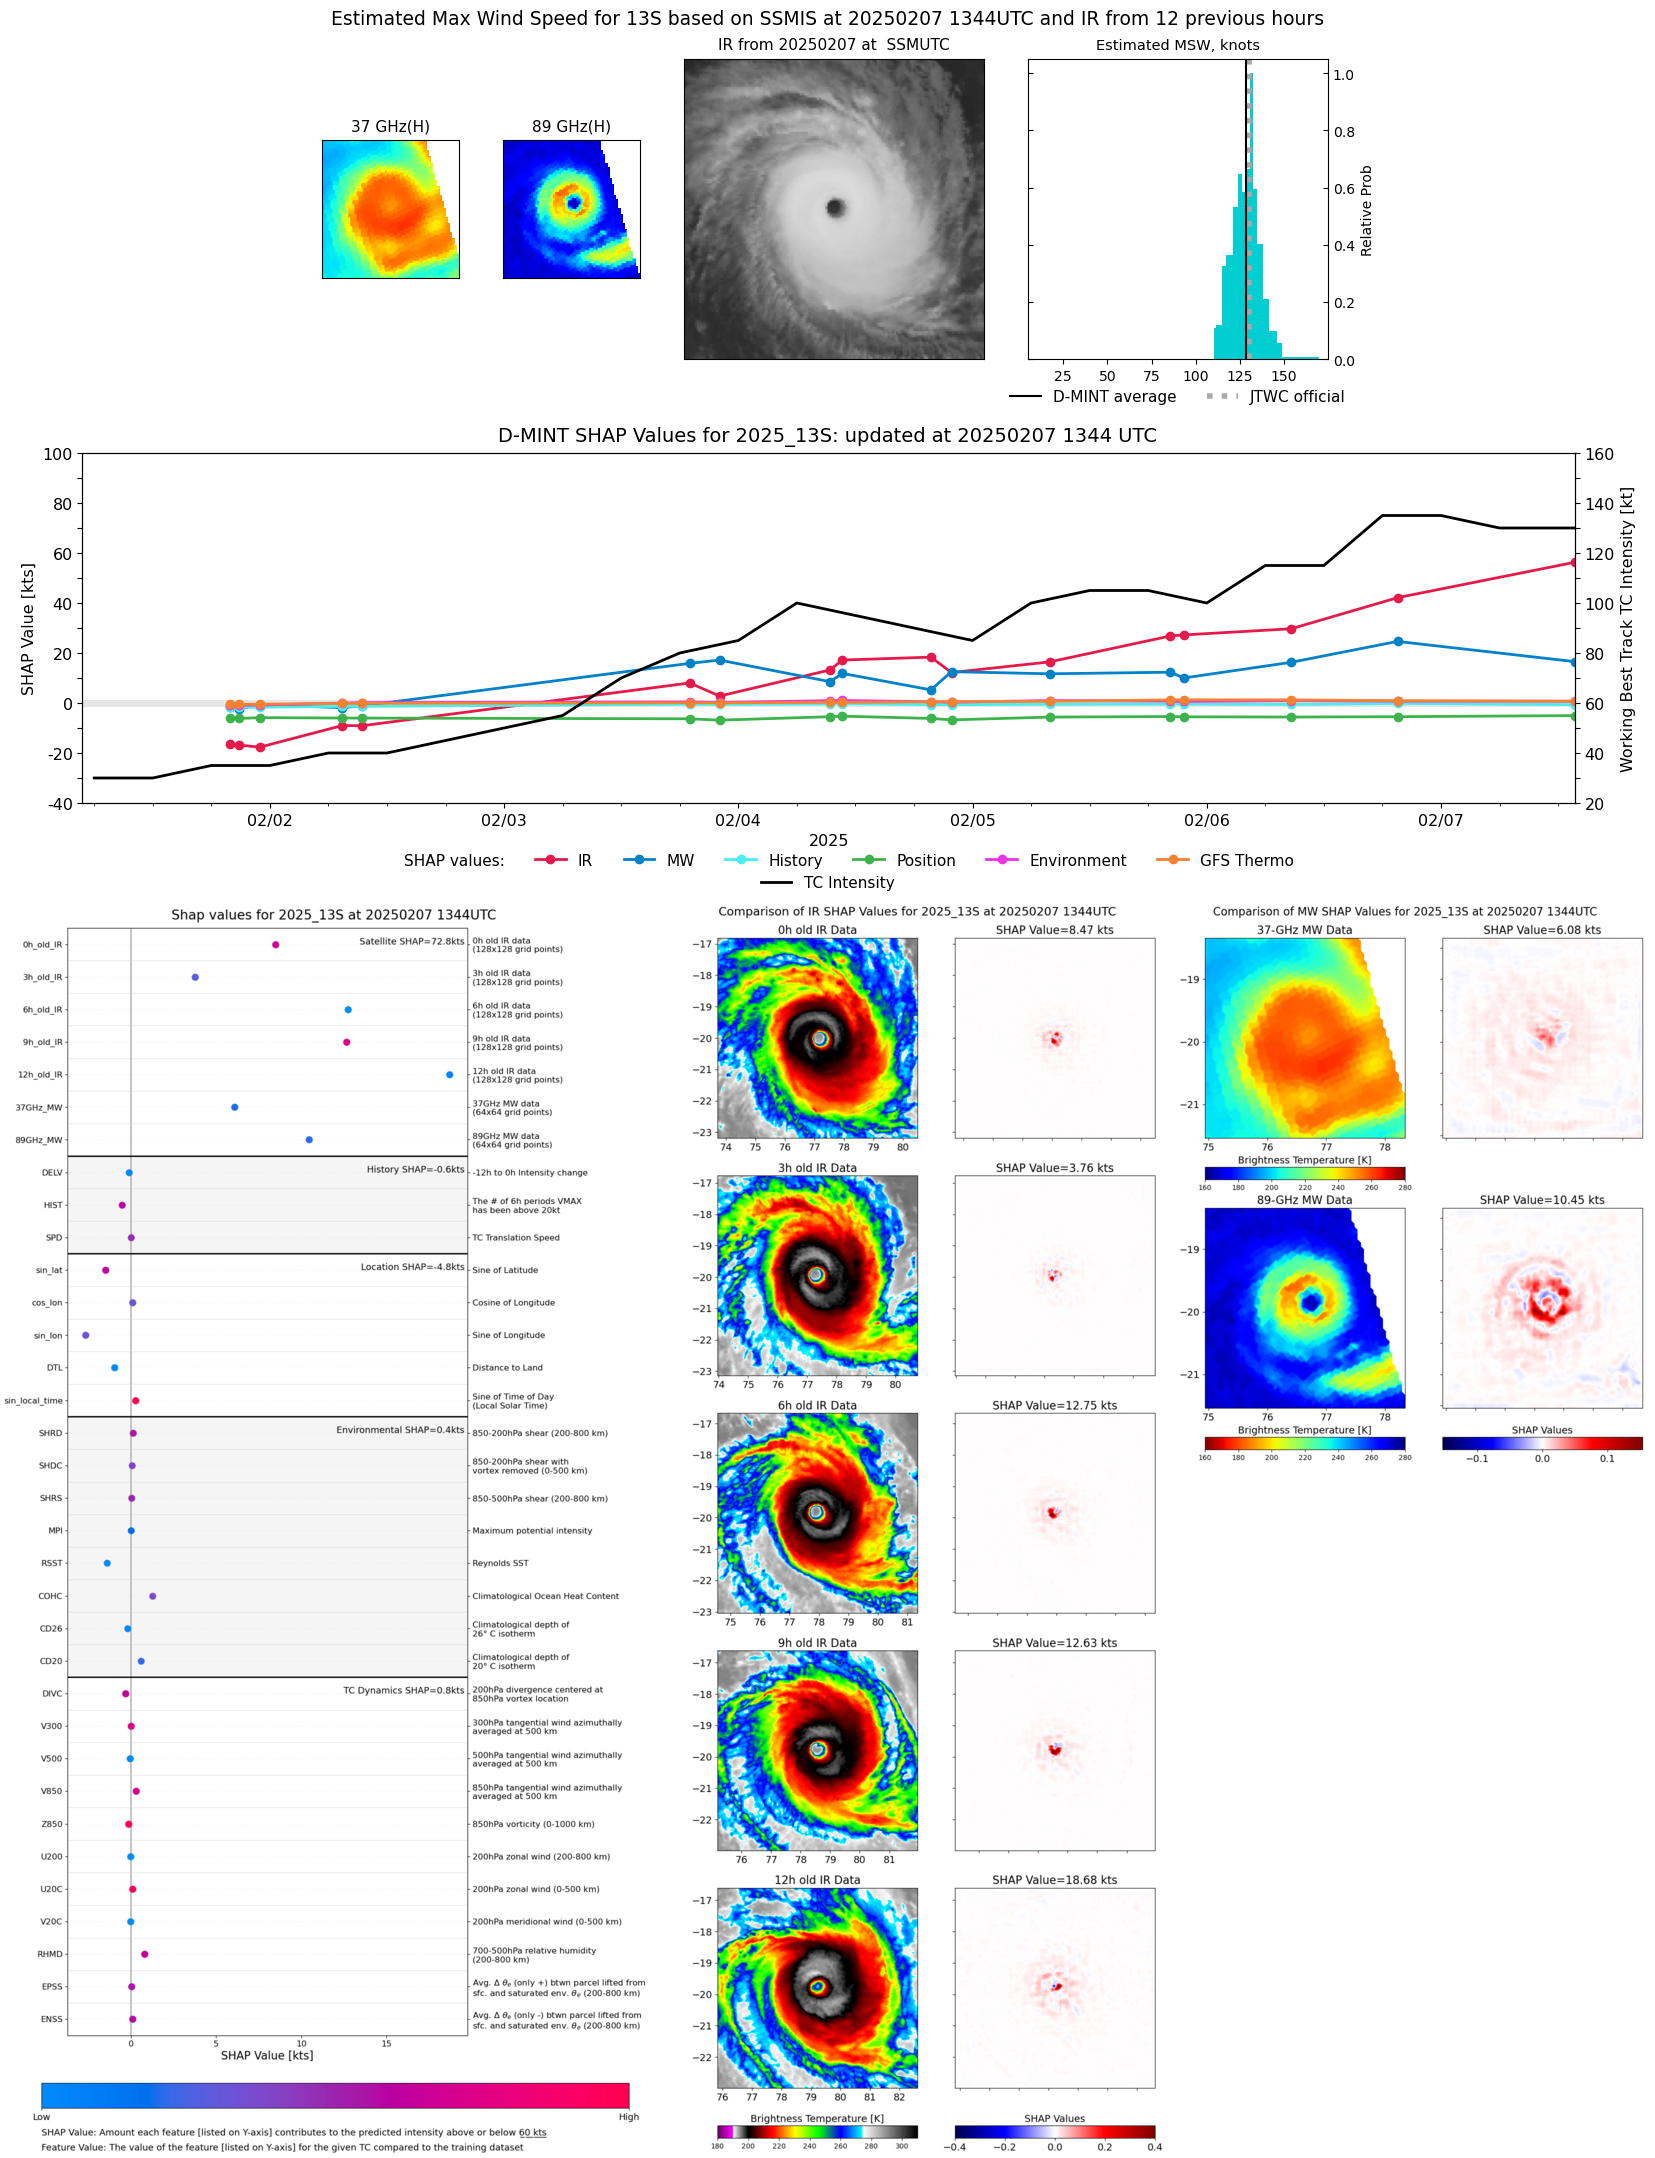 |
| 20250207 | 1155 UTC | TROPICS03 | 927 hPa | 122 kts | 118 kts | 127 kts | 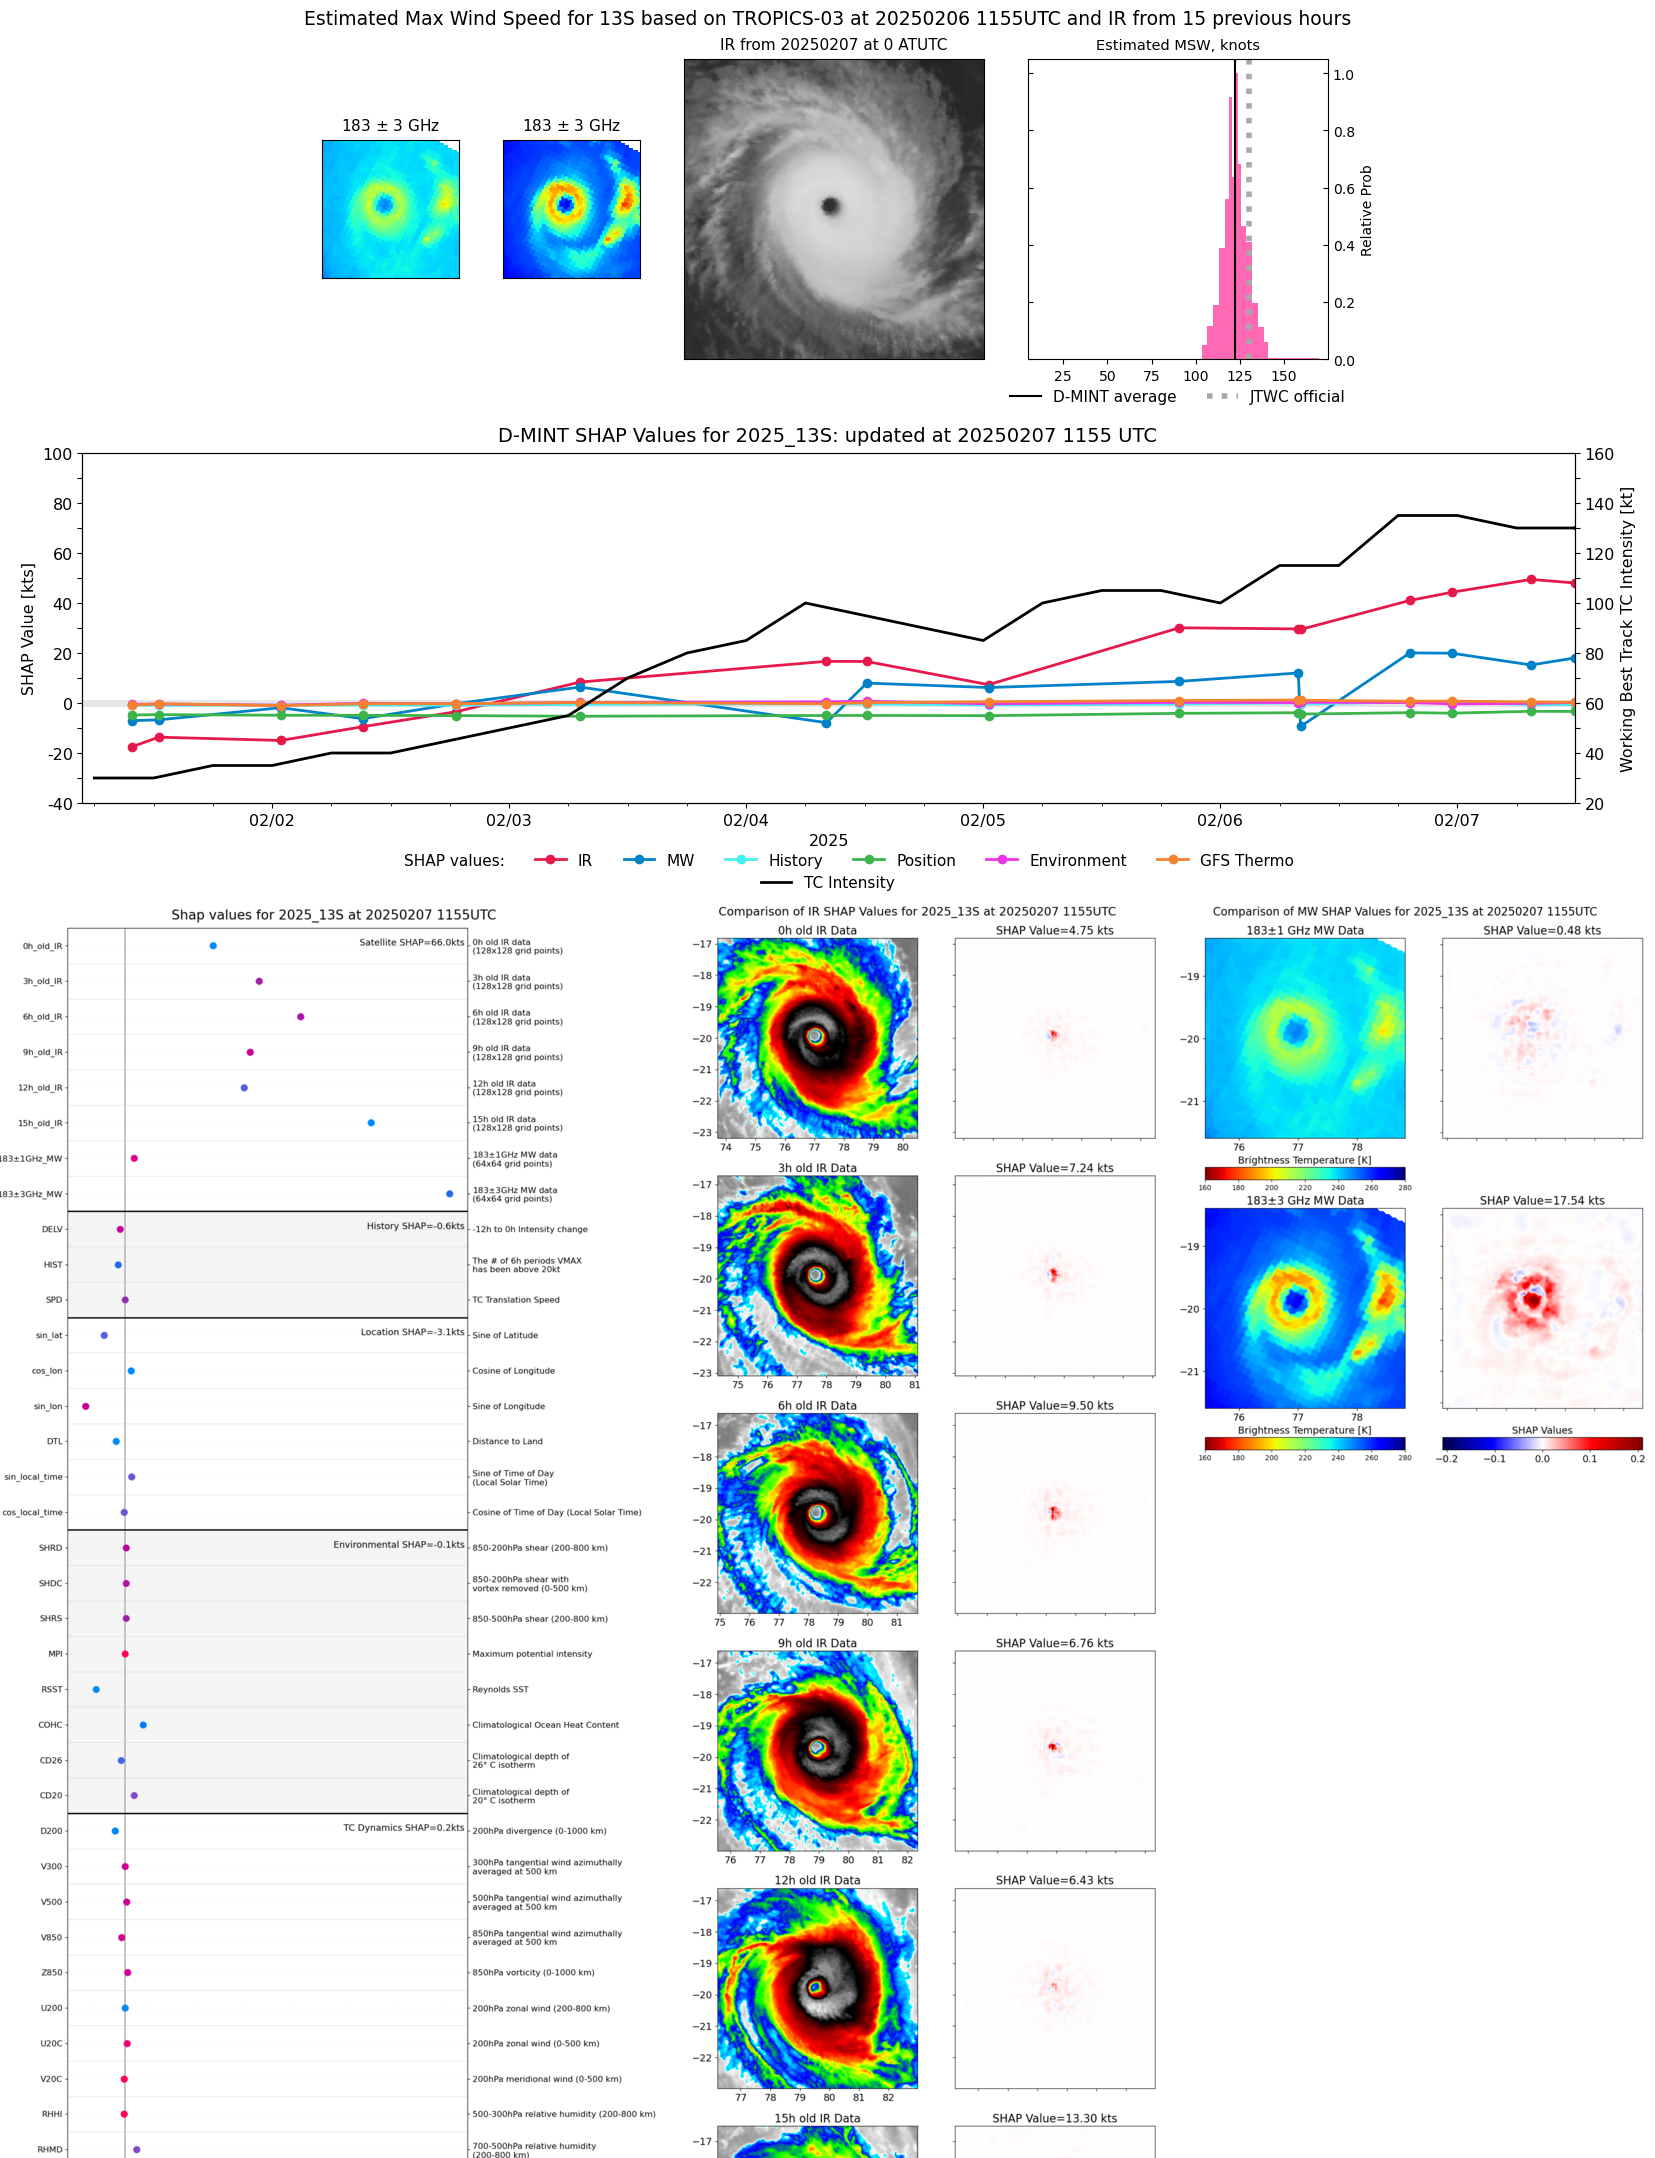 |
| 20250207 | 0728 UTC | TROPICS05 | 935 hPa | 121 kts | 116 kts | 125 kts | 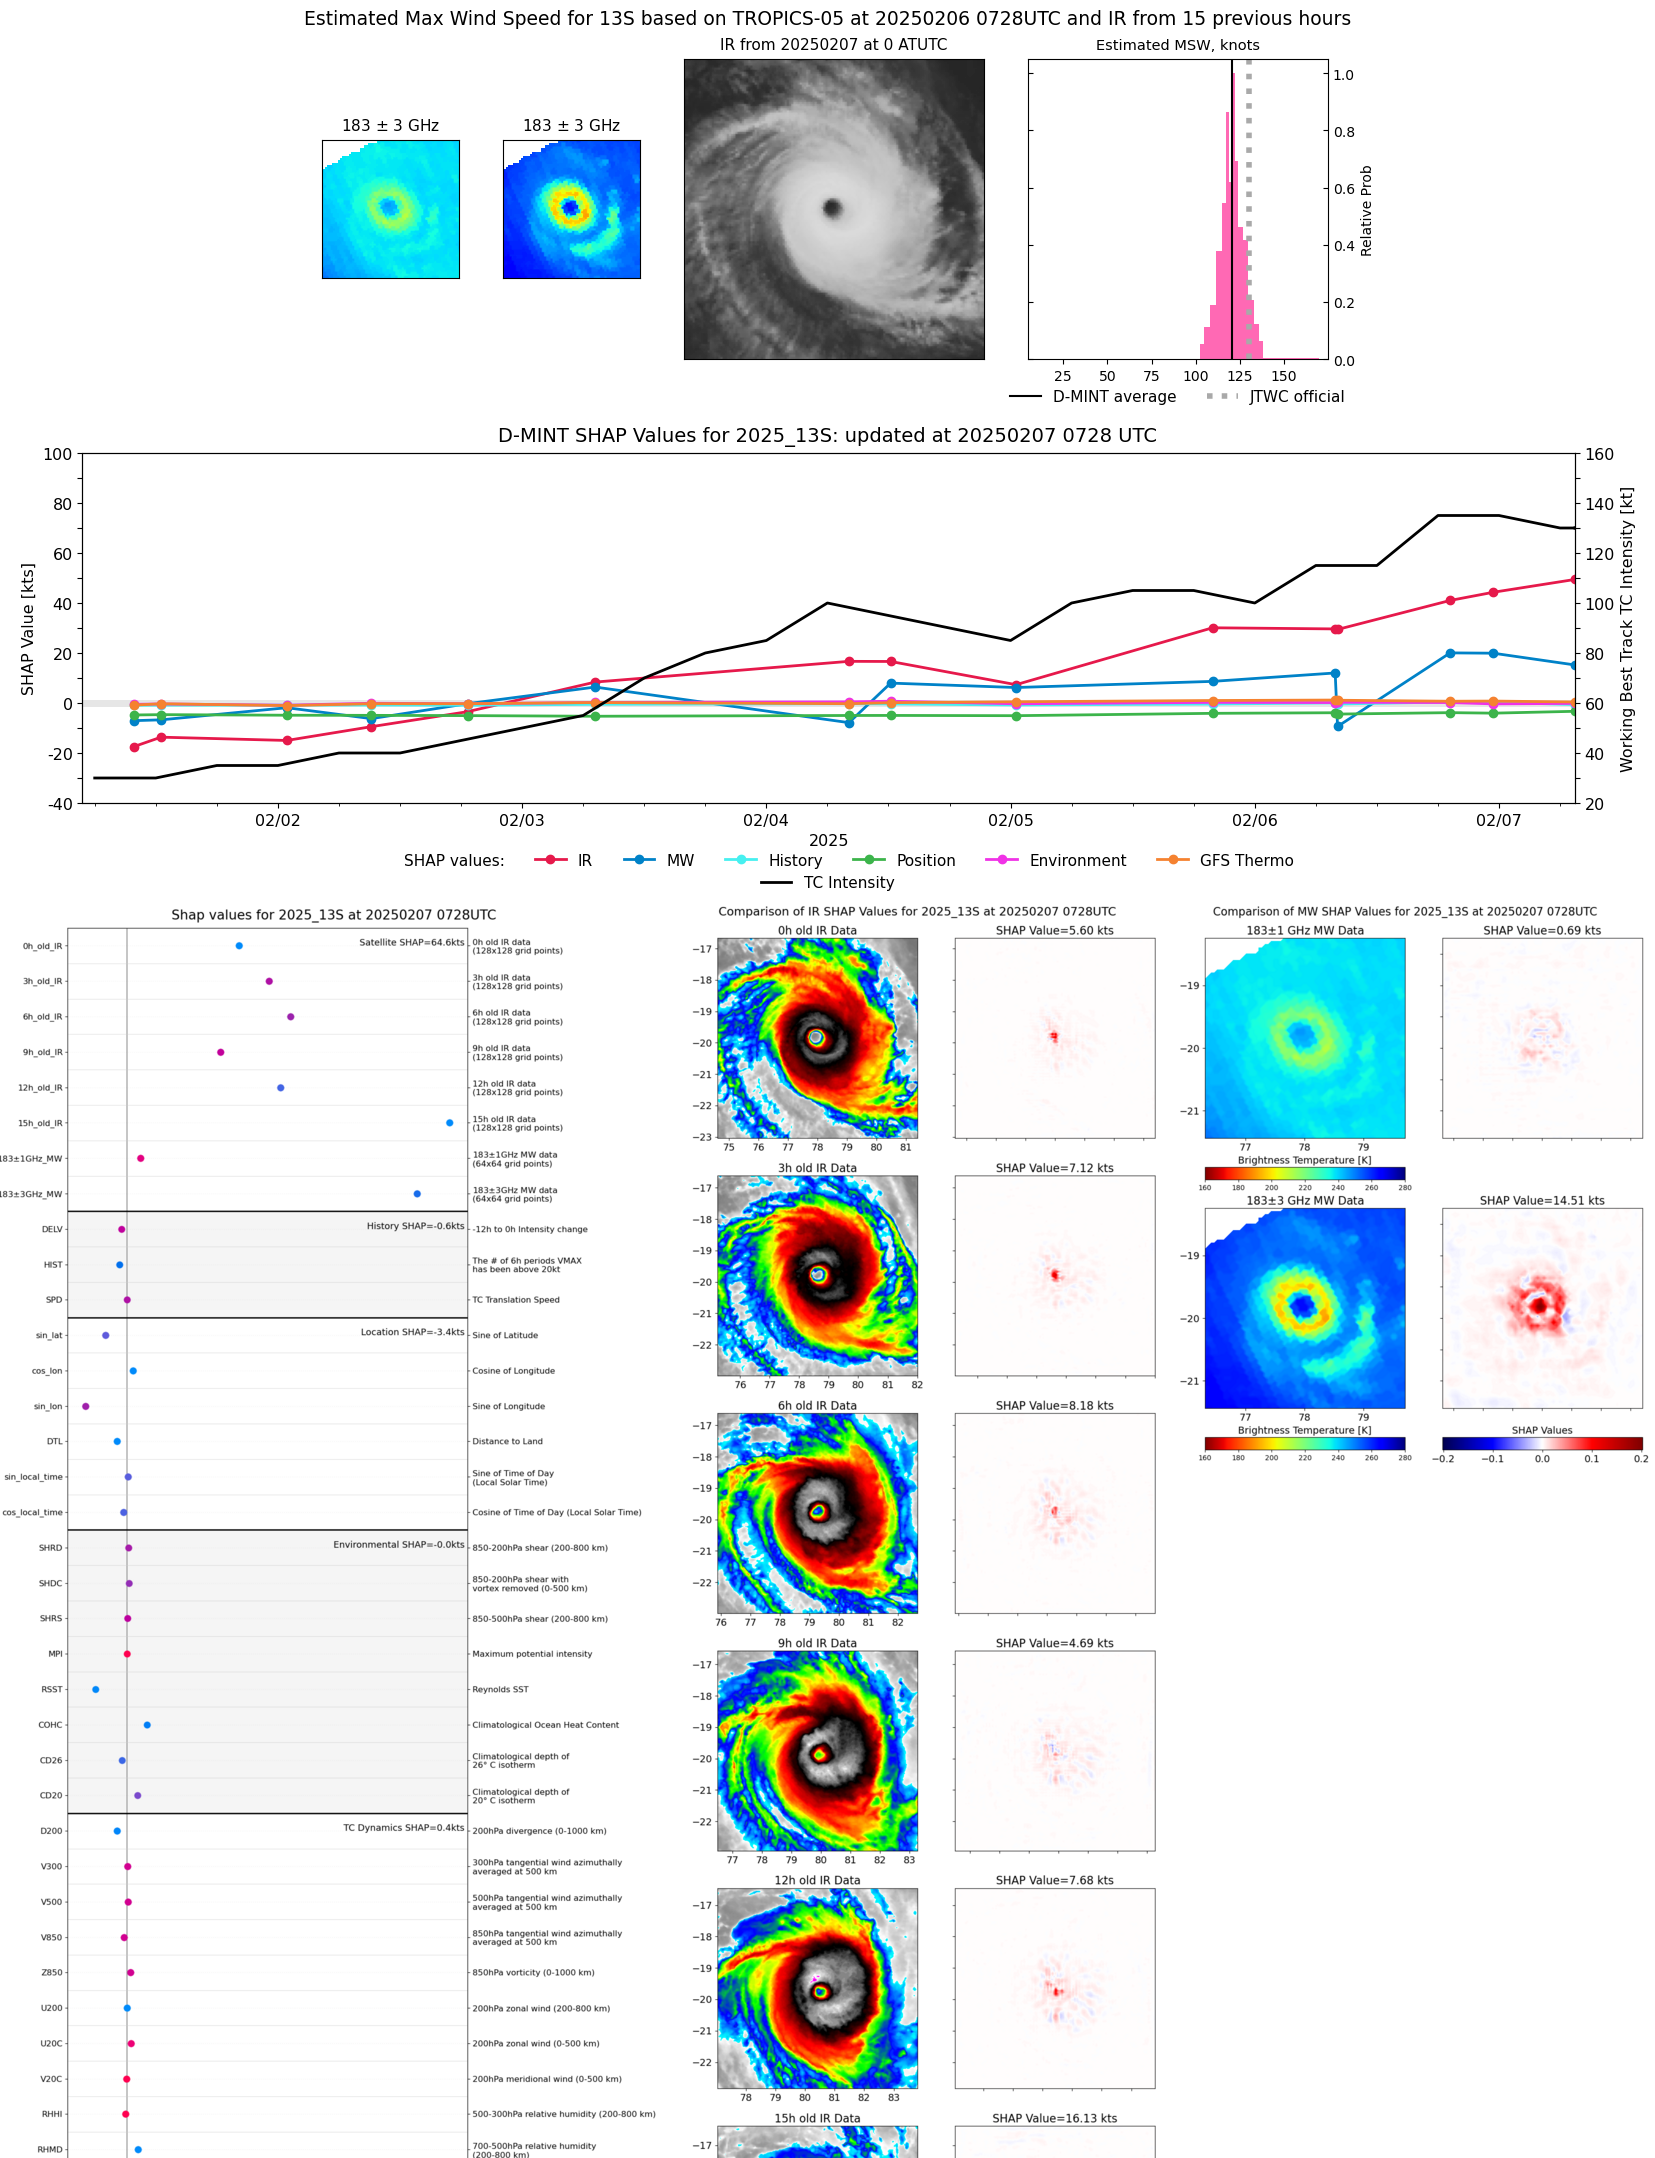 |
| 20250206 | 2326 UTC | TROPICS06 | 933 hPa | 121 kts | 115 kts | 126 kts | 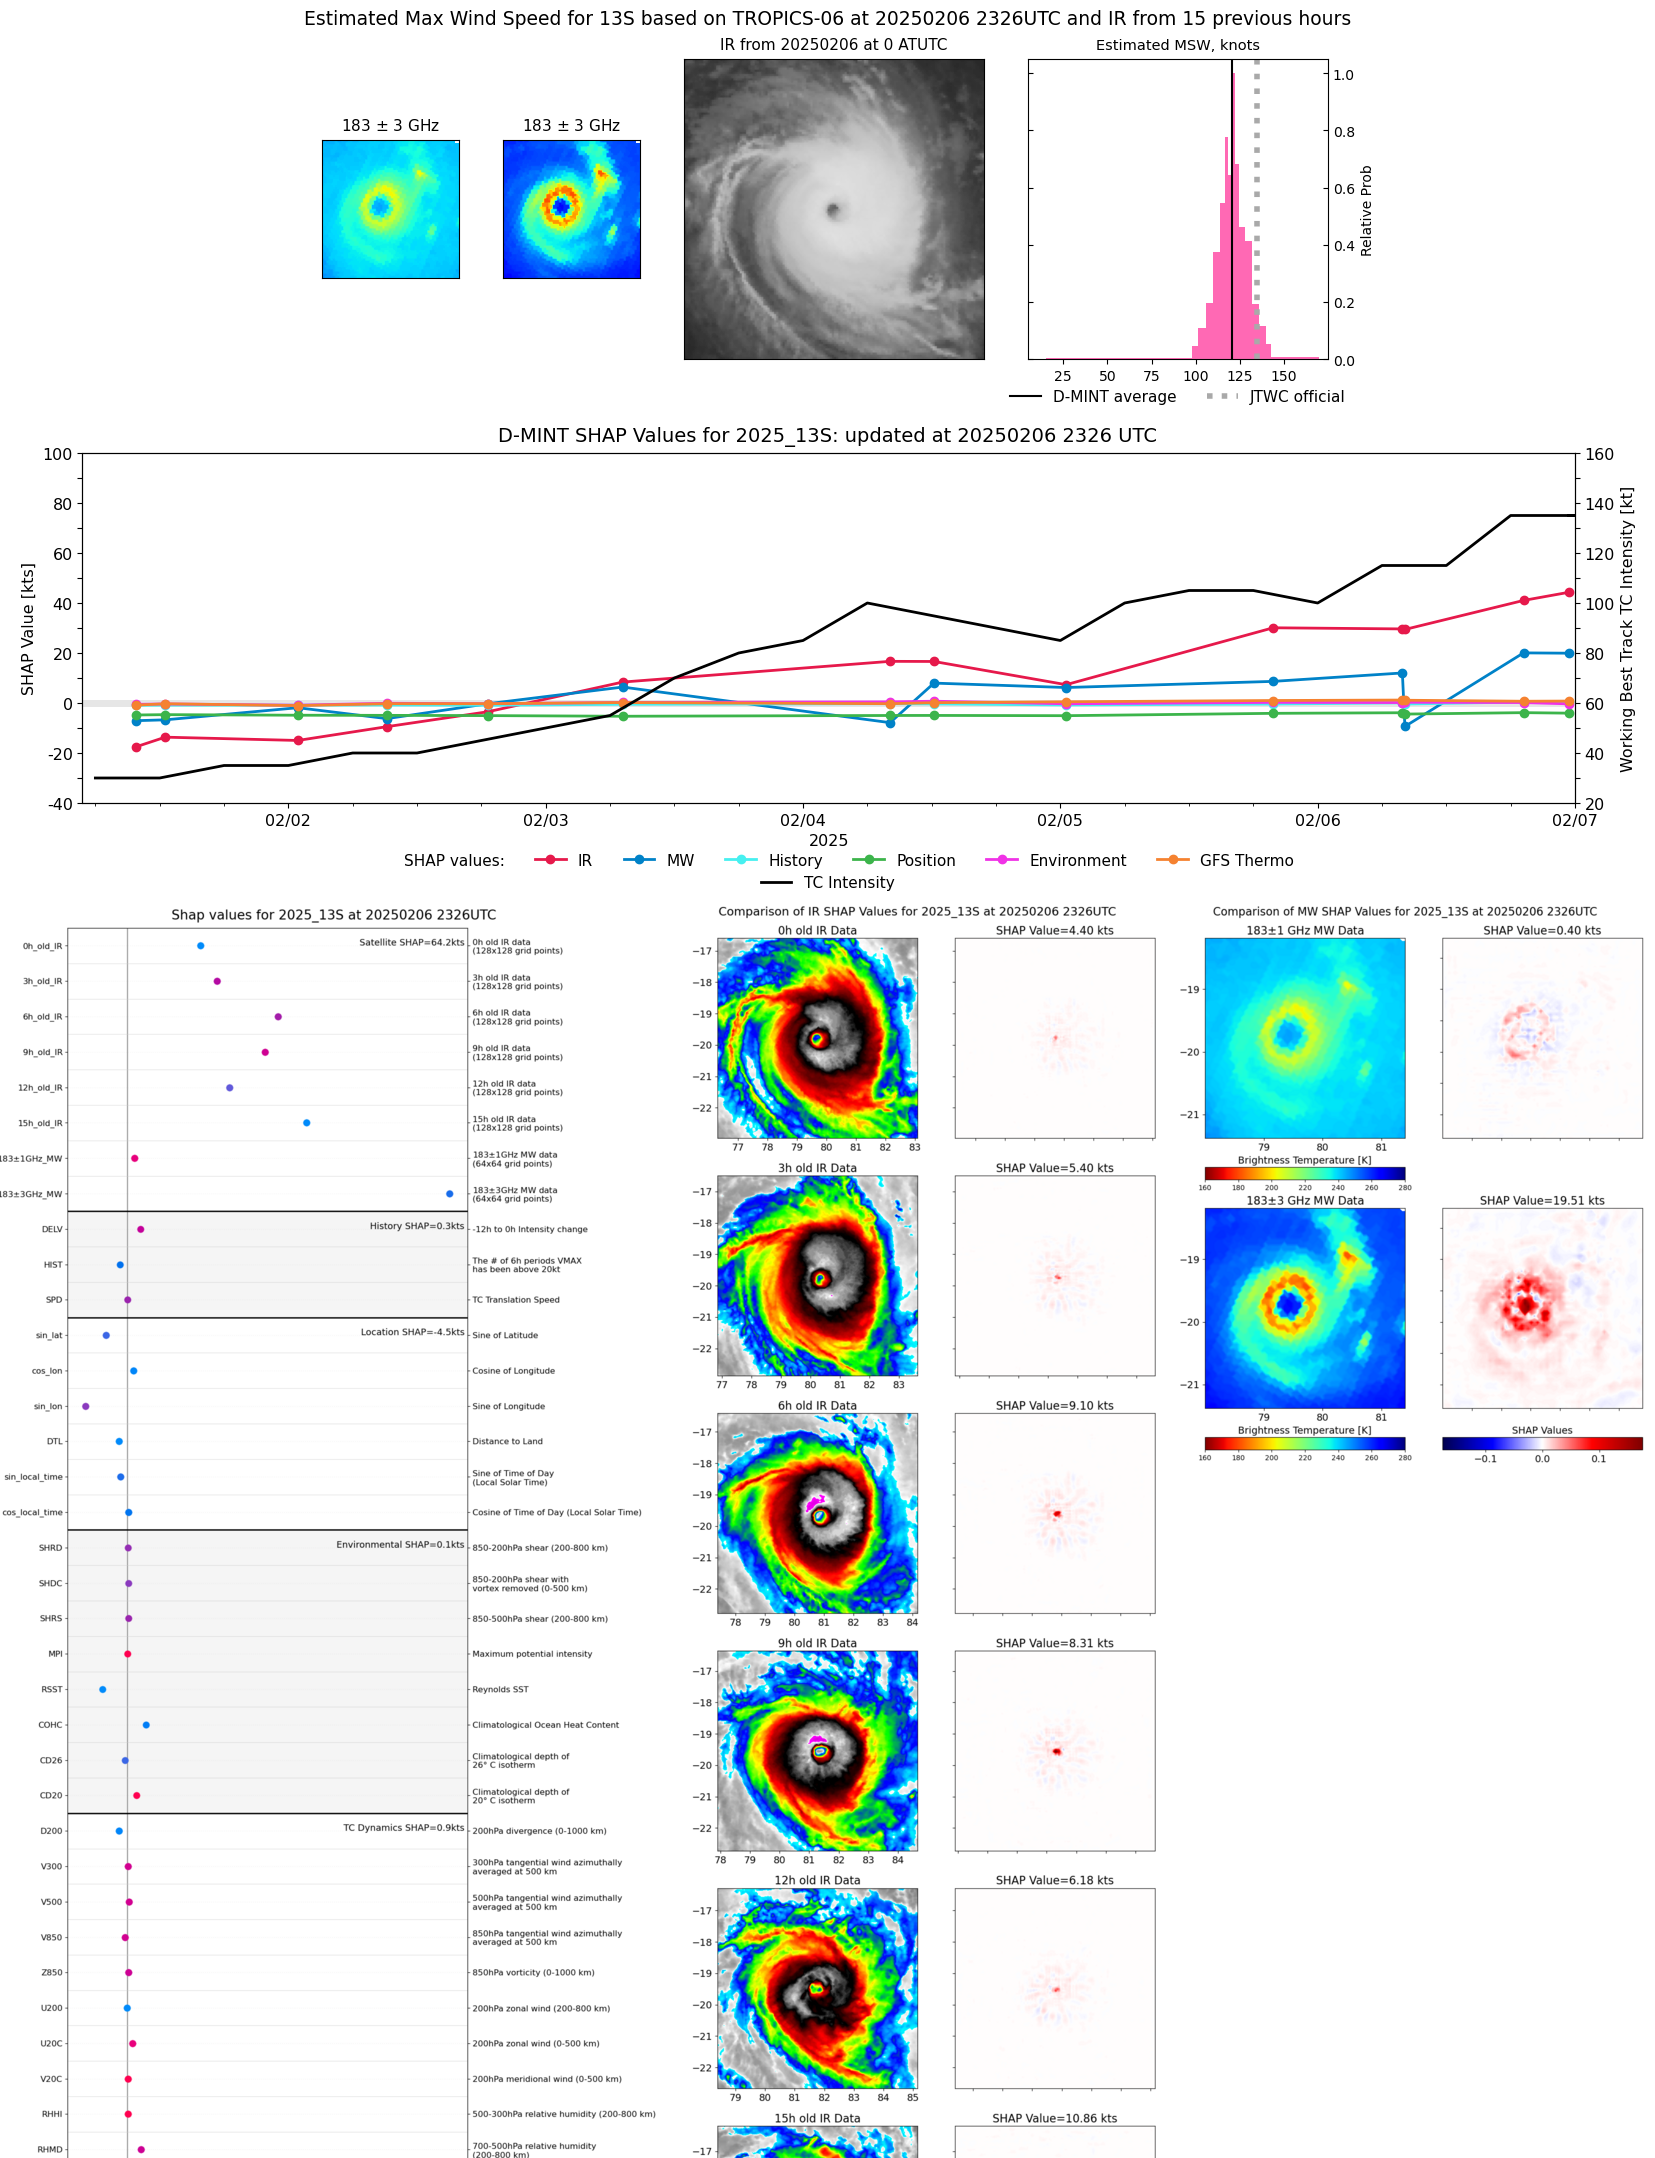 |
| 20250206 | 1933 UTC | AMSR2 | 929 hPa | 122 kts | 117 kts | 128 kts | 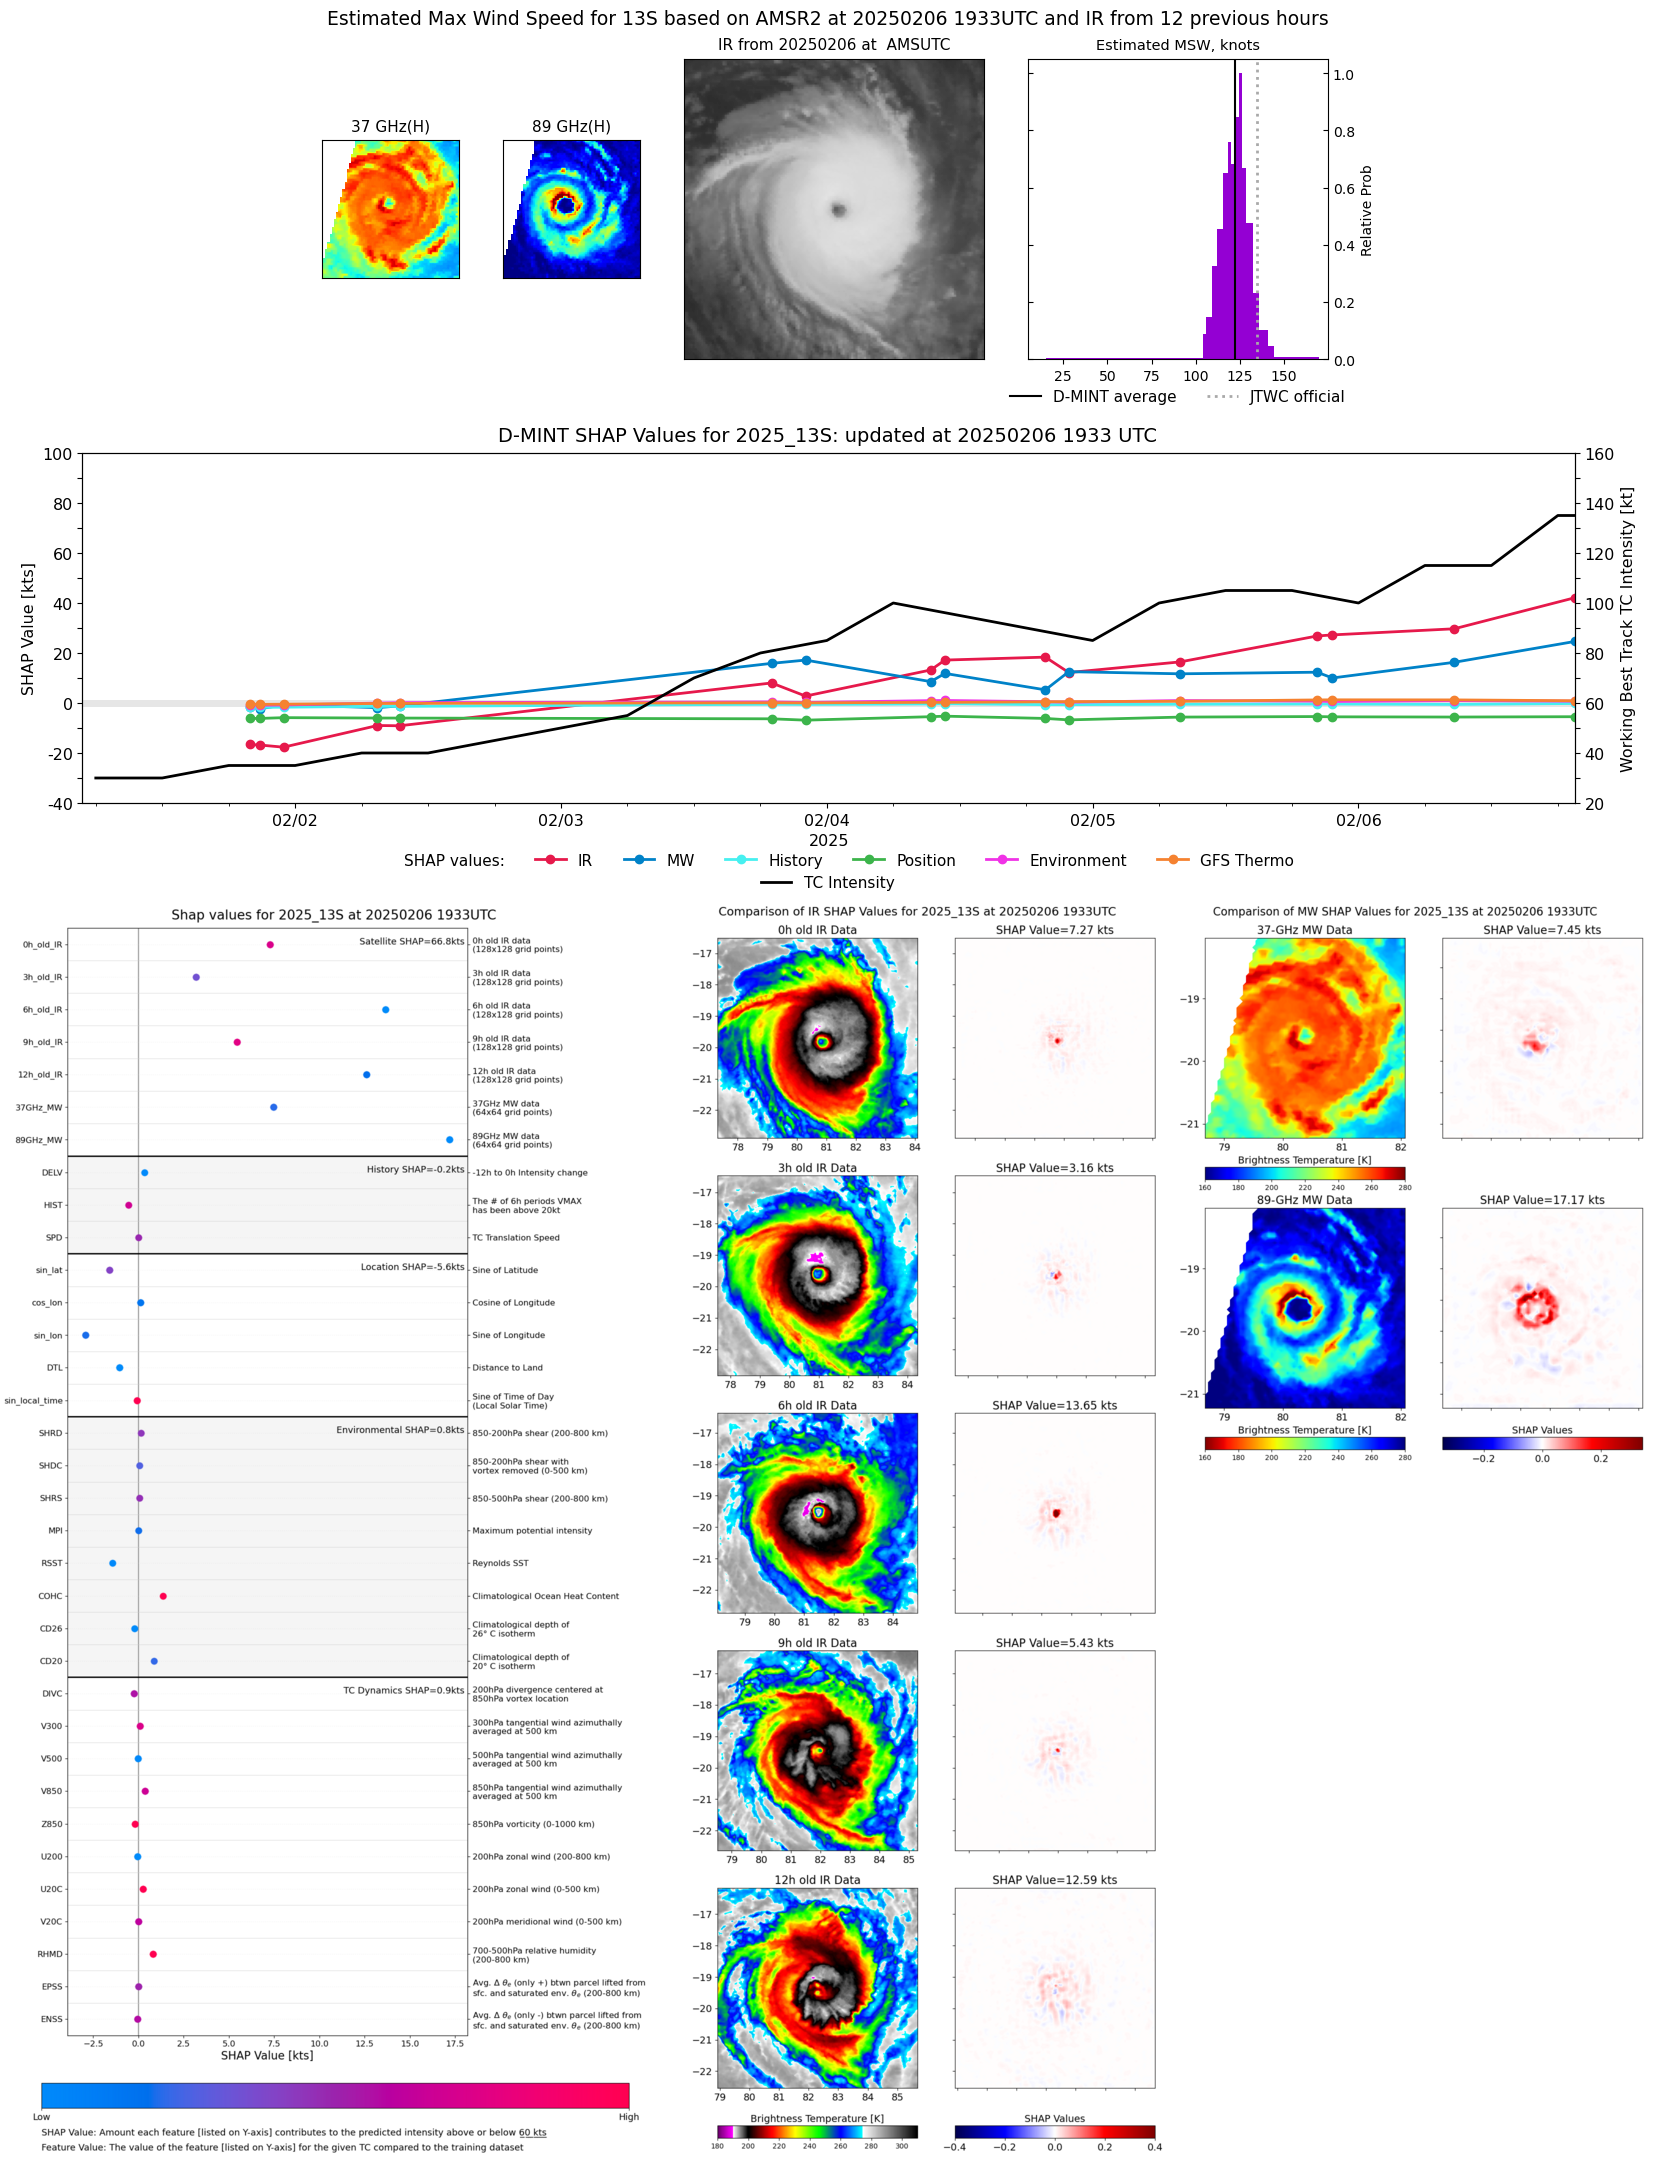 |
| 20250206 | 1912 UTC | TROPICS03 | 936 hPa | 118 kts | 113 kts | 124 kts | 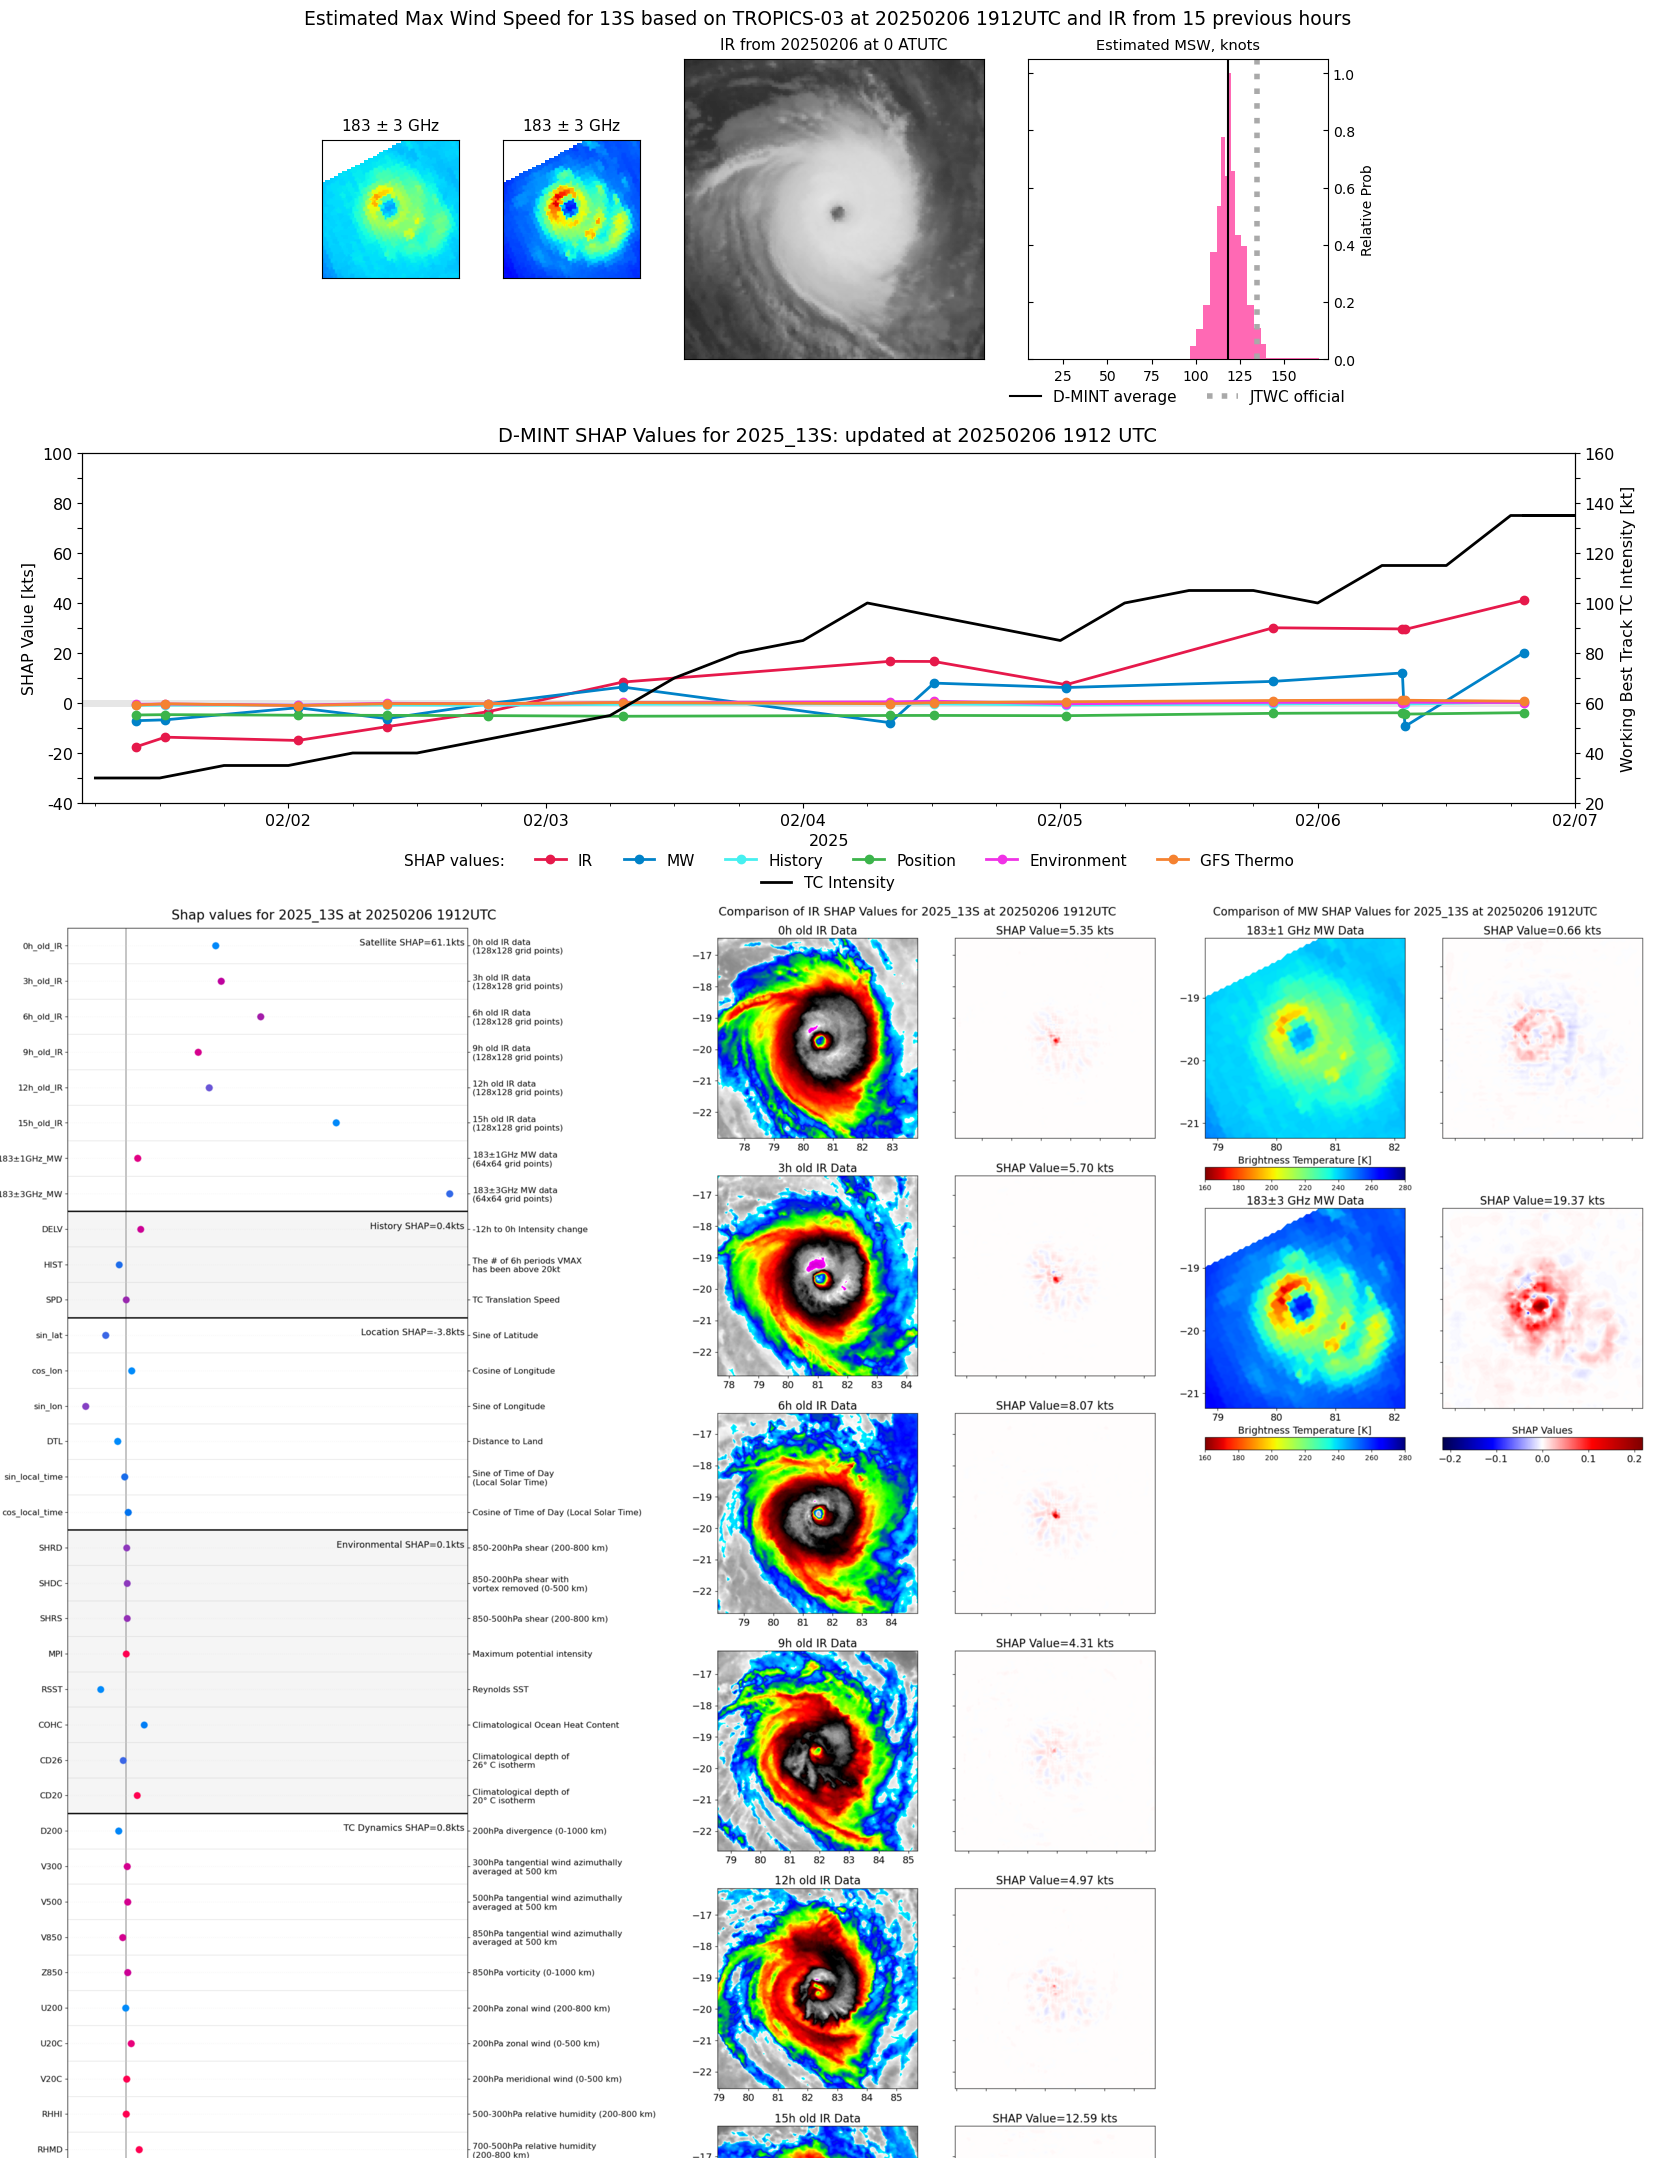 |
| 20250206 | 1252 UTC | SSMISF16 | NaN hPa | 113 kts | 108 kts | 119 kts | 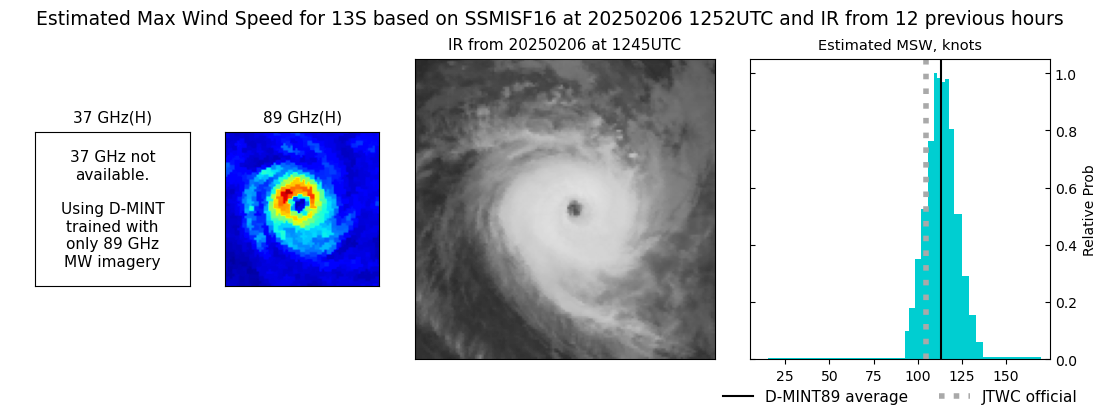 |
| 20250206 | 1012 UTC | SSMISF18 | 945 hPa | 102 kts | 96 kts | 109 kts |  |
| 20250206 | 0839 UTC | AMSR2 | 950 hPa | 102 kts | 96 kts | 107 kts |  |
| 20250206 | 0754 UTC | ATMS-N20 | 954 hPa | 99 kts | 94 kts | 105 kts |  |
| 20250206 | 0020 UTC | SSMISF16 | 947 hPa | 107 kts | 101 kts | 112 kts | 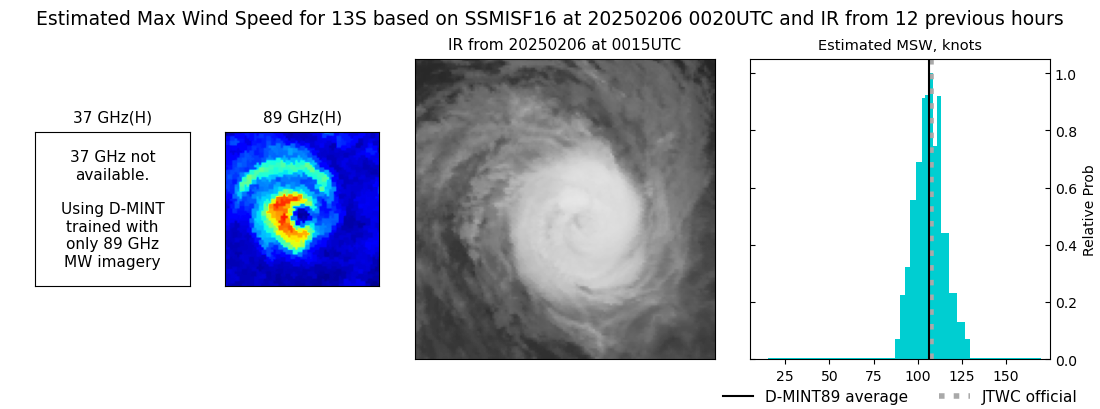 |
| 20250205 | 2139 UTC | SSMISF18 | 961 hPa | 93 kts | 87 kts | 99 kts | 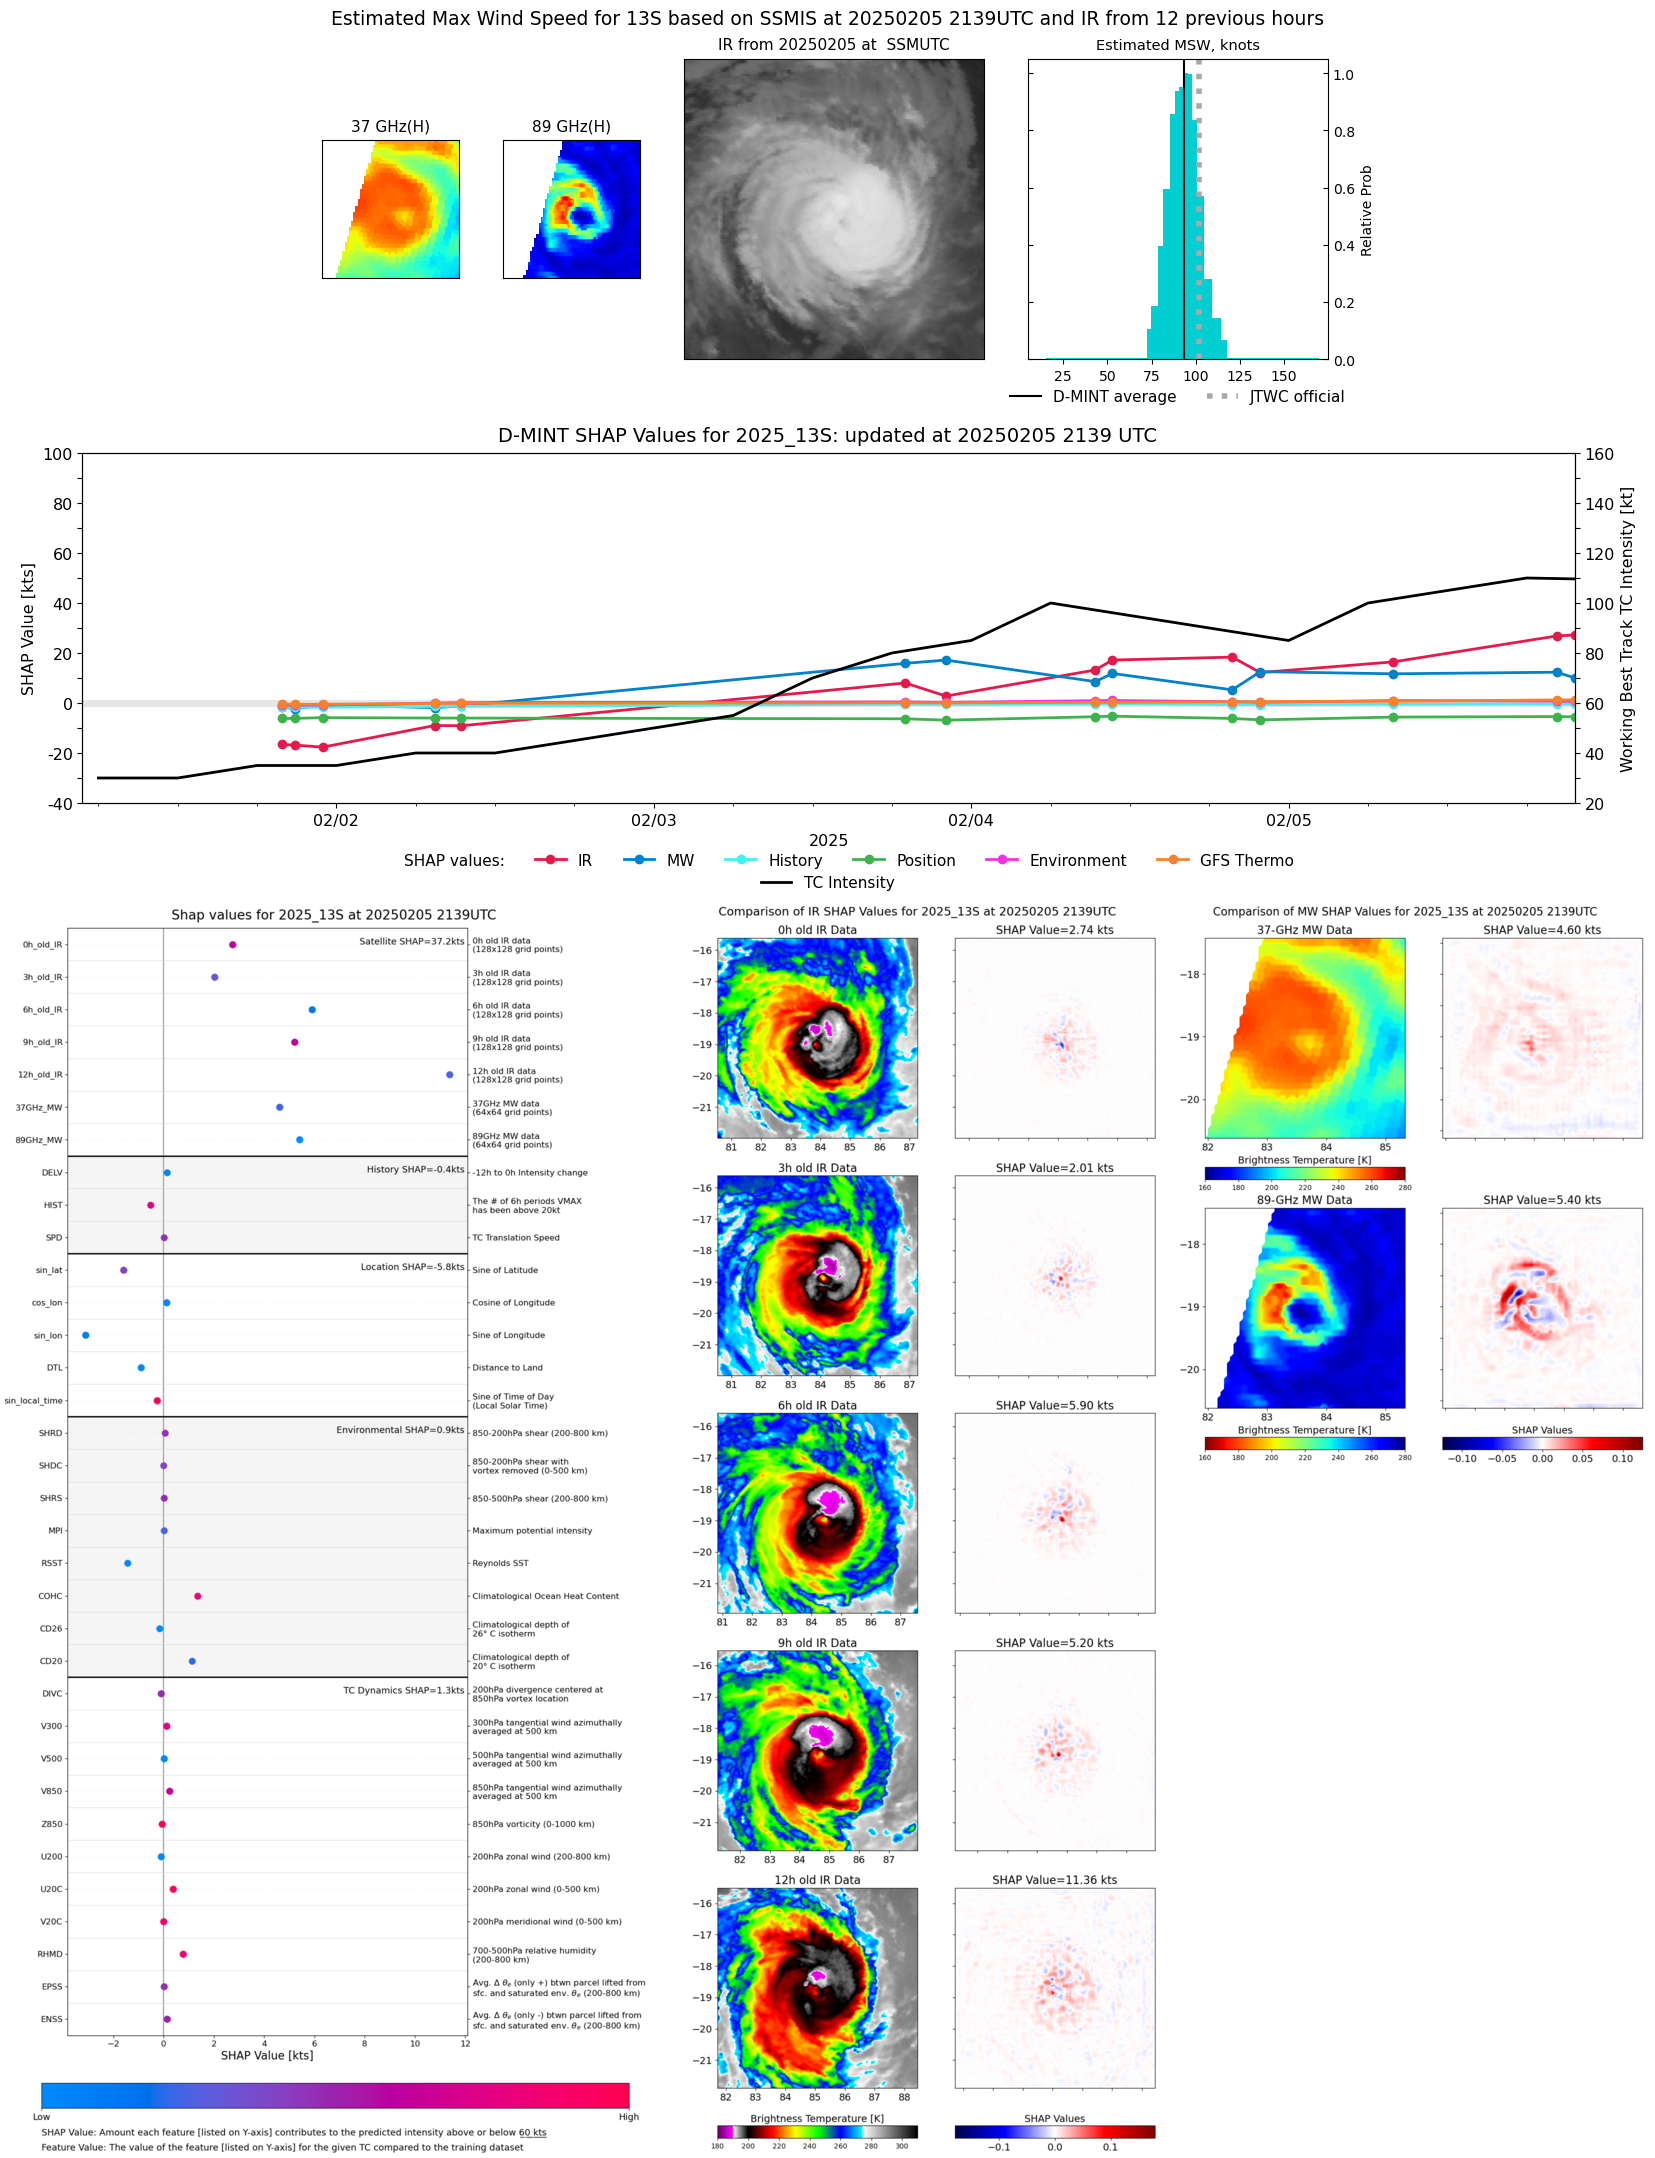 |
| 20250205 | 2016 UTC | GMI | 954 hPa | 95 kts | 89 kts | 101 kts | 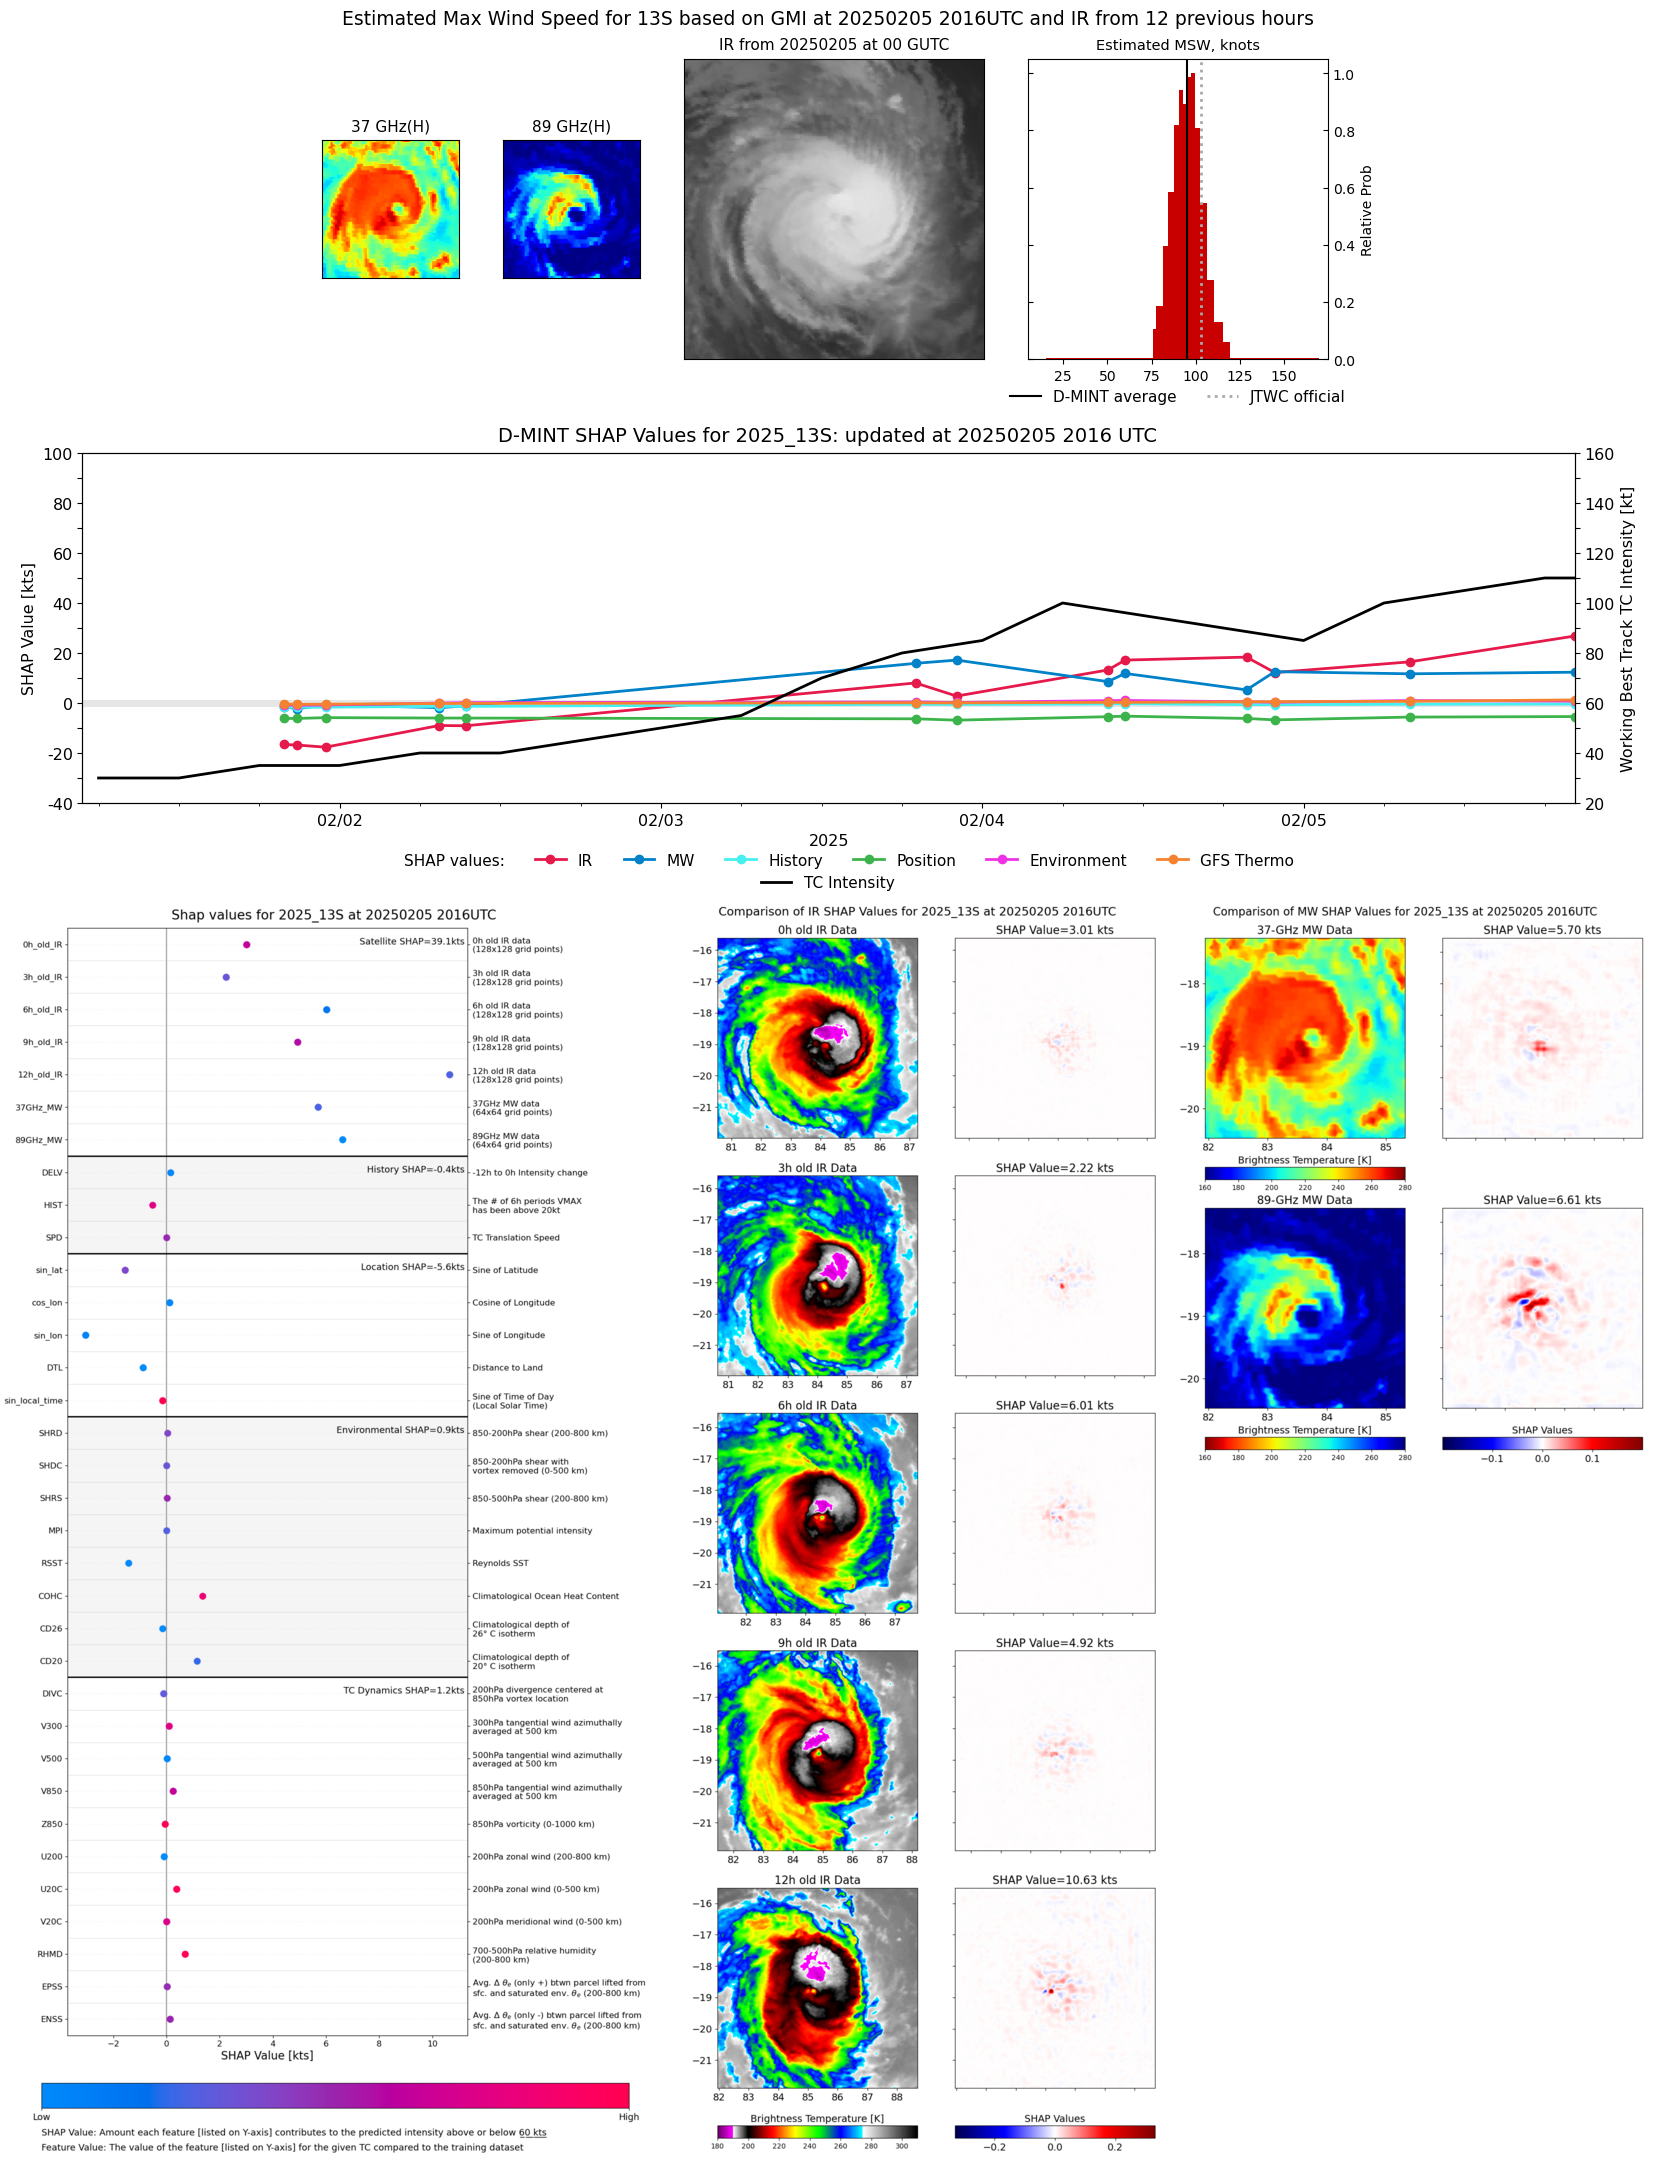 |
| 20250205 | 2013 UTC | GMI | 955 hPa | 95 kts | 89 kts | 100 kts | 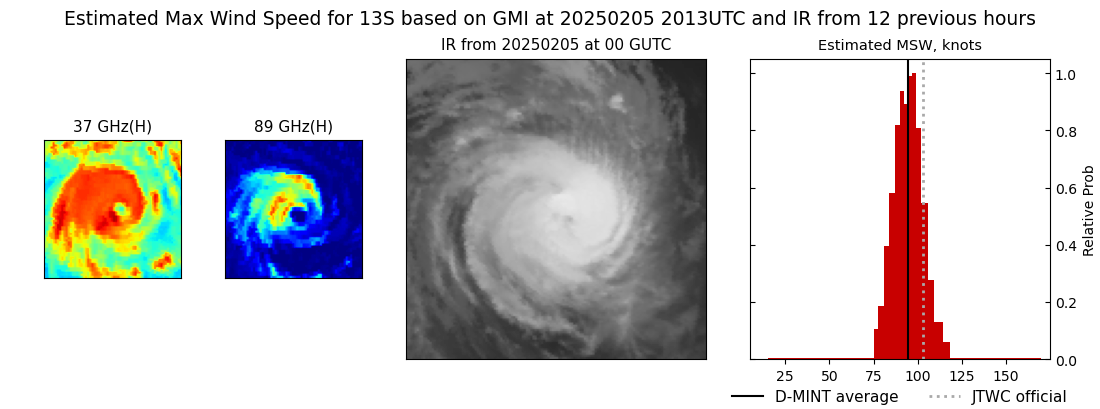 |
| 20250205 | 1951 UTC | TROPICS03 | 956 hPa | 95 kts | 90 kts | 101 kts |  |
| 20250205 | 1306 UTC | SSMISF16 | 963 hPa | 78 kts | 73 kts | 84 kts | 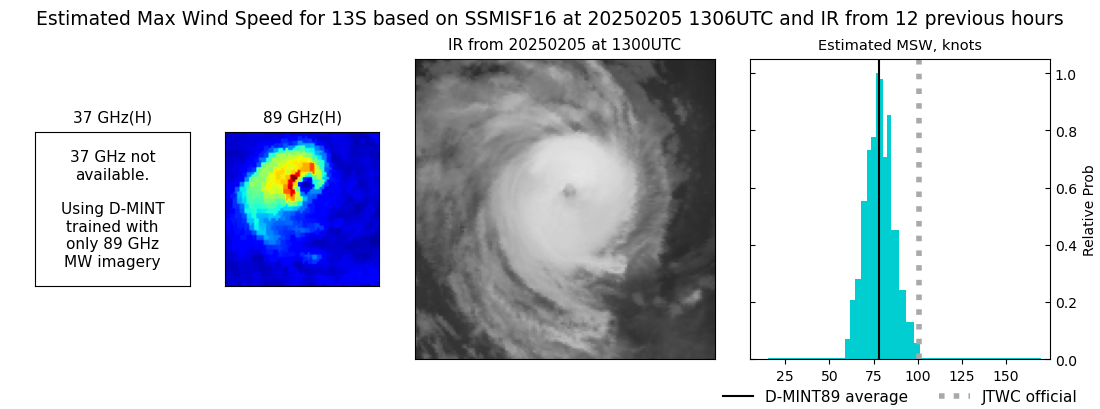 |
| 20250205 | 1230 UTC | SSMISF17 | 975 hPa | 73 kts | 67 kts | 78 kts | 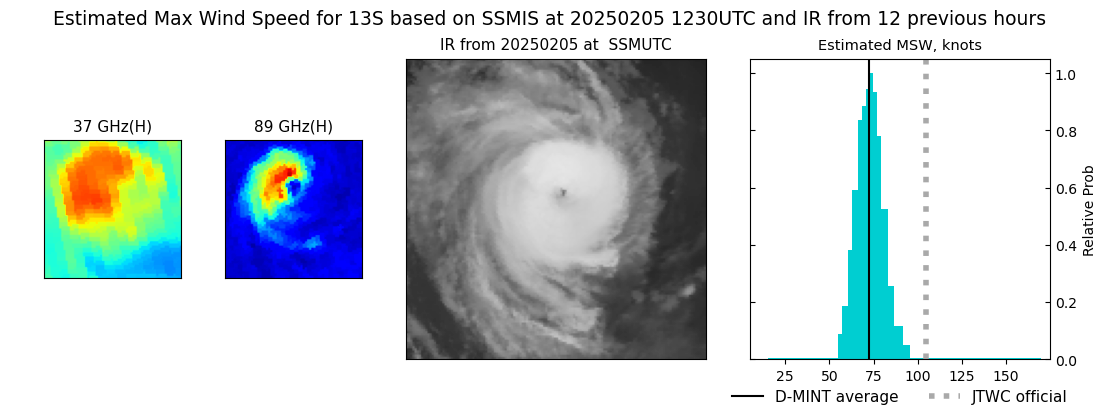 |
| 20250205 | 0755 UTC | AMSR2 | 964 hPa | 84 kts | 78 kts | 90 kts | 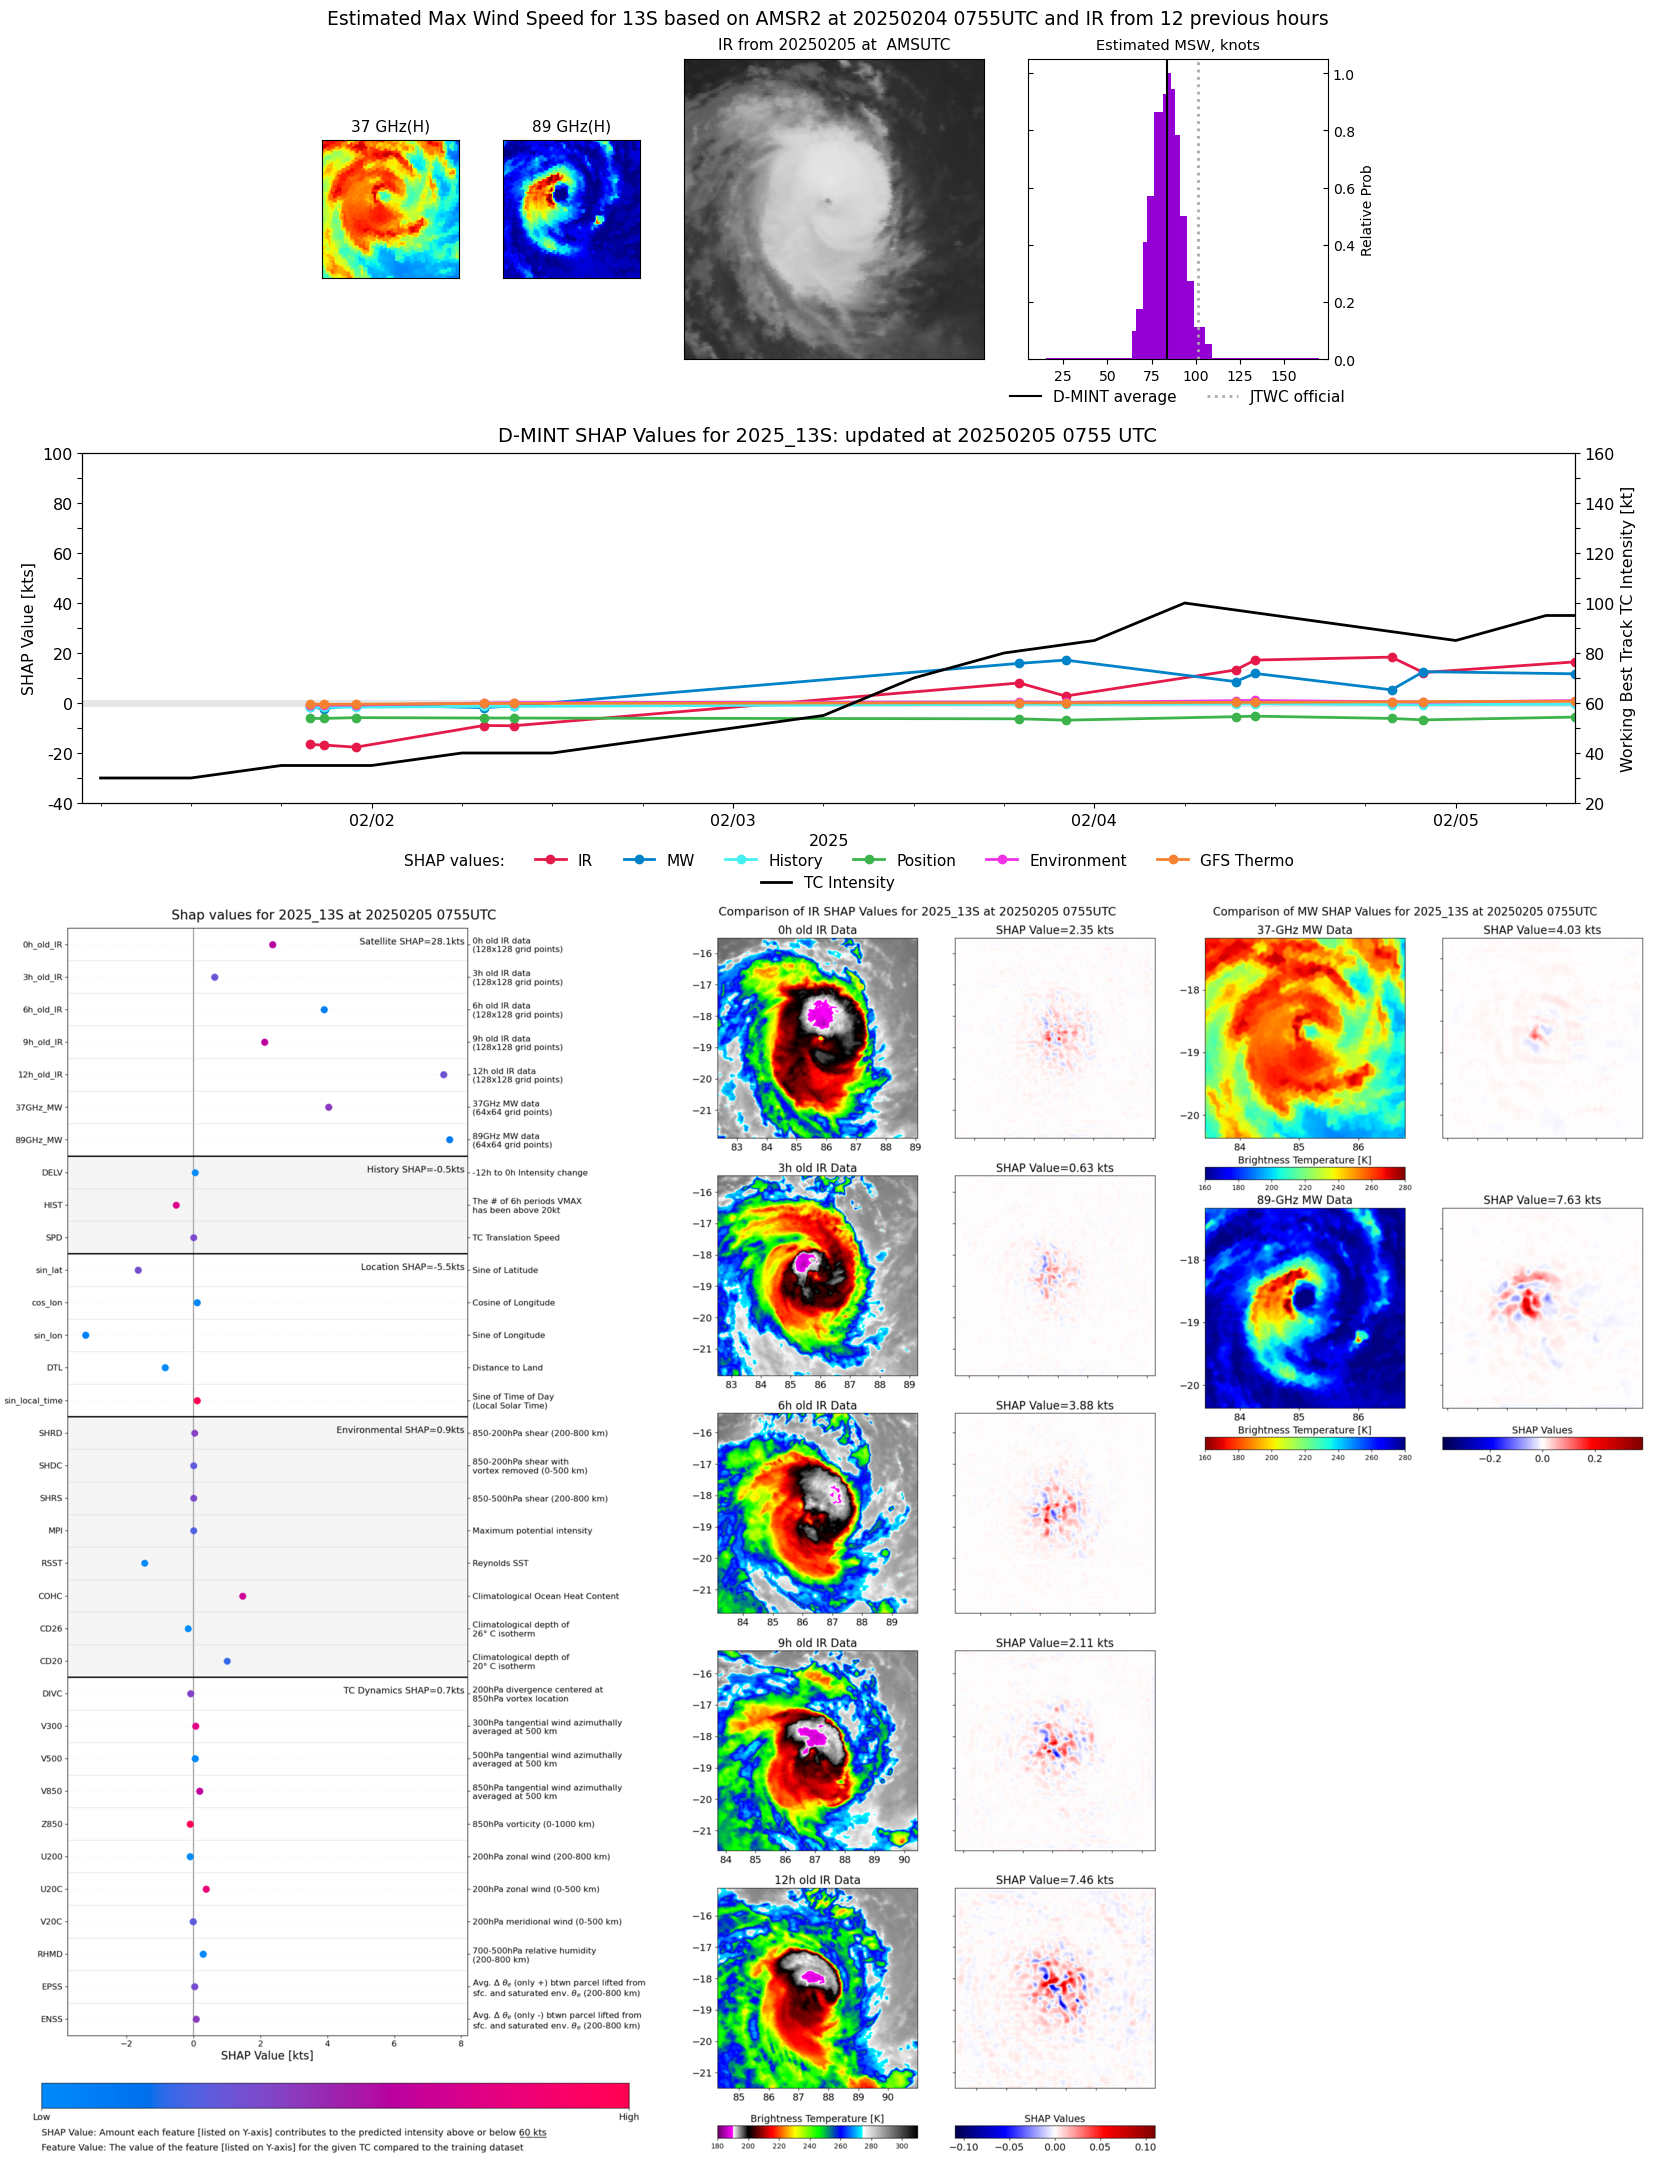 |
| 20250205 | 0033 UTC | SSMISF16 | 963 hPa | 83 kts | 76 kts | 89 kts | 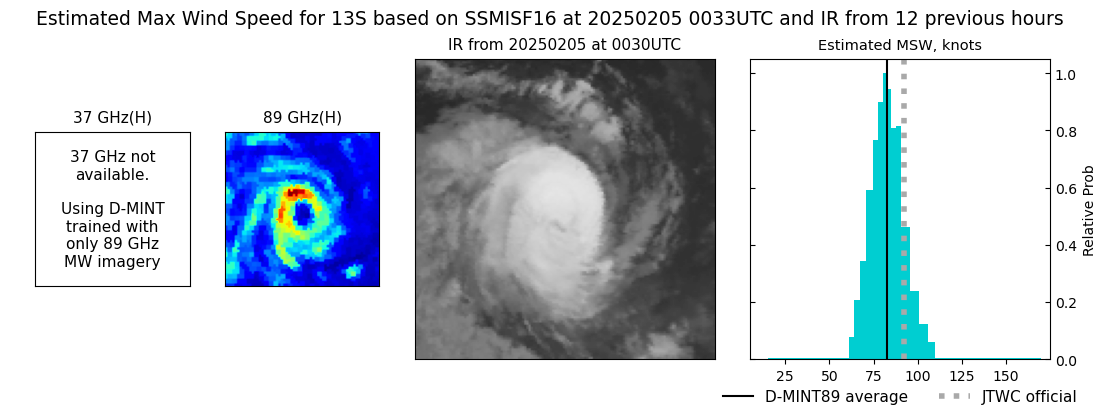 |
| 20250205 | 0032 UTC | TROPICS05 | 974 hPa | 68 kts | 62 kts | 74 kts | 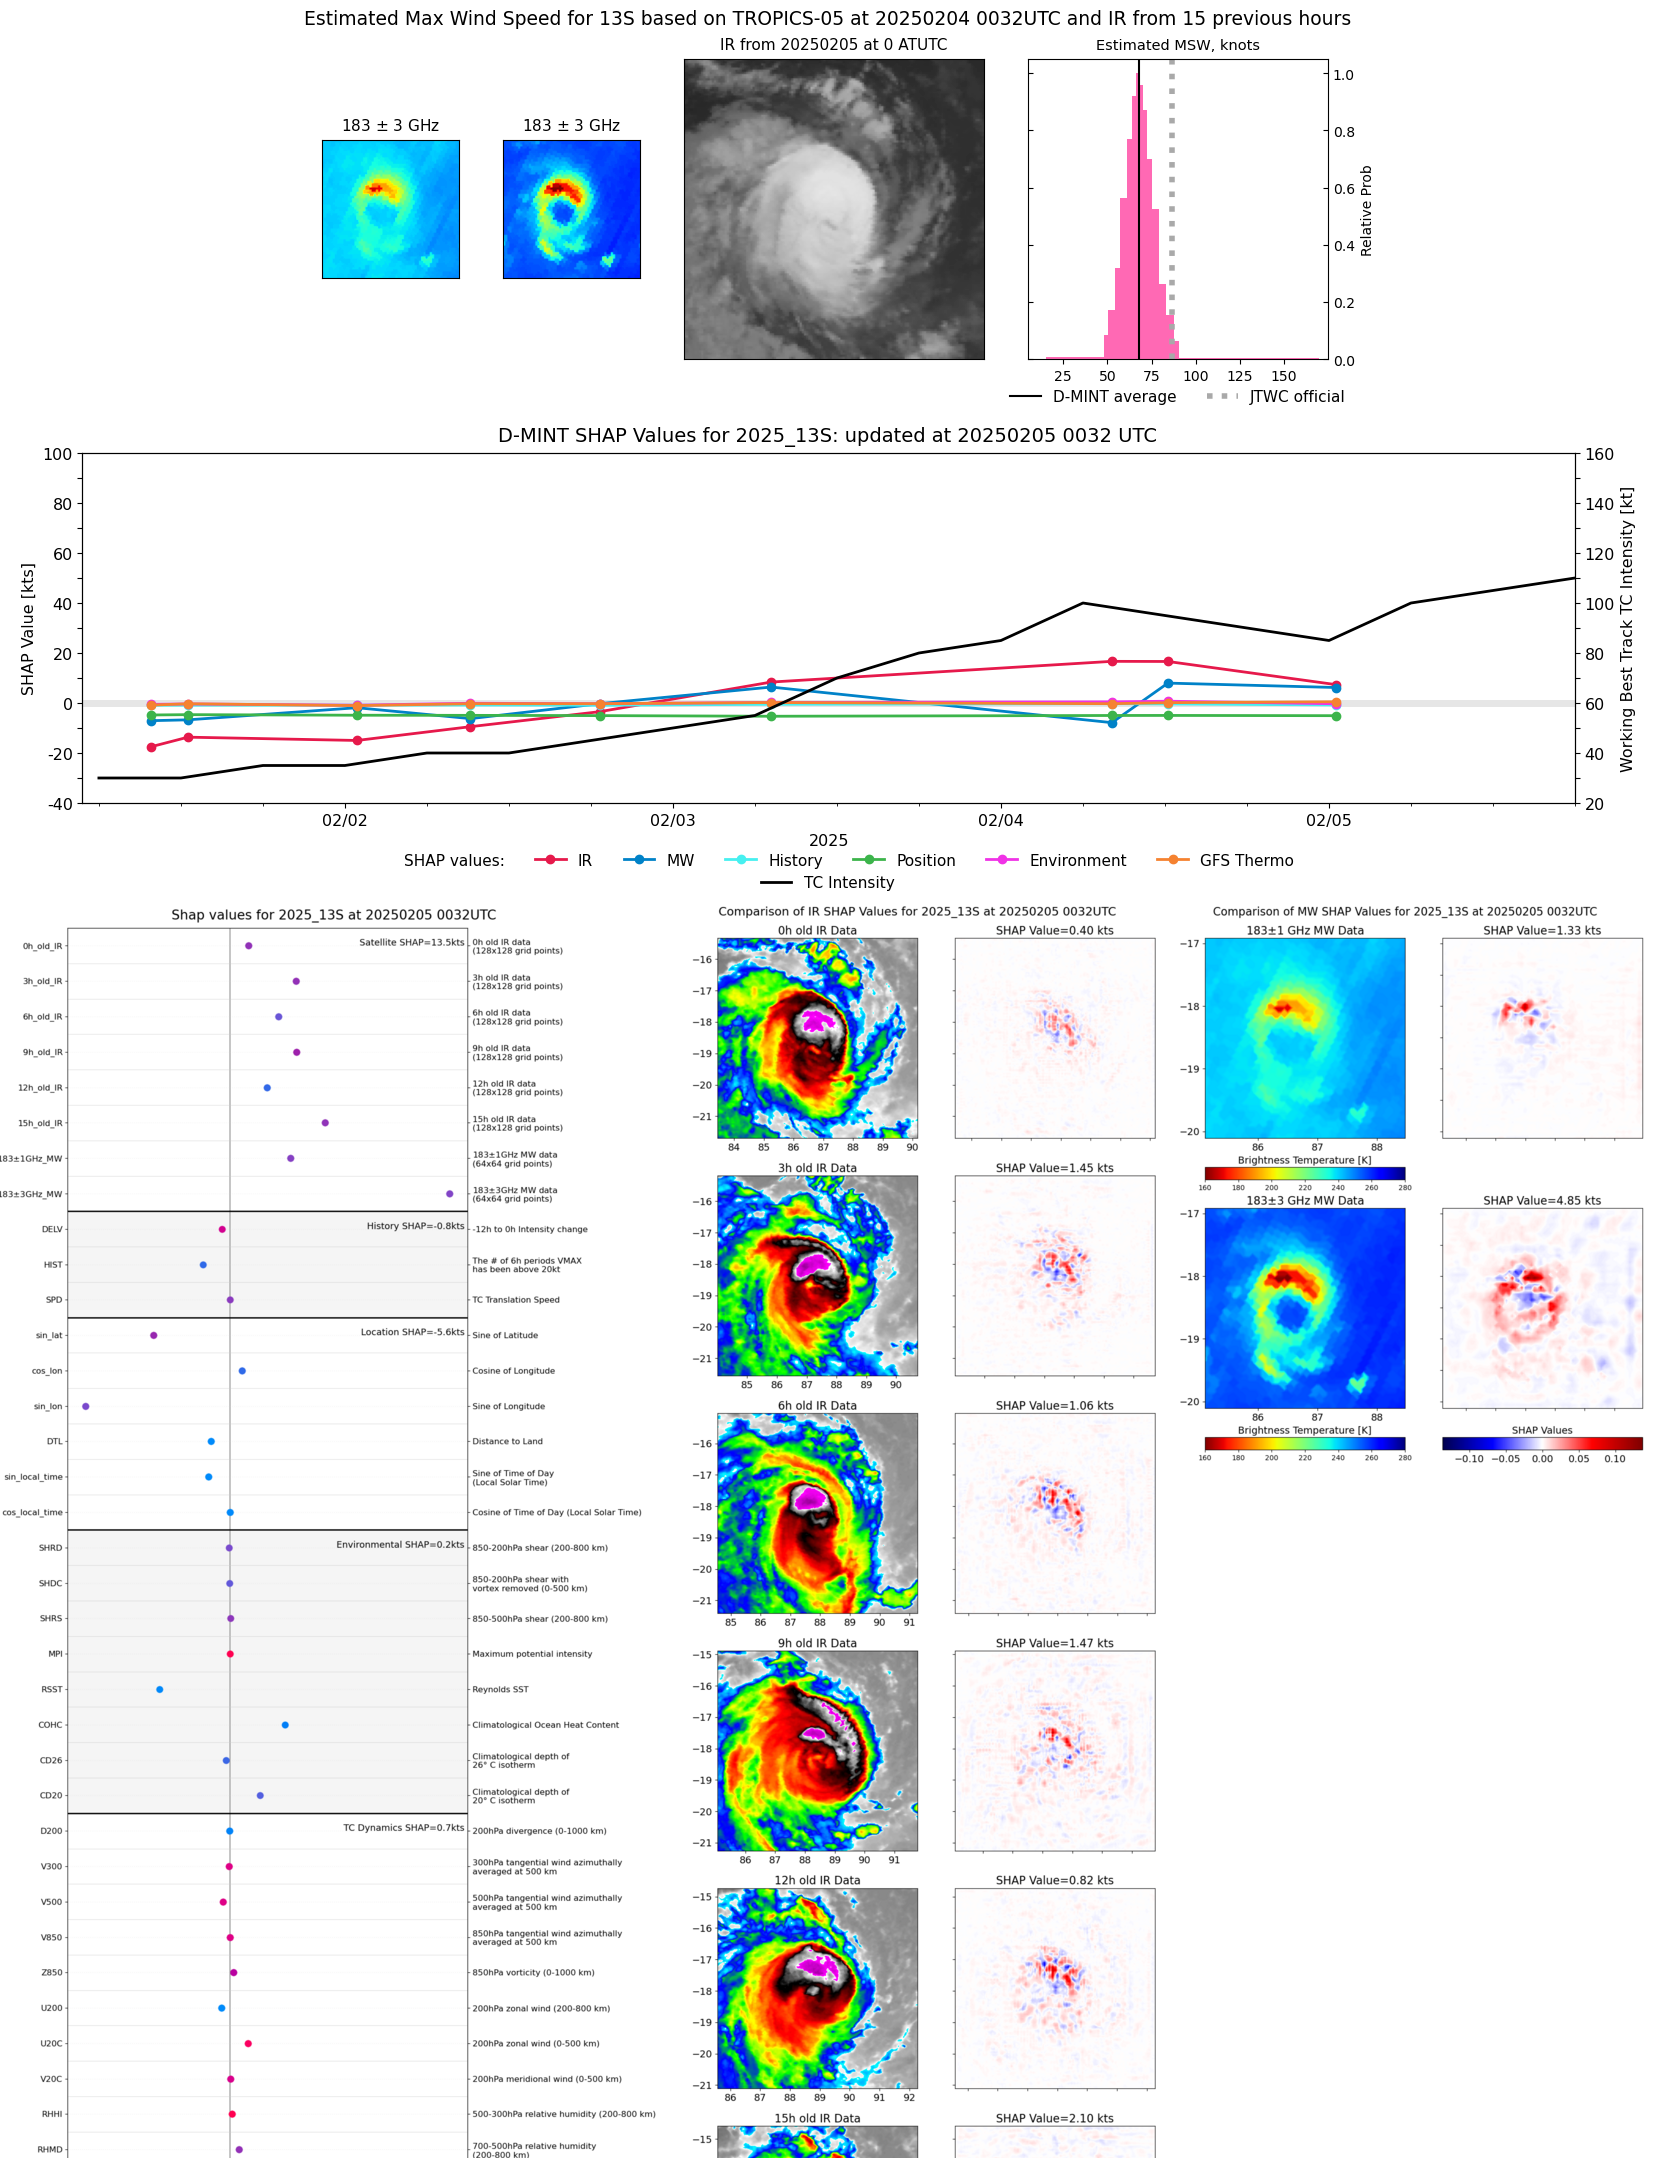 |
| 20250204 | 2357 UTC | SSMISF17 | 972 hPa | 74 kts | 68 kts | 80 kts | 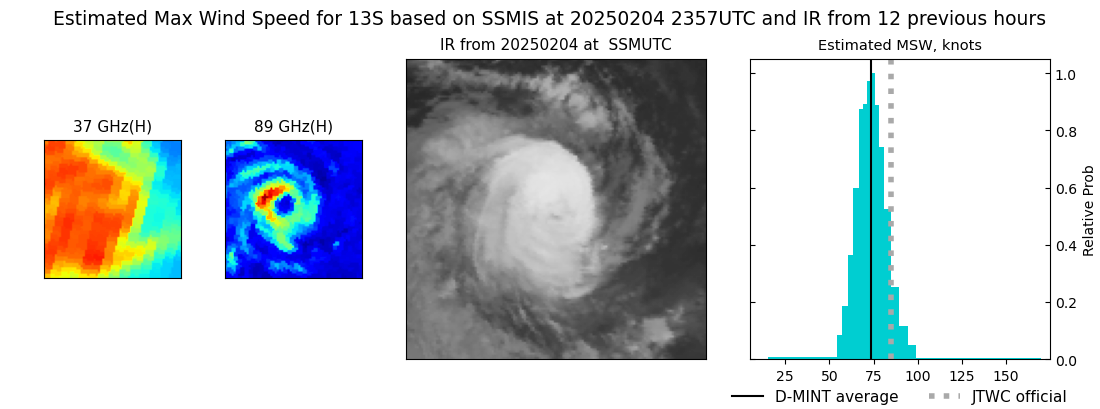 |
| 20250204 | 2151 UTC | SSMISF18 | 964 hPa | 78 kts | 72 kts | 84 kts | 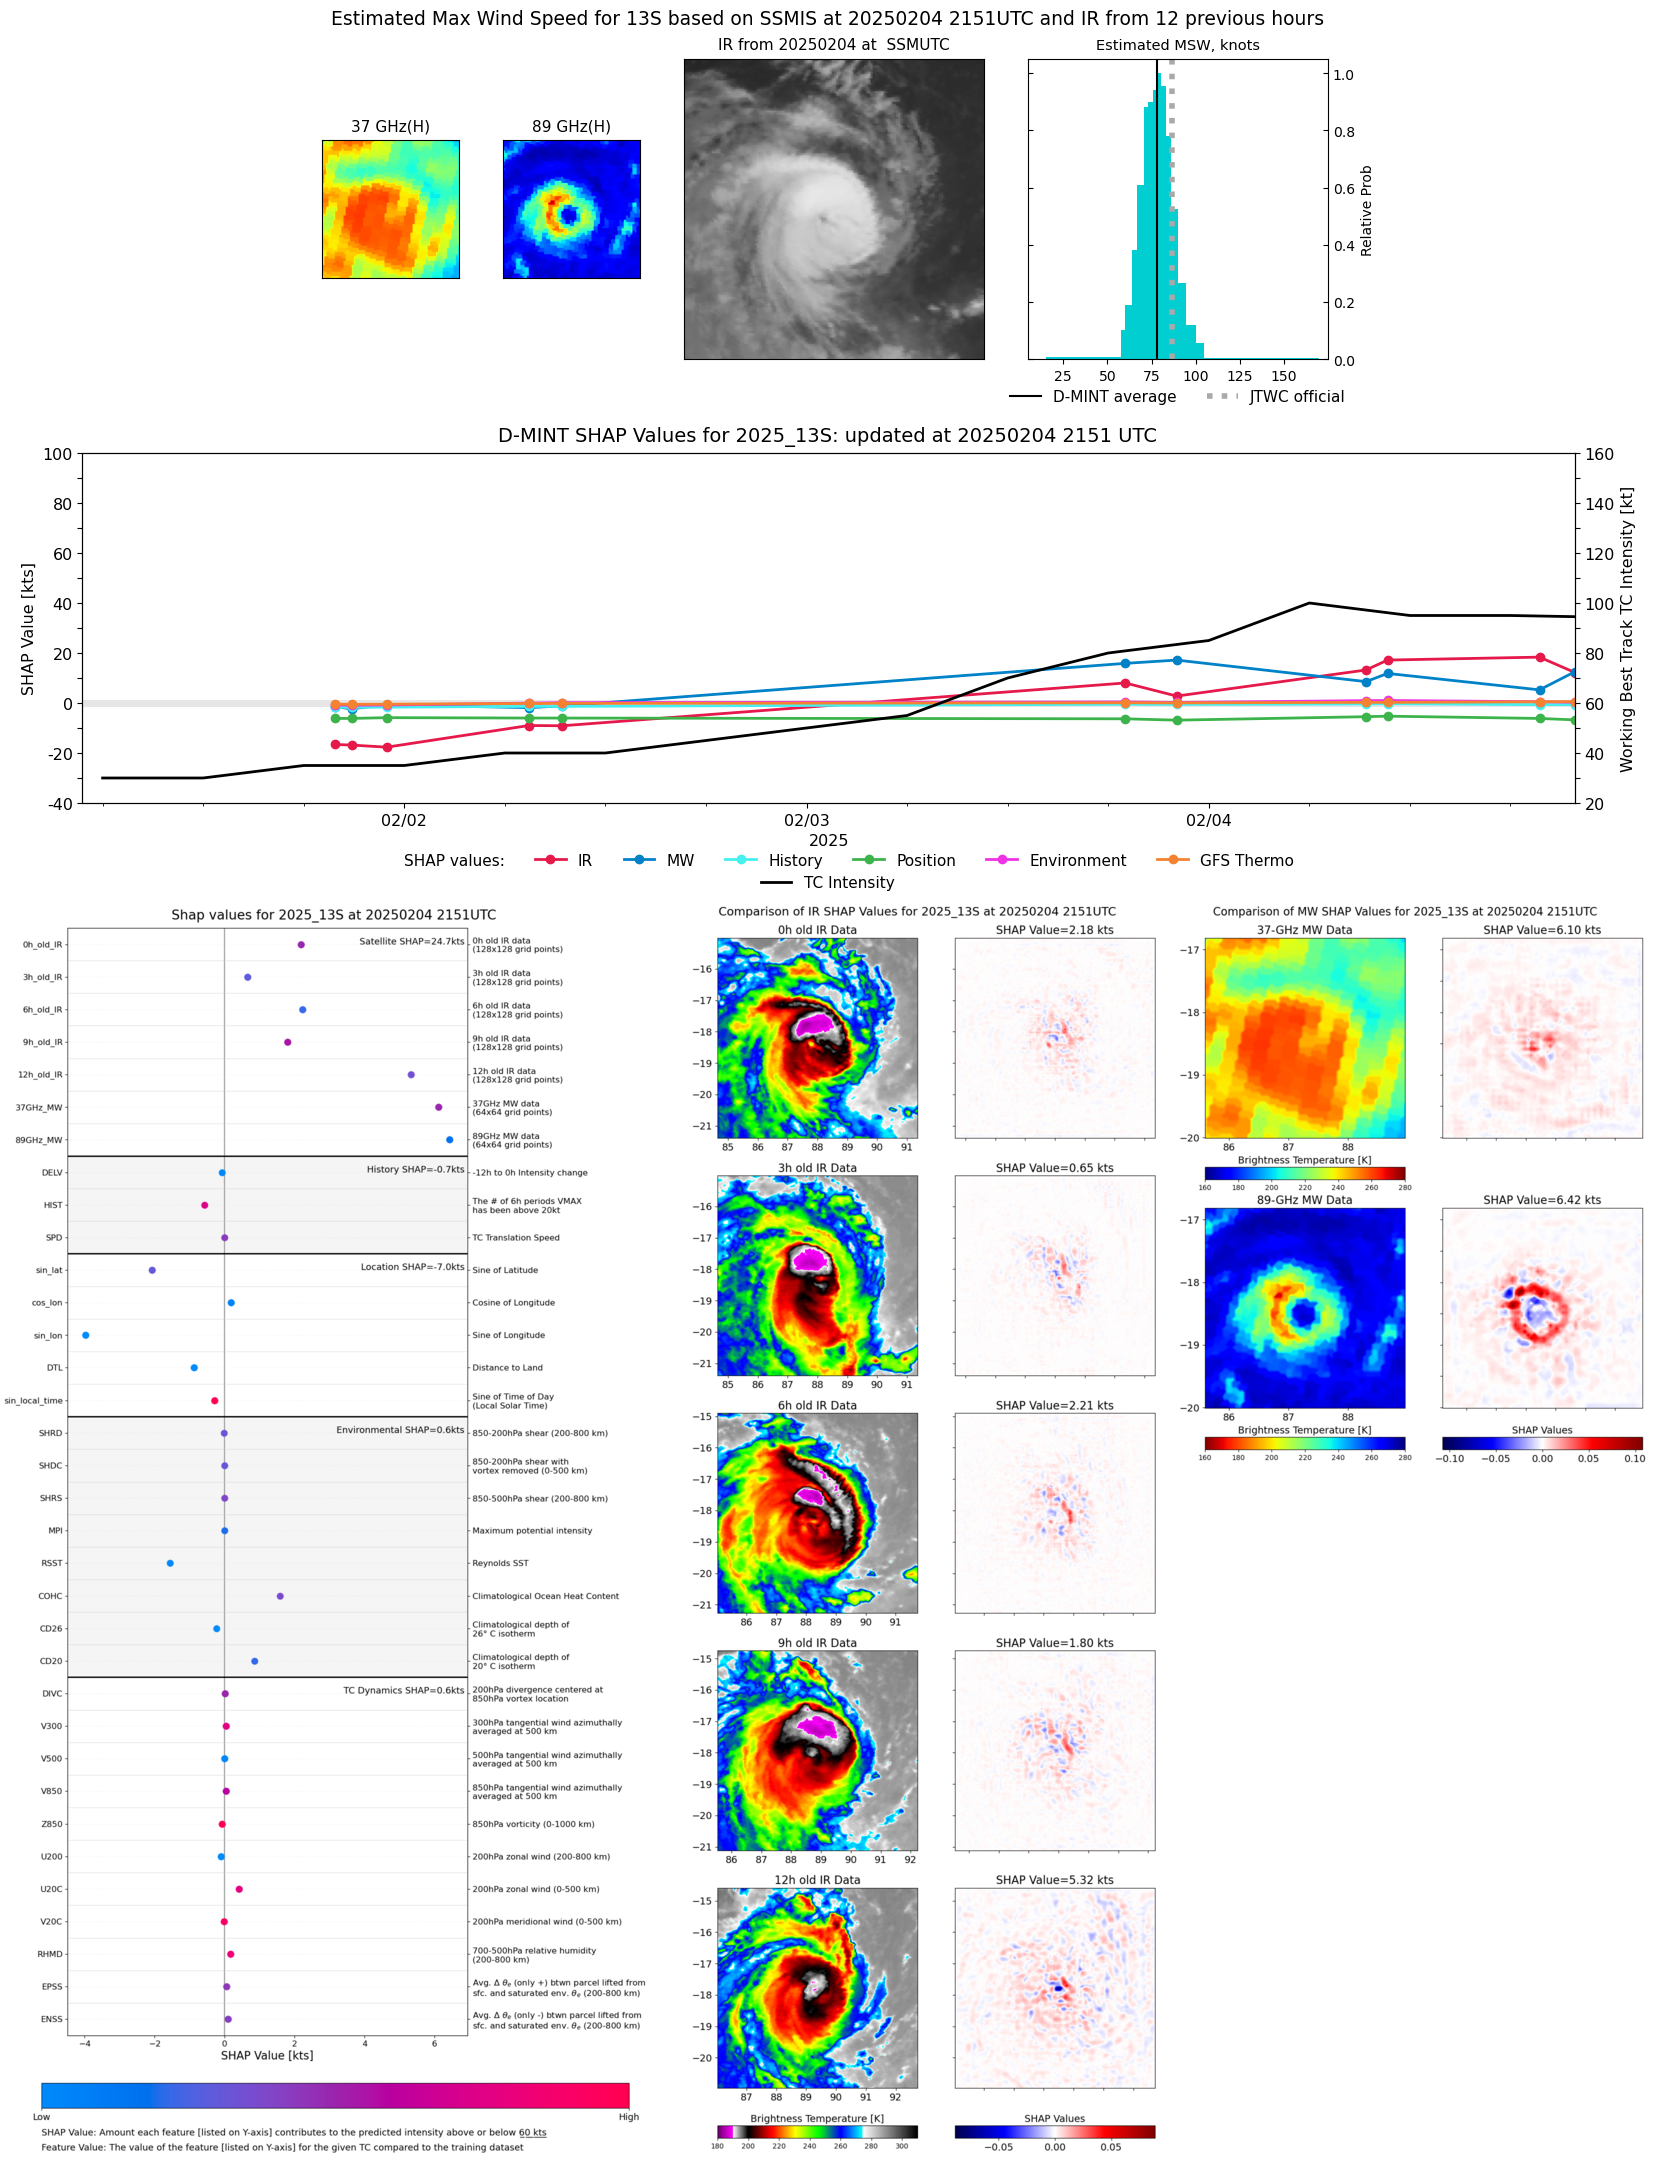 |
| 20250204 | 1944 UTC | AMSR2 | 965 hPa | 78 kts | 71 kts | 85 kts | 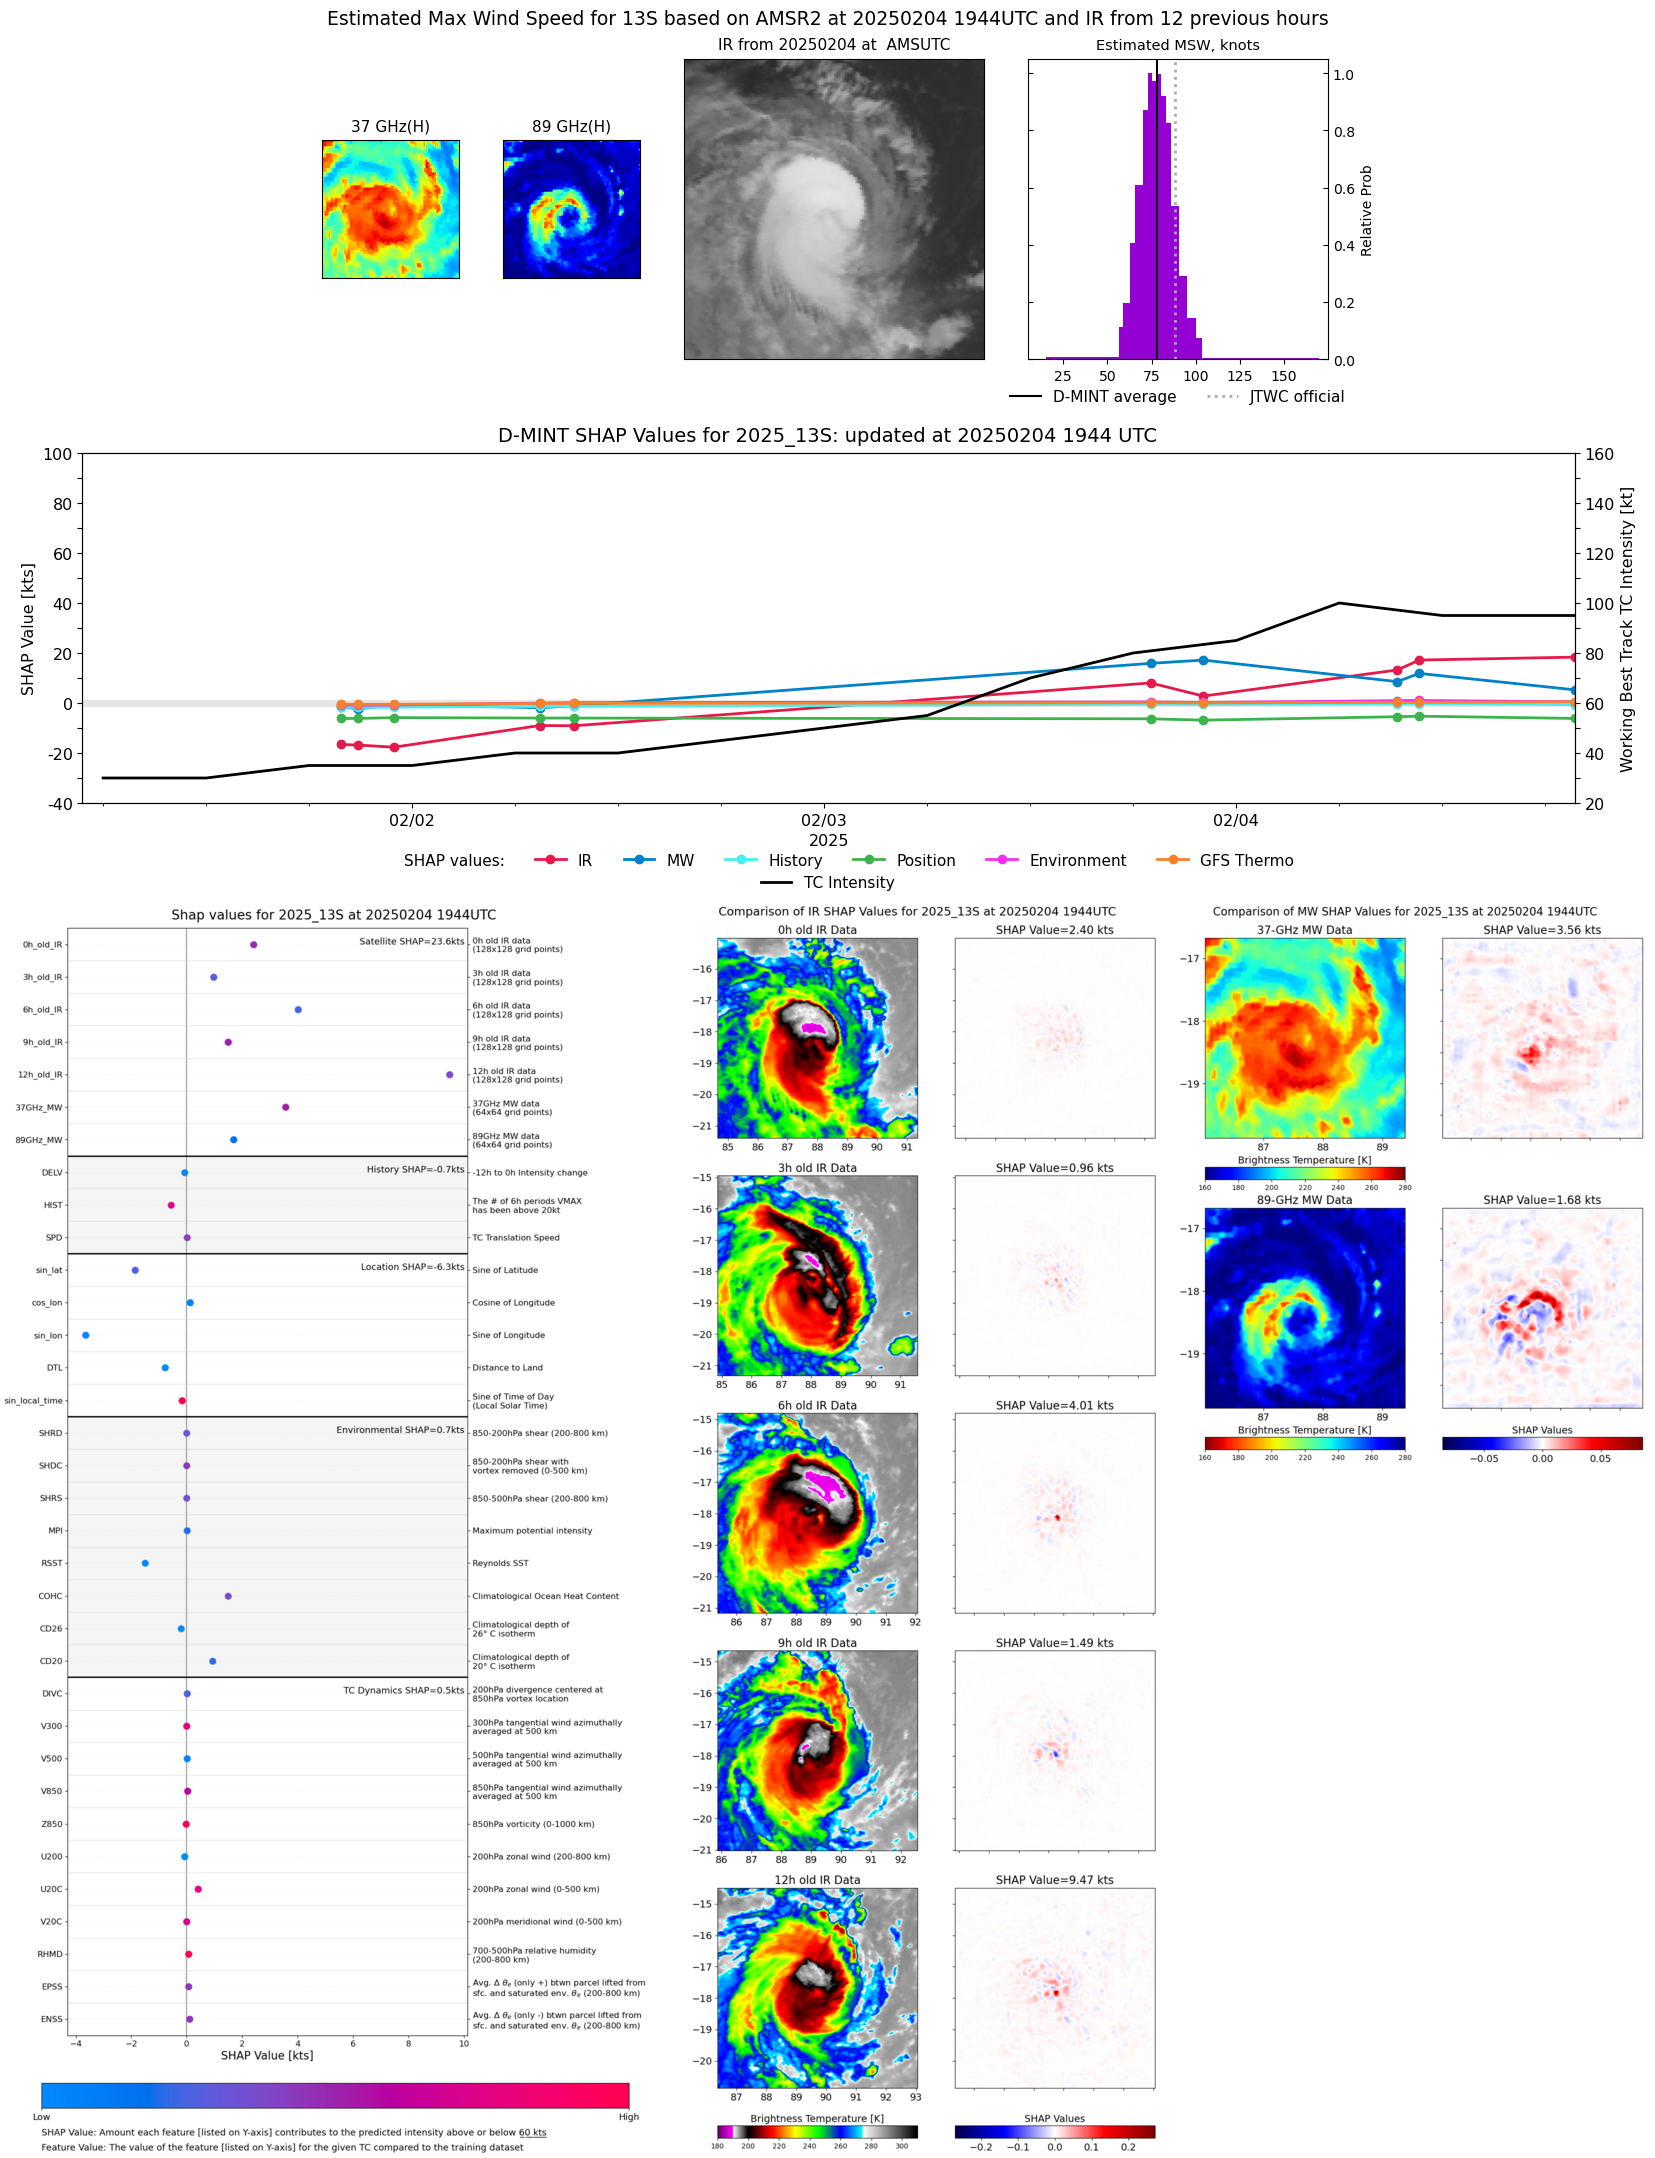 |
| 20250204 | 1213 UTC | TROPICS03 | 966 hPa | 80 kts | 74 kts | 87 kts | 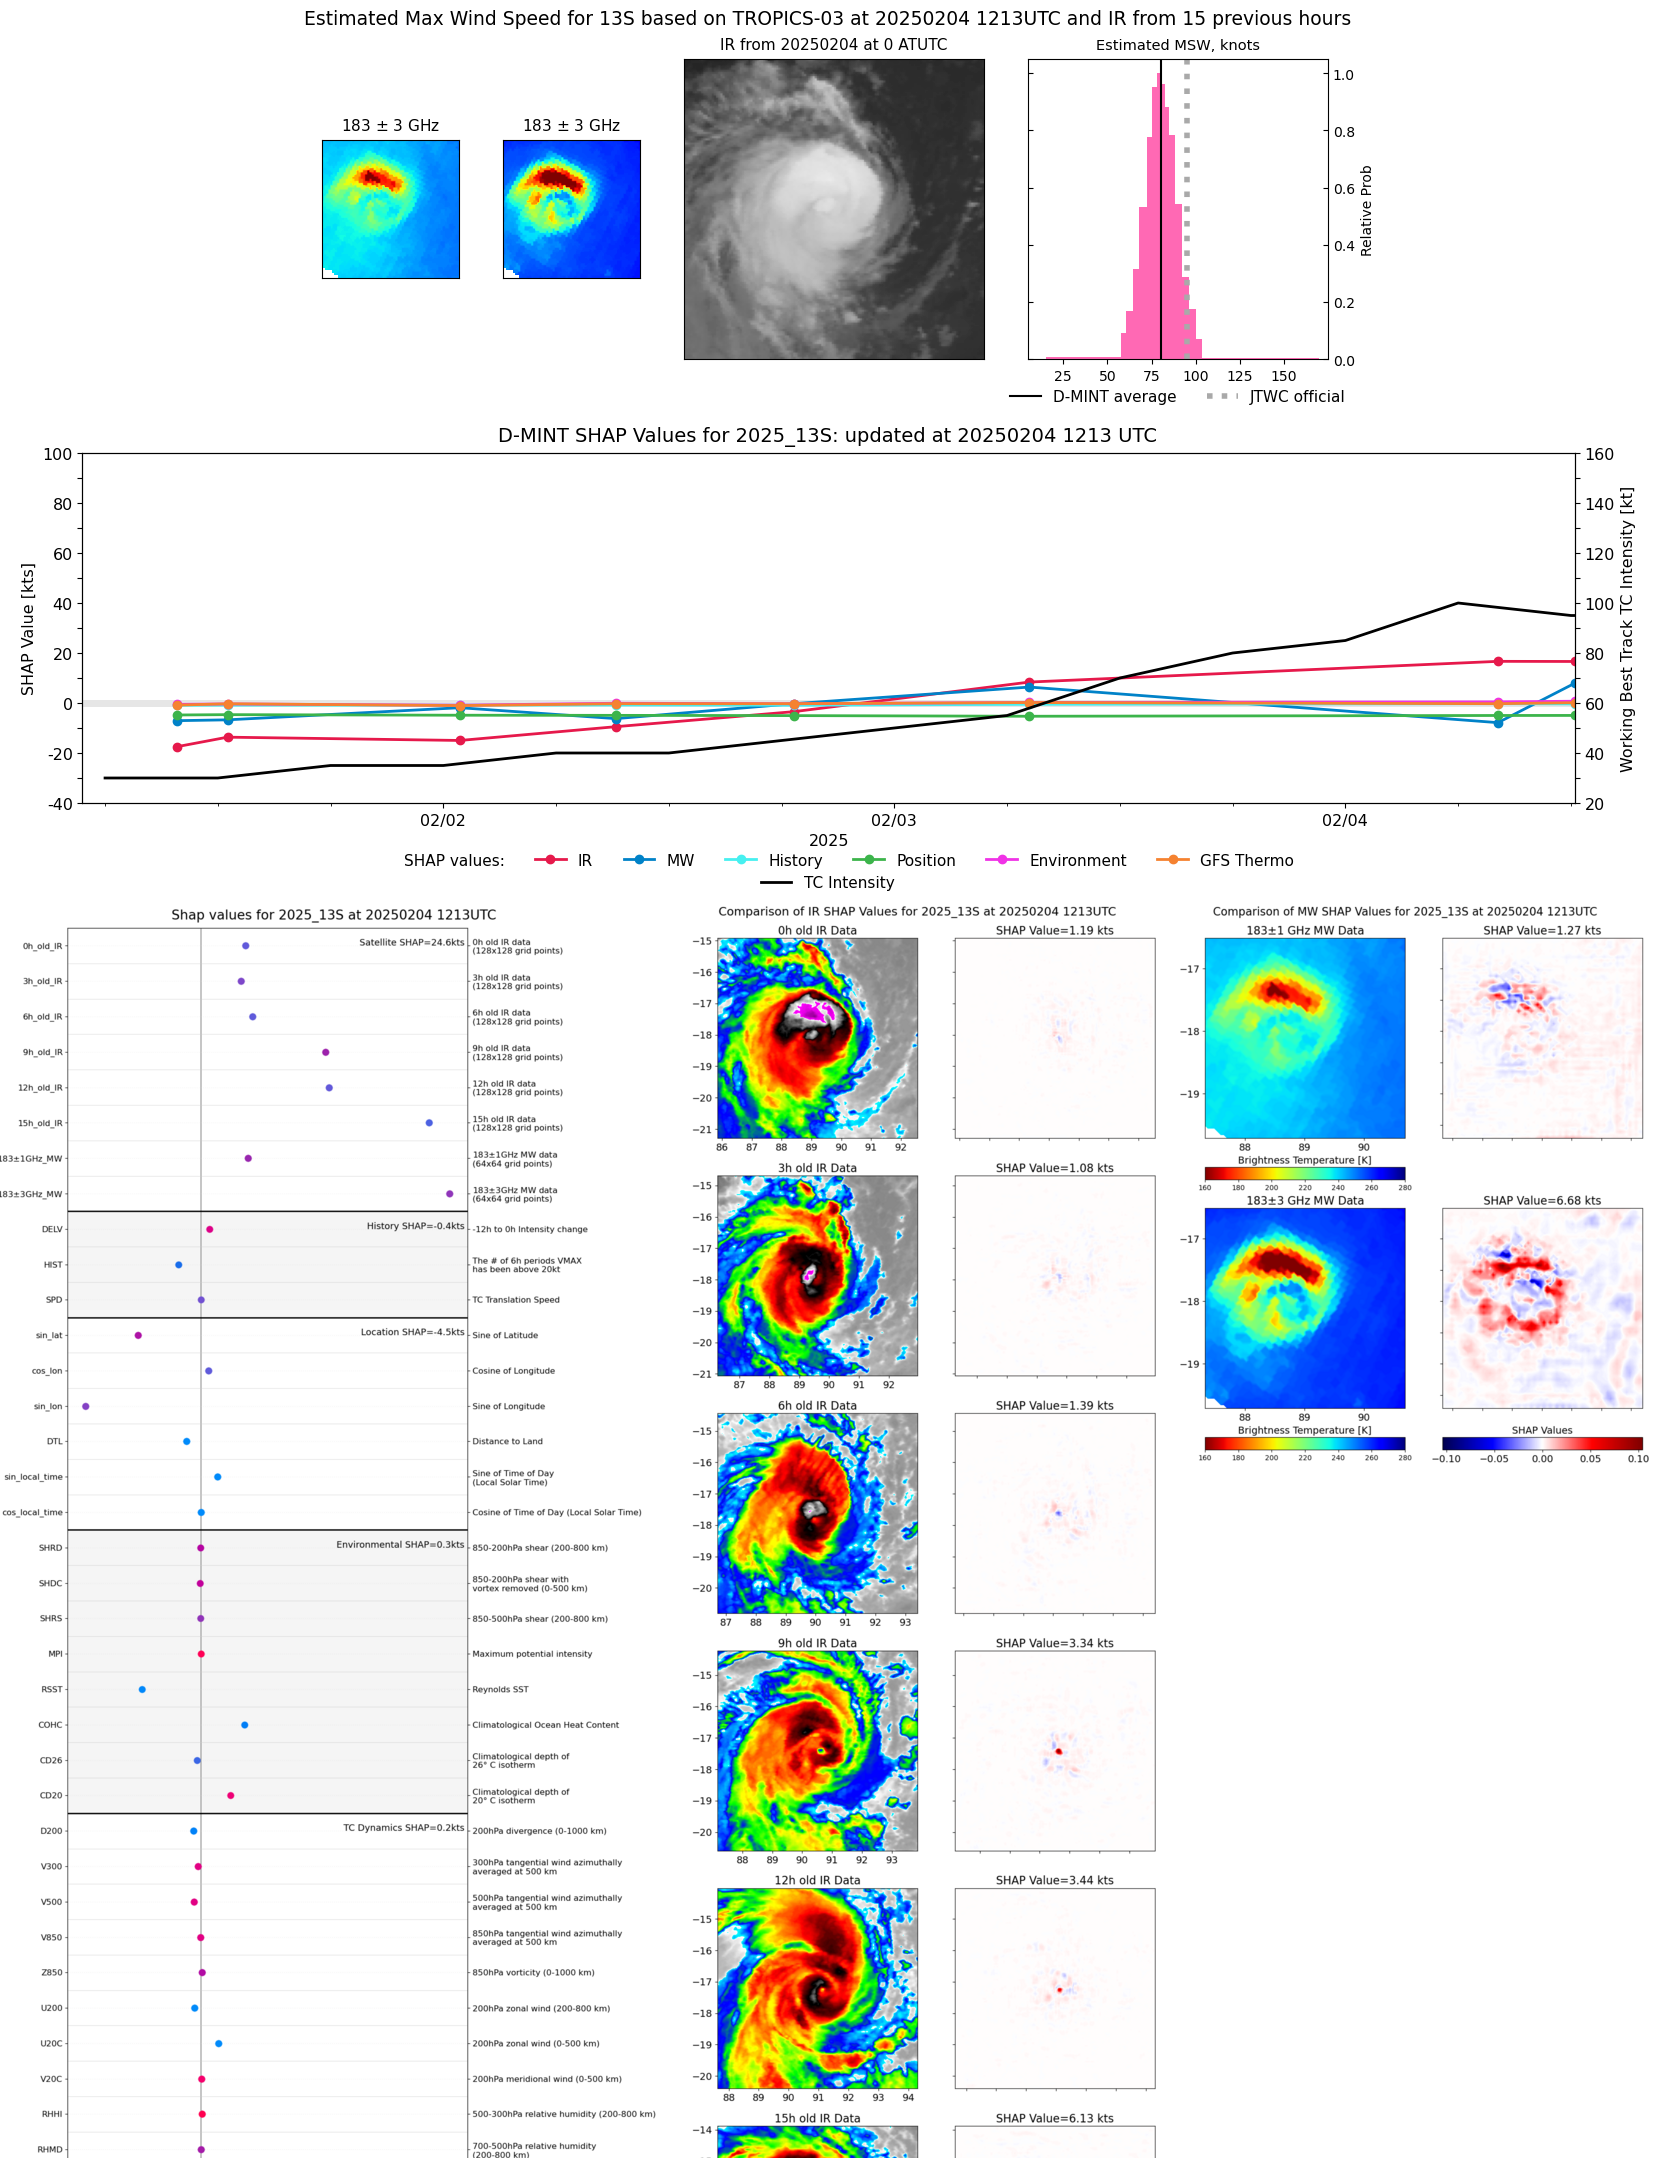 |
| 20250204 | 1040 UTC | SSMISF18 | 962 hPa | 85 kts | 79 kts | 91 kts | 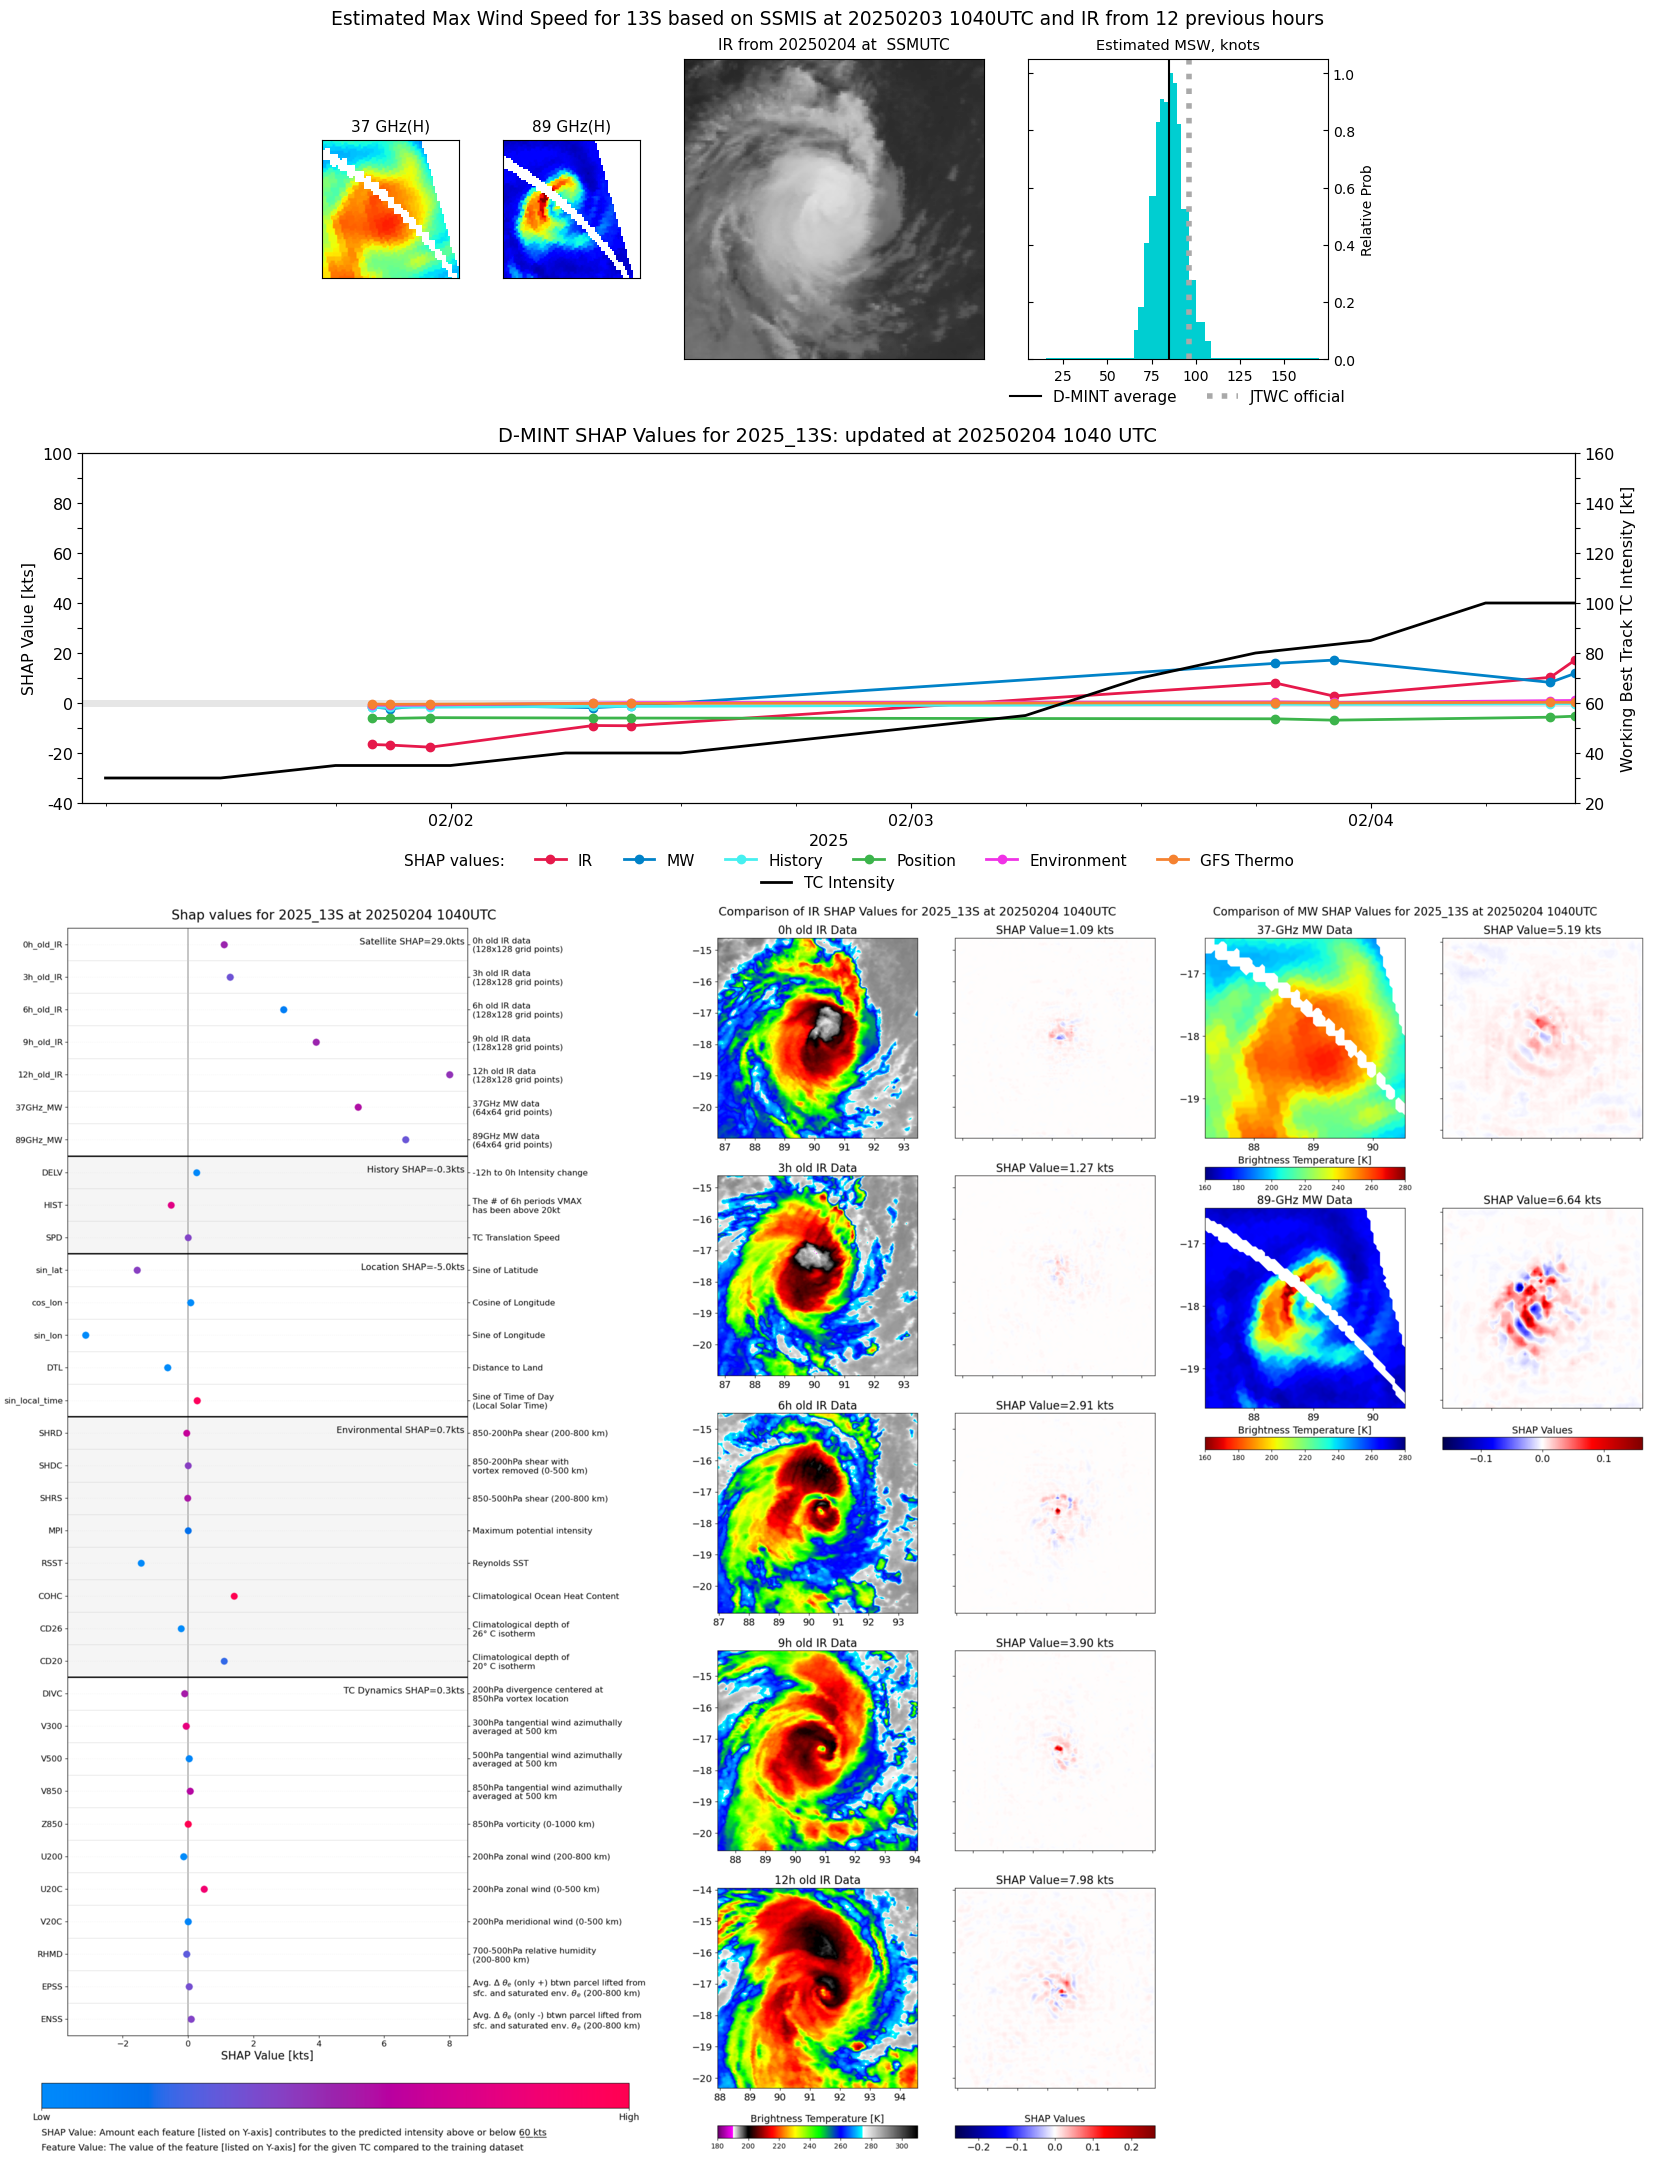 |
| 20250204 | 0923 UTC | GMI | 965 hPa | 77 kts | 71 kts | 83 kts | 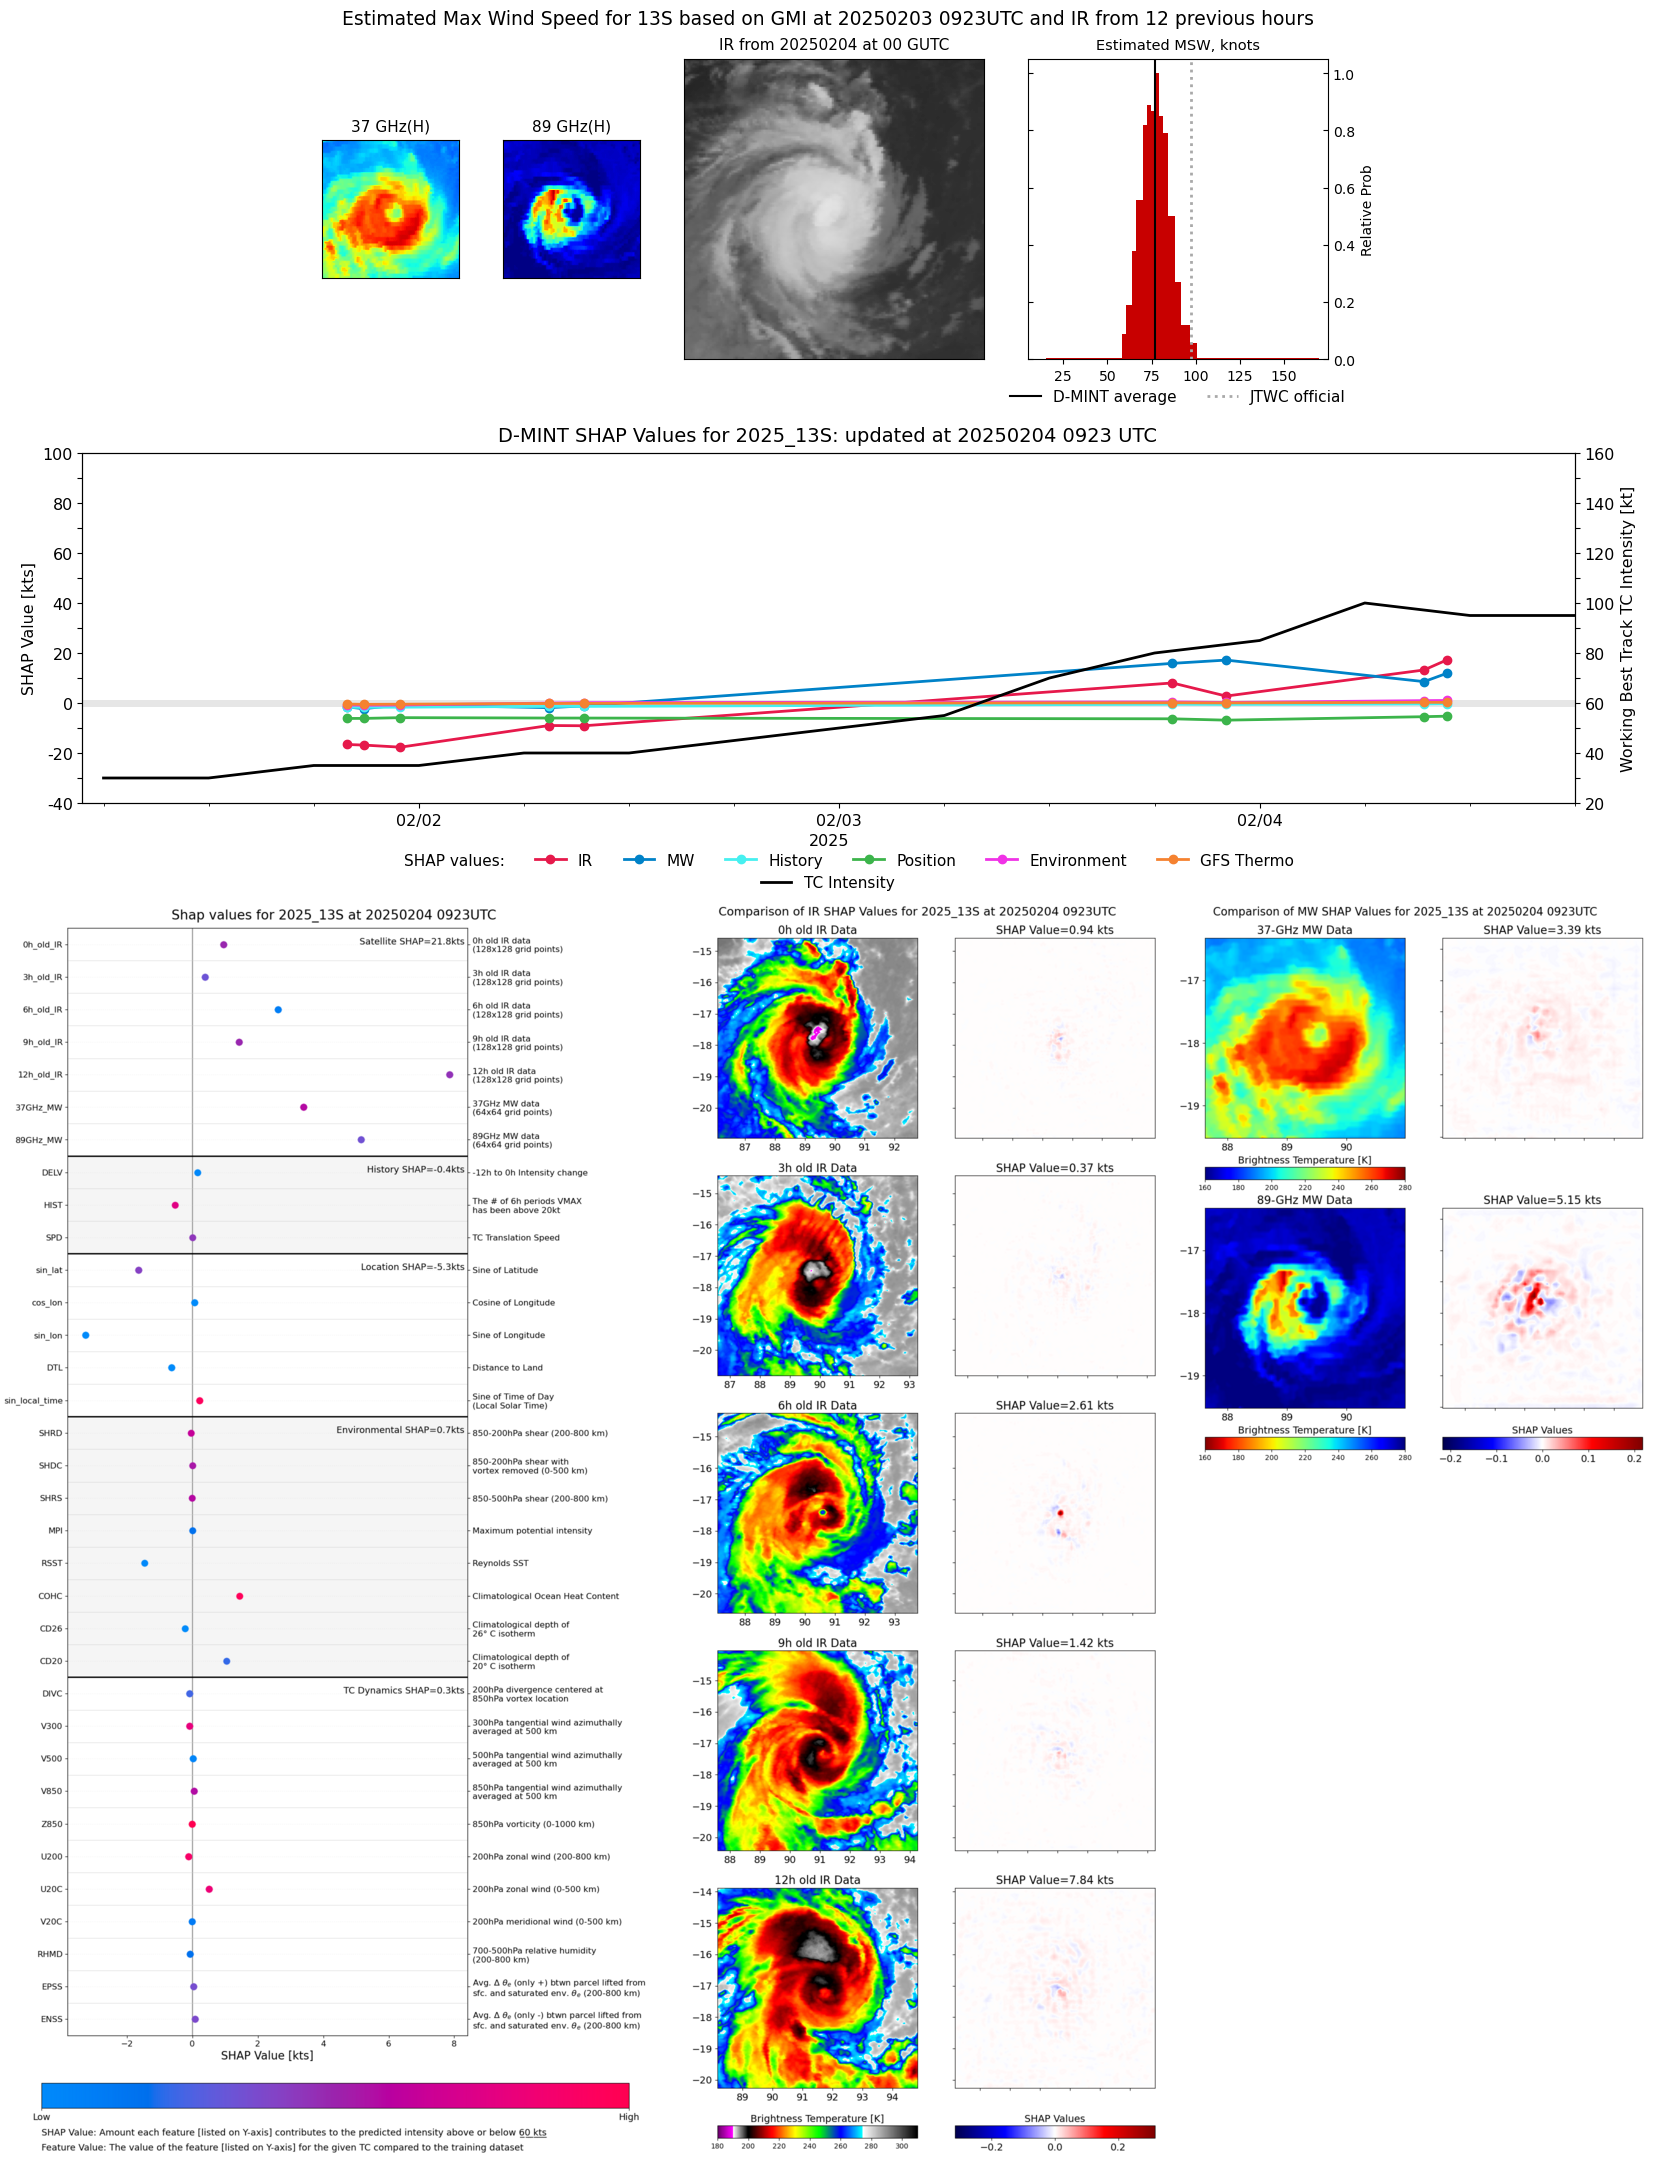 |
| 20250203 | 2205 UTC | SSMISF18 | 964 hPa | 78 kts | 72 kts | 85 kts | 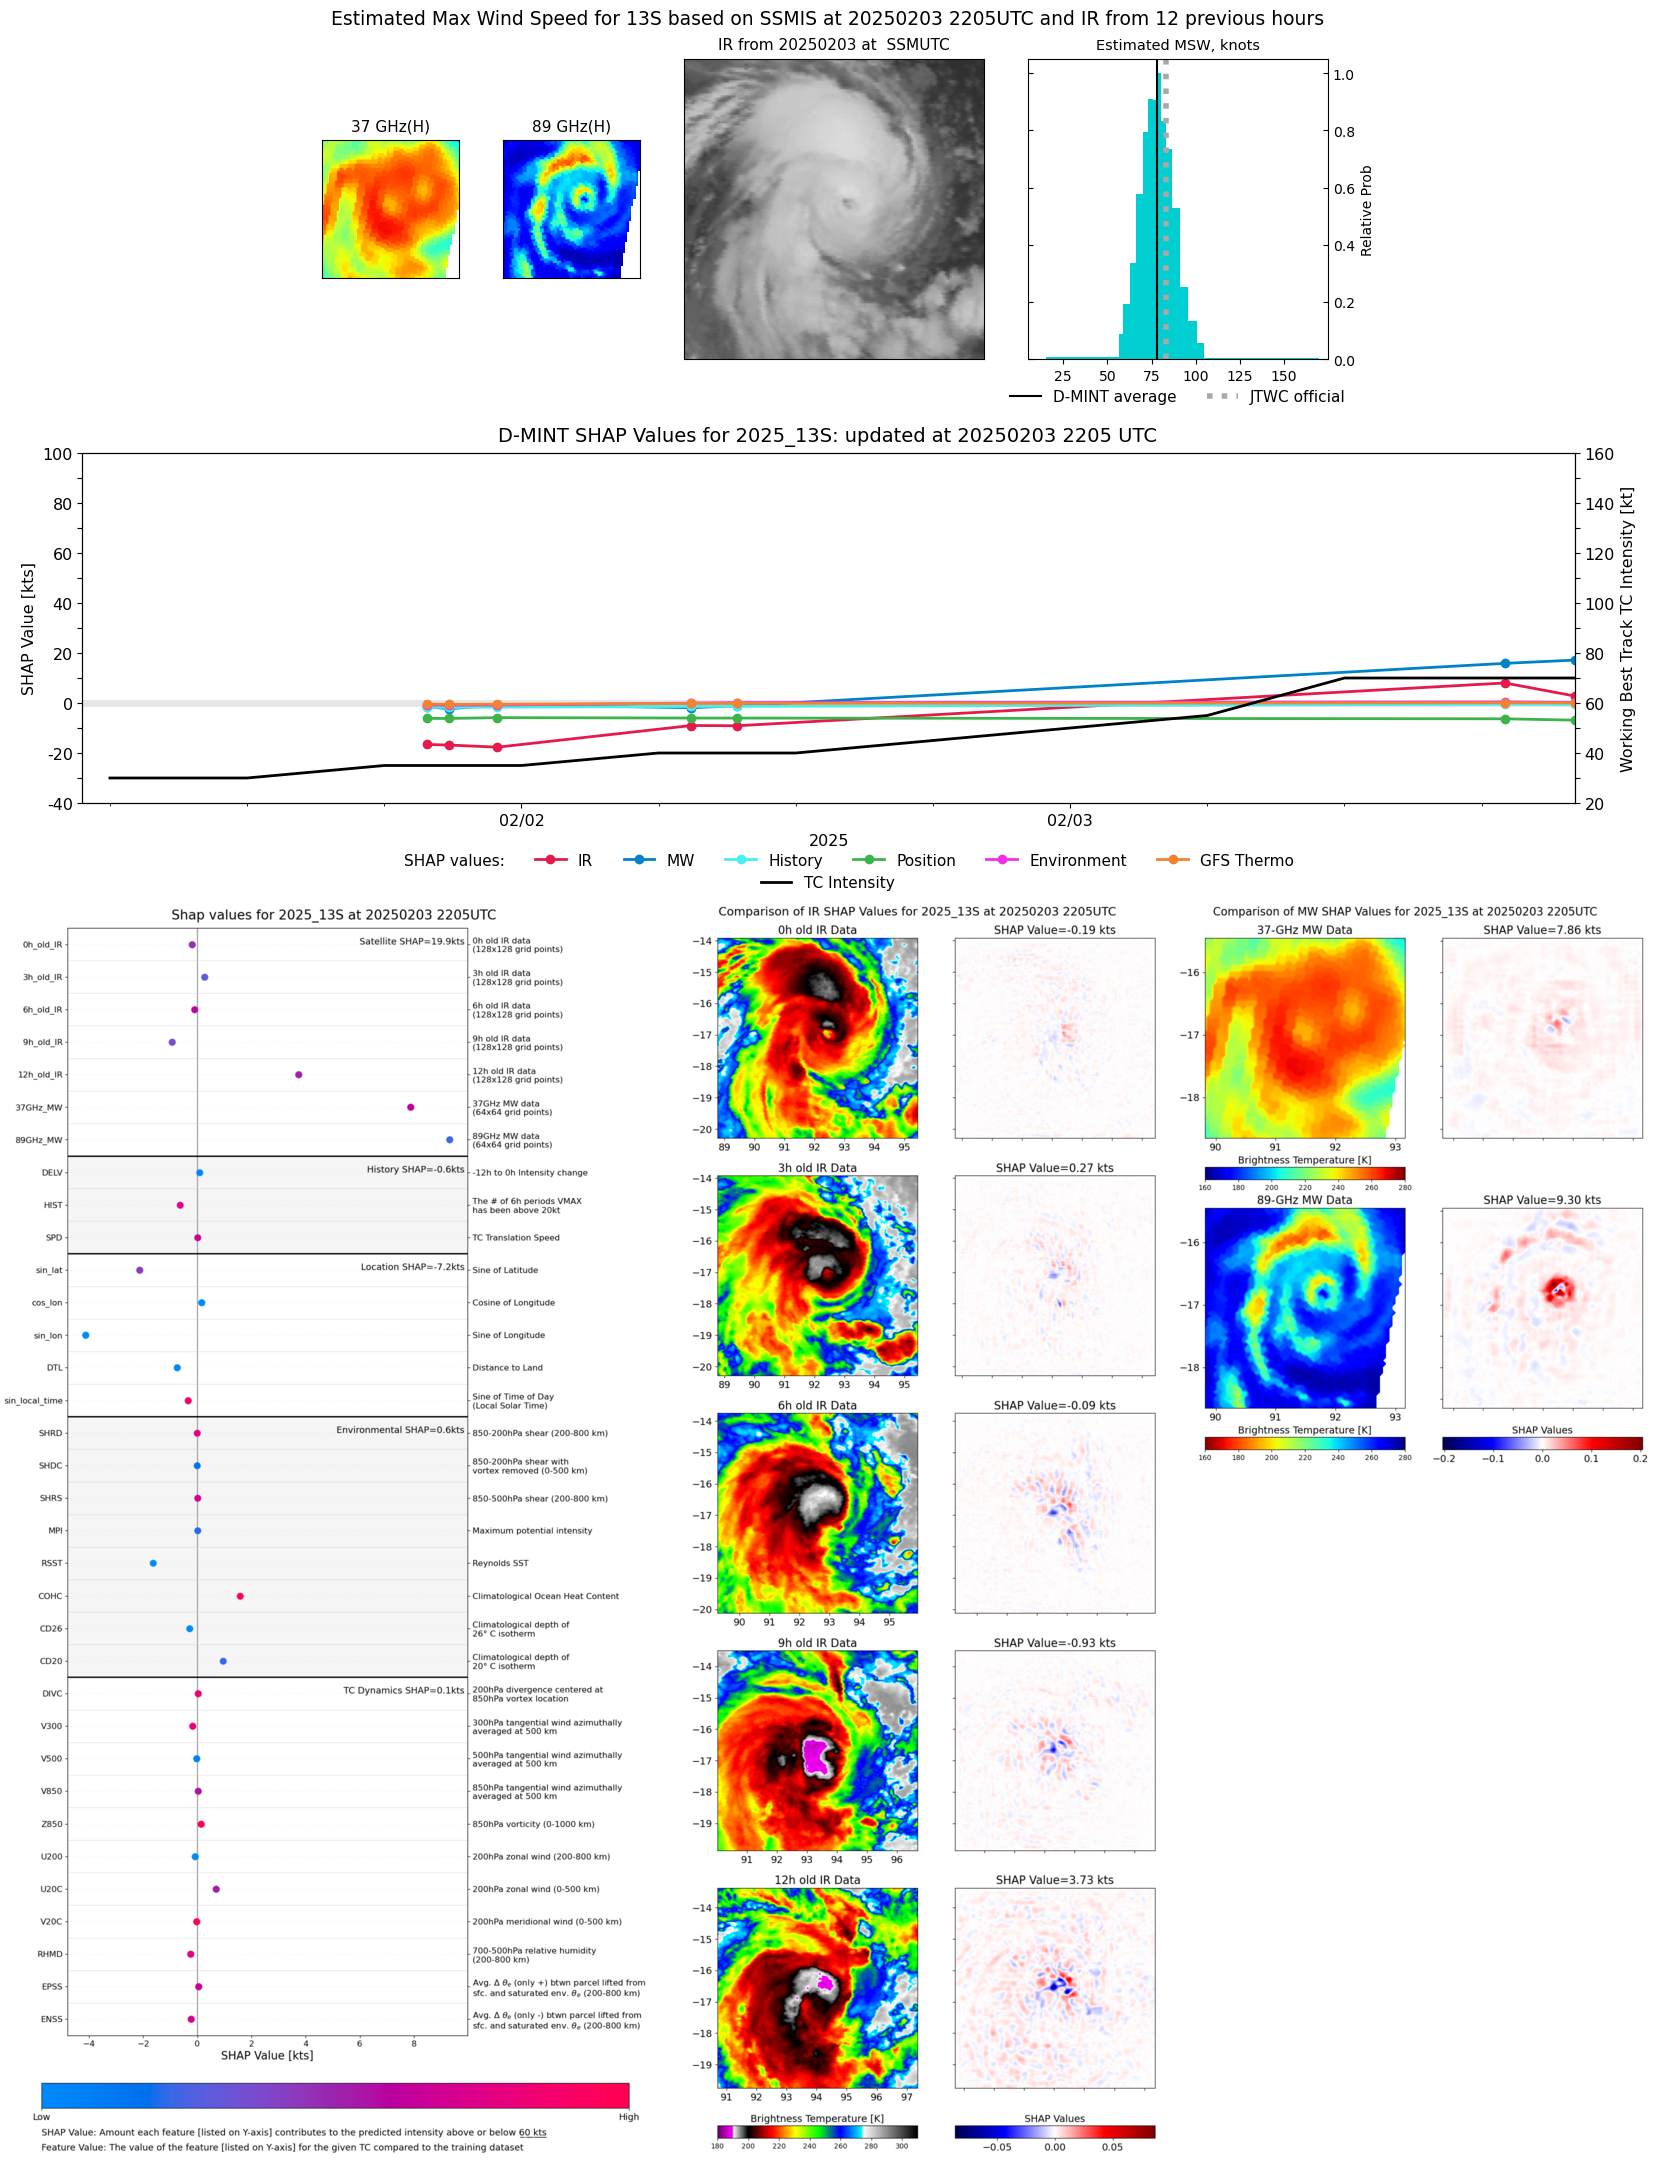 |
| 20250203 | 2003 UTC | GMI | 963 hPa | 76 kts | 70 kts | 83 kts | 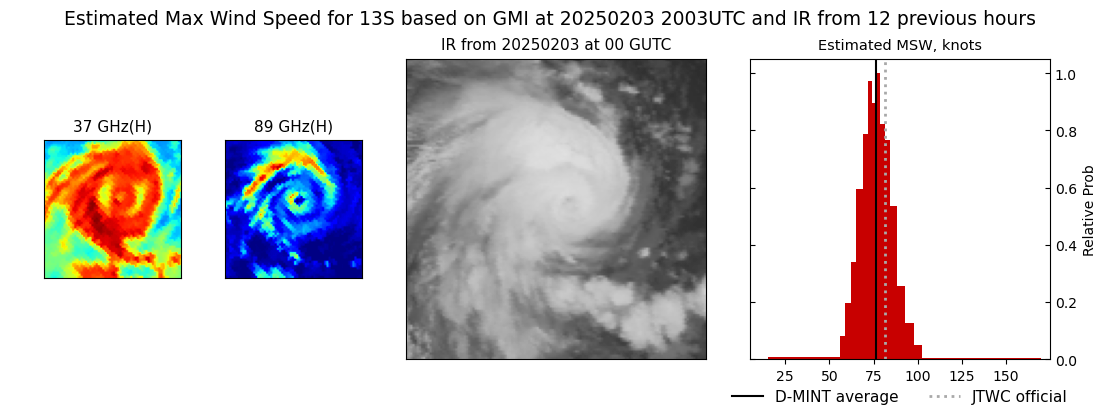 |
| 20250203 | 1901 UTC | AMSR2 | 965 hPa | 79 kts | 72 kts | 85 kts |  |
| 20250203 | 1153 UTC | SSMISF16 | 968 hPa | 66 kts | 60 kts | 72 kts | 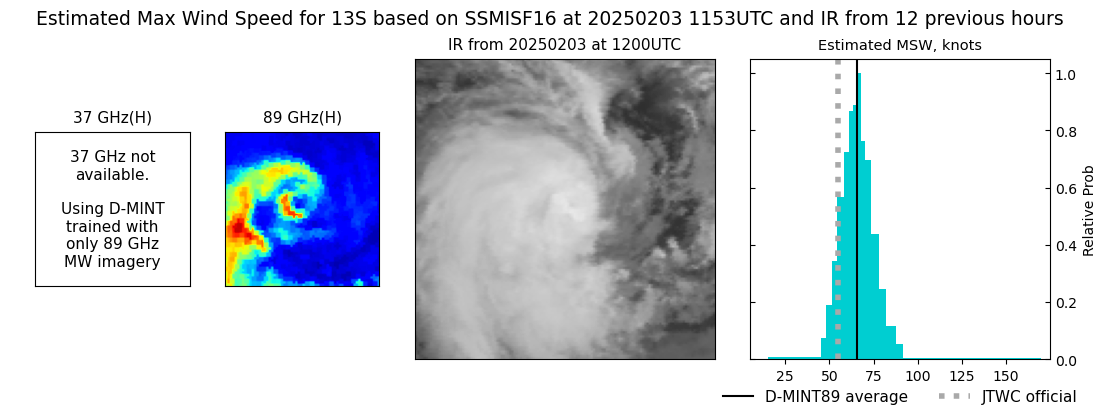 |
| 20250203 | 0711 UTC | ATMS-N20 | 975 hPa | 70 kts | 63 kts | 76 kts |  |
| 20250202 | 2319 UTC | SSMISF16 | 986 hPa | 41 kts | 35 kts | 47 kts | 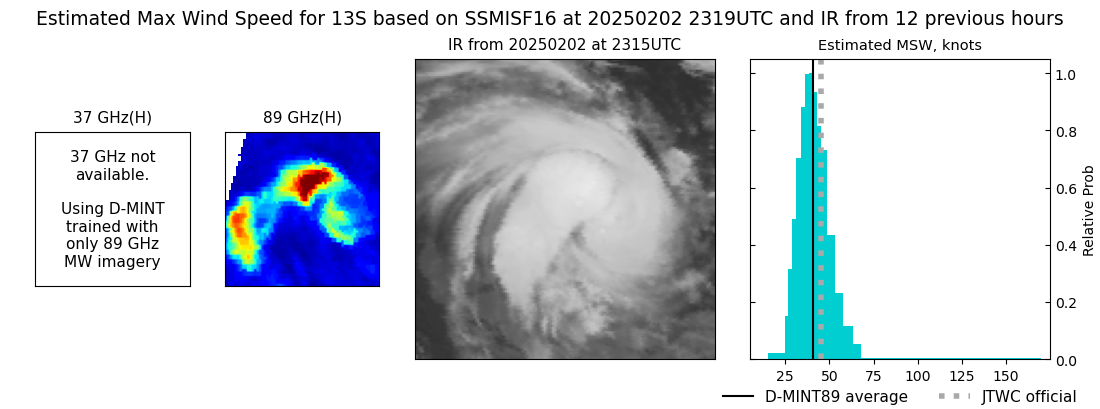 |
| 20250202 | 1839 UTC | ATMS-N20 | 984 hPa | 50 kts | 45 kts | 56 kts |  |
| 20250202 | 1206 UTC | SSMISF16 | 987 hPa | 43 kts | 38 kts | 49 kts | 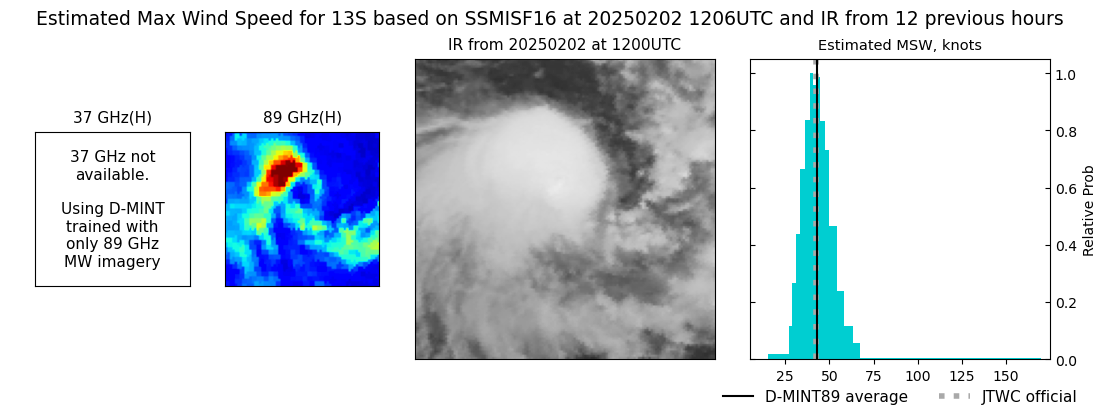 |
| 20250202 | 0926 UTC | SSMISF18 | 991 hPa | 42 kts | 38 kts | 47 kts | 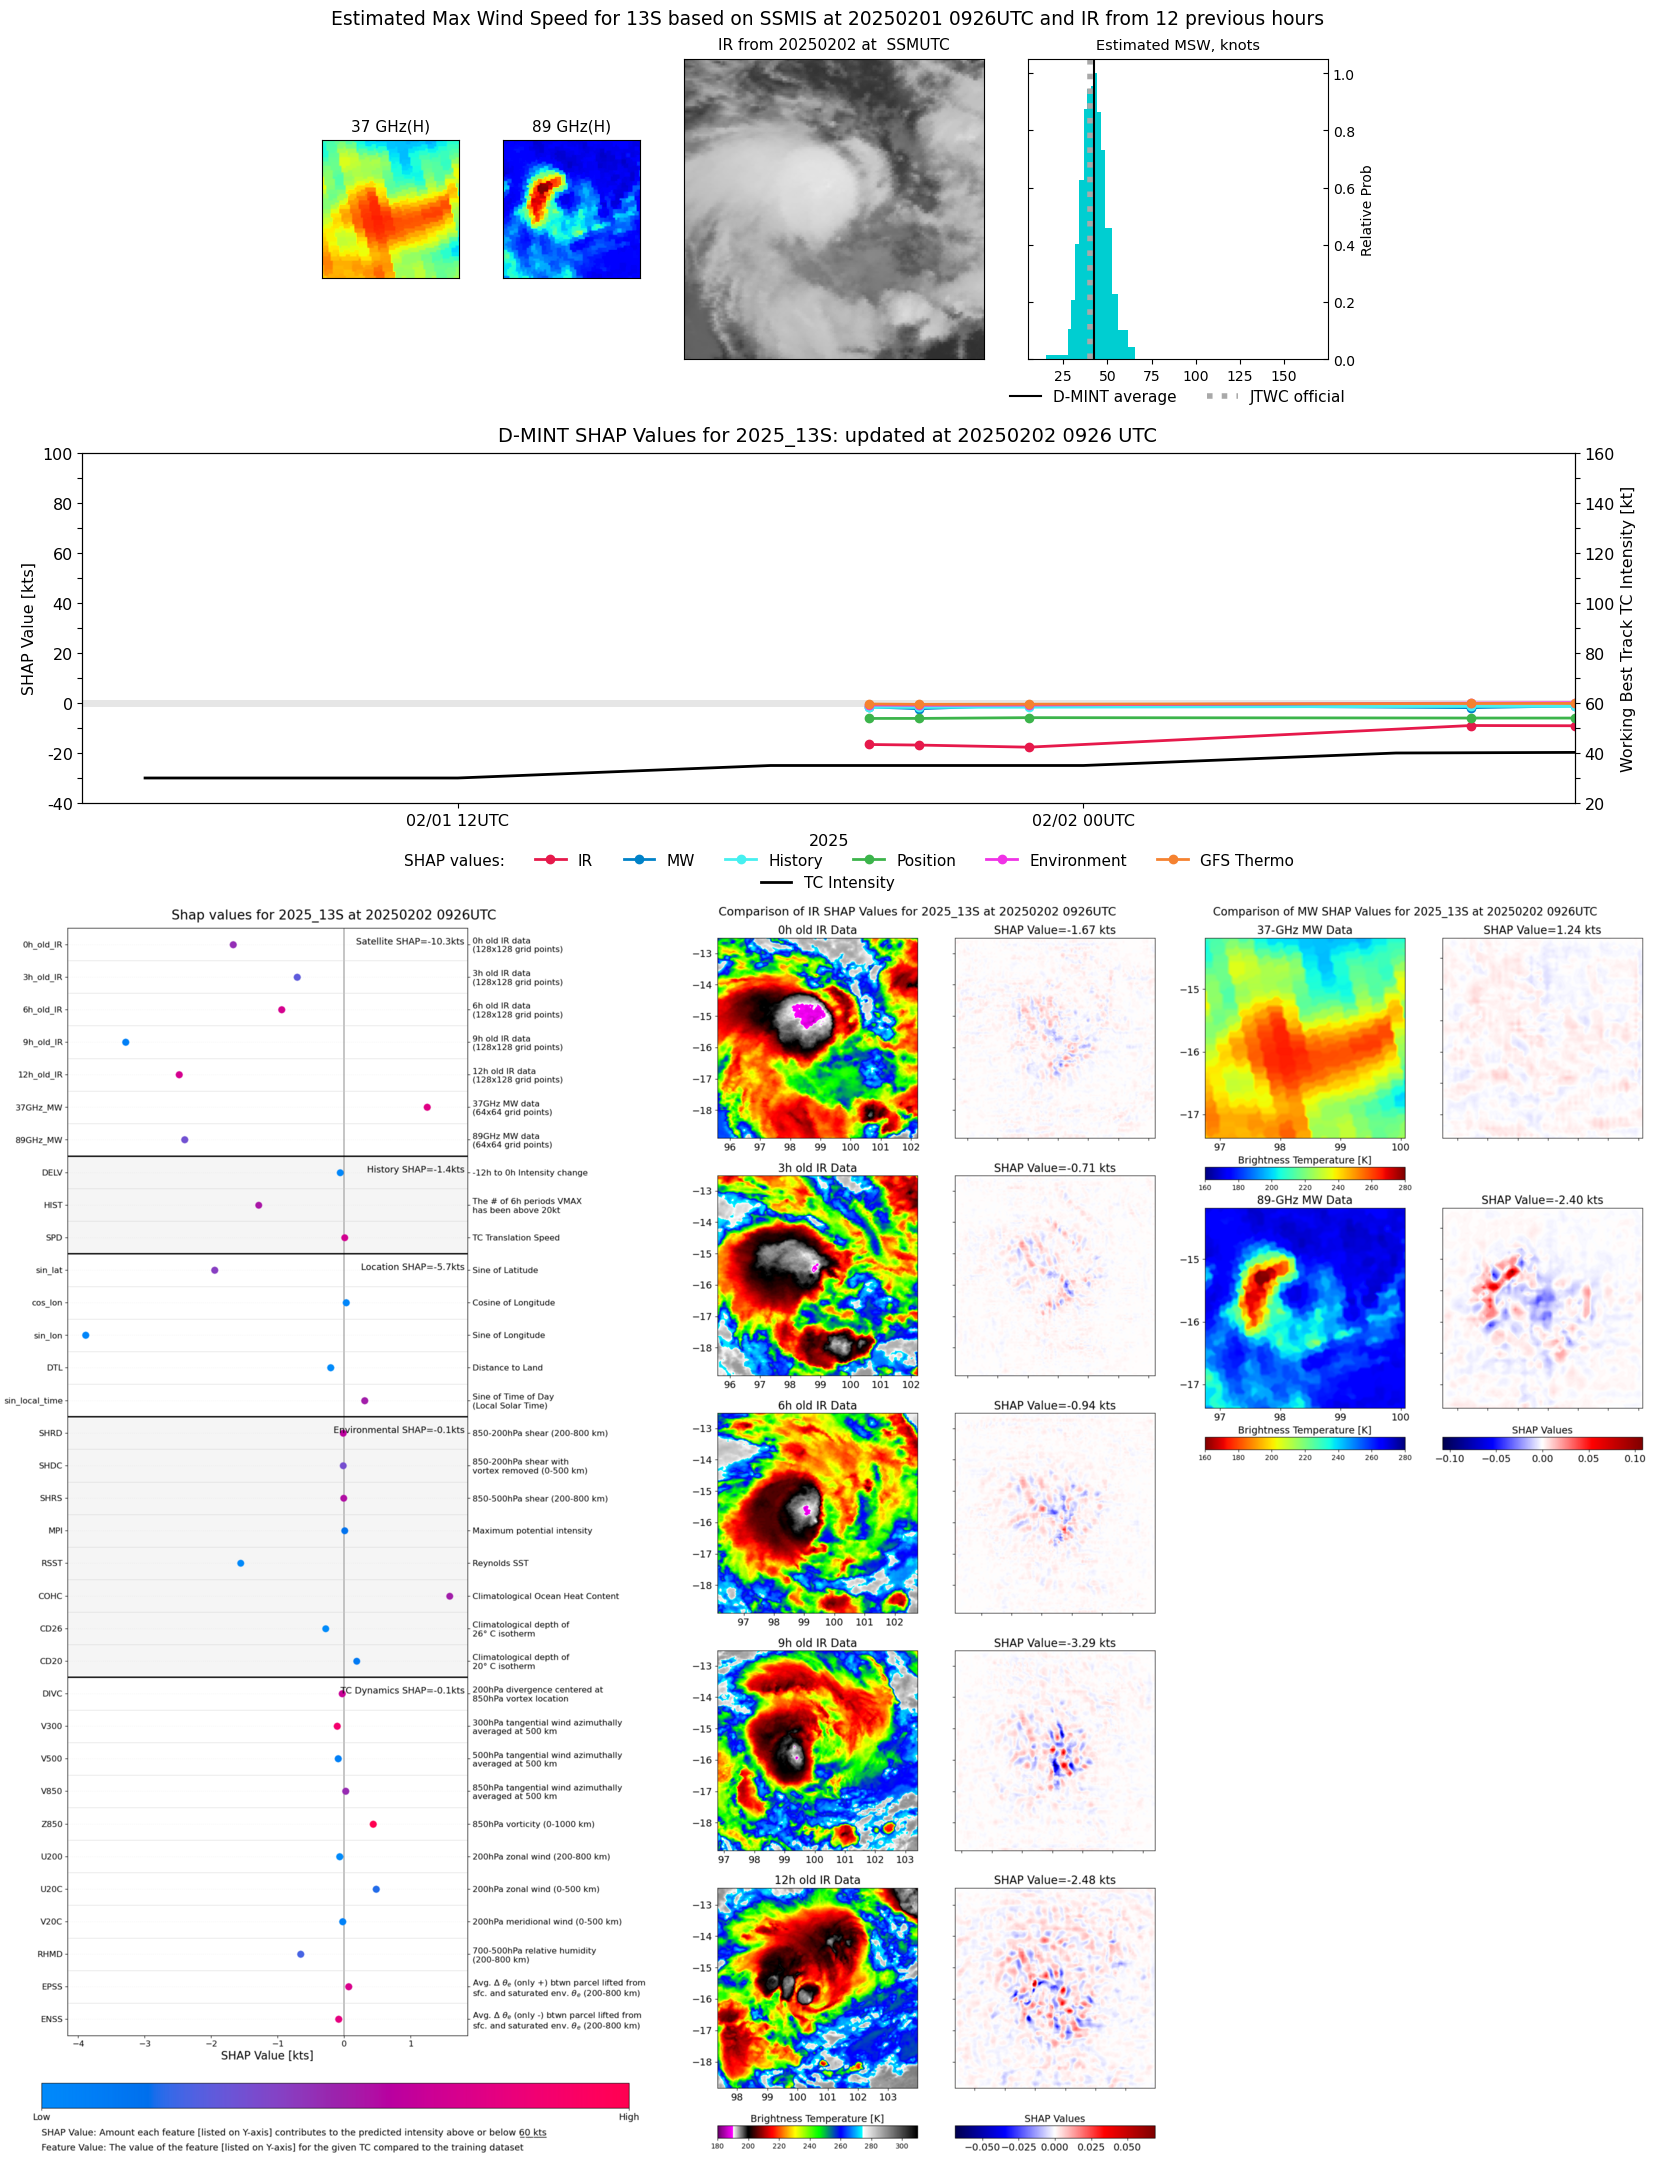 |
| 20250202 | 0913 UTC | GMI | 991 hPa | 40 kts | 36 kts | 45 kts | 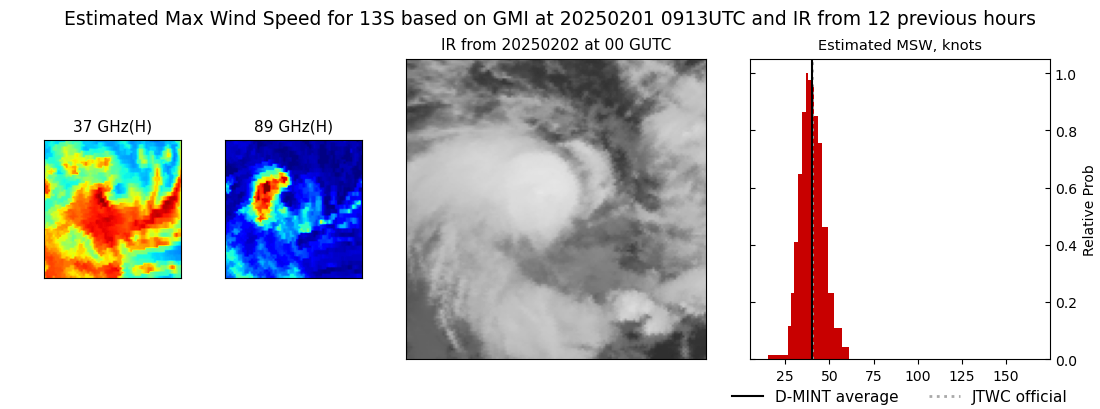 |
| 20250202 | 0911 UTC | TROPICS05 | 995 hPa | 38 kts | 34 kts | 43 kts | 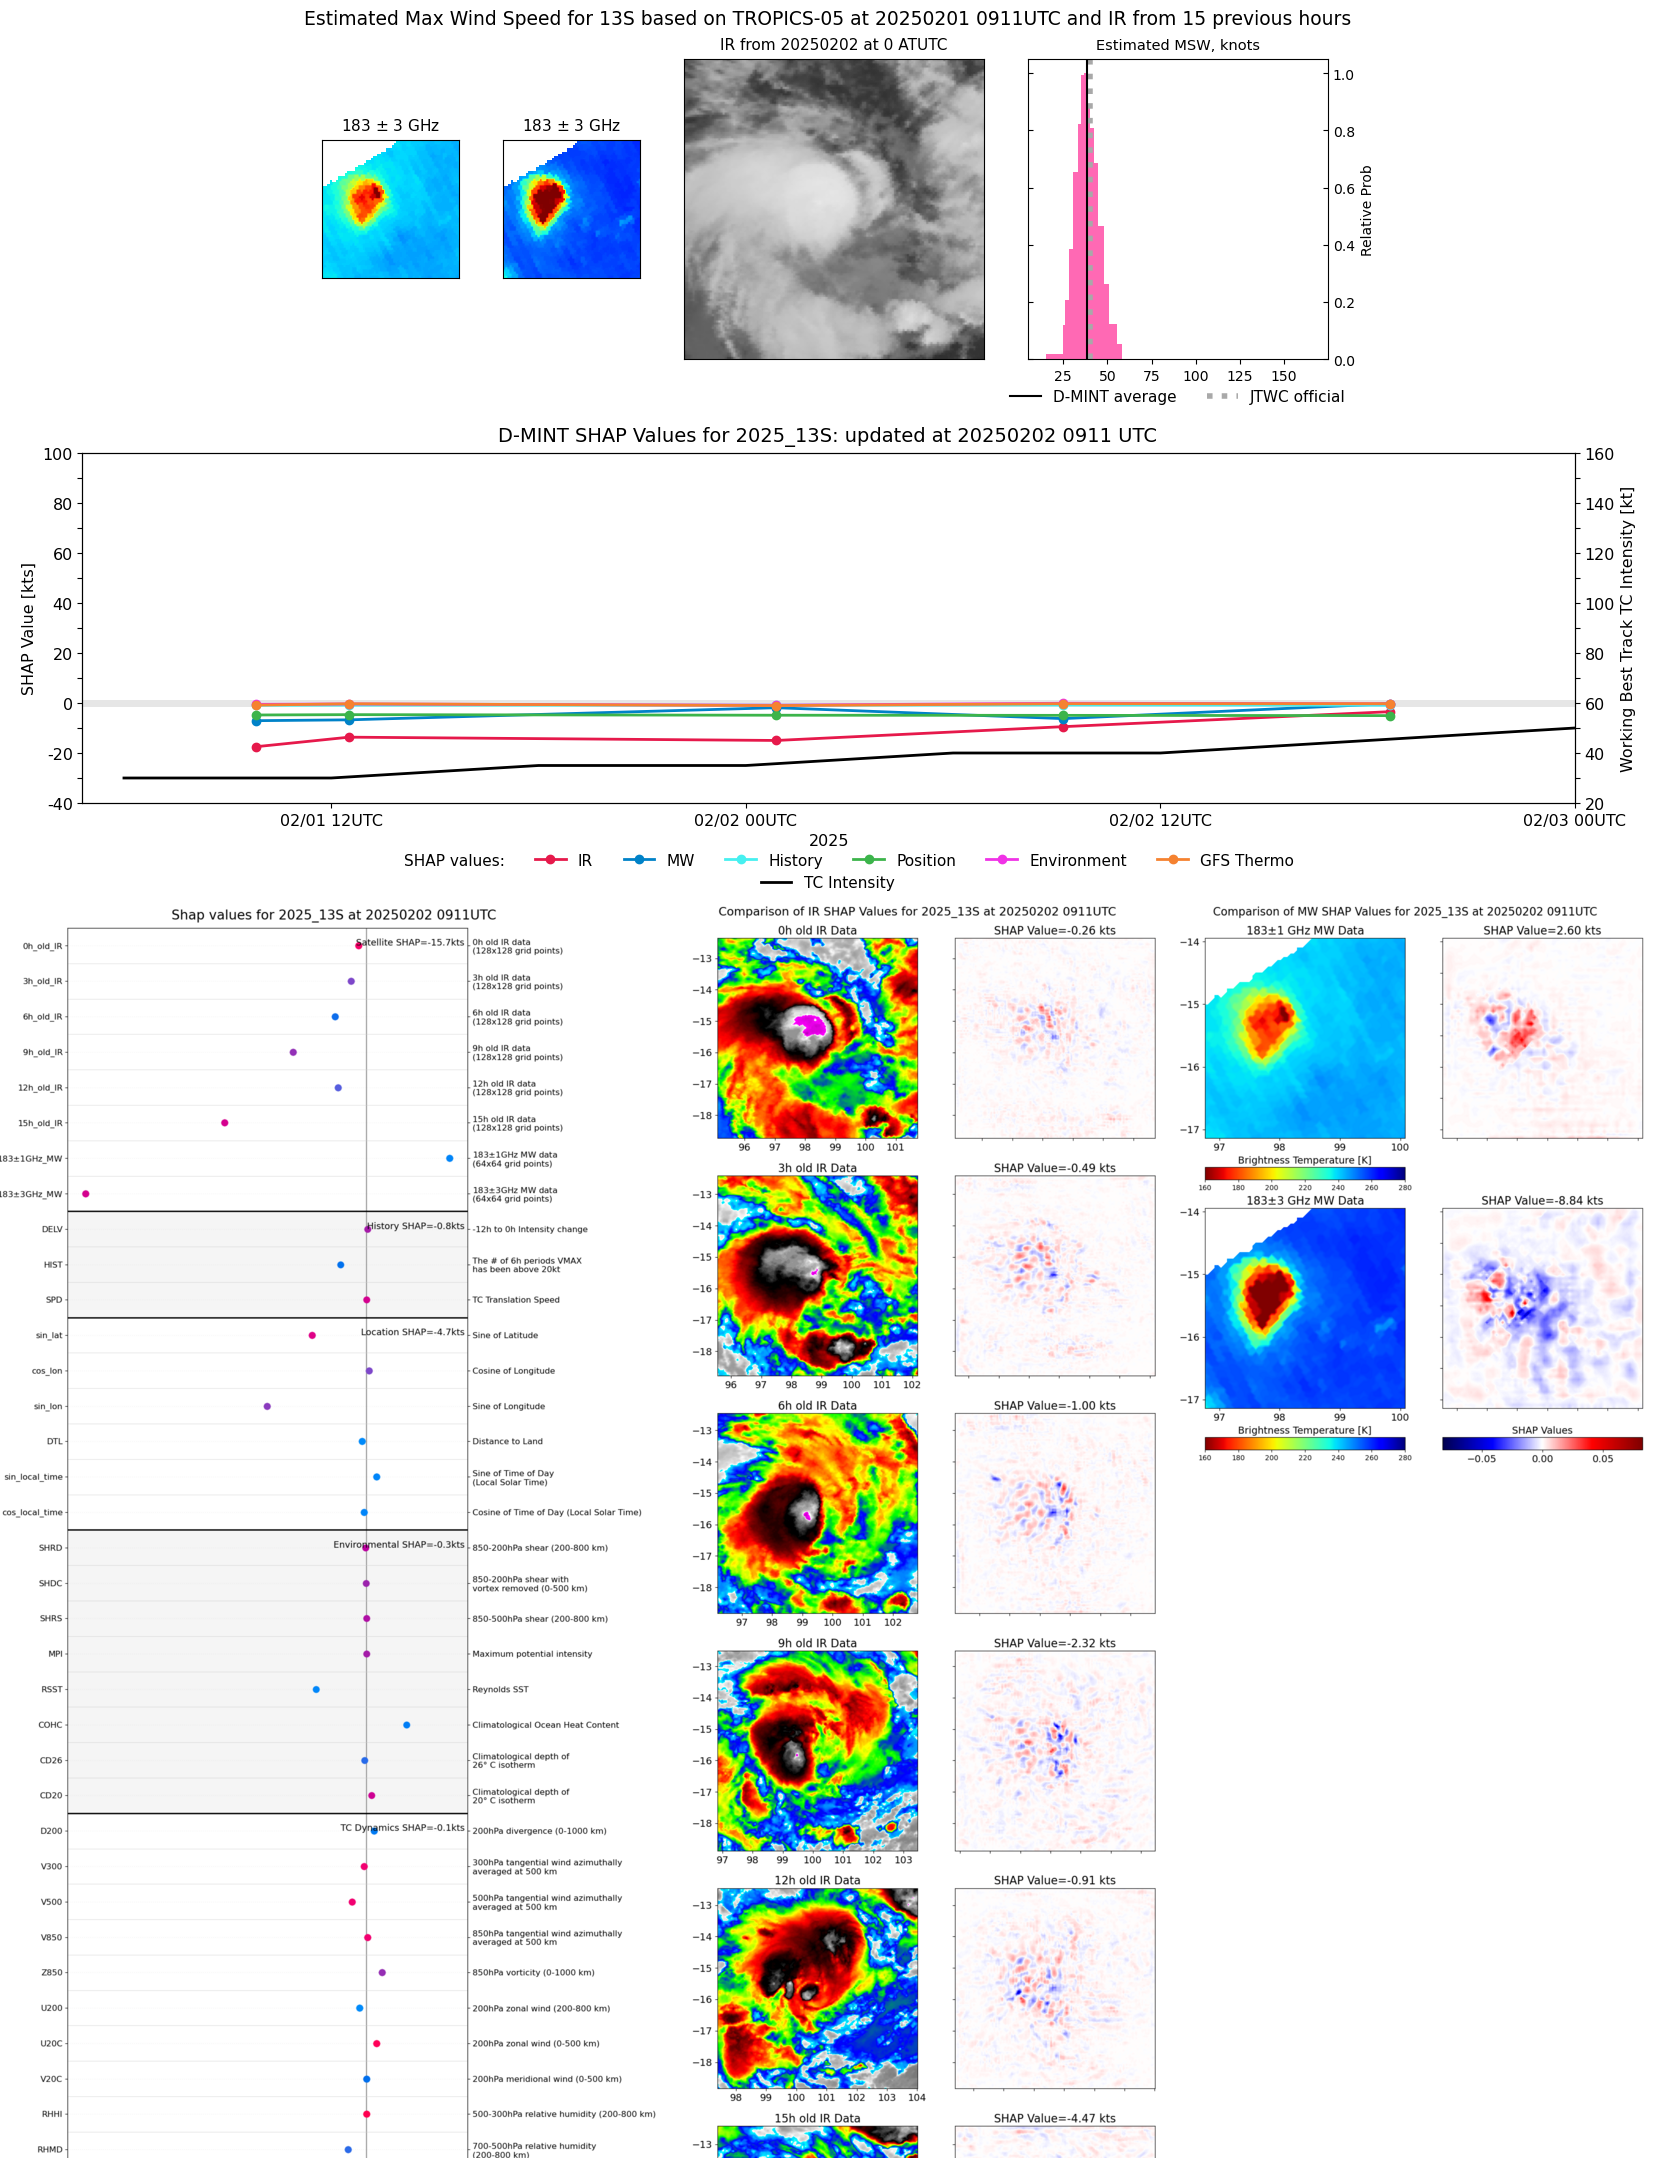 |
| 20250202 | 0726 UTC | AMSR2 | 991 hPa | 42 kts | 37 kts | 47 kts |  |
| 20250202 | 0053 UTC | TROPICS05 | 996 hPa | 36 kts | 32 kts | 40 kts | 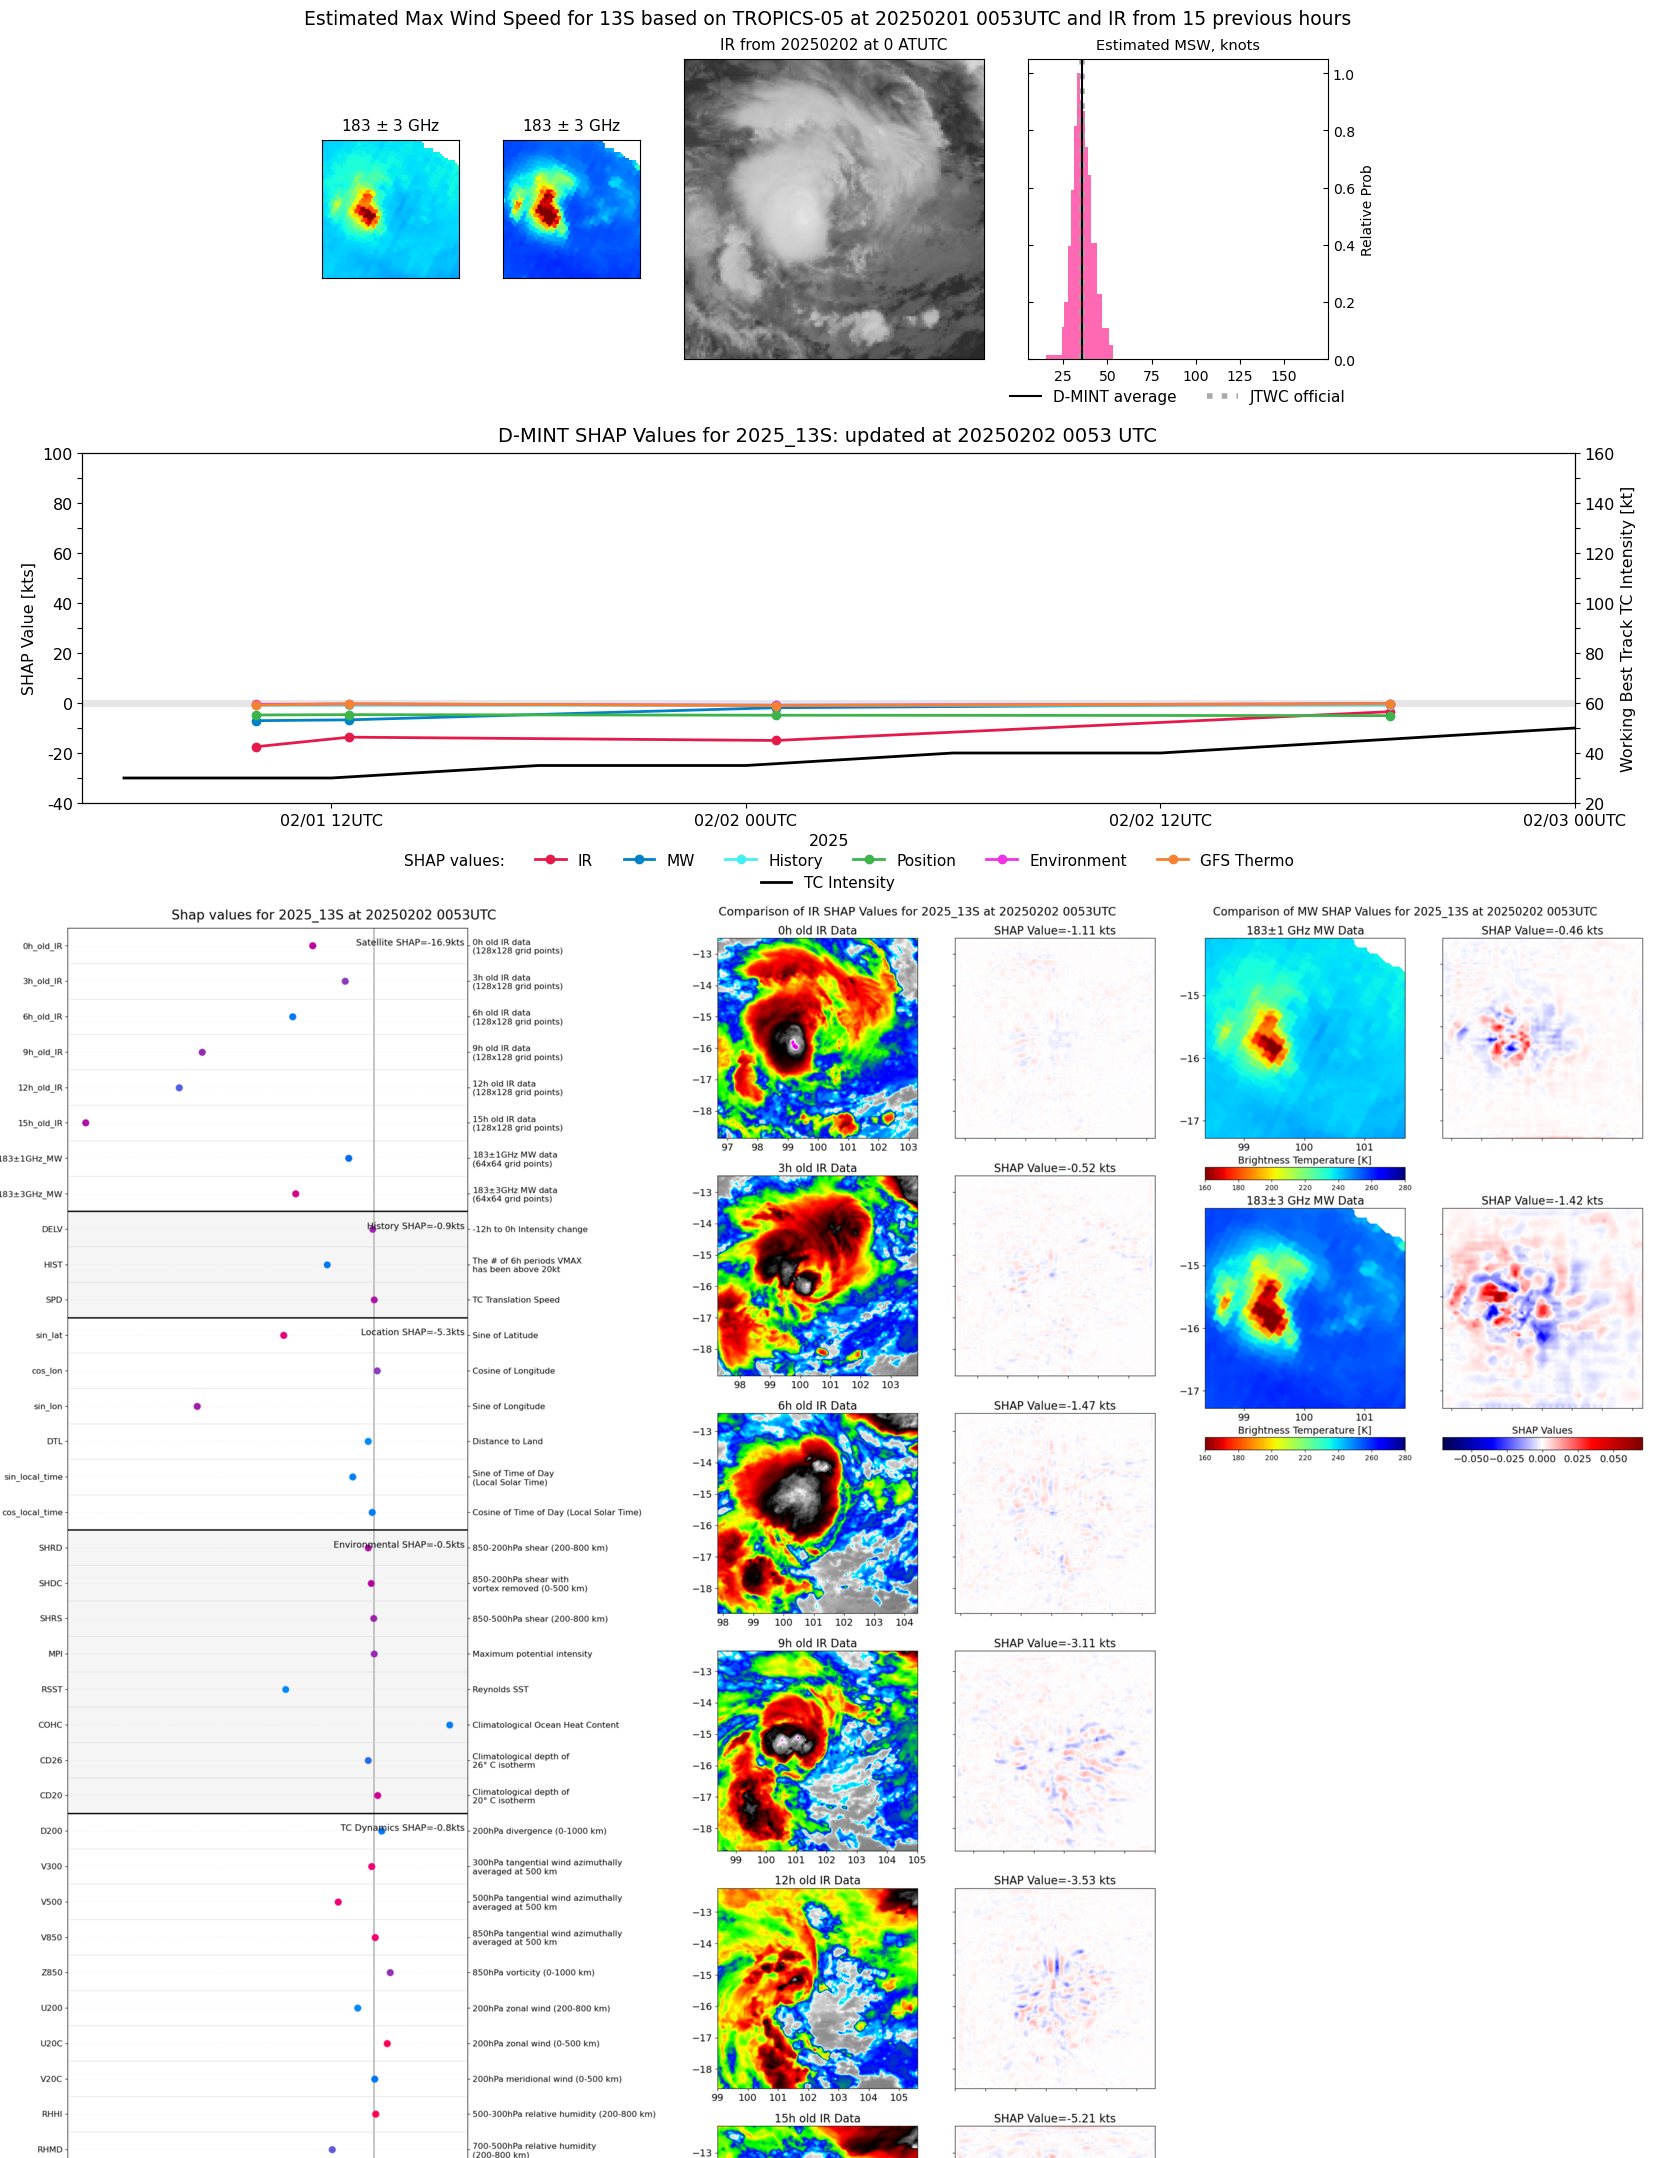 |
| 20250201 | 2331 UTC | SSMISF16 | 994 hPa | 33 kts | 28 kts | 37 kts | 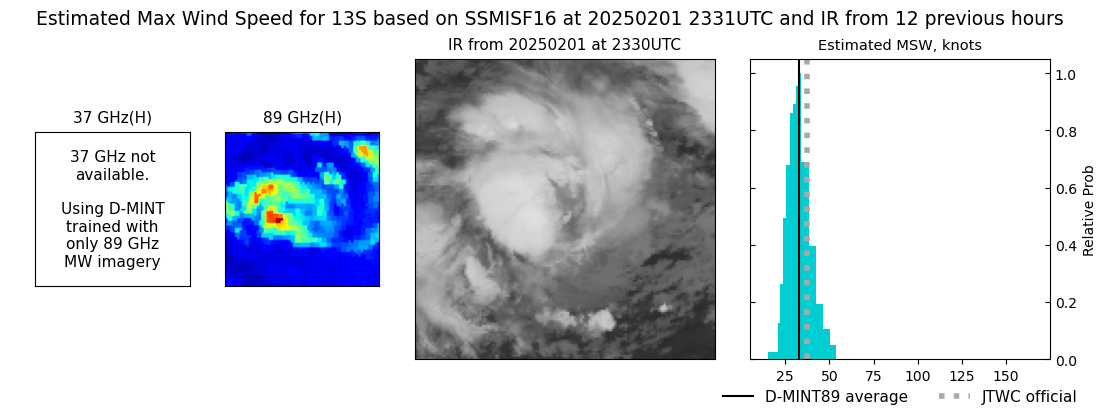 |
| 20250201 | 2257 UTC | SSMISF17 | 993 hPa | 33 kts | 29 kts | 37 kts | 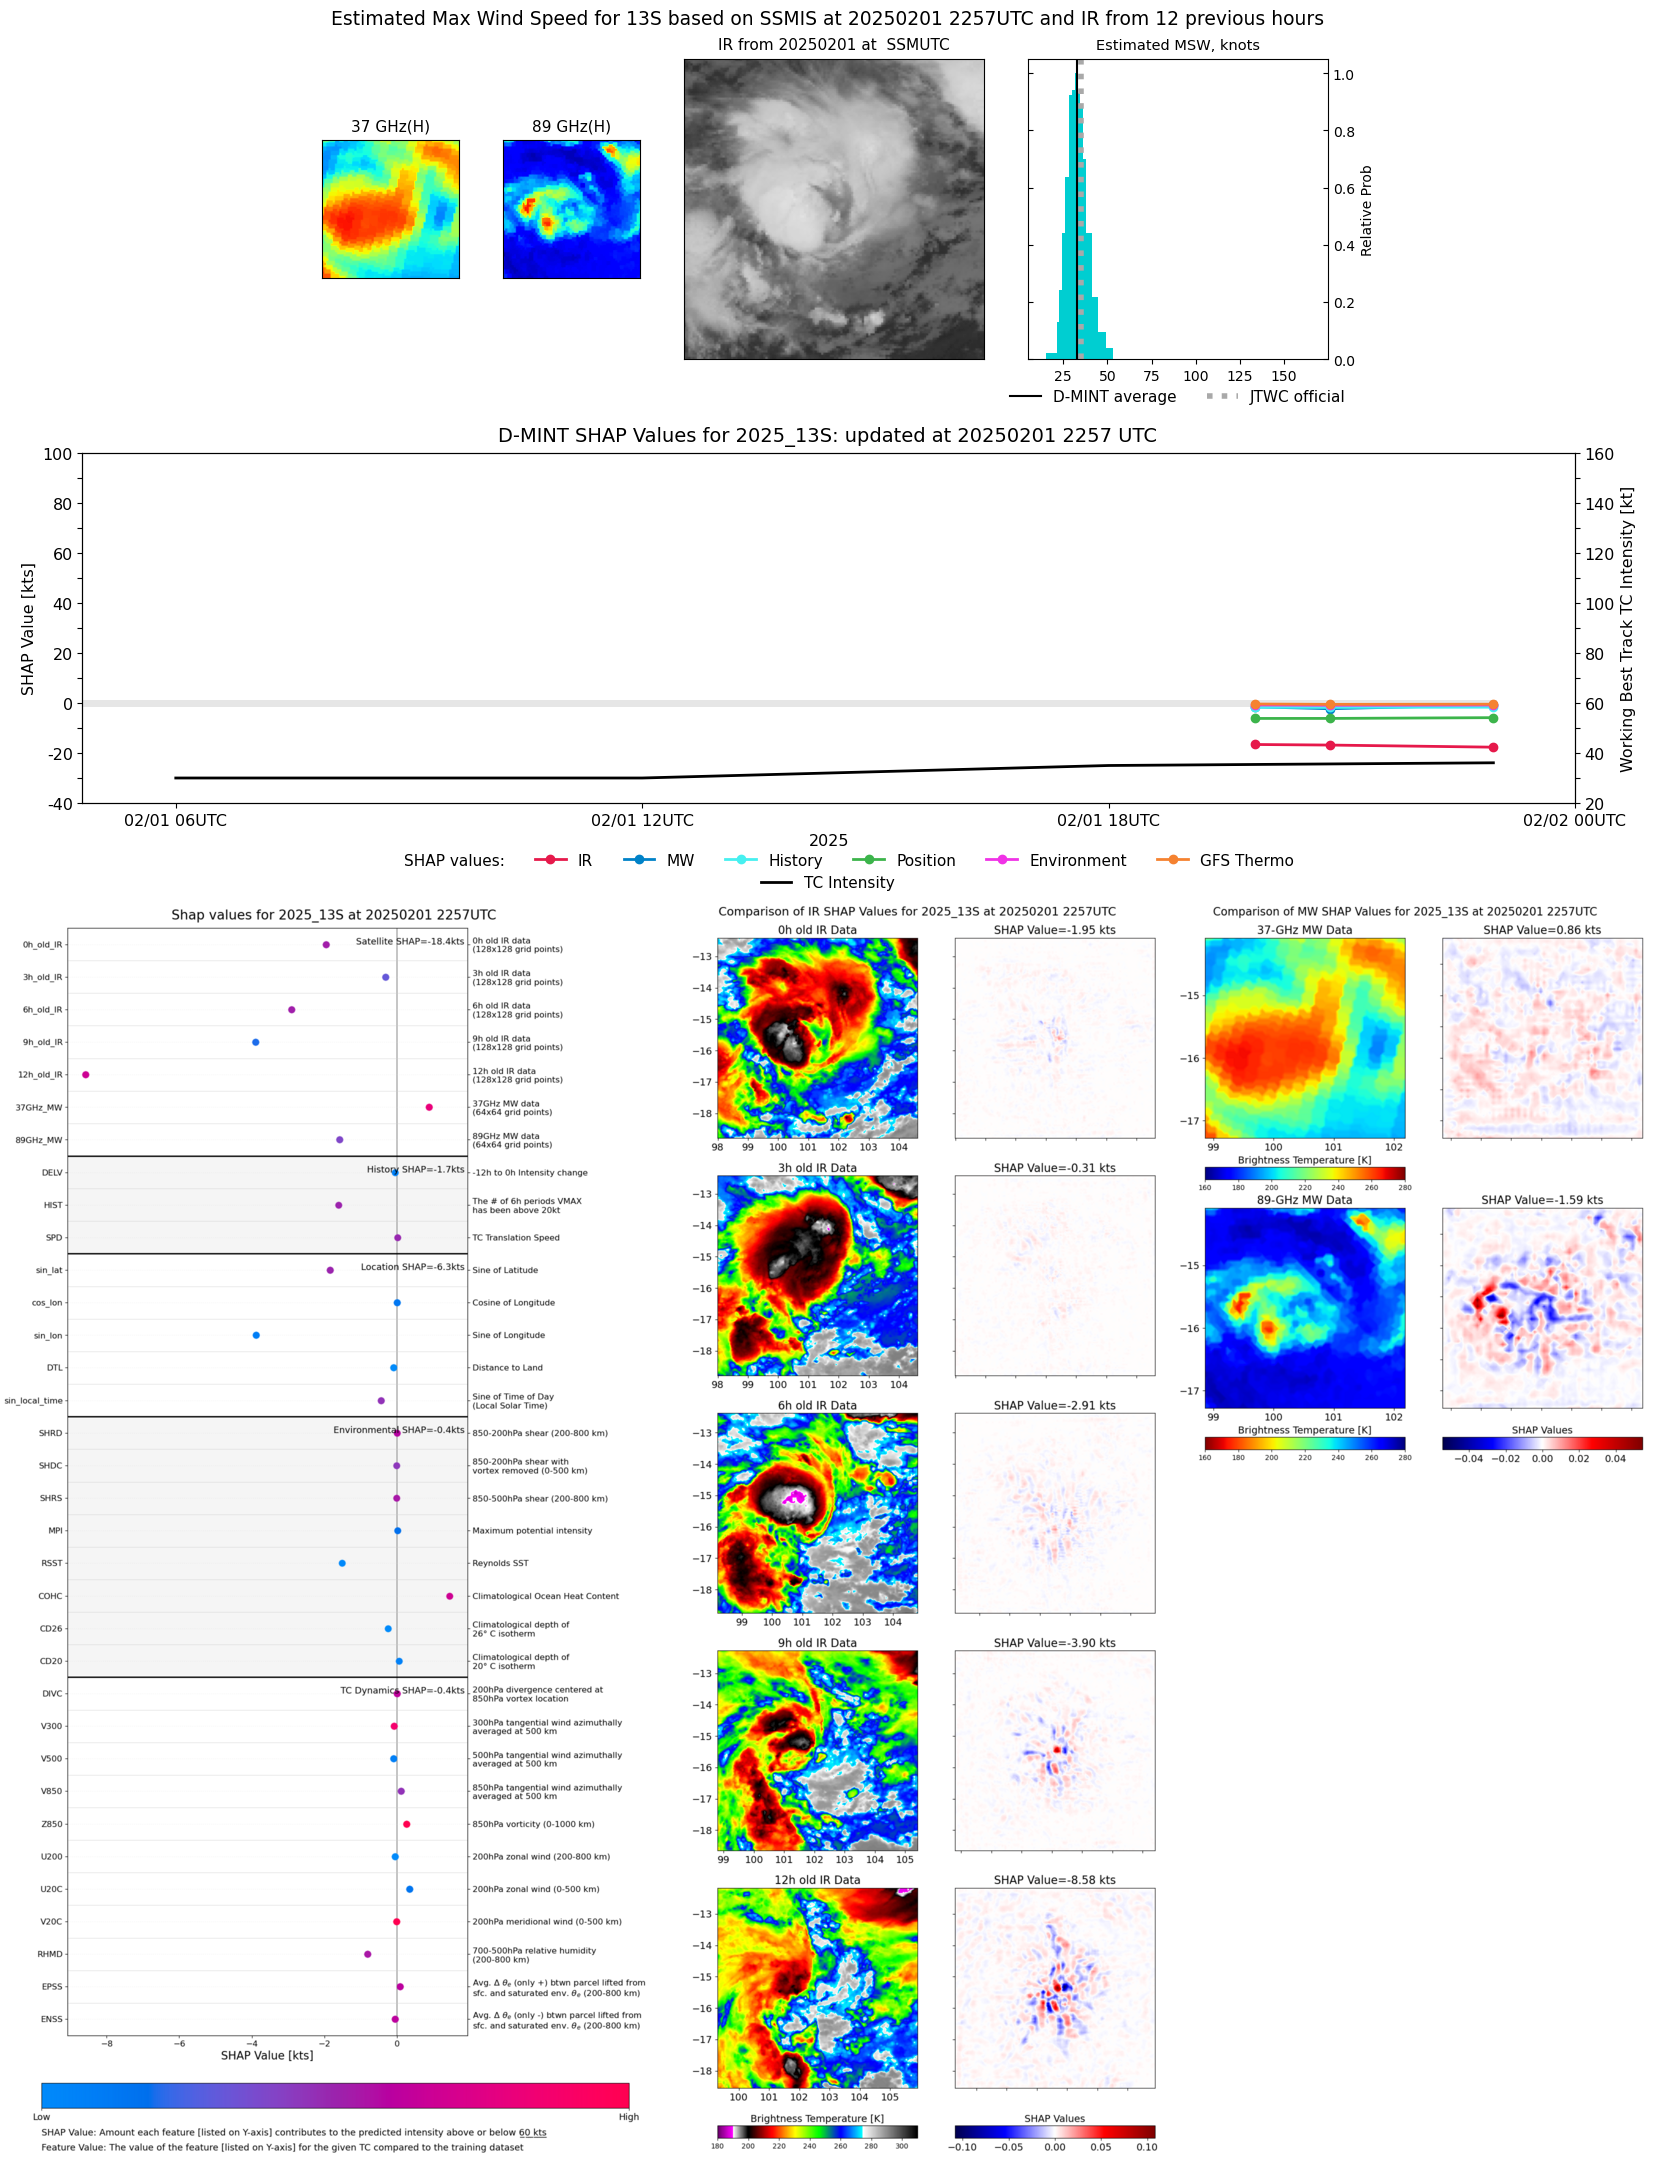 |
| 20250201 | 2051 UTC | SSMISF18 | 993 hPa | 32 kts | 28 kts | 36 kts | 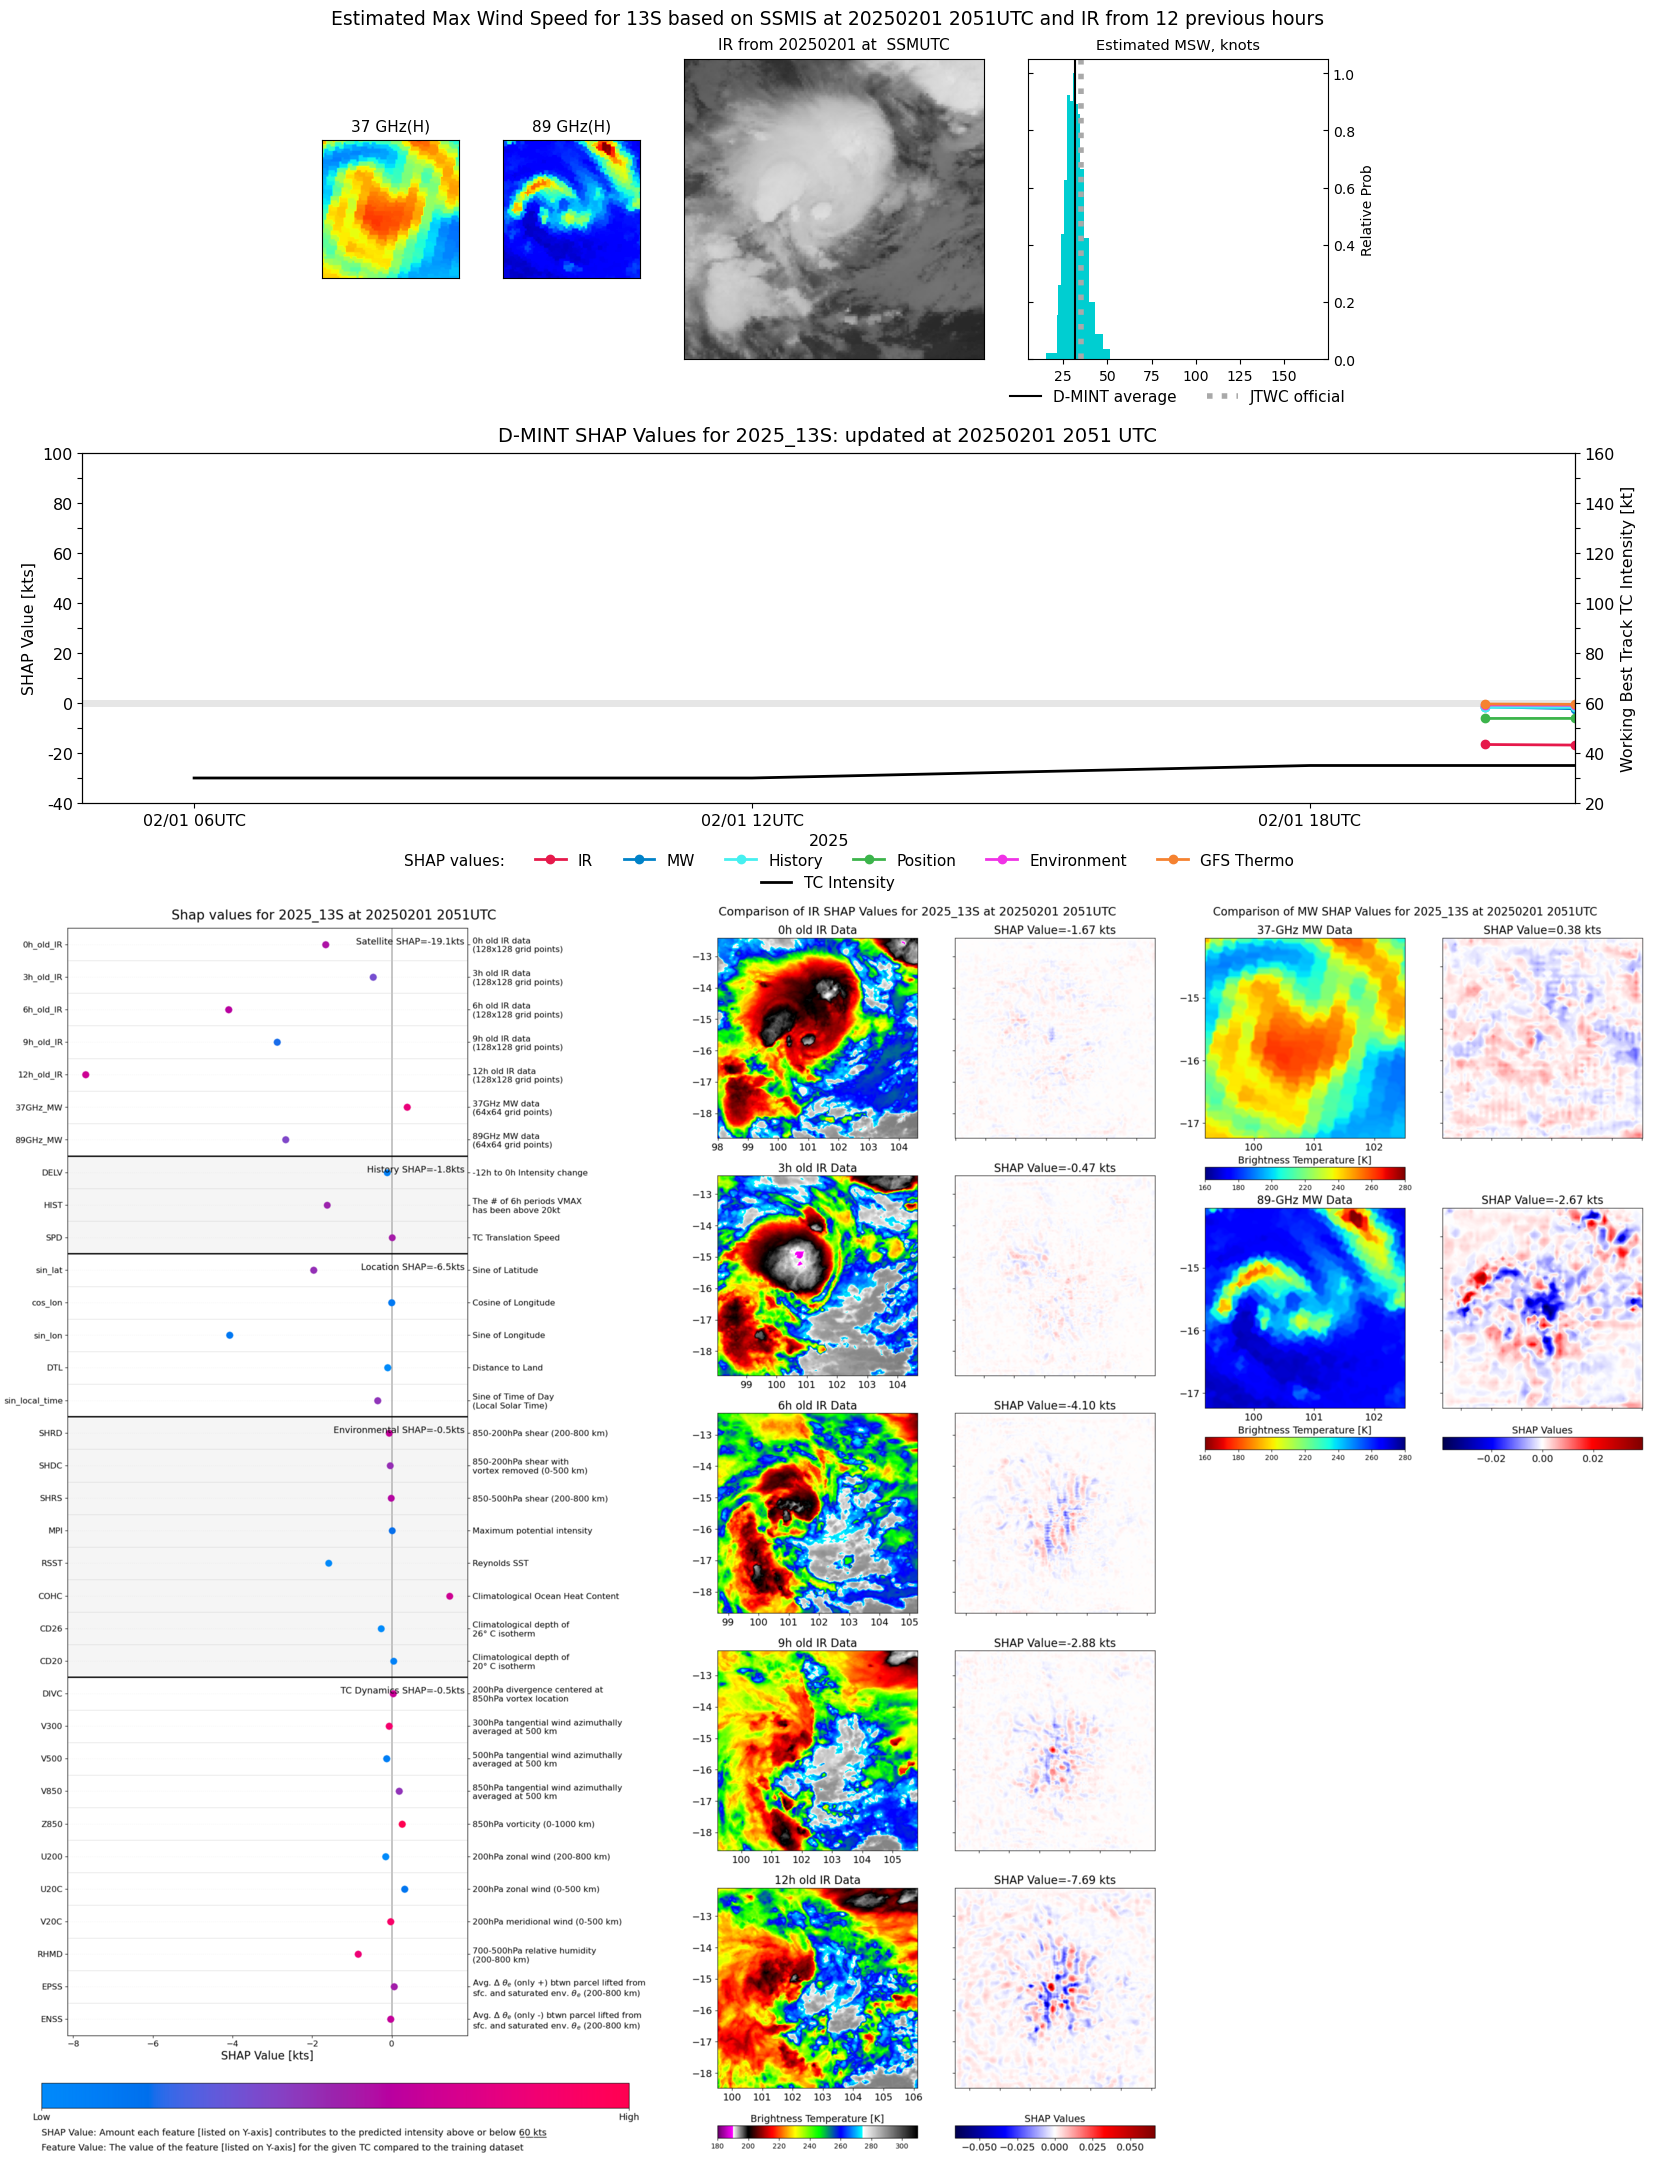 |
| 20250201 | 2049 UTC | TROPICS03 | 996 hPa | 36 kts | 31 kts | 41 kts | 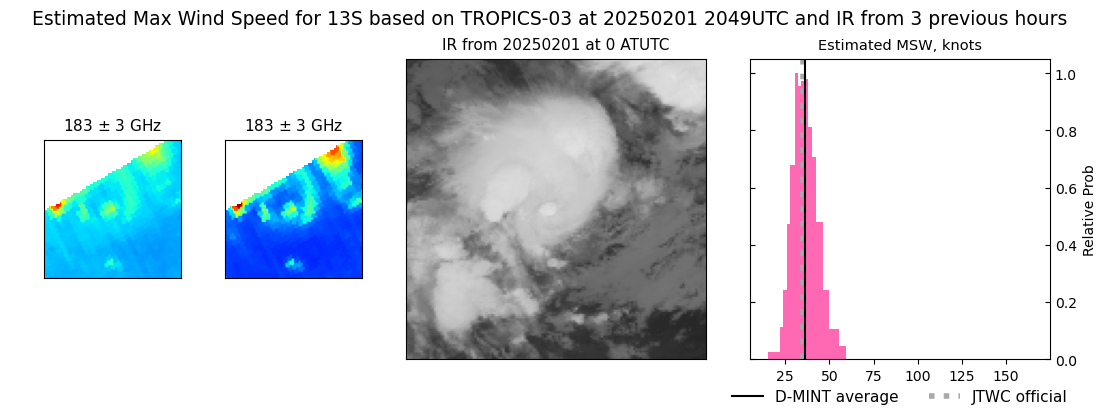 |
| 20250201 | 1953 UTC | GMI | 994 hPa | 33 kts | 29 kts | 37 kts | 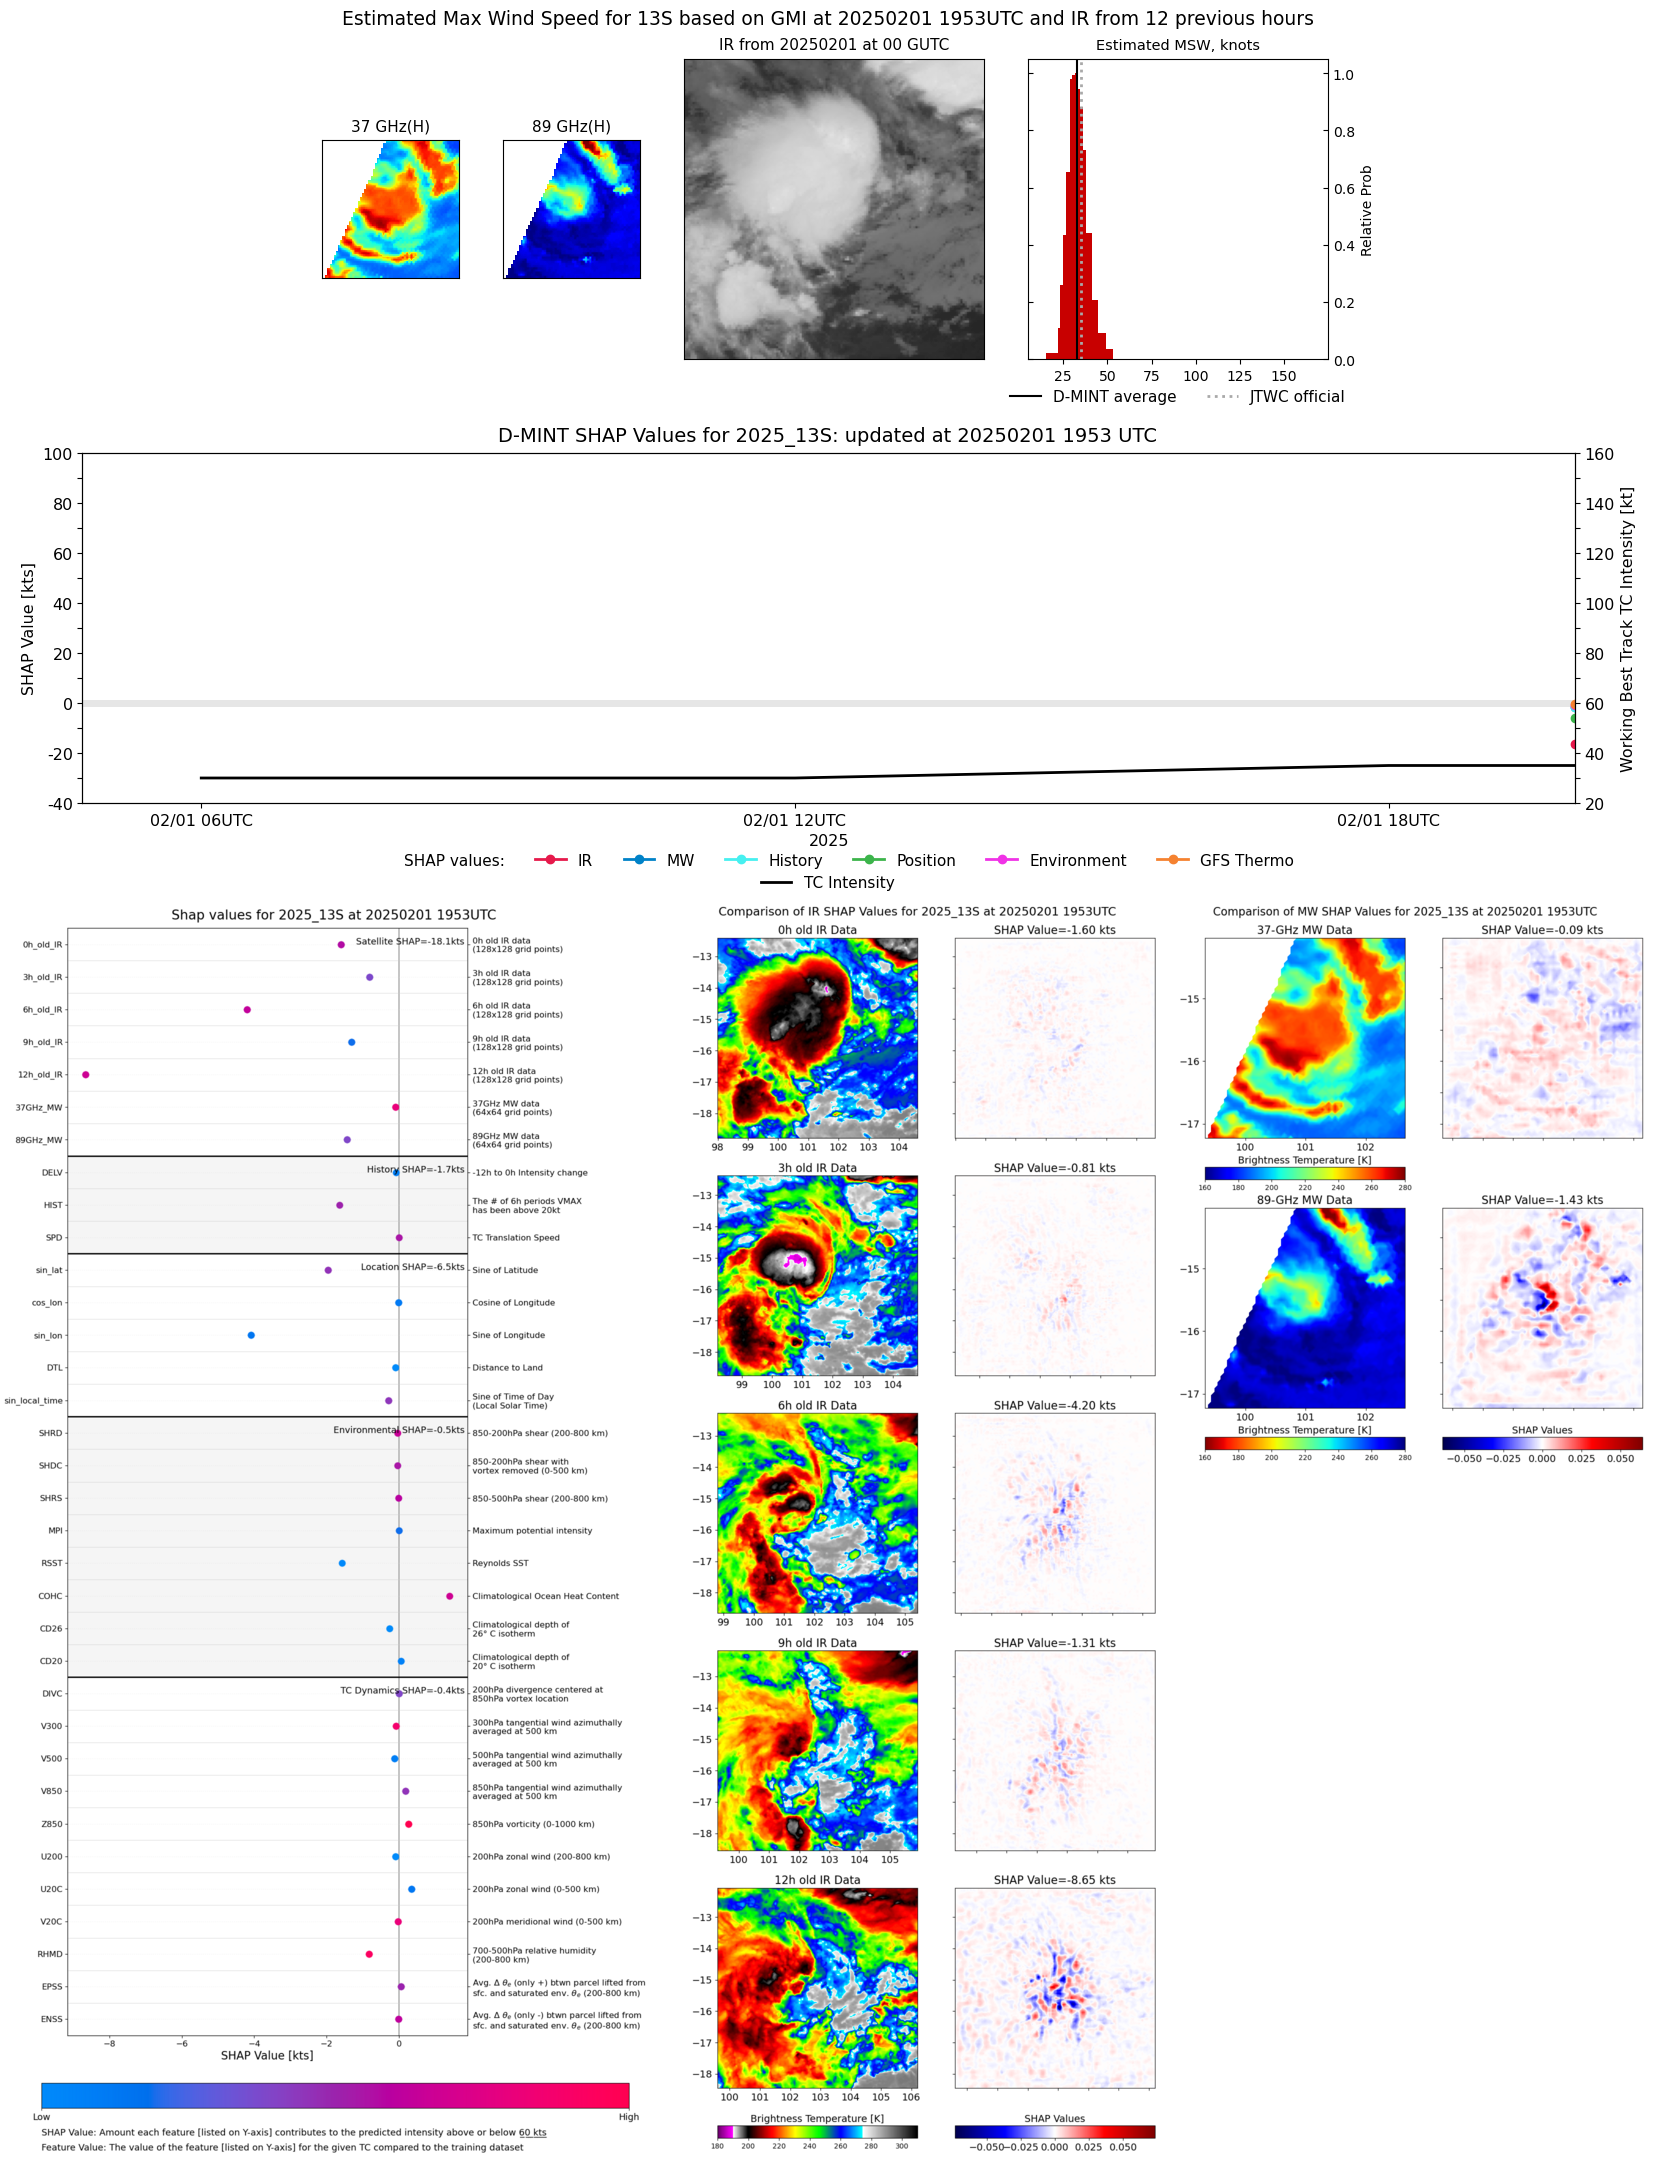 |
| 20250201 | 1231 UTC | TROPICS03 | 994 hPa | 34 kts | 30 kts | 38 kts | 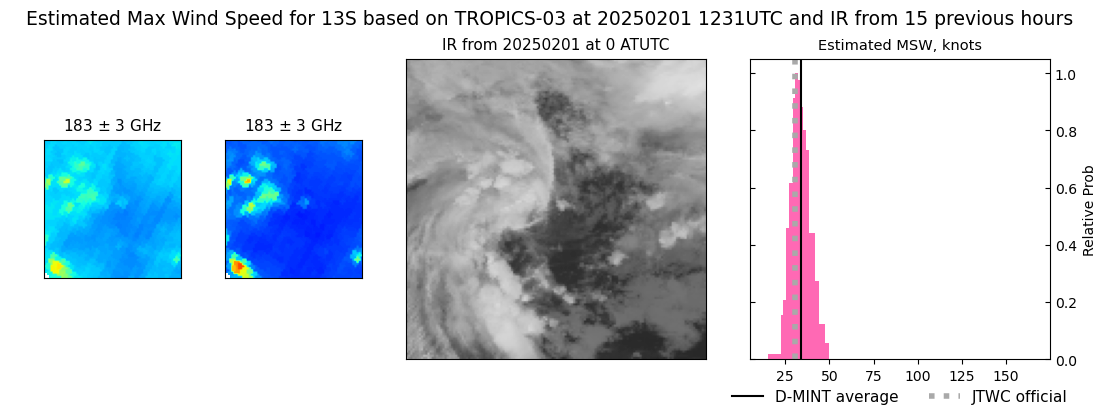 |
| 20250201 | 0950 UTC | TROPICS05 | 995 hPa | 29 kts | 26 kts | 32 kts | 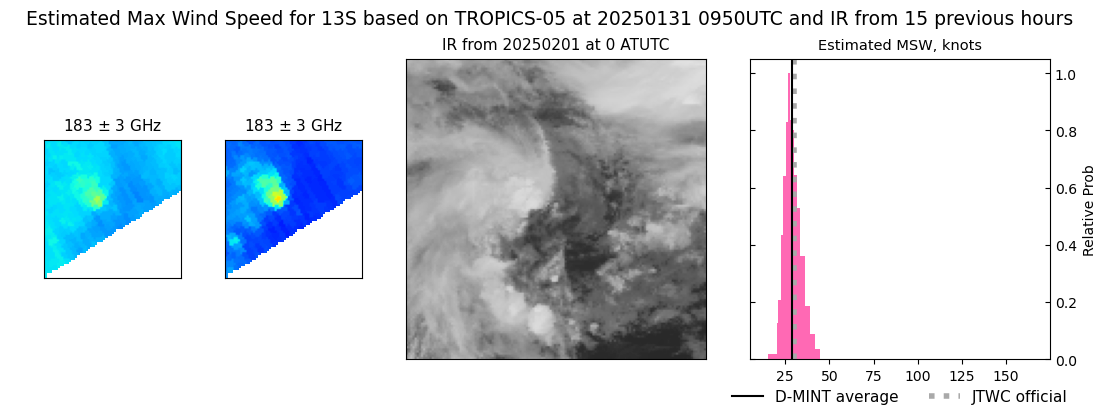 |