|
||

 |
D-MINT HISTORY FILE for 2025_13W
| Date | Time | MW Sensor | MSLP | Vmax (30th-70th percentile average) | Vmax 25th percentile | Vmax 75th percentile | Image |
| 20250806 | 2023 UTC | GMI | 1000 hPa | 21 kts | 20 kts | 22 kts | 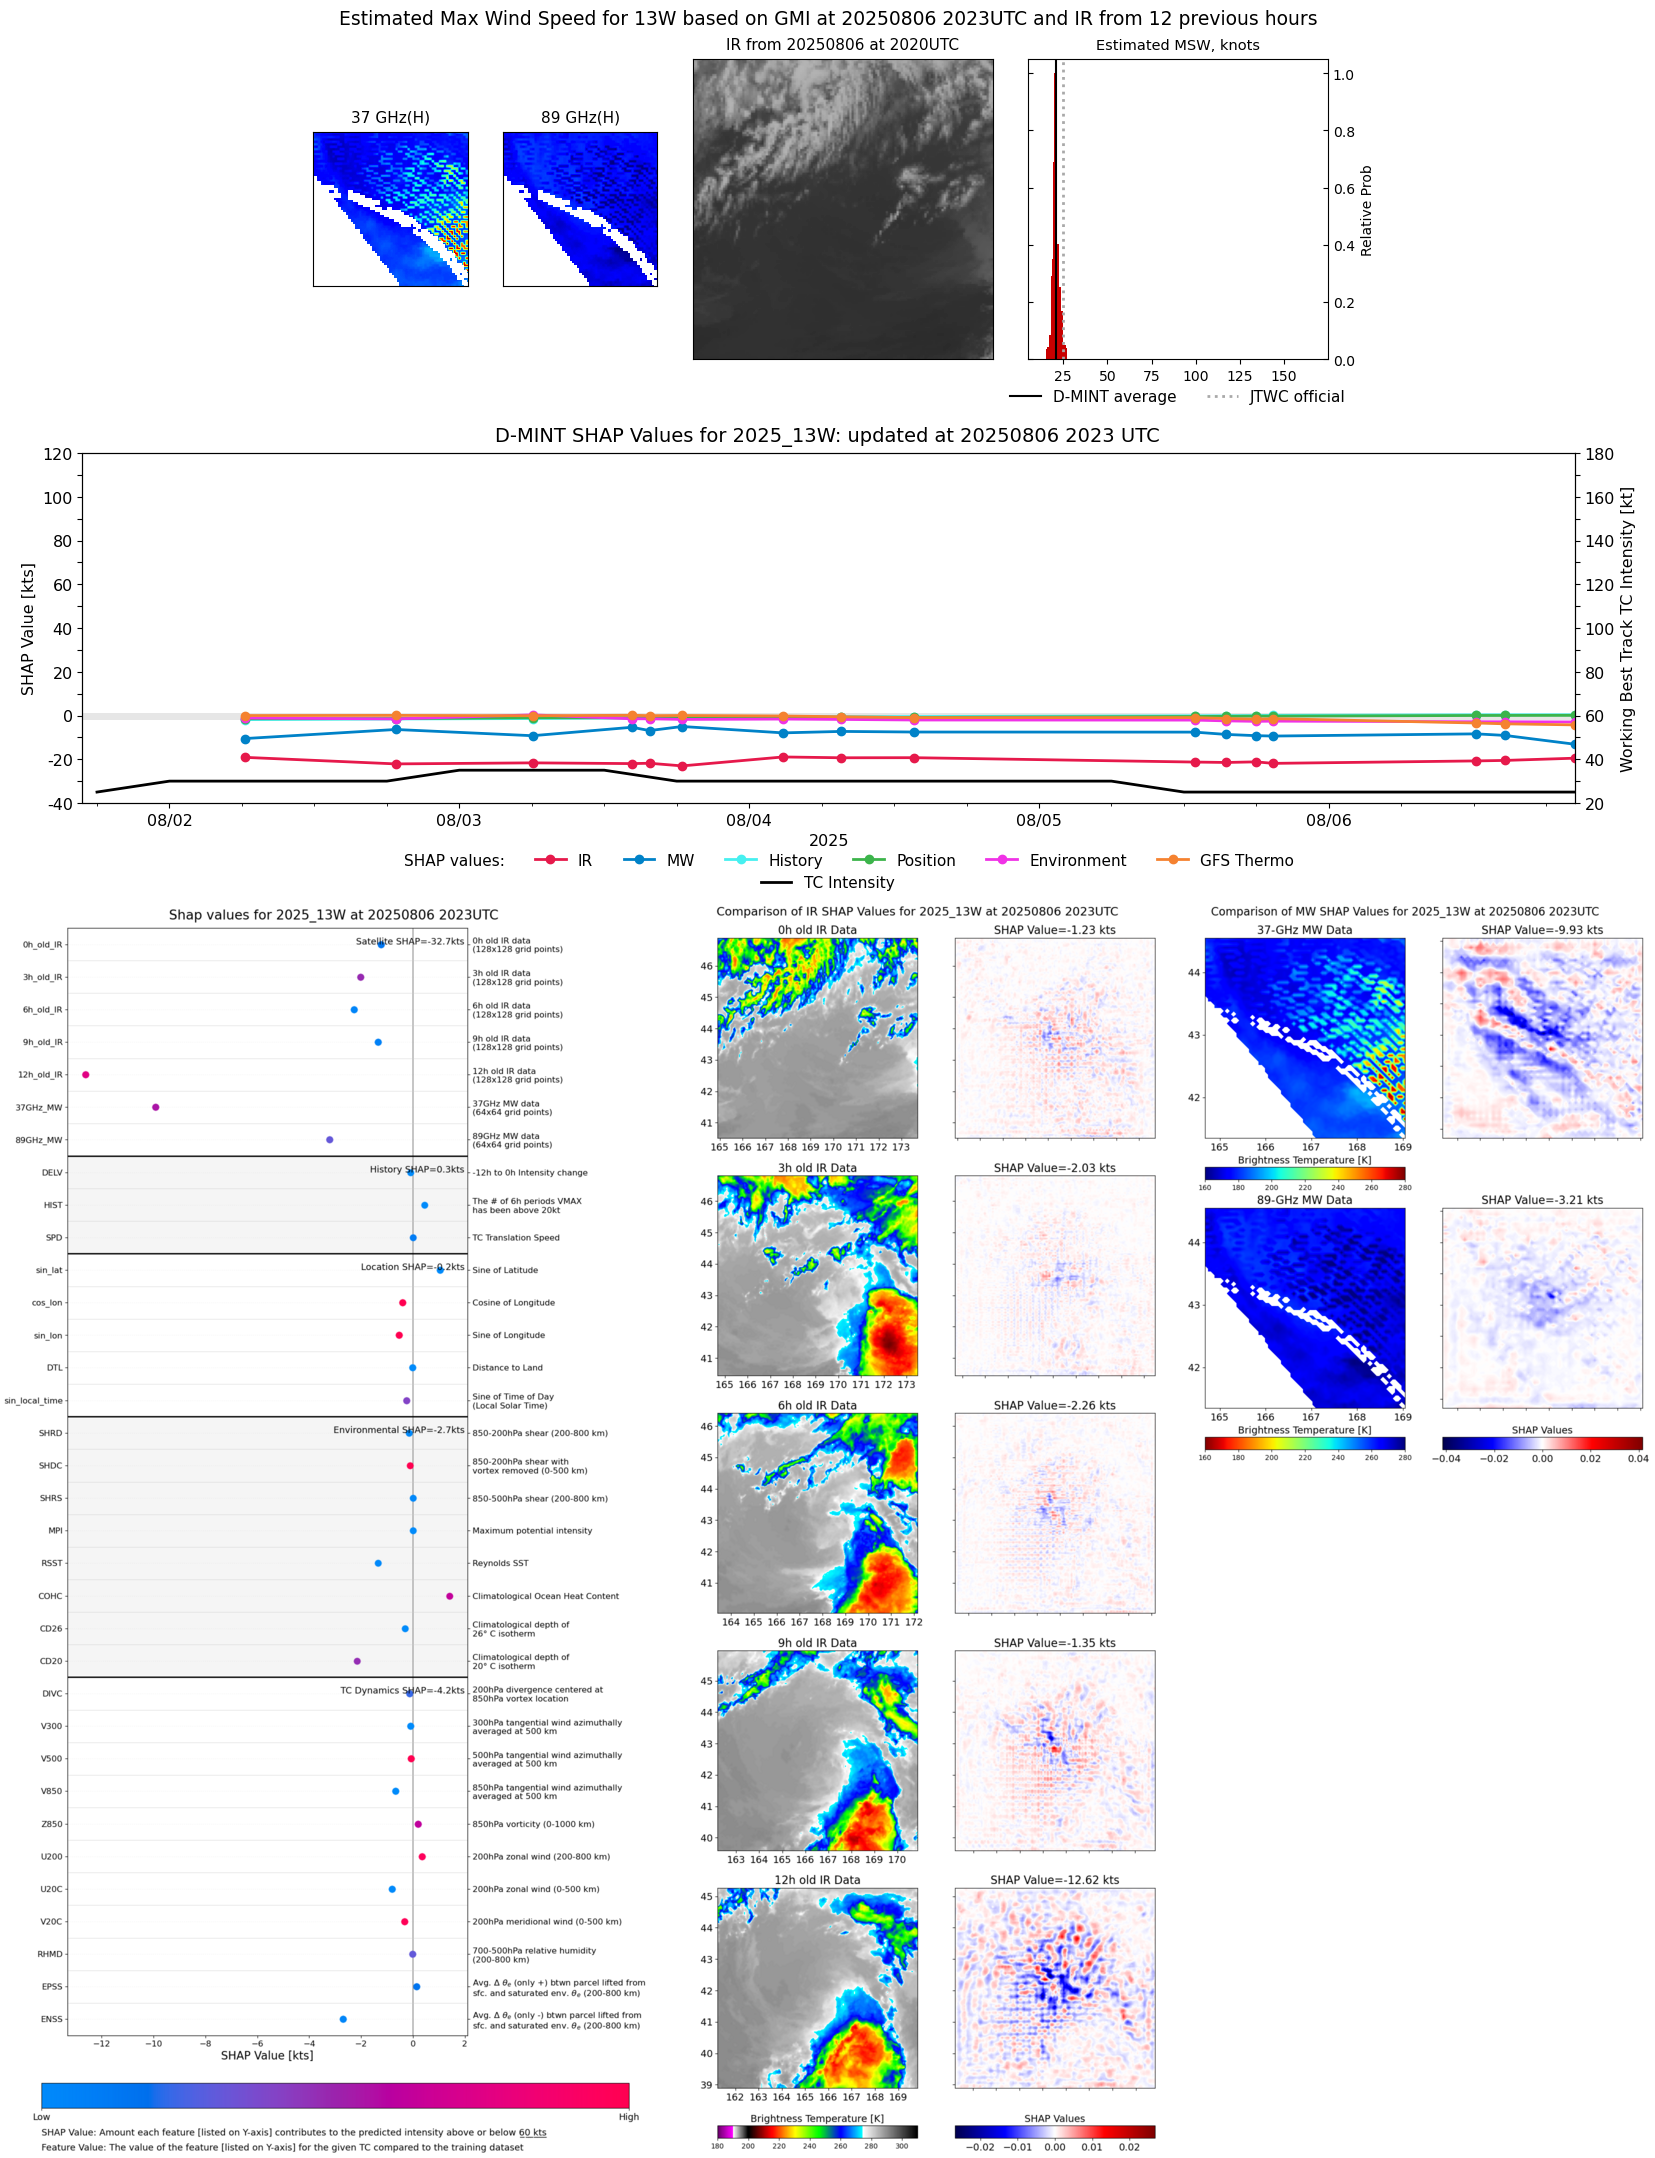 |
| 20250806 | 1506 UTC | ATMS-N21 | 999 hPa | 26 kts | 24 kts | 29 kts | 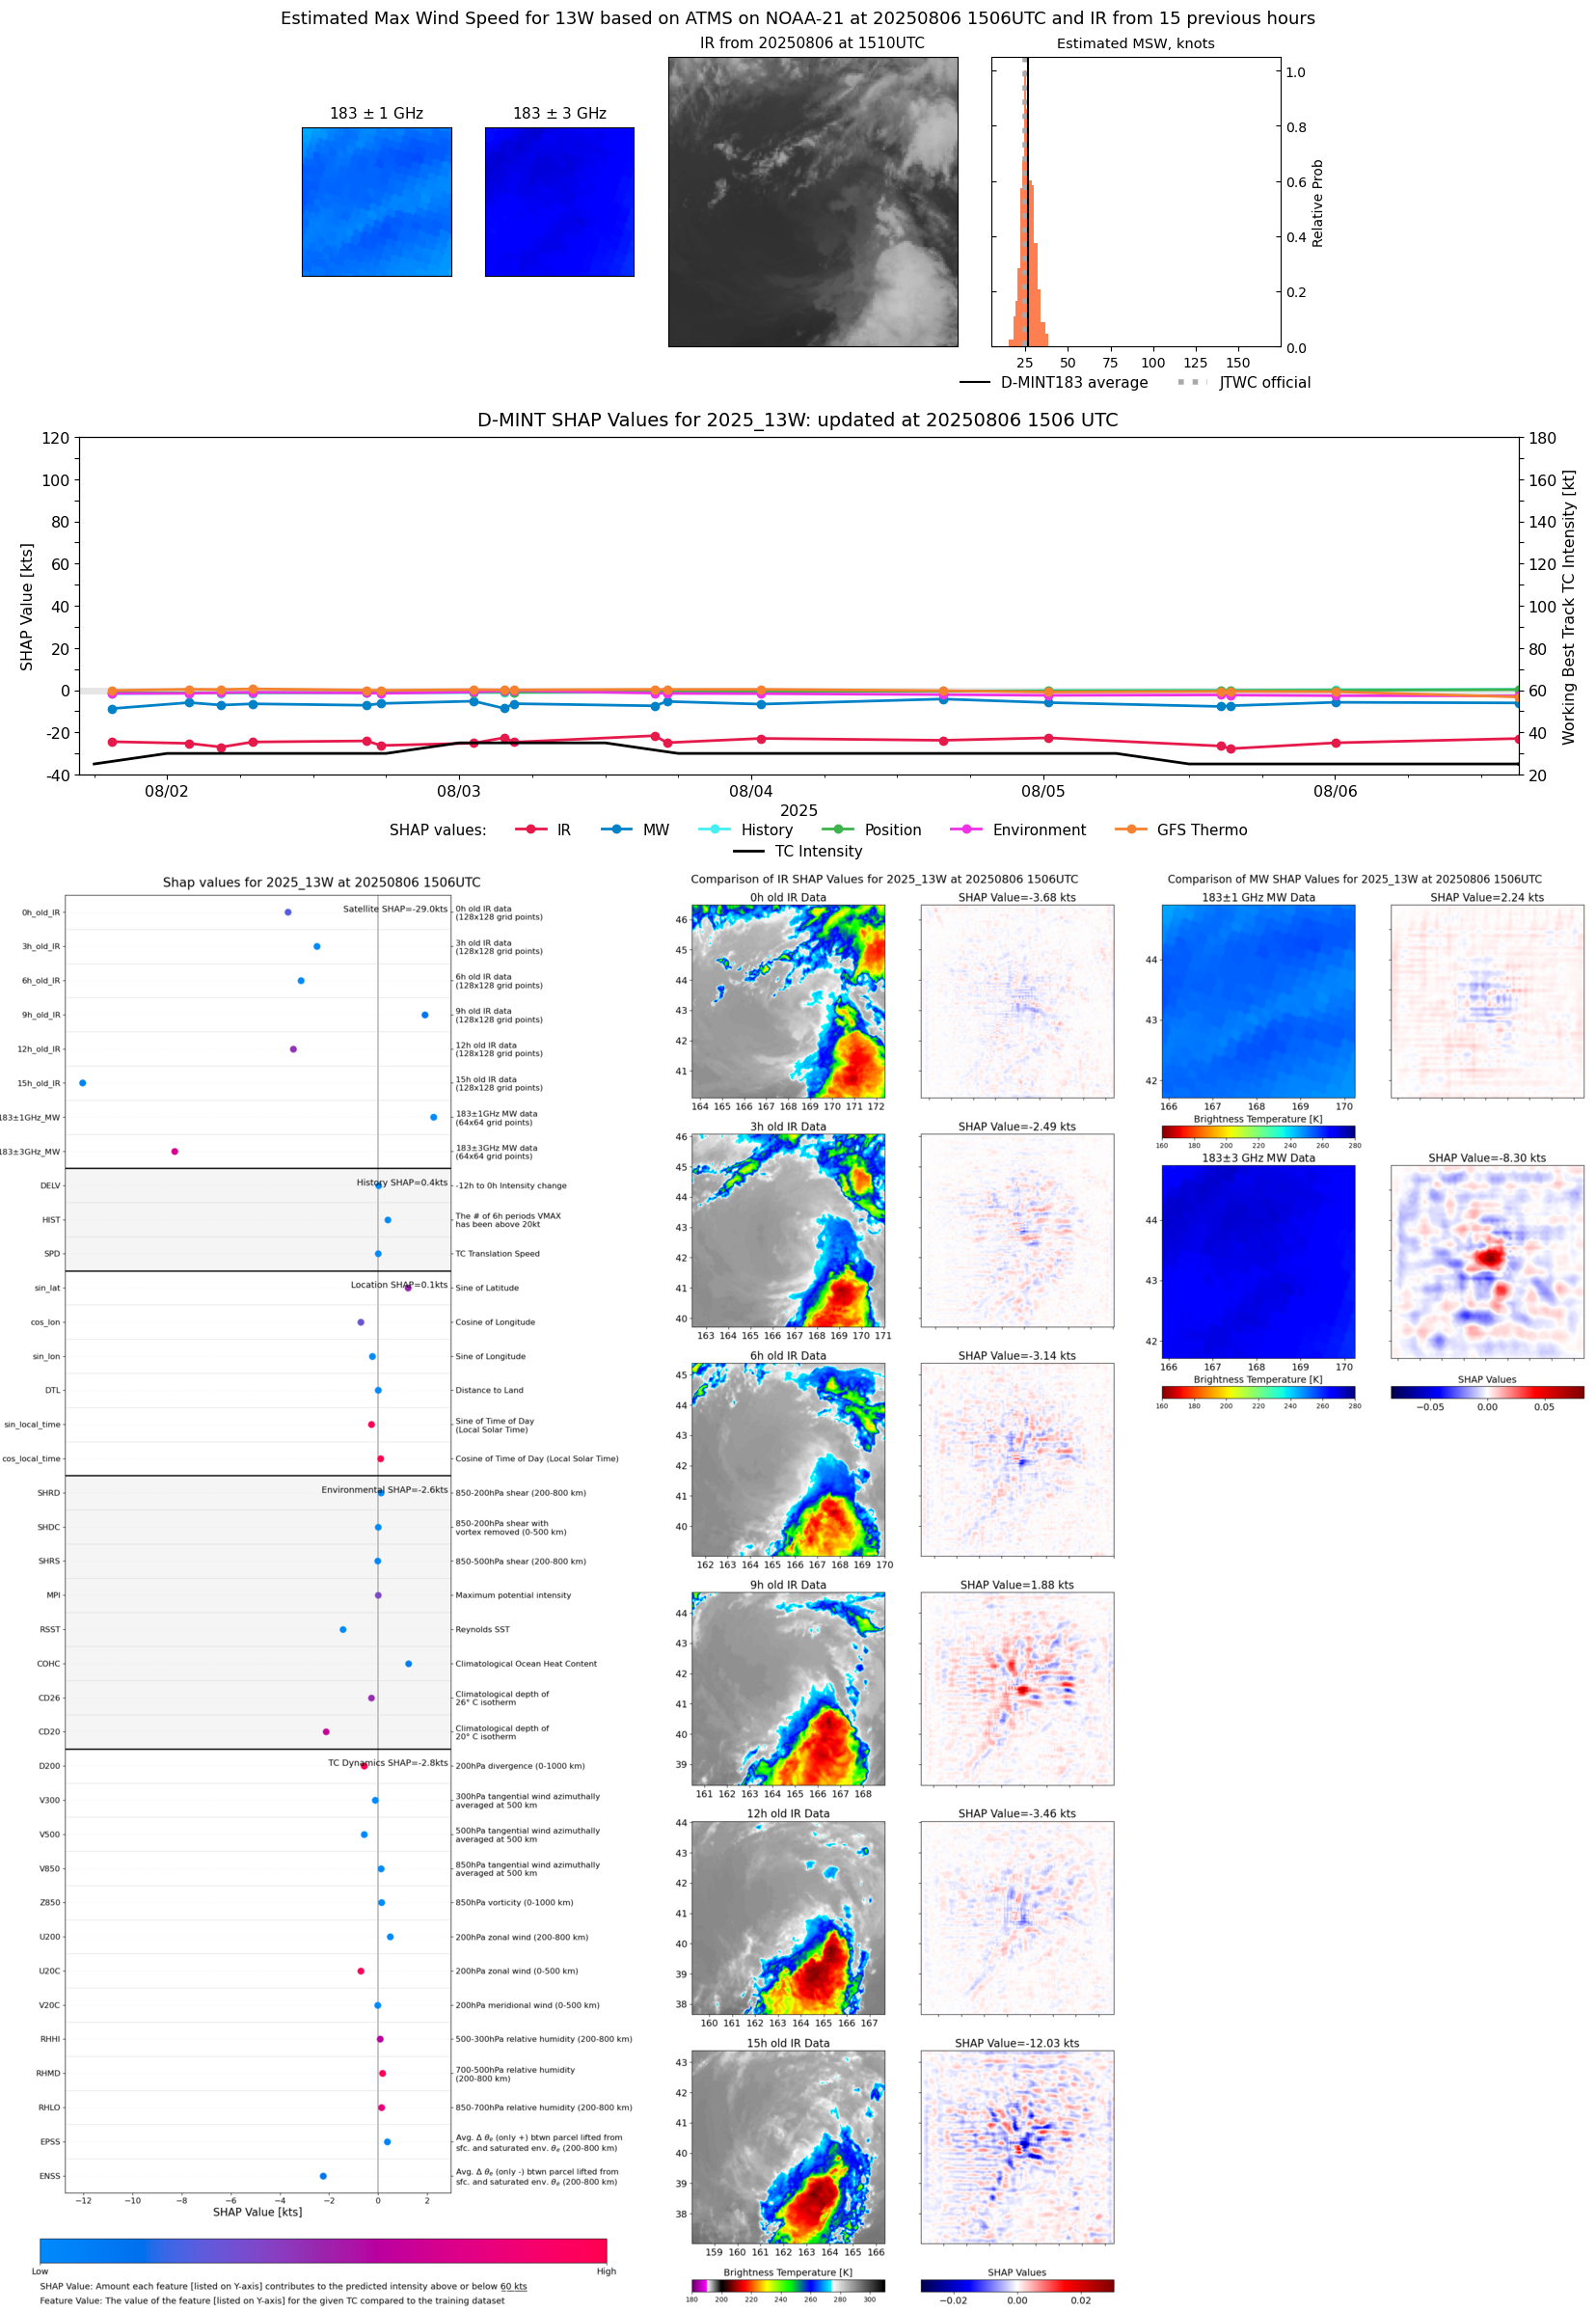 |
| 20250806 | 1435 UTC | AMSR2 | 999 hPa | 24 kts | 22 kts | 26 kts | 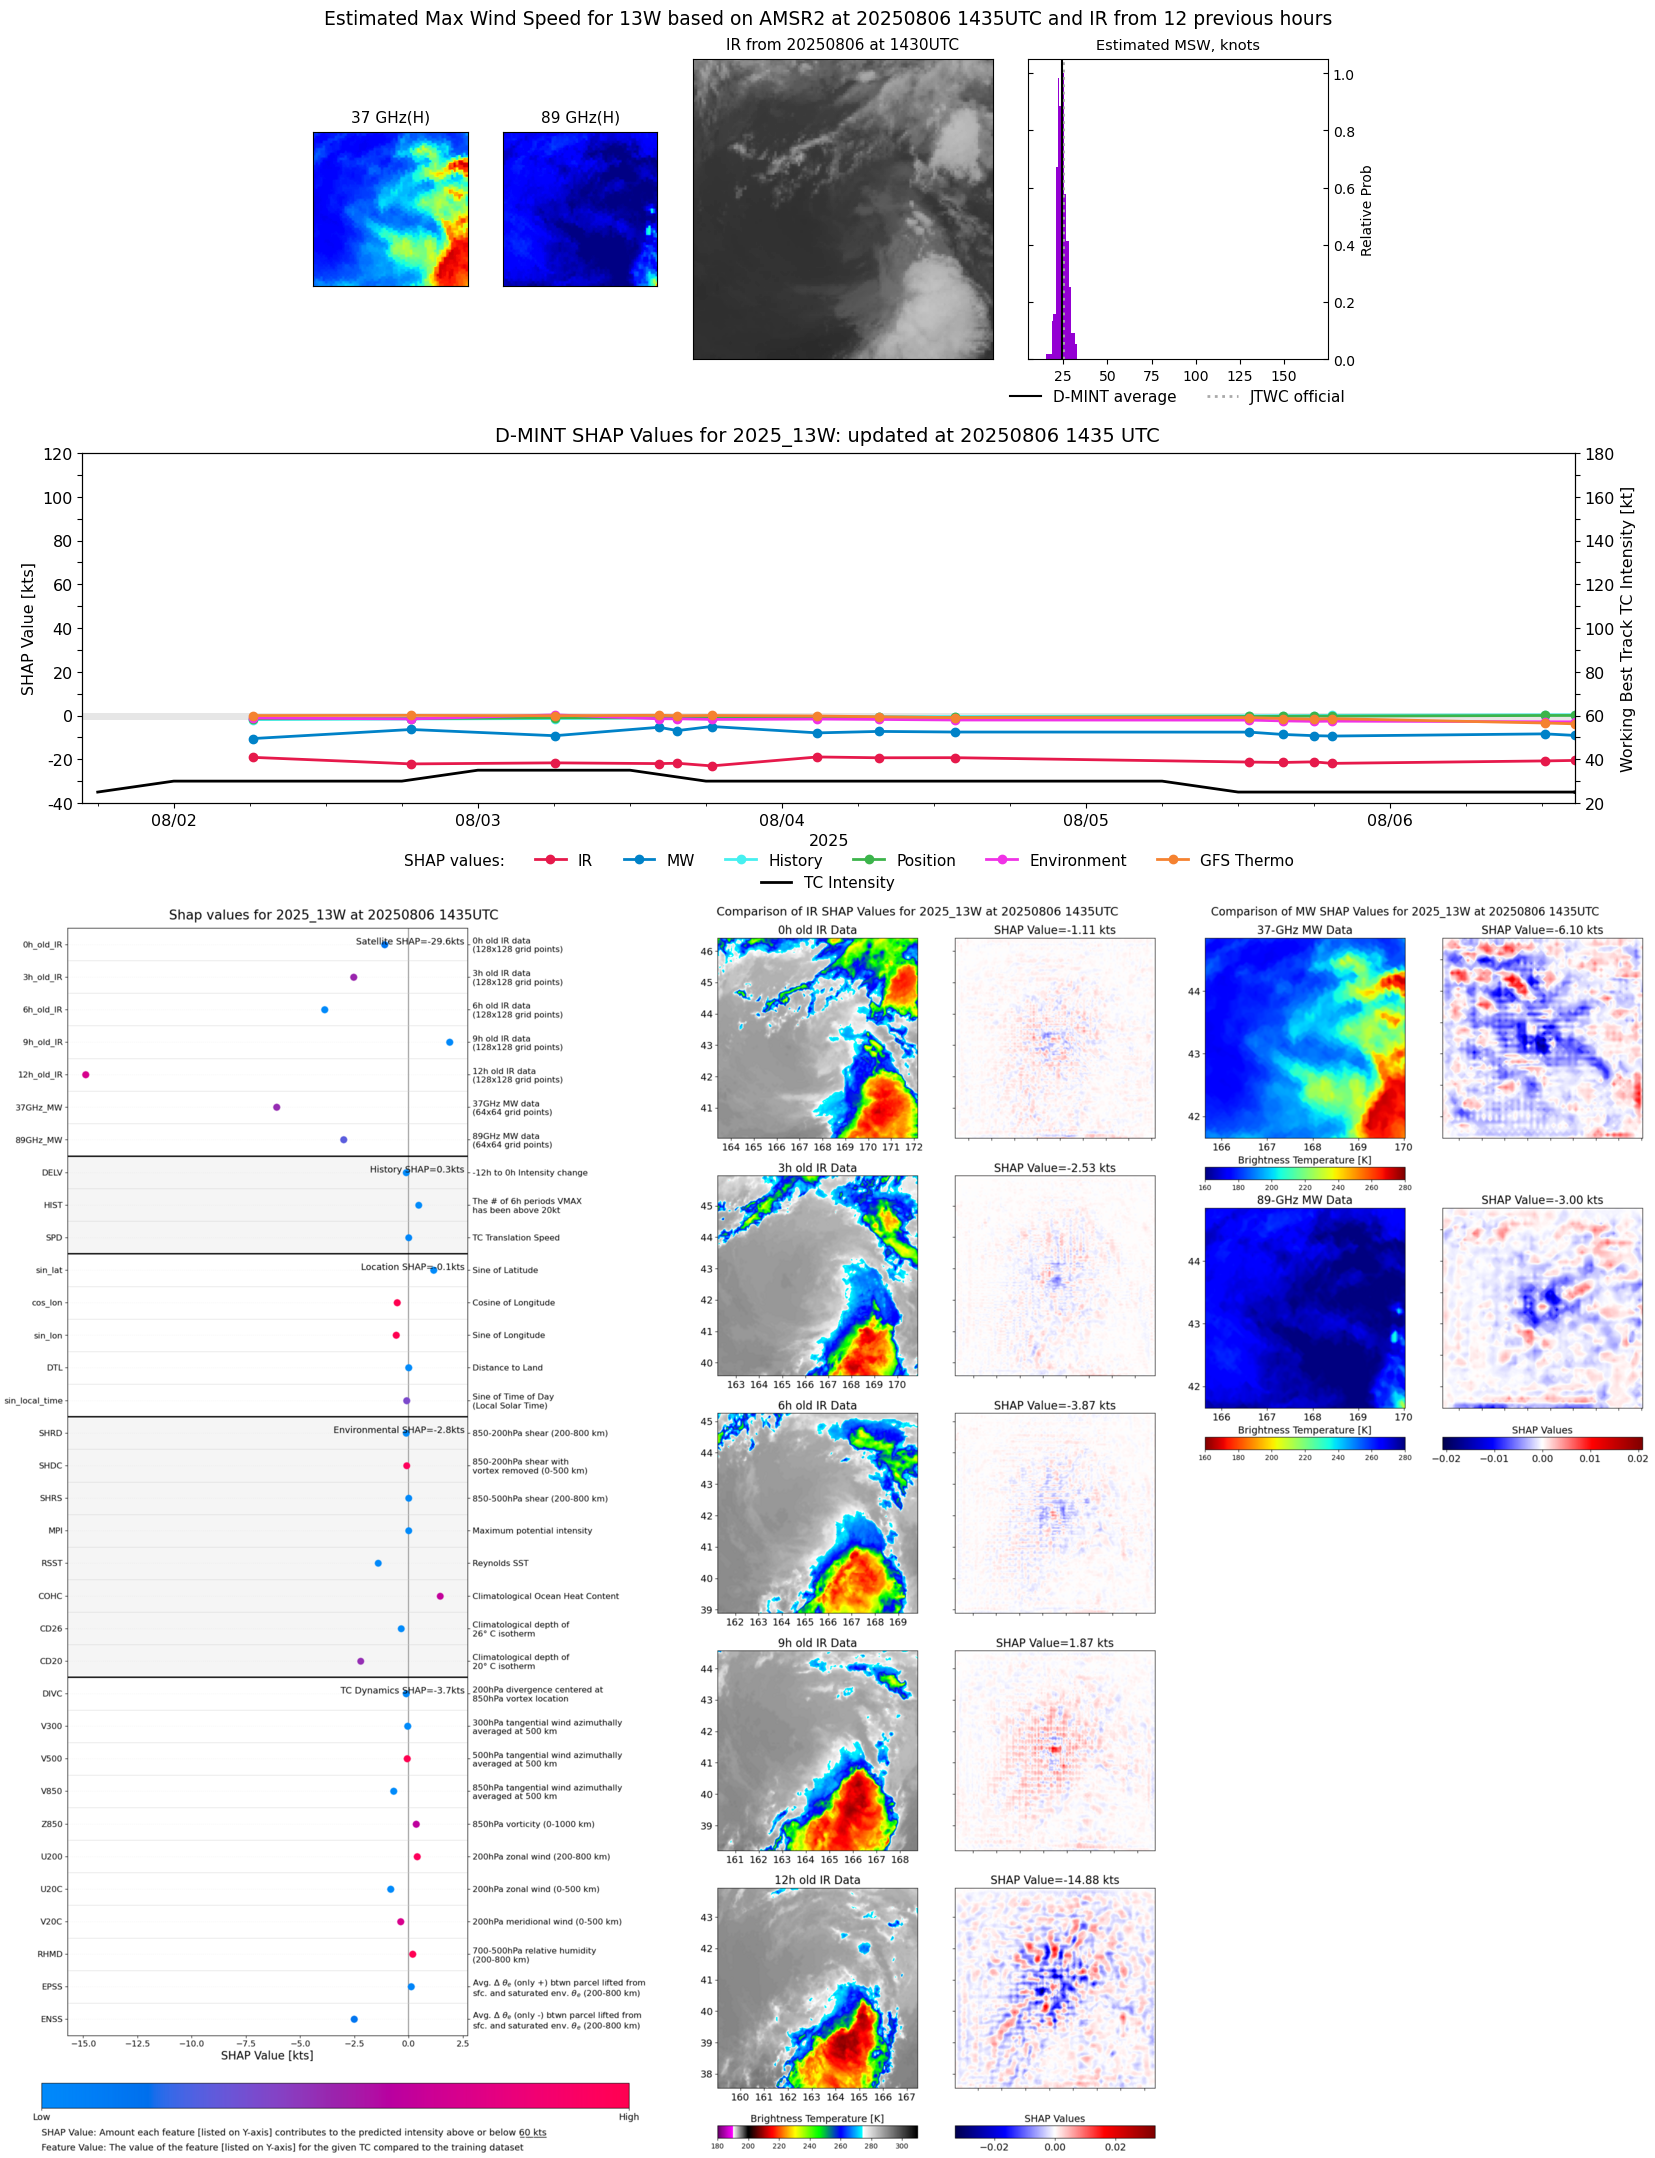 |
| 20250806 | 1213 UTC | GMI | 998 hPa | 25 kts | 23 kts | 27 kts |  |
| 20250806 | 0711 UTC | SSMISF16 | 997 hPa | 28 kts | 25 kts | 31 kts |  |
| 20250806 | 0236 UTC | AMSR2 | 997 hPa | 27 kts | 25 kts | 30 kts |  |
| 20250806 | 0001 UTC | TMS02 | 999 hPa | 26 kts | 24 kts | 29 kts | 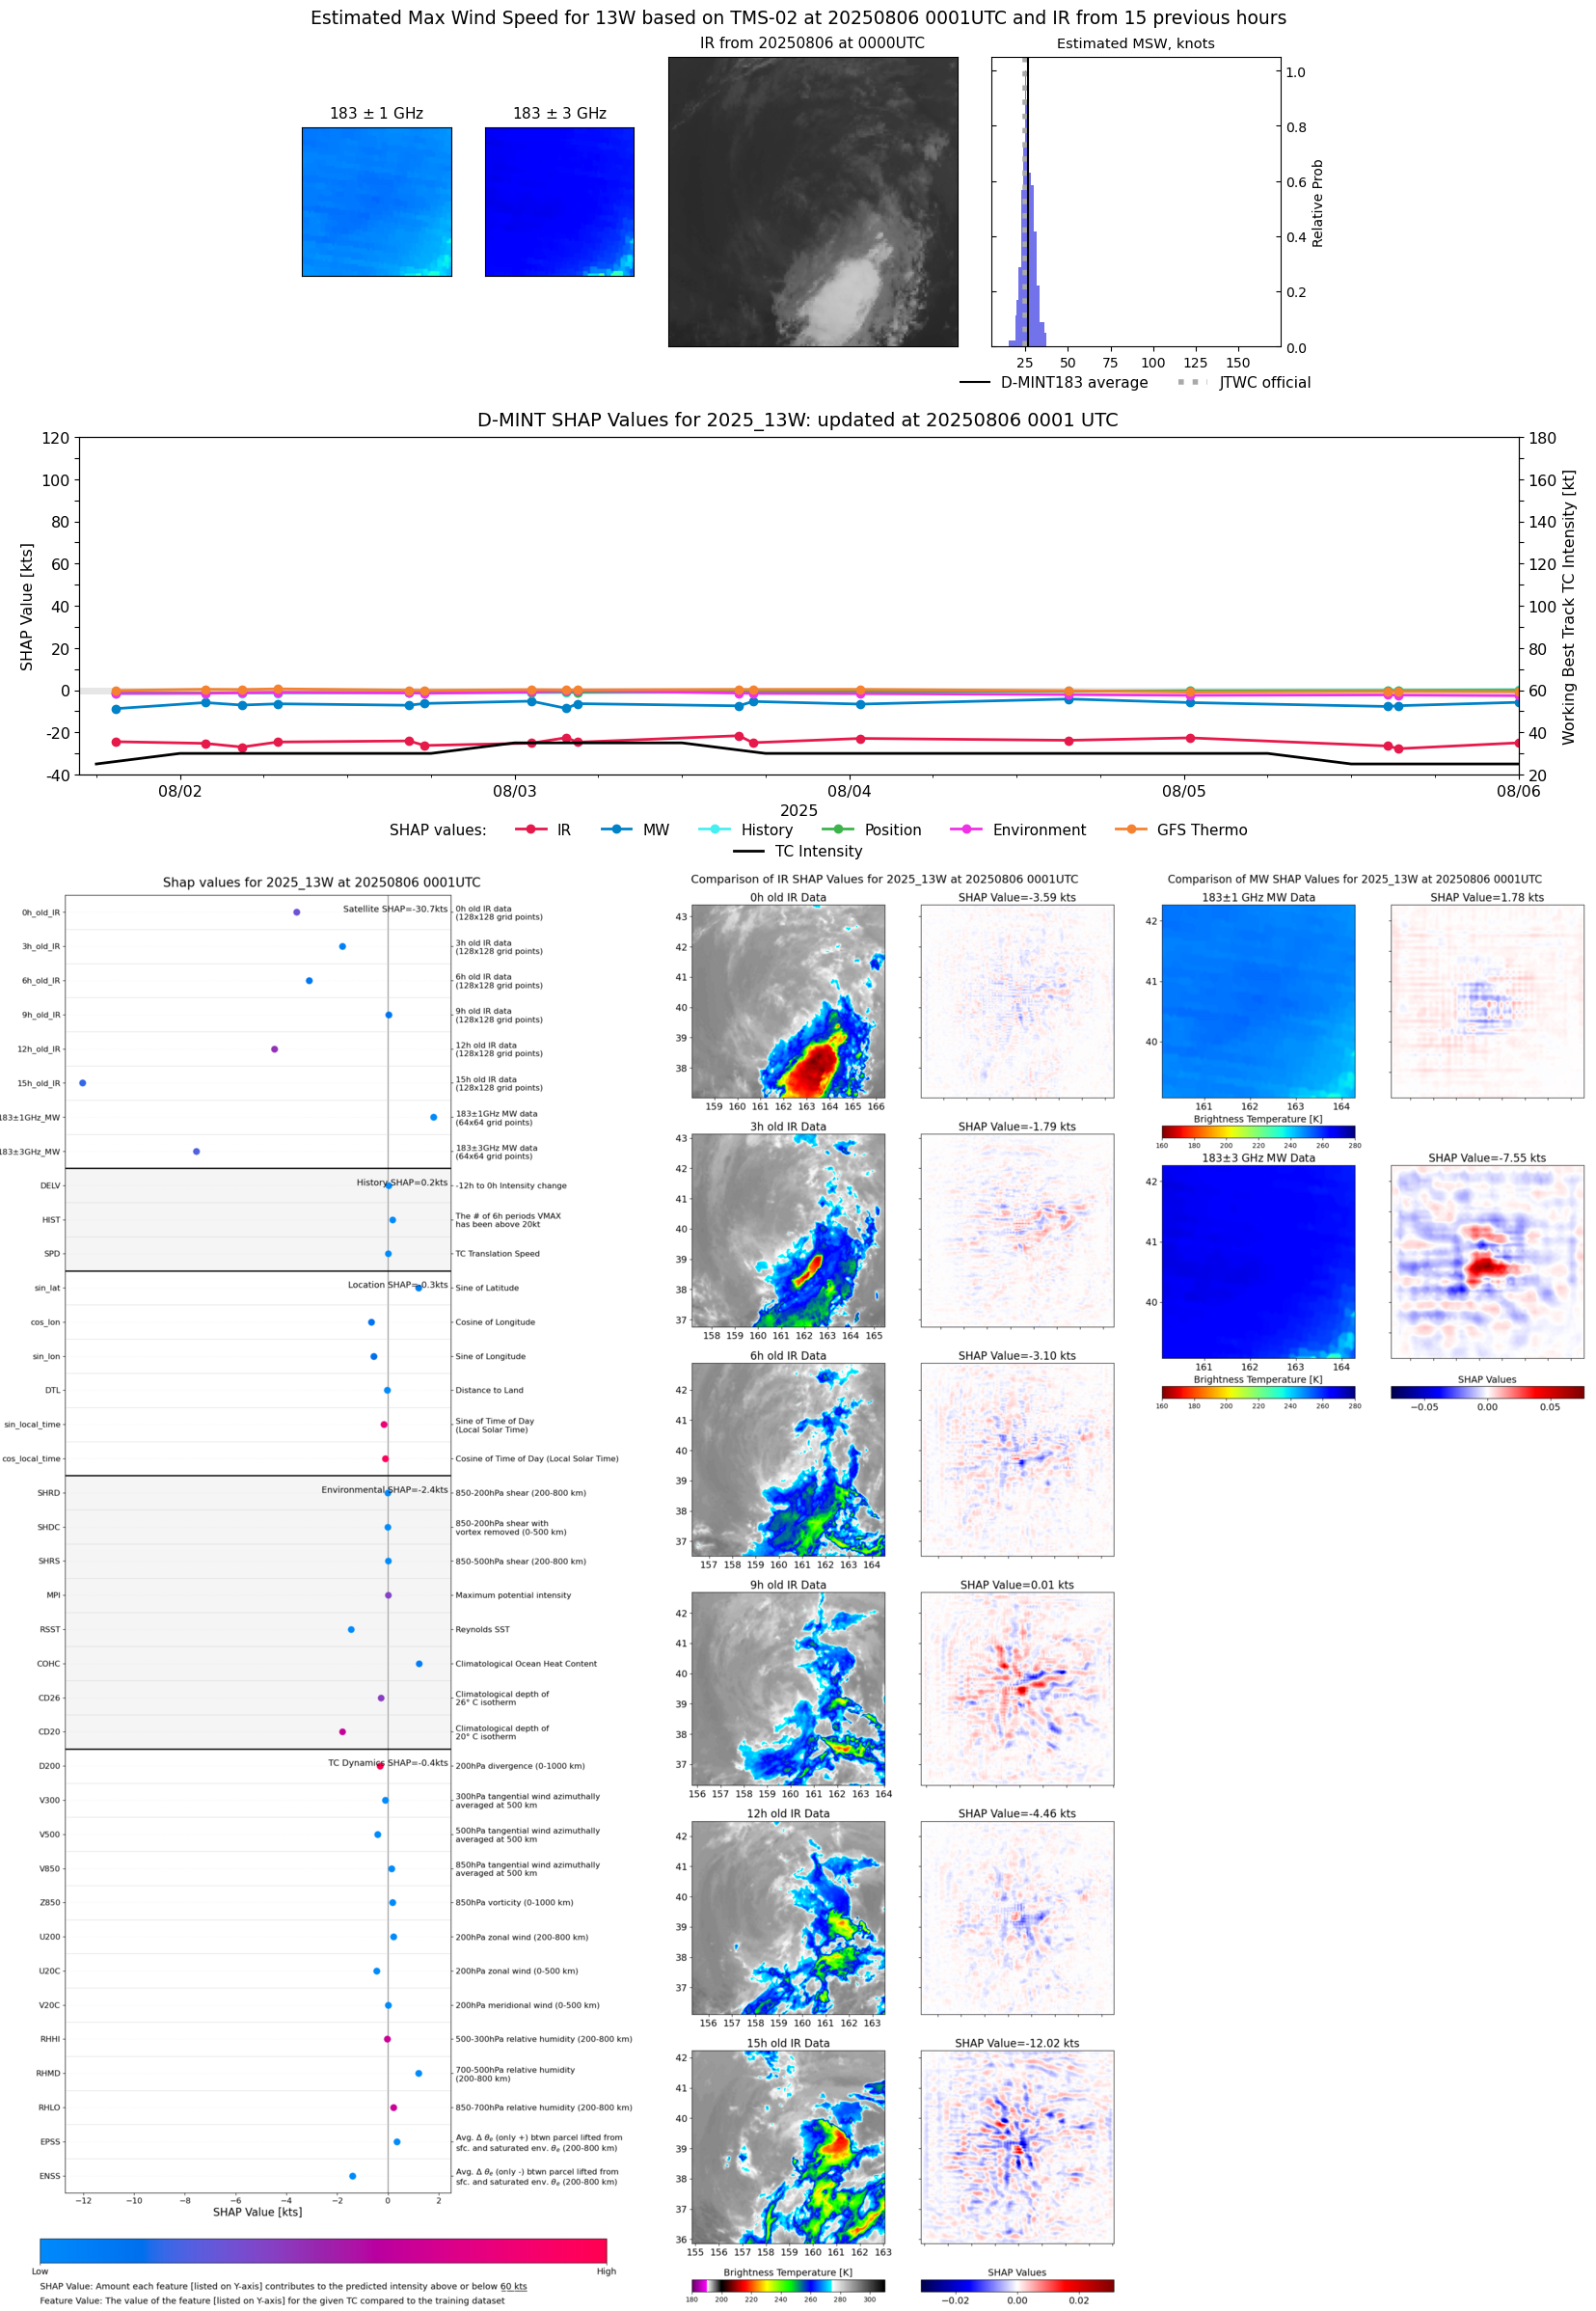 |
| 20250805 | 1924 UTC | SSMISF17 | 1000 hPa | 25 kts | 23 kts | 27 kts | 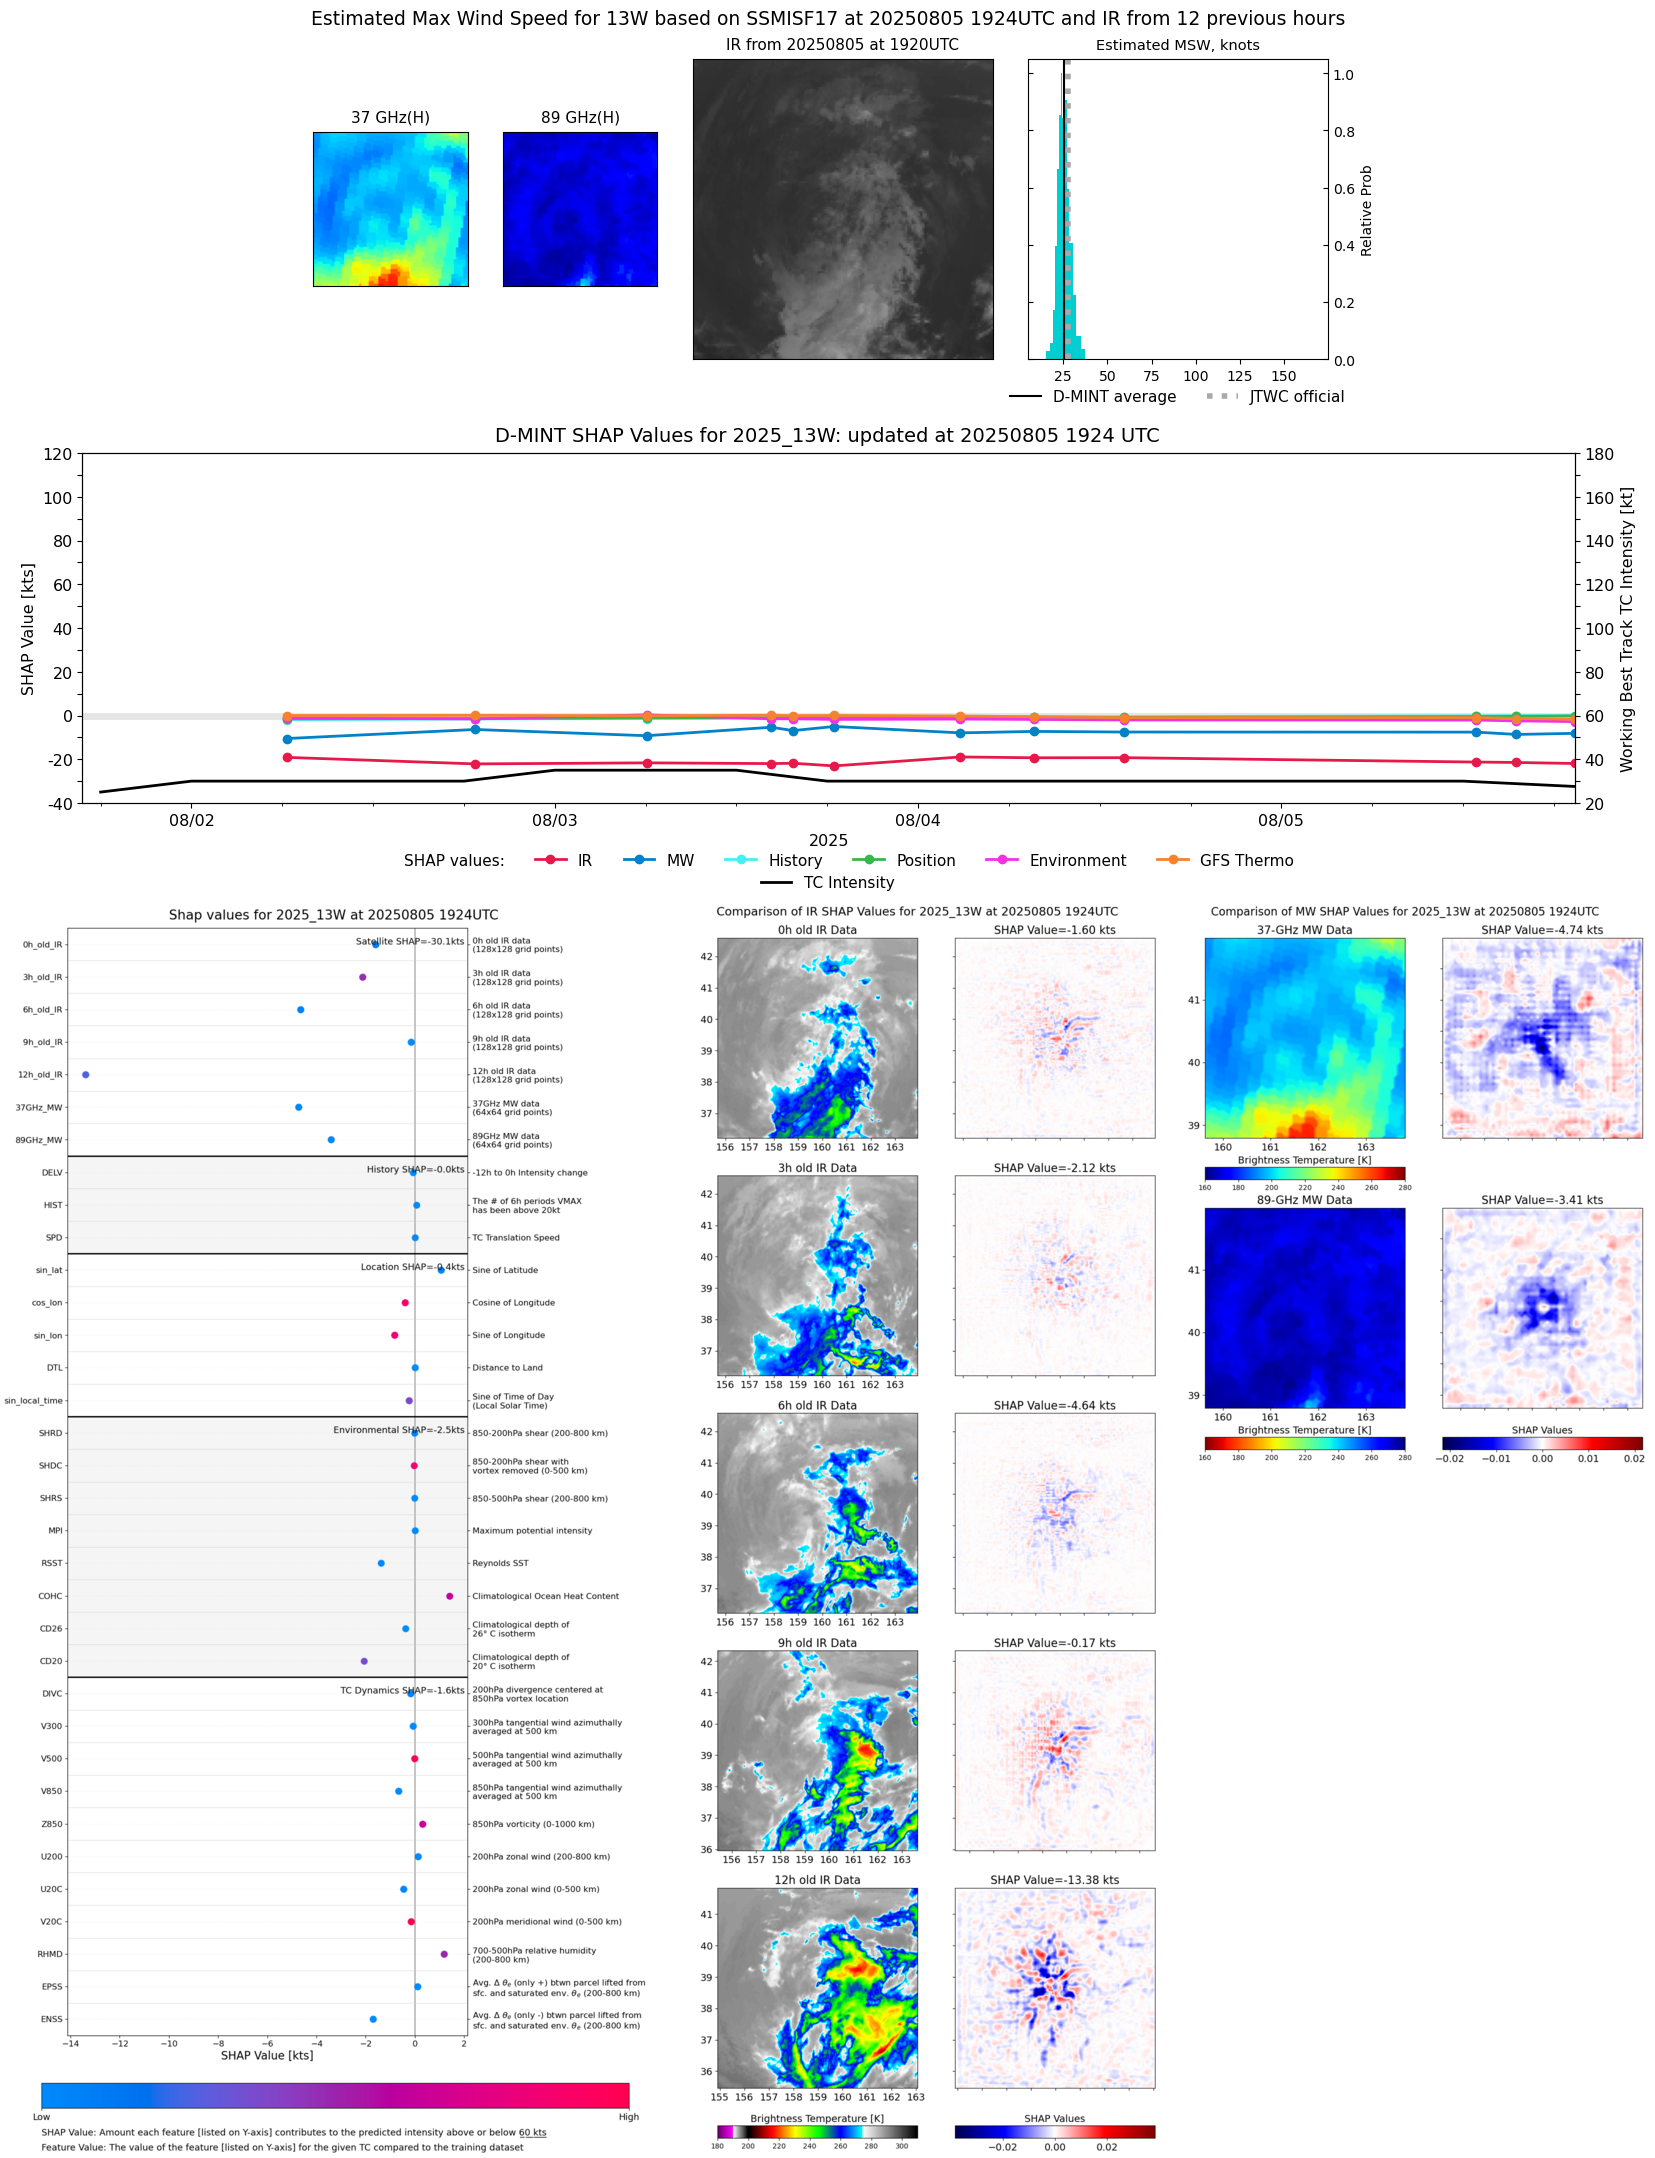 |
| 20250805 | 1924 UTC | SSMISF17 | 1000 hPa | 25 kts | 23 kts | 27 kts |  |
| 20250805 | 1758 UTC | SSMISF18 | 1002 hPa | 25 kts | 23 kts | 27 kts | 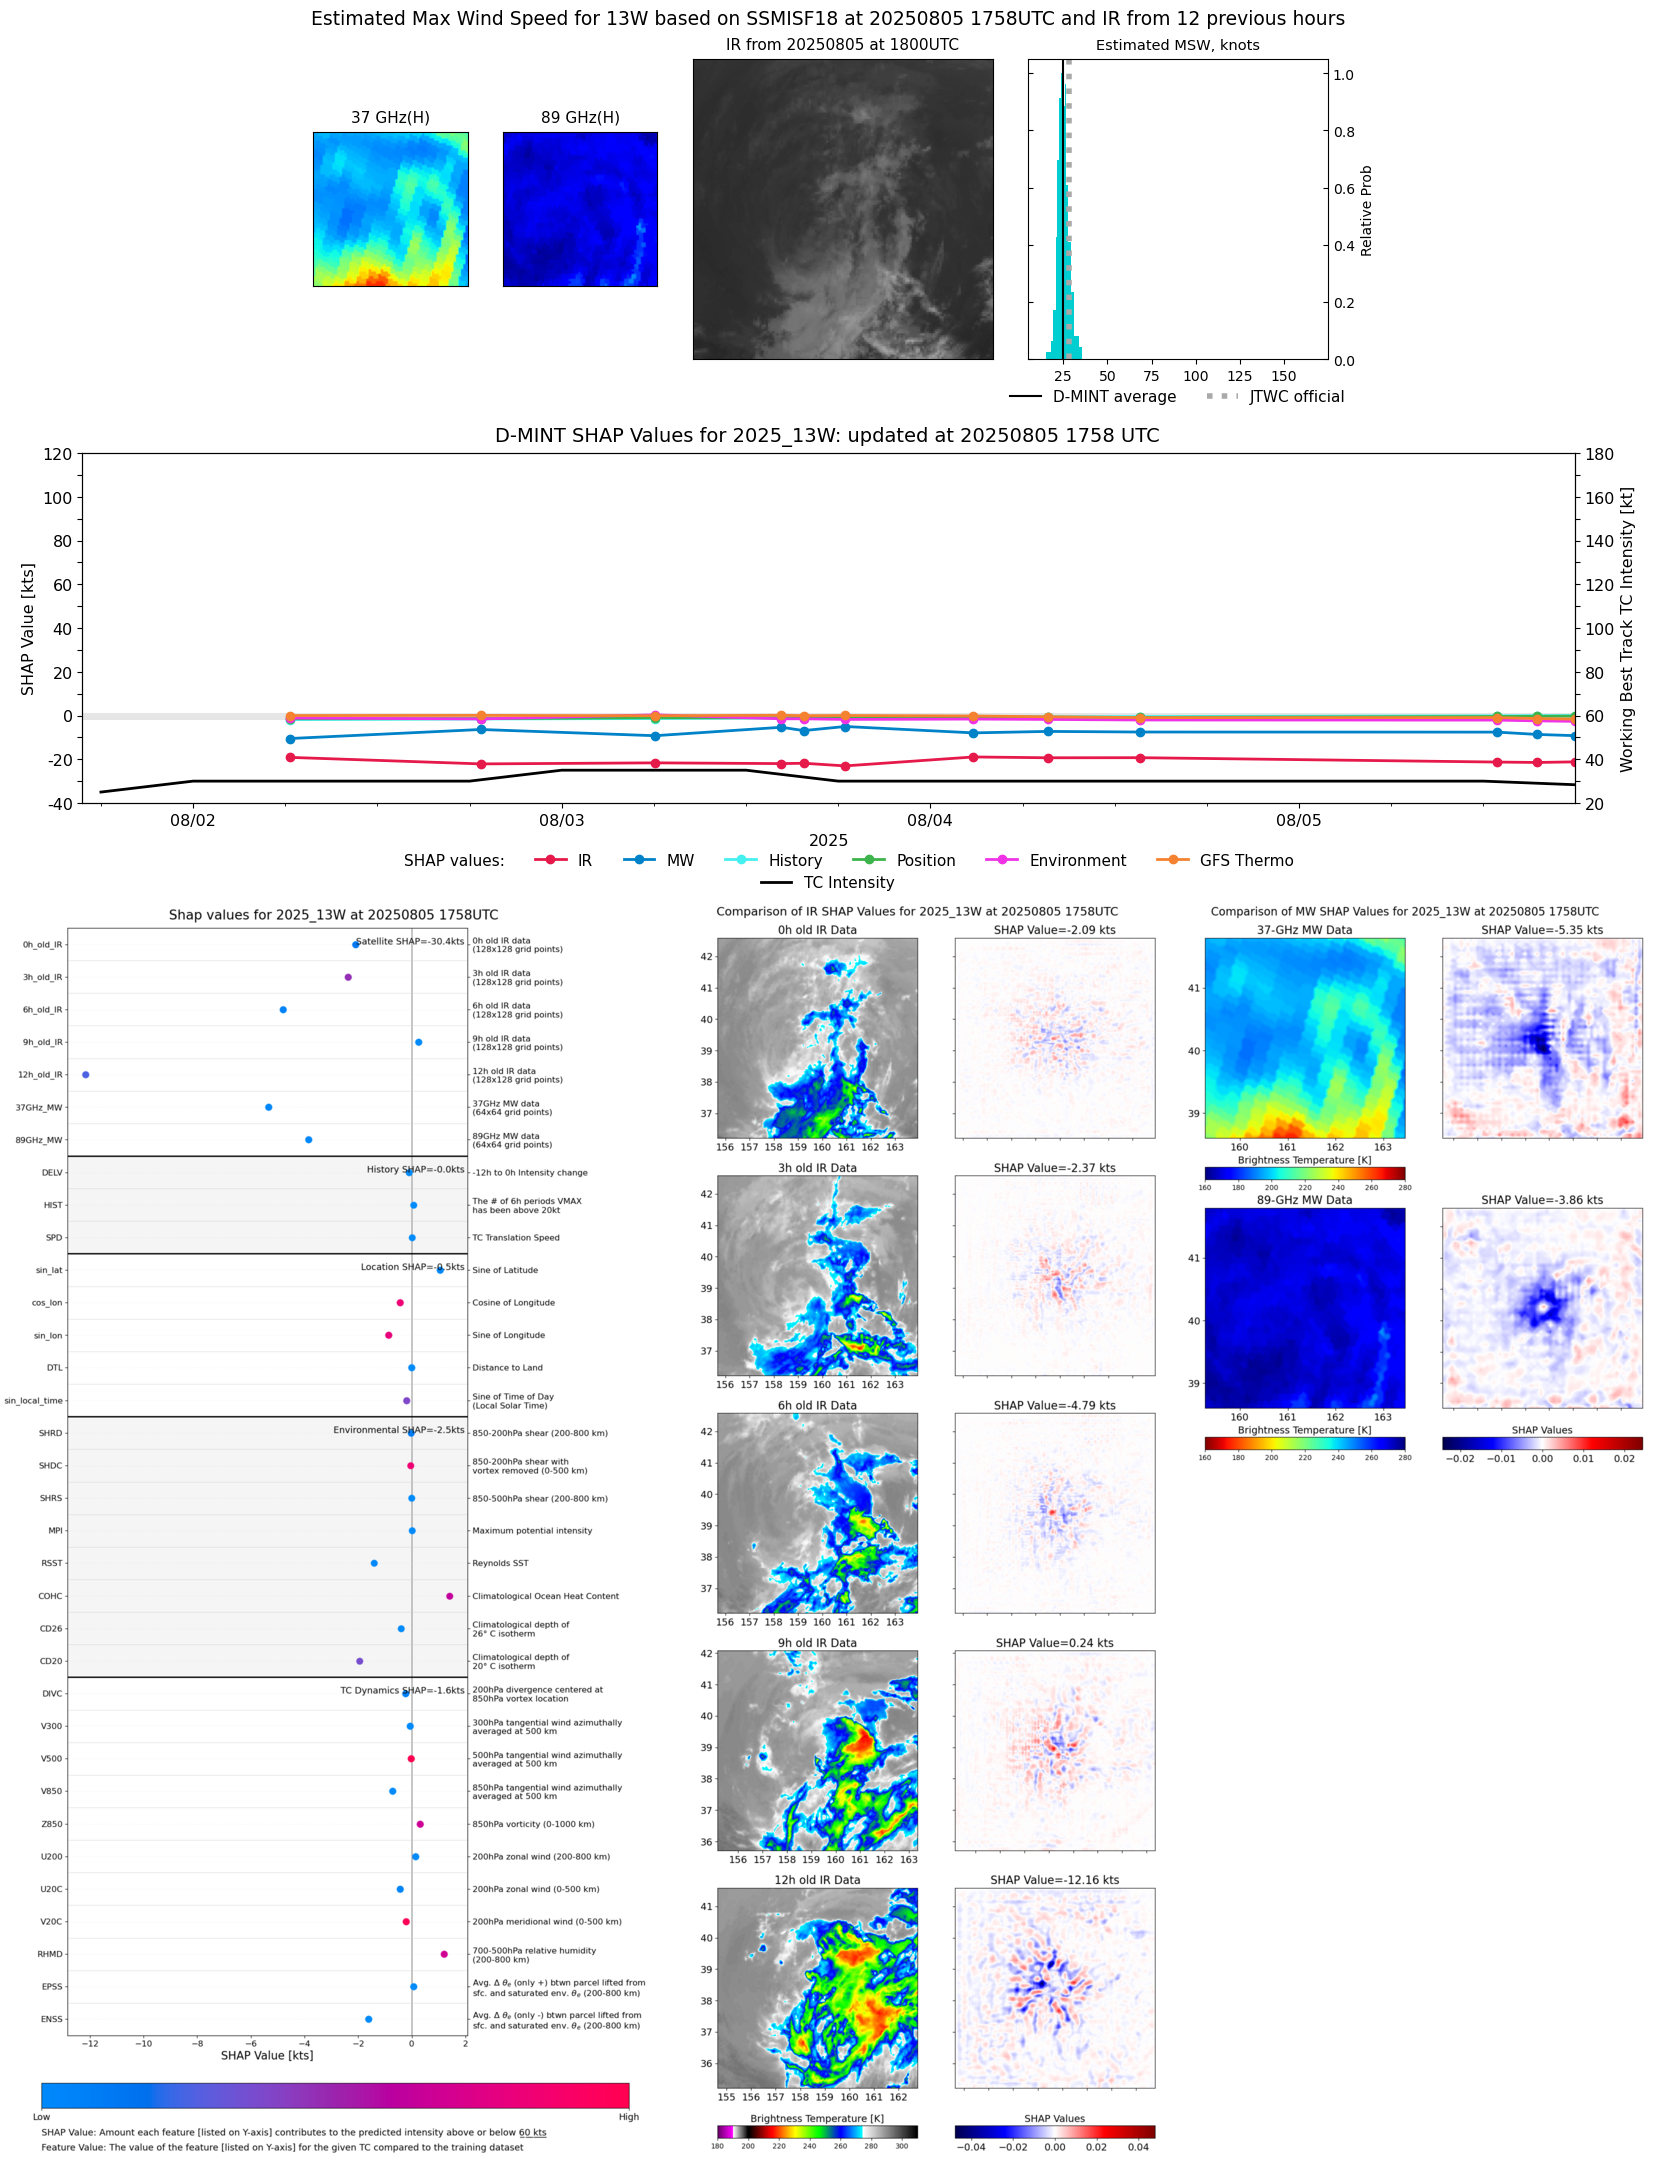 |
| 20250805 | 1531 UTC | AMSR2 | 1001 hPa | 26 kts | 24 kts | 28 kts | 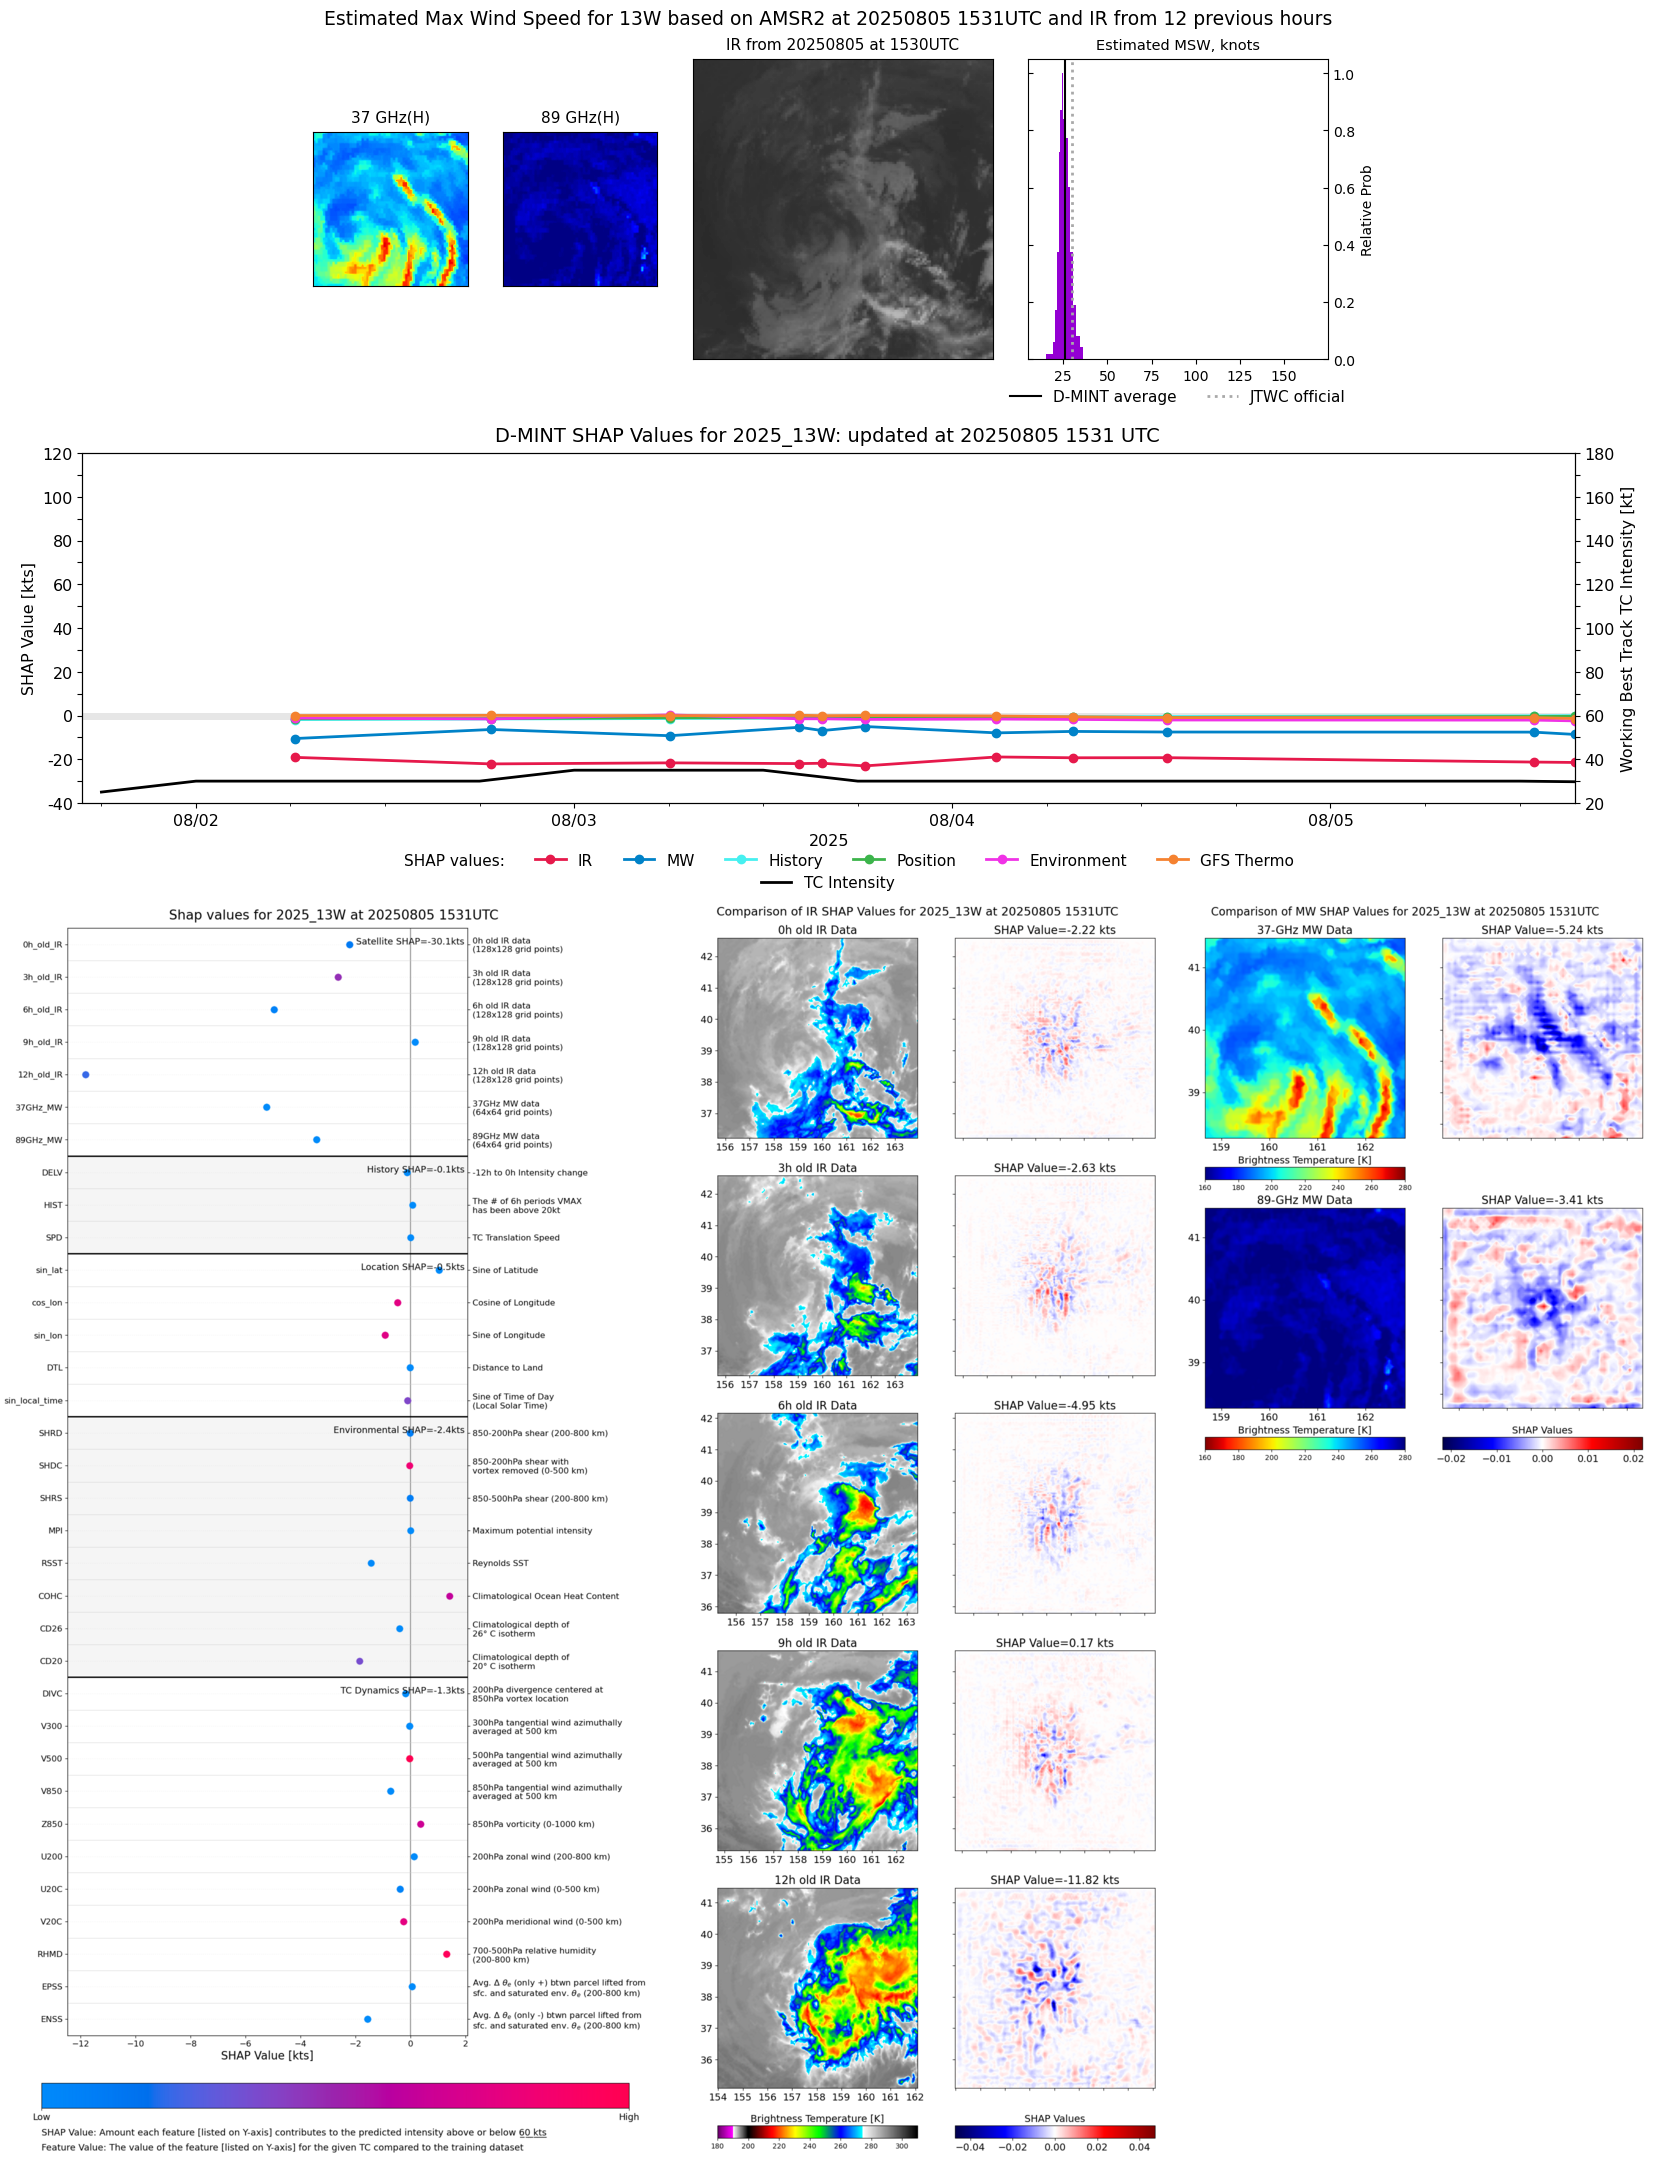 |
| 20250805 | 1524 UTC | ATMS-N21 | 1001 hPa | 22 kts | 21 kts | 24 kts | 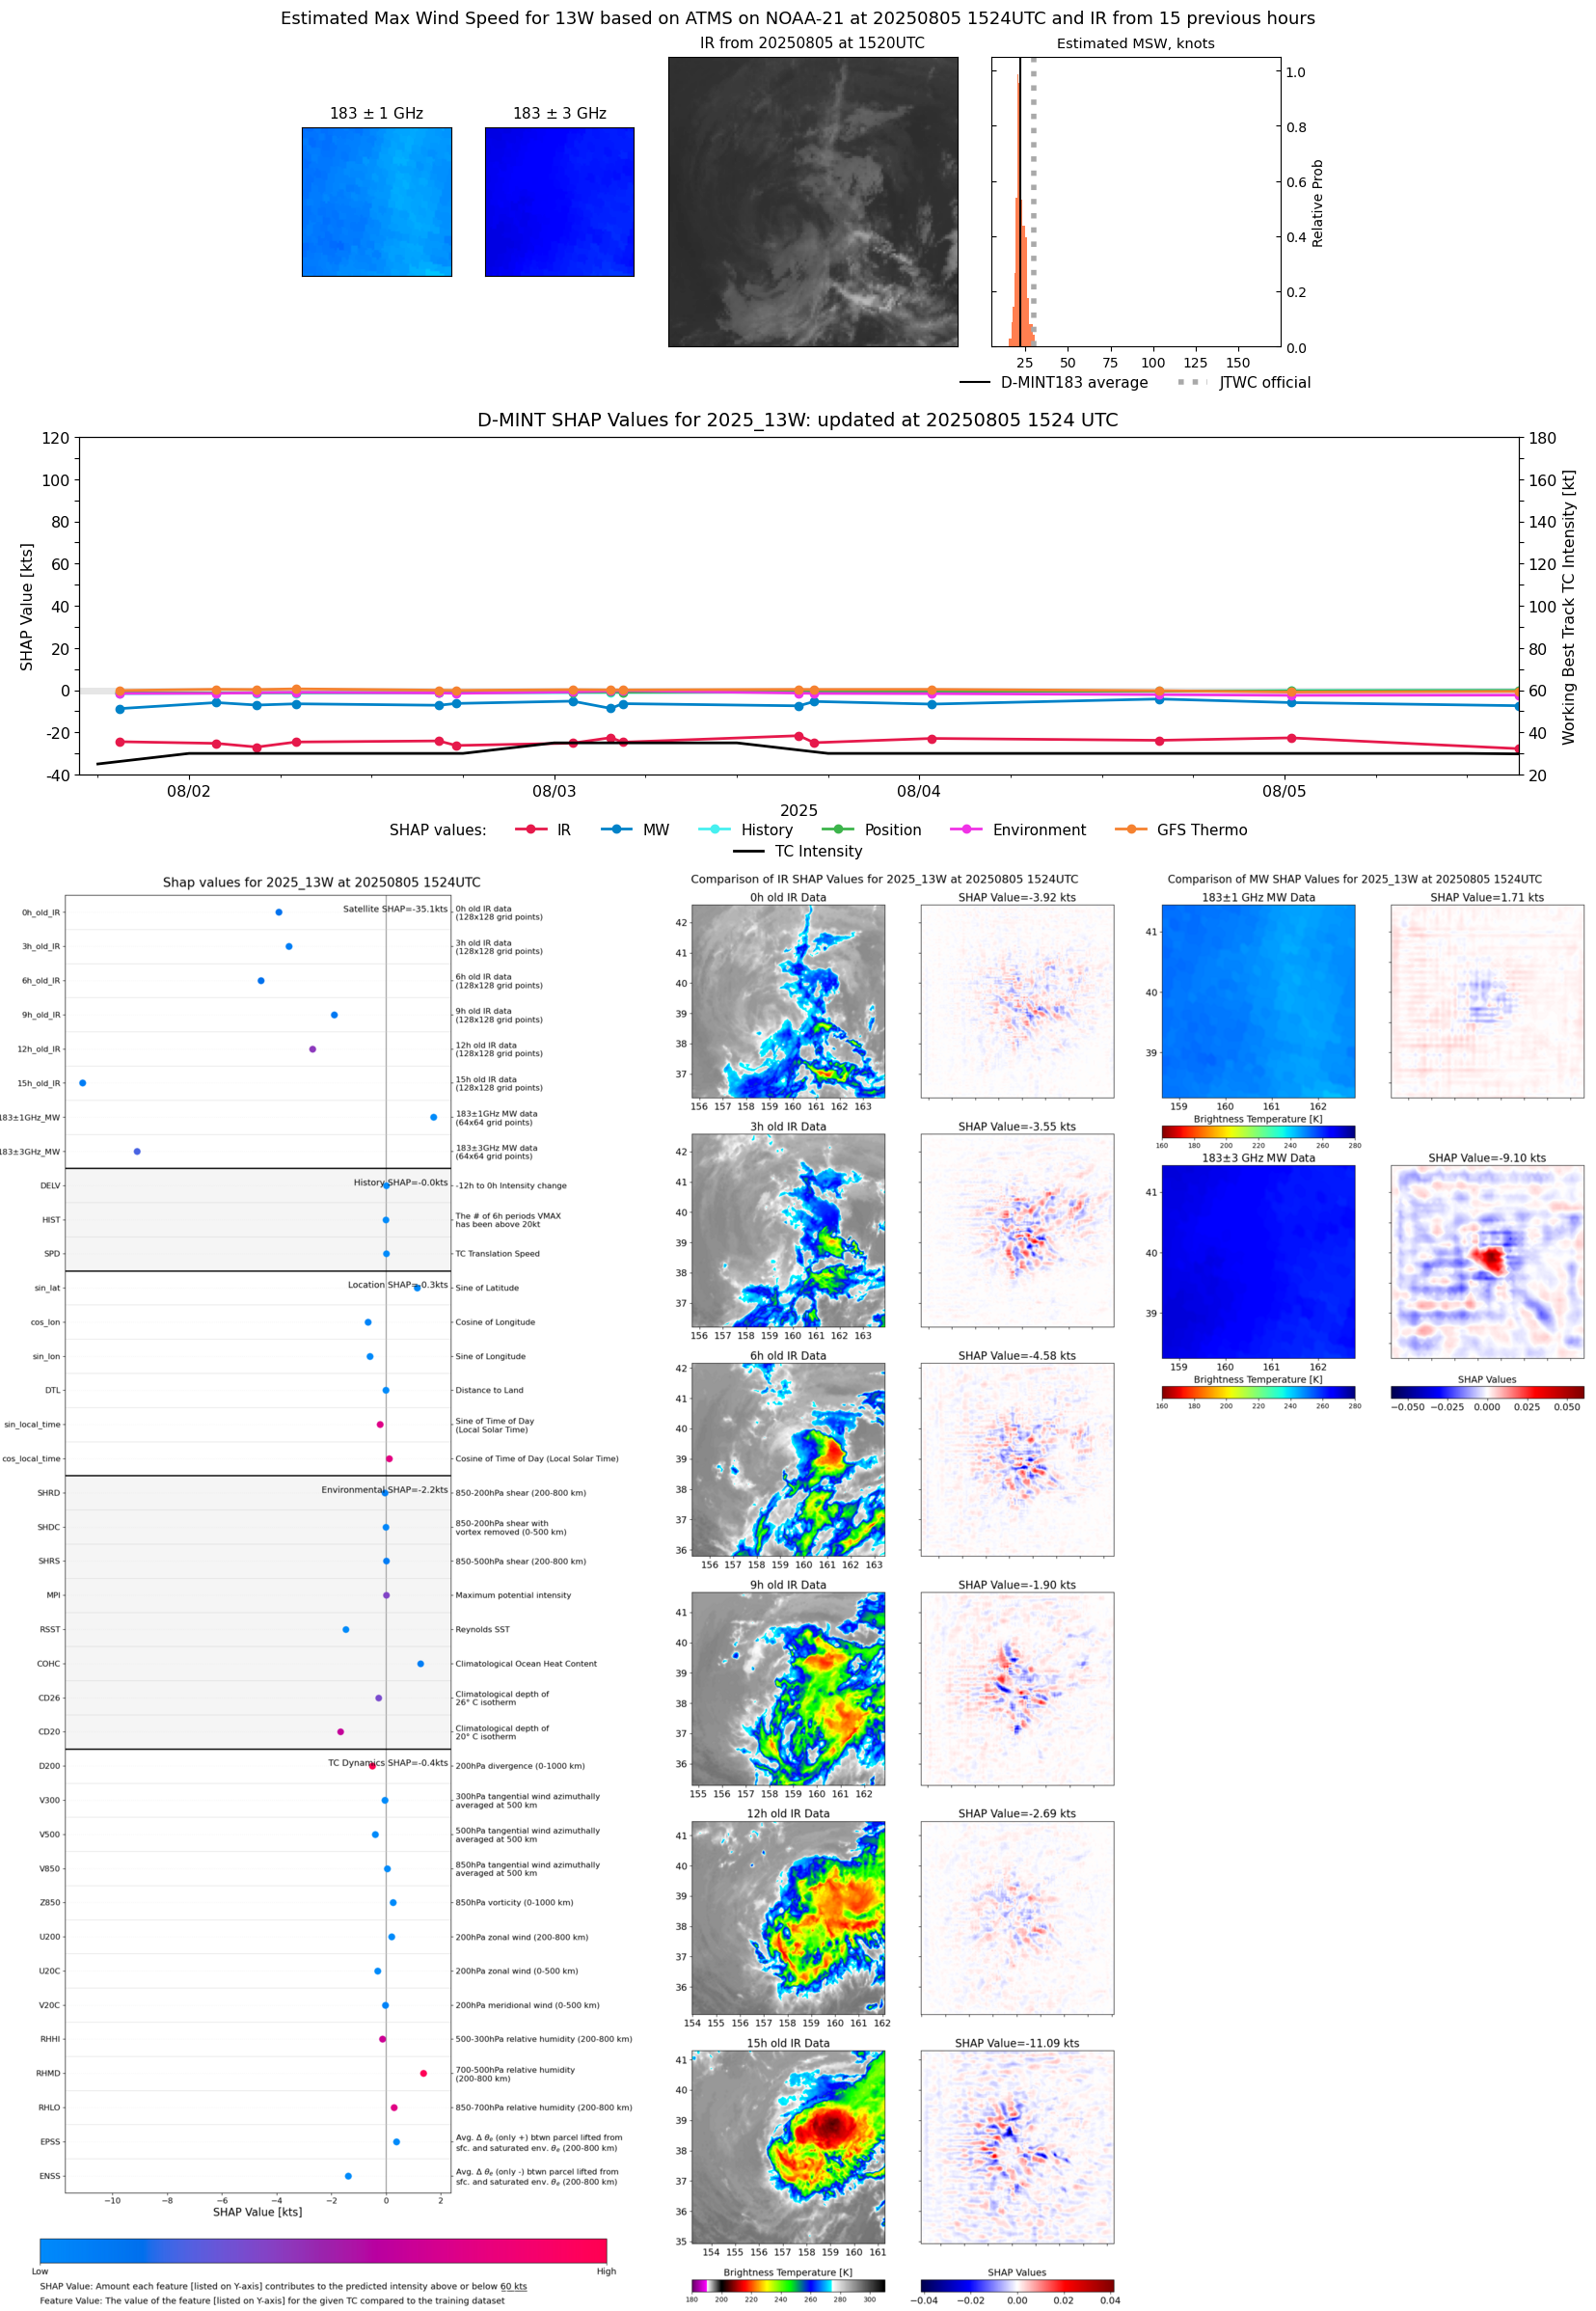 |
| 20250805 | 1436 UTC | TMS03 | 1001 hPa | 23 kts | 21 kts | 25 kts | 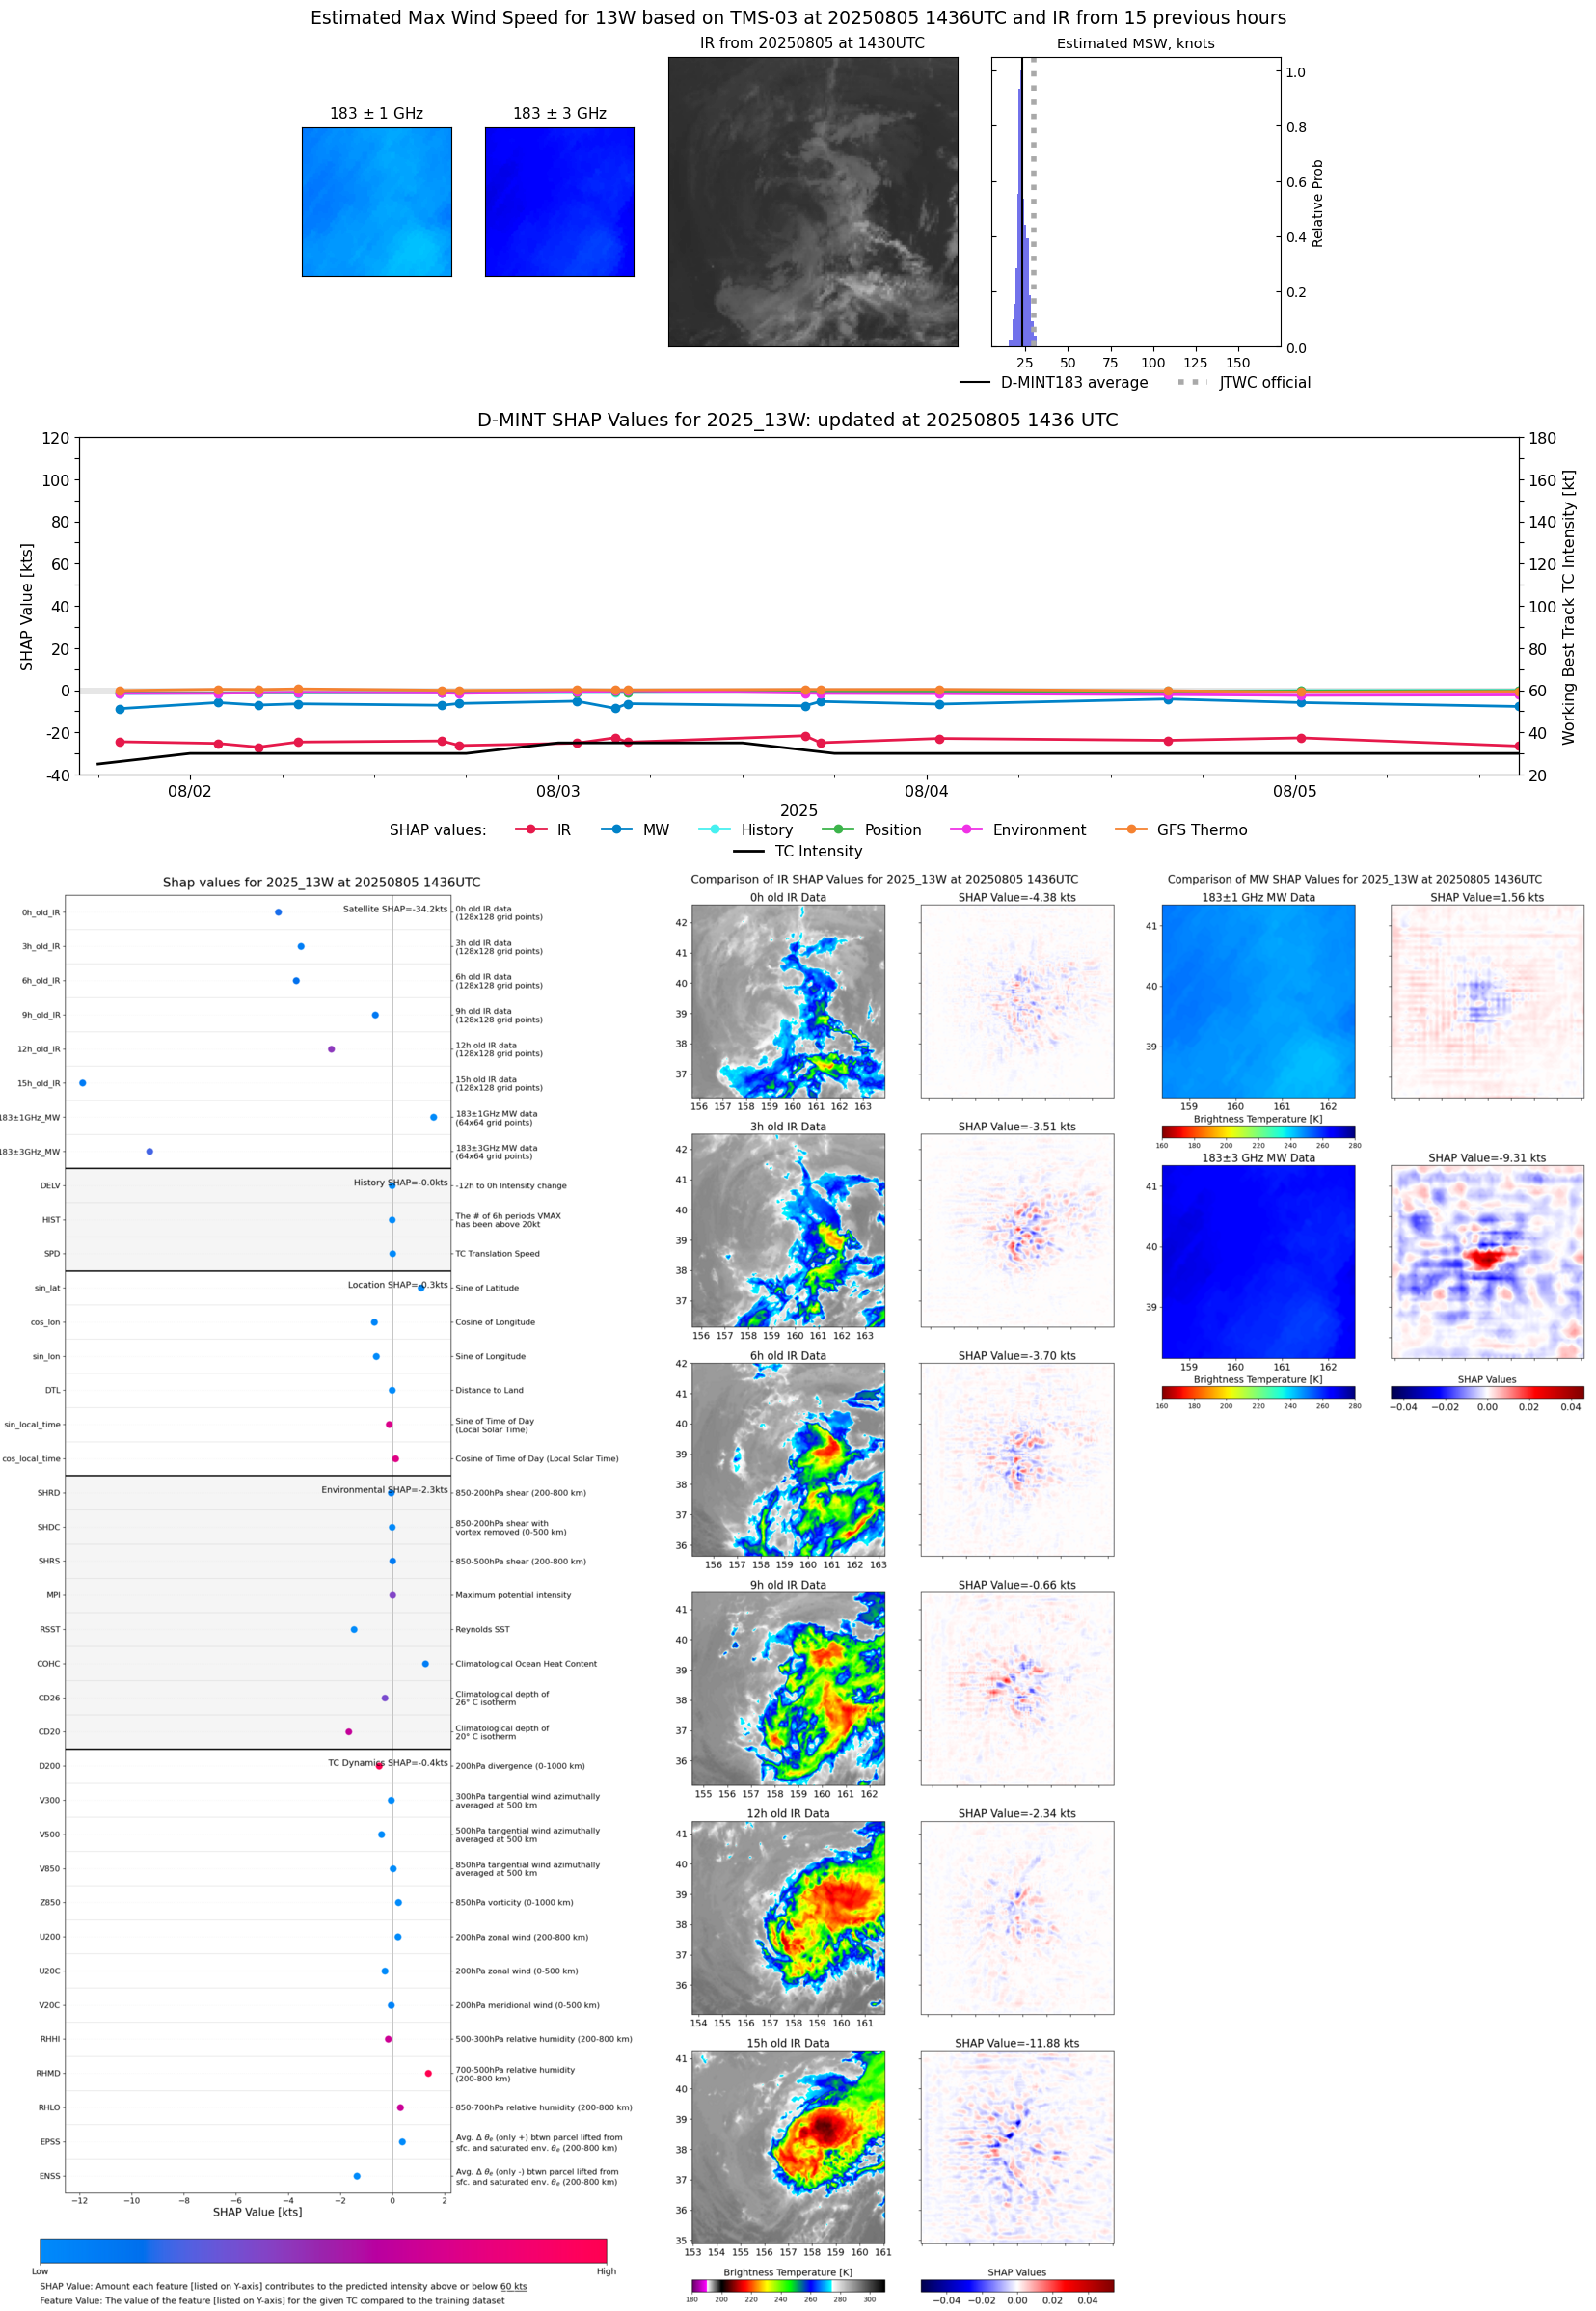 |
| 20250805 | 1253 UTC | GMI | 1001 hPa | 28 kts | 25 kts | 30 kts |  |
| 20250805 | 0724 UTC | SSMISF16 | 1000 hPa | 29 kts | 26 kts | 32 kts |  |
| 20250805 | 0025 UTC | TMS02 | 1002 hPa | 28 kts | 25 kts | 31 kts | 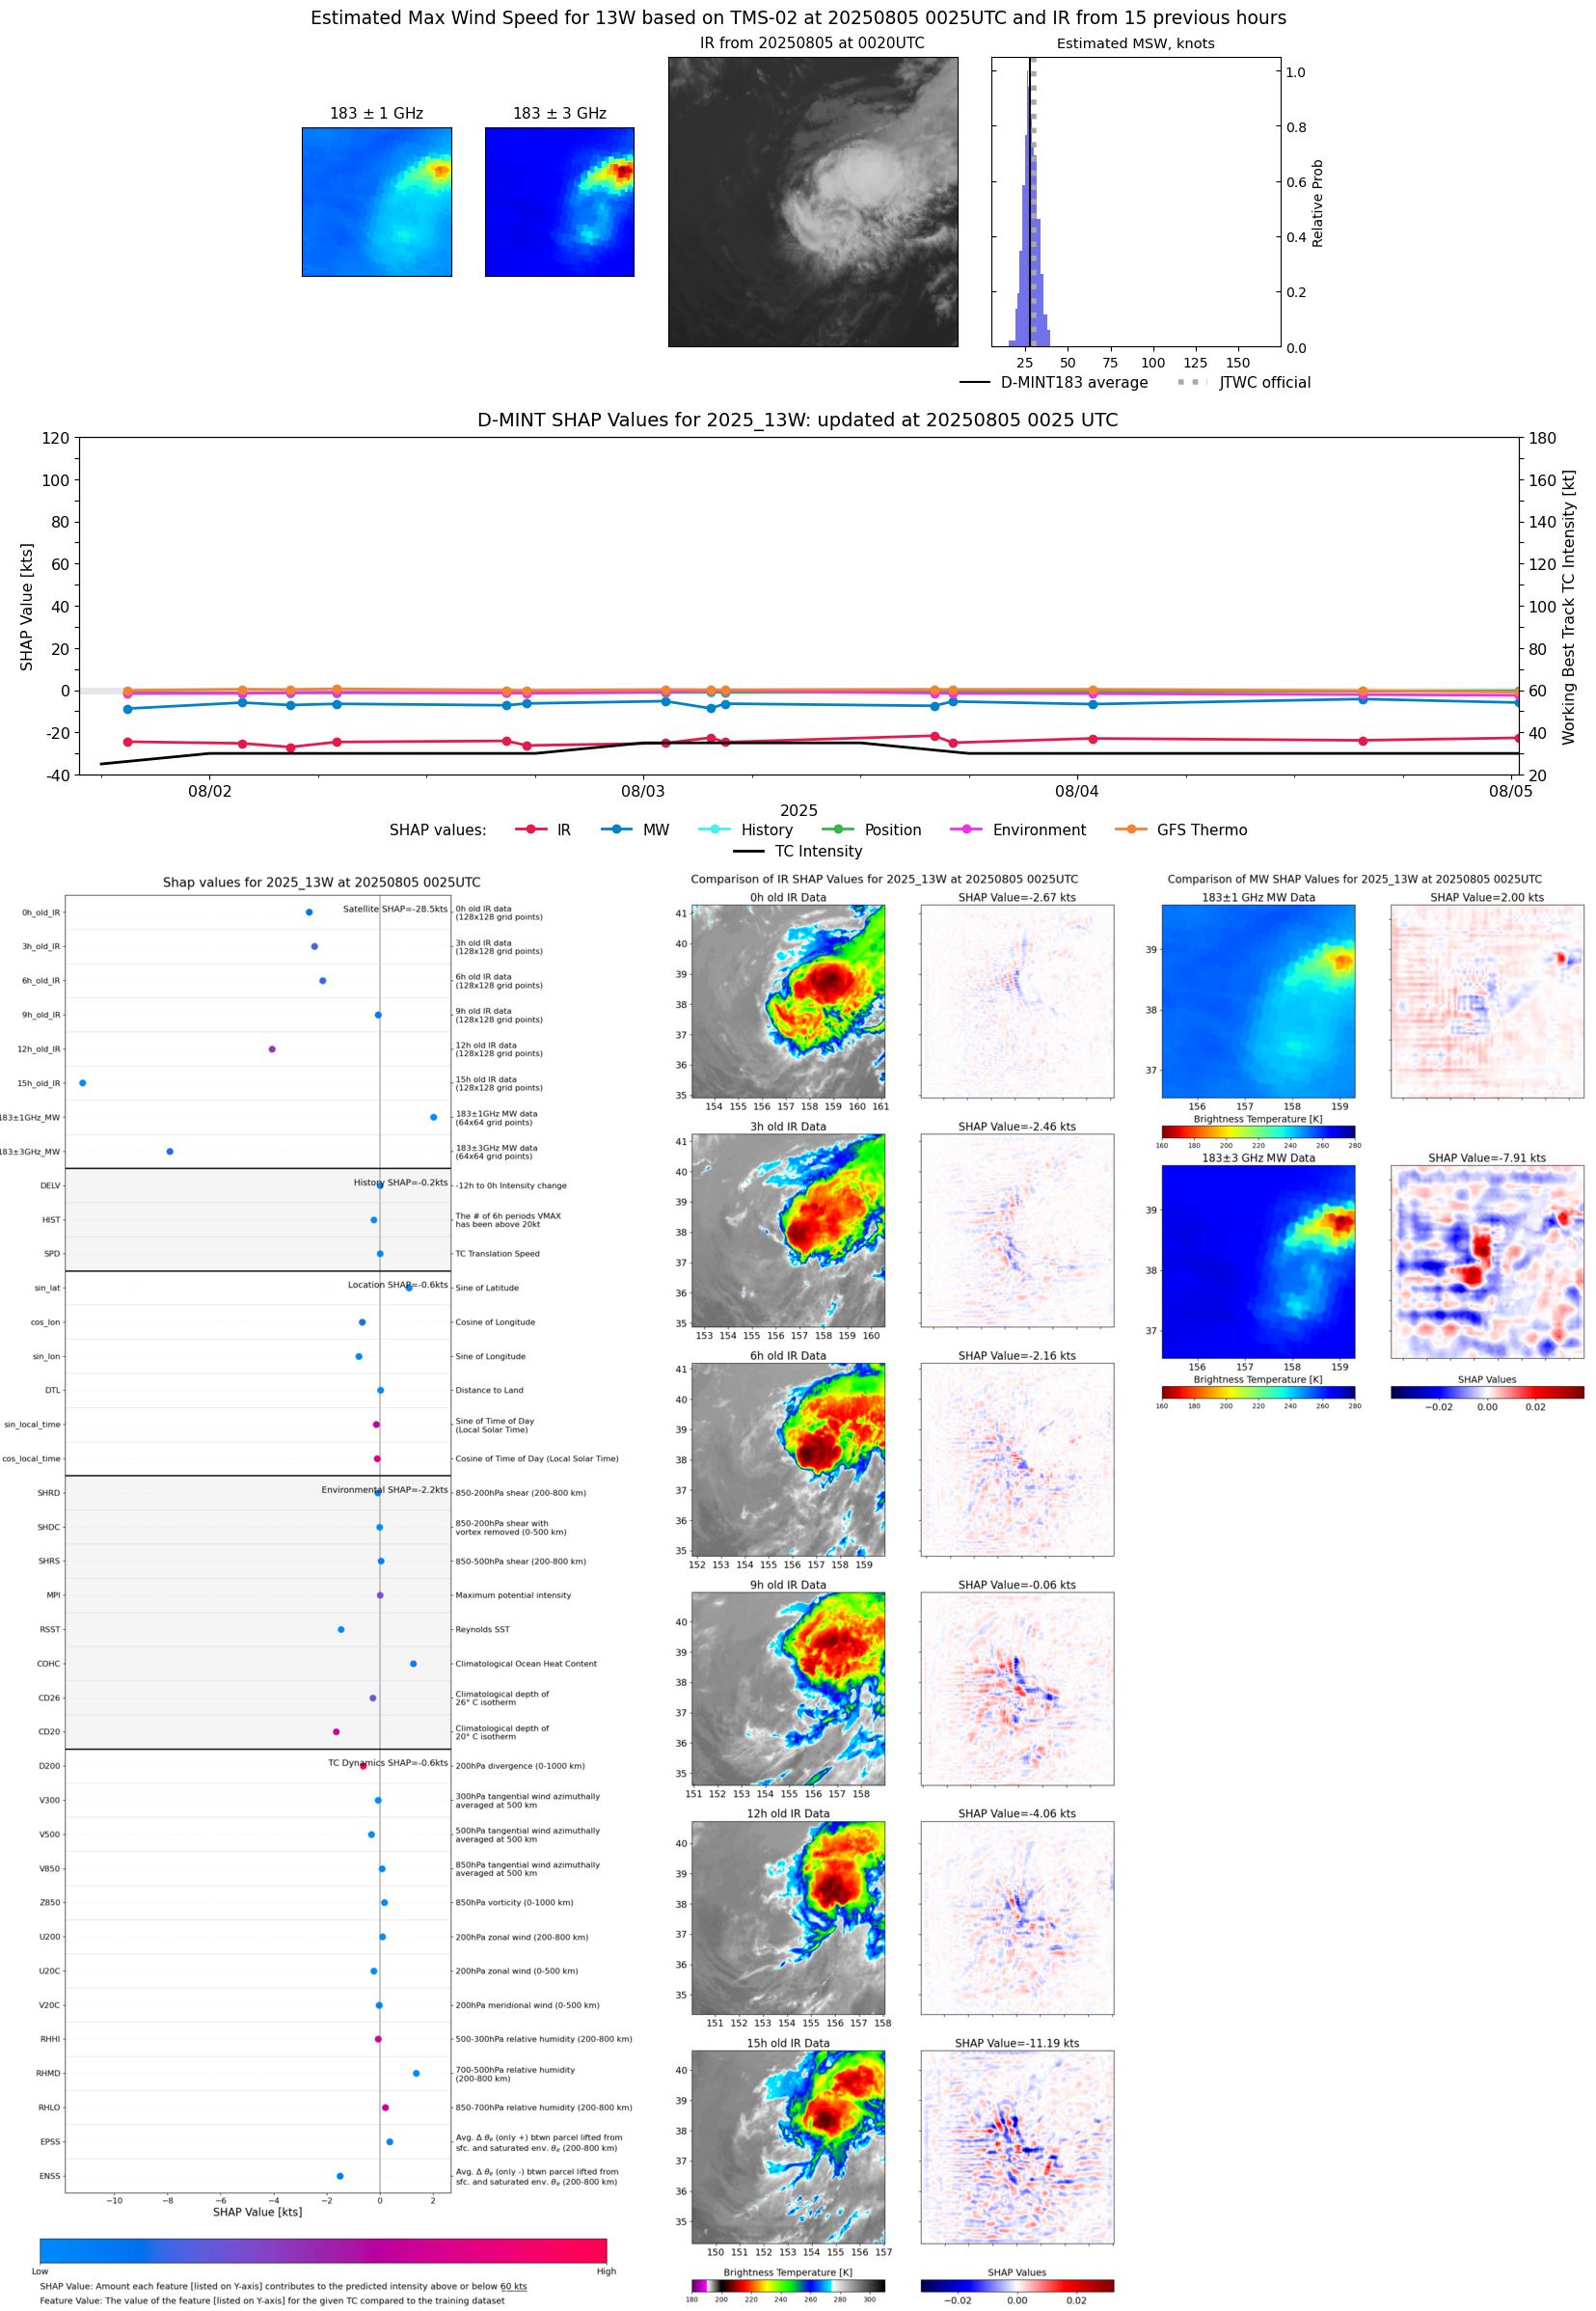 |
| 20250804 | 1545 UTC | ATMS-N21 | 999 hPa | 29 kts | 26 kts | 33 kts | 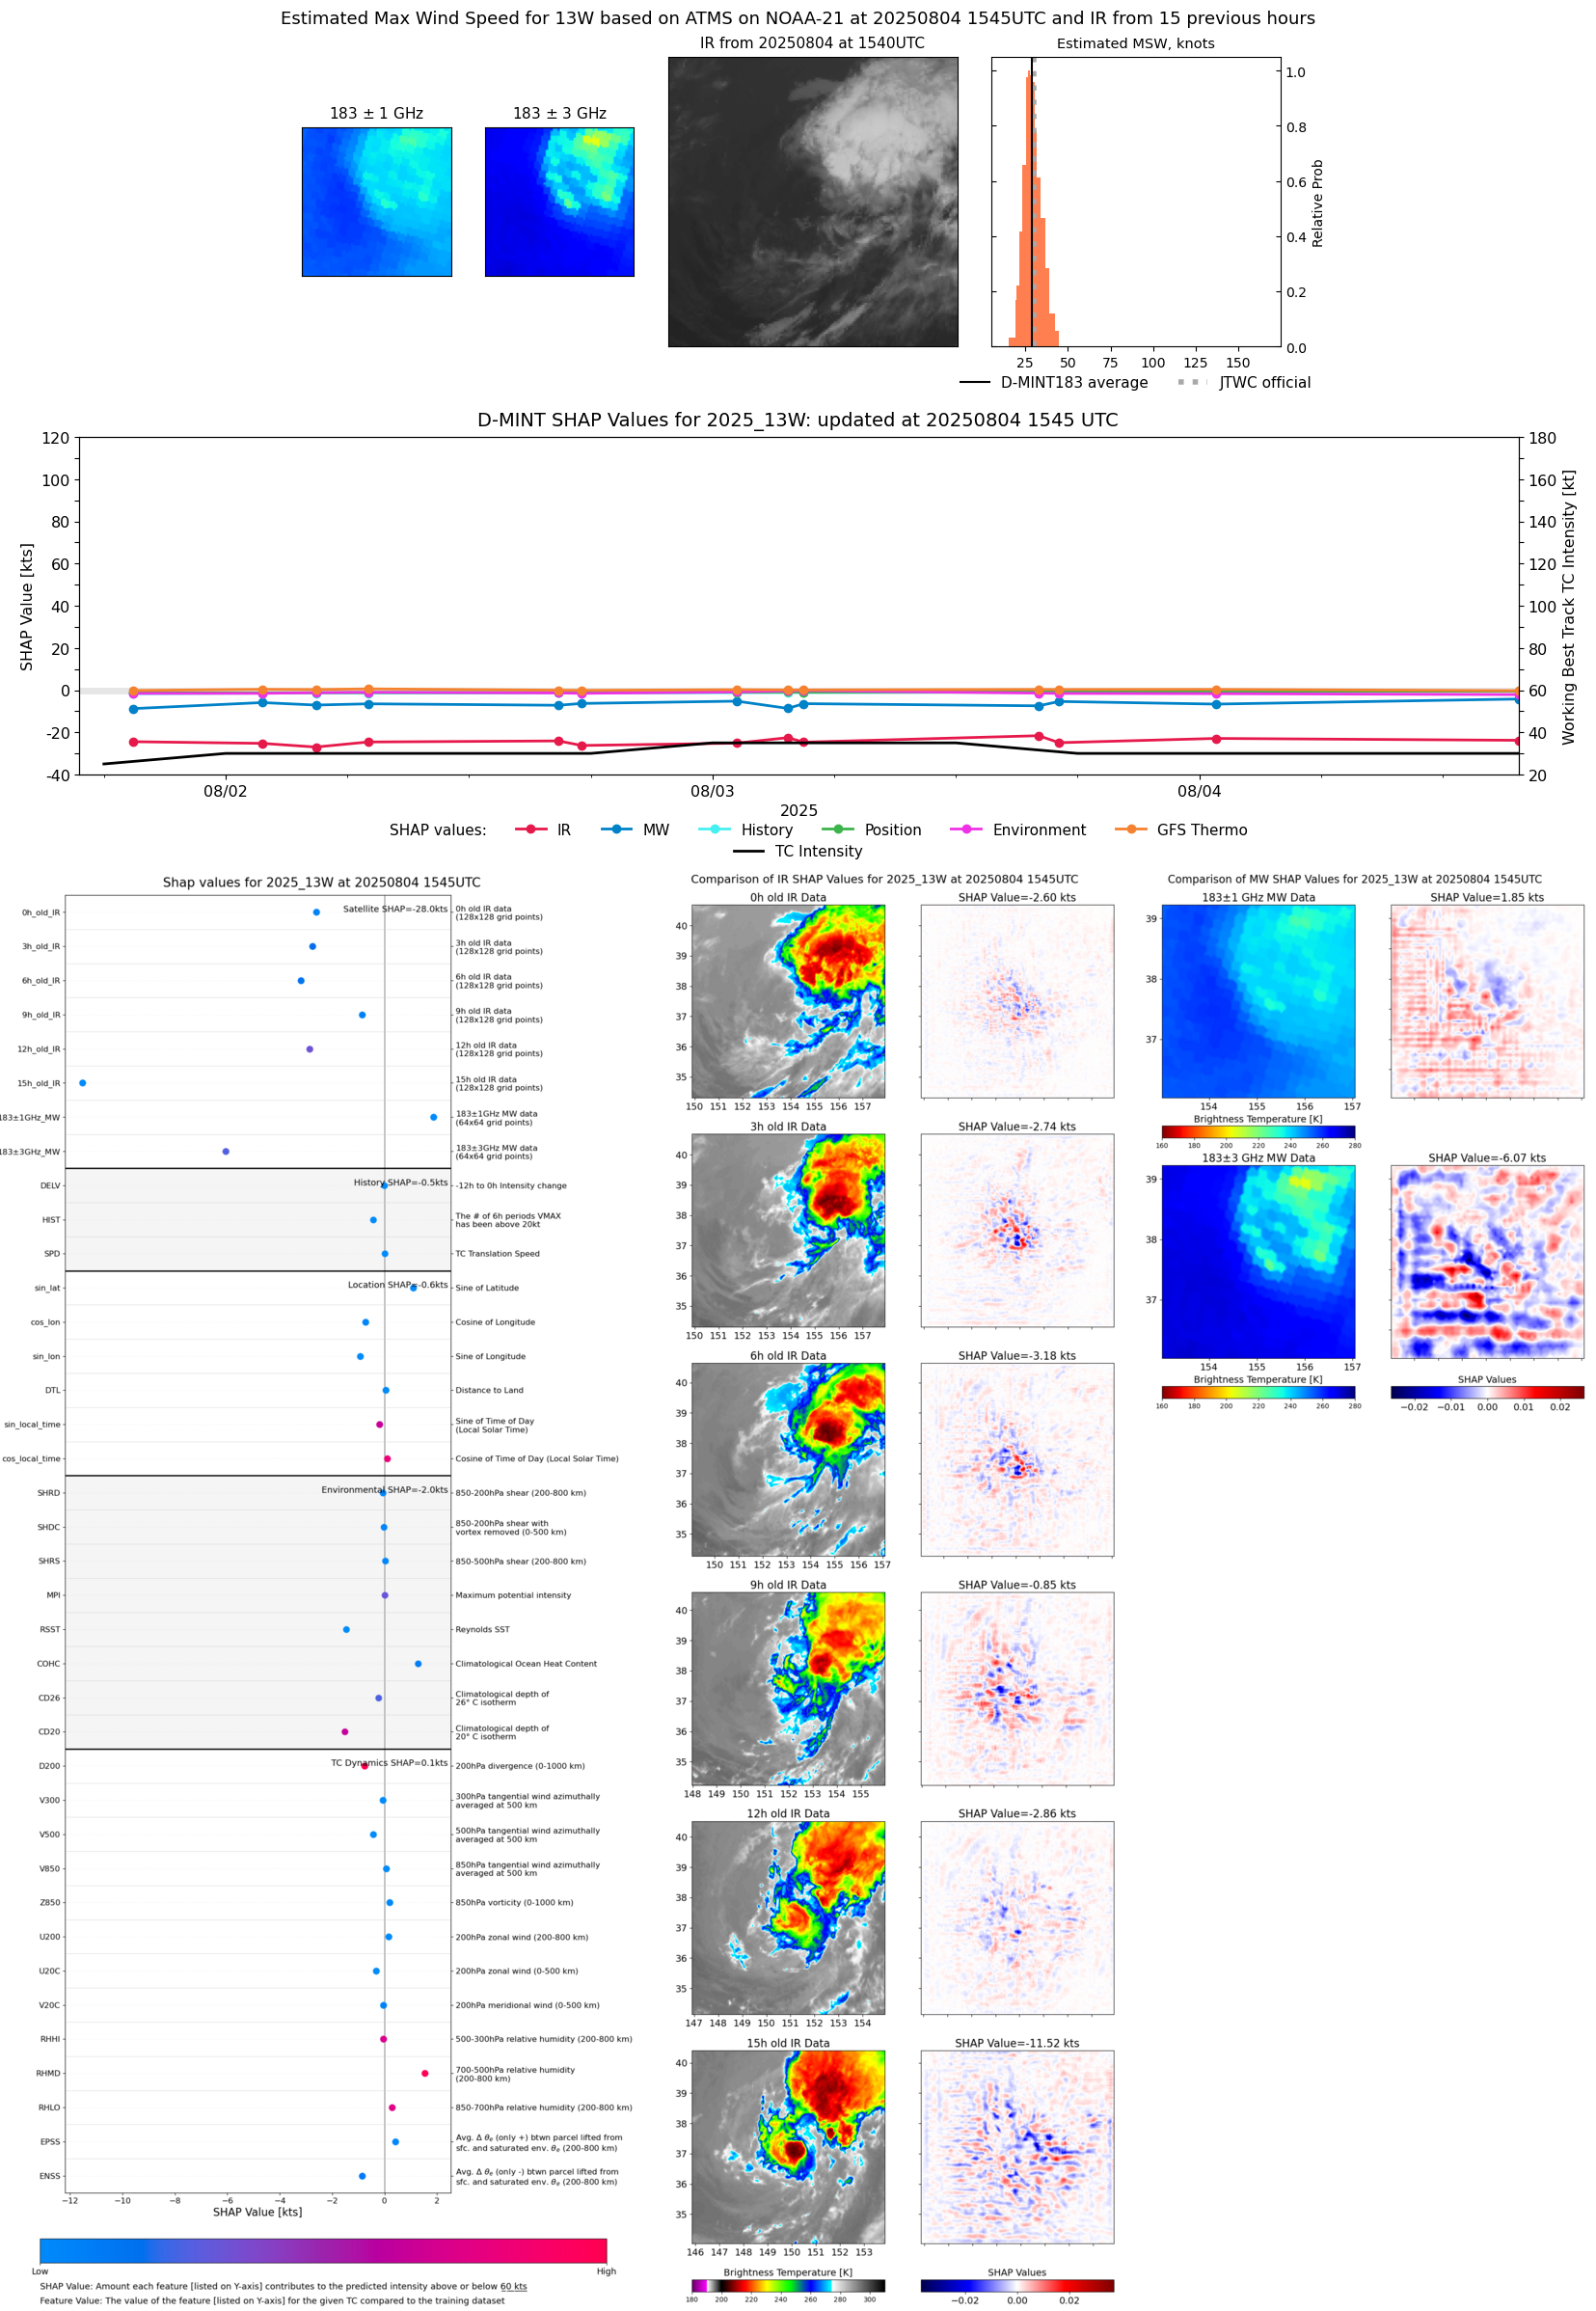 |
| 20250804 | 1338 UTC | GMI | 1001 hPa | 29 kts | 26 kts | 32 kts | 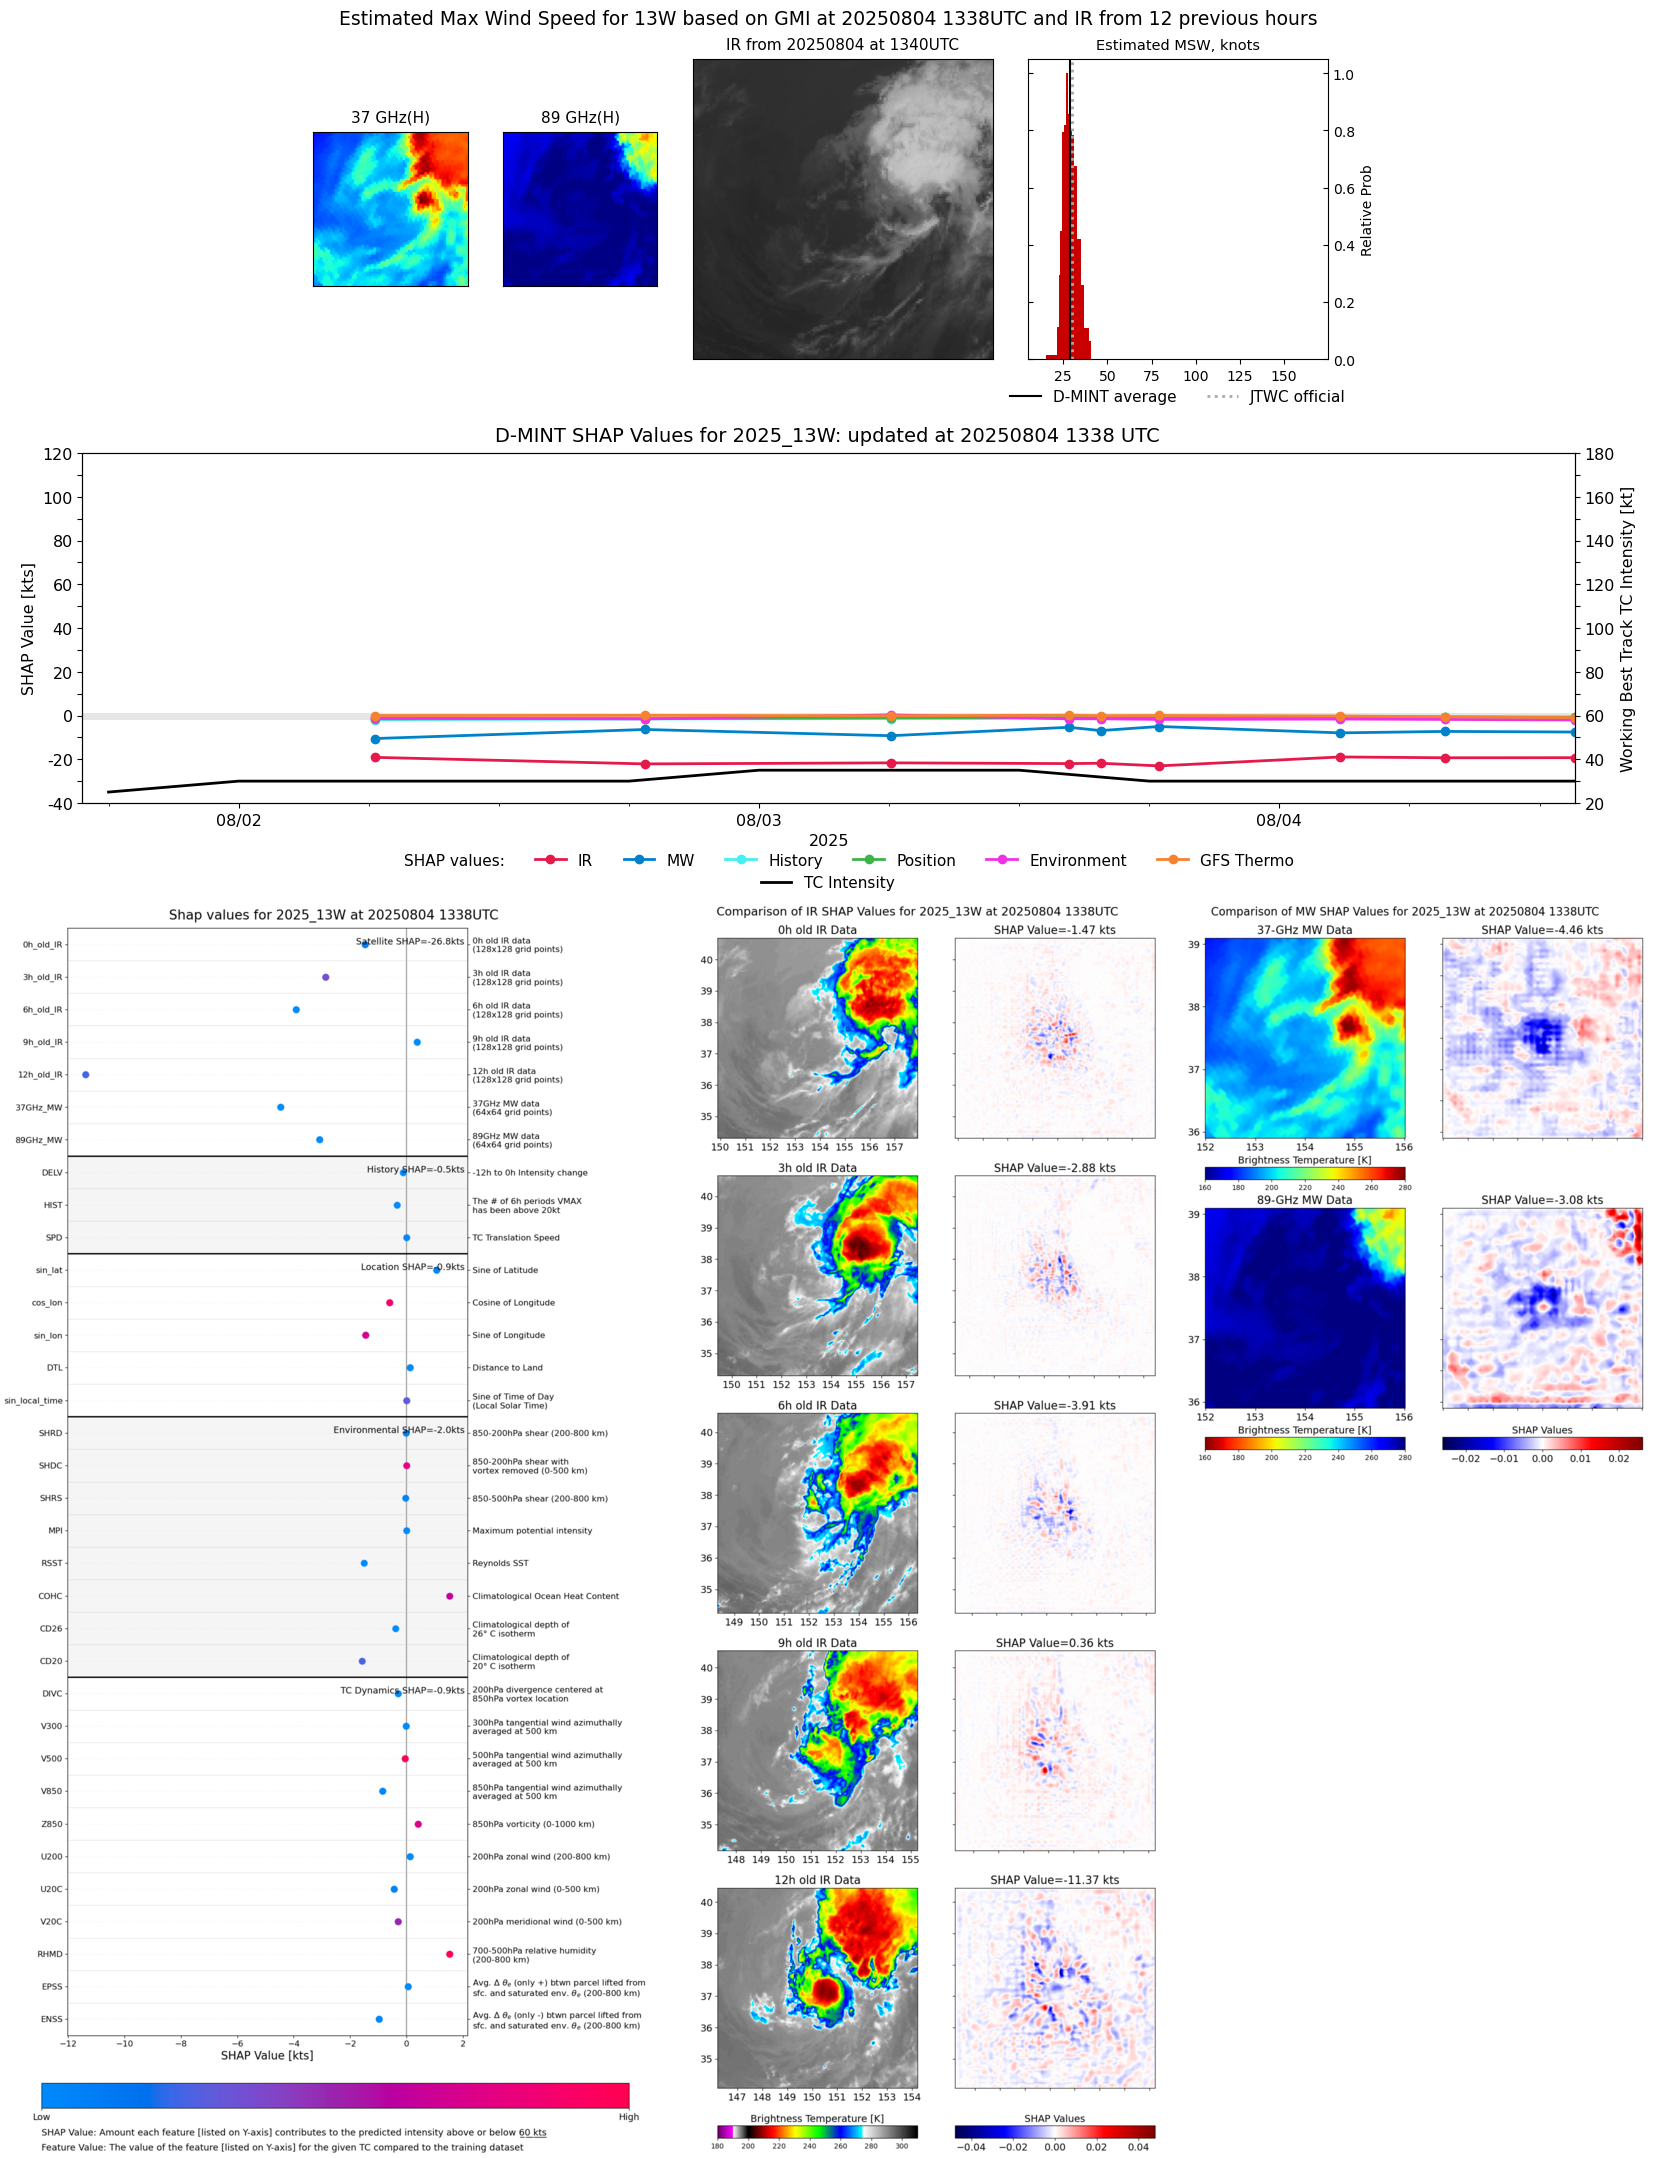 |
| 20250804 | 0738 UTC | SSMISF16 | 1000 hPa | 30 kts | 27 kts | 33 kts |  |
| 20250804 | 0716 UTC | SSMISF17 | 1000 hPa | 30 kts | 27 kts | 33 kts |  |
| 20250804 | 0248 UTC | AMSR2 | 1002 hPa | 30 kts | 27 kts | 33 kts | 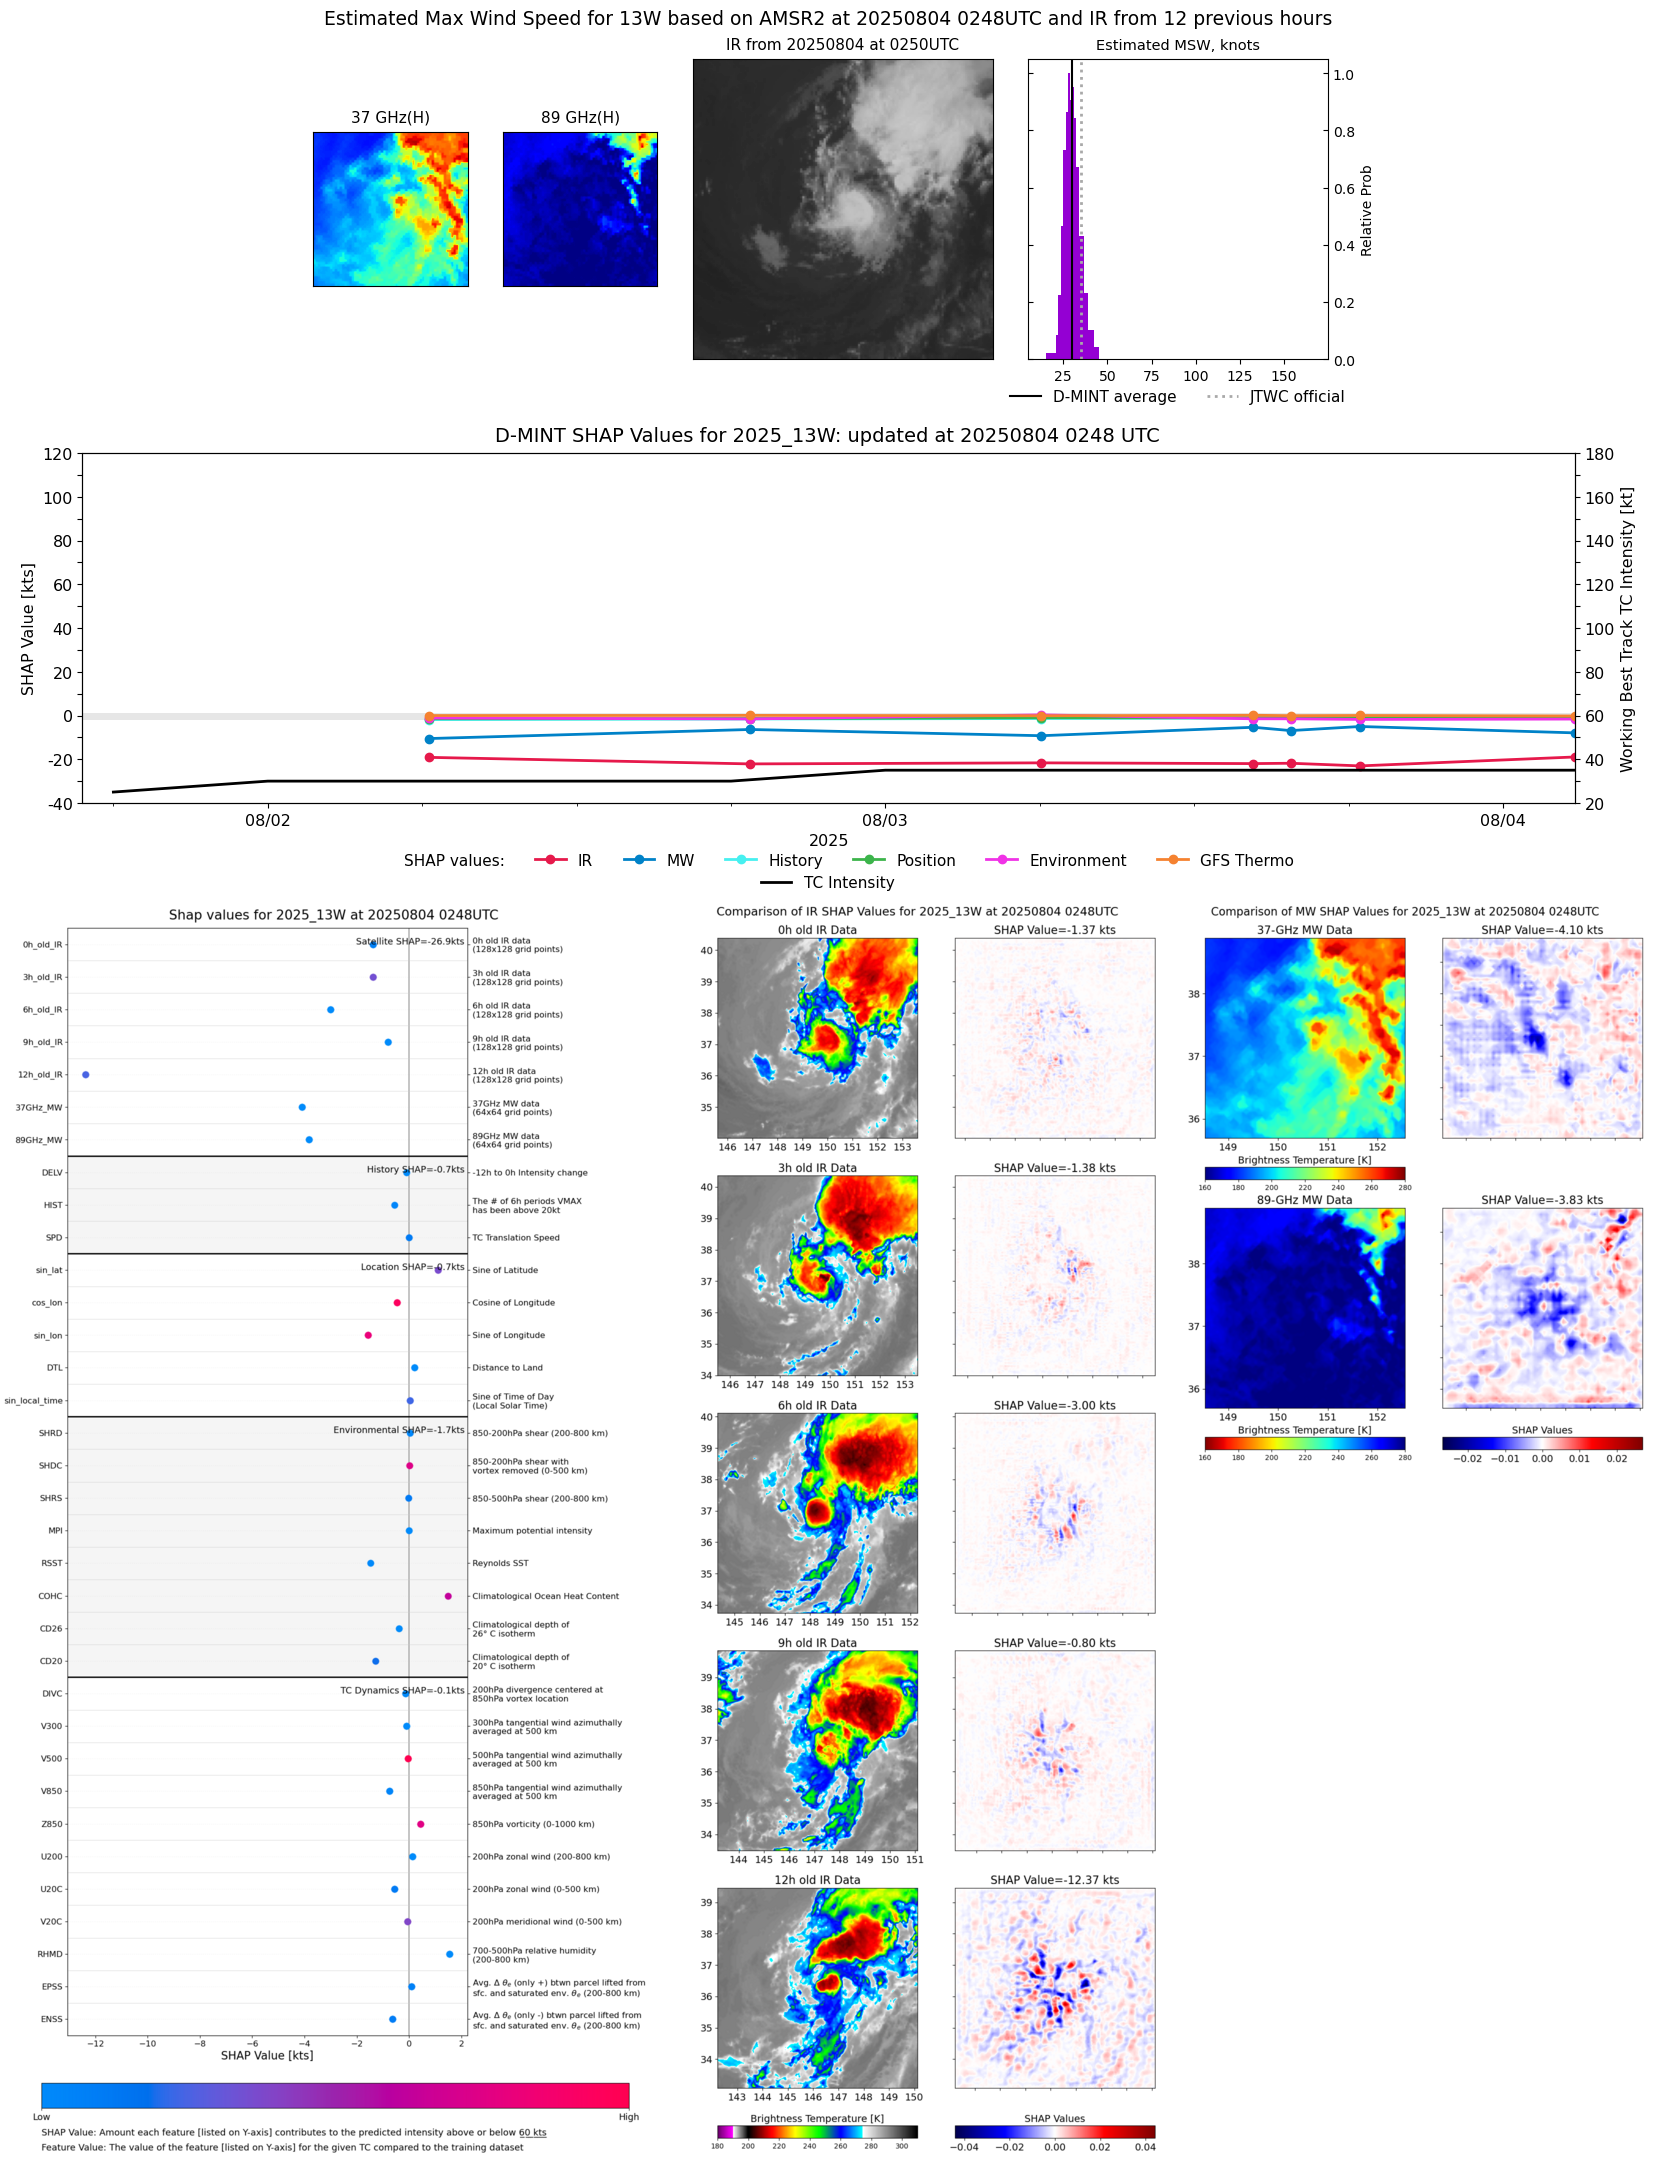 |
| 20250804 | 0049 UTC | TMS02 | 1001 hPa | 28 kts | 25 kts | 32 kts | 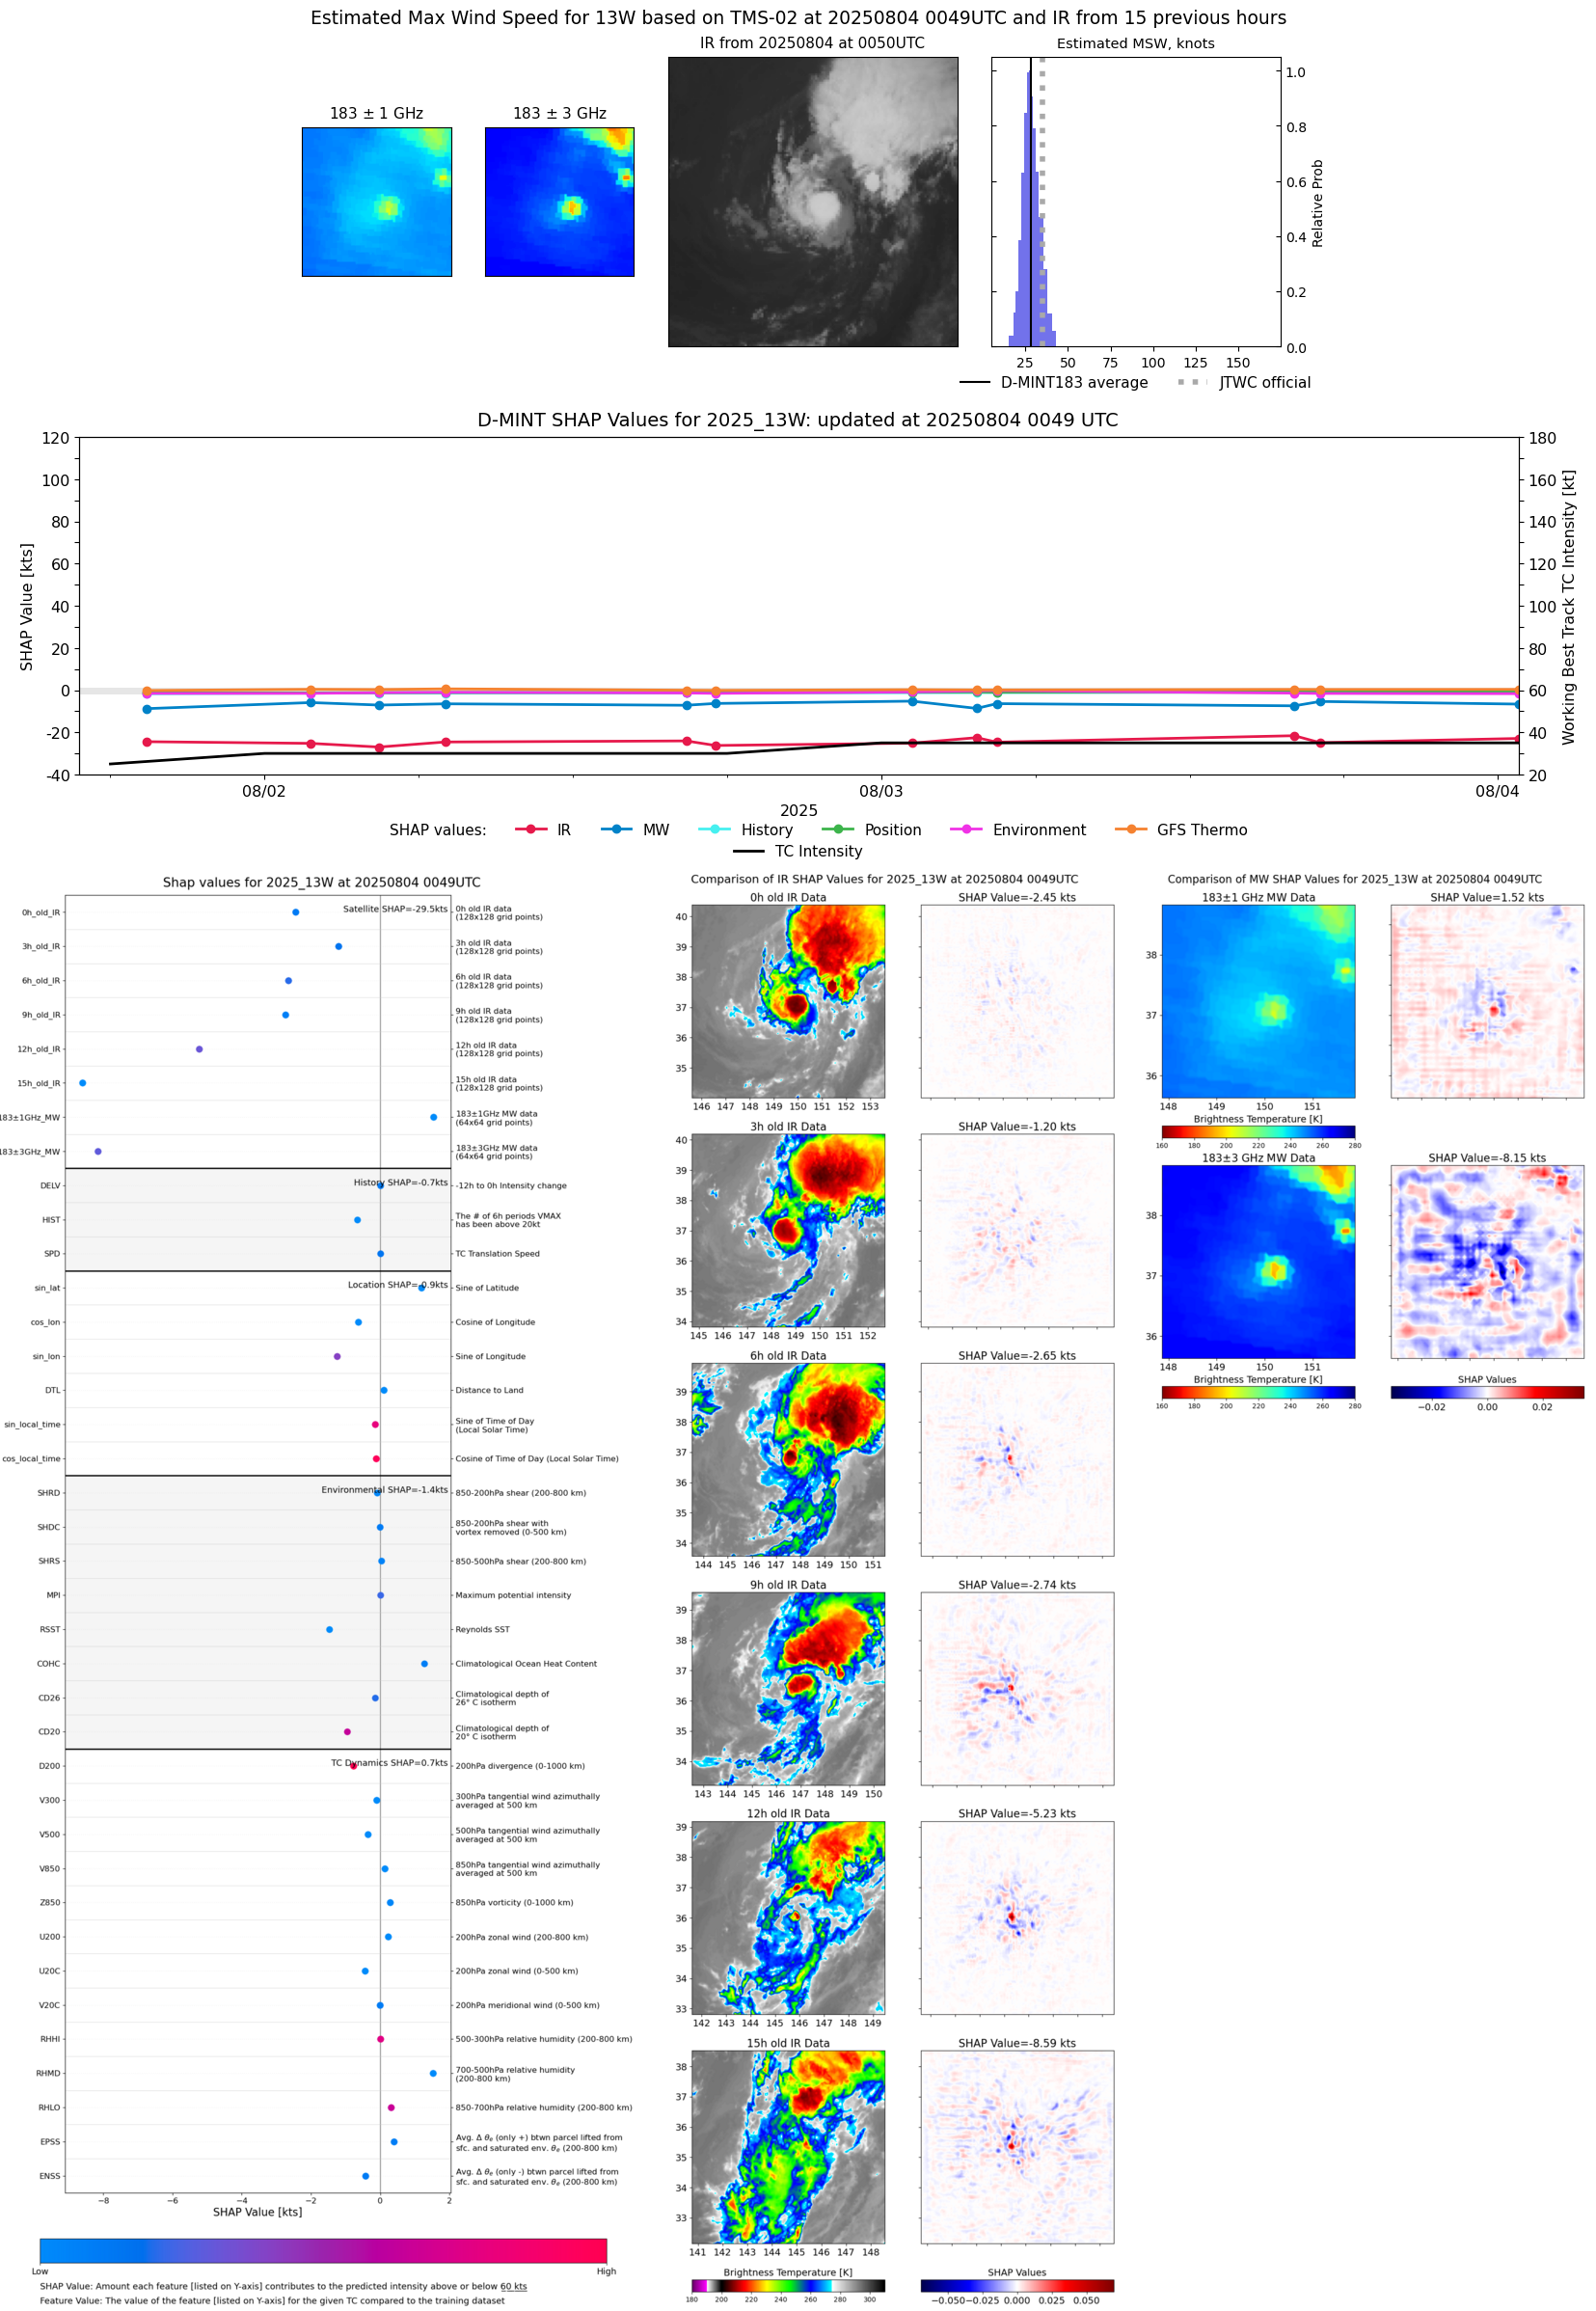 |
| 20250803 | 1827 UTC | SSMISF18 | 999 hPa | 28 kts | 25 kts | 32 kts | 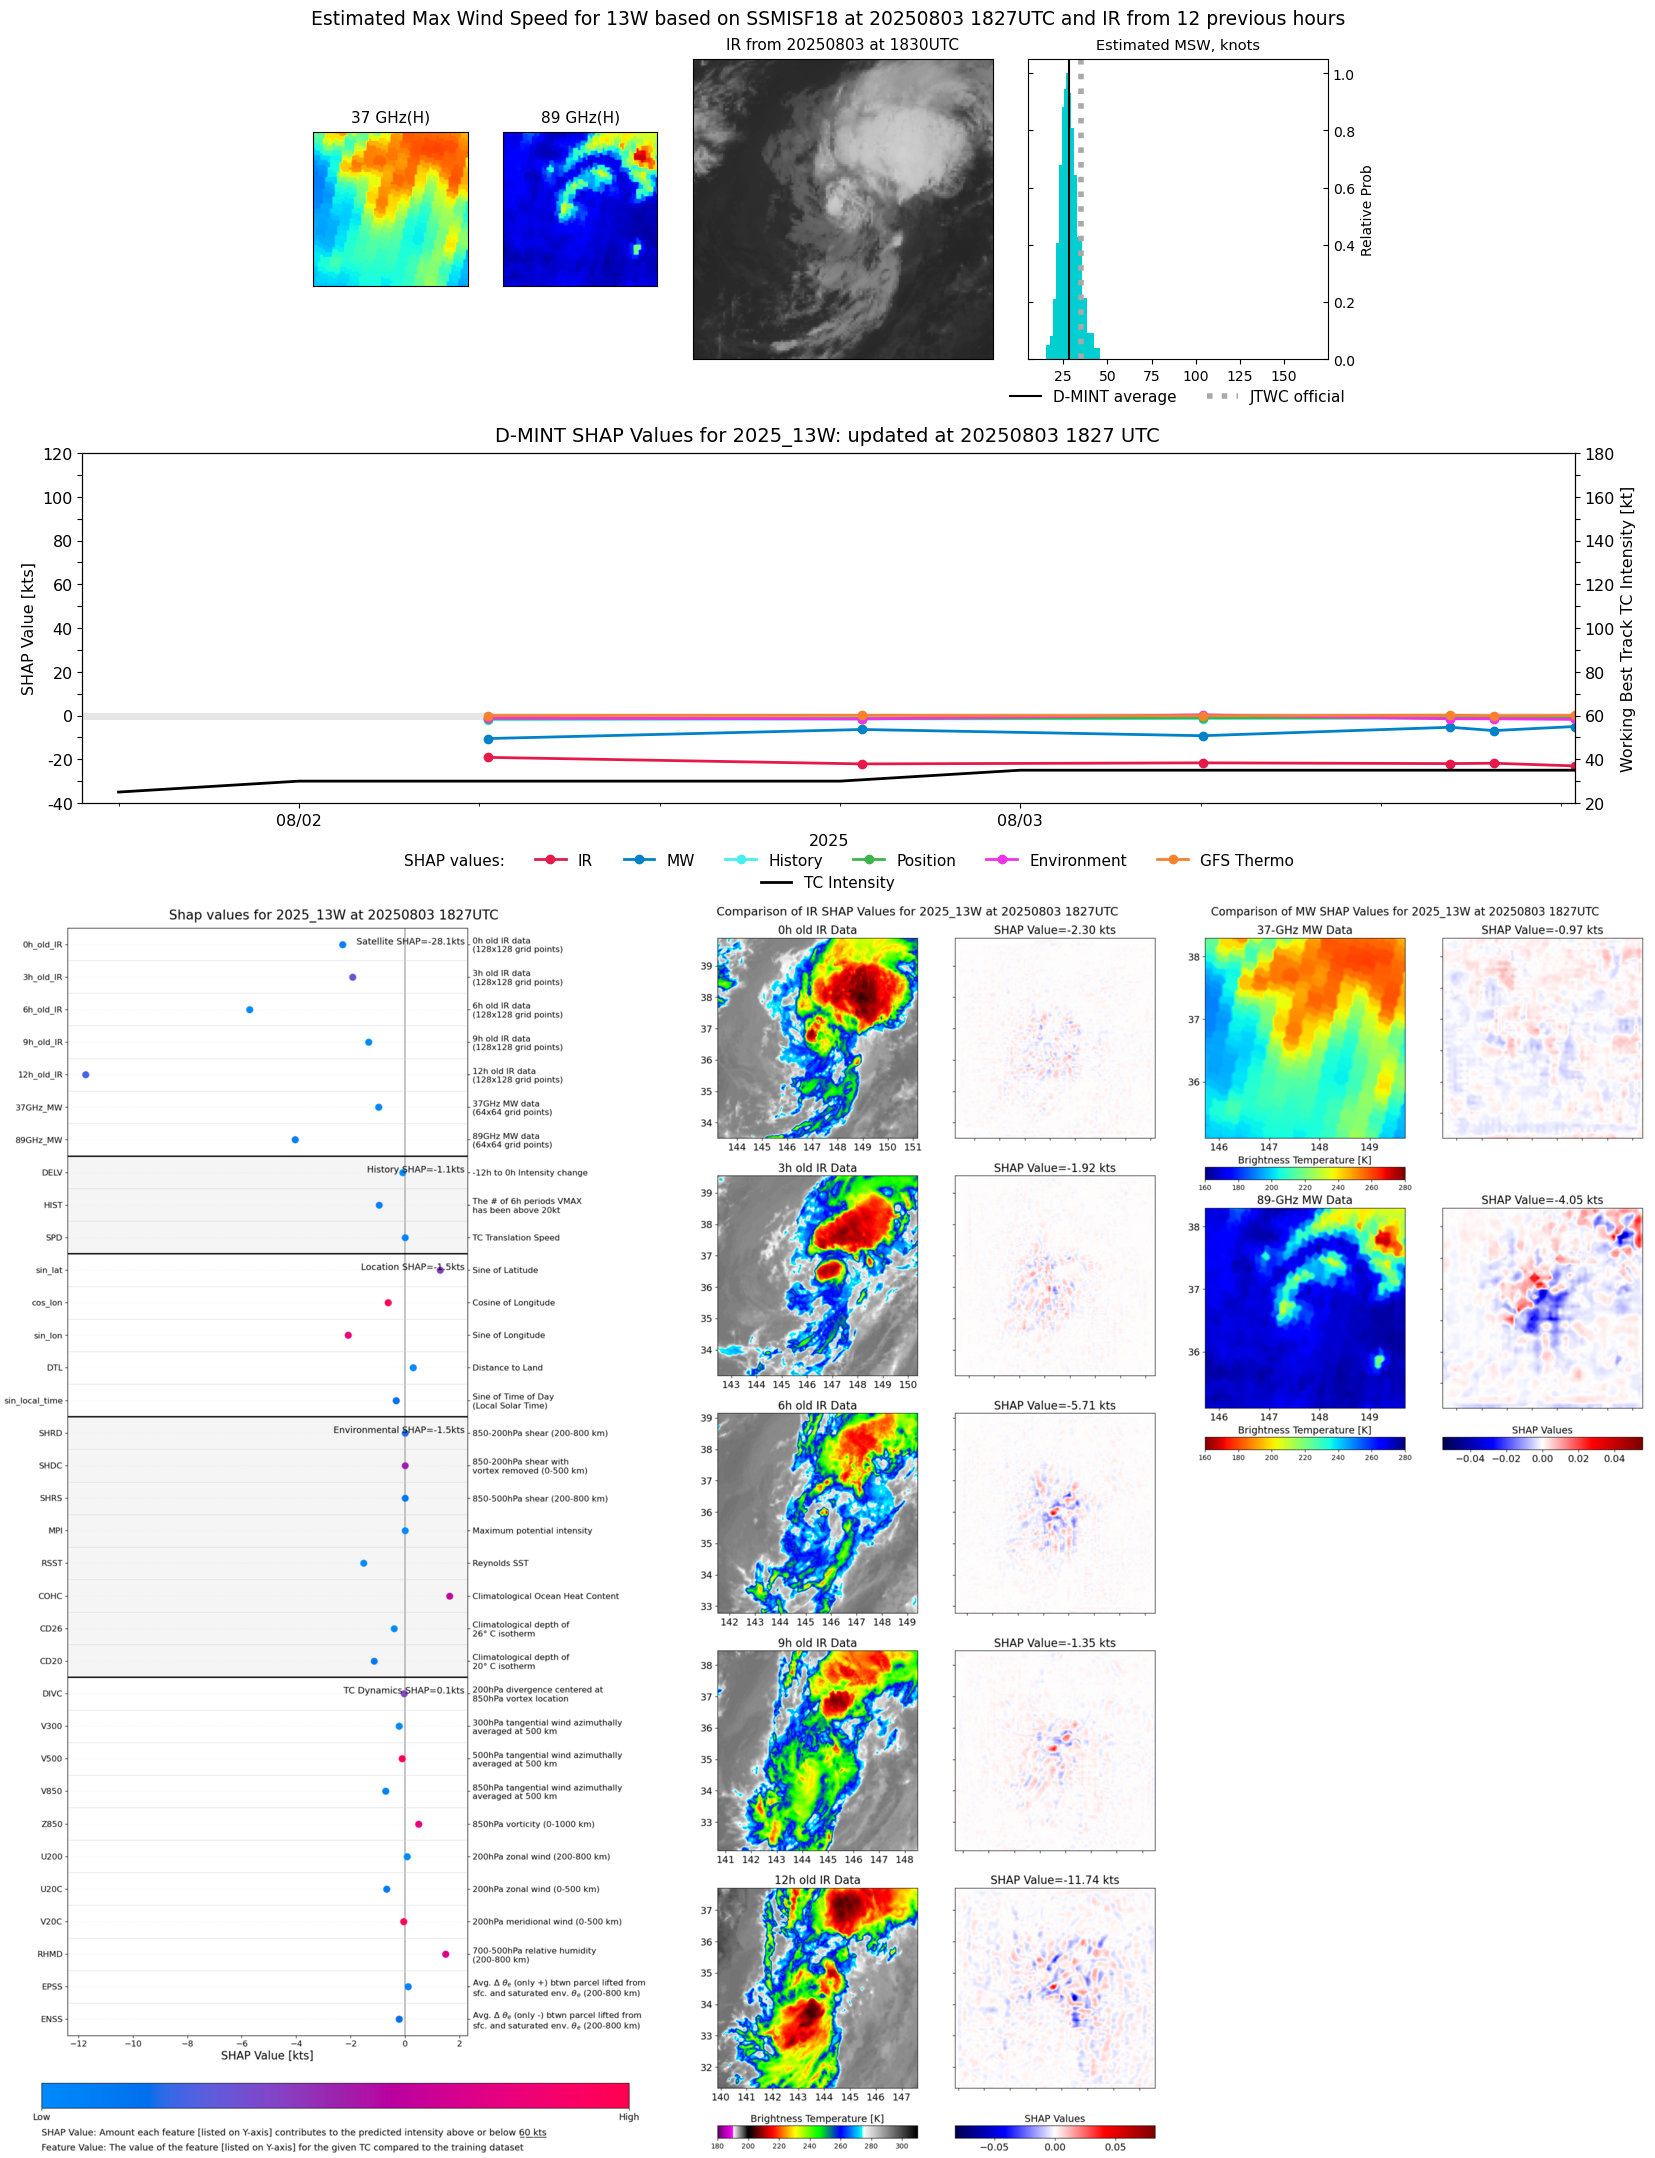 |
| 20250803 | 1705 UTC | TMS03 | 999 hPa | 27 kts | 24 kts | 31 kts | 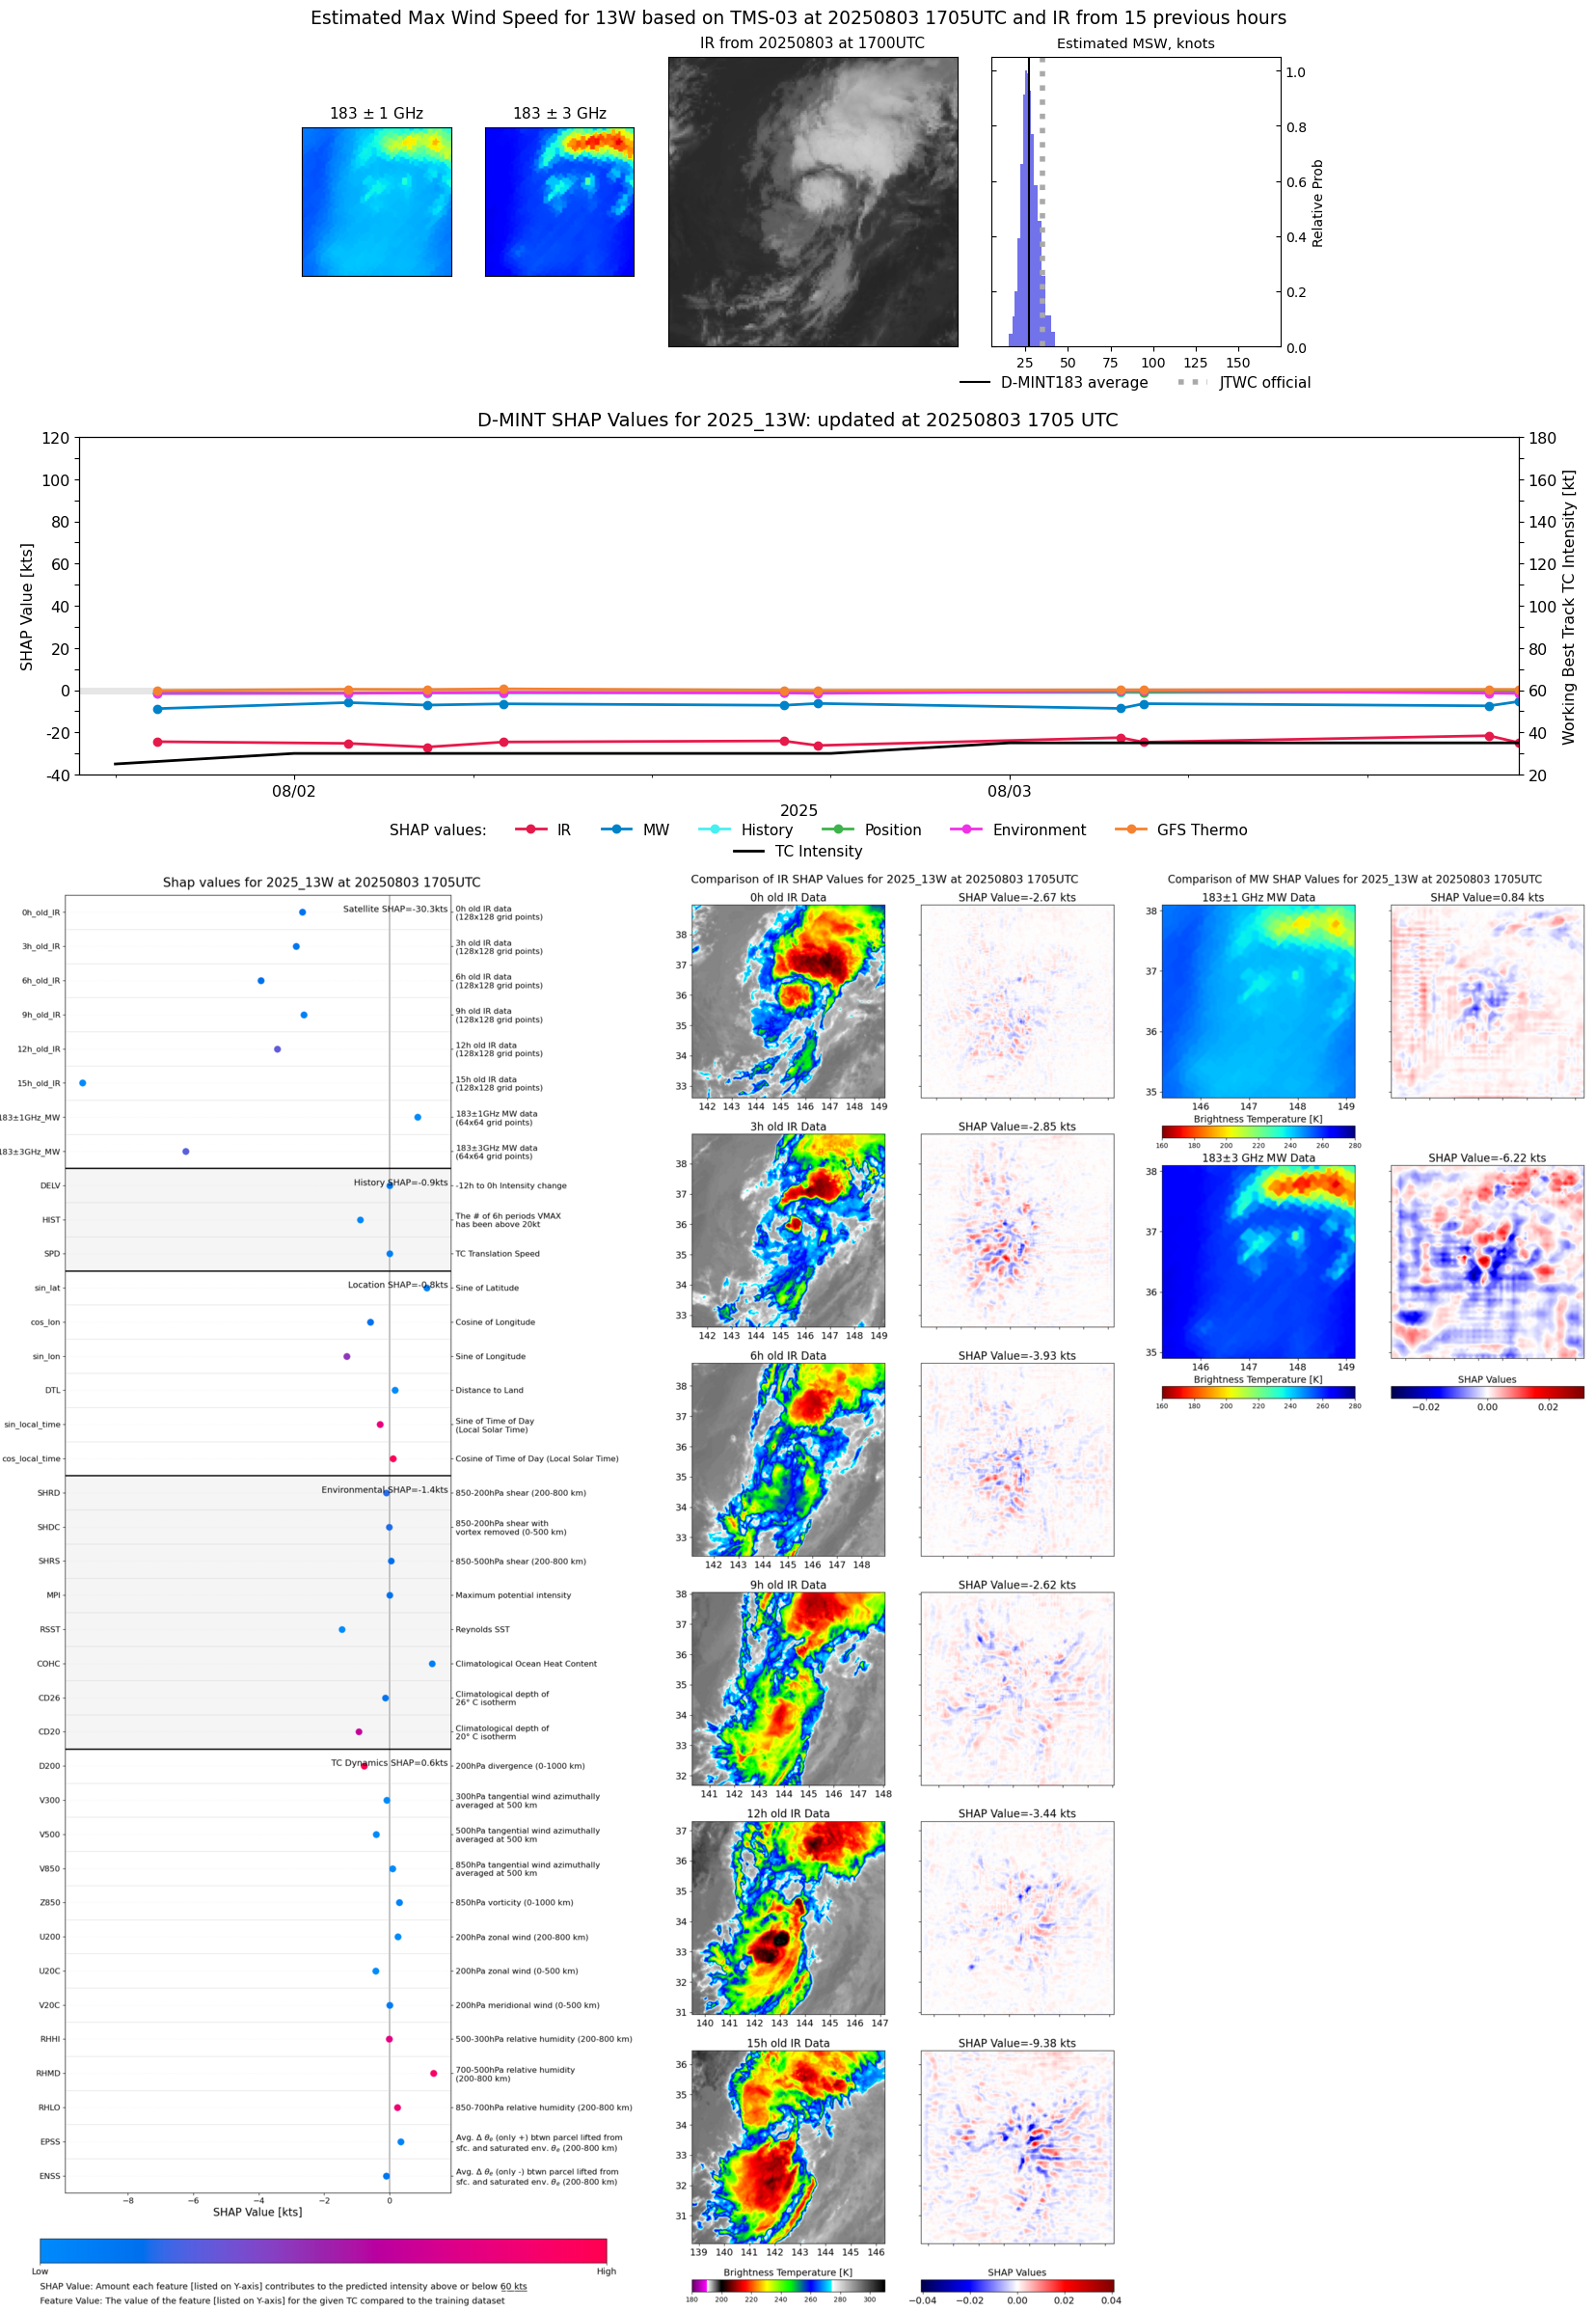 |
| 20250803 | 1605 UTC | ATMS-N21 | 997 hPa | 29 kts | 25 kts | 33 kts | 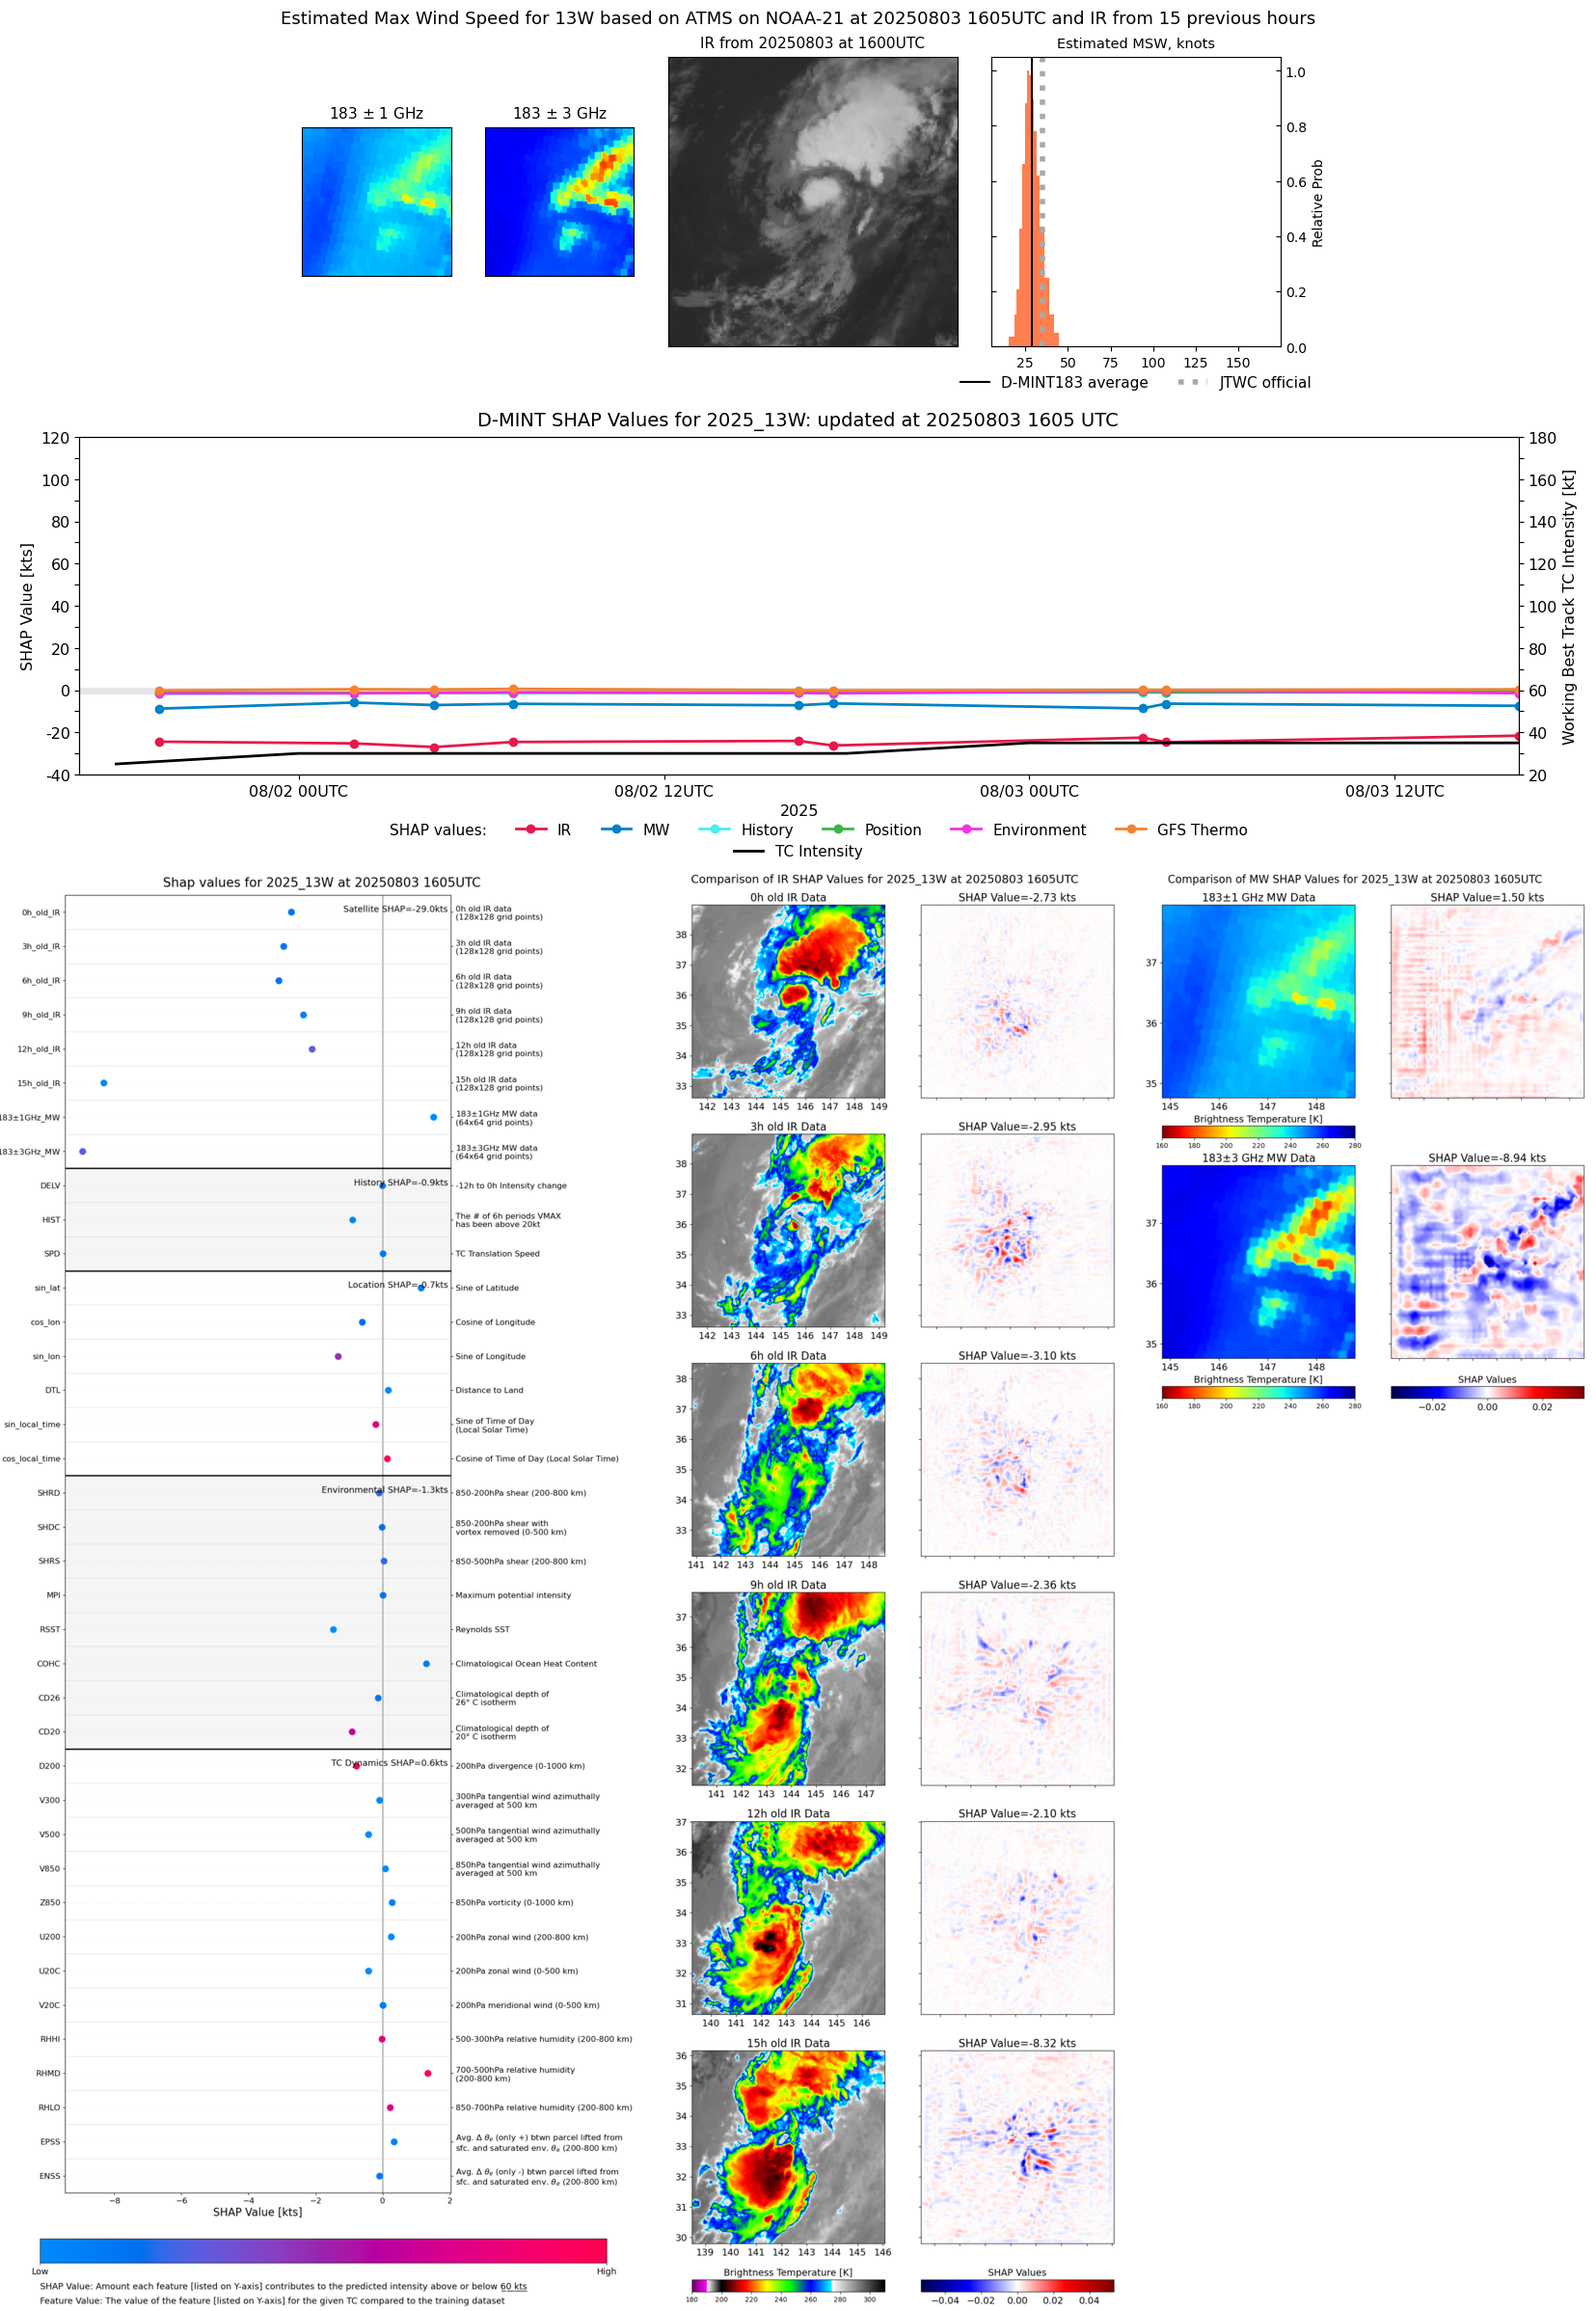 |
| 20250803 | 1545 UTC | AMSR2 | 1000 hPa | 28 kts | 25 kts | 31 kts | 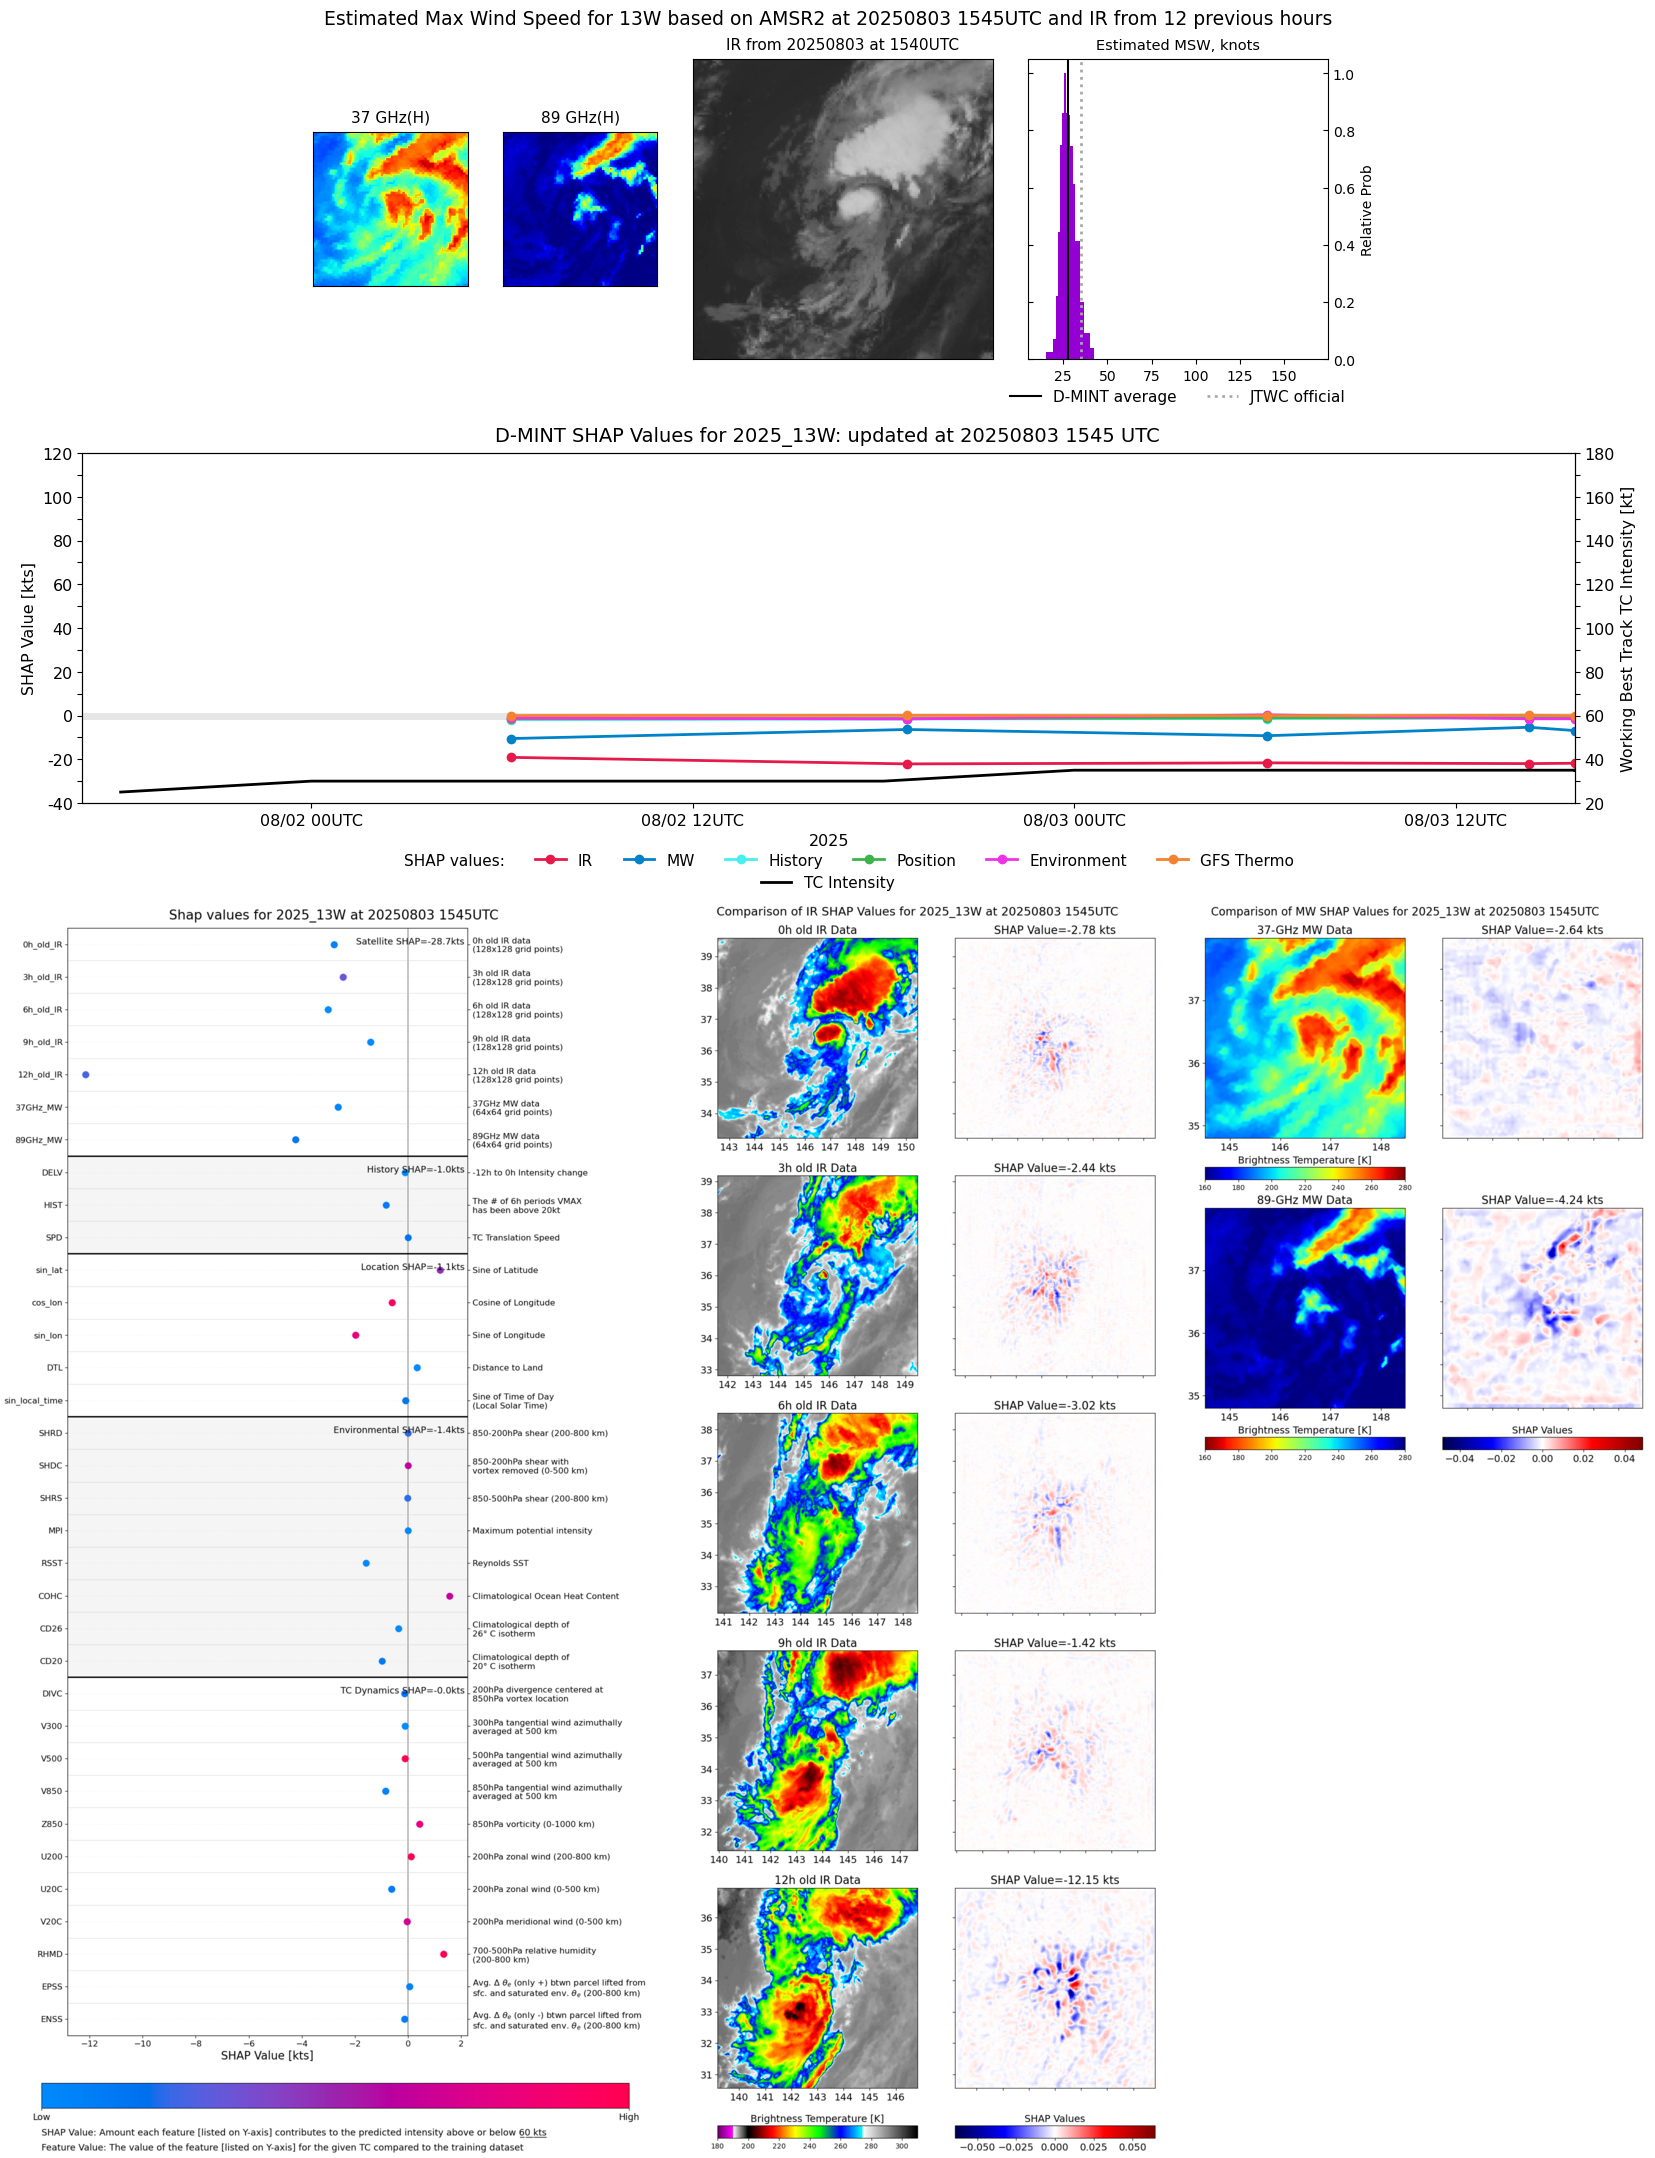 |
| 20250803 | 1418 UTC | GMI | 999 hPa | 29 kts | 26 kts | 33 kts |  |
| 20250803 | 0604 UTC | SSMISF18 | 997 hPa | 27 kts | 24 kts | 30 kts | 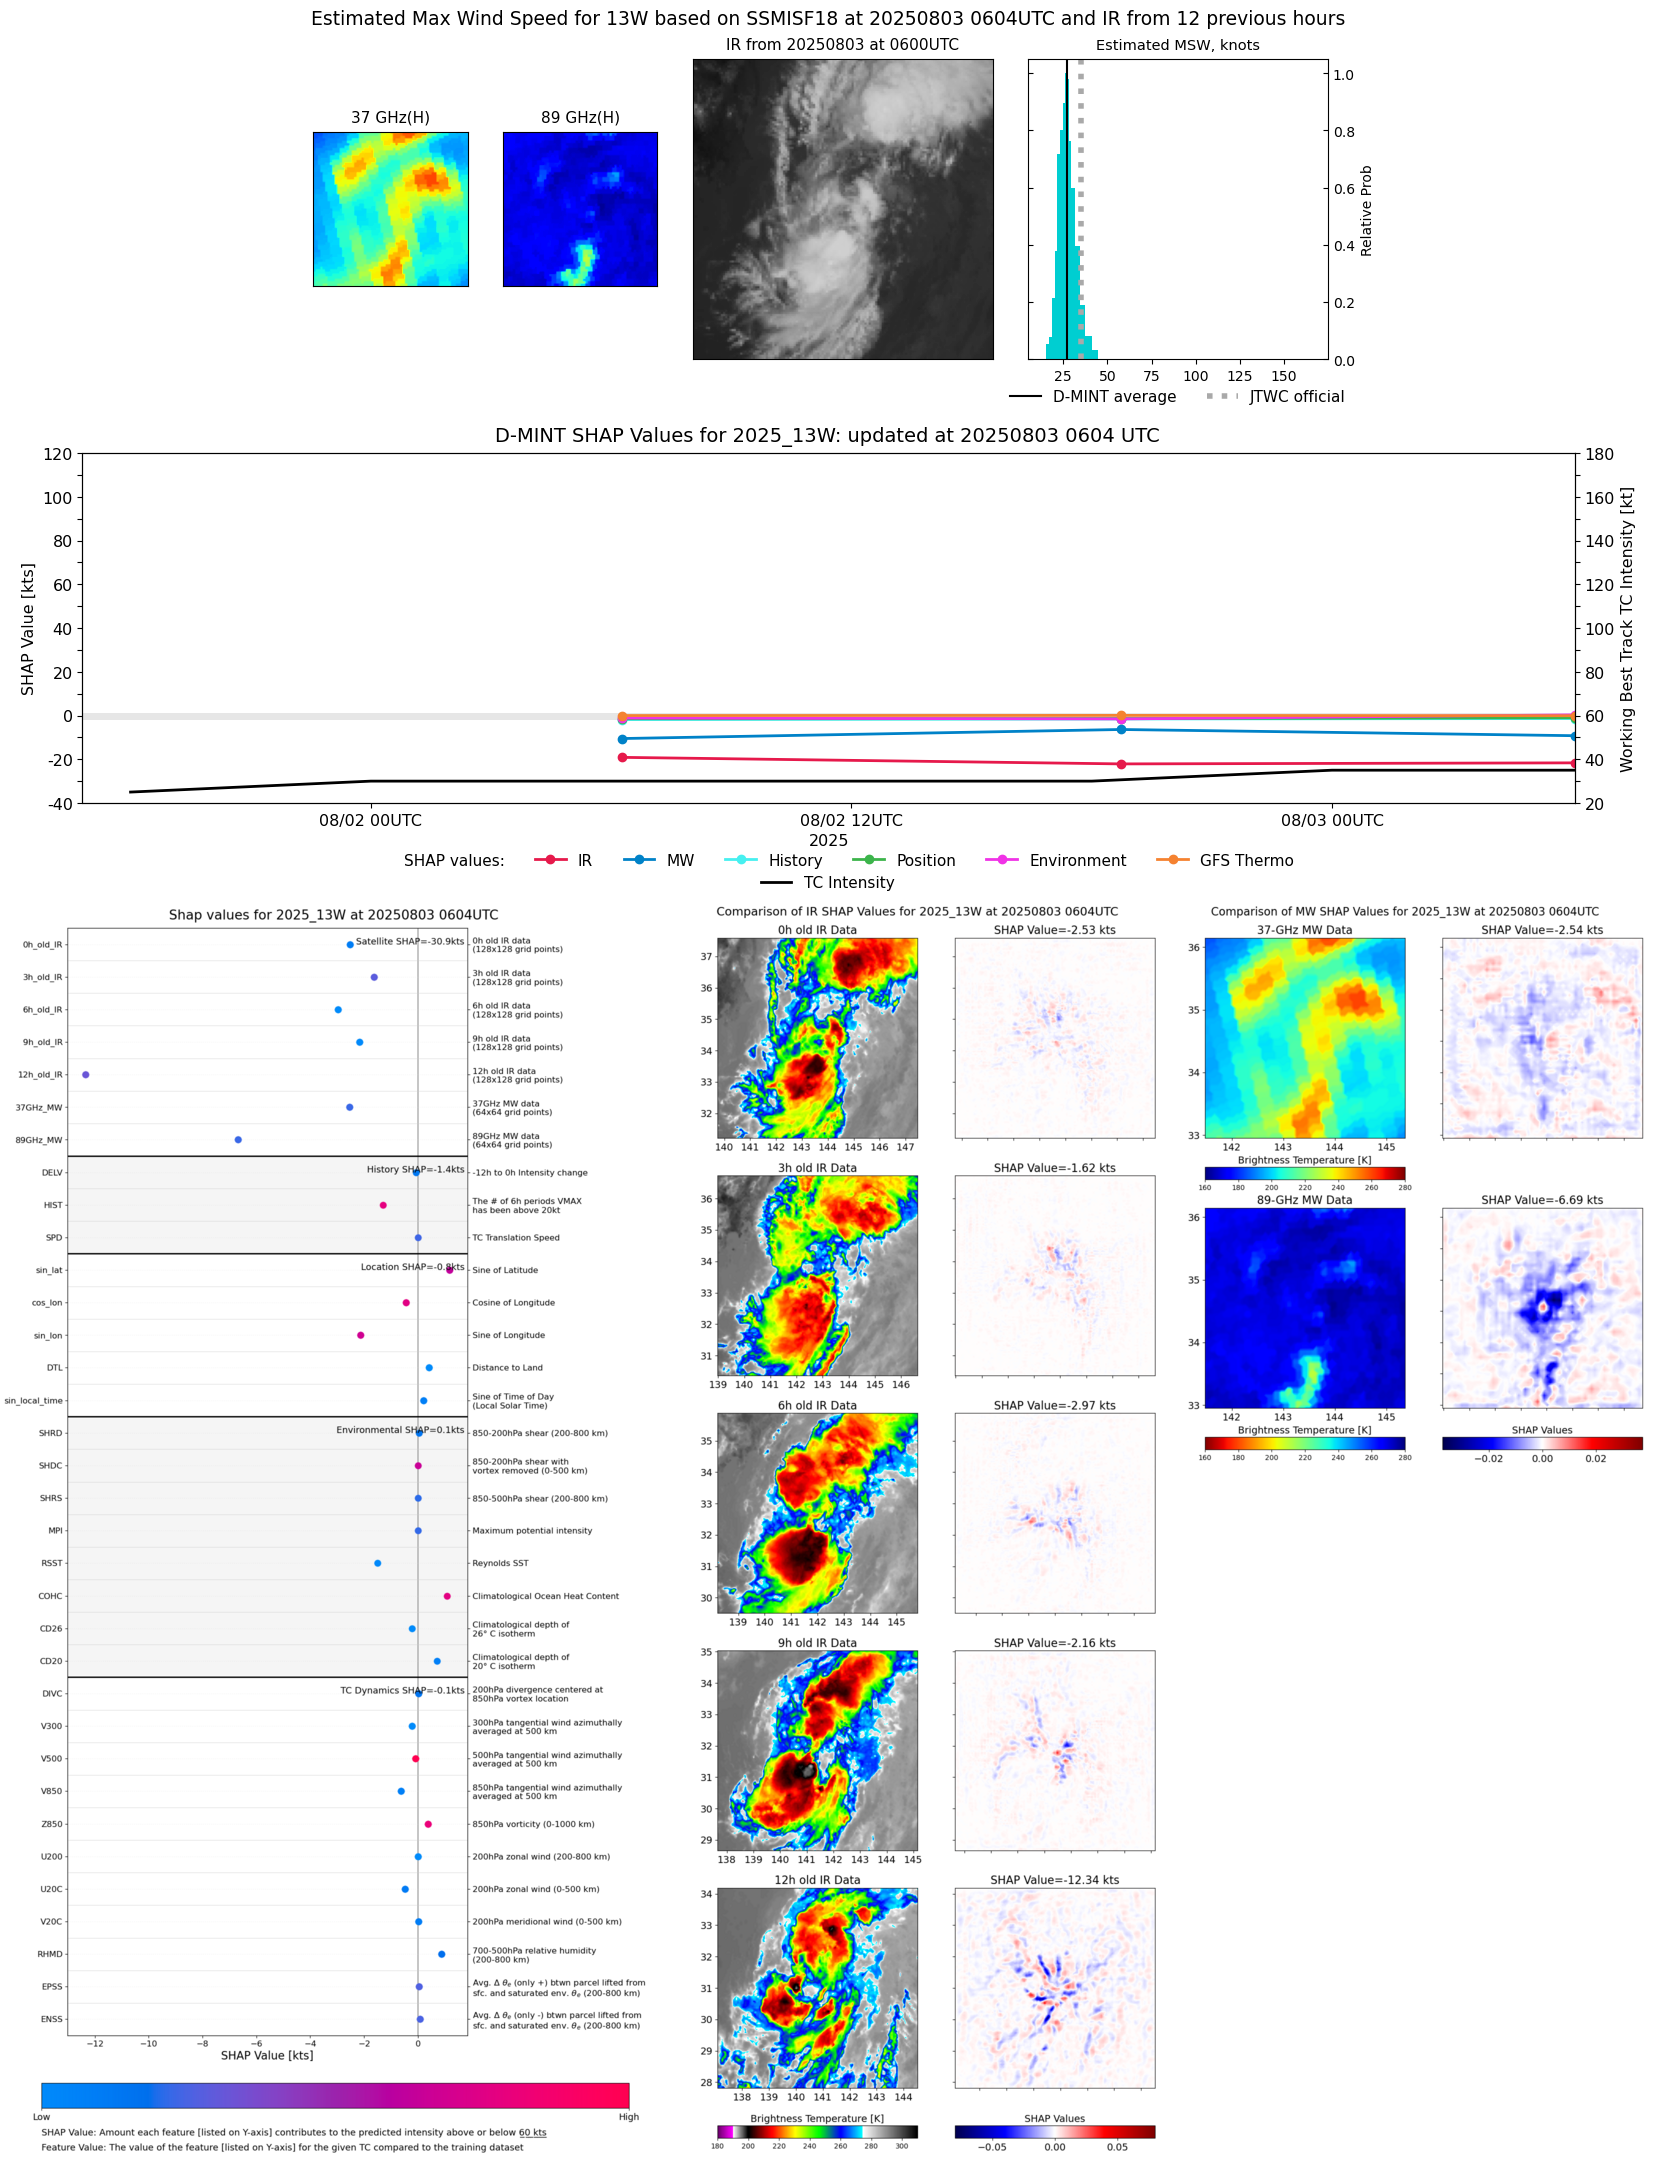 |
| 20250803 | 0430 UTC | TROPICS03 | 997 hPa | 27 kts | 24 kts | 30 kts | 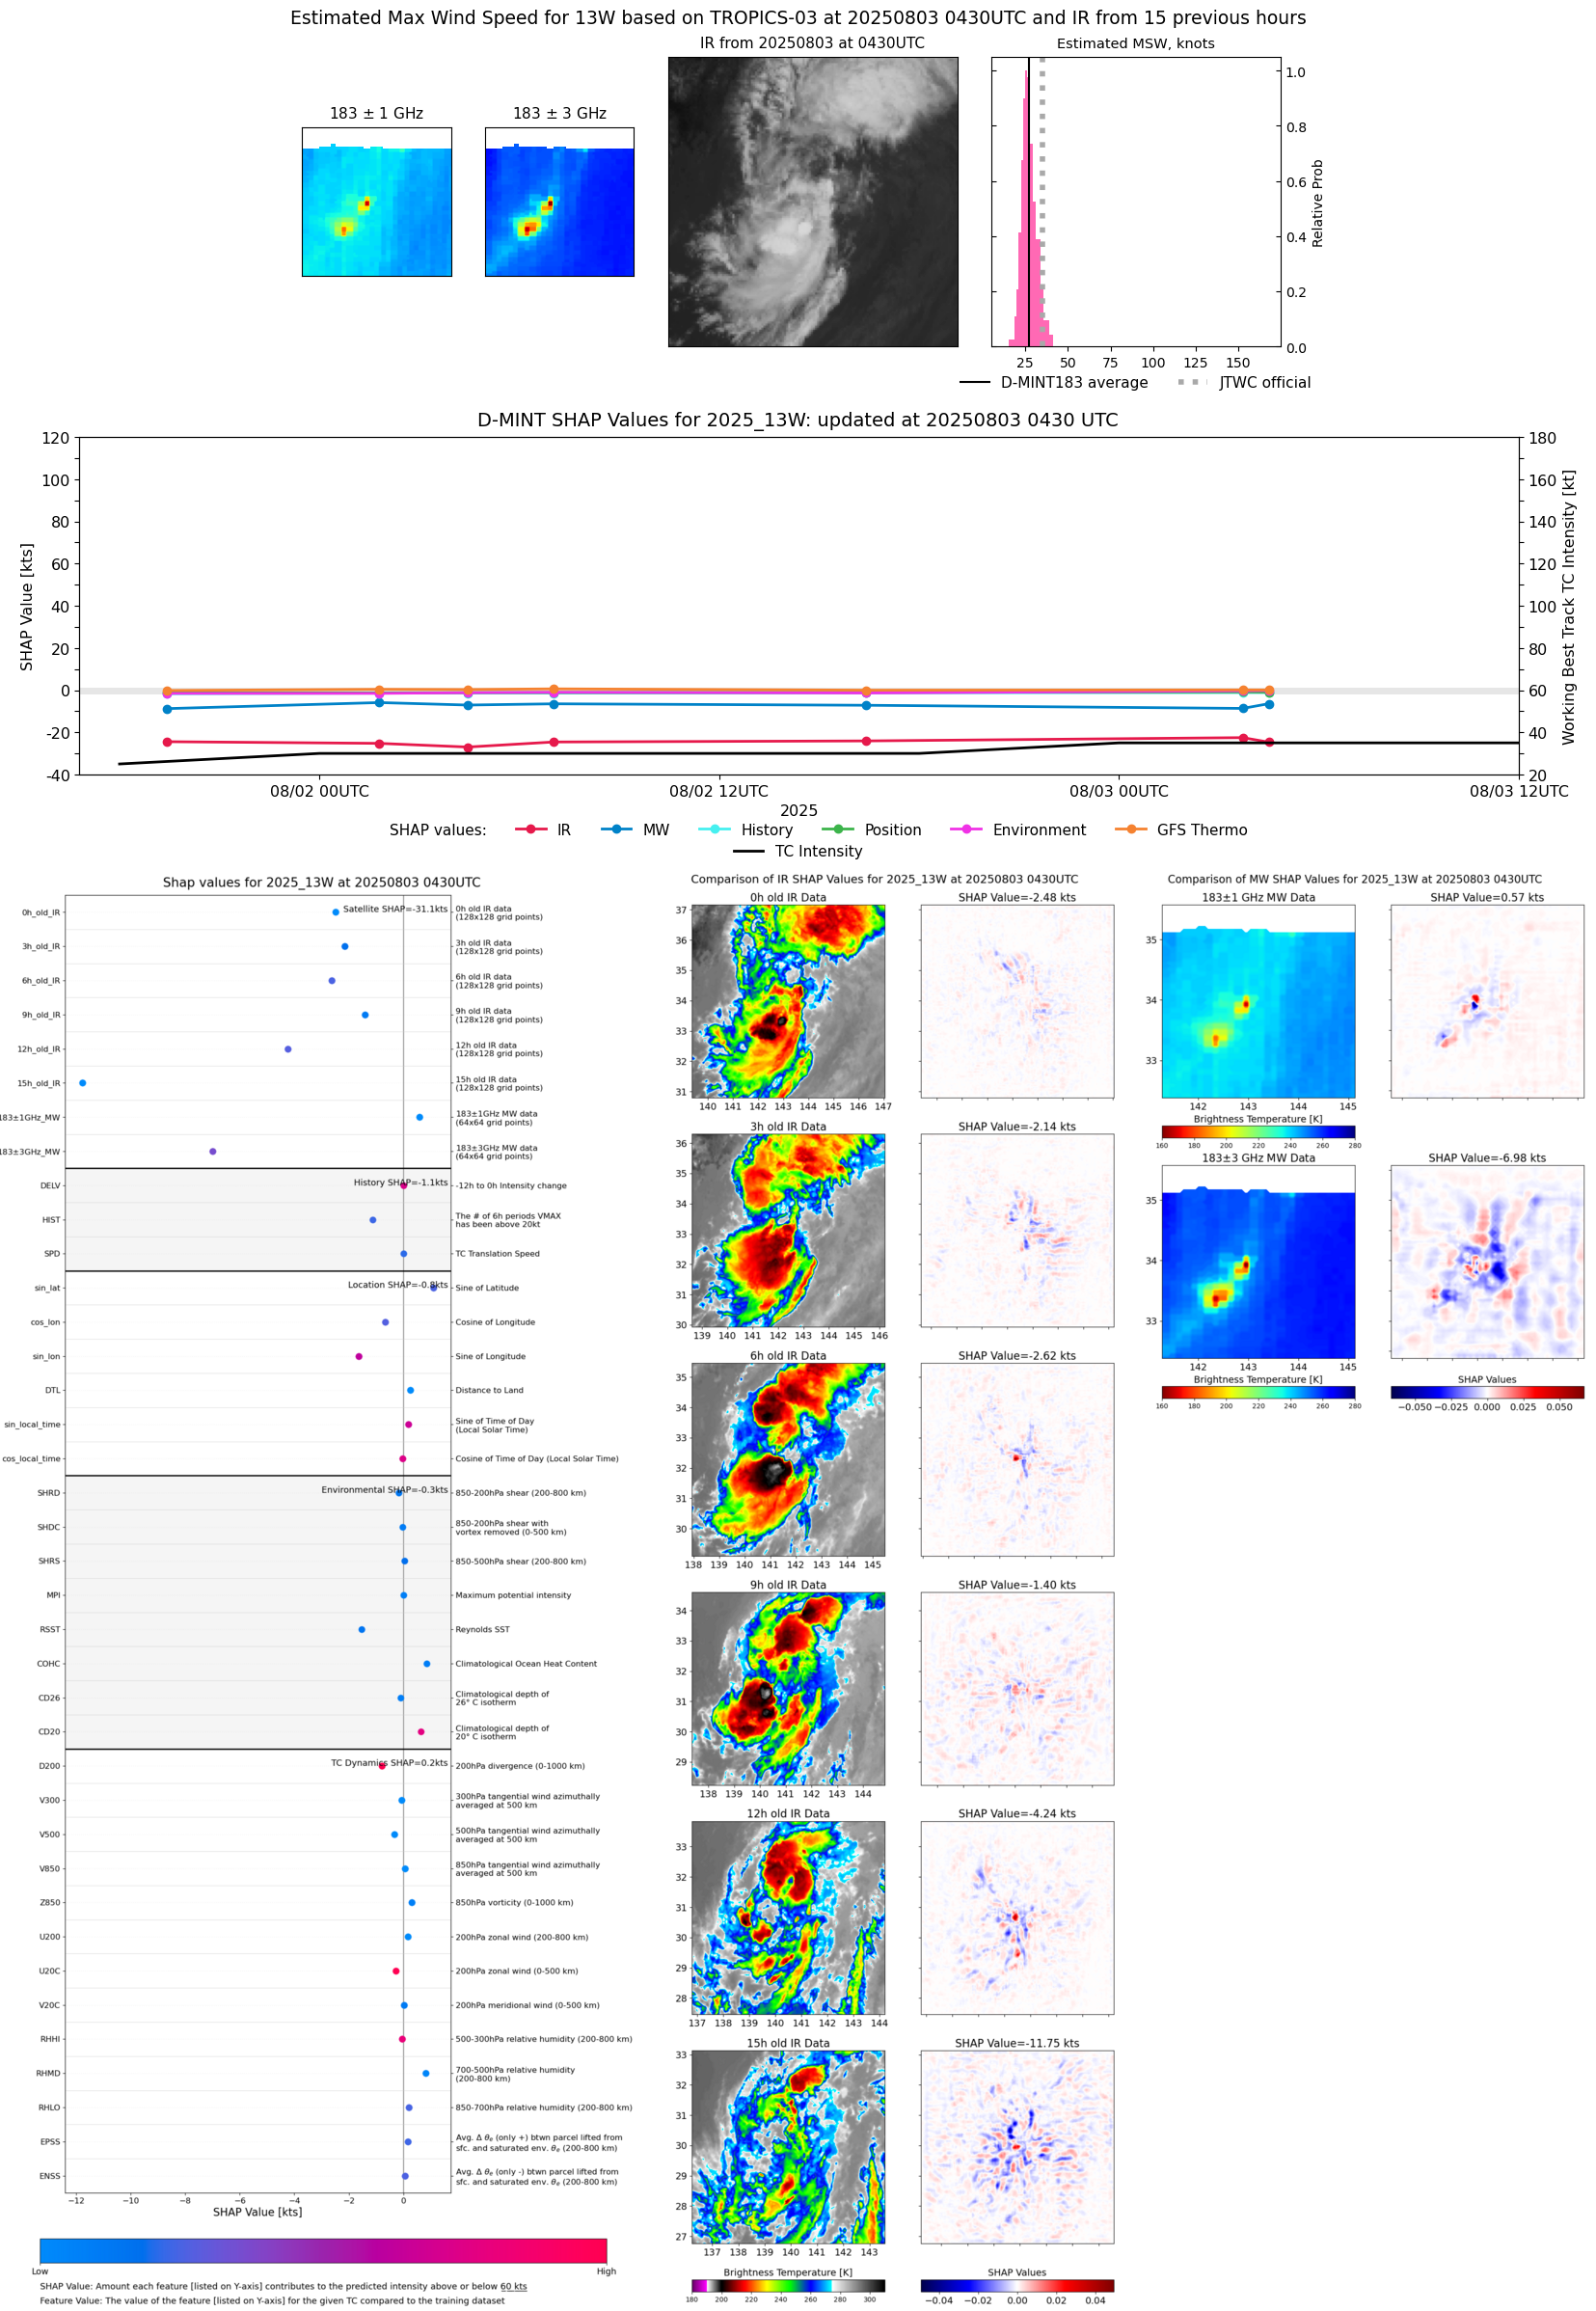 |
| 20250803 | 0343 UTC | ATMS-N21 | 998 hPa | 27 kts | 24 kts | 30 kts |  |
| 20250803 | 0342 UTC | AMSR2 | 999 hPa | 28 kts | 25 kts | 31 kts |  |
| 20250803 | 0112 UTC | TMS02 | 996 hPa | 27 kts | 24 kts | 30 kts | 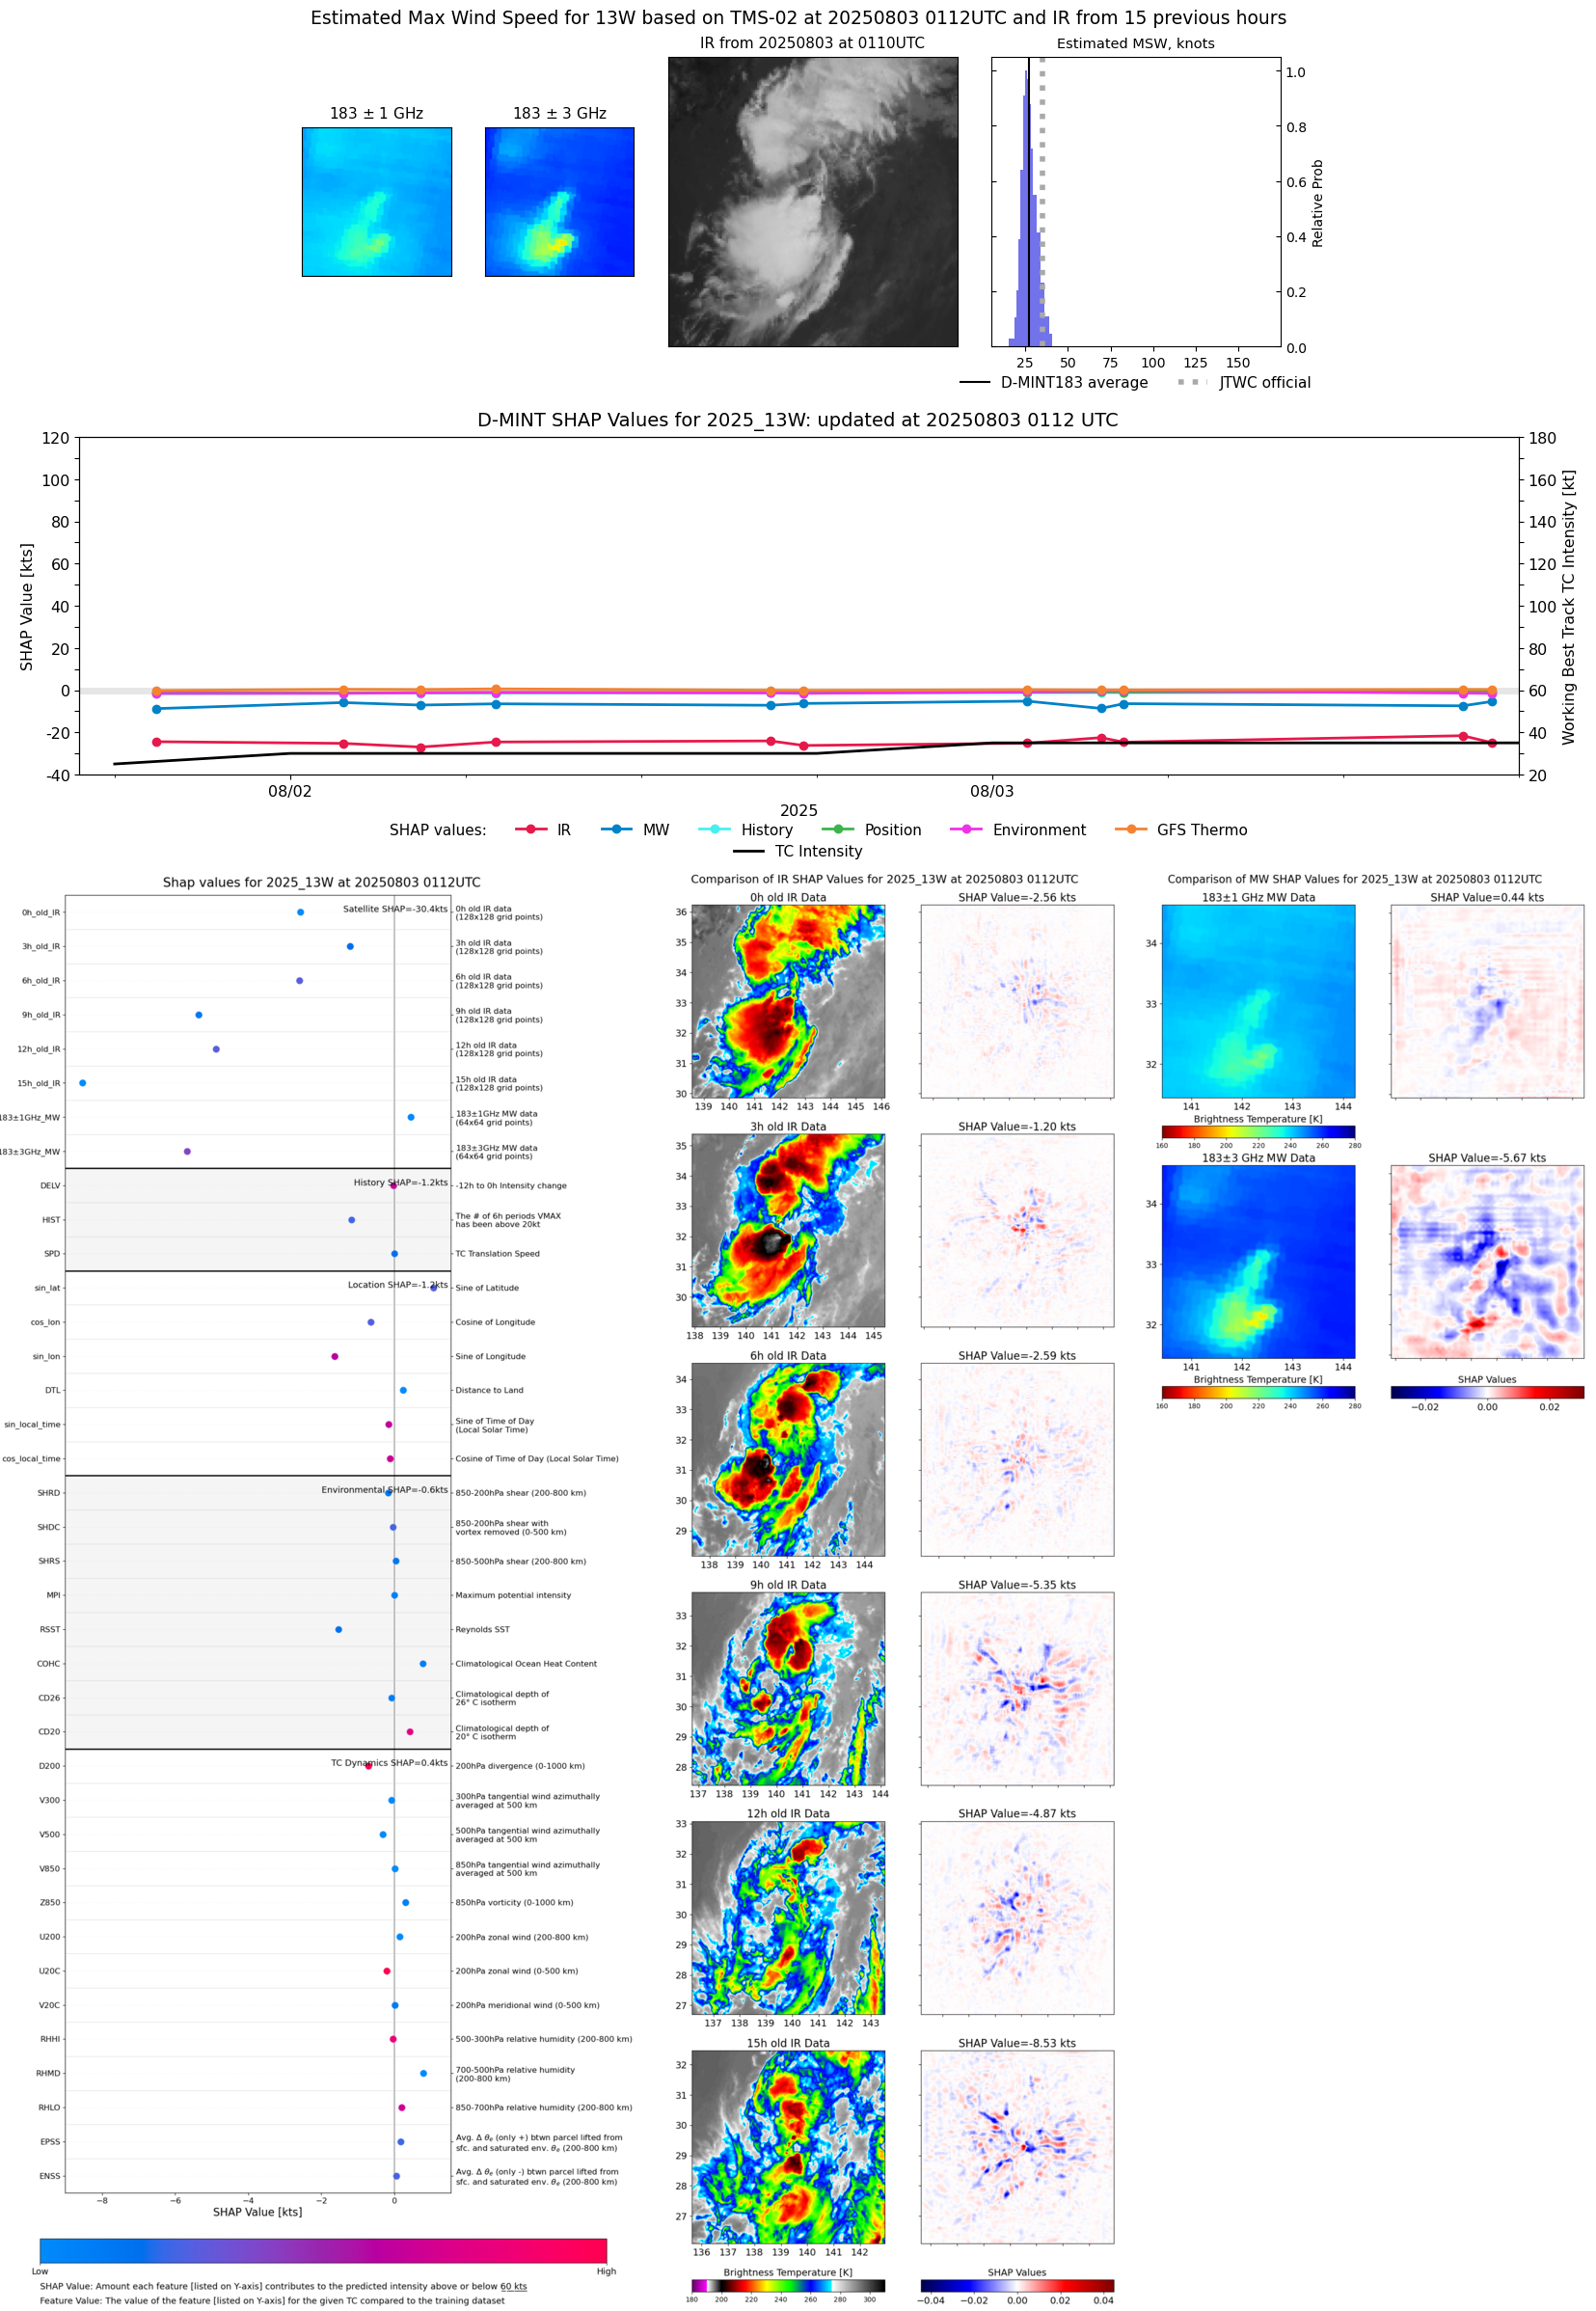 |
| 20250802 | 1844 UTC | SSMISF18 | 996 hPa | 27 kts | 24 kts | 31 kts | 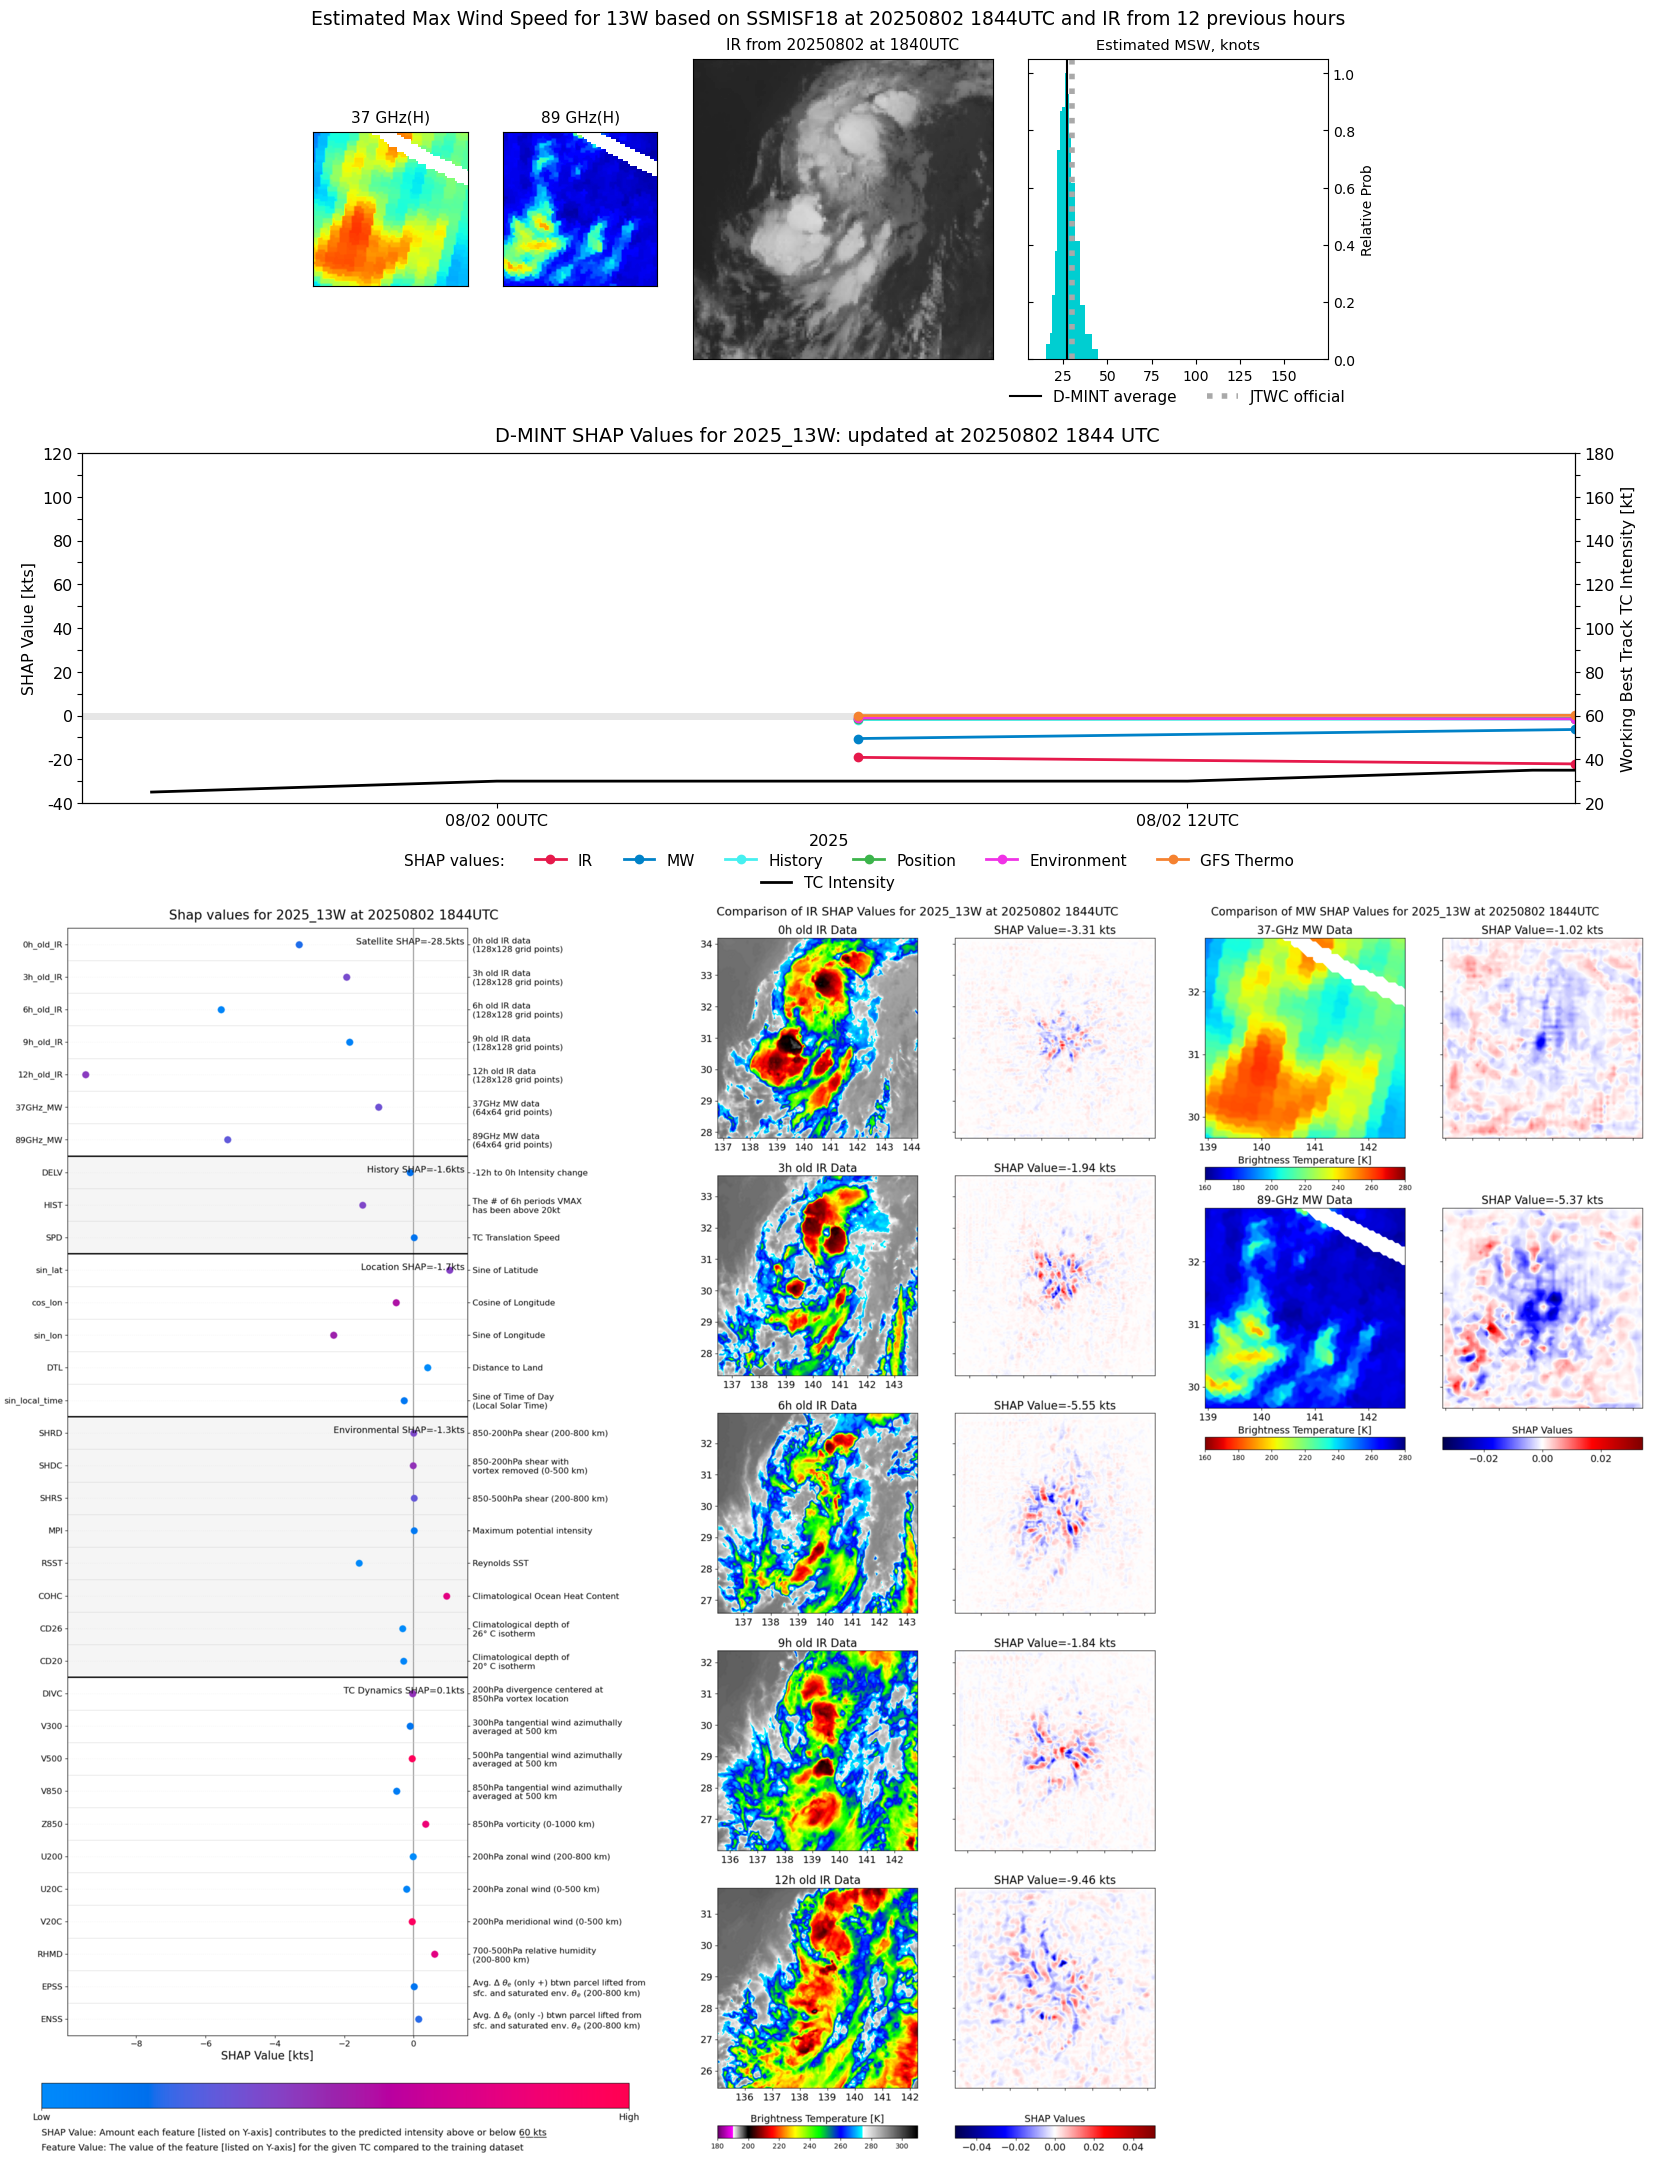 |
| 20250802 | 1733 UTC | TROPICS05 | 996 hPa | 24 kts | 21 kts | 27 kts | 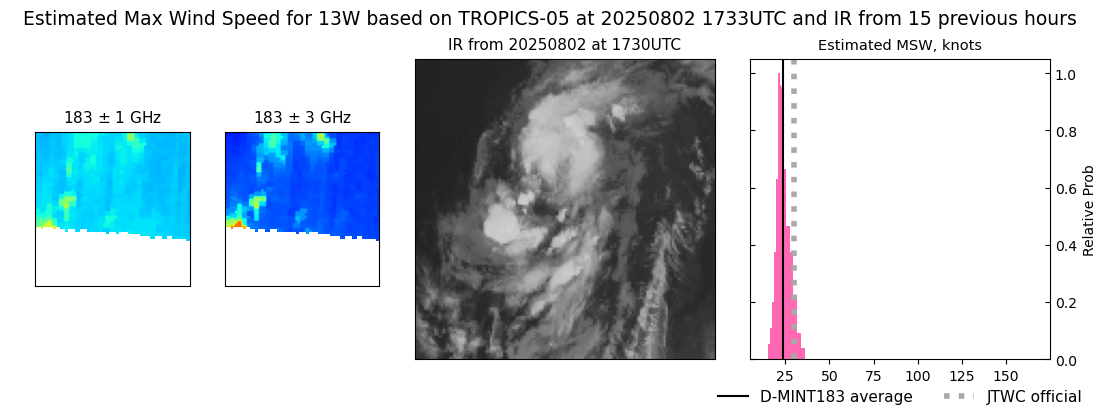 |
| 20250802 | 1641 UTC | AMSR2 | 999 hPa | 25 kts | 22 kts | 27 kts | 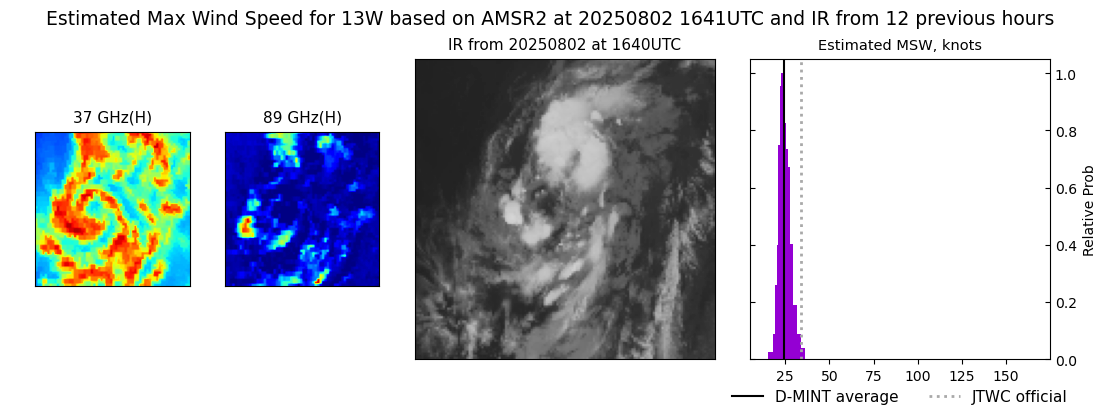 |
| 20250802 | 1625 UTC | ATMS-N21 | 997 hPa | 25 kts | 23 kts | 28 kts | 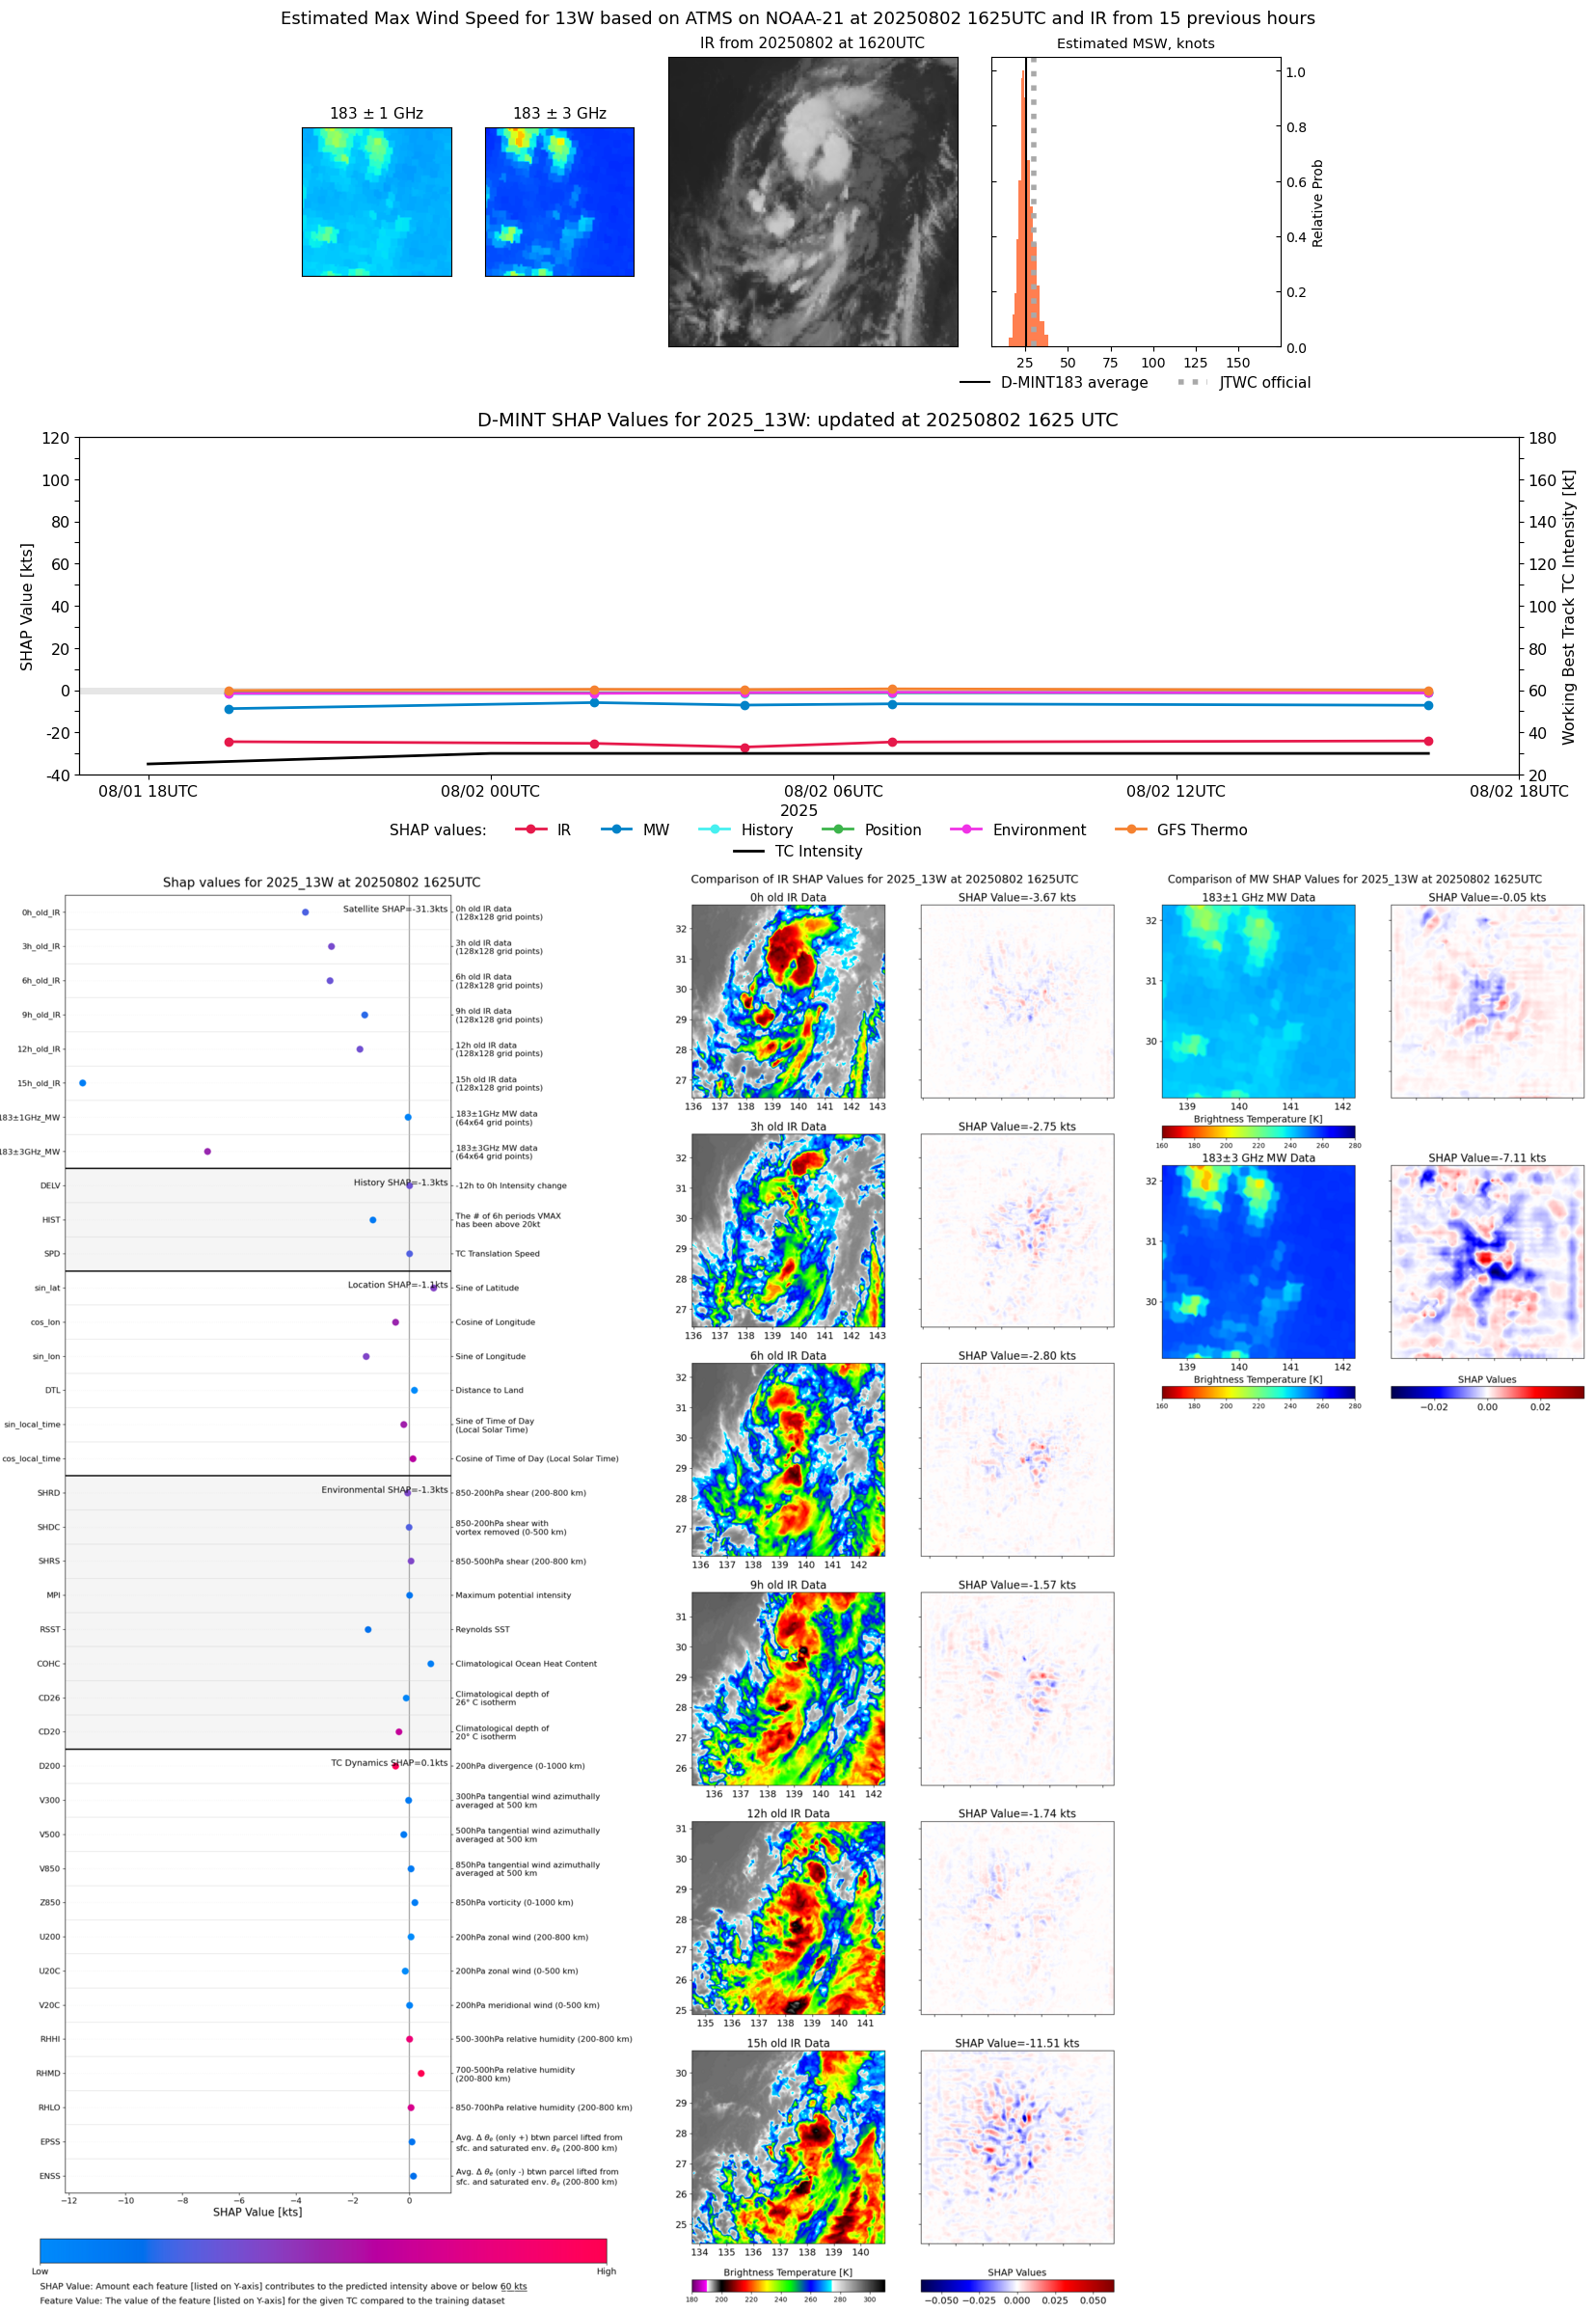 |
| 20250802 | 1555 UTC | TROPICS05 | 997 hPa | 26 kts | 23 kts | 29 kts | 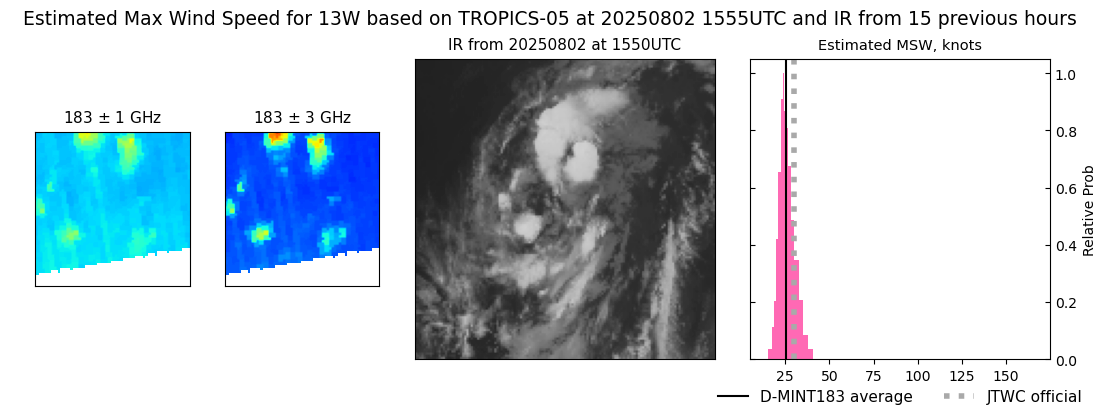 |
| 20250802 | 0702 UTC | TROPICS03 | 995 hPa | 26 kts | 23 kts | 29 kts |  |
| 20250802 | 0617 UTC | SSMISF18 | 995 hPa | 26 kts | 23 kts | 28 kts | 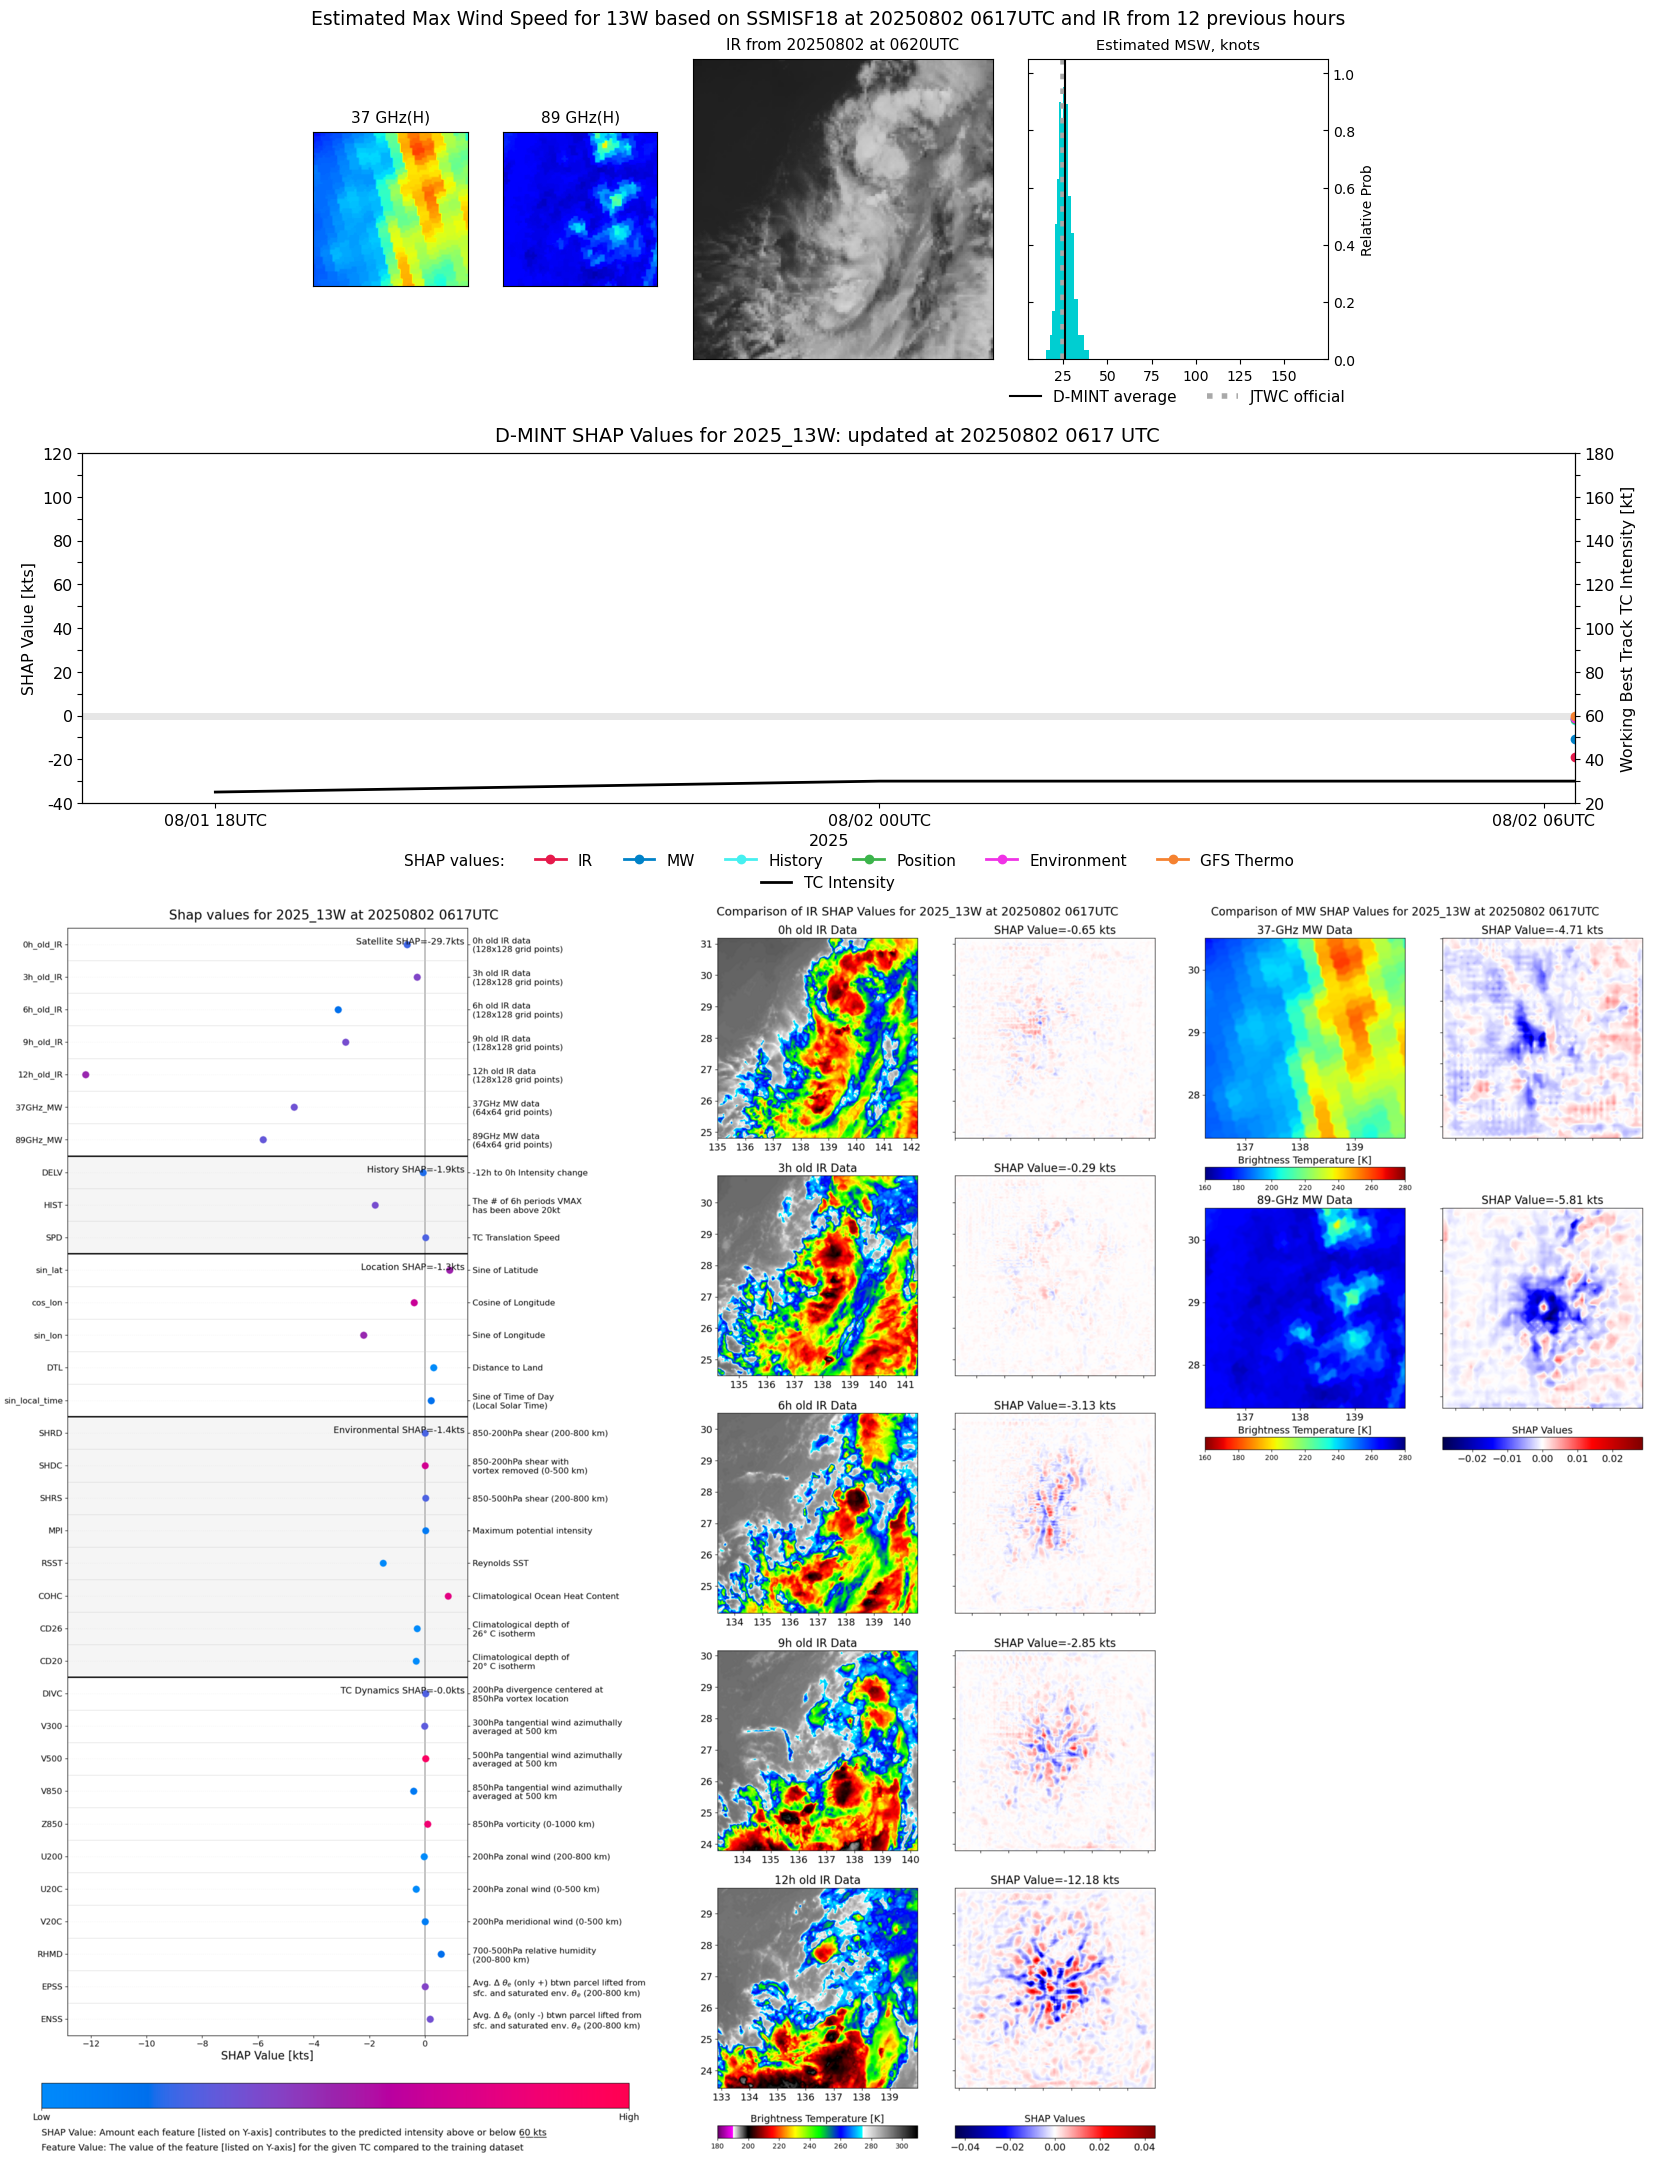 |
| 20250802 | 0427 UTC | ATMS-NPP | 995 hPa | 22 kts | 21 kts | 25 kts |  |
| 20250802 | 0148 UTC | TMS02 | 995 hPa | 25 kts | 23 kts | 28 kts |  |
| 20250801 | 1925 UTC | TMS03 | 996 hPa | 22 kts | 21 kts | 25 kts | 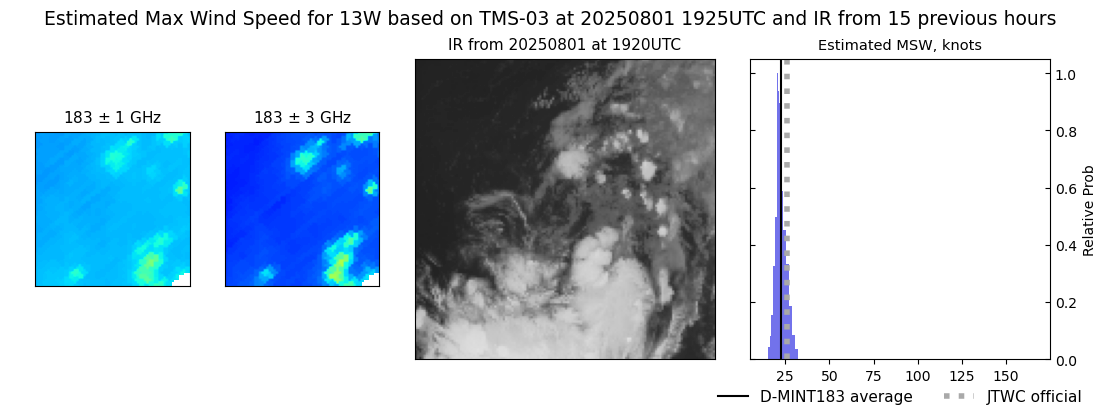 |