|
||

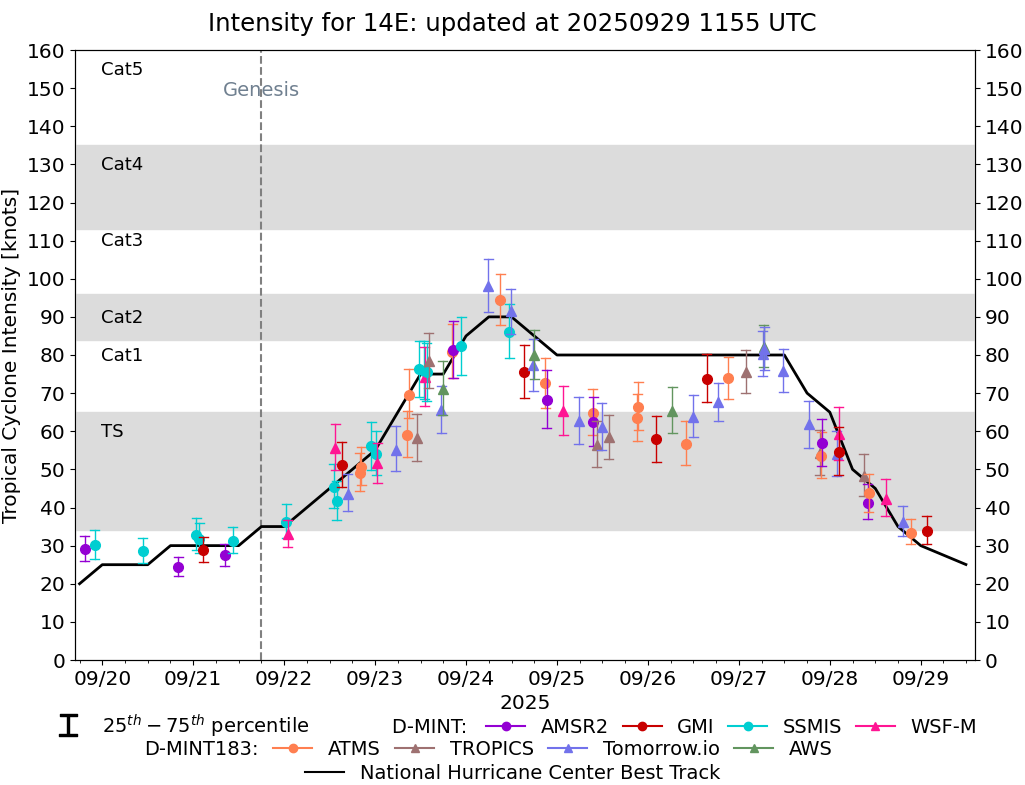 |
D-MINT HISTORY FILE for 2025_14E
| Date | Time | MW Sensor | MSLP | Vmax (30th-70th percentile average) | Vmax 25th percentile | Vmax 75th percentile | Image |
| 20250929 | 0138 UTC | GMI | 1007 hPa | 34 kts | 30 kts | 38 kts | 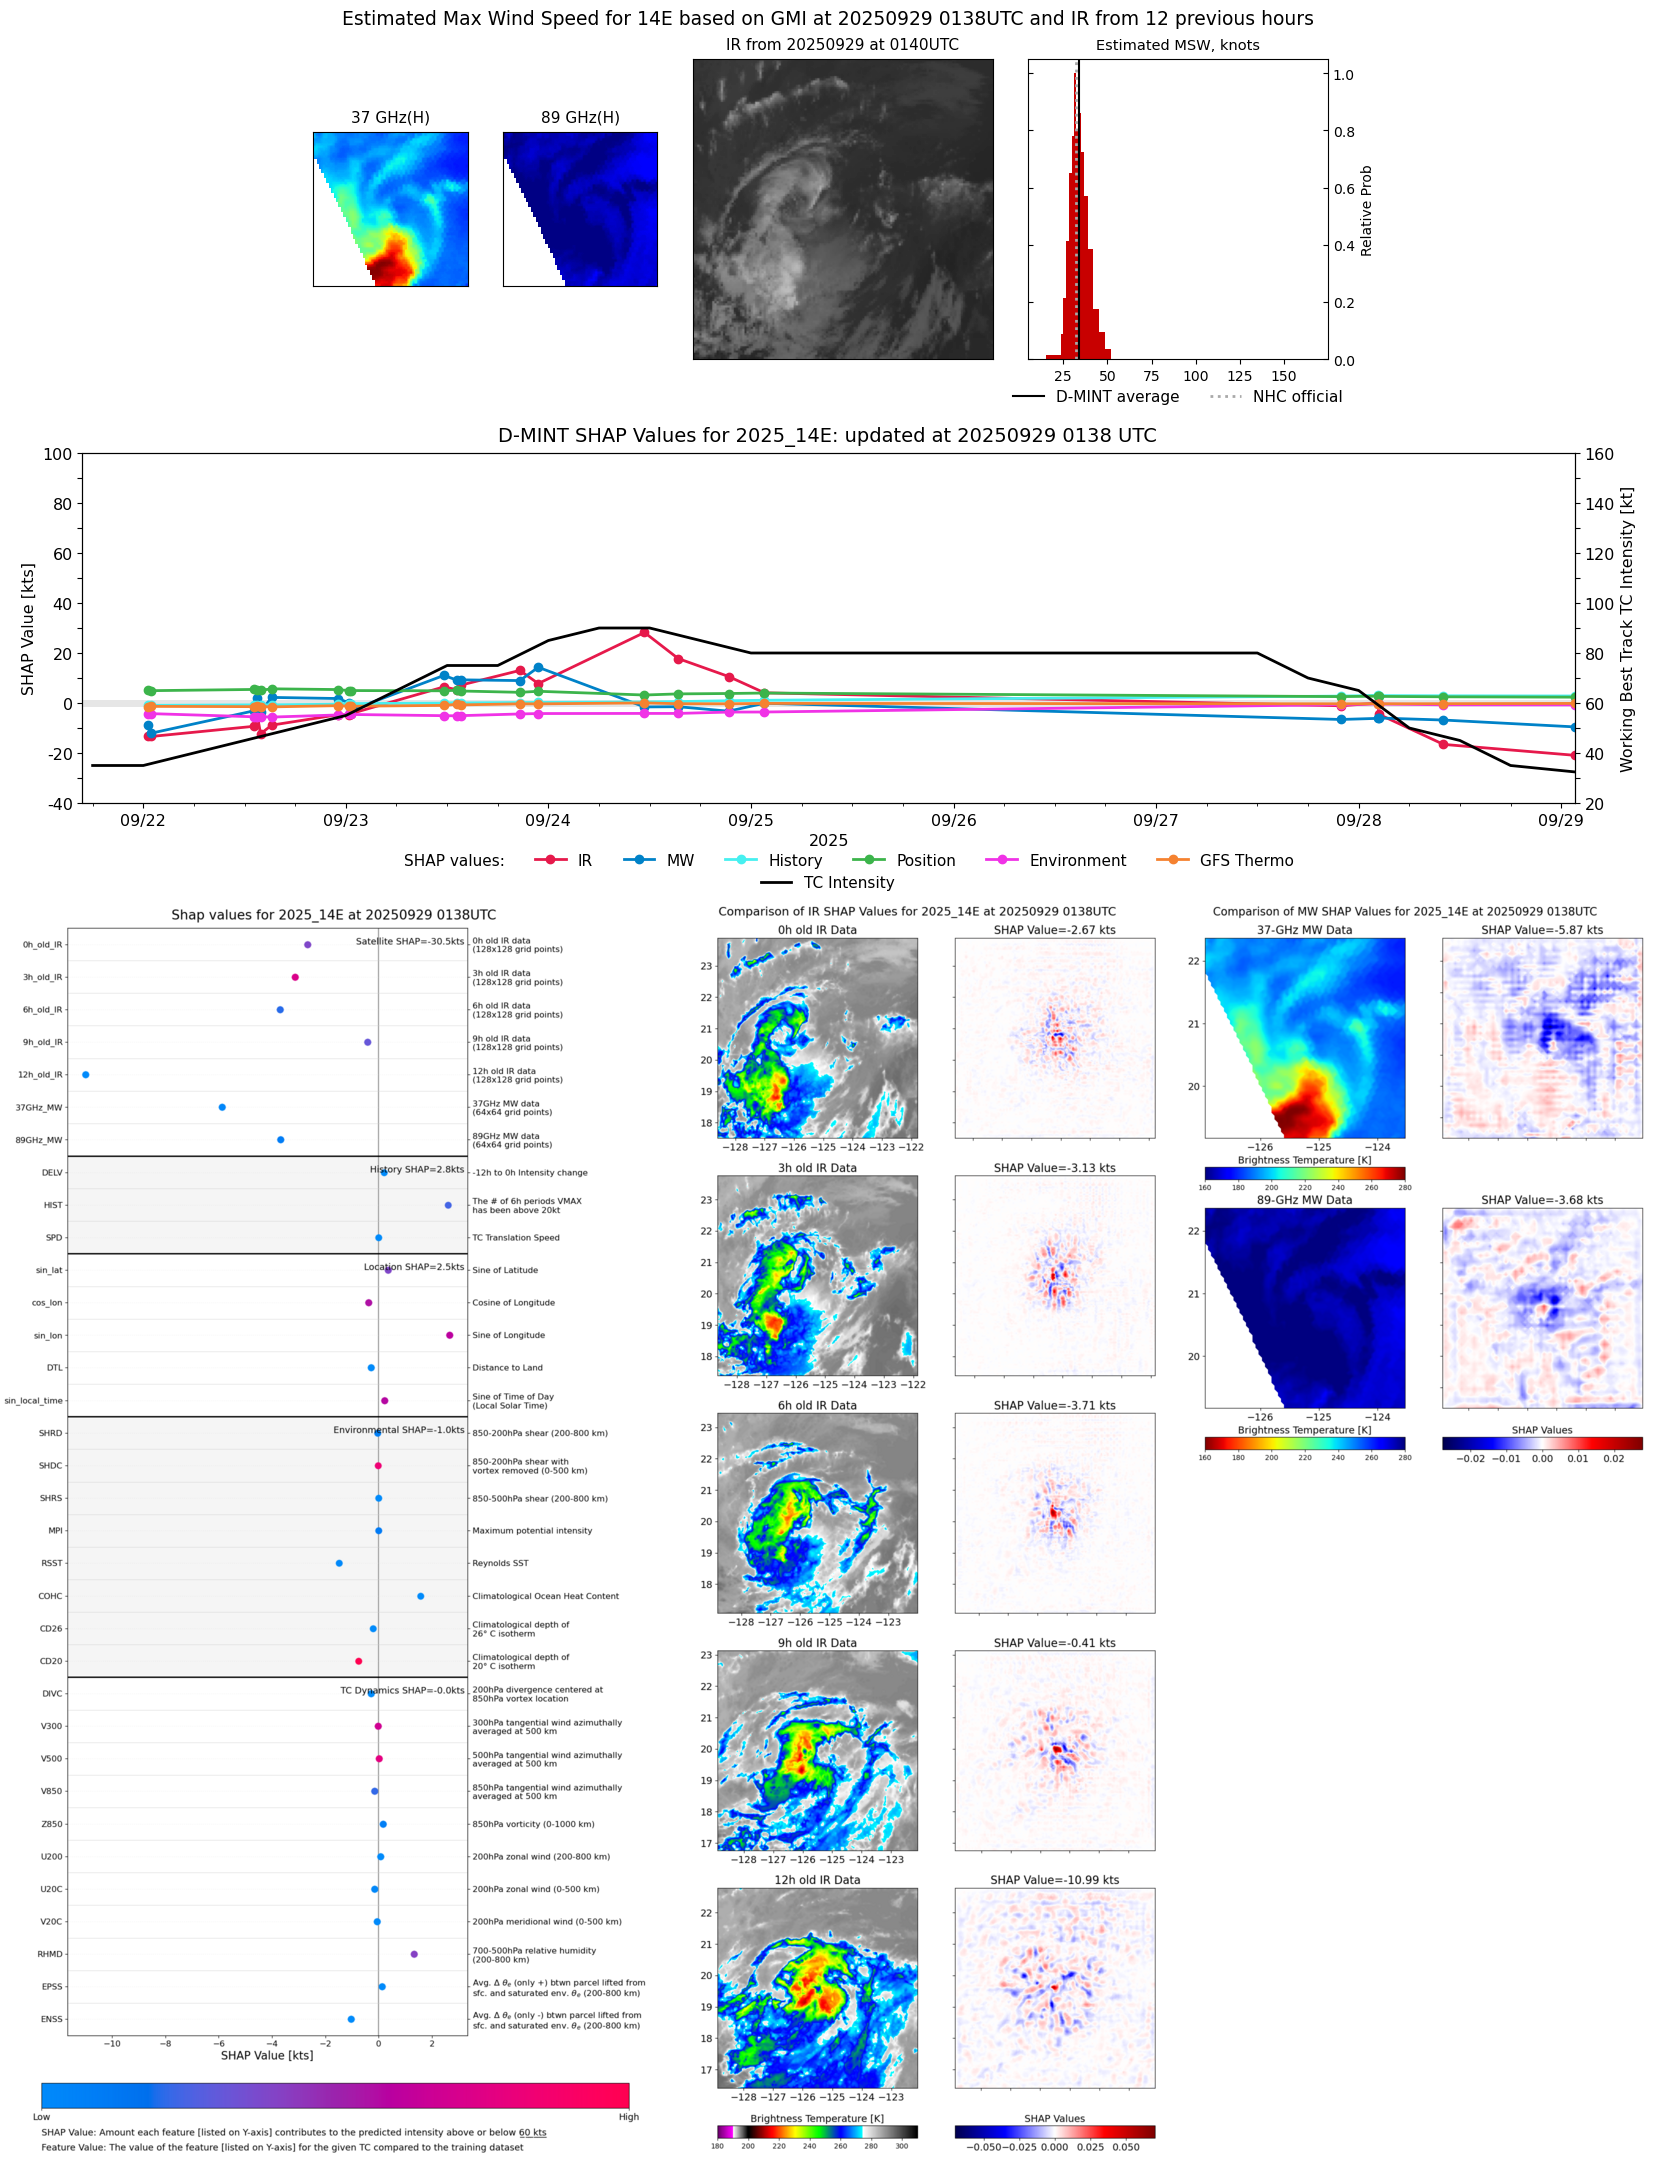 |
| 20250928 | 2124 UTC | ATMS-N21 | 1008 hPa | 33 kts | 30 kts | 37 kts | 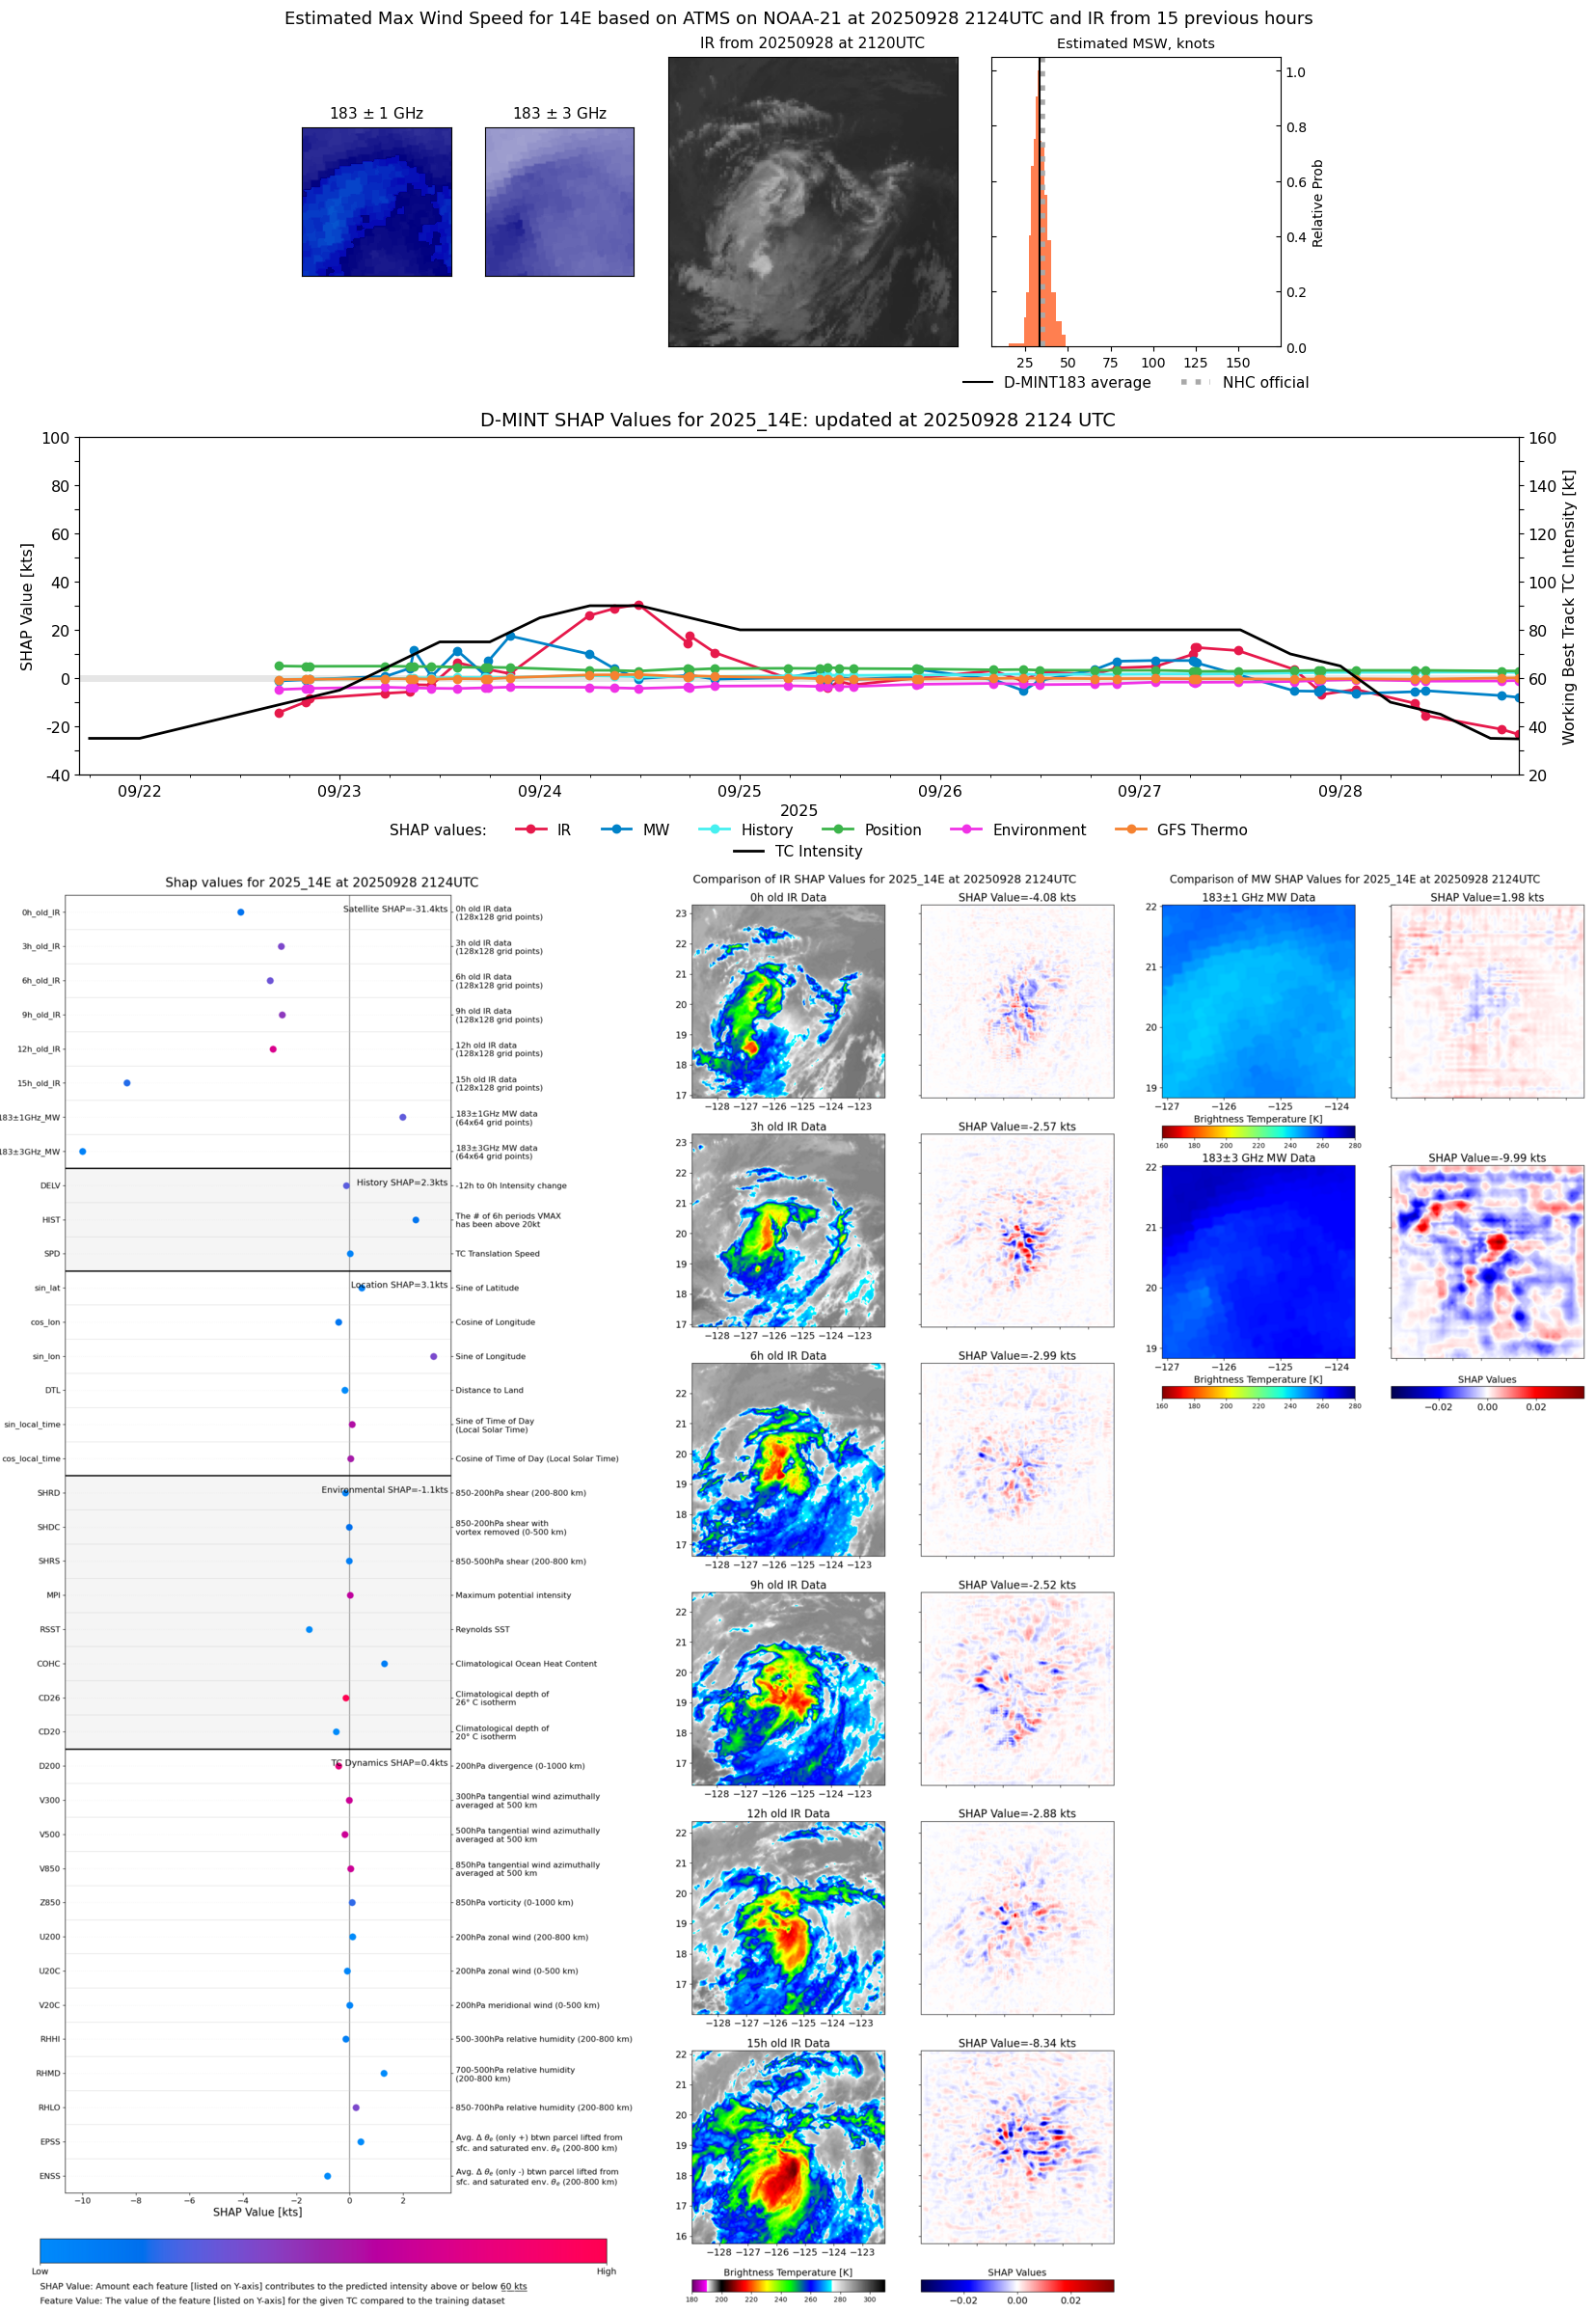 |
| 20250928 | 1918 UTC | TMS02 | 1005 hPa | 36 kts | 32 kts | 40 kts | 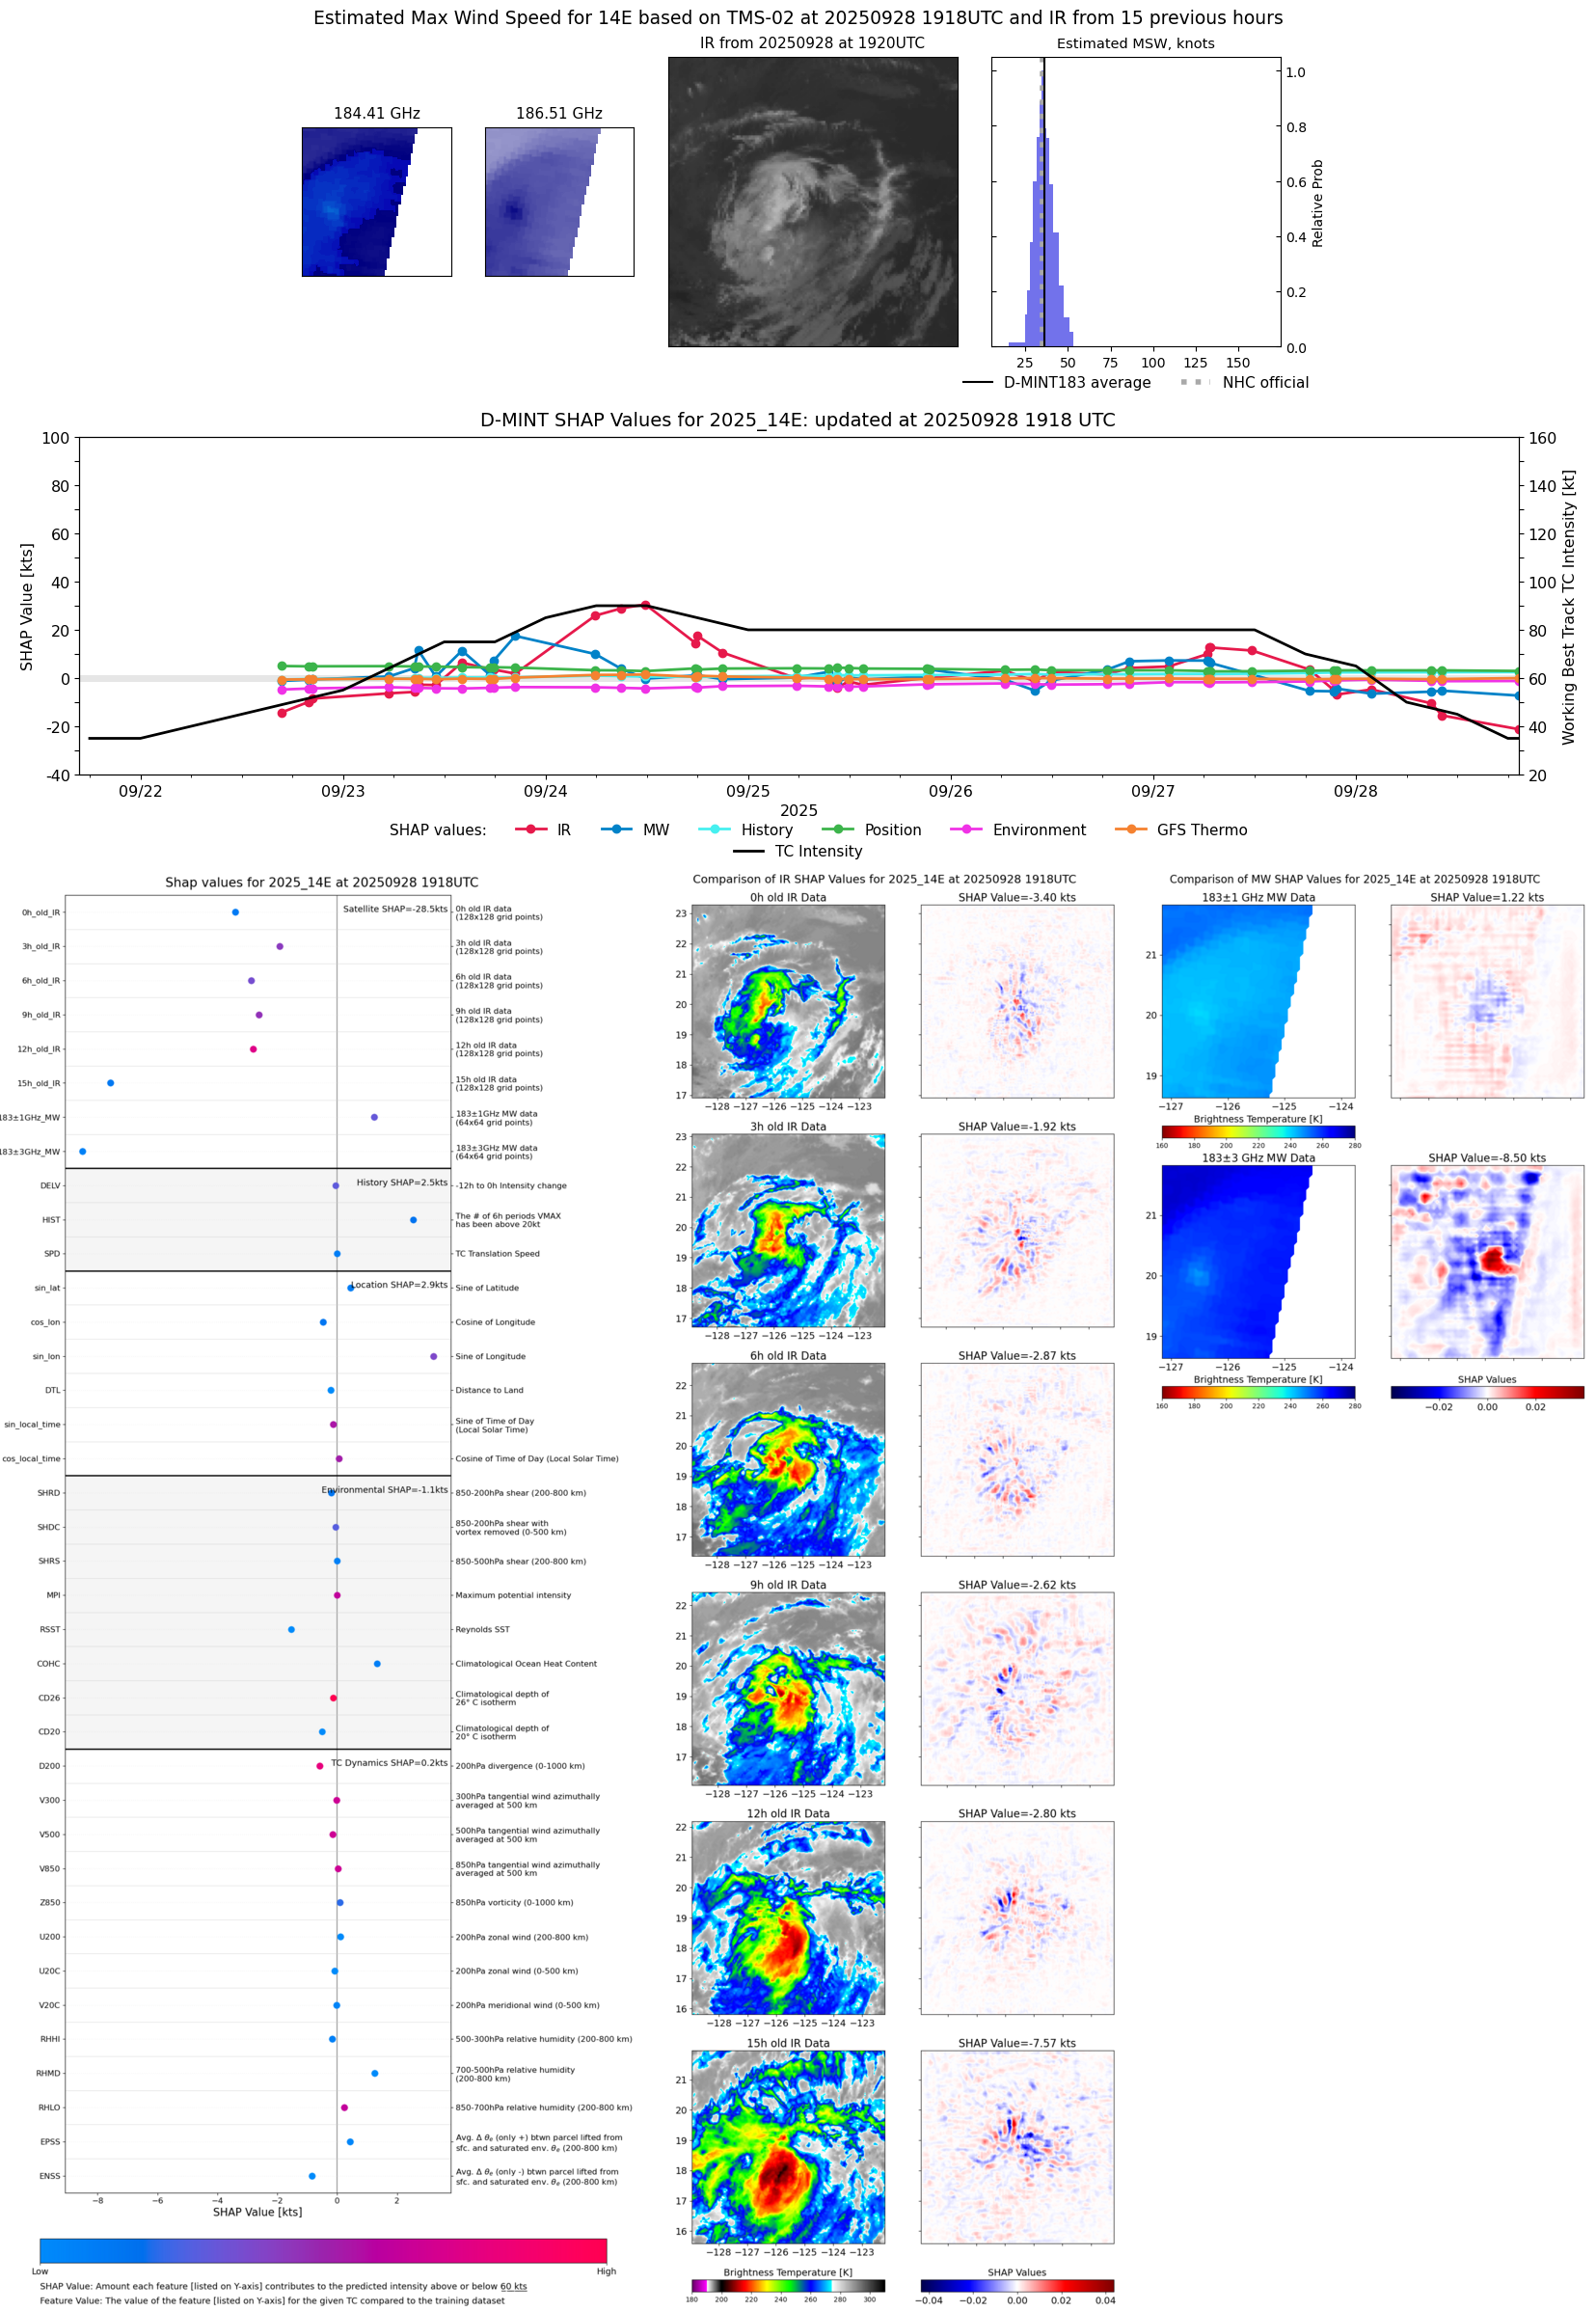 |
| 20250928 | 1448 UTC | WSFM01 | 1003 hPa | 42 kts | 38 kts | 47 kts | 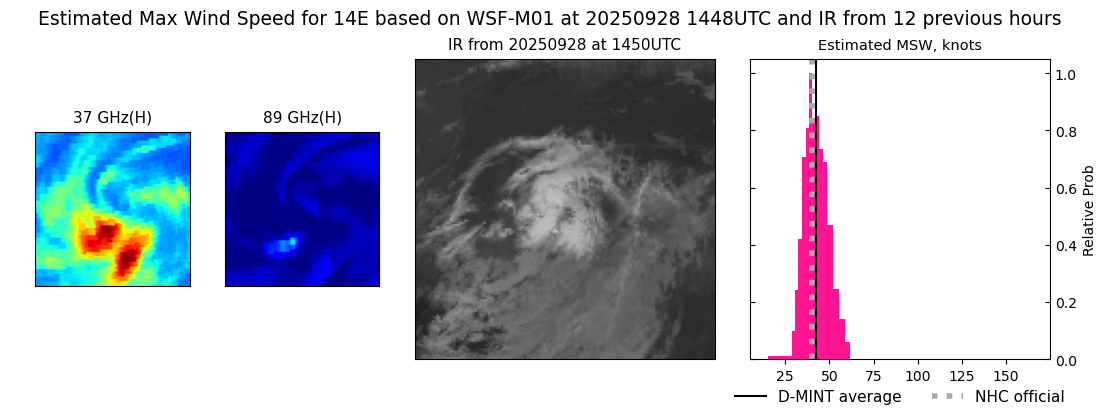 |
| 20250928 | 1013 UTC | ATMS-N21 | 1001 hPa | 44 kts | 39 kts | 49 kts | 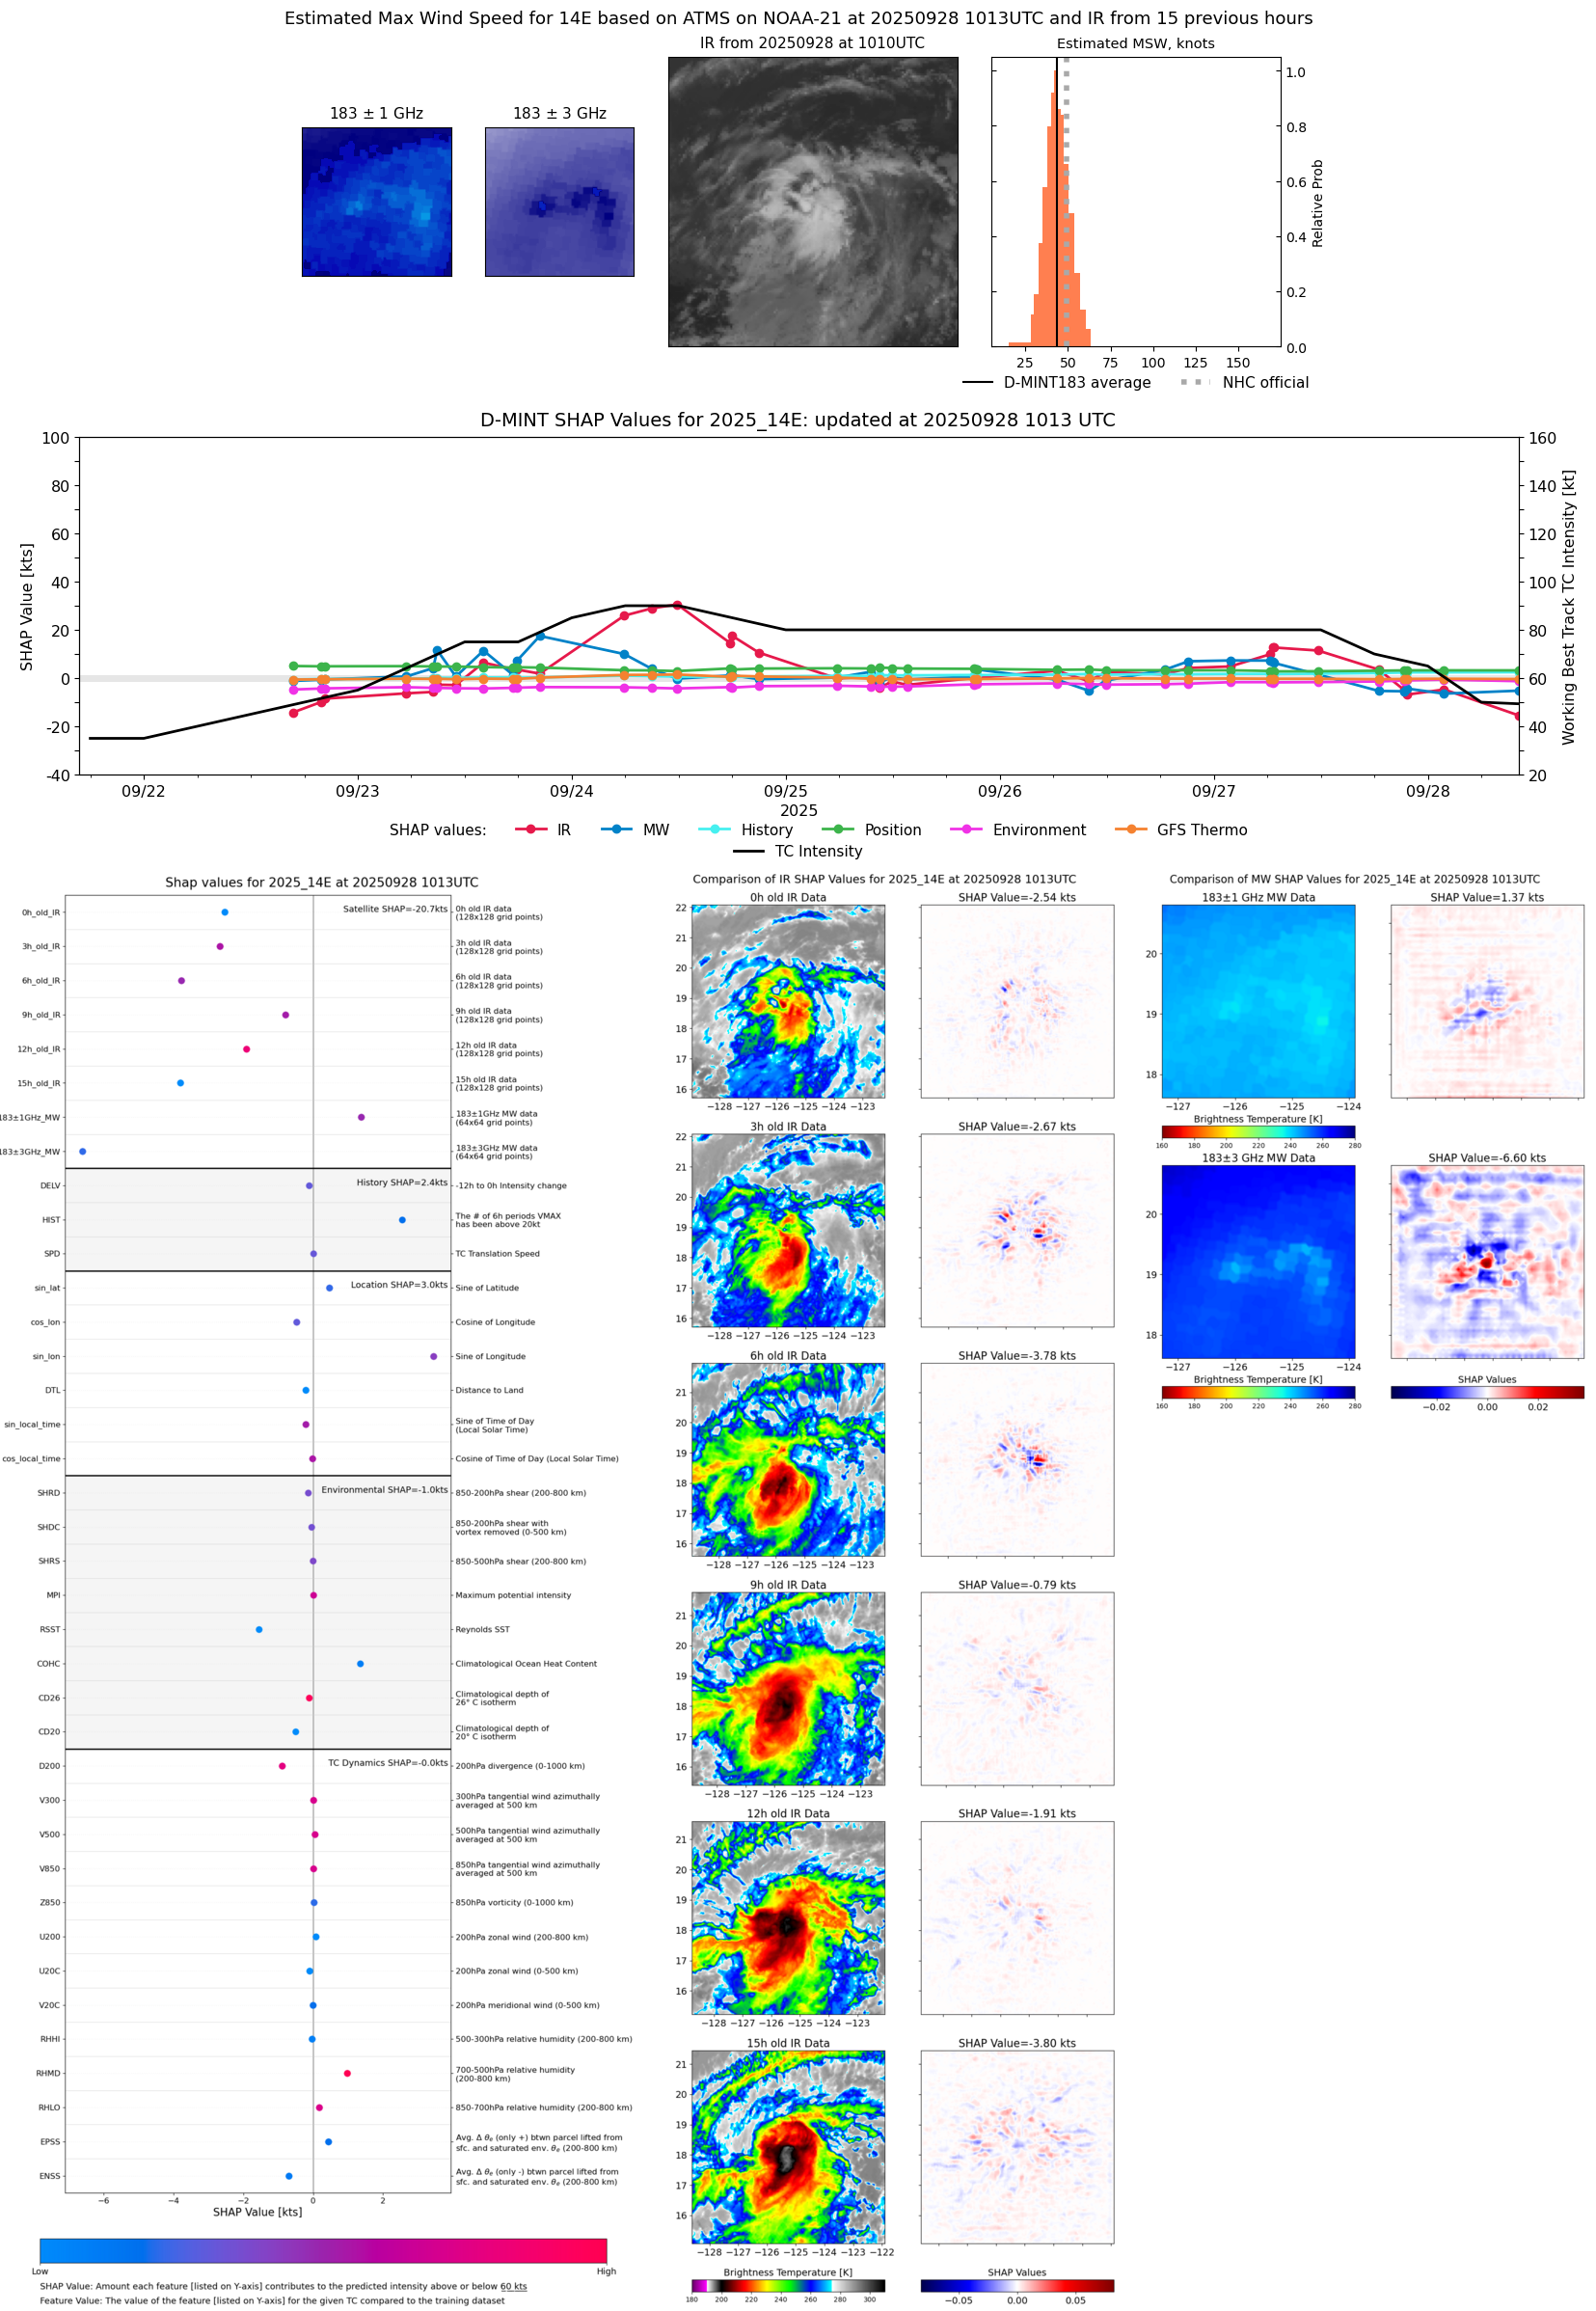 |
| 20250928 | 1003 UTC | AMSR2 | 1001 hPa | 41 kts | 37 kts | 46 kts | 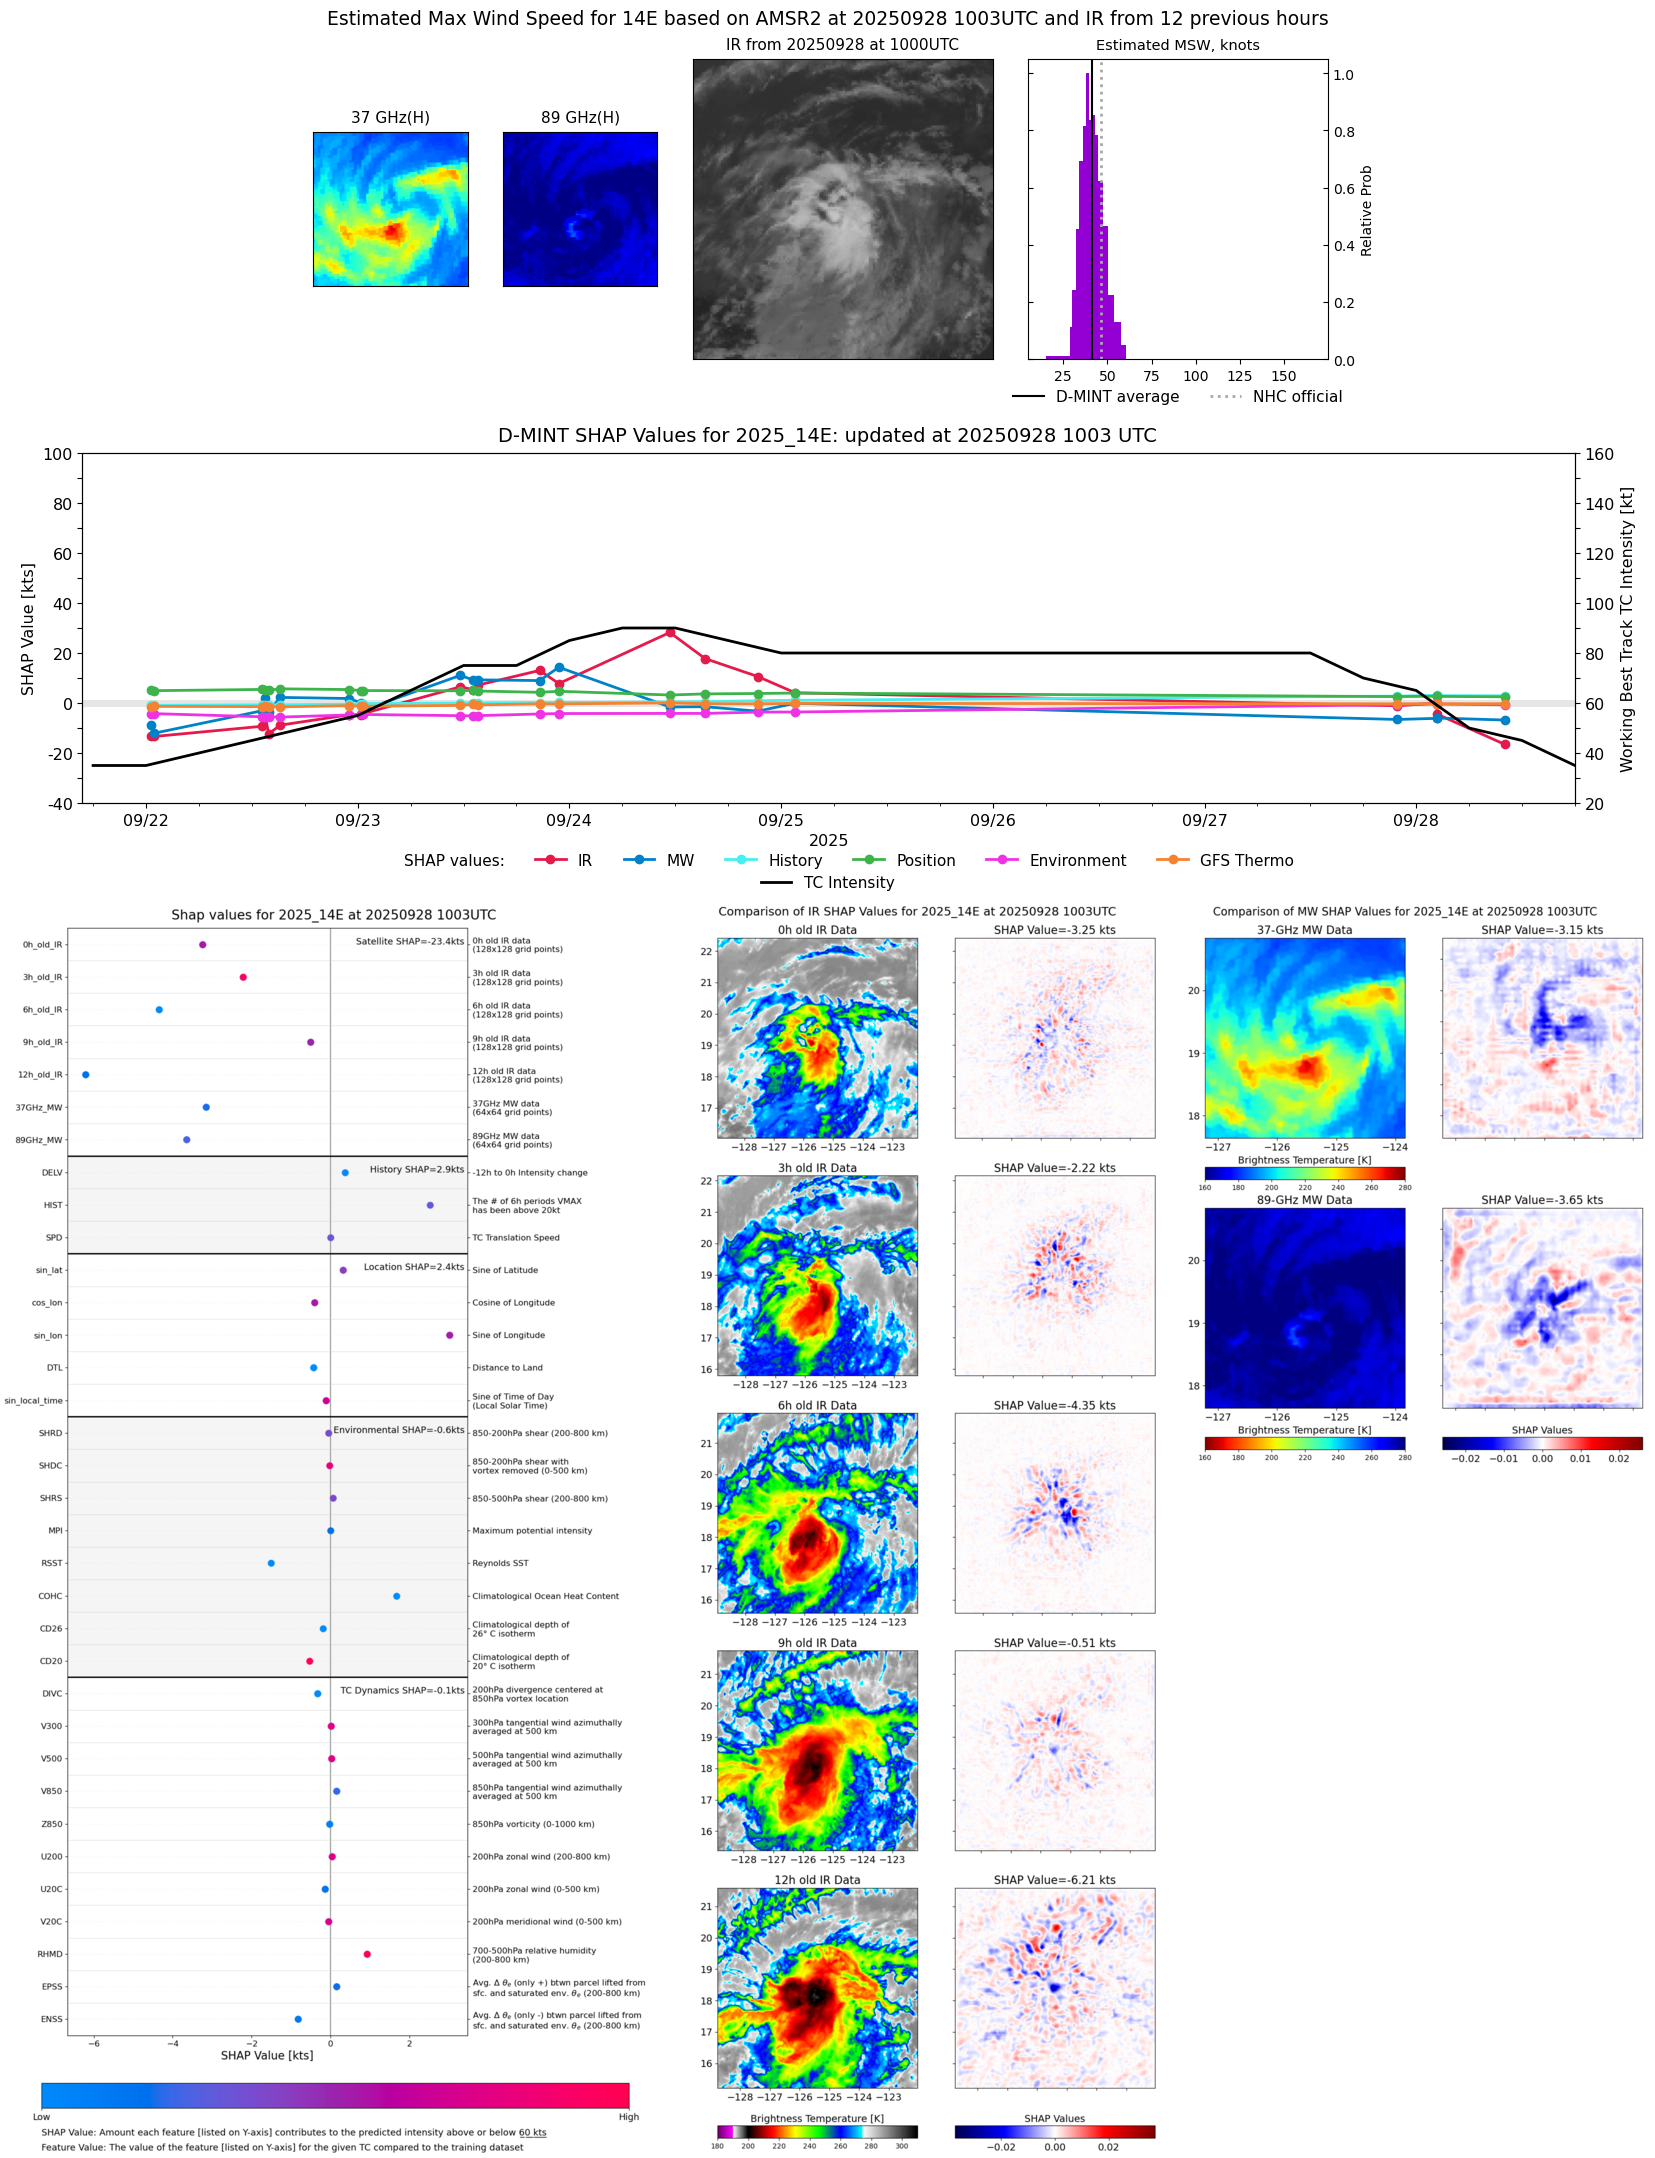 |
| 20250928 | 0856 UTC | TROPICS05 | 1001 hPa | 48 kts | 43 kts | 54 kts | 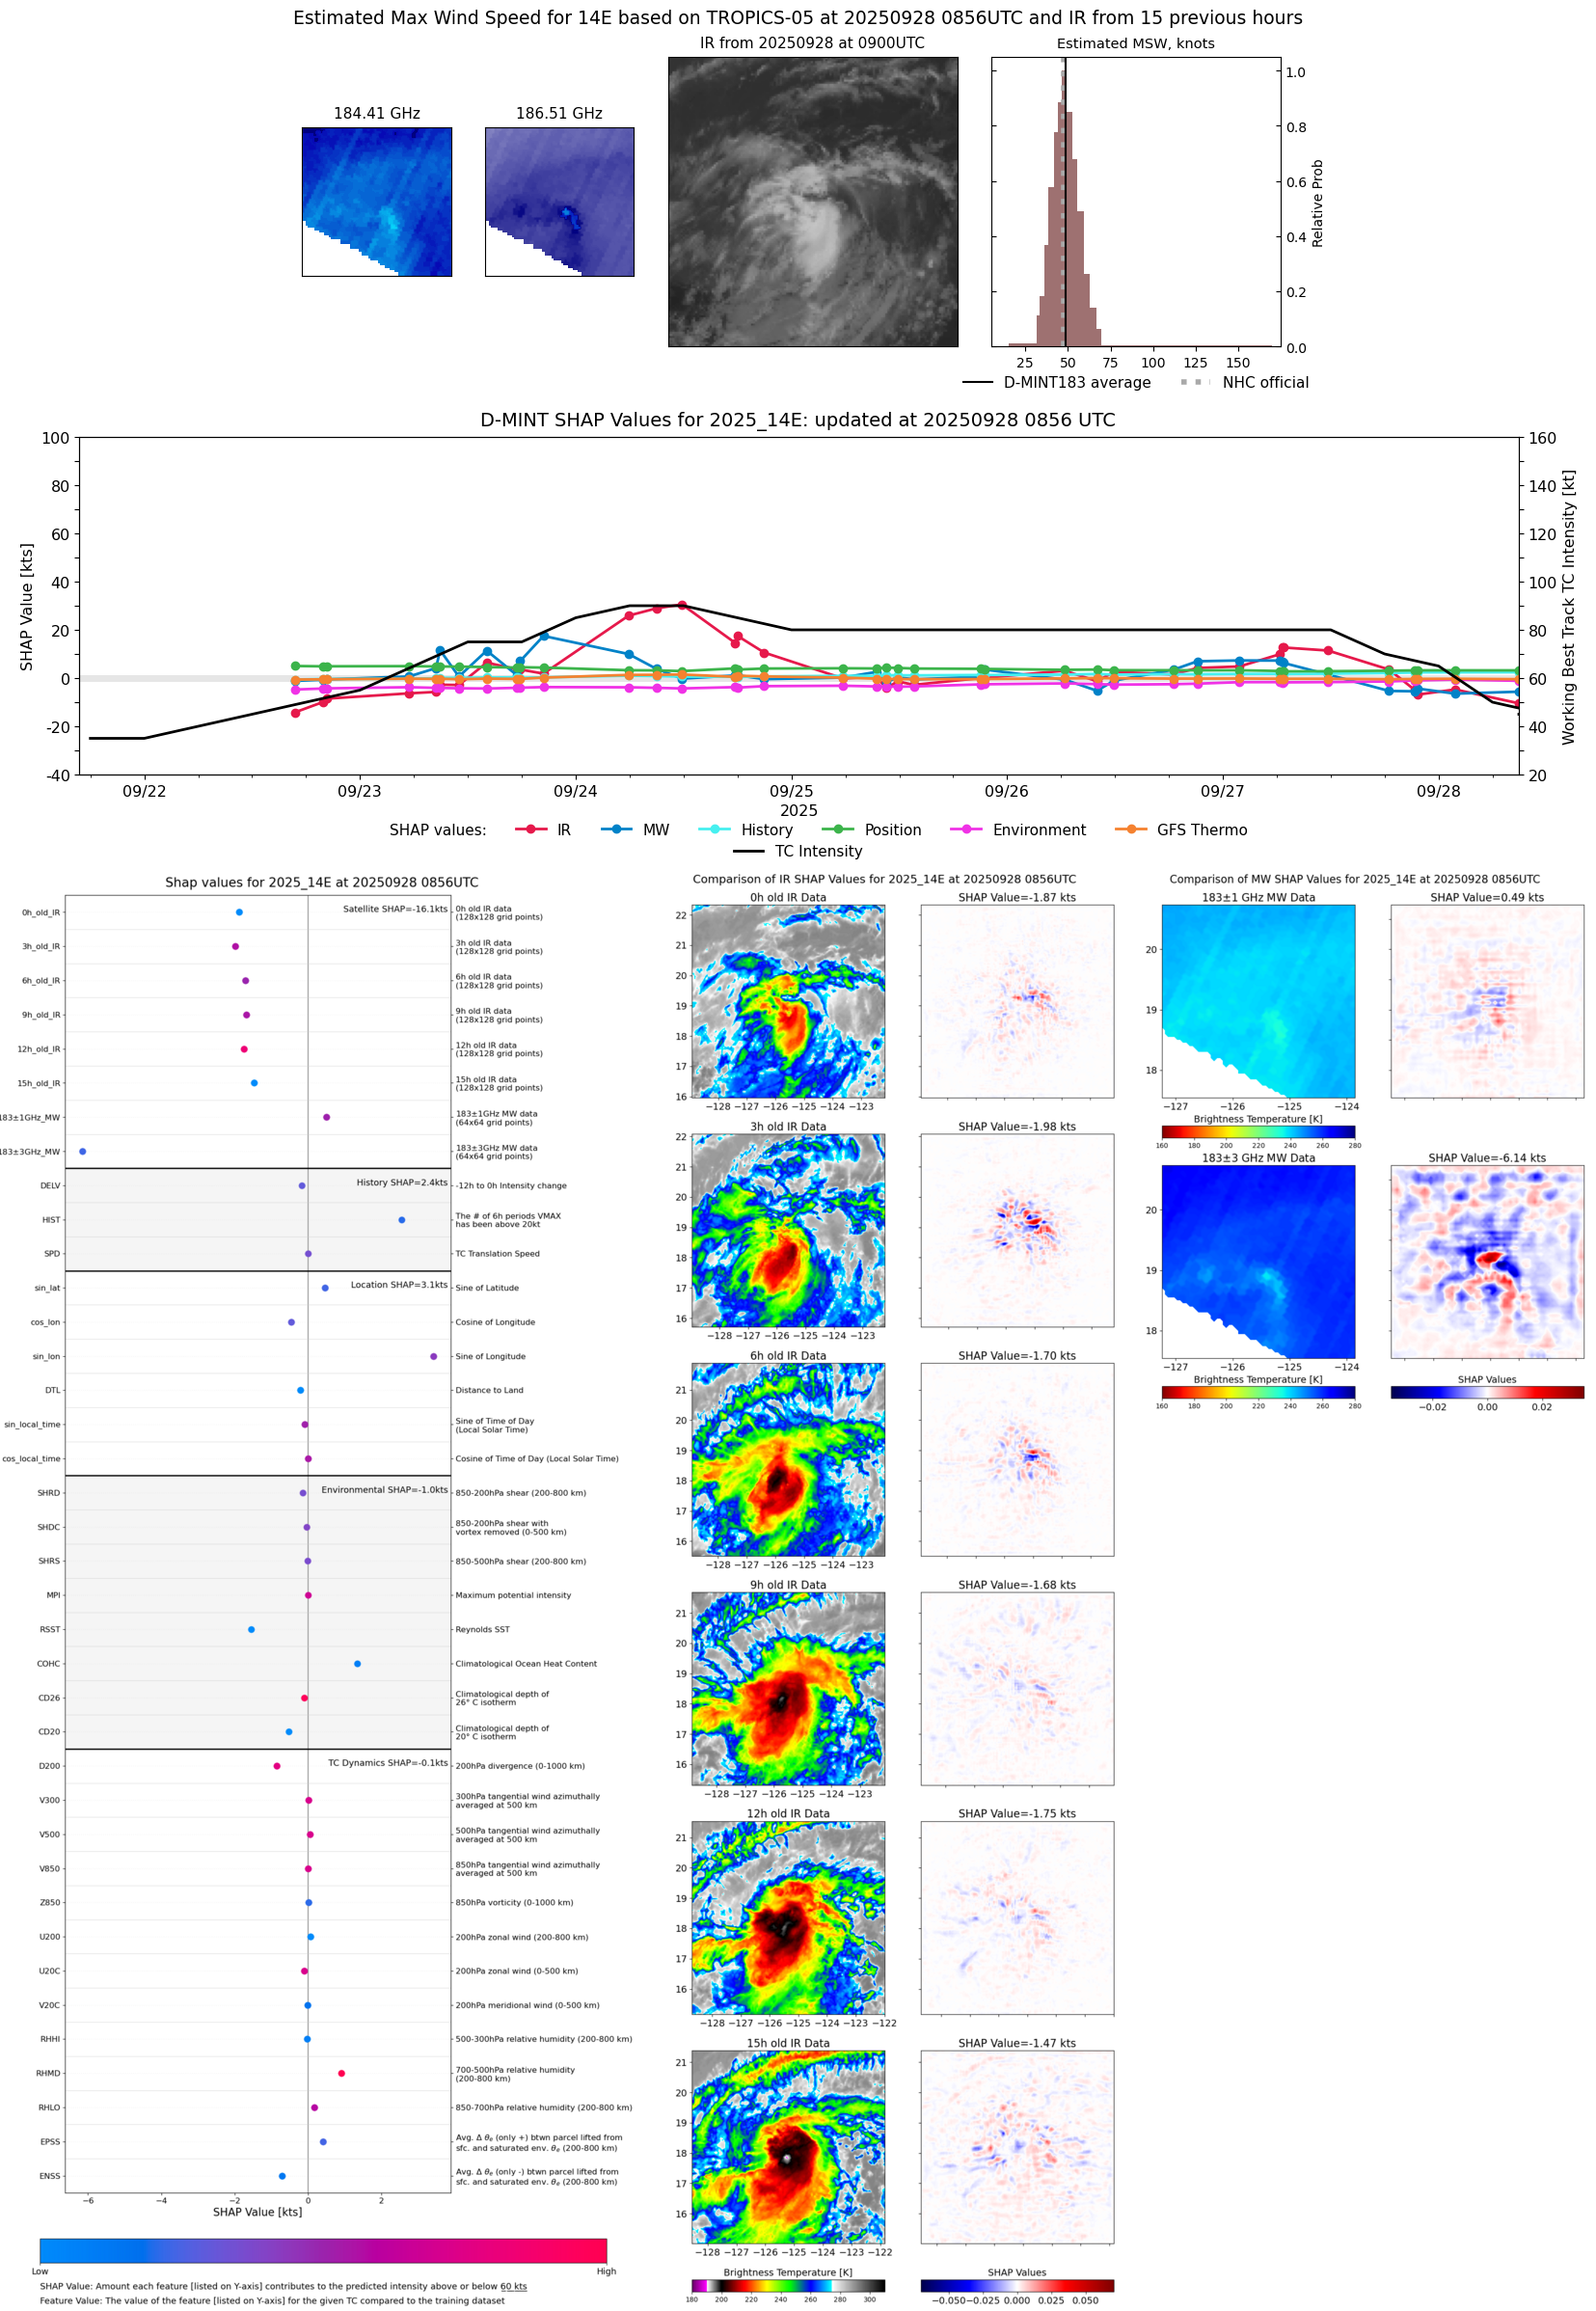 |
| 20250928 | 0223 UTC | GMI | 999 hPa | 55 kts | 49 kts | 61 kts | 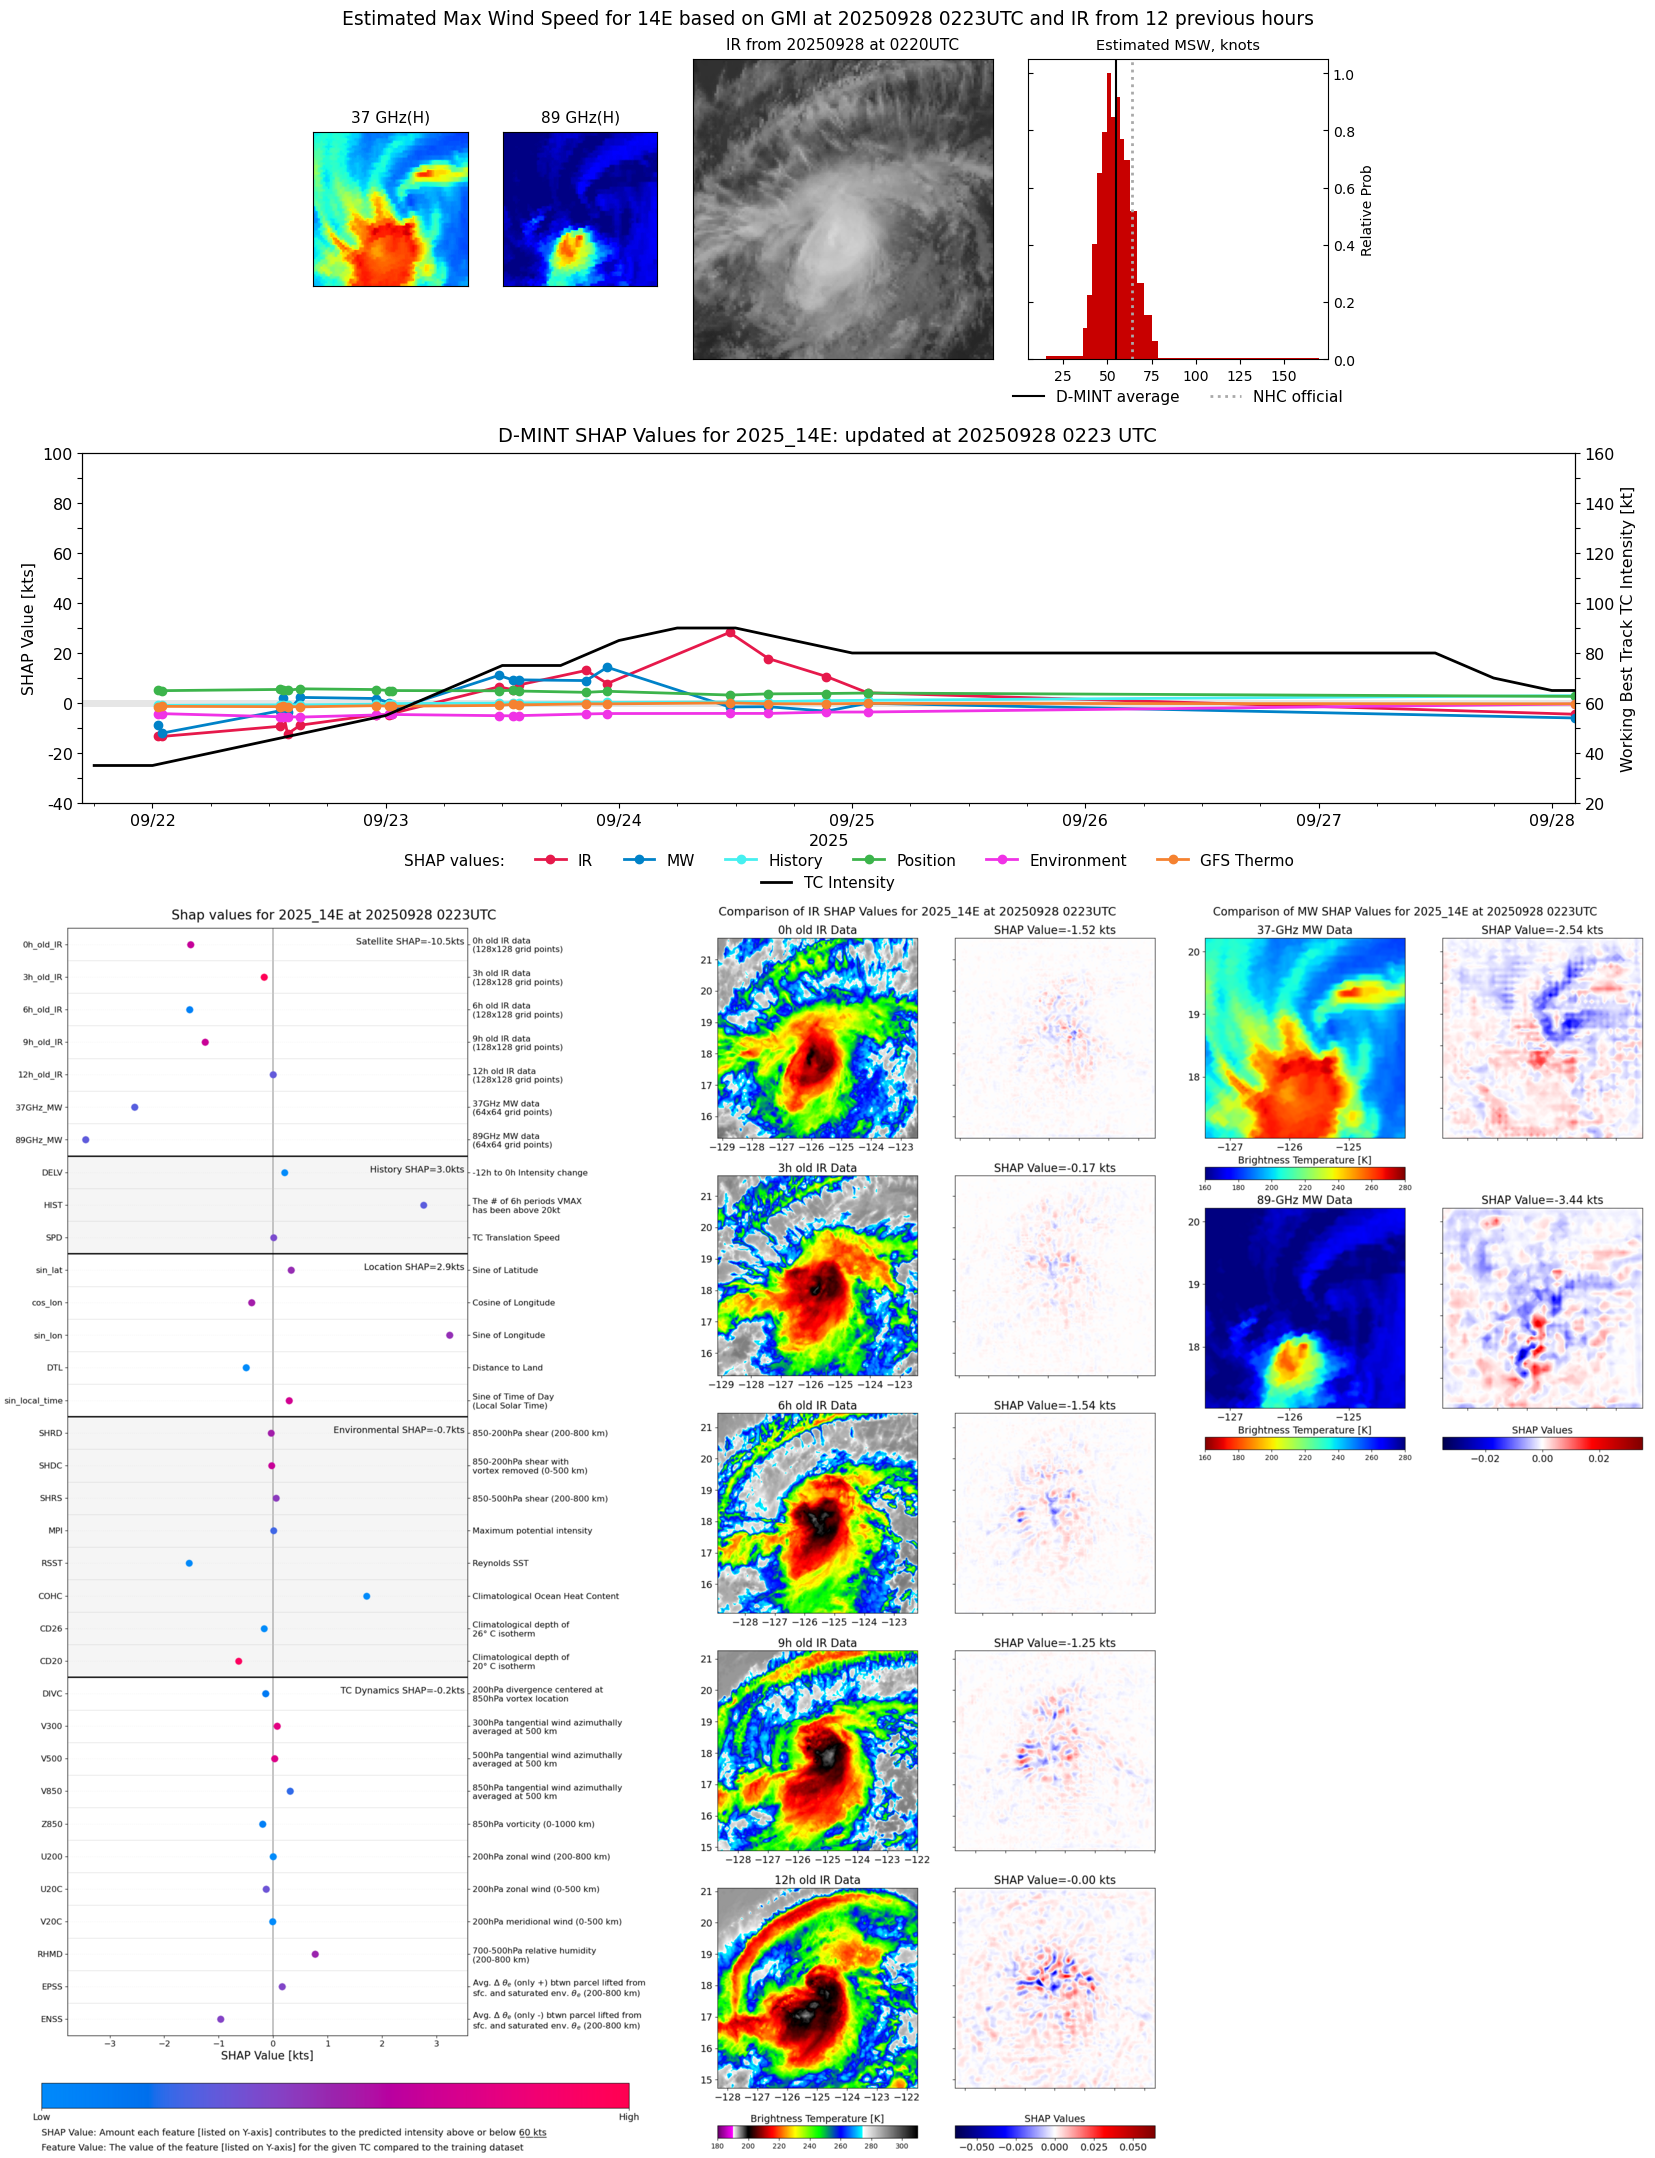 |
| 20250928 | 0218 UTC | WSFM01 | 998 hPa | 59 kts | 53 kts | 66 kts | 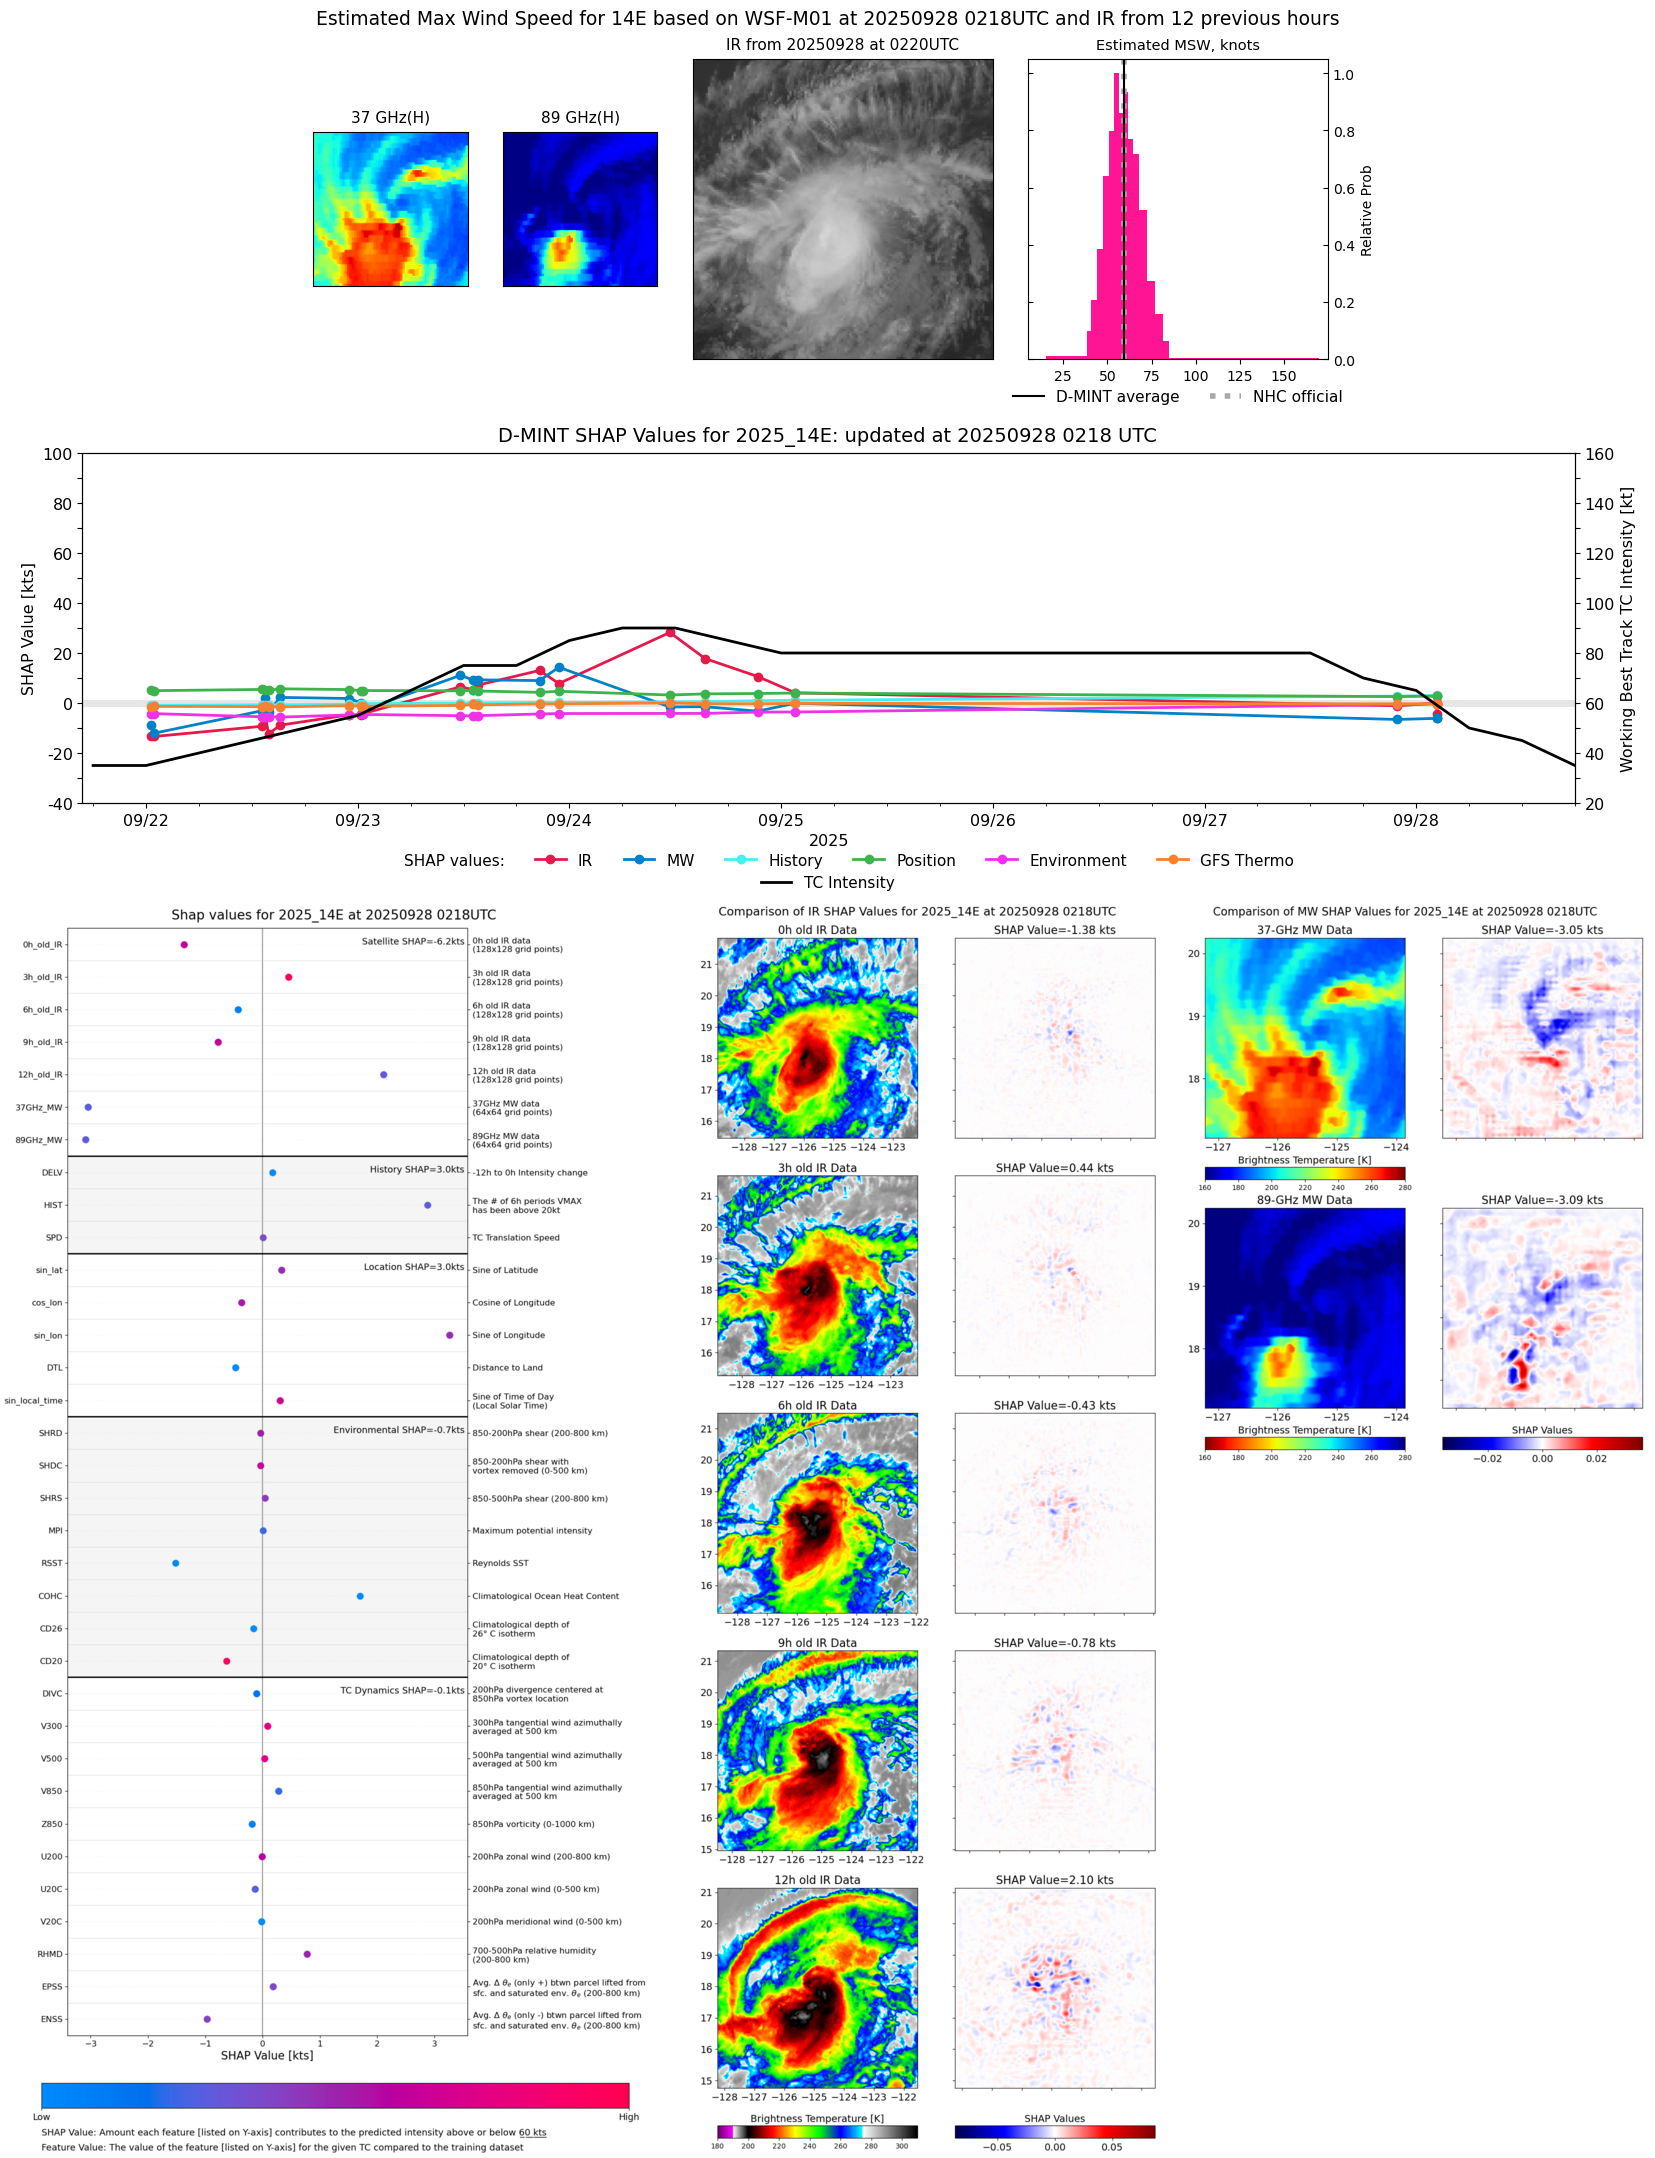 |
| 20250928 | 0150 UTC | TMS07 | 996 hPa | 54 kts | 48 kts | 60 kts | 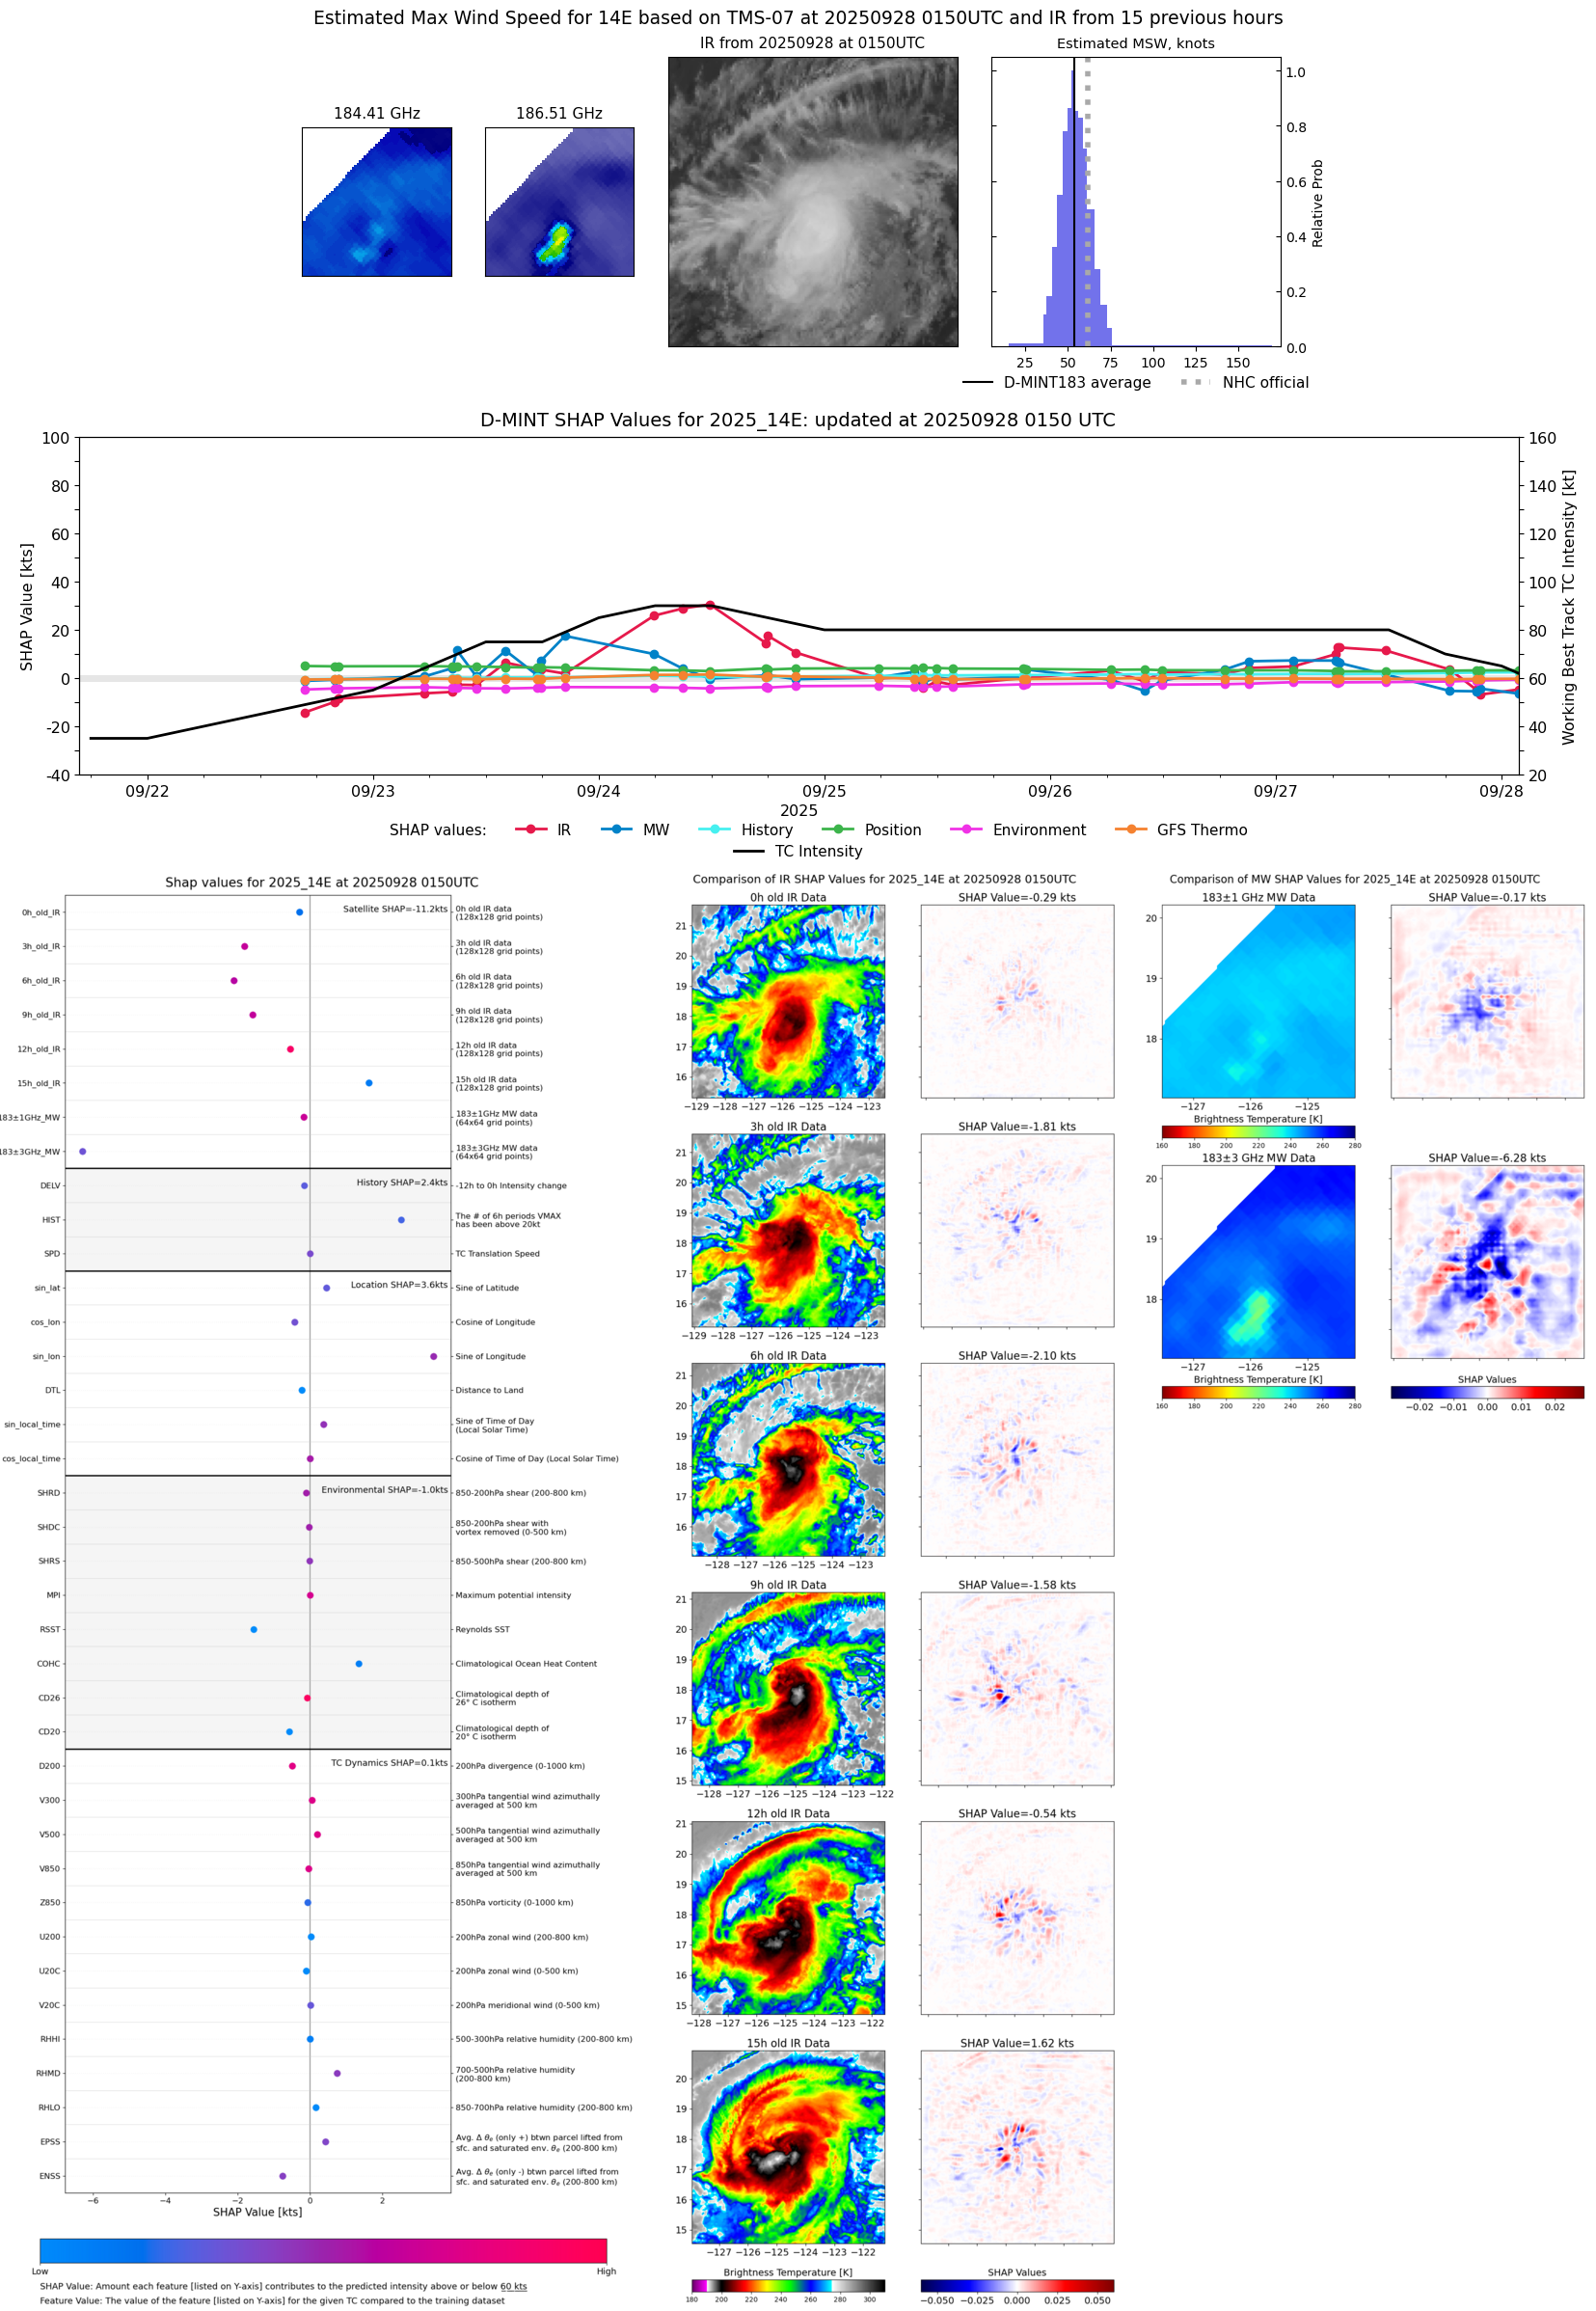 |
| 20250927 | 2152 UTC | AMSR2 | 994 hPa | 57 kts | 51 kts | 63 kts |  |
| 20250927 | 2143 UTC | ATMS-N21 | 993 hPa | 54 kts | 48 kts | 60 kts |  |
| 20250927 | 2119 UTC | TROPICS03 | 991 hPa | 54 kts | 49 kts | 60 kts | 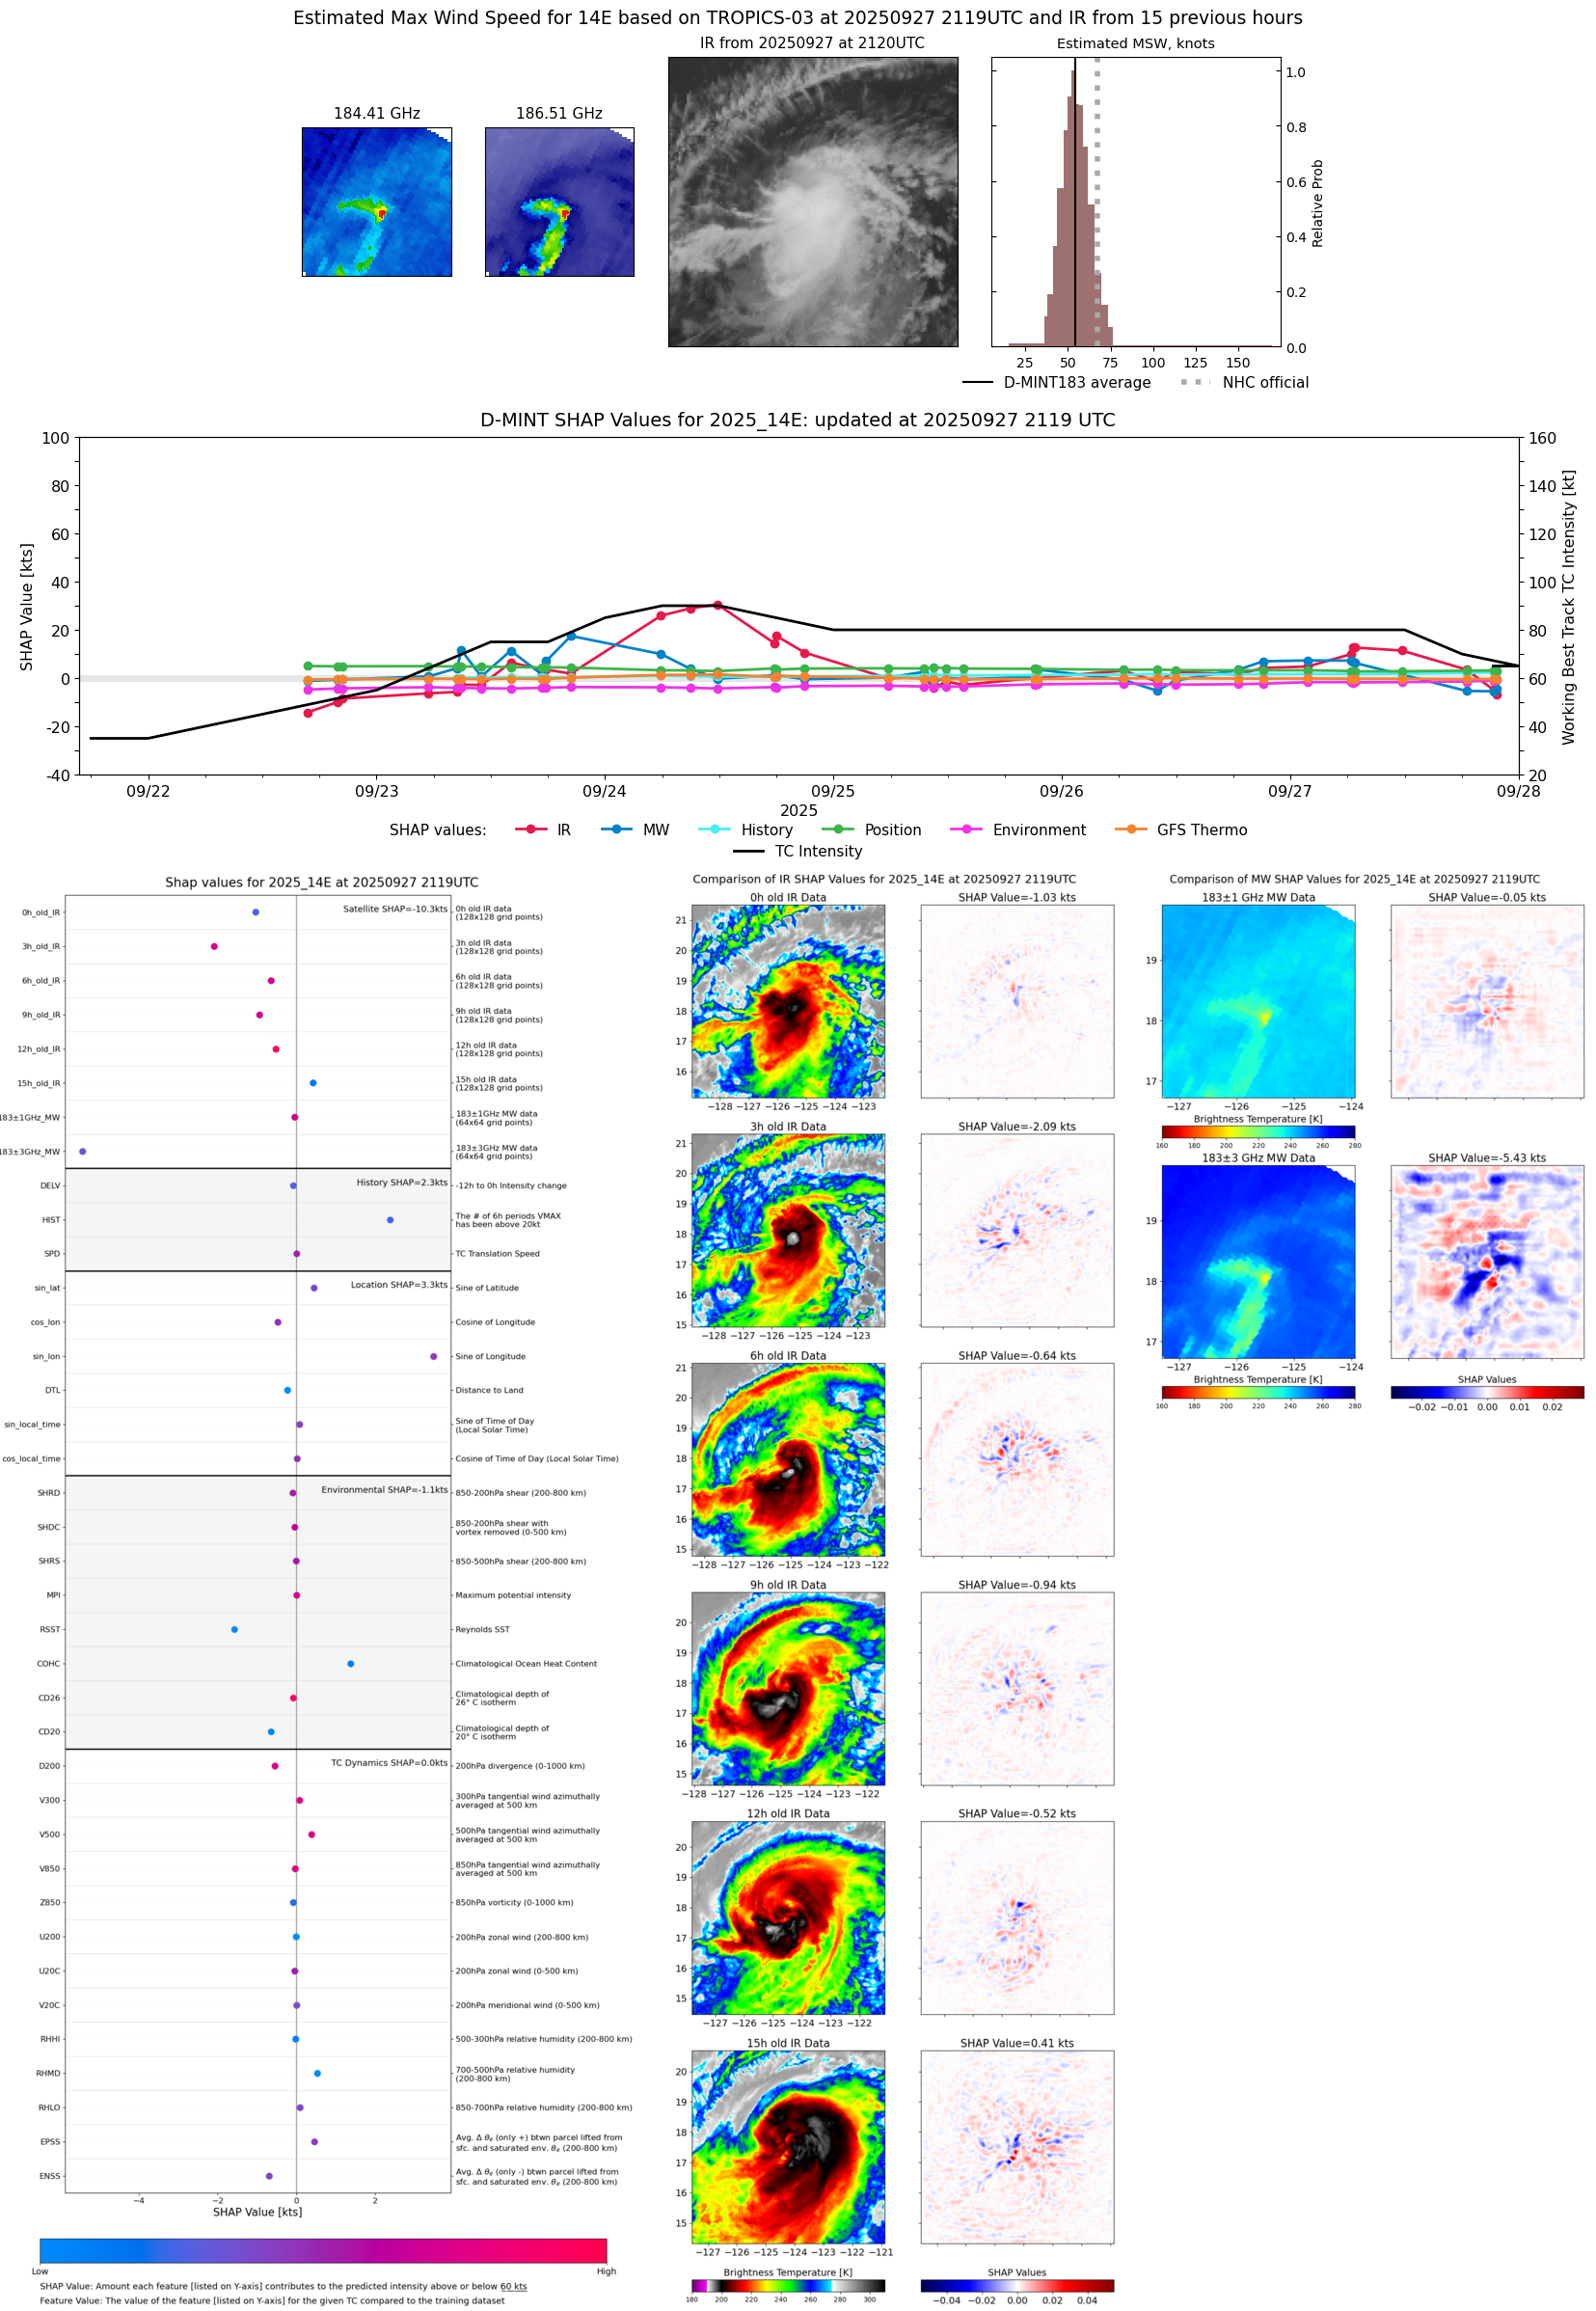 |
| 20250927 | 1830 UTC | TMS05 | 987 hPa | 62 kts | 56 kts | 68 kts | 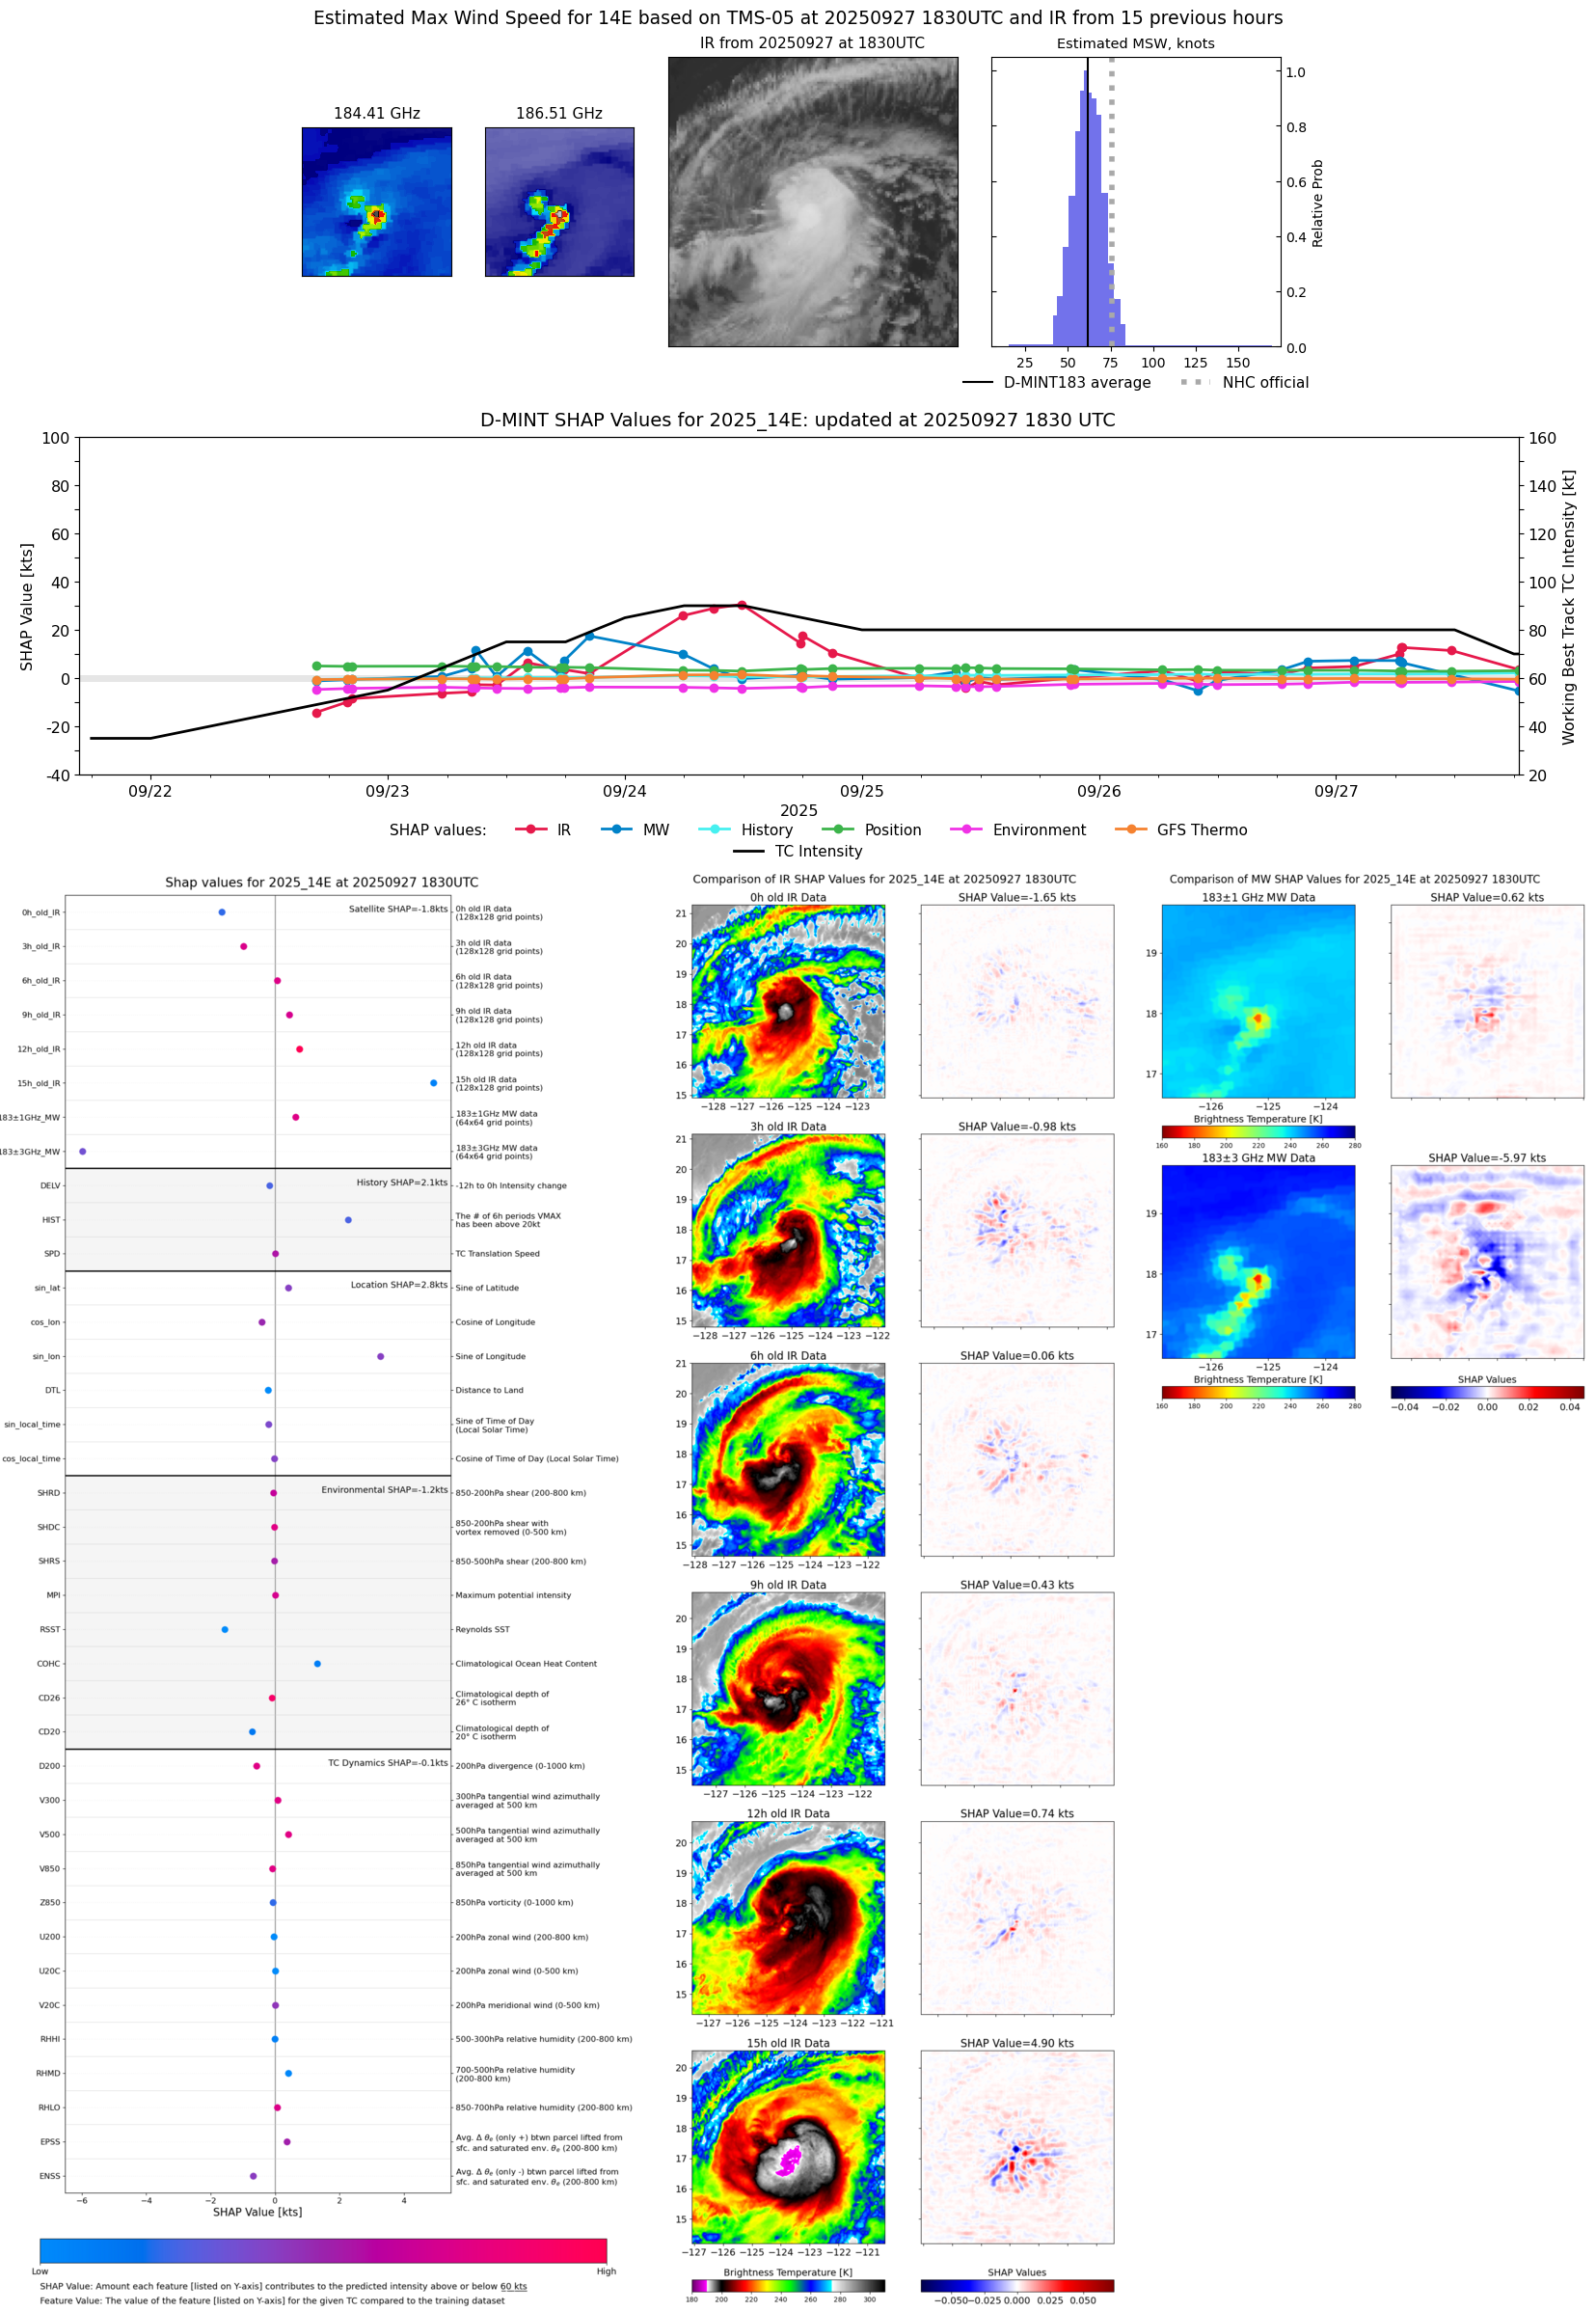 |
| 20250927 | 1142 UTC | TMS07 | 978 hPa | 76 kts | 70 kts | 82 kts | 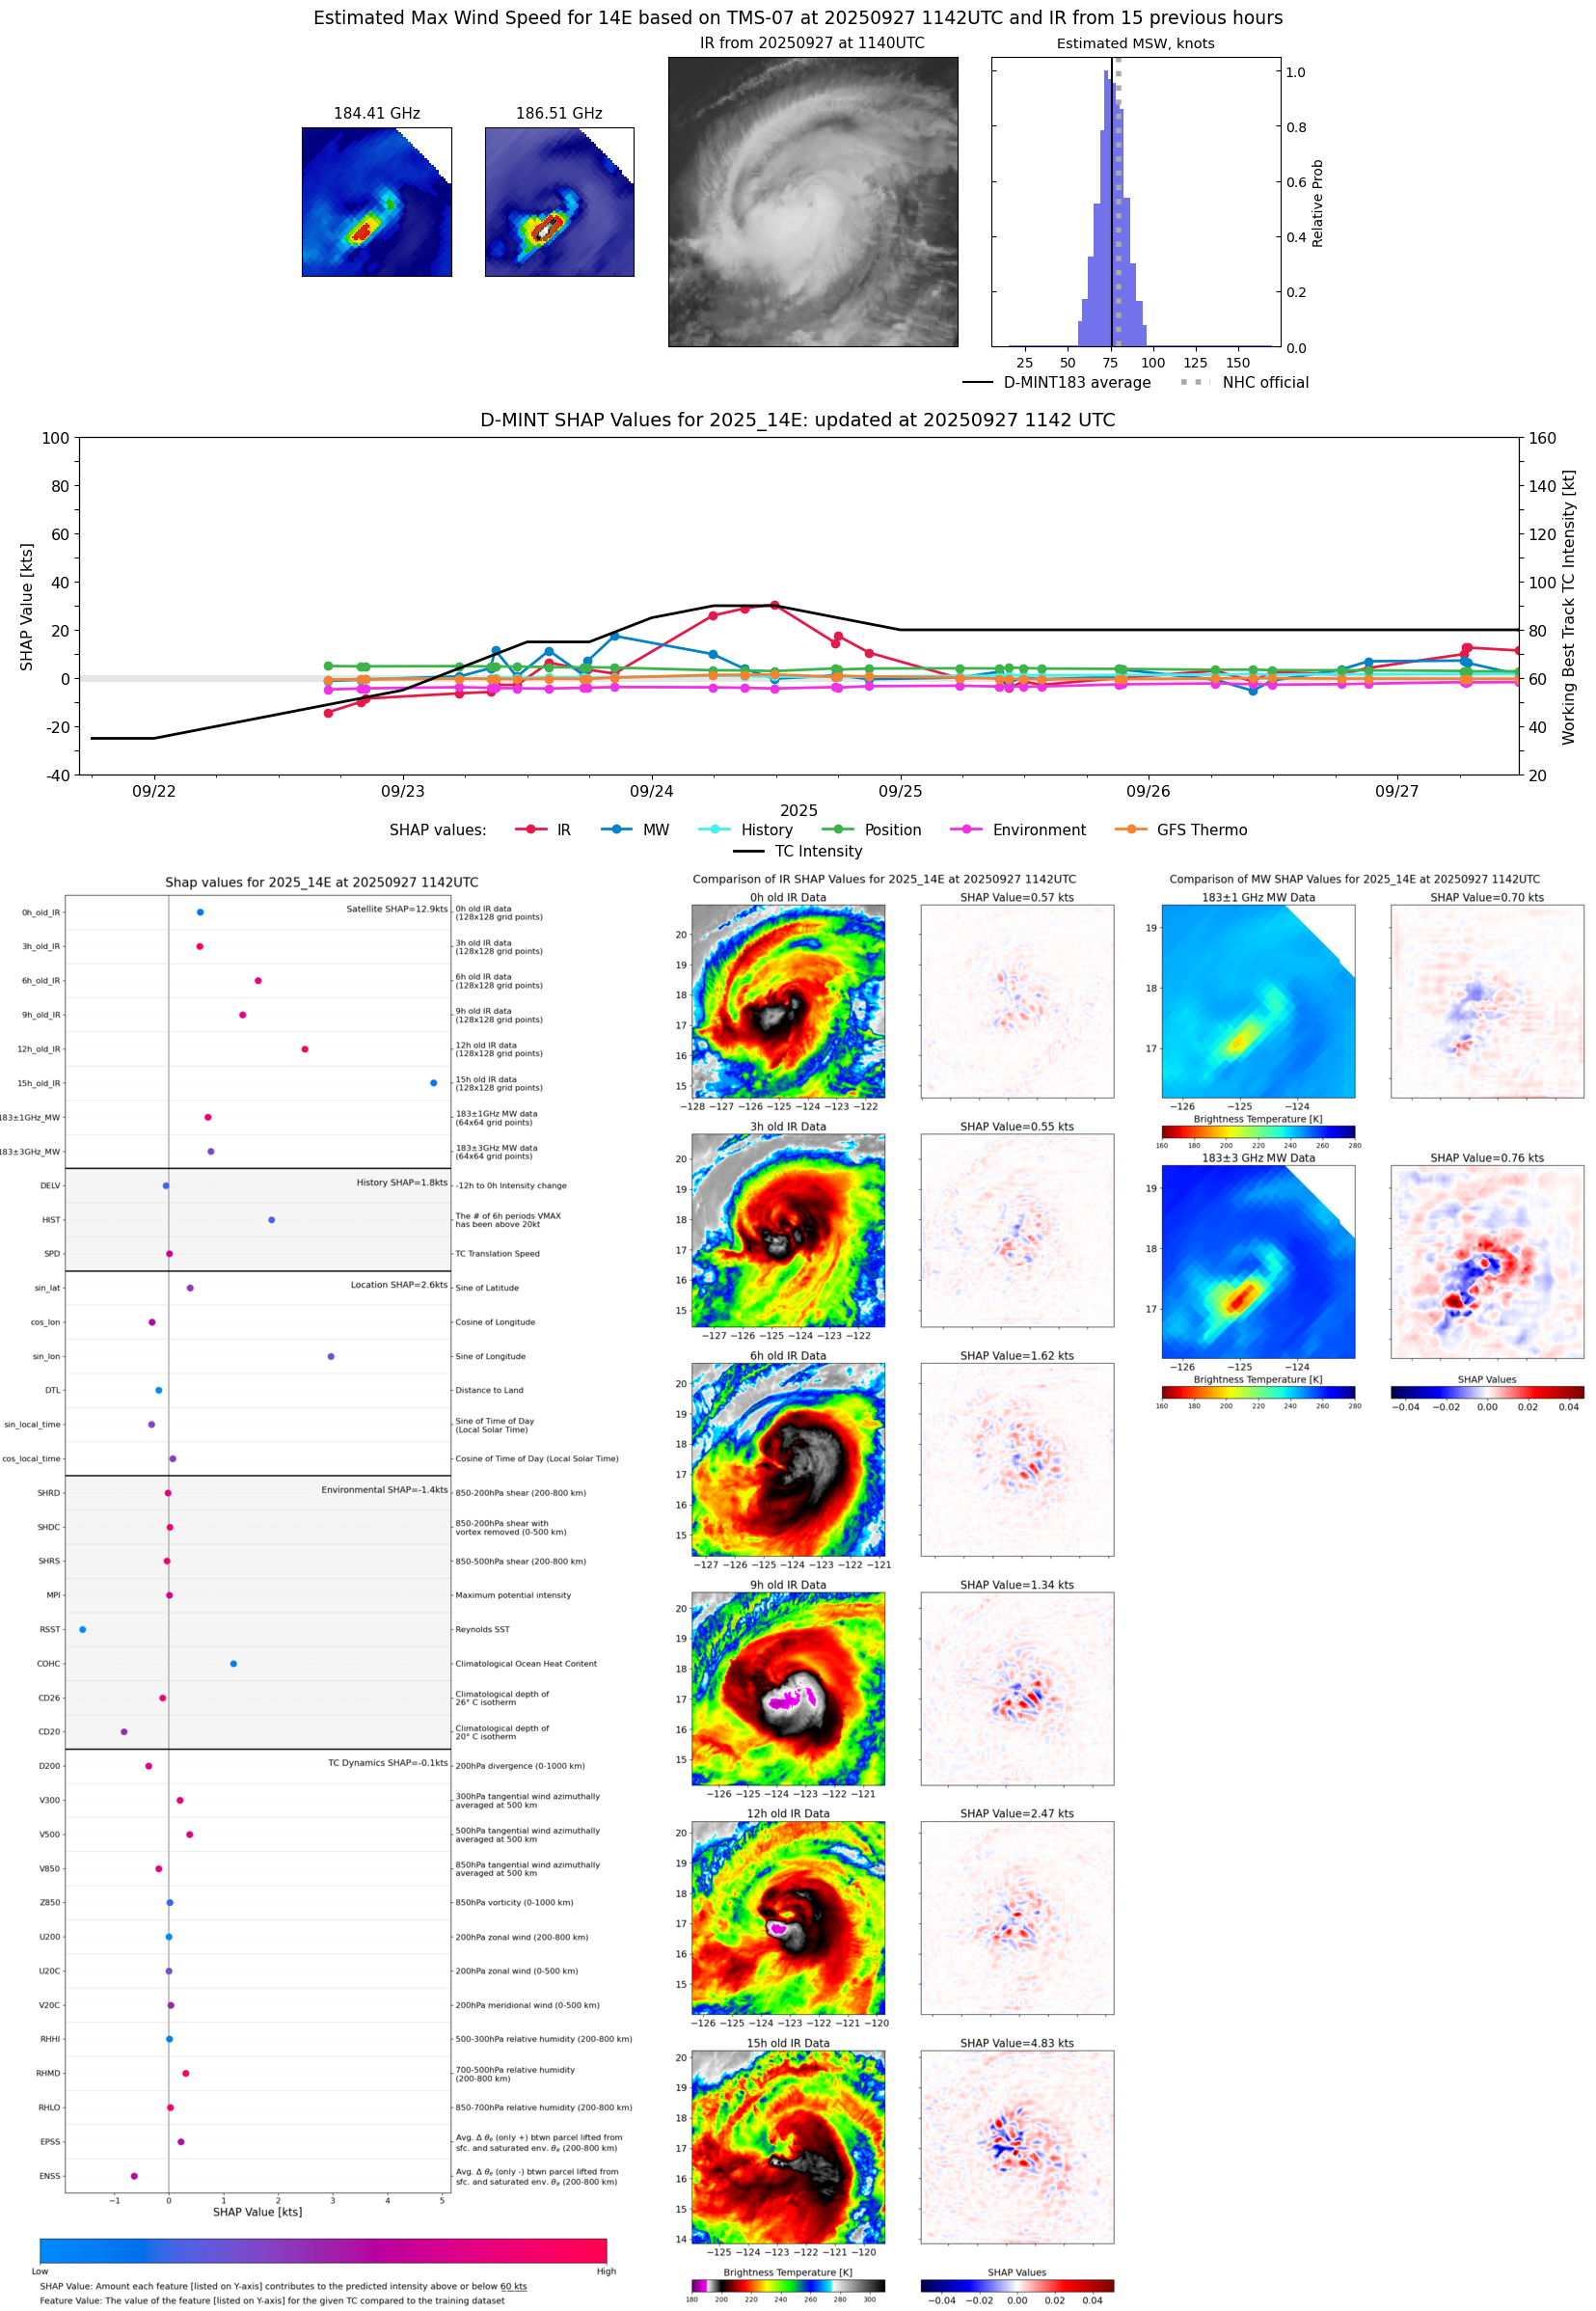 |
| 20250927 | 0644 UTC | TMS02 | 975 hPa | 82 kts | 76 kts | 87 kts | 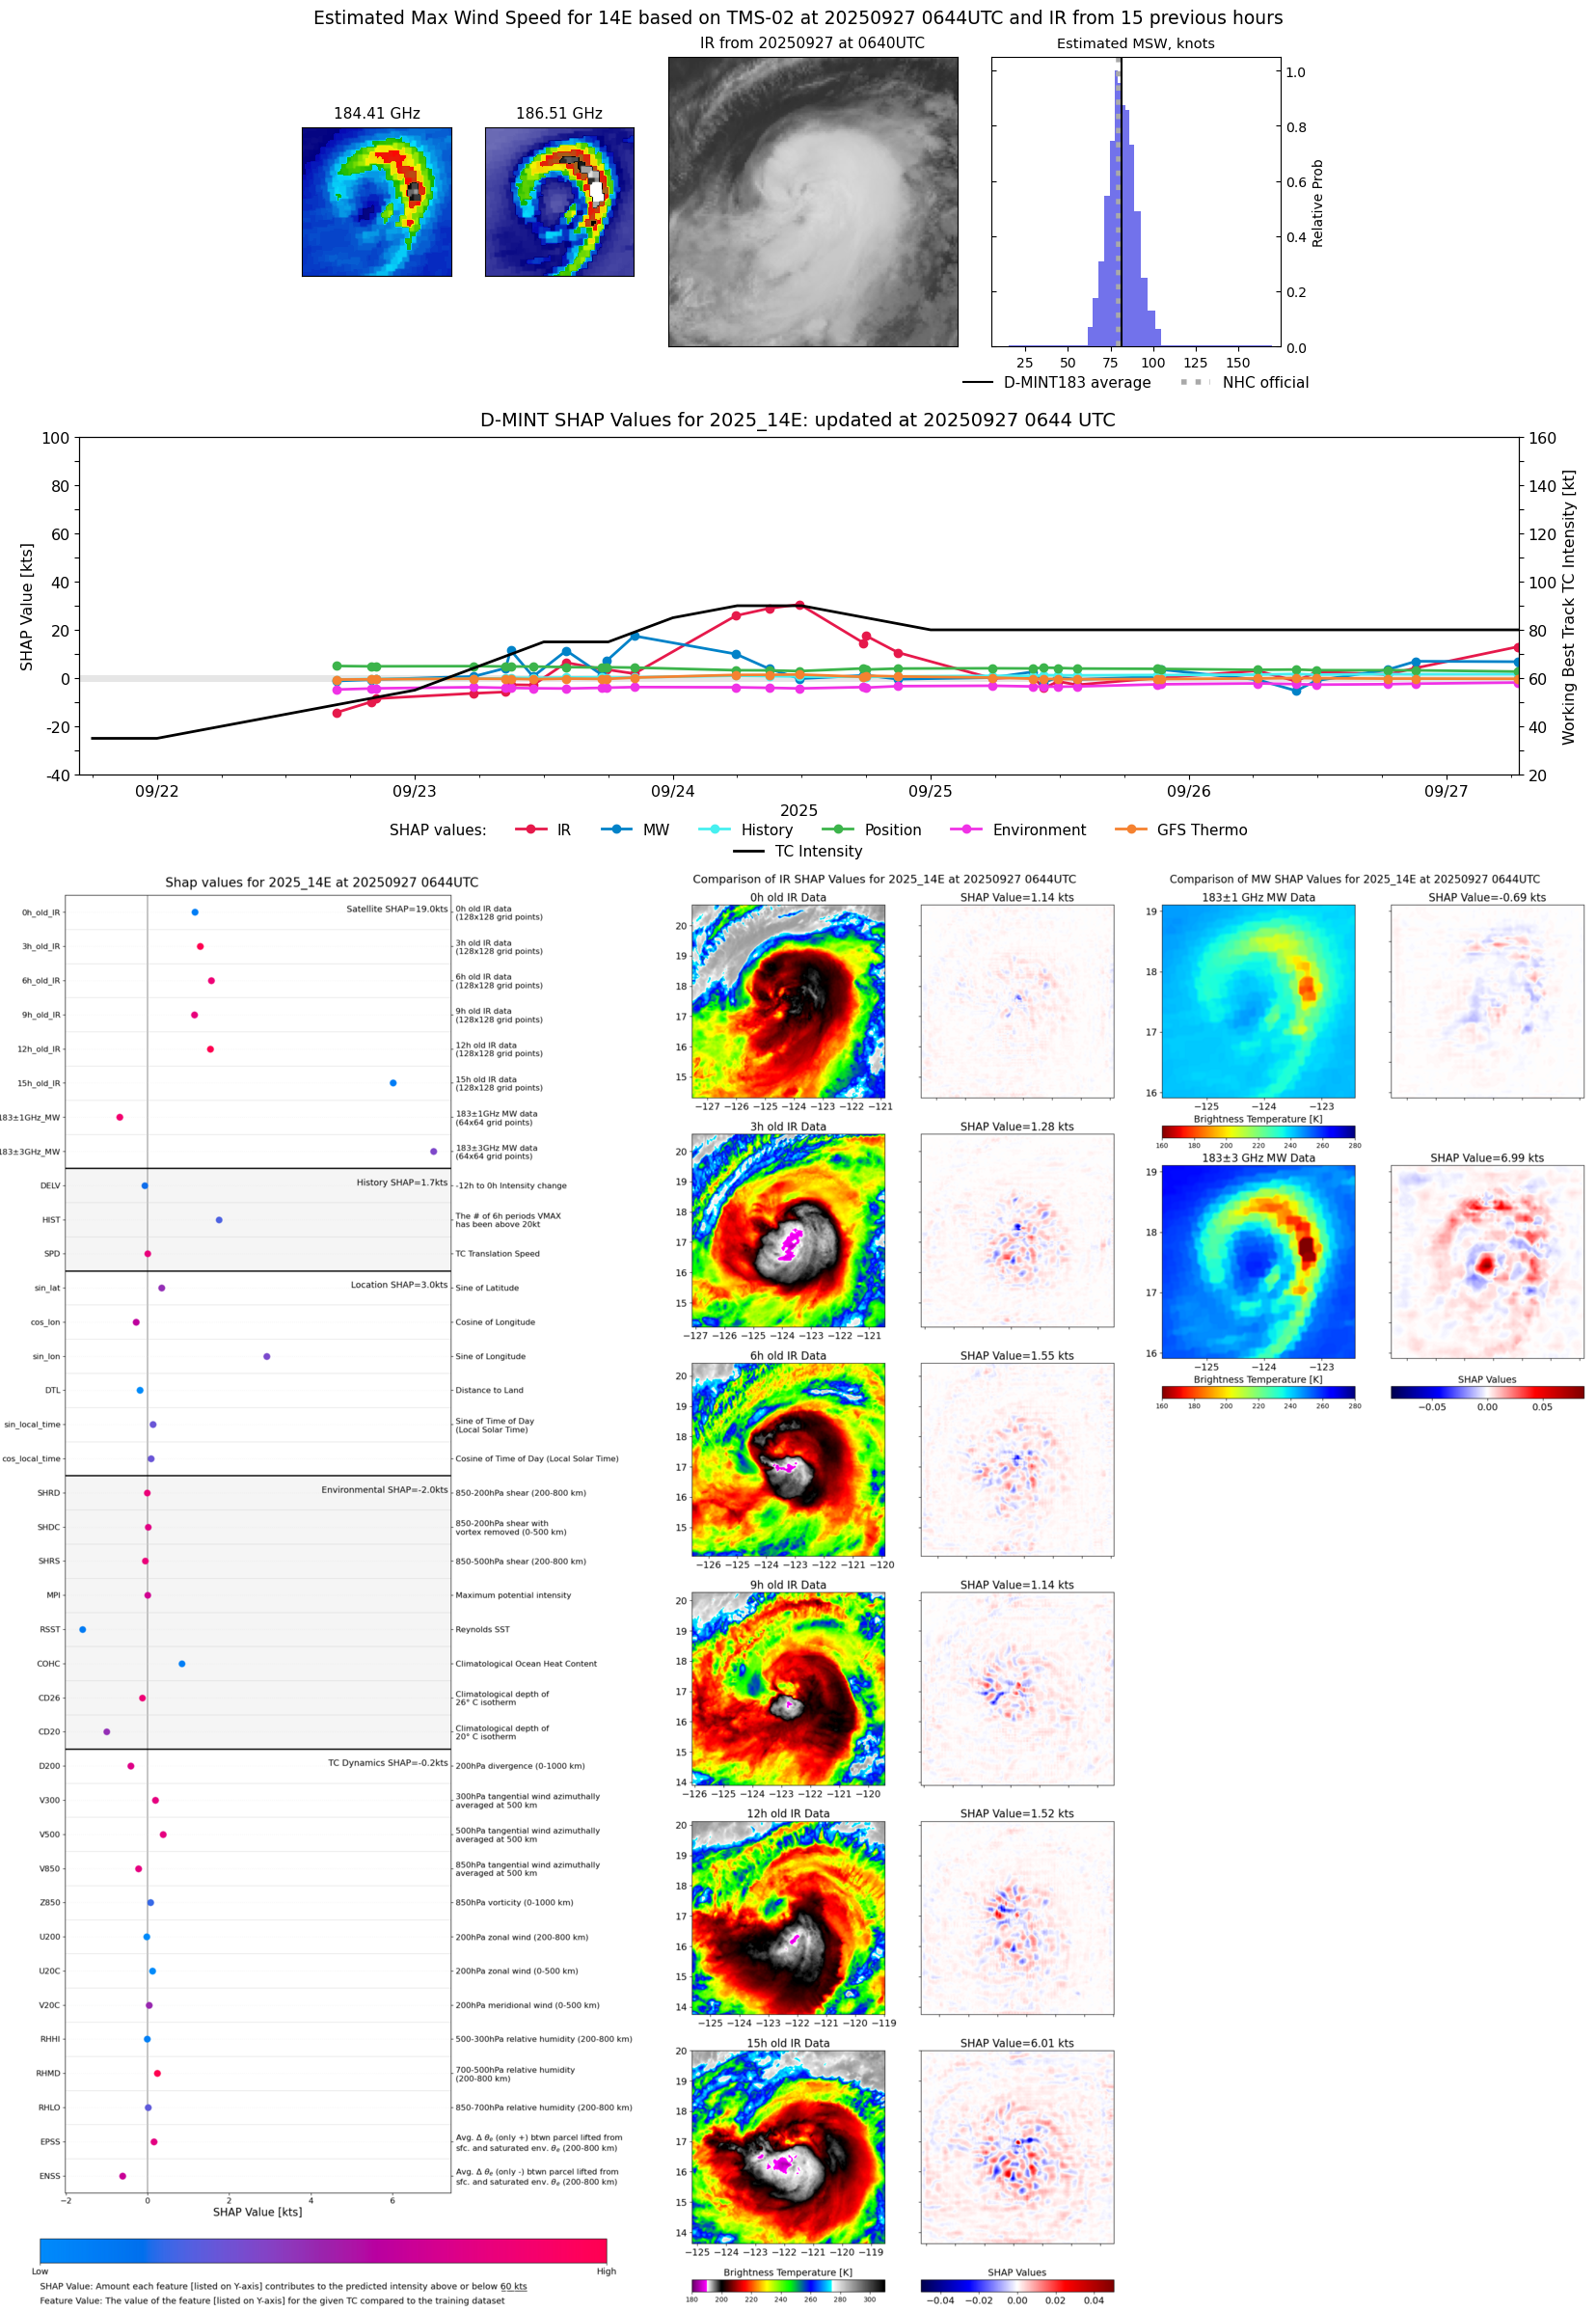 |
| 20250927 | 0636 UTC | AWS | 975 hPa | 82 kts | 77 kts | 88 kts |  |
| 20250927 | 0622 UTC | TMS05 | 975 hPa | 80 kts | 74 kts | 86 kts | 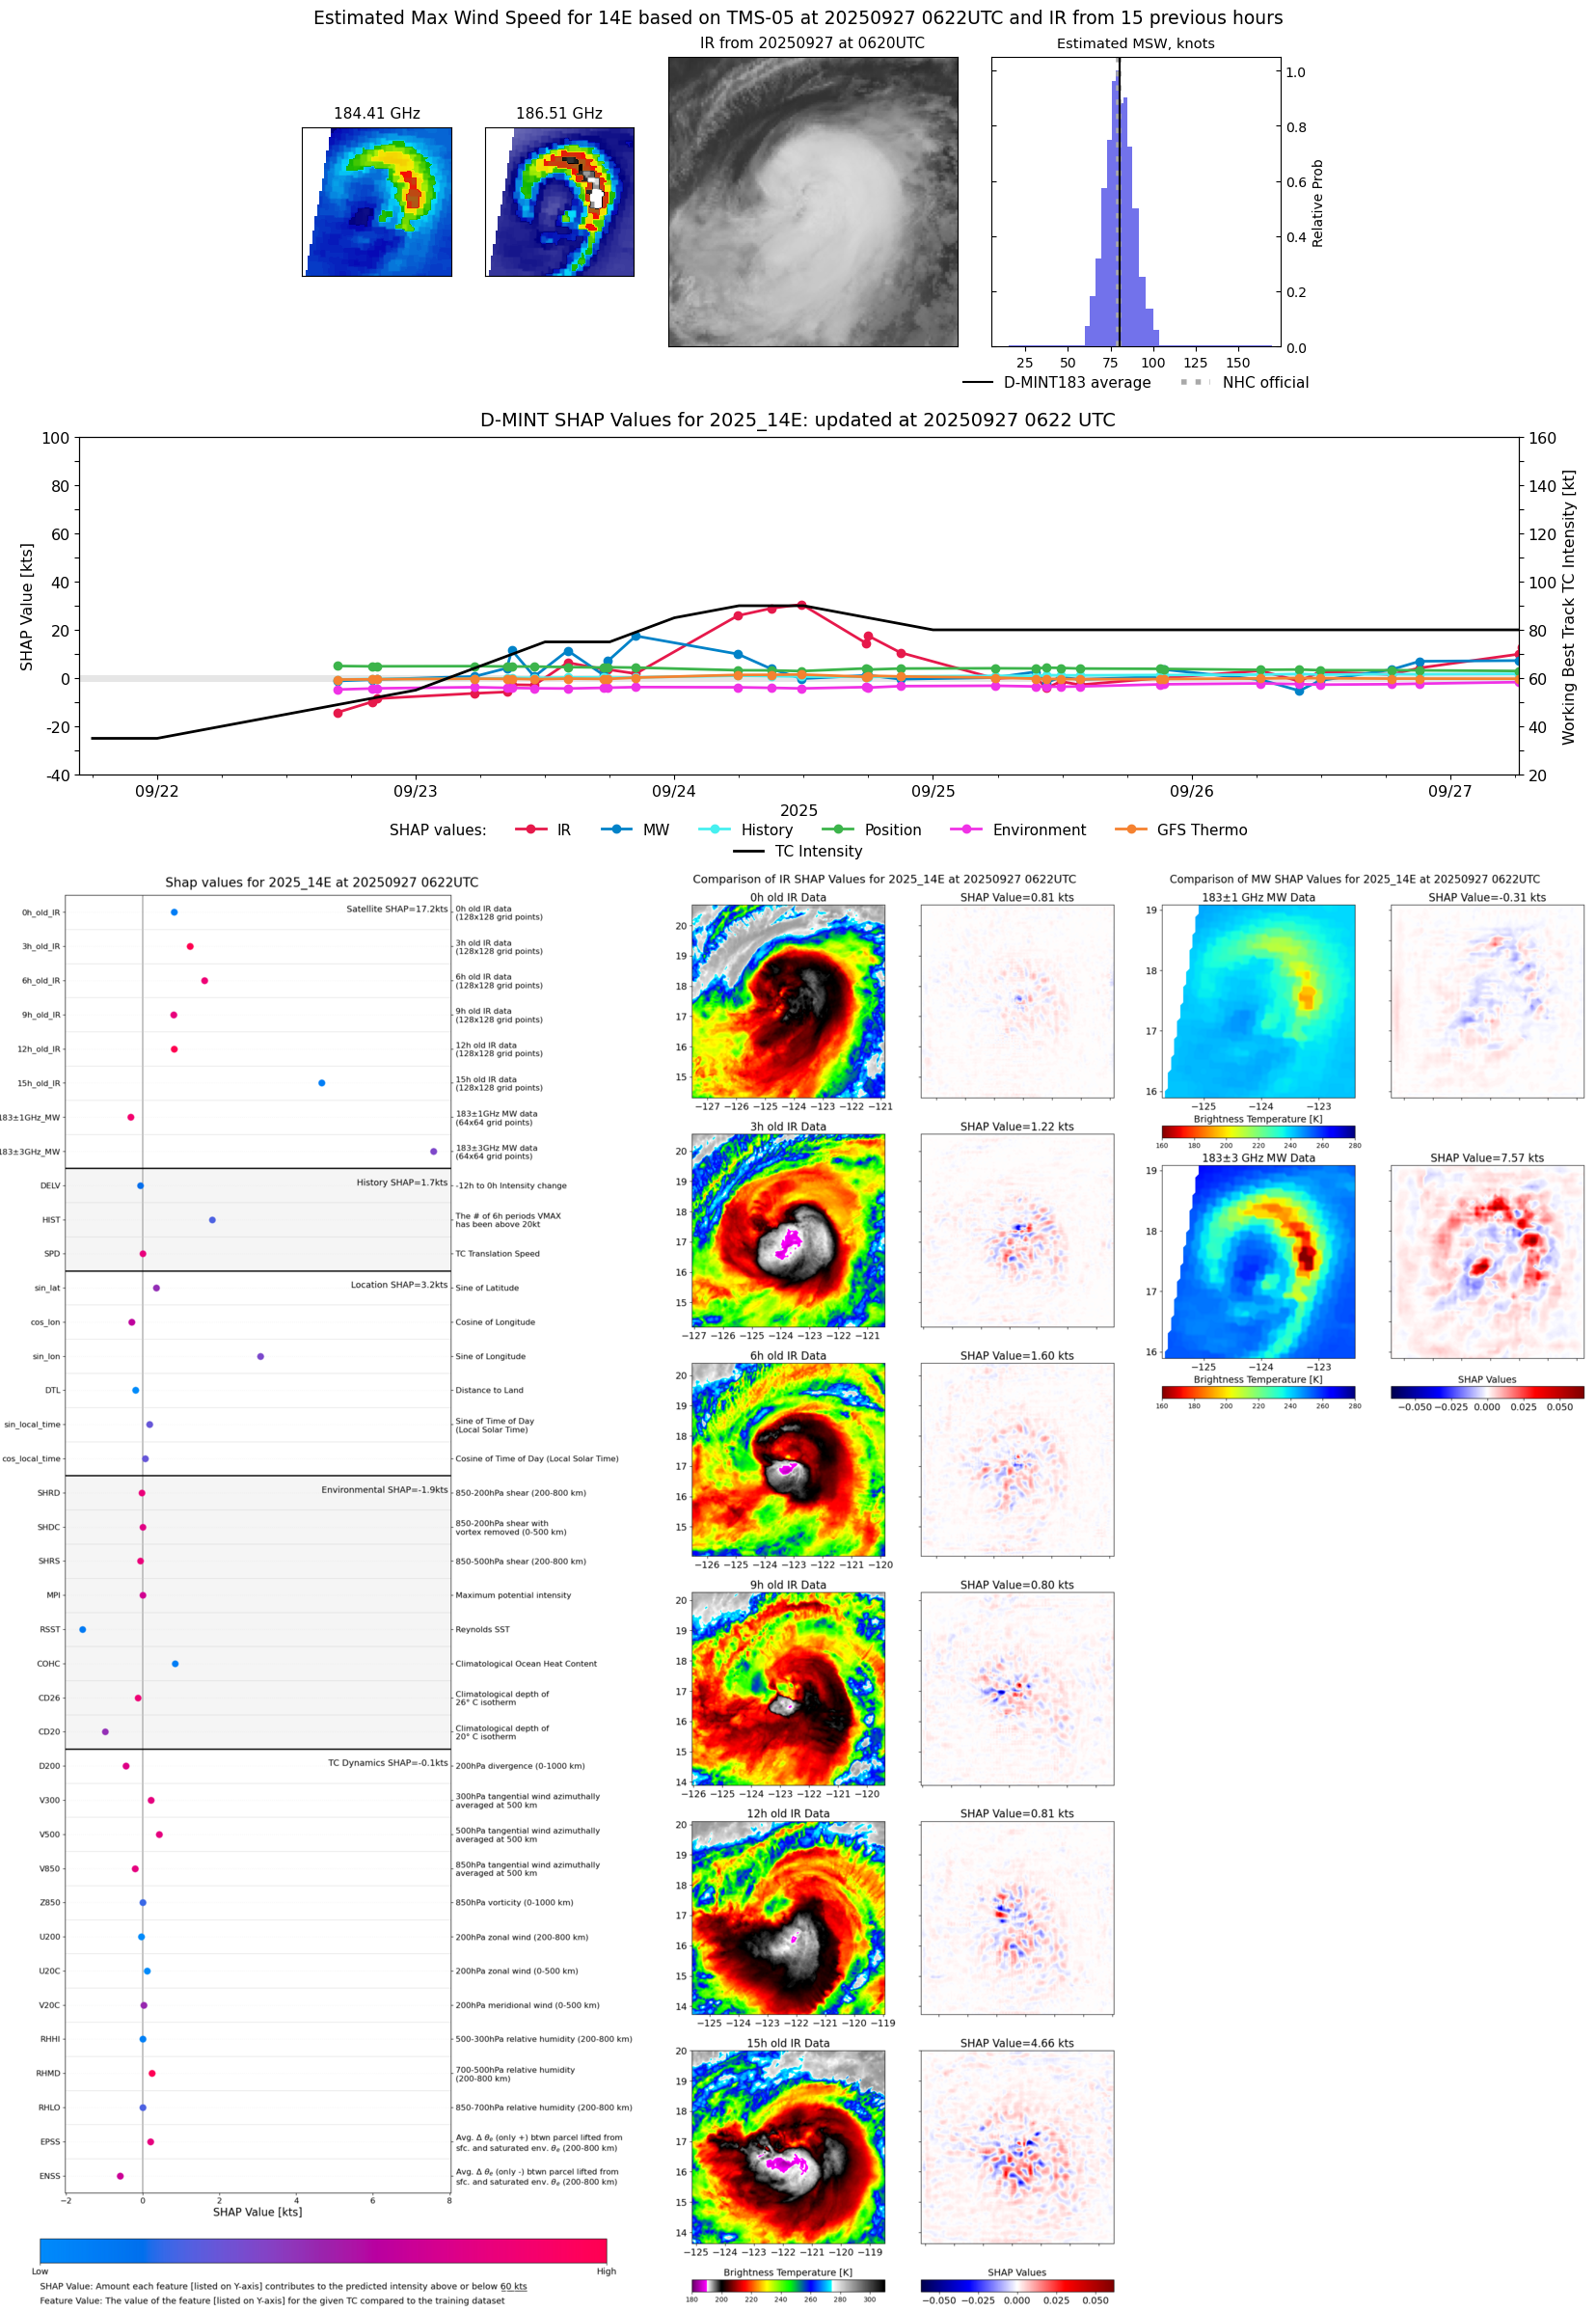 |
| 20250927 | 0151 UTC | TROPICS05 | 983 hPa | 76 kts | 70 kts | 81 kts | 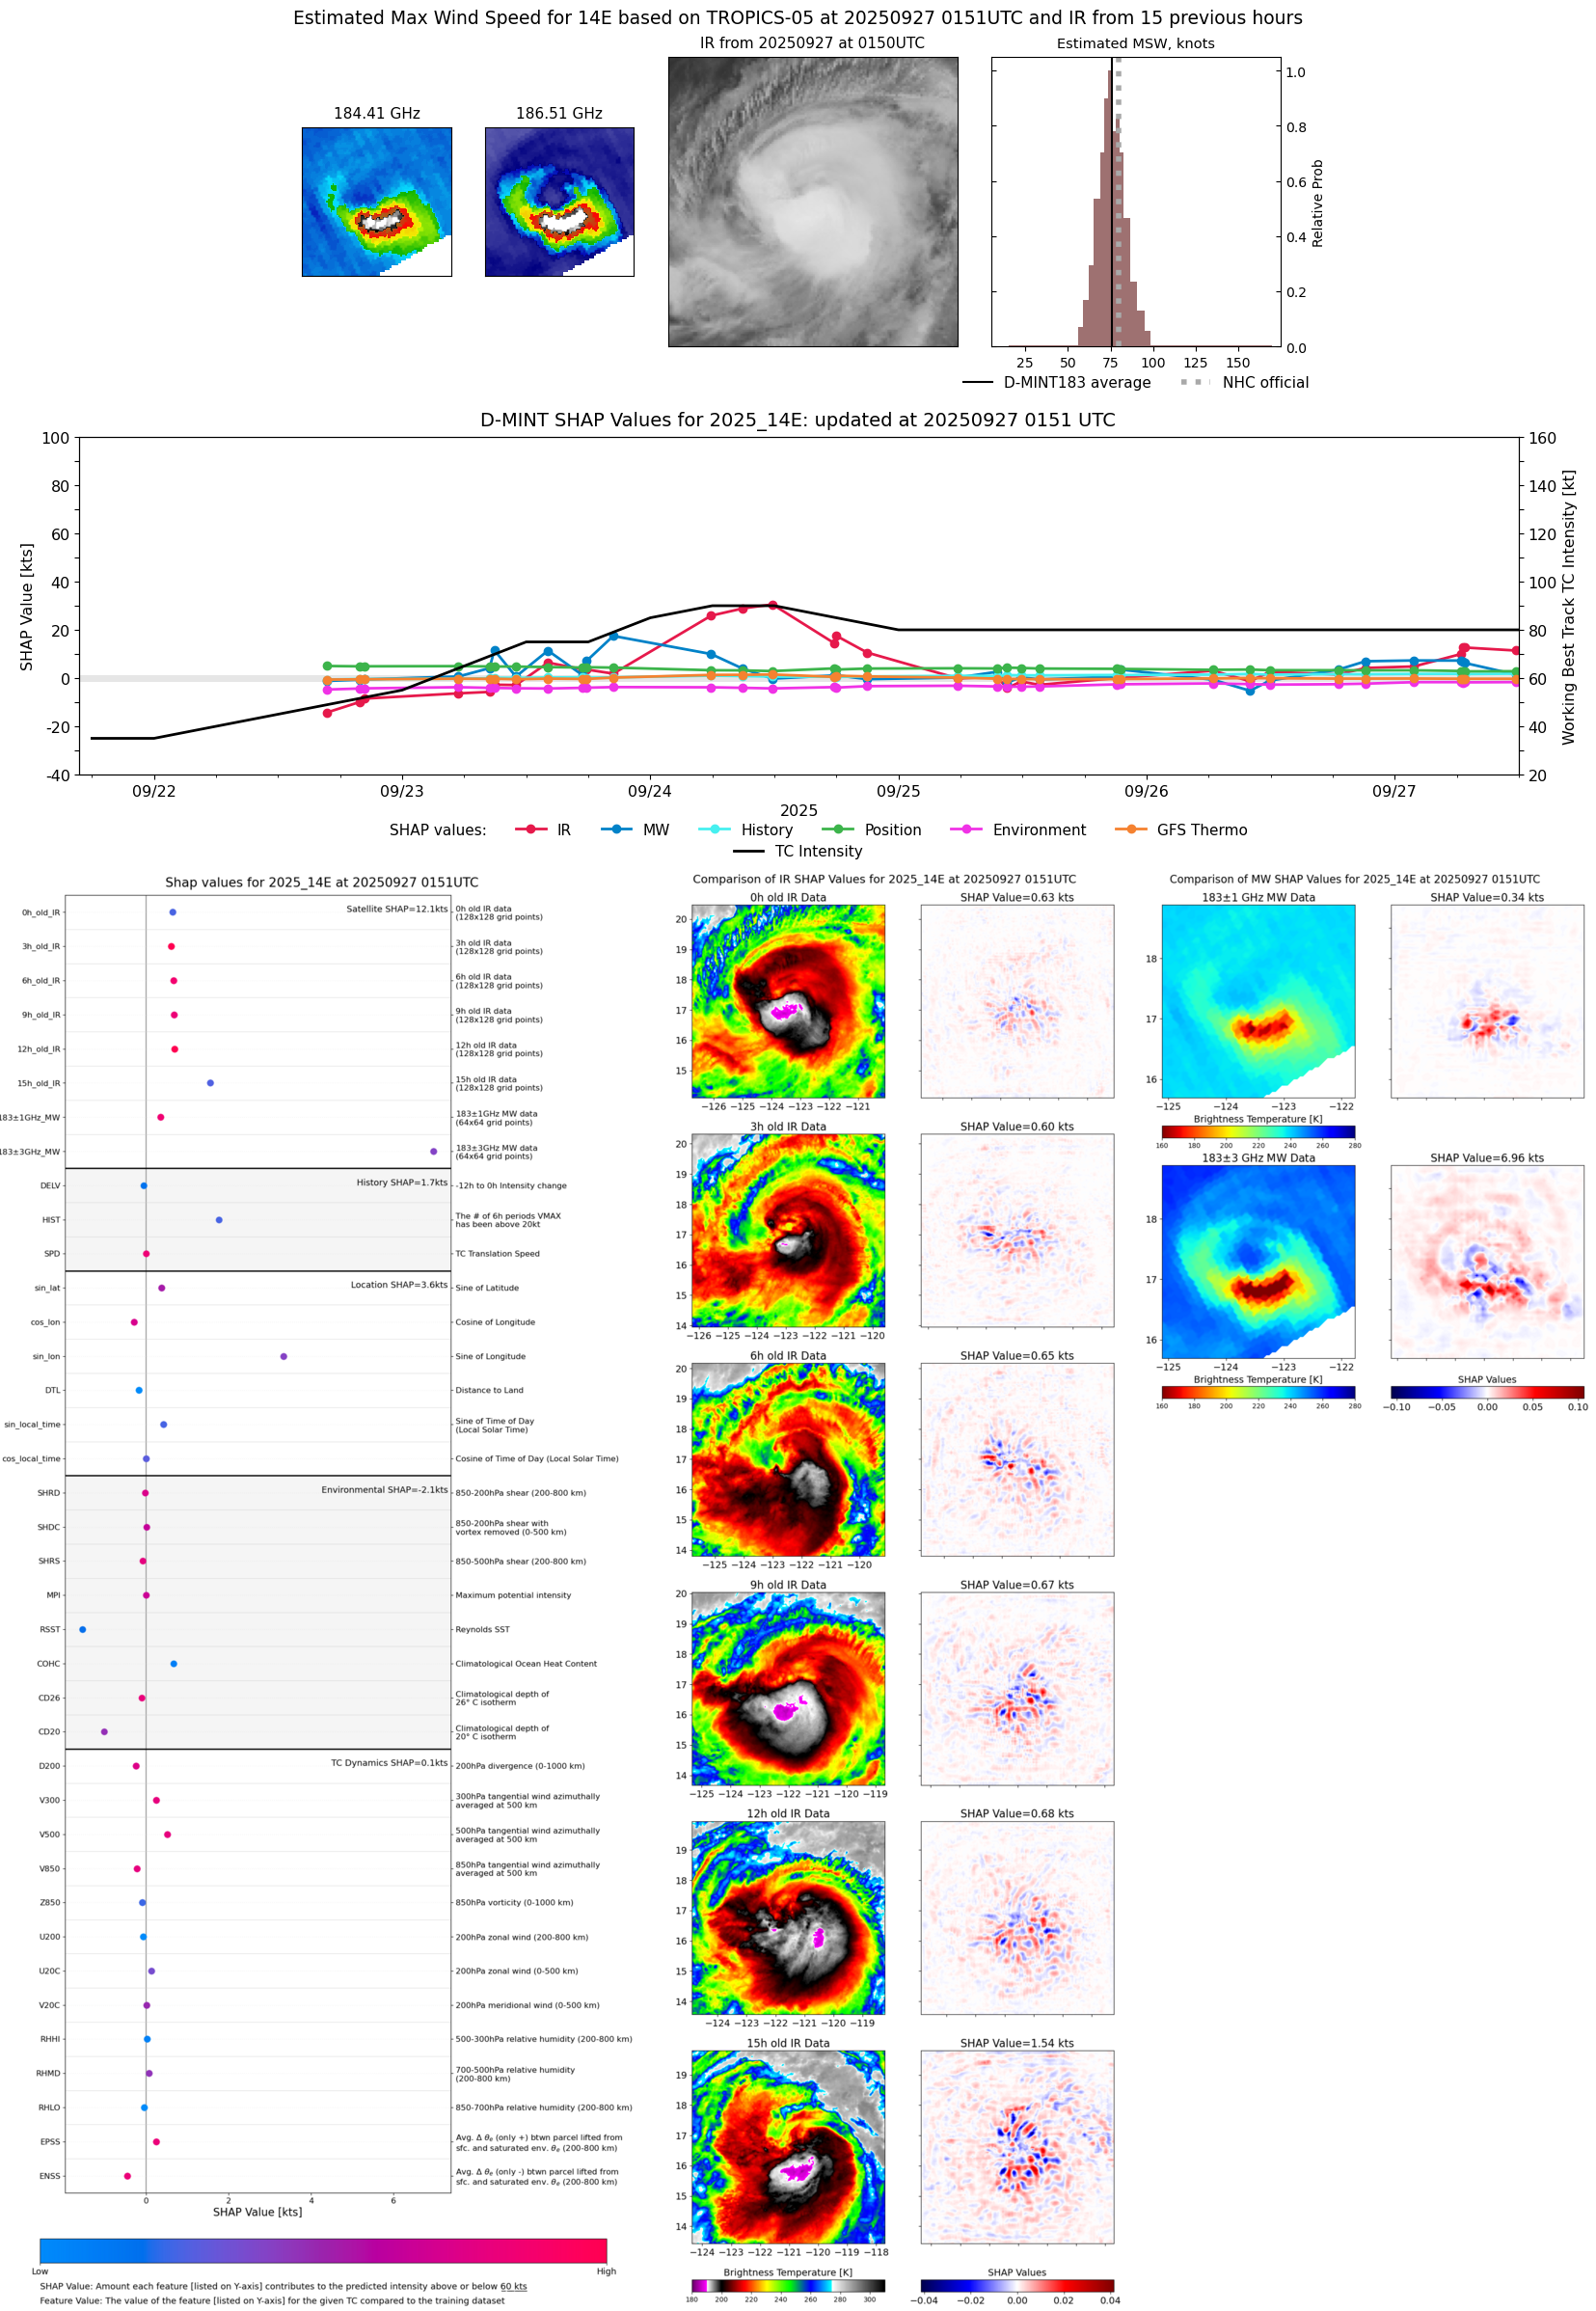 |
| 20250926 | 2110 UTC | ATMS-N20 | 979 hPa | 74 kts | 68 kts | 79 kts | 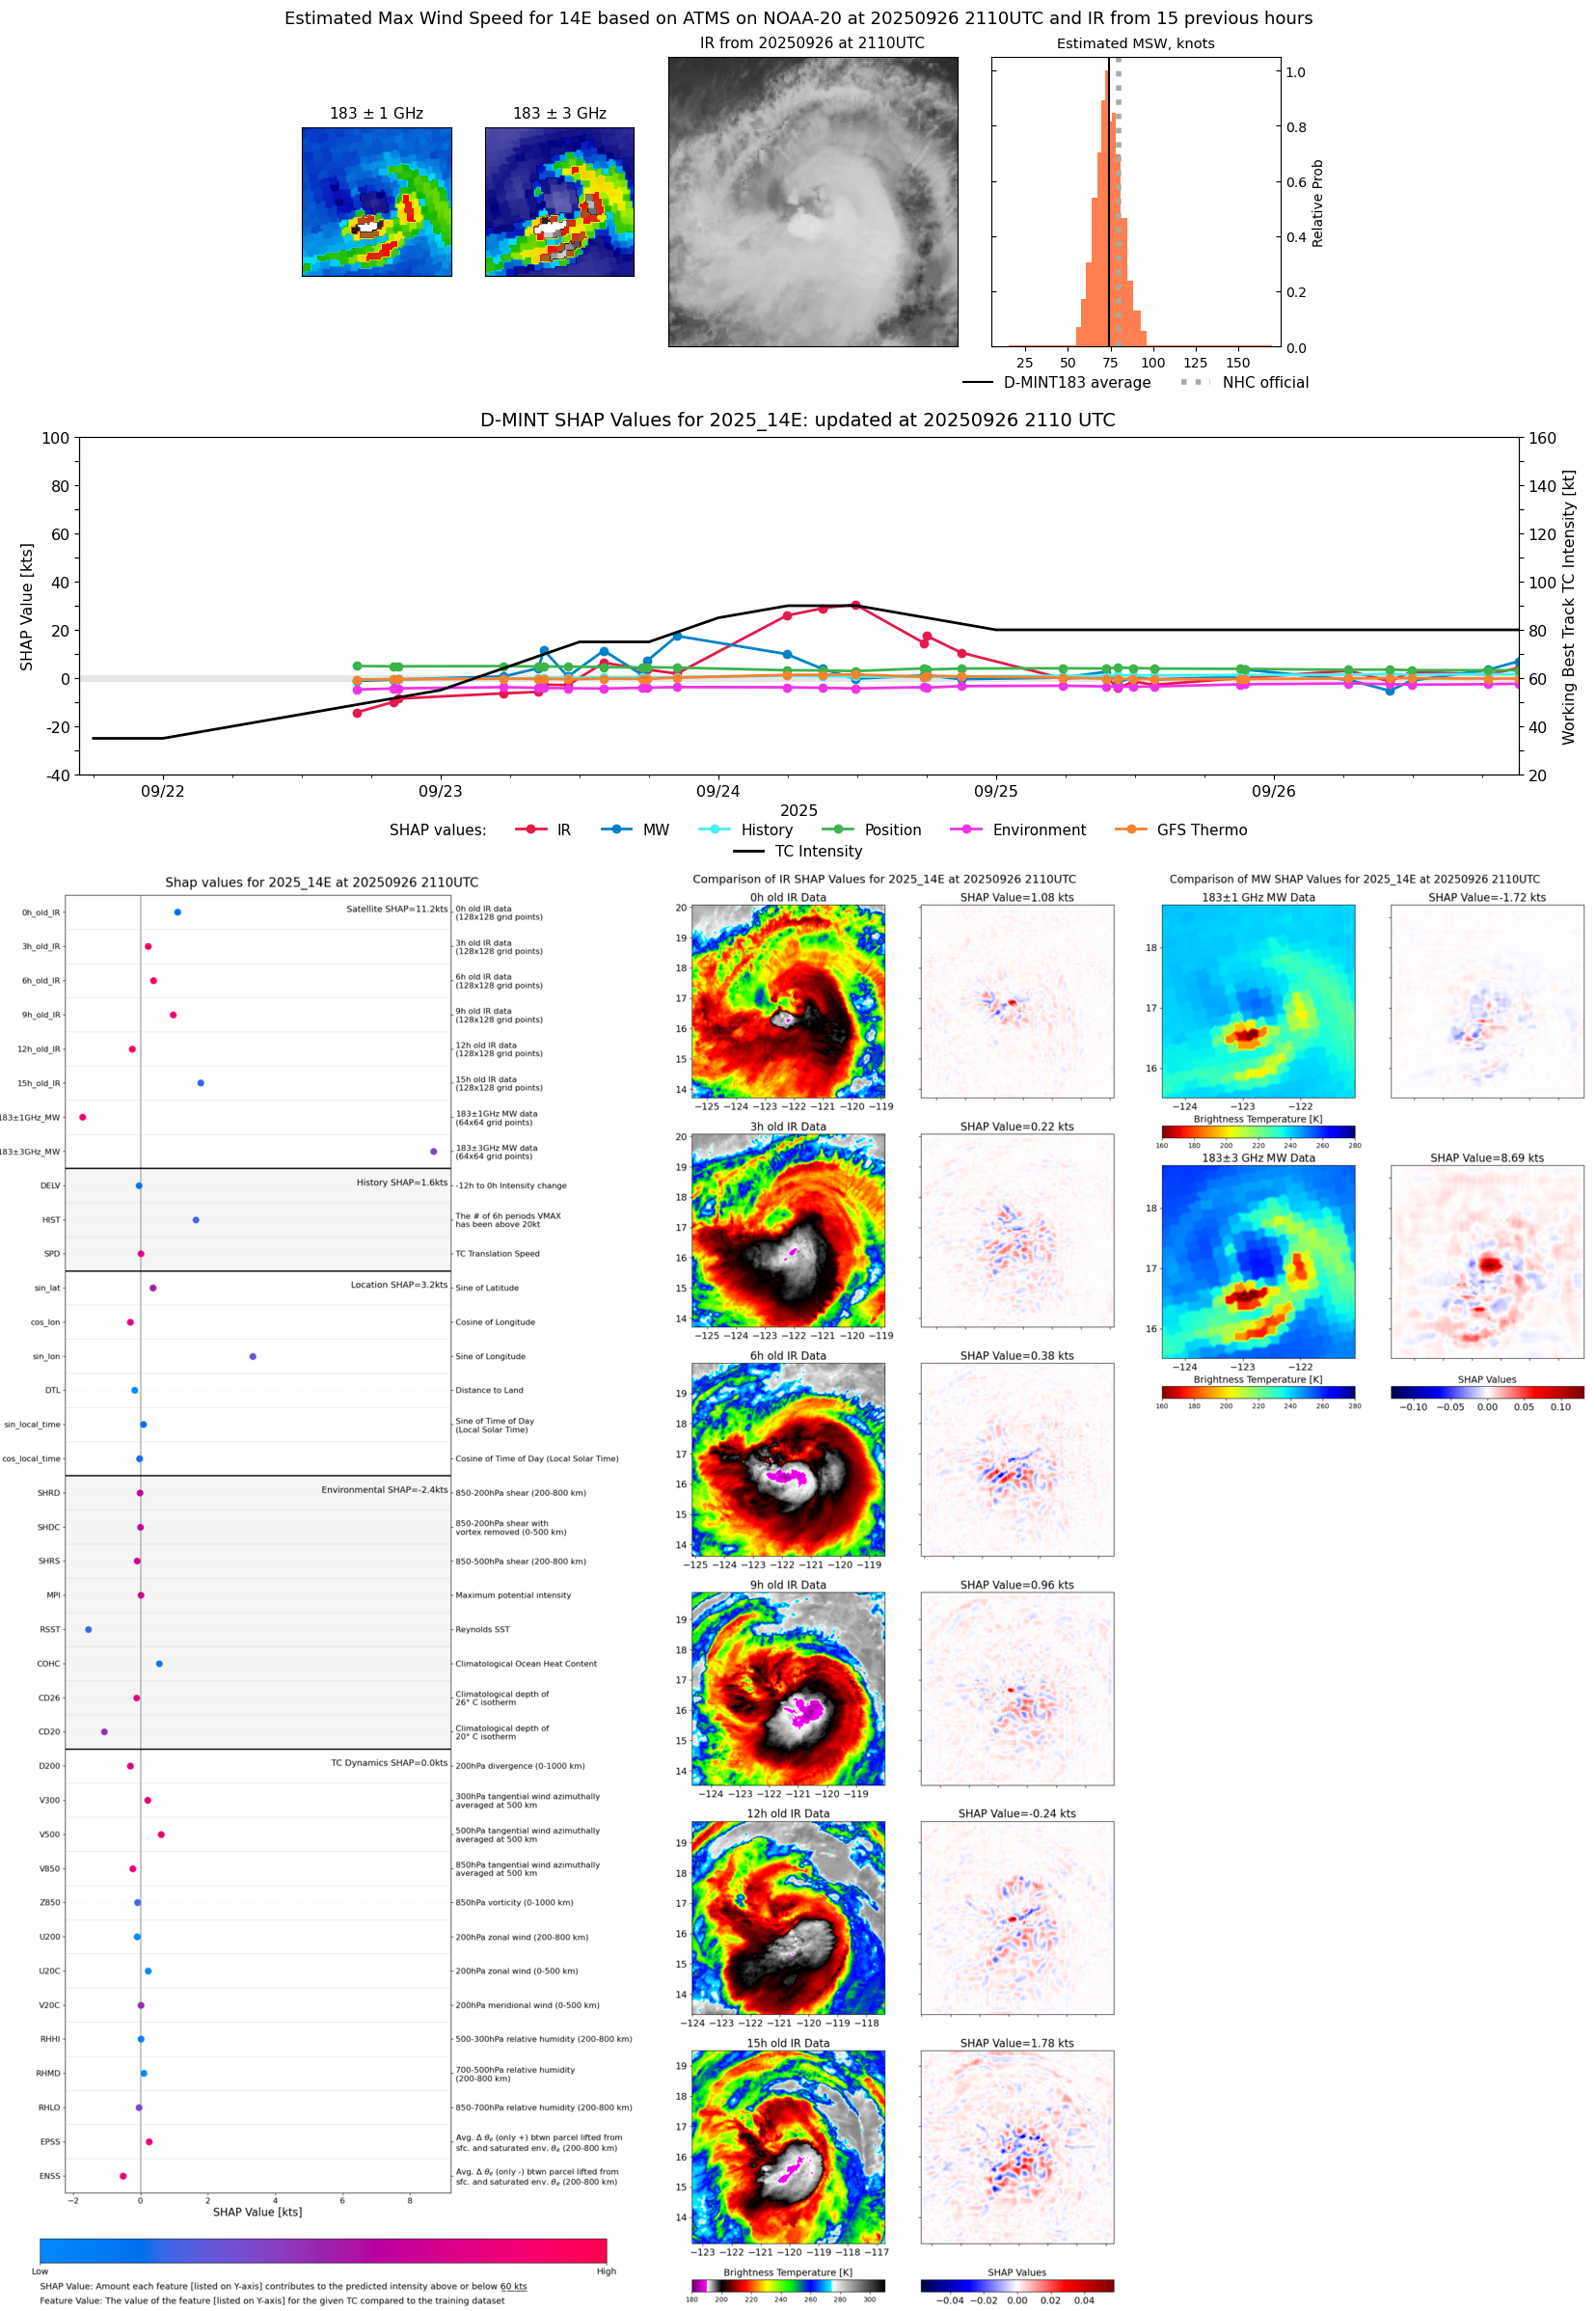 |
| 20250926 | 1832 UTC | TMS02 | 981 hPa | 68 kts | 63 kts | 73 kts |  |
| 20250926 | 1533 UTC | GMI | 981 hPa | 74 kts | 68 kts | 80 kts |  |
| 20250926 | 1154 UTC | TMS07 | 982 hPa | 64 kts | 58 kts | 69 kts | 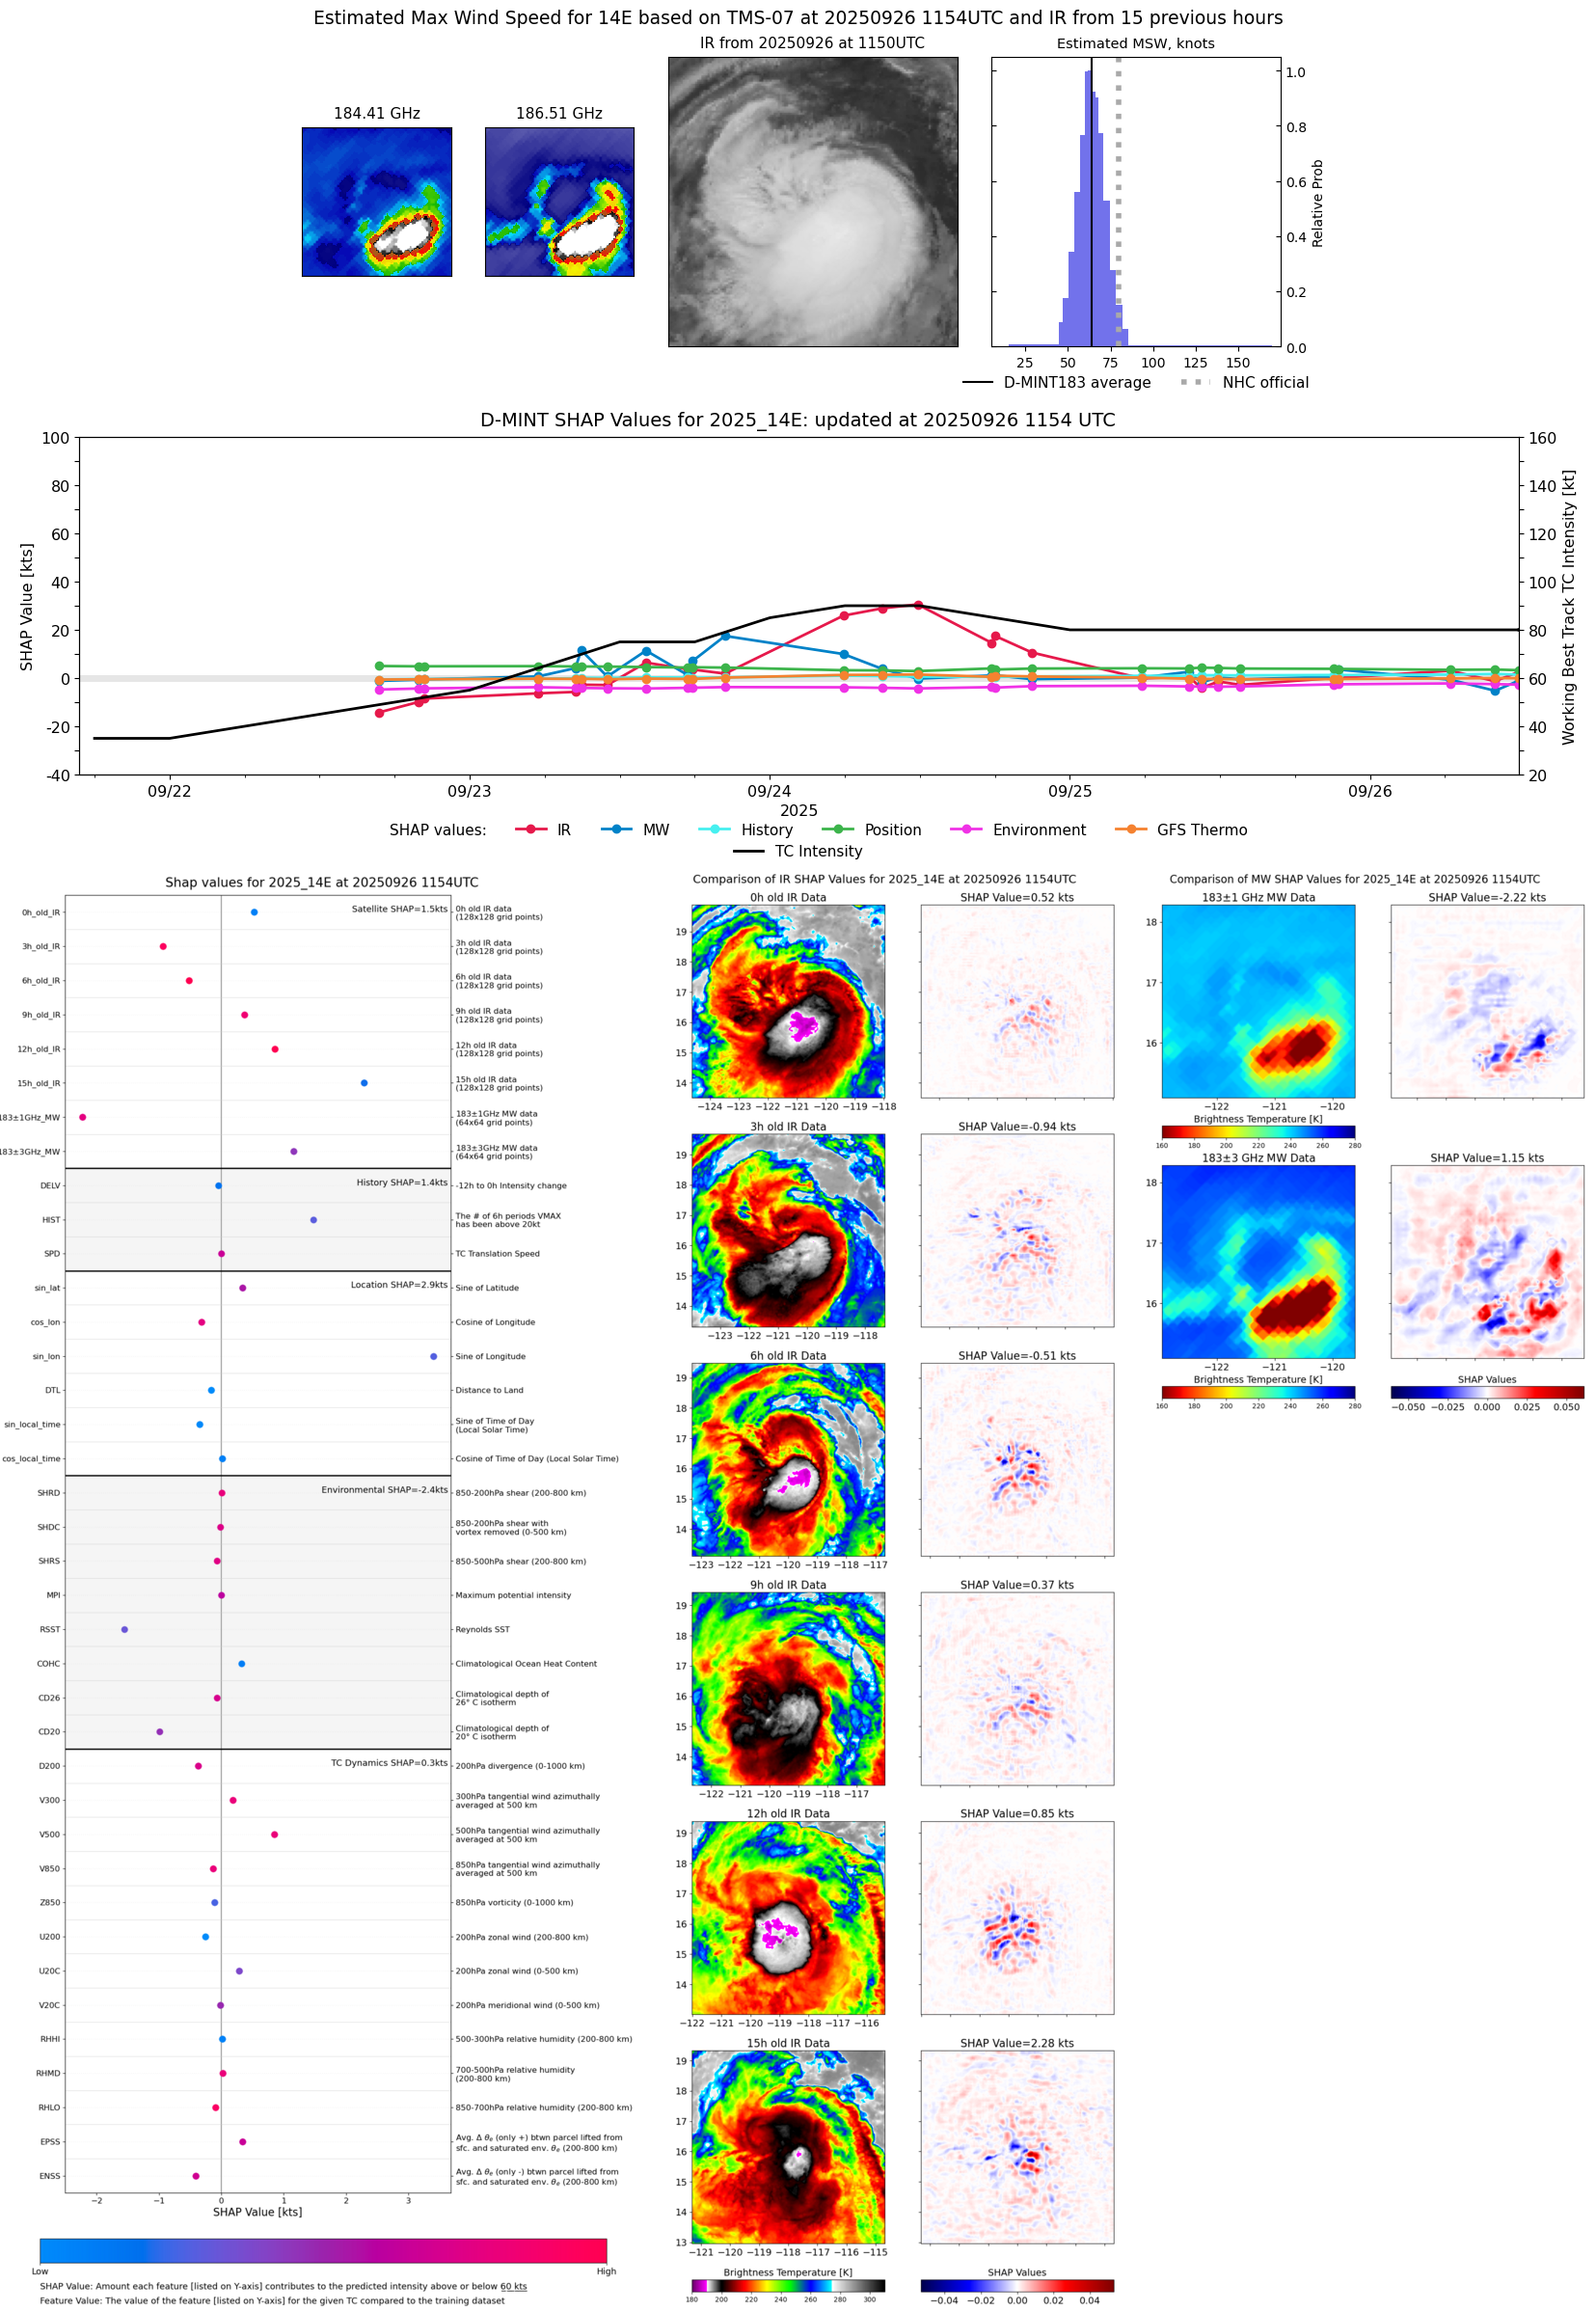 |
| 20250926 | 1000 UTC | ATMS-N20 | 981 hPa | 57 kts | 51 kts | 63 kts | 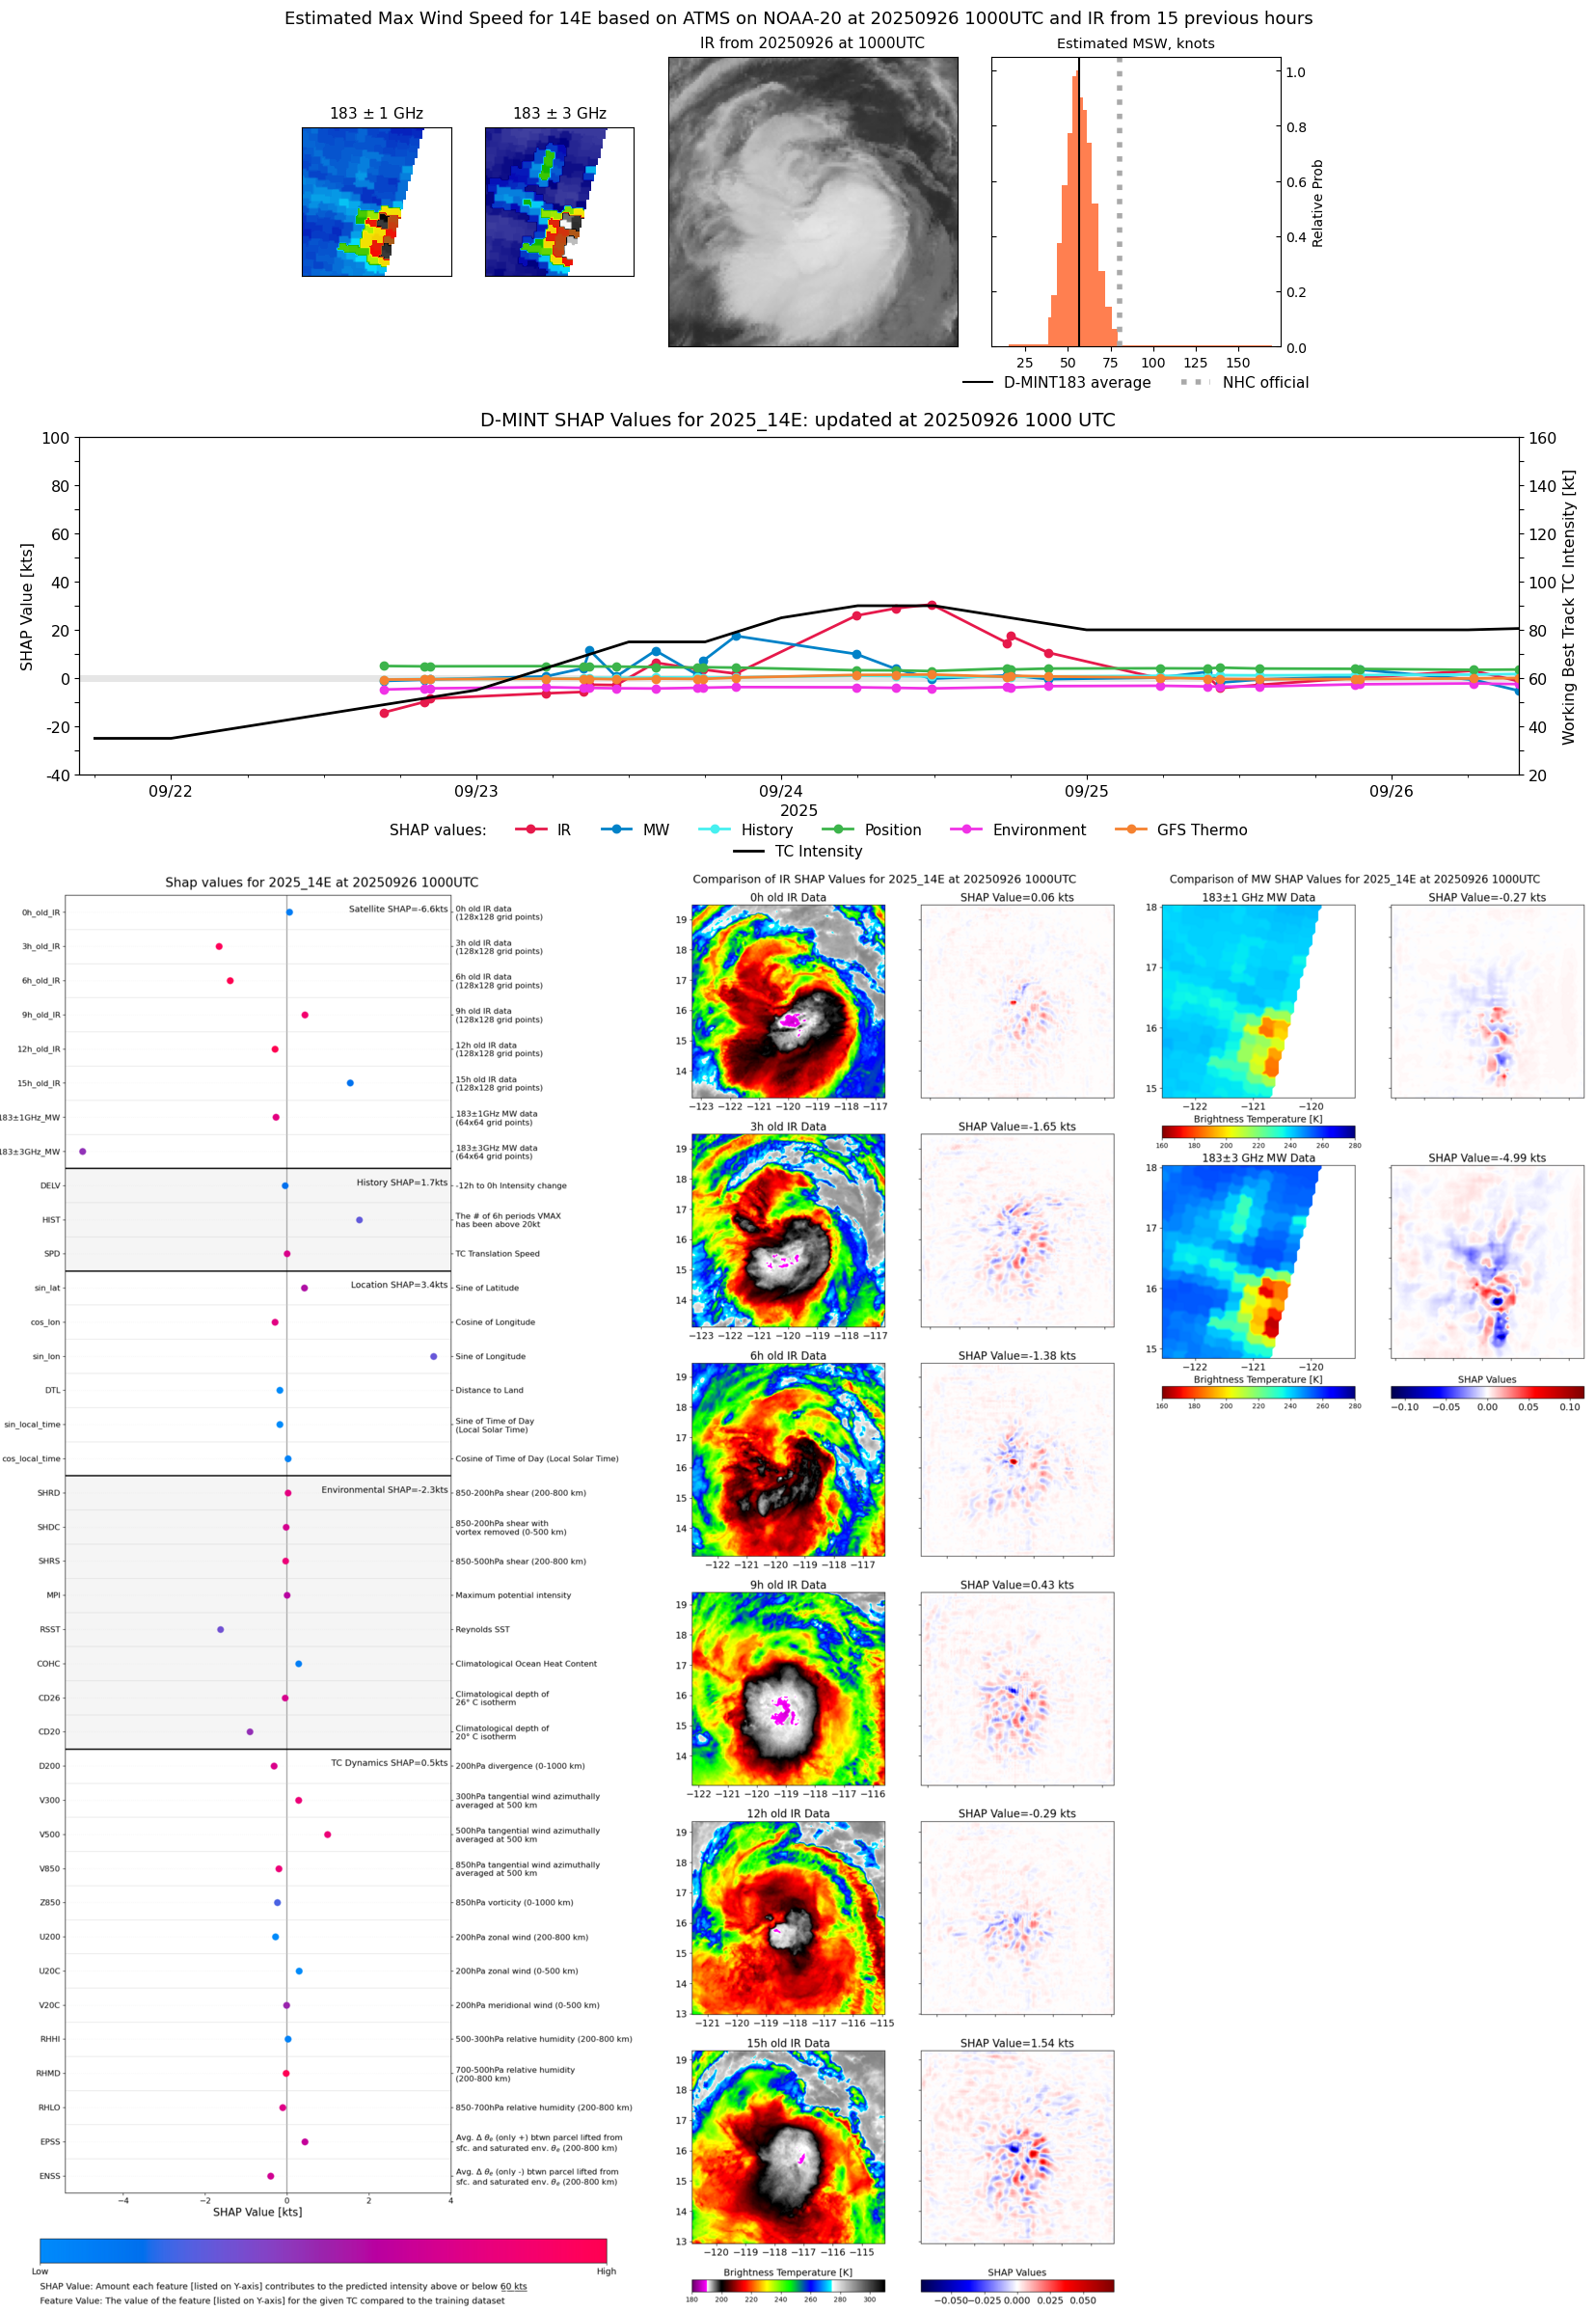 |
| 20250926 | 0625 UTC | AWS | 984 hPa | 65 kts | 59 kts | 72 kts |  |
| 20250926 | 0213 UTC | GMI | 998 hPa | 58 kts | 52 kts | 64 kts | 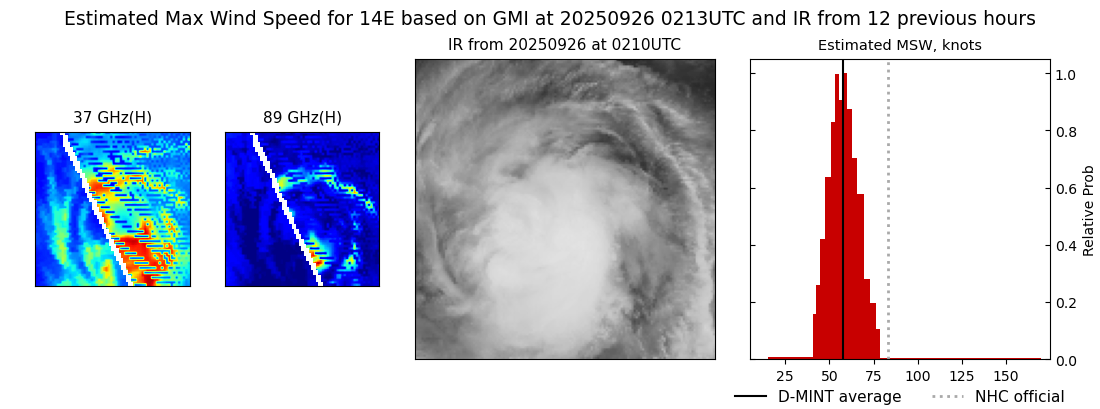 |
| 20250925 | 2128 UTC | ATMS-N20 | 982 hPa | 66 kts | 60 kts | 73 kts | 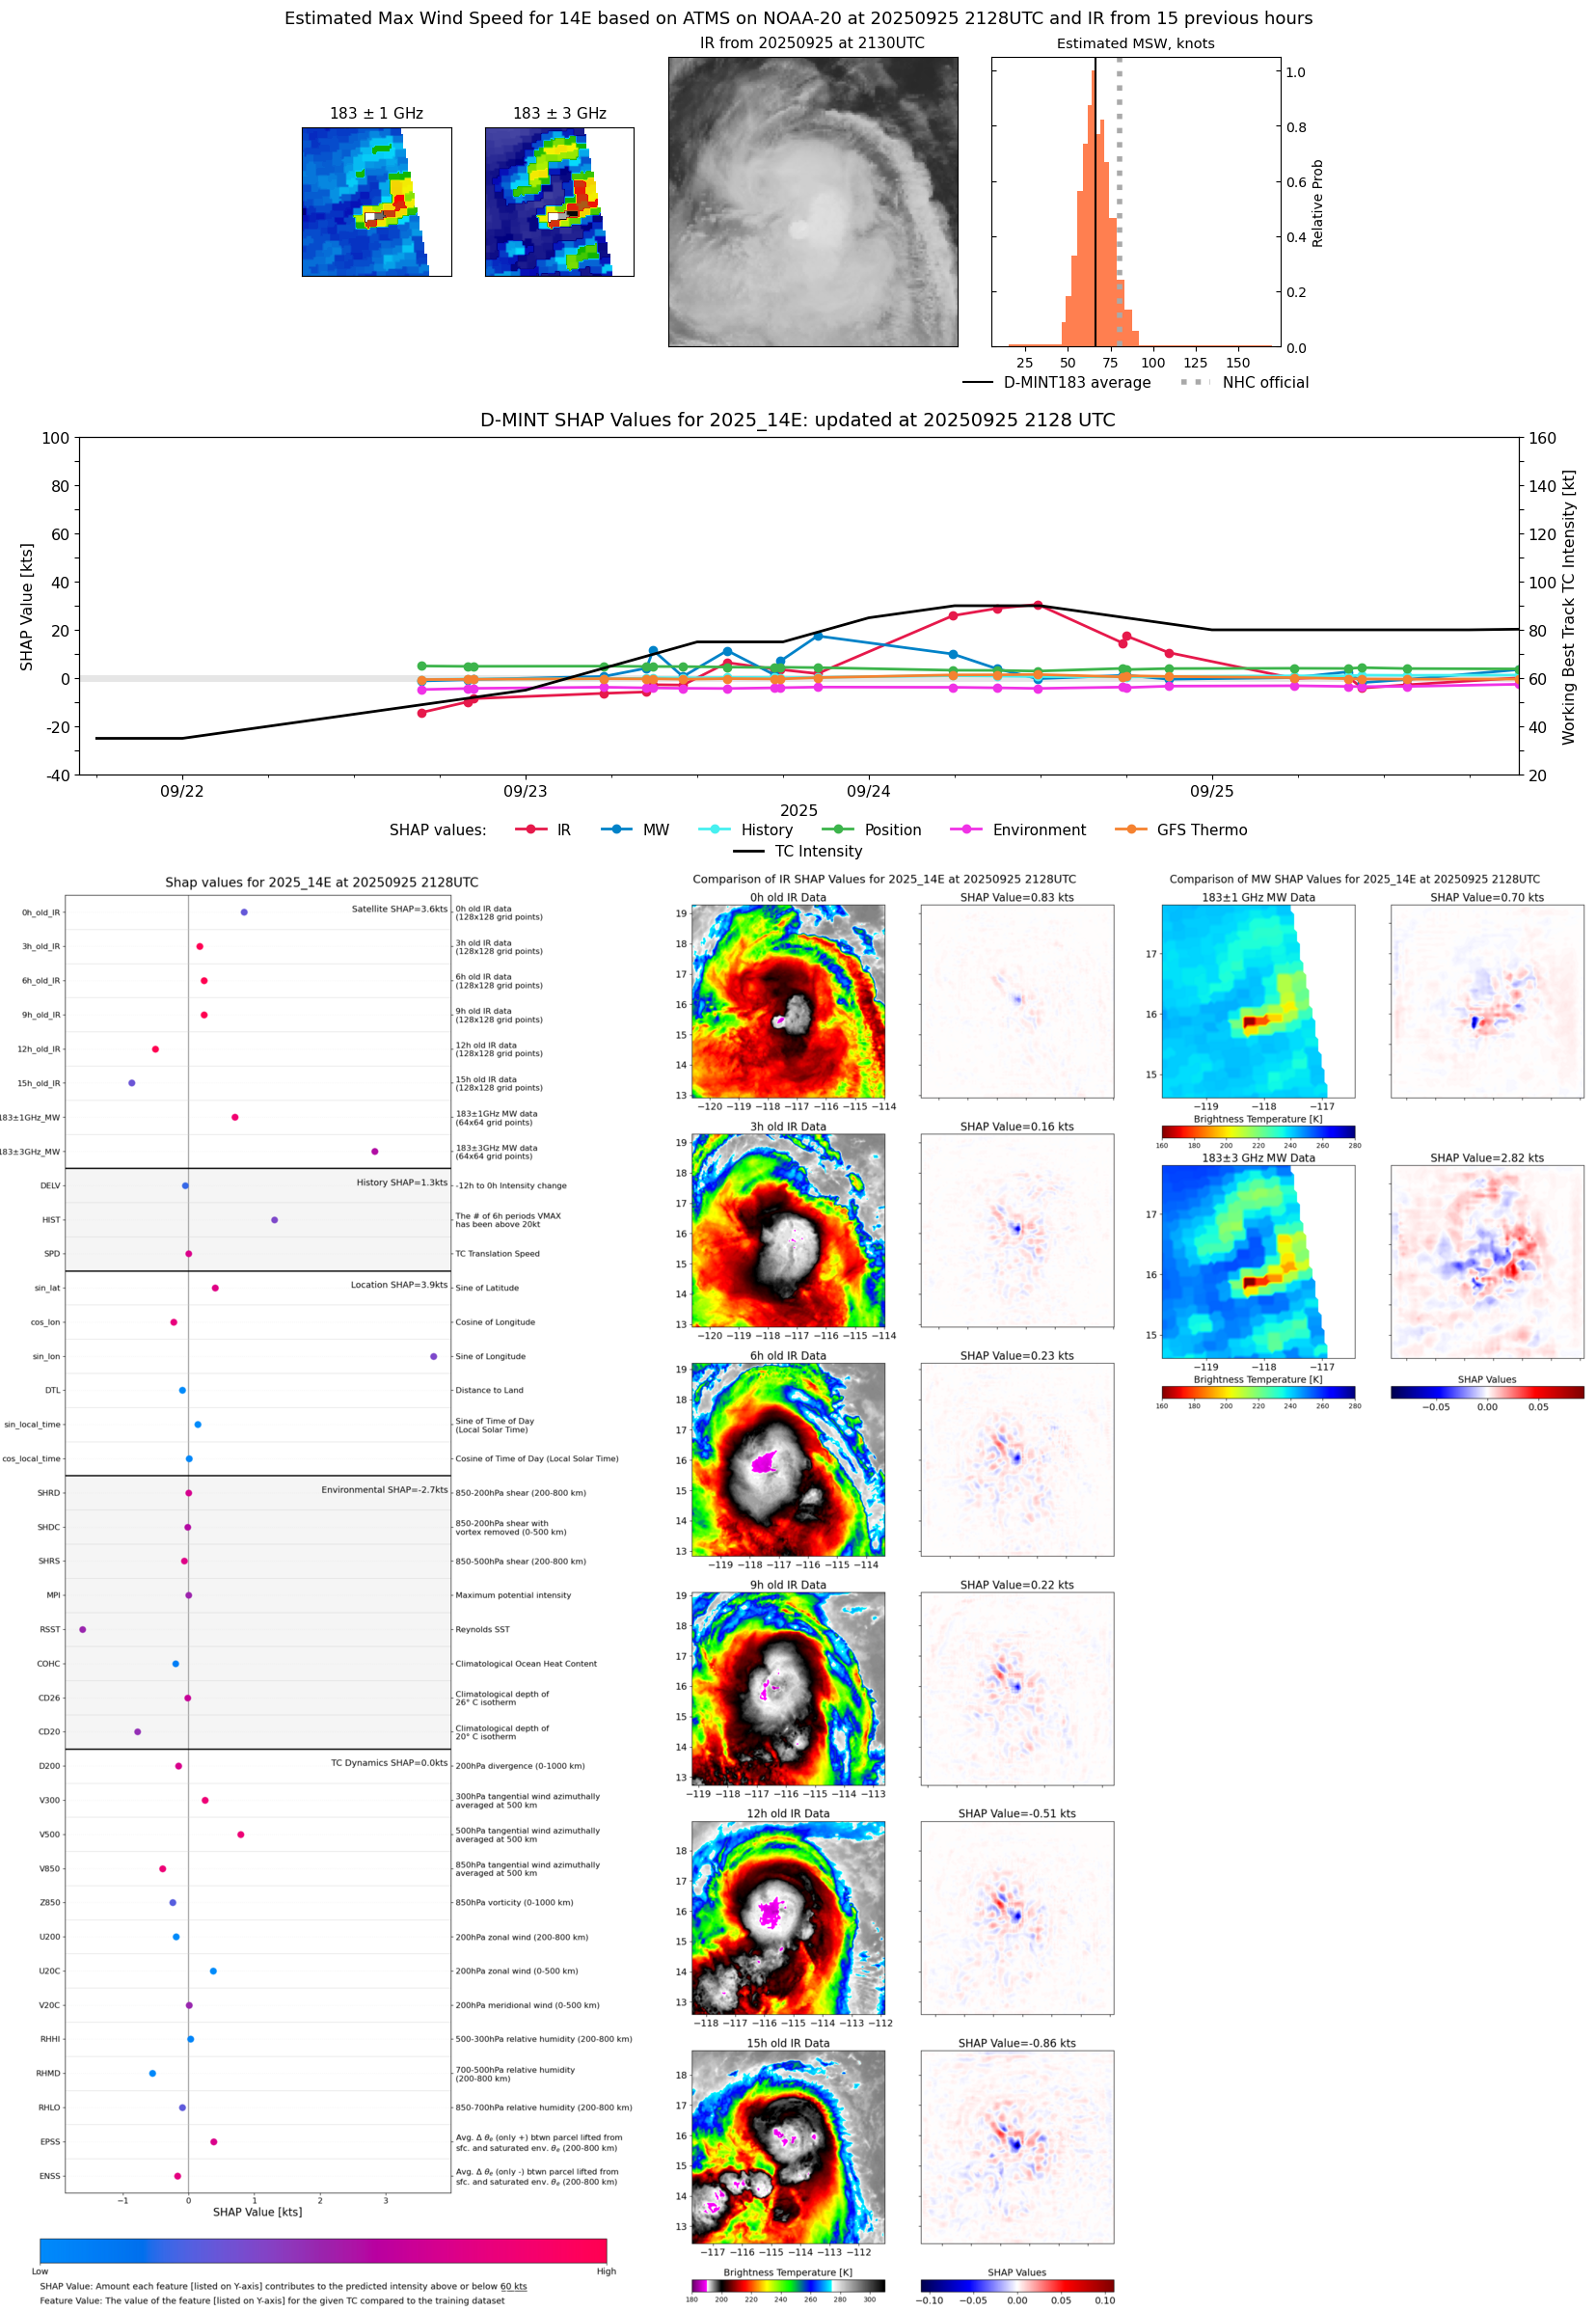 |
| 20250925 | 2107 UTC | ATMS-NPP | 983 hPa | 63 kts | 57 kts | 70 kts | 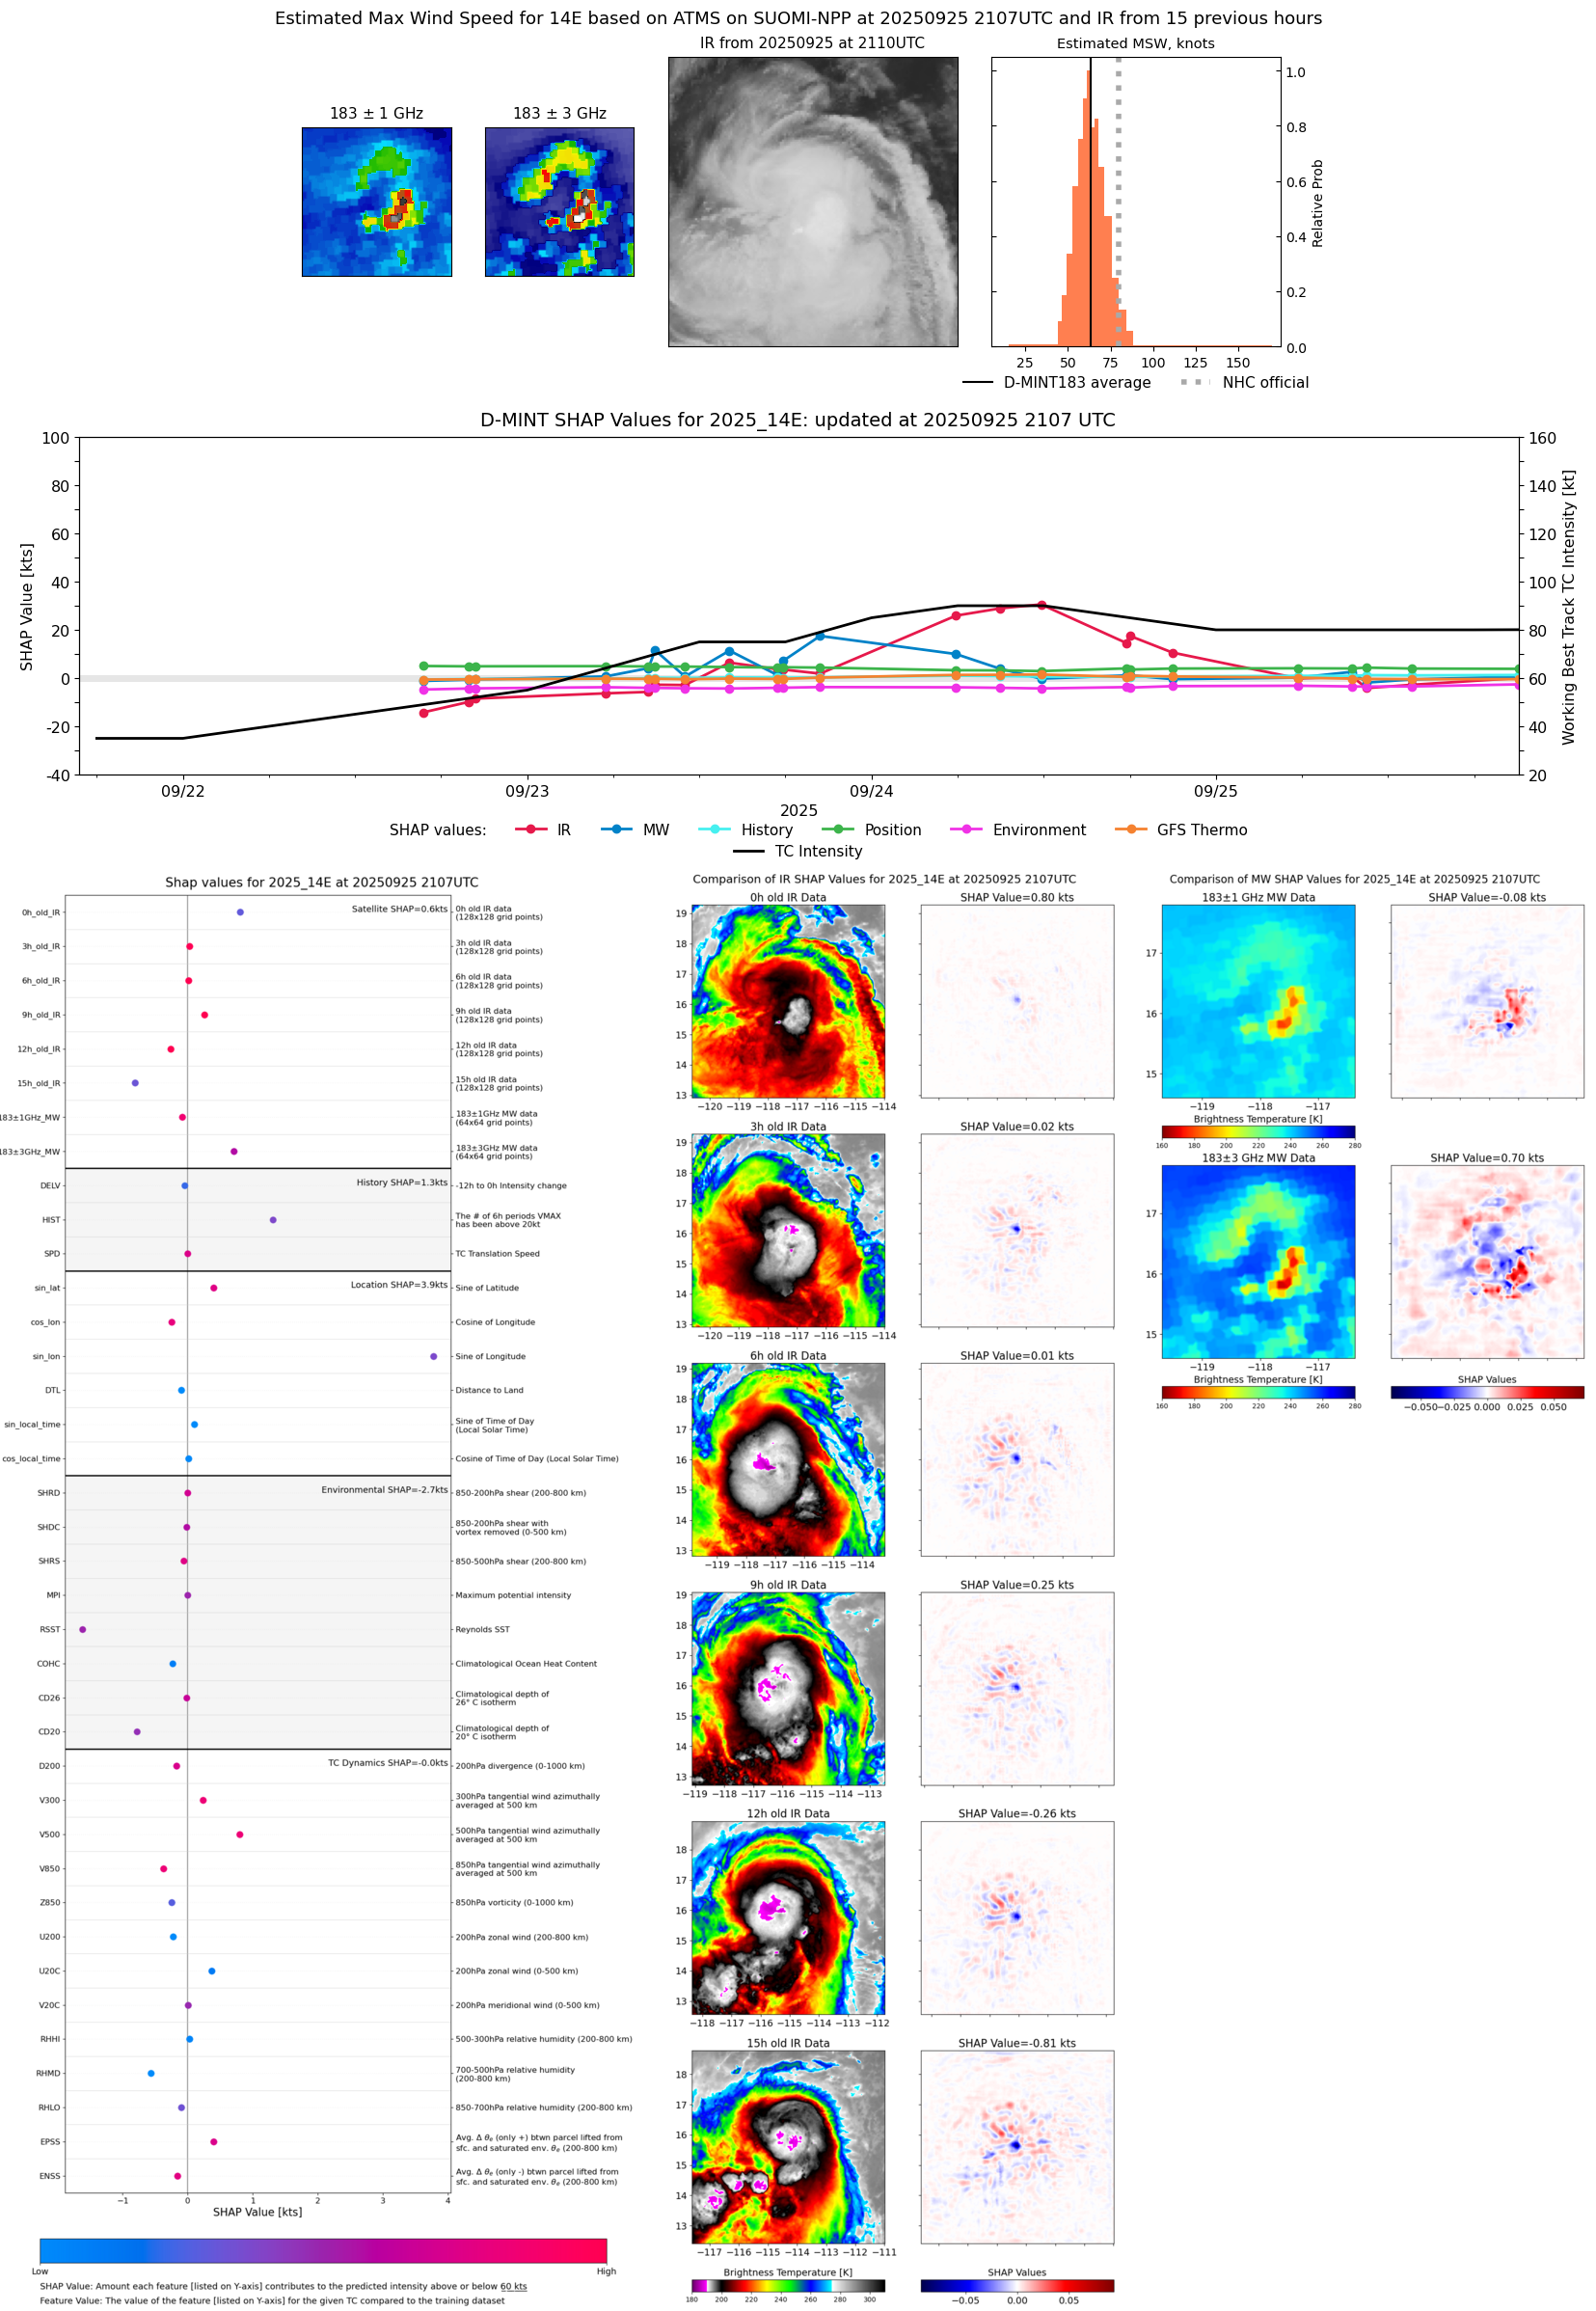 |
| 20250925 | 1338 UTC | TROPICS03 | 988 hPa | 58 kts | 53 kts | 64 kts | 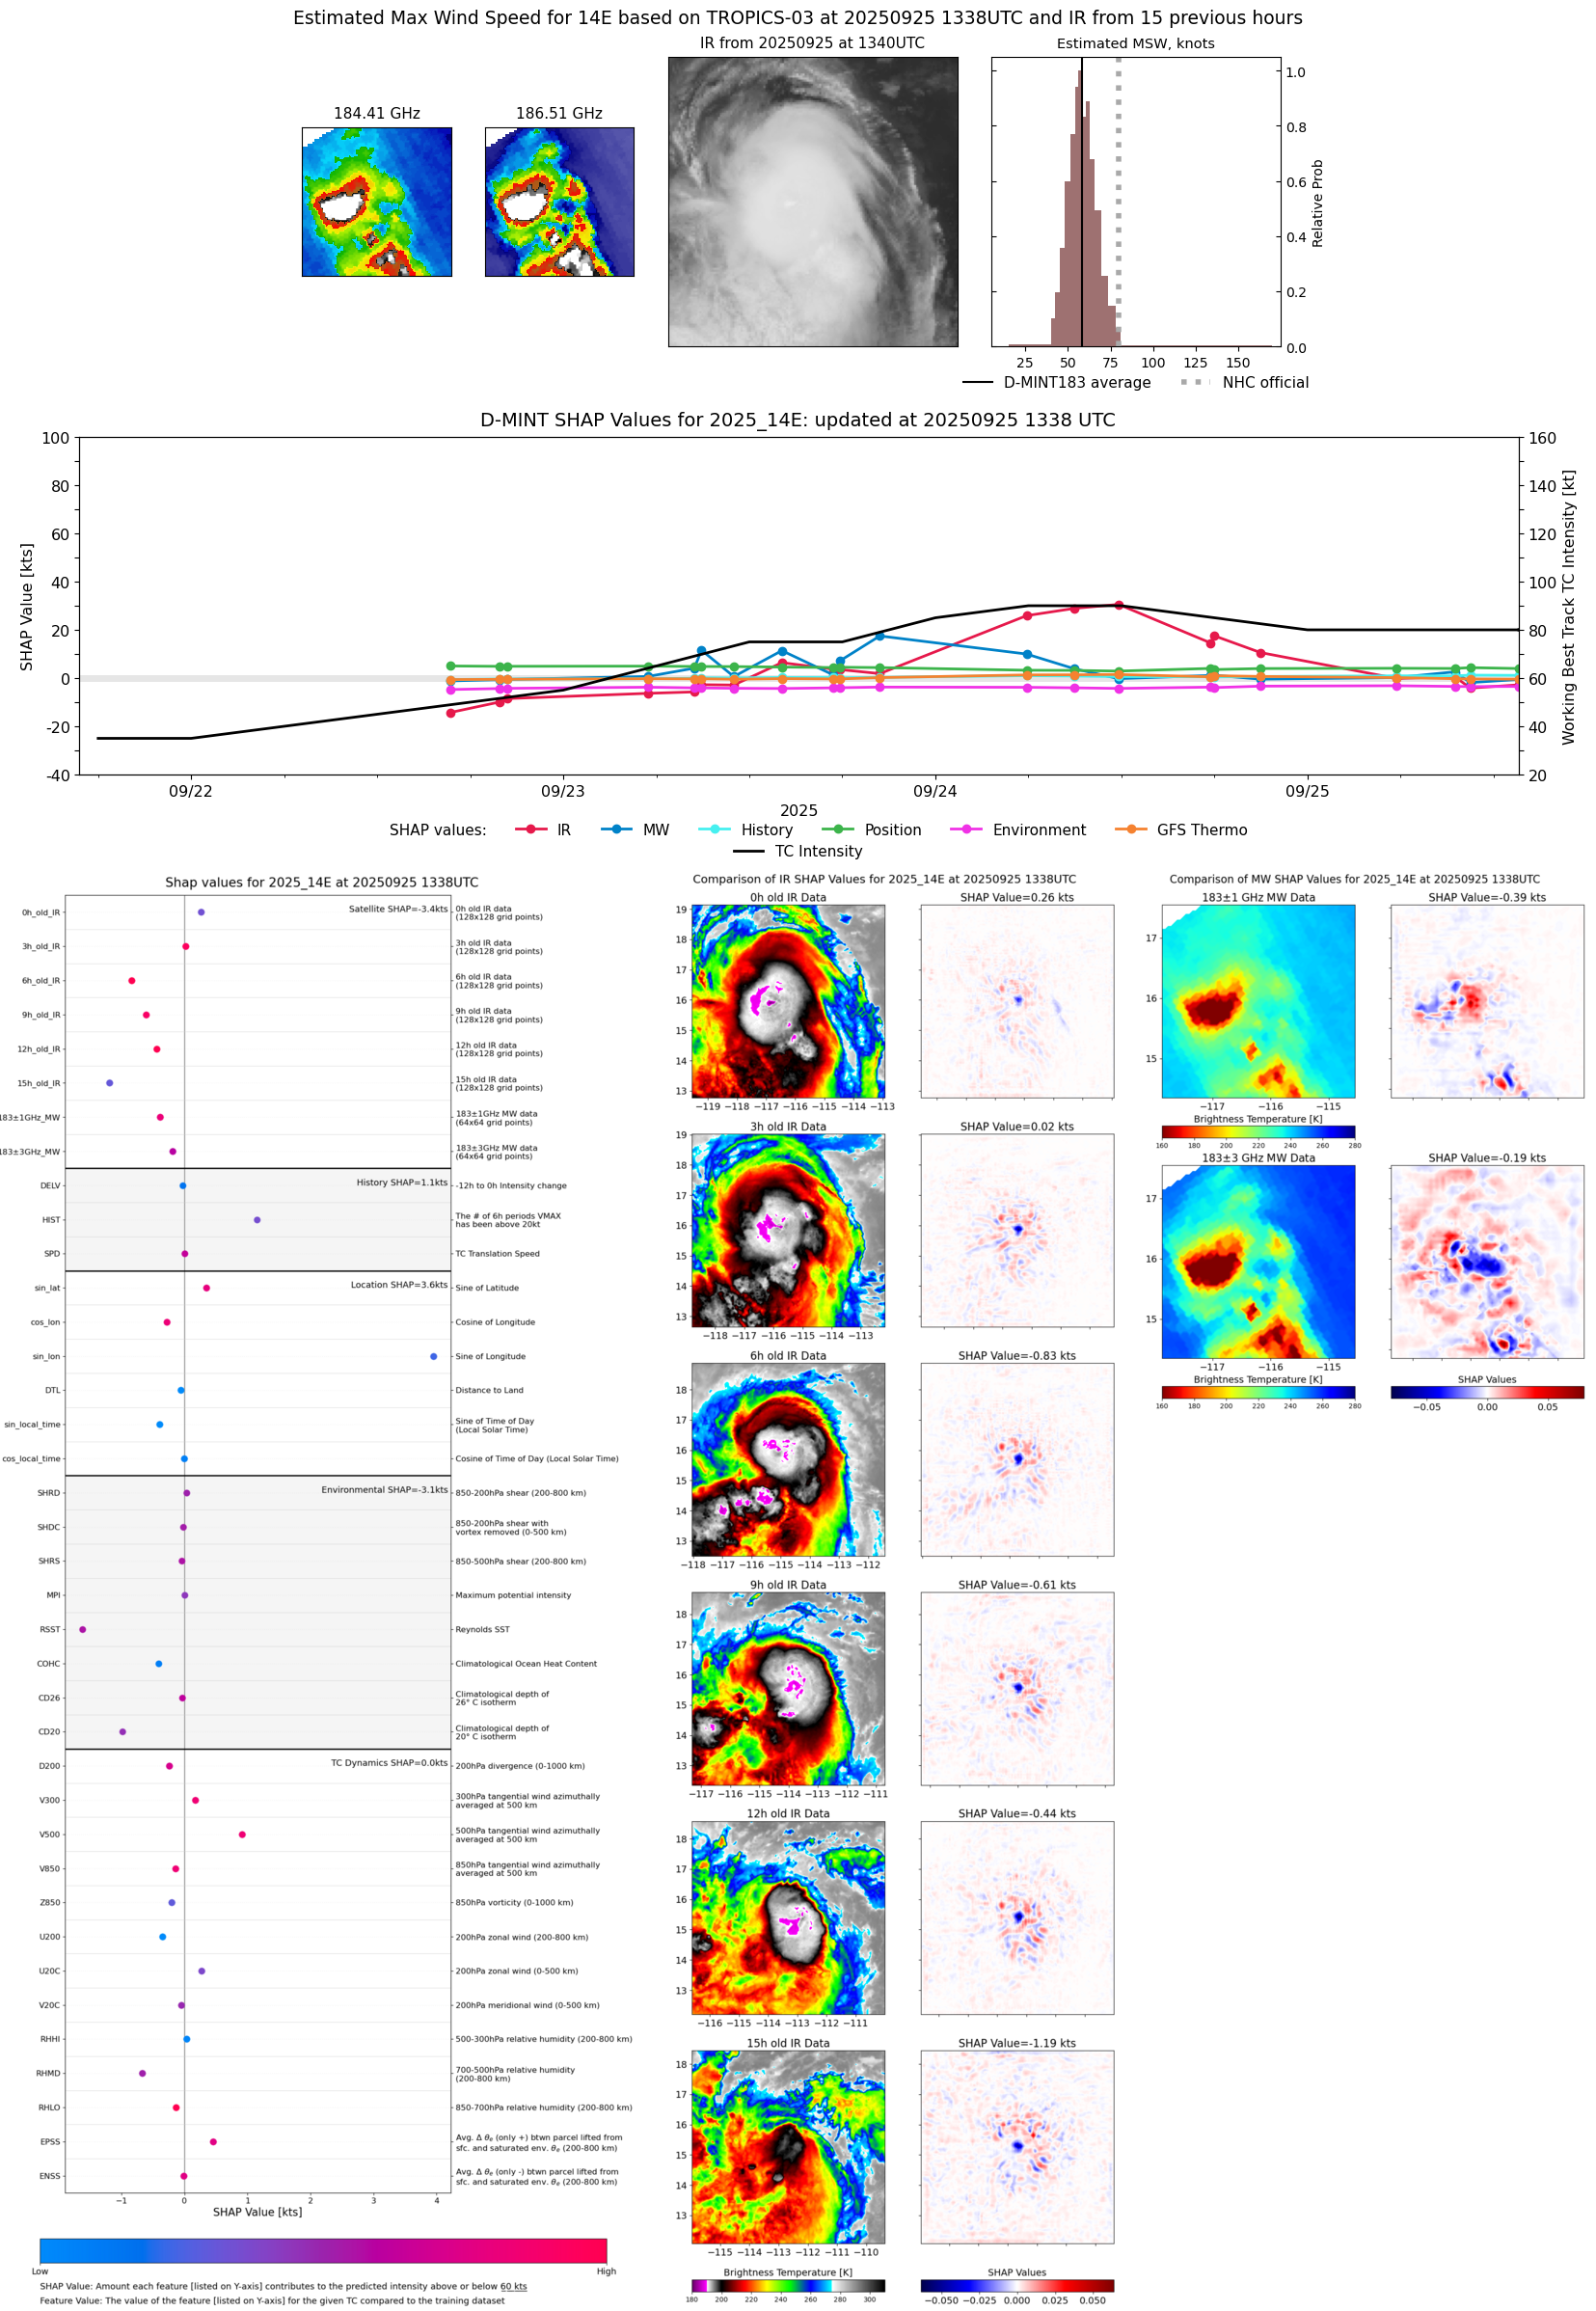 |
| 20250925 | 1152 UTC | TMS07 | 992 hPa | 61 kts | 55 kts | 67 kts | 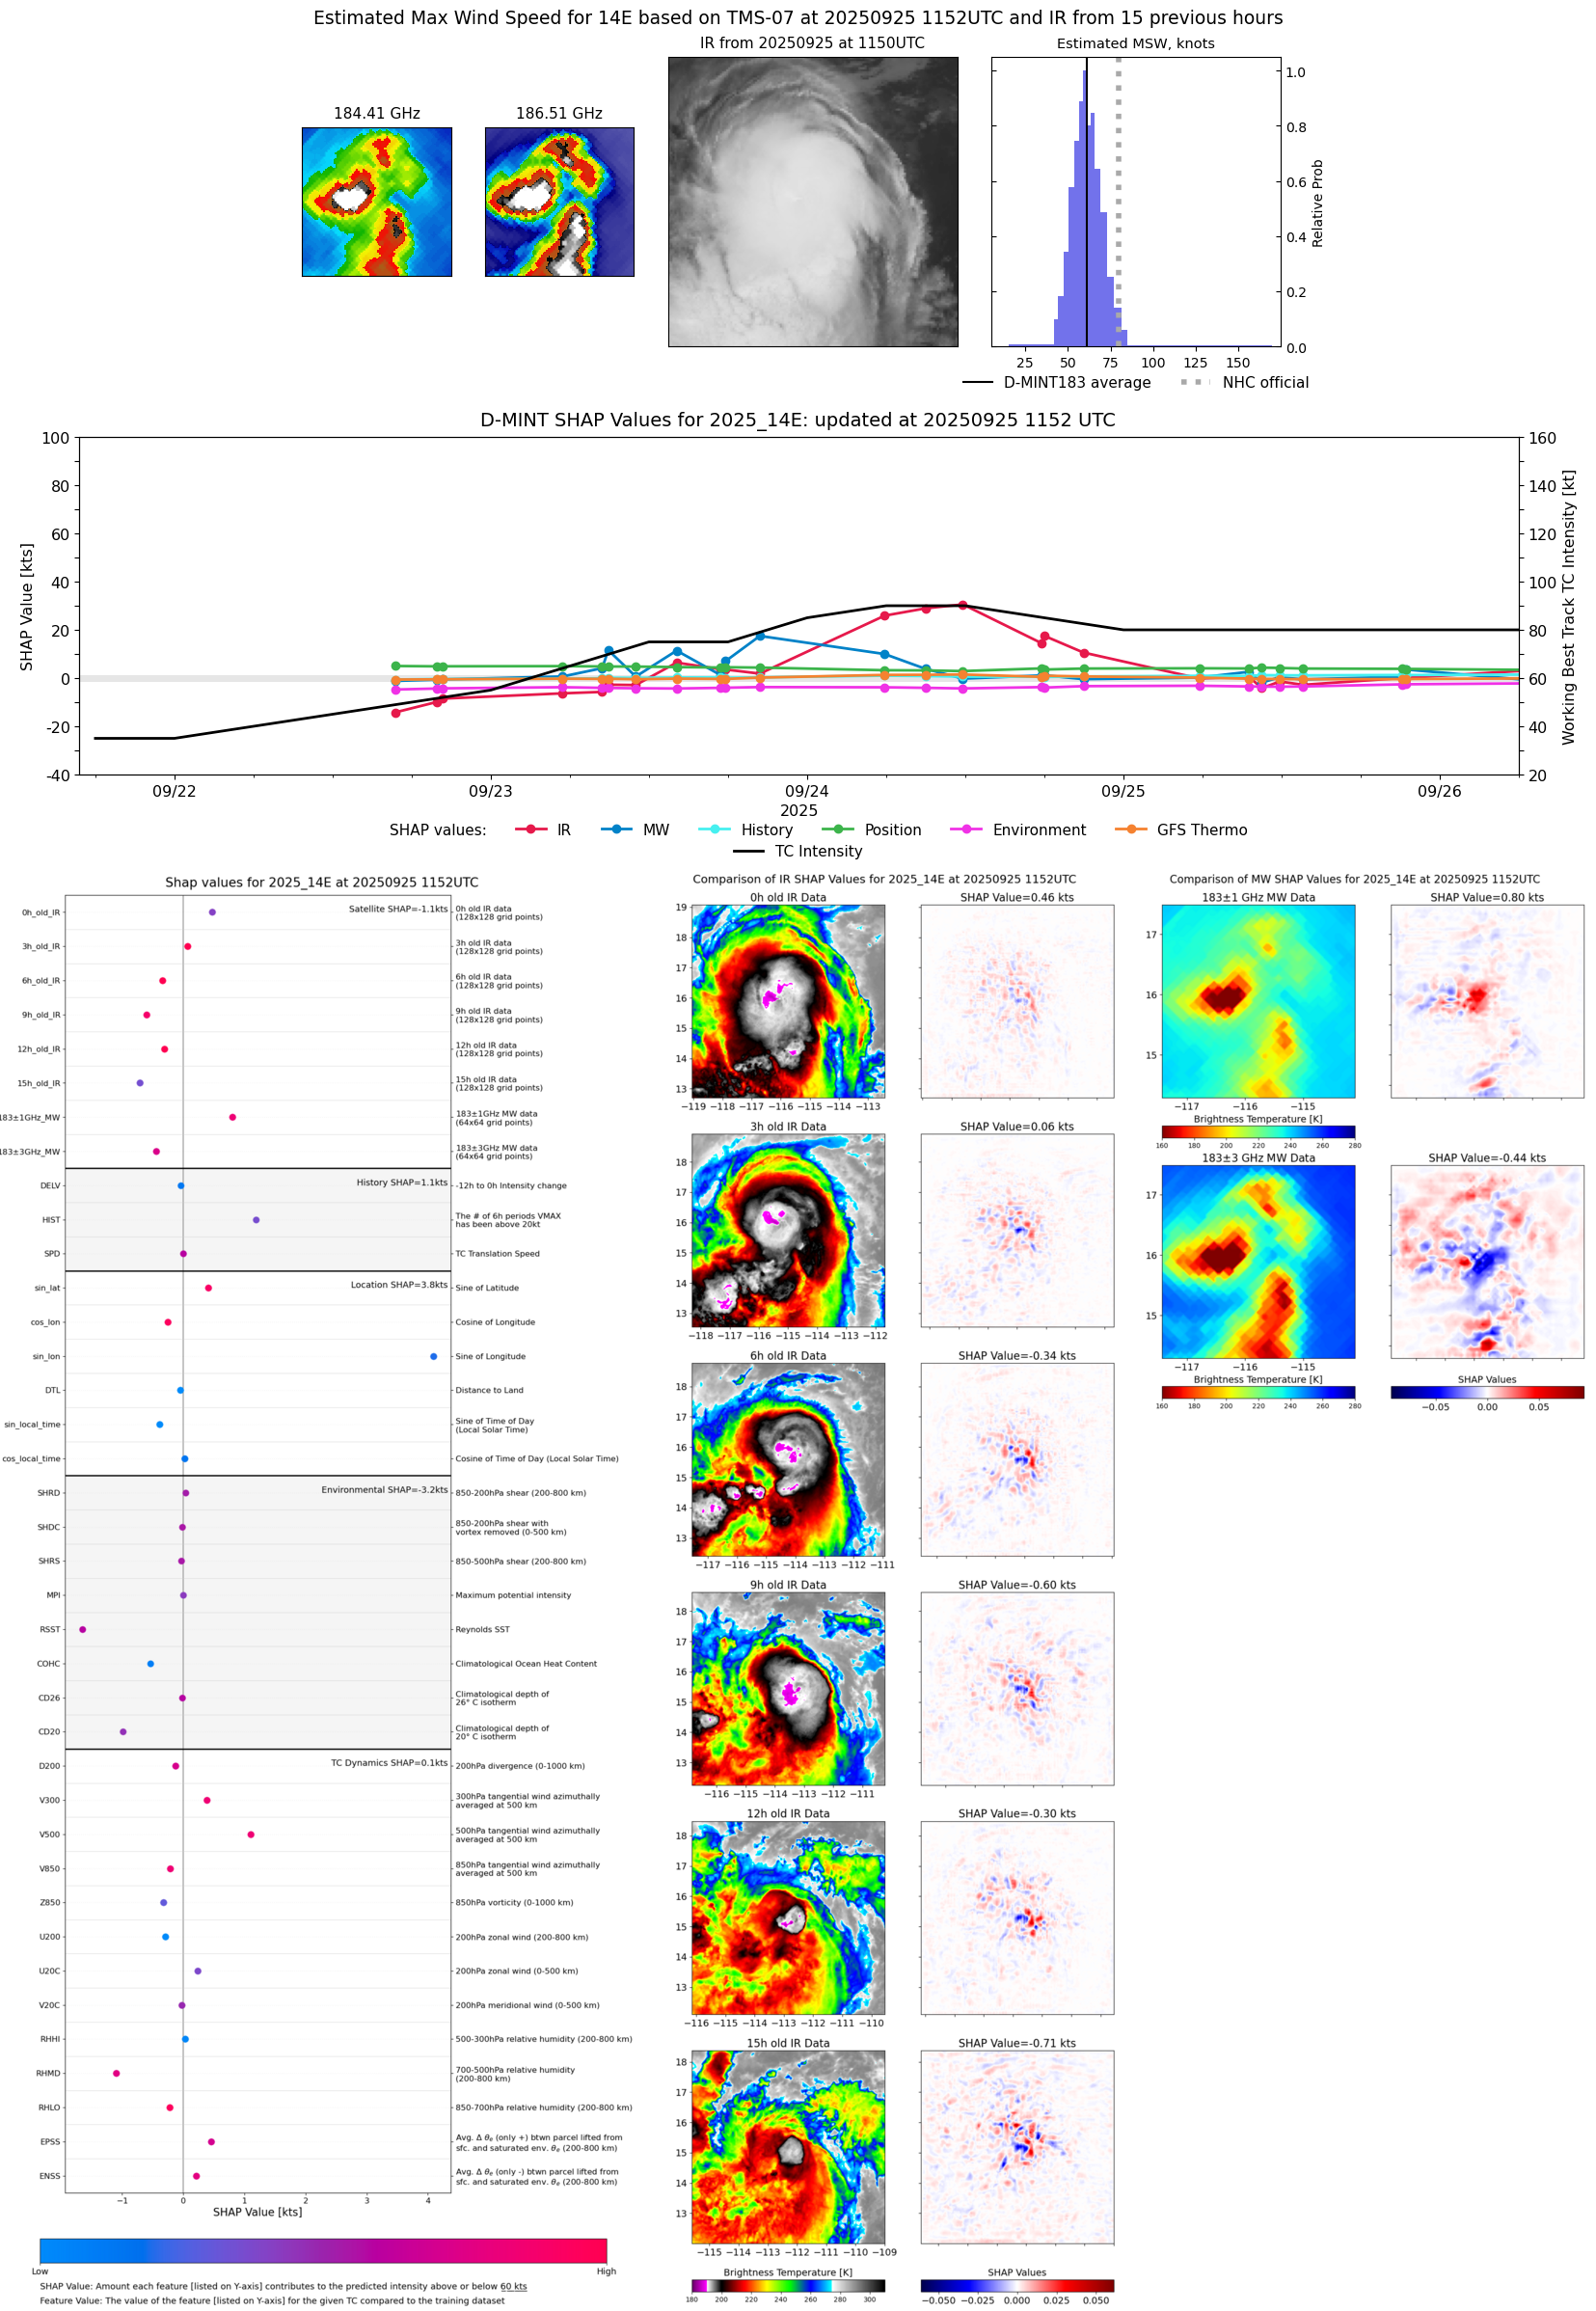 |
| 20250925 | 1030 UTC | TROPICS05 | 990 hPa | 56 kts | 51 kts | 63 kts | 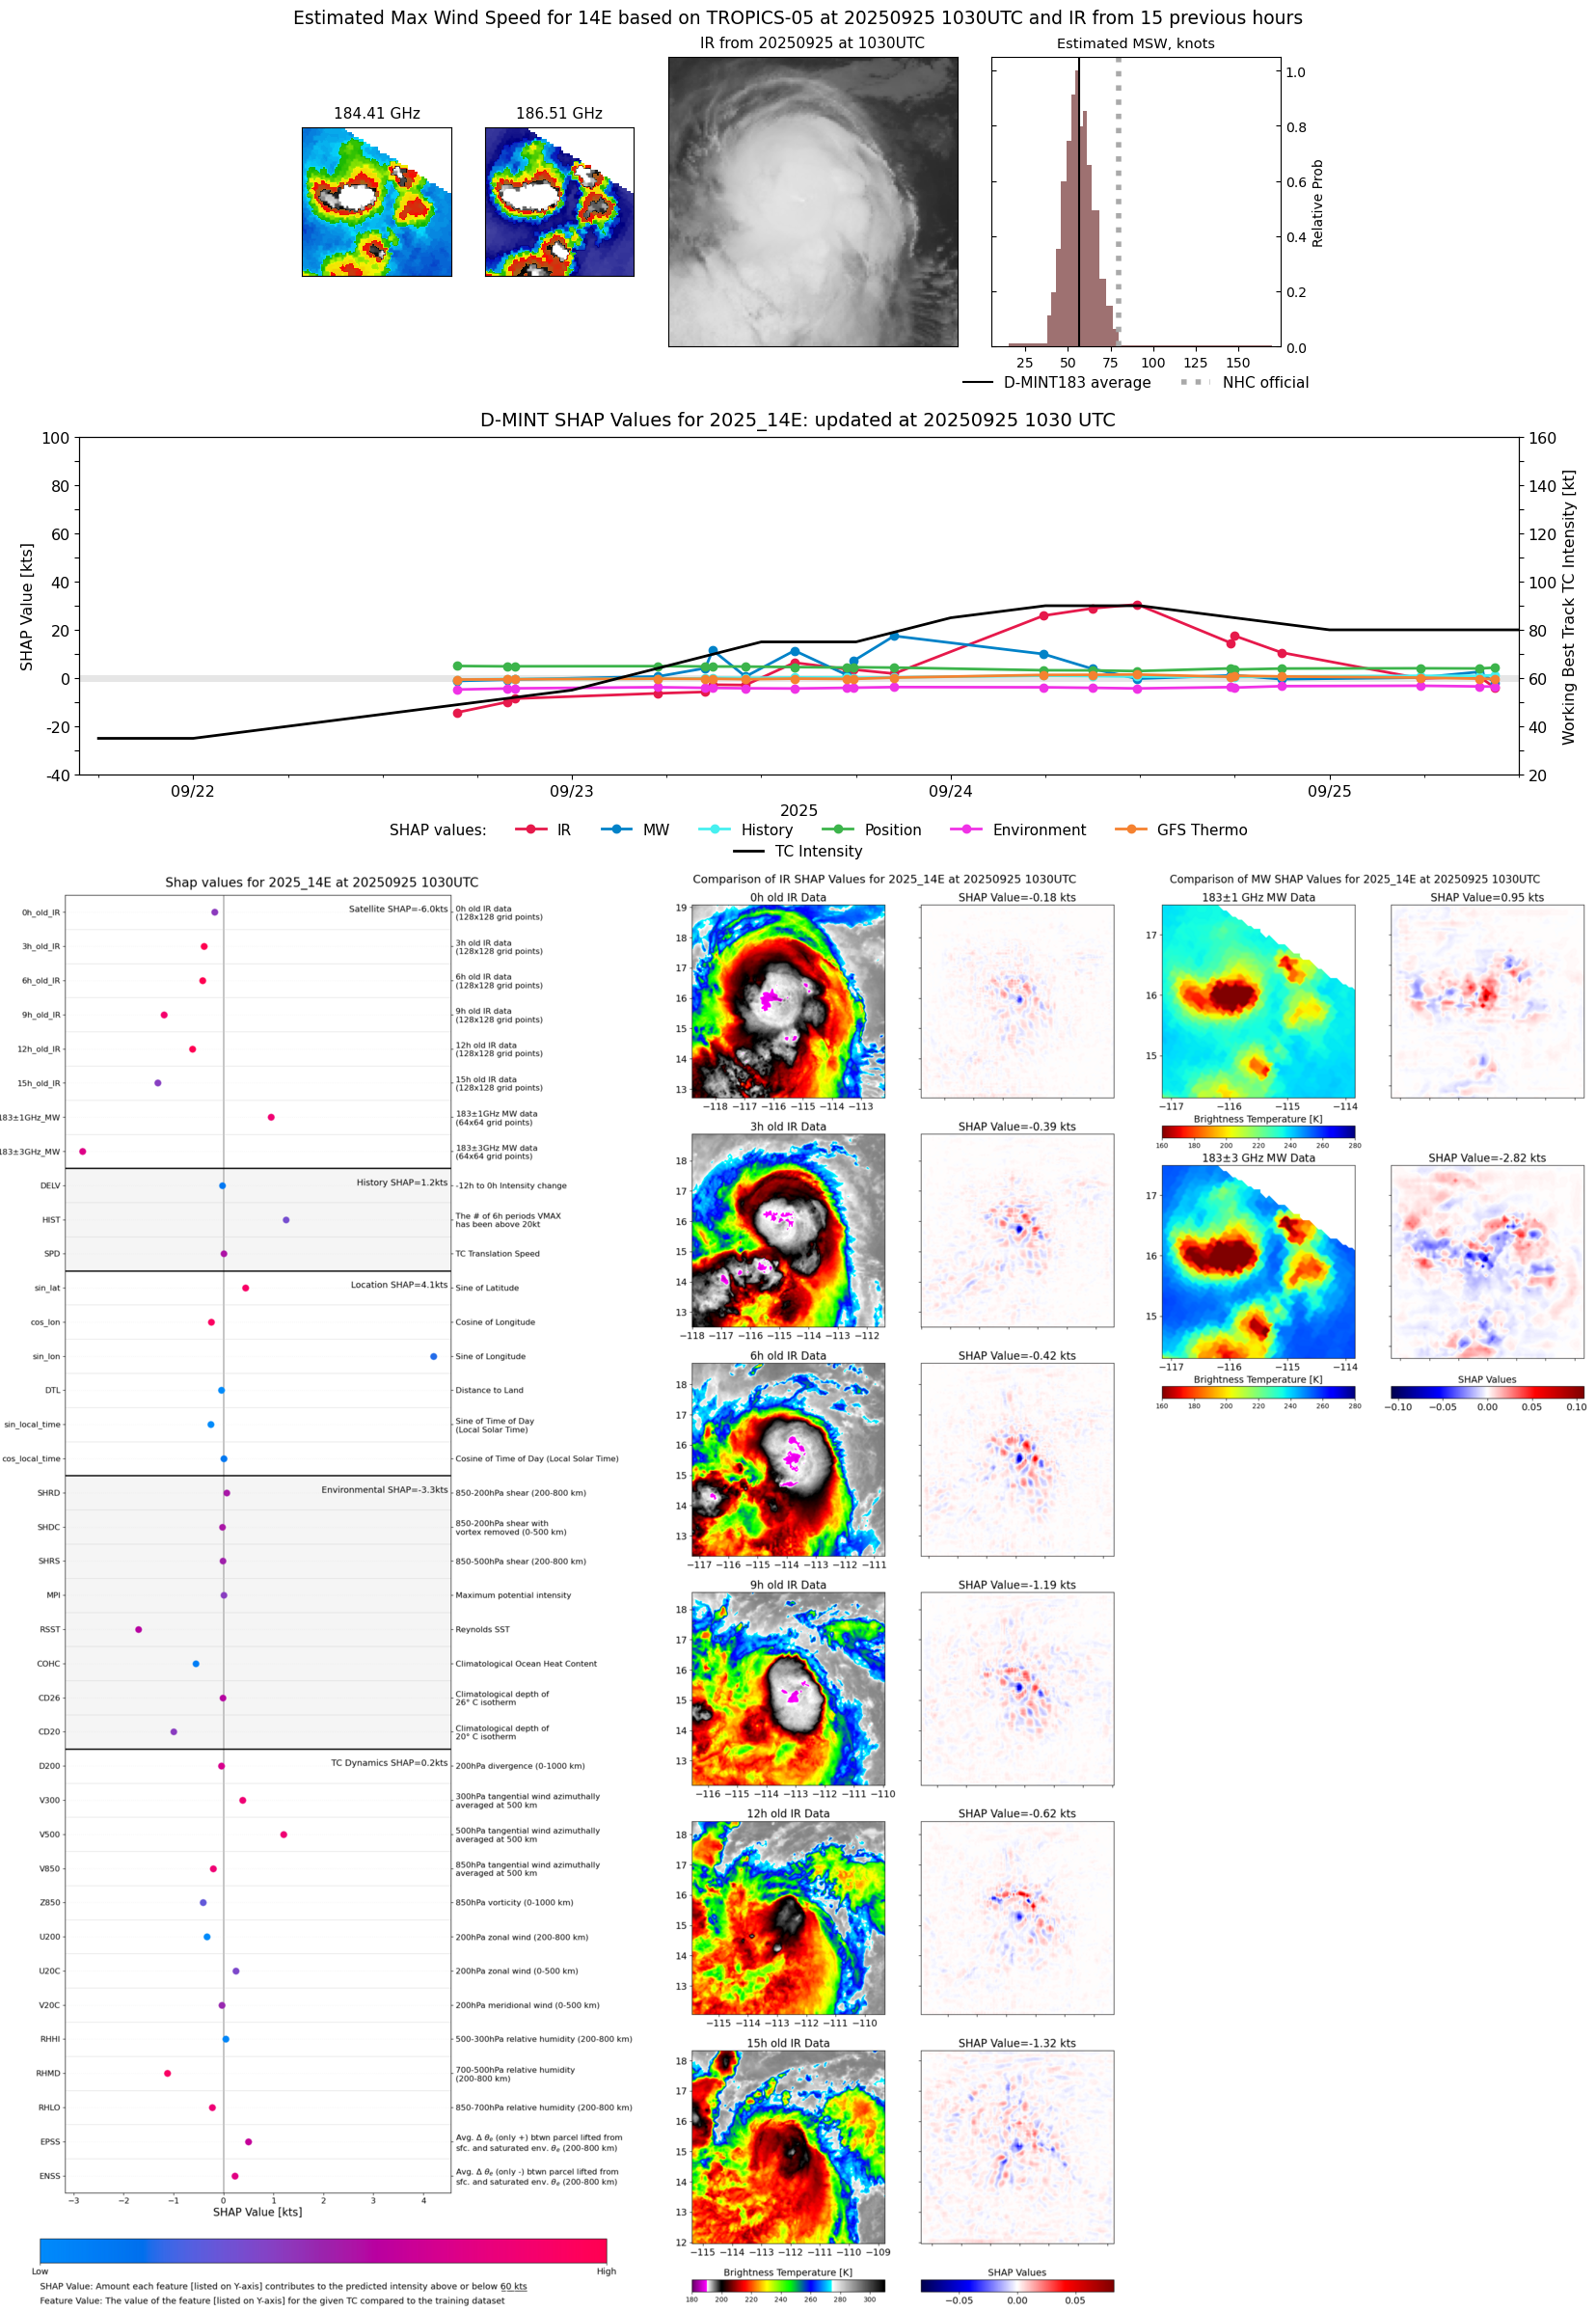 |
| 20250925 | 0933 UTC | AMSR2 | 992 hPa | 62 kts | 56 kts | 69 kts |  |
| 20250925 | 0930 UTC | ATMS-N21 | 985 hPa | 65 kts | 59 kts | 71 kts | 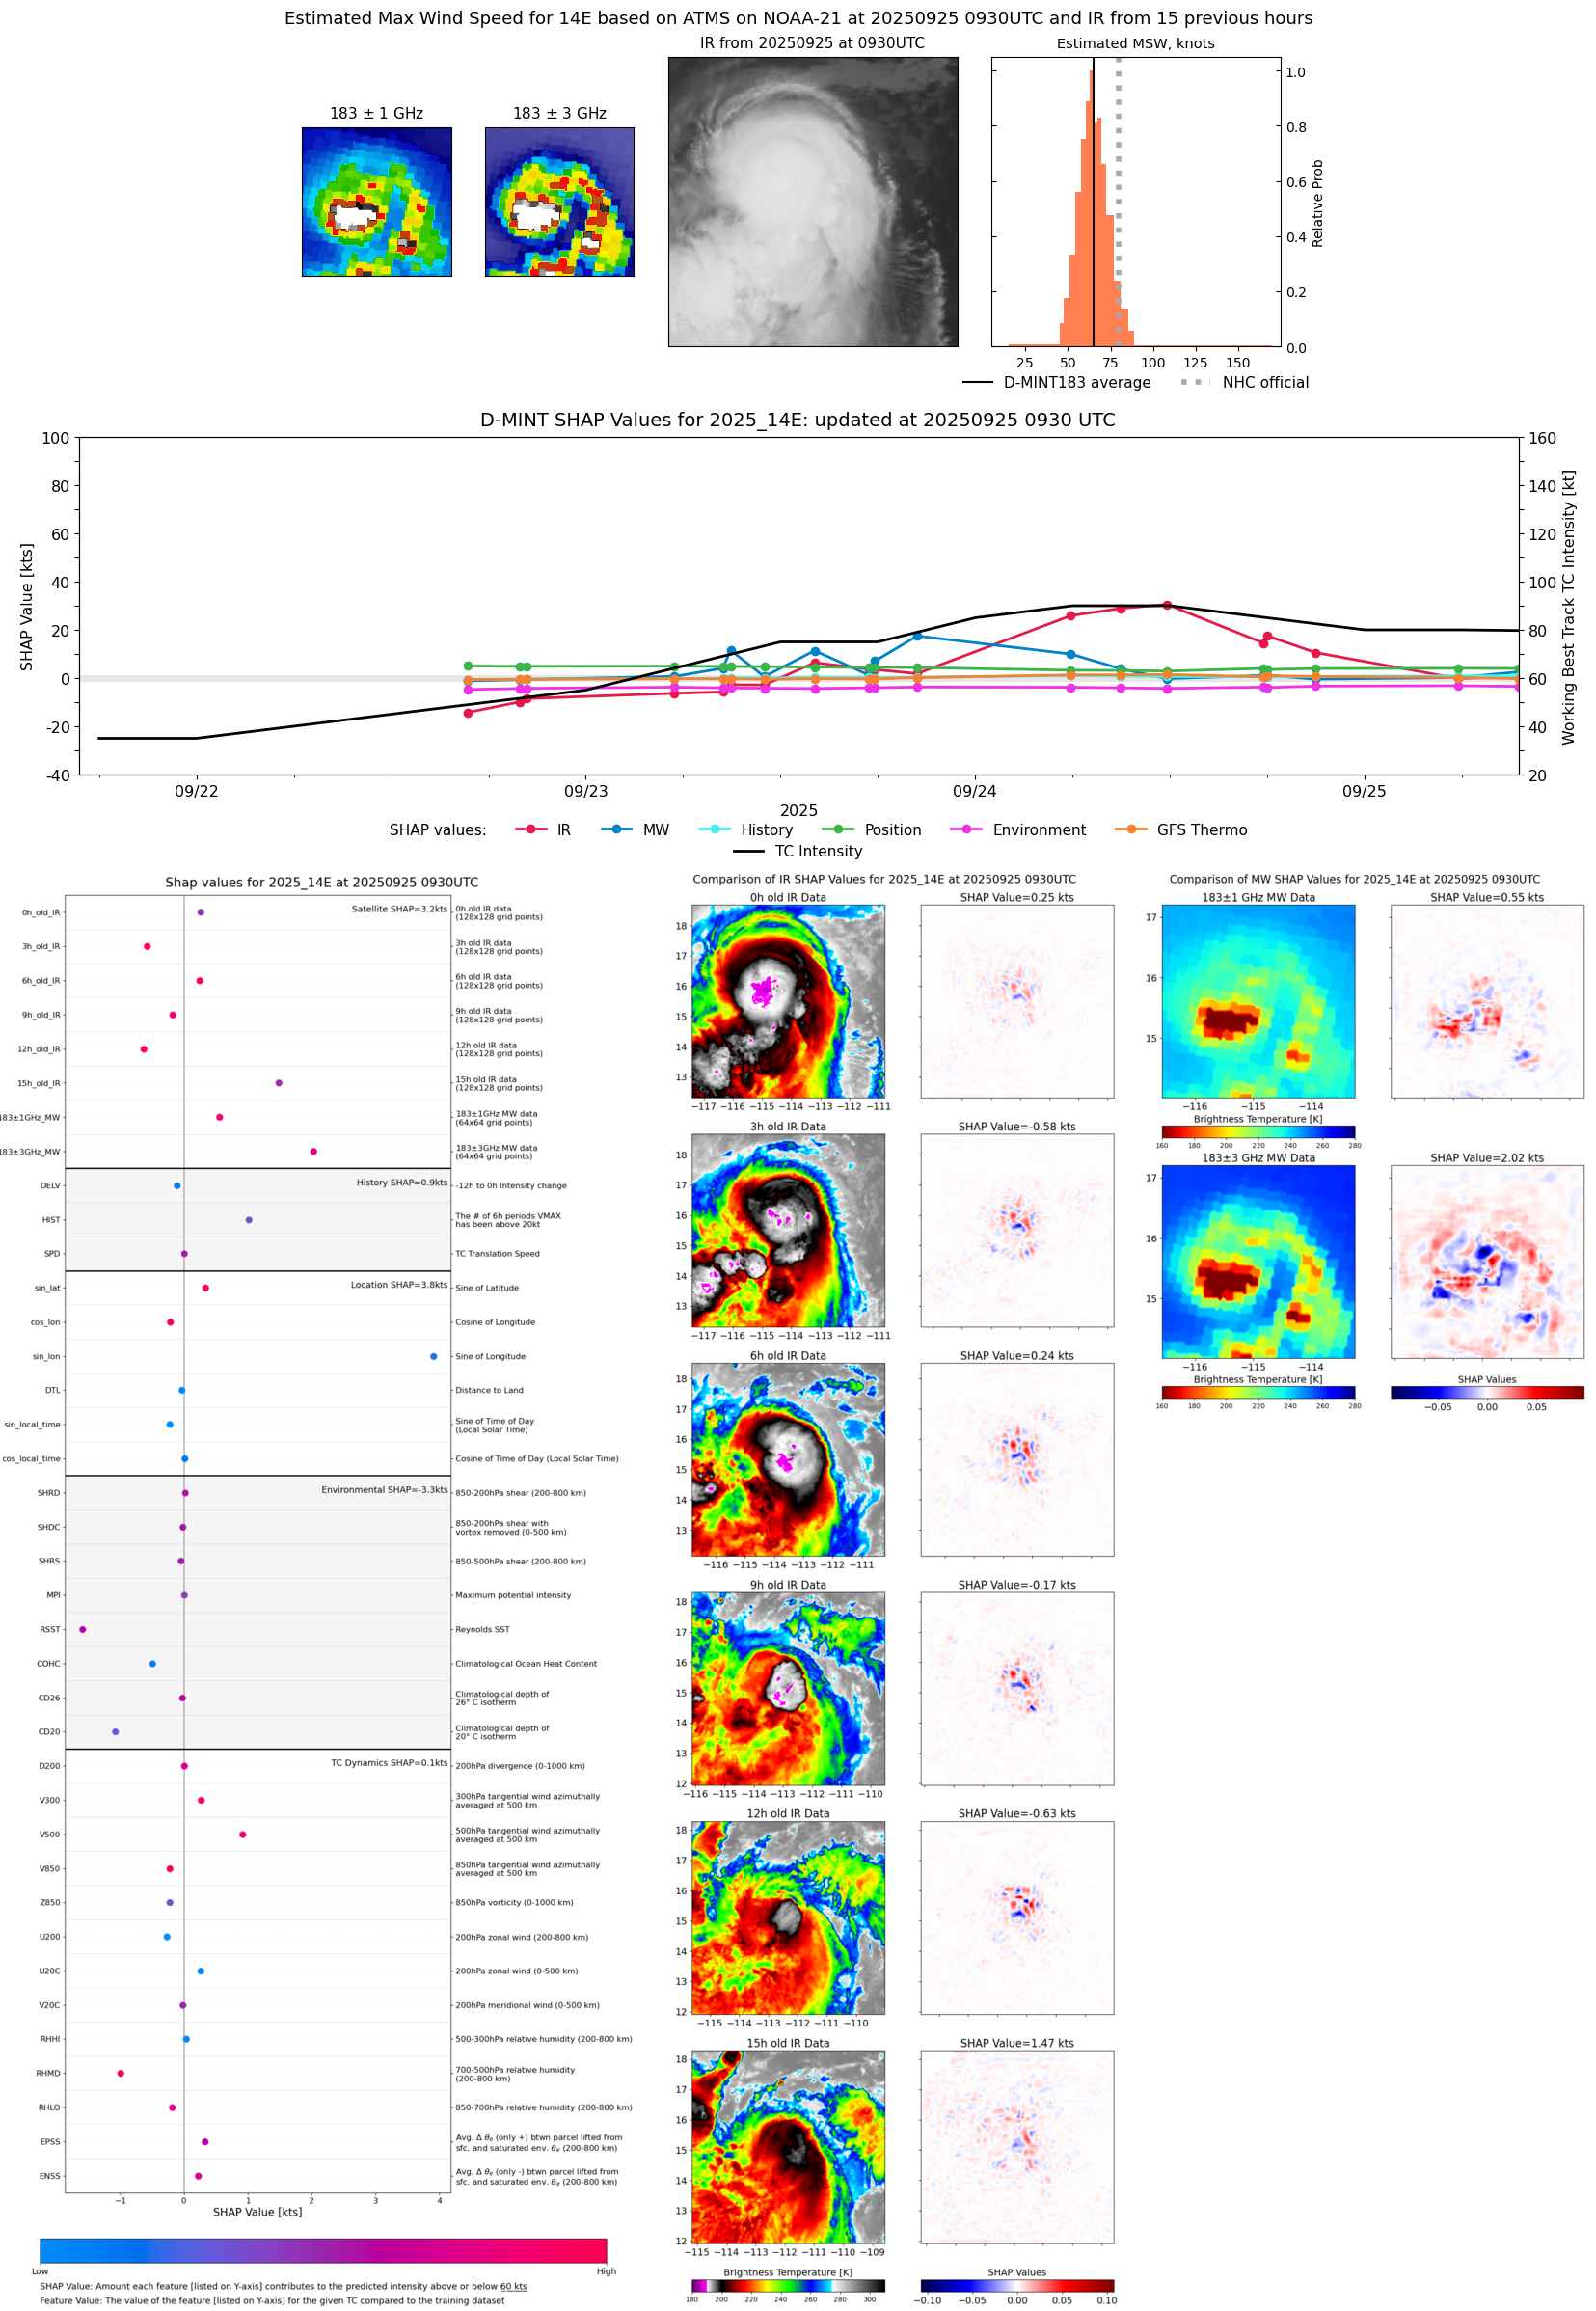 |
| 20250925 | 0545 UTC | TMS02 | 989 hPa | 63 kts | 57 kts | 69 kts | 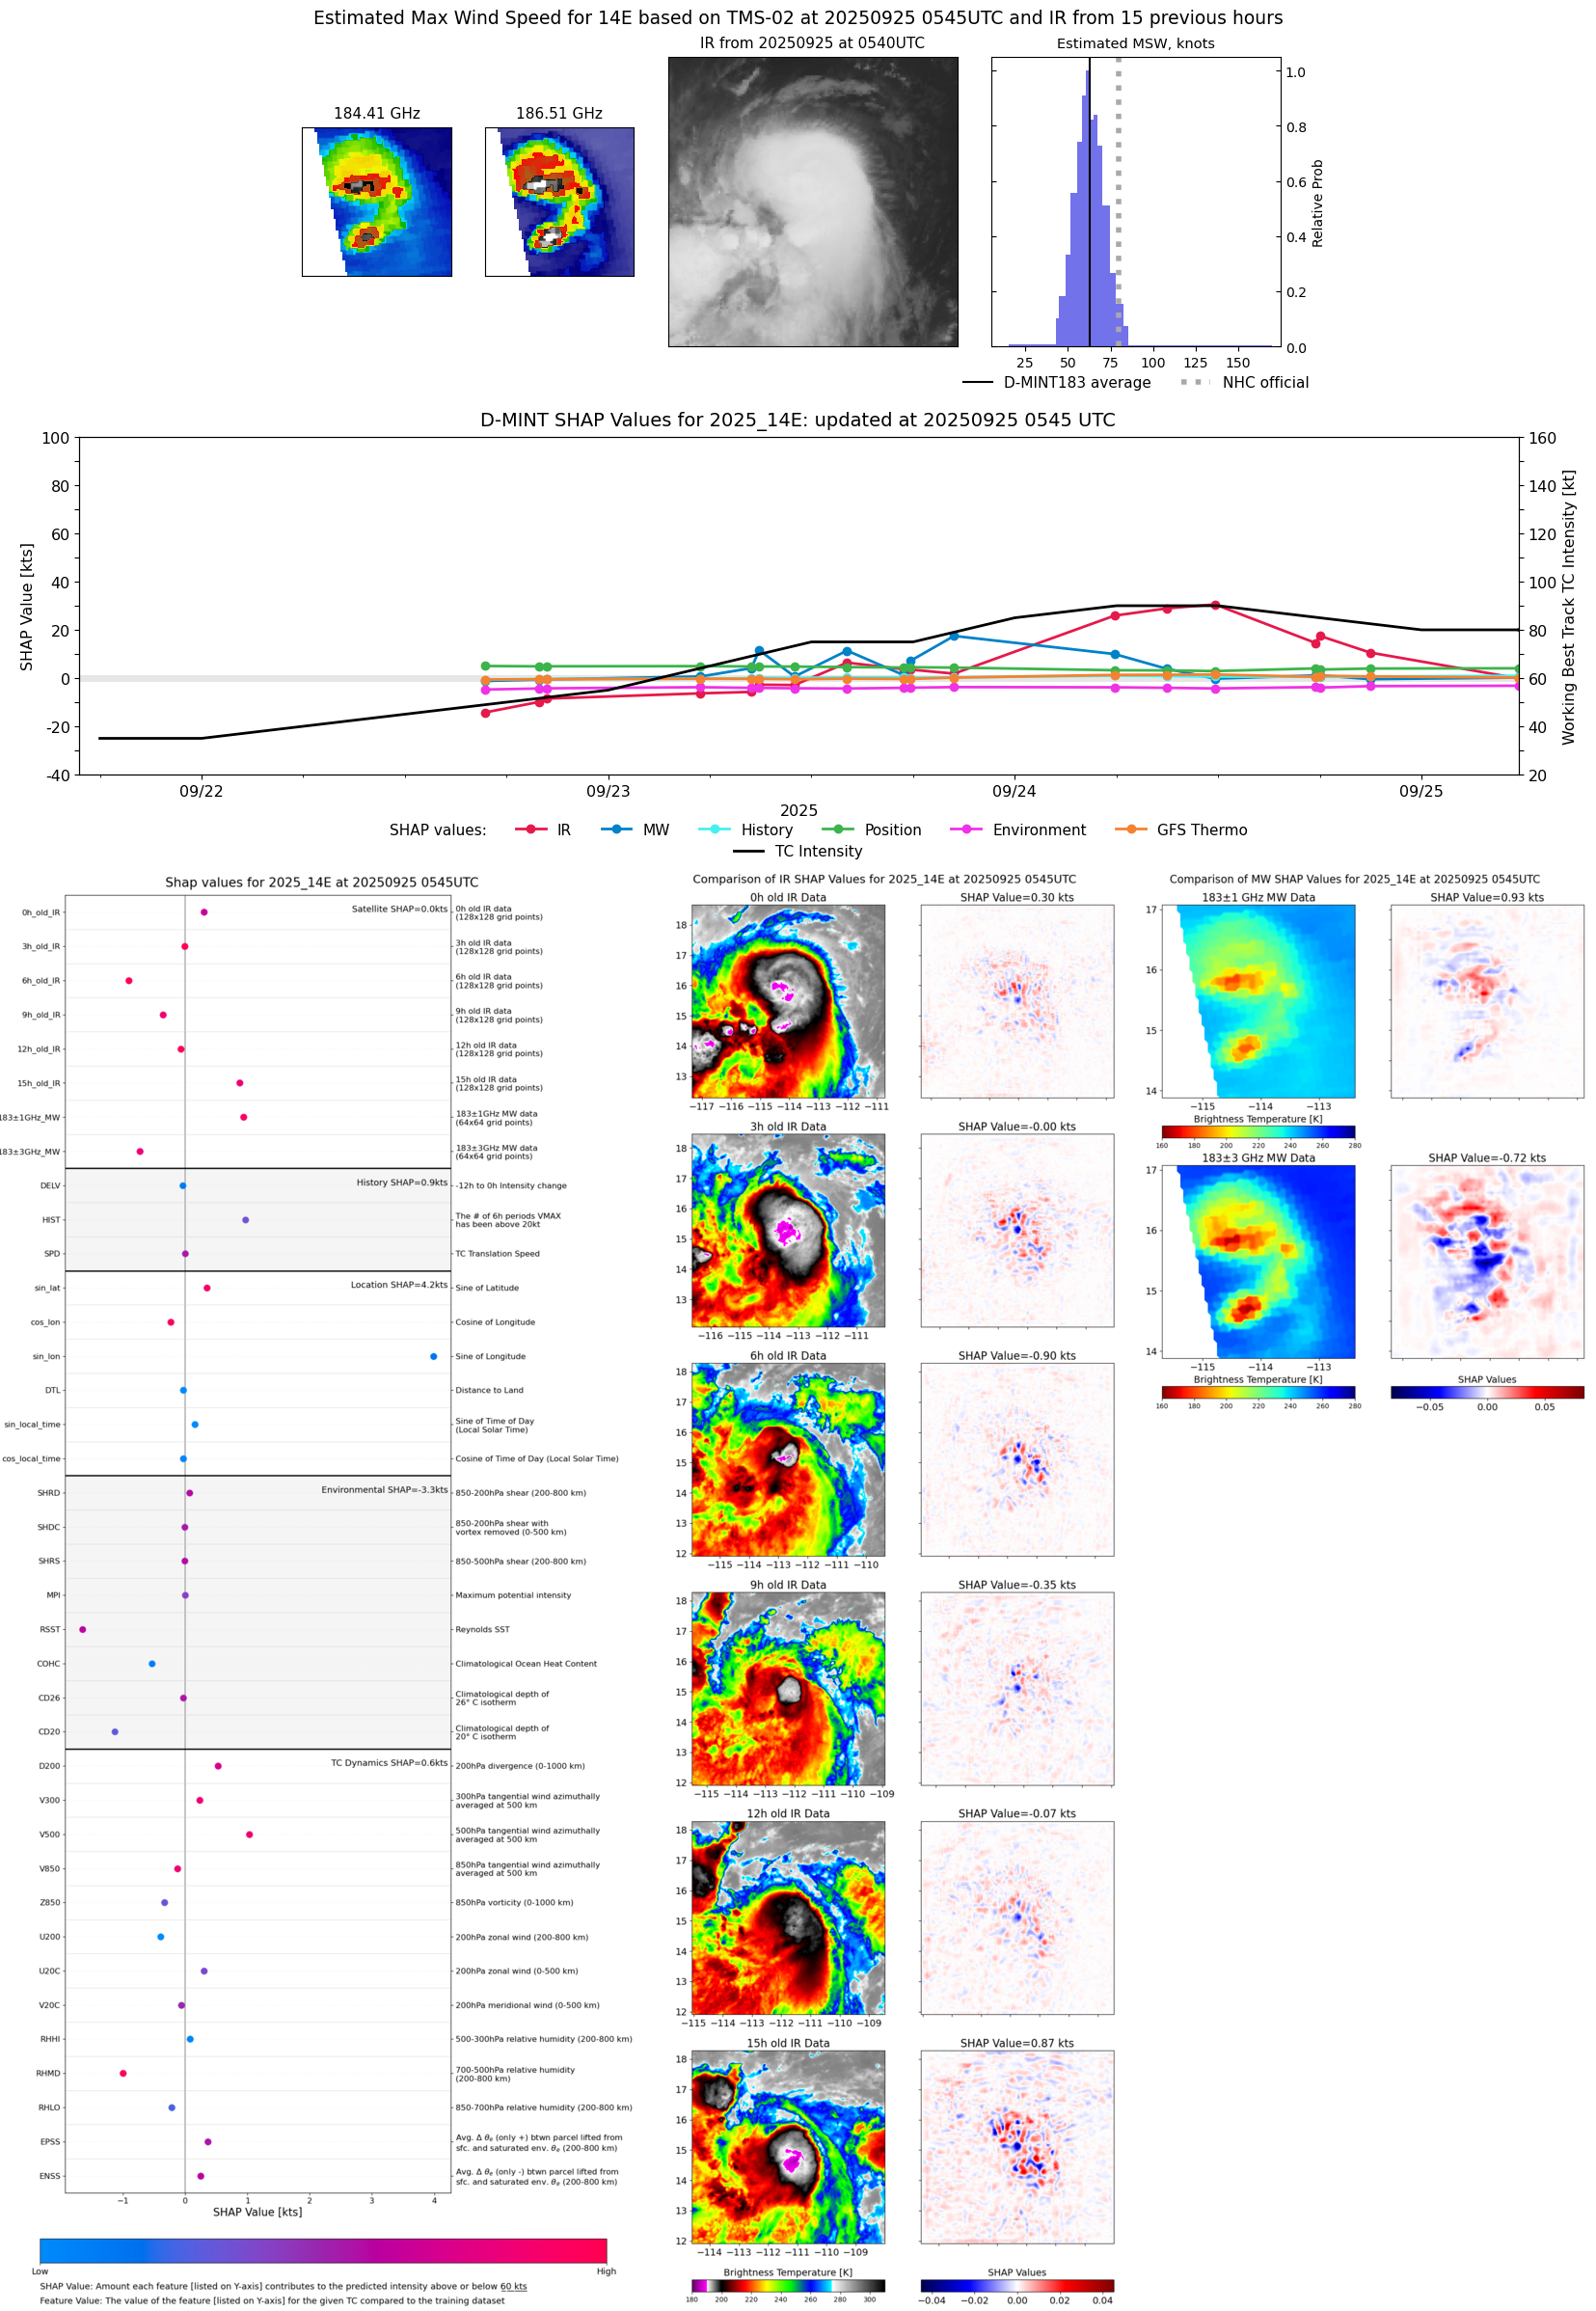 |
| 20250925 | 0136 UTC | WSFM01 | 990 hPa | 65 kts | 59 kts | 72 kts | 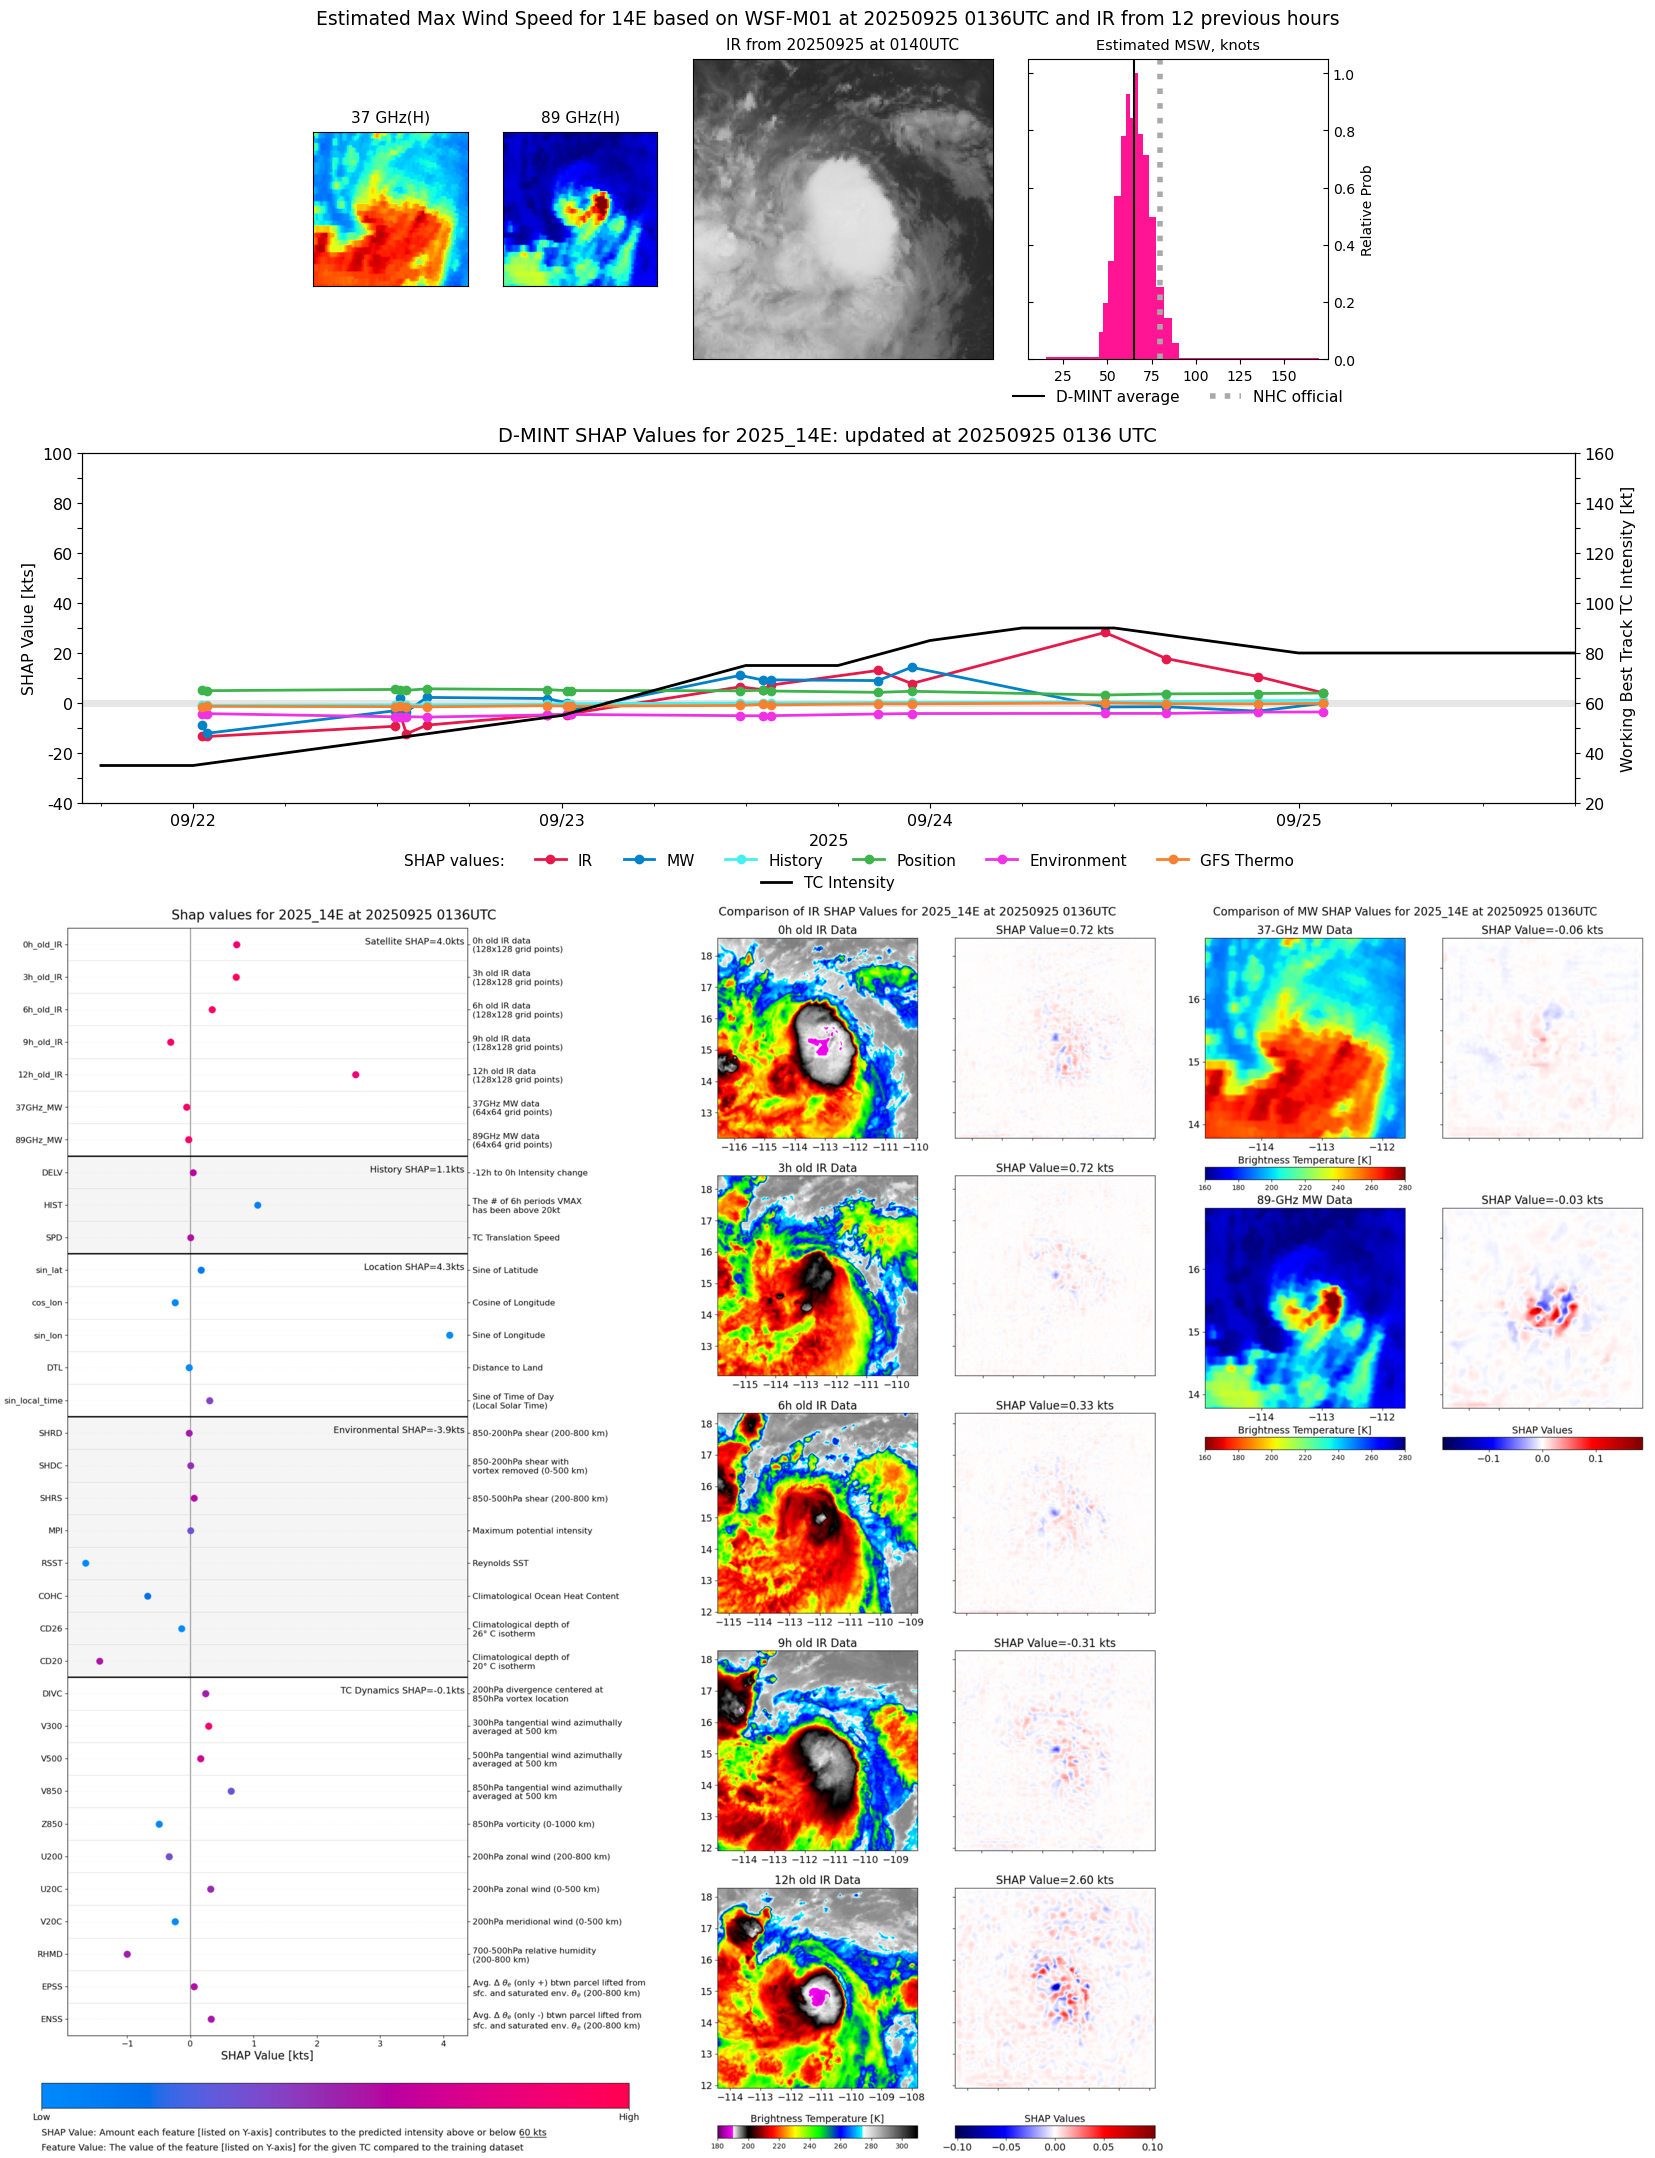 |
| 20250924 | 2121 UTC | AMSR2 | 986 hPa | 68 kts | 61 kts | 76 kts | 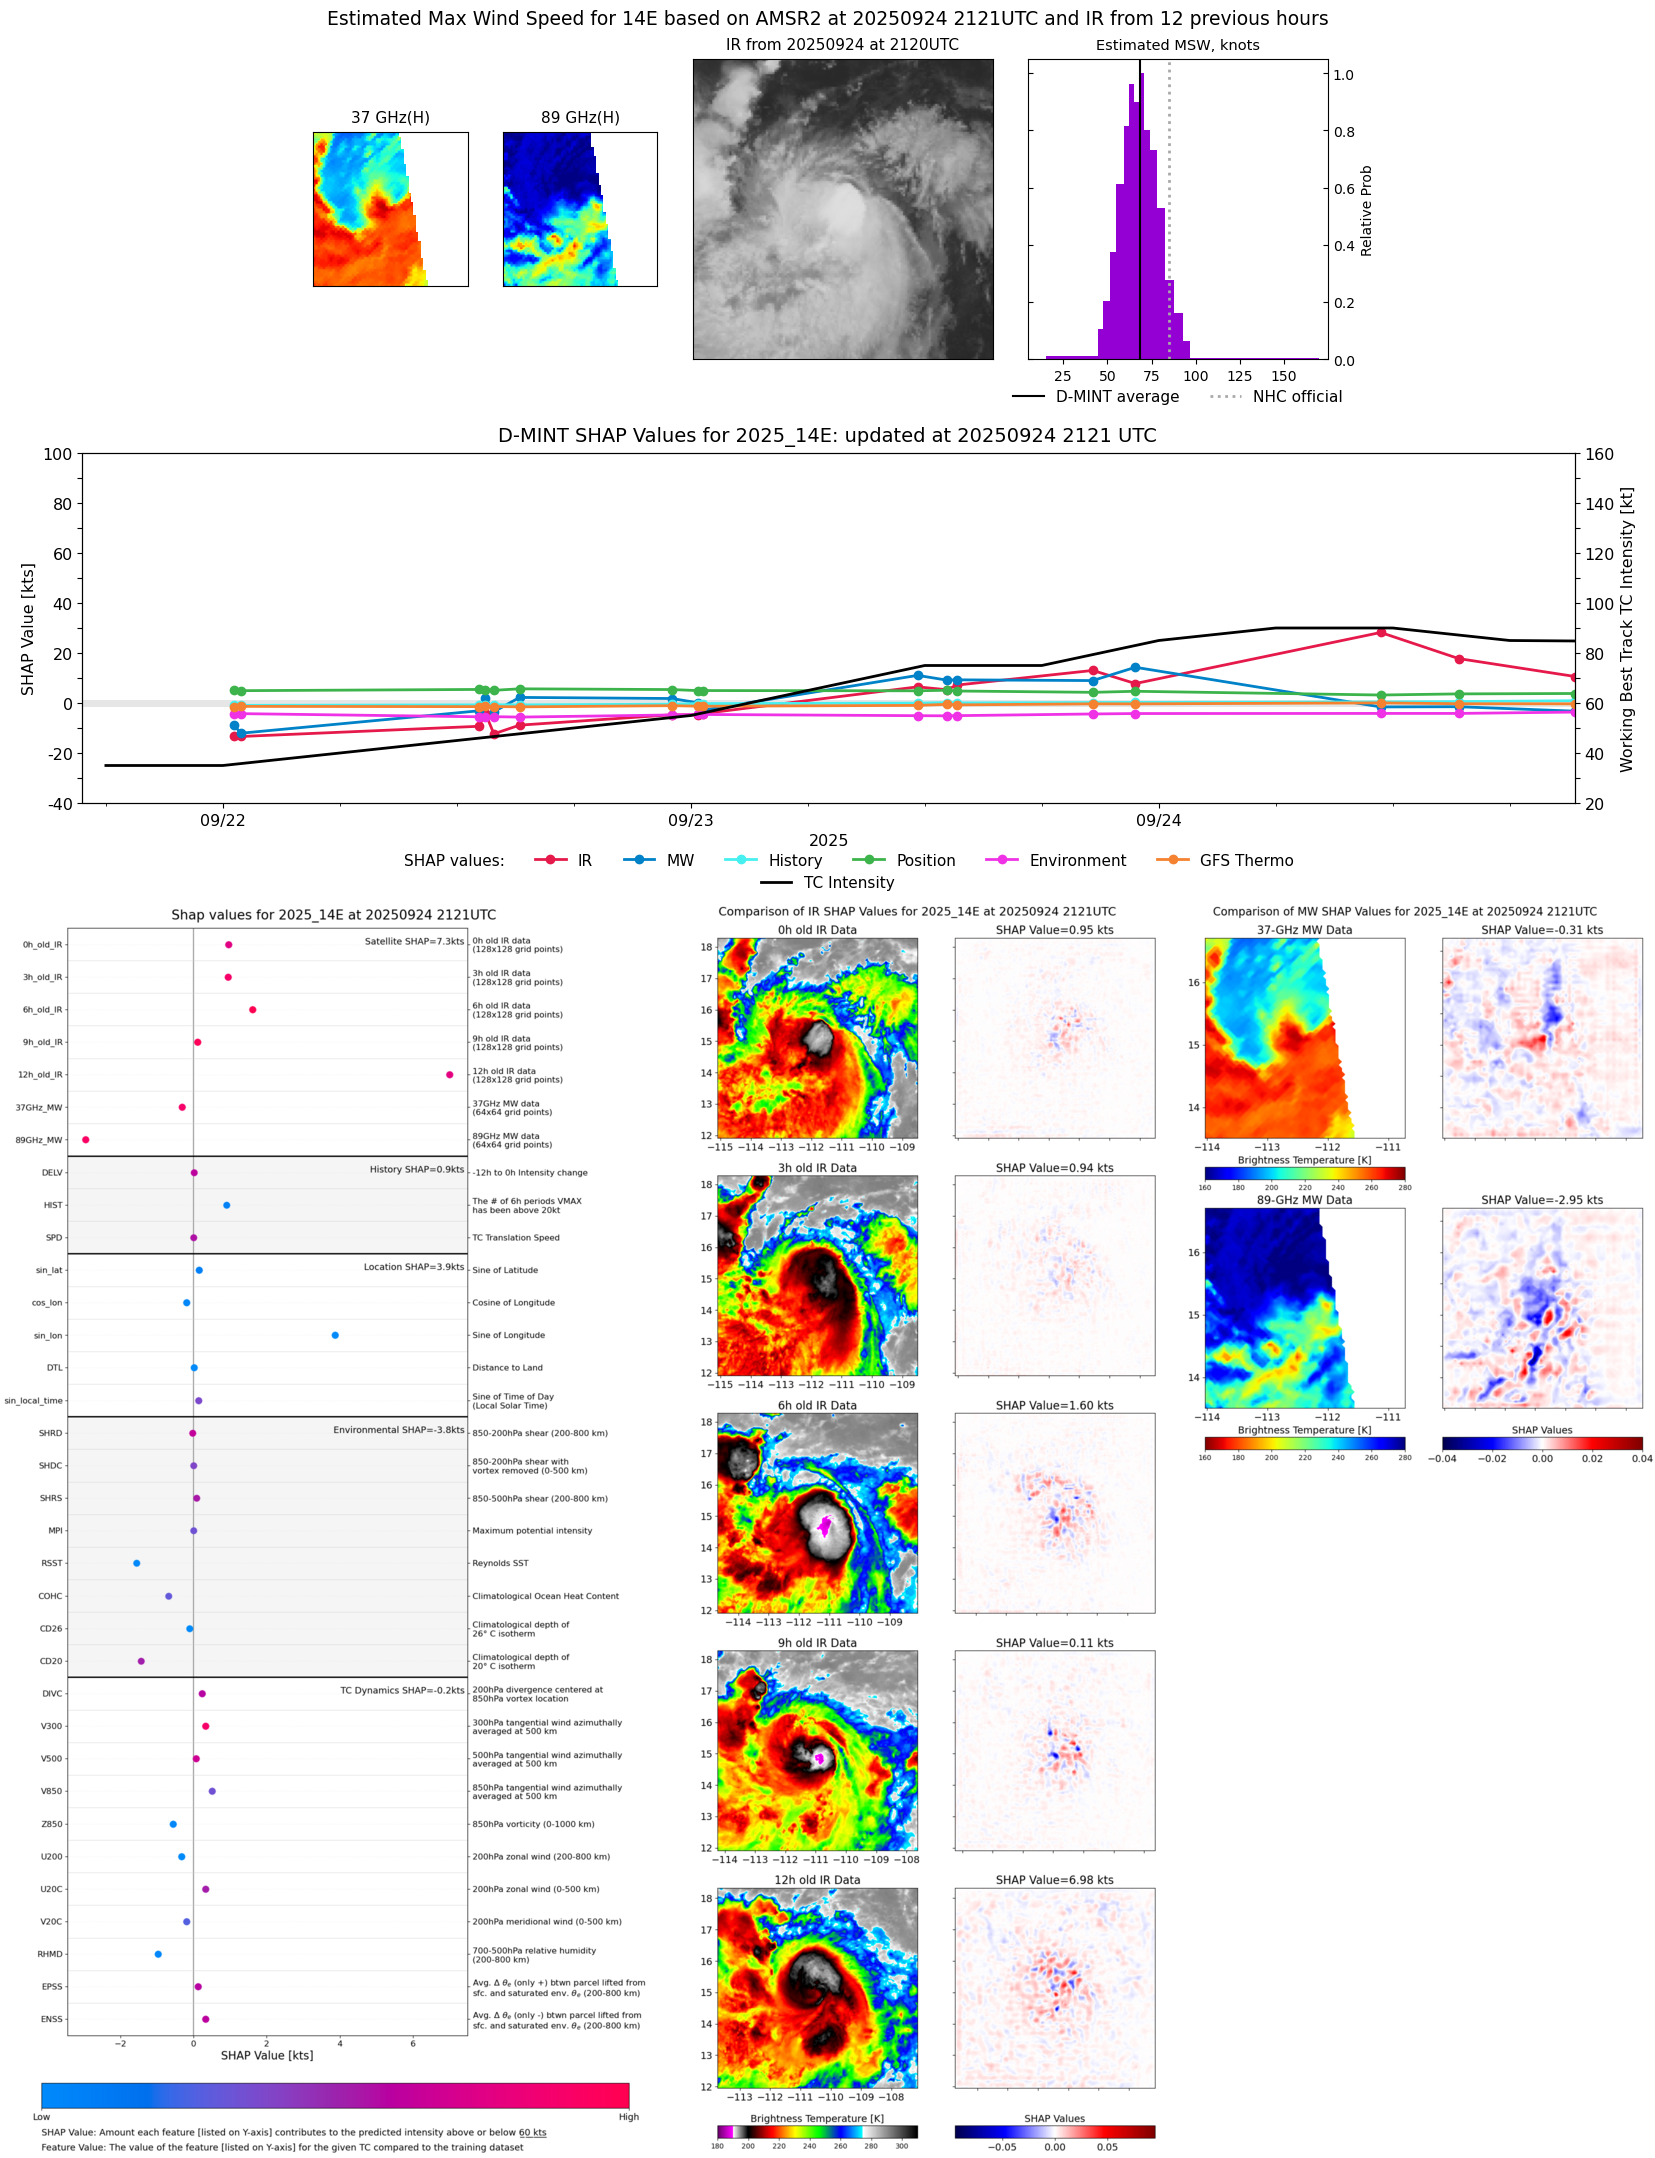 |
| 20250924 | 2058 UTC | ATMS-N21 | 979 hPa | 73 kts | 66 kts | 79 kts |  |
| 20250924 | 1800 UTC | AWS | 974 hPa | 80 kts | 74 kts | 86 kts | 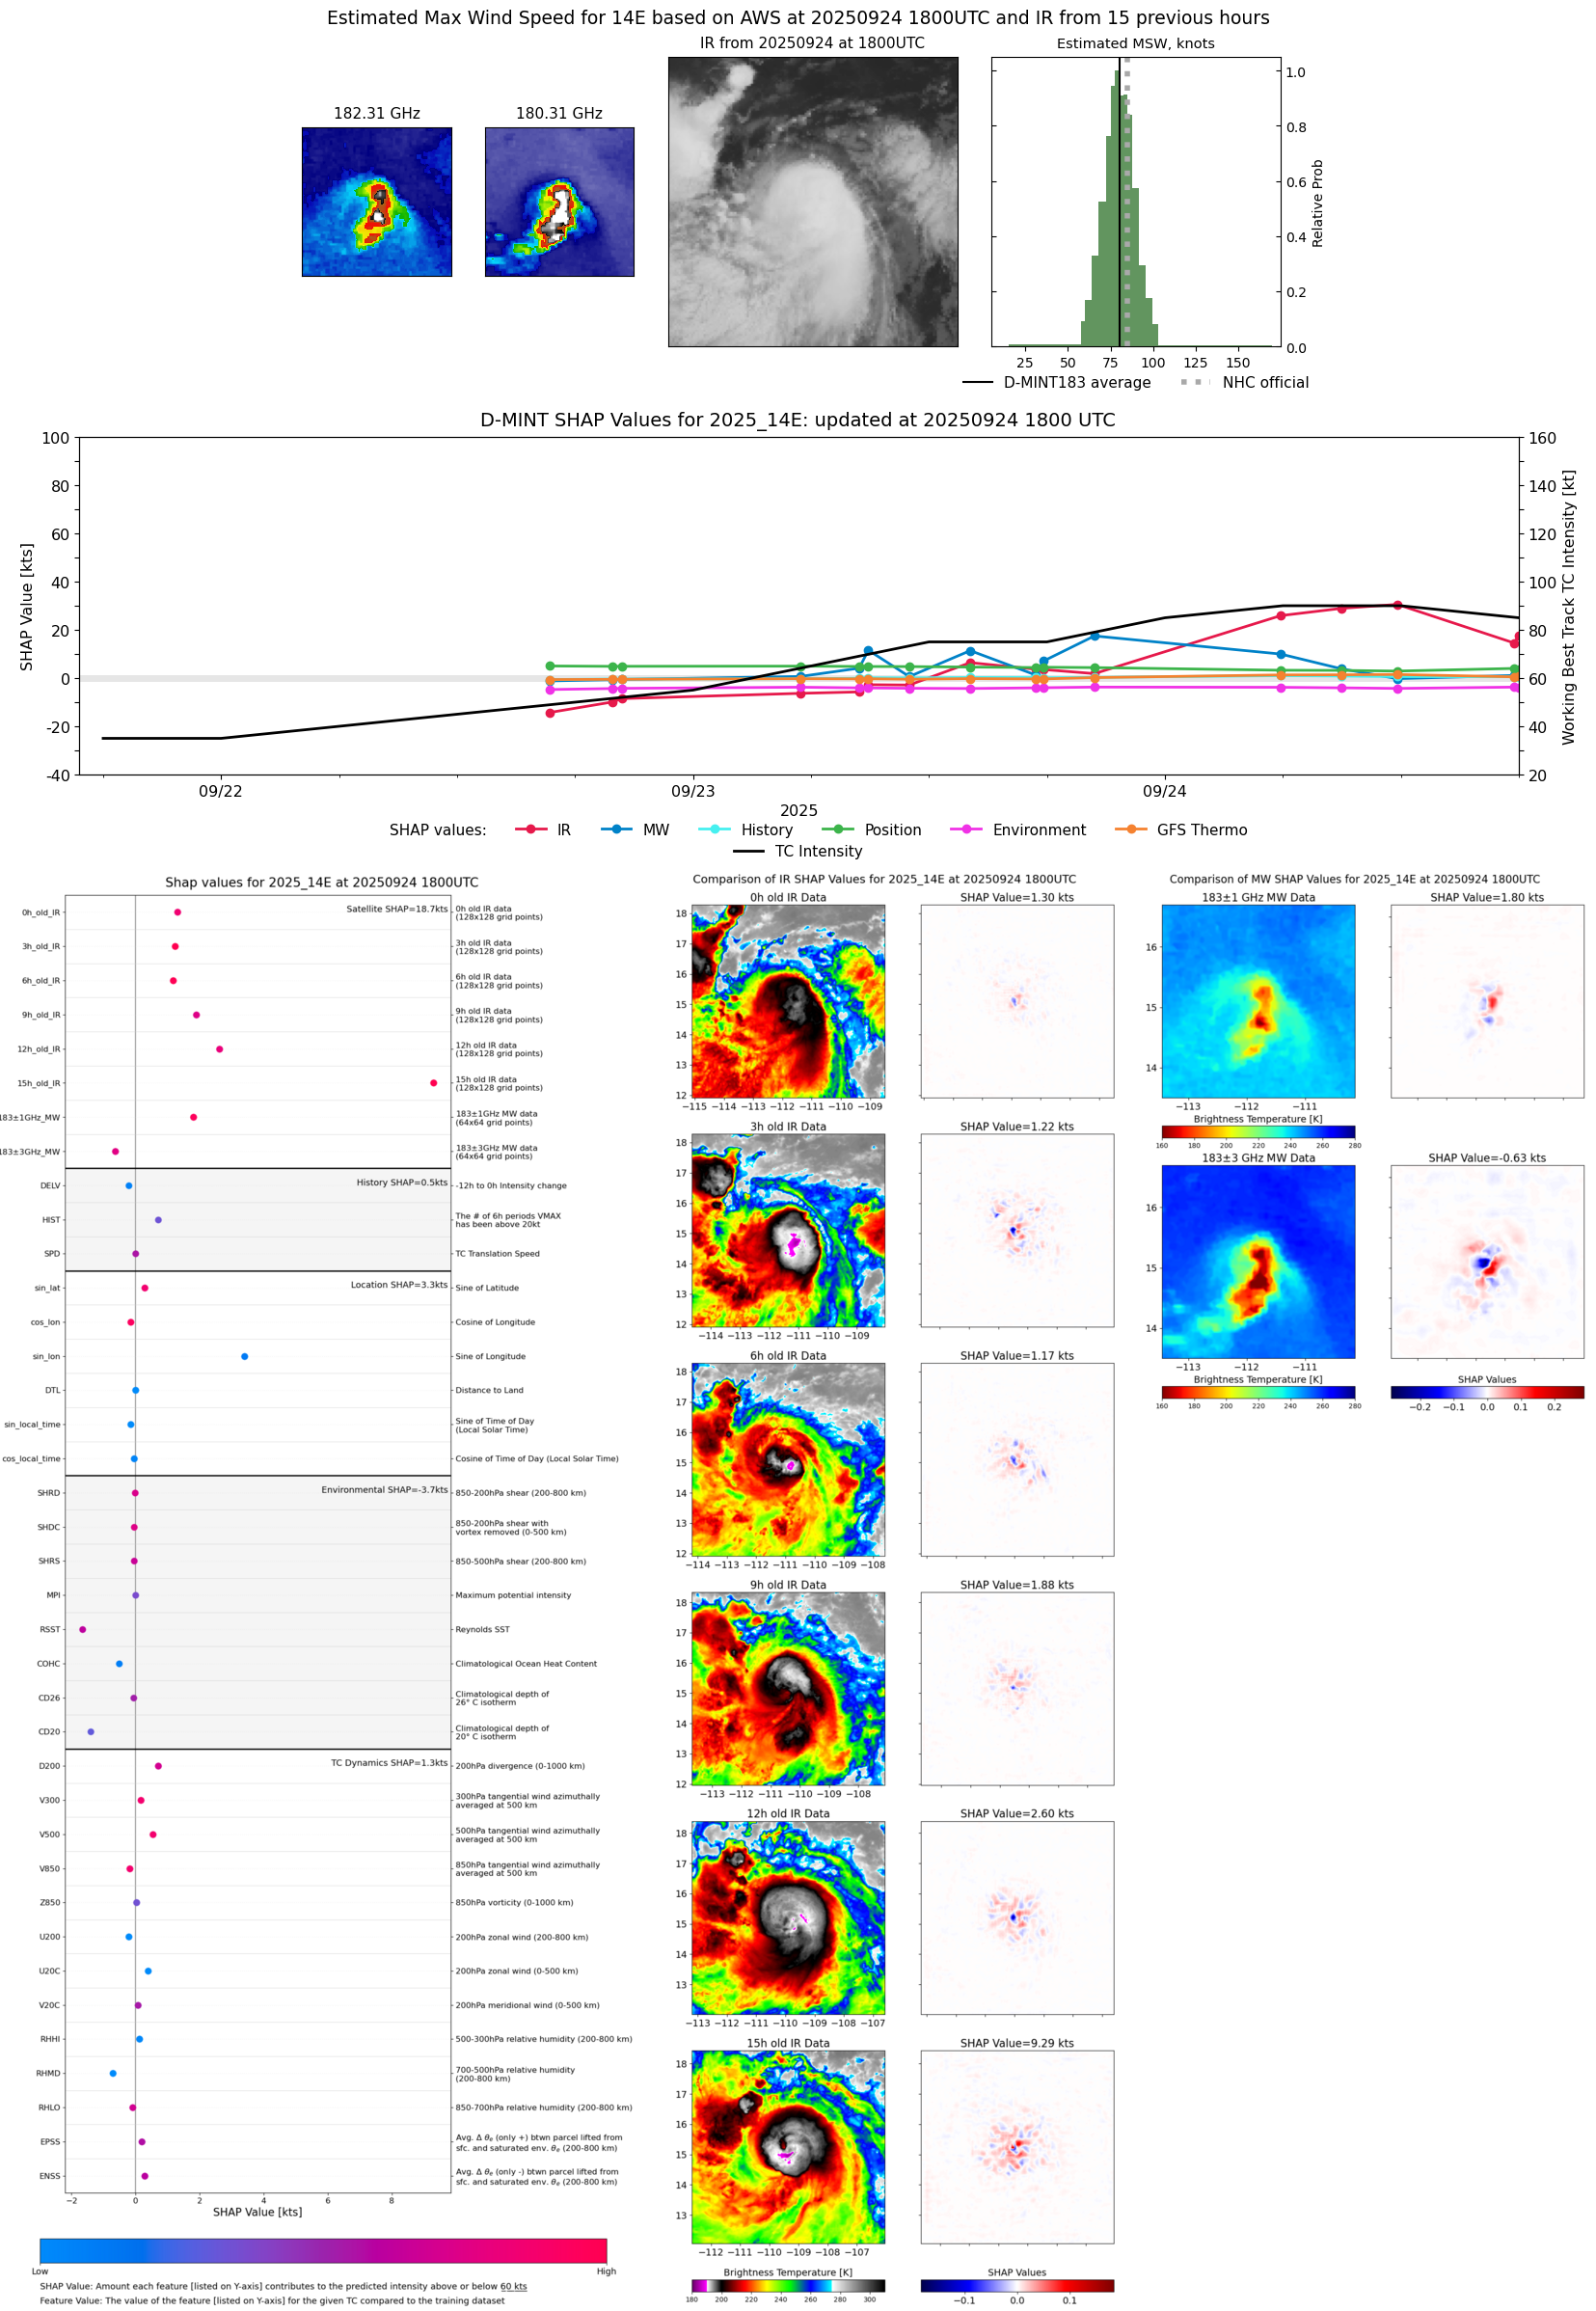 |
| 20250924 | 1745 UTC | TMS05 | 976 hPa | 77 kts | 70 kts | 84 kts | 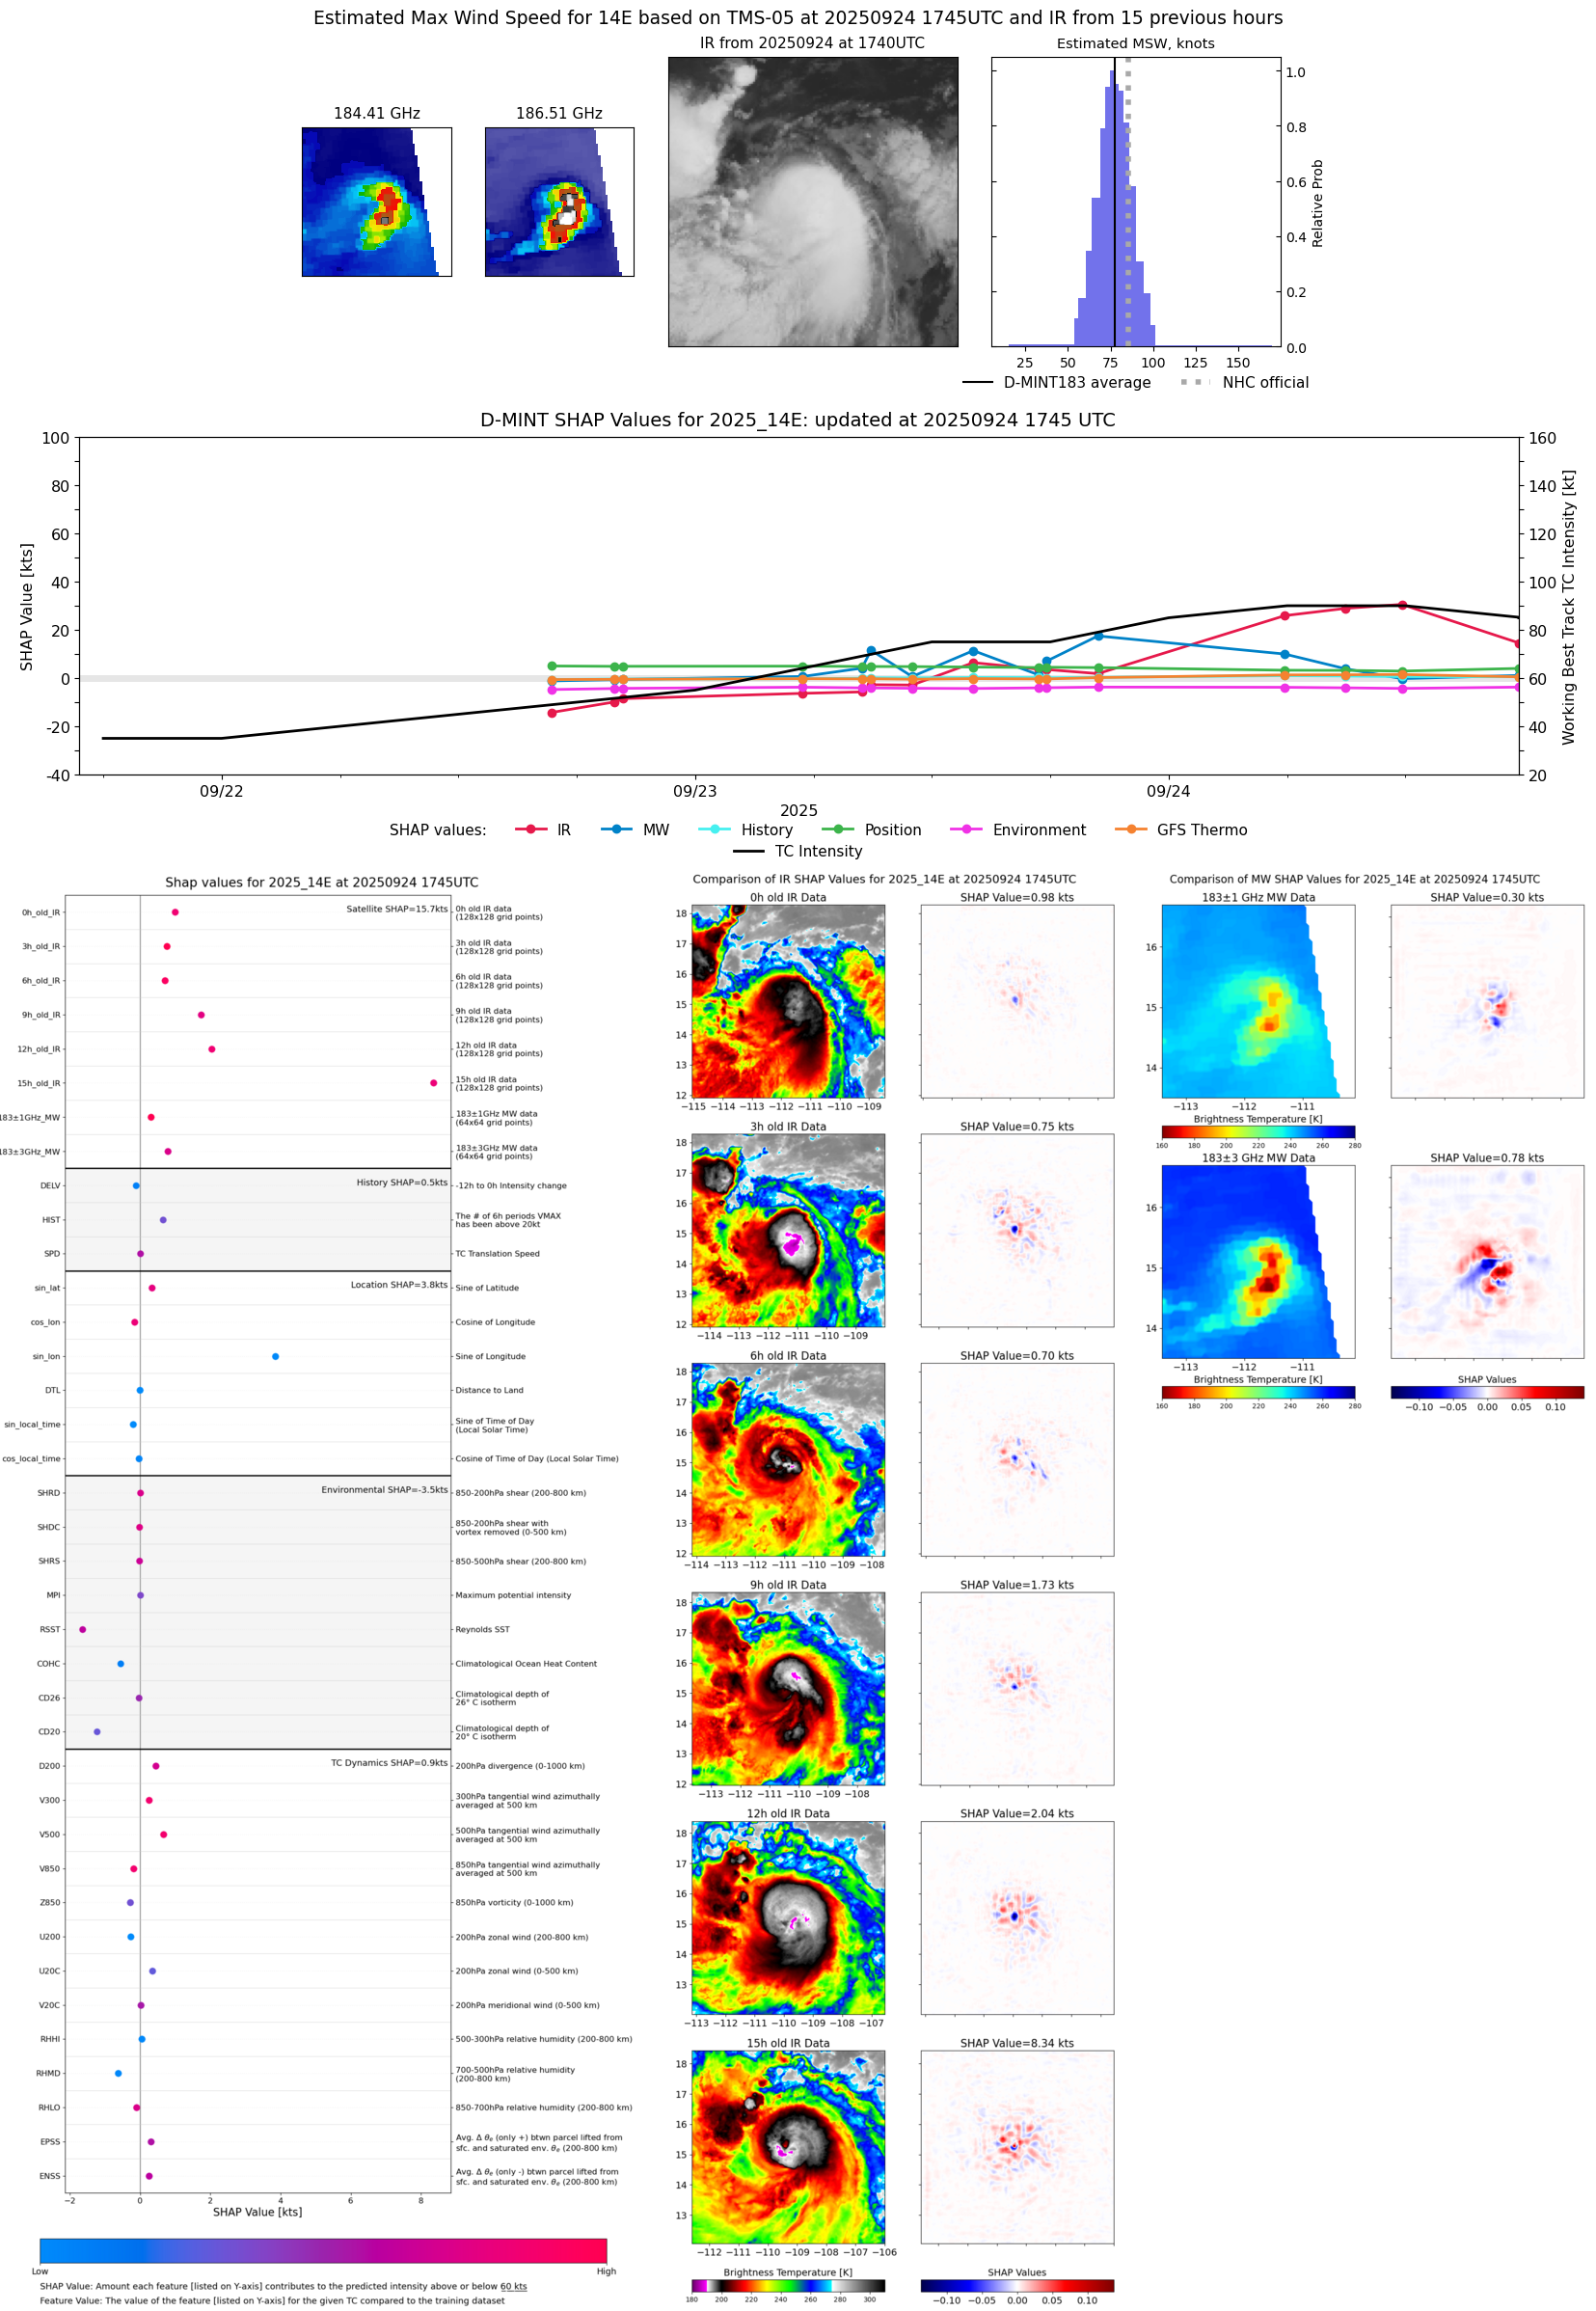 |
| 20250924 | 1523 UTC | GMI | 985 hPa | 76 kts | 69 kts | 83 kts | 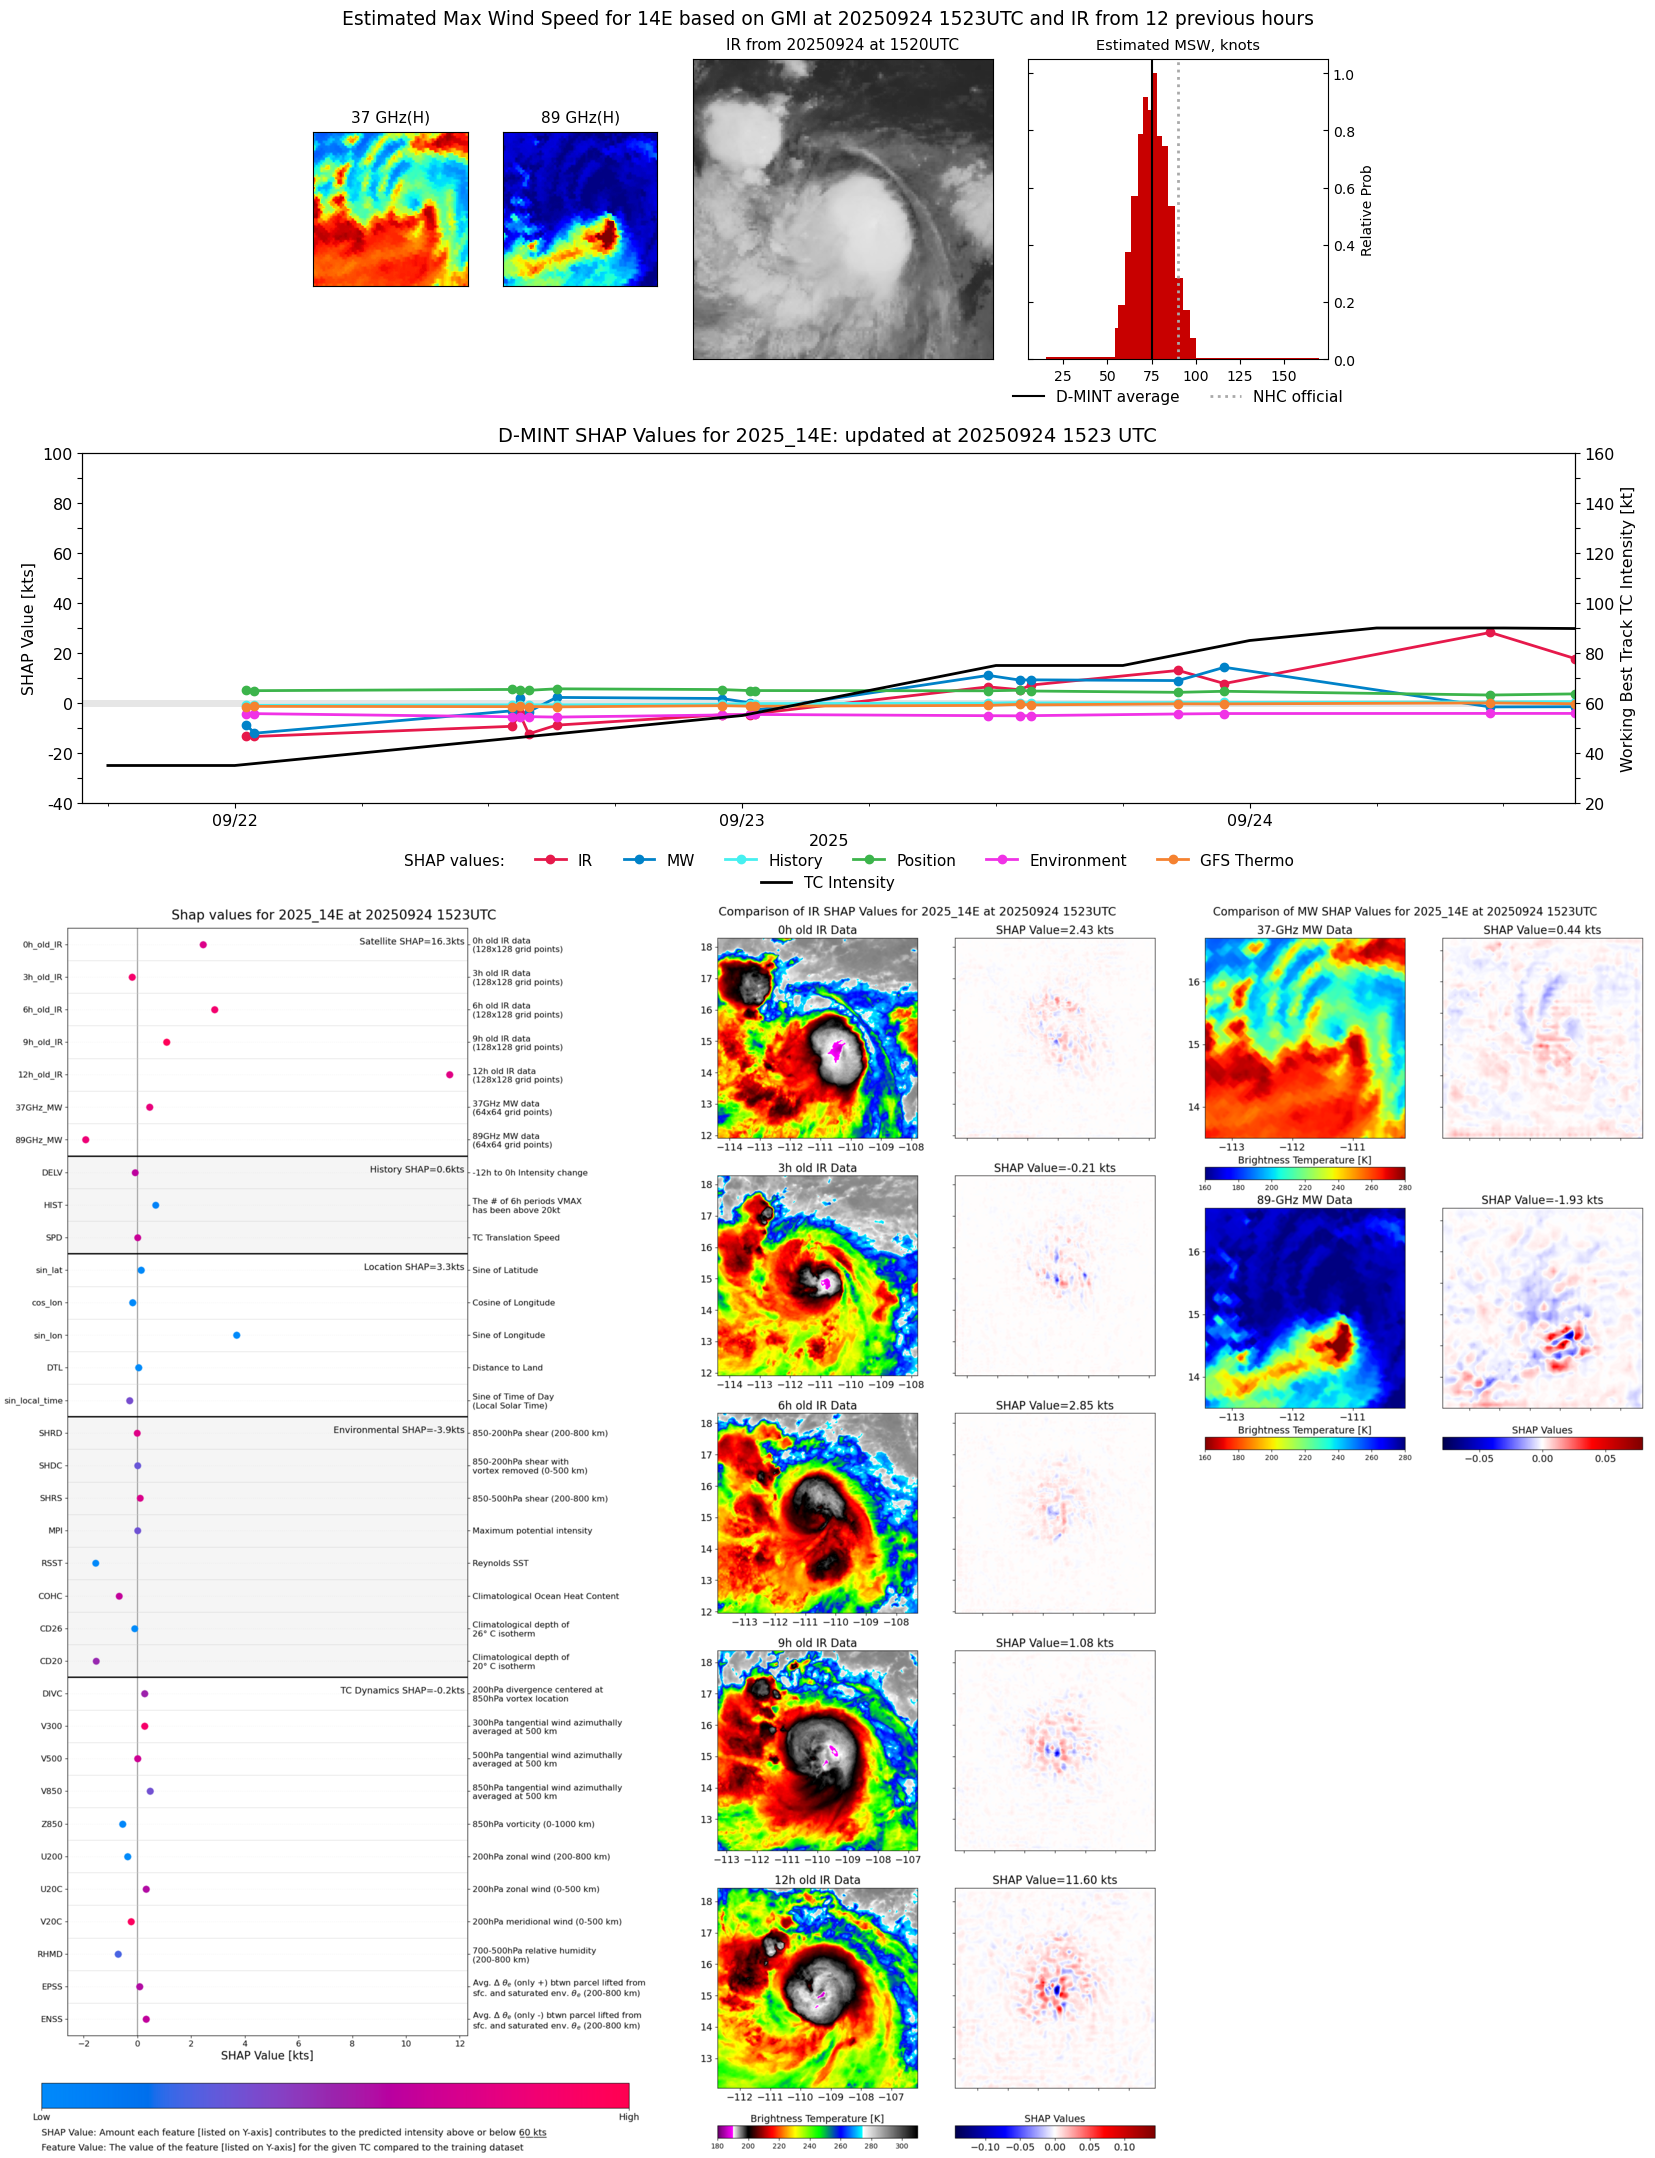 |
| 20250924 | 1149 UTC | TMS07 | 969 hPa | 91 kts | 85 kts | 97 kts | 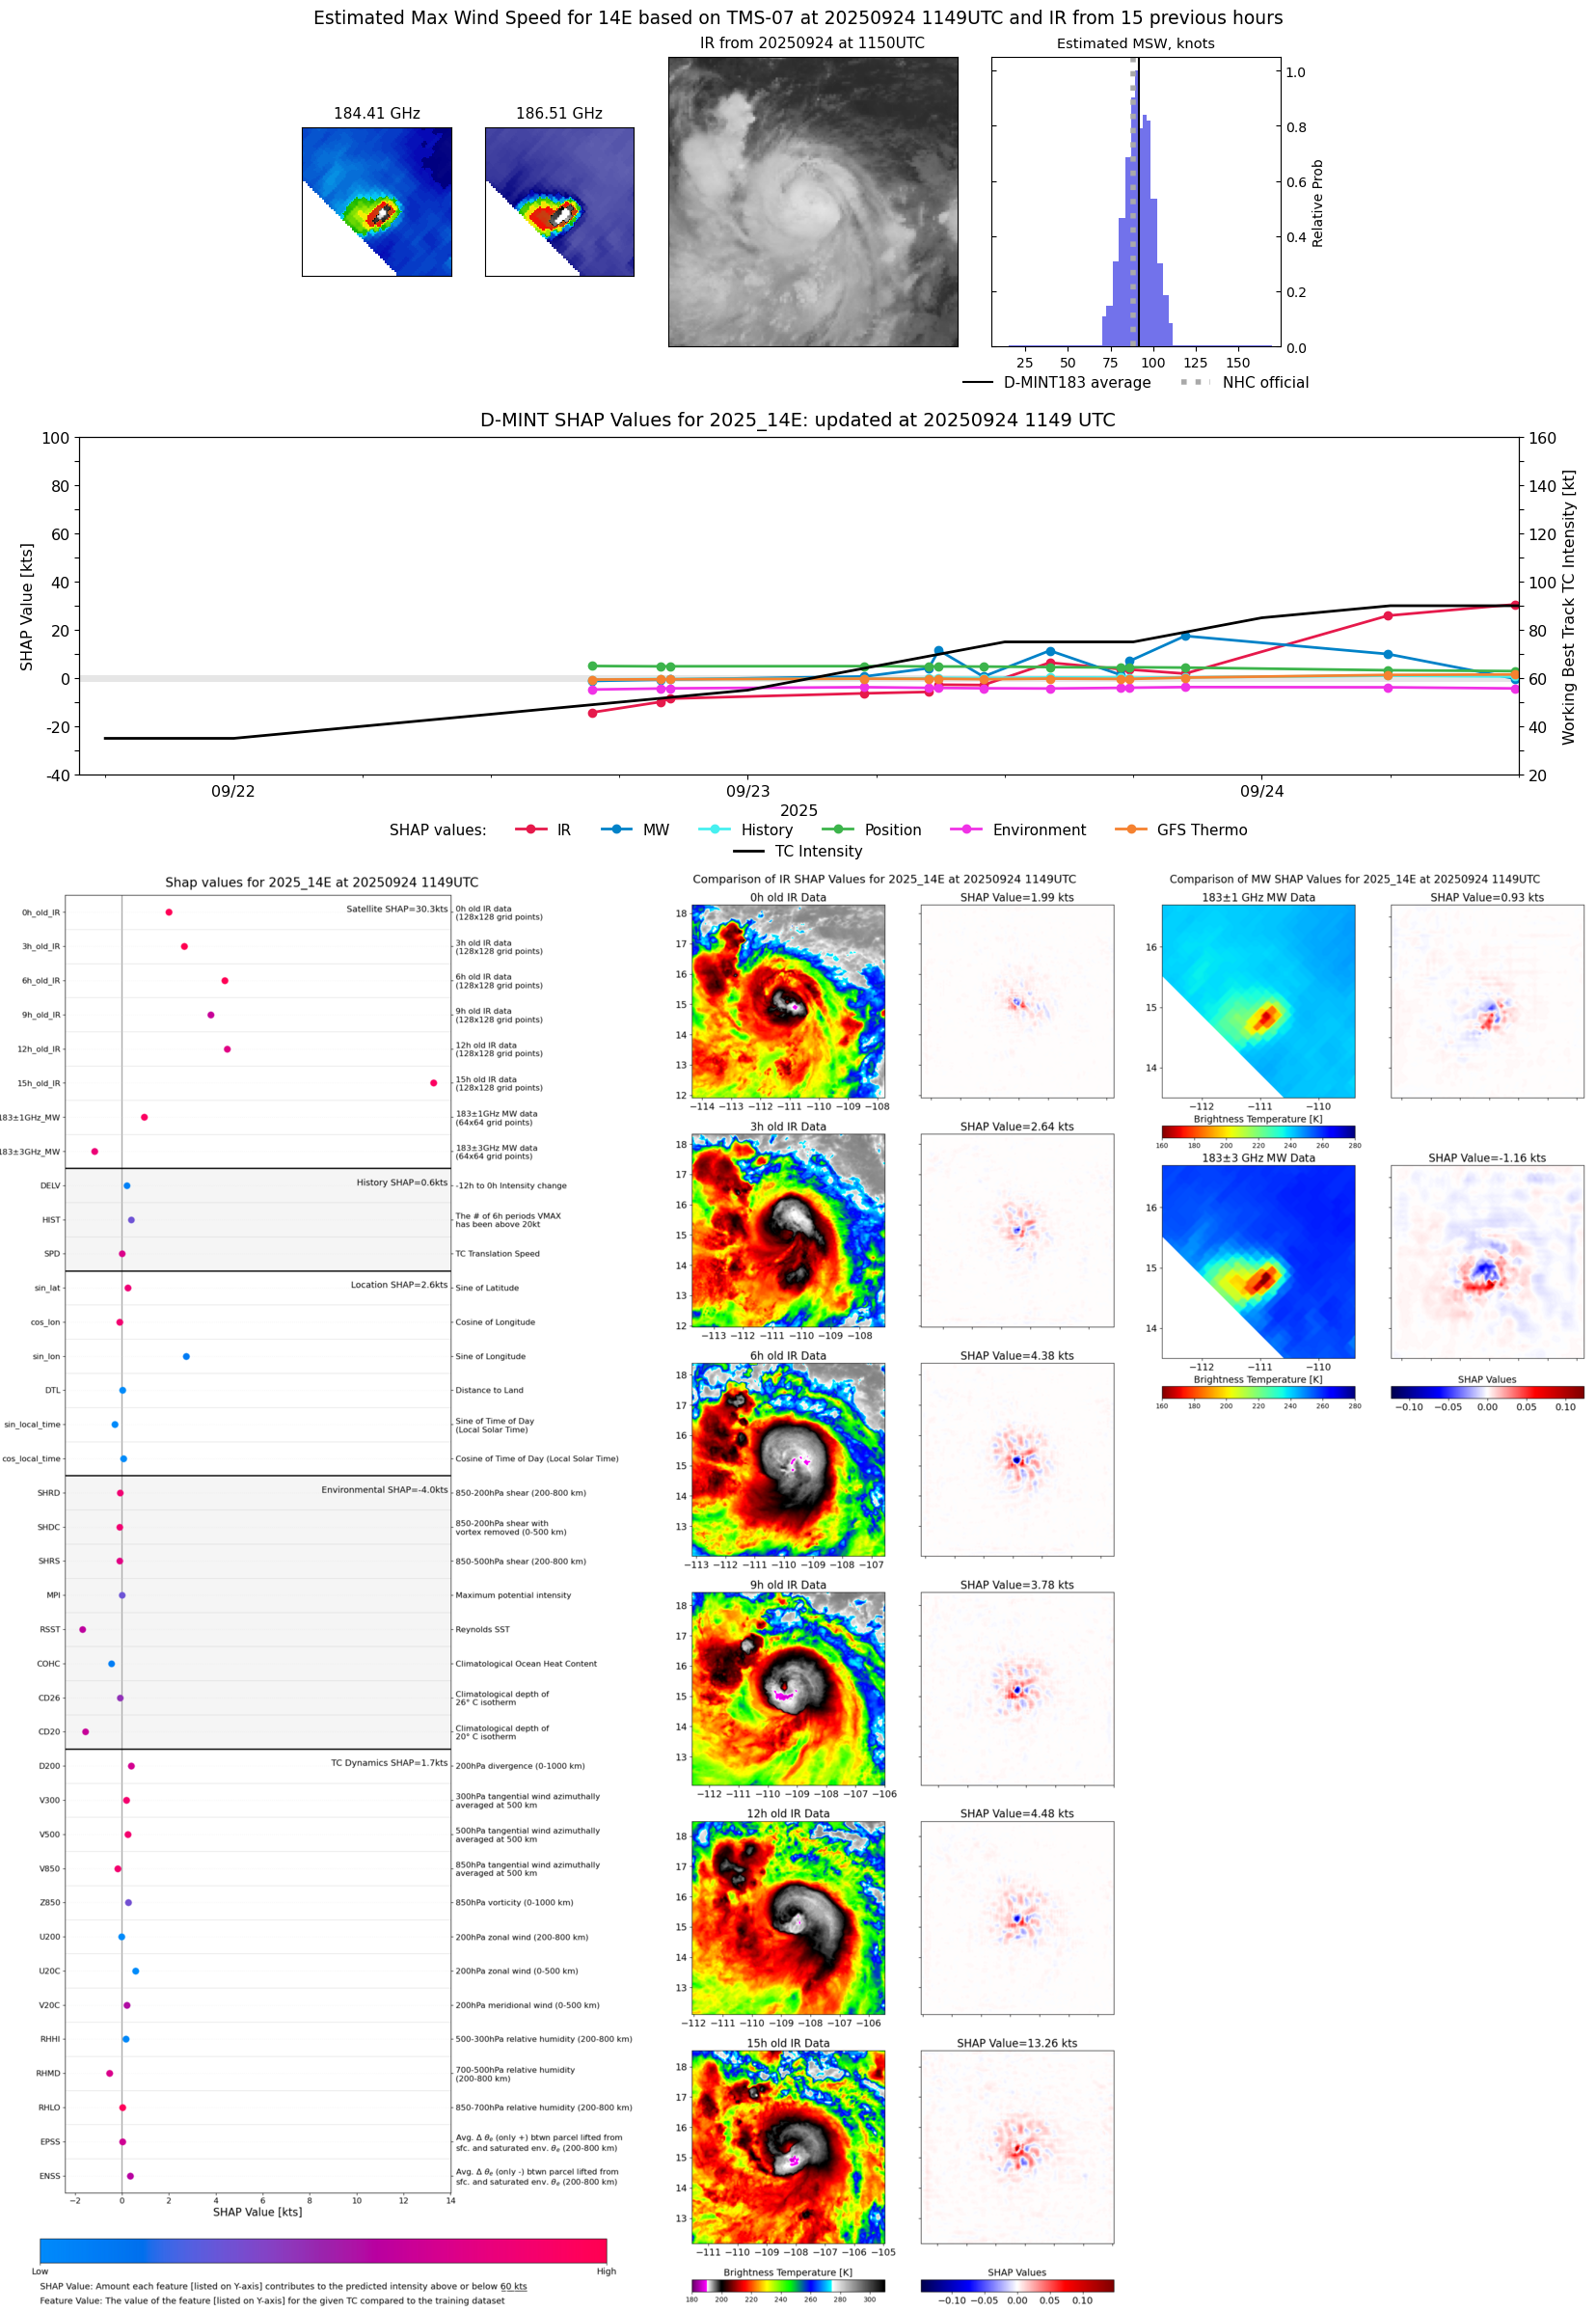 |
| 20250924 | 1123 UTC | SSMISF18 | 979 hPa | 86 kts | 79 kts | 93 kts |  |
| 20250924 | 0858 UTC | ATMS-N20 | 970 hPa | 95 kts | 88 kts | 101 kts | 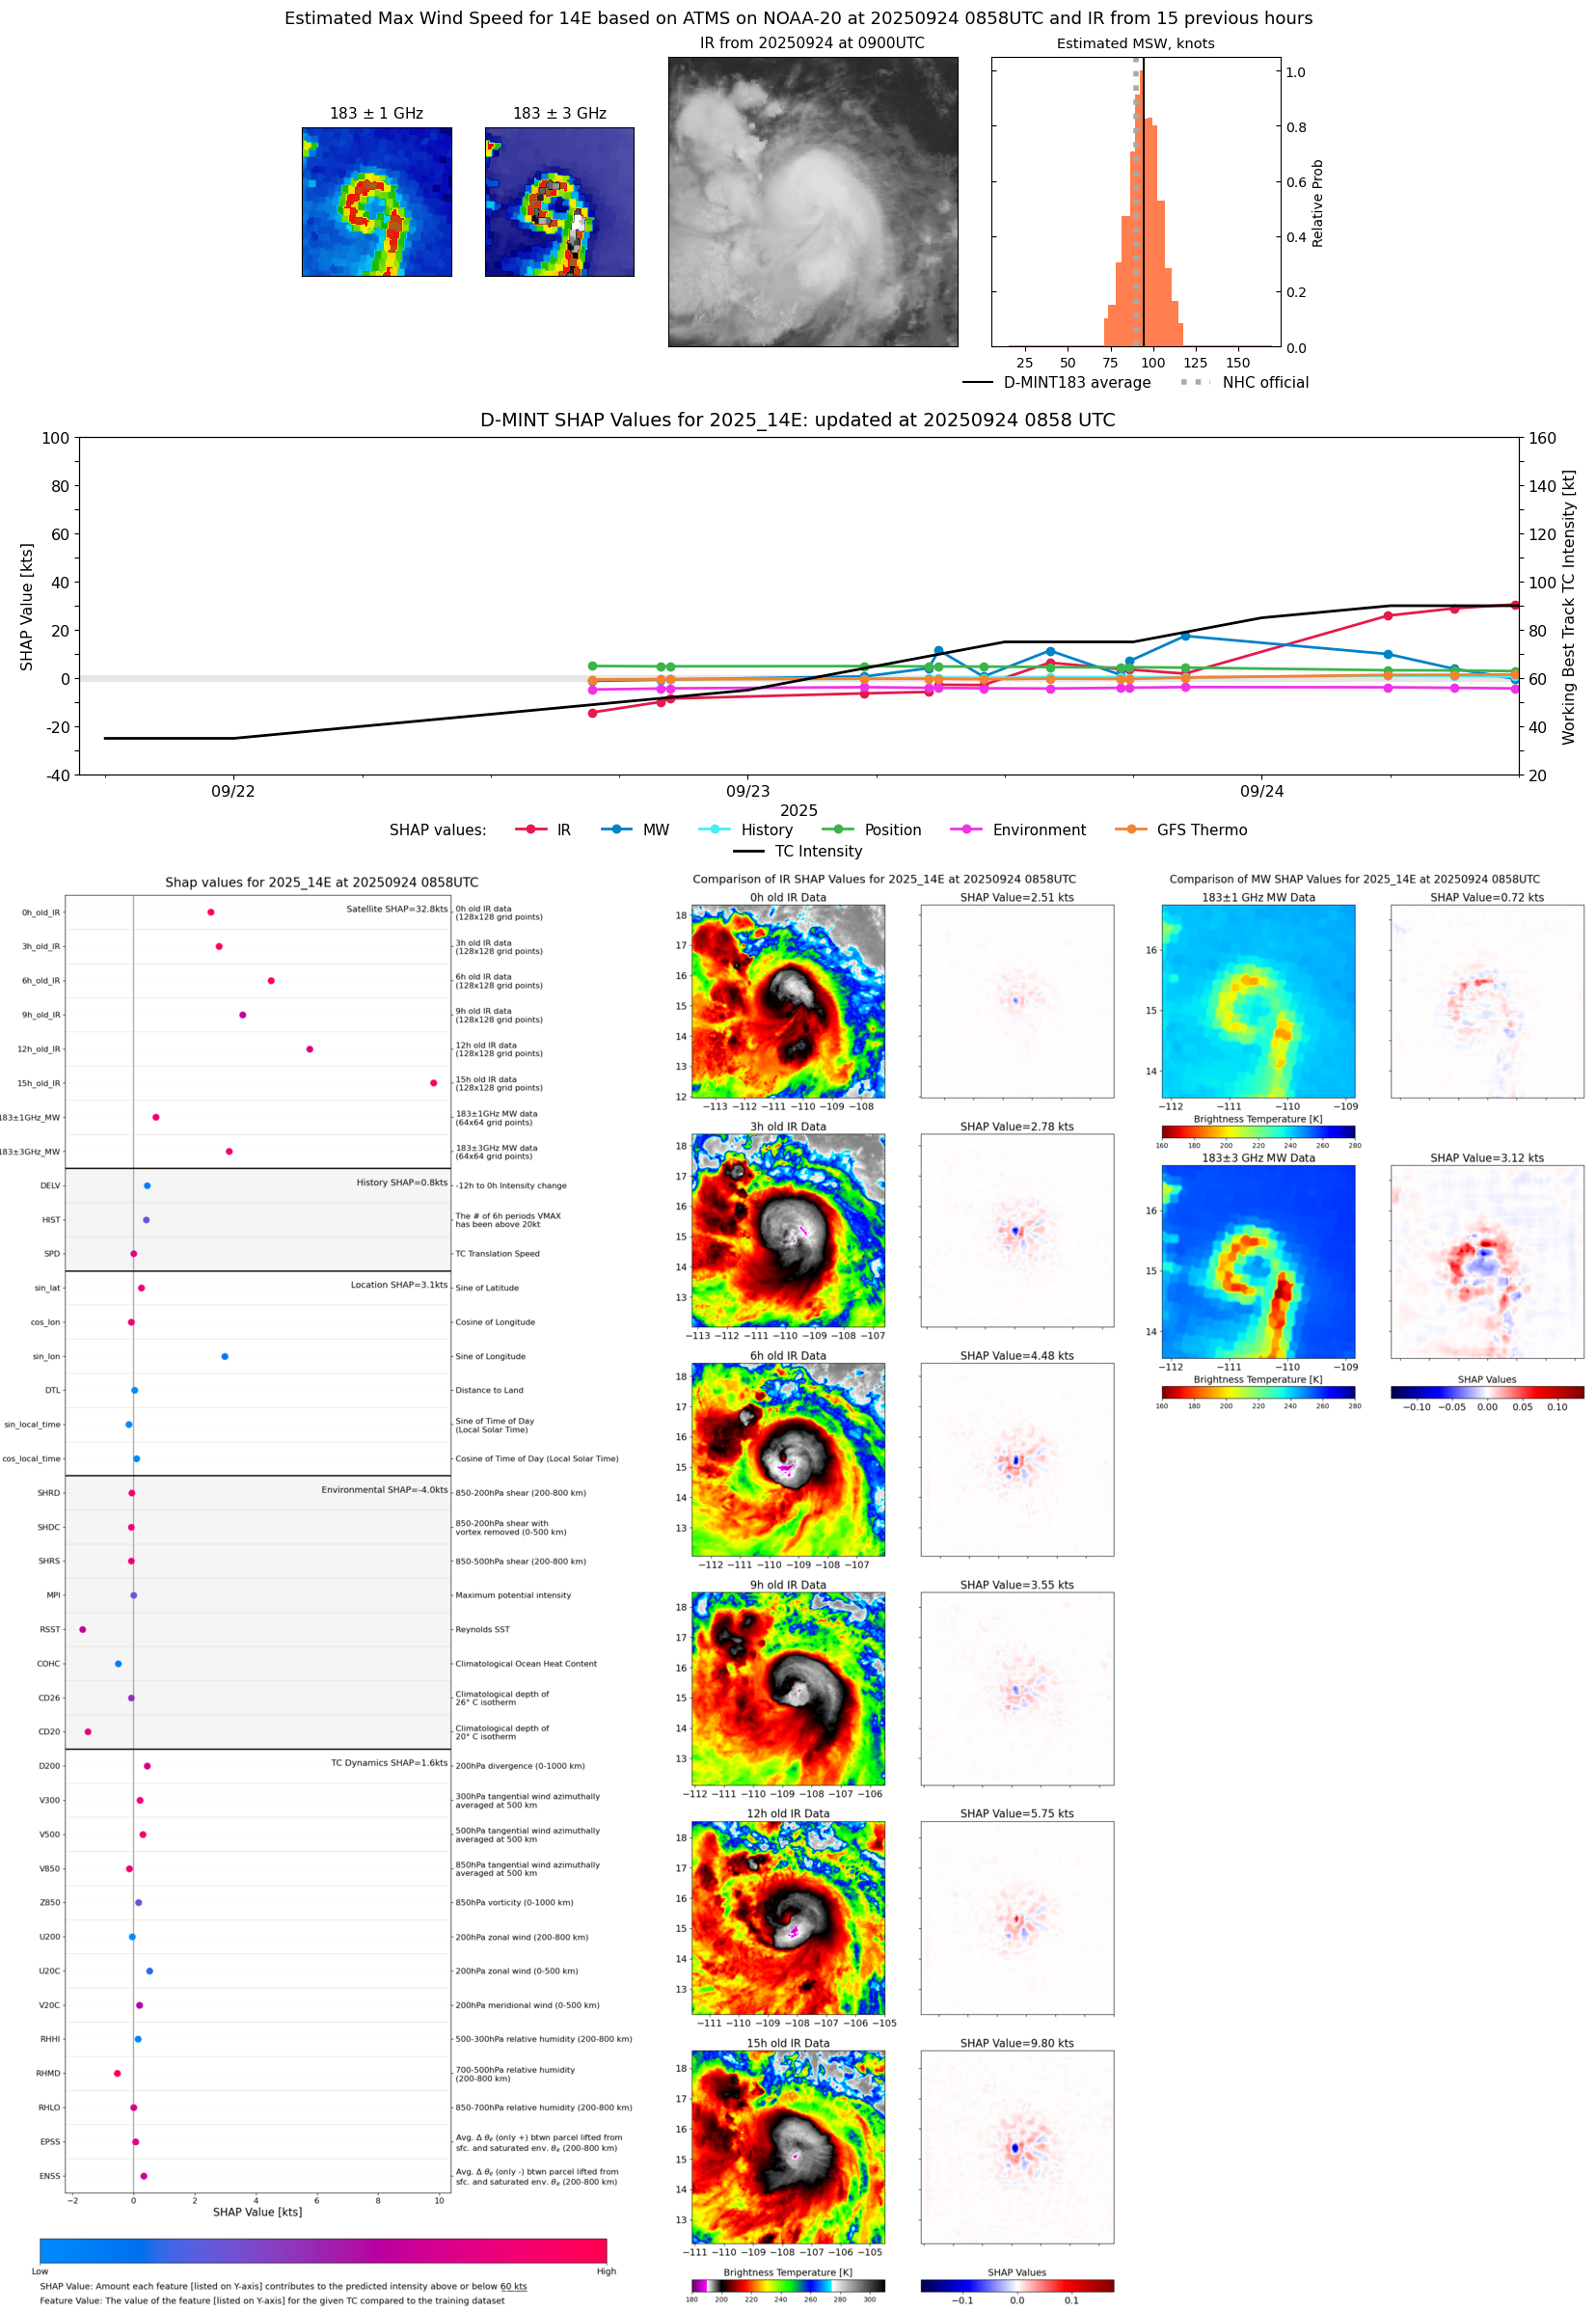 |
| 20250924 | 0553 UTC | TMS05 | 962 hPa | 98 kts | 91 kts | 105 kts | 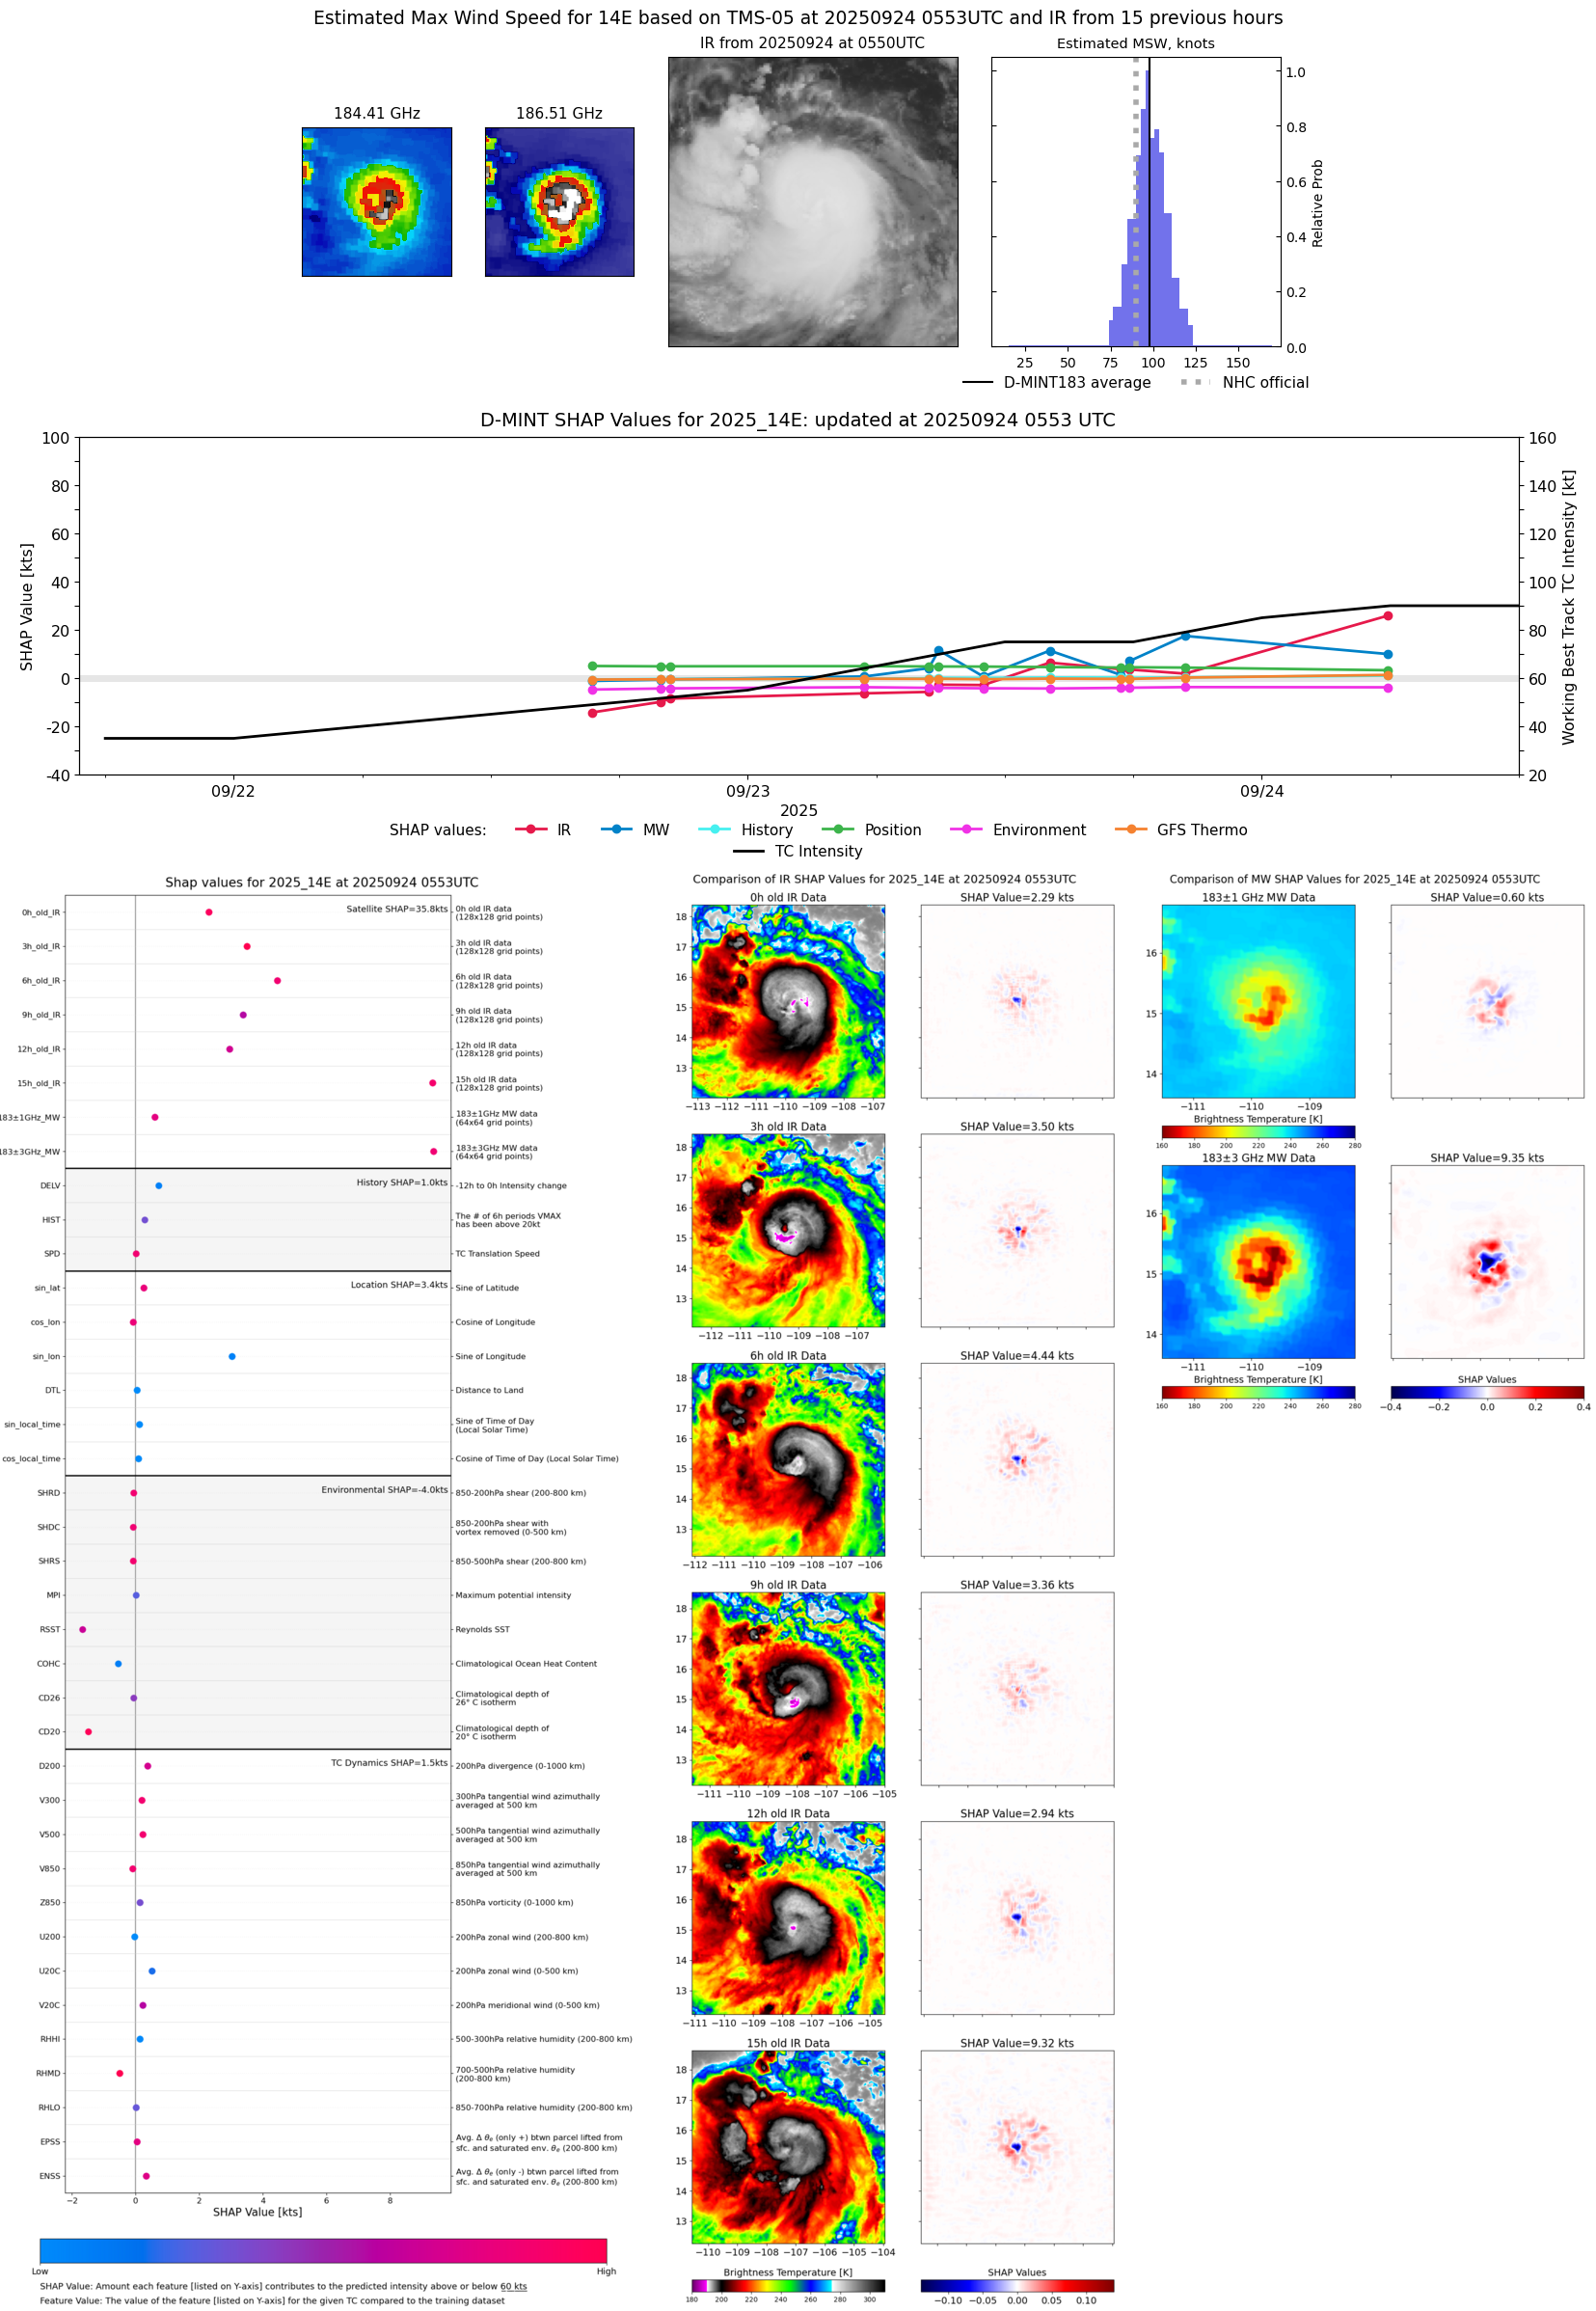 |
| 20250923 | 2248 UTC | SSMISF18 | 972 hPa | 82 kts | 75 kts | 90 kts |  |
| 20250923 | 2037 UTC | AMSR2 | 978 hPa | 81 kts | 74 kts | 89 kts | 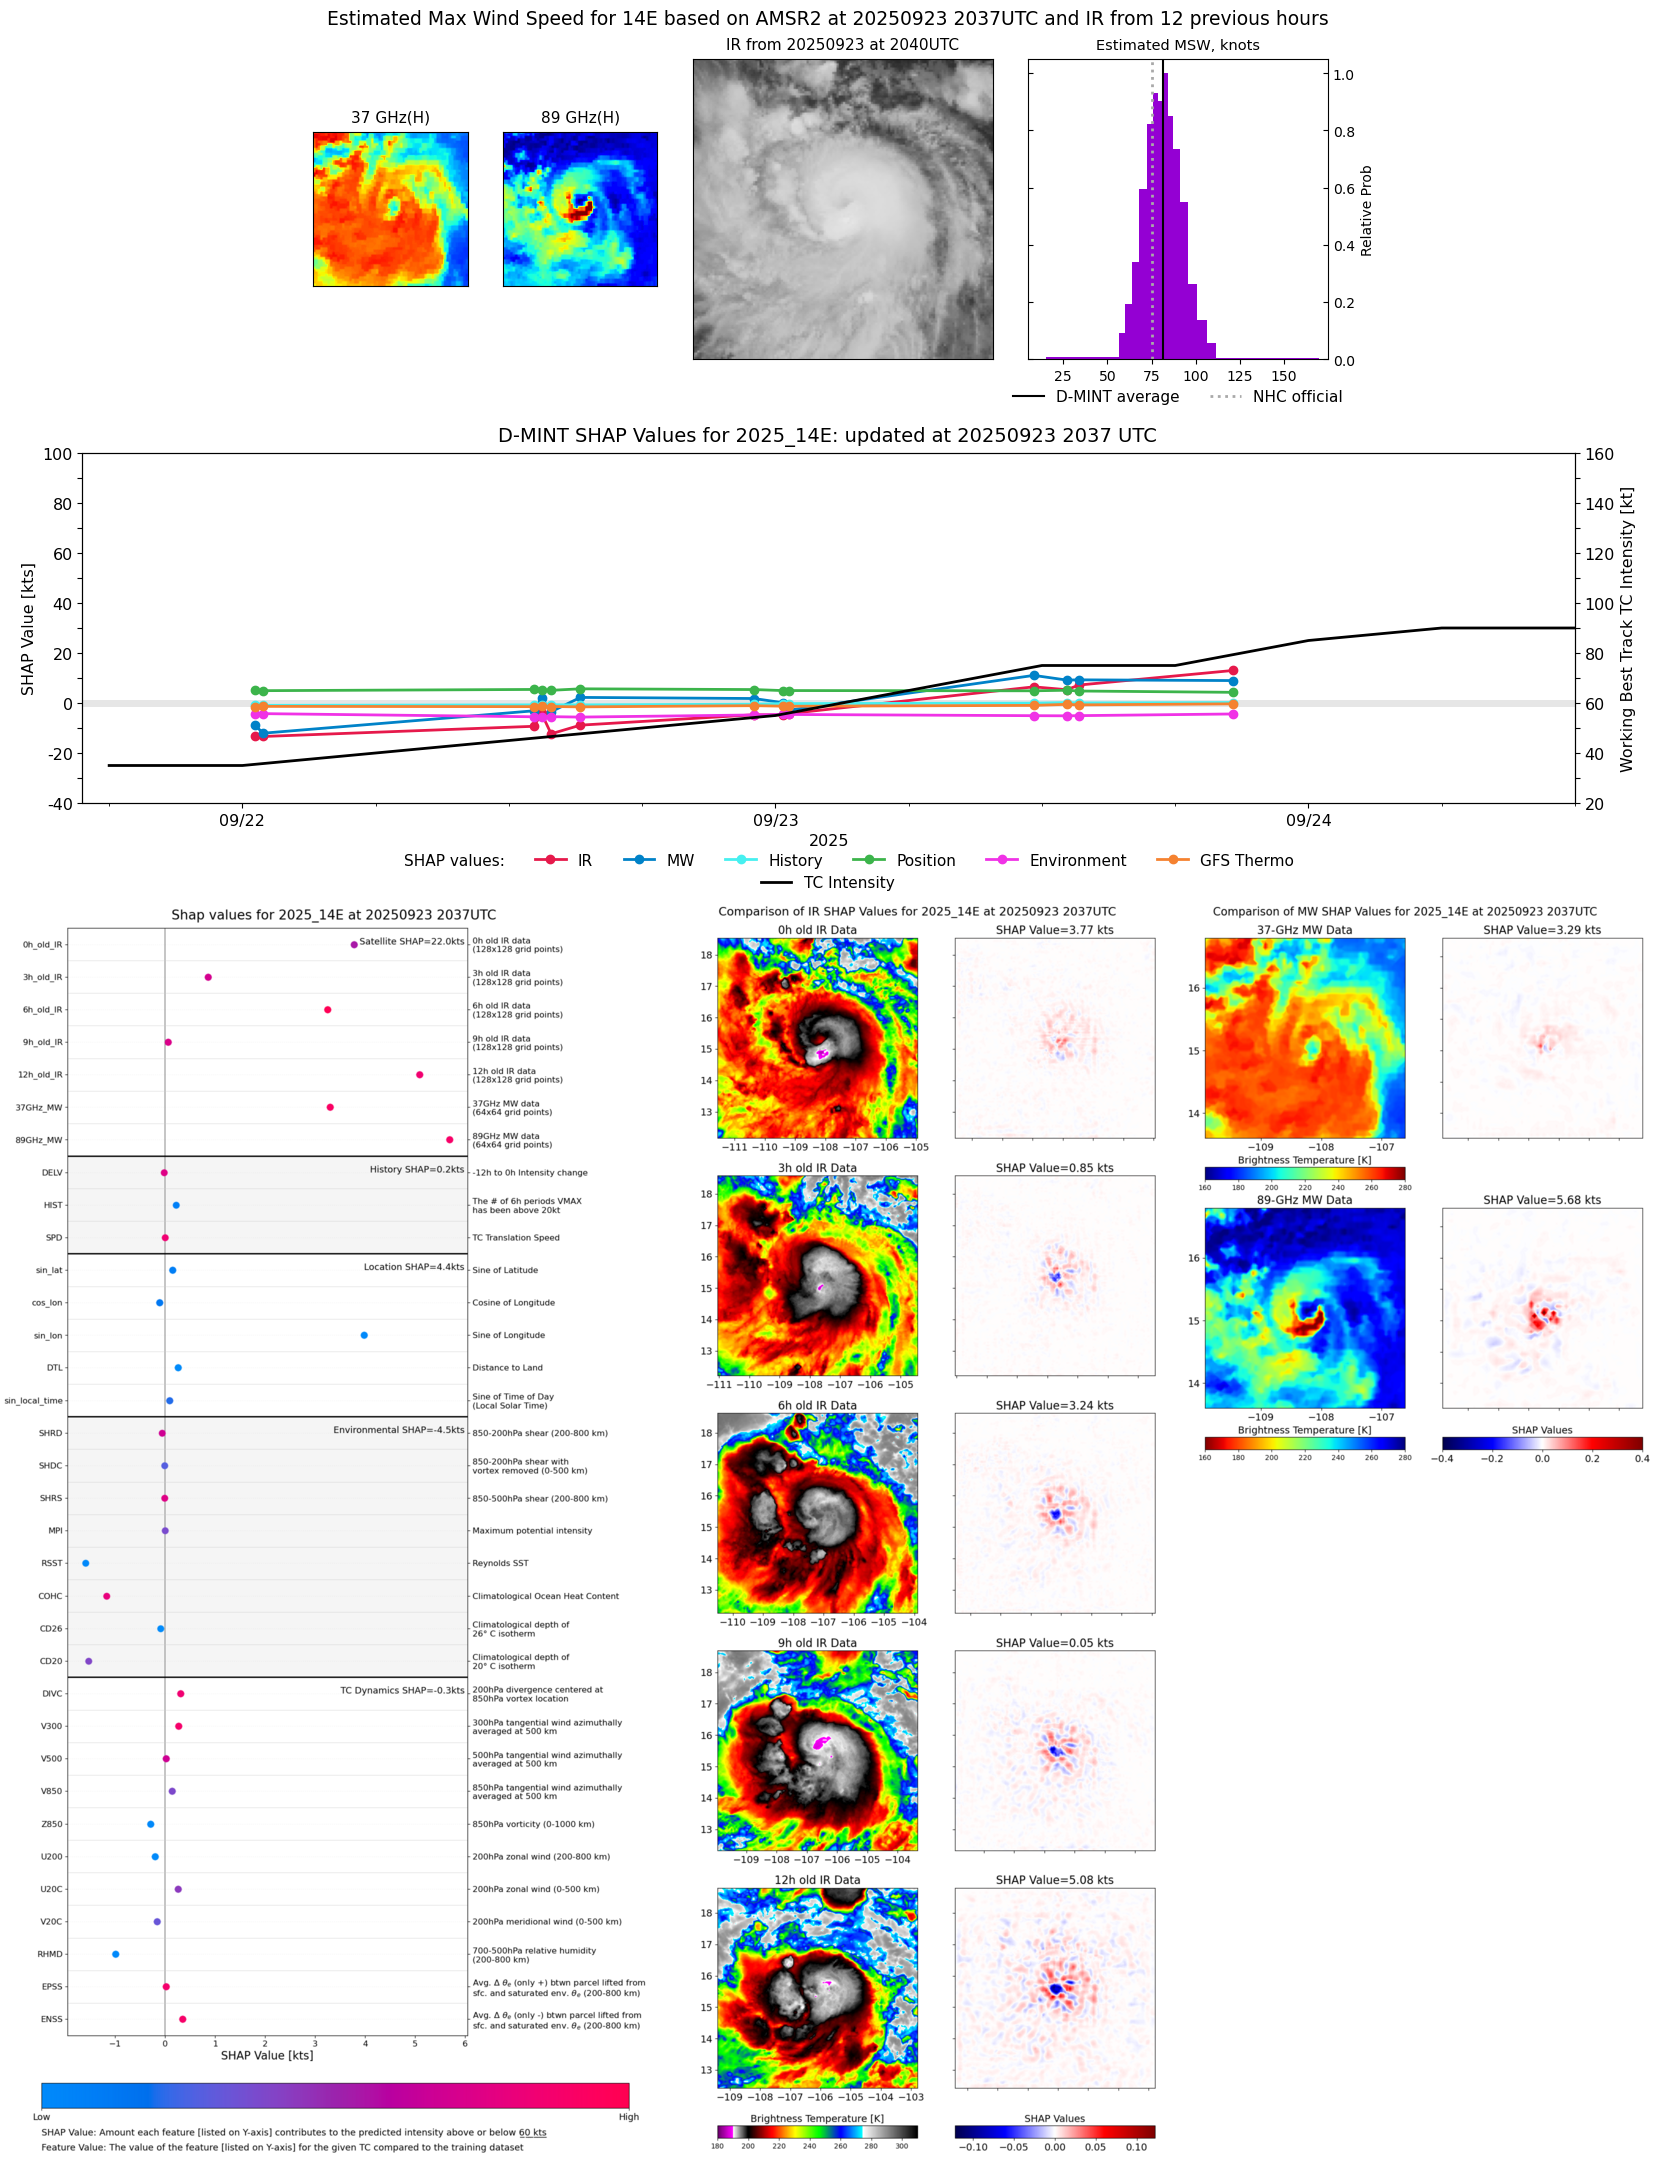 |
| 20250923 | 2025 UTC | ATMS-N20 | 973 hPa | 81 kts | 74 kts | 88 kts | 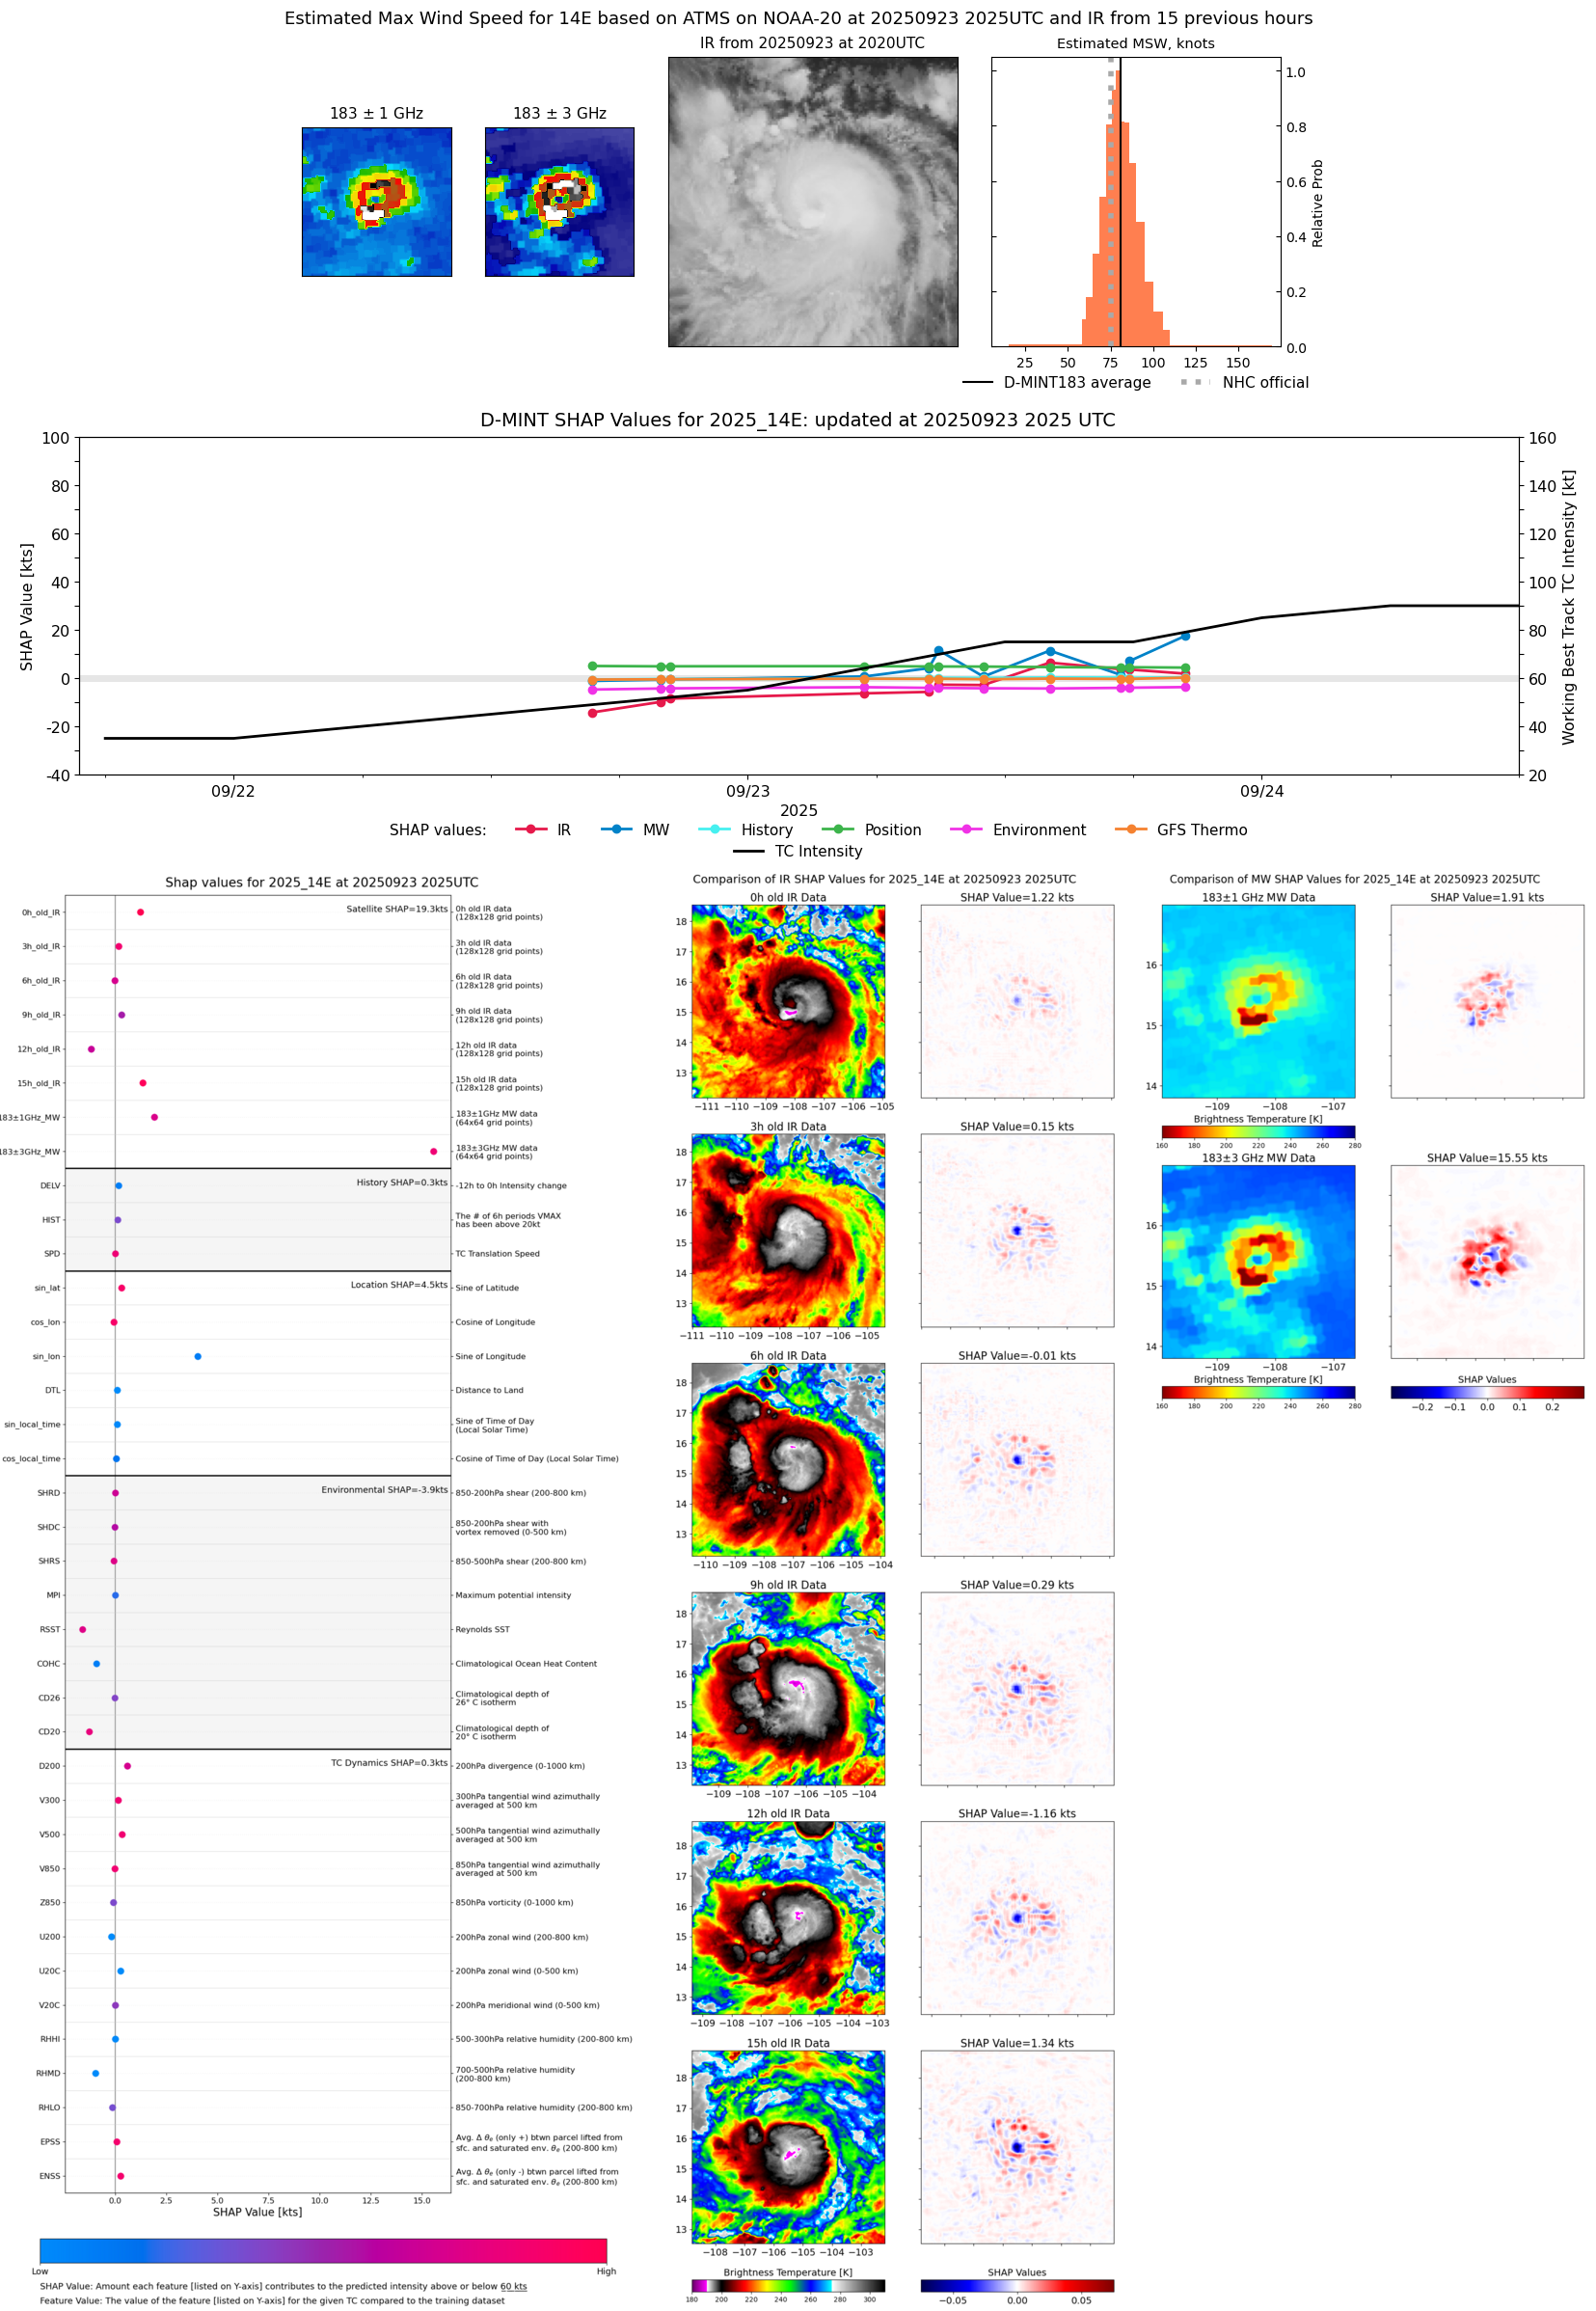 |
| 20250923 | 1749 UTC | AWS | 978 hPa | 71 kts | 64 kts | 78 kts | 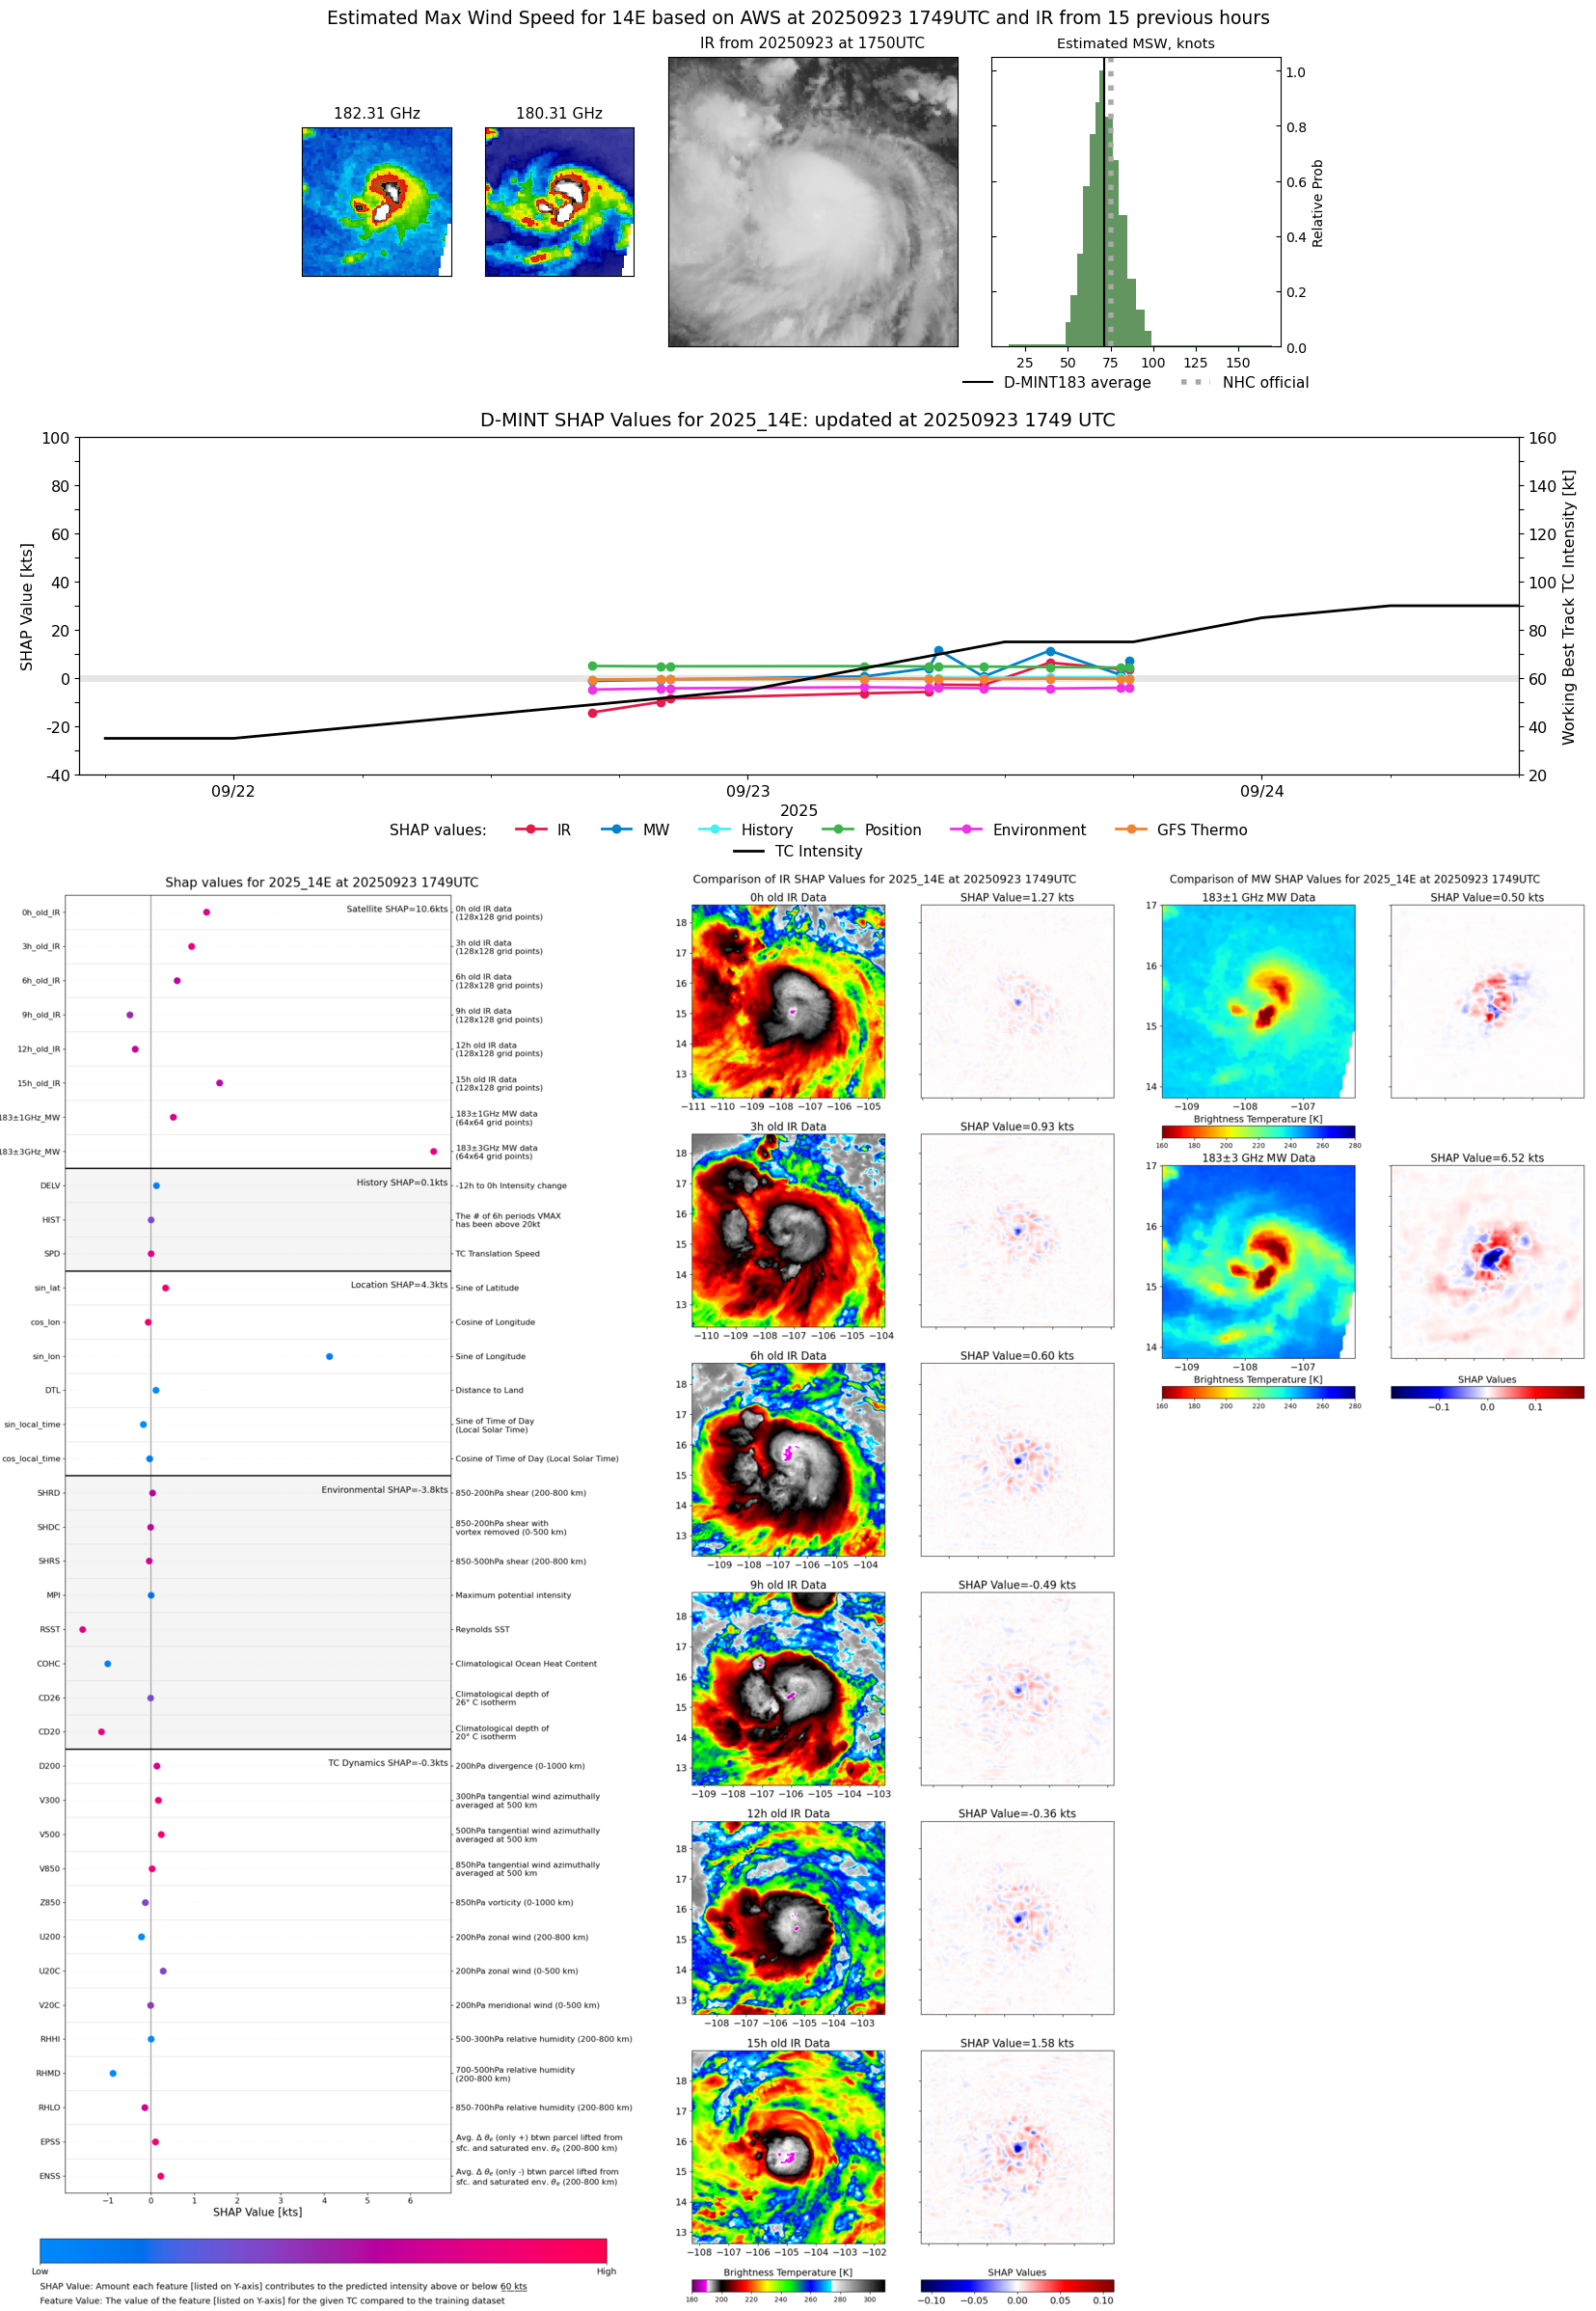 |
| 20250923 | 1725 UTC | TMS06 | 983 hPa | 66 kts | 59 kts | 72 kts | 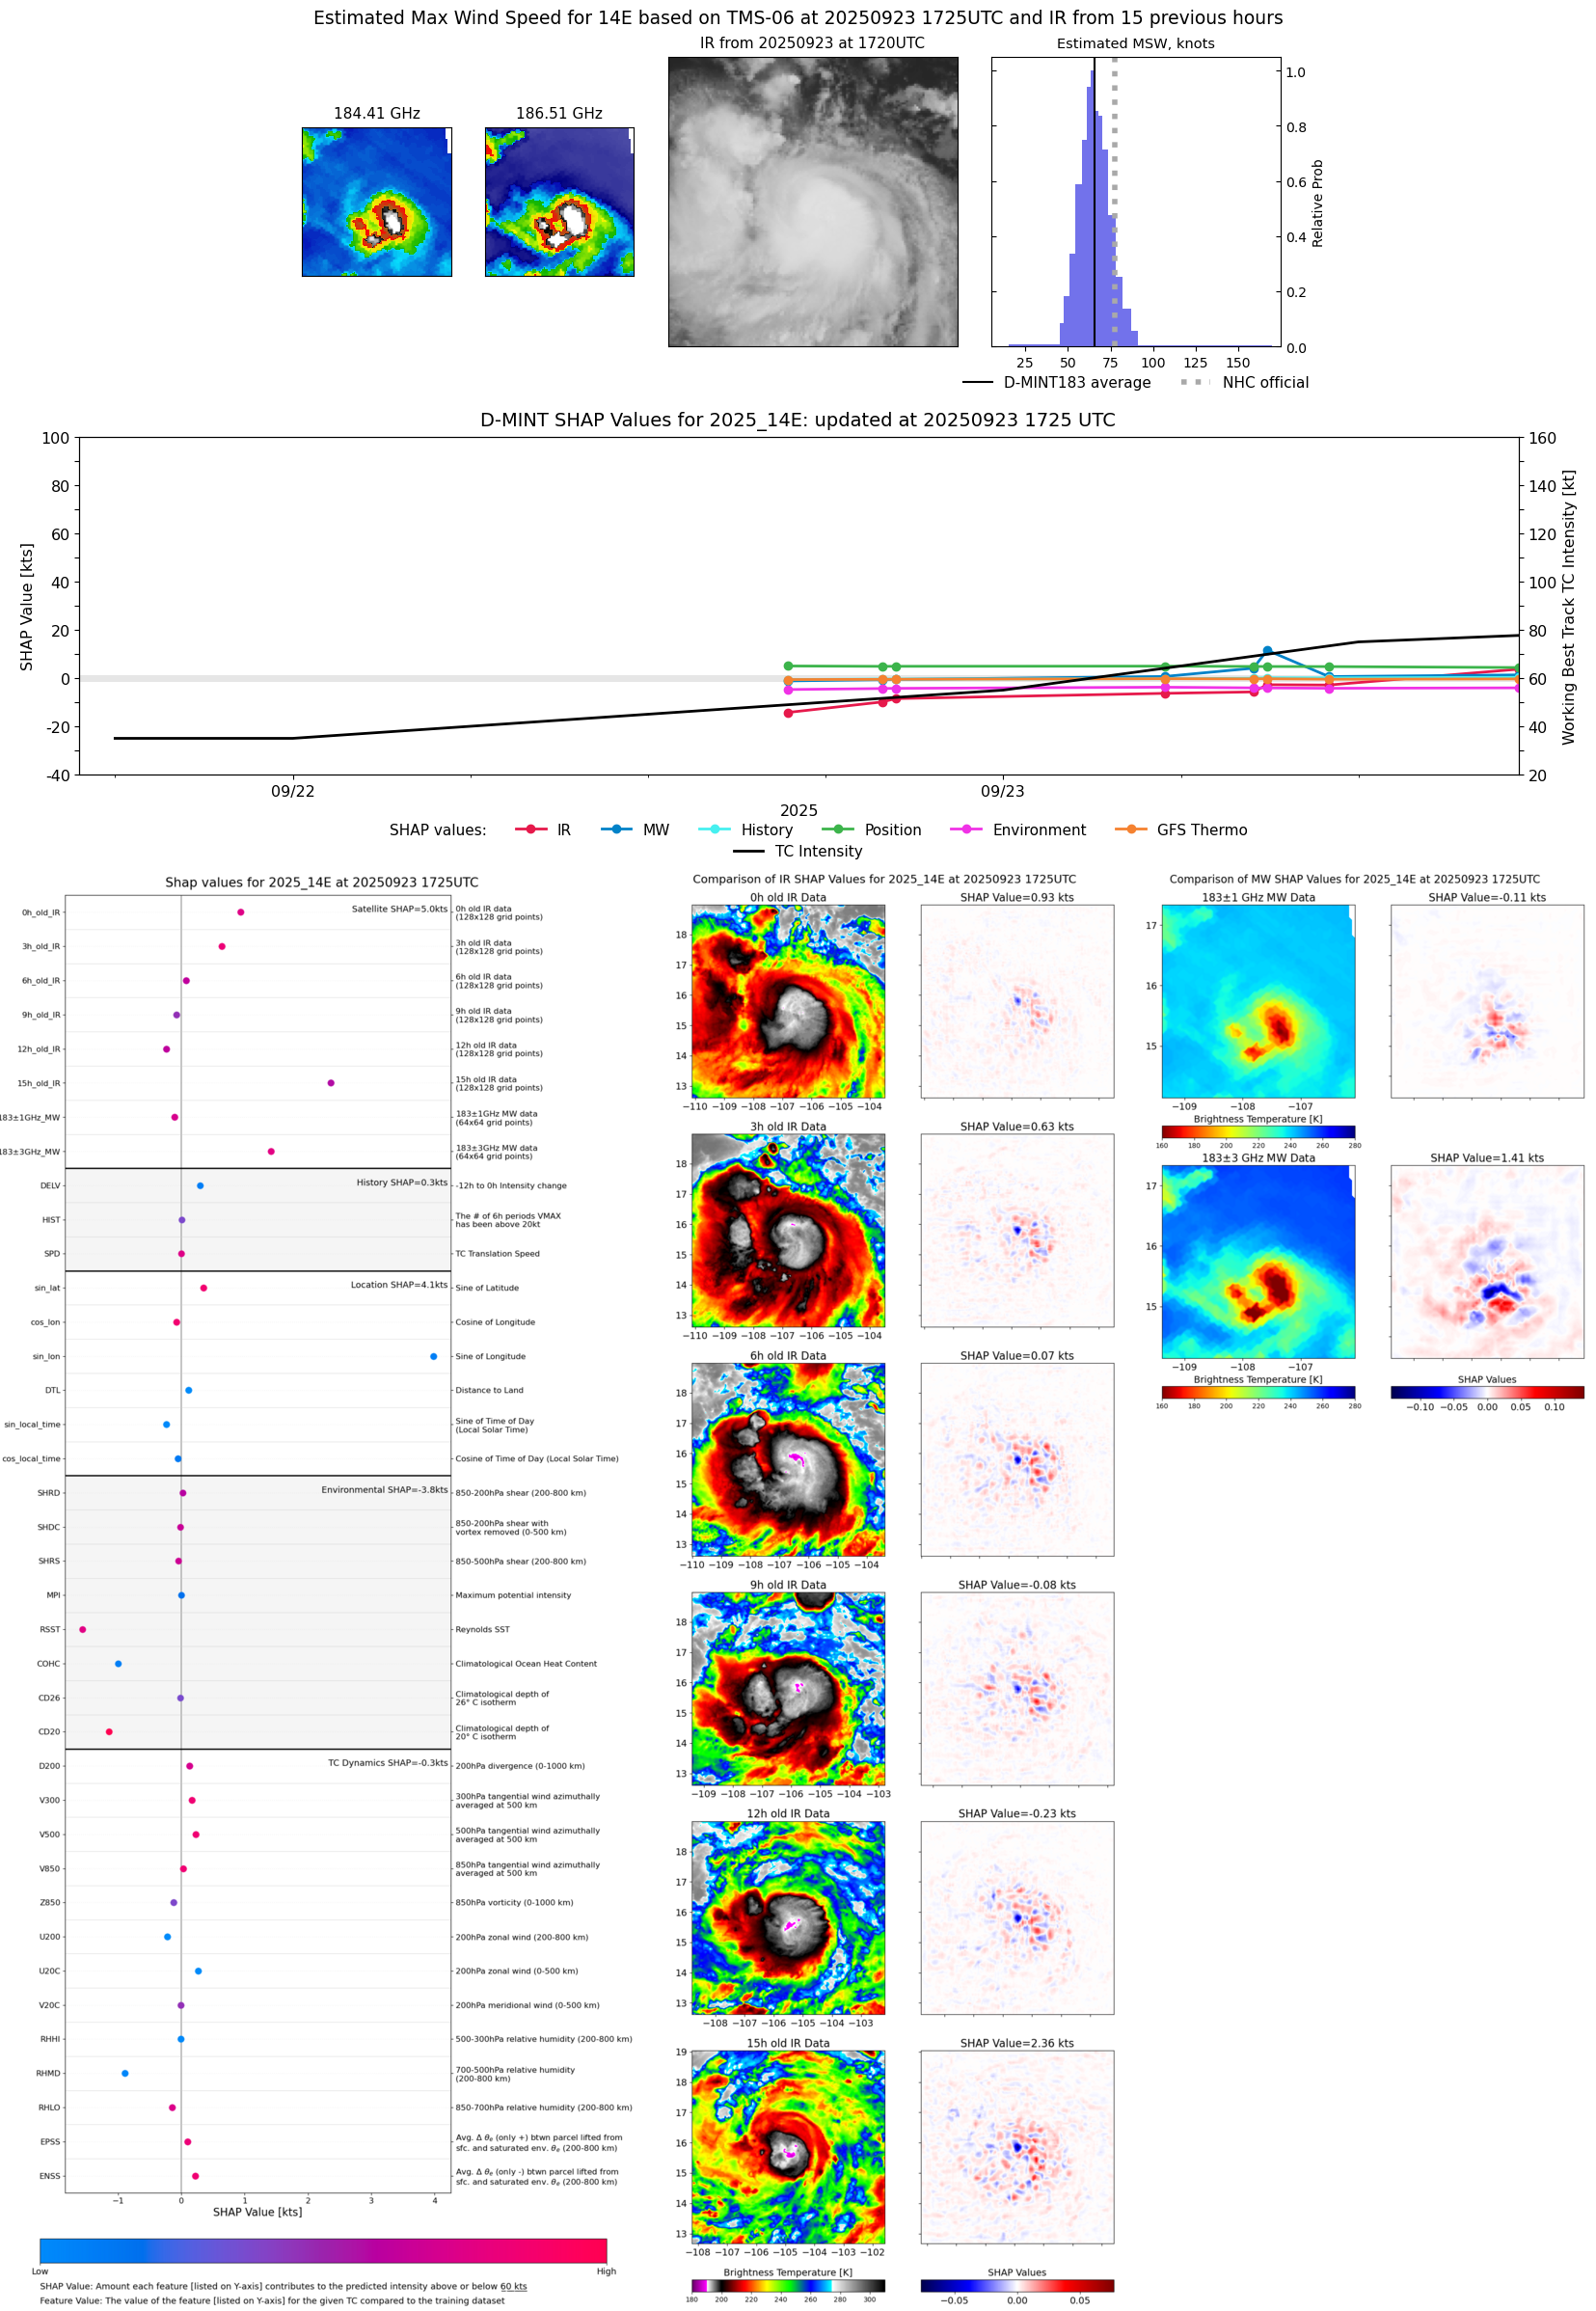 |
| 20250923 | 1406 UTC | TROPICS03 | 977 hPa | 78 kts | 71 kts | 86 kts | 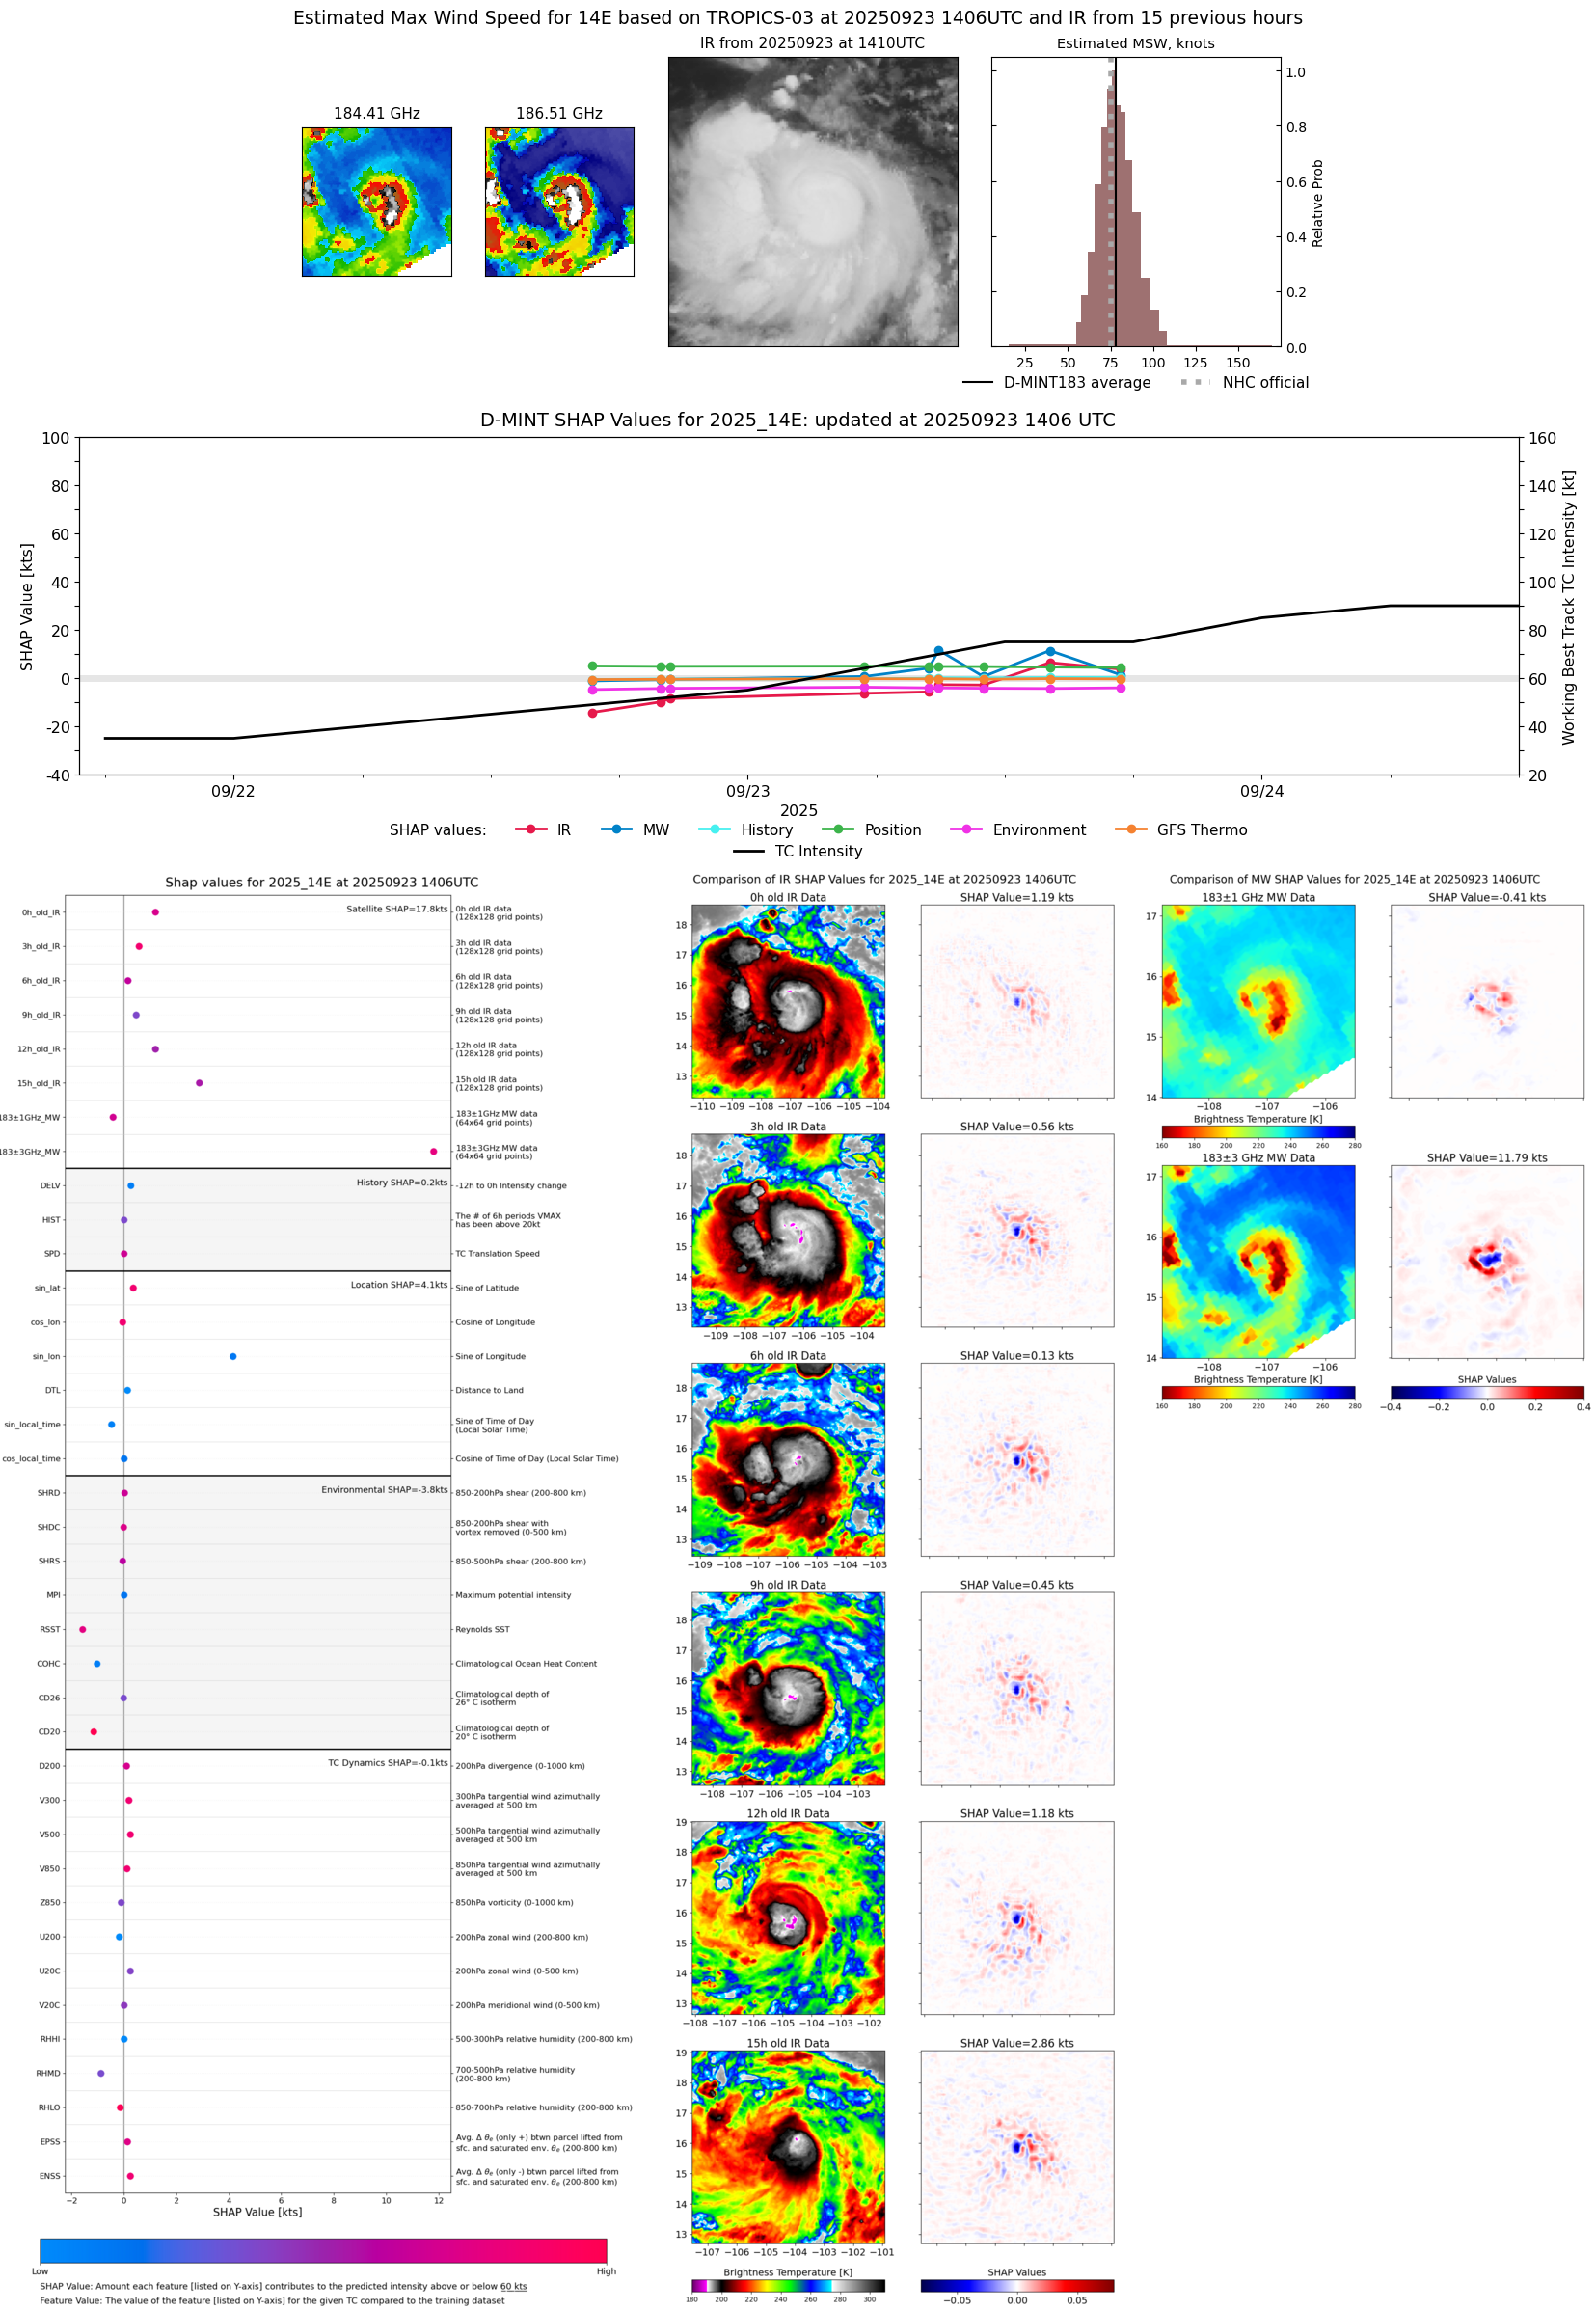 |
| 20250923 | 1340 UTC | SSMISF16 | 984 hPa | 75 kts | 68 kts | 83 kts |  |
| 20250923 | 1307 UTC | WSFM01 | 983 hPa | 74 kts | 67 kts | 82 kts | 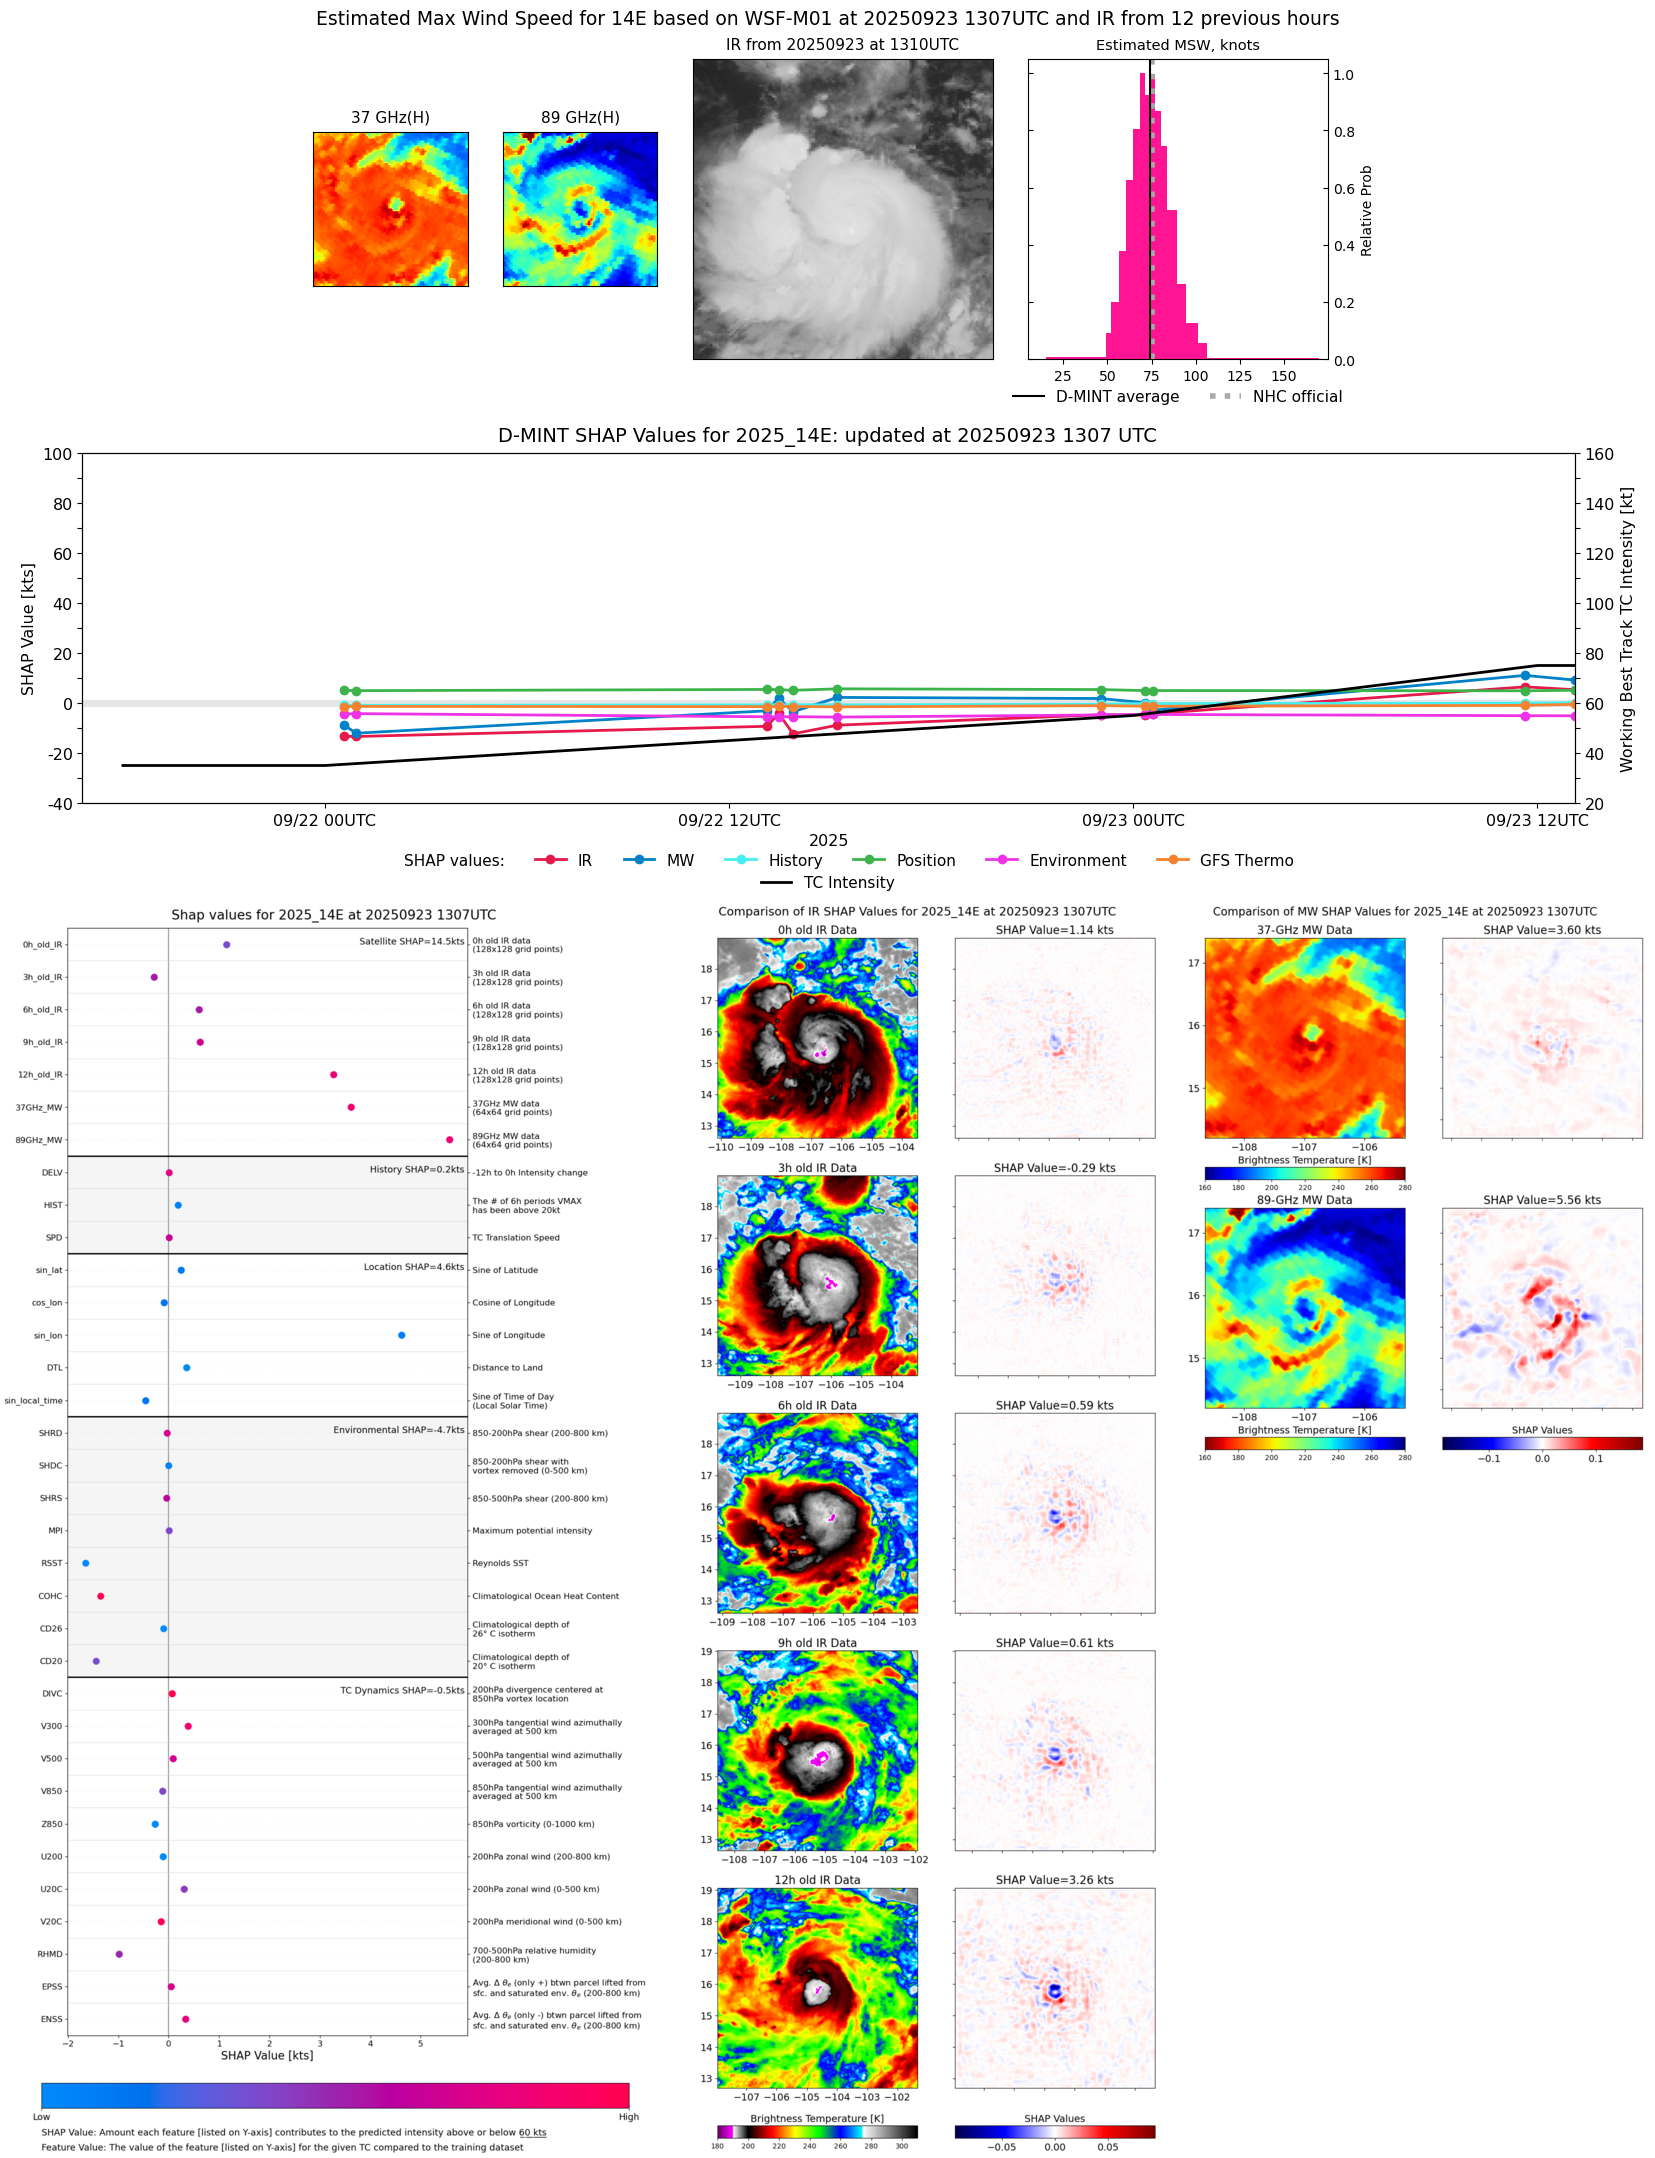 |
| 20250923 | 1255 UTC | SSMISF17 | 983 hPa | 76 kts | 68 kts | 84 kts |  |
| 20250923 | 1138 UTC | SSMISF18 | 979 hPa | 76 kts | 69 kts | 84 kts | 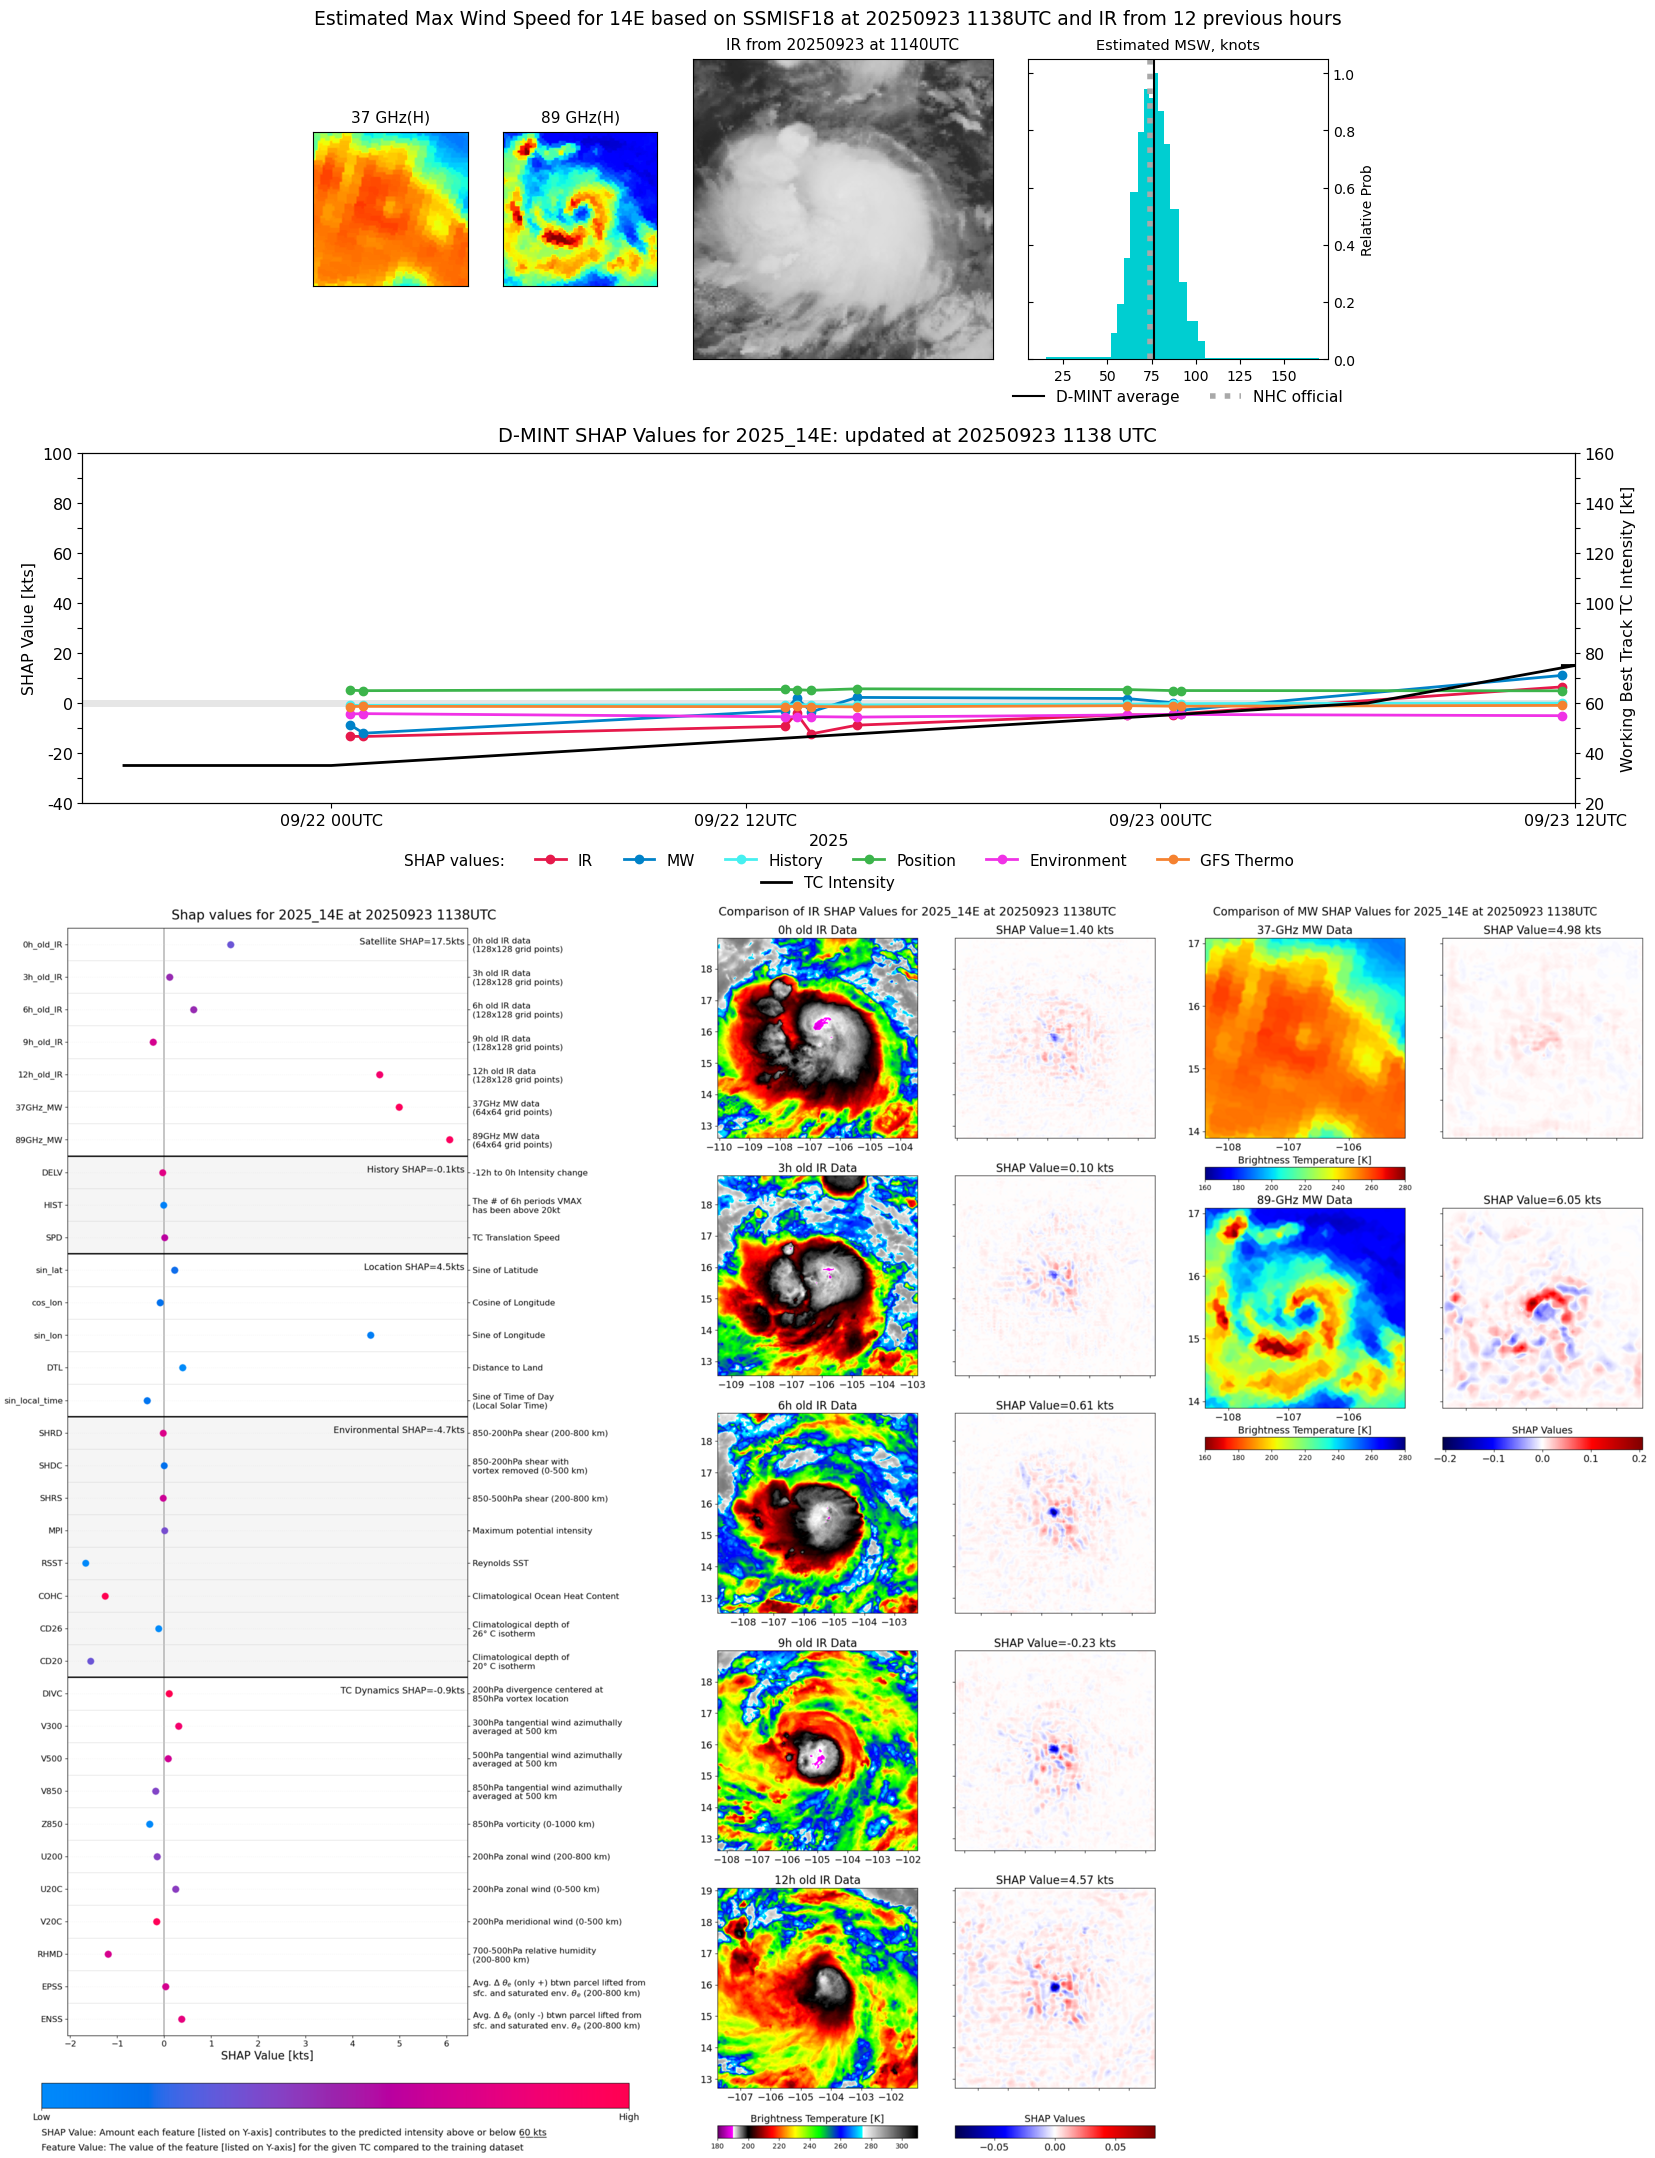 |
| 20250923 | 1100 UTC | TROPICS05 | 988 hPa | 58 kts | 52 kts | 65 kts | 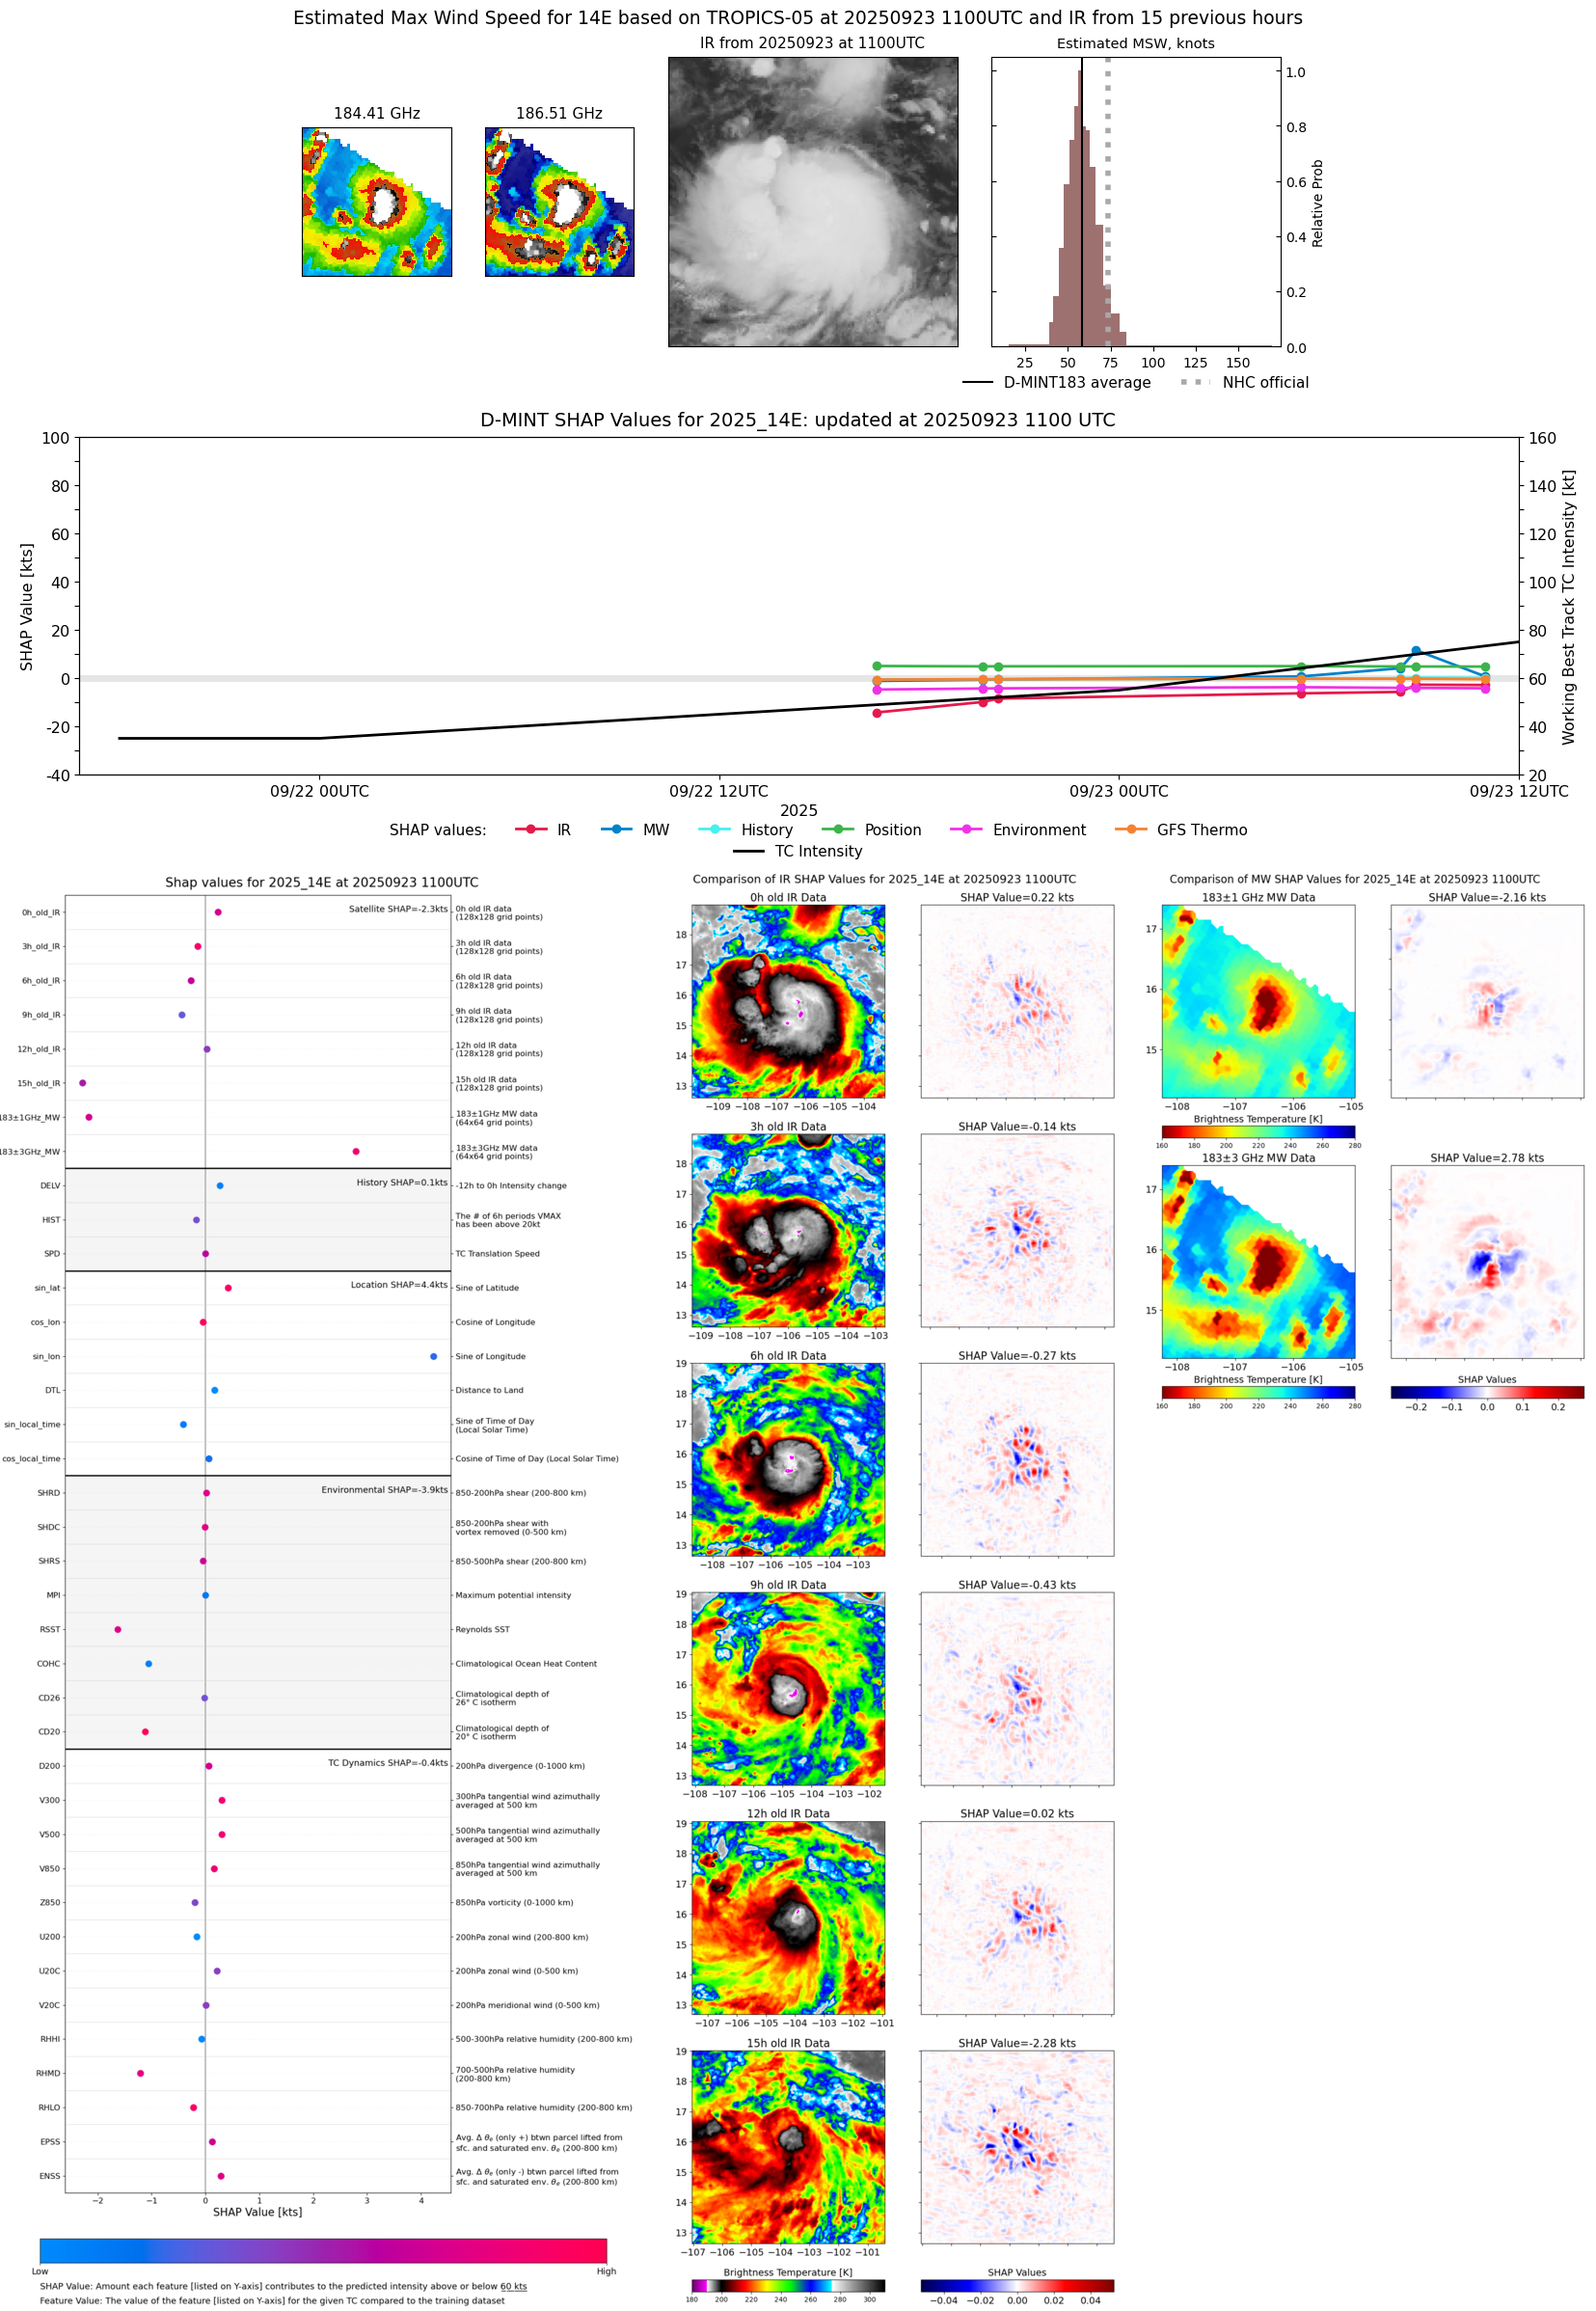 |
| 20250923 | 0855 UTC | ATMS-NPP | 988 hPa | 70 kts | 63 kts | 76 kts |  |
| 20250923 | 0827 UTC | ATMS-N21 | 993 hPa | 59 kts | 53 kts | 65 kts | 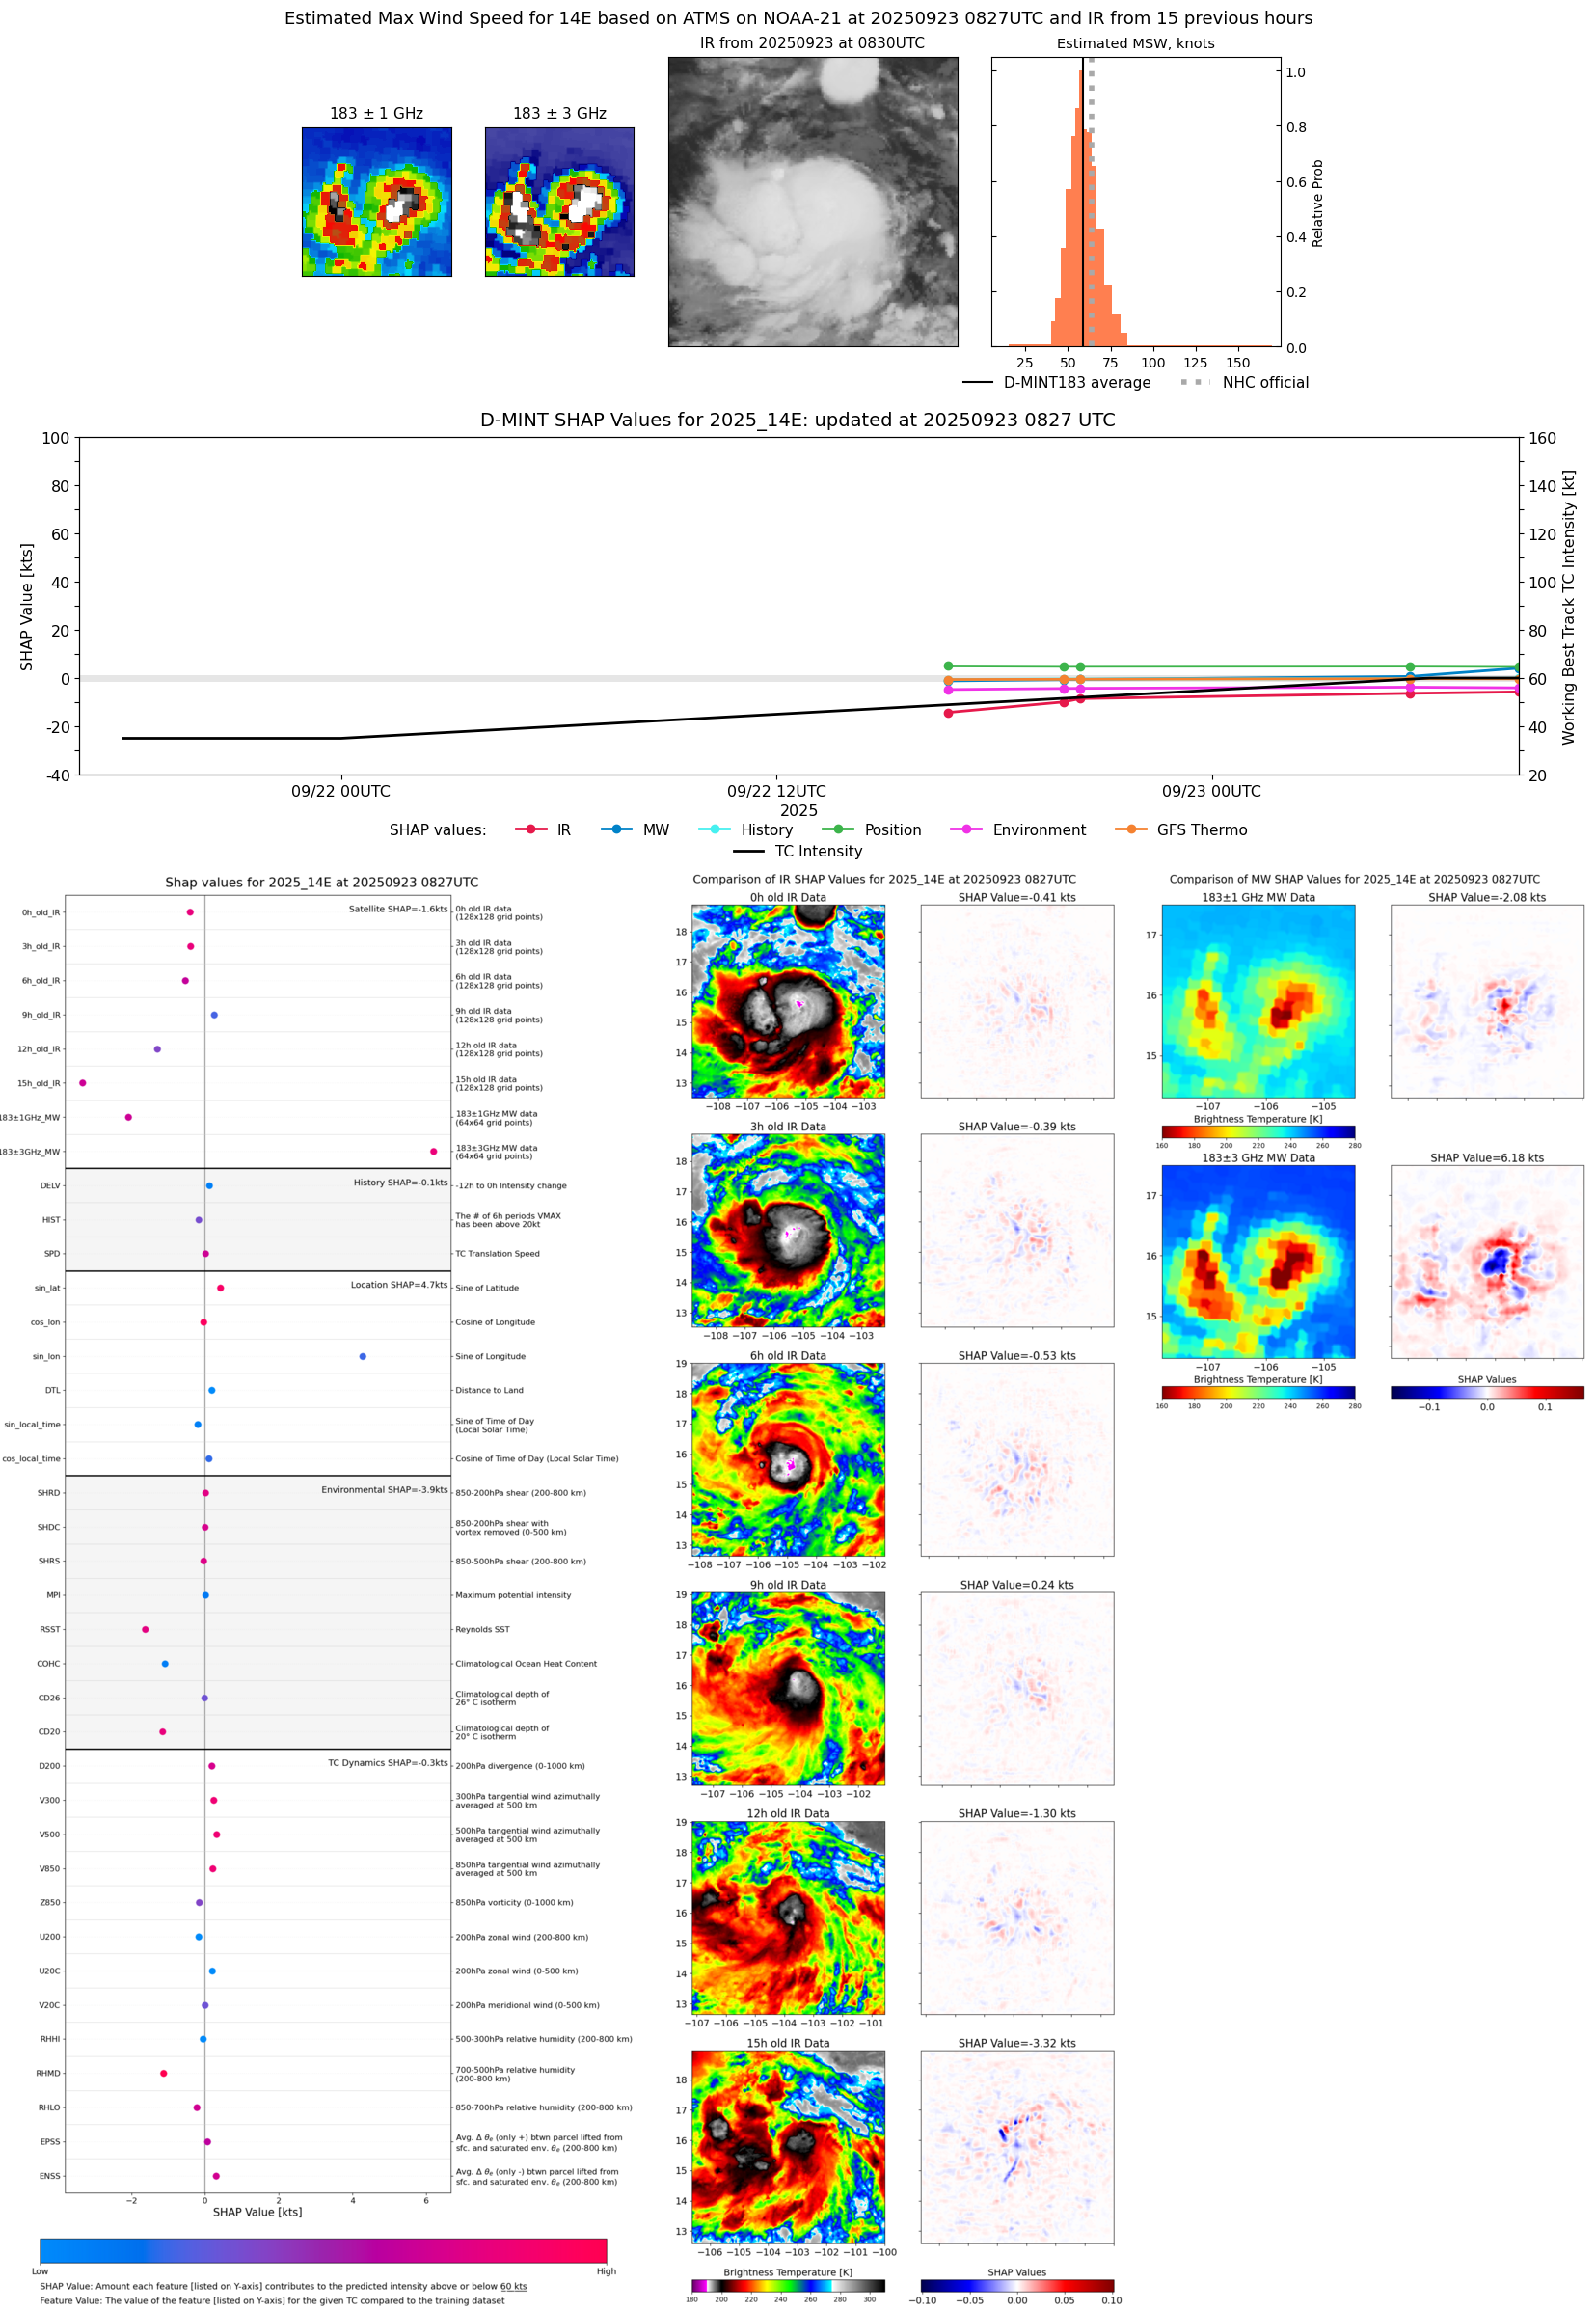 |
| 20250923 | 0527 UTC | TMS06 | 993 hPa | 55 kts | 50 kts | 61 kts | 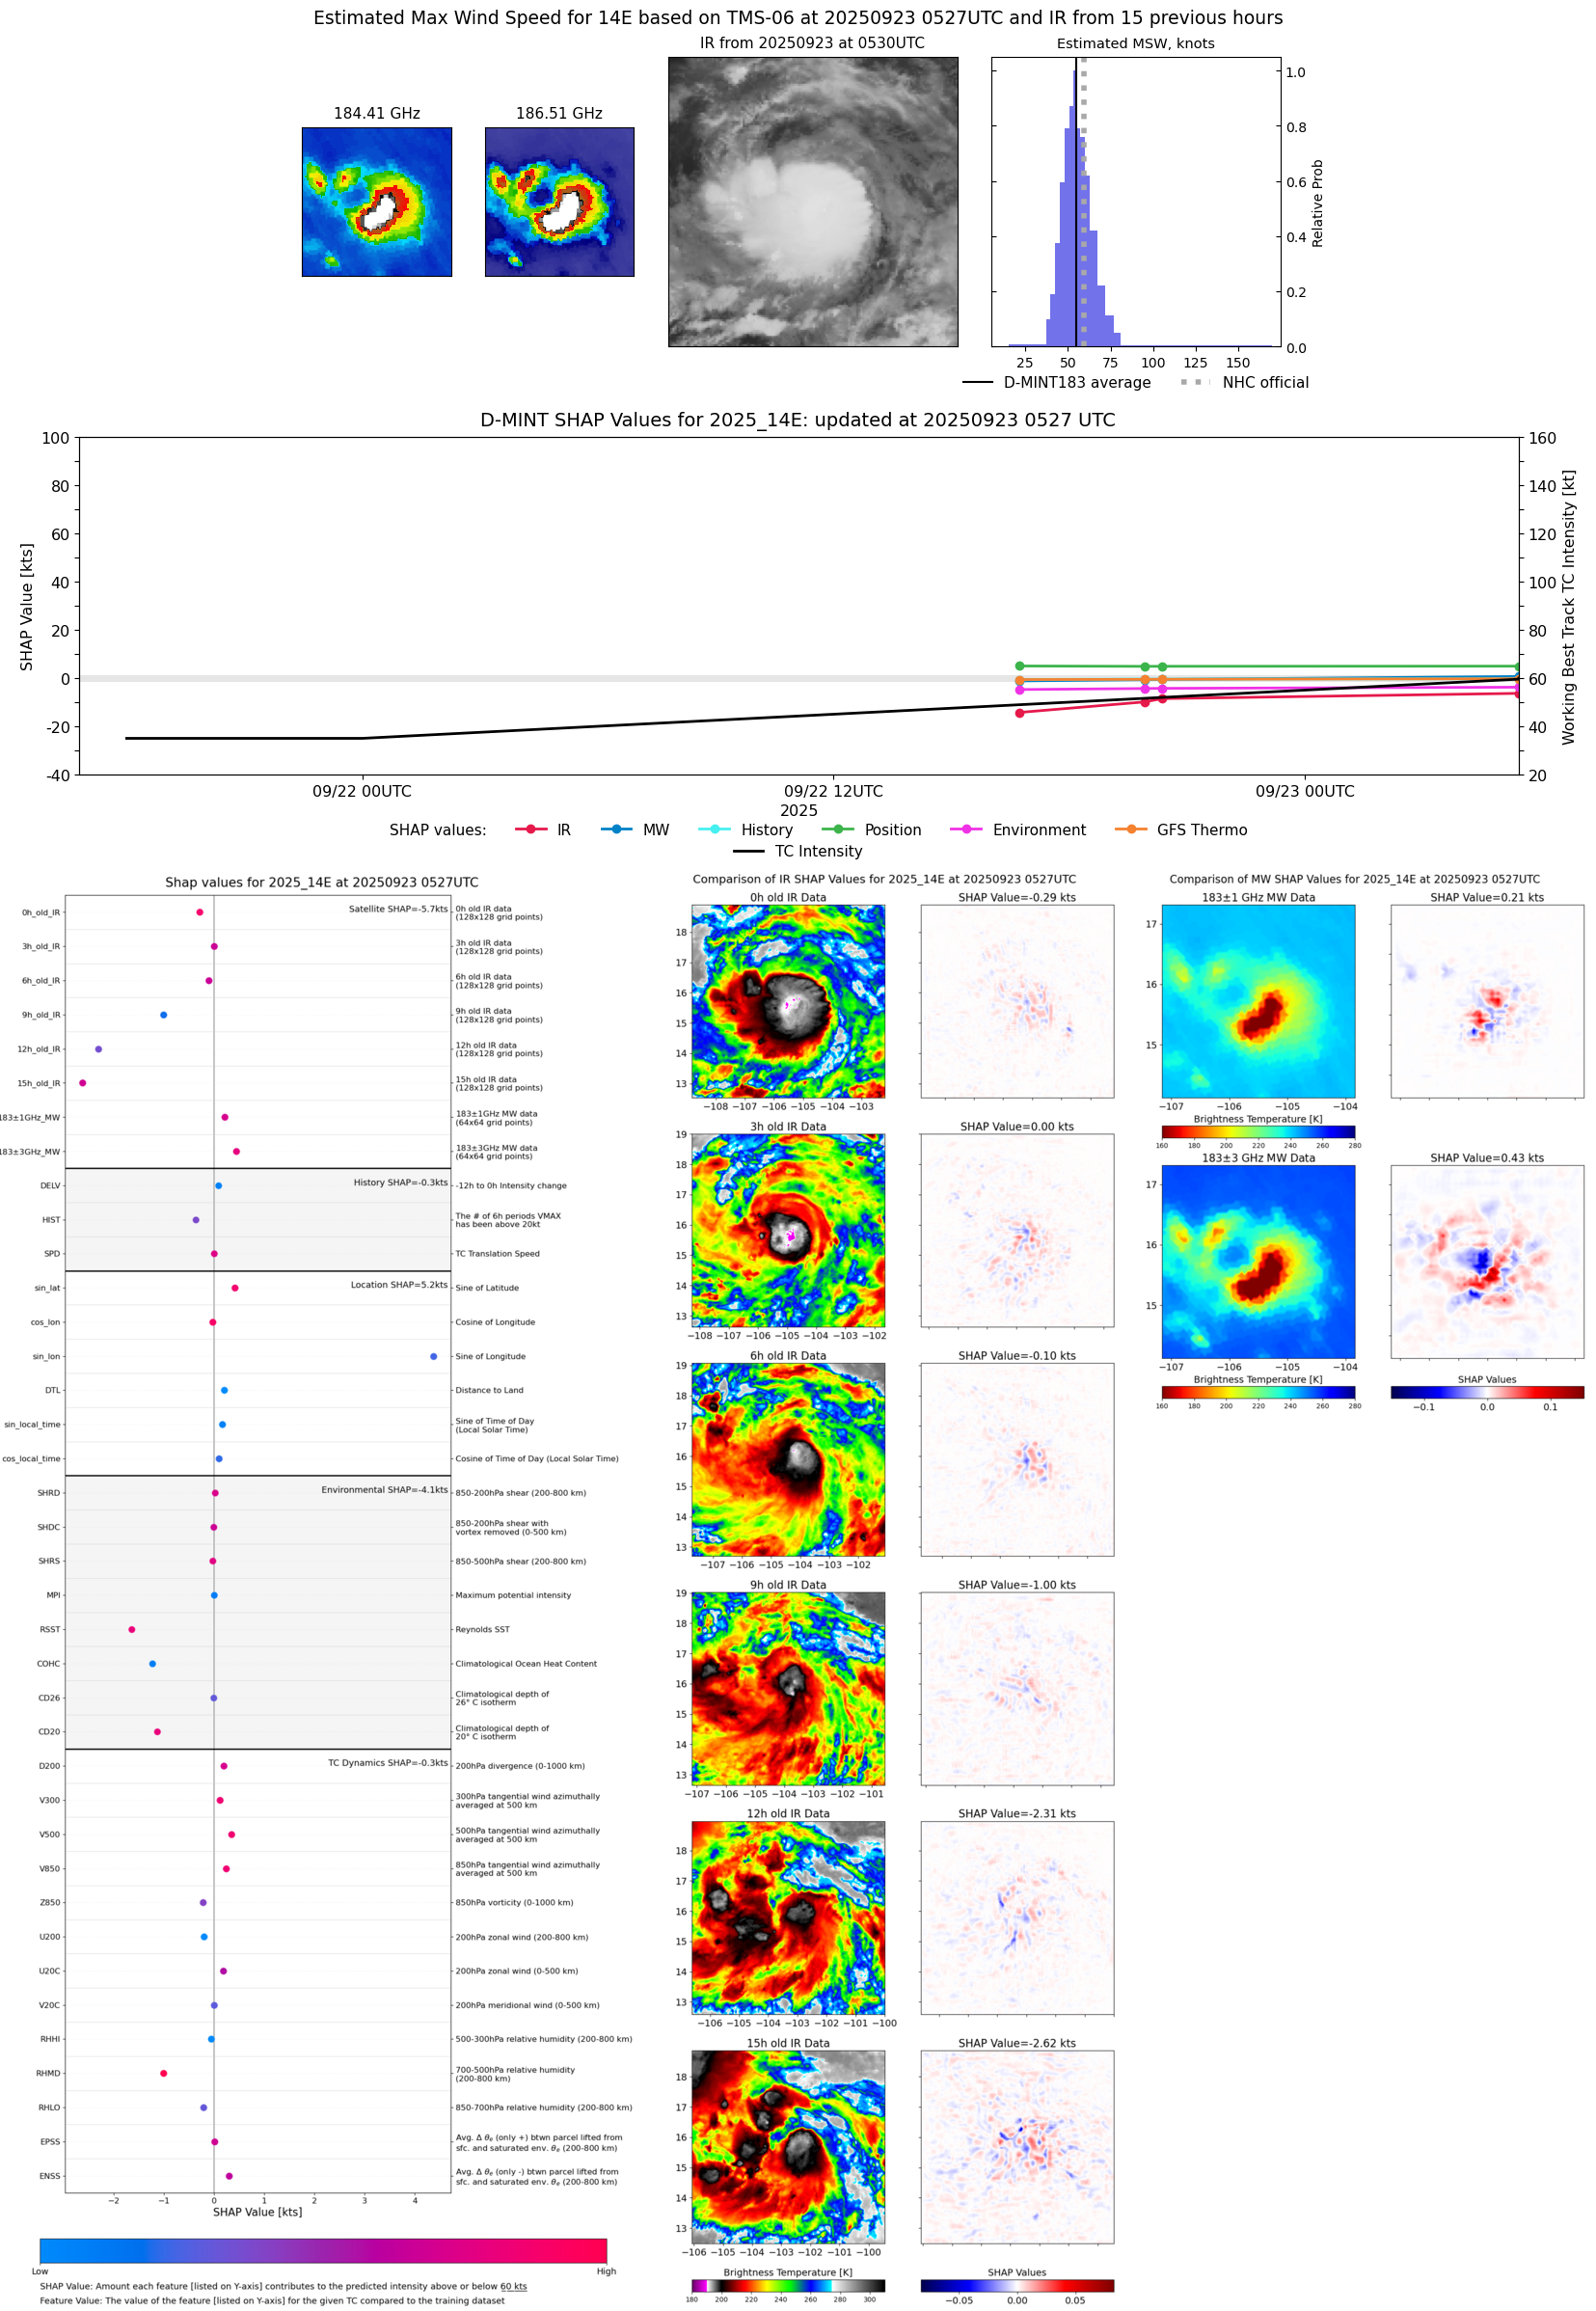 |
| 20250923 | 0036 UTC | WSFM01 | 995 hPa | 52 kts | 46 kts | 57 kts |  |
| 20250923 | 0021 UTC | SSMISF17 | 995 hPa | 54 kts | 48 kts | 60 kts | 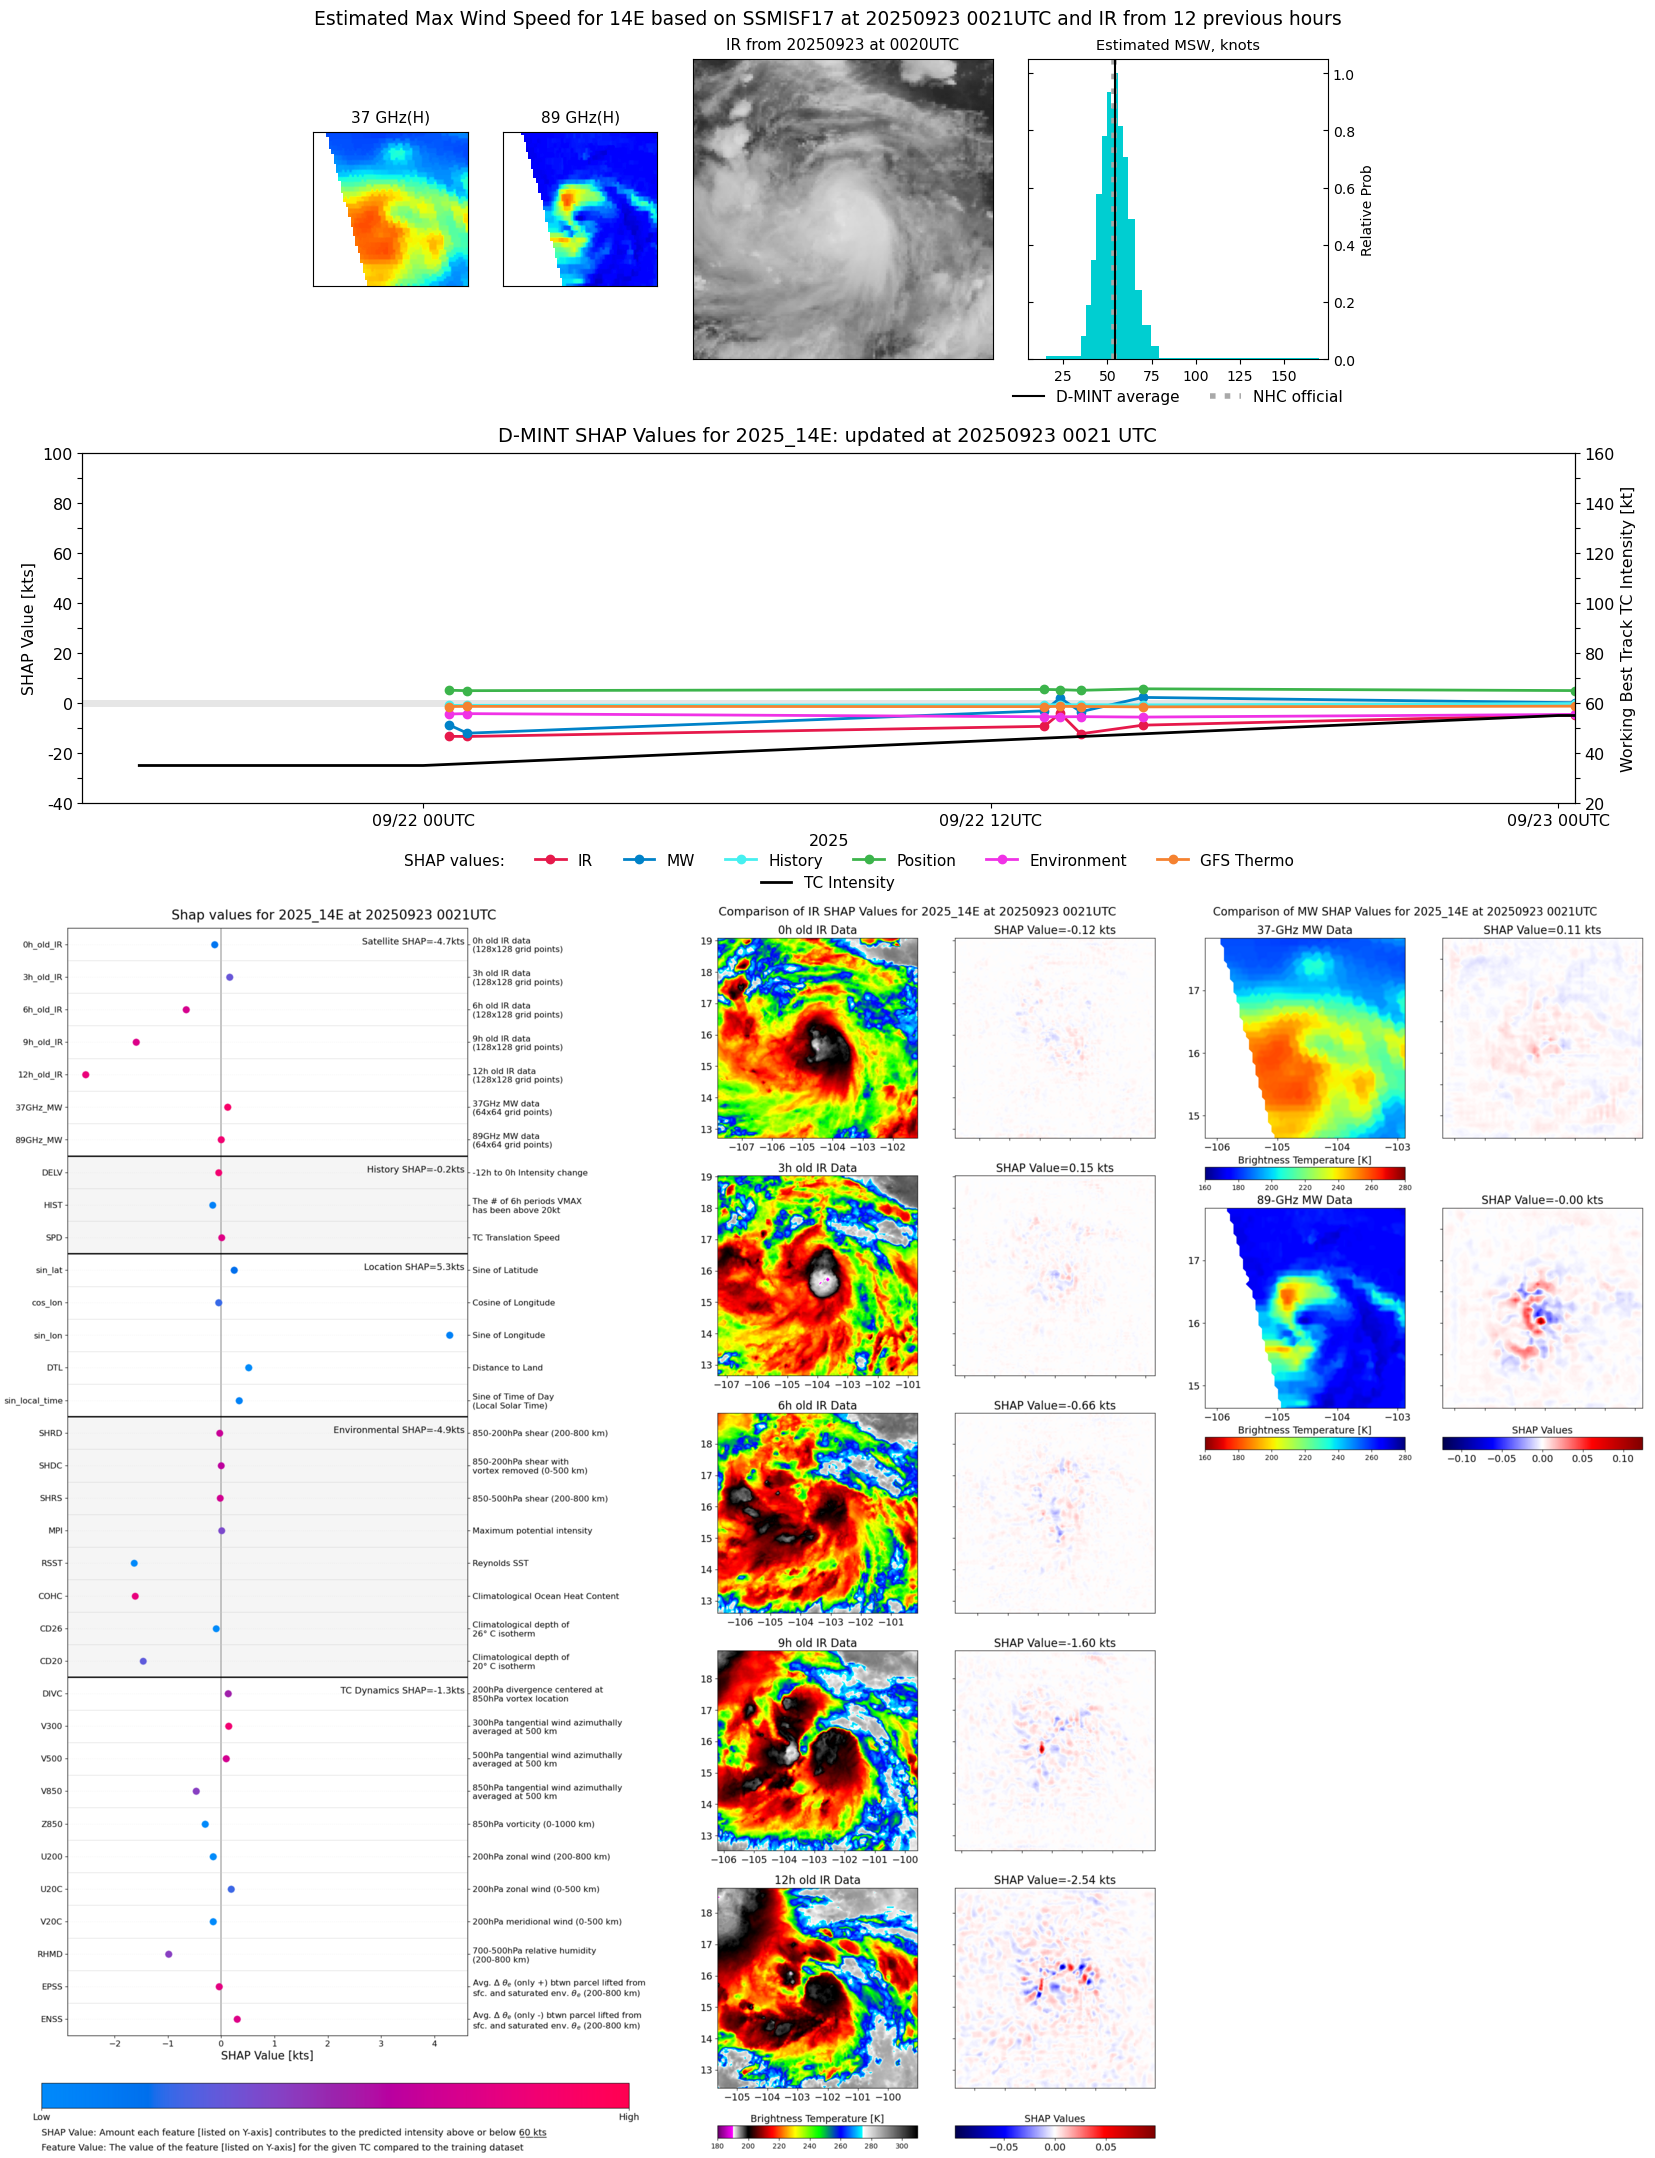 |
| 20250922 | 2302 UTC | SSMISF18 | 994 hPa | 56 kts | 50 kts | 63 kts | 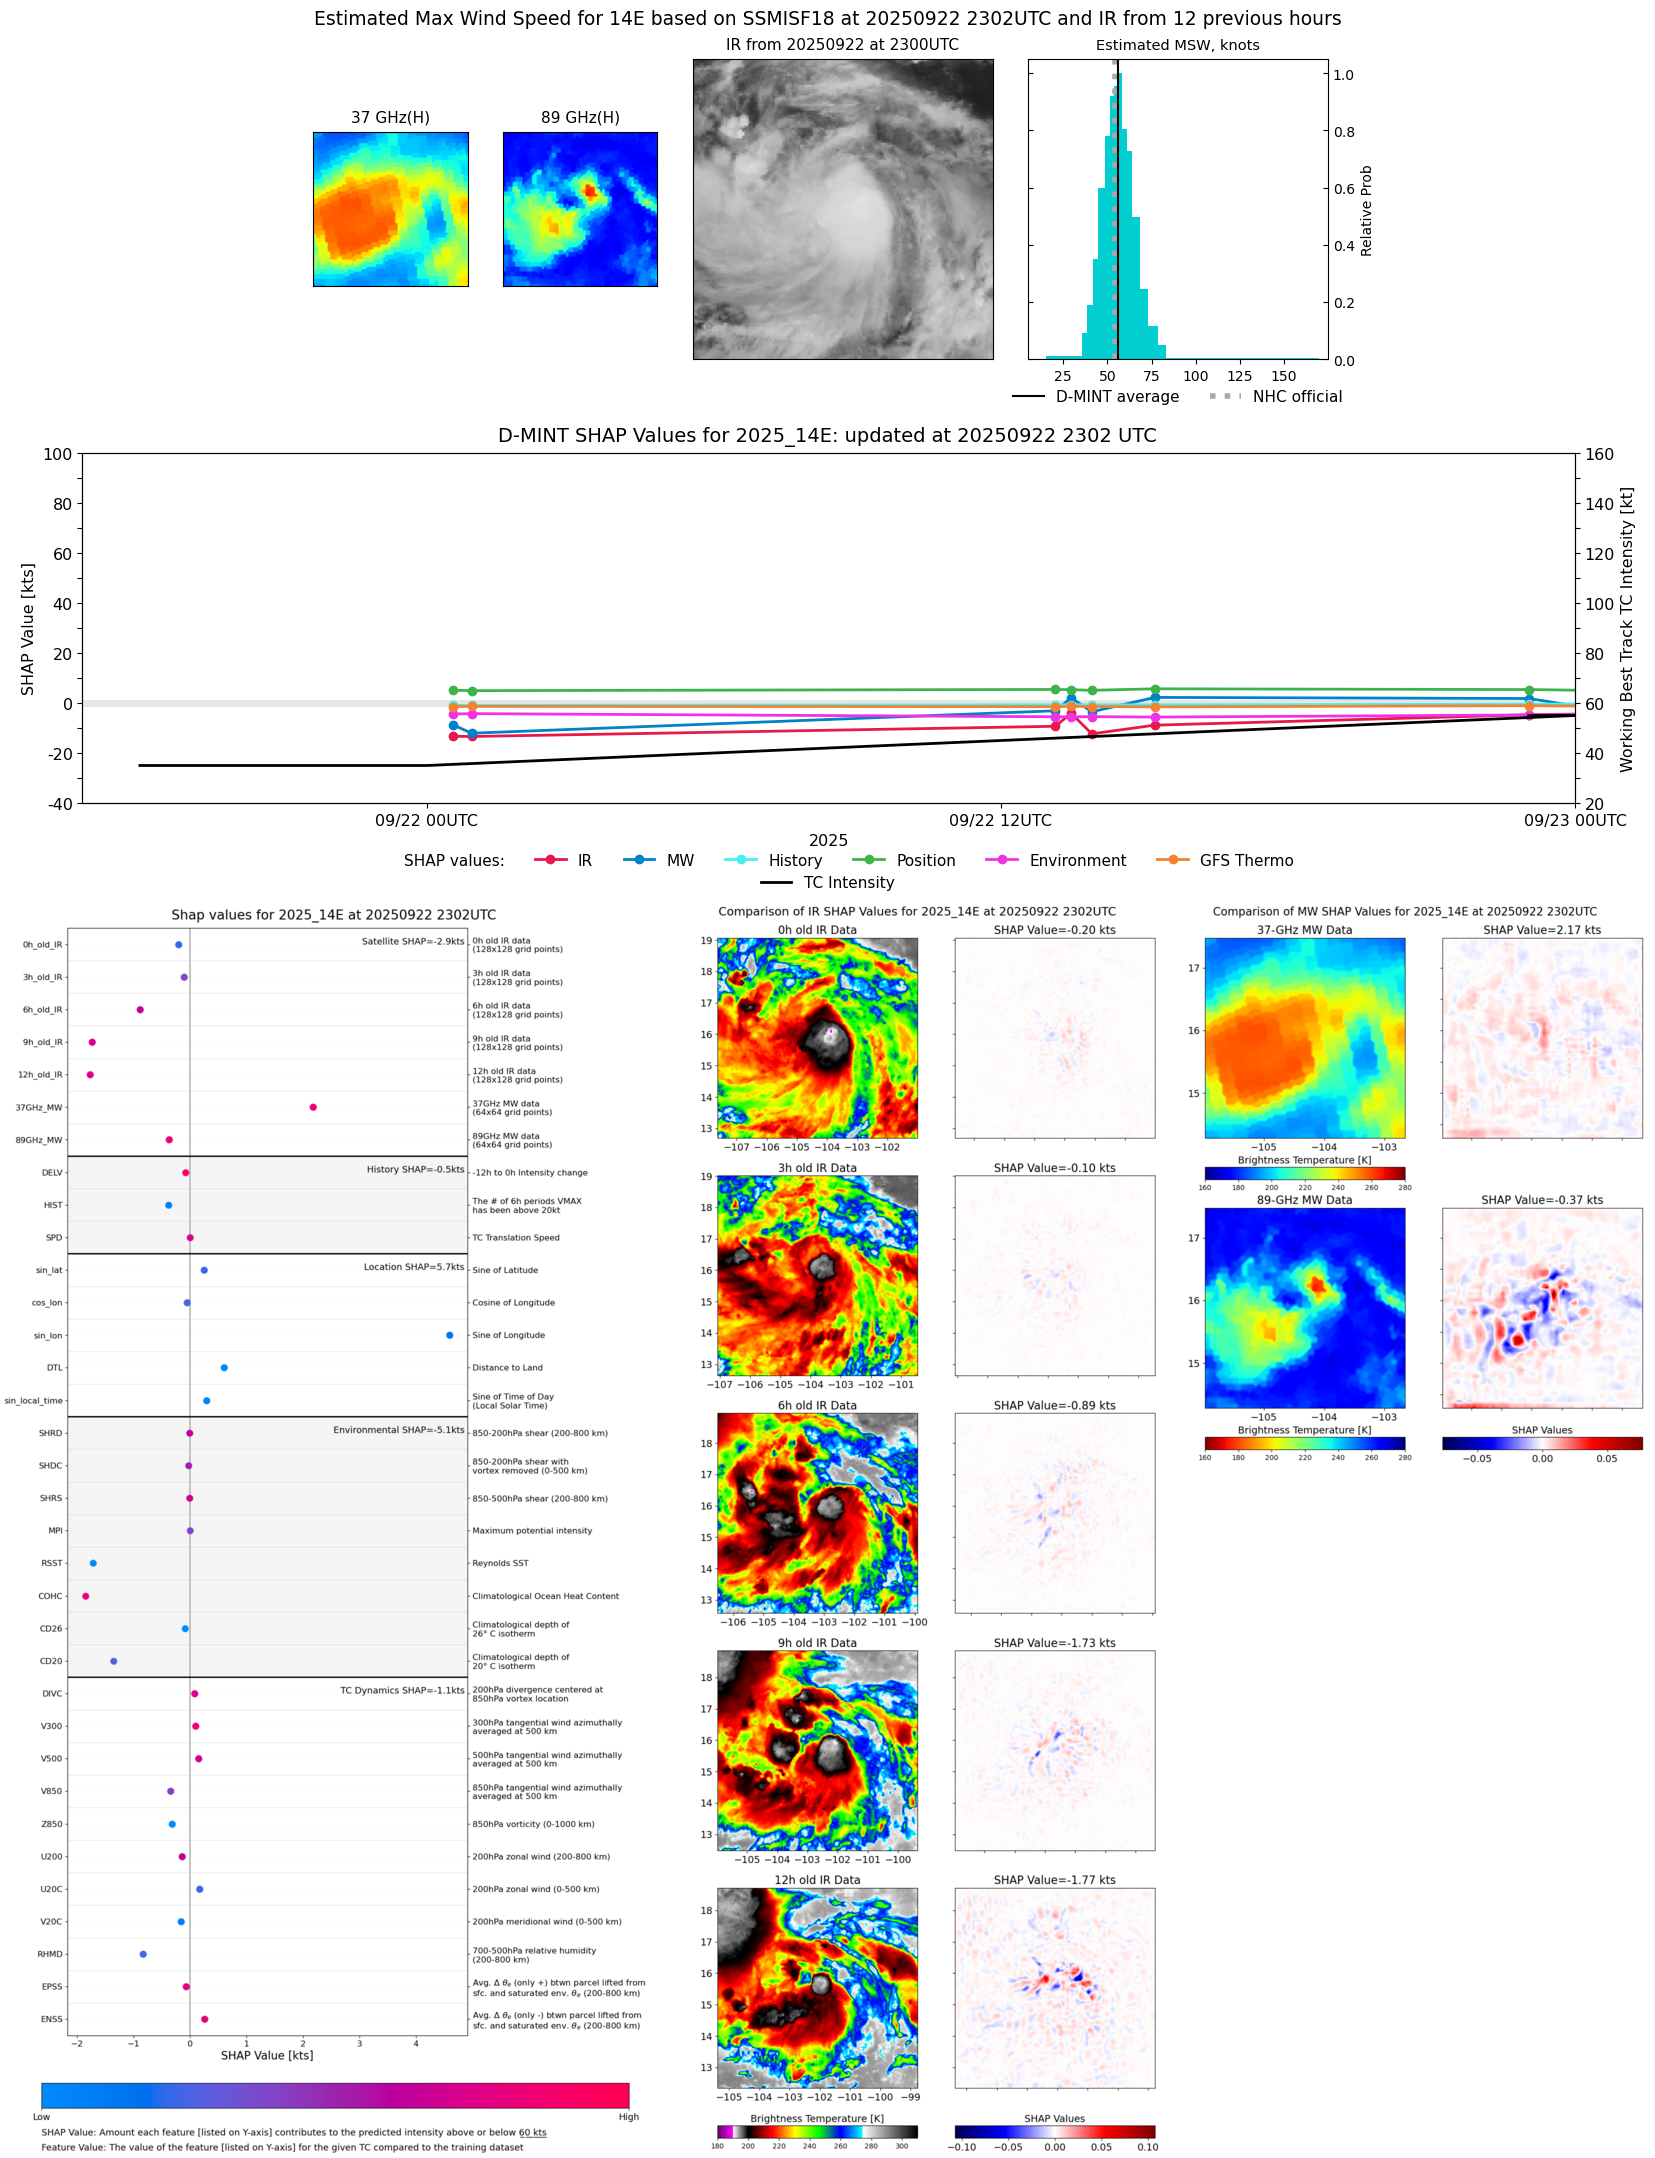 |
| 20250922 | 2022 UTC | ATMS-NPP | 996 hPa | 51 kts | 46 kts | 56 kts |  |
| 20250922 | 1955 UTC | ATMS-N21 | 1000 hPa | 49 kts | 44 kts | 54 kts | 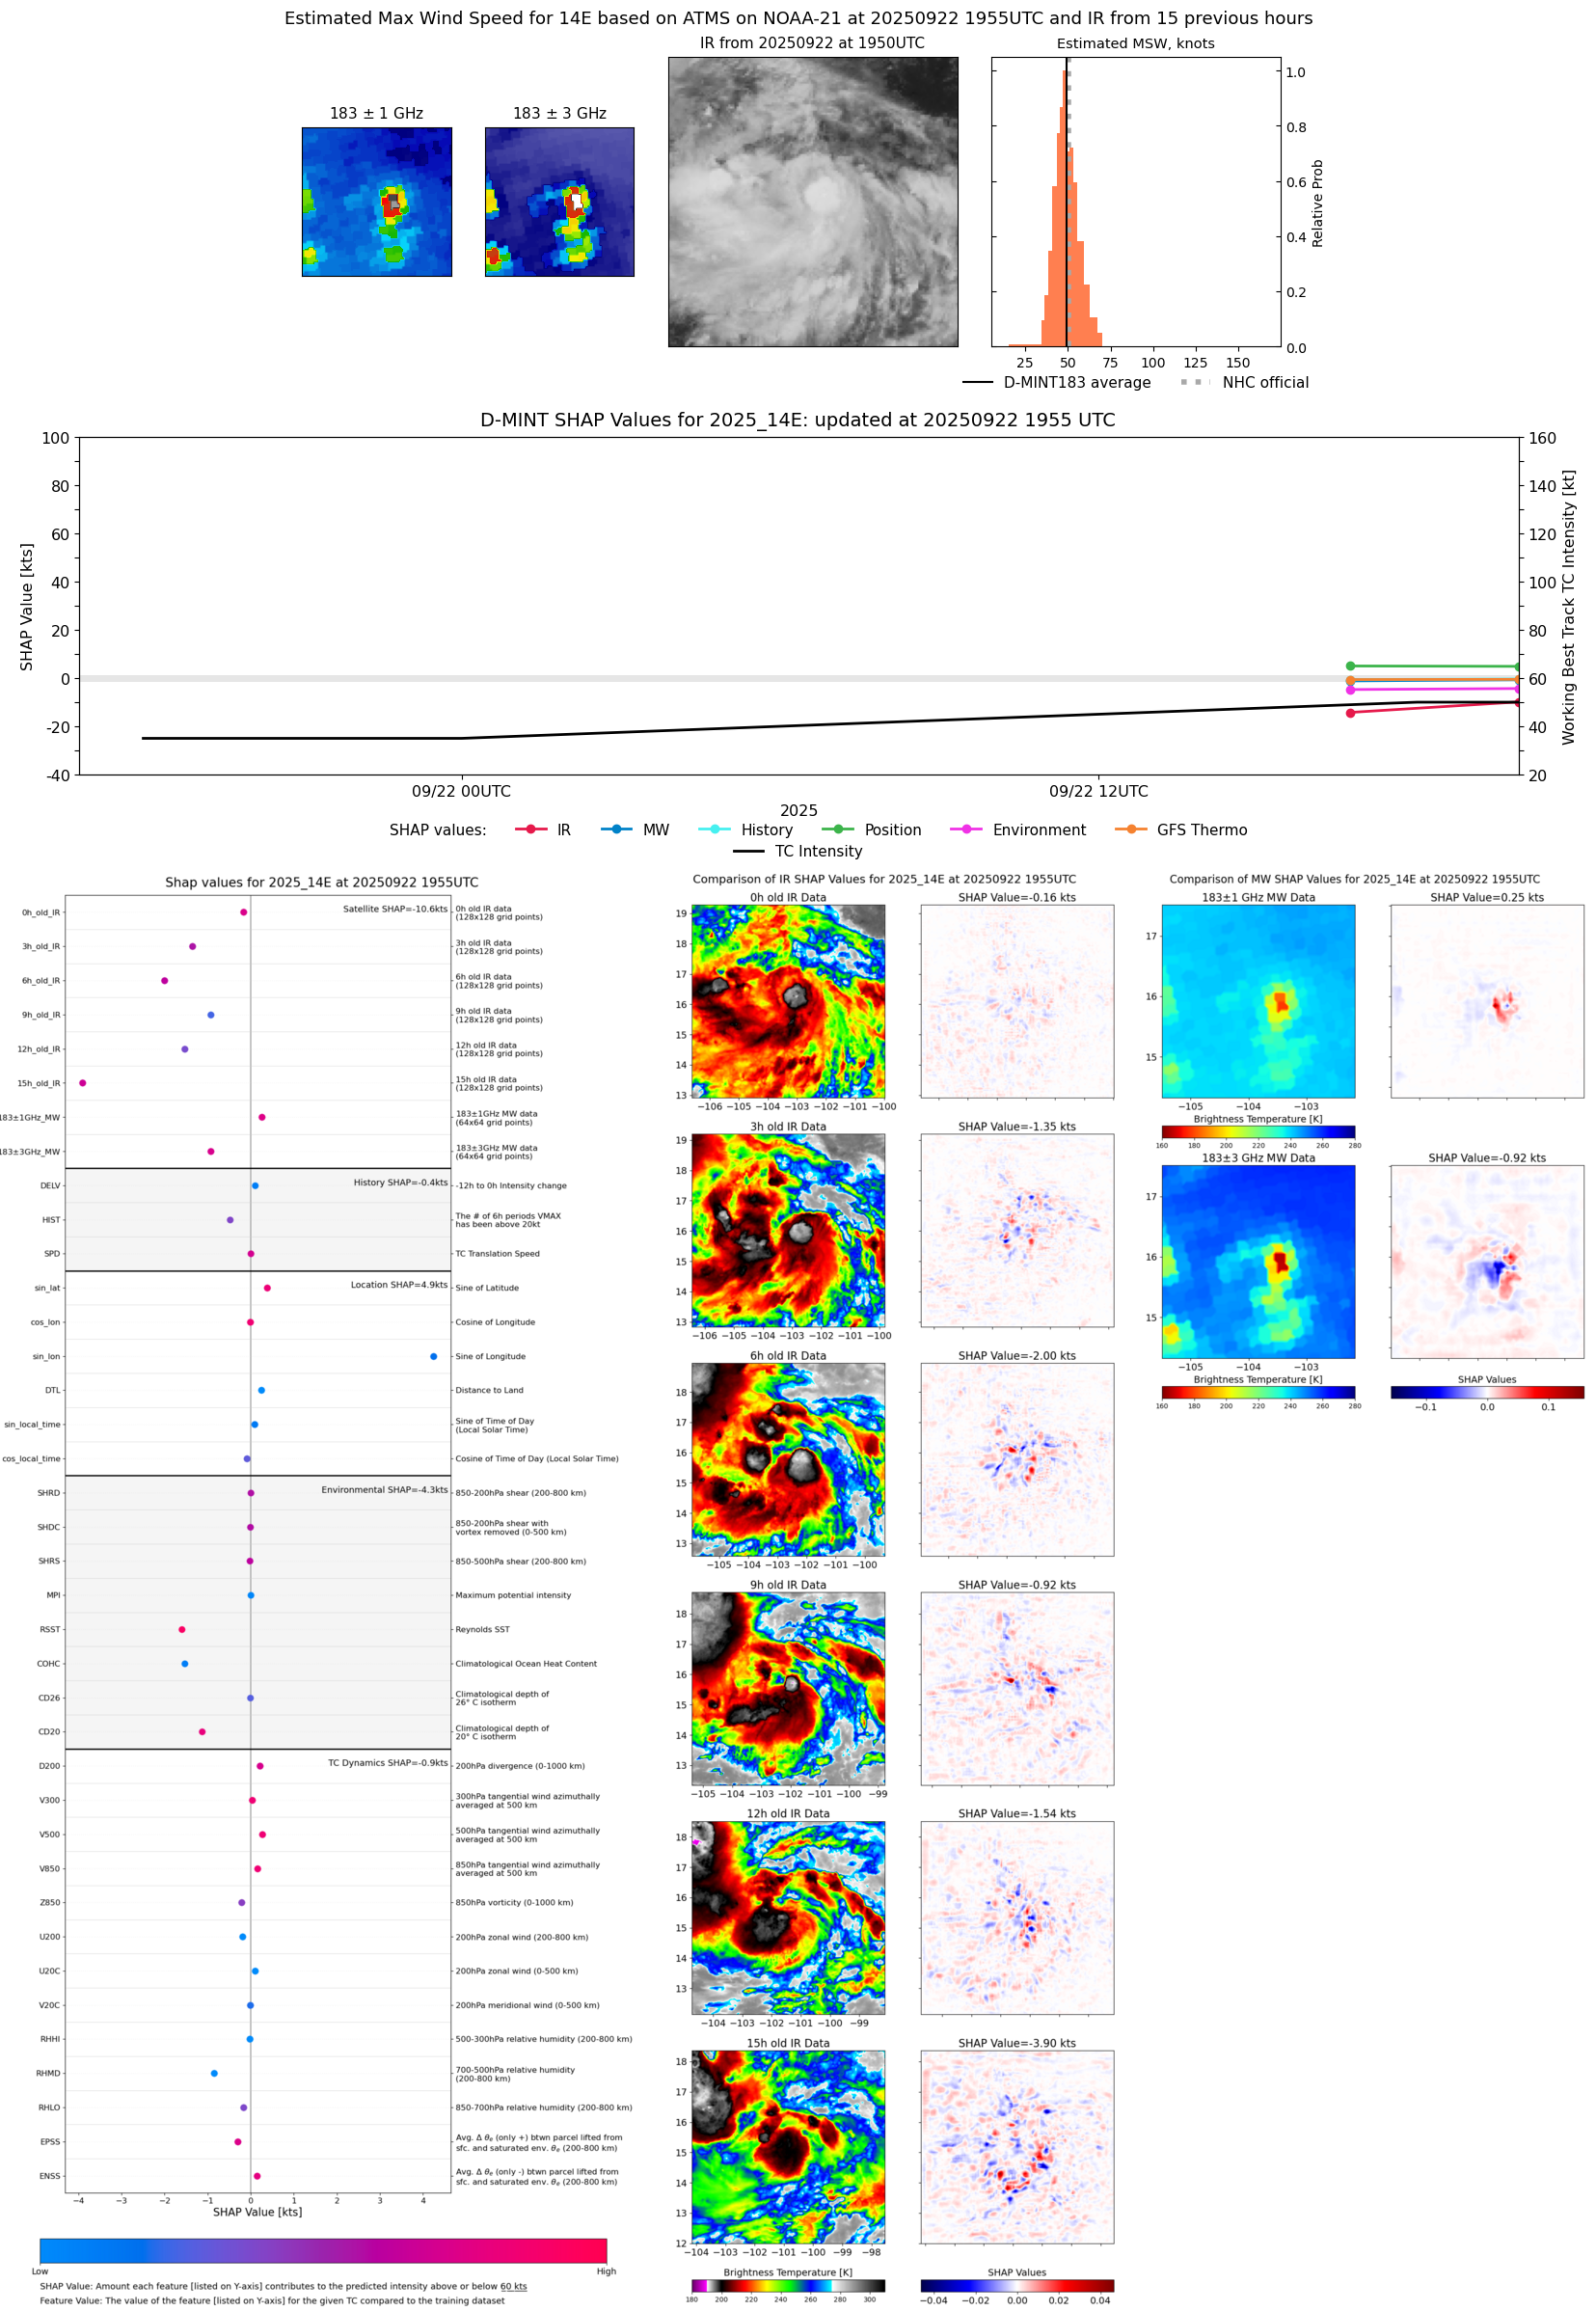 |
| 20250922 | 1644 UTC | TMS05 | 997 hPa | 44 kts | 39 kts | 49 kts | 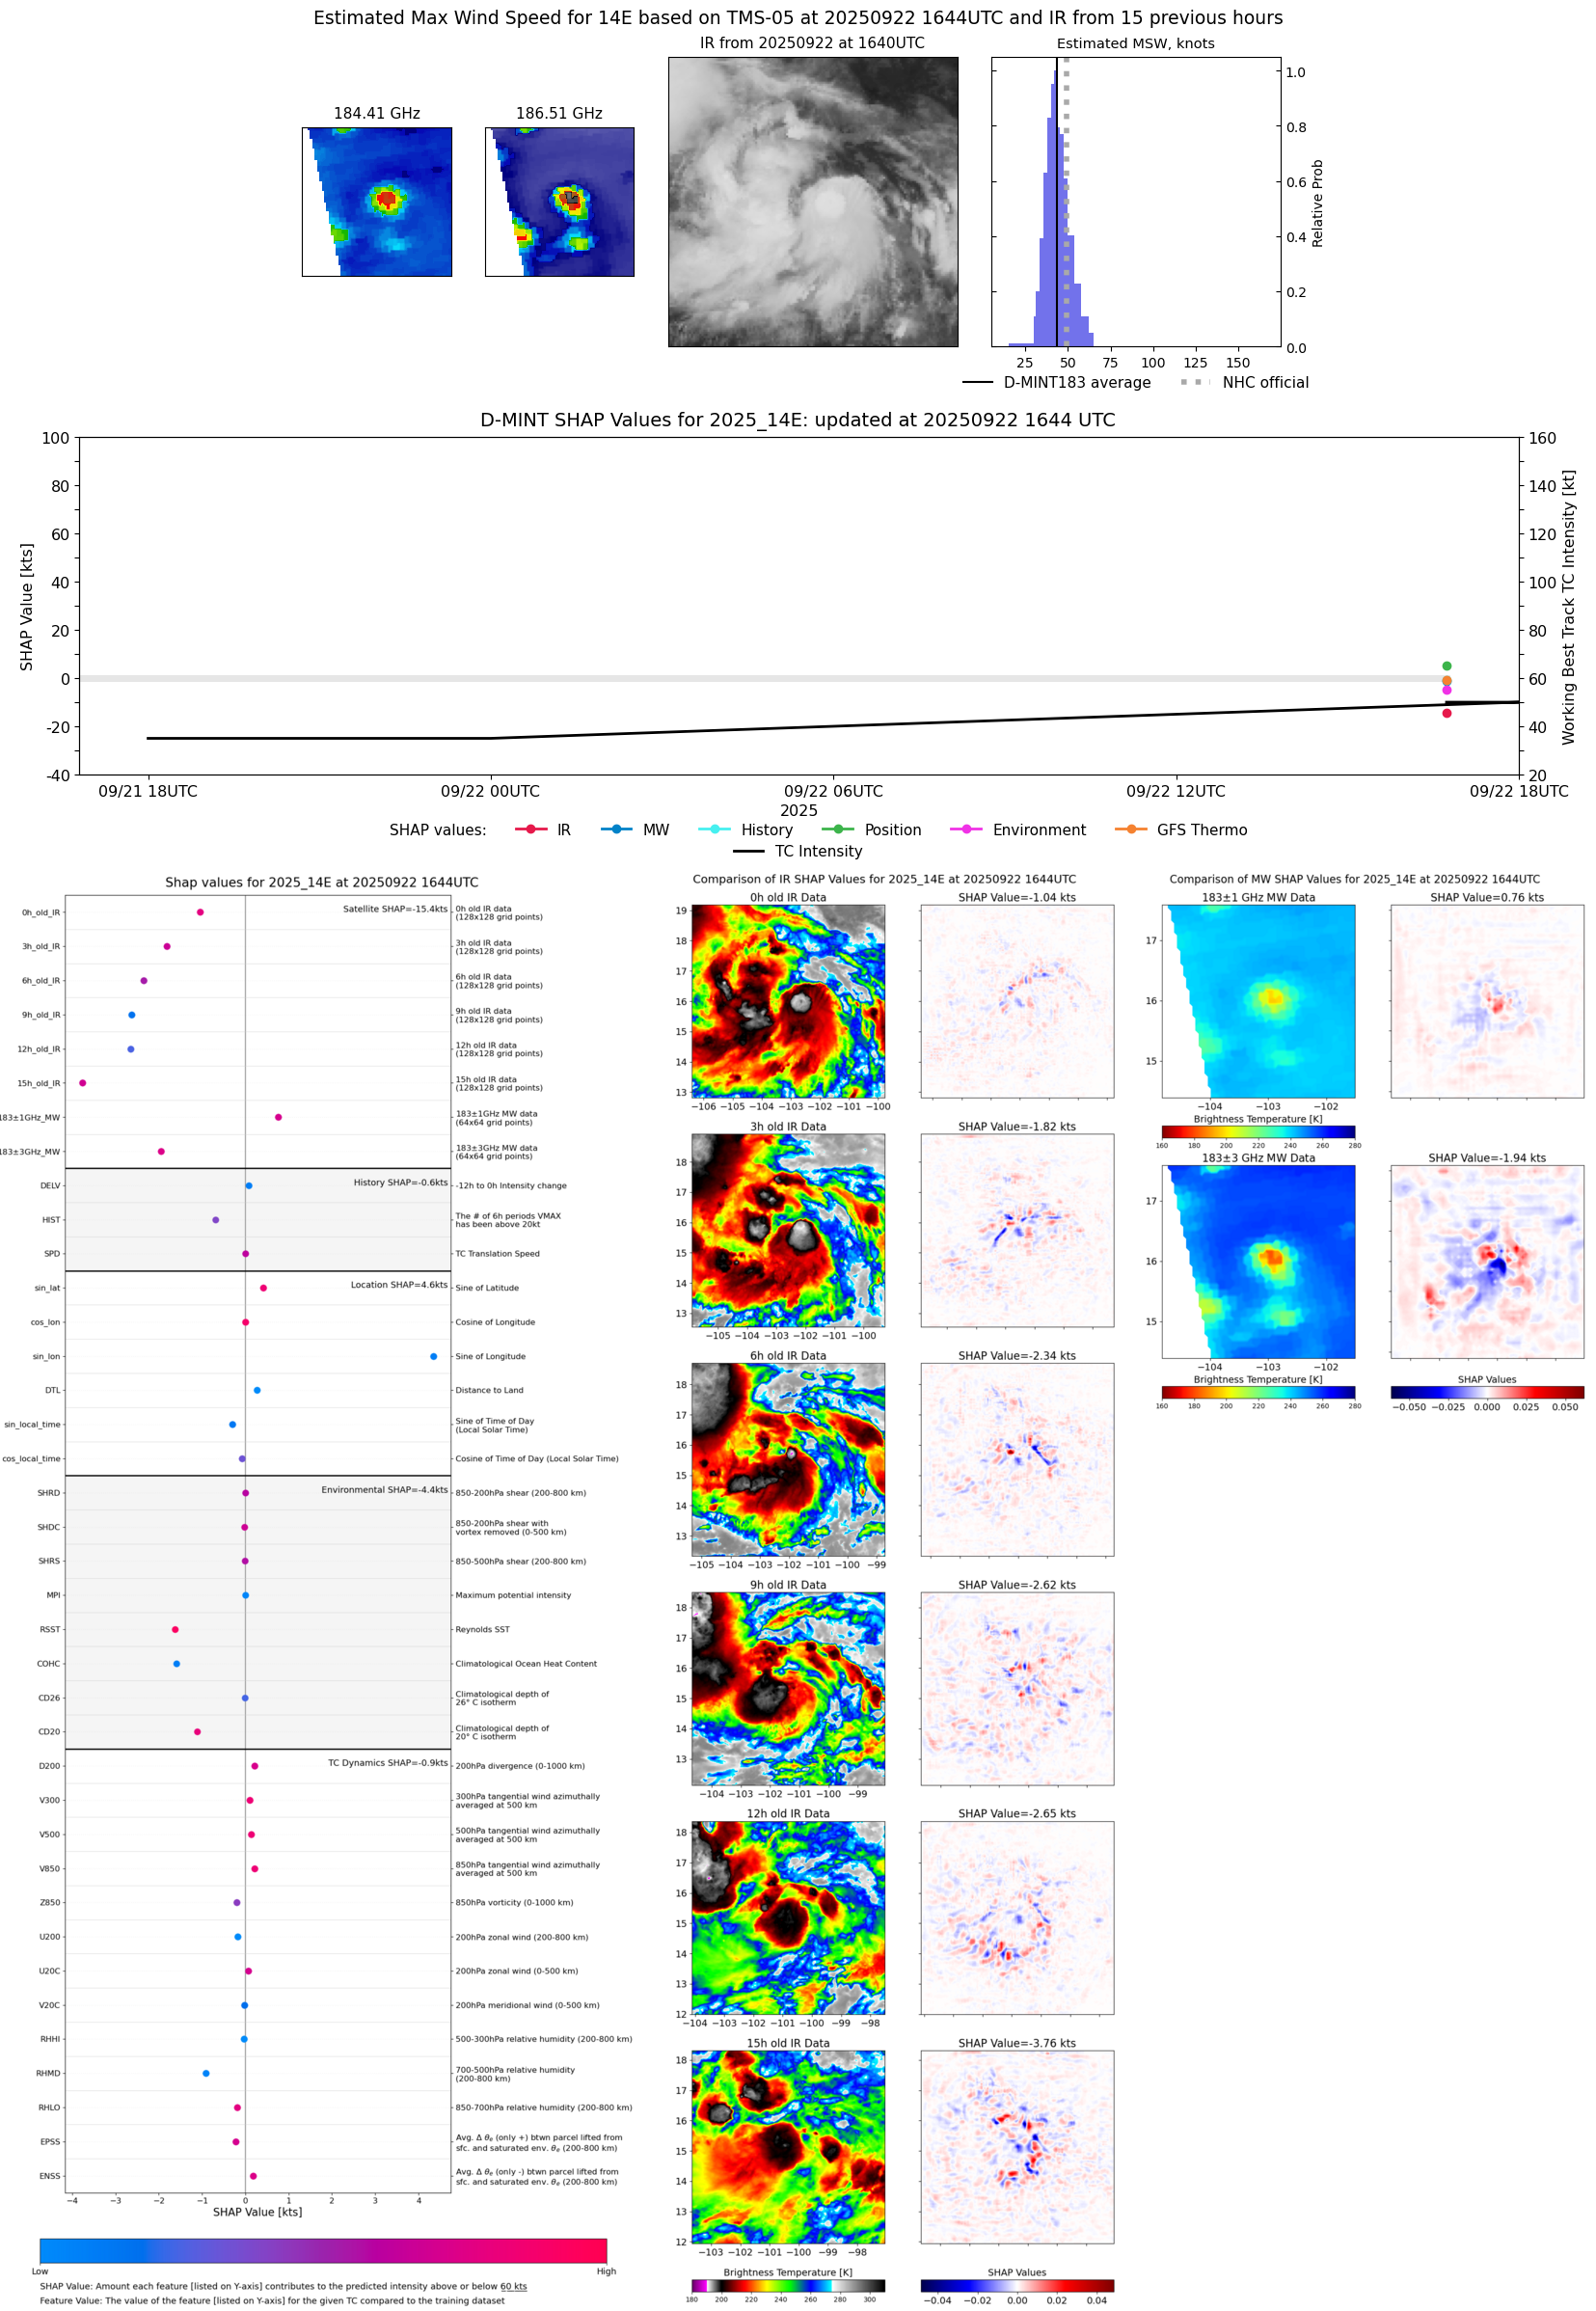 |
| 20250922 | 1513 UTC | GMI | 996 hPa | 51 kts | 45 kts | 57 kts | 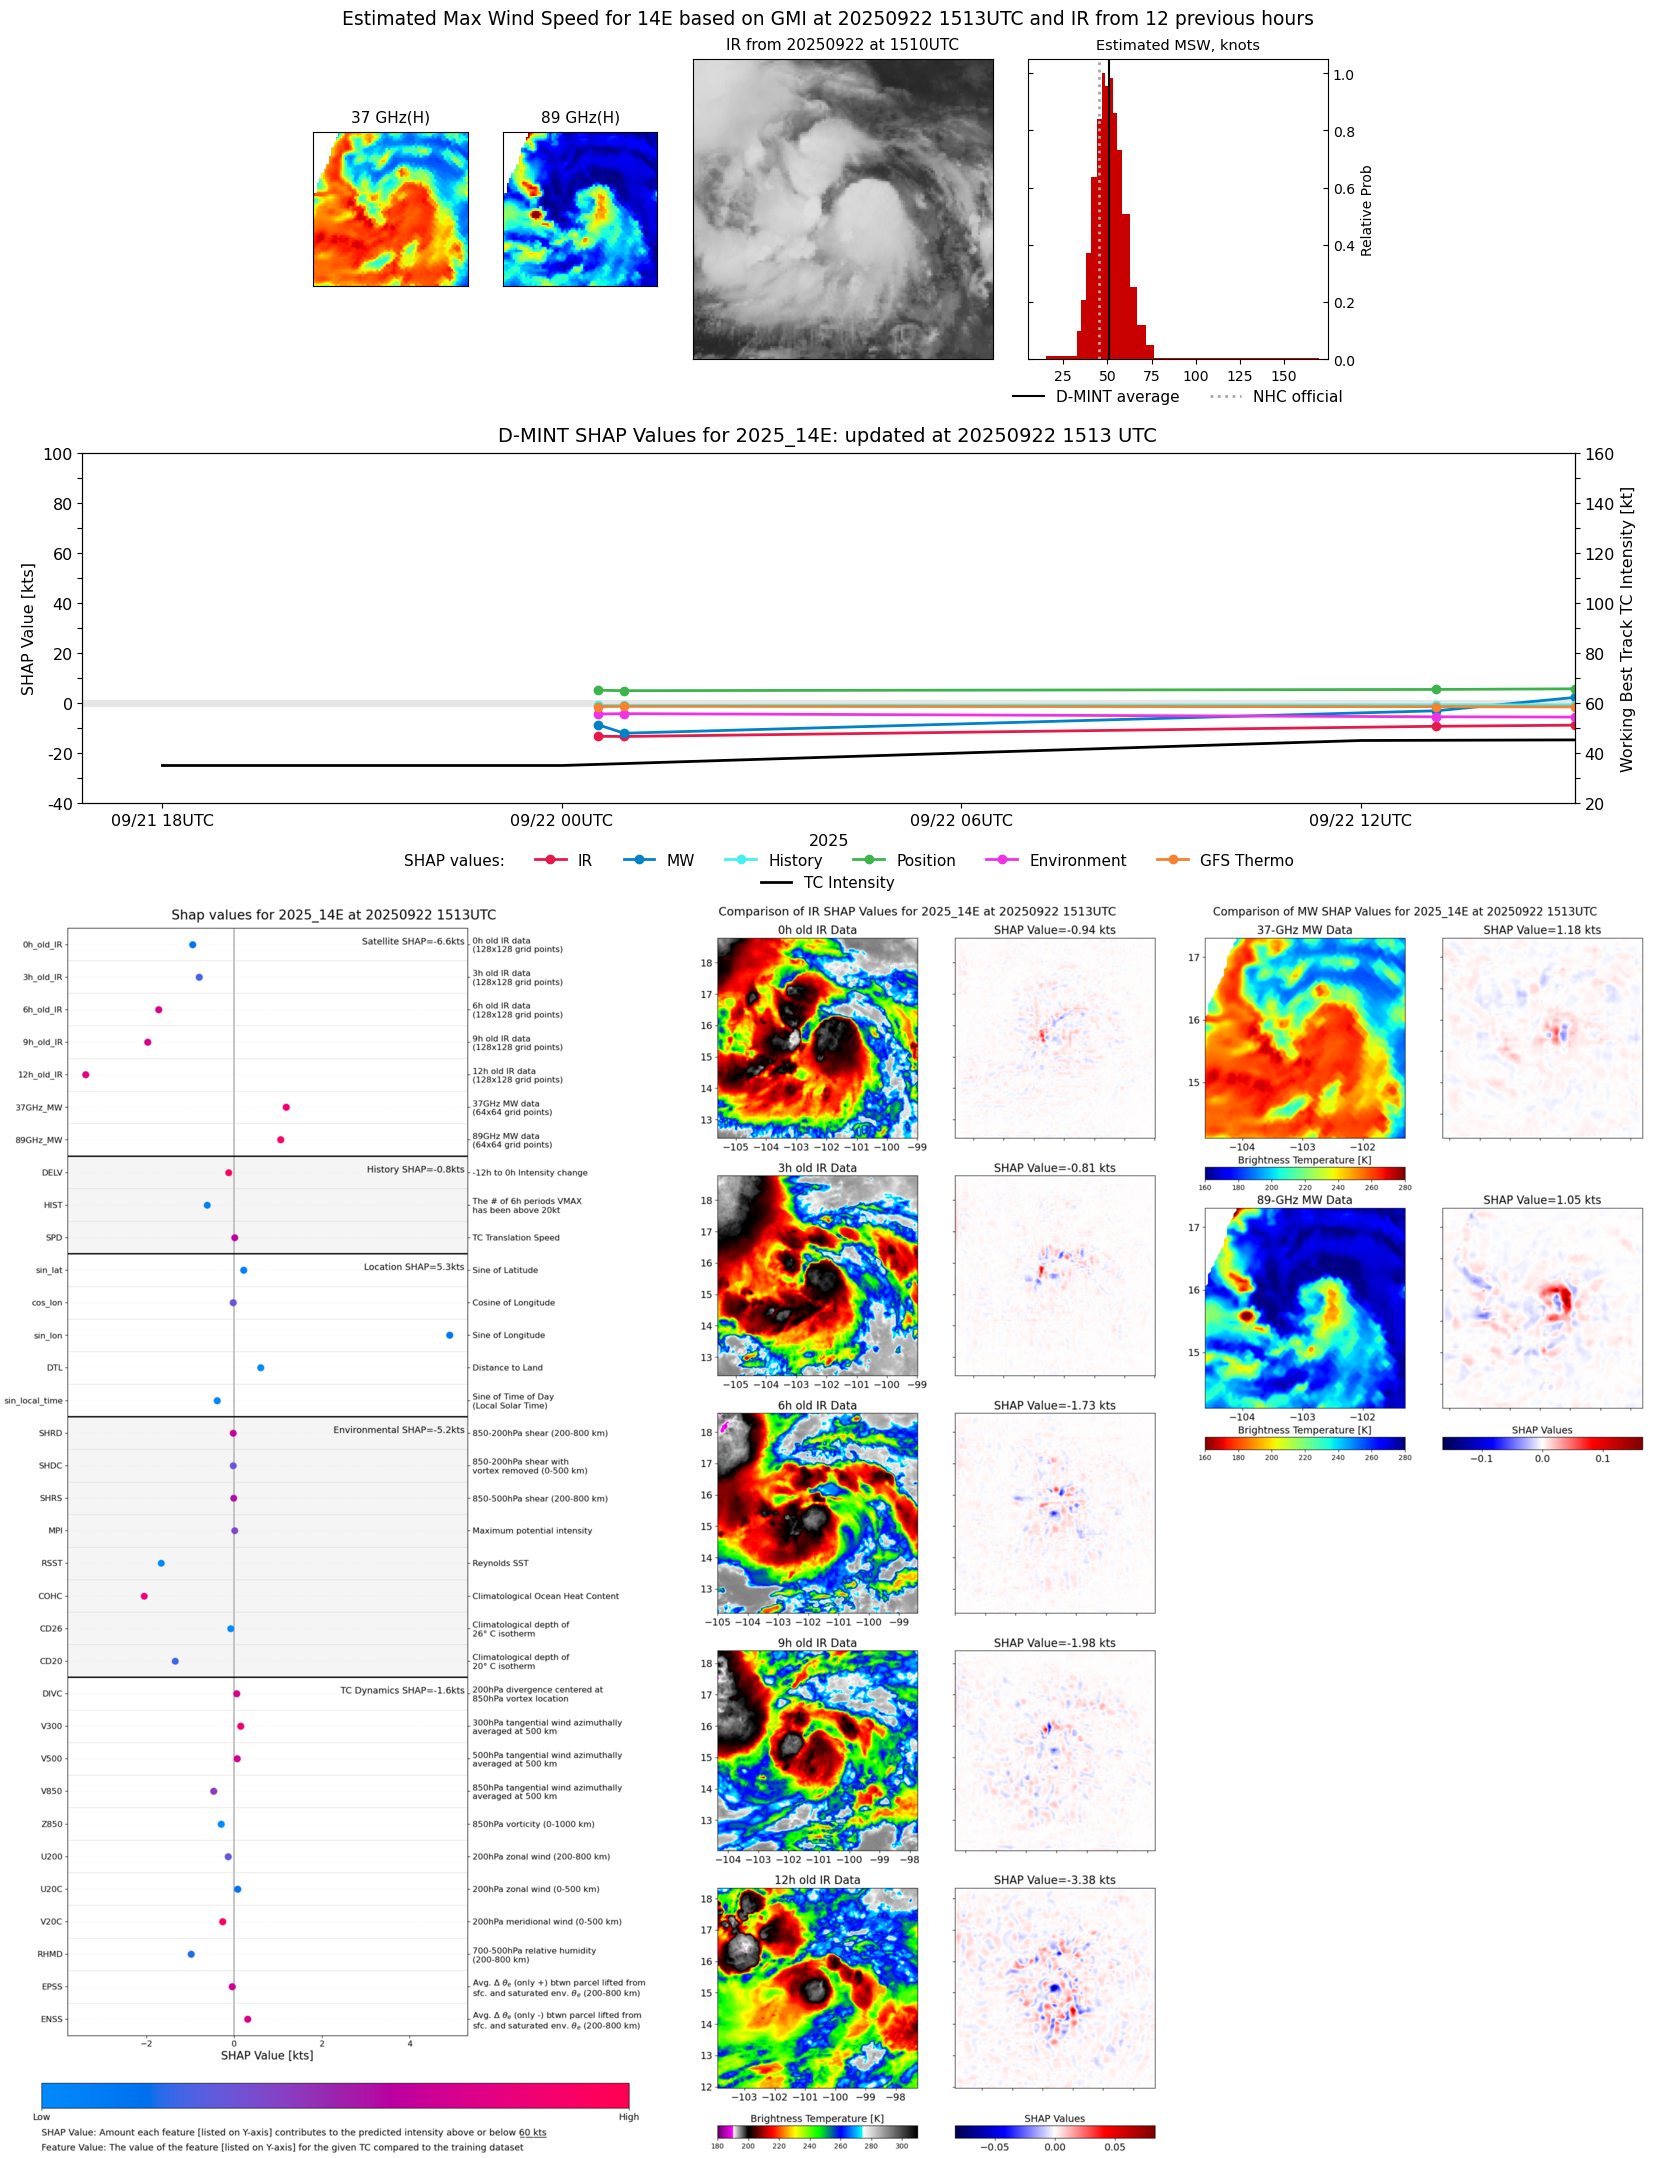 |
| 20250922 | 1354 UTC | SSMISF16 | 1000 hPa | 42 kts | 37 kts | 47 kts | 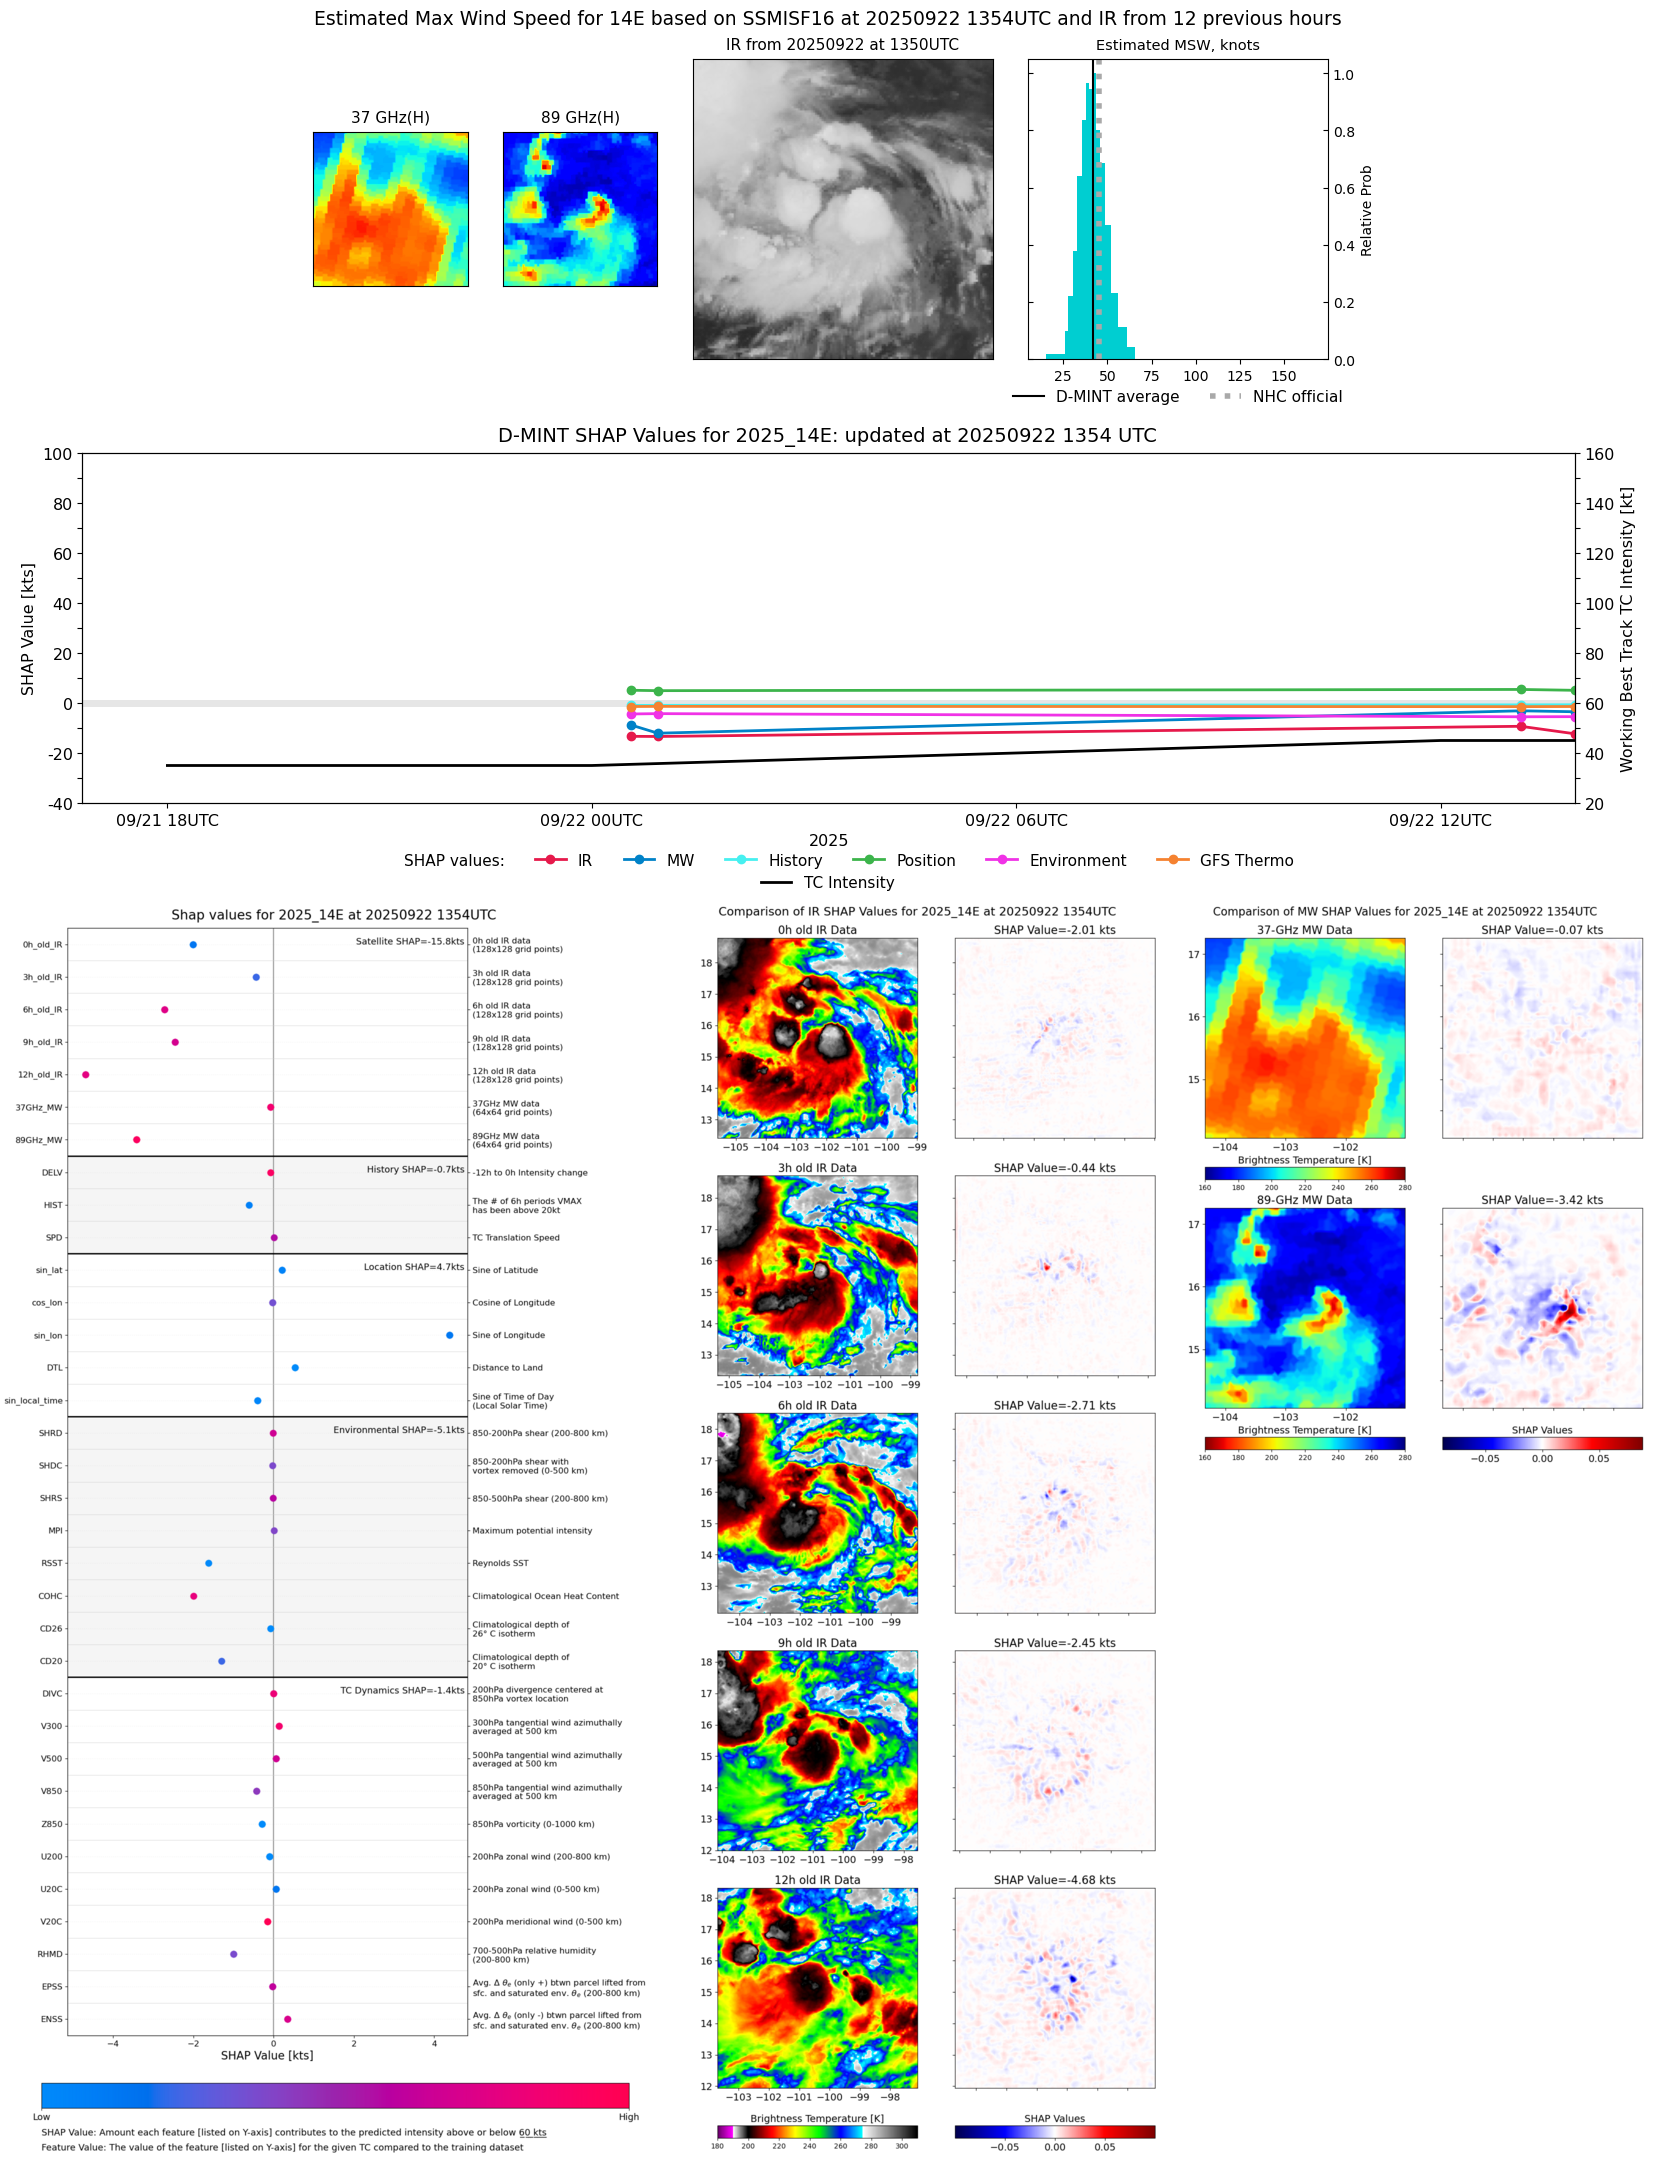 |
| 20250922 | 1328 UTC | WSFM01 | 997 hPa | 56 kts | 50 kts | 62 kts |  |
| 20250922 | 1308 UTC | SSMISF17 | 998 hPa | 45 kts | 40 kts | 51 kts |  |
| 20250922 | 0056 UTC | WSFM01 | 1004 hPa | 33 kts | 30 kts | 37 kts |  |
| 20250922 | 0033 UTC | SSMISF17 | 1004 hPa | 36 kts | 32 kts | 41 kts | 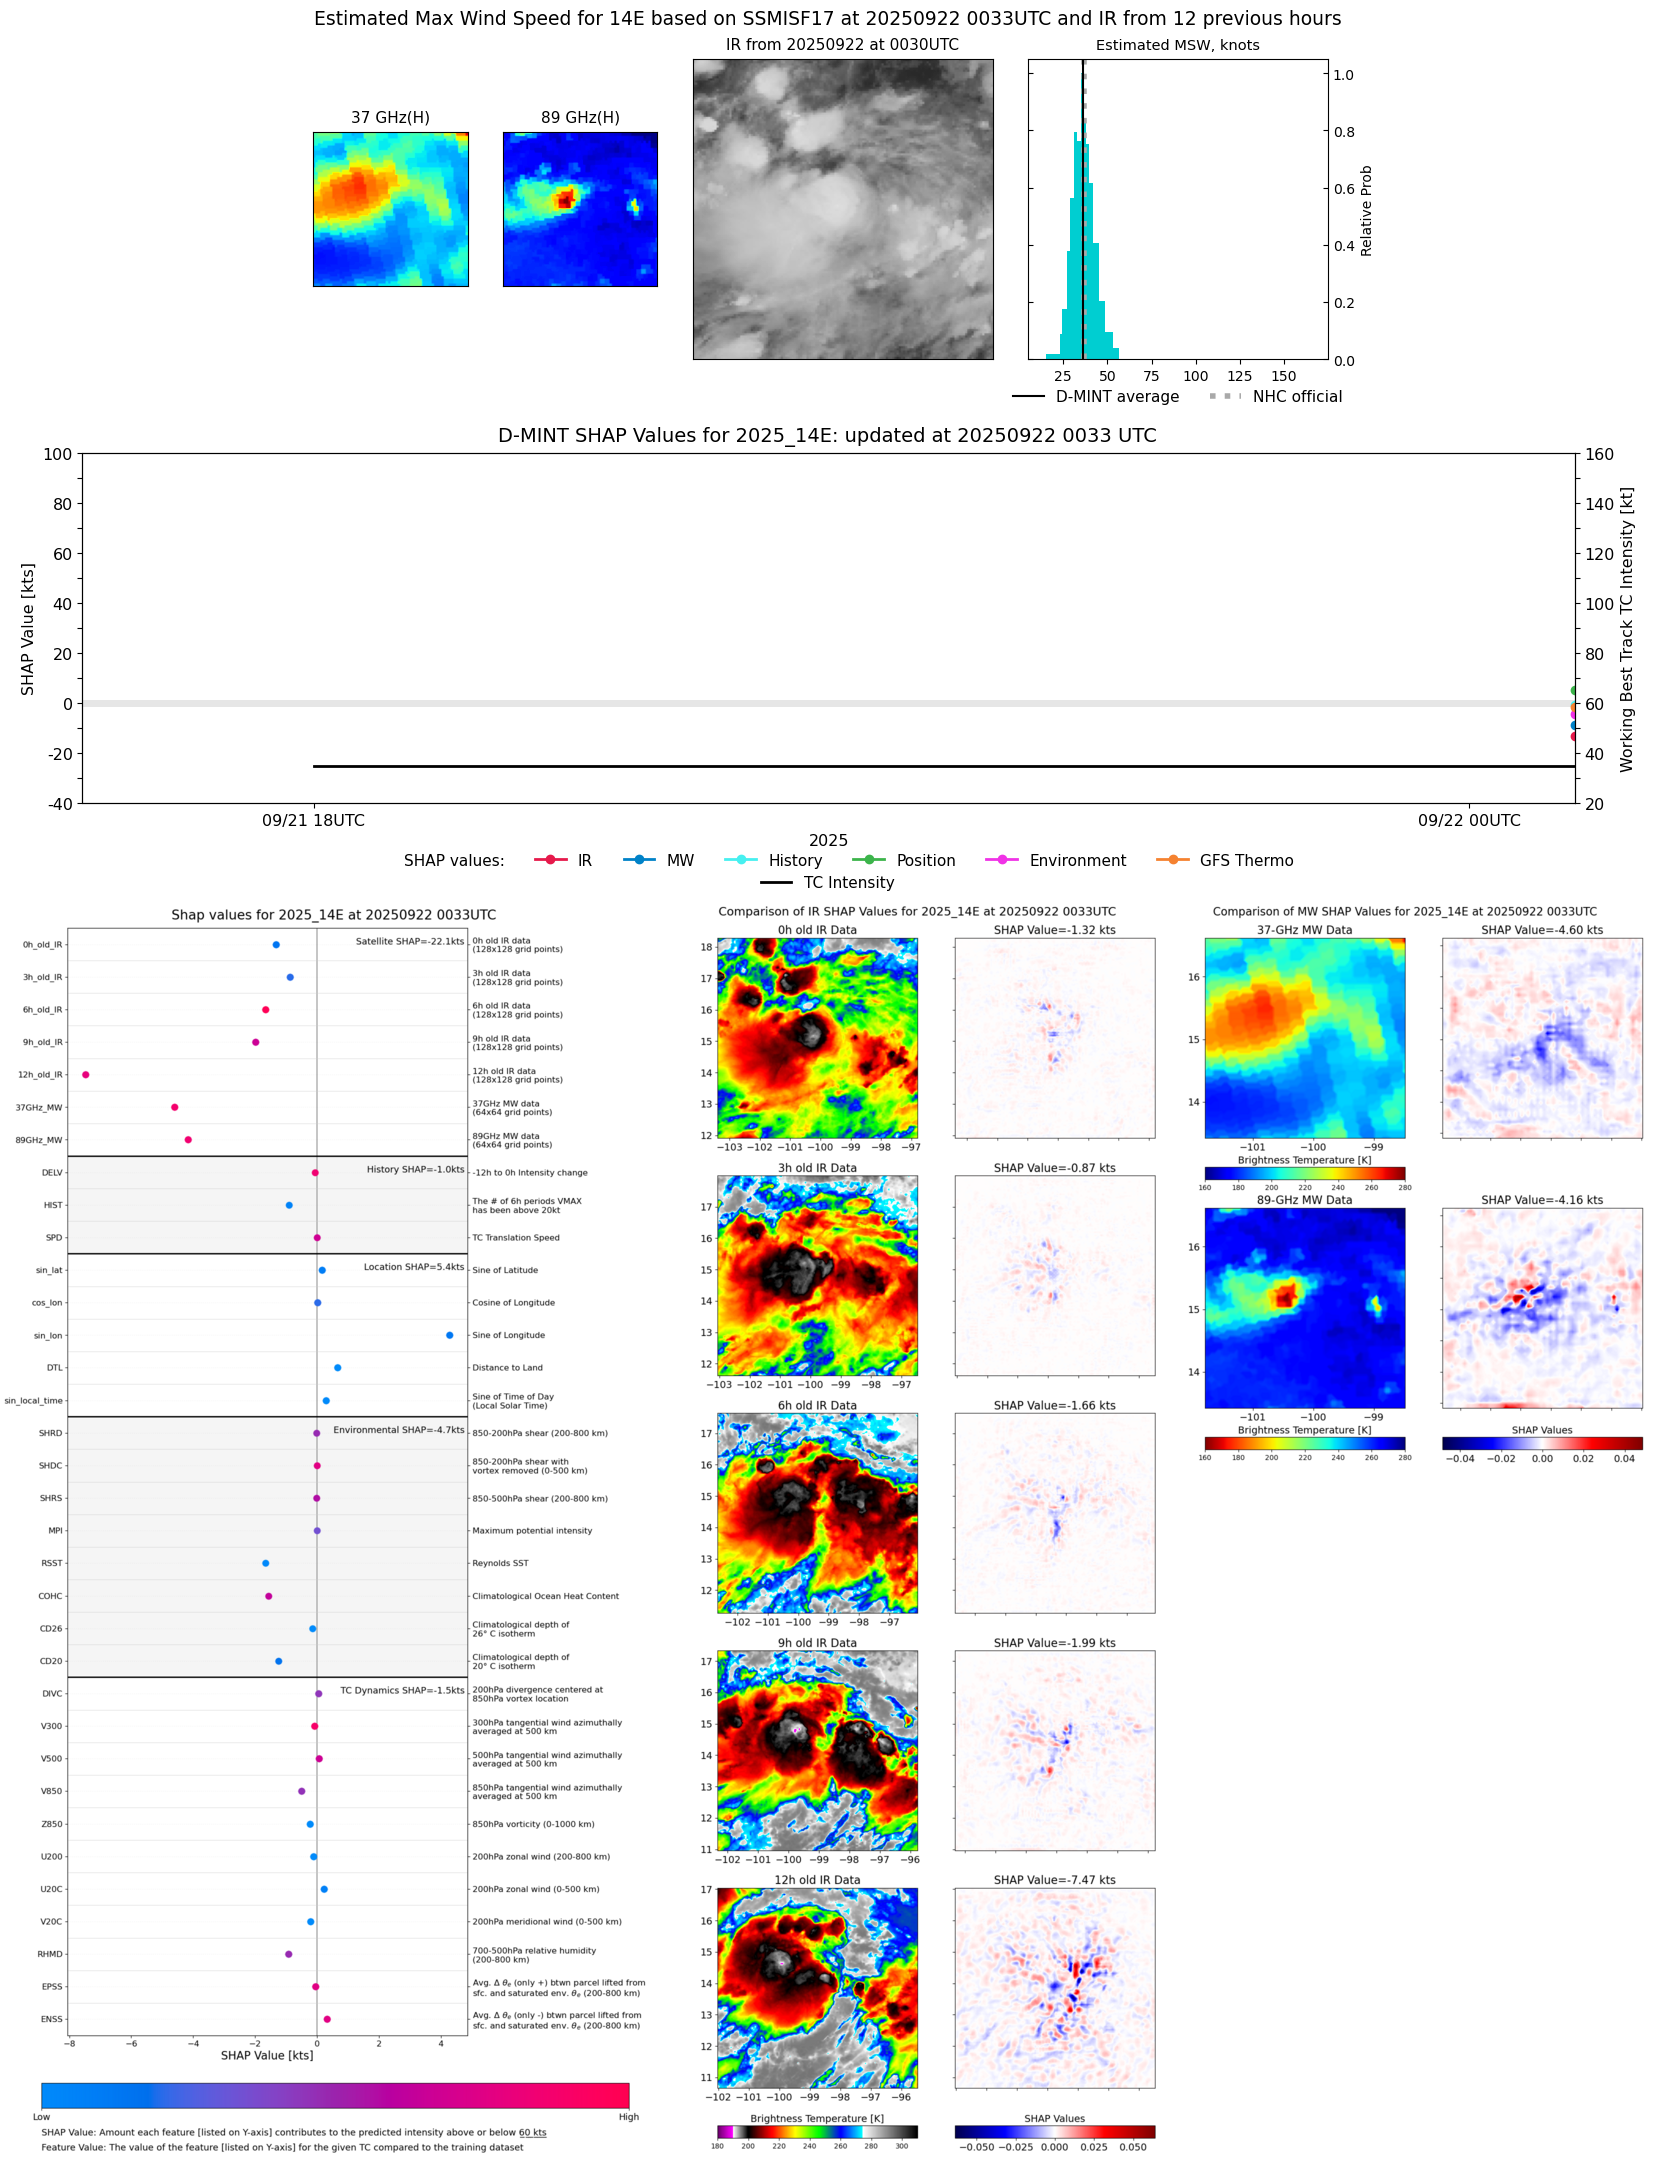 |
| 20250921 | 1025 UTC | SSMISF18 | NaN hPa | 31 kts | 28 kts | 35 kts | 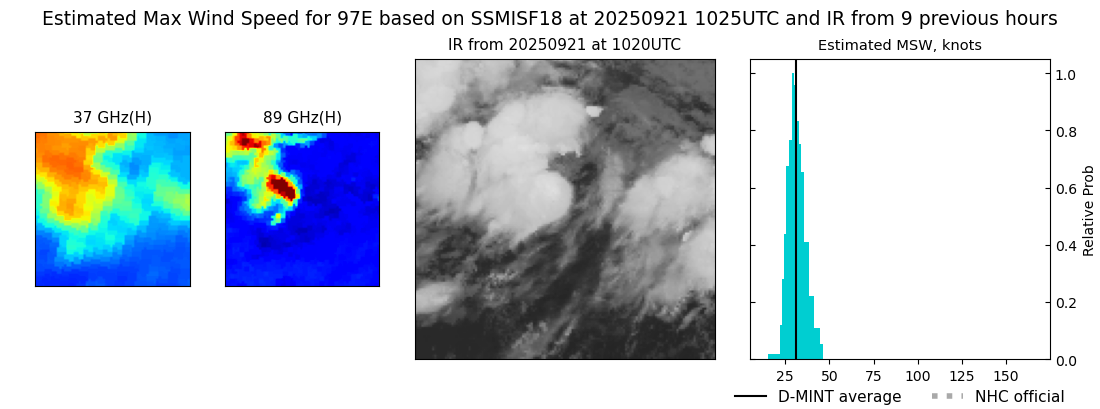 |
| 20250921 | 0819 UTC | AMSR2 | NaN hPa | 27 kts | 25 kts | 30 kts | 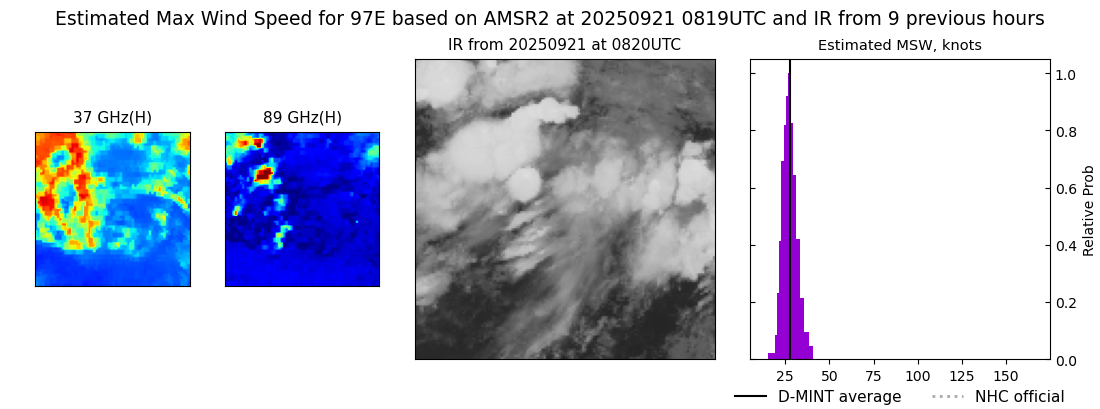 |
| 20250921 | 0241 UTC | GMI | NaN hPa | 29 kts | 26 kts | 32 kts | 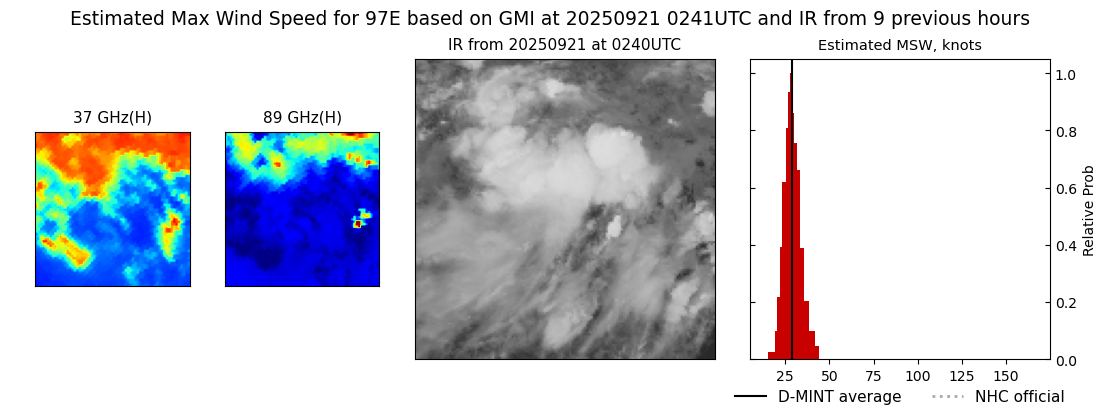 |
| 20250921 | 0132 UTC | SSMISF16 | NaN hPa | 32 kts | 28 kts | 36 kts |  |
| 20250921 | 0048 UTC | SSMISF17 | NaN hPa | 33 kts | 29 kts | 37 kts | 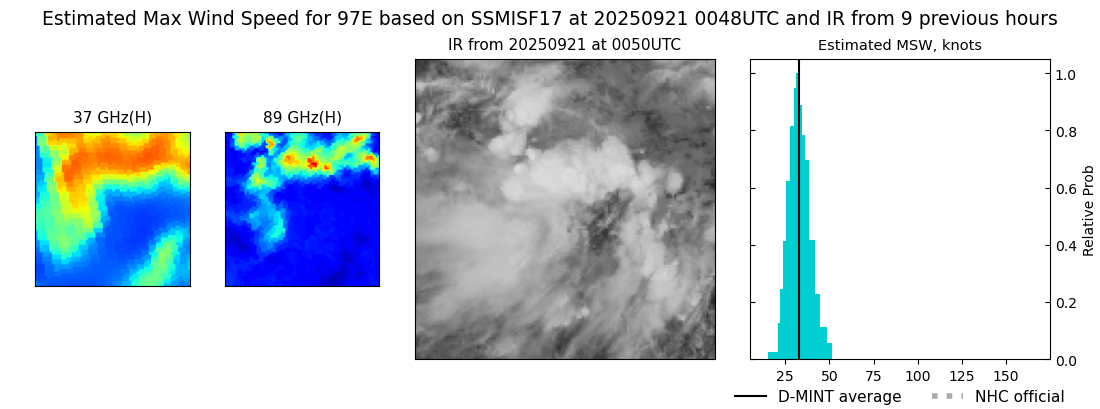 |
| 20250920 | 2005 UTC | AMSR2 | NaN hPa | 24 kts | 22 kts | 27 kts | 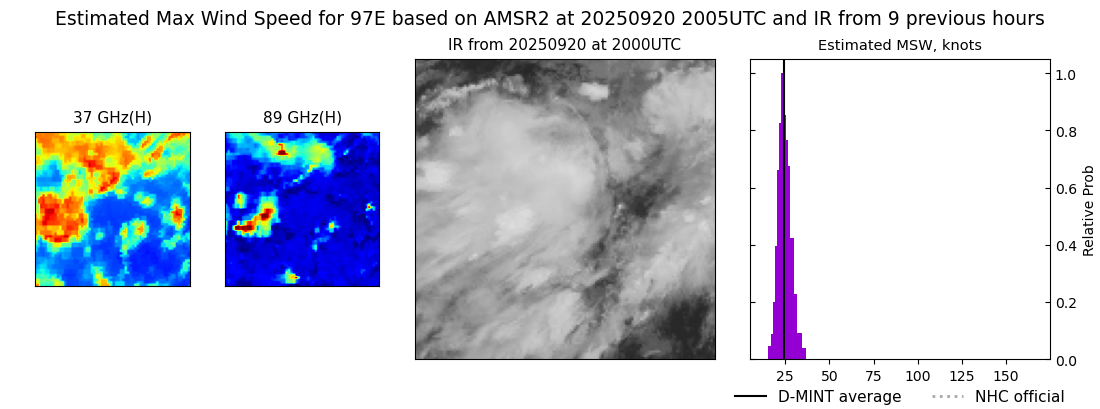 |
| 20250920 | 1039 UTC | SSMISF18 | NaN hPa | 29 kts | 25 kts | 32 kts |  |
| 20250919 | 2203 UTC | SSMISF18 | NaN hPa | 30 kts | 27 kts | 34 kts |  |
| 20250919 | 1923 UTC | AMSR2 | NaN hPa | 29 kts | 26 kts | 33 kts | 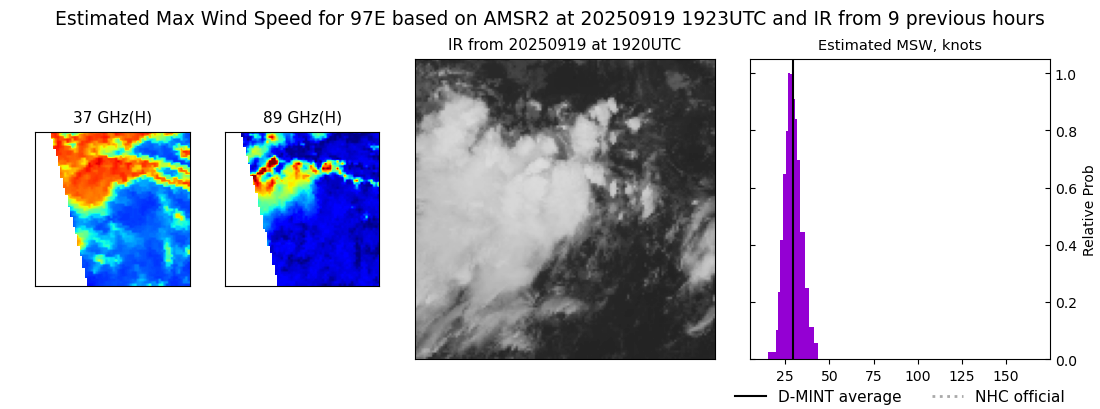 |