|
||

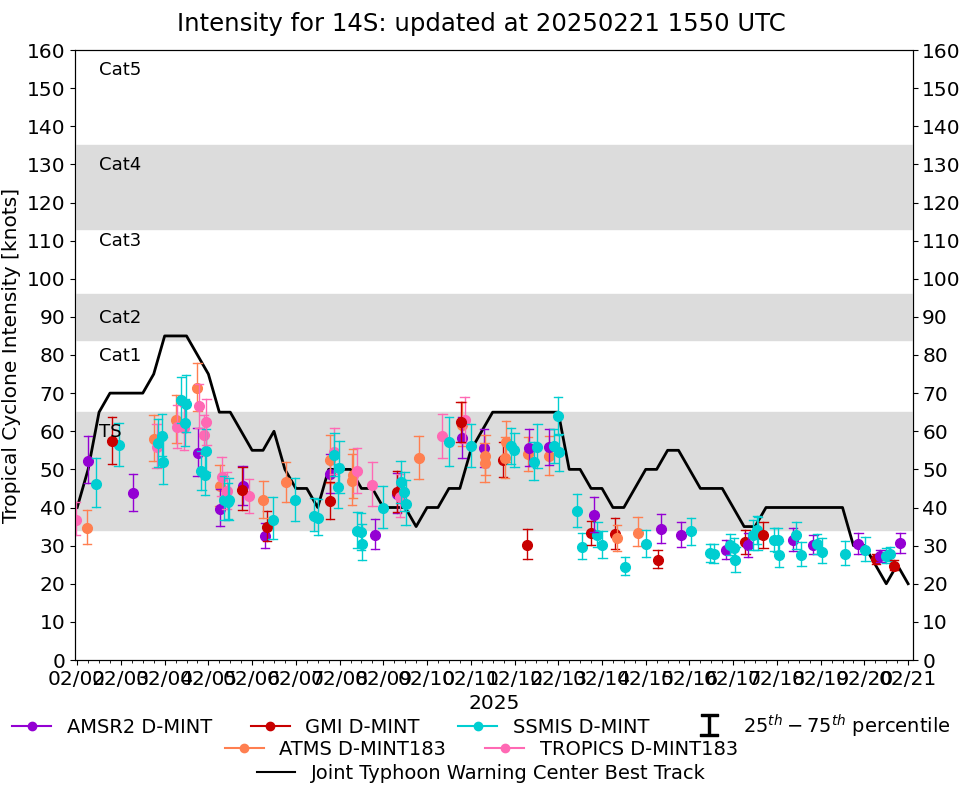 |
D-MINT HISTORY FILE for 2025_14S
| Date | Time | MW Sensor | MSLP | Vmax (30th-70th percentile average) | Vmax 25th percentile | Vmax 75th percentile | Image |
| 20250220 | 1948 UTC | AMSR2 | 1001 hPa | 31 kts | 28 kts | 33 kts | 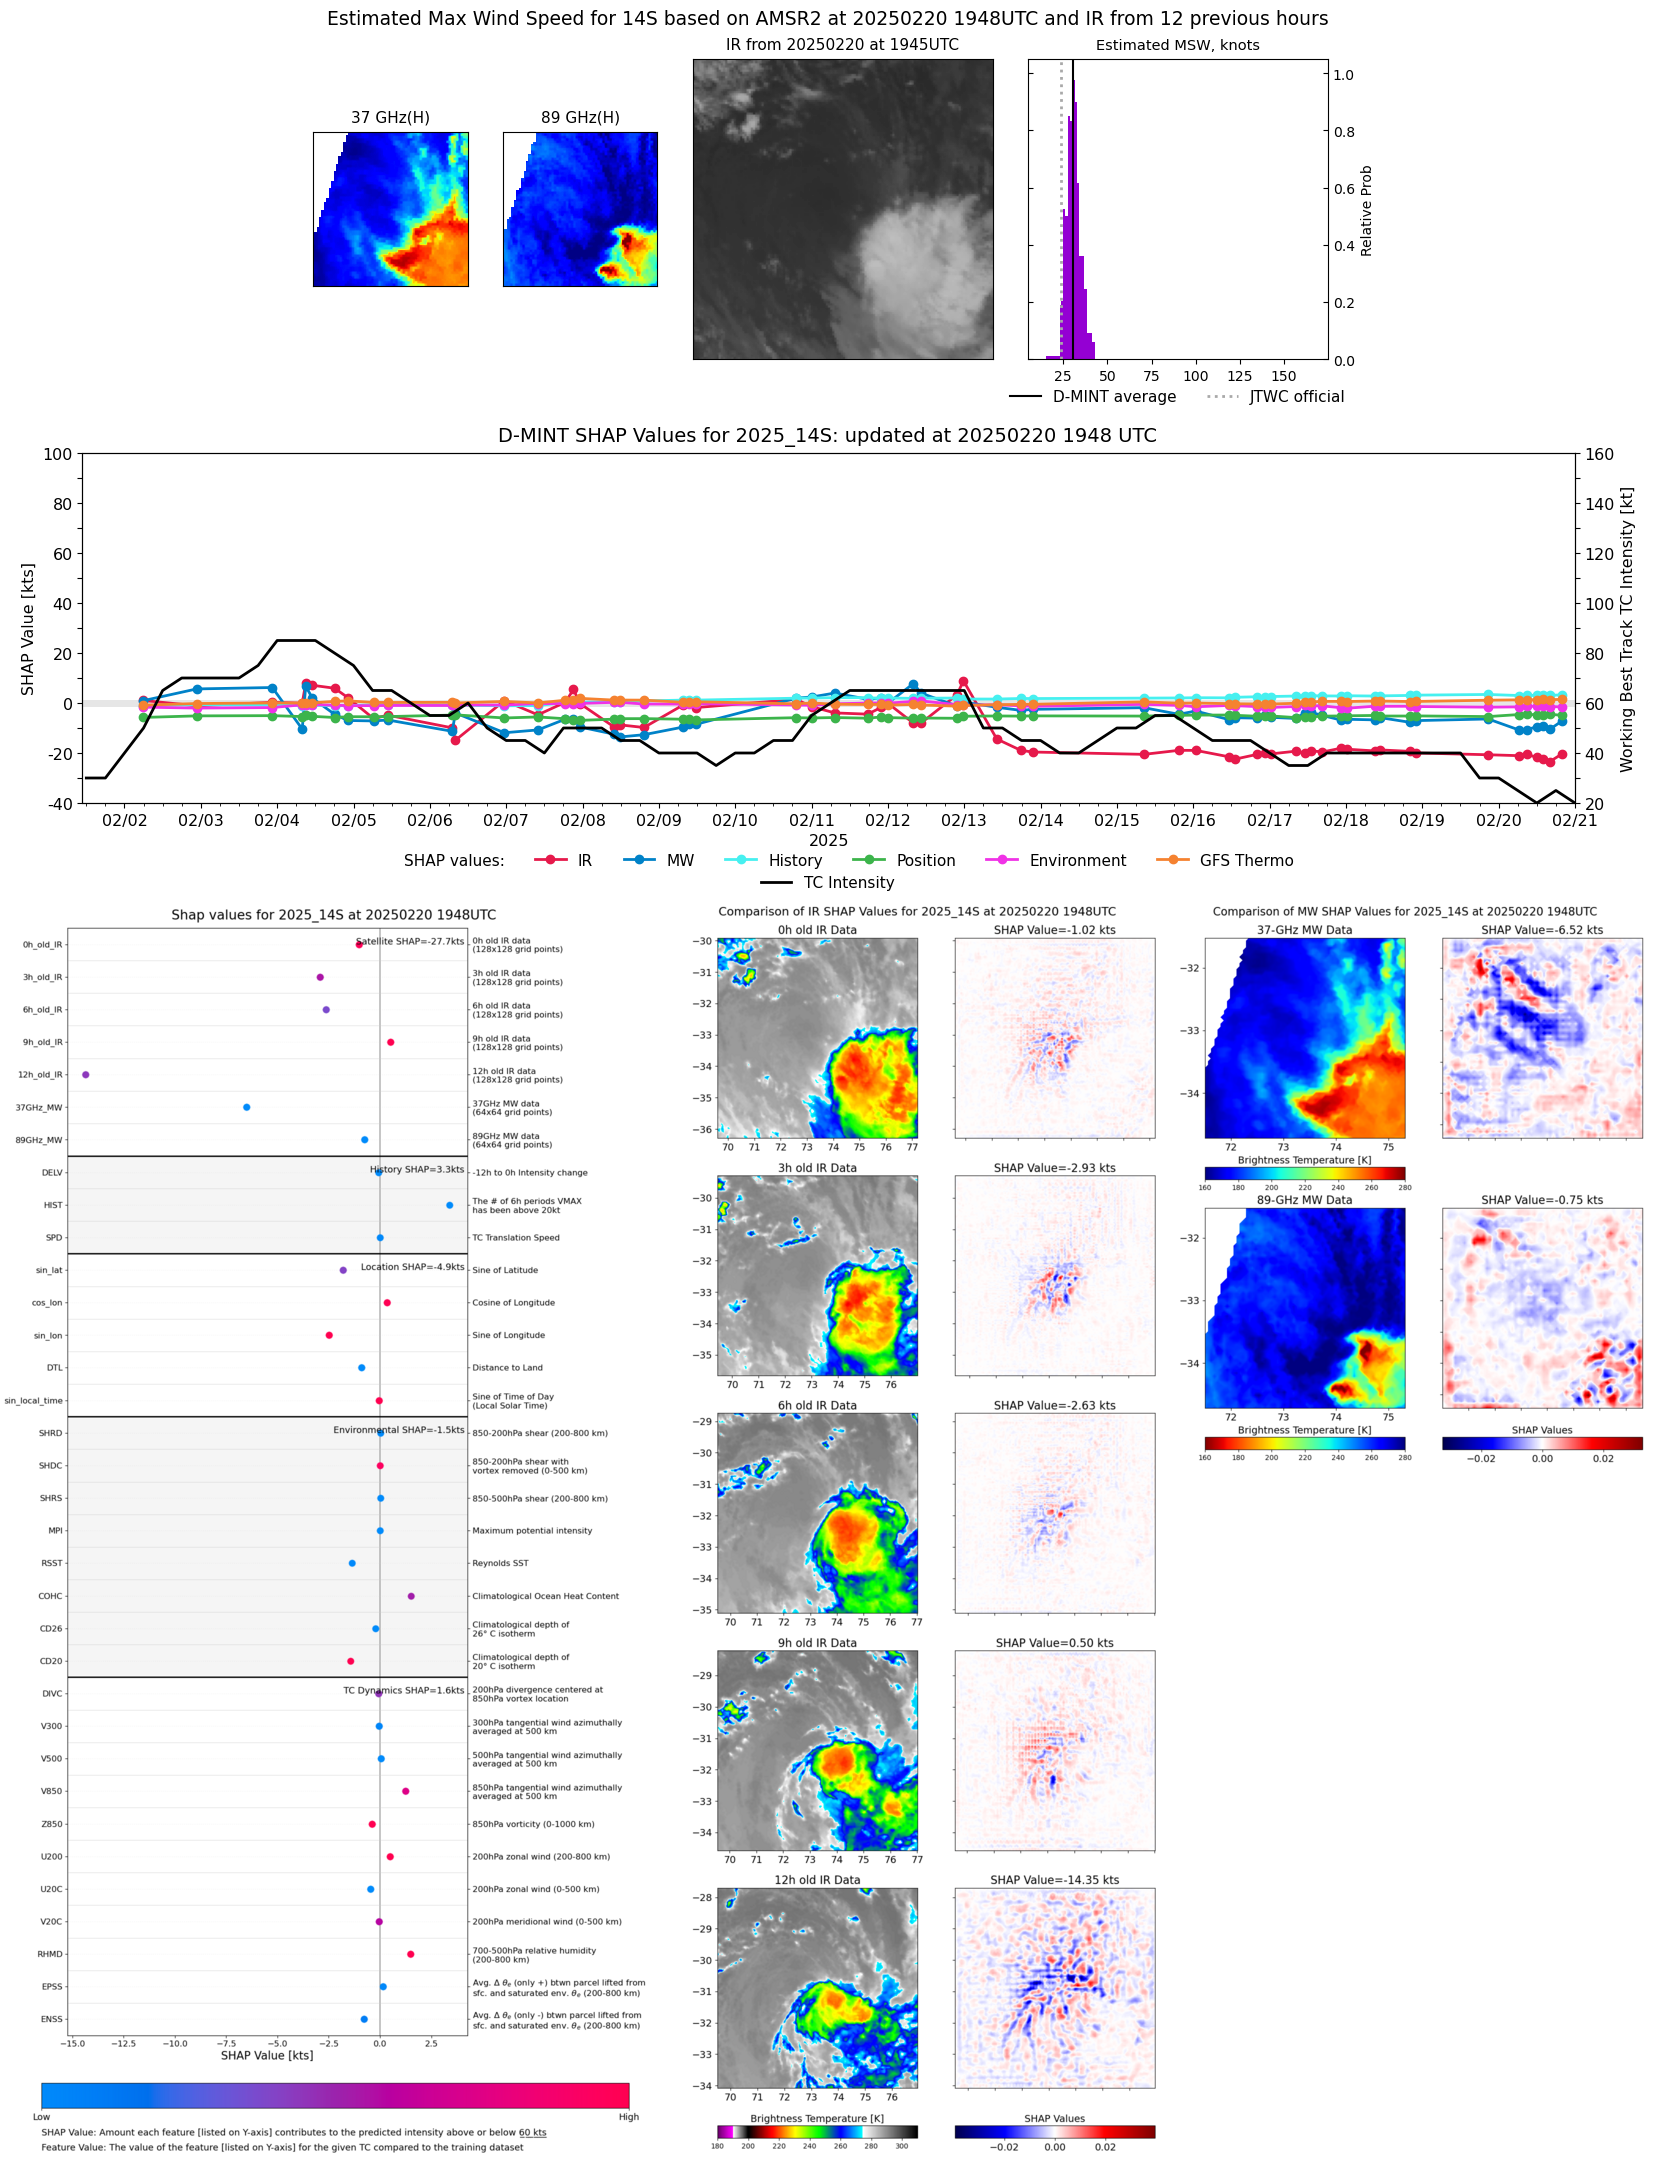 |
| 20250220 | 1607 UTC | GMI | 1005 hPa | 25 kts | 24 kts | 26 kts |  |
| 20250220 | 1358 UTC | SSMISF17 | 1003 hPa | 28 kts | 26 kts | 30 kts | 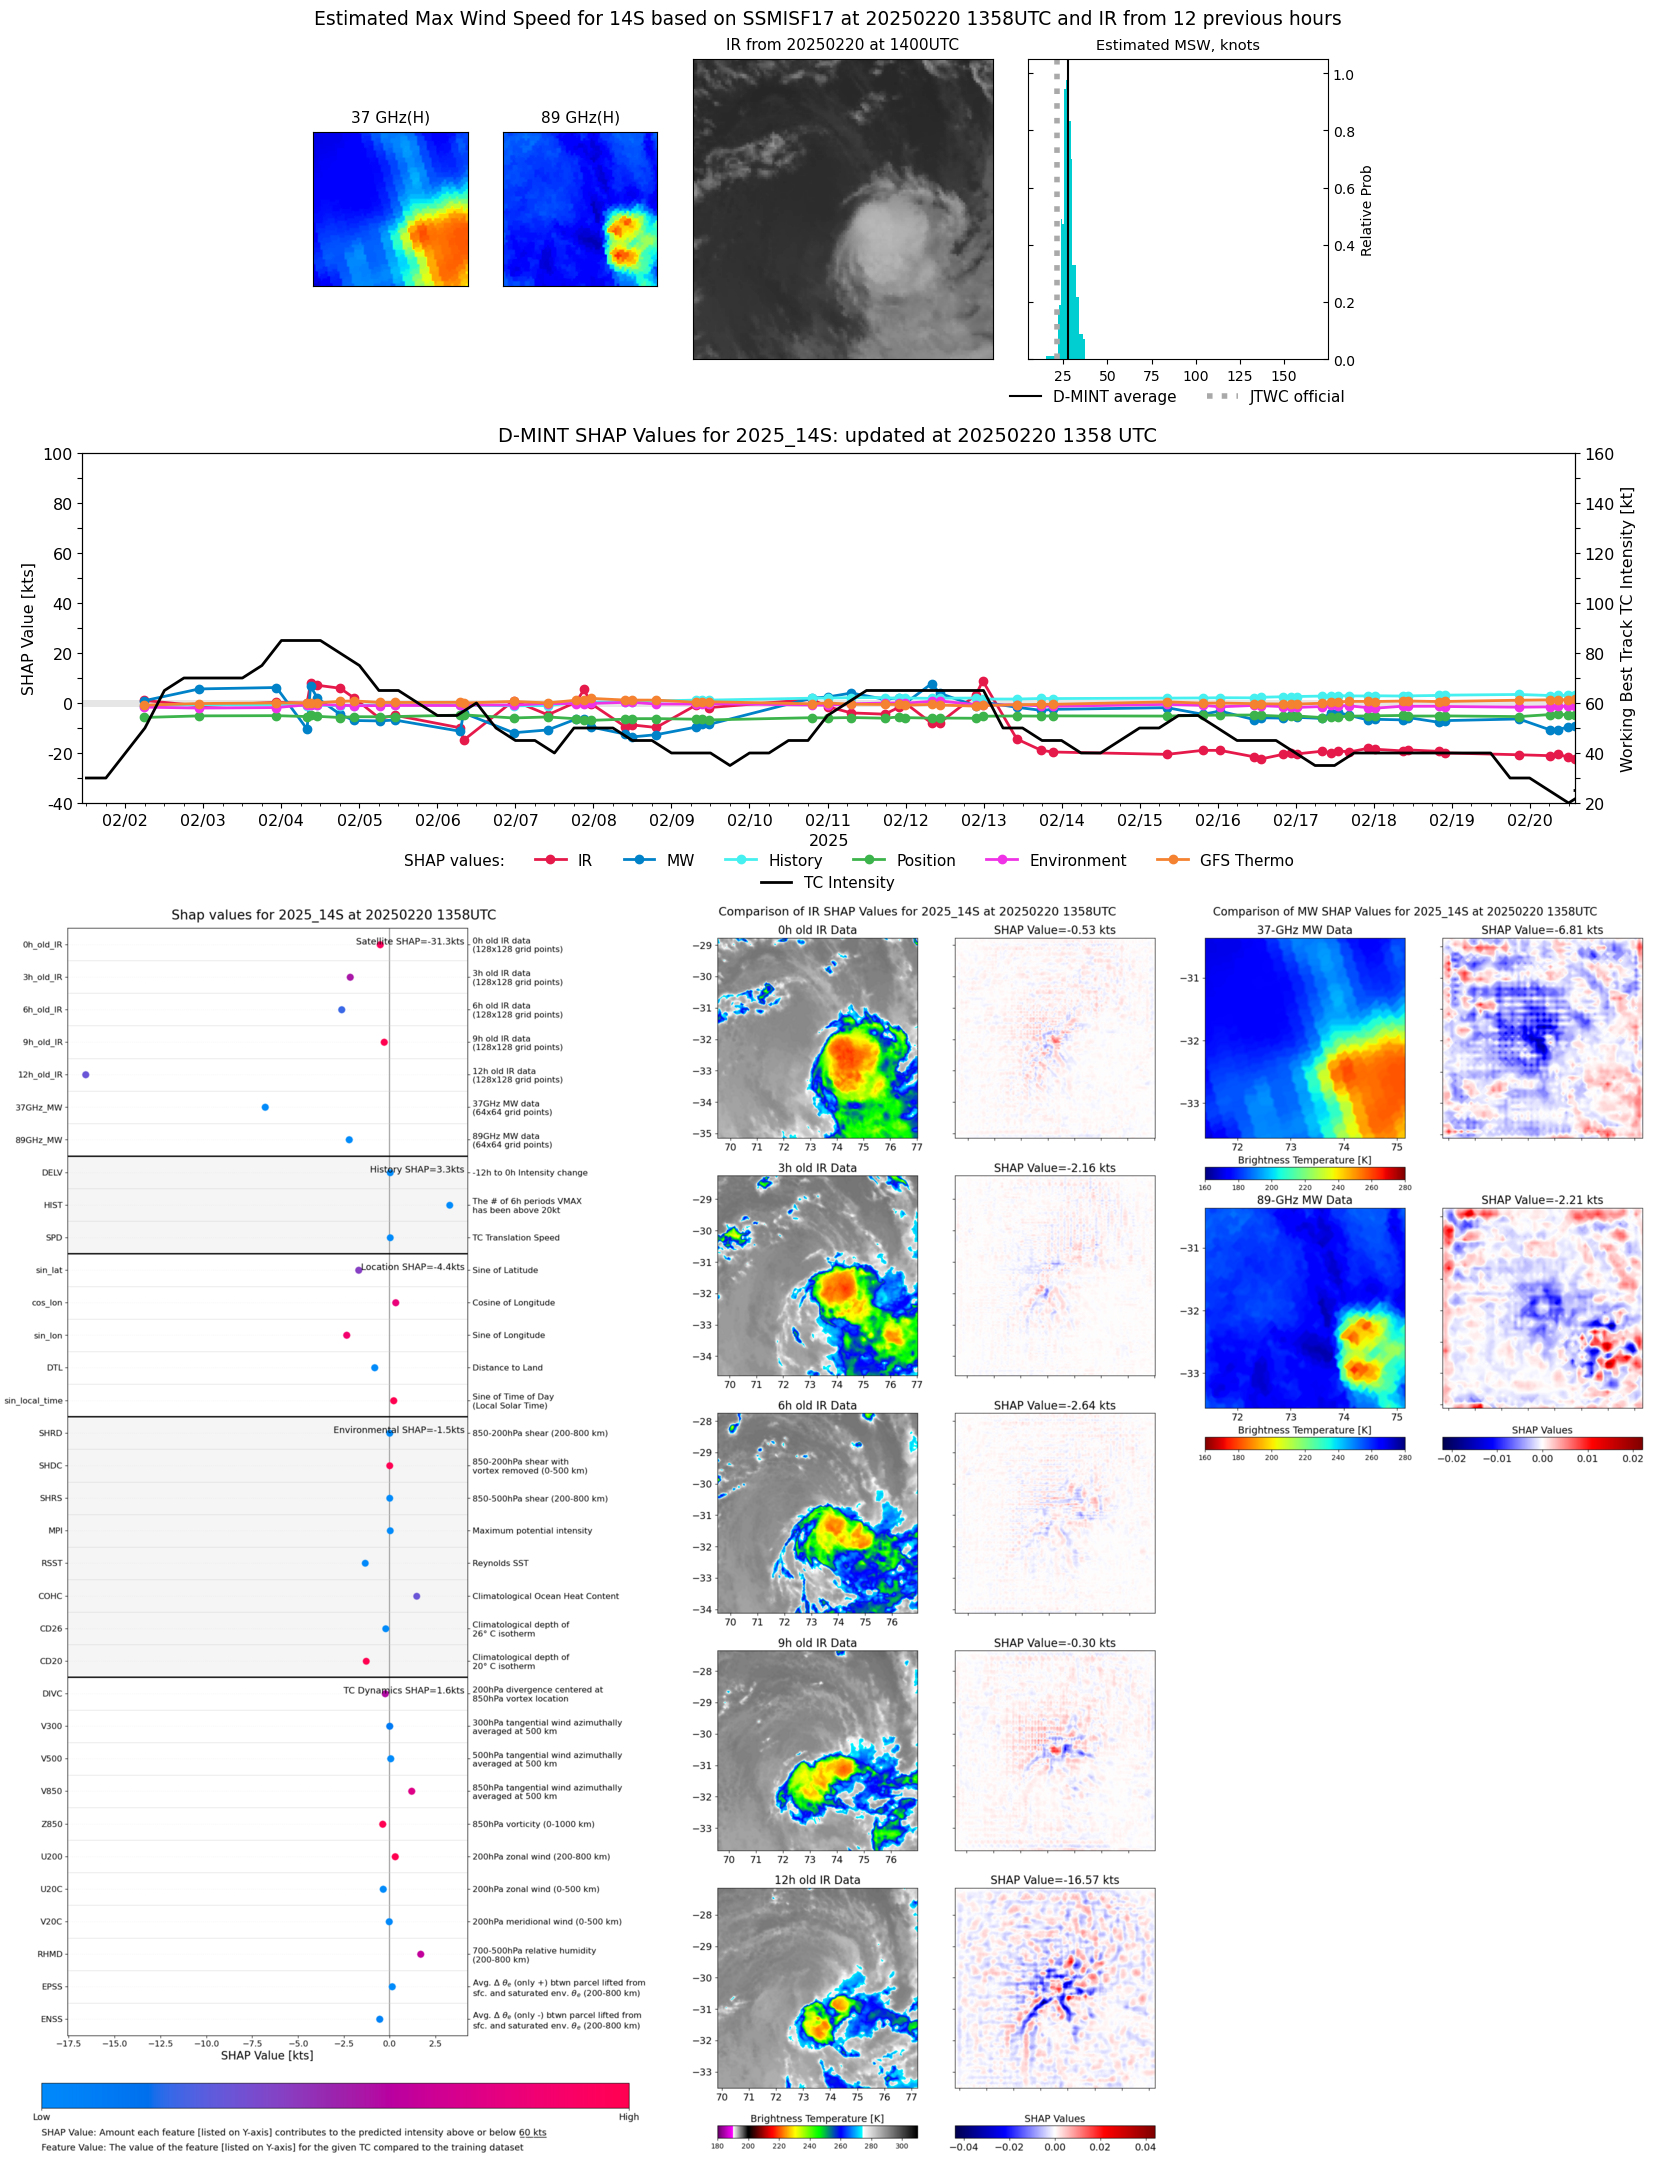 |
| 20250220 | 1157 UTC | SSMISF18 | 1003 hPa | 27 kts | 25 kts | 29 kts |  |
| 20250220 | 0847 UTC | AMSR2 | 1005 hPa | 27 kts | 26 kts | 29 kts | 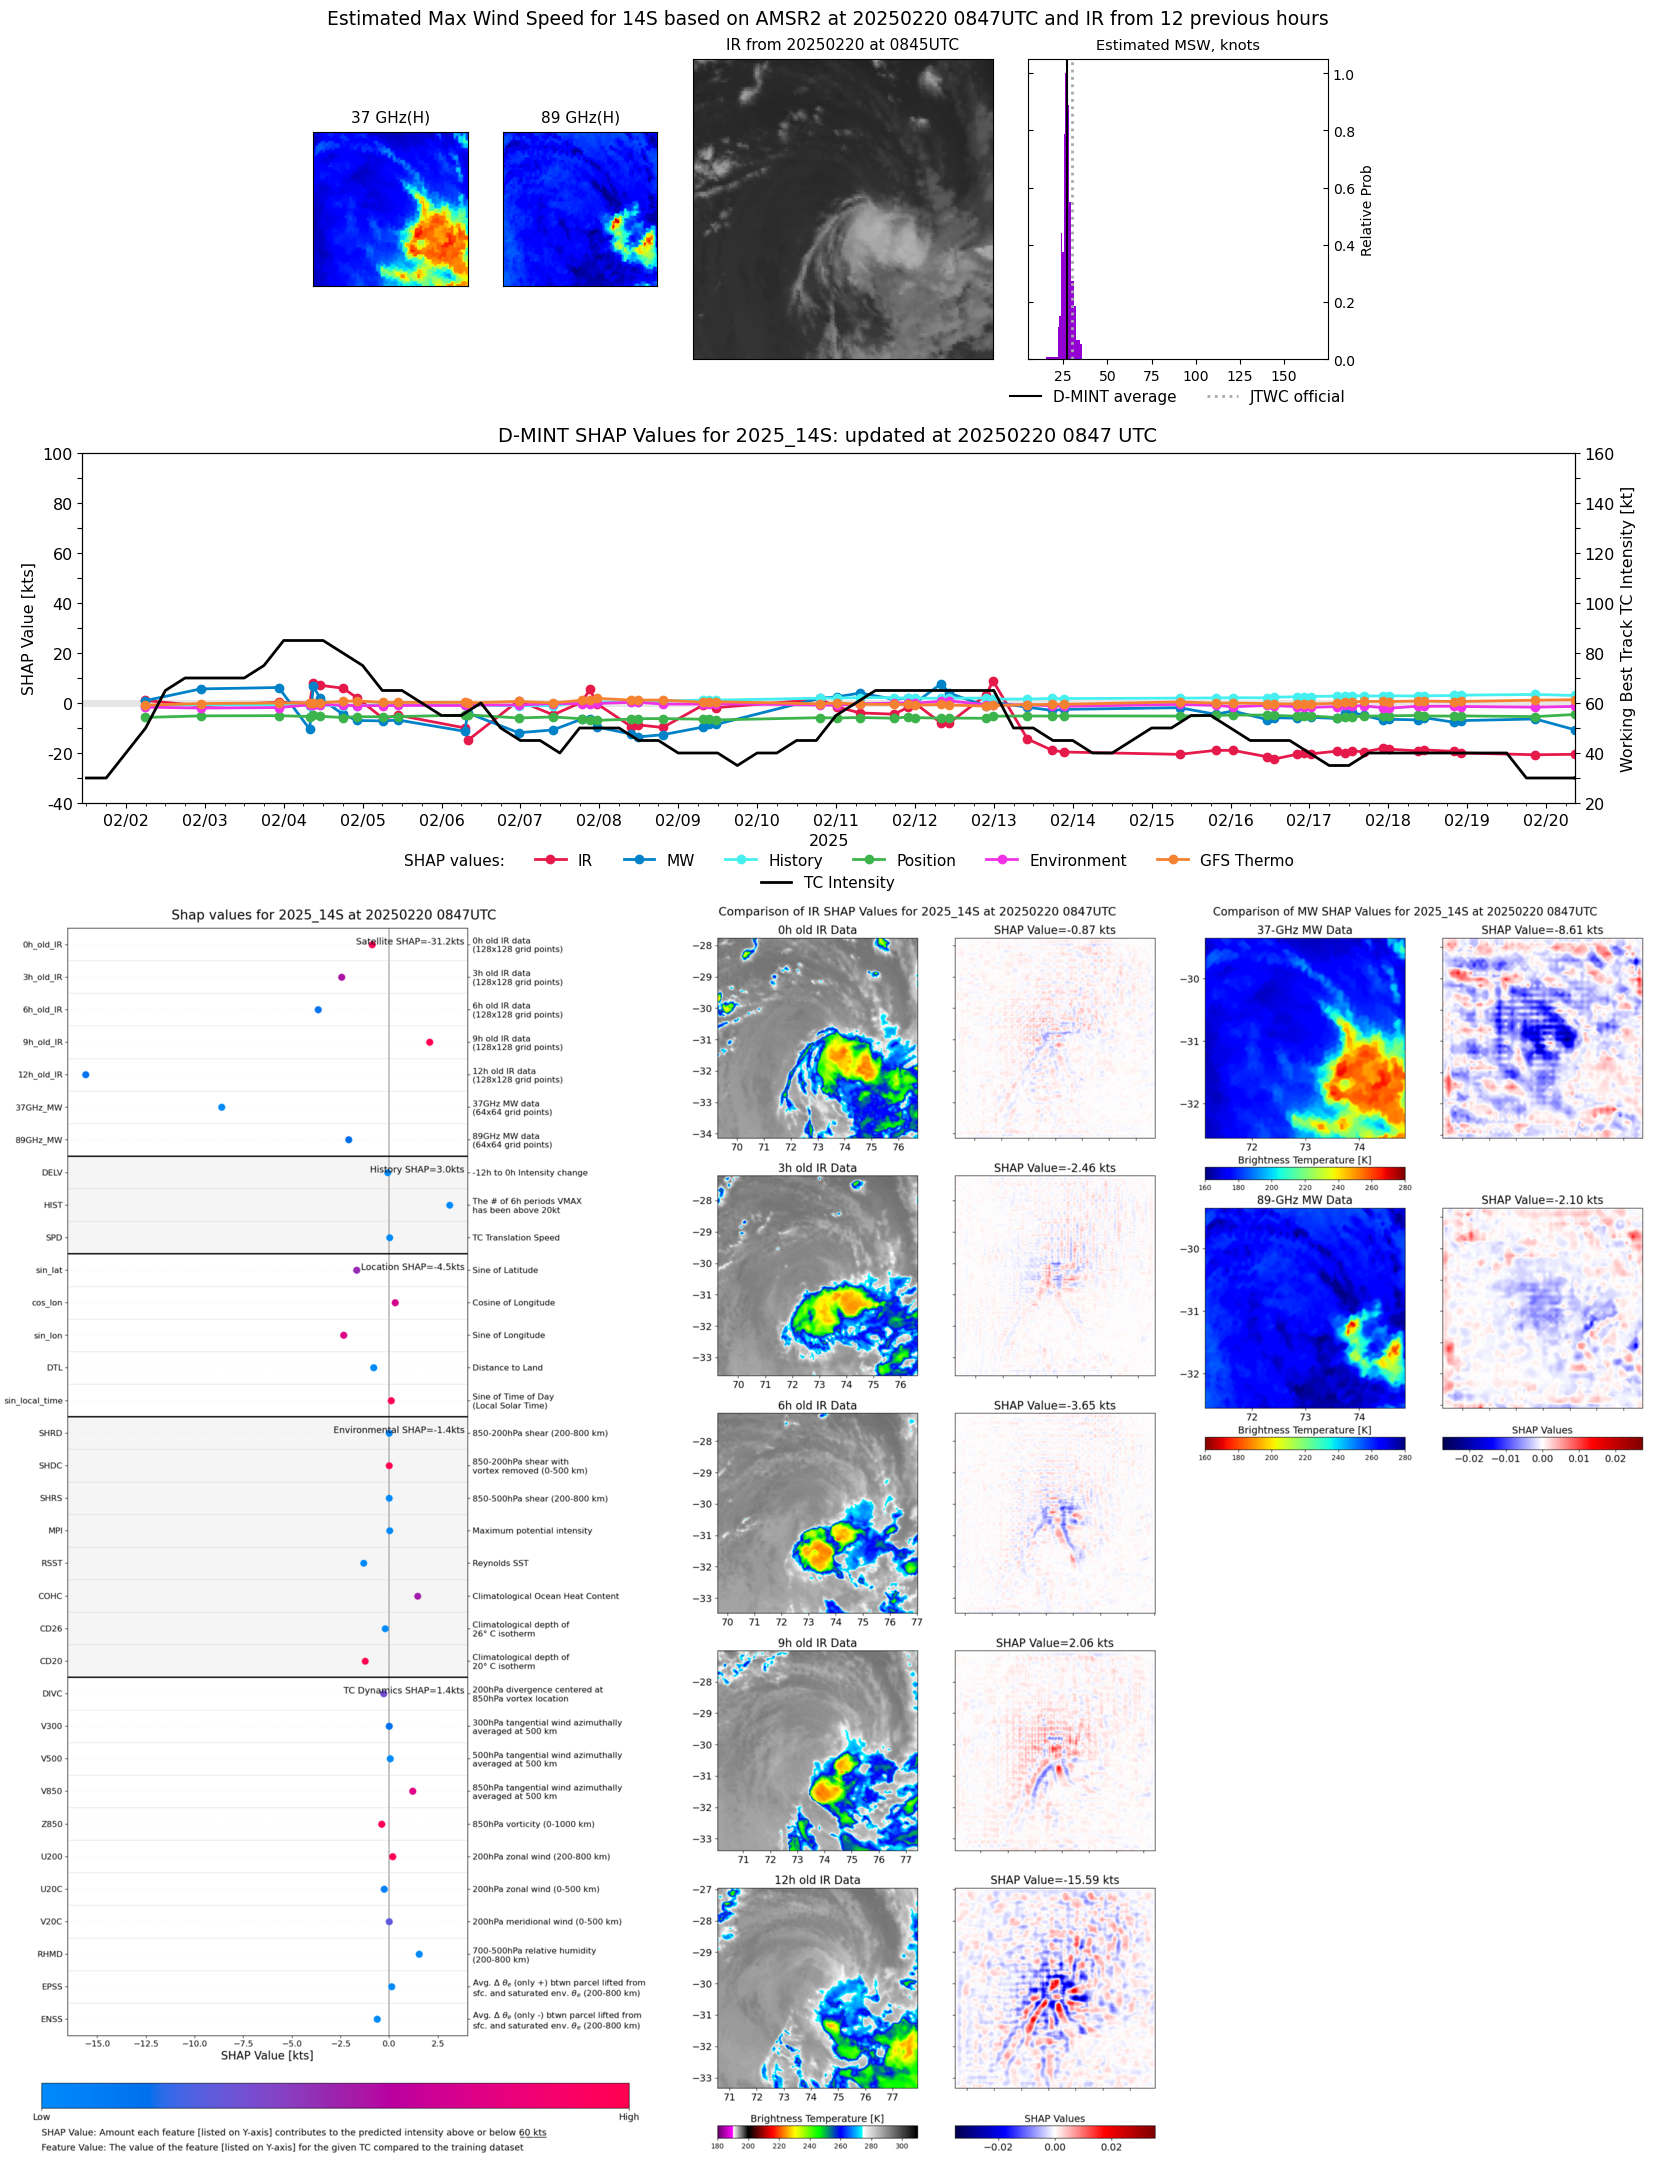 |
| 20250220 | 0615 UTC | GMI | 1007 hPa | 26 kts | 25 kts | 28 kts | 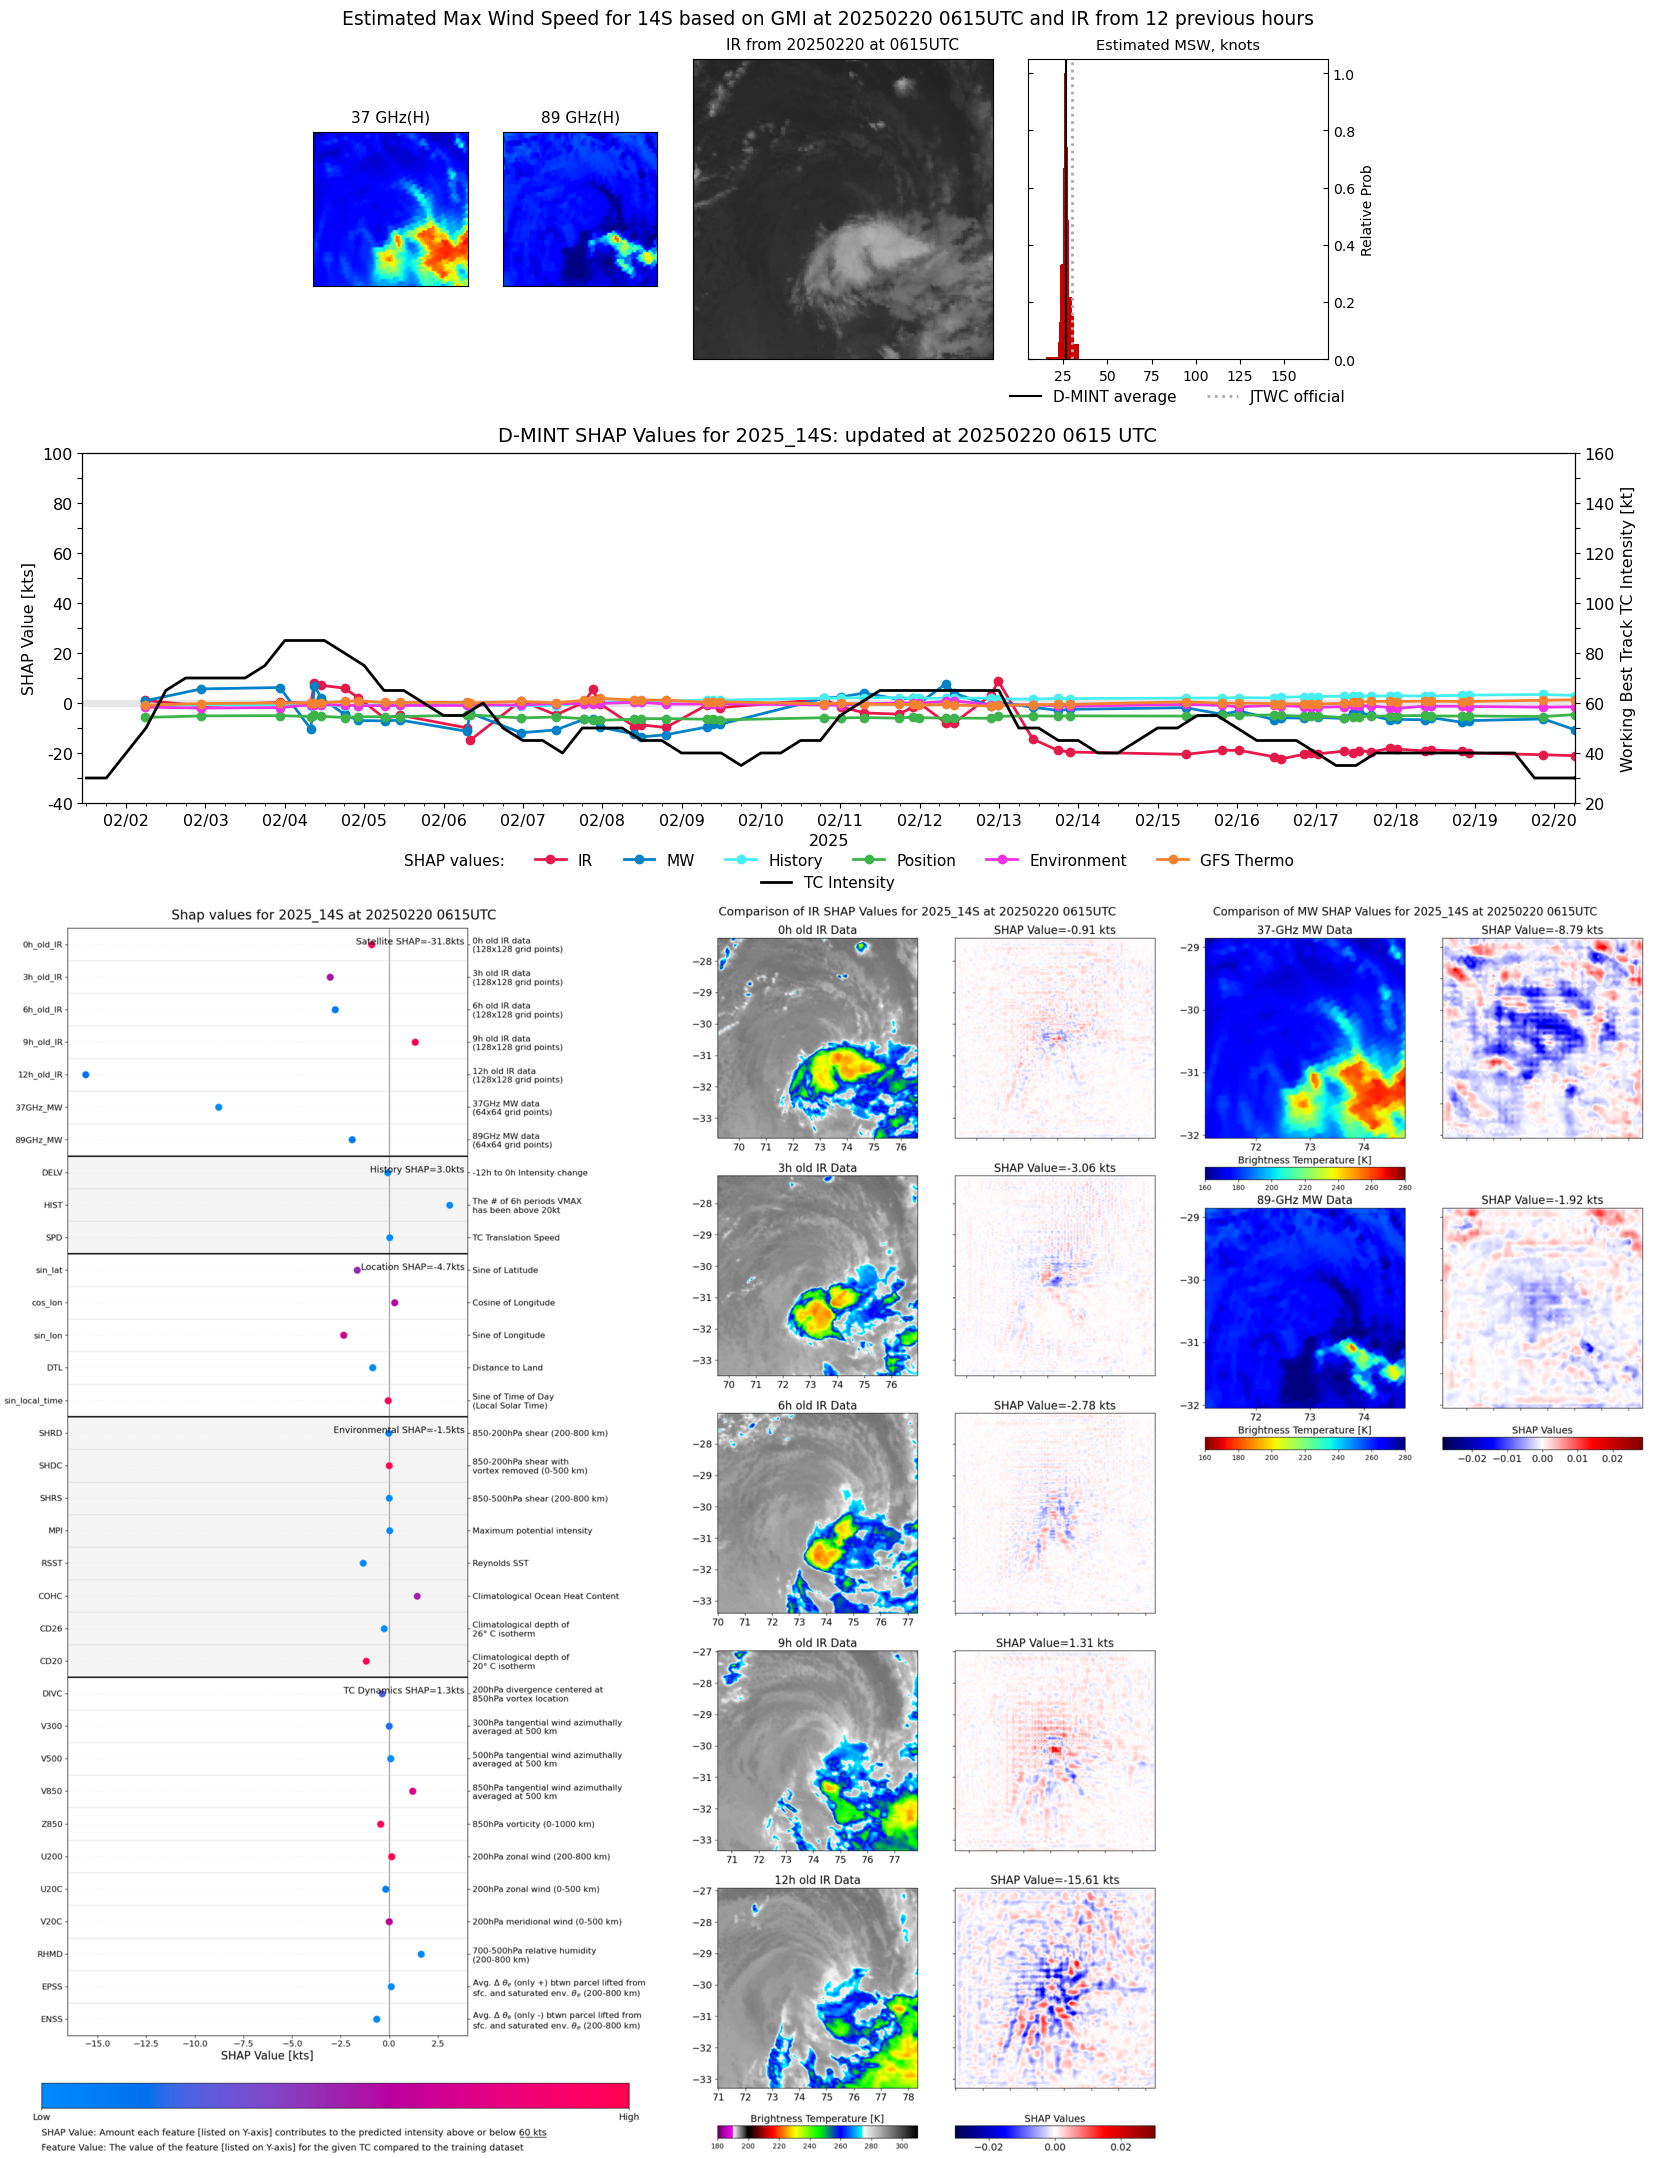 |
| 20250220 | 0035 UTC | SSMISF16 | 1004 hPa | 29 kts | 26 kts | 32 kts | 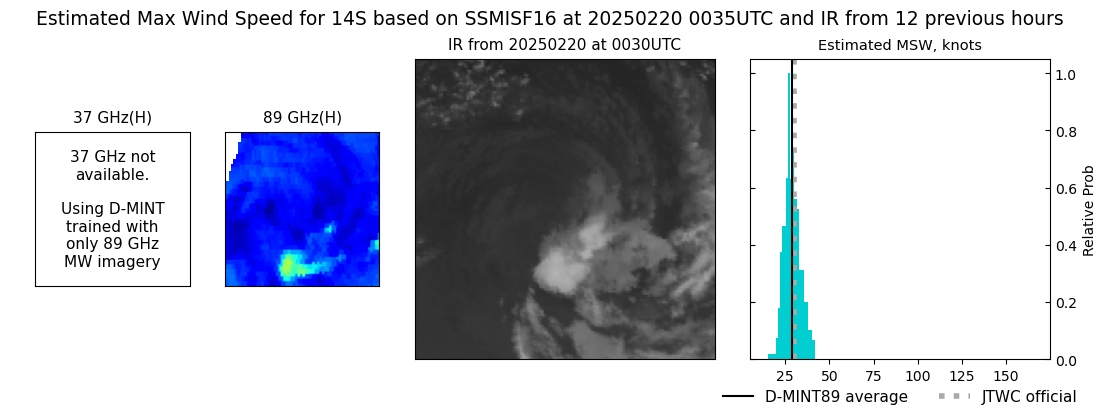 |
| 20250219 | 2042 UTC | AMSR2 | 1000 hPa | 30 kts | 28 kts | 33 kts |  |
| 20250219 | 1315 UTC | SSMISF16 | 1002 hPa | 28 kts | 25 kts | 31 kts | 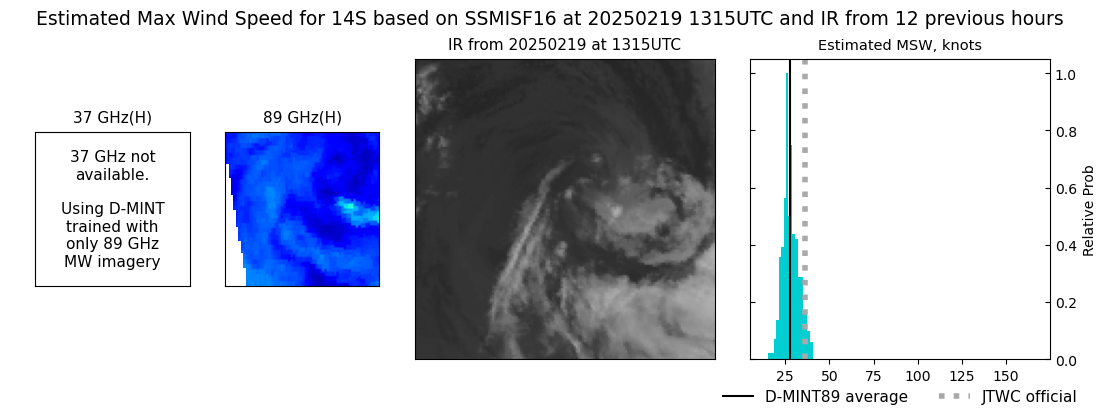 |
| 20250219 | 0048 UTC | SSMISF16 | 1002 hPa | 28 kts | 25 kts | 32 kts |  |
| 20250218 | 2205 UTC | SSMISF18 | 1004 hPa | 30 kts | 28 kts | 33 kts |  |
| 20250218 | 1959 UTC | AMSR2 | 1004 hPa | 30 kts | 28 kts | 33 kts | 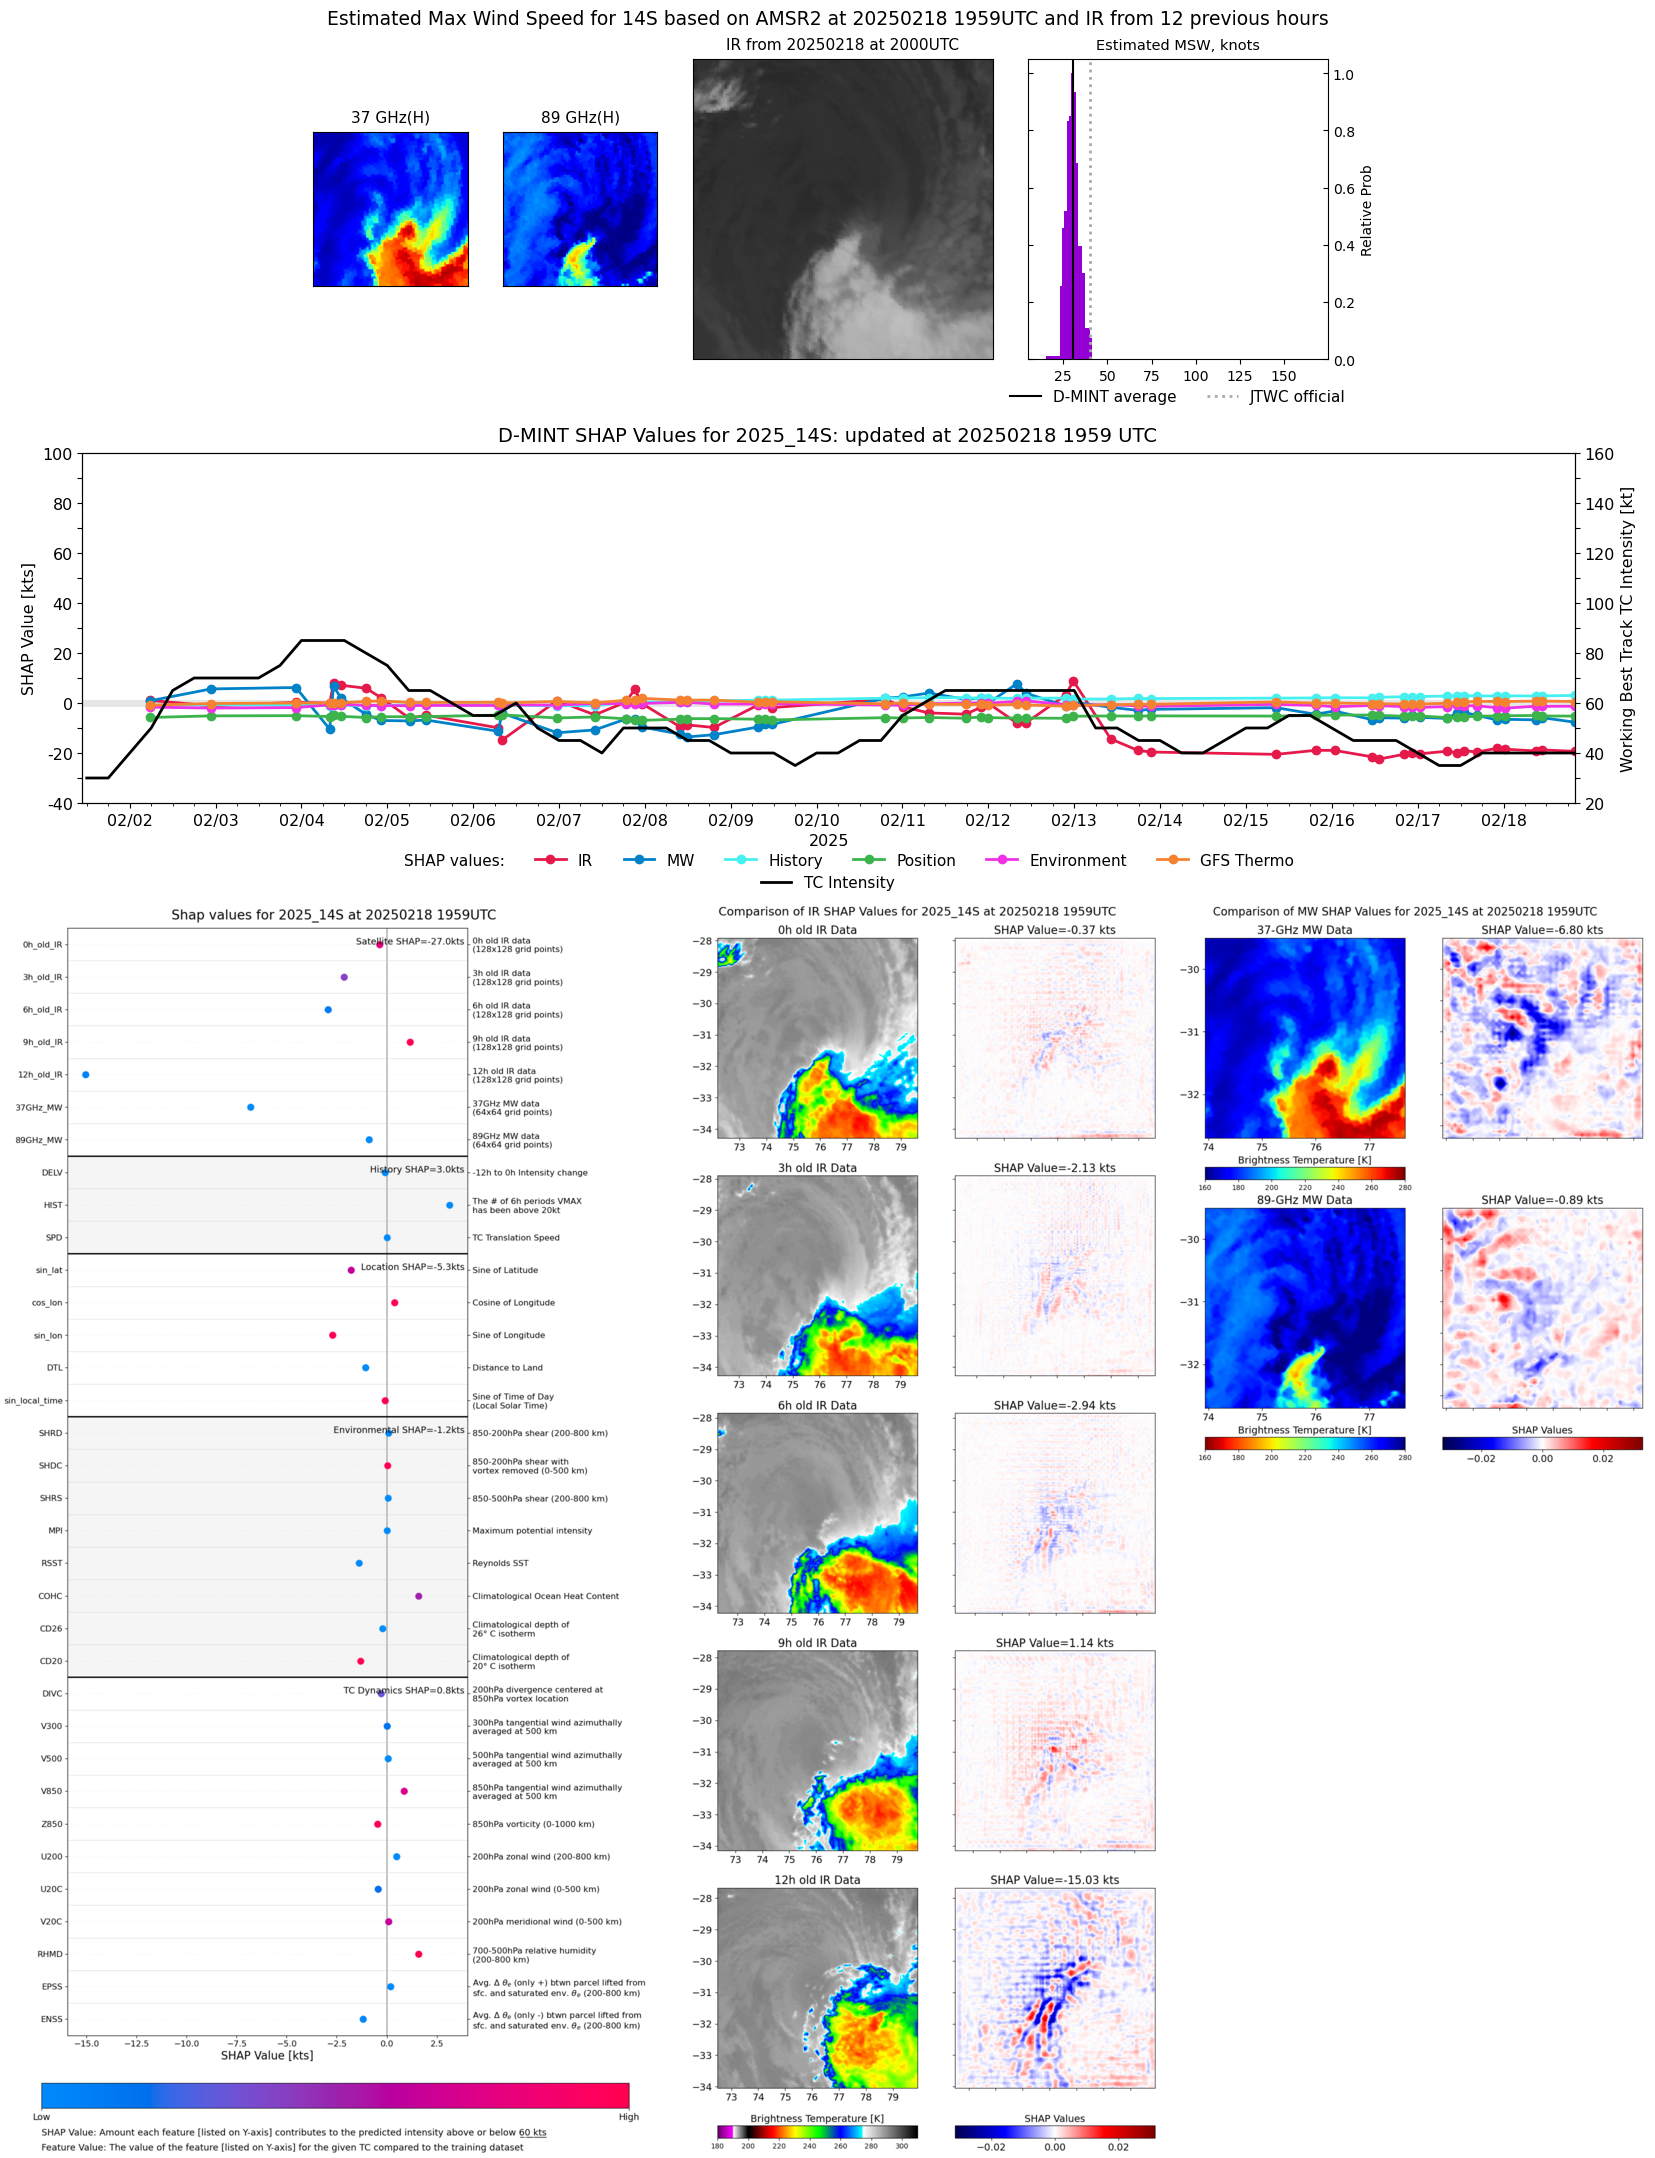 |
| 20250218 | 1328 UTC | SSMISF16 | 1003 hPa | 28 kts | 25 kts | 31 kts |  |
| 20250218 | 1044 UTC | SSMISF18 | 1002 hPa | 33 kts | 29 kts | 36 kts | 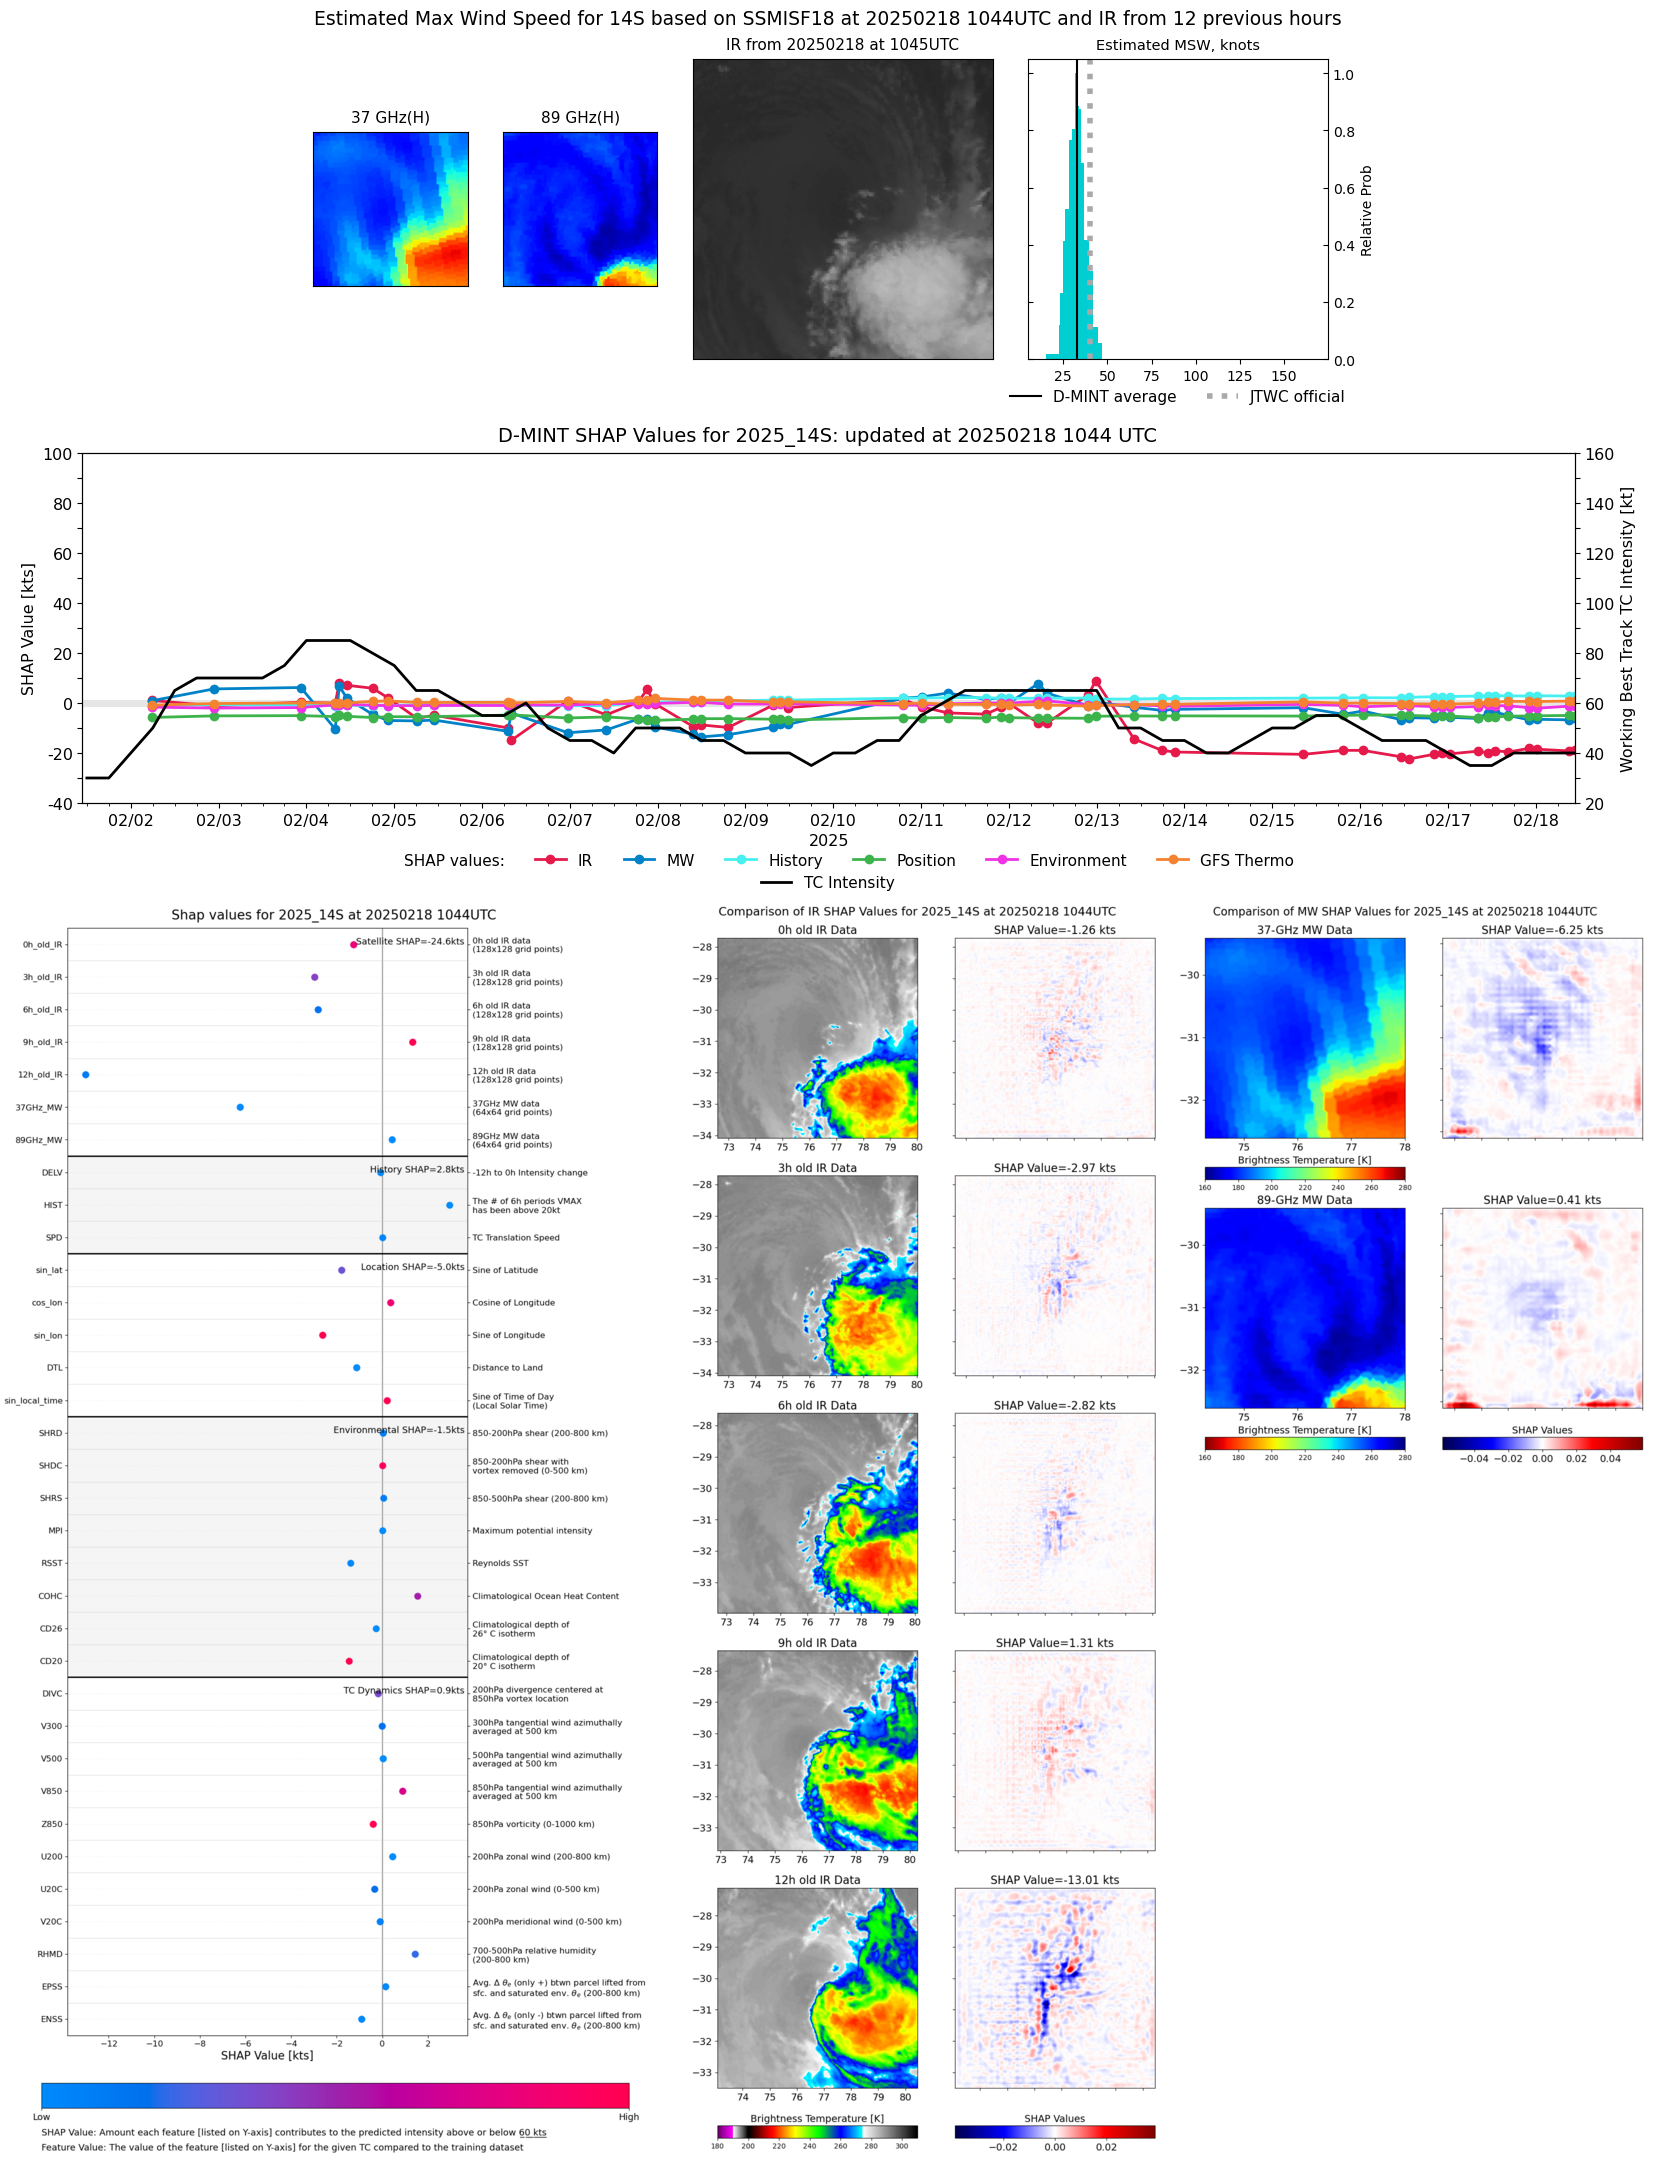 |
| 20250218 | 0859 UTC | AMSR2 | 1001 hPa | 32 kts | 29 kts | 35 kts |  |
| 20250218 | 0101 UTC | SSMISF16 | 1003 hPa | 28 kts | 24 kts | 31 kts | 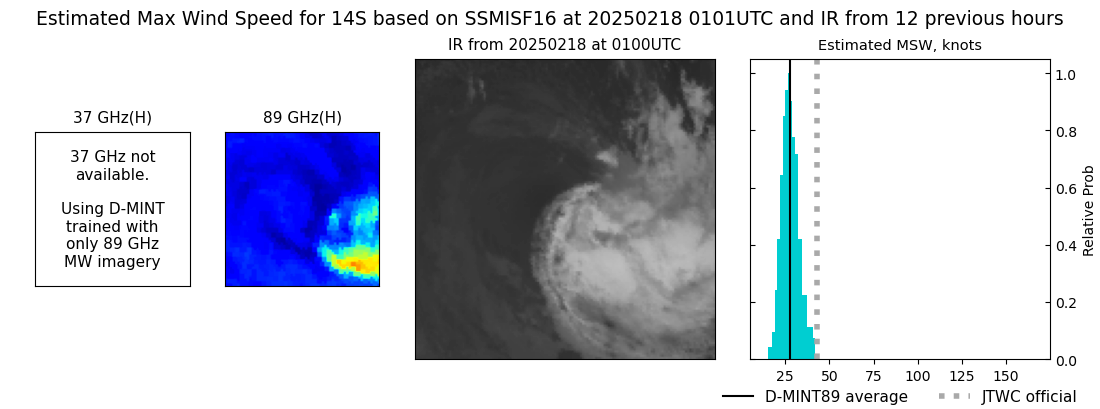 |
| 20250218 | 0019 UTC | SSMISF17 | 1002 hPa | 31 kts | 28 kts | 35 kts | 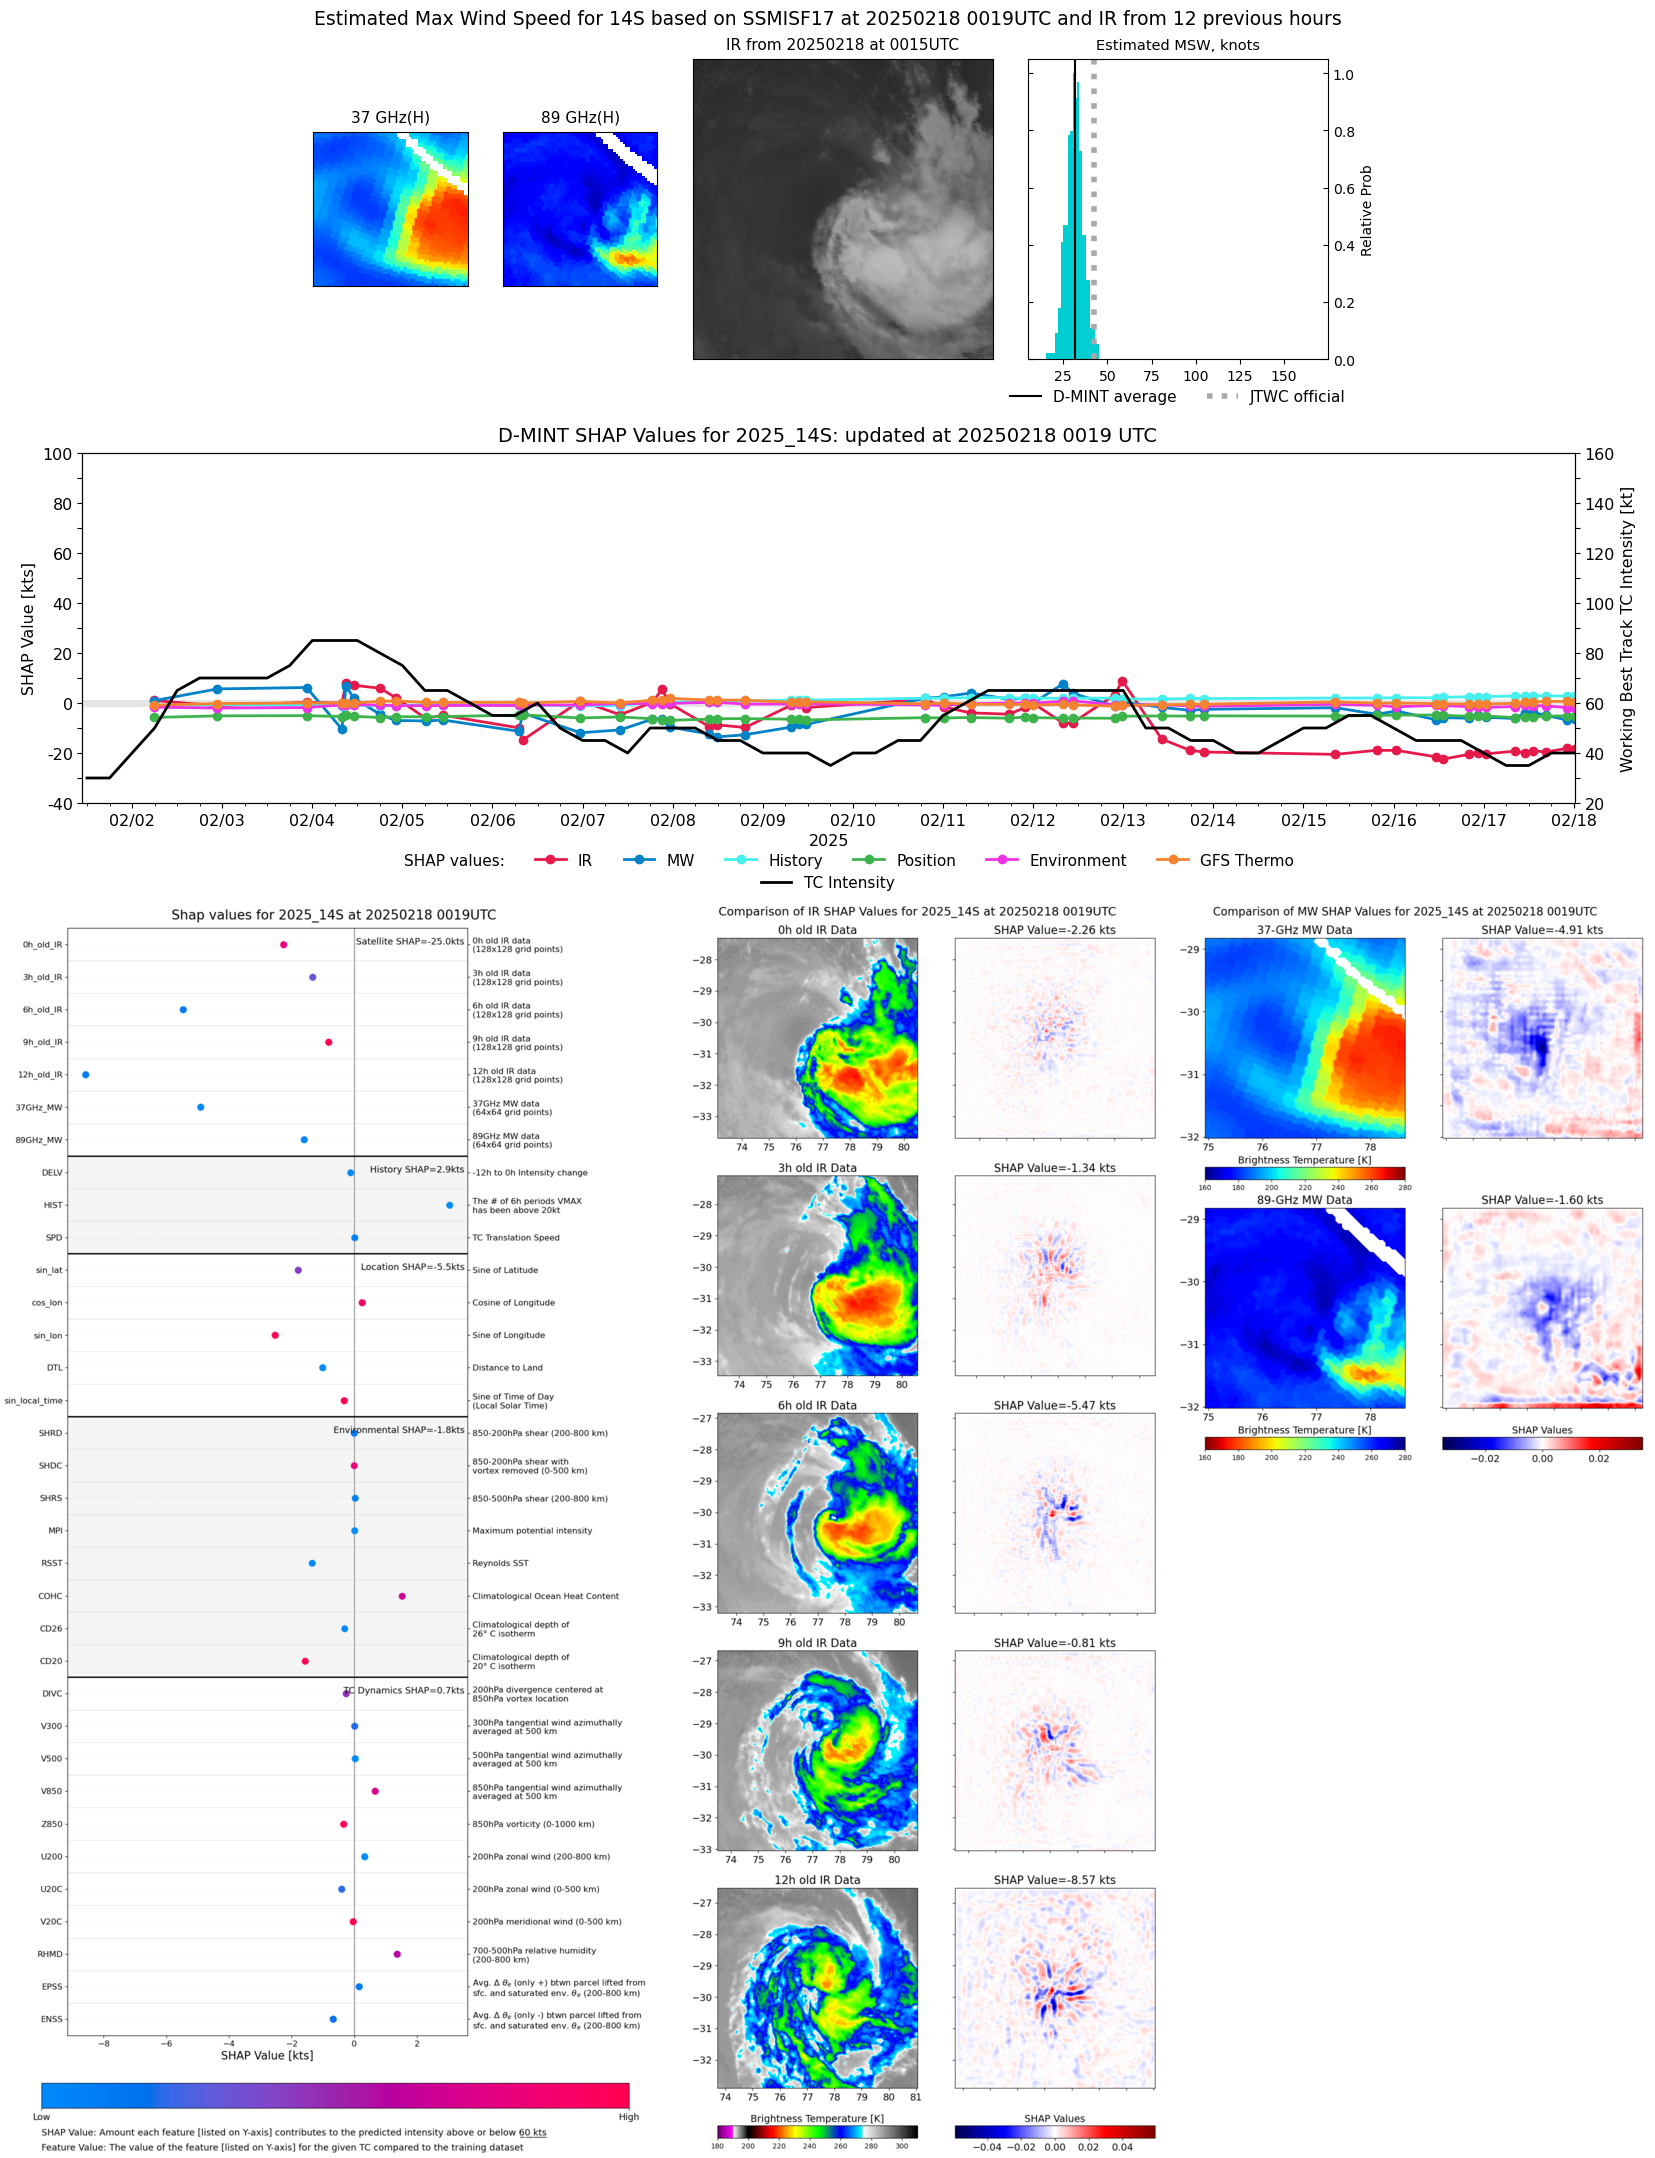 |
| 20250217 | 2217 UTC | SSMISF18 | 1004 hPa | 32 kts | 28 kts | 35 kts |  |
| 20250217 | 1633 UTC | GMI | 1002 hPa | 33 kts | 29 kts | 36 kts | 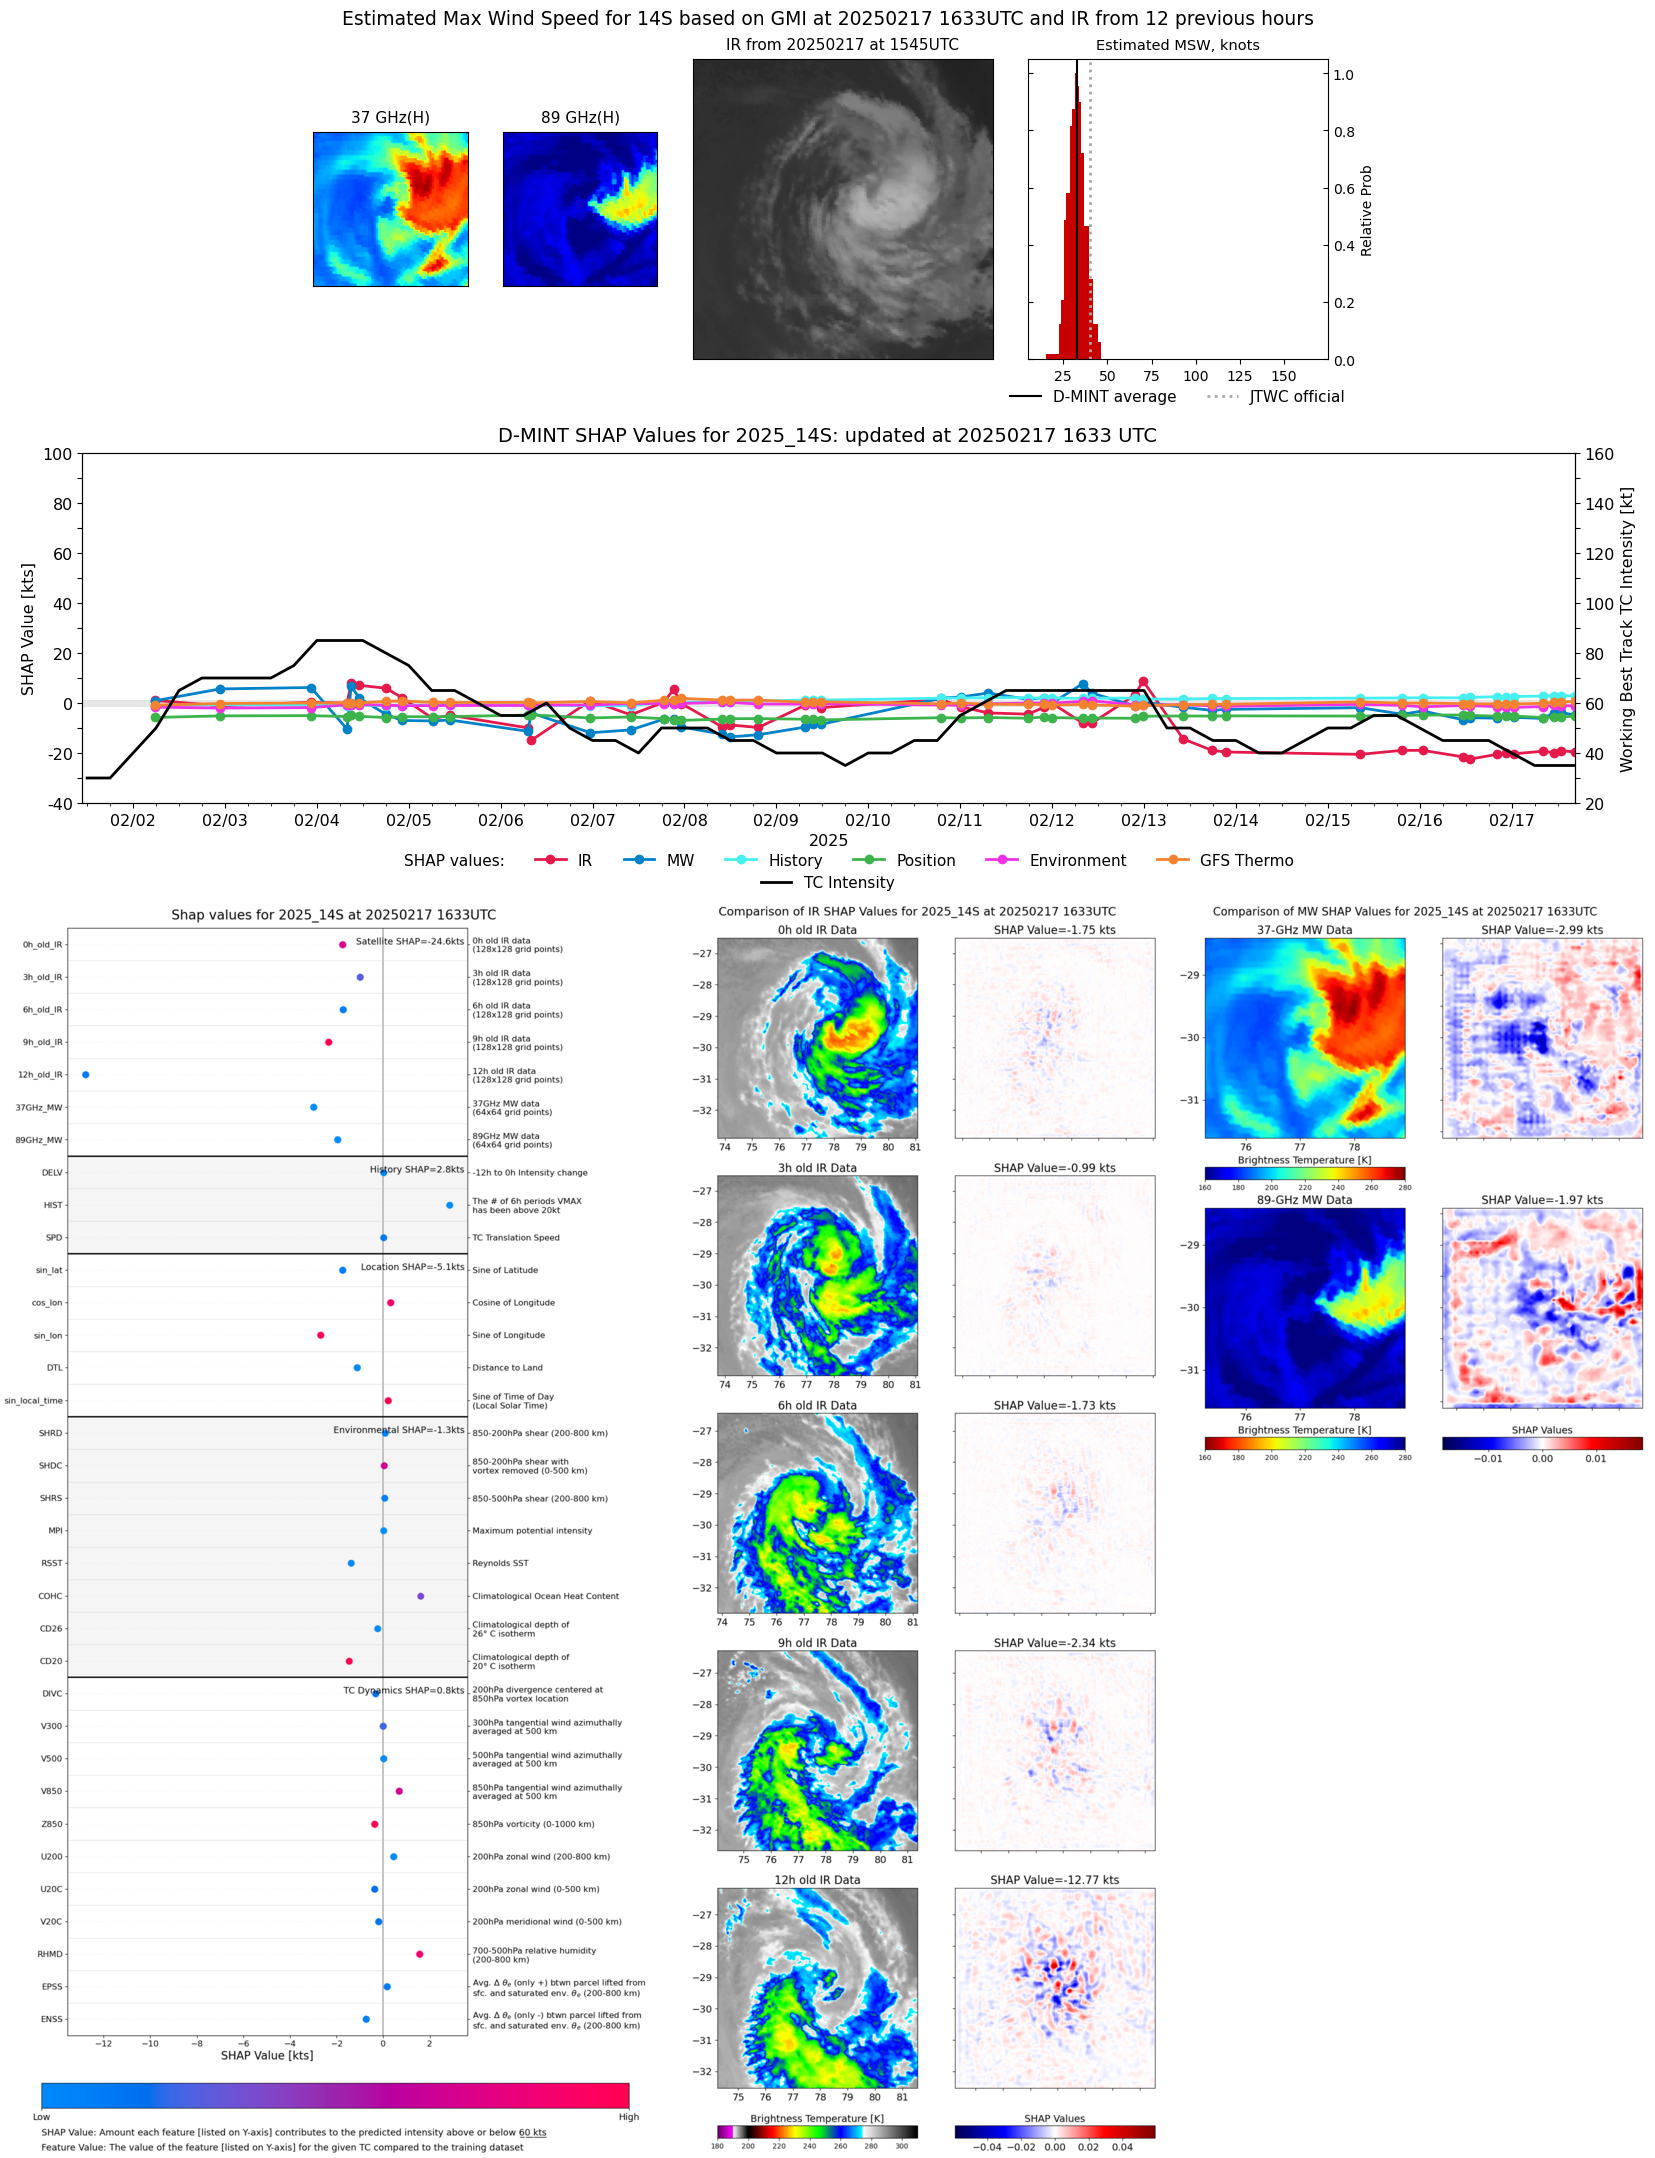 |
| 20250217 | 1342 UTC | SSMISF16 | 999 hPa | 33 kts | 29 kts | 38 kts |  |
| 20250217 | 1300 UTC | SSMISF17 | 1002 hPa | 34 kts | 30 kts | 38 kts |  |
| 20250217 | 1058 UTC | SSMISF18 | 1002 hPa | 33 kts | 29 kts | 37 kts |  |
| 20250217 | 0817 UTC | AMSR2 | 1004 hPa | 30 kts | 27 kts | 33 kts | 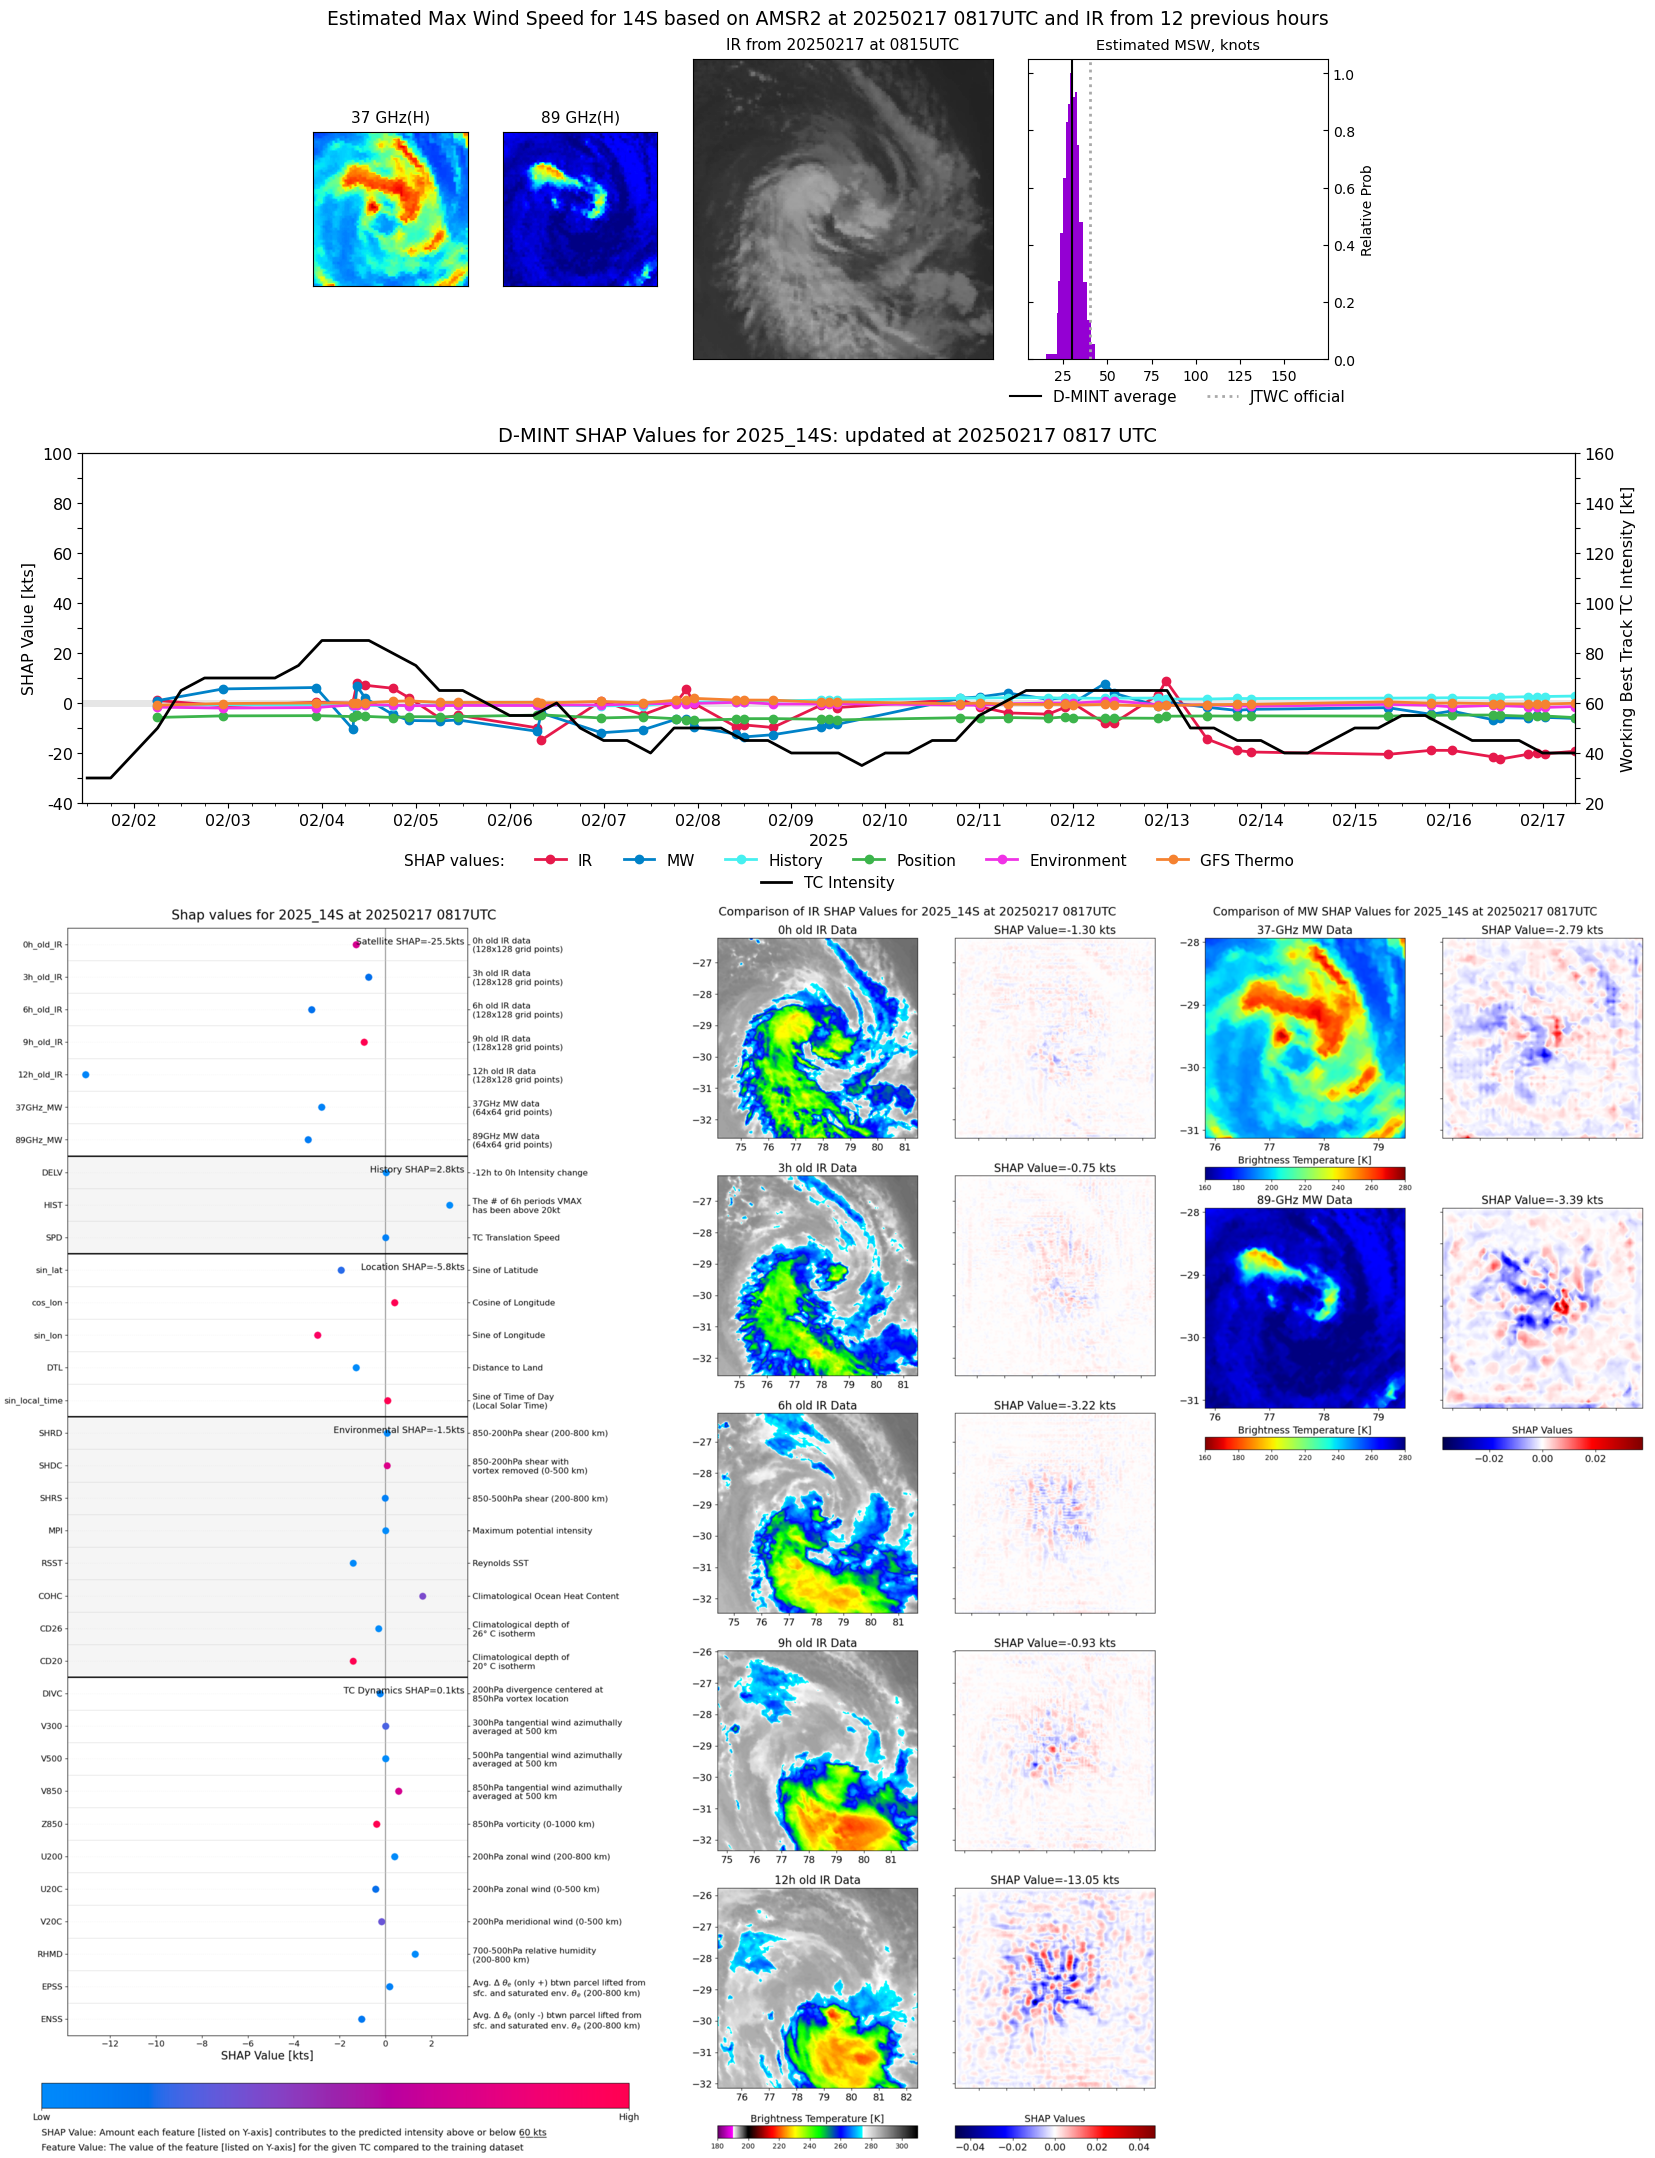 |
| 20250217 | 0643 UTC | GMI | 998 hPa | 31 kts | 28 kts | 34 kts | 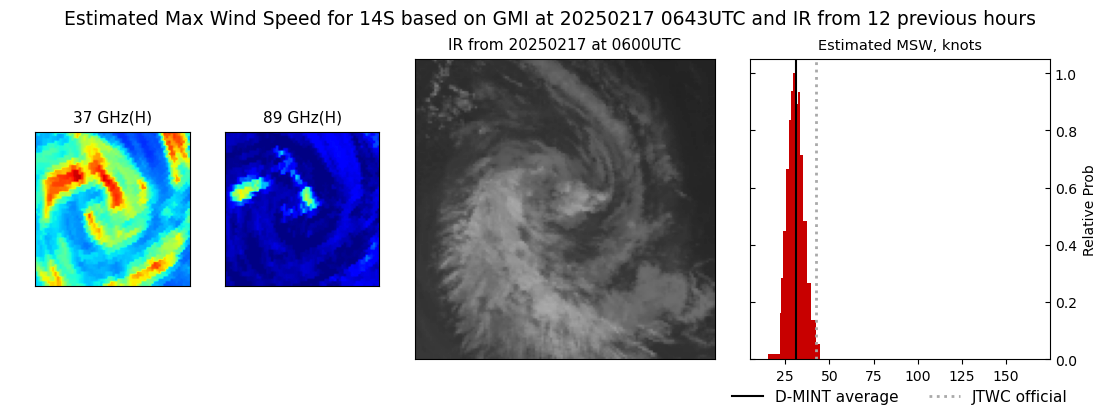 |
| 20250217 | 0115 UTC | SSMISF16 | 1000 hPa | 26 kts | 23 kts | 30 kts | 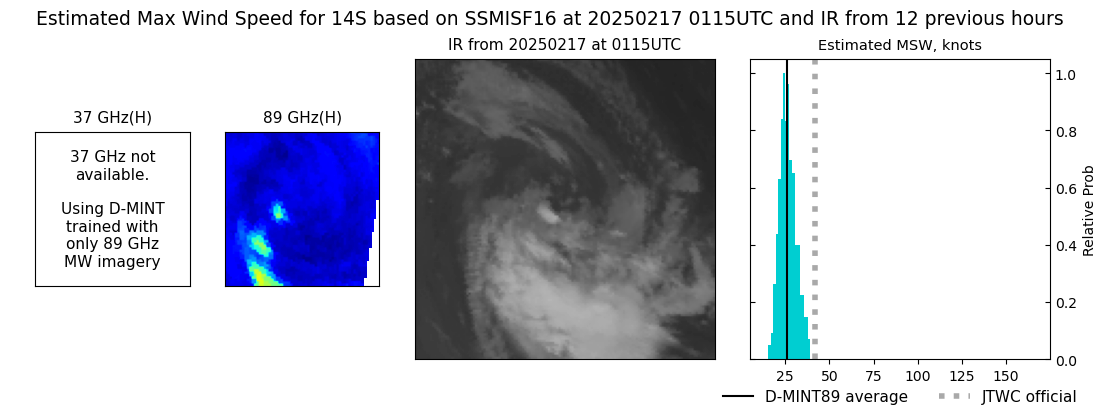 |
| 20250217 | 0032 UTC | SSMISF17 | 999 hPa | 29 kts | 27 kts | 32 kts |  |
| 20250216 | 2230 UTC | SSMISF18 | 998 hPa | 30 kts | 27 kts | 33 kts | 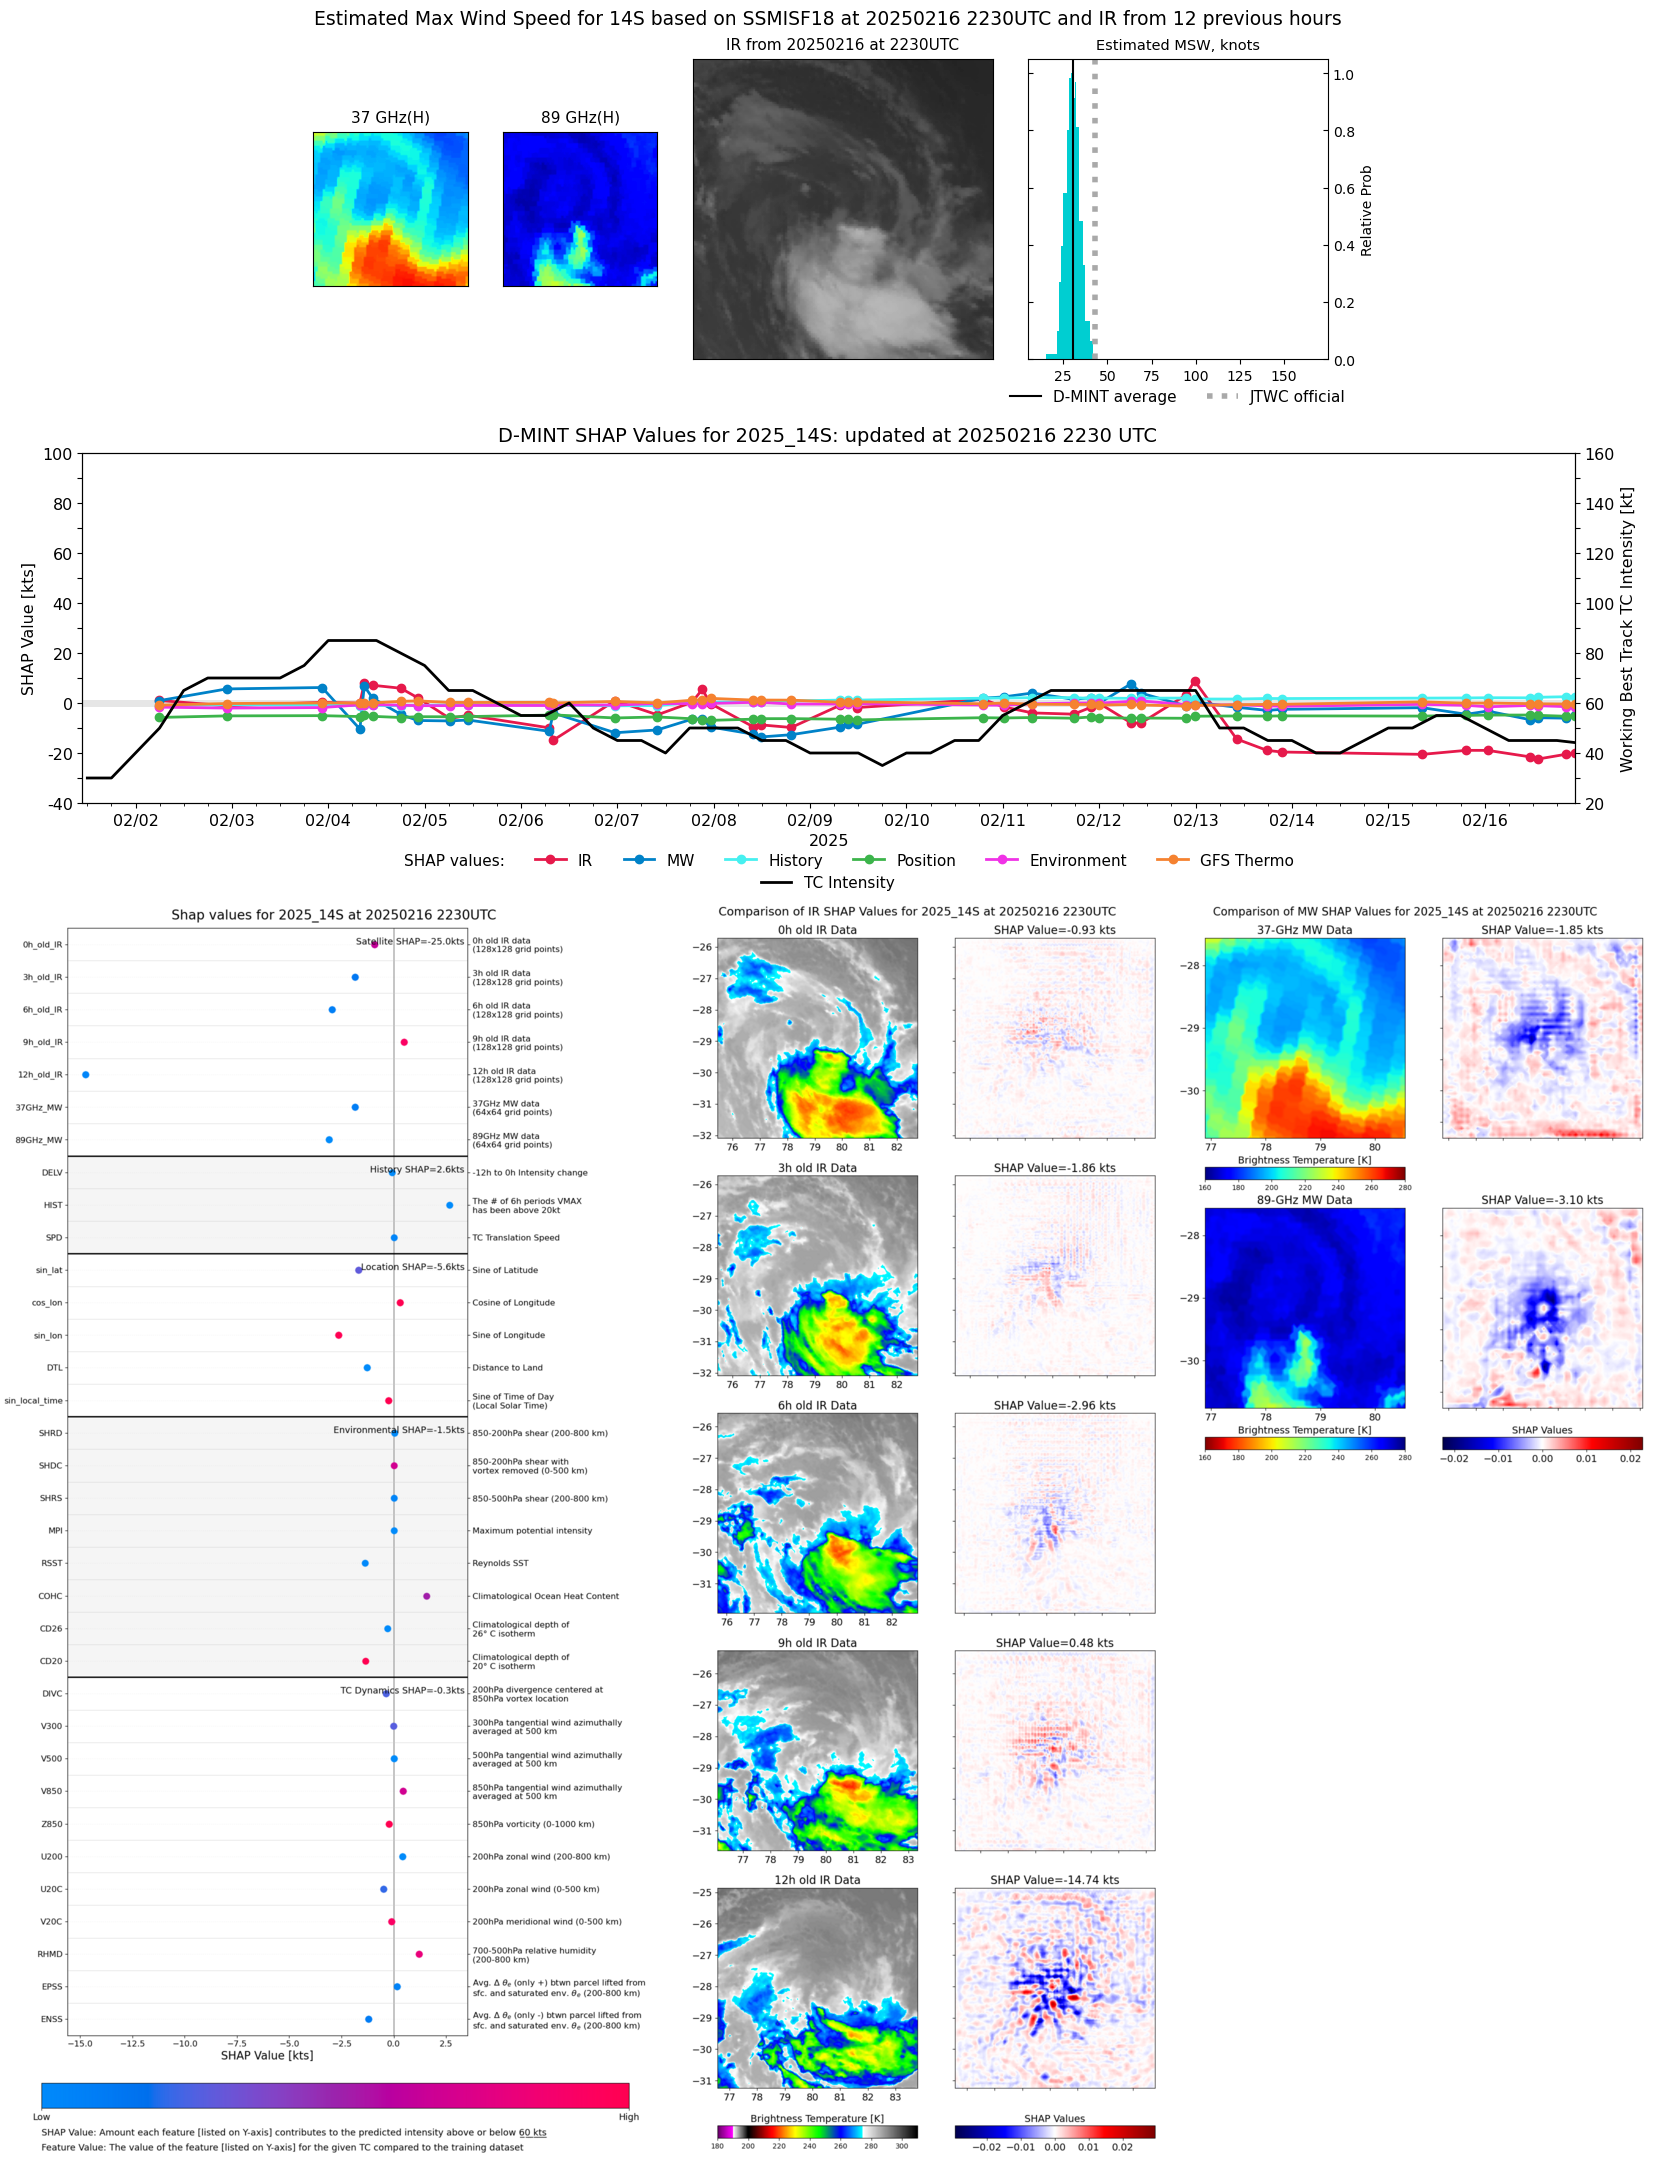 |
| 20250216 | 2011 UTC | AMSR2 | 1000 hPa | 29 kts | 26 kts | 32 kts | 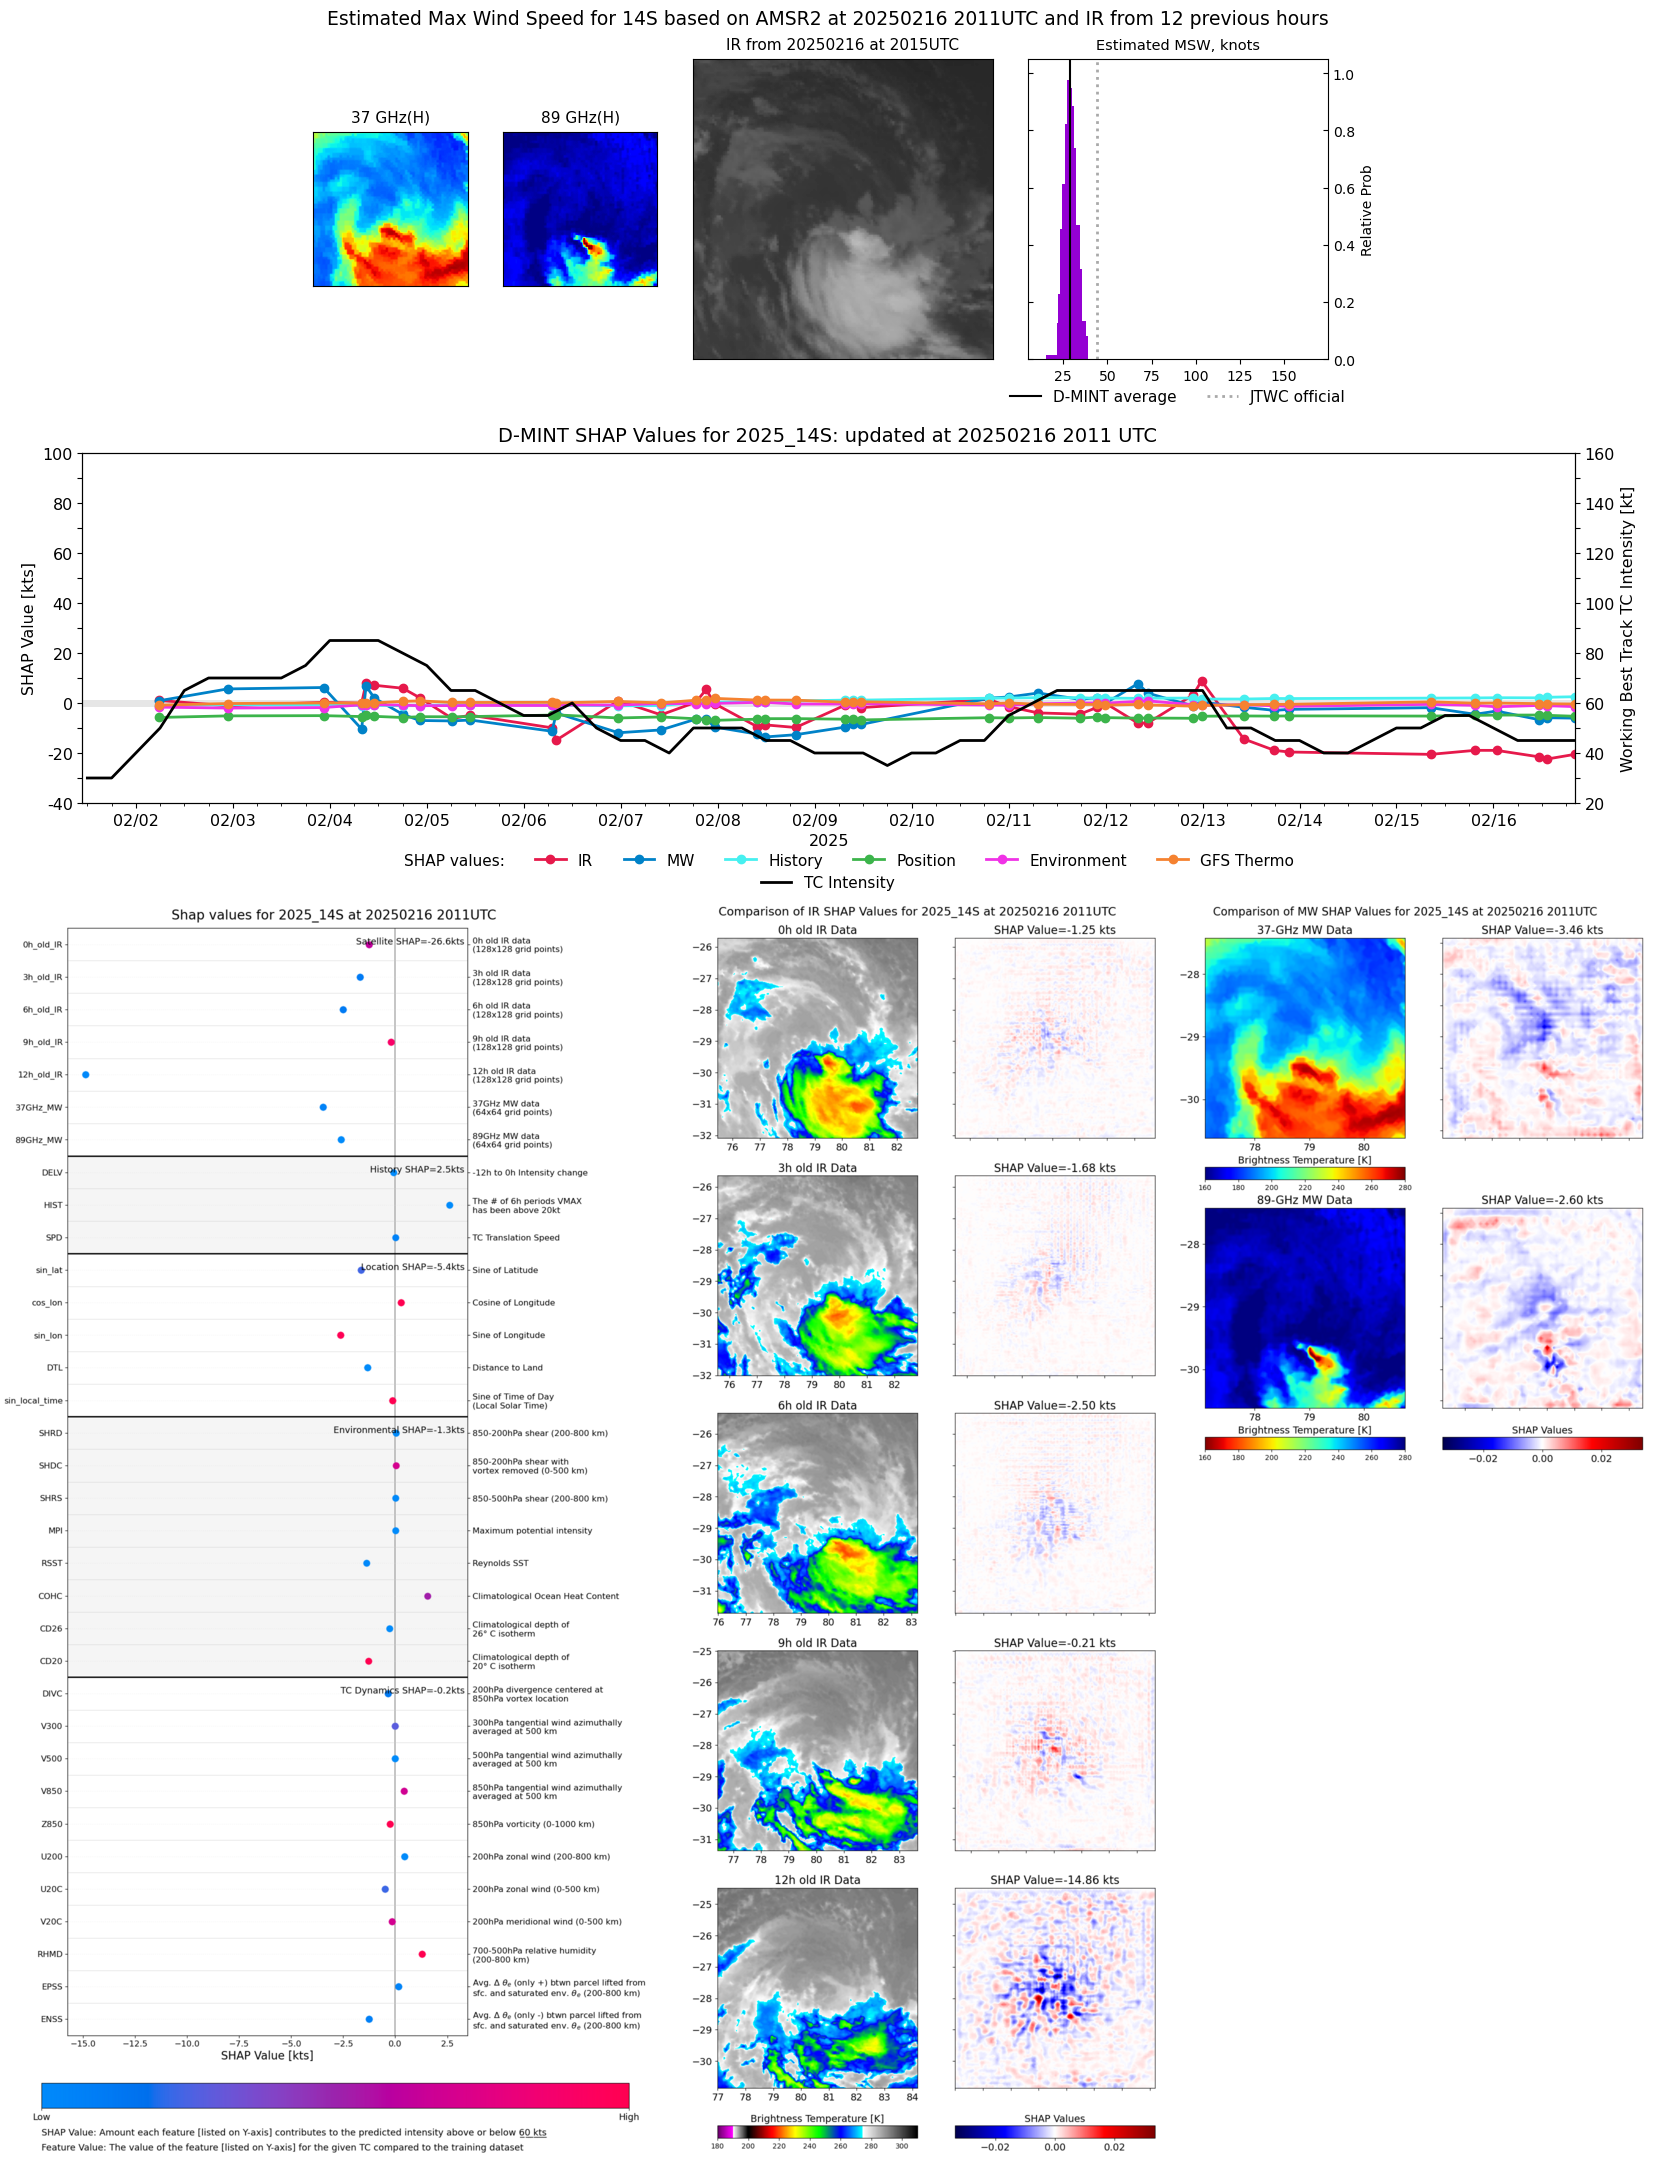 |
| 20250216 | 1314 UTC | SSMISF17 | 1001 hPa | 28 kts | 25 kts | 30 kts |  |
| 20250216 | 1112 UTC | SSMISF18 | 1001 hPa | 28 kts | 26 kts | 30 kts | 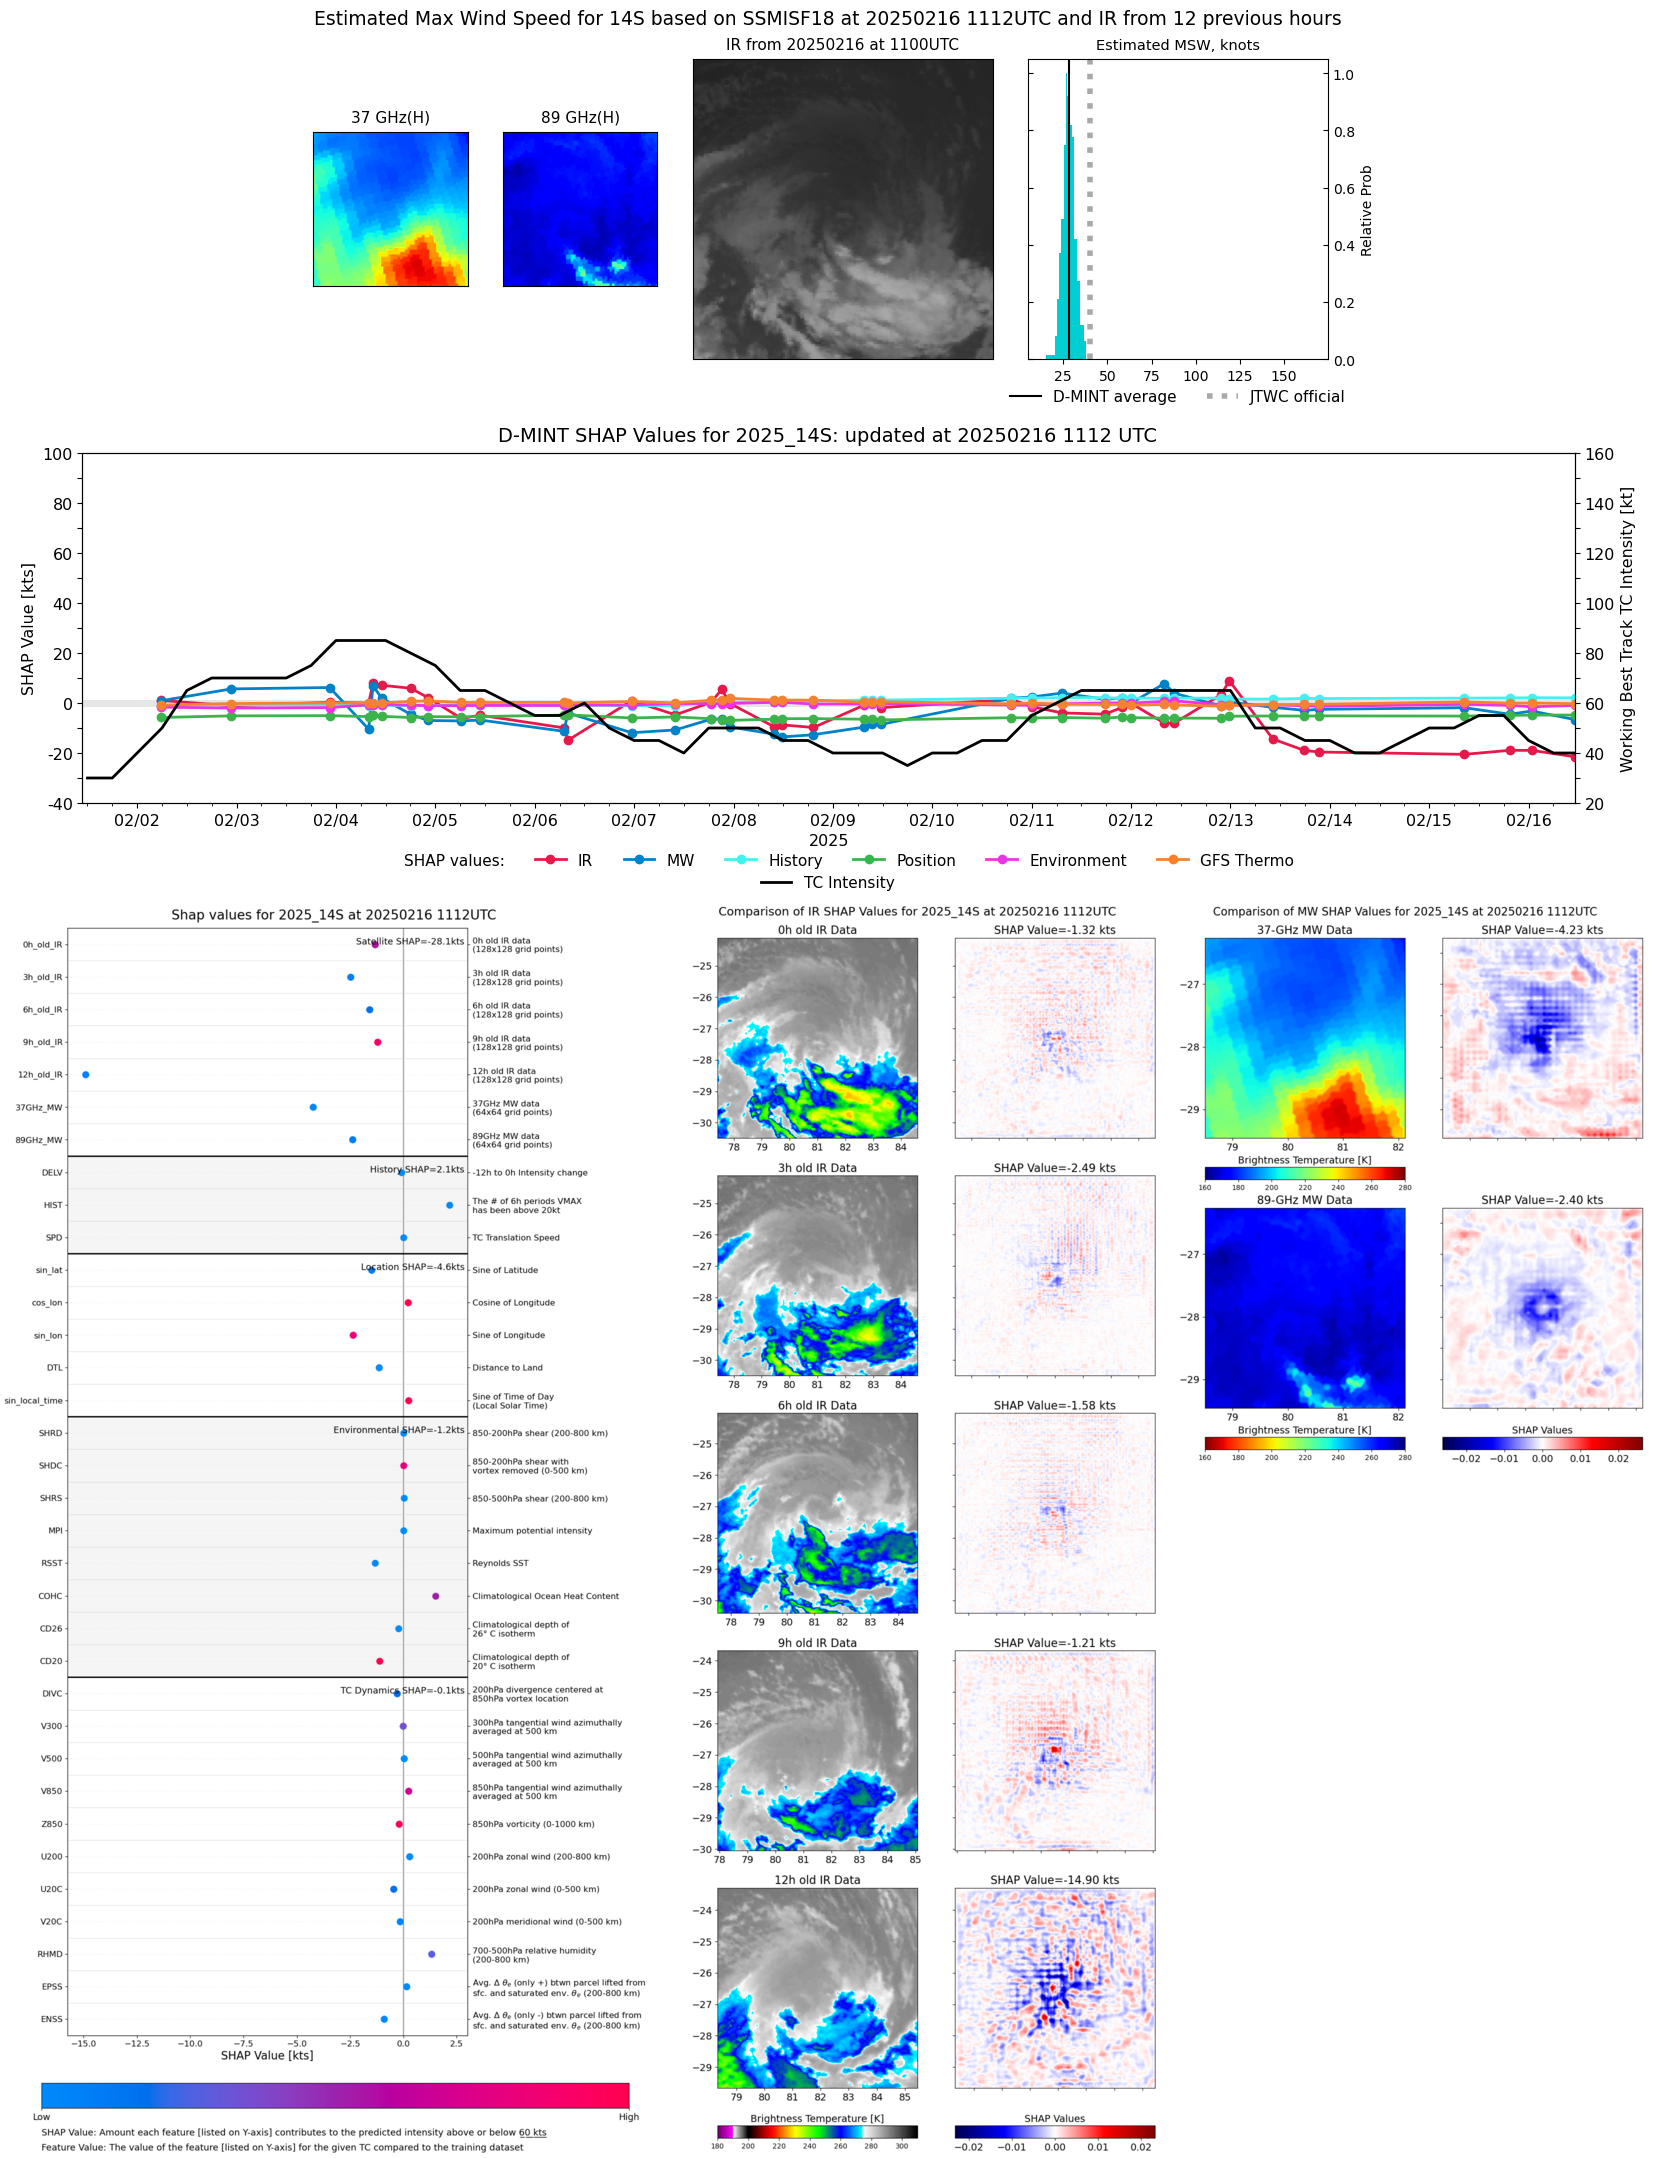 |
| 20250216 | 0046 UTC | SSMISF17 | 1000 hPa | 34 kts | 30 kts | 37 kts |  |
| 20250215 | 1927 UTC | AMSR2 | 998 hPa | 33 kts | 30 kts | 36 kts | 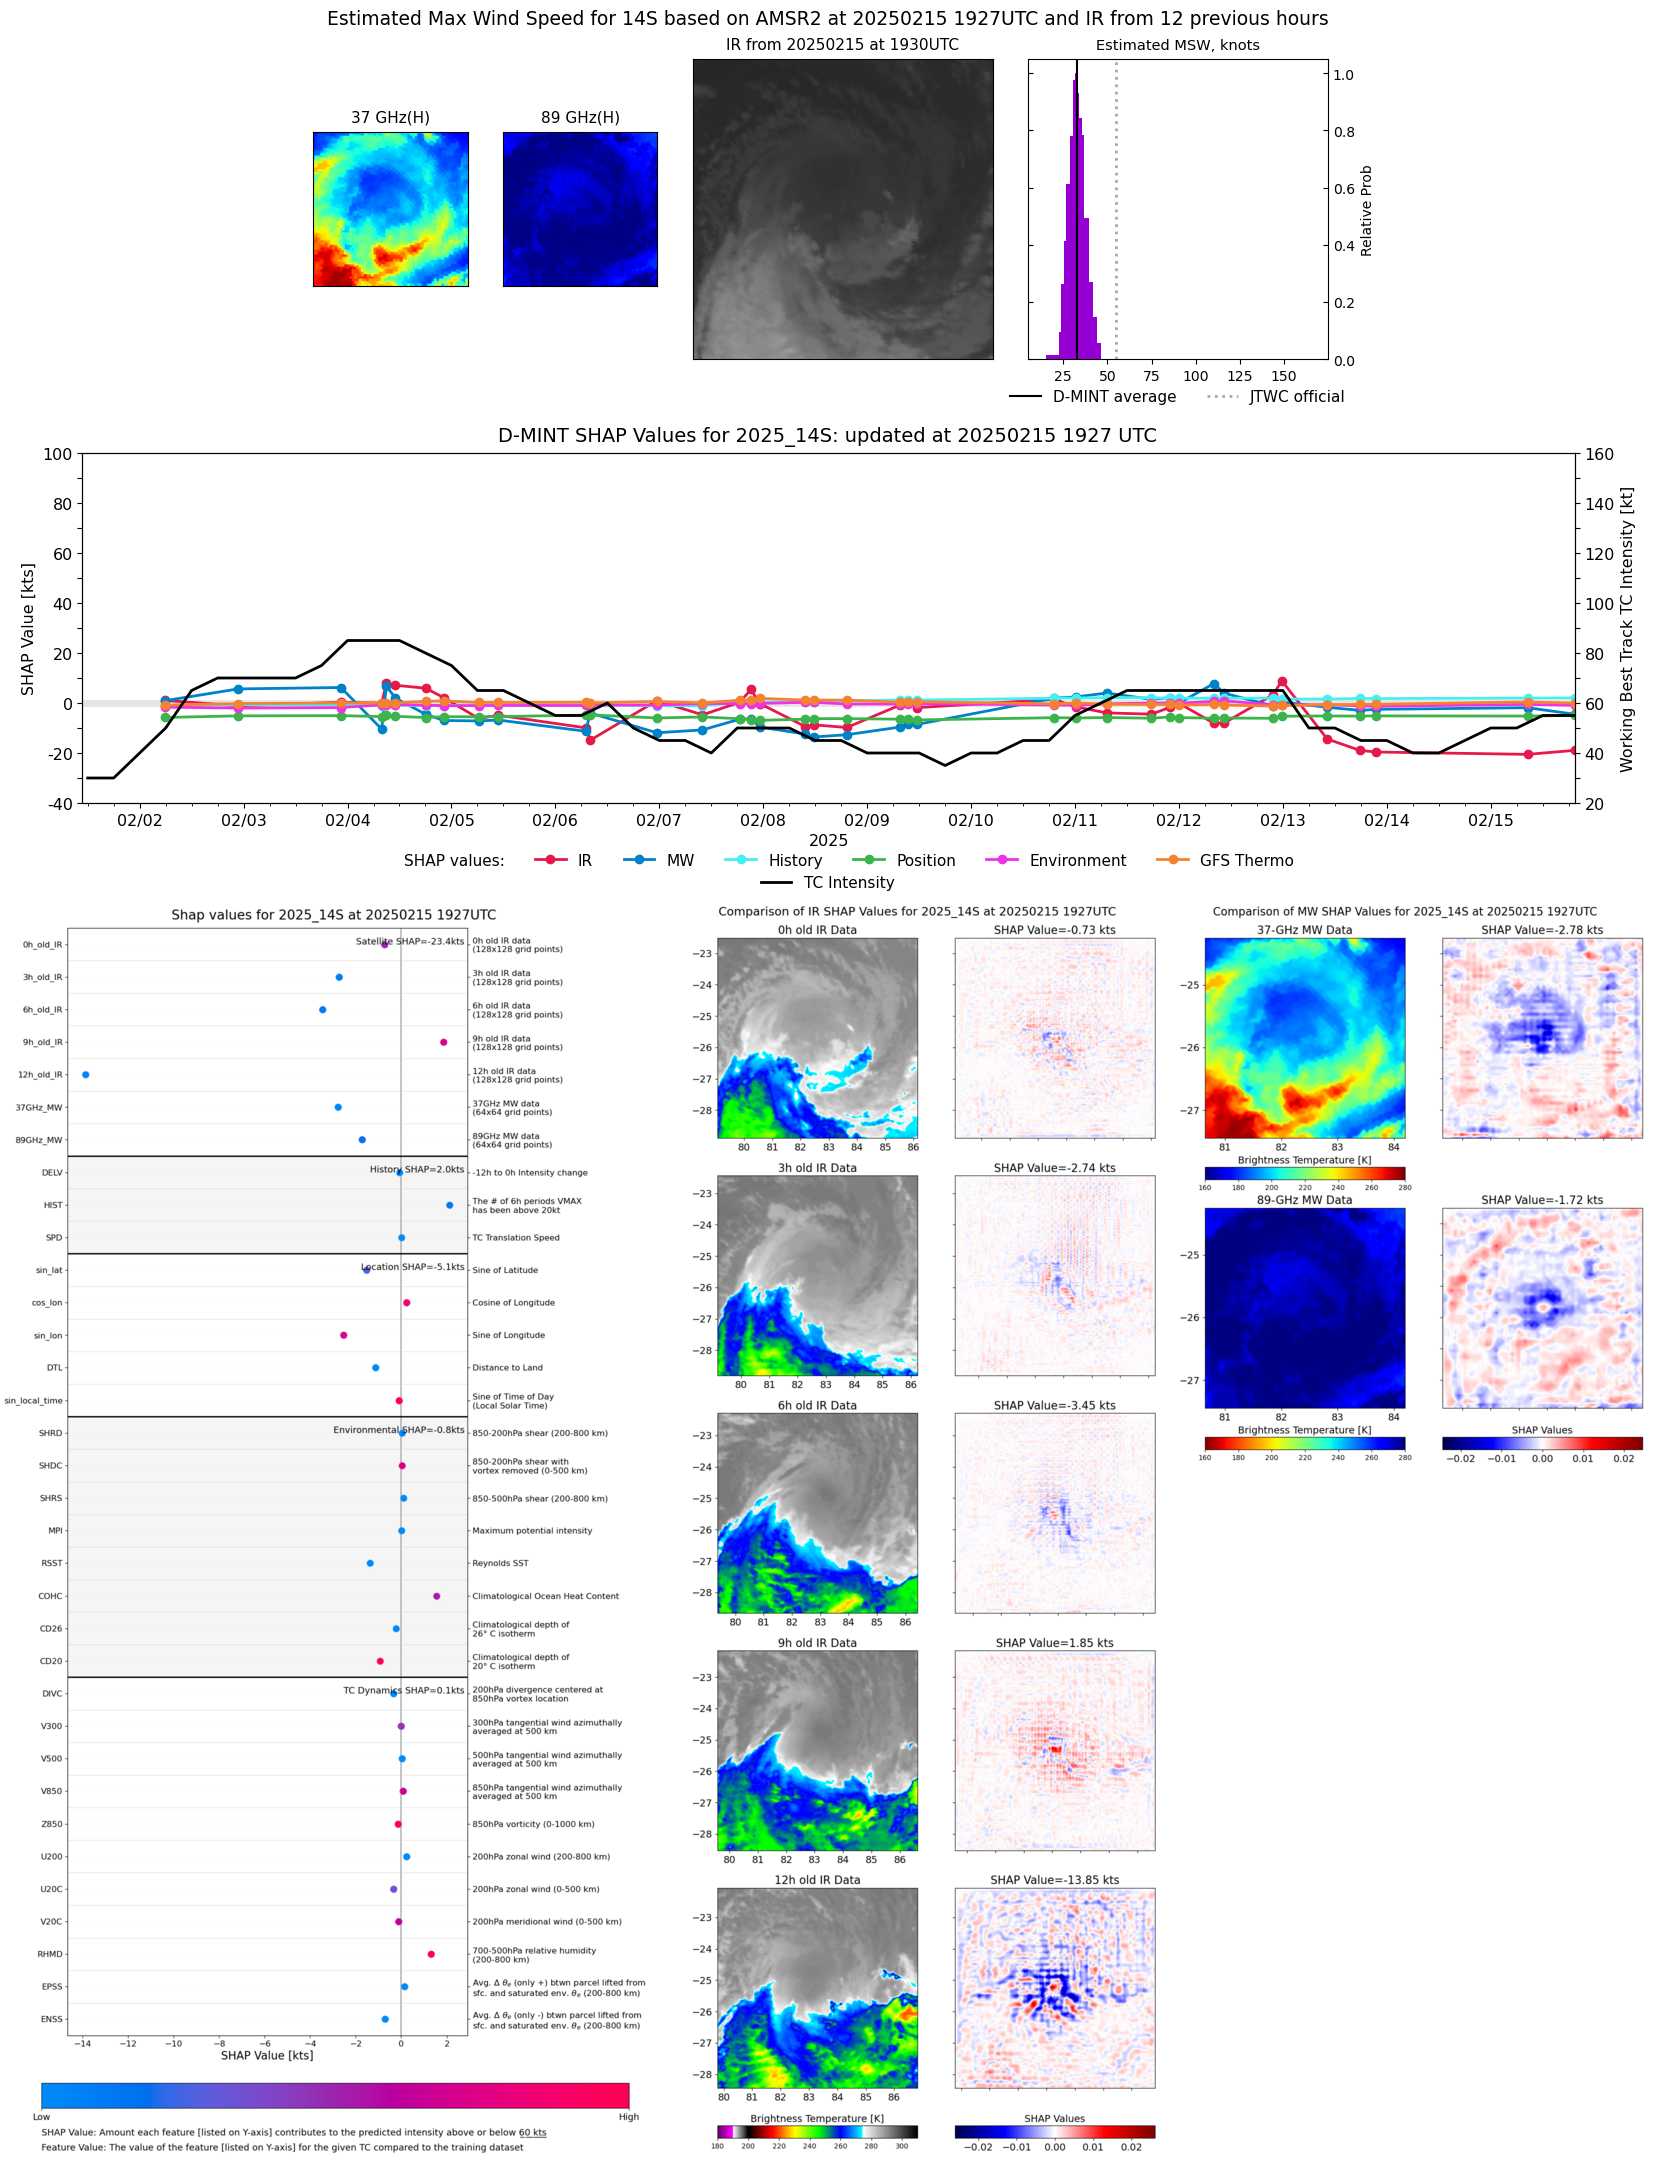 |
| 20250215 | 0830 UTC | AMSR2 | 997 hPa | 34 kts | 31 kts | 38 kts | 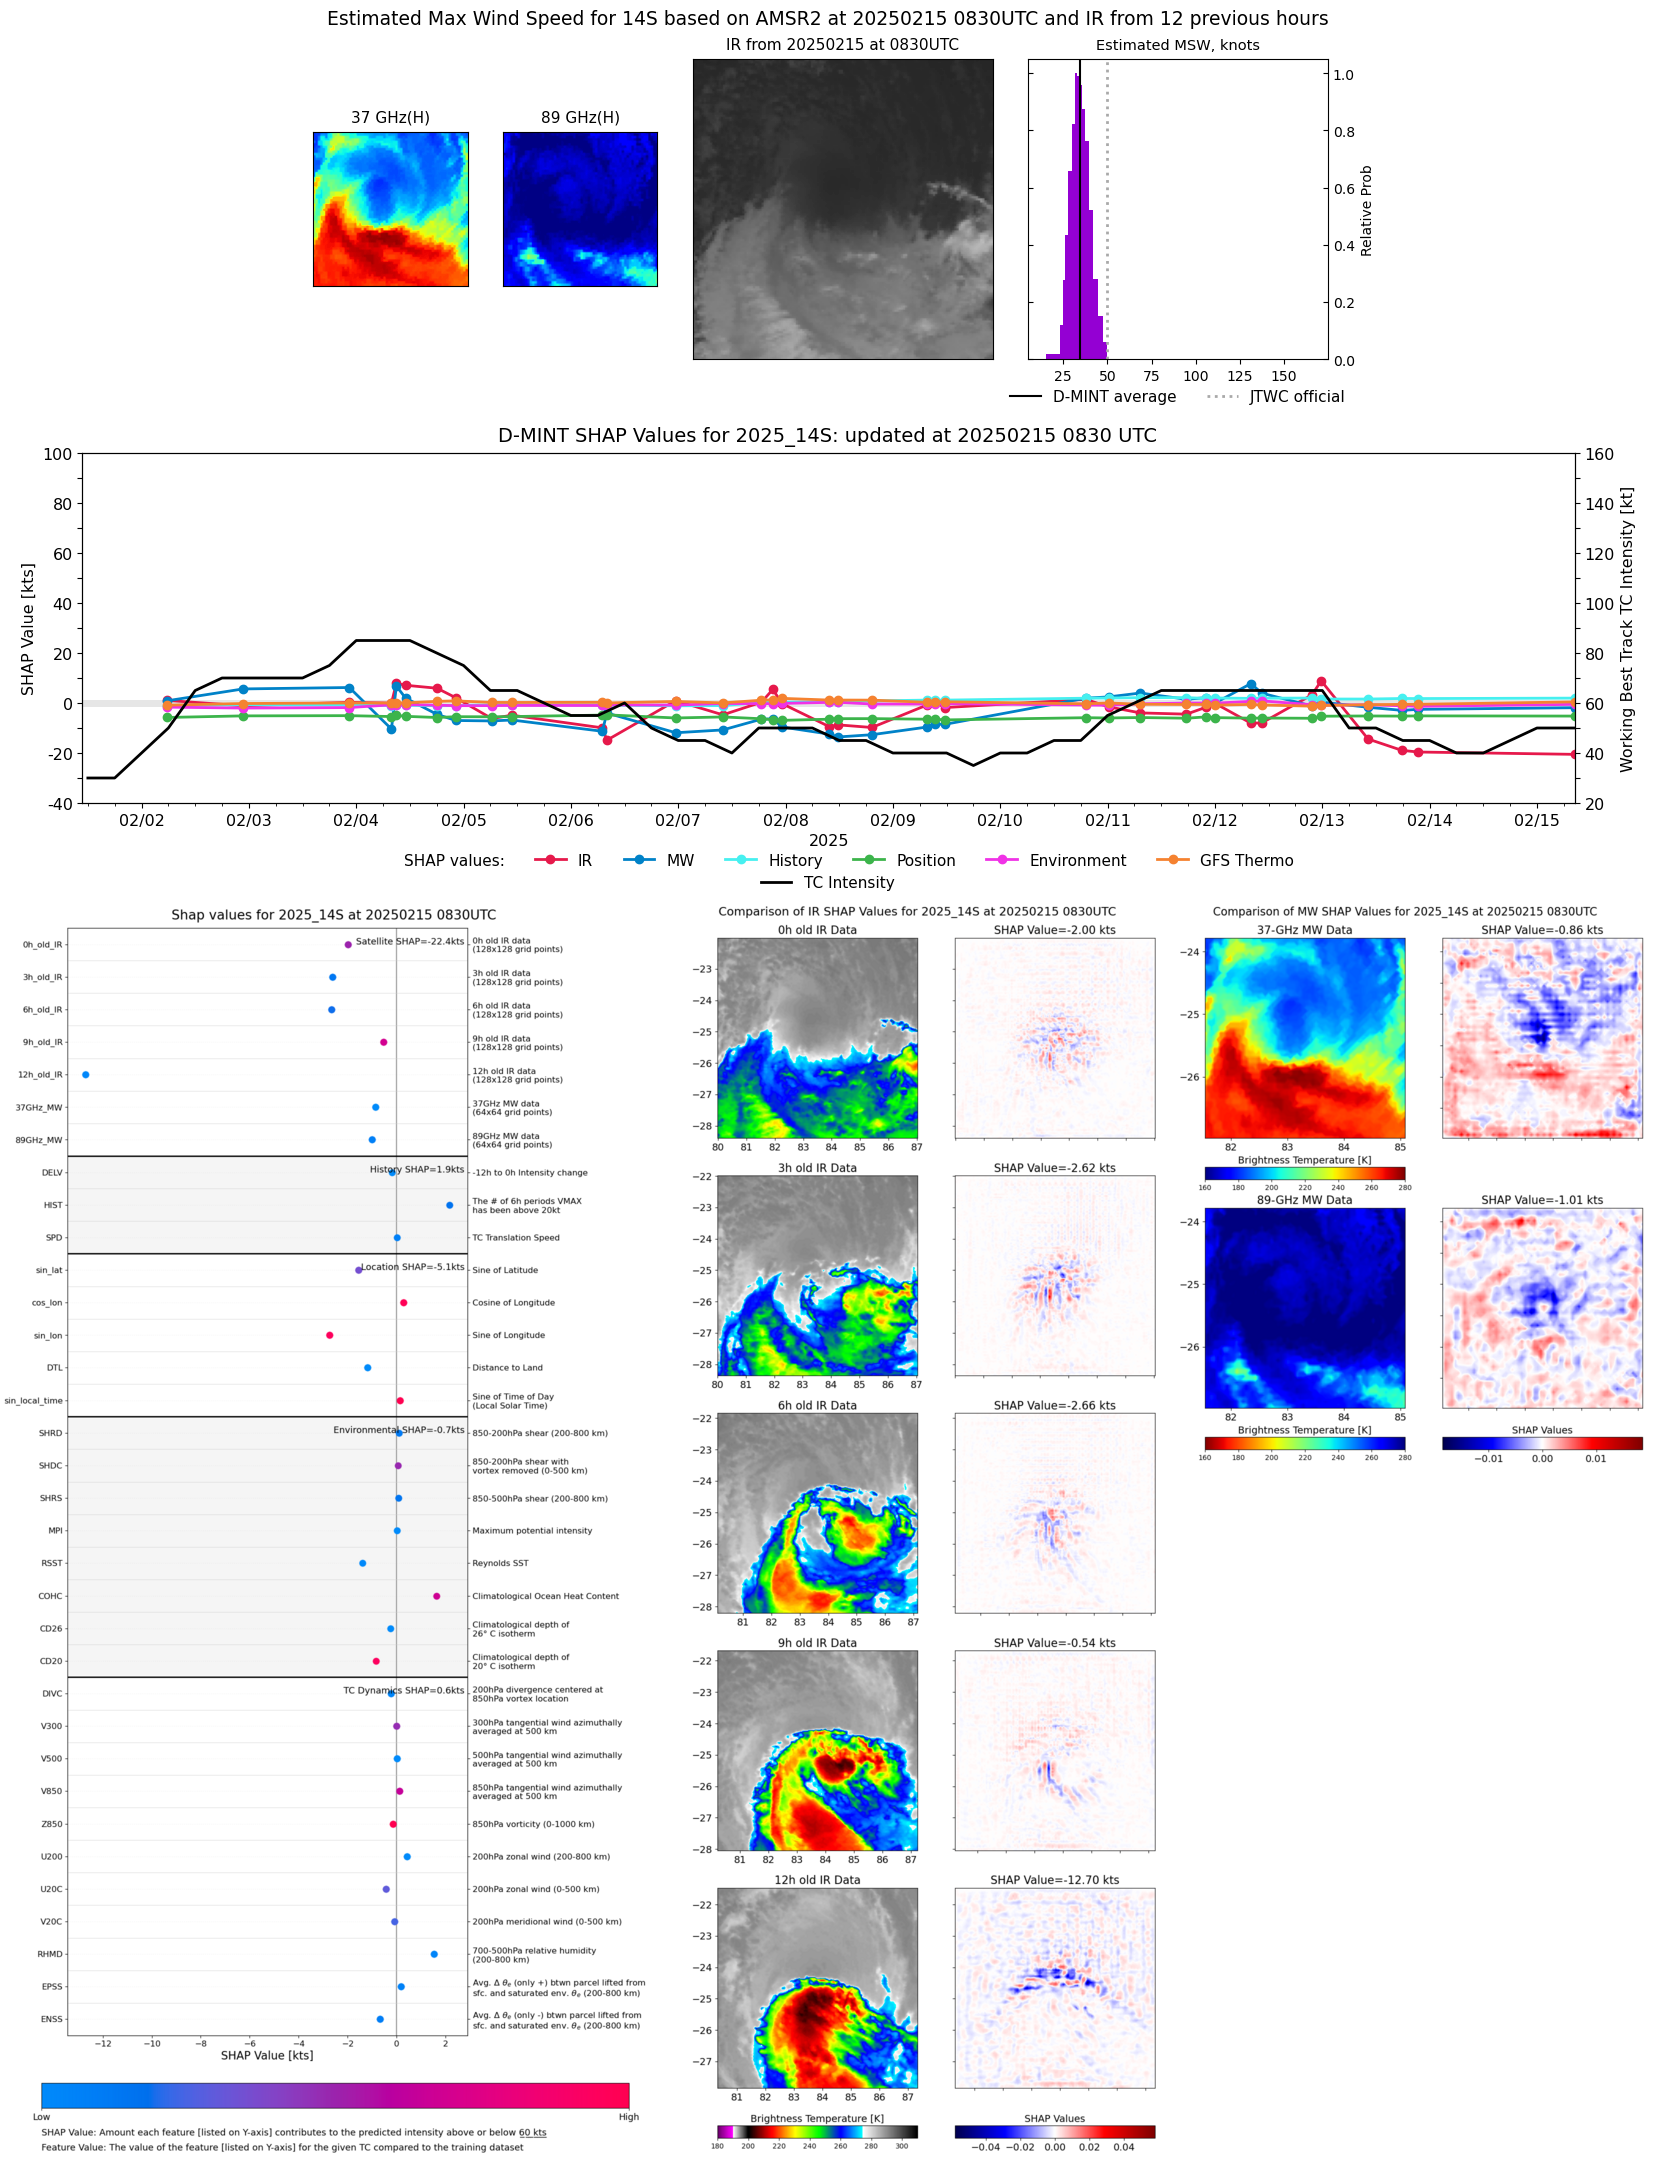 |
| 20250215 | 0633 UTC | GMI | 1000 hPa | 26 kts | 24 kts | 29 kts | 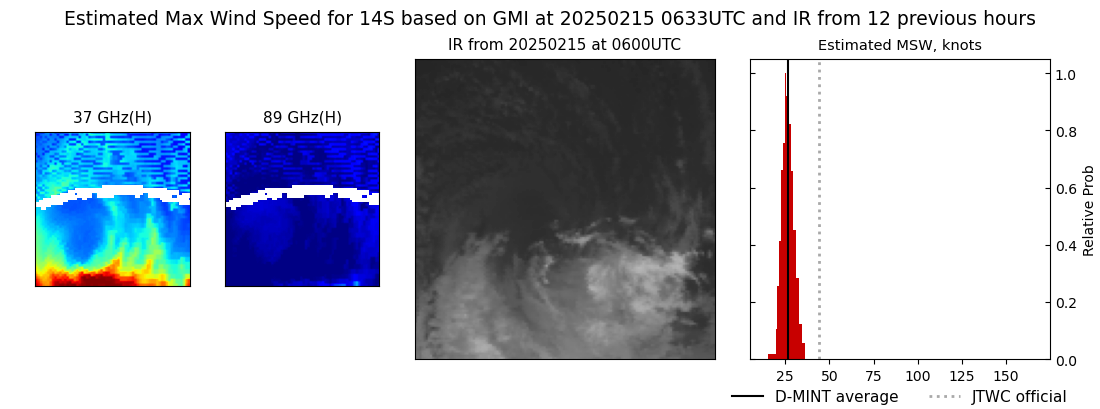 |
| 20250215 | 0001 UTC | SSMISF16 | 1000 hPa | 30 kts | 27 kts | 34 kts |  |
| 20250214 | 1931 UTC | ATMS-N20 | 999 hPa | 33 kts | 30 kts | 38 kts | 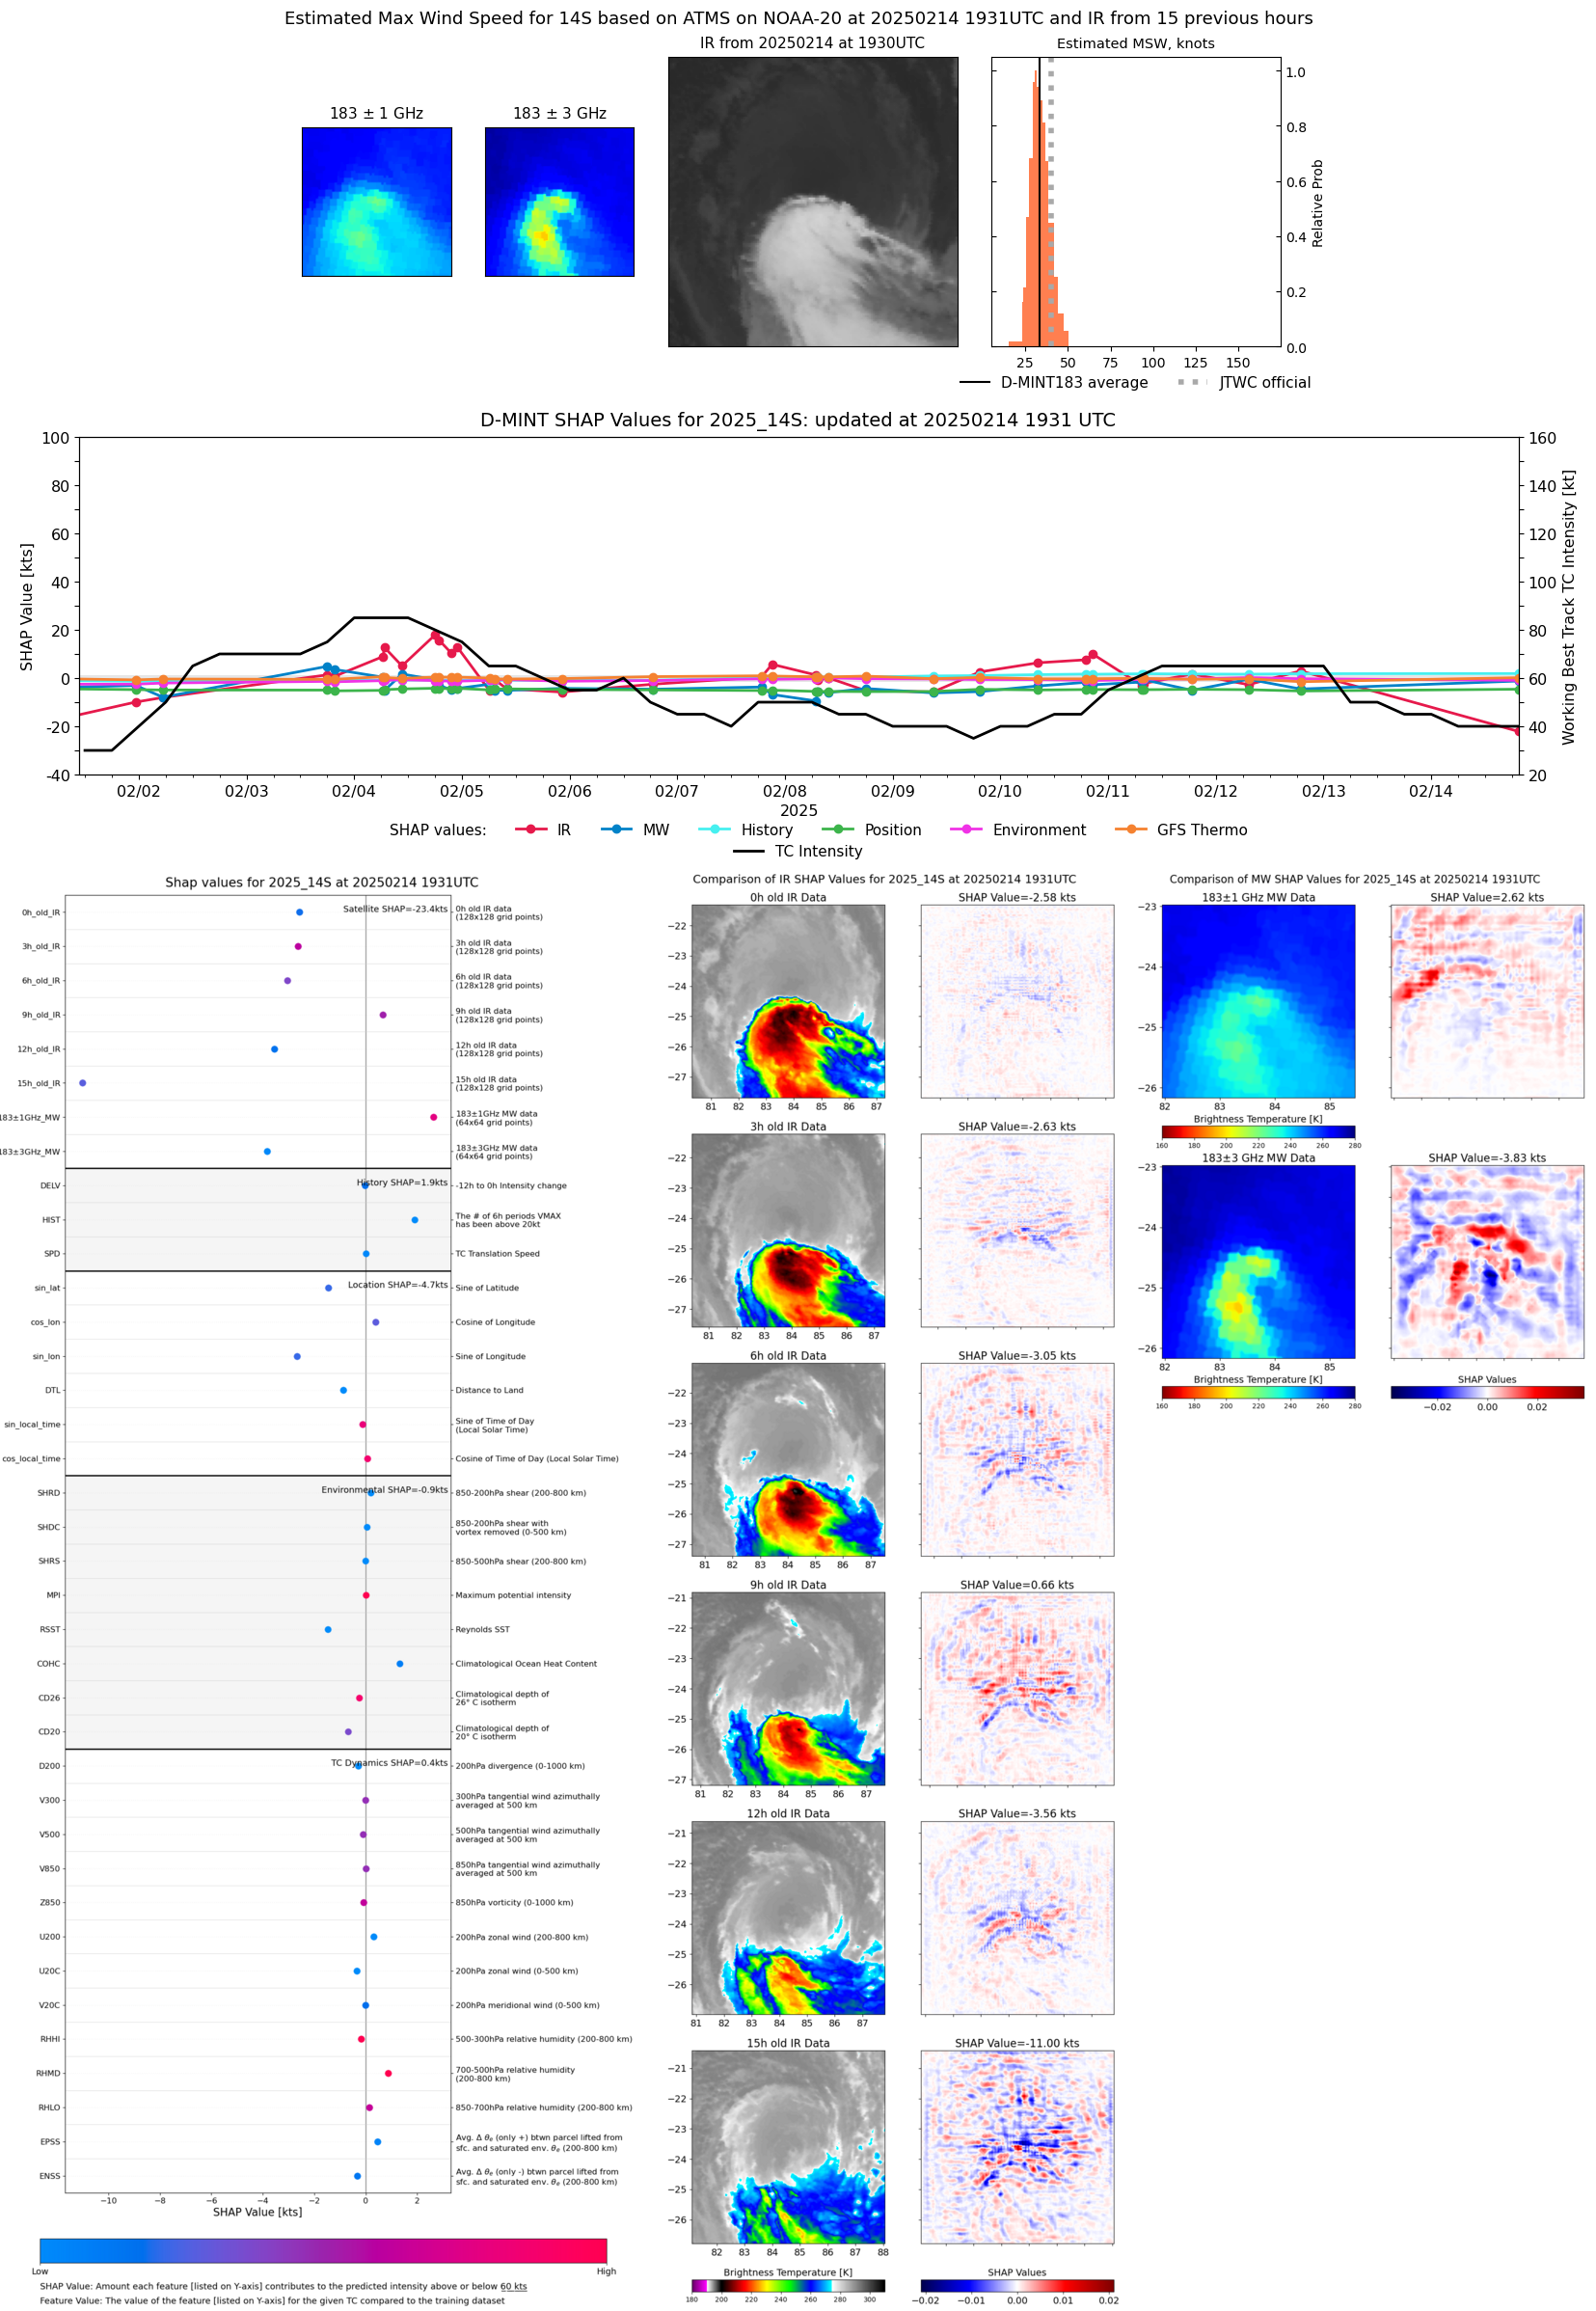 |
| 20250214 | 1243 UTC | SSMISF16 | 999 hPa | 24 kts | 22 kts | 27 kts | 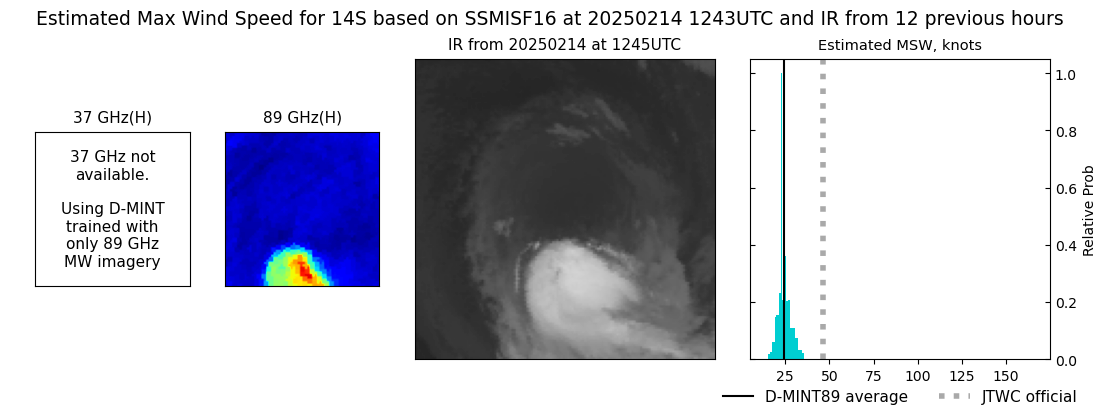 |
| 20250214 | 0818 UTC | ATMS-N20 | NaN hPa | 32 kts | 29 kts | 35 kts | 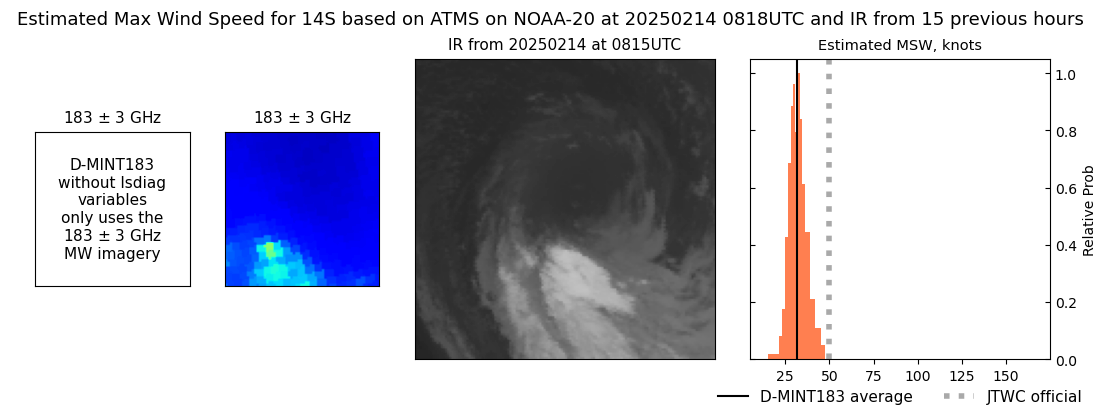 |
| 20250214 | 0713 UTC | GMI | NaN hPa | 33 kts | 29 kts | 37 kts | 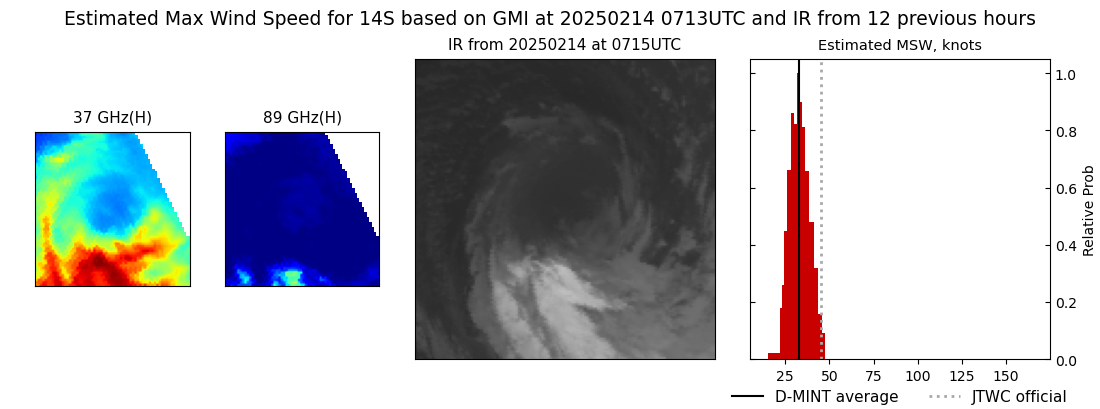 |
| 20250214 | 0013 UTC | SSMISF16 | NaN hPa | 30 kts | 27 kts | 34 kts | 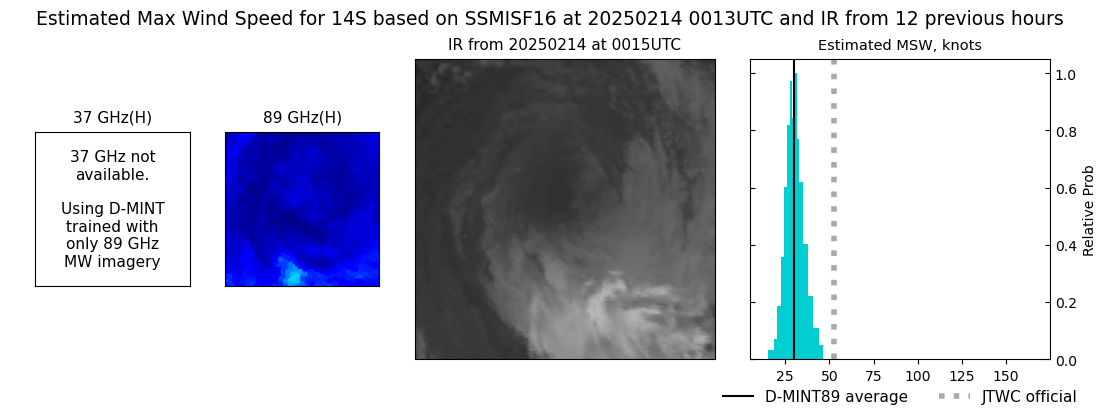 |
| 20250213 | 2130 UTC | SSMISF18 | 997 hPa | 33 kts | 30 kts | 36 kts | 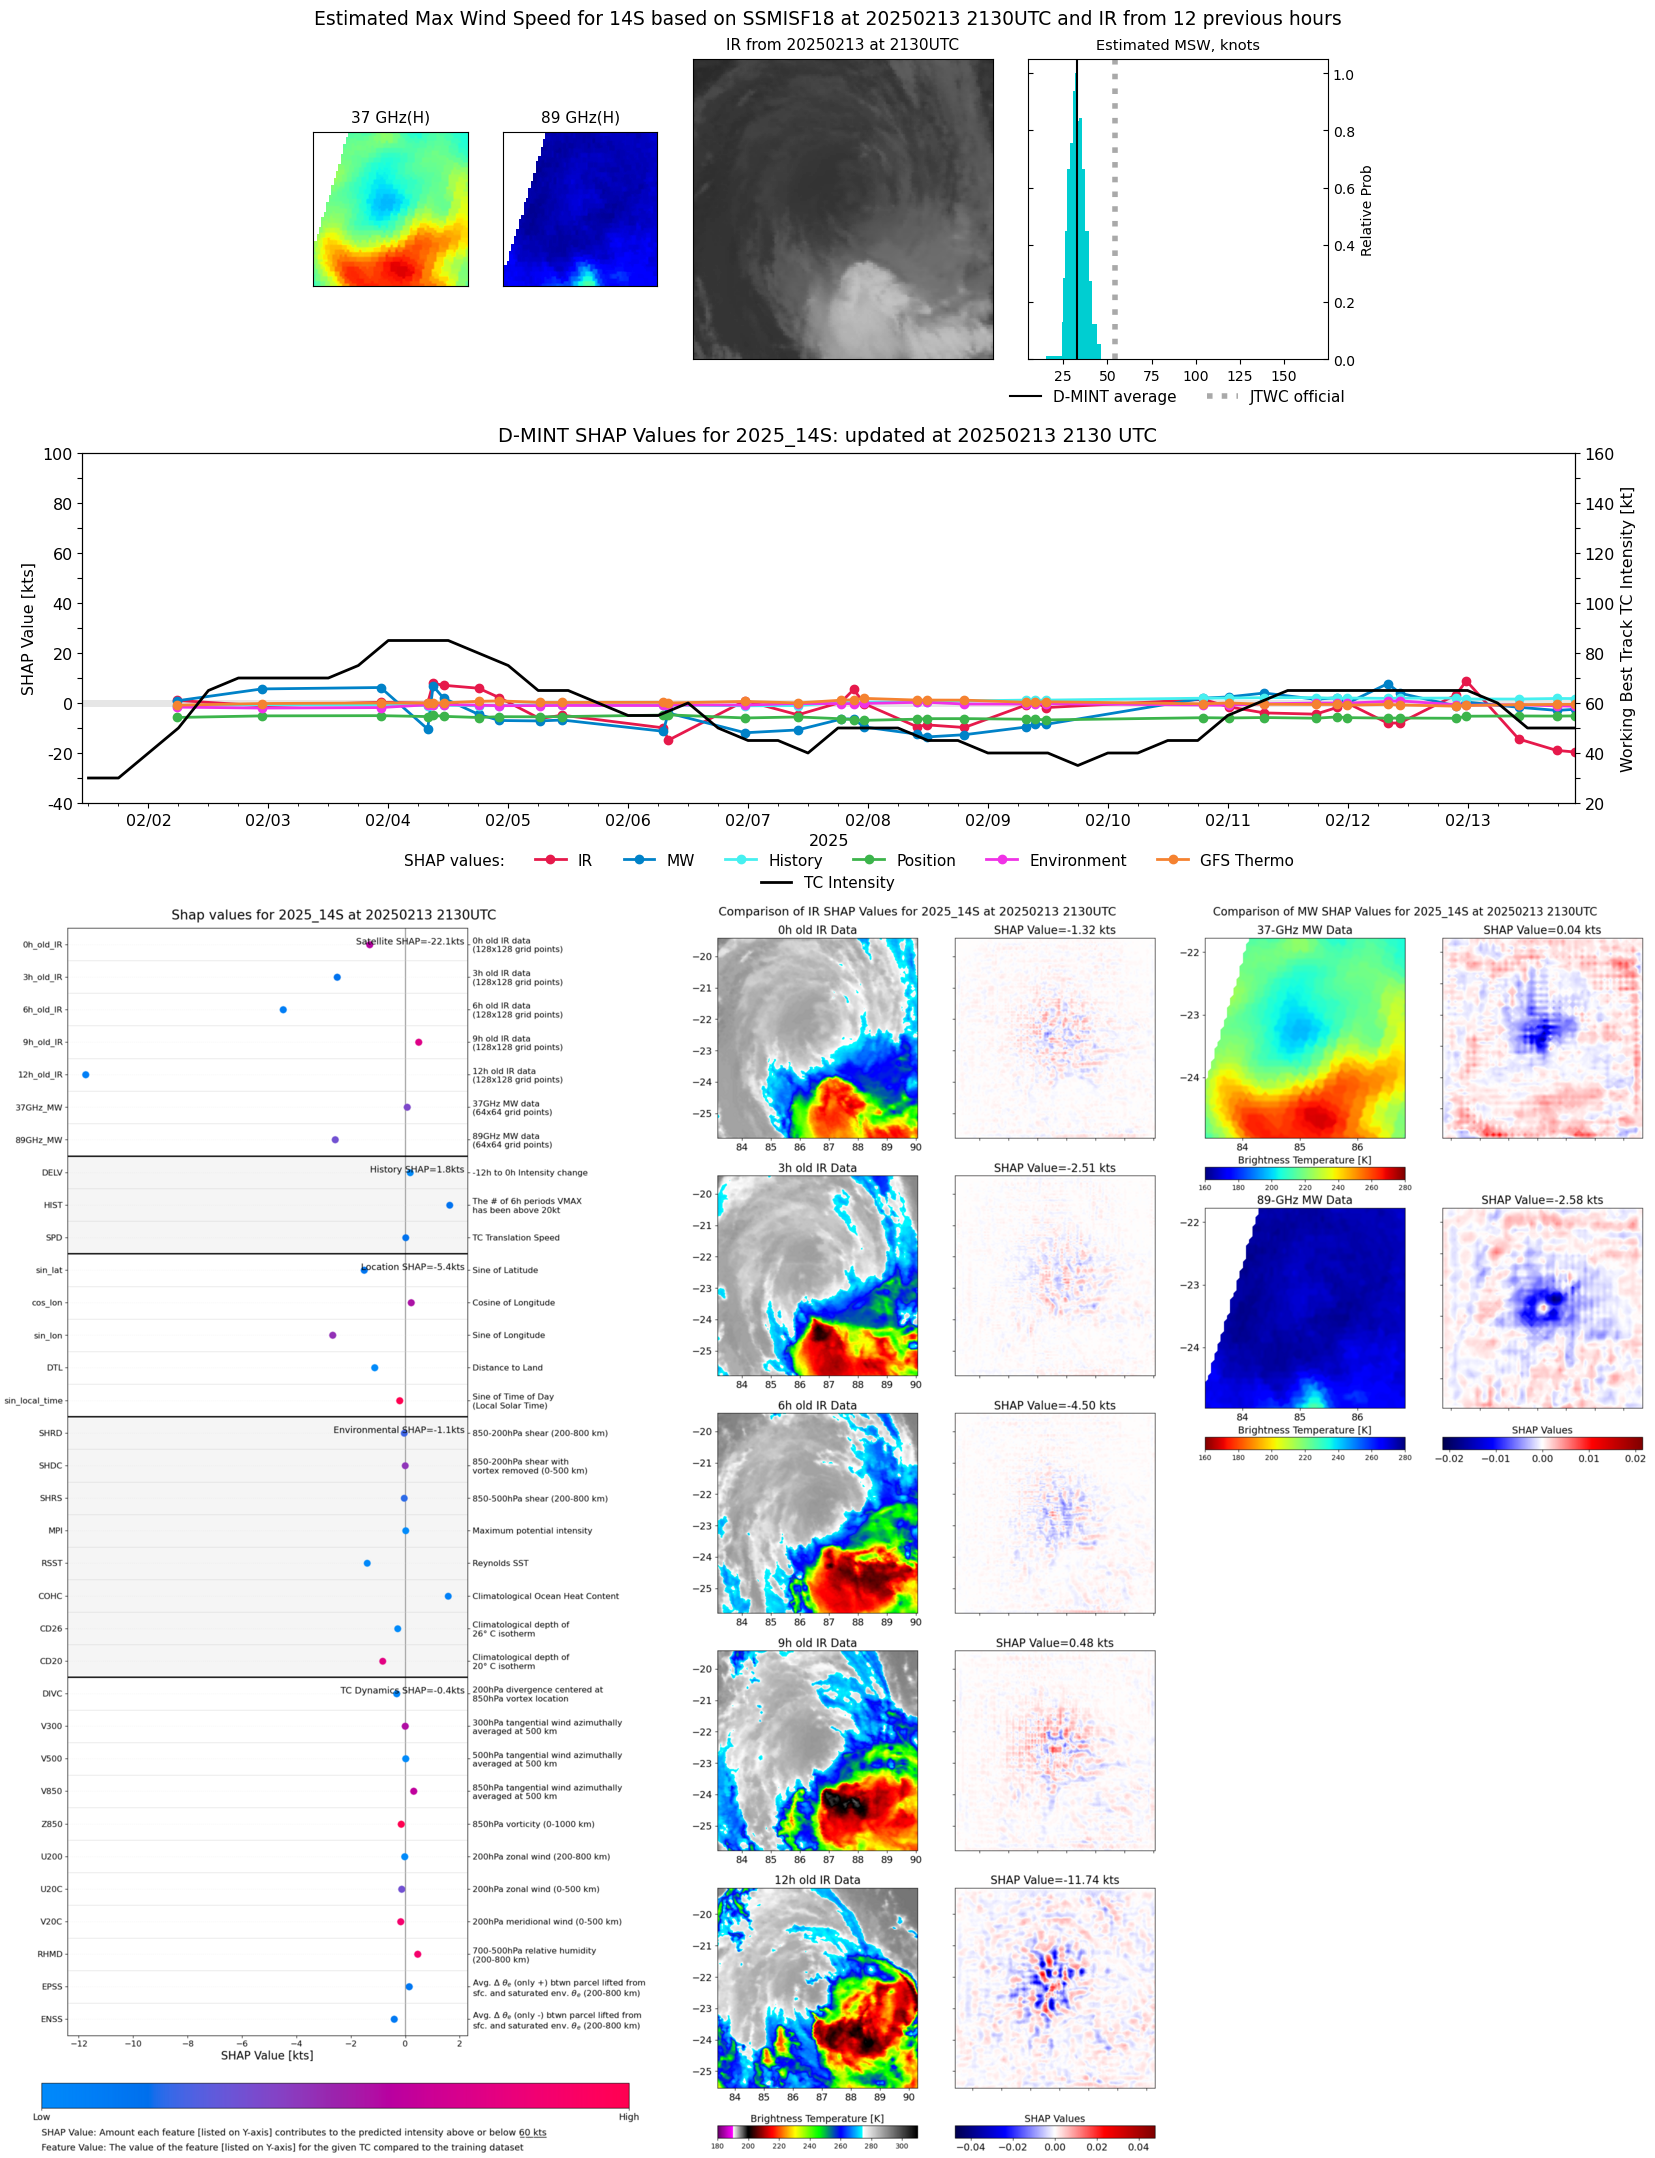 |
| 20250213 | 1938 UTC | AMSR2 | NaN hPa | 38 kts | 34 kts | 43 kts | 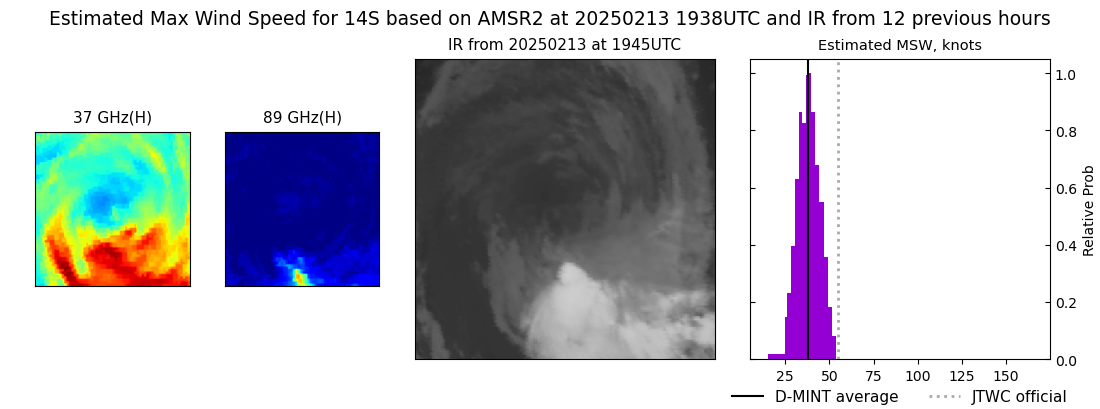 |
| 20250213 | 1748 UTC | GMI | 995 hPa | 33 kts | 30 kts | 36 kts | 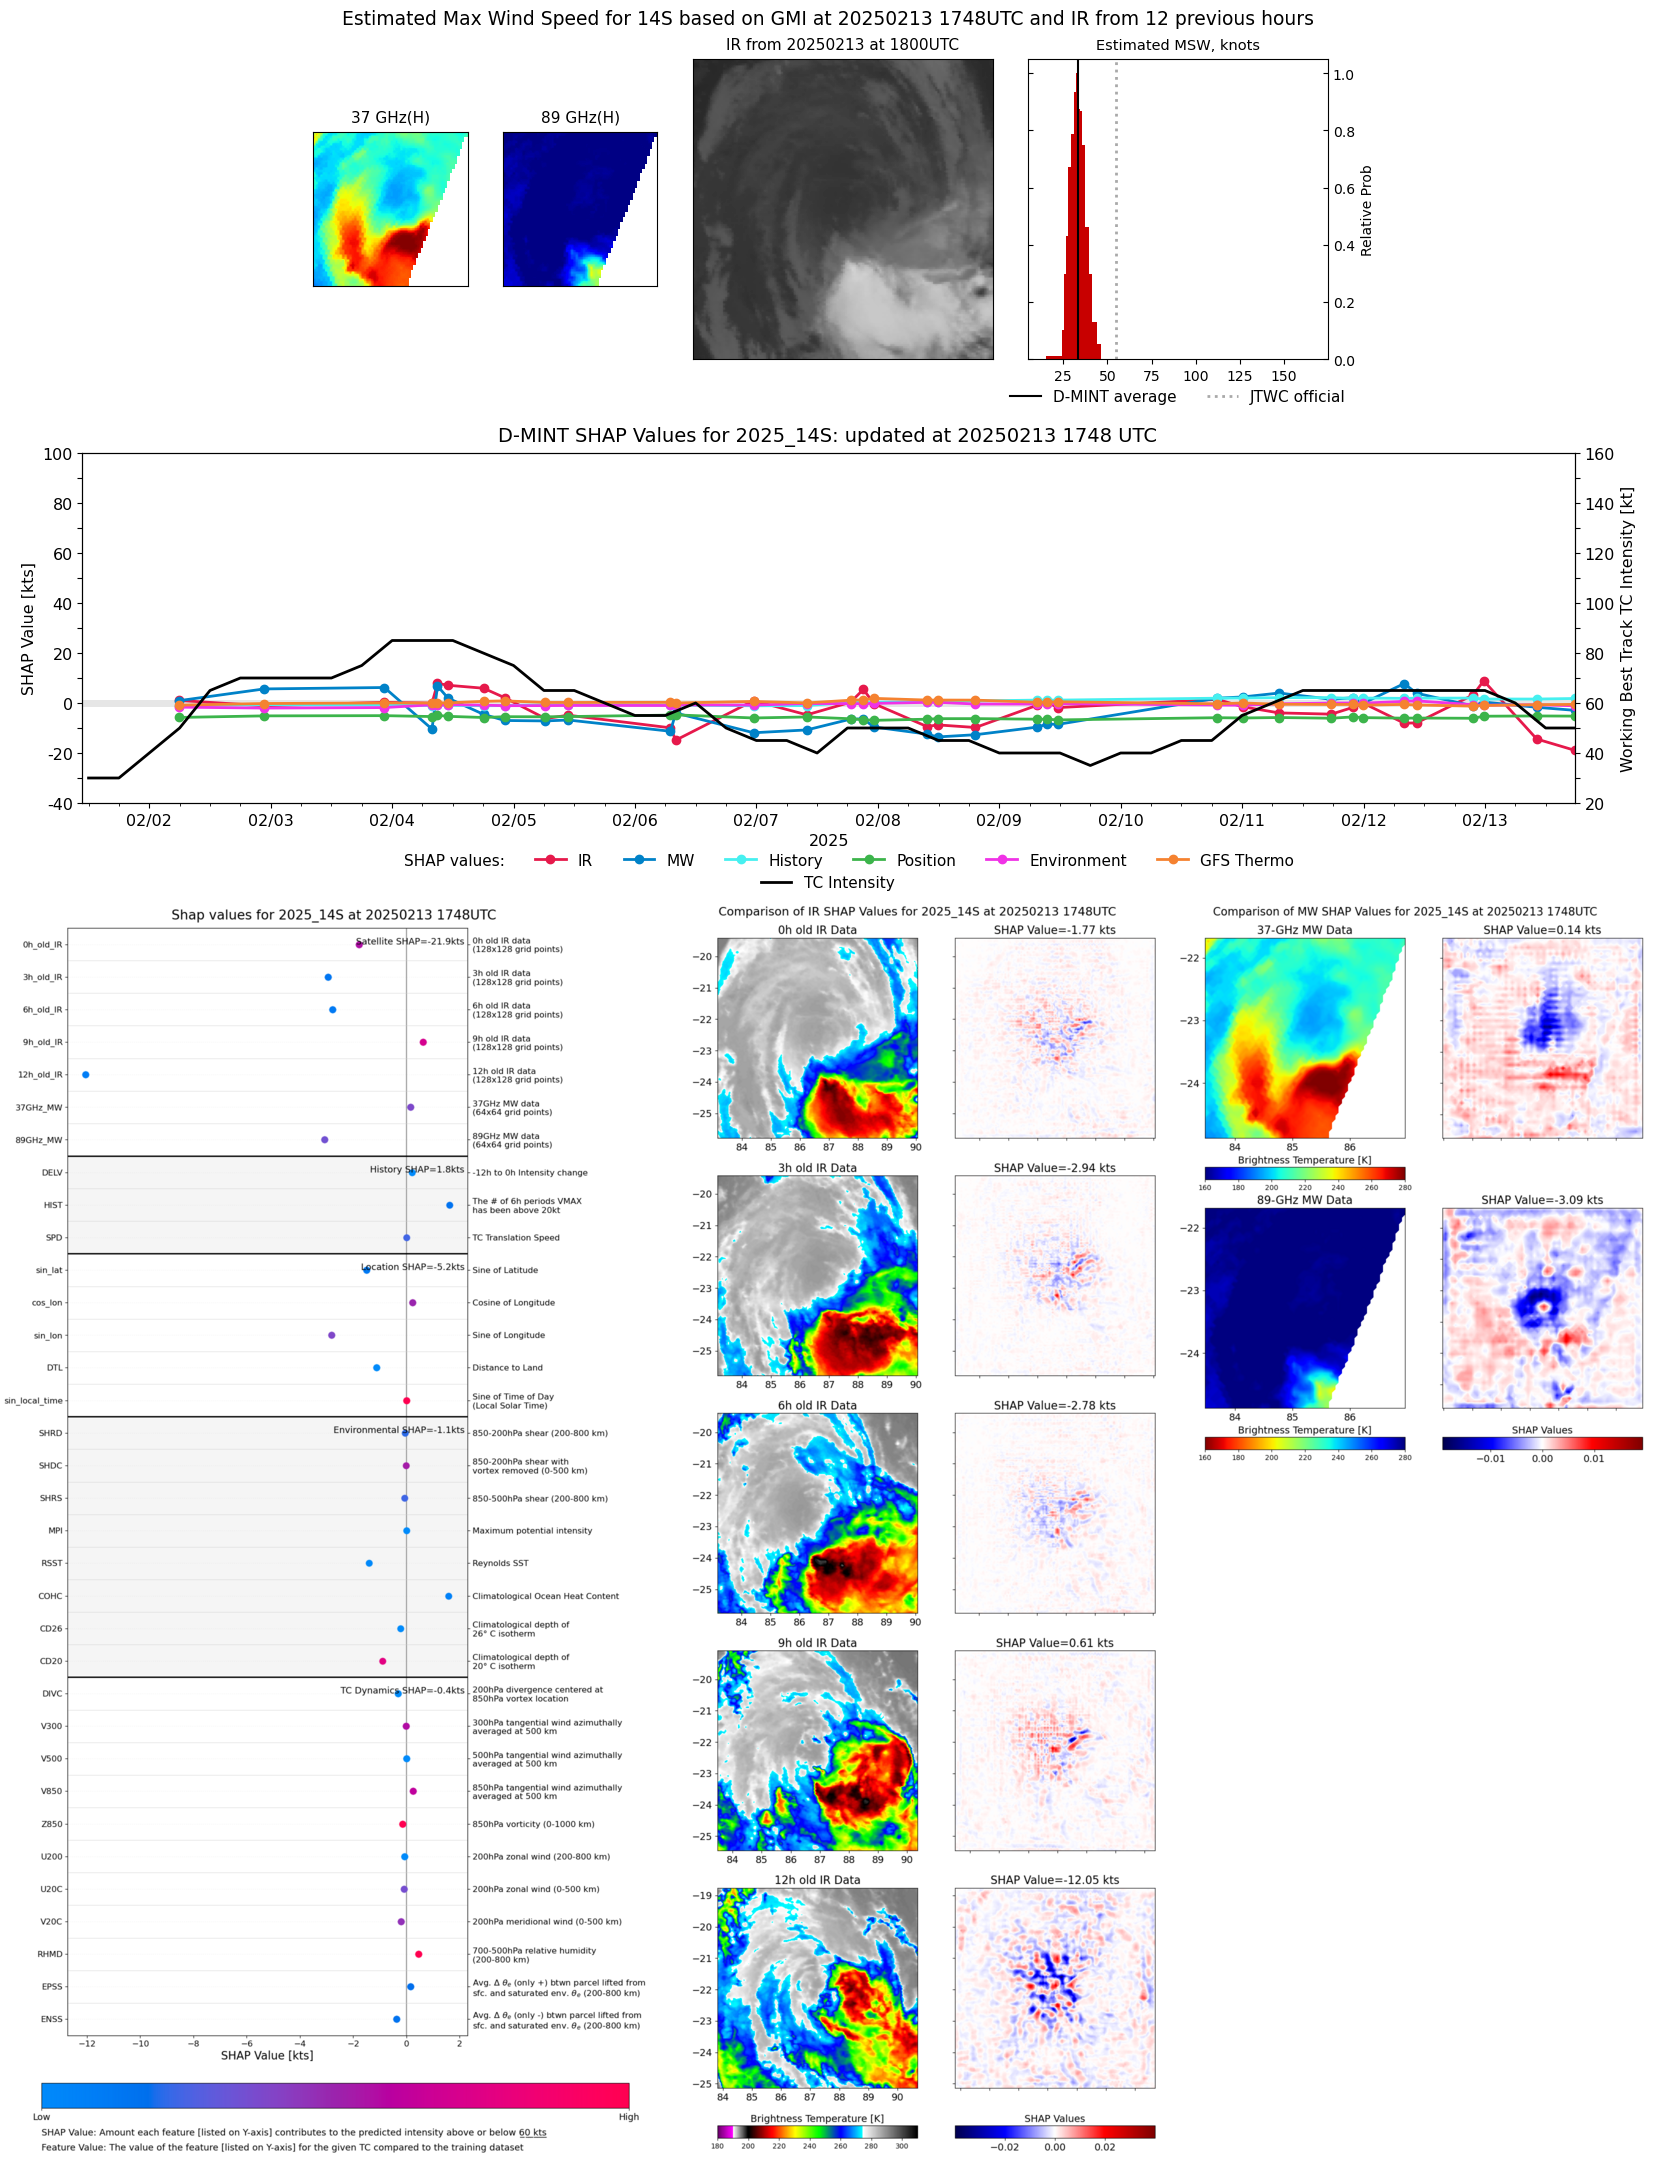 |
| 20250213 | 1257 UTC | SSMISF16 | 995 hPa | 30 kts | 26 kts | 33 kts | 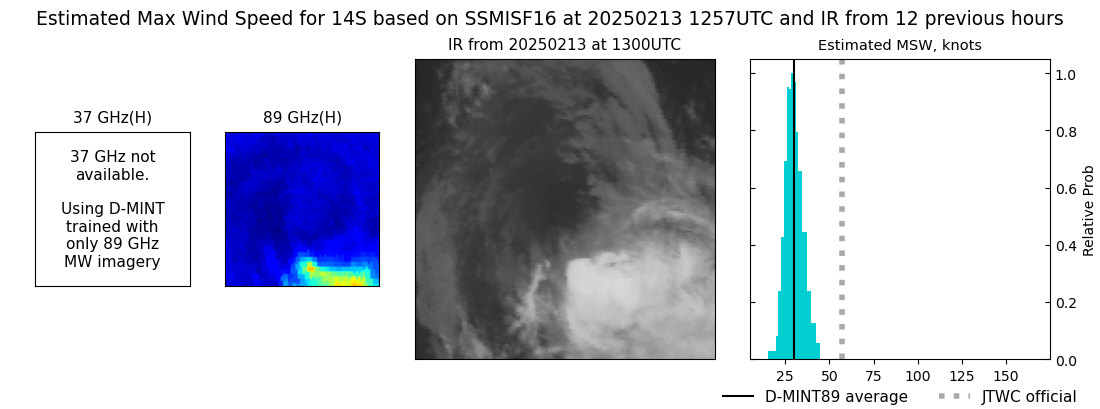 |
| 20250213 | 1014 UTC | SSMISF18 | 992 hPa | 39 kts | 35 kts | 44 kts | 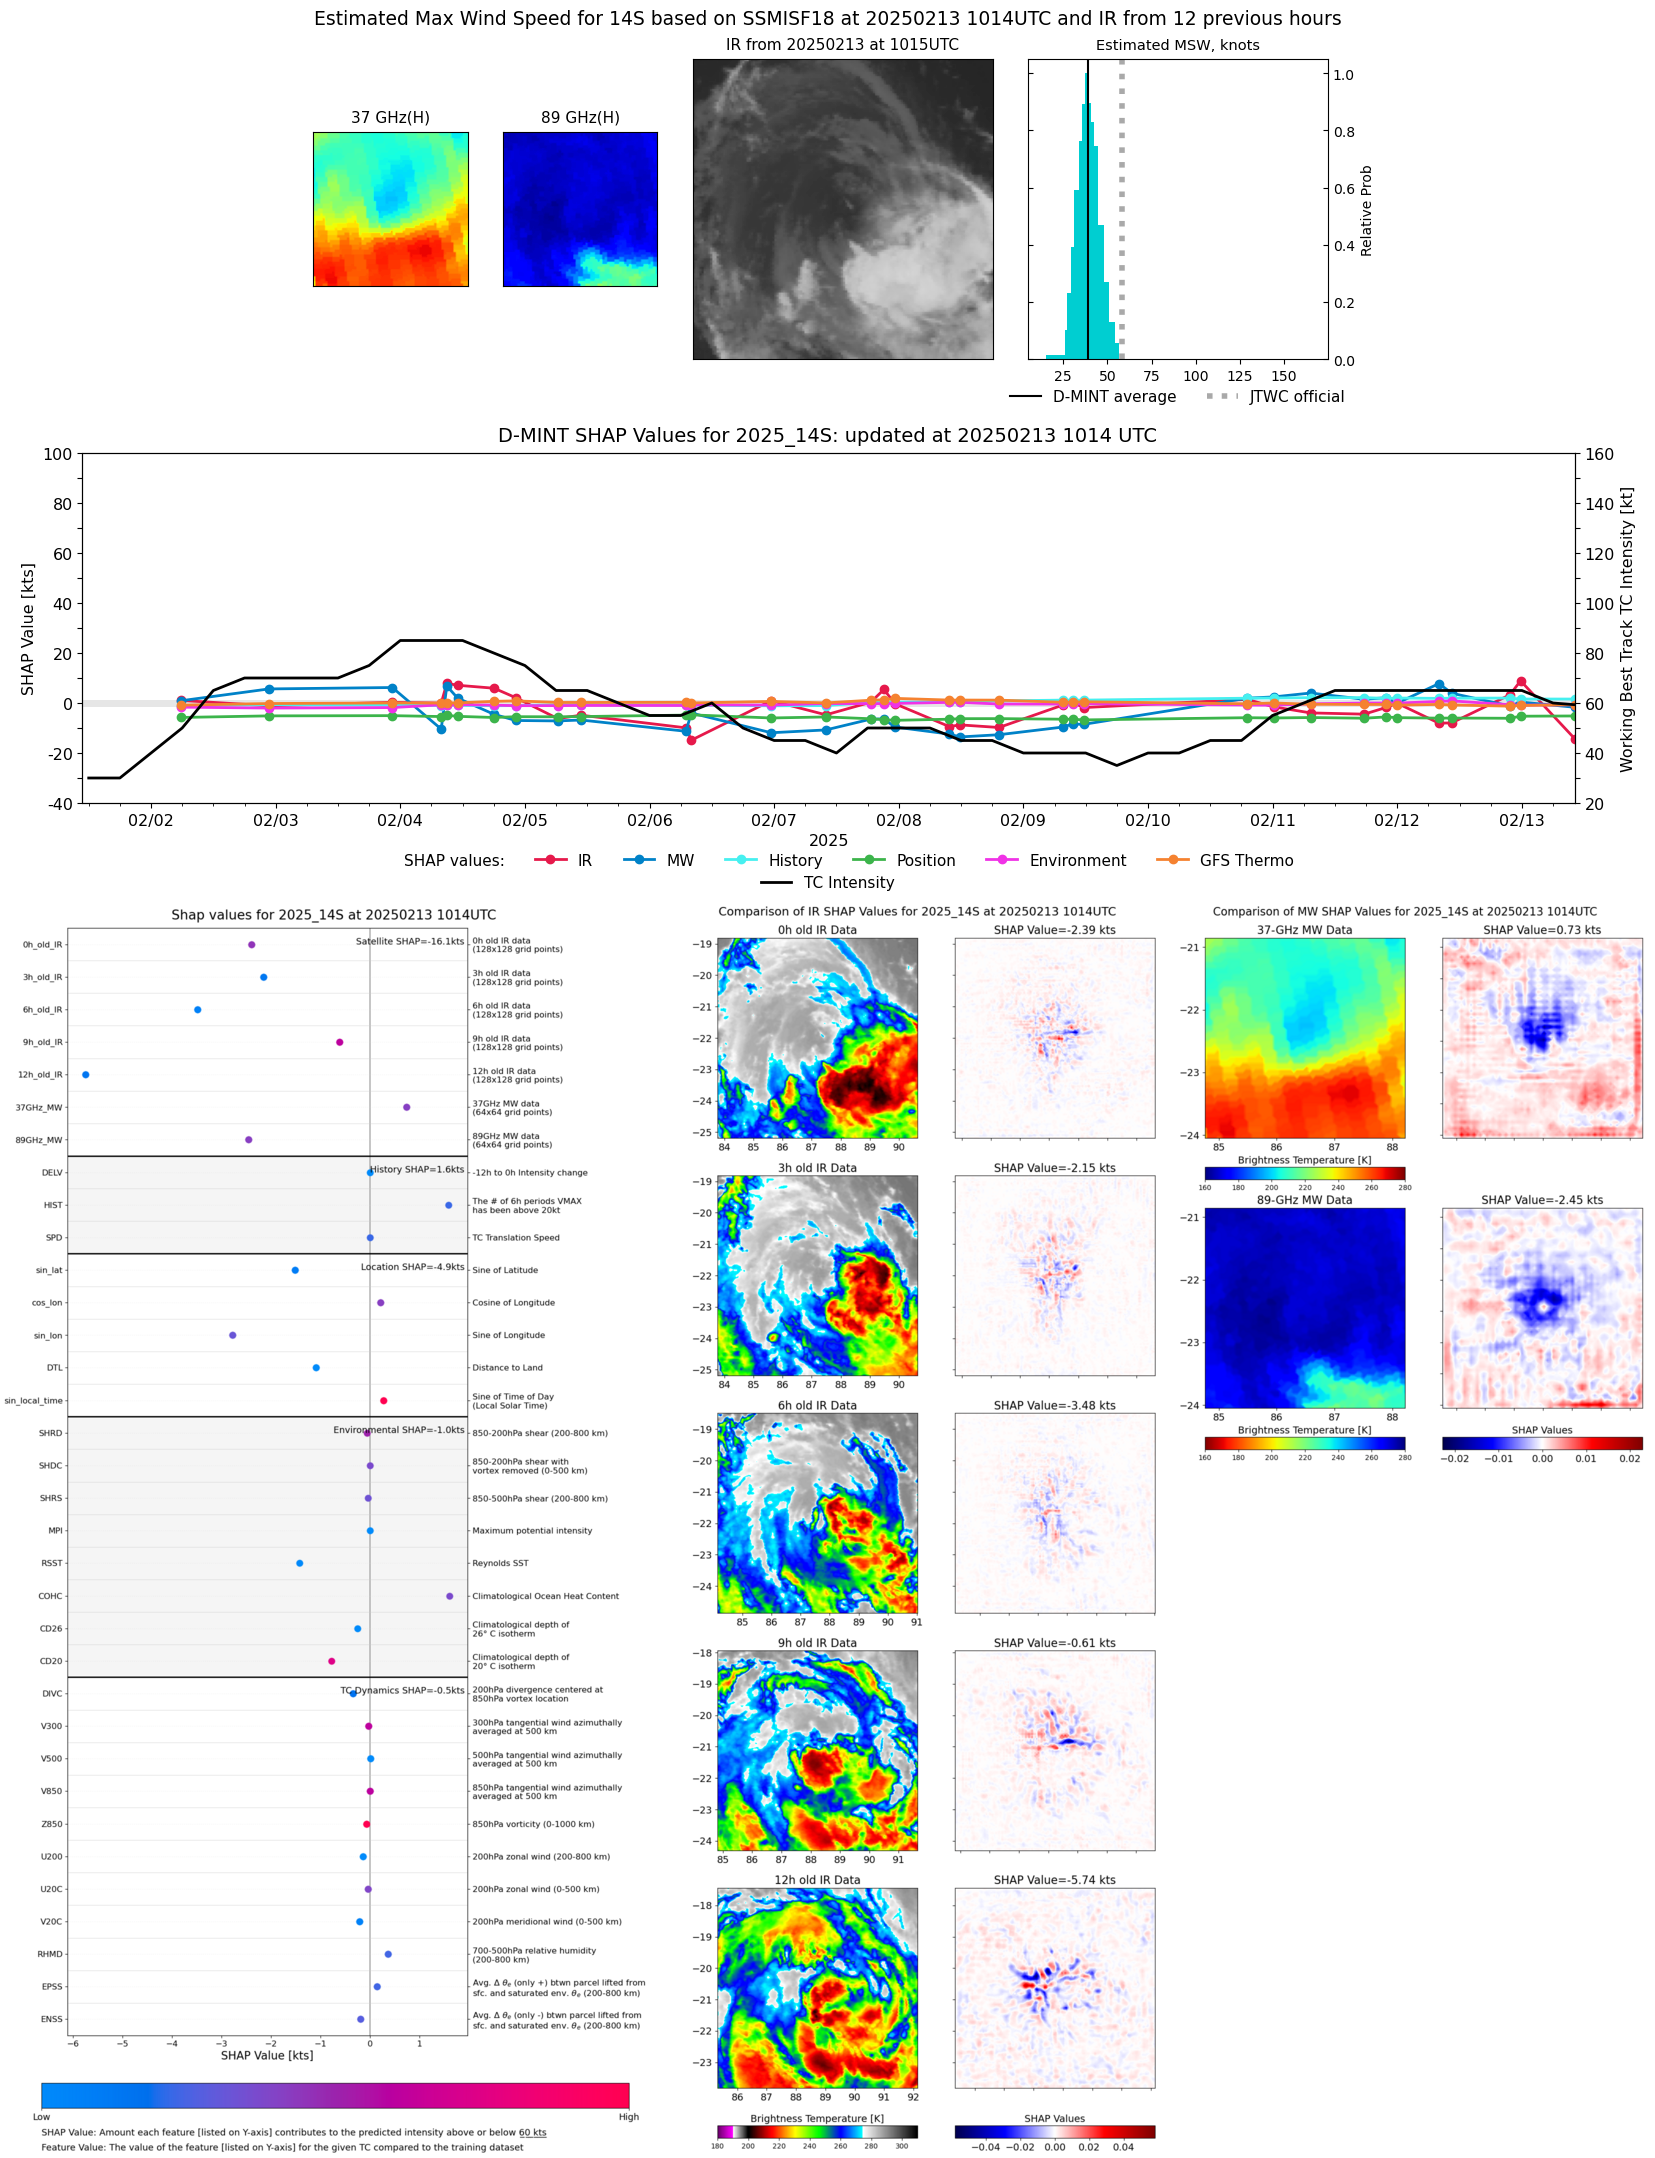 |
| 20250213 | 0025 UTC | SSMISF16 | 982 hPa | 54 kts | 50 kts | 59 kts | 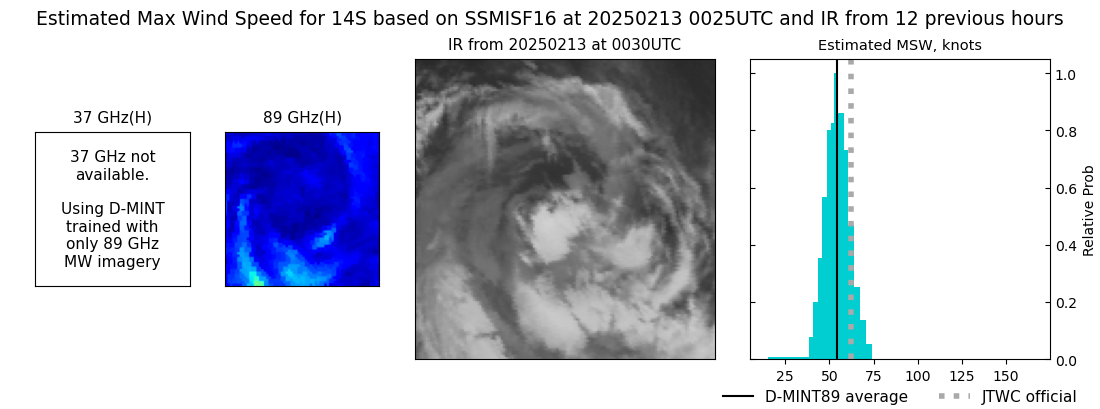 |
| 20250212 | 2345 UTC | SSMISF17 | 982 hPa | 64 kts | 59 kts | 69 kts | 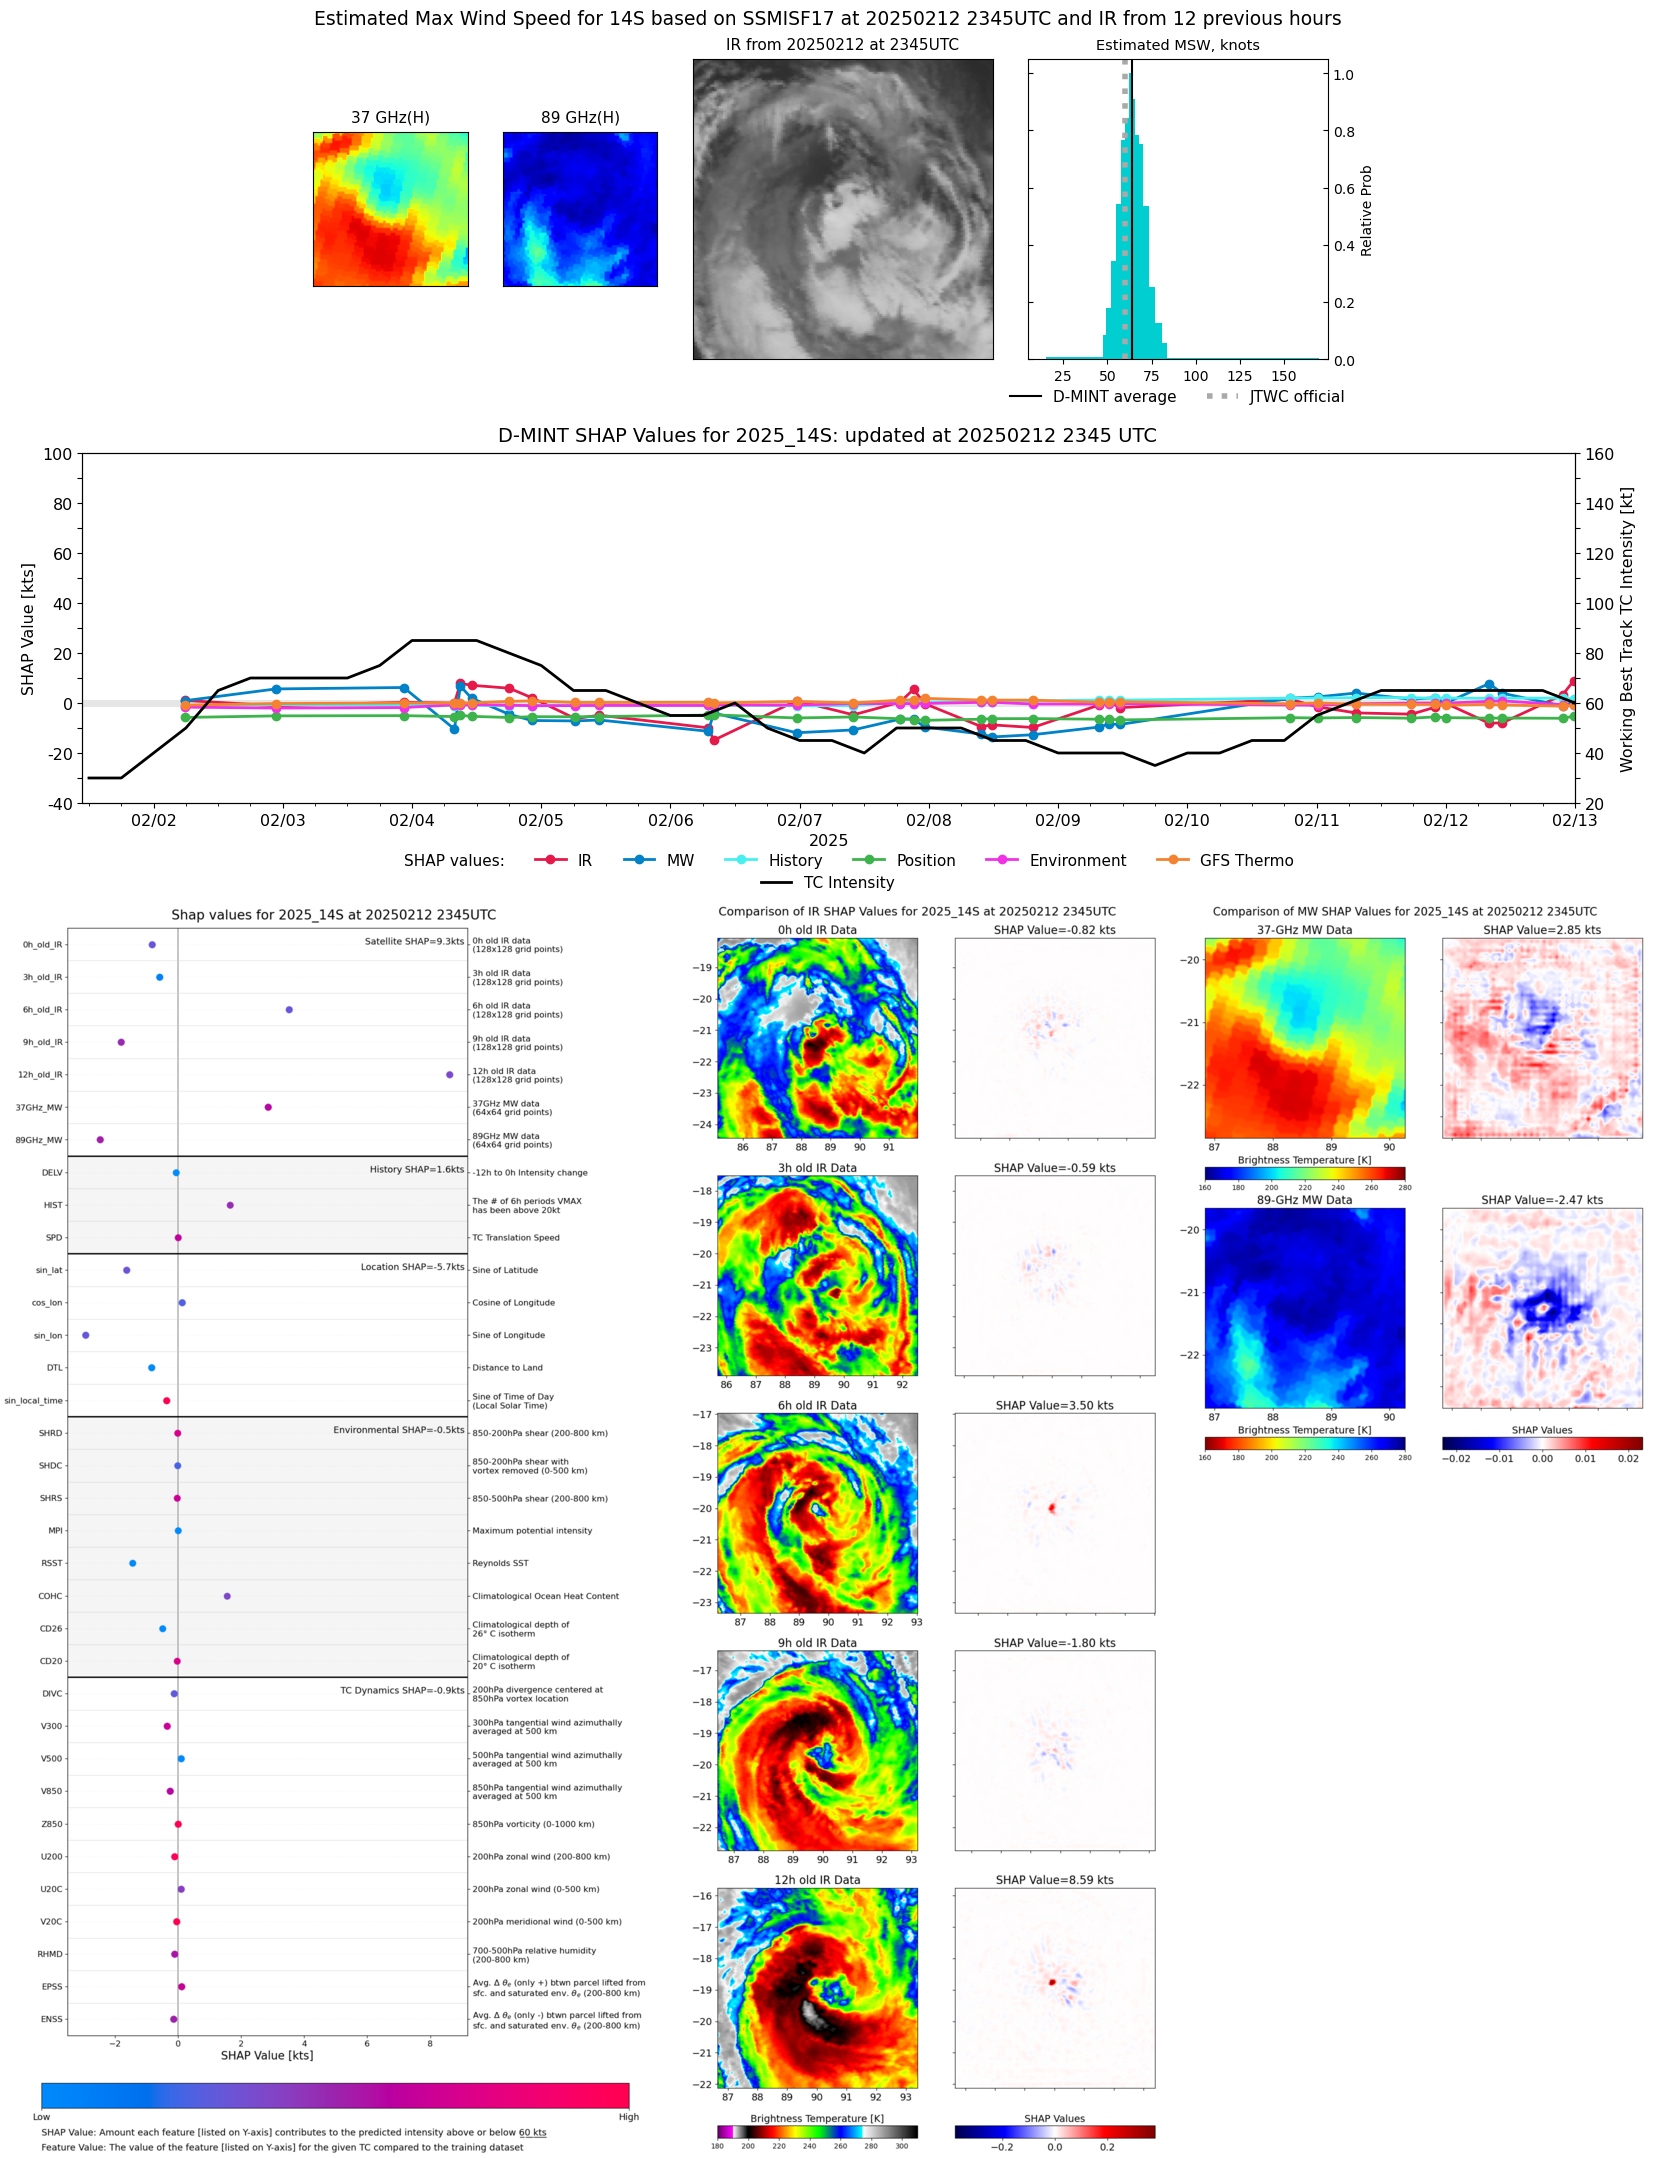 |
| 20250212 | 2142 UTC | SSMISF18 | 984 hPa | 56 kts | 52 kts | 61 kts | 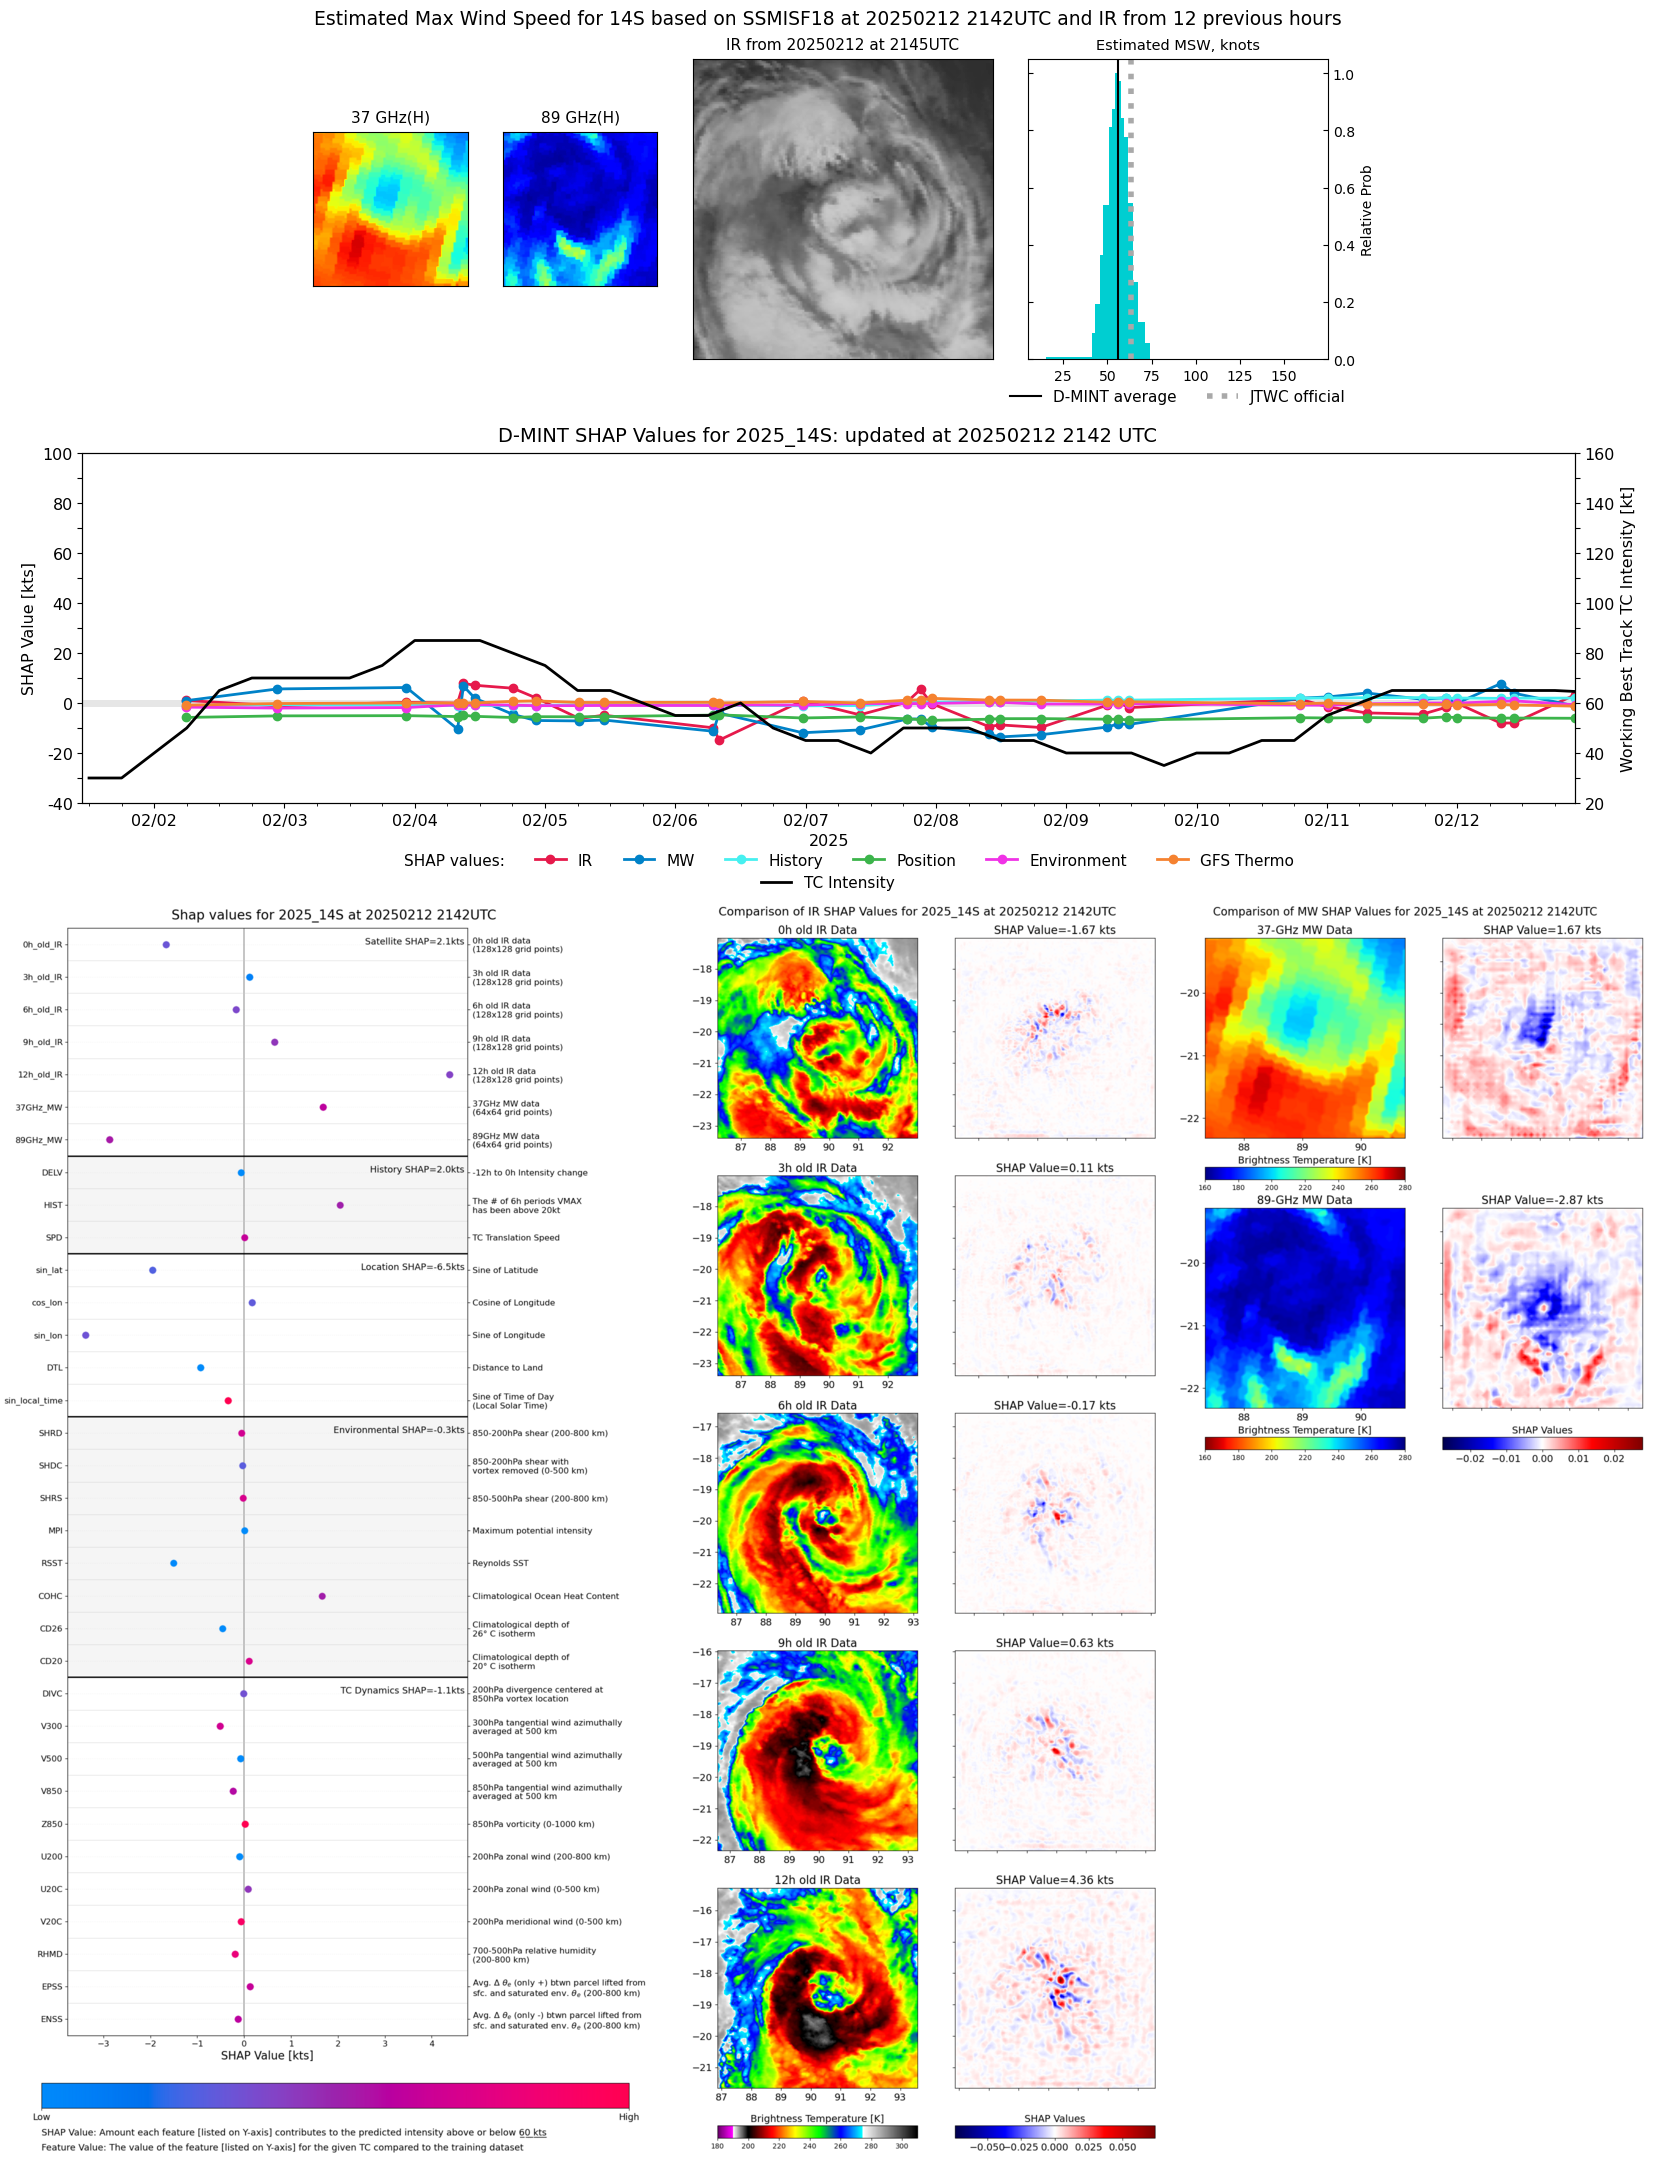 |
| 20250212 | 1856 UTC | AMSR2 | 979 hPa | 56 kts | 51 kts | 61 kts | 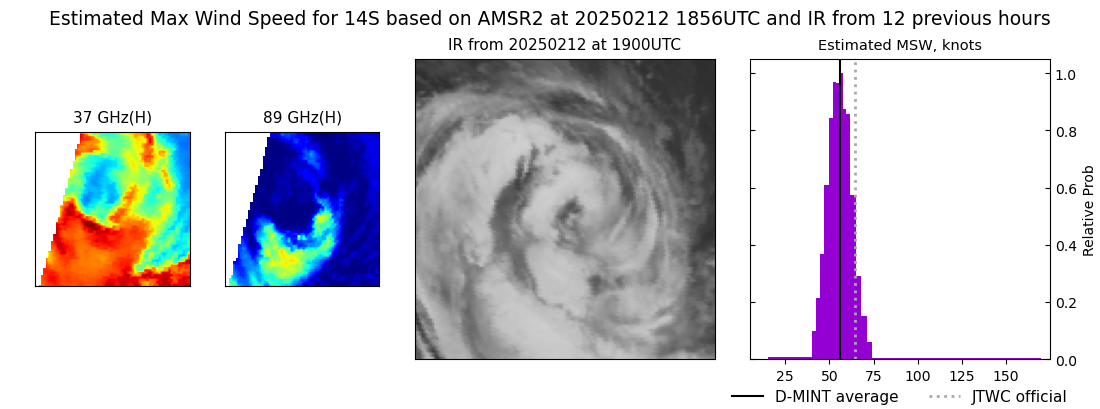 |
| 20250212 | 1853 UTC | ATMS-N20 | 991 hPa | 54 kts | 49 kts | 59 kts | 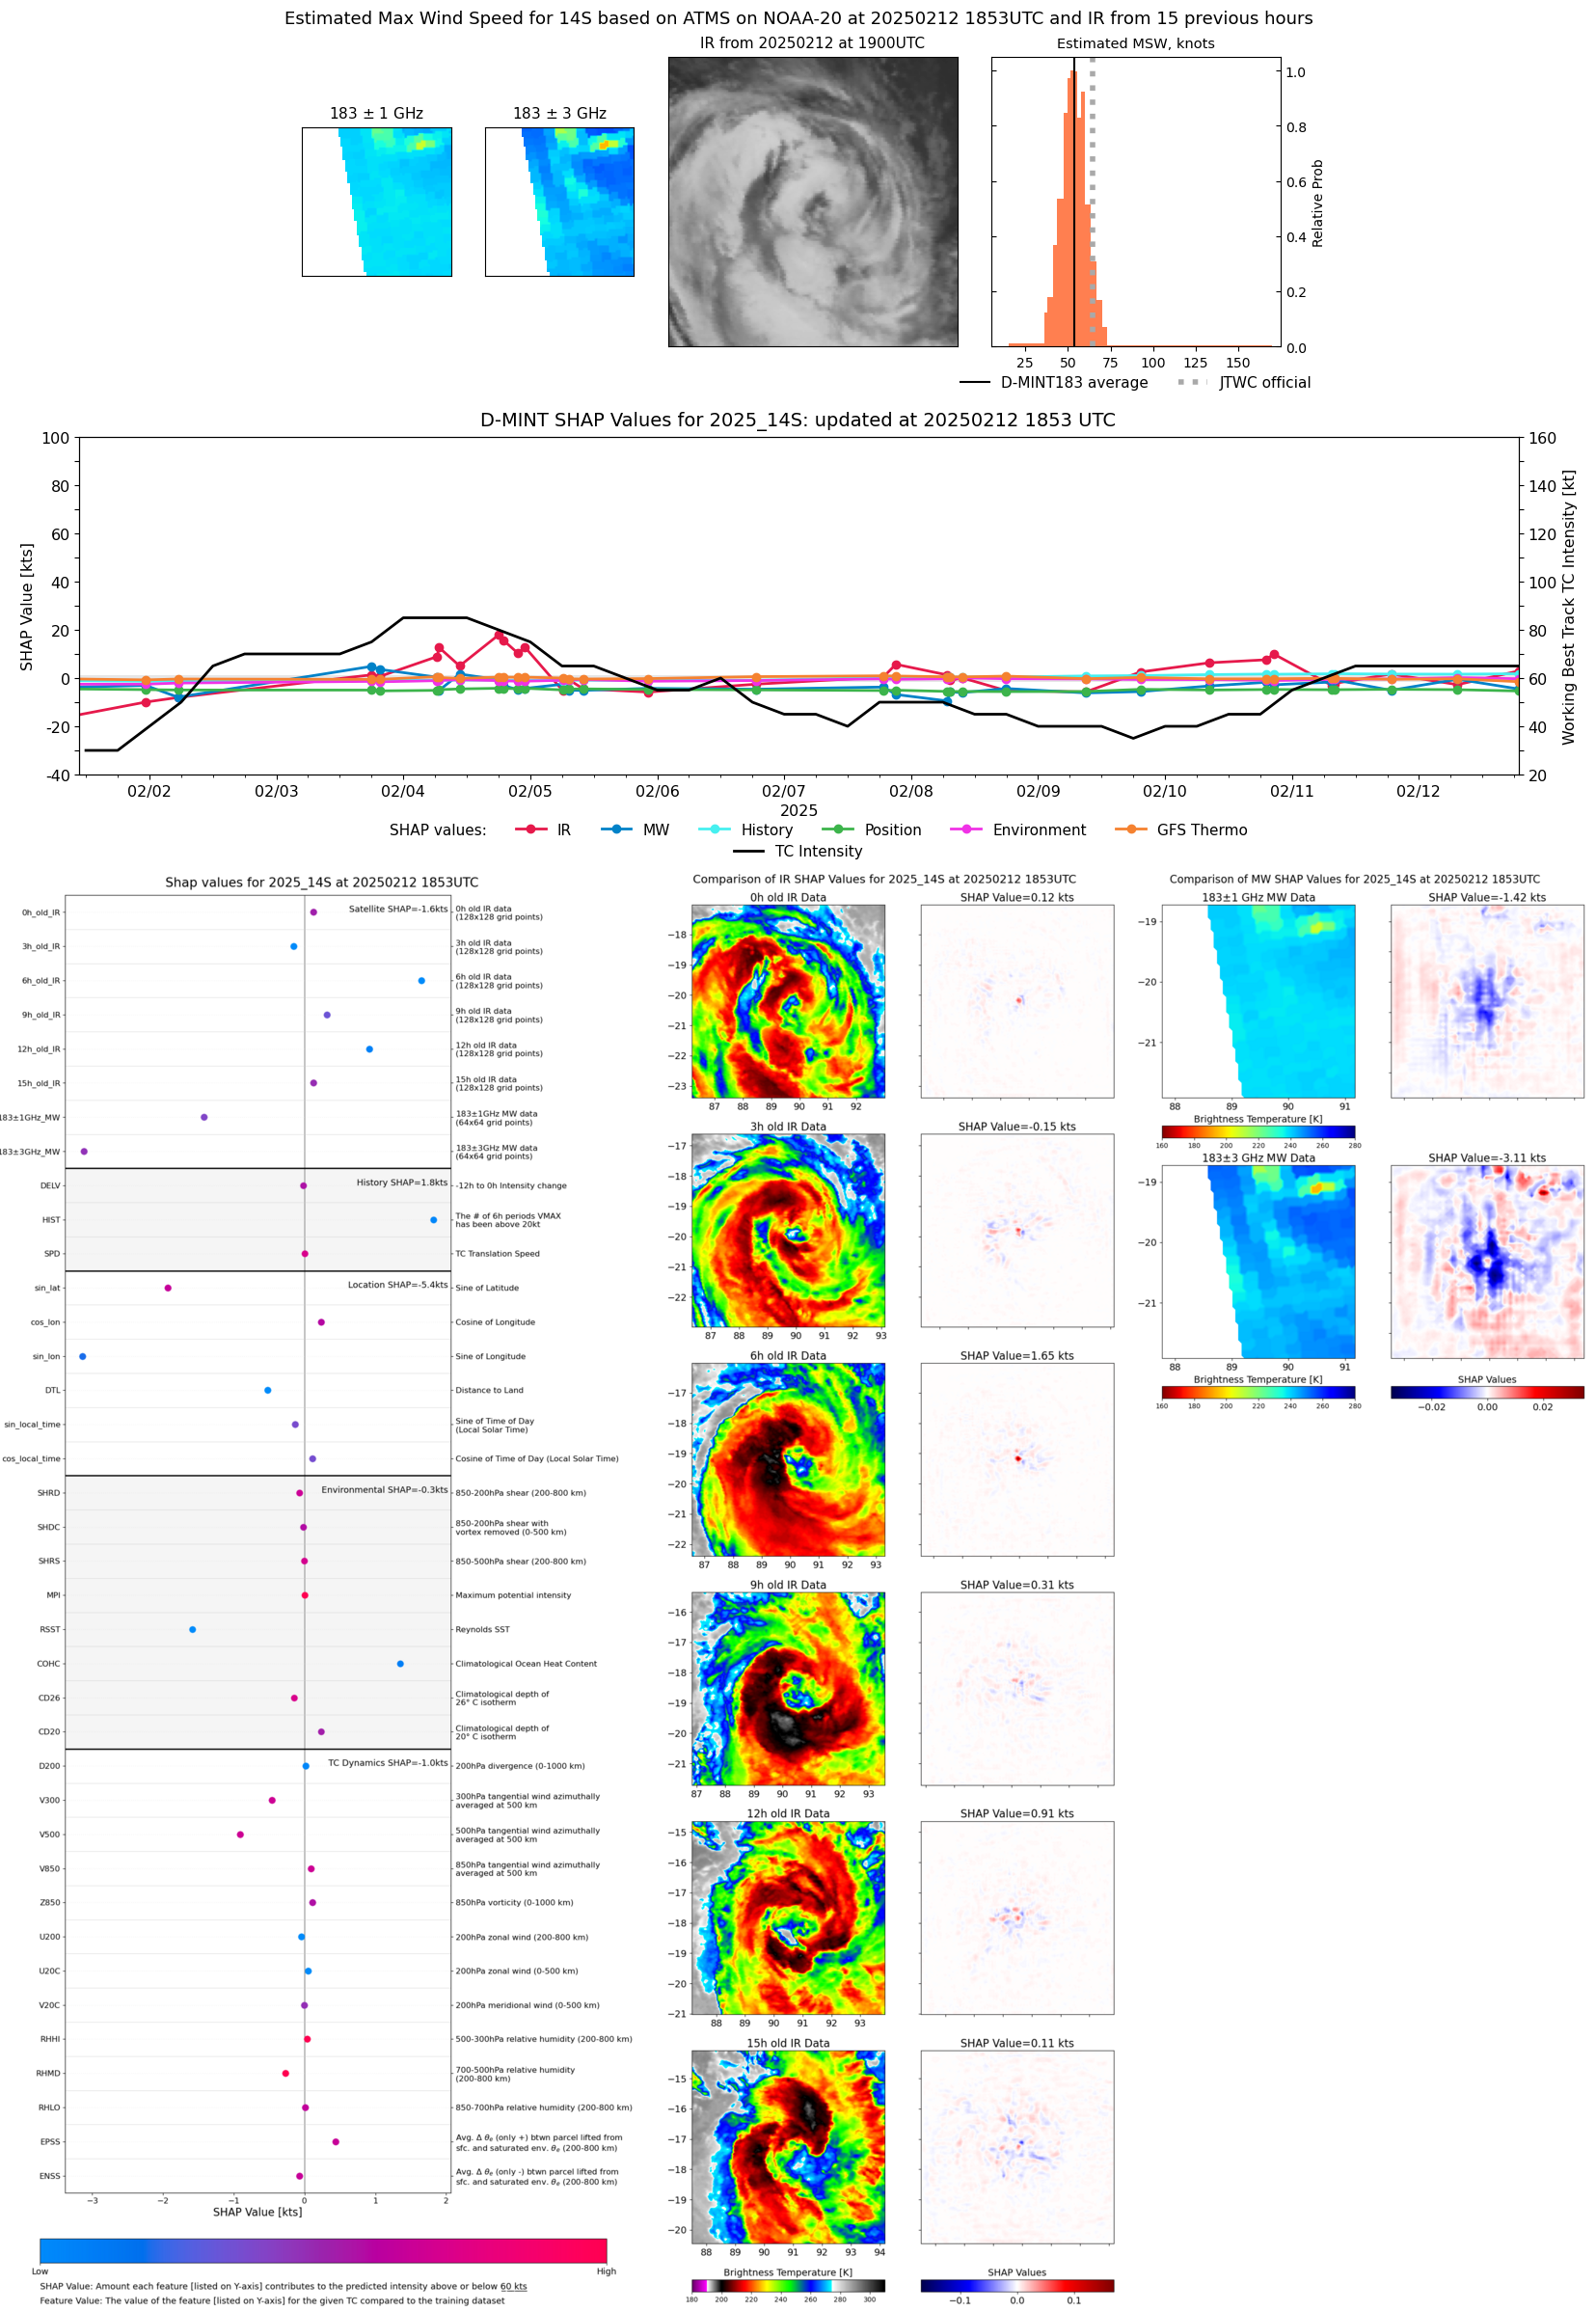 |
| 20250212 | 1232 UTC | SSMISF17 | NaN hPa | 56 kts | 50 kts | 62 kts | 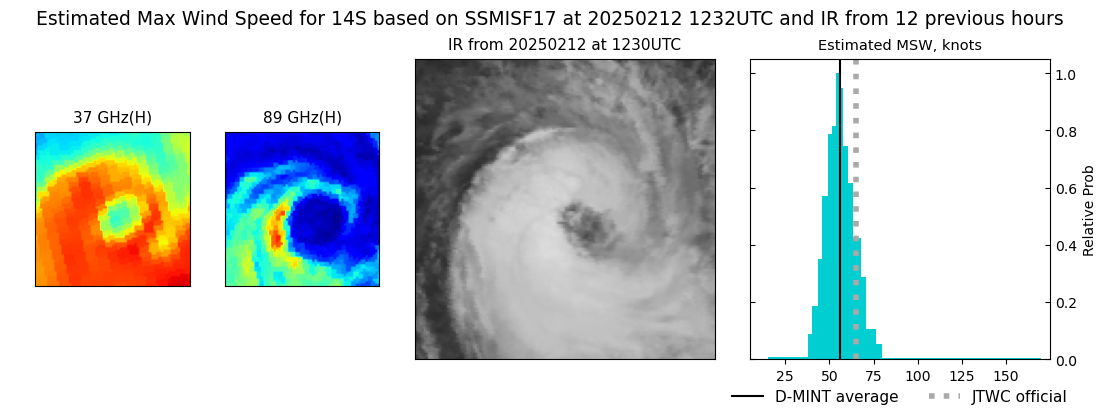 |
| 20250212 | 1029 UTC | SSMISF18 | 987 hPa | 52 kts | 47 kts | 57 kts |  |
| 20250212 | 0802 UTC | AMSR2 | 987 hPa | 56 kts | 51 kts | 61 kts | 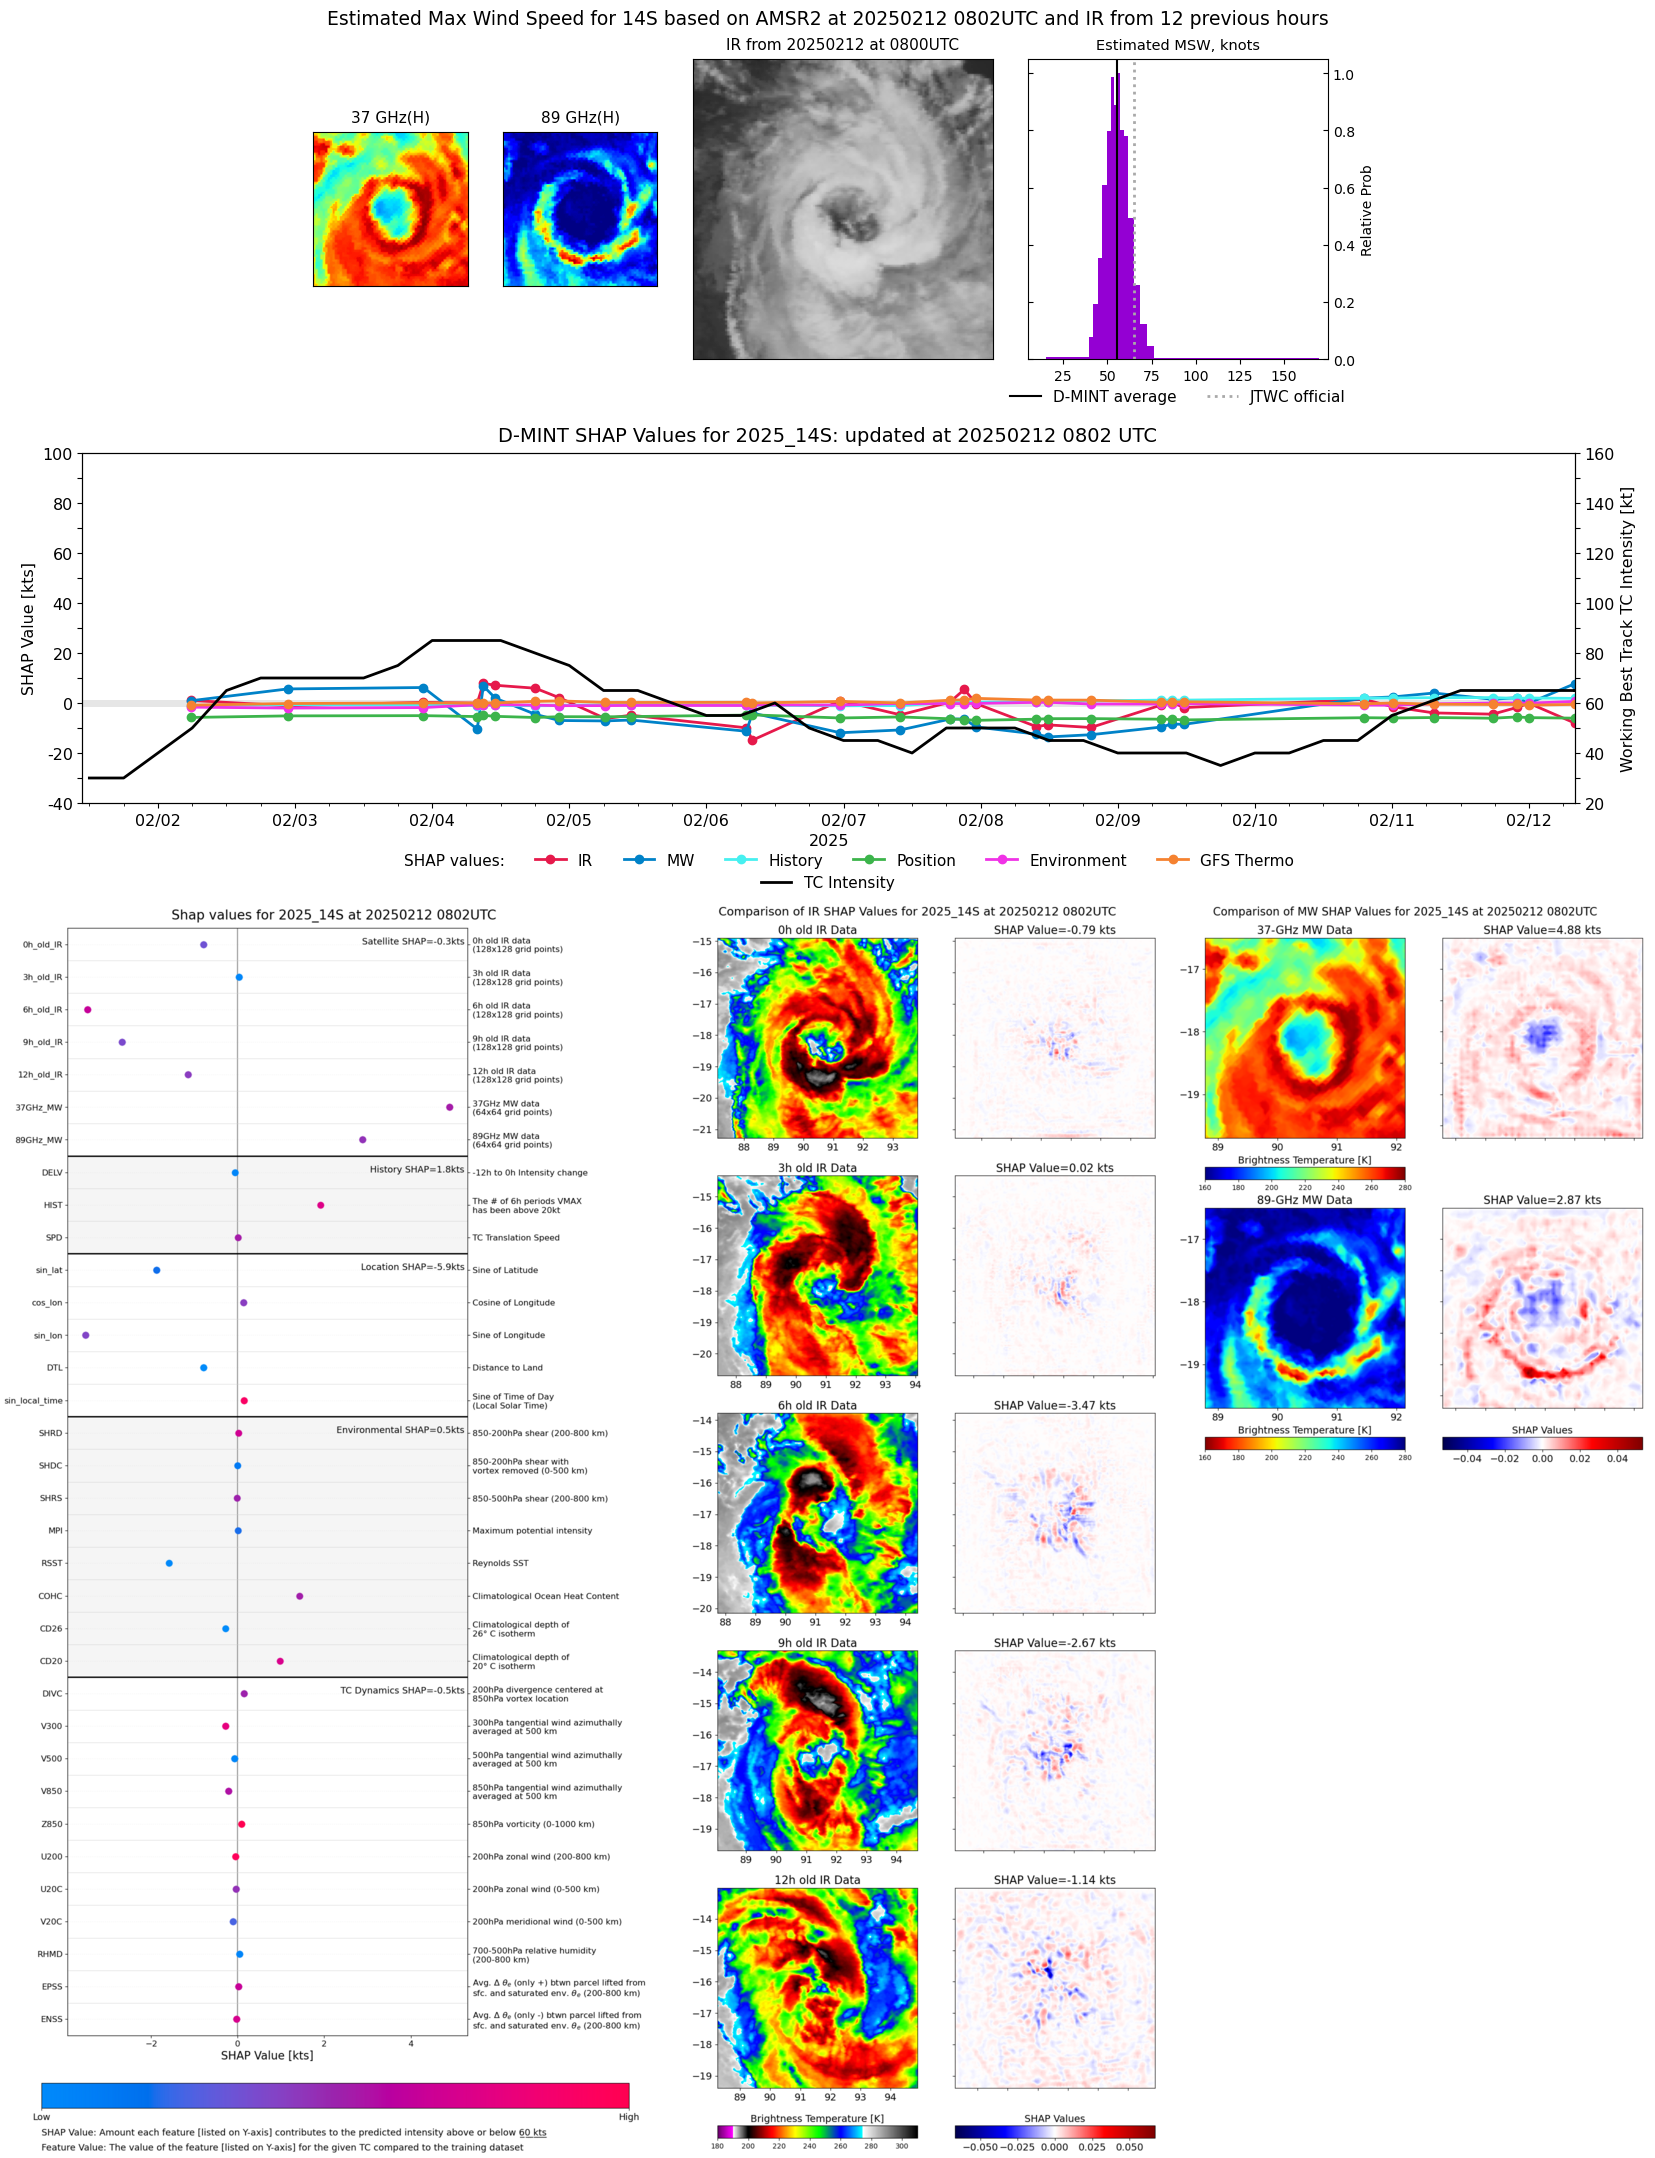 |
| 20250212 | 0717 UTC | ATMS-N20 | 982 hPa | 54 kts | 49 kts | 59 kts | 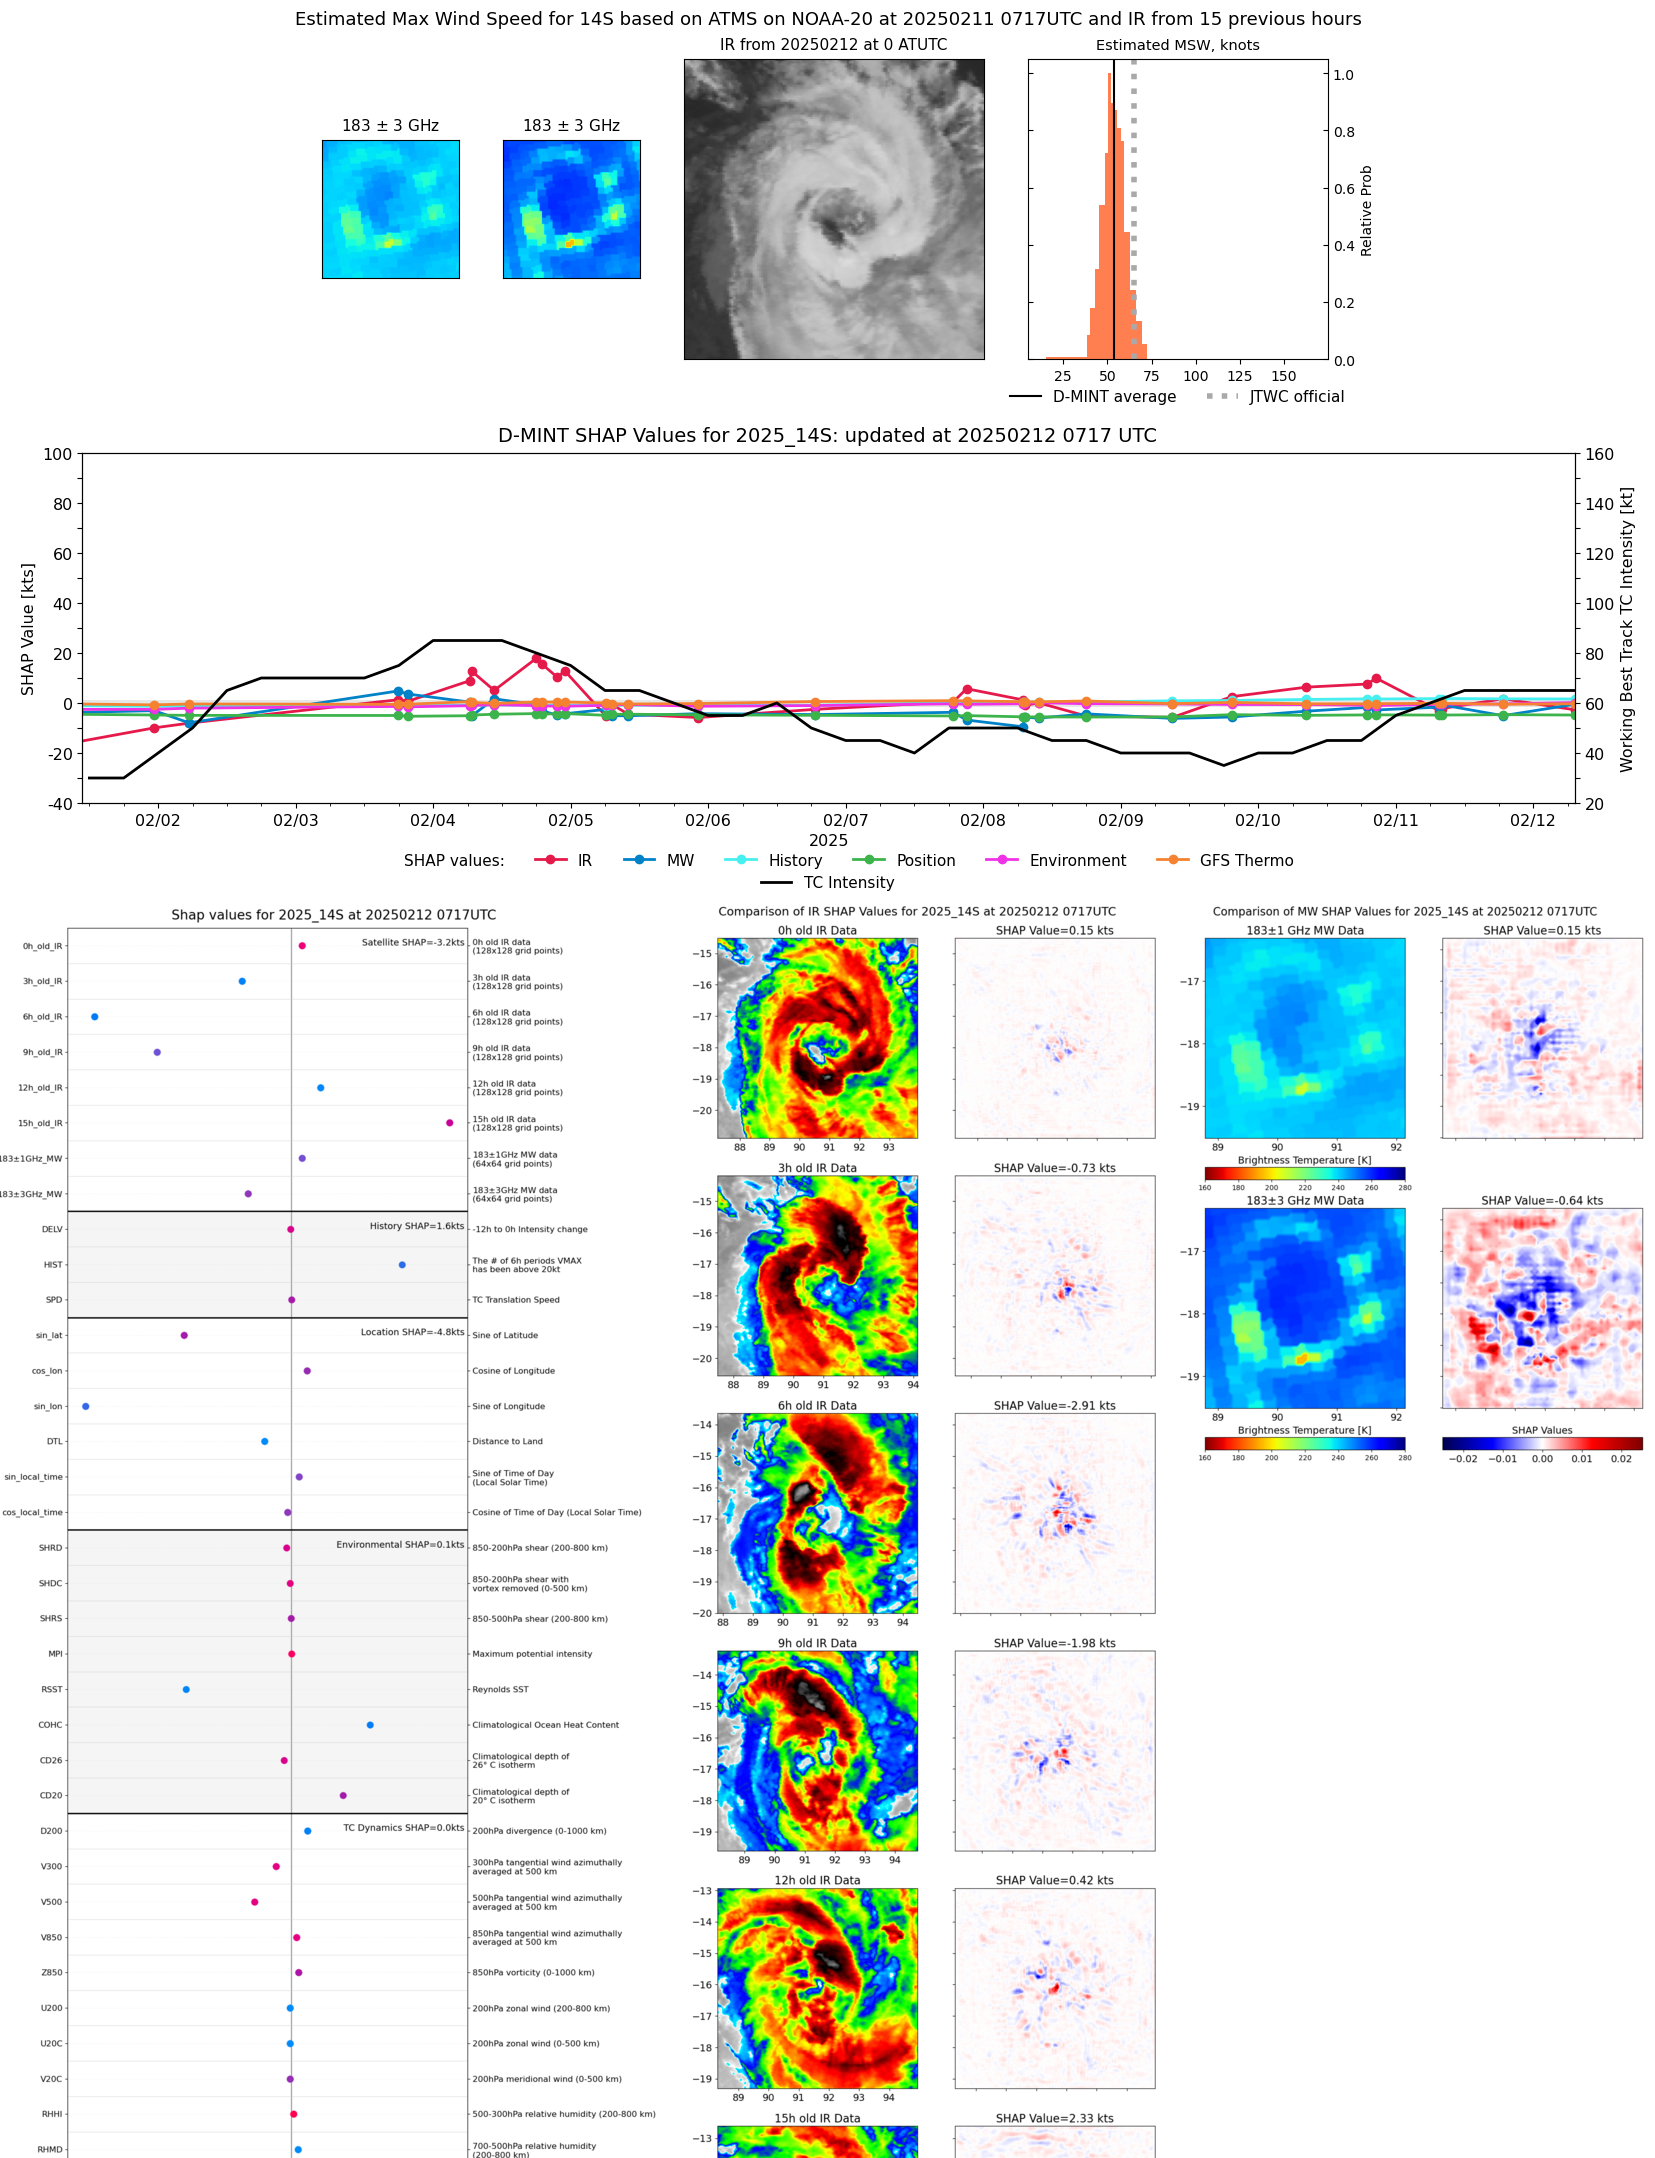 |
| 20250212 | 0703 UTC | GMI | NaN hPa | 30 kts | 27 kts | 34 kts | 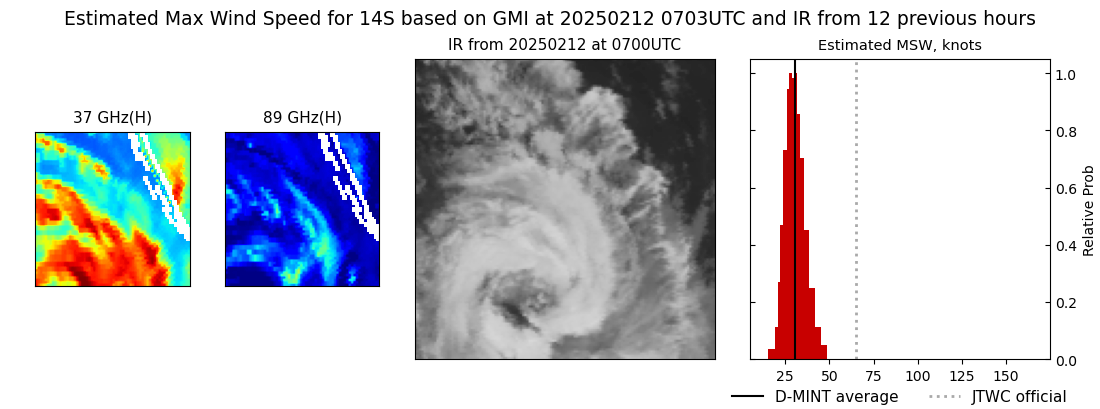 |
| 20250211 | 2358 UTC | SSMISF17 | 987 hPa | 55 kts | 51 kts | 60 kts | 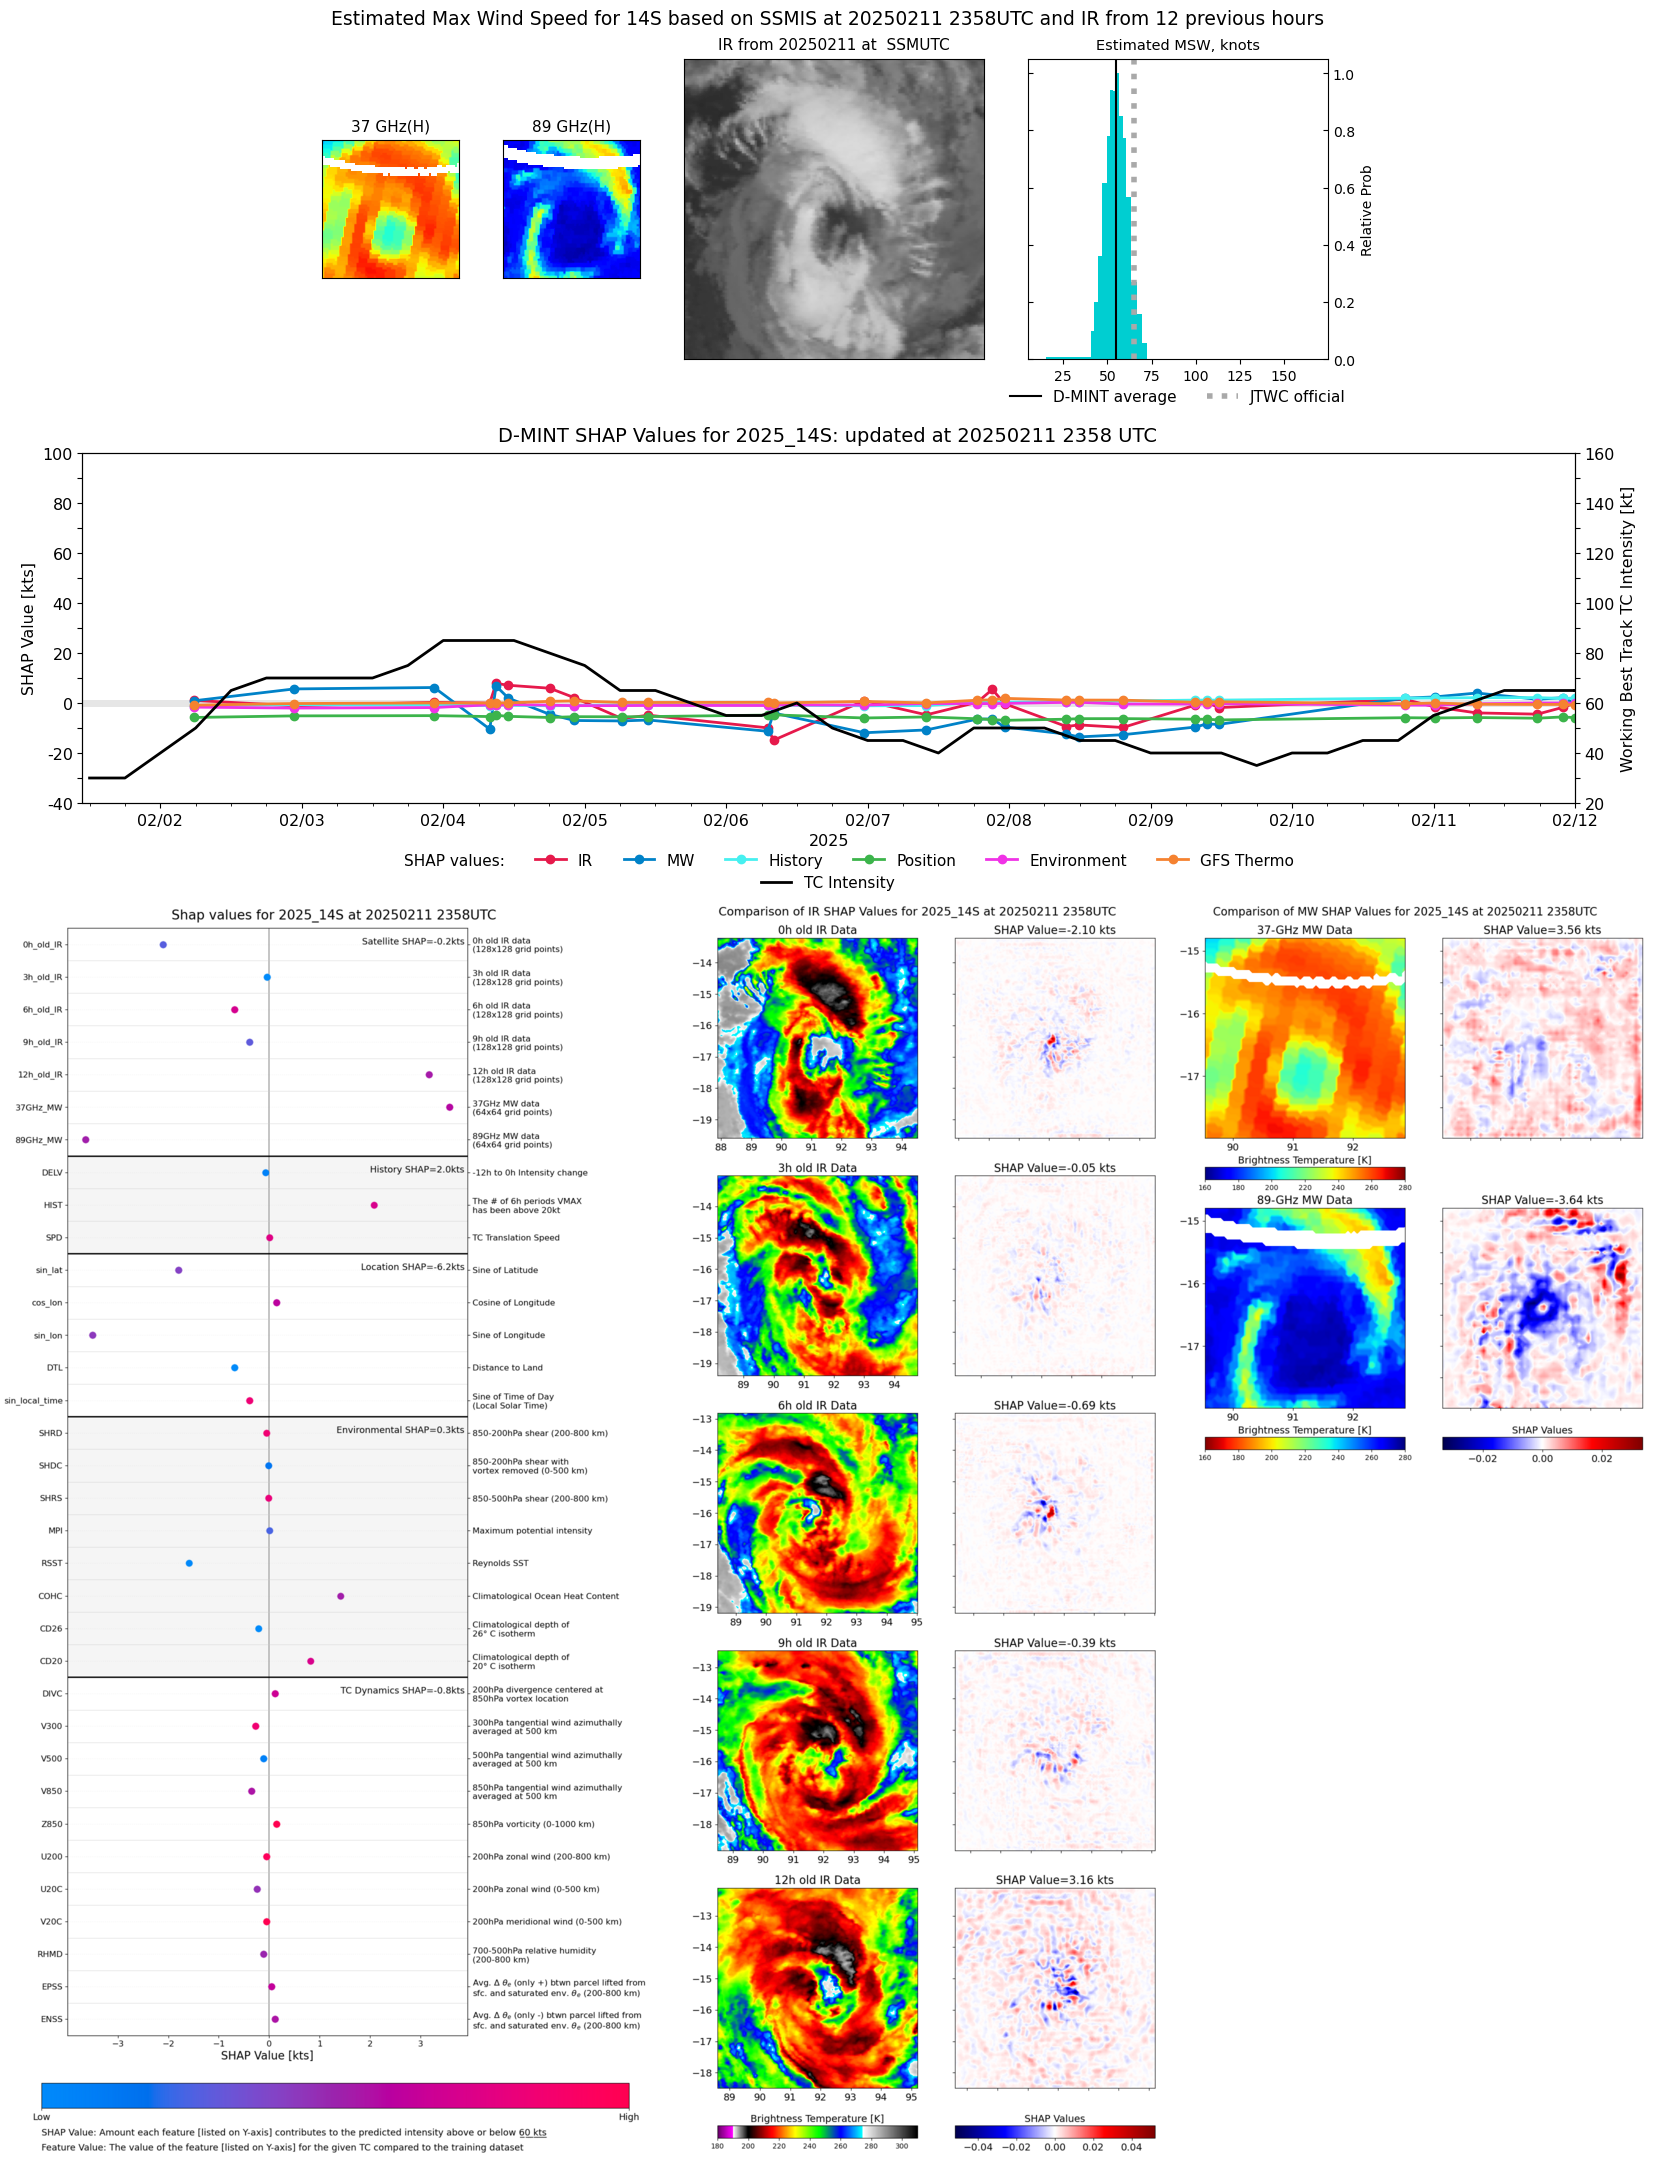 |
| 20250211 | 2155 UTC | SSMISF18 | 986 hPa | 56 kts | 52 kts | 61 kts |  |
| 20250211 | 1911 UTC | ATMS-N20 | 986 hPa | 57 kts | 52 kts | 63 kts | 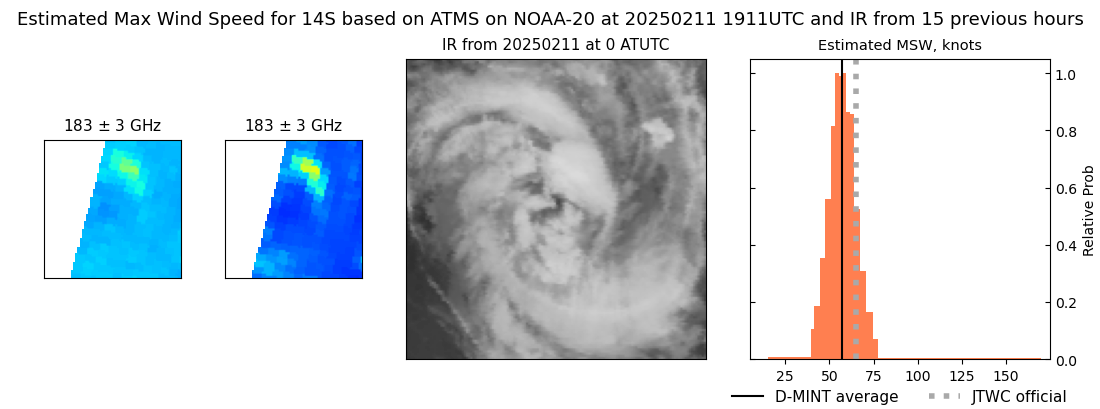 |
| 20250211 | 1844 UTC | ATMS-N20 | 985 hPa | 53 kts | 48 kts | 59 kts | 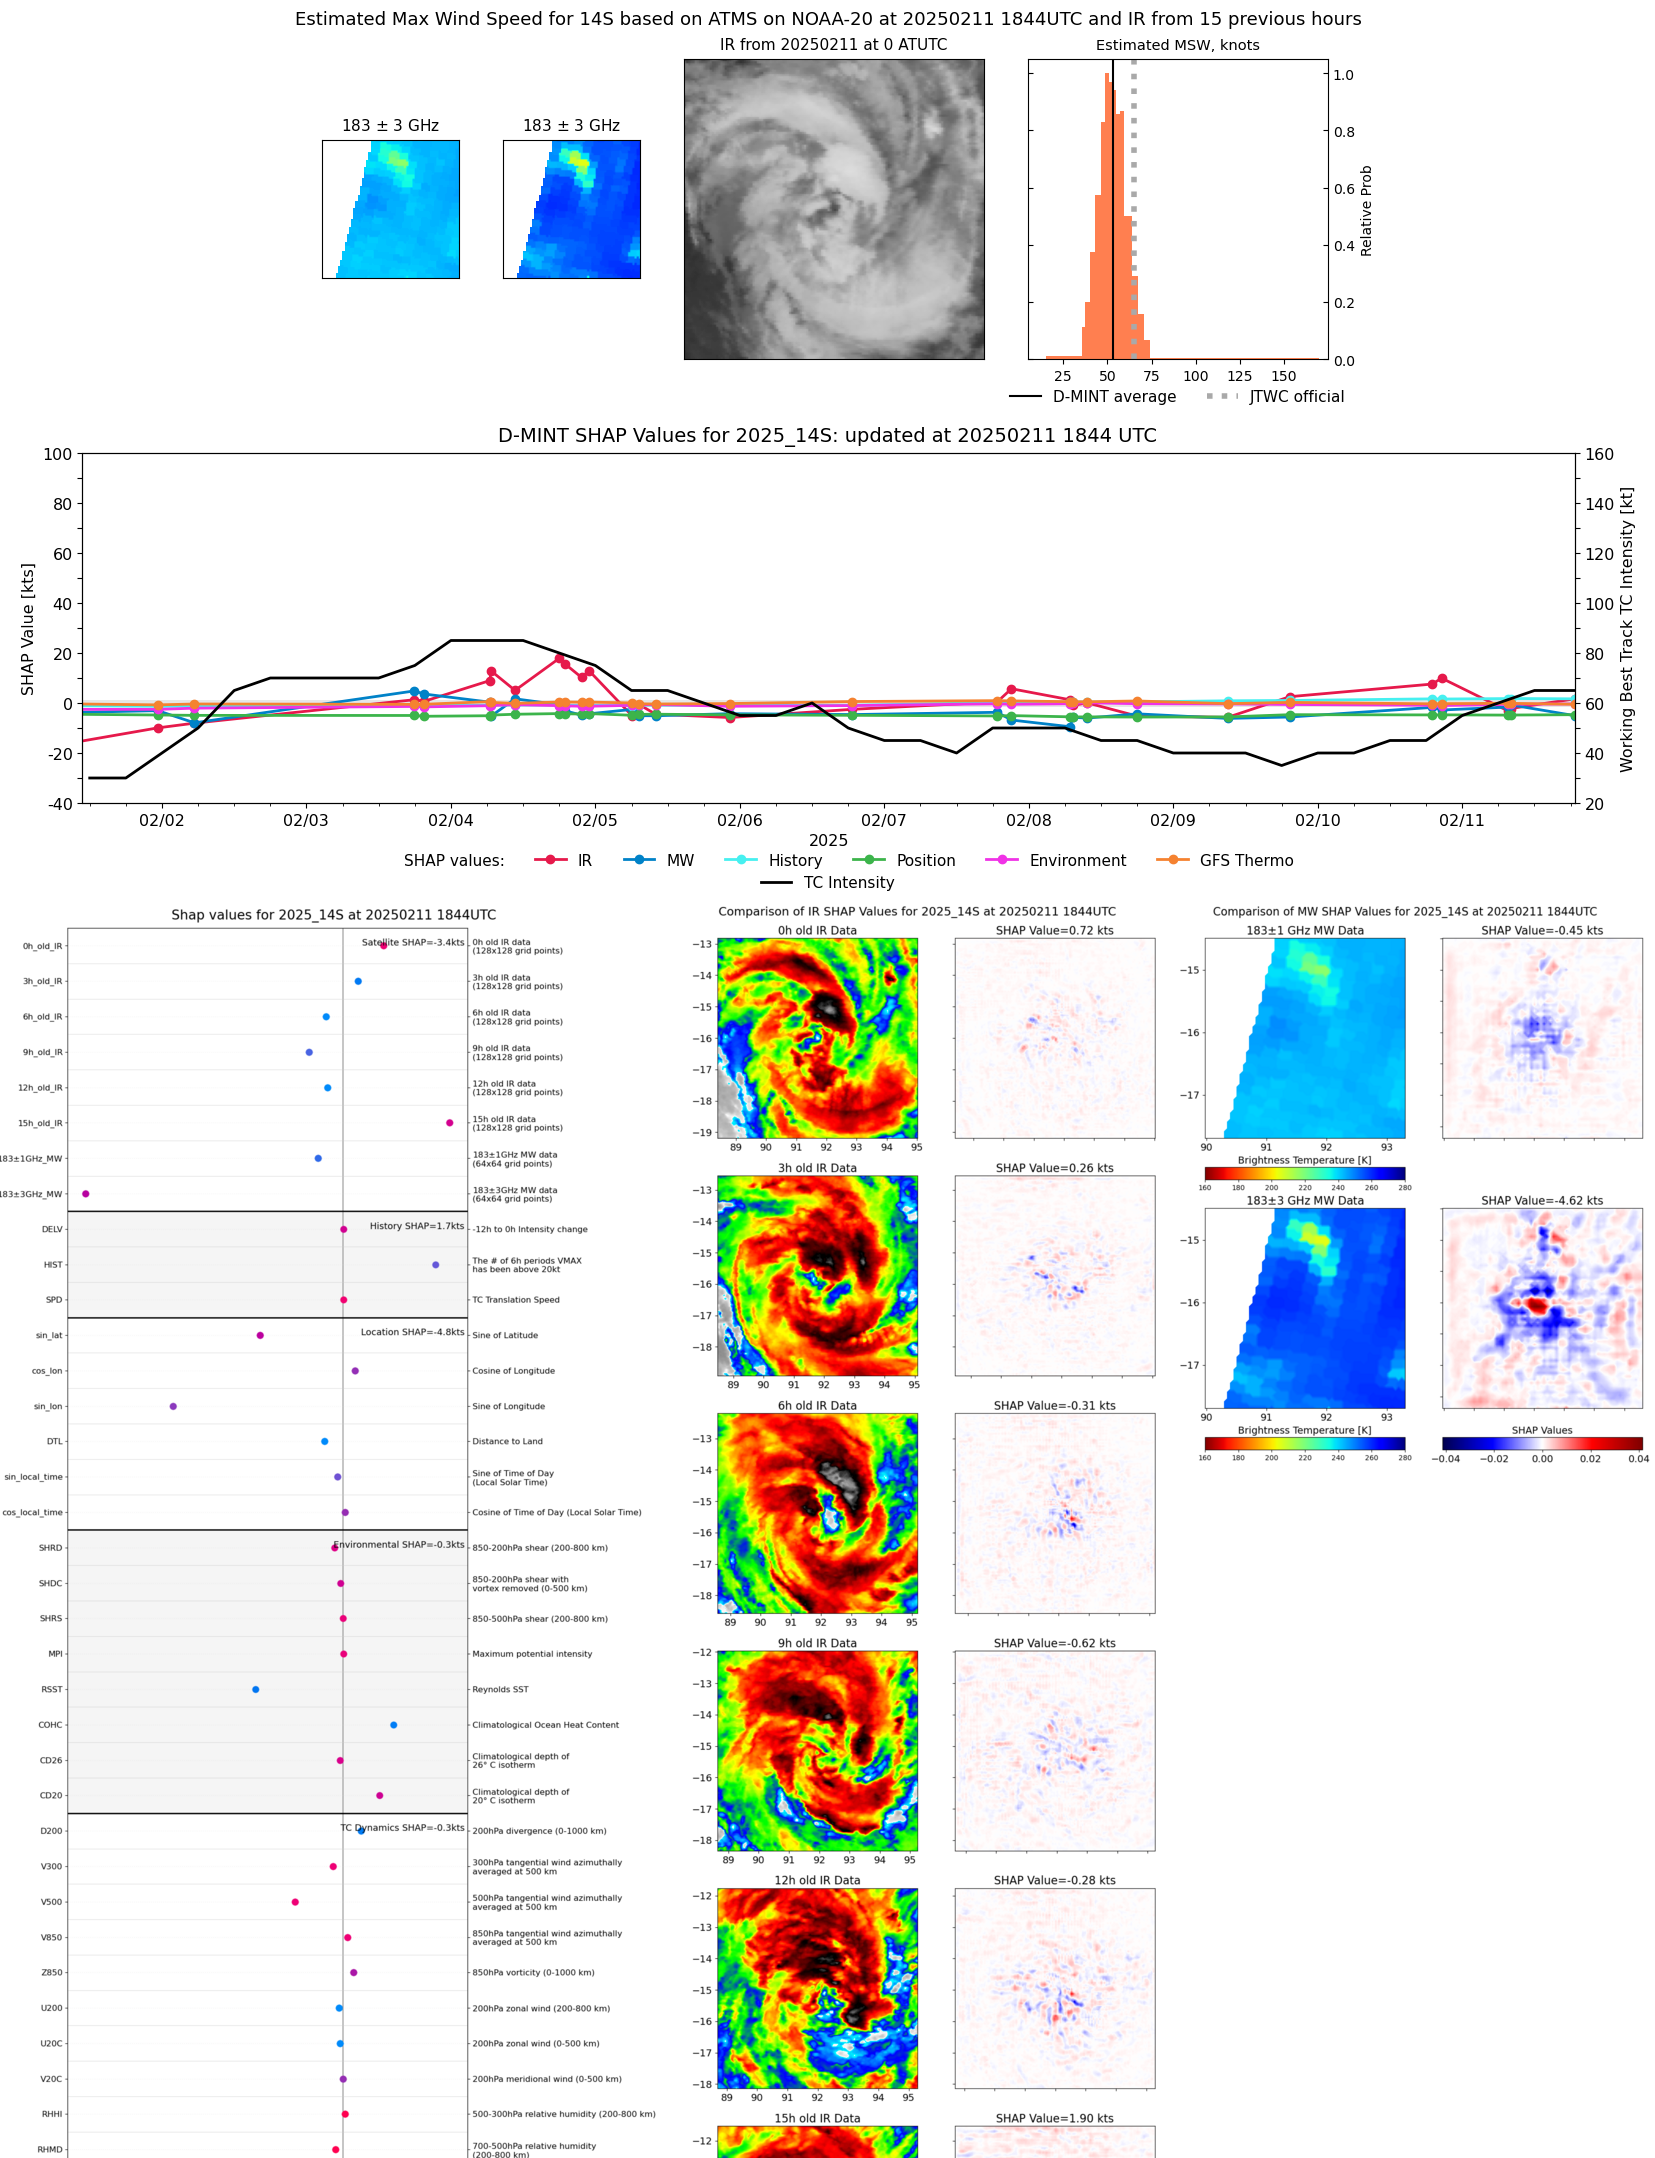 |
| 20250211 | 1738 UTC | GMI | 985 hPa | 53 kts | 48 kts | 57 kts | 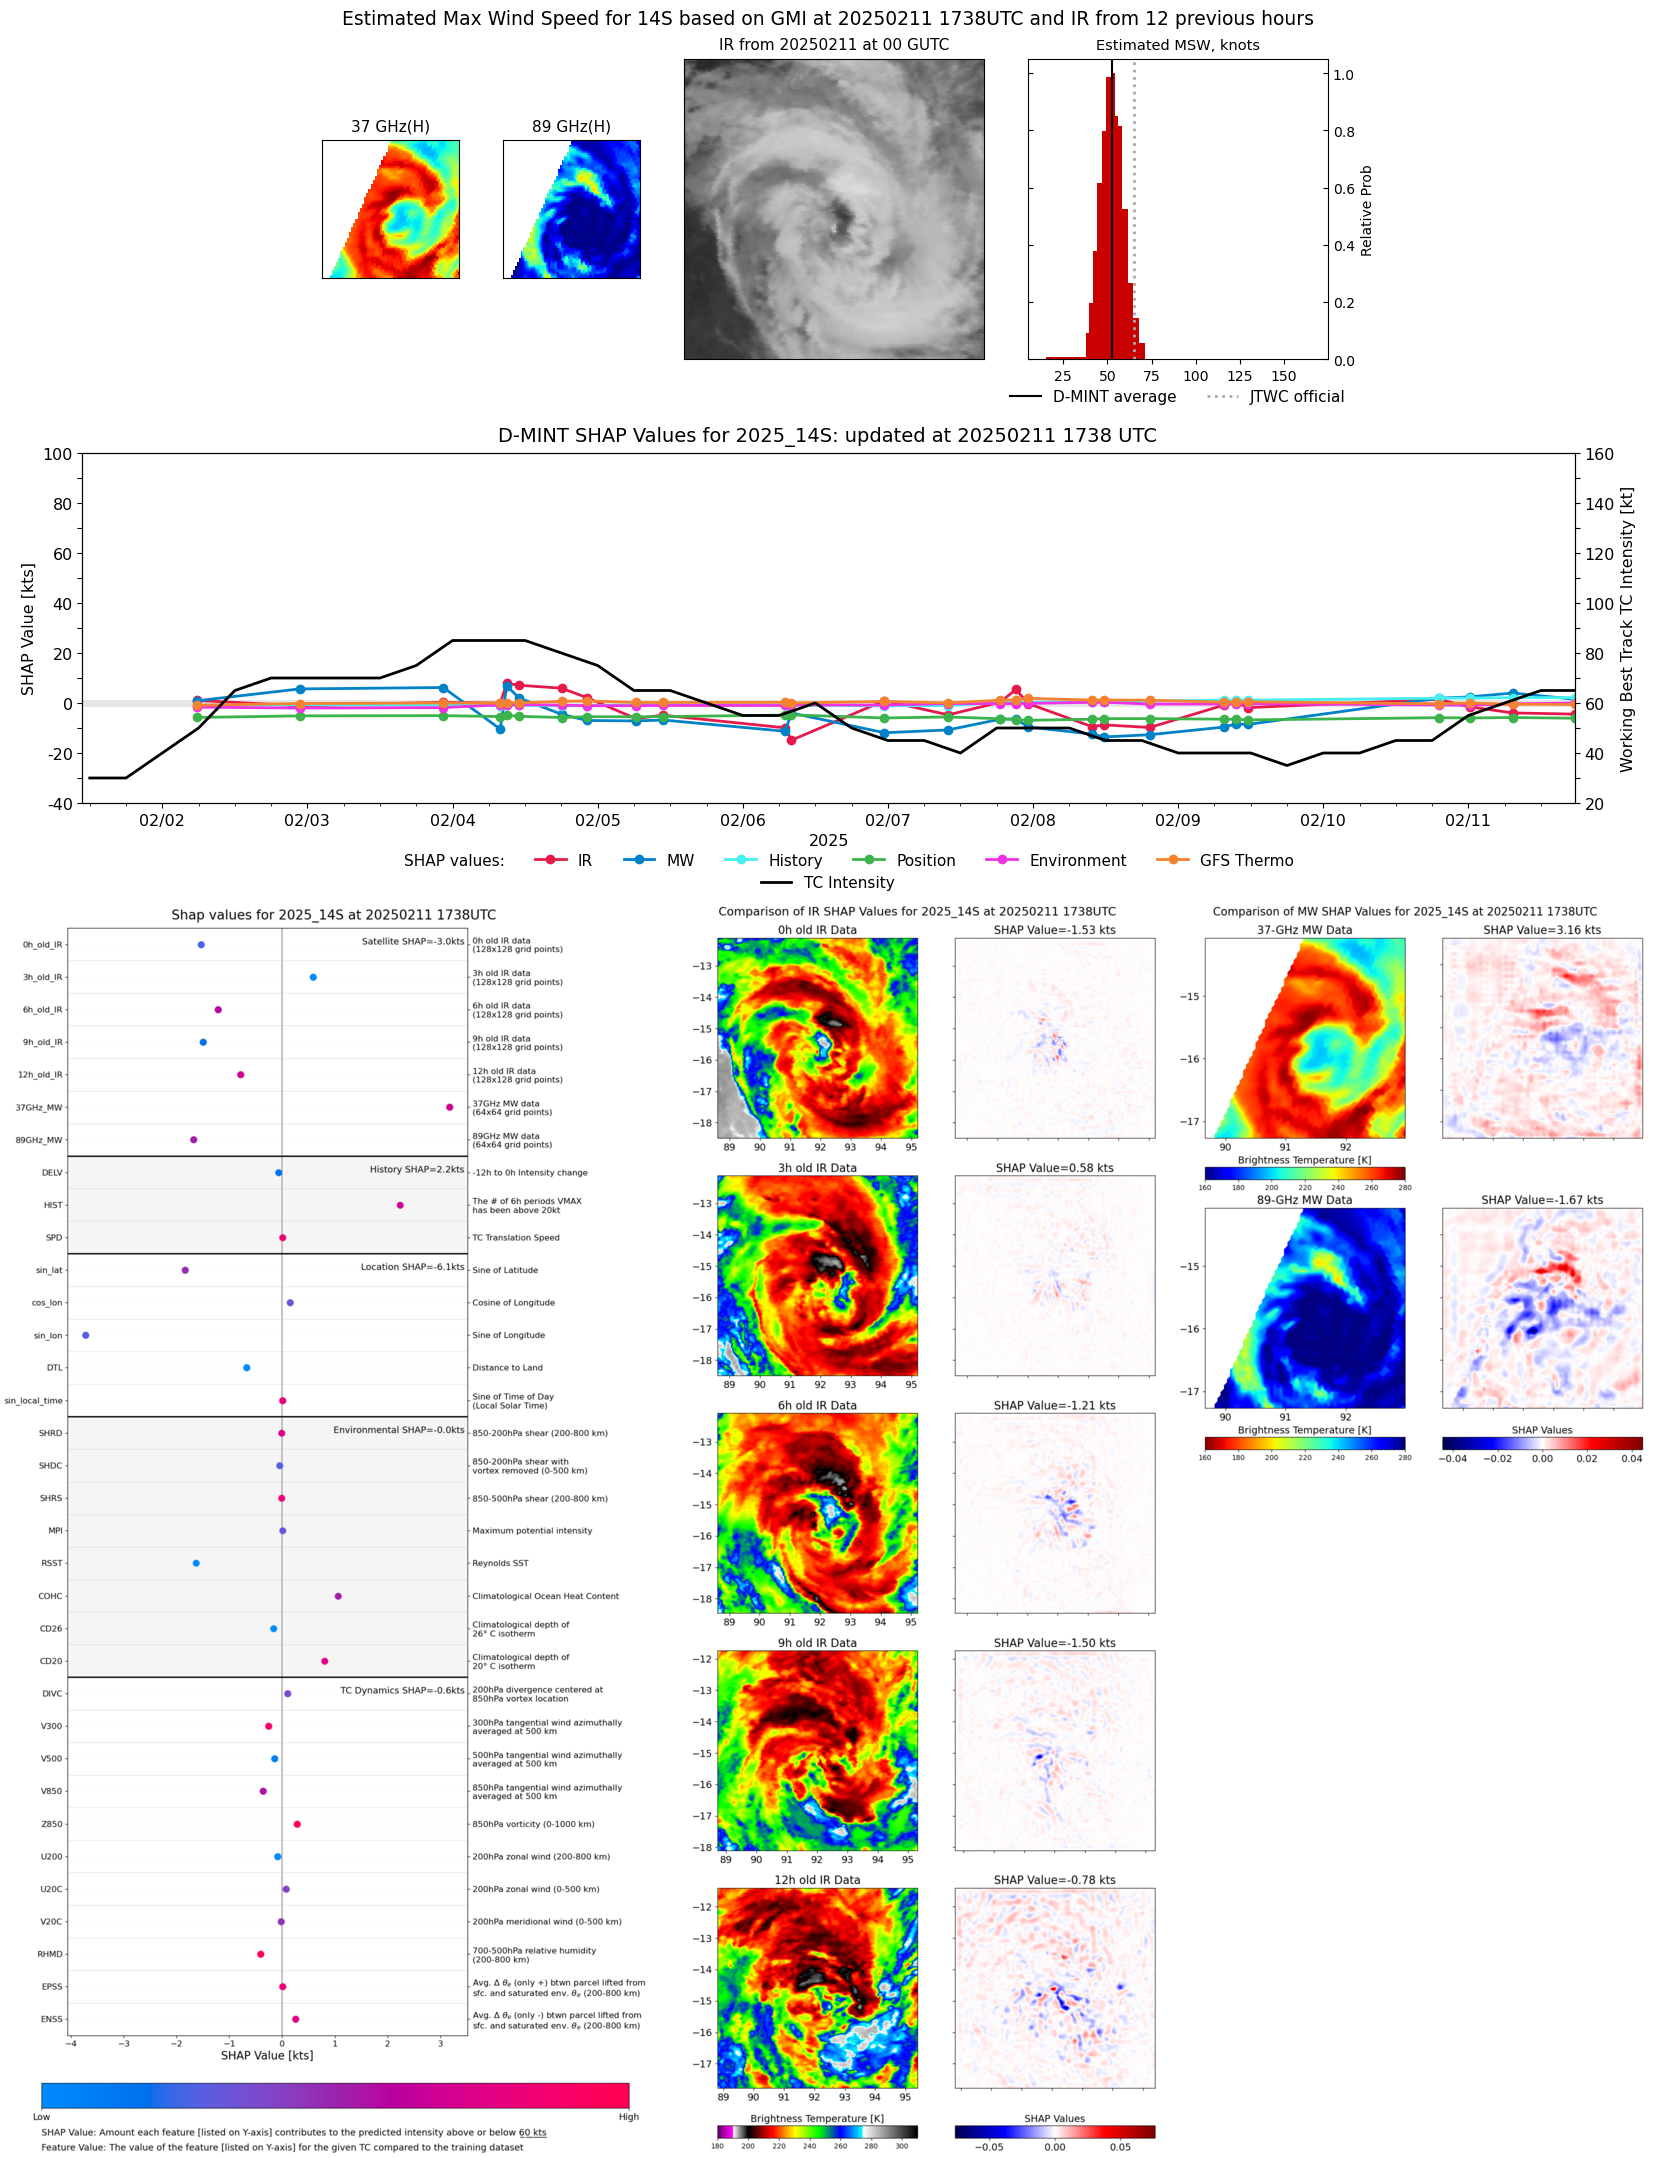 |
| 20250211 | 0802 UTC | ATMS-N20 | 986 hPa | 54 kts | 49 kts | 59 kts | 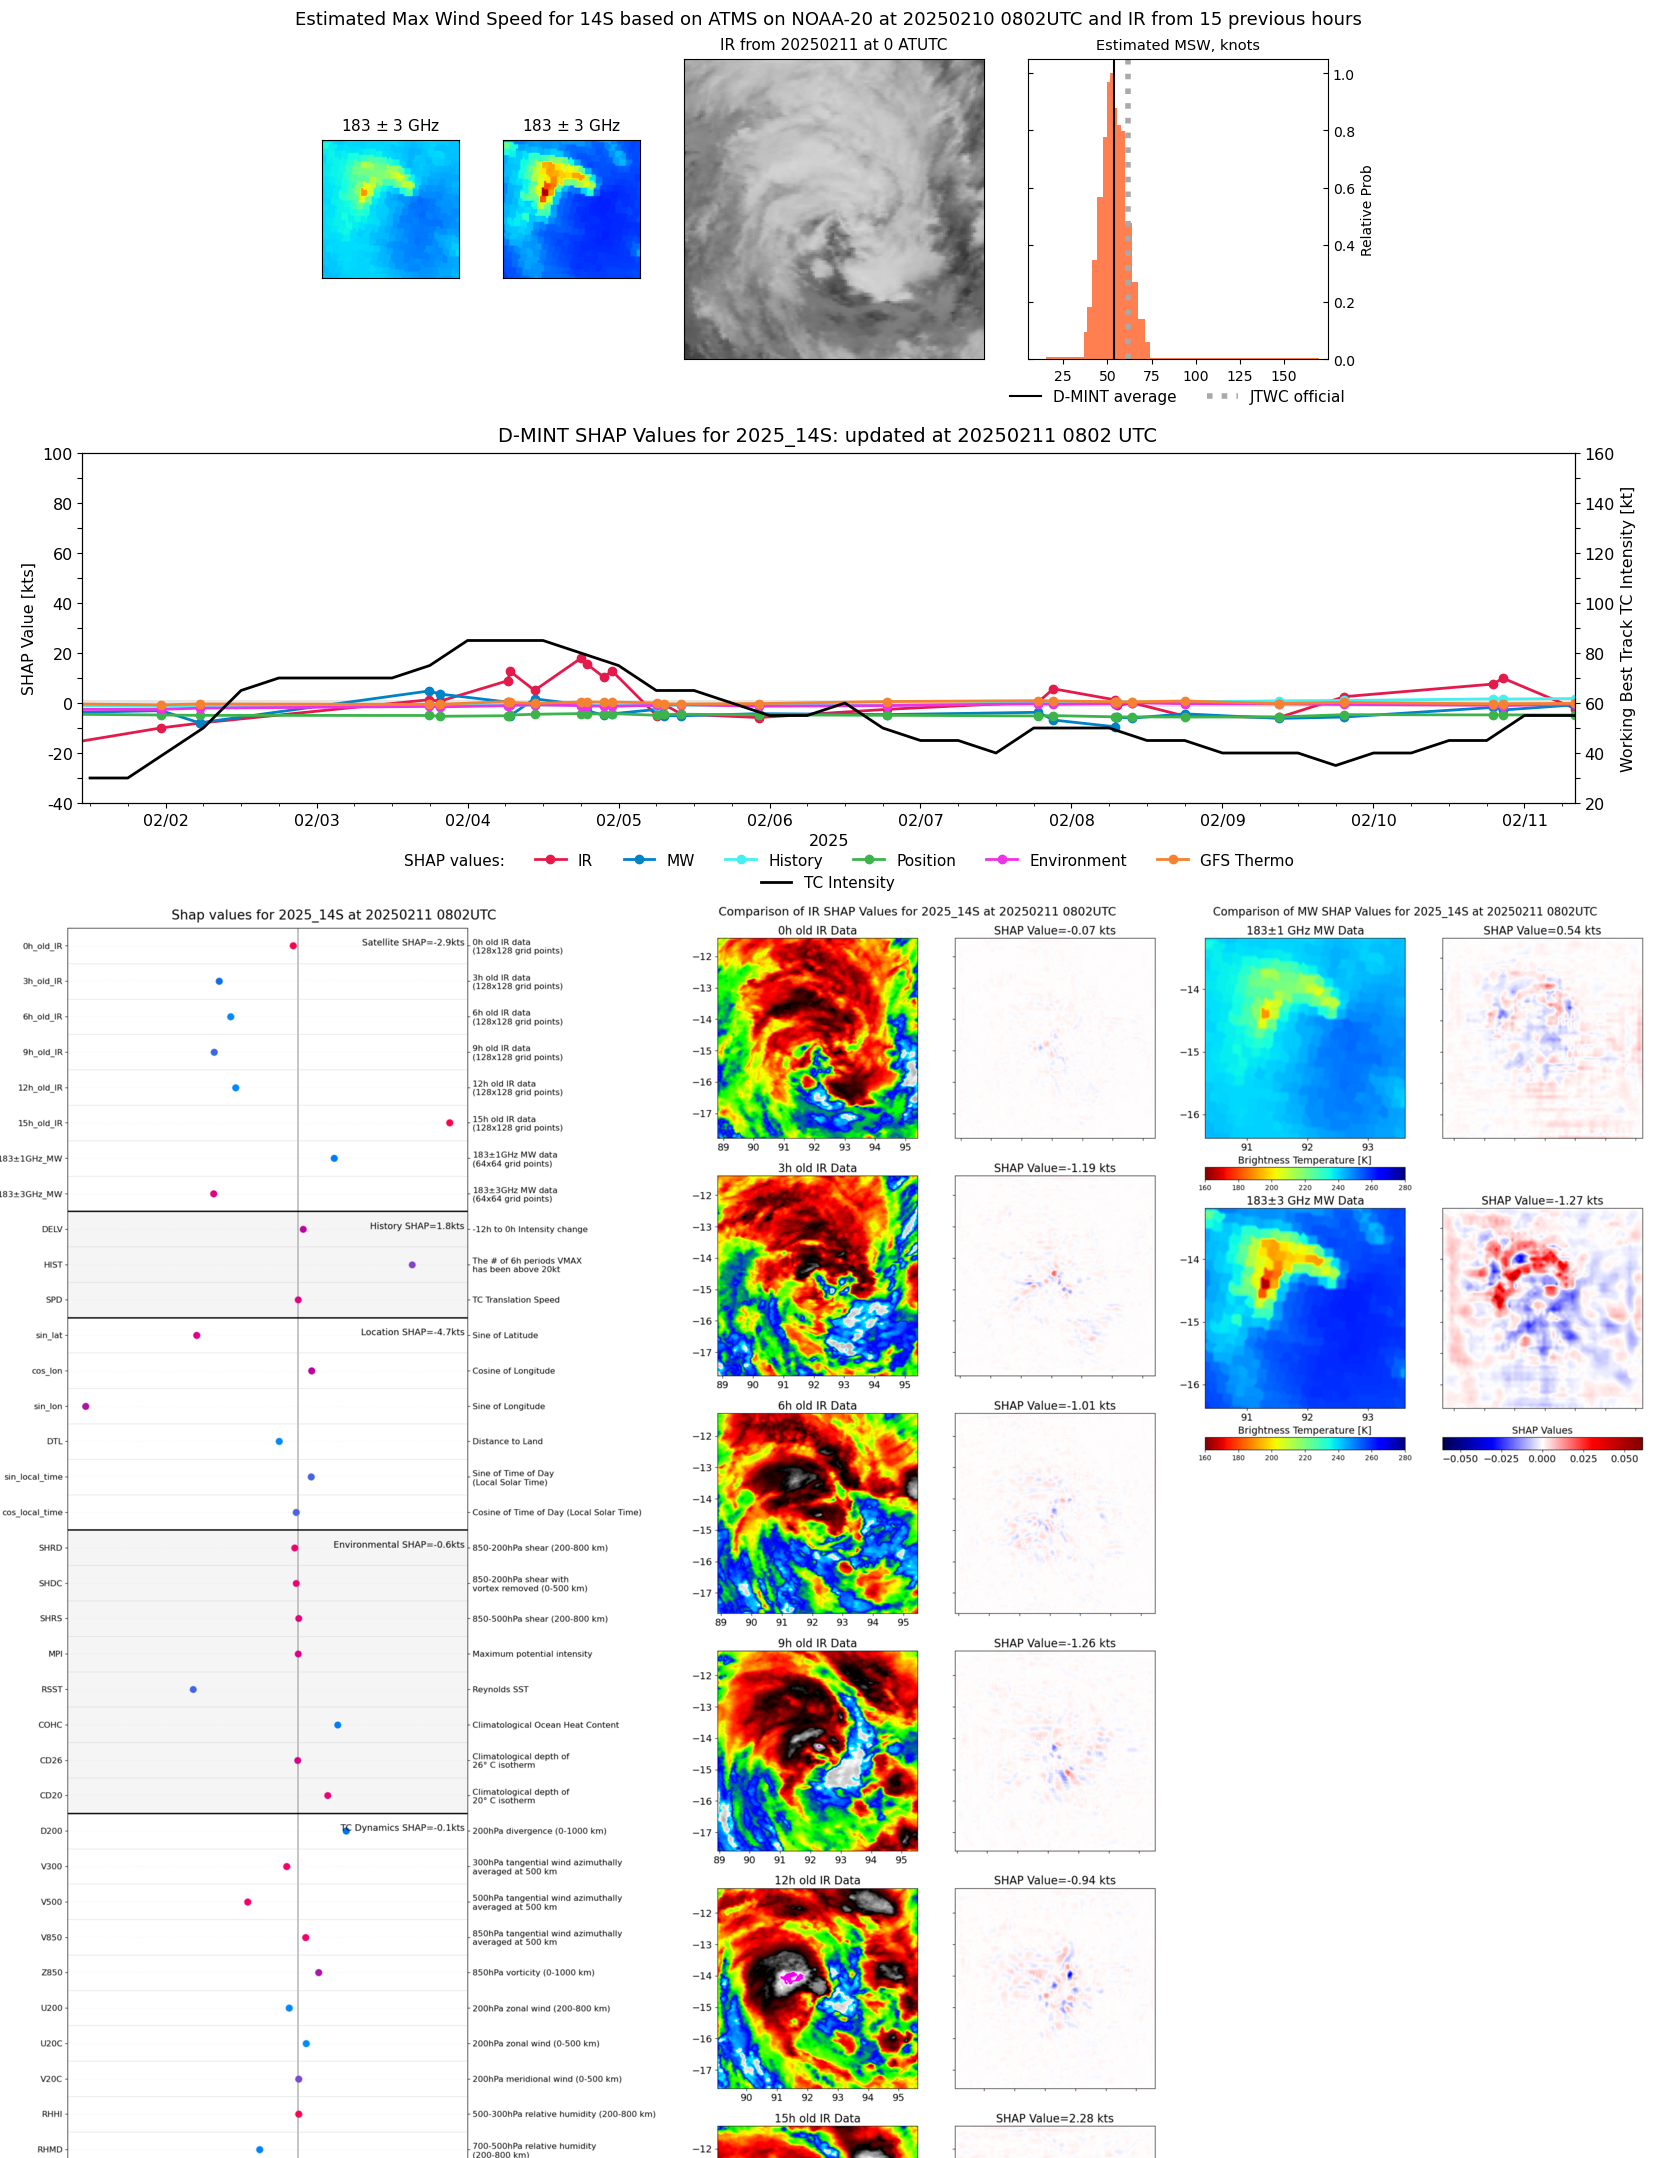 |
| 20250211 | 0736 UTC | ATMS-N20 | 991 hPa | 52 kts | 47 kts | 57 kts |  |
| 20250211 | 0719 UTC | AMSR2 | 986 hPa | 56 kts | 51 kts | 61 kts | 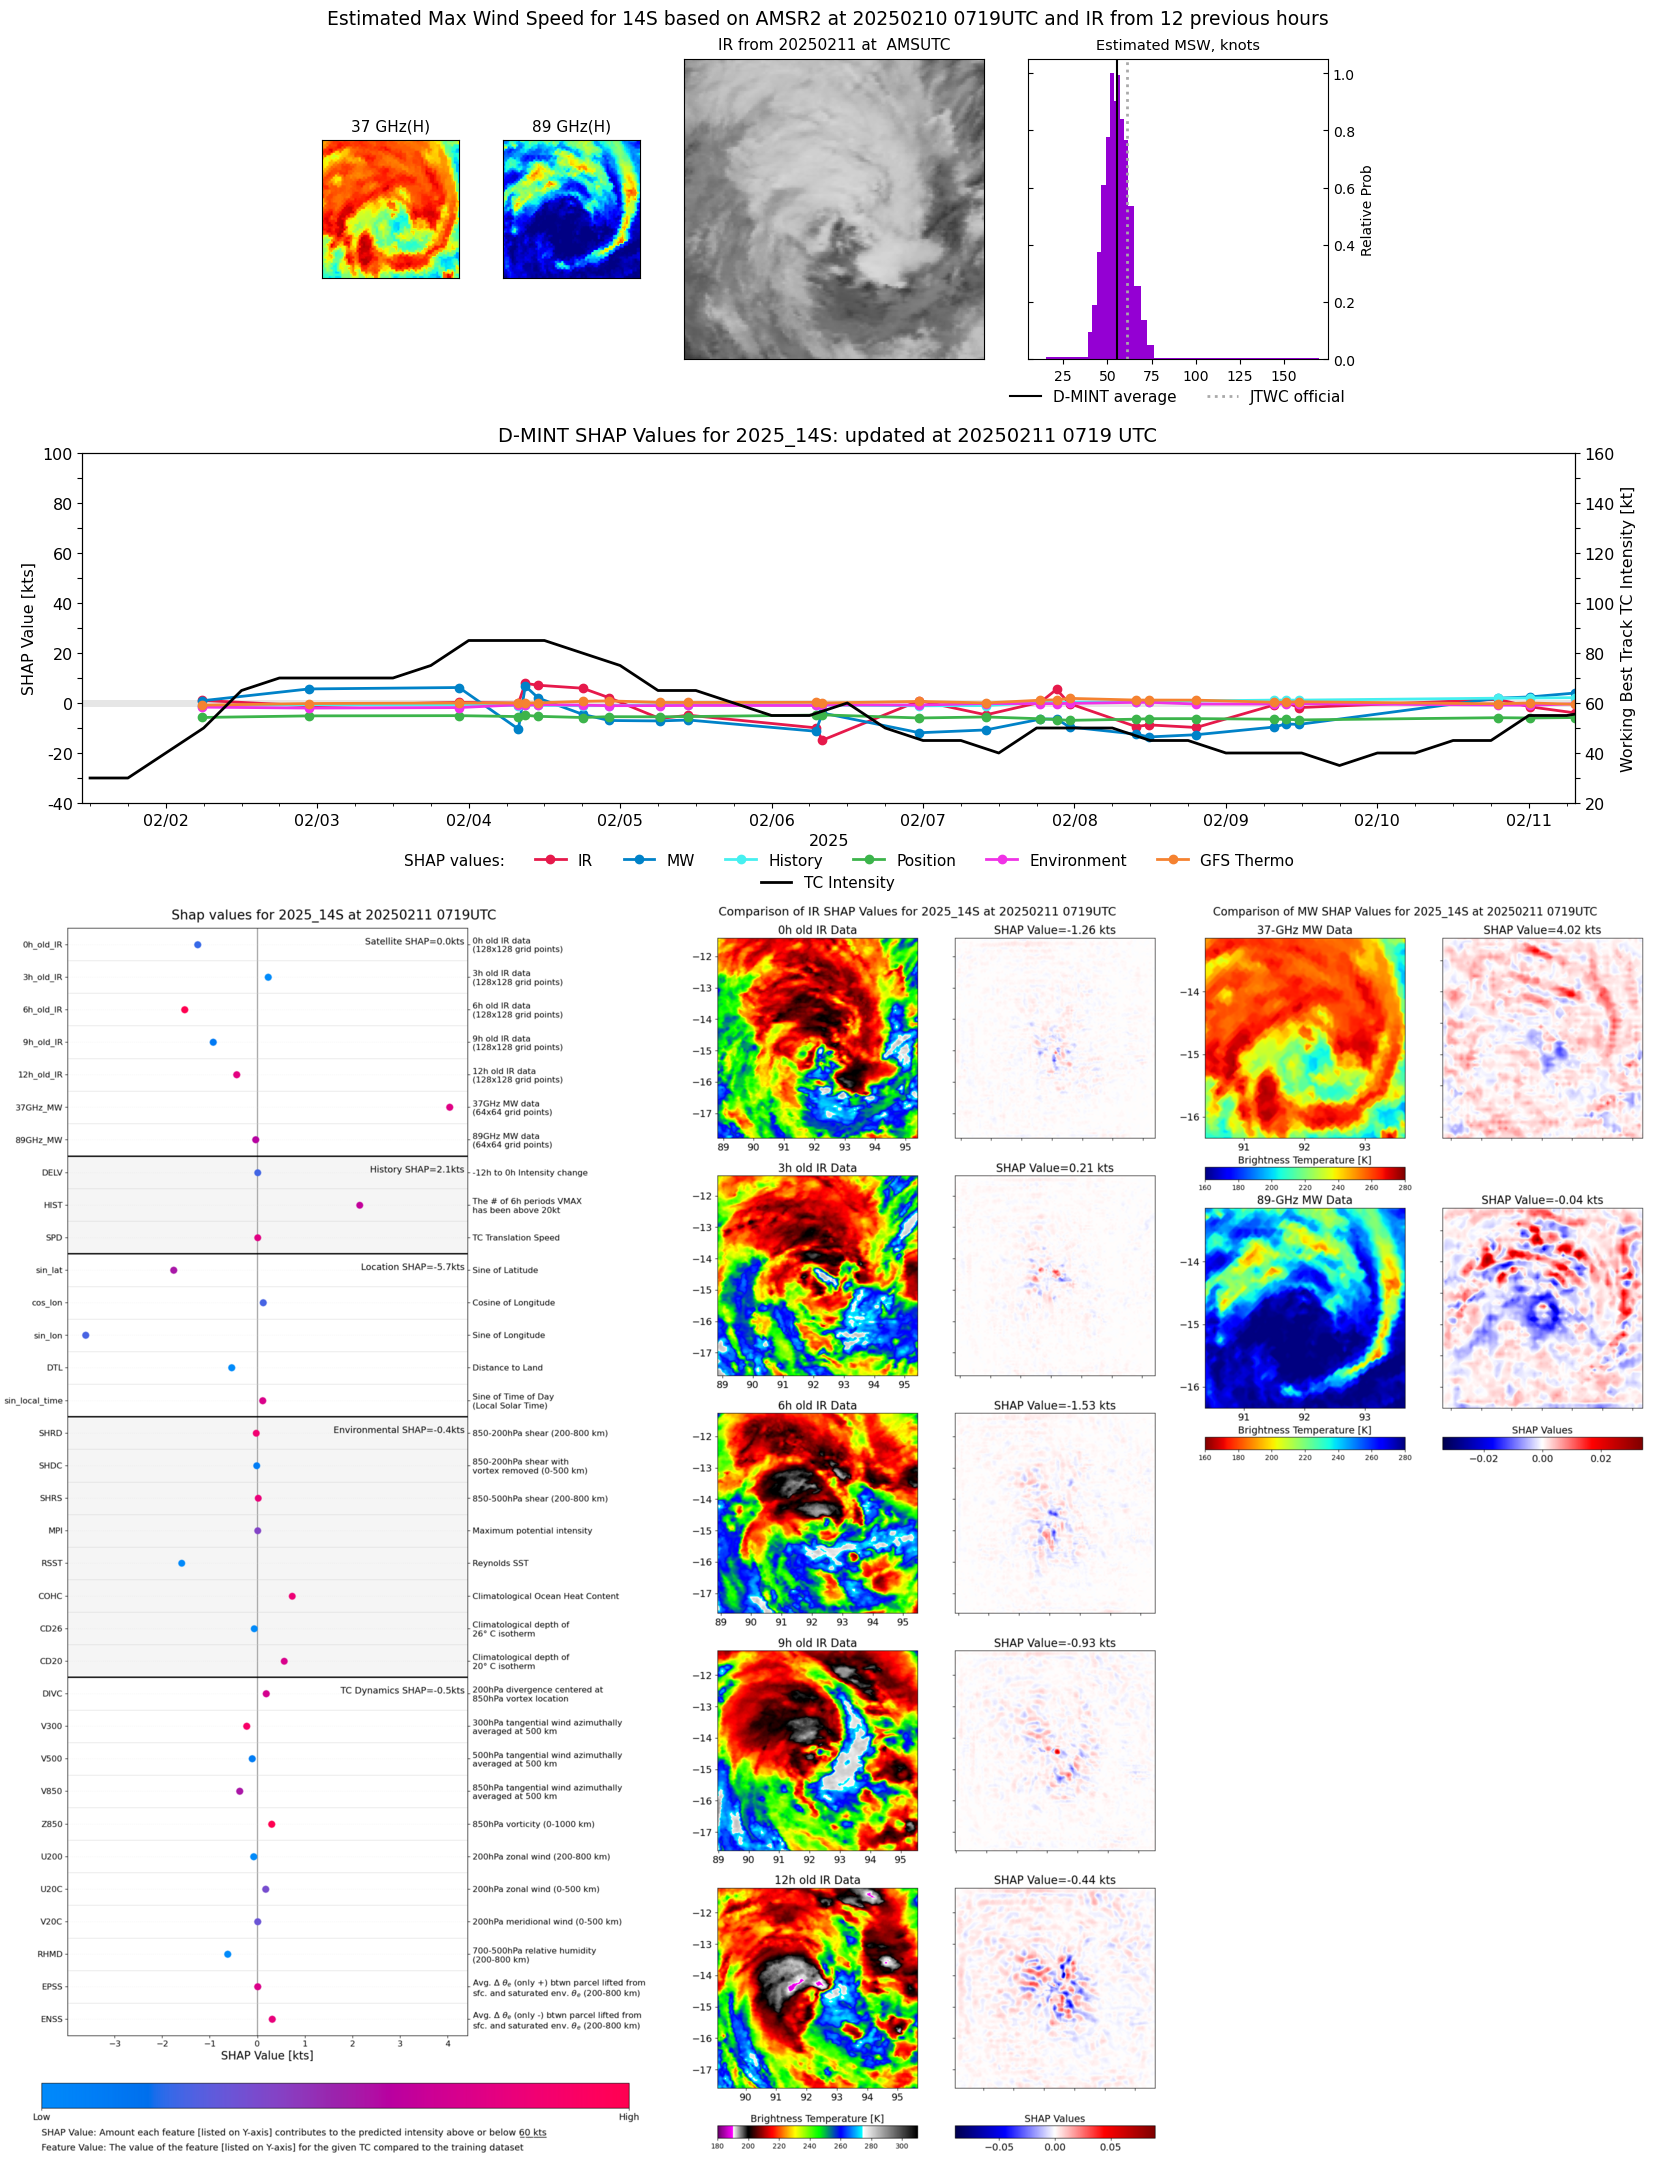 |
| 20250211 | 0012 UTC | SSMISF17 | 978 hPa | 56 kts | 51 kts | 62 kts | 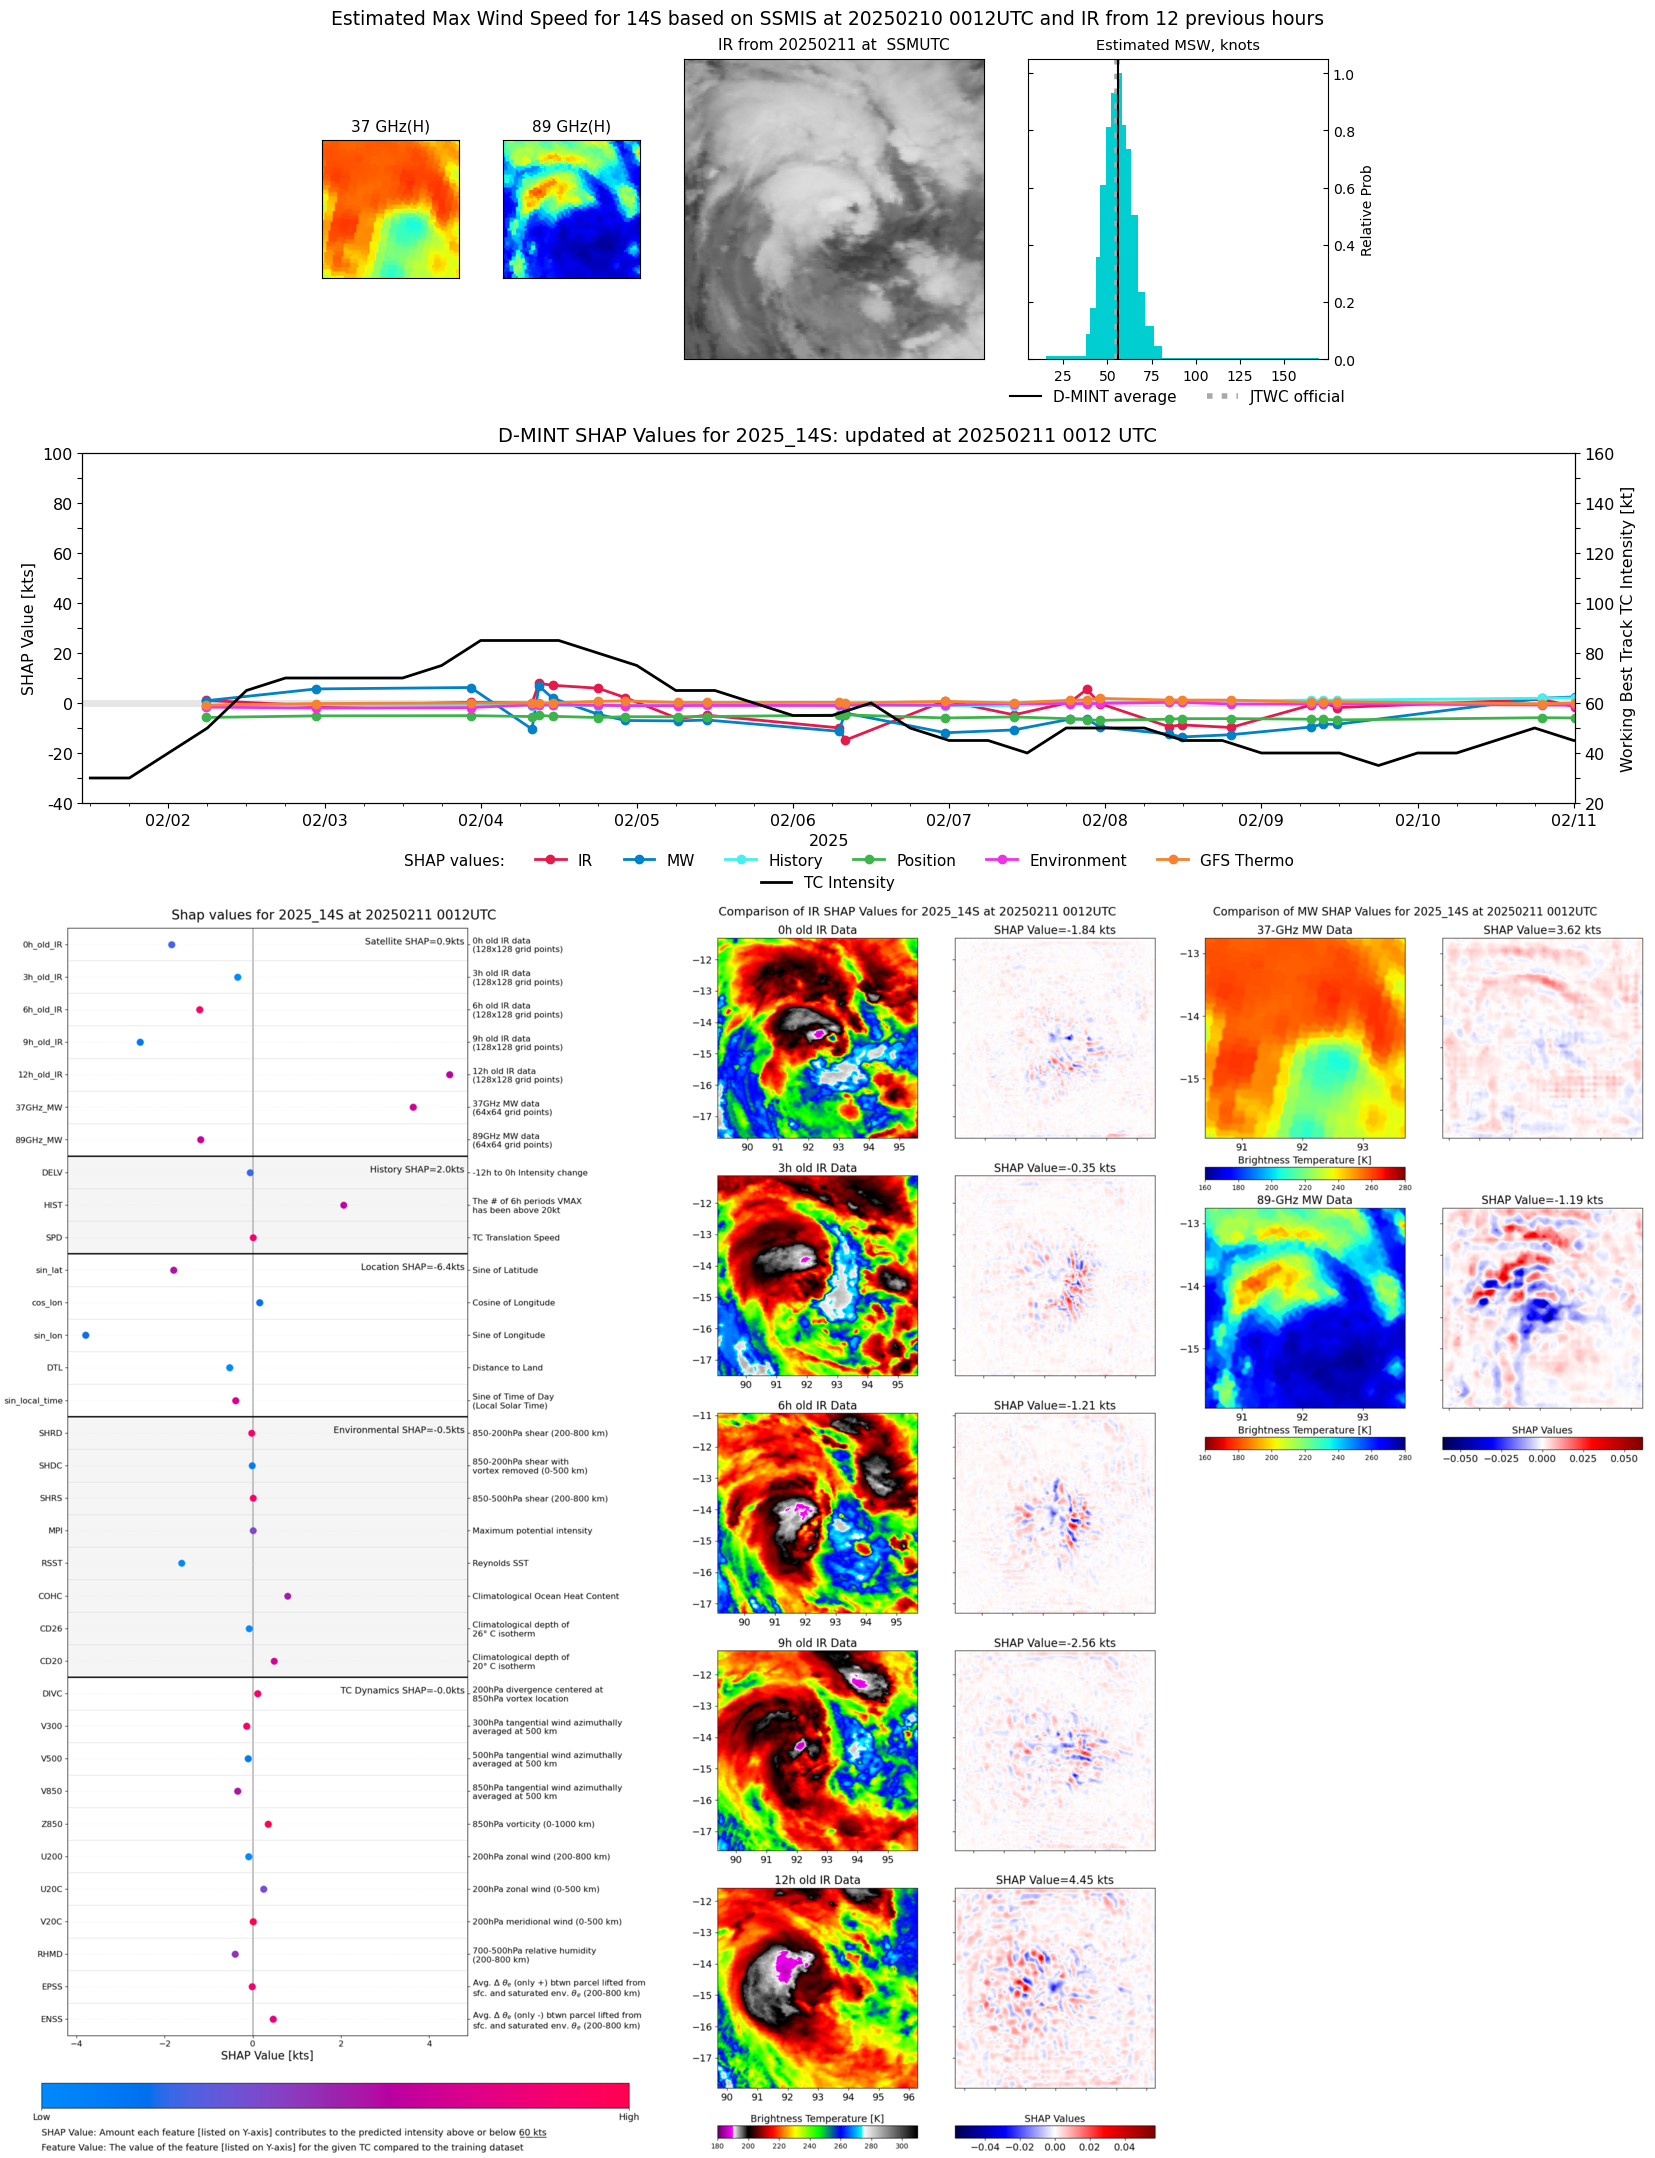 |
| 20250210 | 2034 UTC | TROPICS05 | 984 hPa | 63 kts | 57 kts | 69 kts | 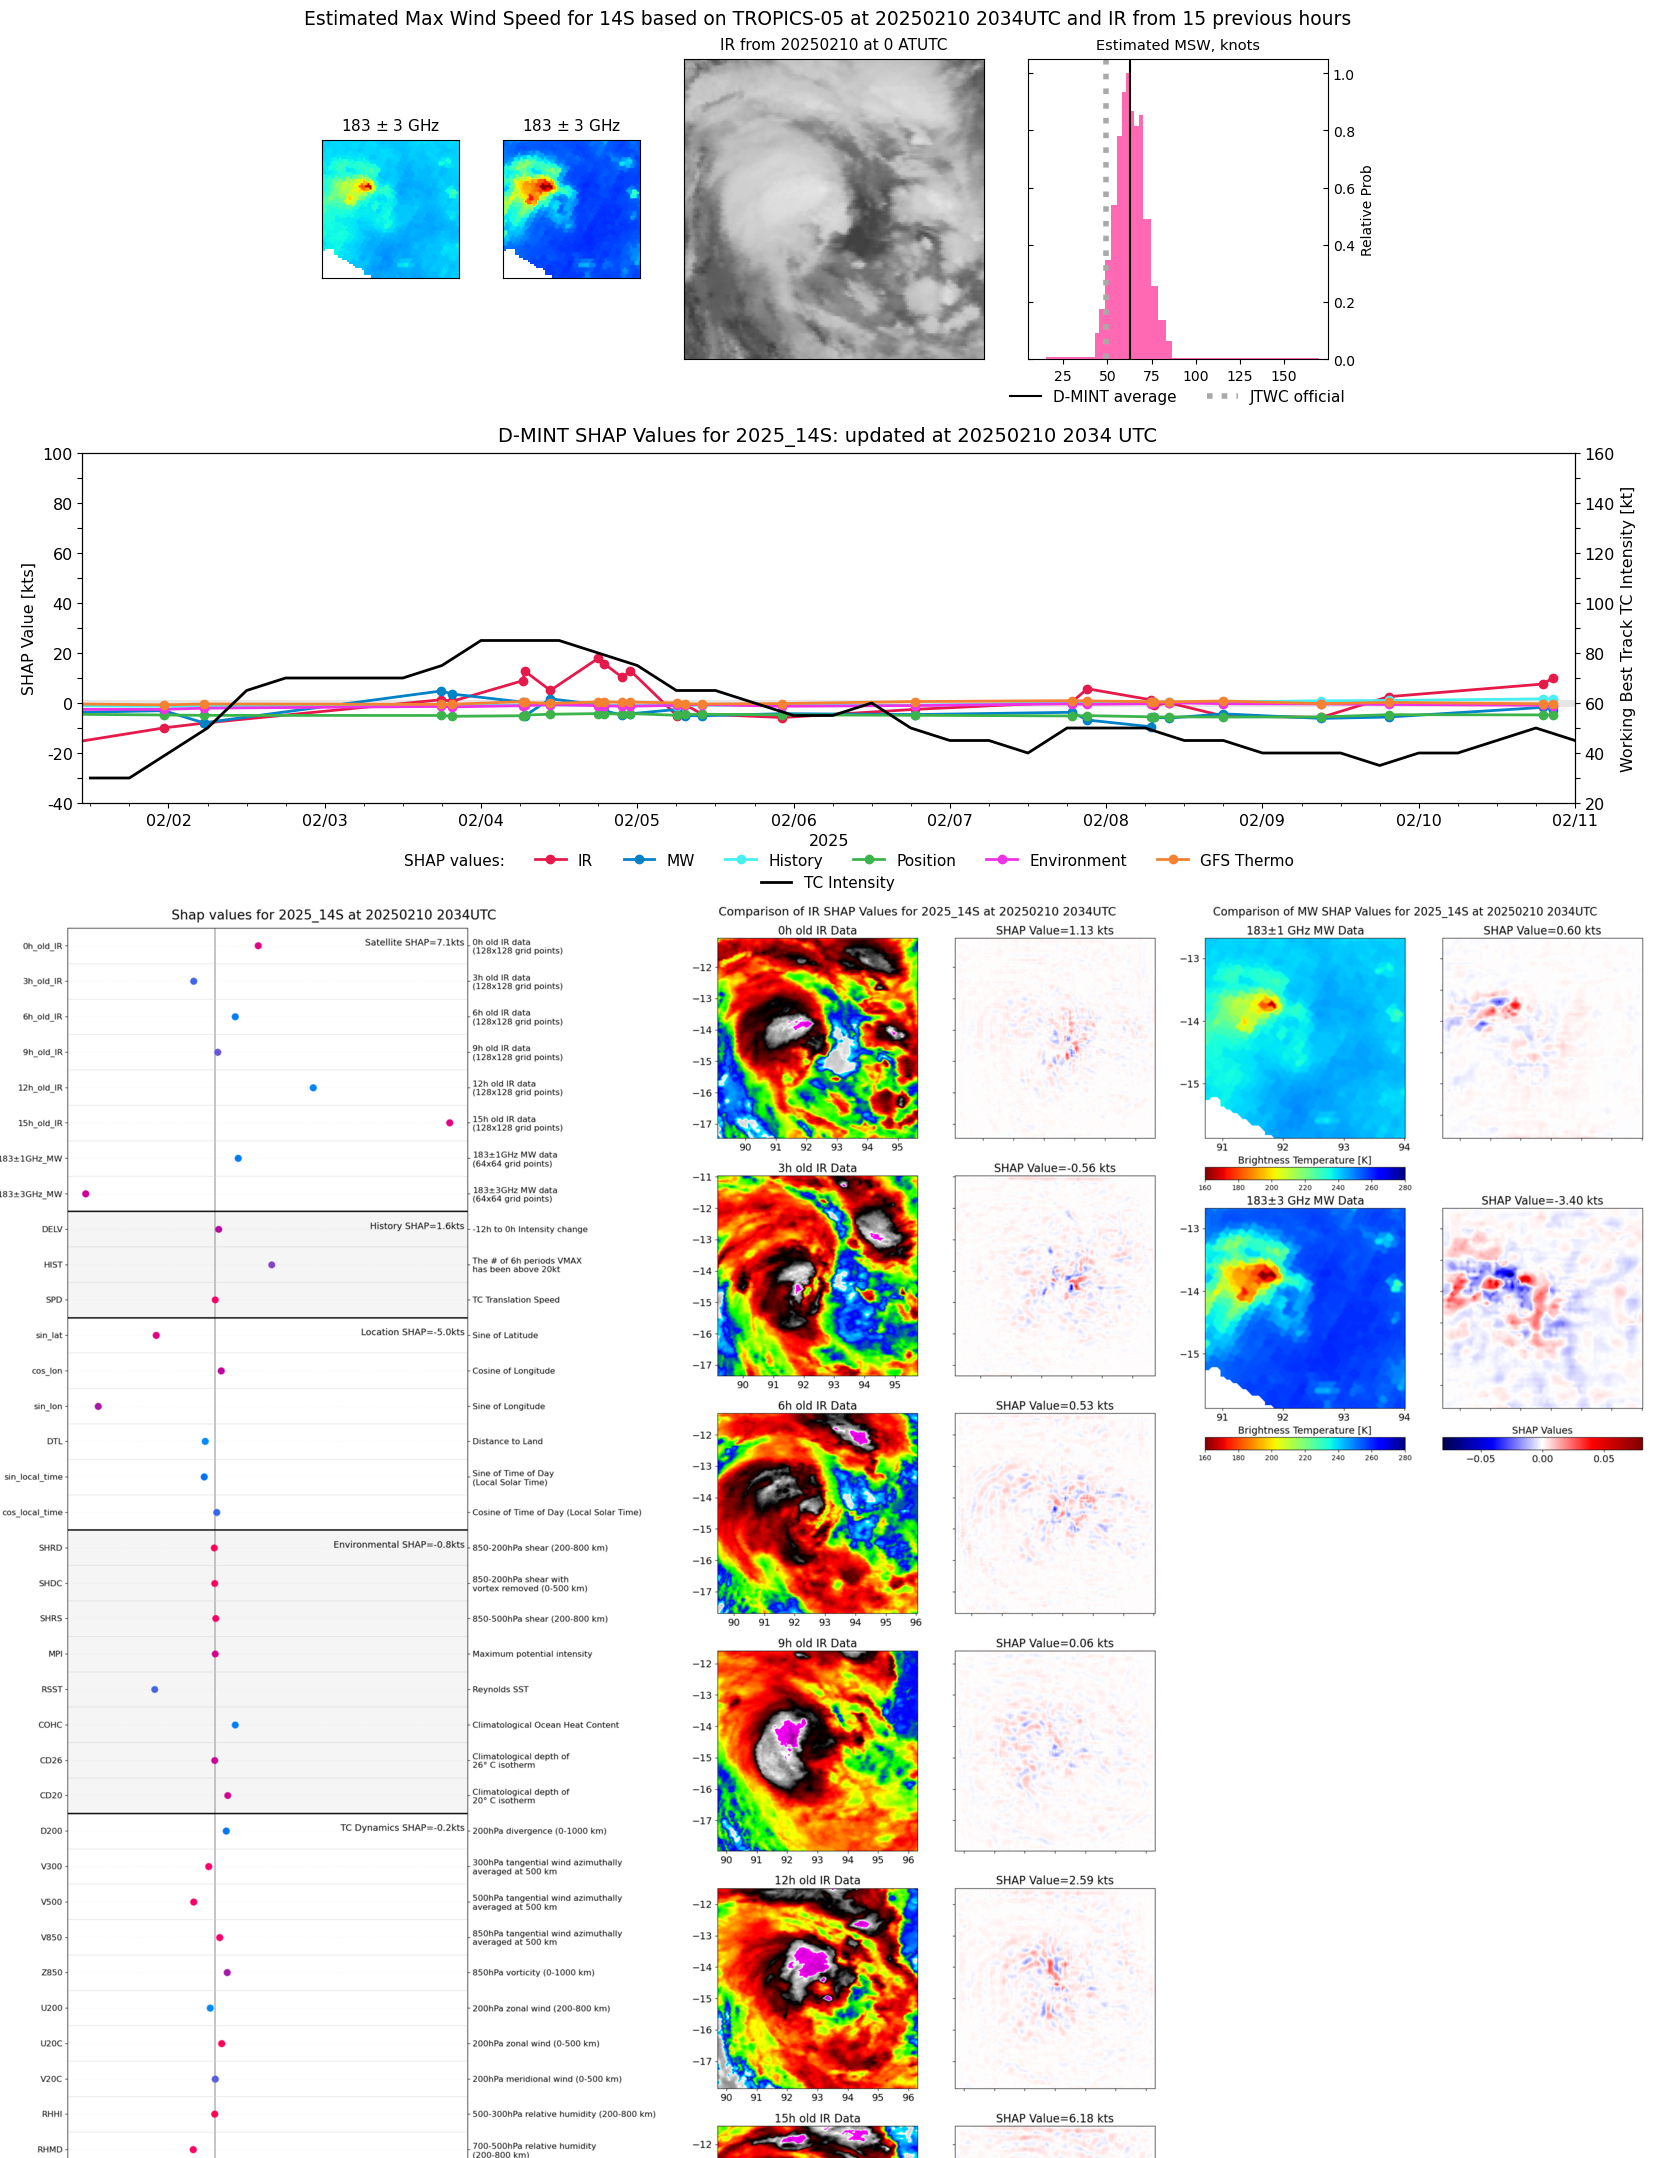 |
| 20250210 | 1905 UTC | AMSR2 | 978 hPa | 58 kts | 53 kts | 64 kts | 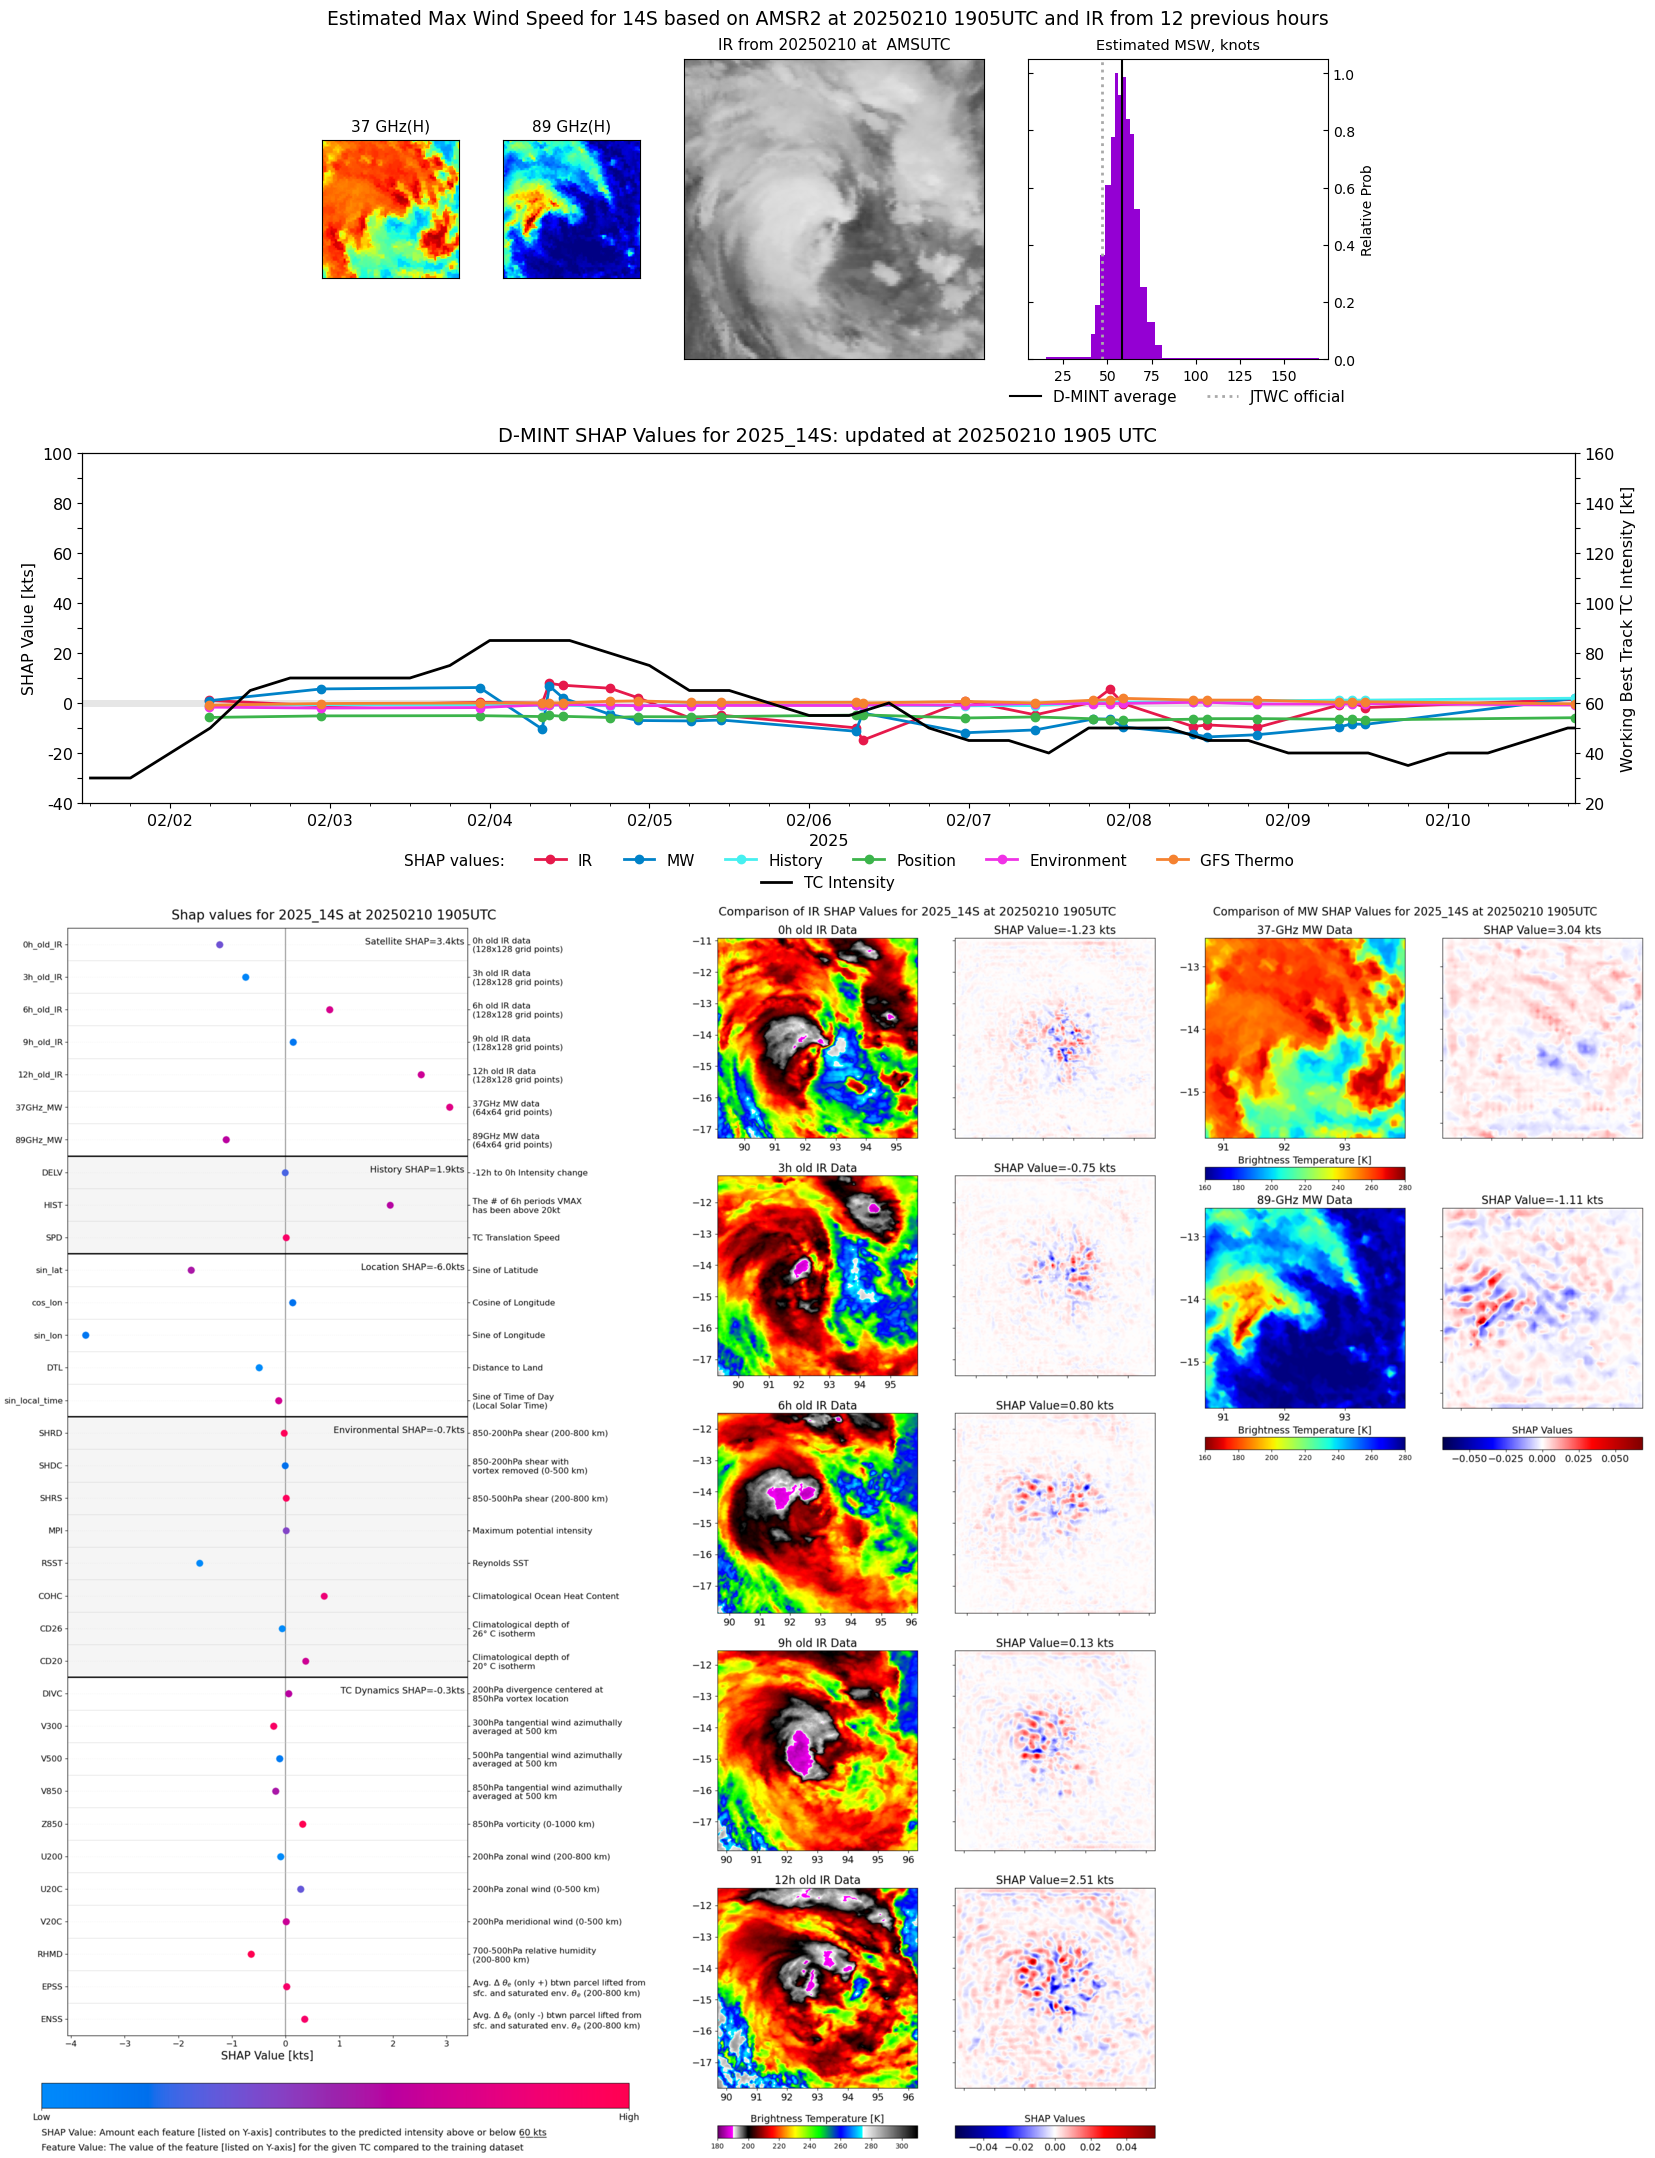 |
| 20250210 | 1903 UTC | ATMS-N20 | 981 hPa | 62 kts | 56 kts | 68 kts | 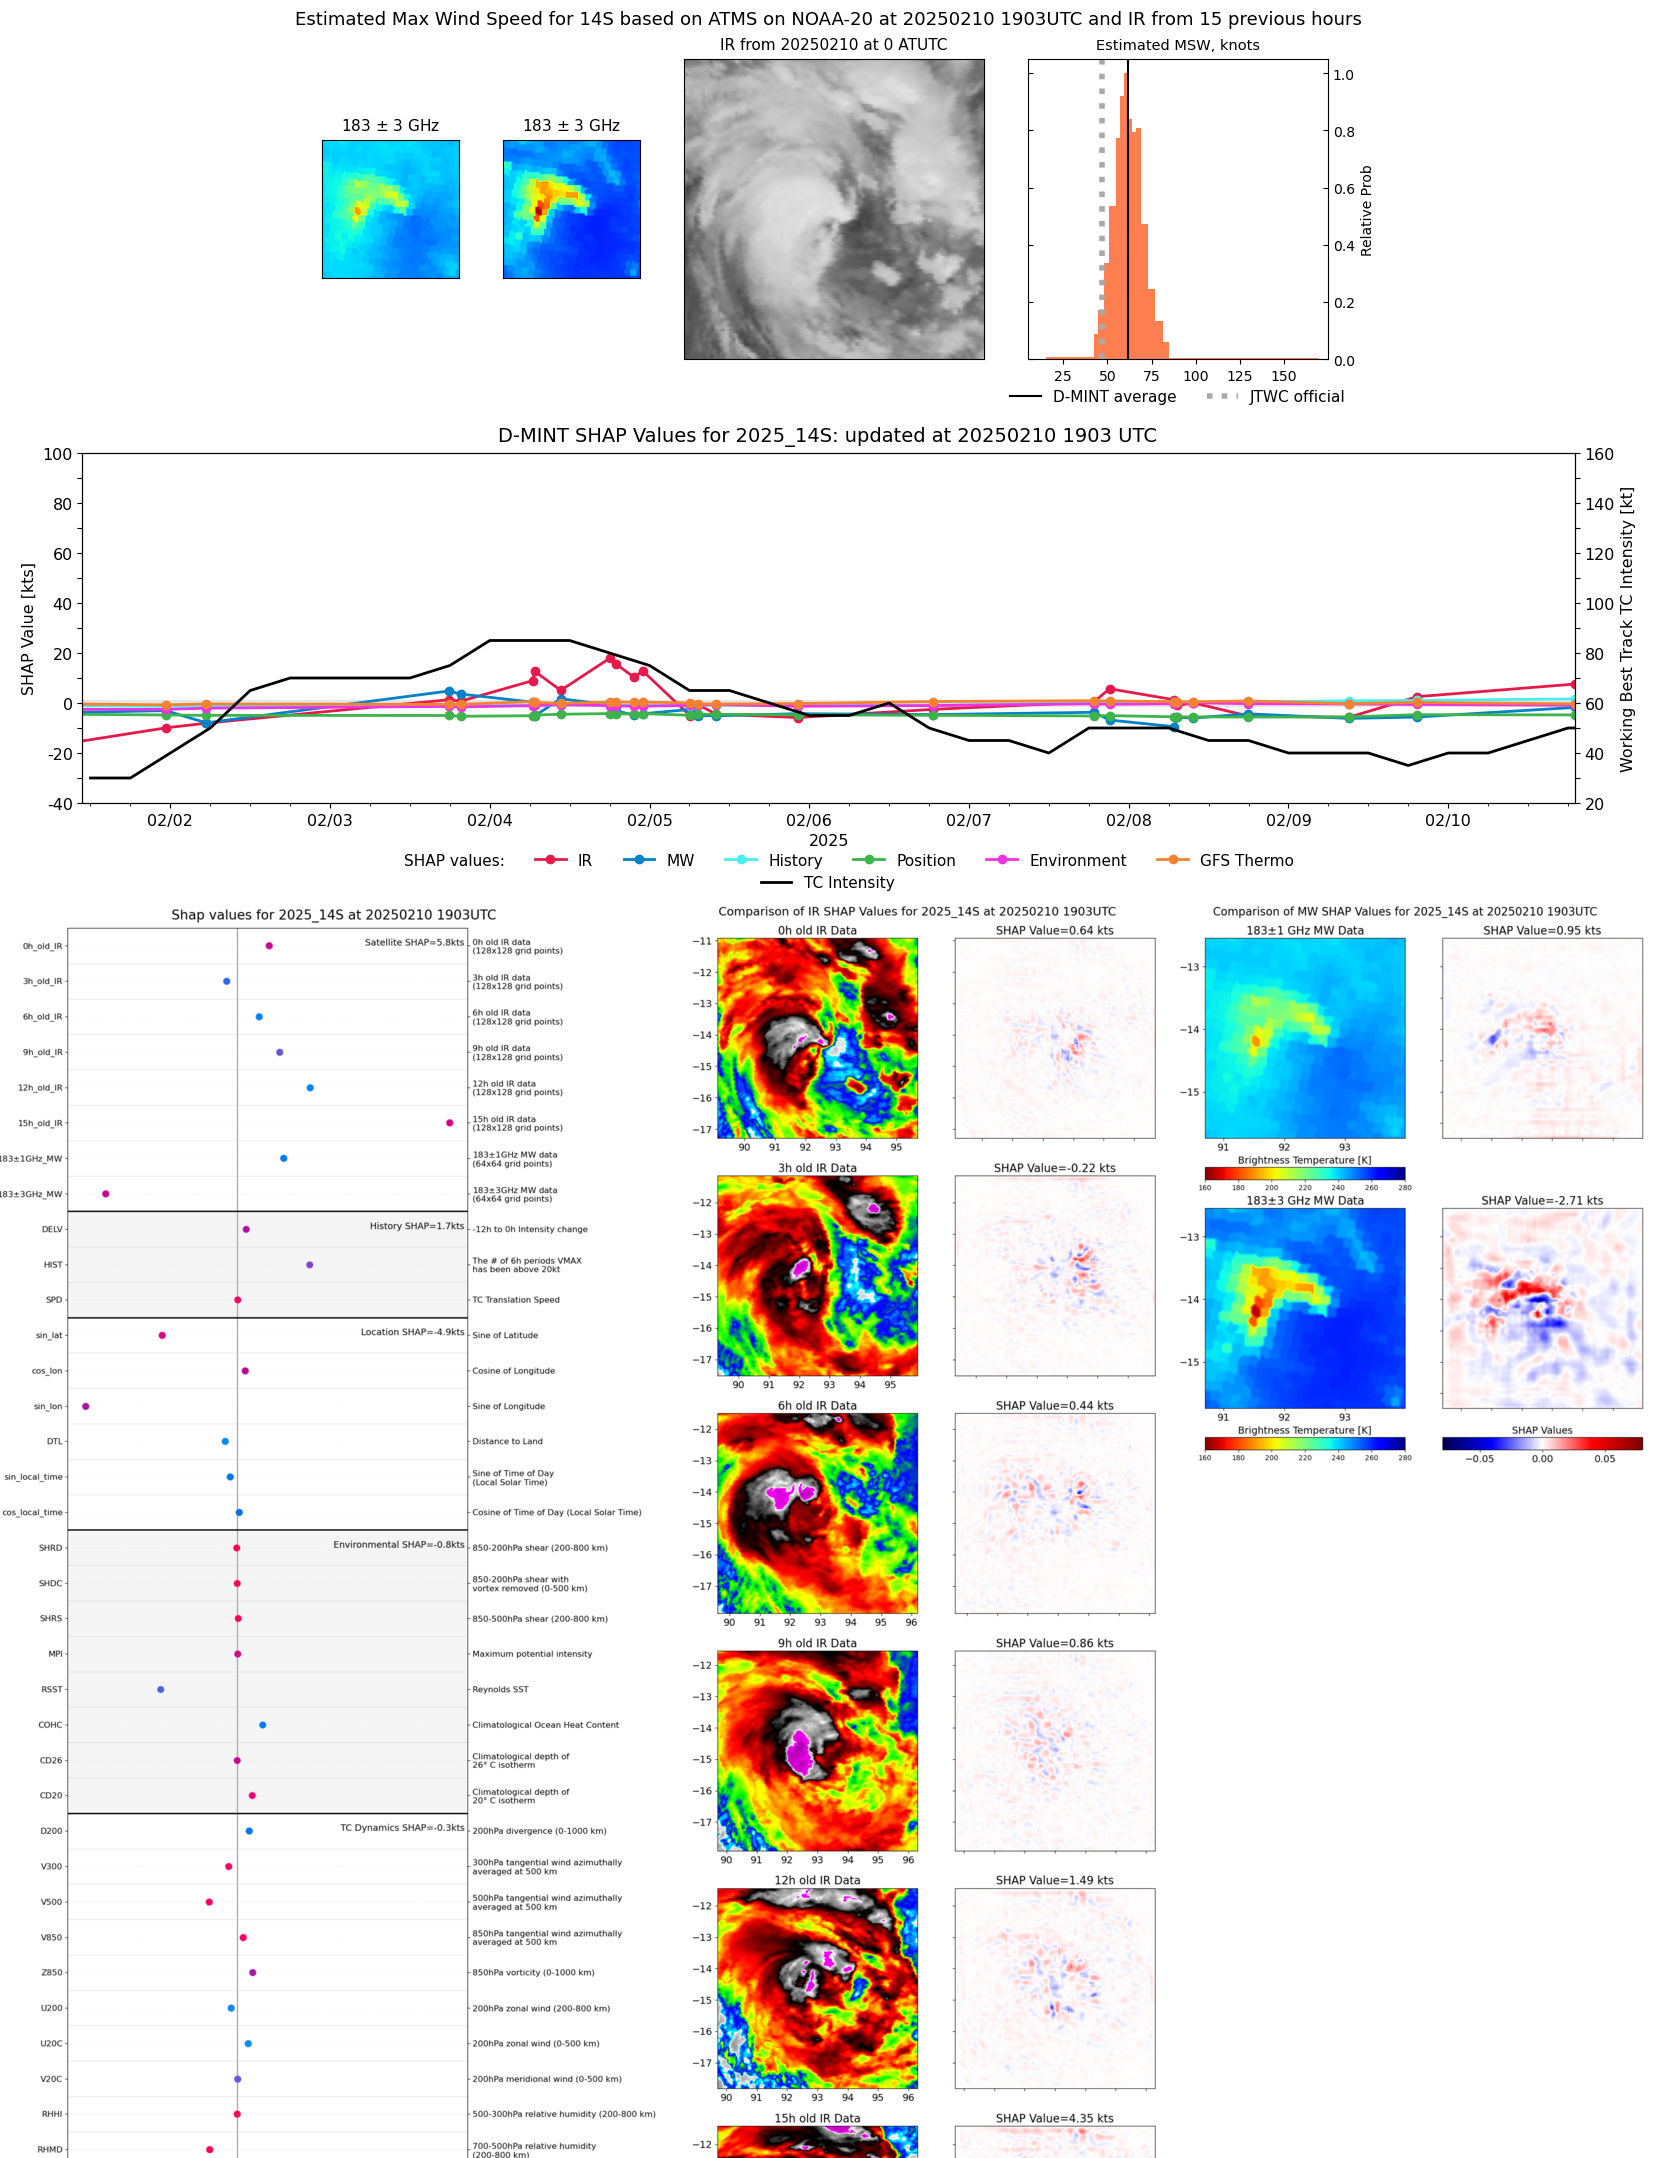 |
| 20250210 | 1823 UTC | GMI | NaN hPa | 62 kts | 57 kts | 68 kts | 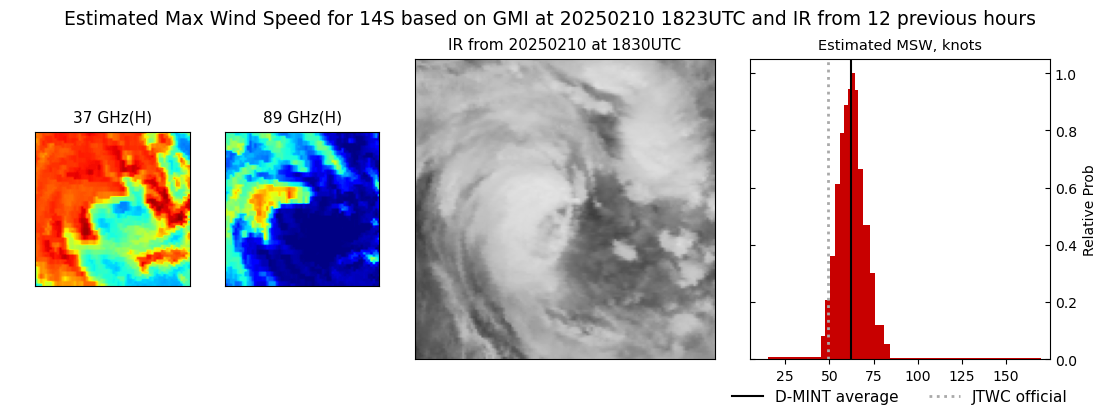 |
| 20250210 | 1159 UTC | SSMISF16 | 981 hPa | 57 kts | 51 kts | 64 kts | 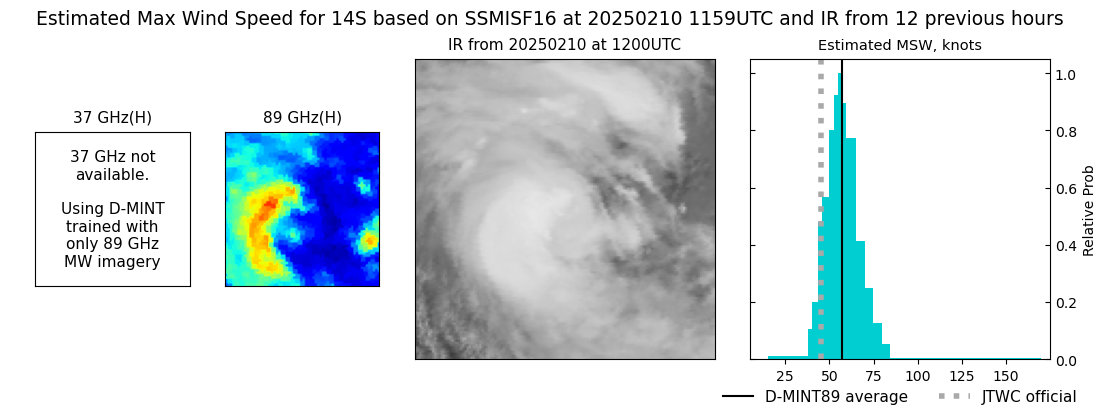 |
| 20250210 | 0823 UTC | TROPICS03 | 987 hPa | 59 kts | 53 kts | 65 kts | 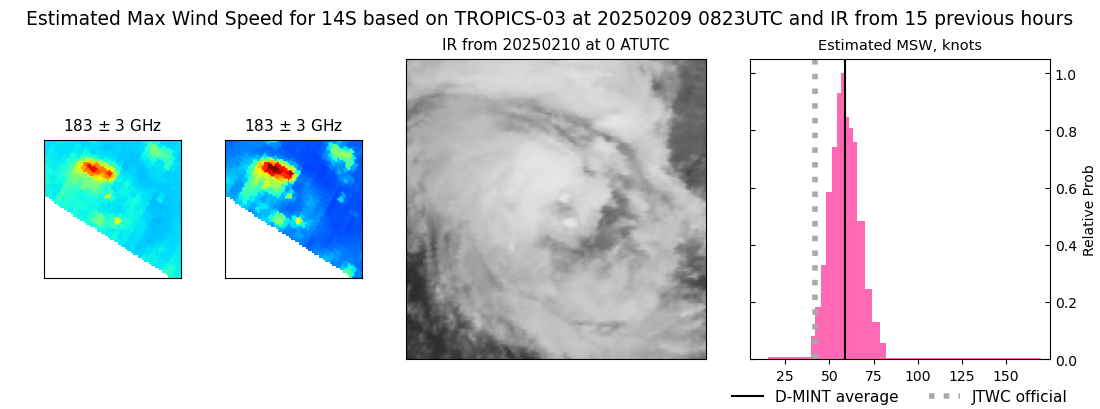 |
| 20250209 | 1922 UTC | ATMS-N20 | 984 hPa | 53 kts | 47 kts | 59 kts | 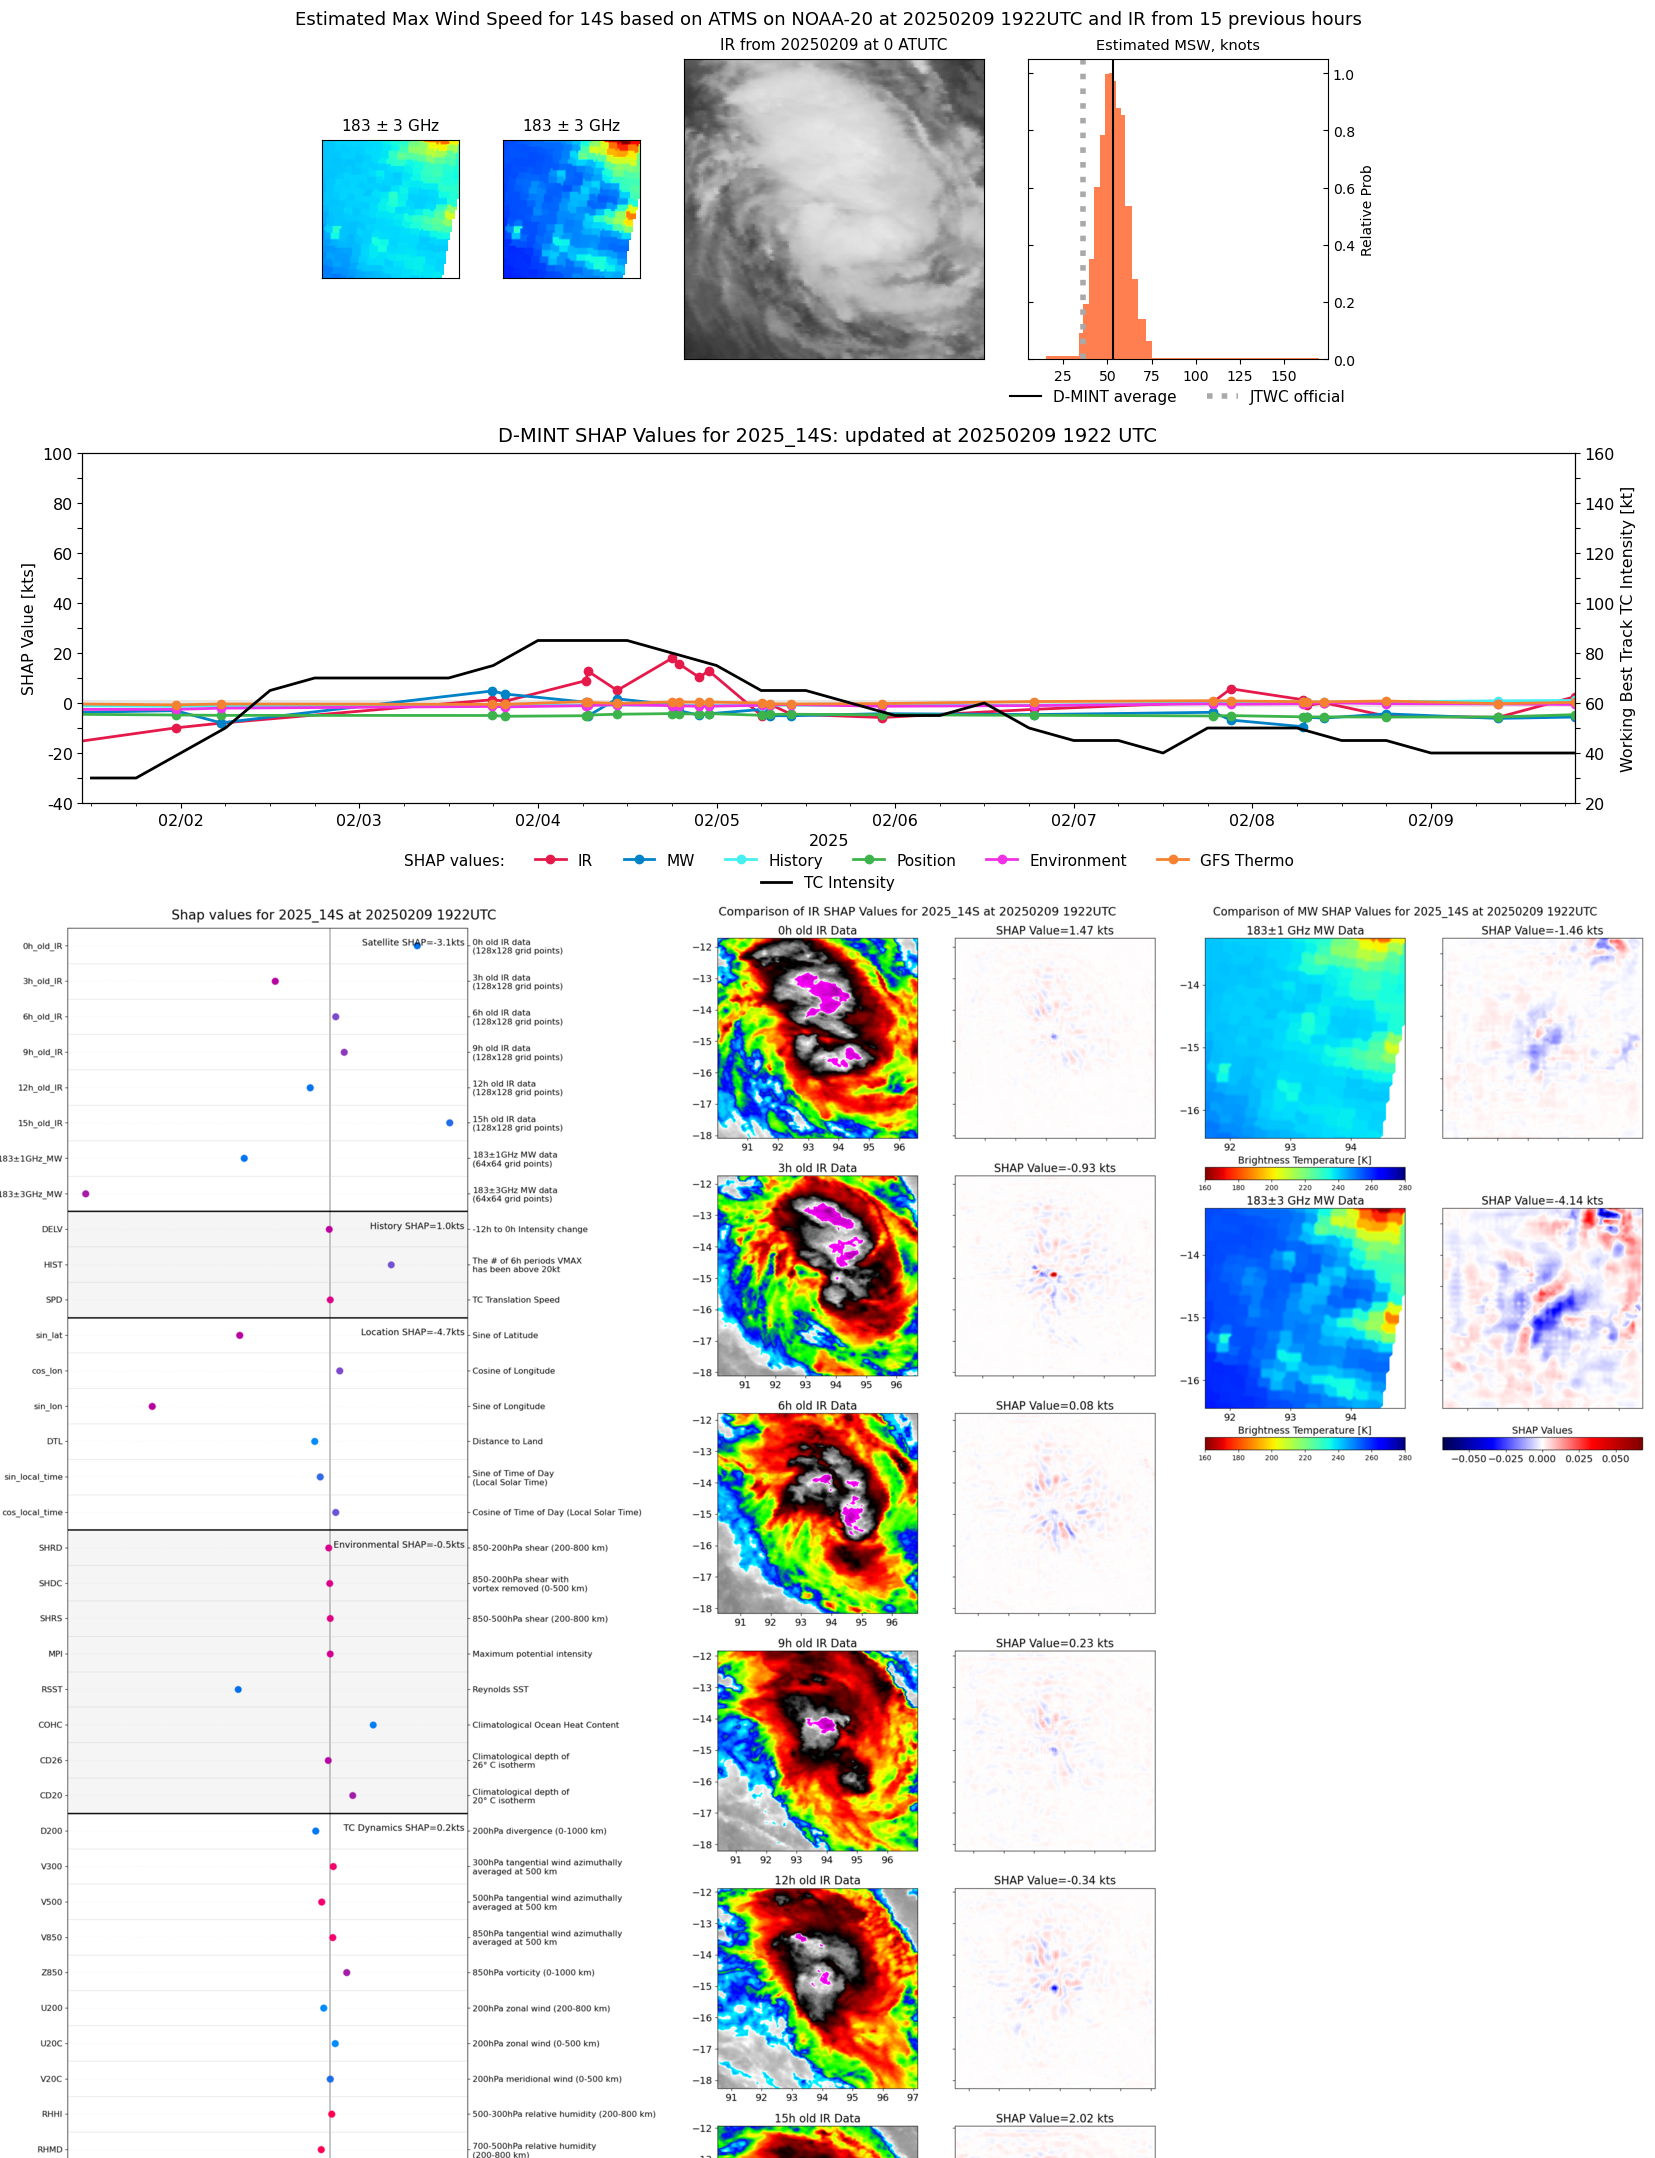 |
| 20250209 | 1213 UTC | SSMISF16 | NaN hPa | 41 kts | 35 kts | 47 kts | 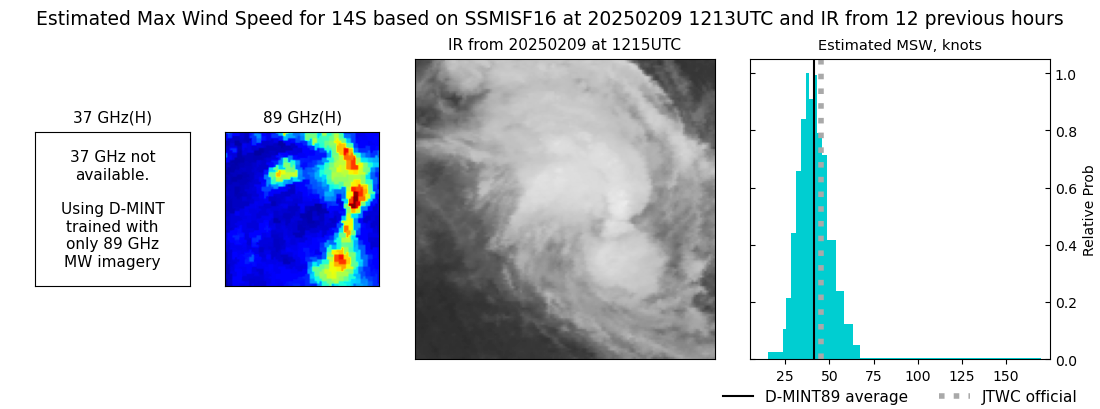 |
| 20250209 | 1135 UTC | SSMISF17 | 990 hPa | 44 kts | 39 kts | 49 kts | 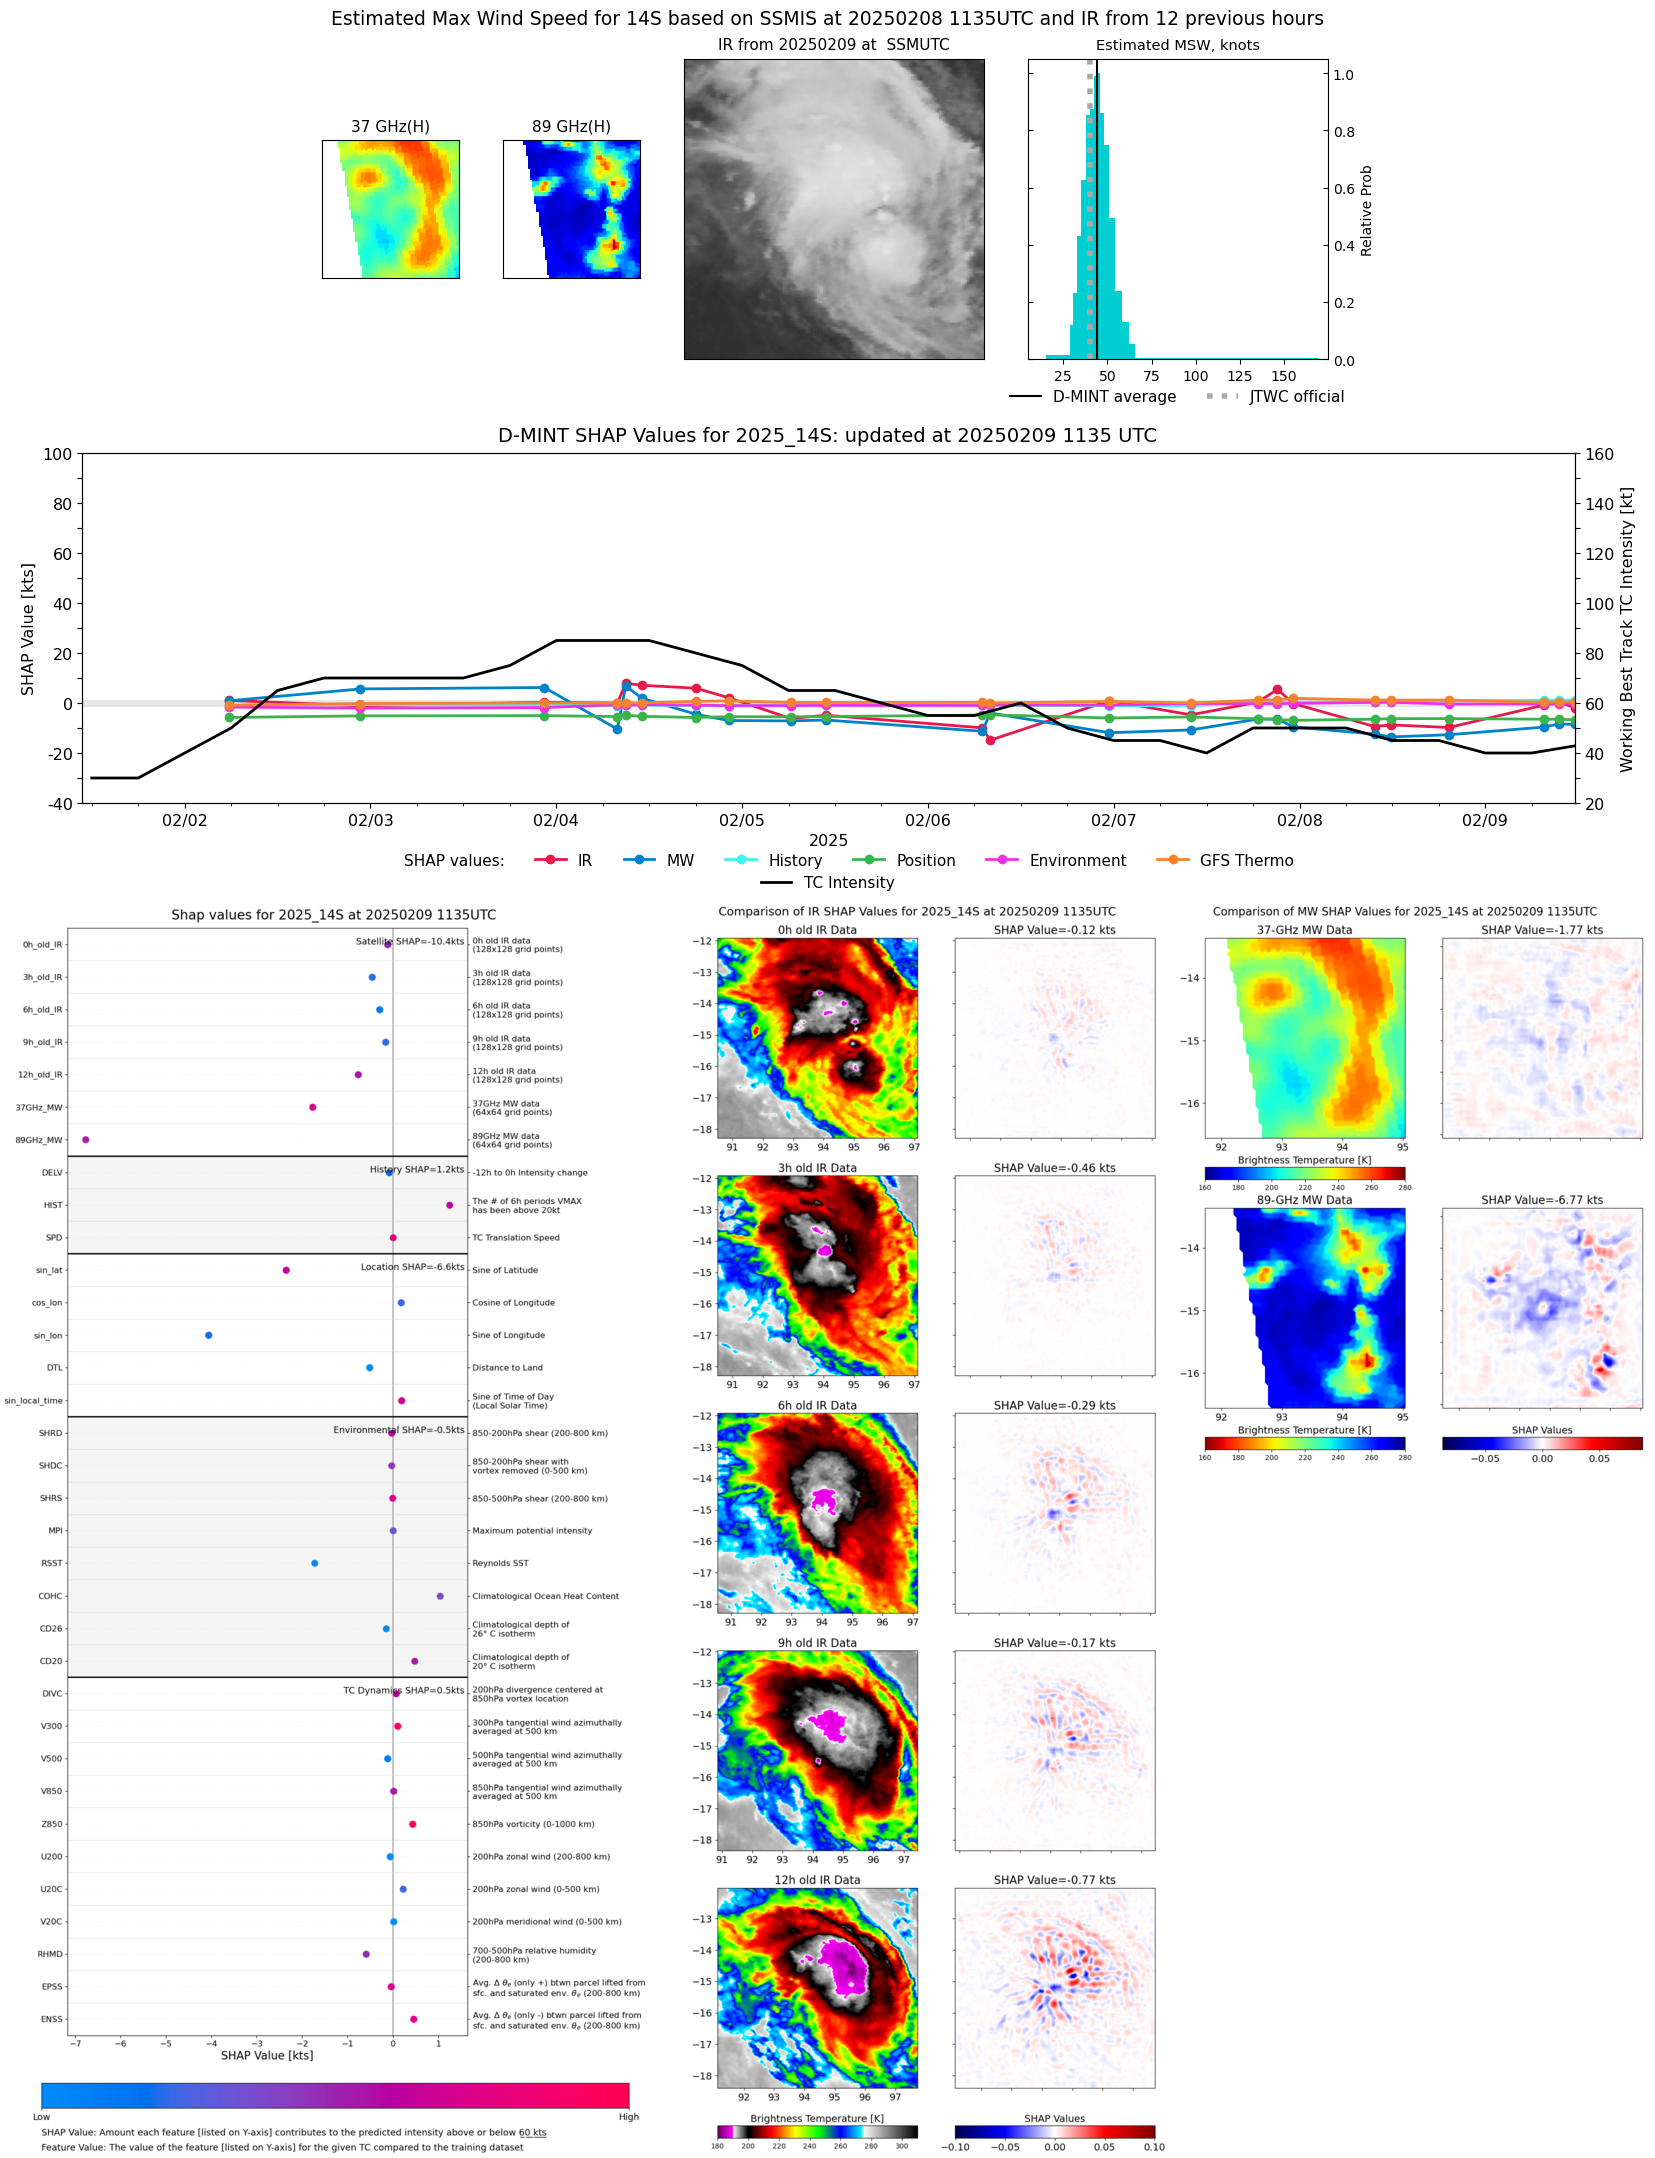 |
| 20250209 | 0931 UTC | SSMISF18 | 991 hPa | 47 kts | 41 kts | 52 kts | 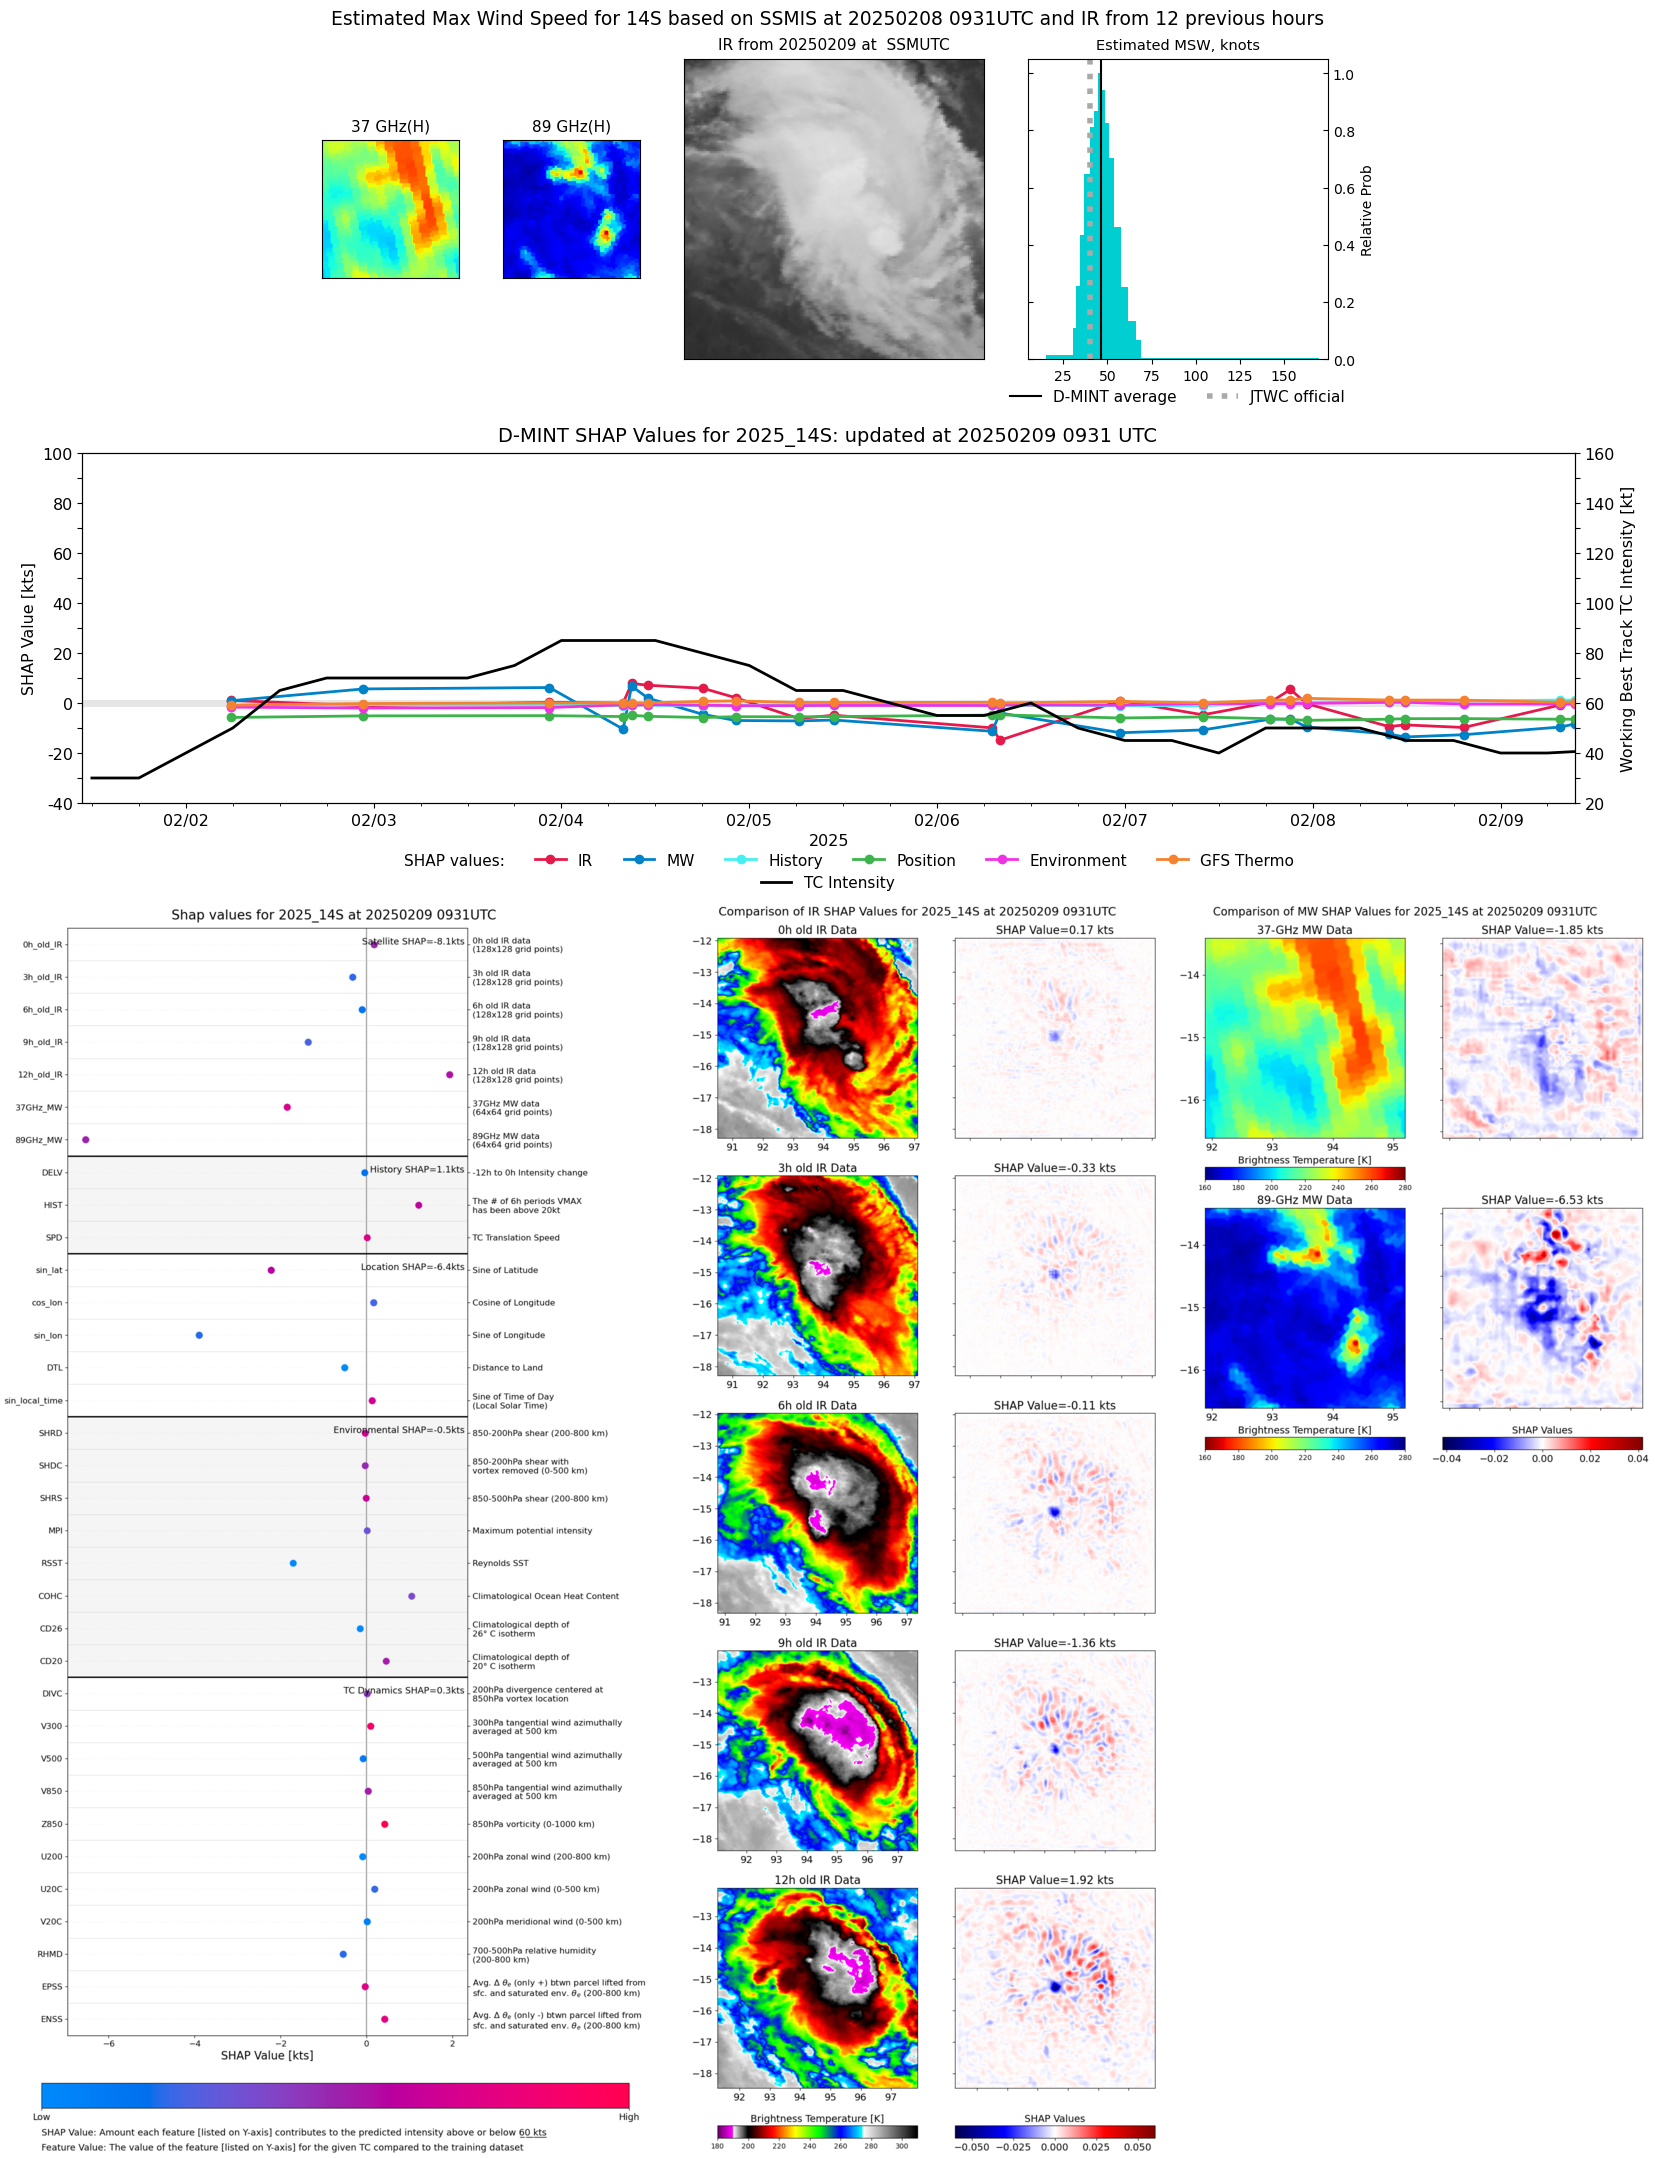 |
| 20250209 | 0902 UTC | TROPICS03 | 990 hPa | 43 kts | 38 kts | 49 kts | 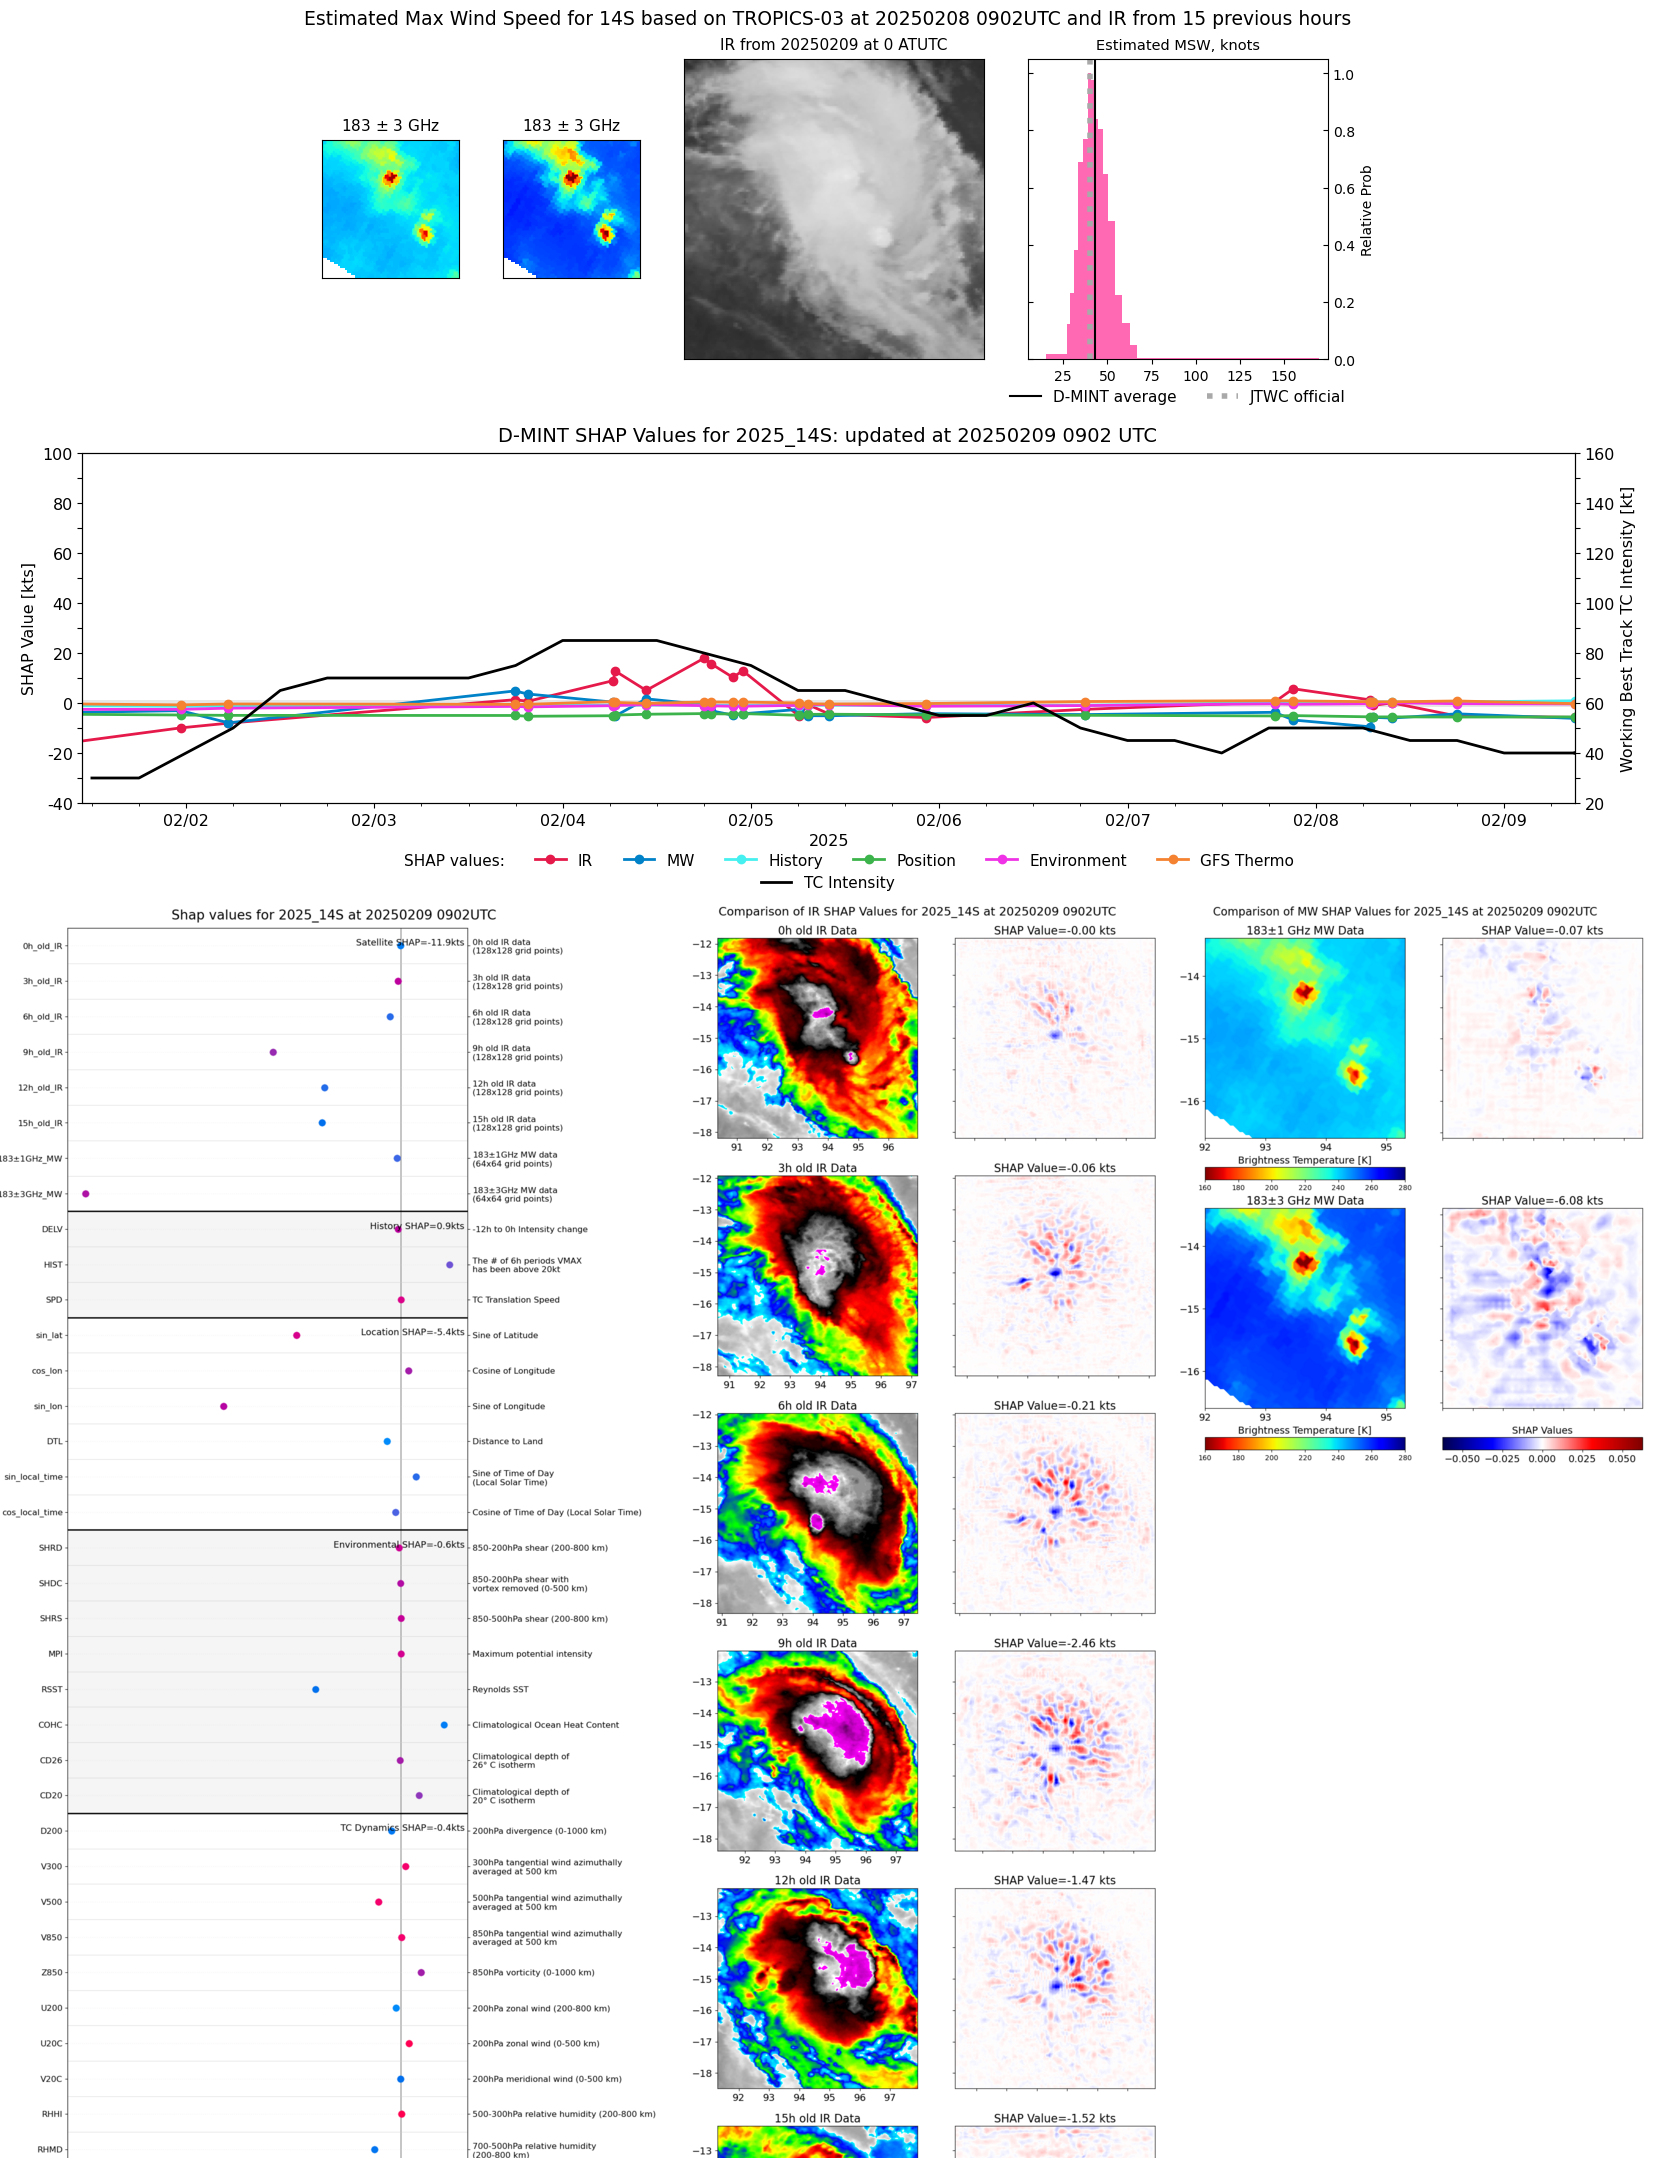 |
| 20250209 | 0733 UTC | GMI | 995 hPa | 44 kts | 39 kts | 50 kts | 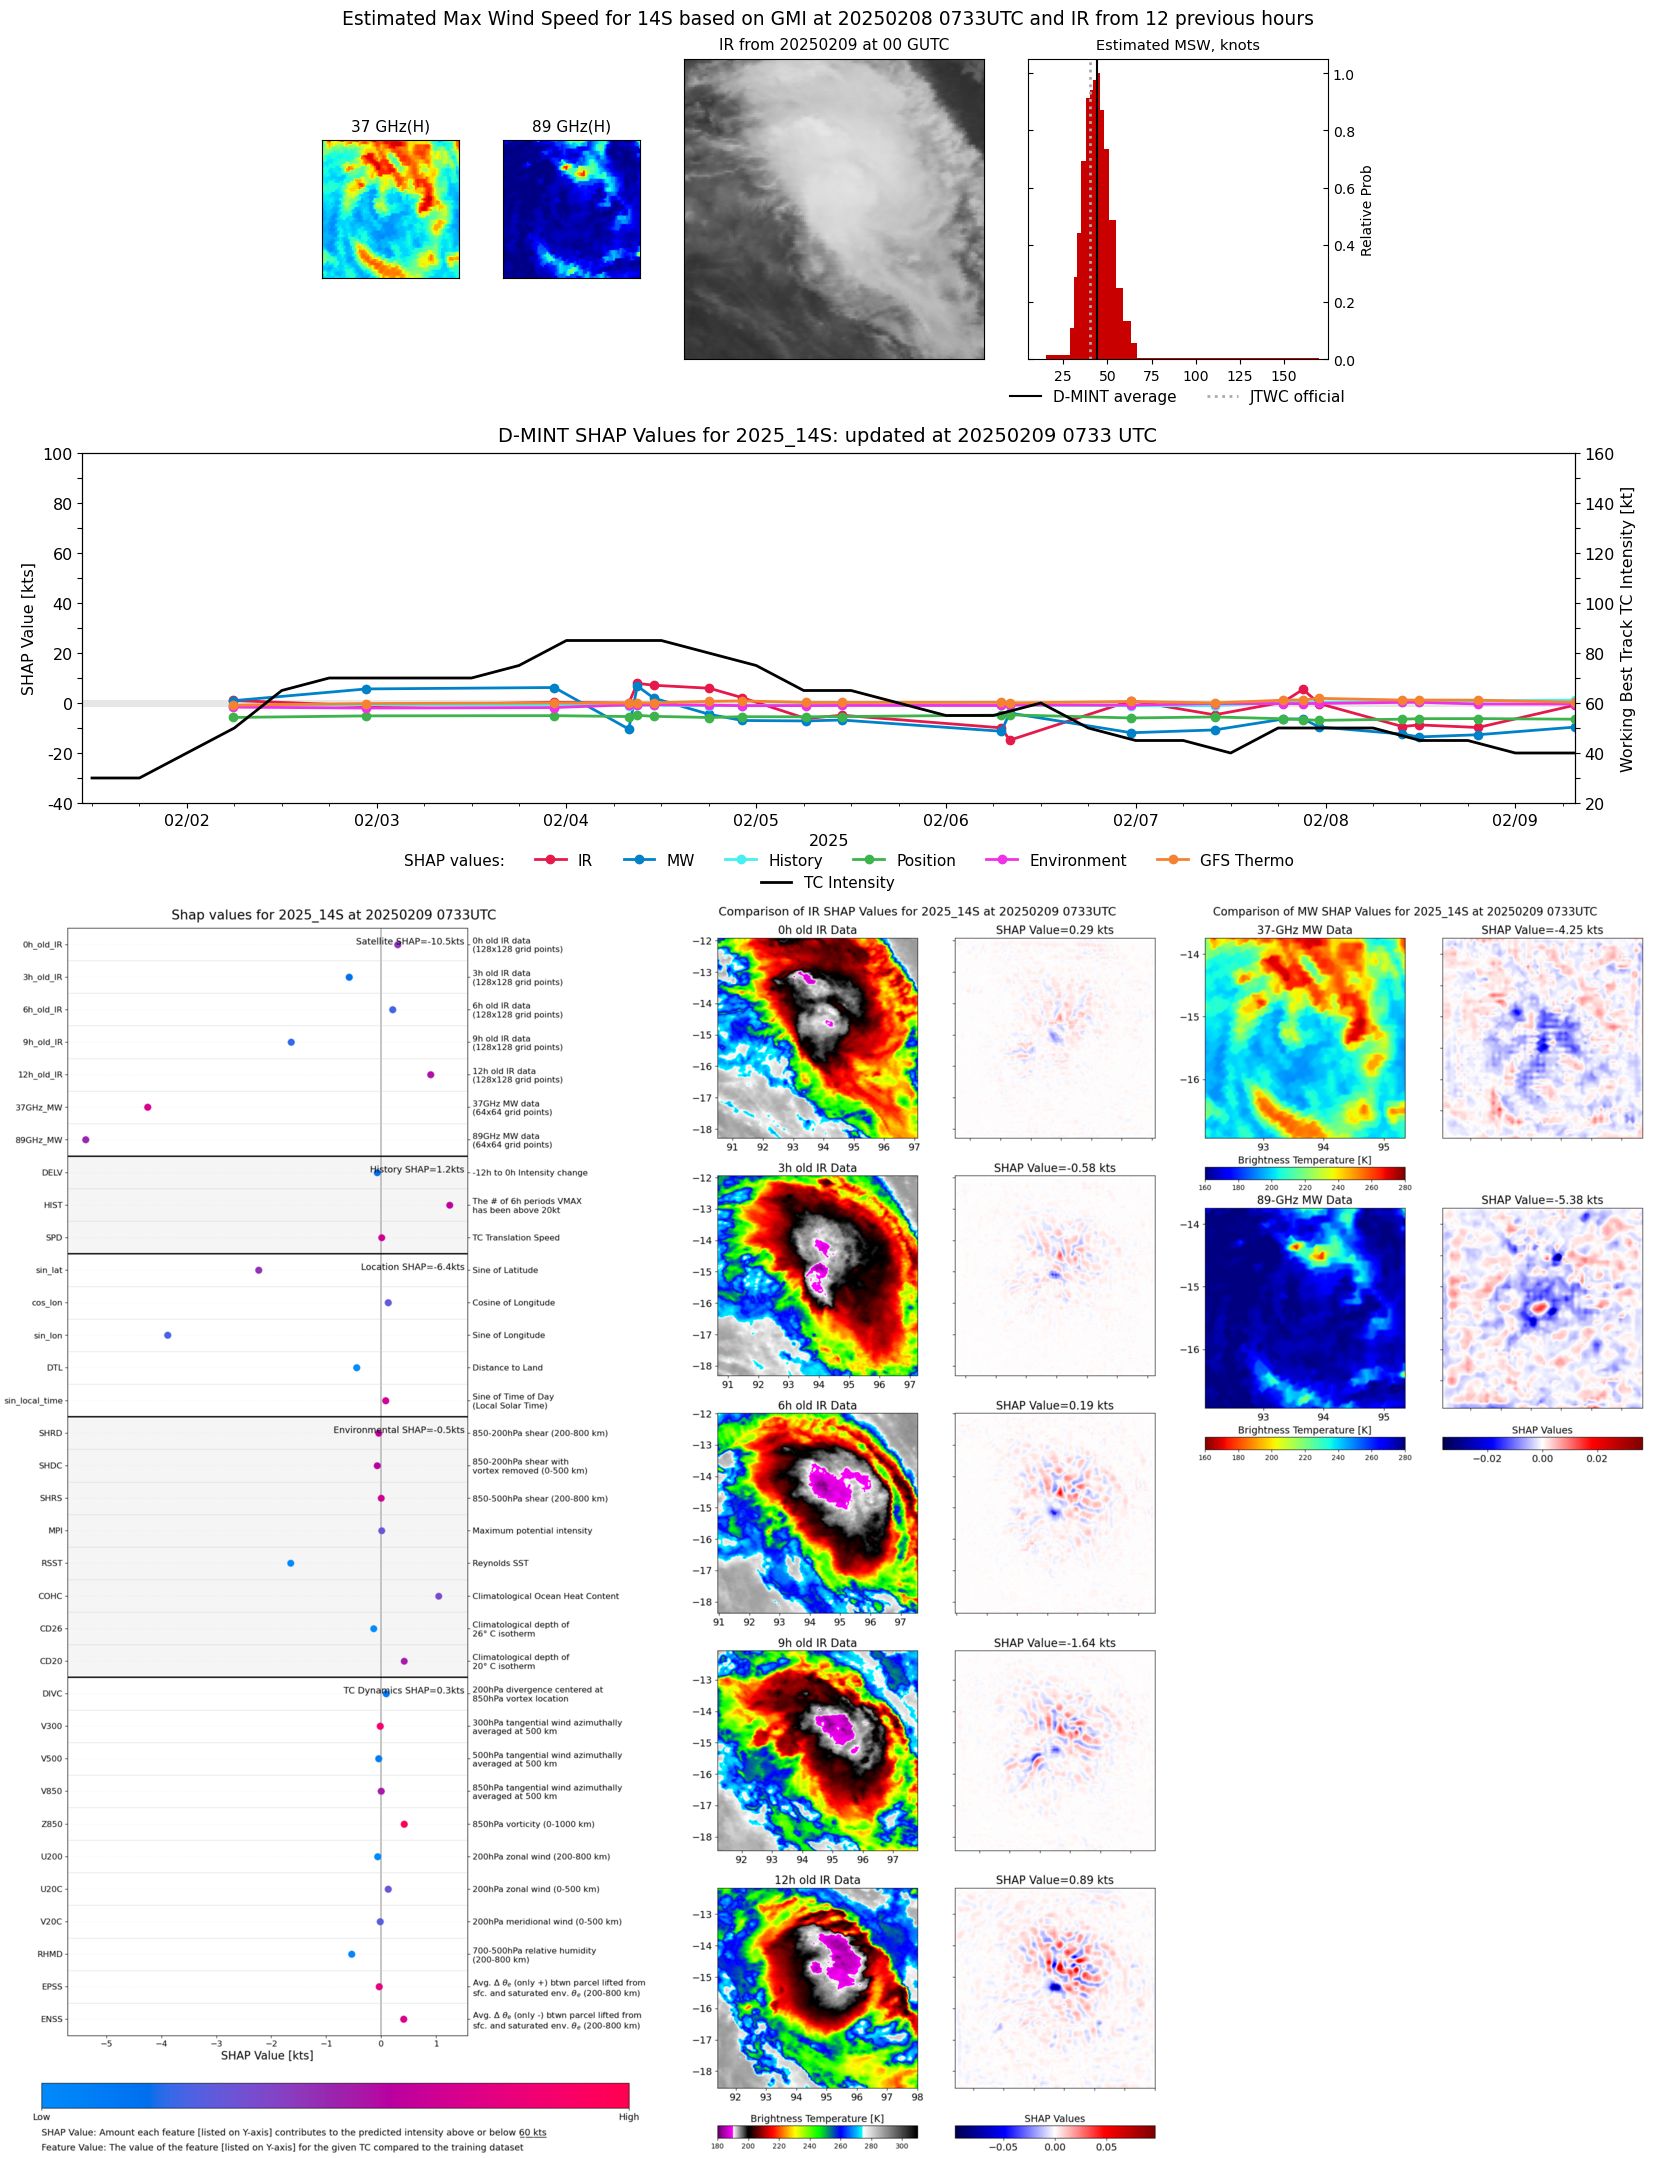 |
| 20250209 | 0731 UTC | AMSR2 | 996 hPa | 44 kts | 39 kts | 49 kts | 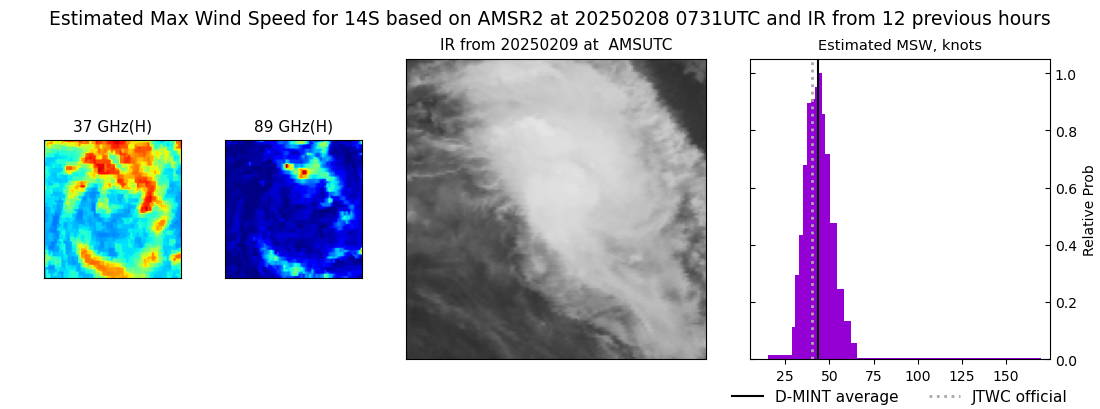 |
| 20250208 | 2337 UTC | SSMISF16 | 994 hPa | 40 kts | 35 kts | 46 kts | 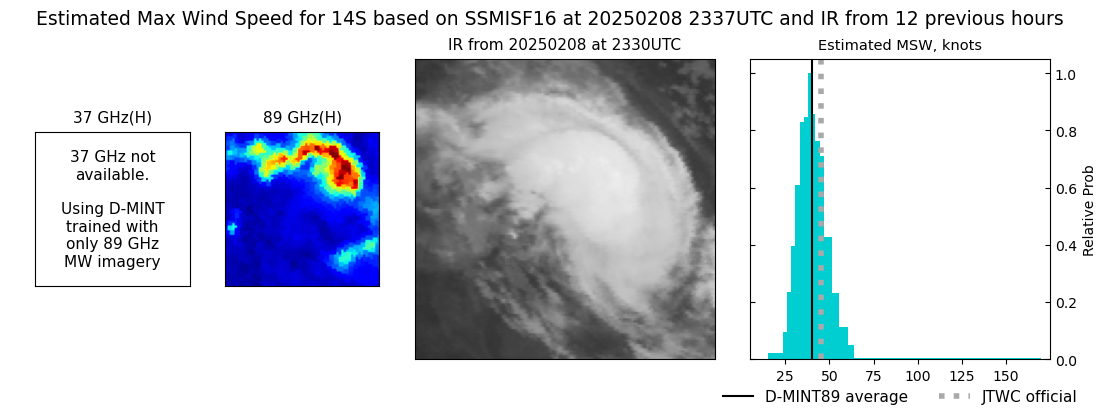 |
| 20250208 | 1918 UTC | AMSR2 | 993 hPa | 33 kts | 29 kts | 37 kts | 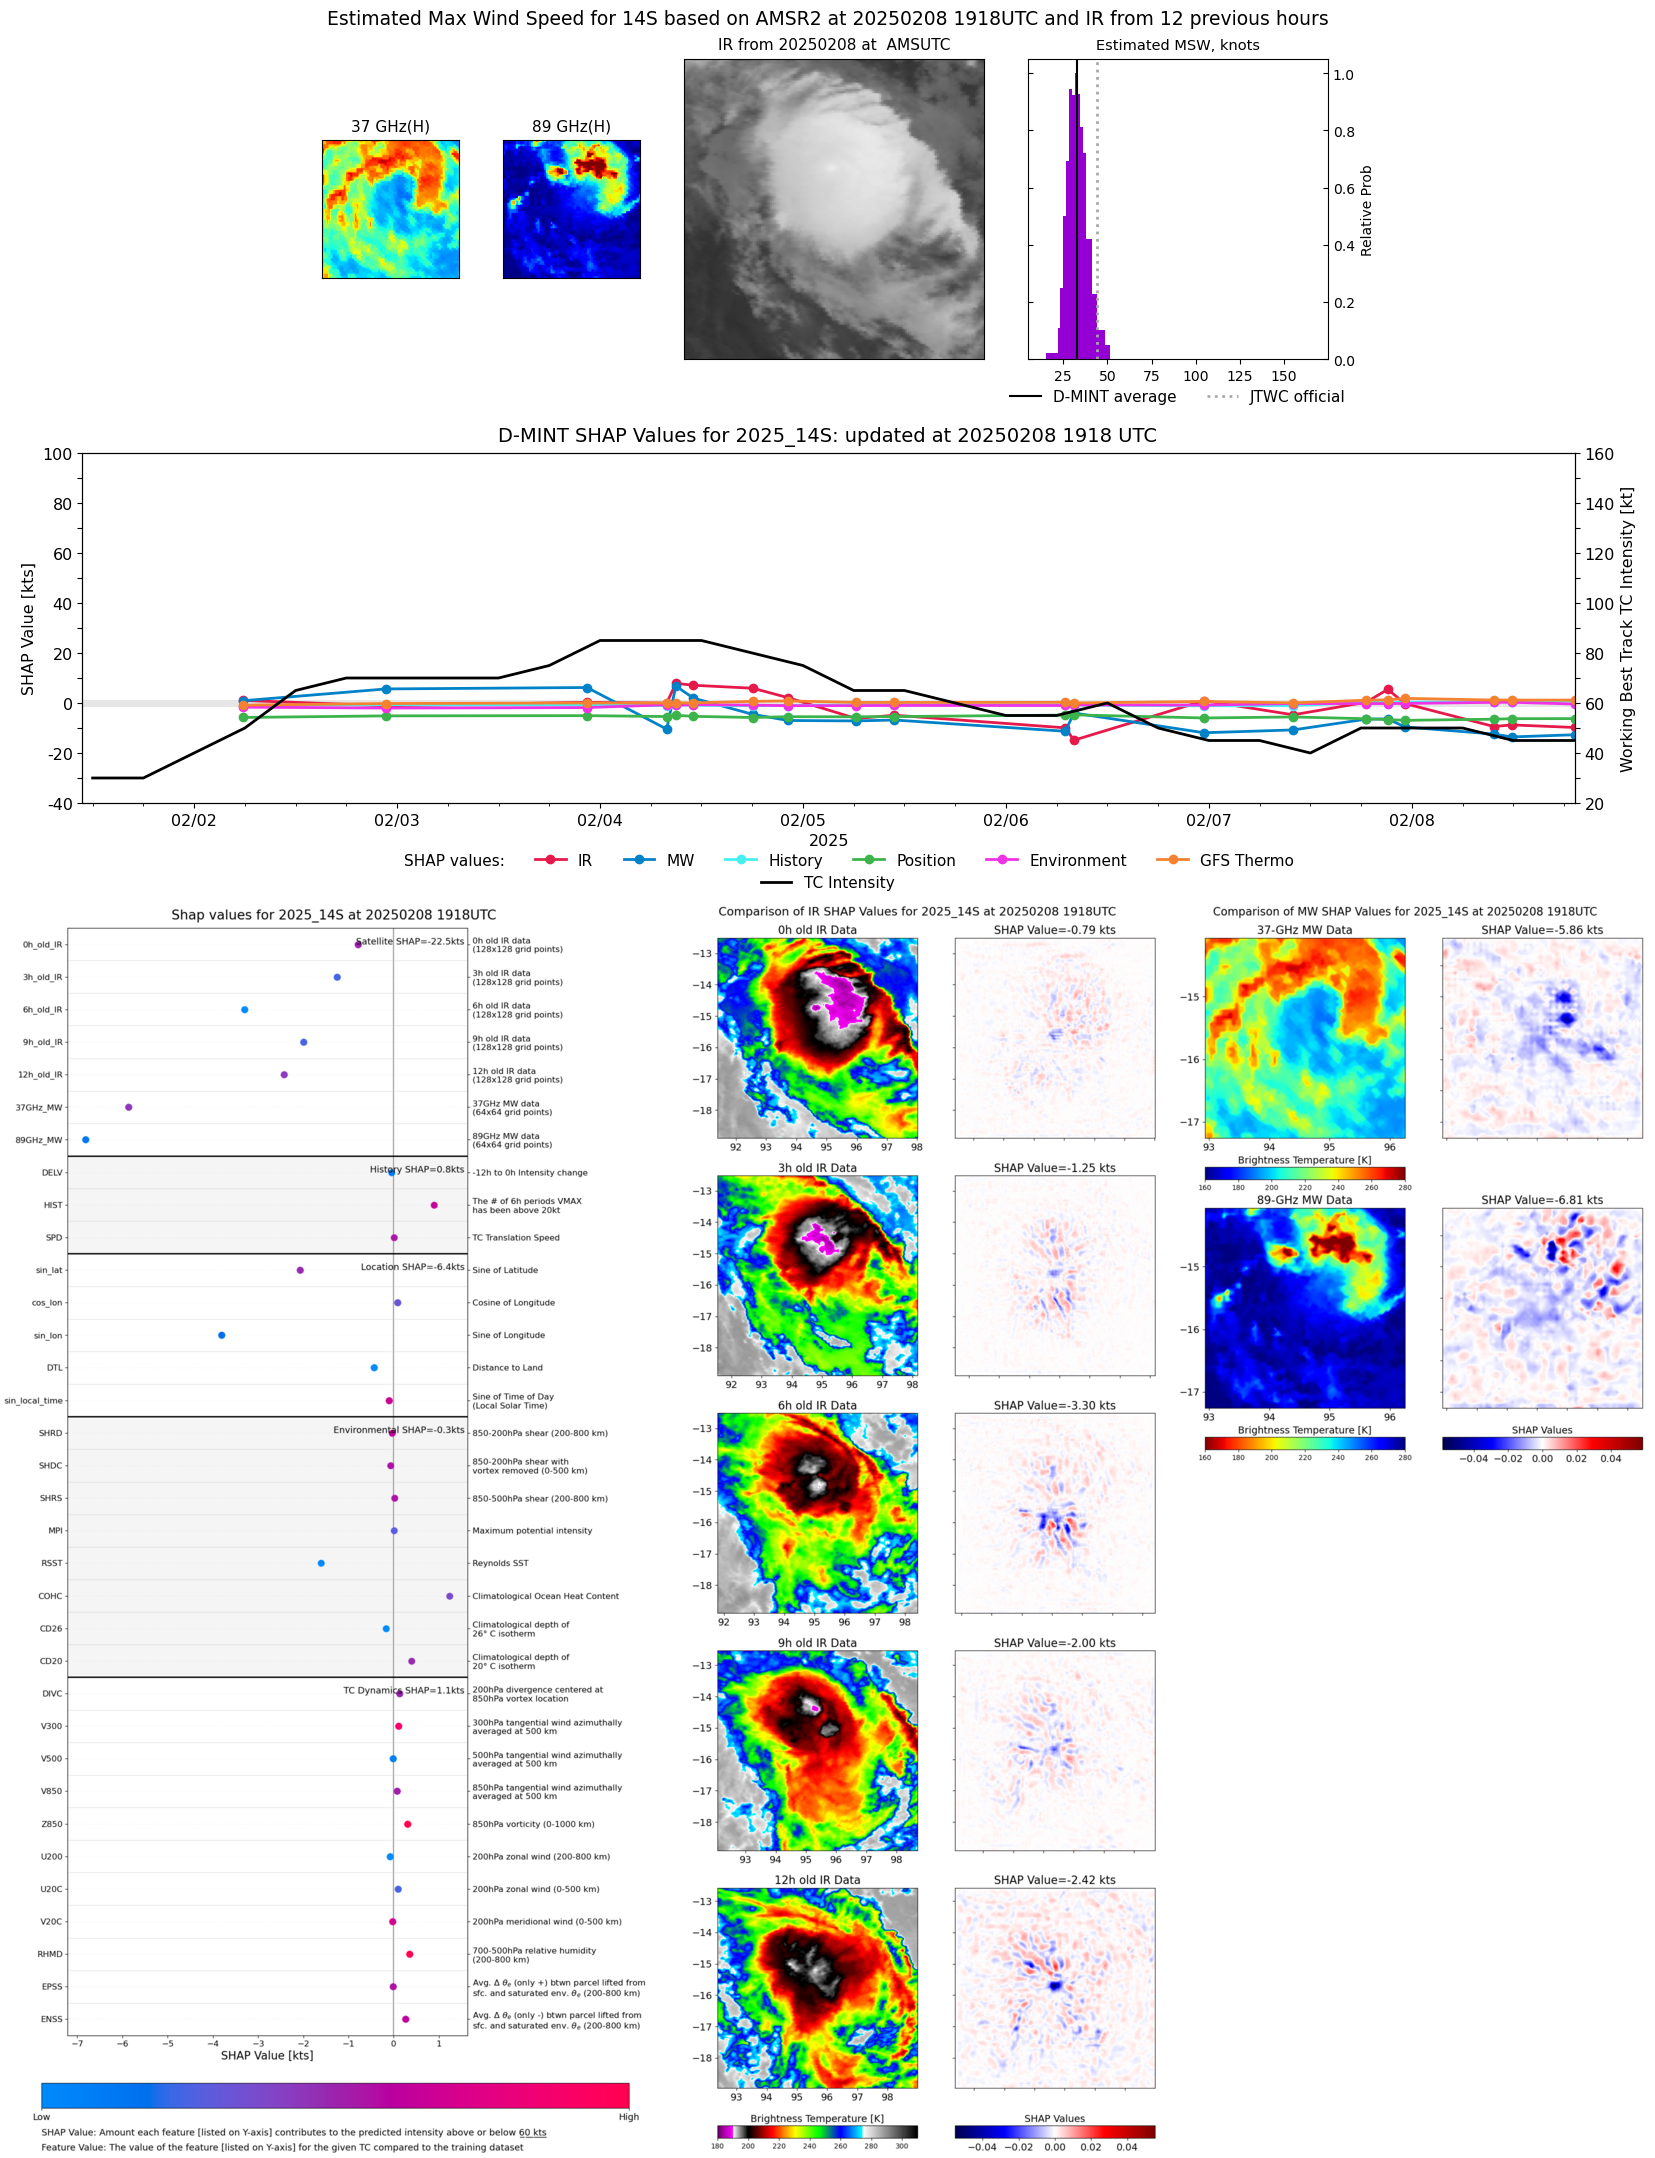 |
| 20250208 | 1759 UTC | TROPICS03 | 986 hPa | 46 kts | 40 kts | 52 kts | 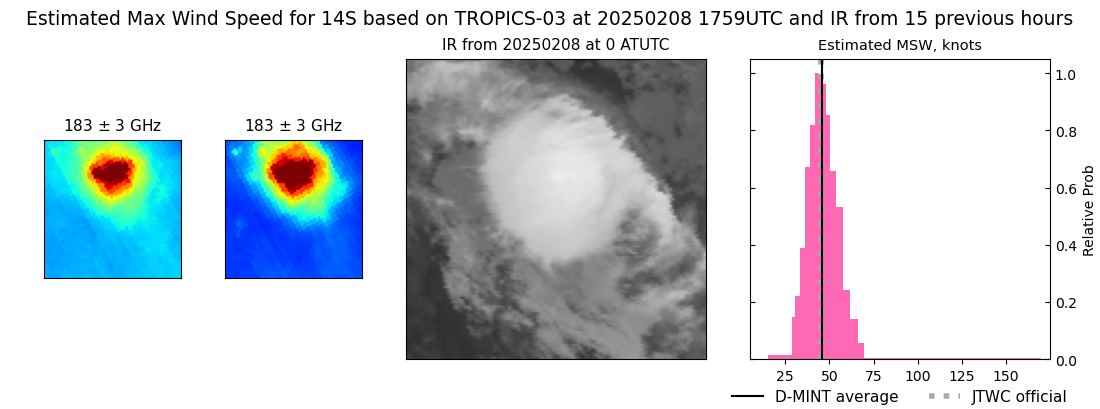 |
| 20250208 | 1226 UTC | SSMISF16 | 994 hPa | 31 kts | 26 kts | 36 kts |  |
| 20250208 | 1148 UTC | SSMISF17 | 993 hPa | 33 kts | 29 kts | 39 kts | 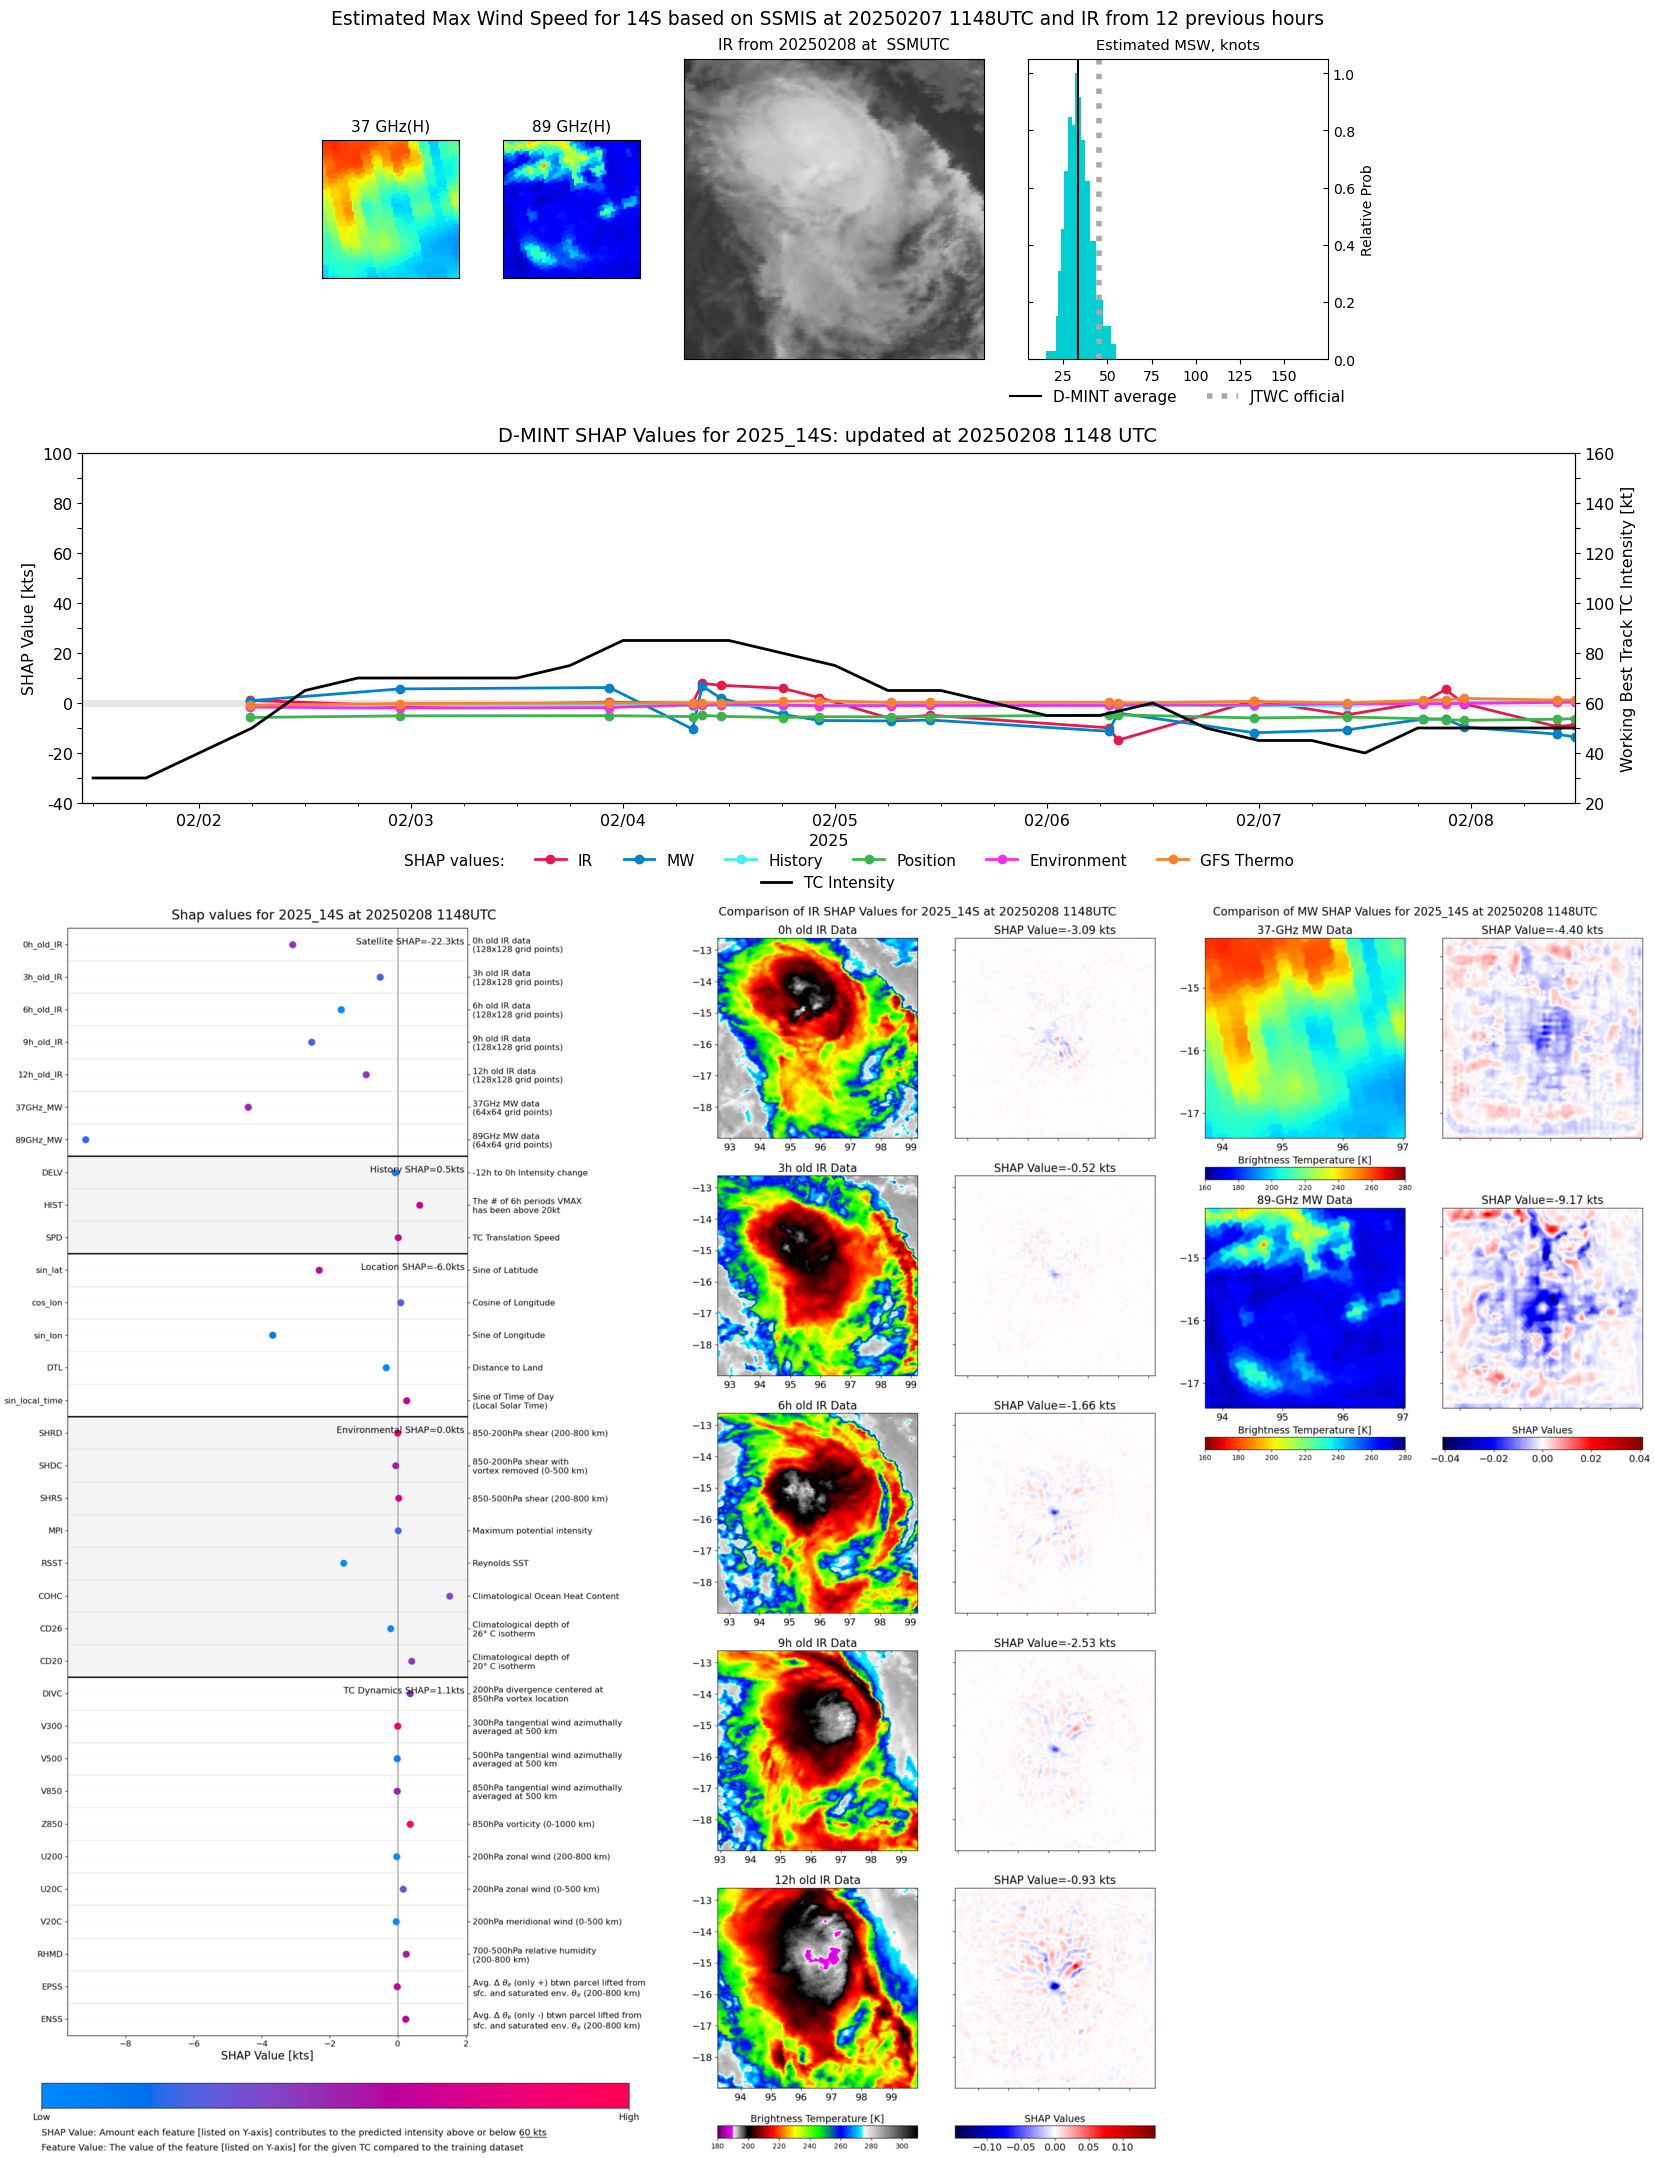 |
| 20250208 | 0944 UTC | SSMISF18 | 993 hPa | 34 kts | 29 kts | 39 kts | 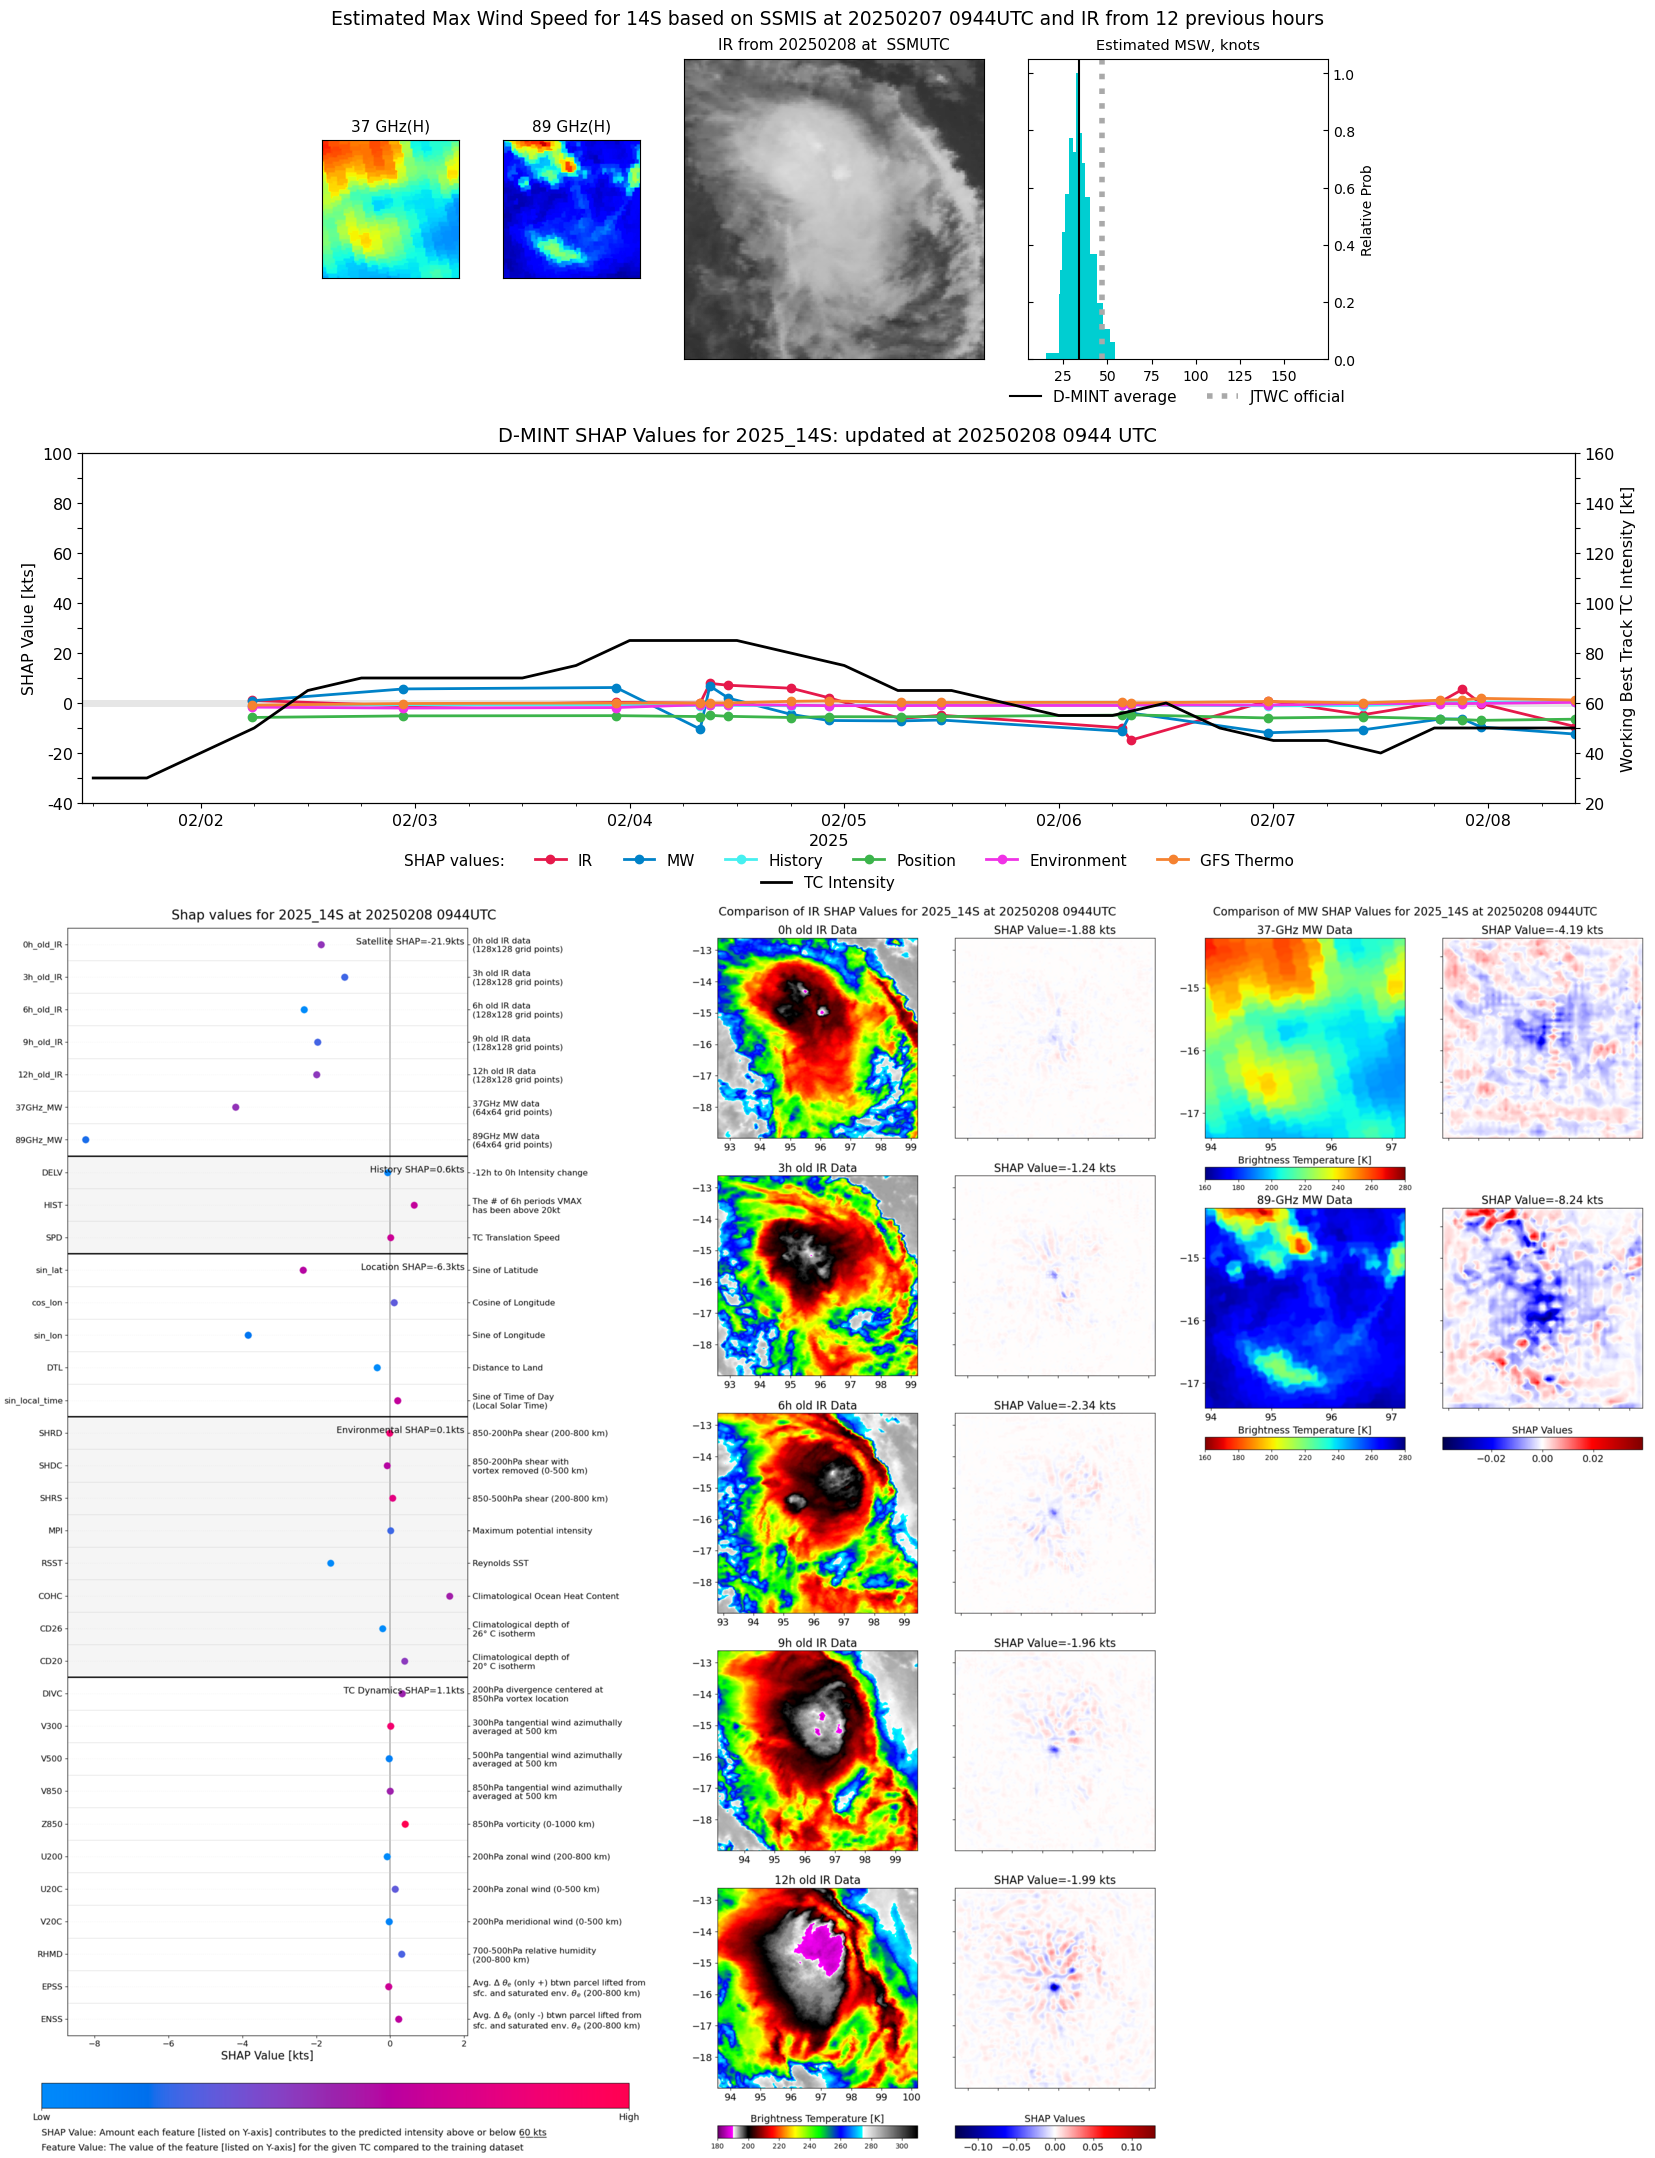 |
| 20250208 | 0941 UTC | TROPICS03 | 986 hPa | 50 kts | 44 kts | 56 kts | 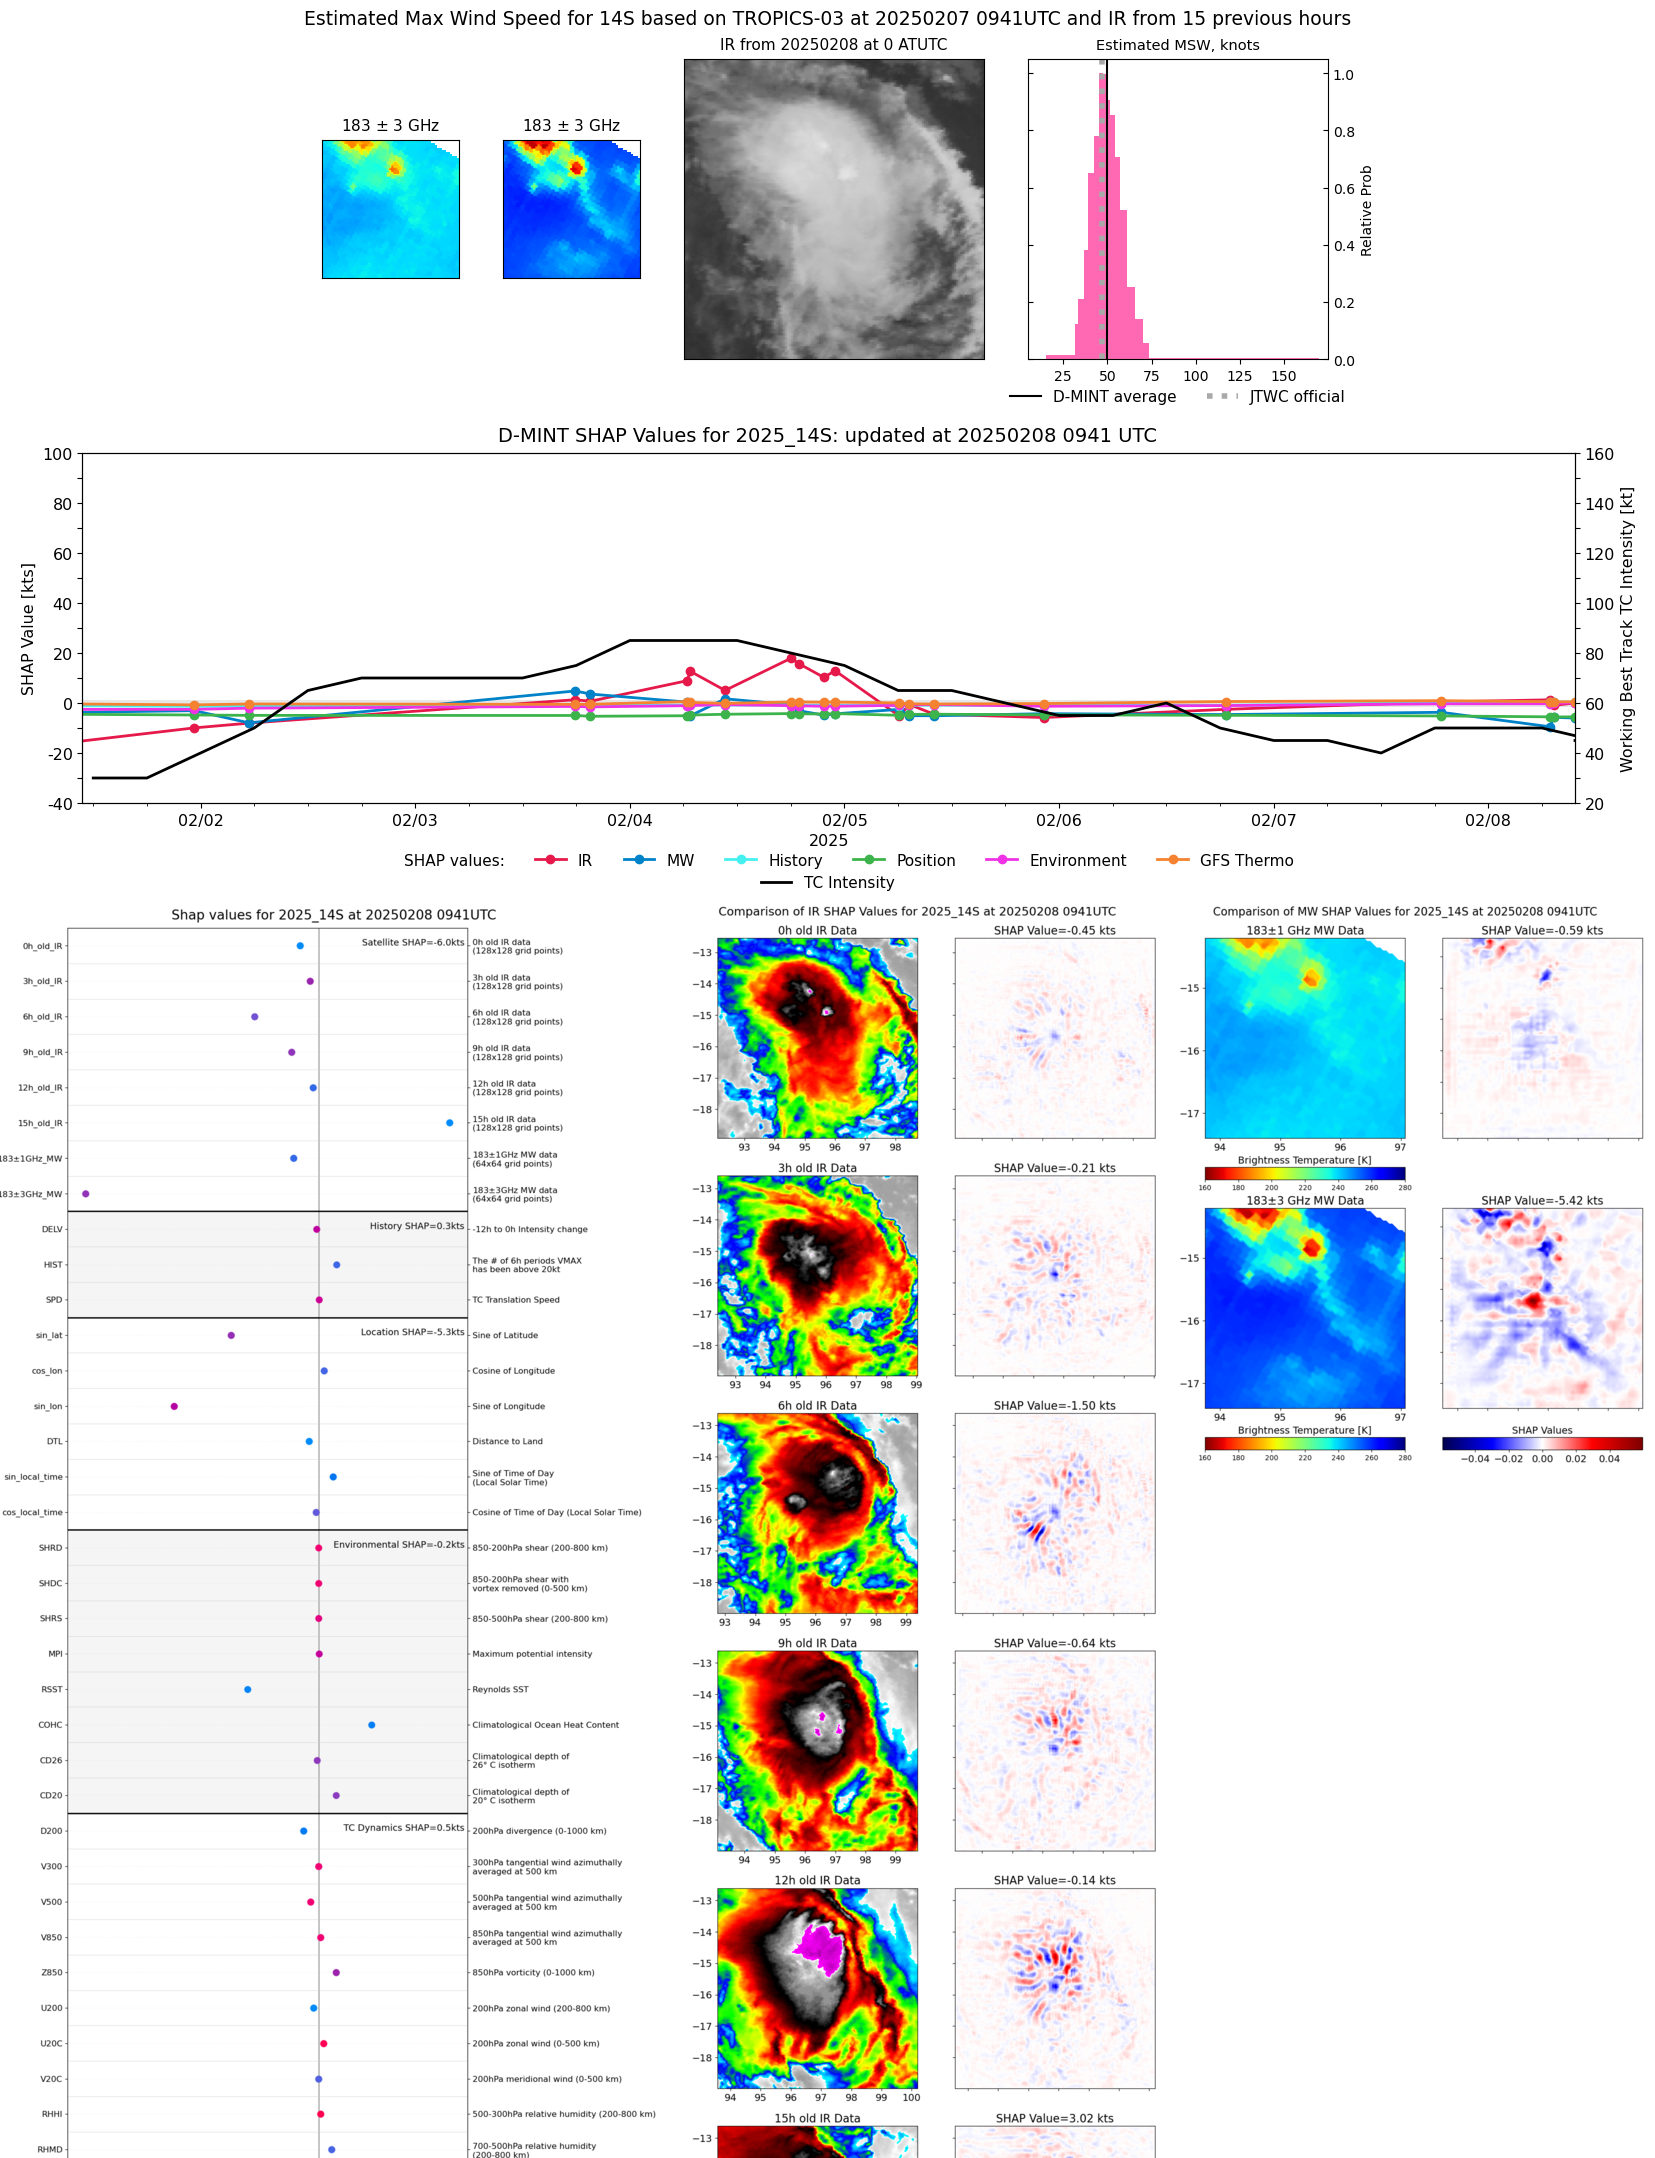 |
| 20250208 | 0718 UTC | ATMS-N20 | 988 hPa | 49 kts | 42 kts | 55 kts | 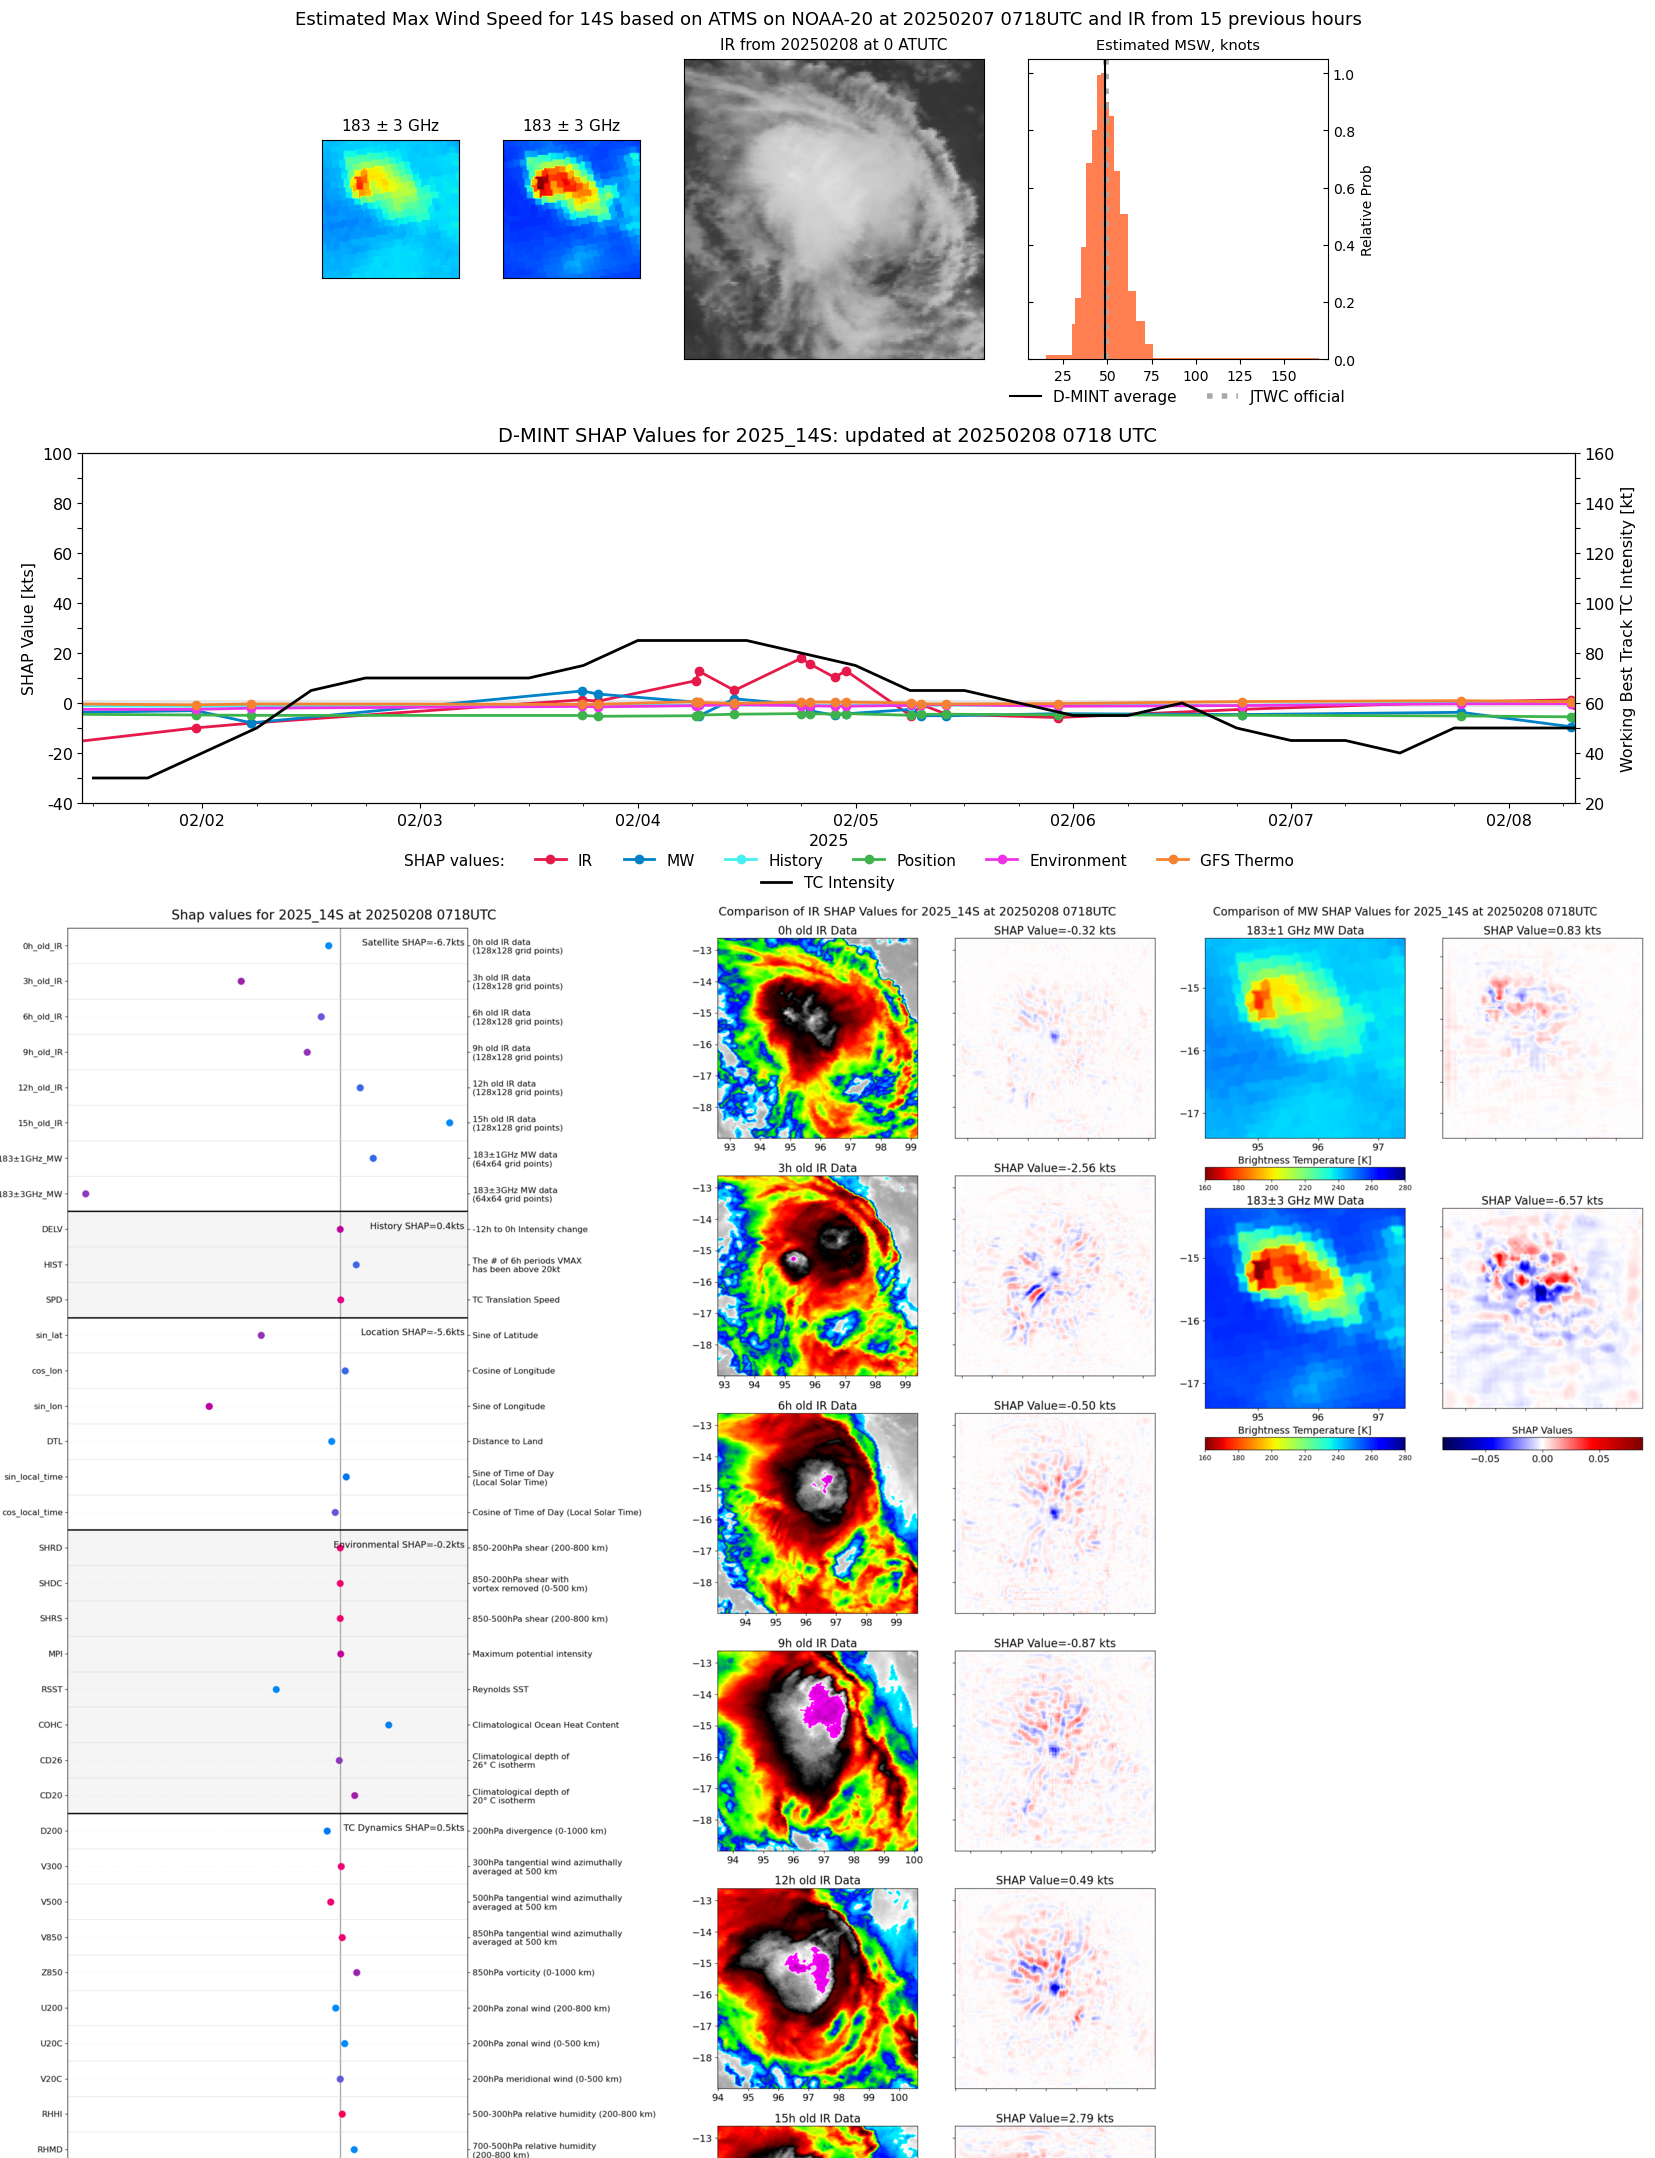 |
| 20250208 | 0652 UTC | ATMS-N20 | 990 hPa | 47 kts | 41 kts | 54 kts | 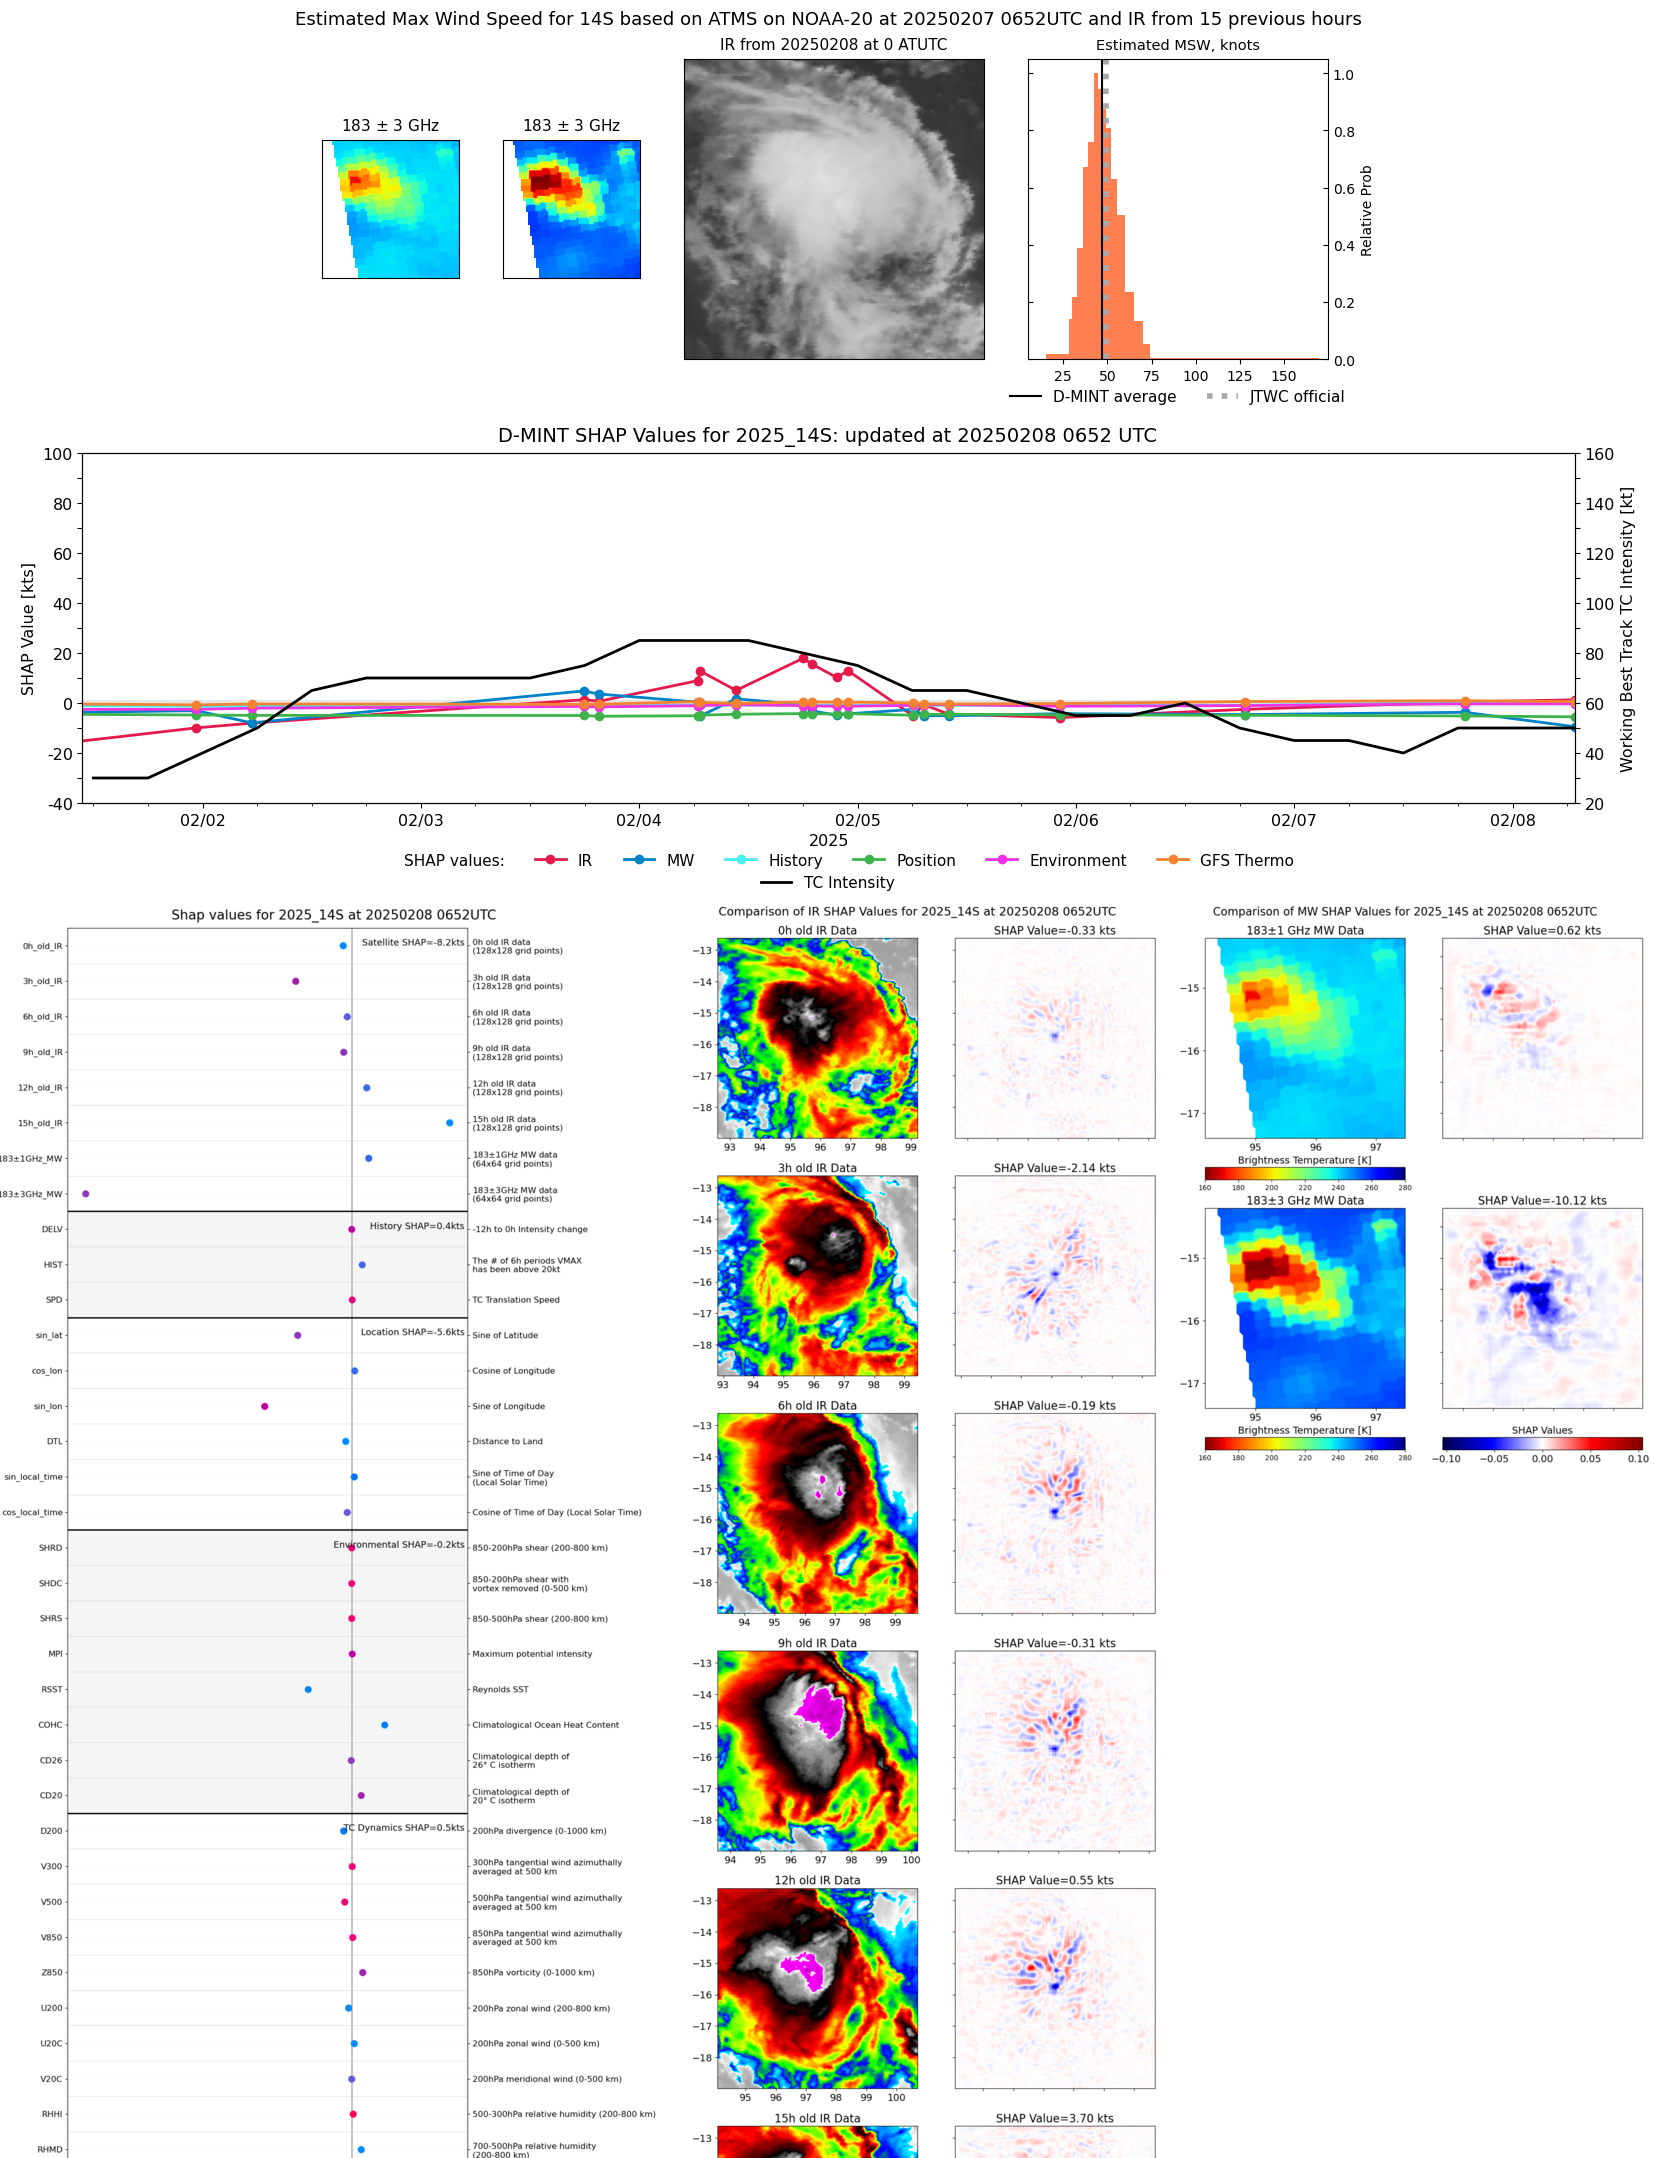 |
| 20250207 | 2351 UTC | SSMISF16 | 984 hPa | 50 kts | 44 kts | 58 kts |  |
| 20250207 | 2313 UTC | SSMISF17 | 984 hPa | 45 kts | 40 kts | 51 kts |  |
| 20250207 | 2109 UTC | SSMISF18 | 983 hPa | 54 kts | 48 kts | 60 kts |  |
| 20250207 | 2107 UTC | TROPICS06 | 986 hPa | 55 kts | 49 kts | 61 kts | 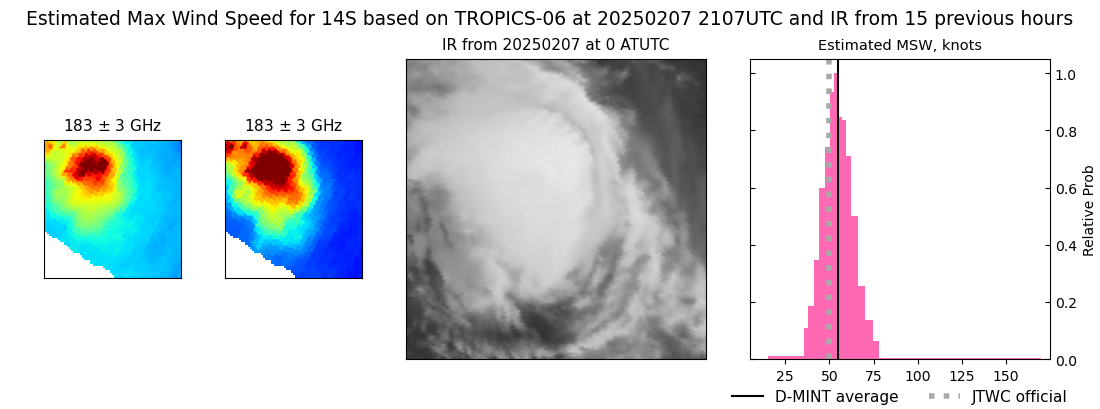 |
| 20250207 | 1848 UTC | GMI | NaN hPa | 42 kts | 37 kts | 47 kts | 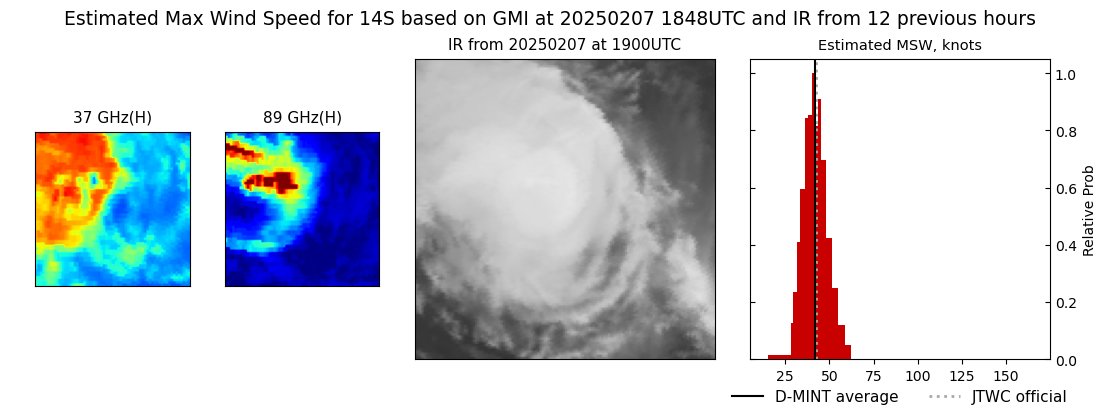 |
| 20250207 | 1845 UTC | ATMS-N20 | 987 hPa | 53 kts | 46 kts | 59 kts | 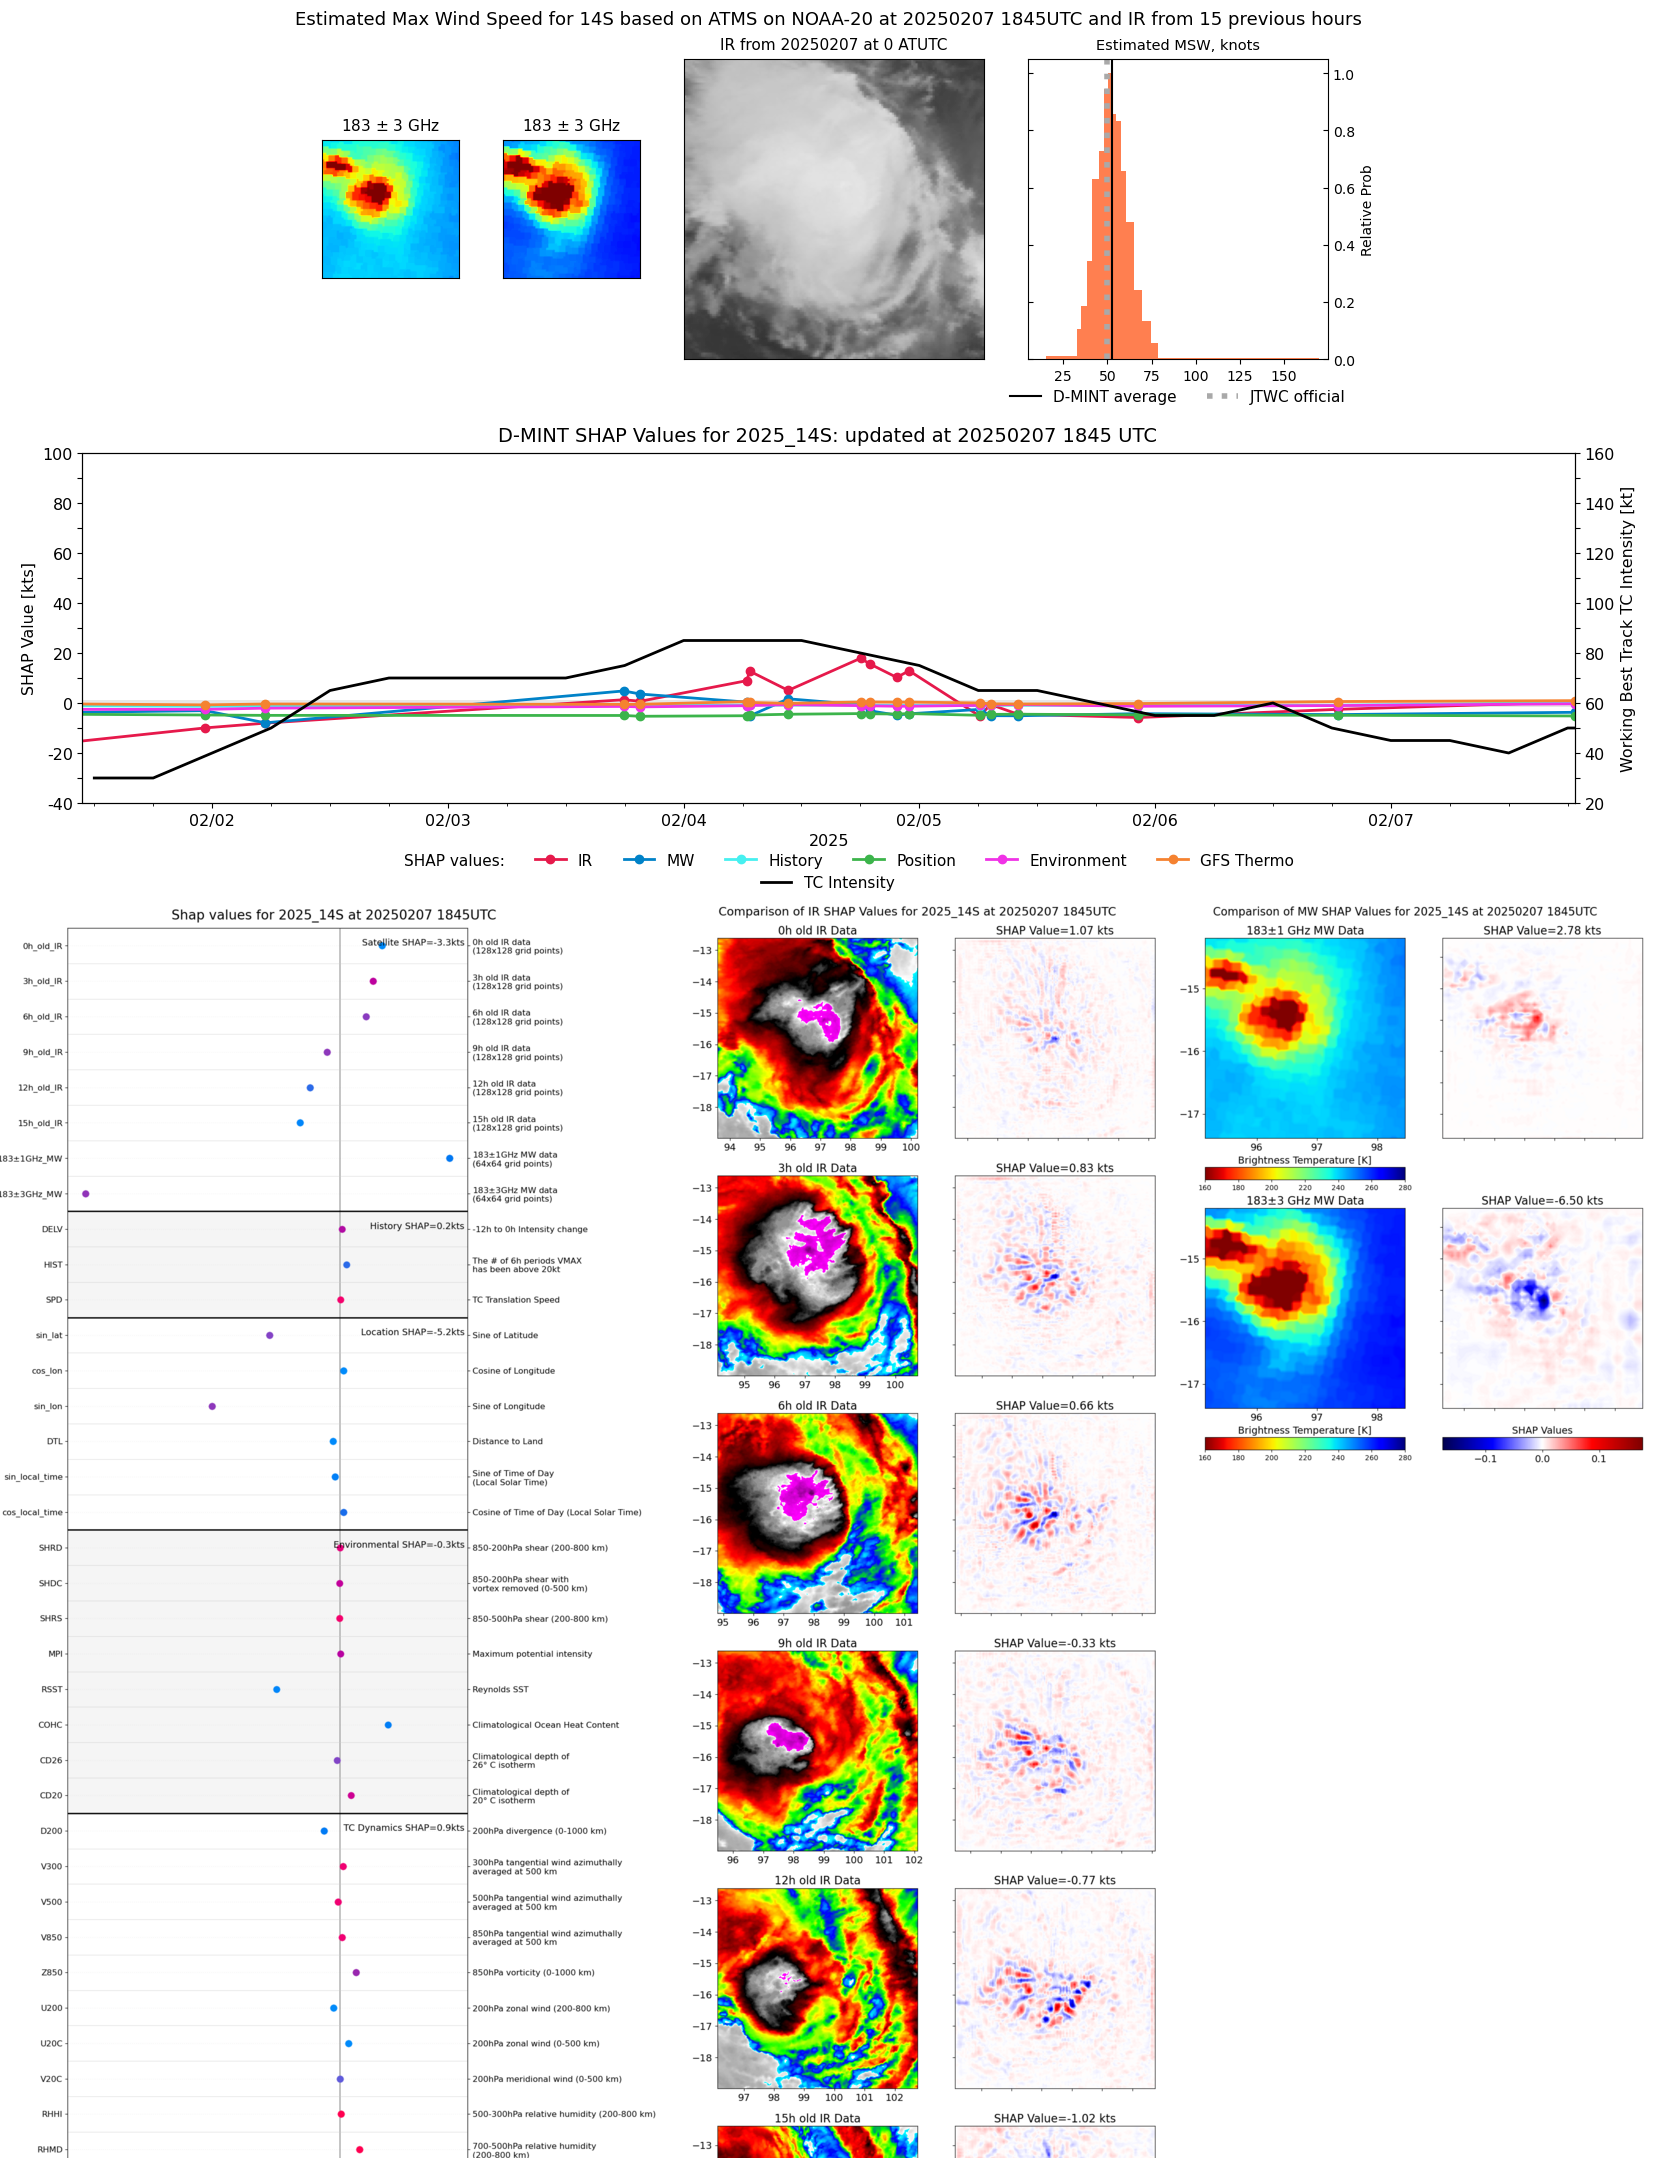 |
| 20250207 | 1836 UTC | AMSR2 | 990 hPa | 49 kts | 44 kts | 54 kts | 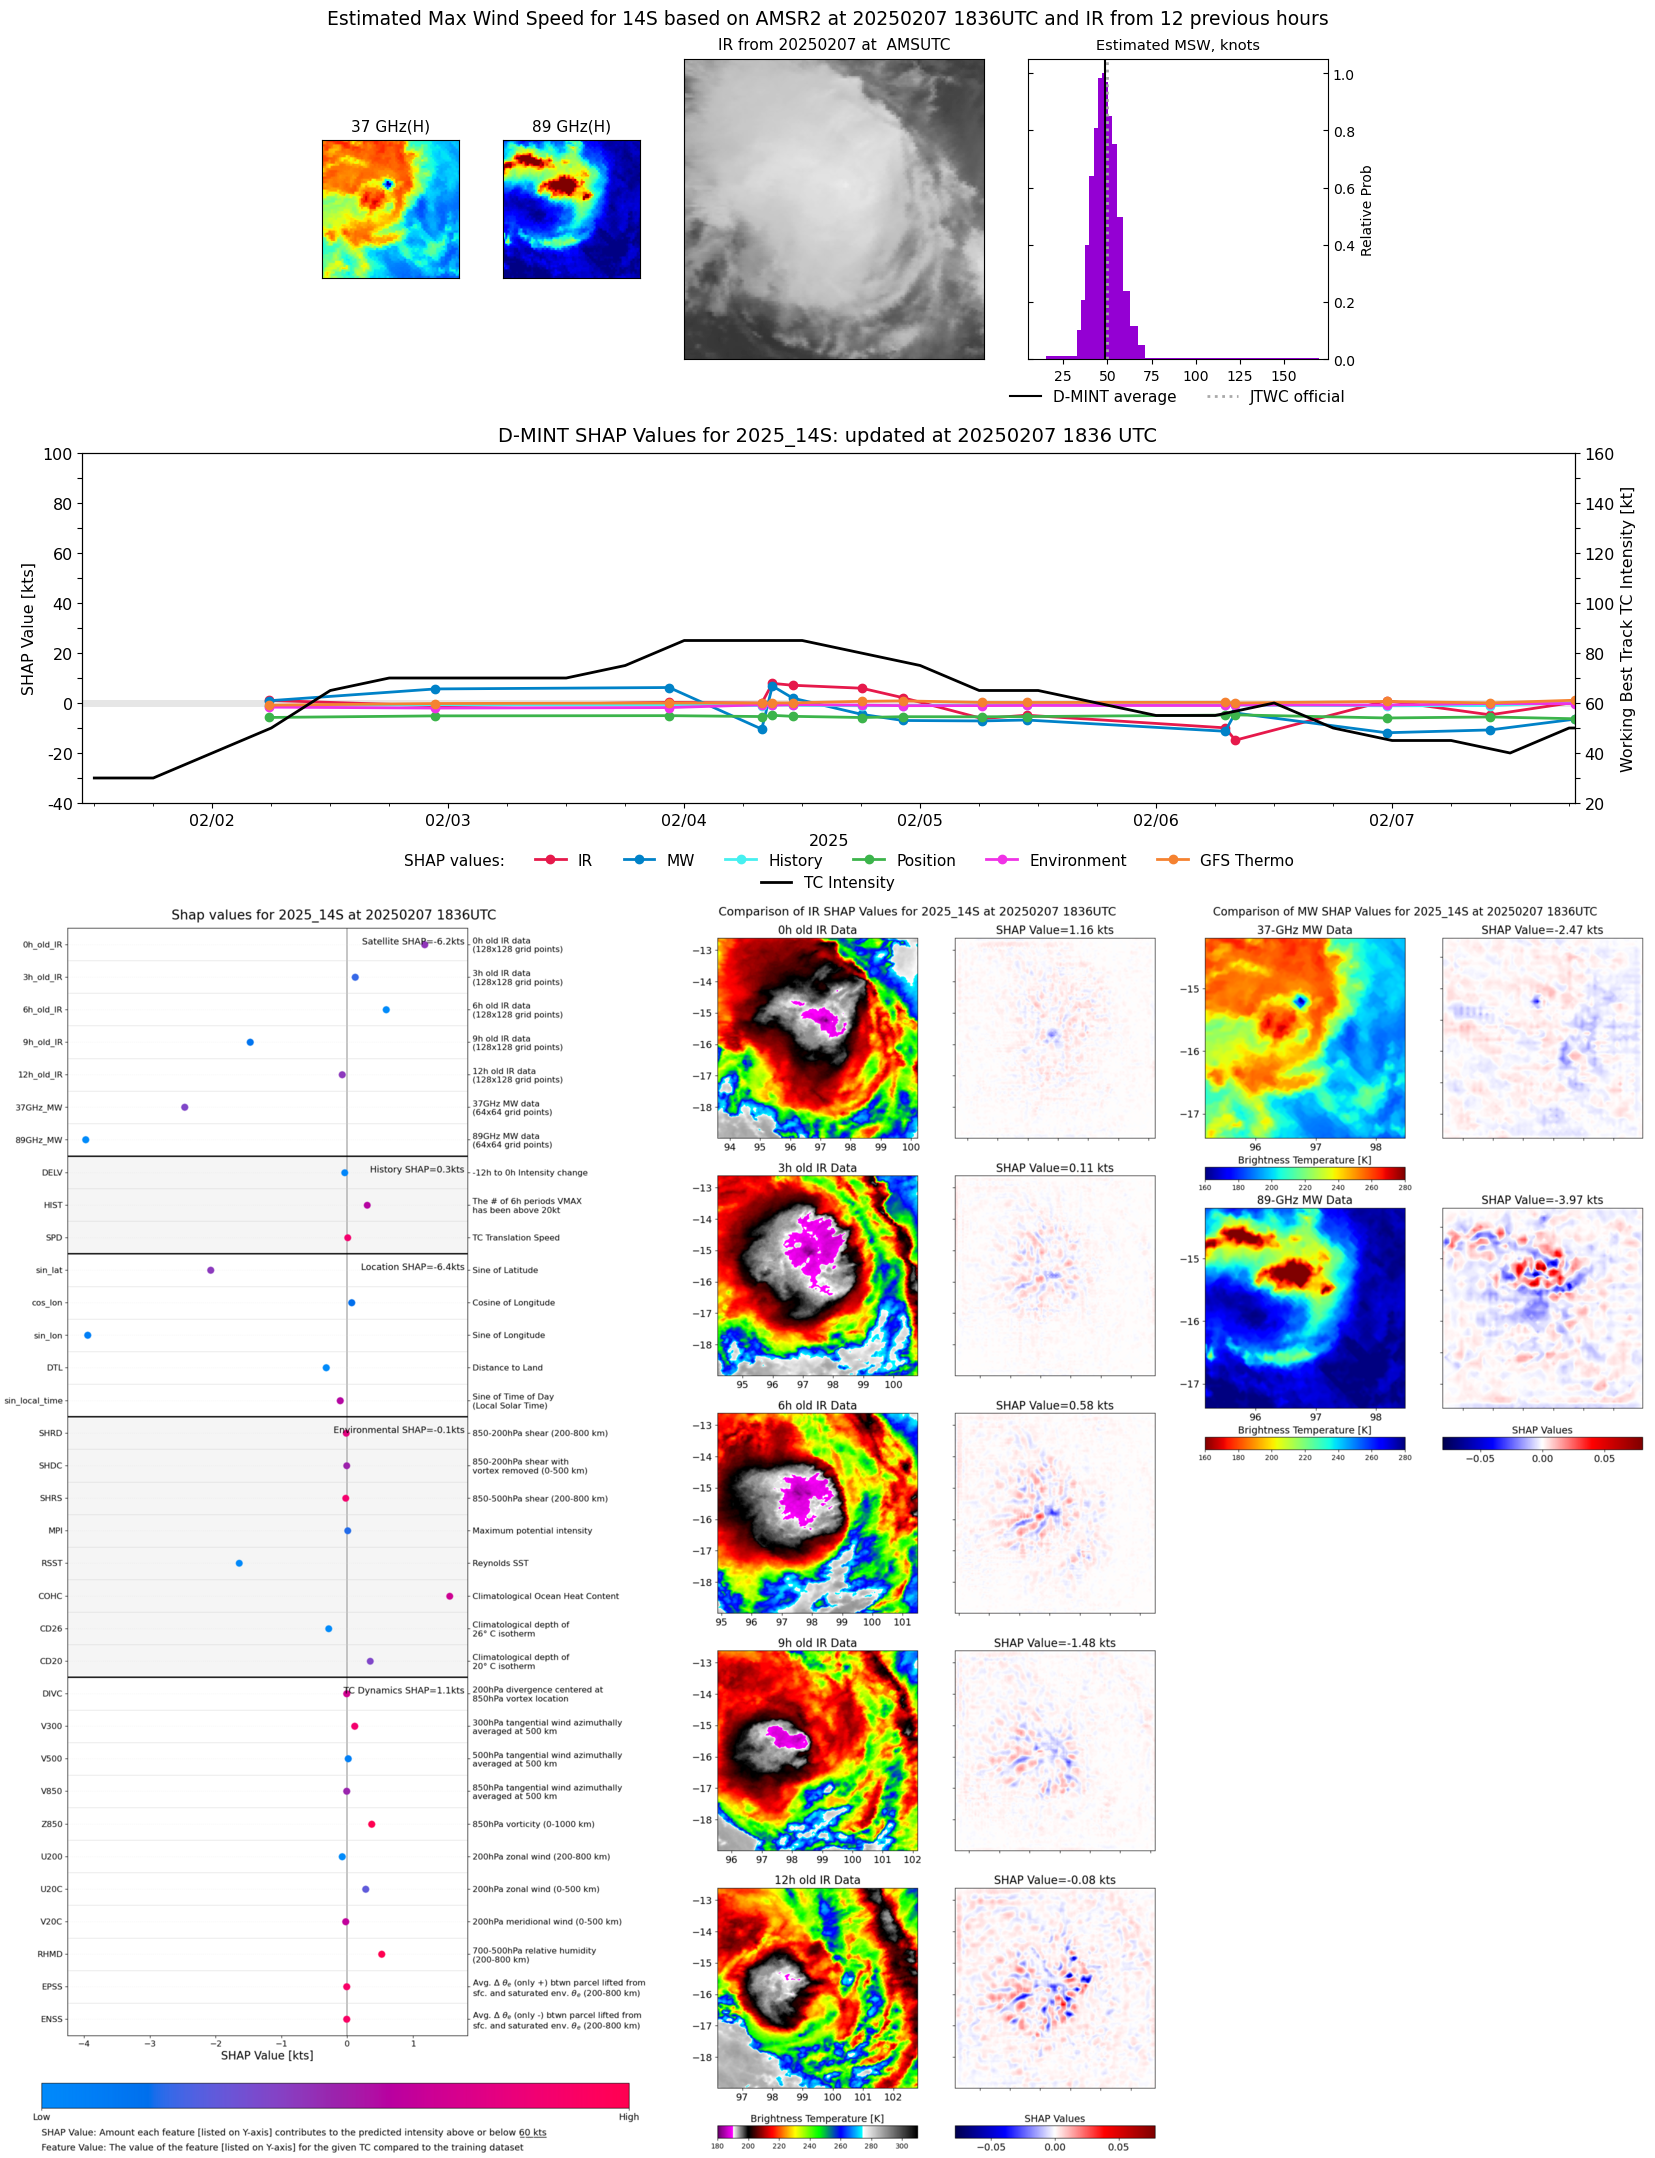 |
| 20250207 | 1202 UTC | SSMISF17 | NaN hPa | 37 kts | 33 kts | 42 kts |  |
| 20250207 | 0958 UTC | SSMISF18 | 997 hPa | 38 kts | 34 kts | 42 kts | 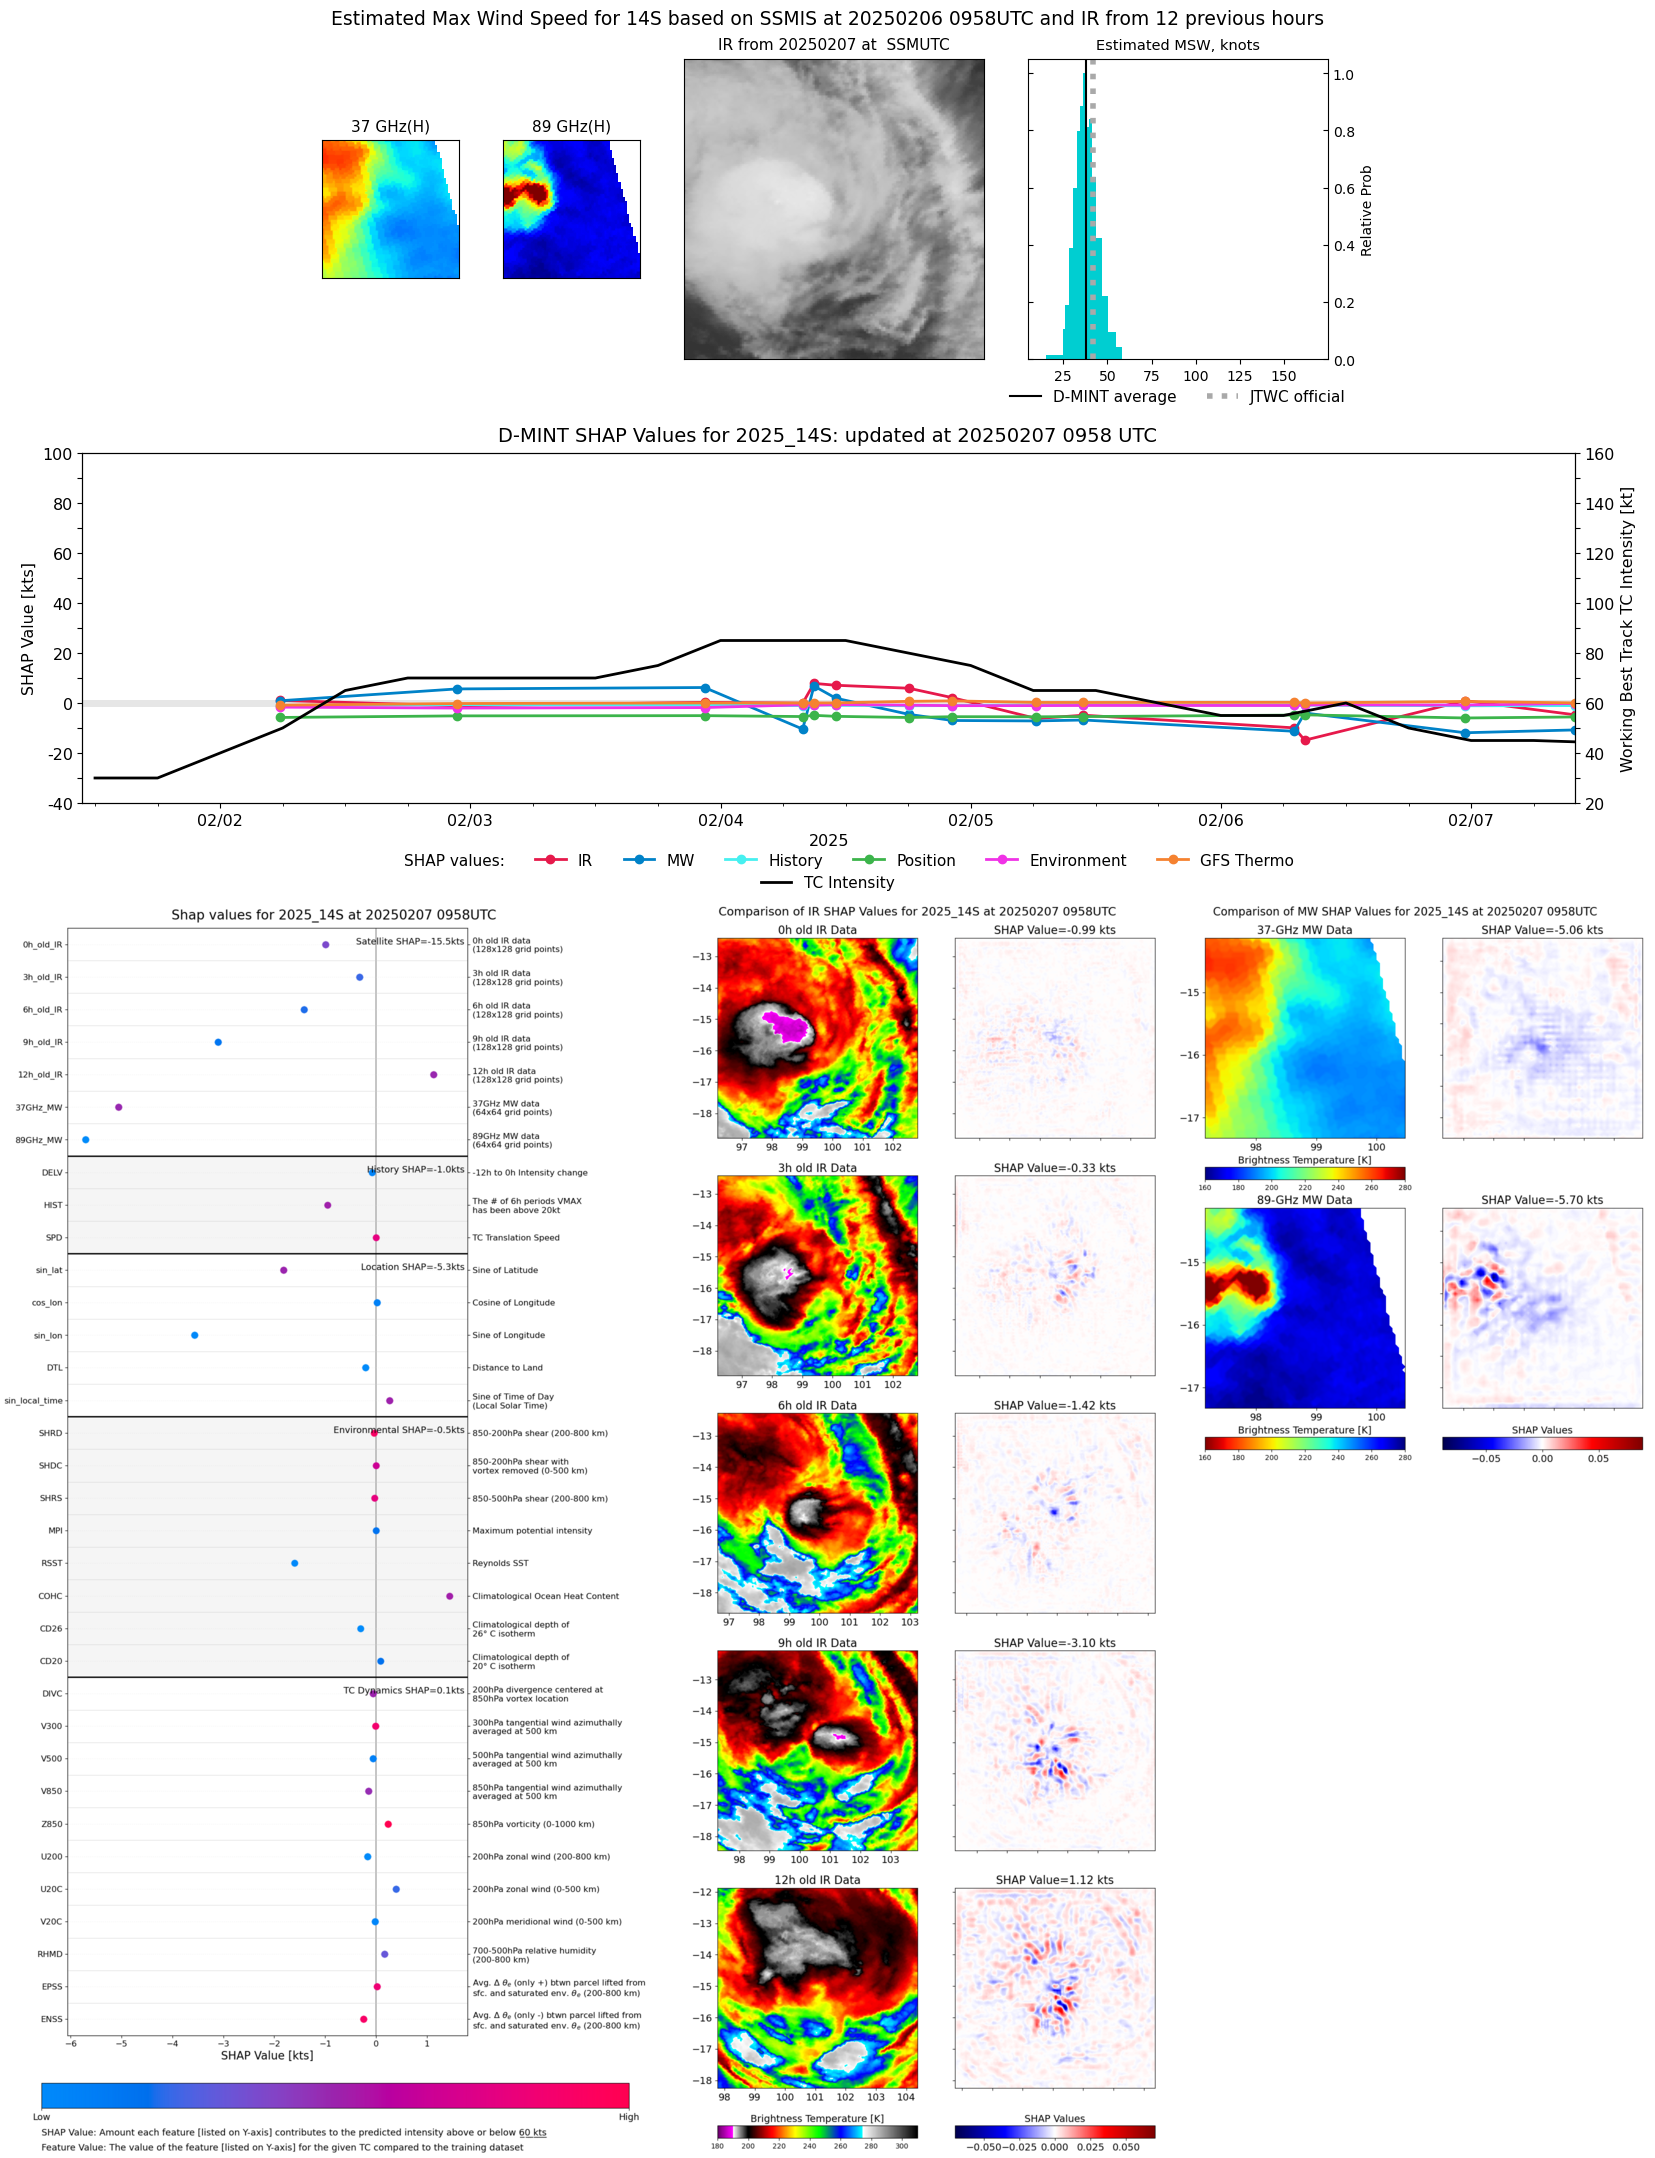 |
| 20250206 | 2326 UTC | SSMISF17 | 995 hPa | 42 kts | 37 kts | 48 kts | 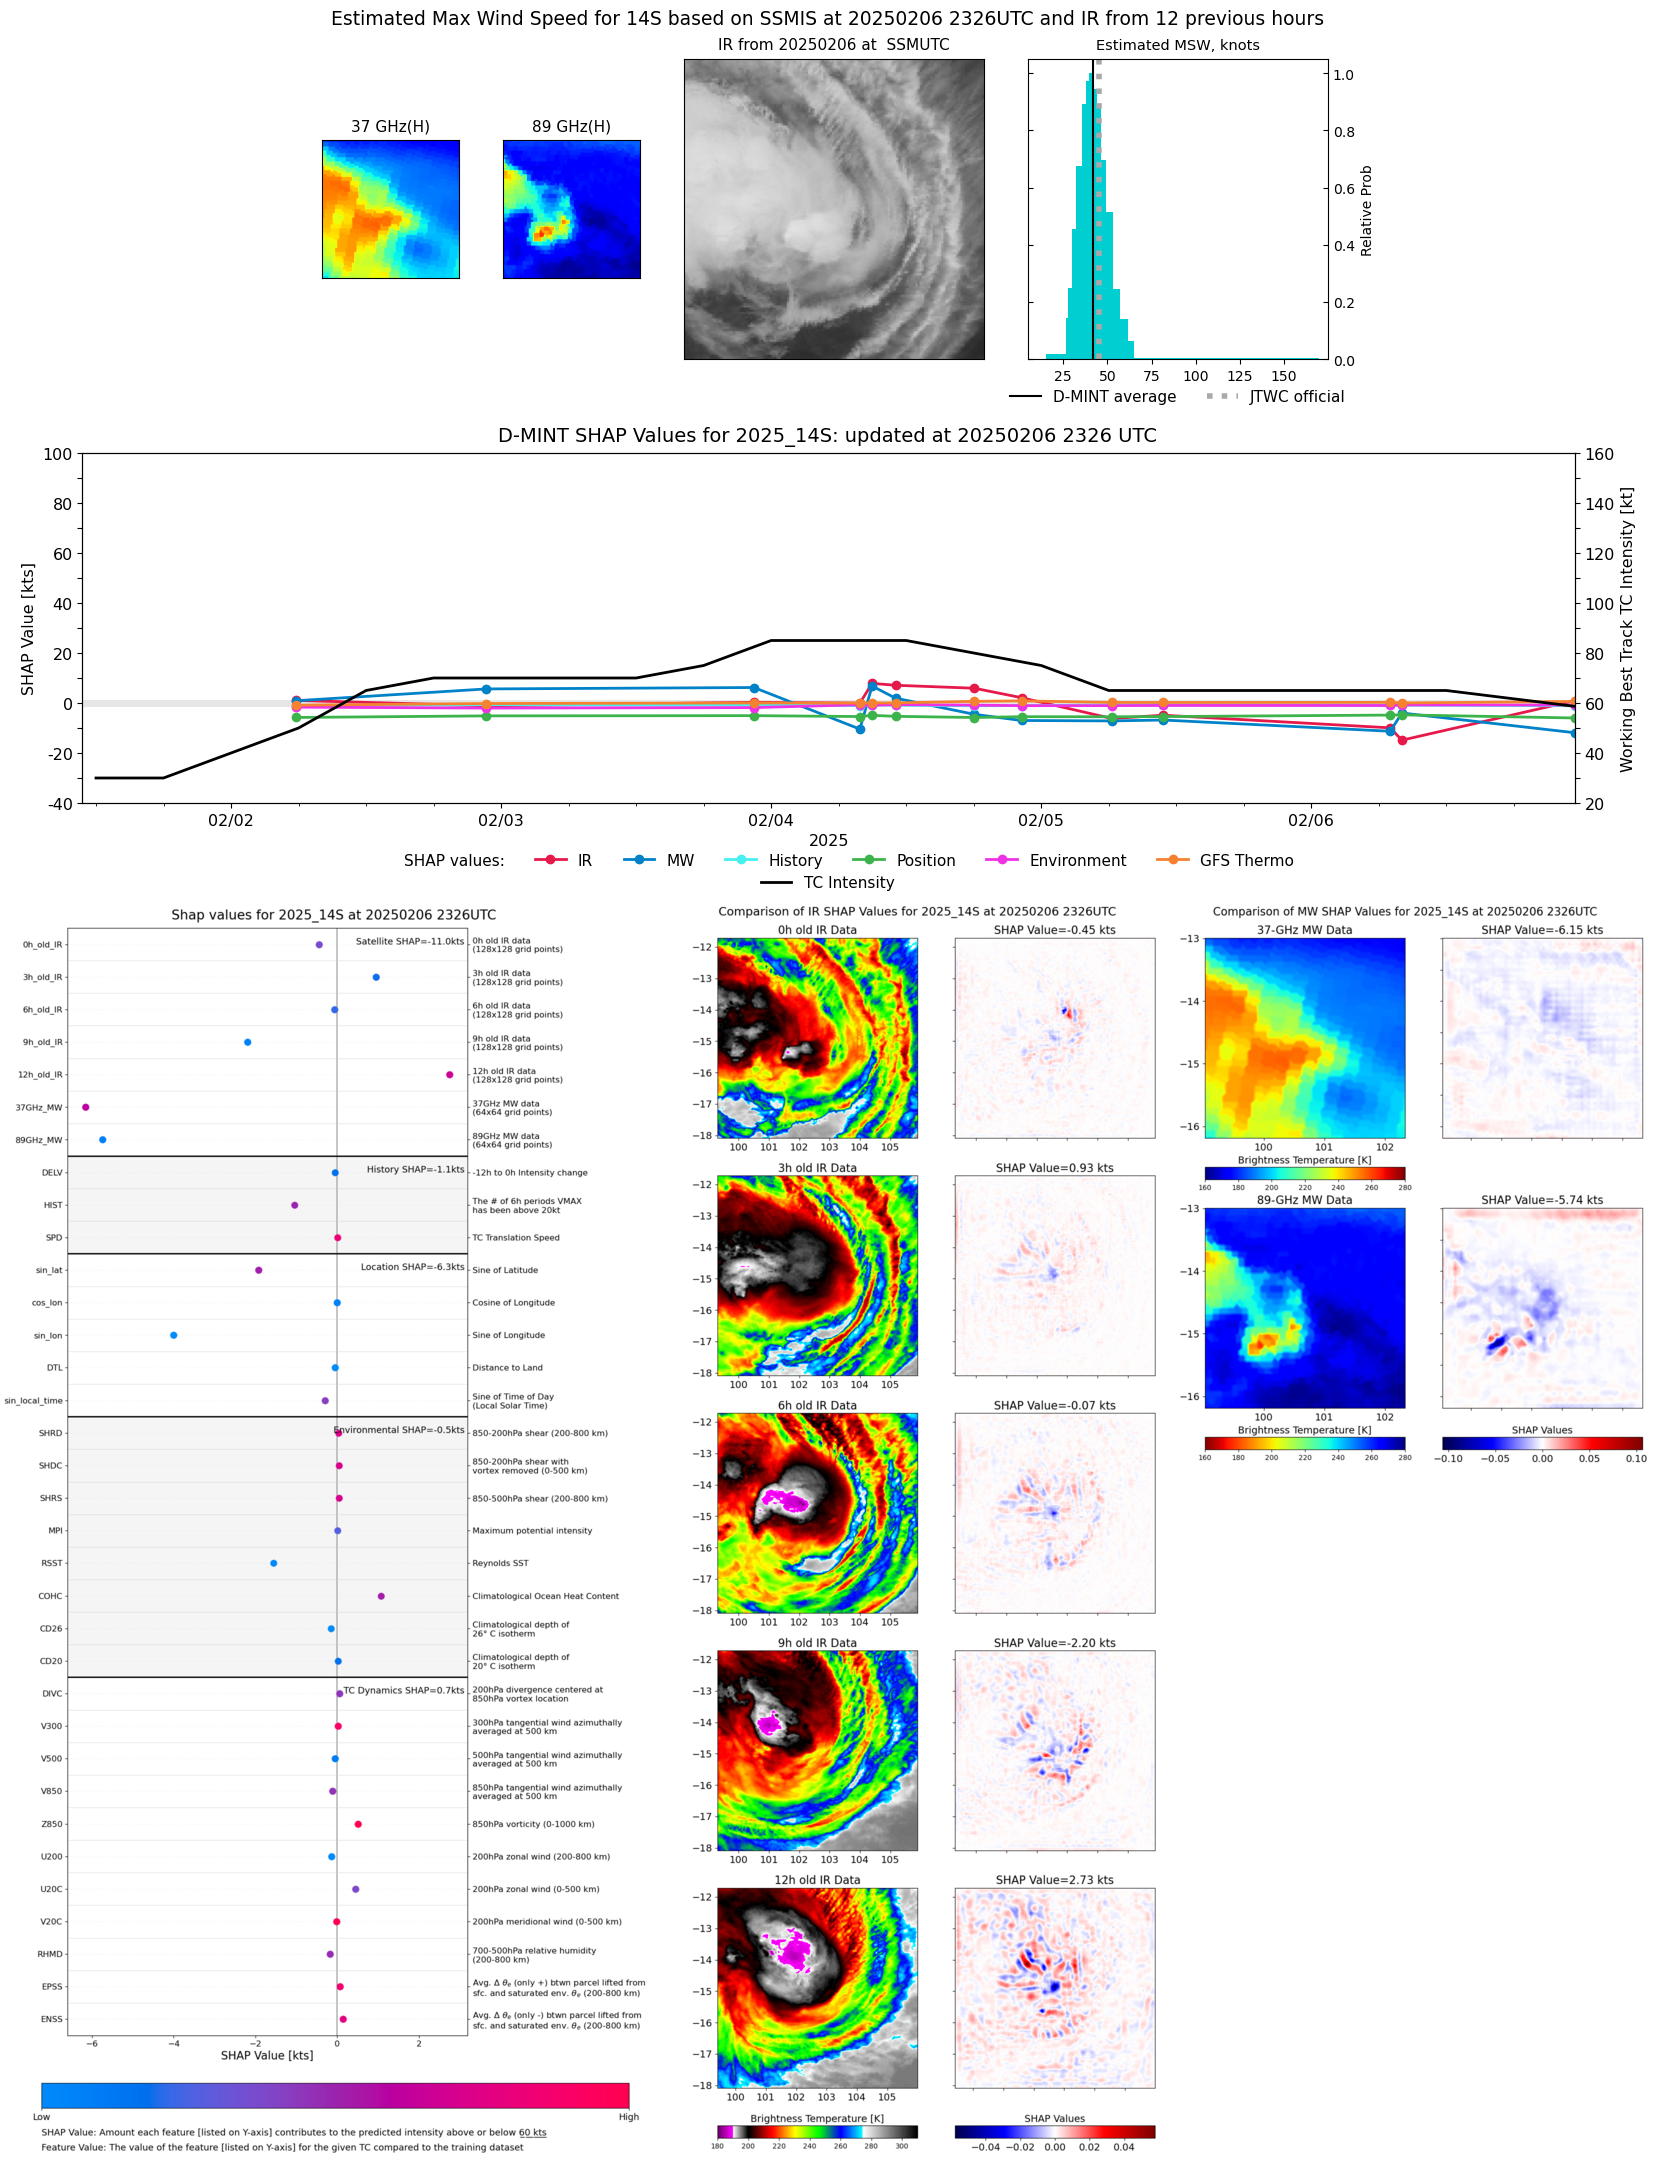 |
| 20250206 | 1837 UTC | ATMS-N20 | 994 hPa | 47 kts | 42 kts | 52 kts | 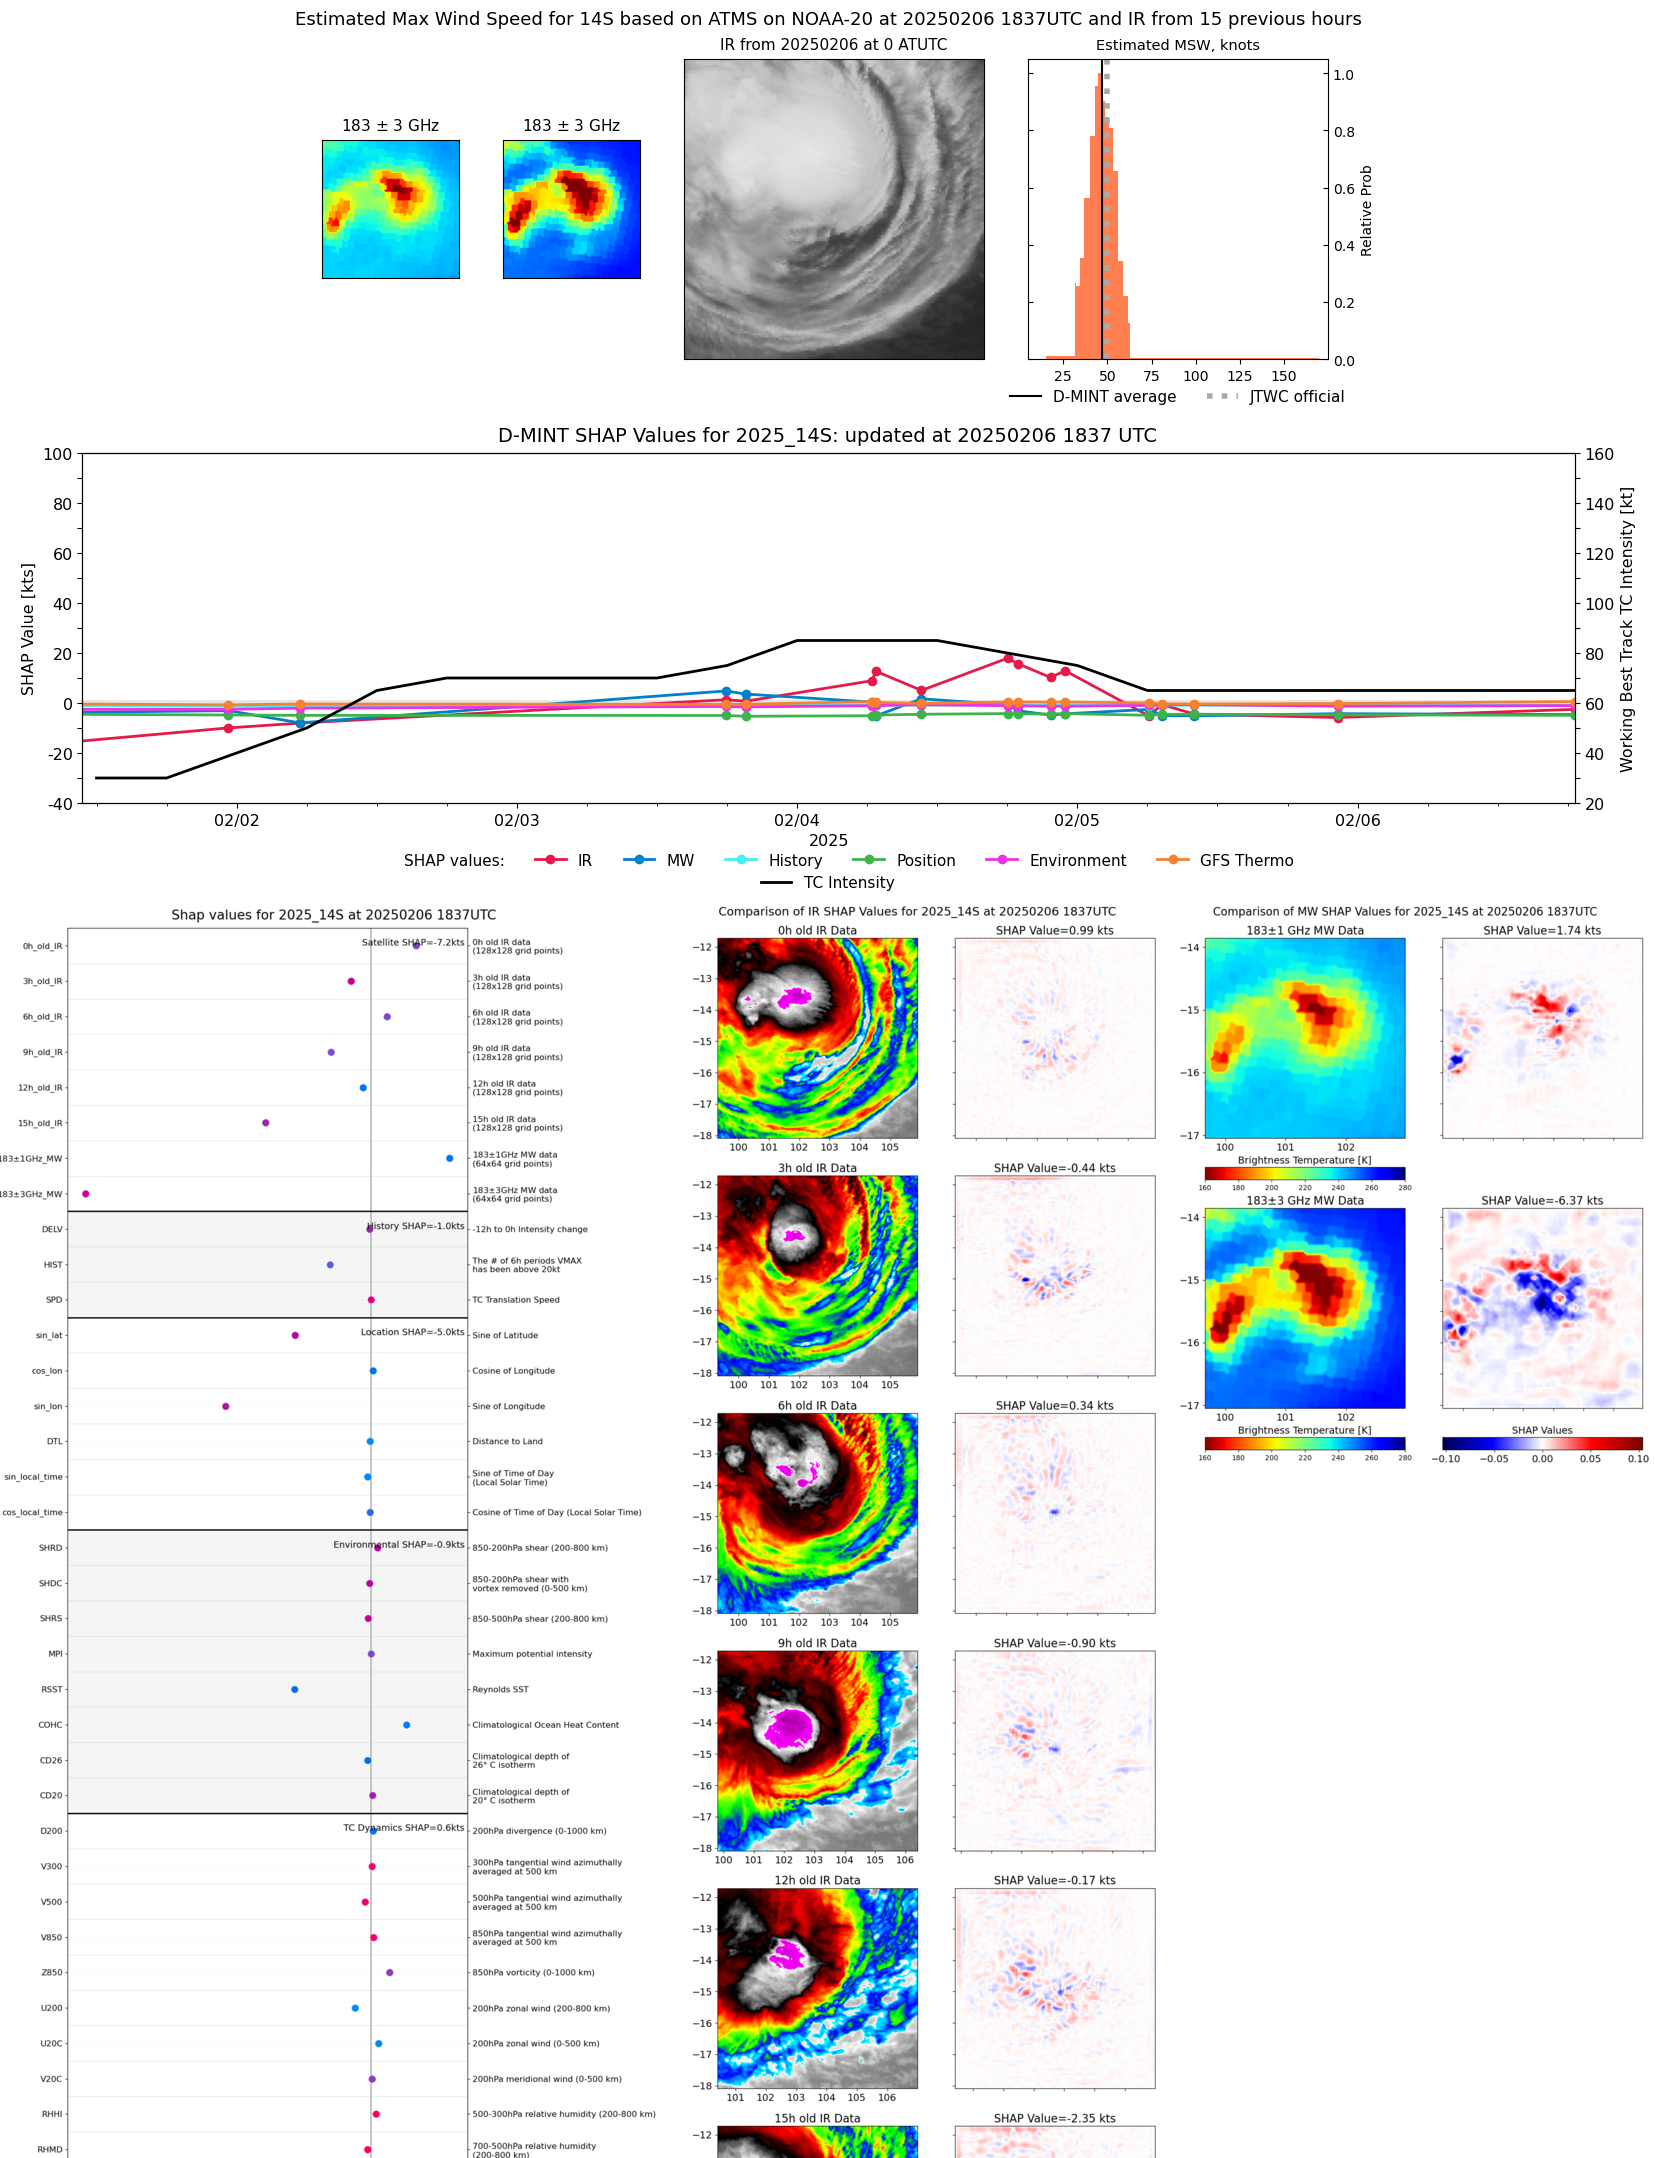 |
| 20250206 | 1113 UTC | SSMISF16 | 995 hPa | 37 kts | 32 kts | 43 kts | 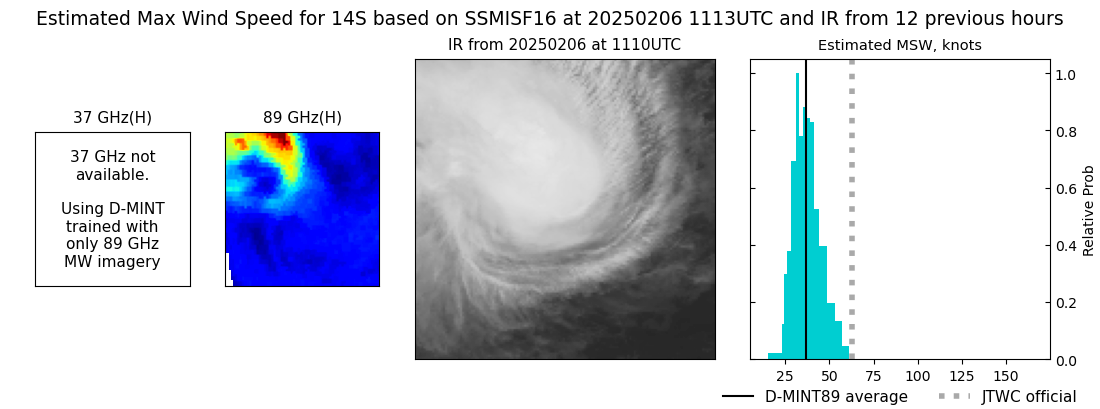 |
| 20250206 | 0803 UTC | GMI | 995 hPa | 35 kts | 31 kts | 39 kts | 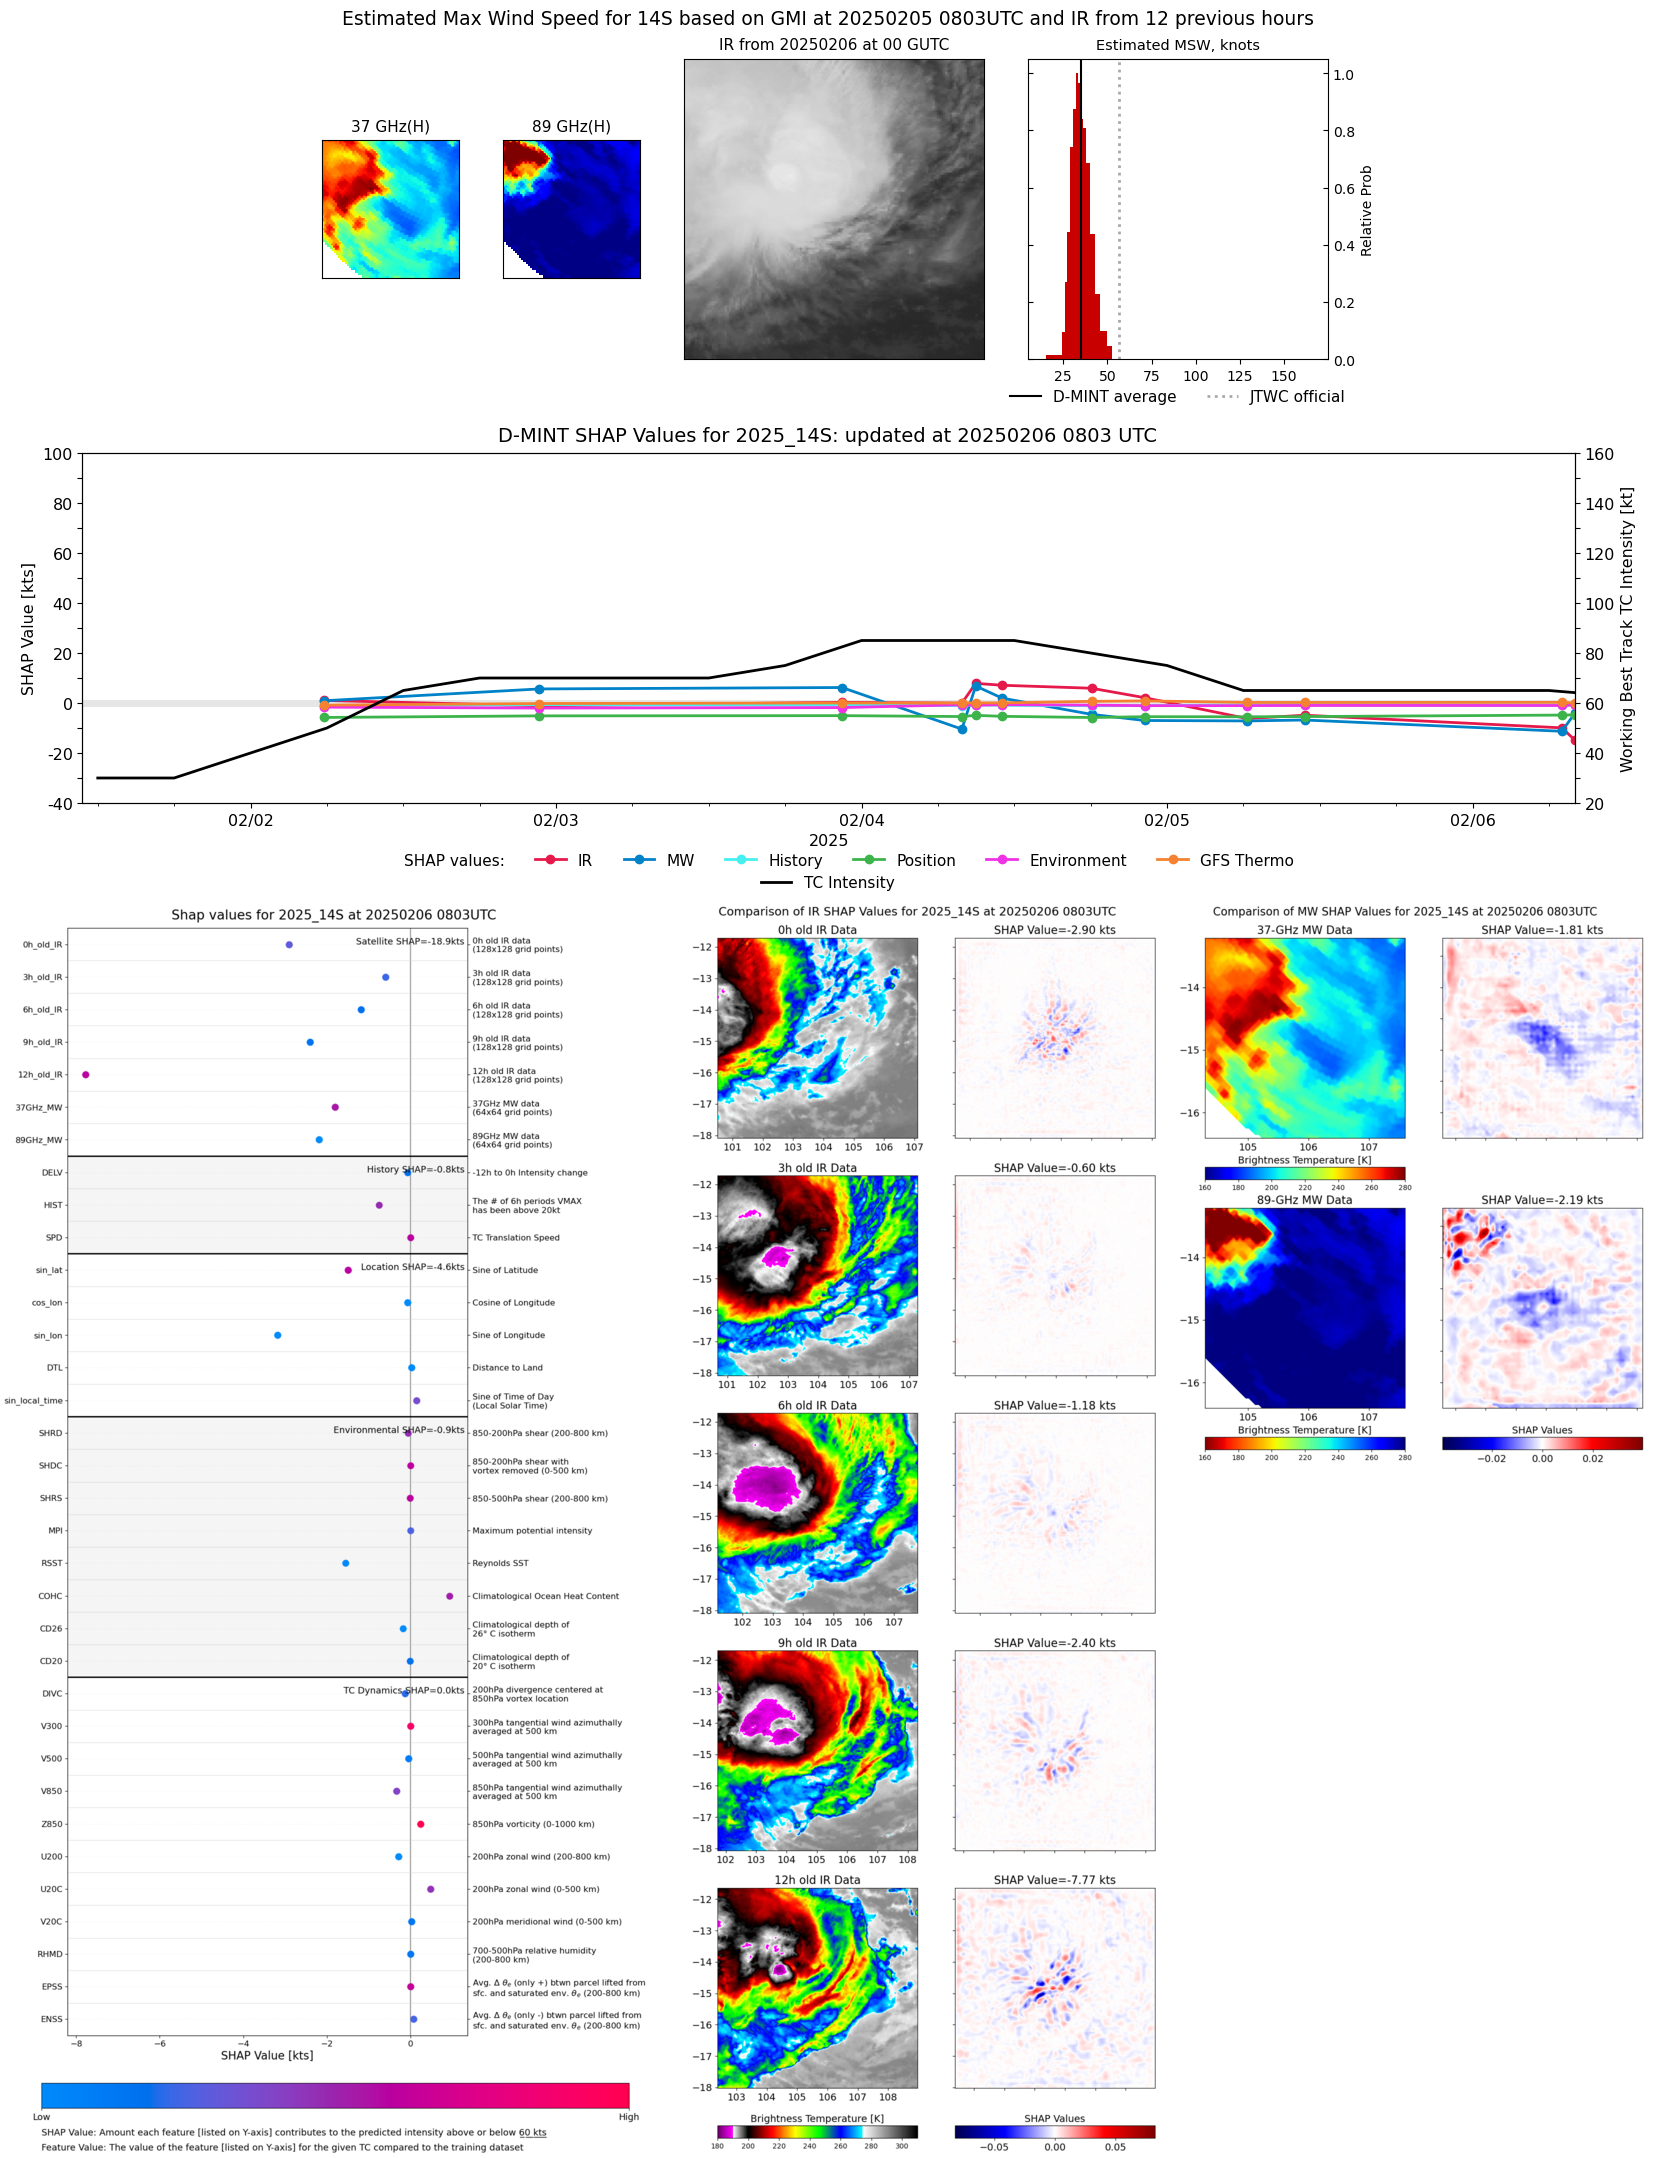 |
| 20250206 | 0701 UTC | AMSR2 | 999 hPa | 32 kts | 29 kts | 36 kts | 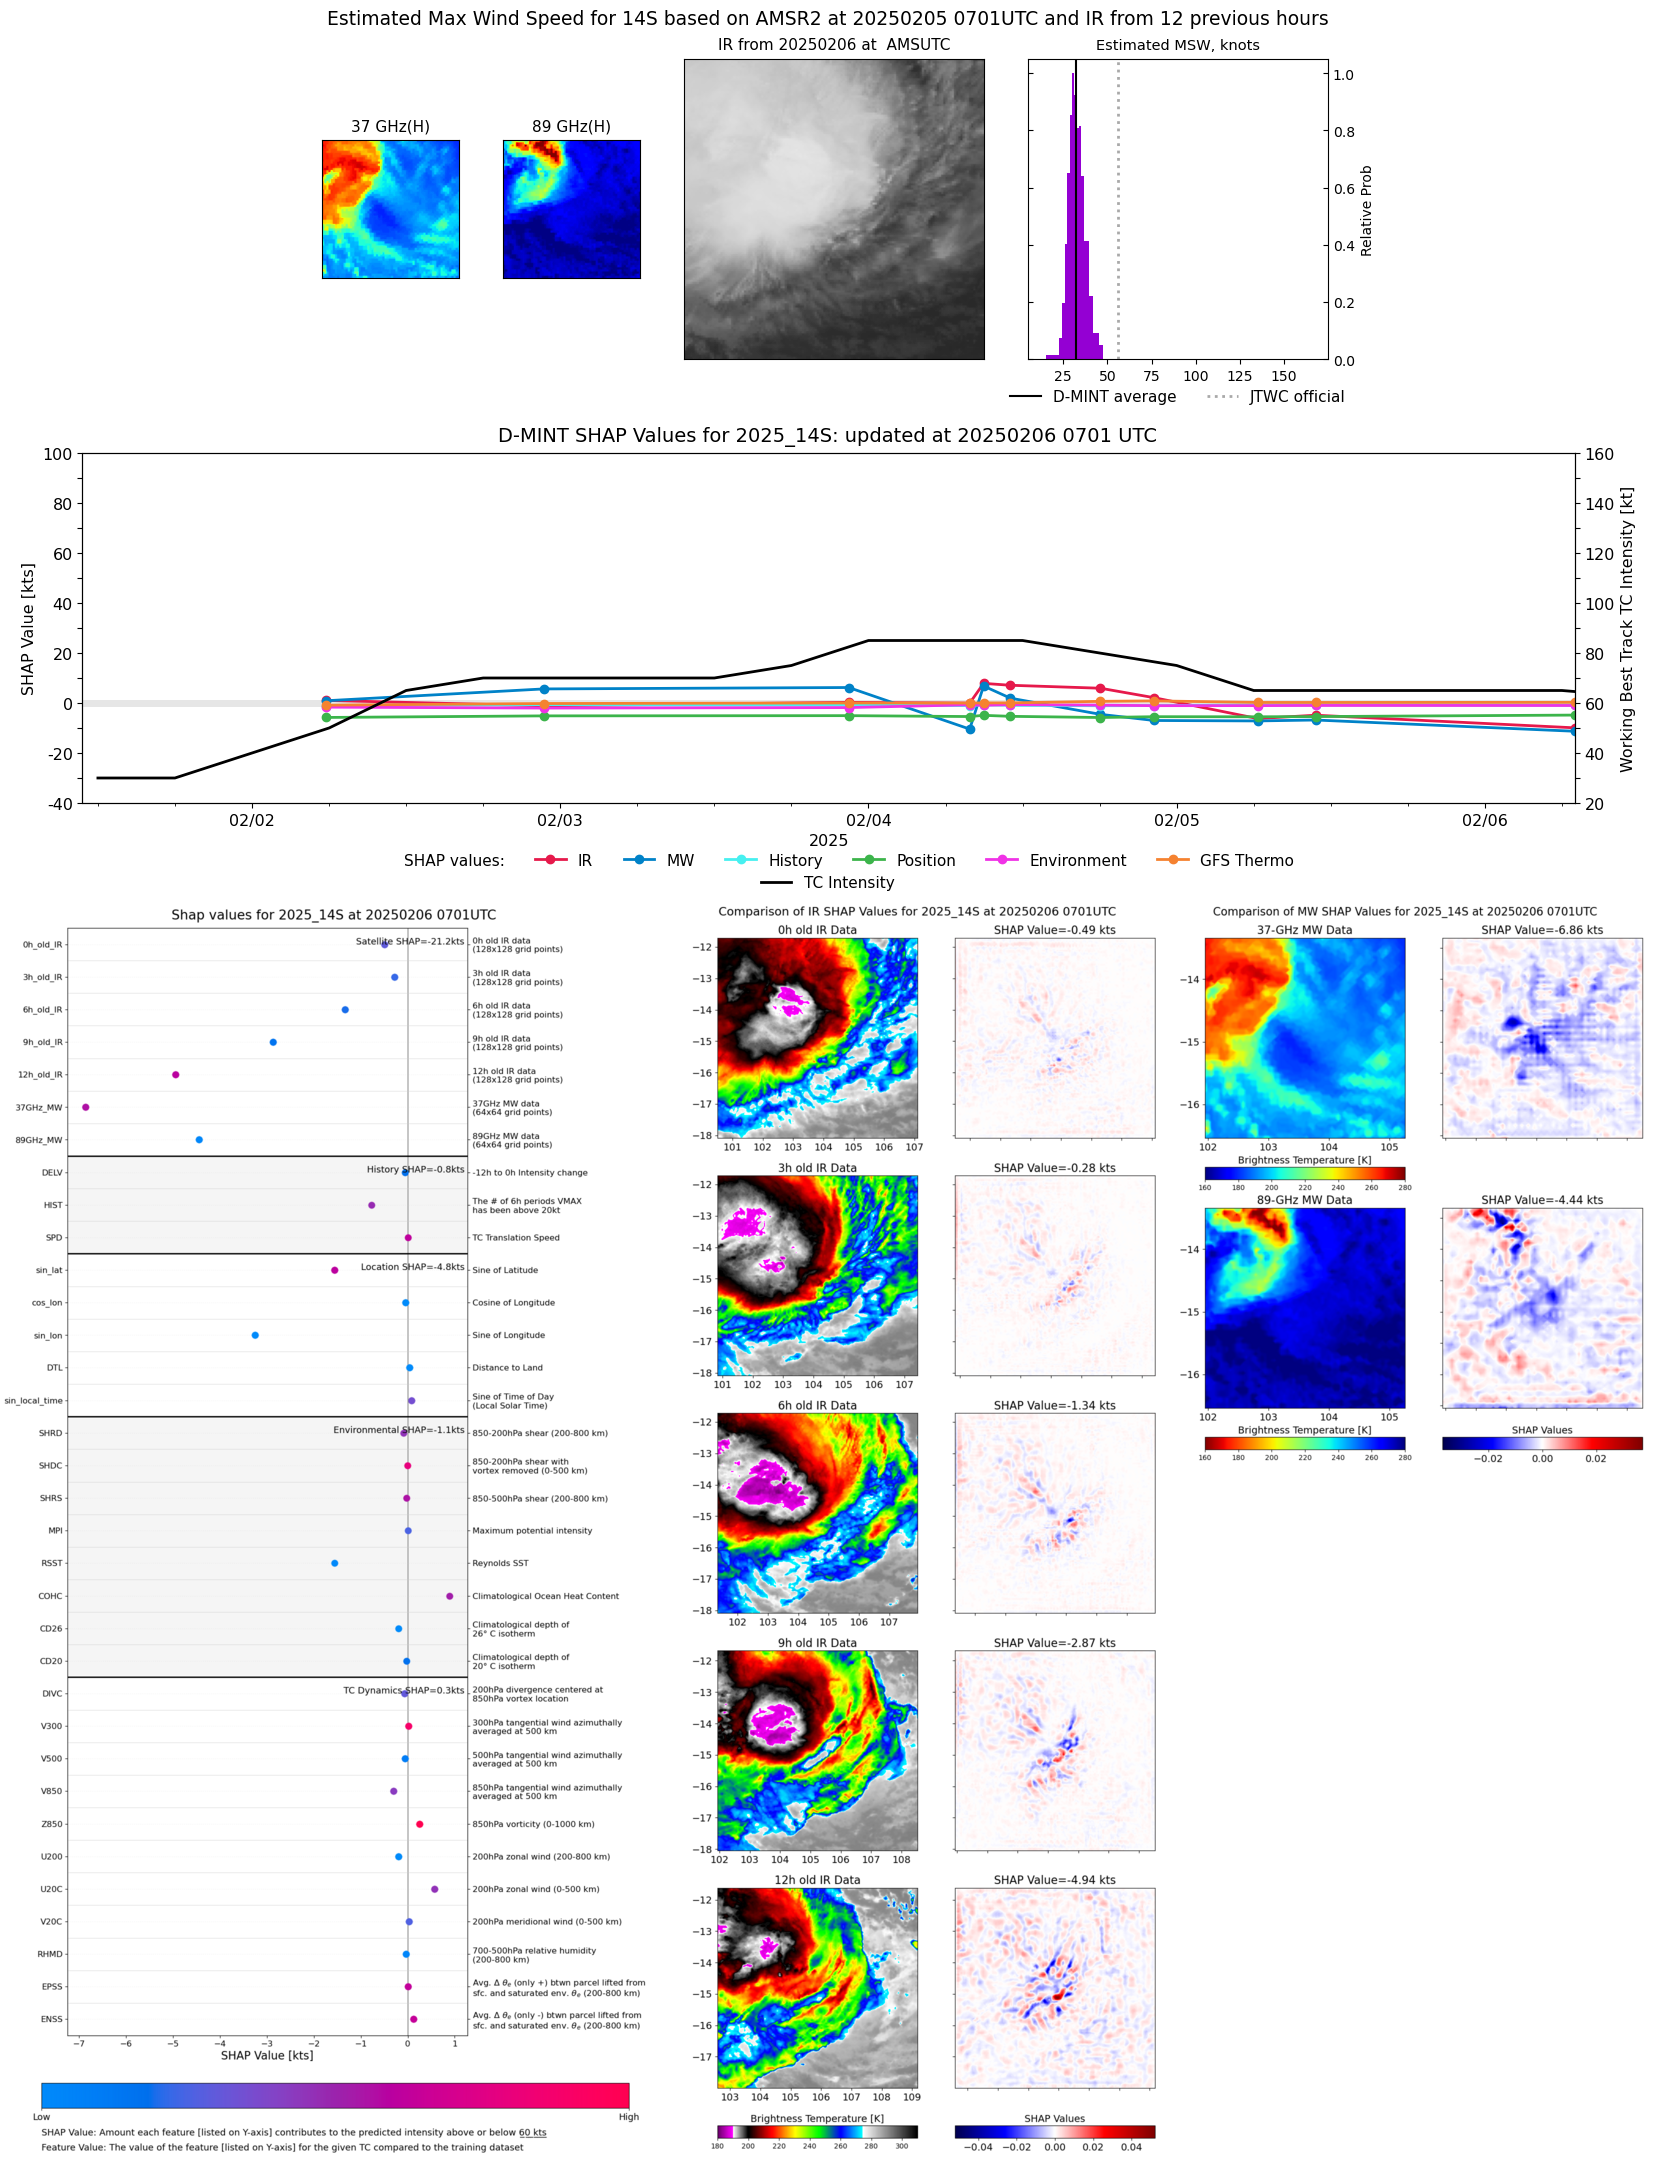 |
| 20250206 | 0614 UTC | ATMS-N20 | NaN hPa | 42 kts | 37 kts | 47 kts | 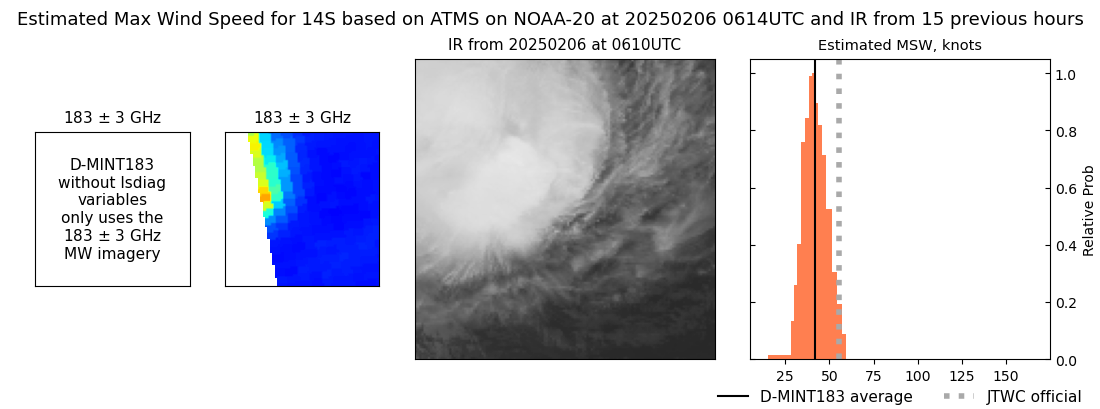 |
| 20250205 | 2217 UTC | TROPICS05 | 994 hPa | 43 kts | 39 kts | 48 kts | 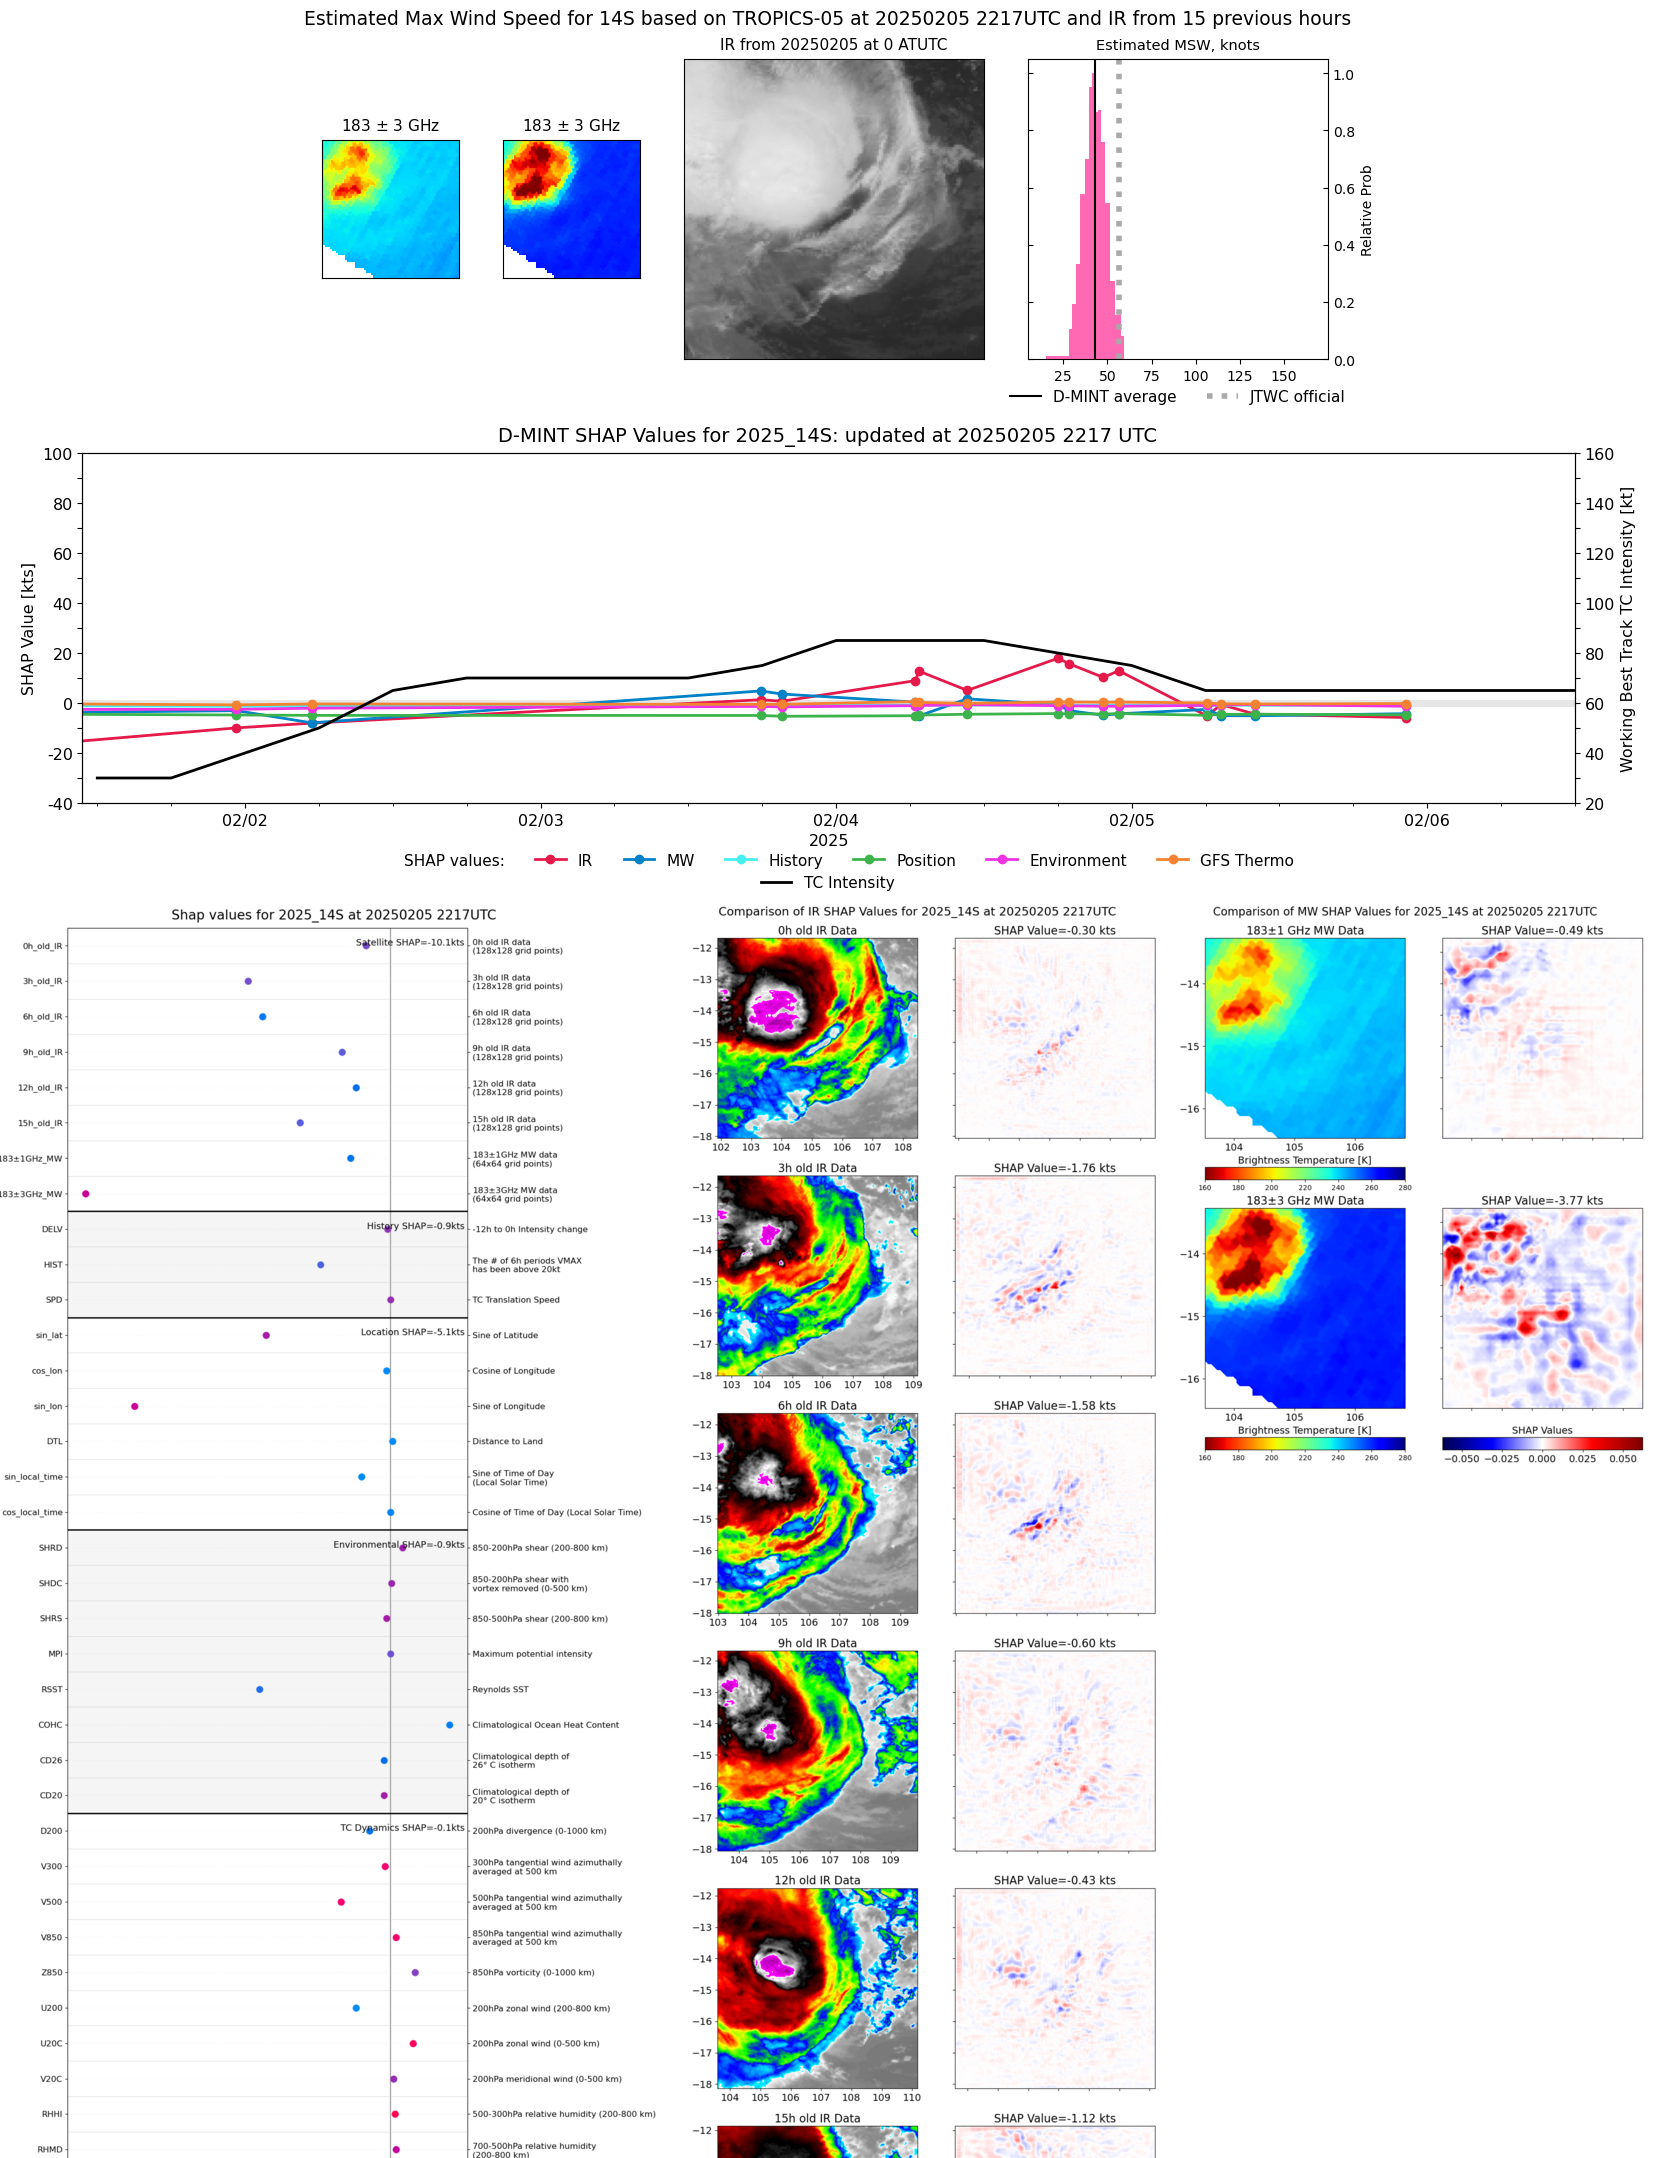 |
| 20250205 | 1848 UTC | AMSR2 | 993 hPa | 46 kts | 41 kts | 51 kts | 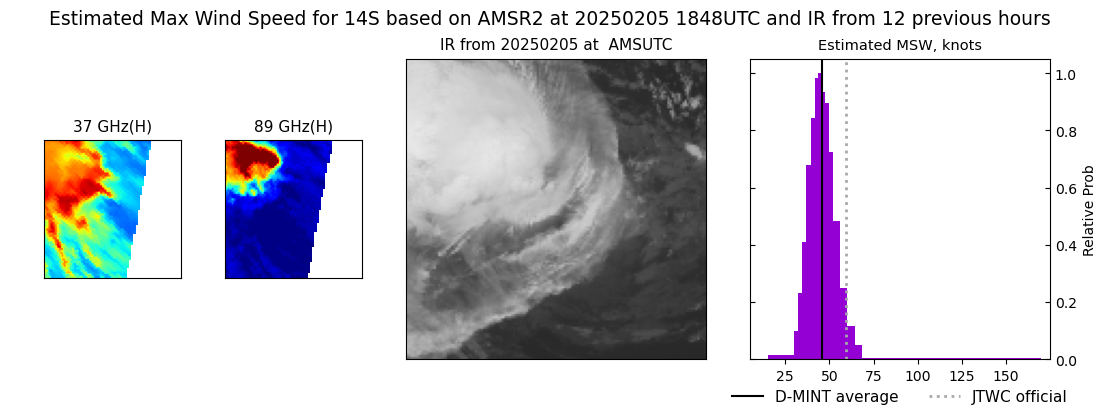 |
| 20250205 | 1838 UTC | GMI | NaN hPa | 45 kts | 39 kts | 51 kts | 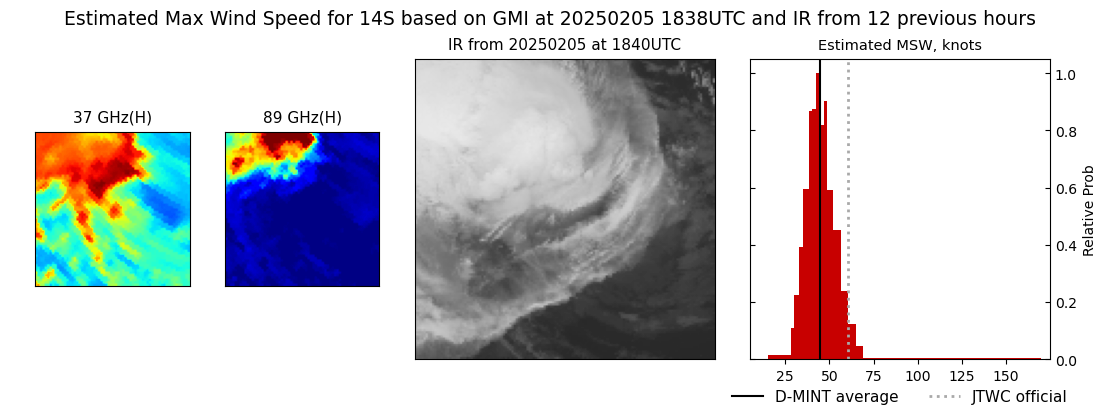 |
| 20250205 | 1125 UTC | SSMISF16 | 992 hPa | 42 kts | 37 kts | 48 kts |  |
| 20250205 | 1049 UTC | SSMISF17 | 992 hPa | 42 kts | 37 kts | 47 kts | 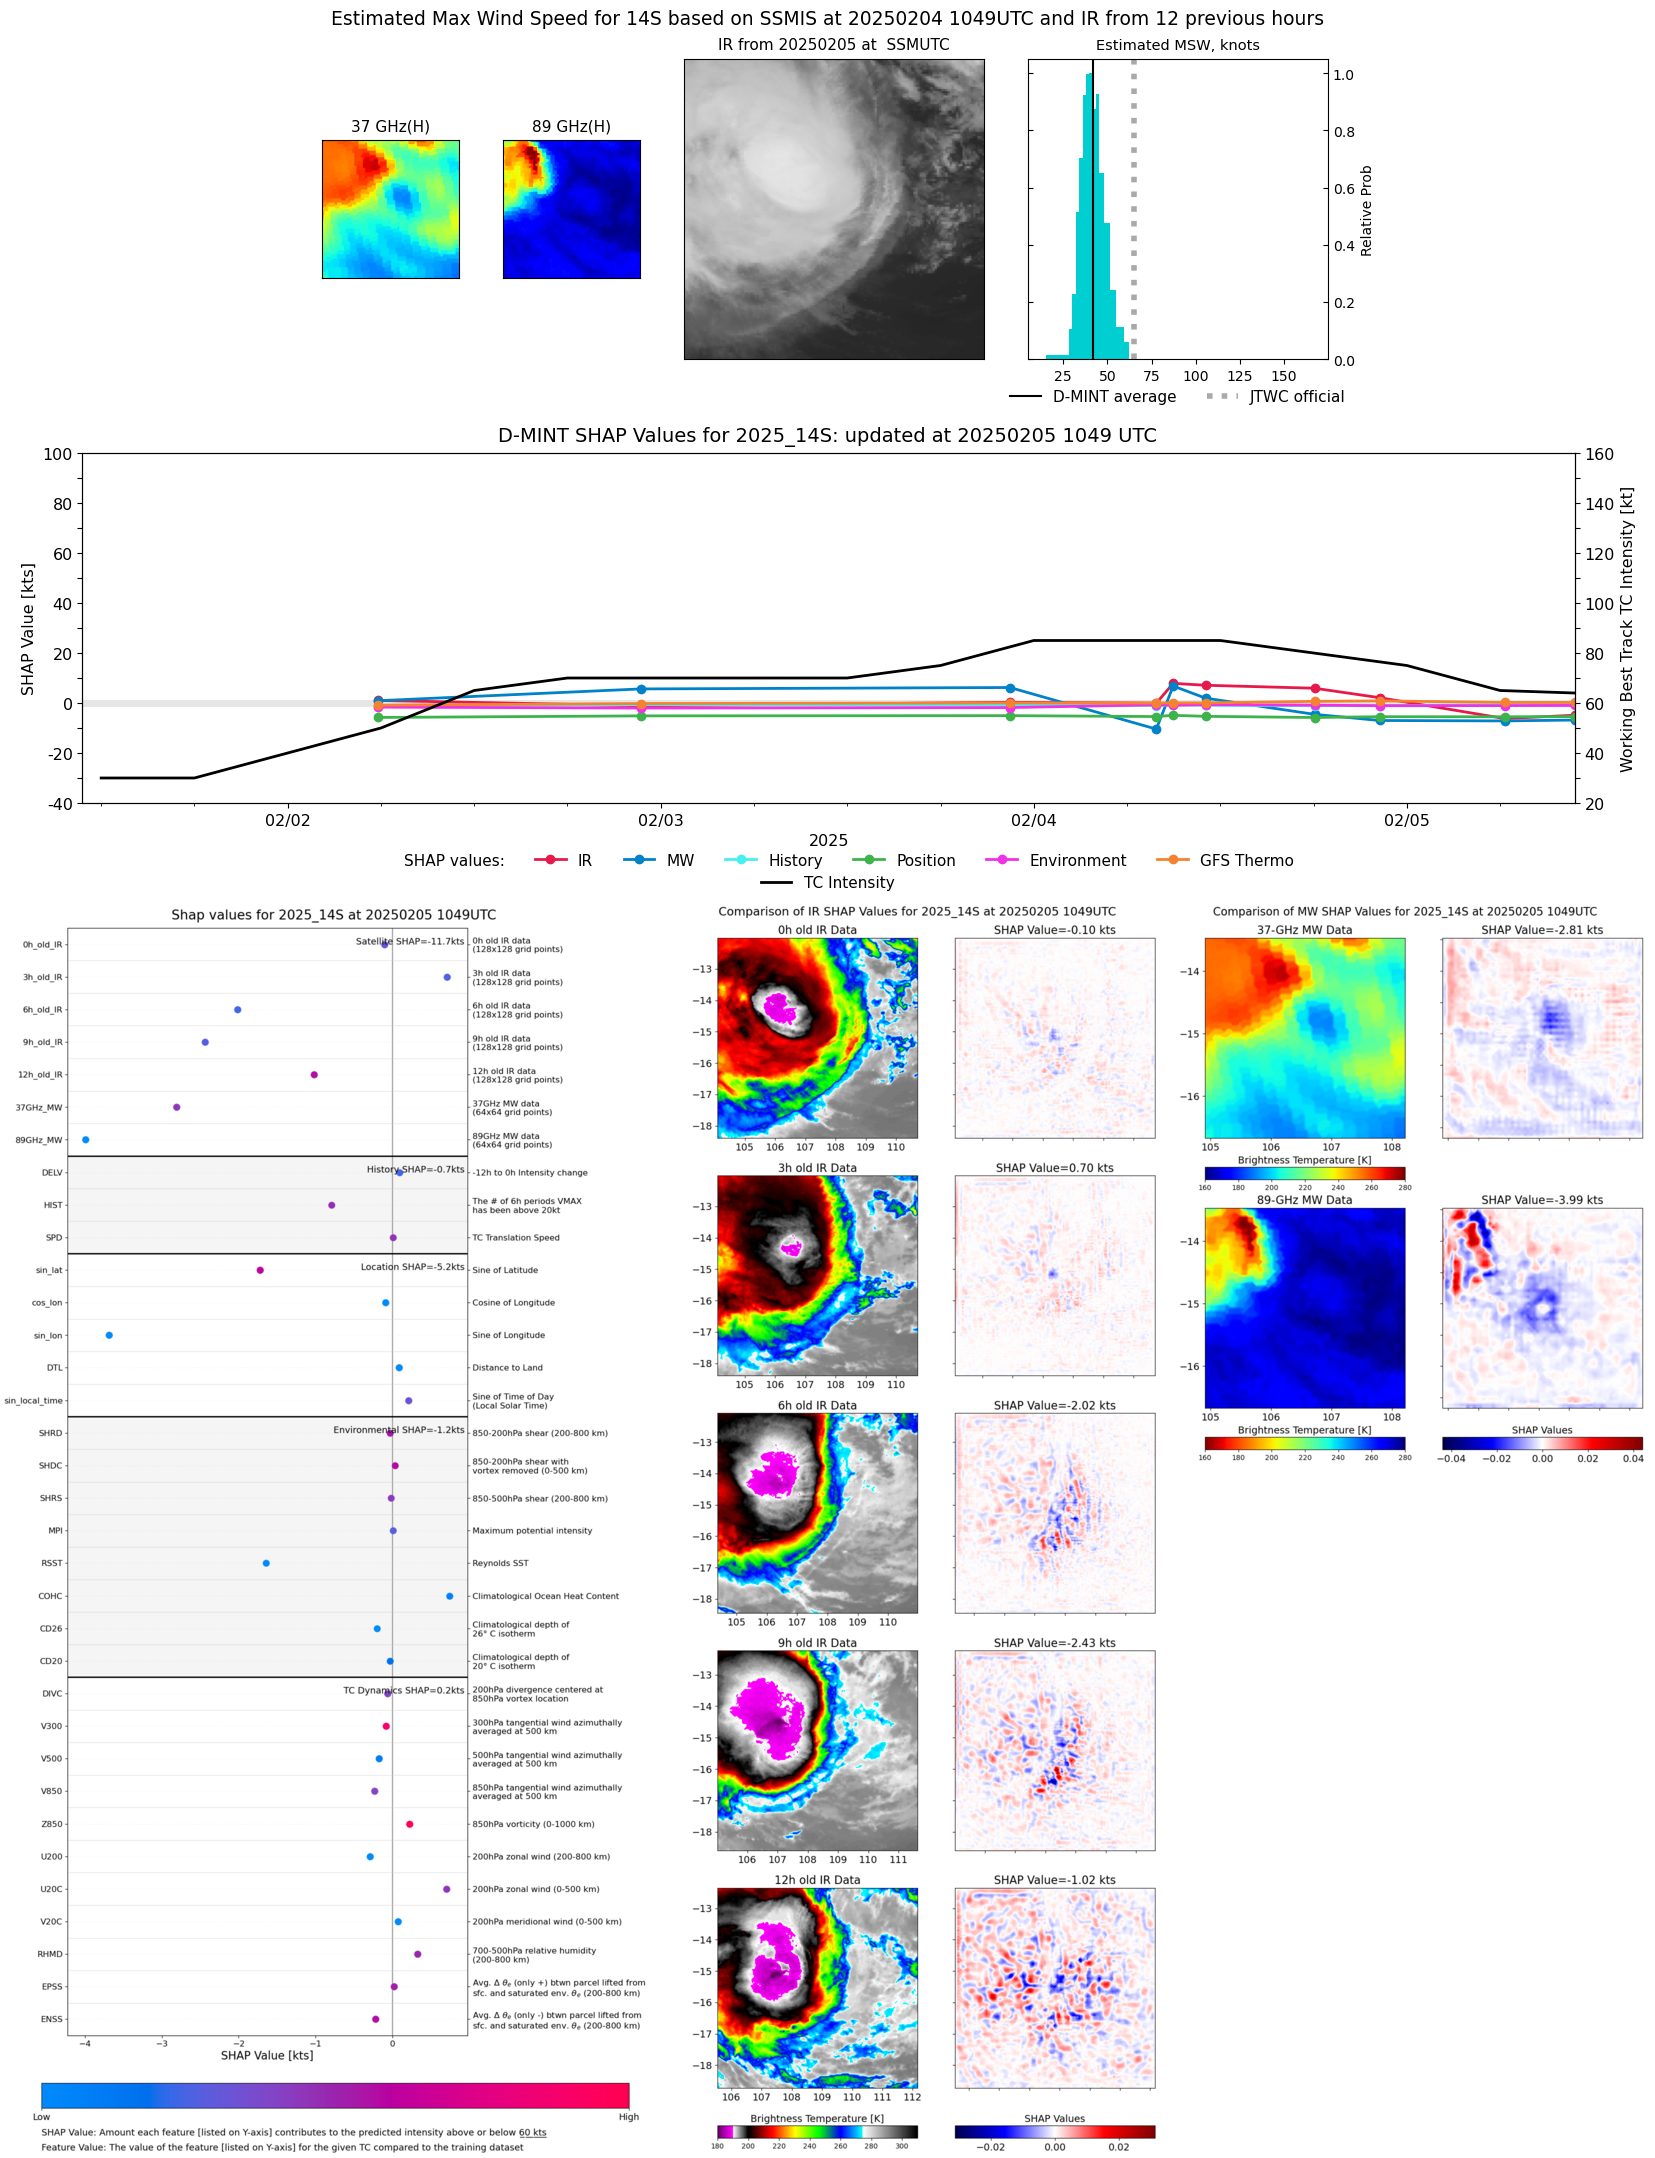 |
| 20250205 | 1000 UTC | TROPICS03 | 992 hPa | 44 kts | 40 kts | 49 kts | 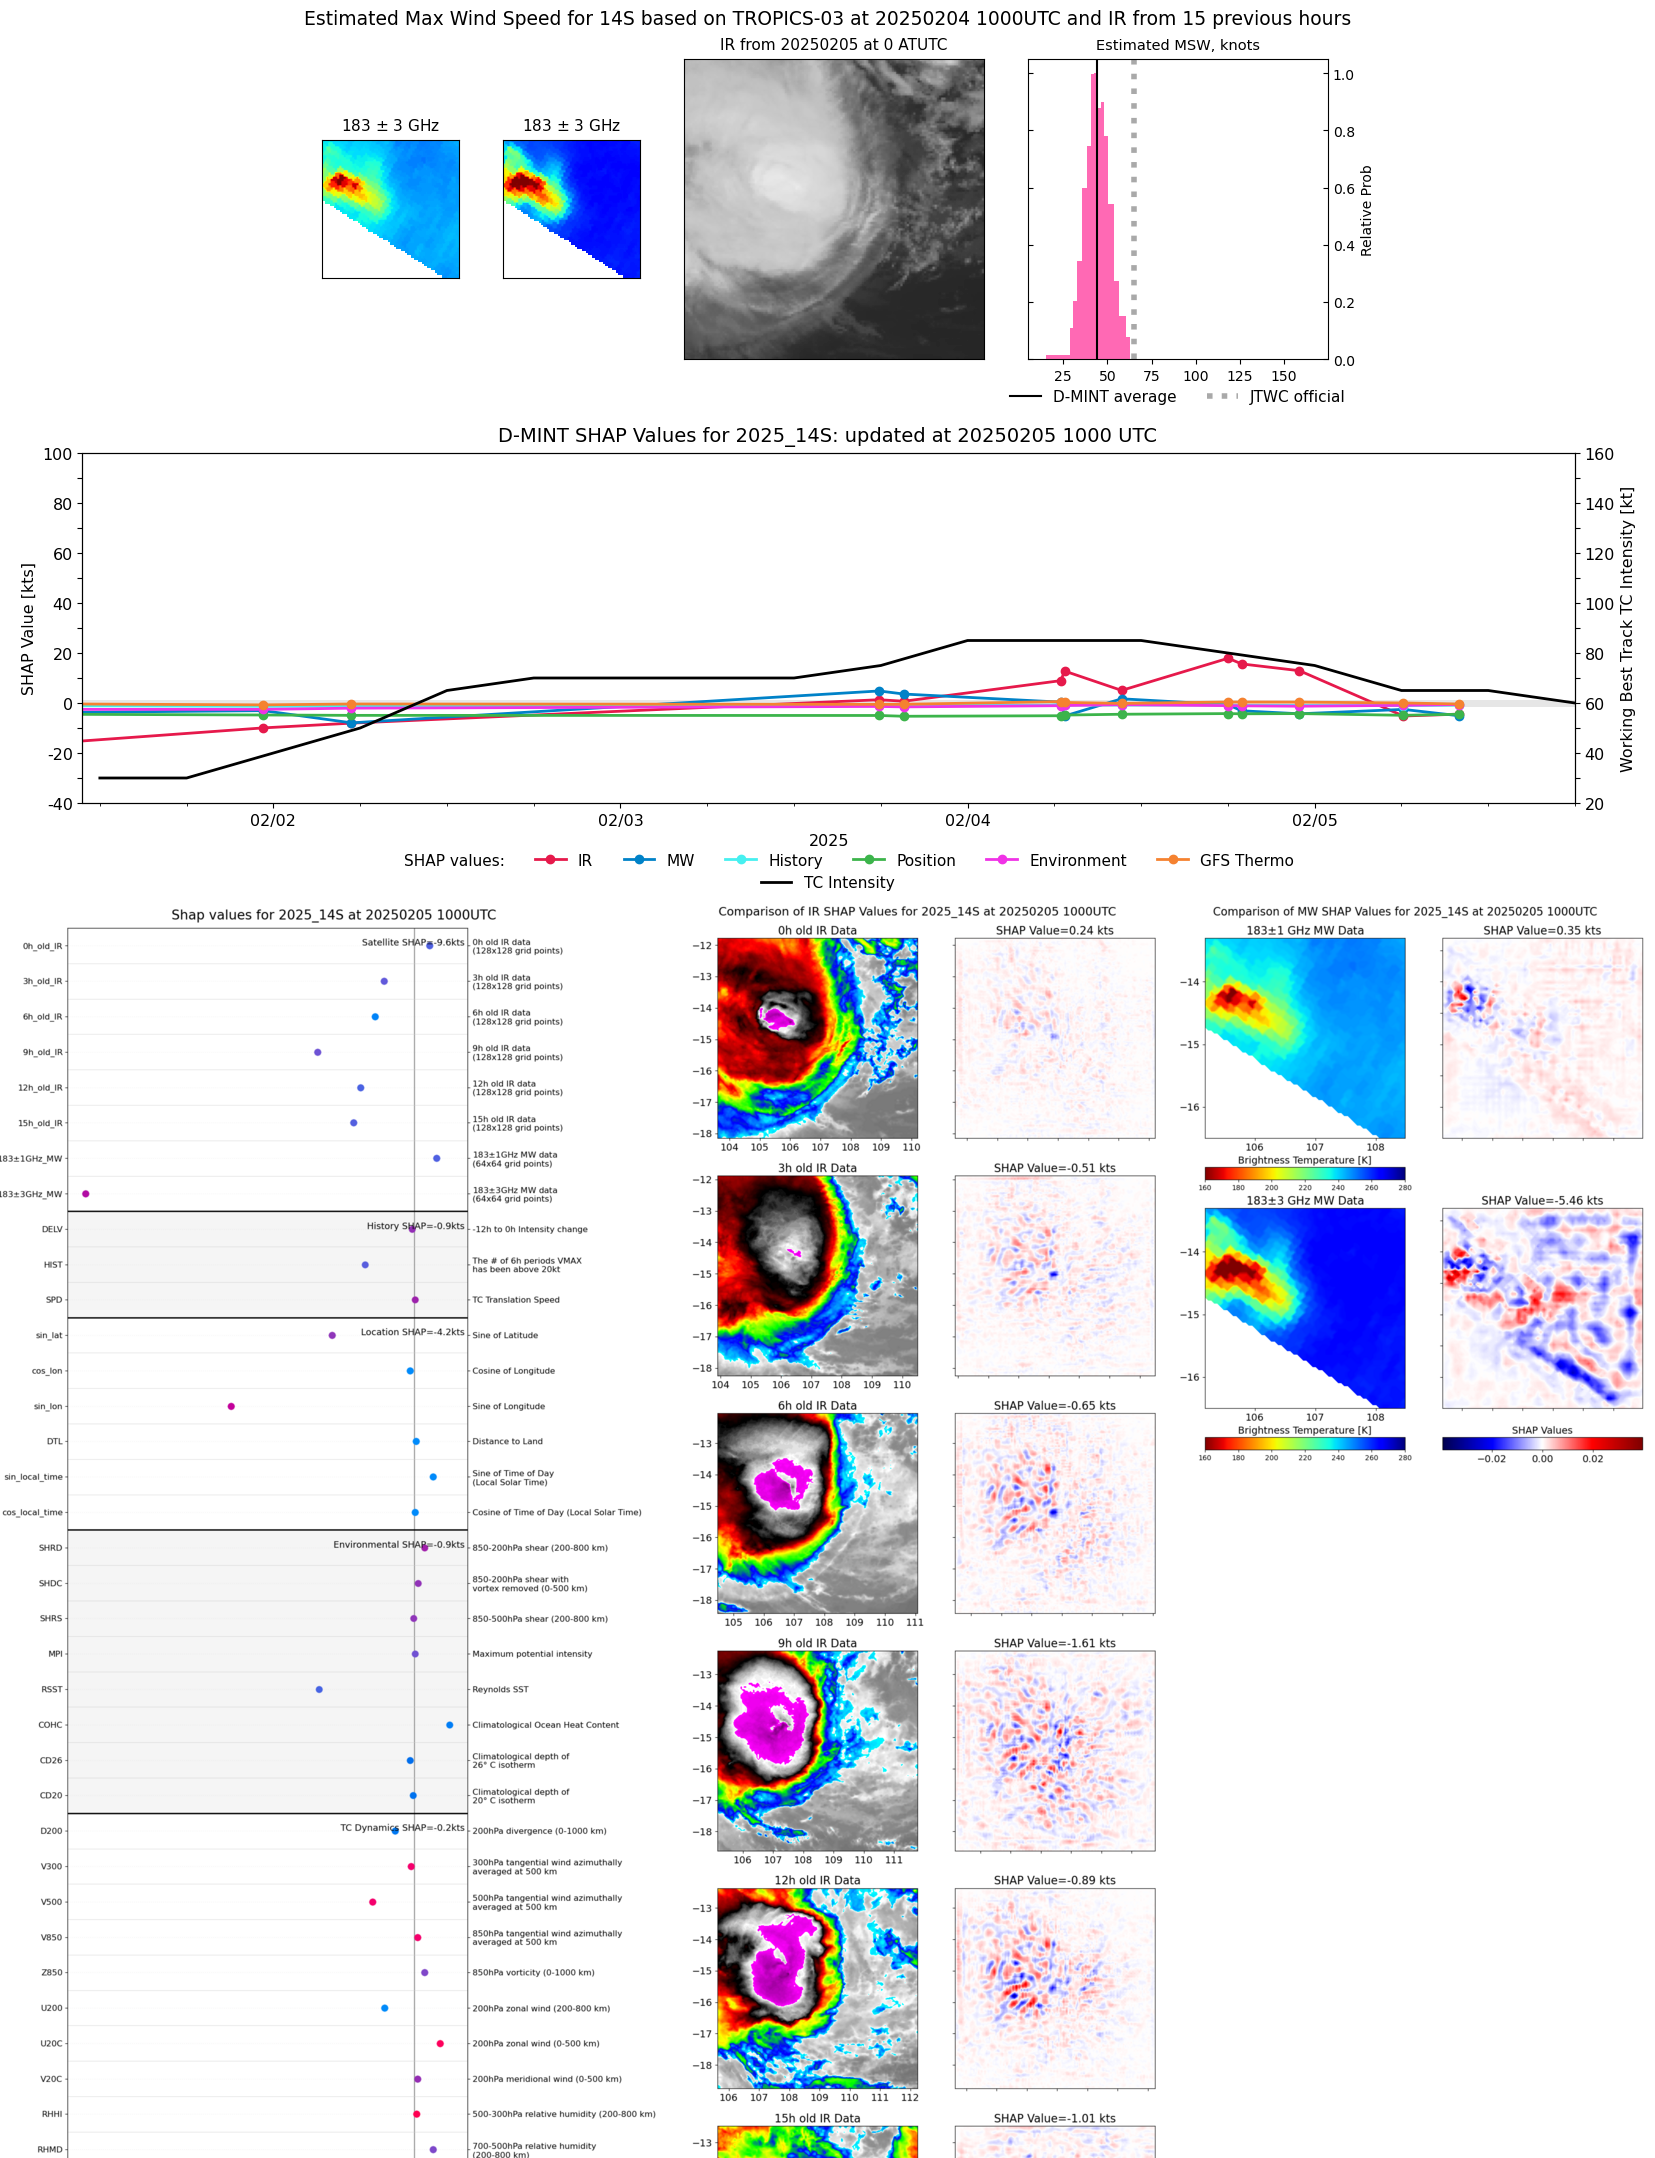 |
| 20250205 | 0844 UTC | SSMISF18 | 991 hPa | 42 kts | 37 kts | 48 kts | 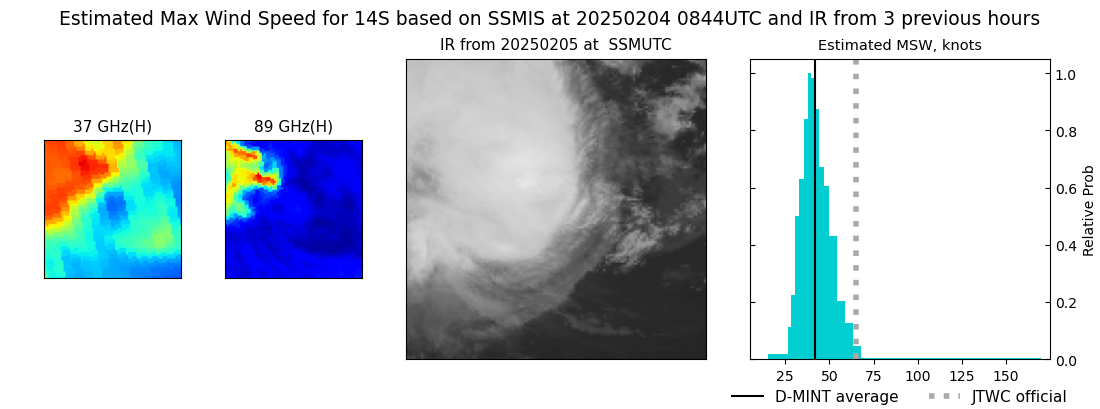 |
| 20250205 | 0715 UTC | TROPICS05 | 990 hPa | 48 kts | 43 kts | 53 kts | 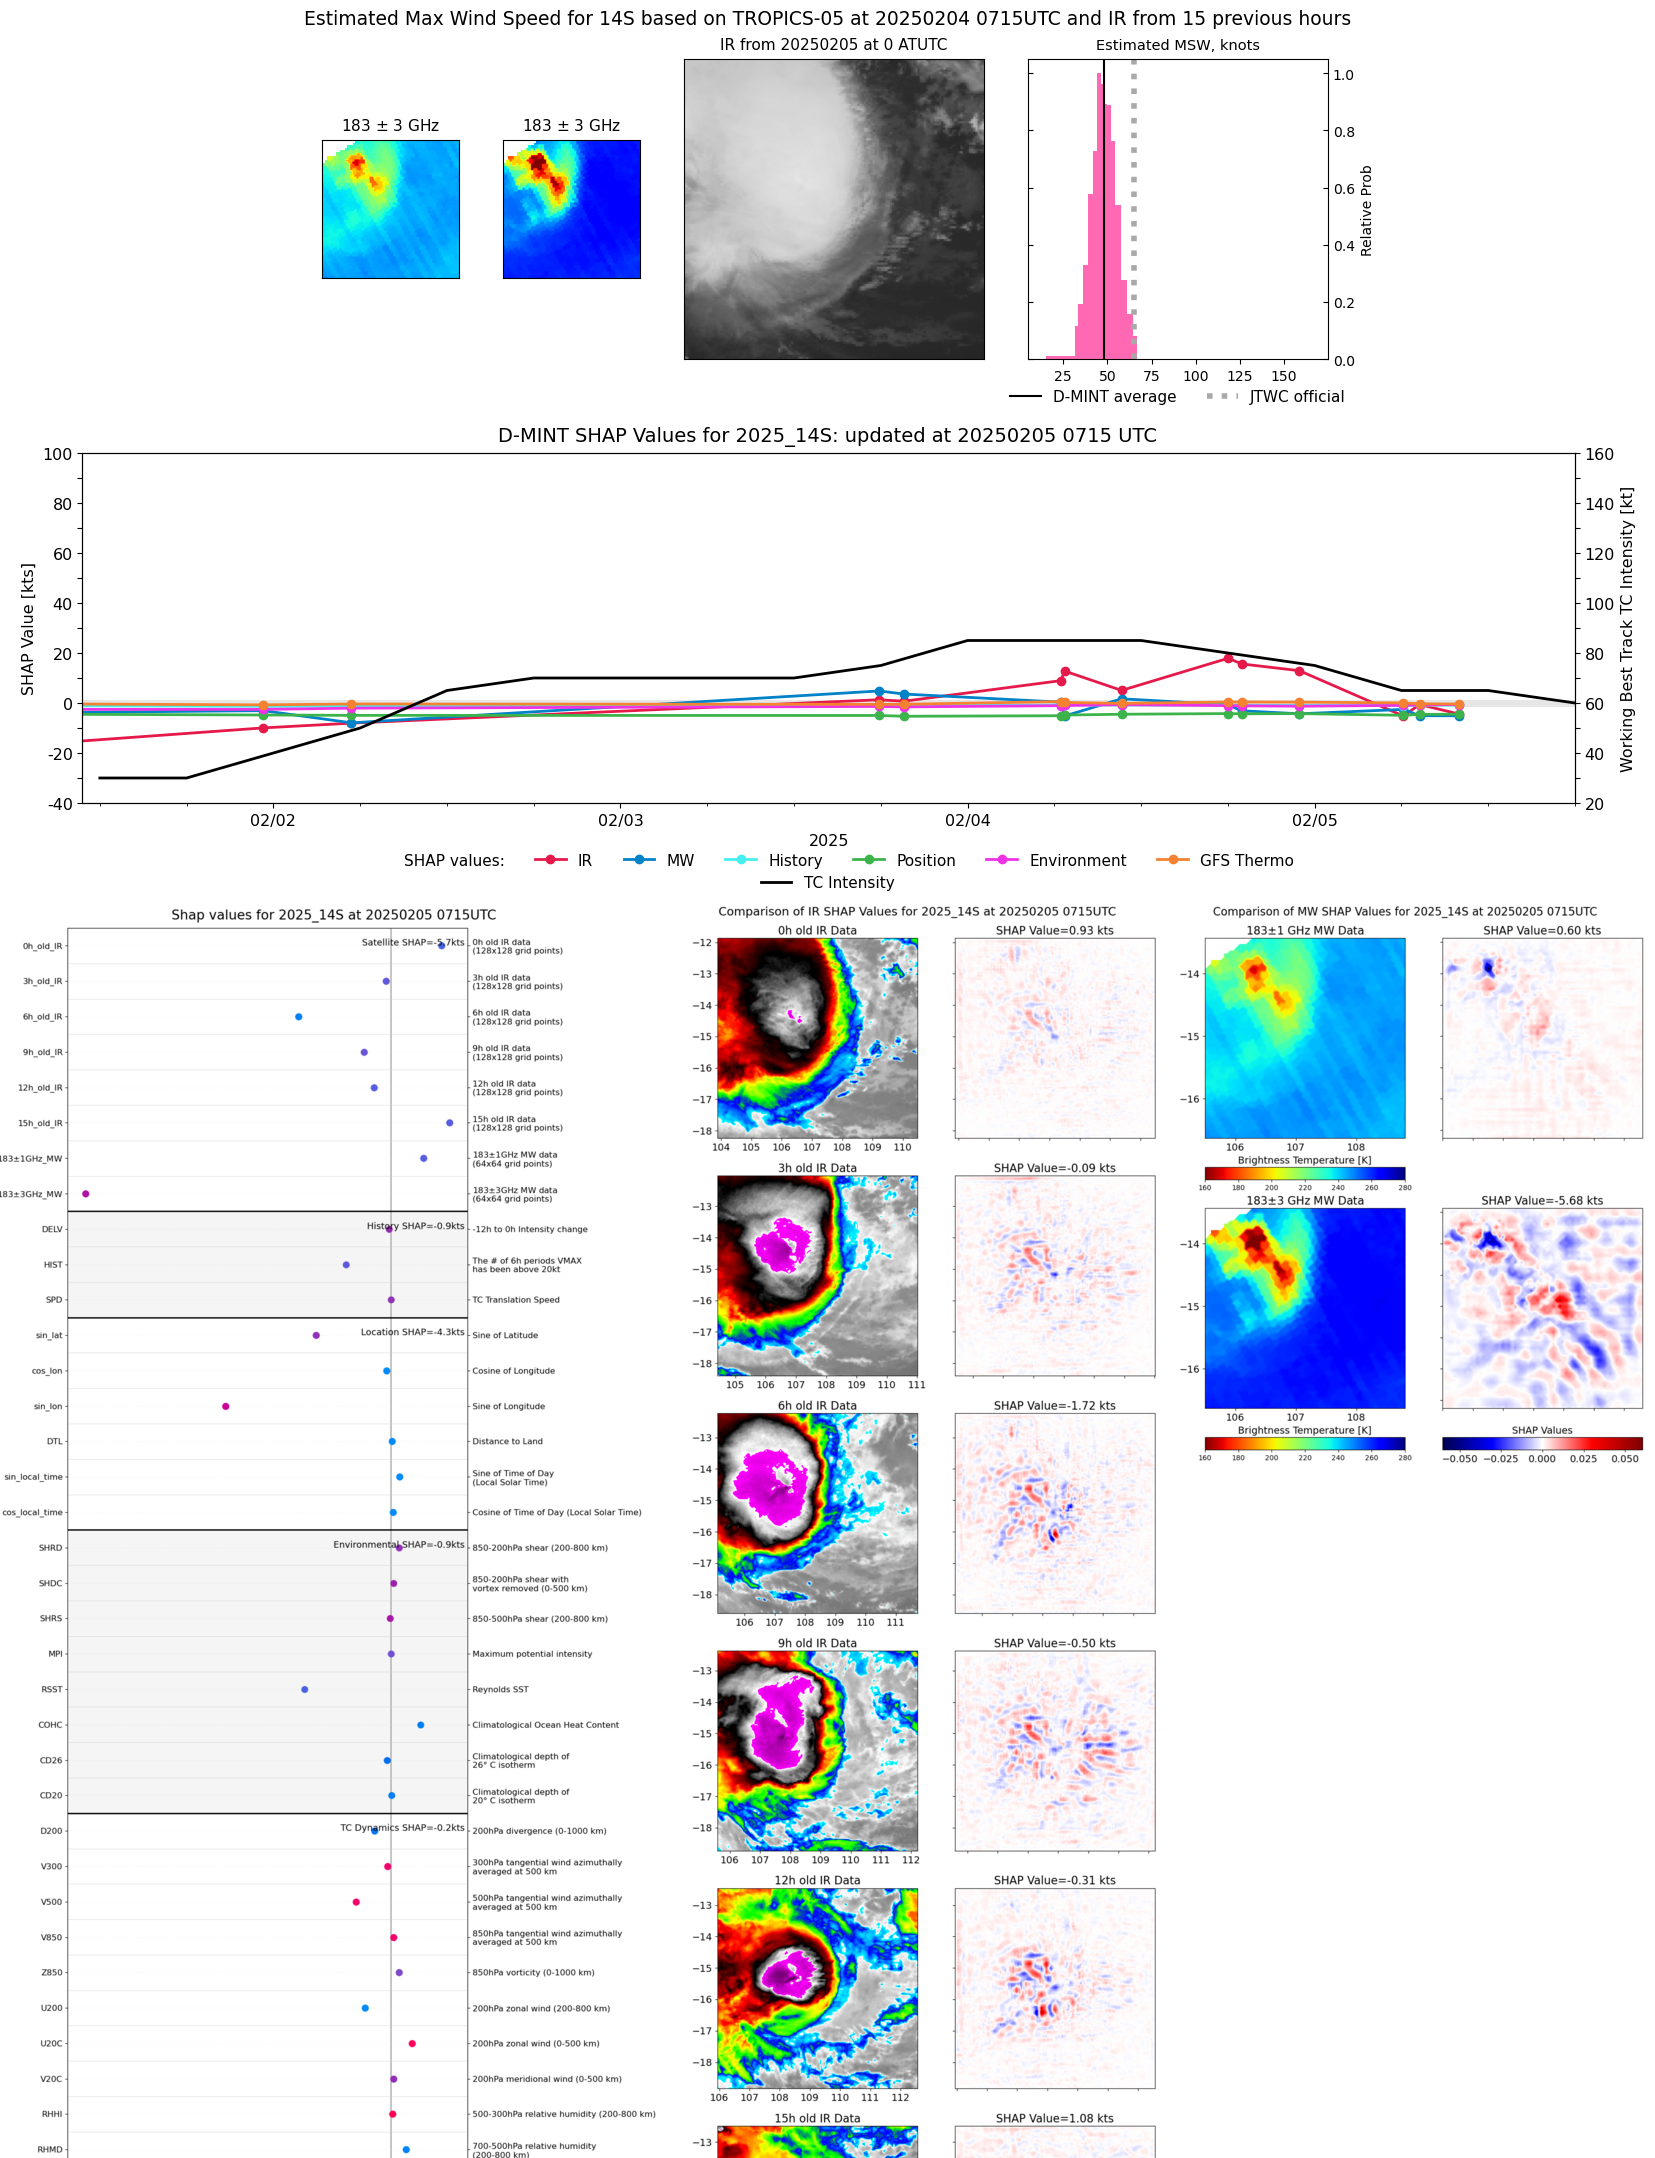 |
| 20250205 | 0618 UTC | AMSR2 | 990 hPa | 40 kts | 35 kts | 45 kts | 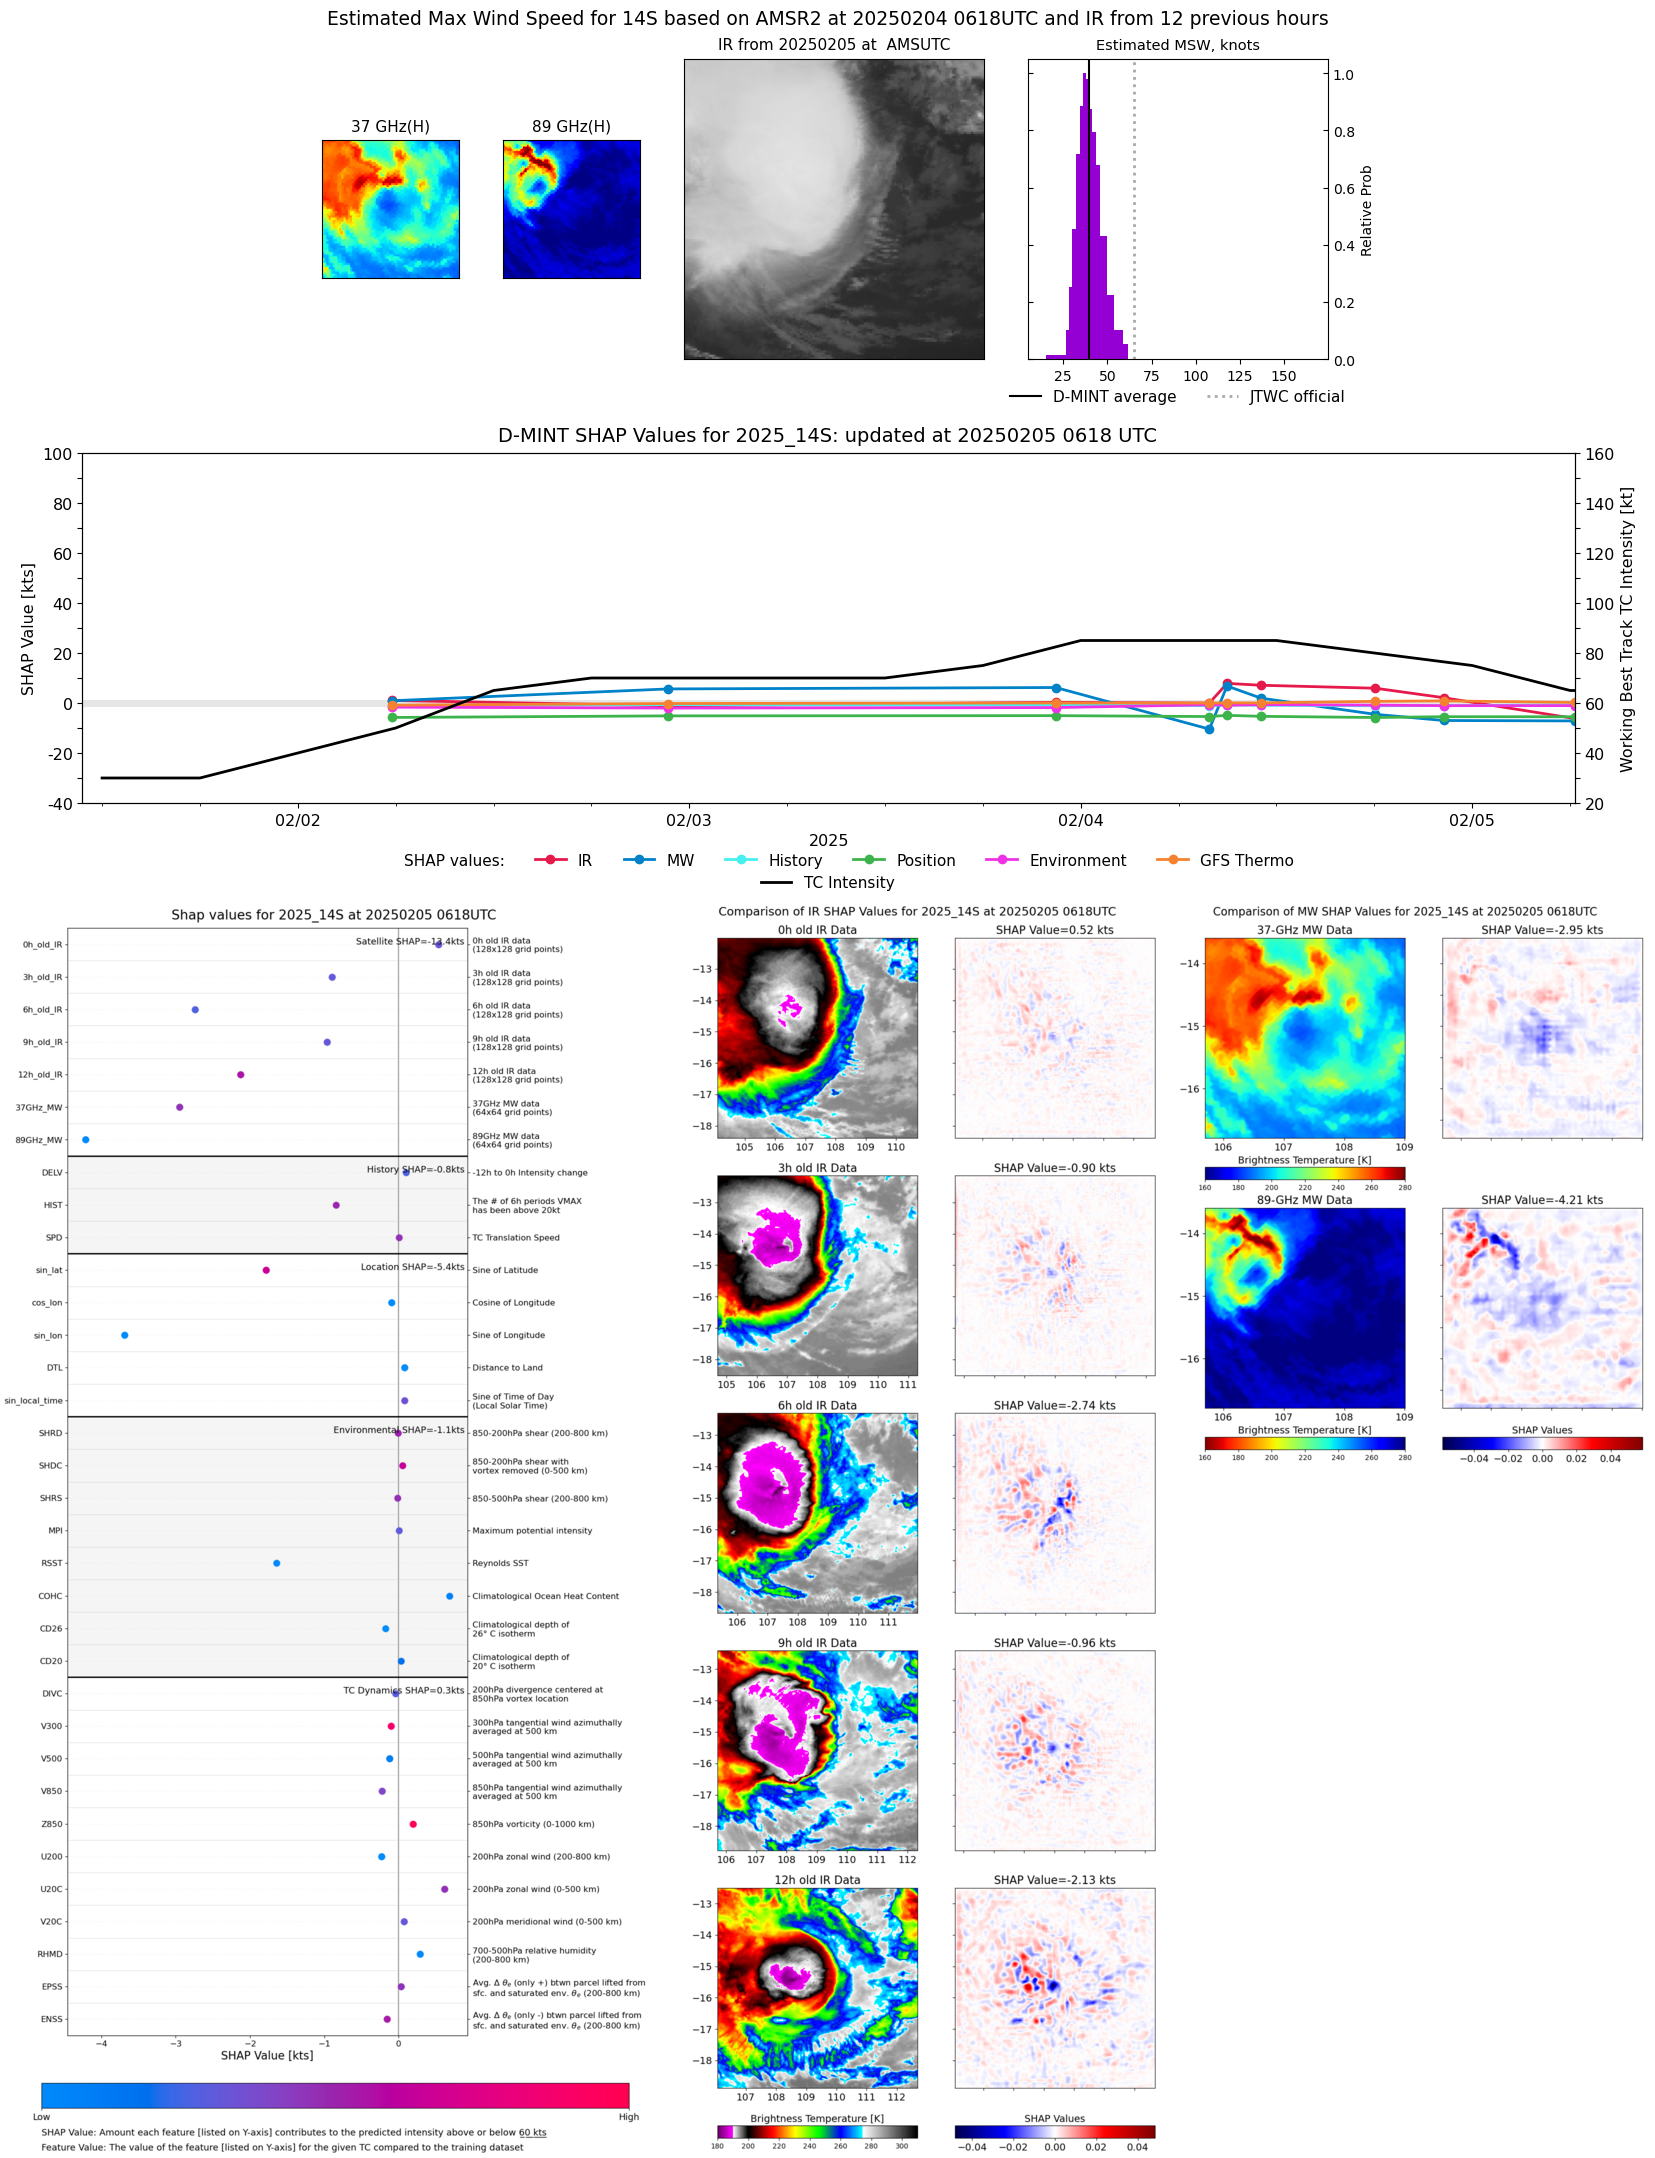 |
| 20250205 | 0608 UTC | ATMS-N20 | 990 hPa | 46 kts | 41 kts | 51 kts | 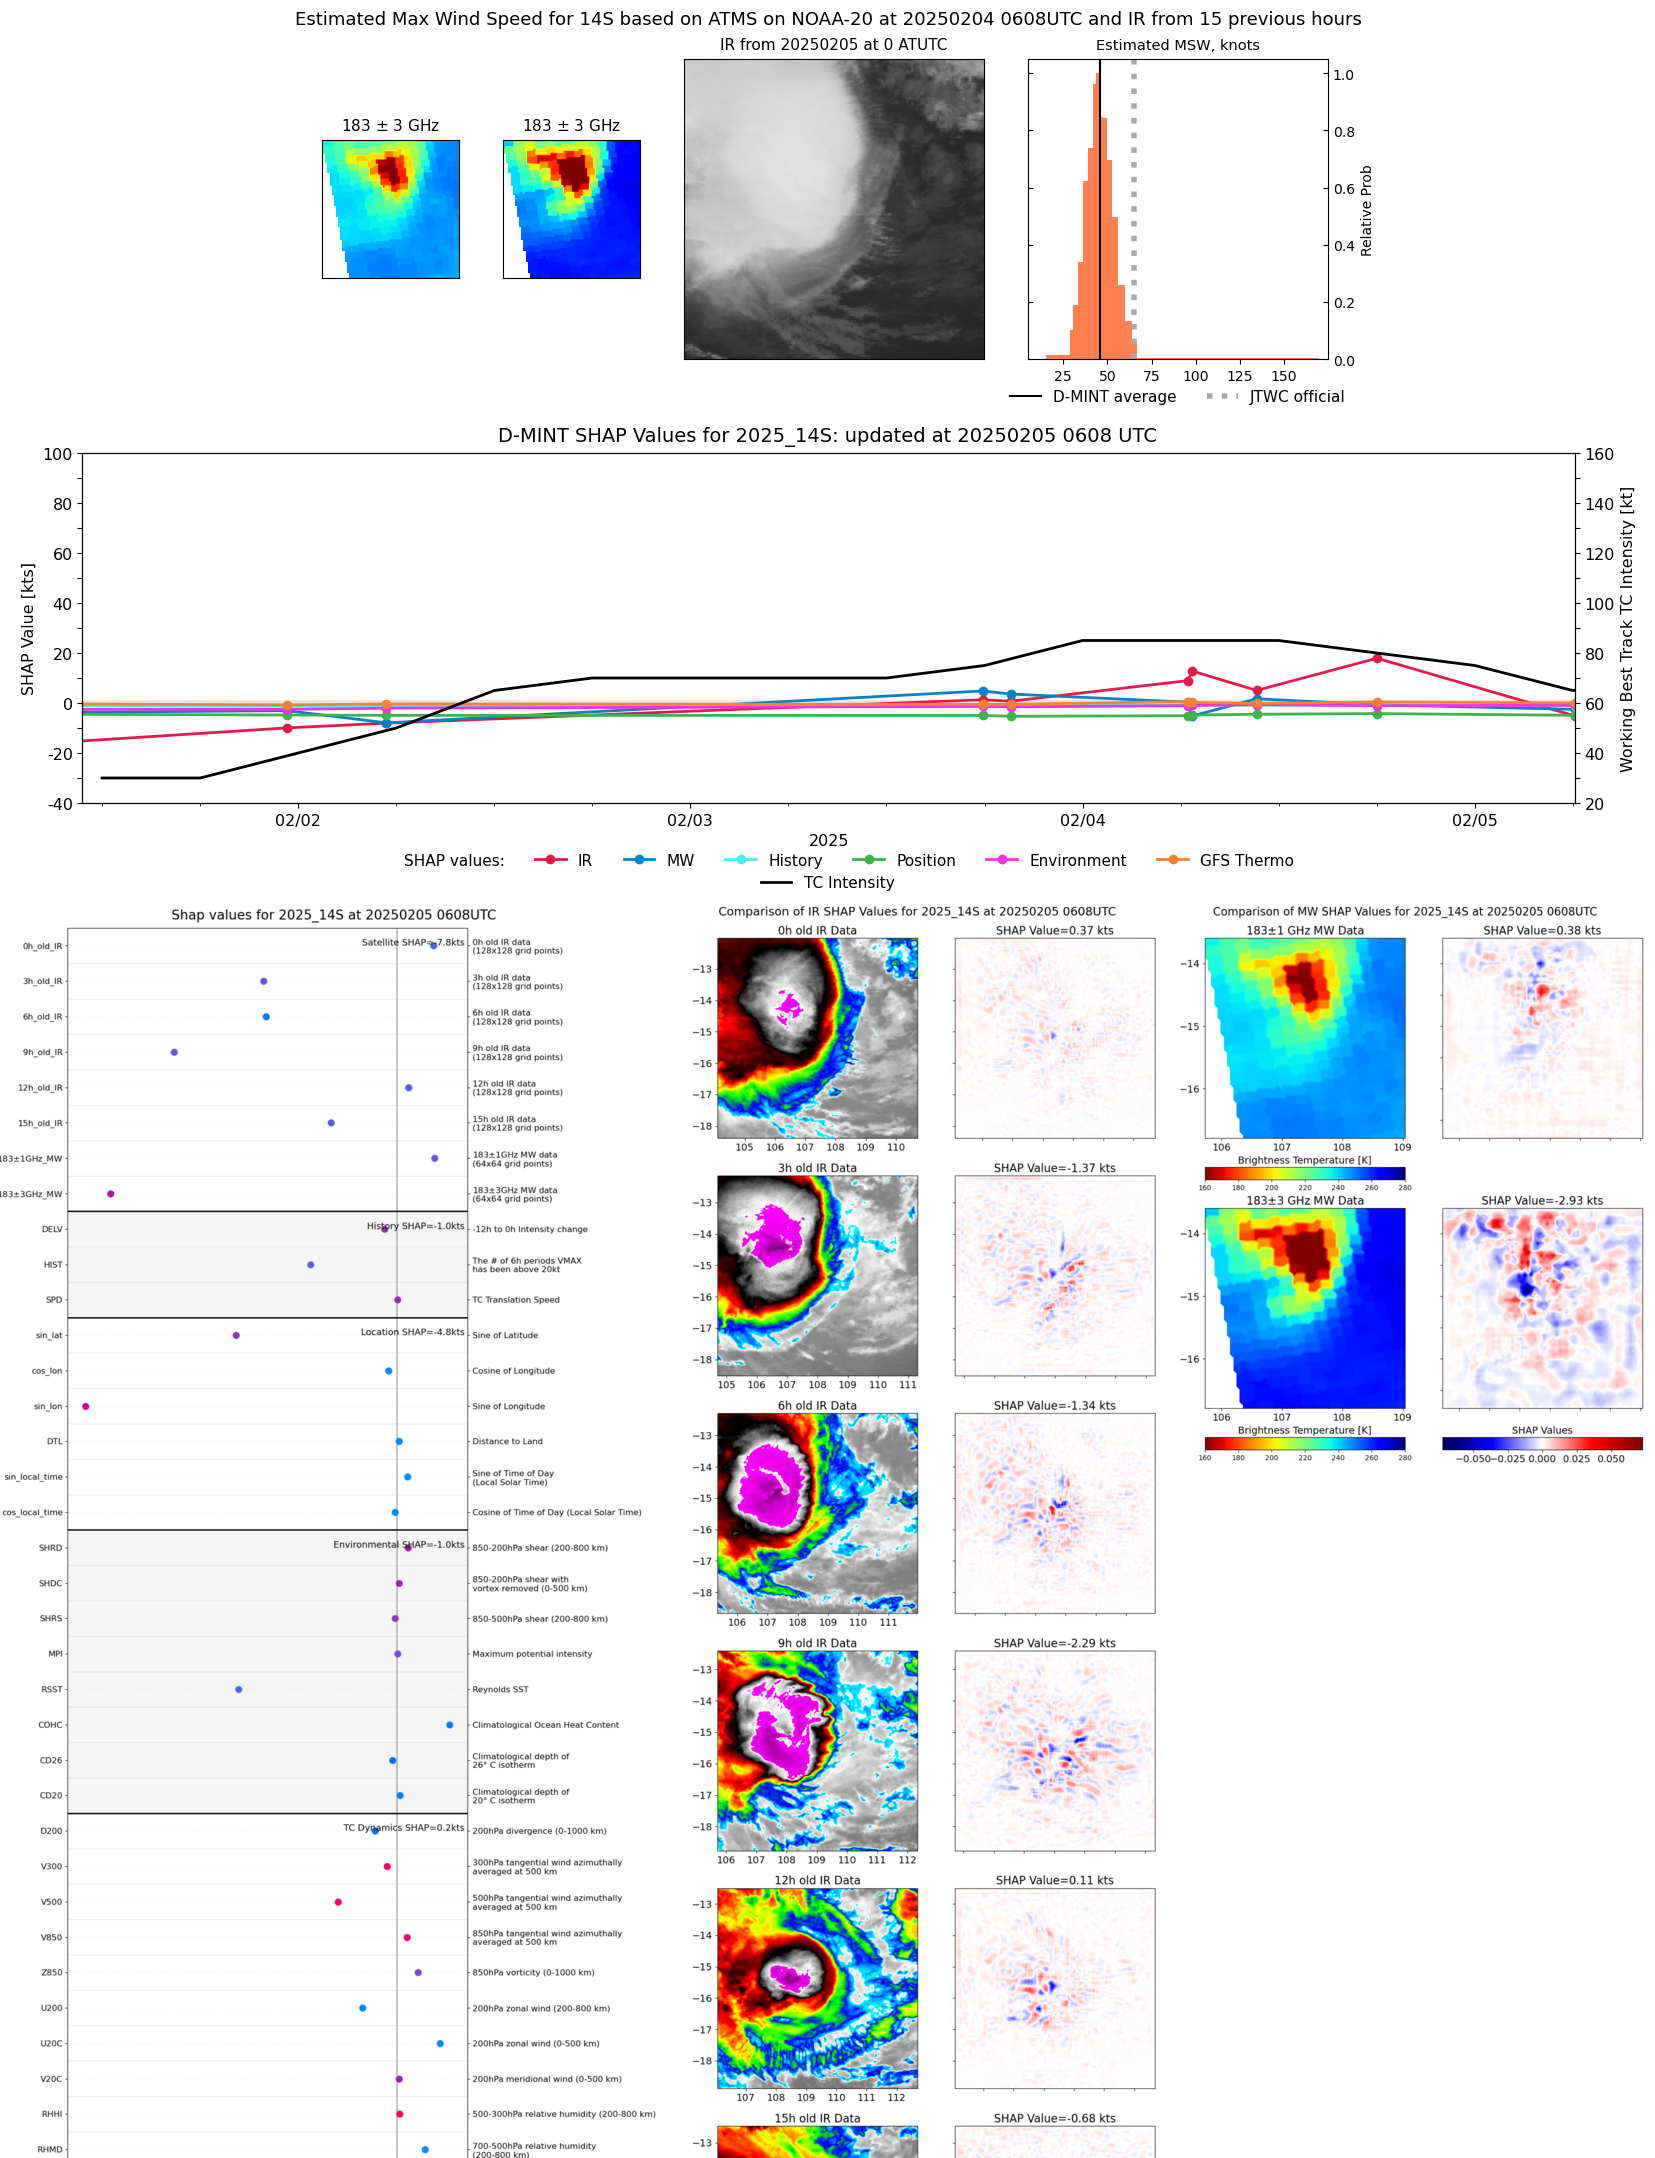 |
| 20250204 | 2257 UTC | TROPICS05 | 985 hPa | 62 kts | 56 kts | 68 kts | 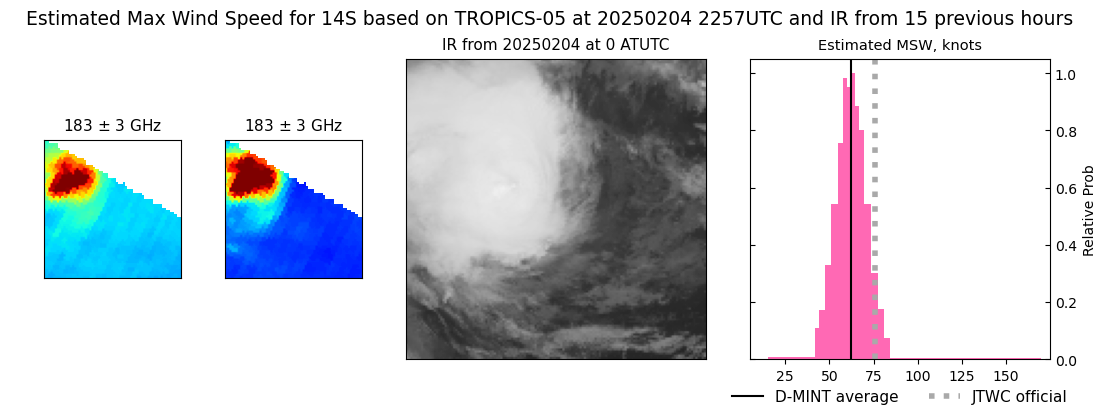 |
| 20250204 | 2250 UTC | SSMISF16 | 987 hPa | 55 kts | 49 kts | 61 kts | 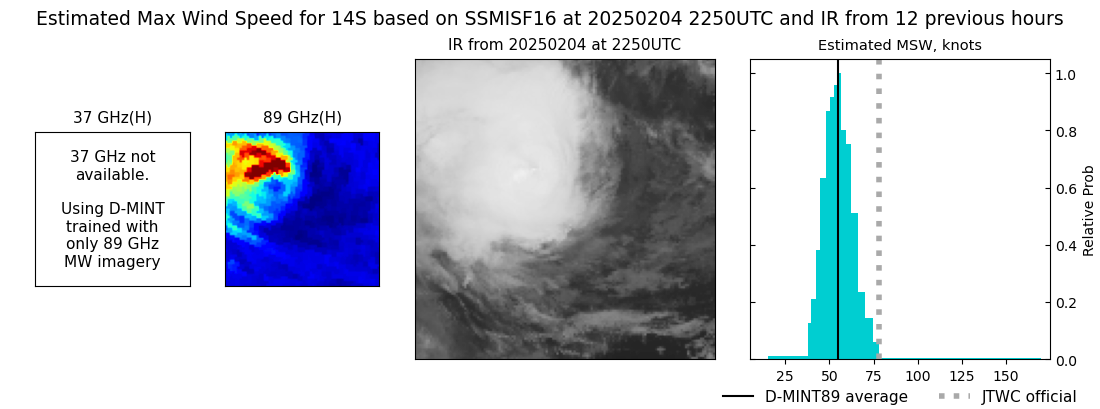 |
| 20250204 | 2215 UTC | SSMISF17 | 987 hPa | 48 kts | 43 kts | 54 kts |  |
| 20250204 | 2142 UTC | TROPICS06 | 984 hPa | 59 kts | 54 kts | 64 kts | 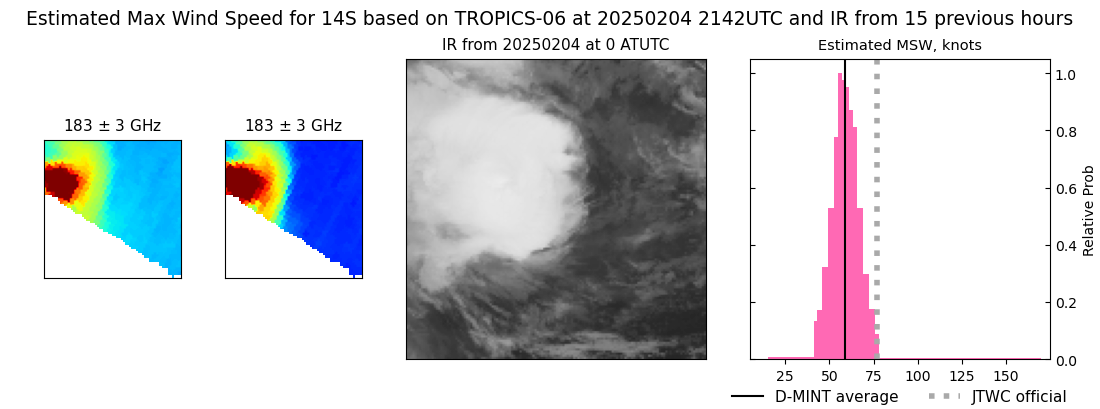 |
| 20250204 | 2010 UTC | SSMISF18 | 984 hPa | 50 kts | 45 kts | 55 kts | 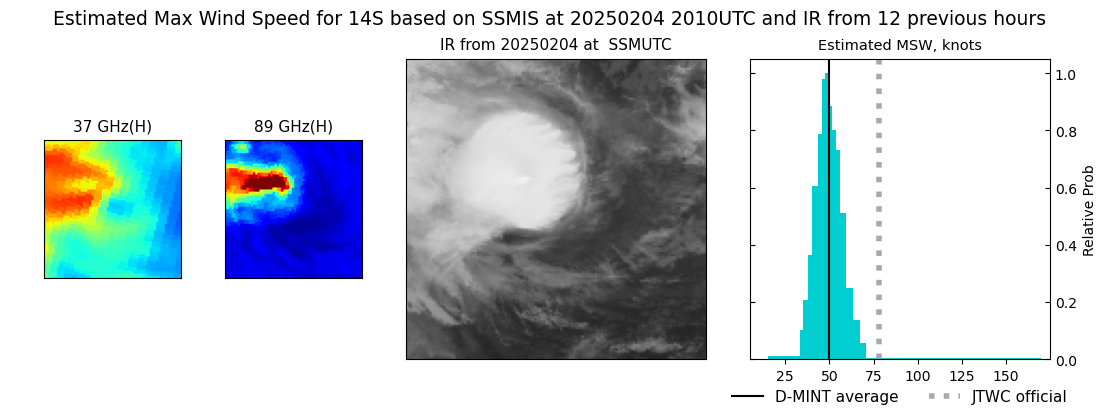 |
| 20250204 | 1857 UTC | TROPICS03 | 984 hPa | 67 kts | 61 kts | 72 kts | 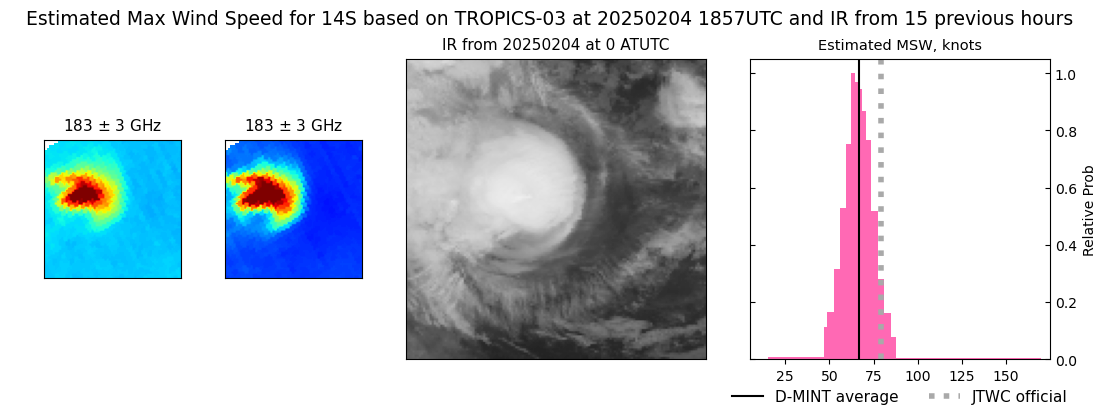 |
| 20250204 | 1804 UTC | AMSR2 | 980 hPa | 54 kts | 48 kts | 61 kts | 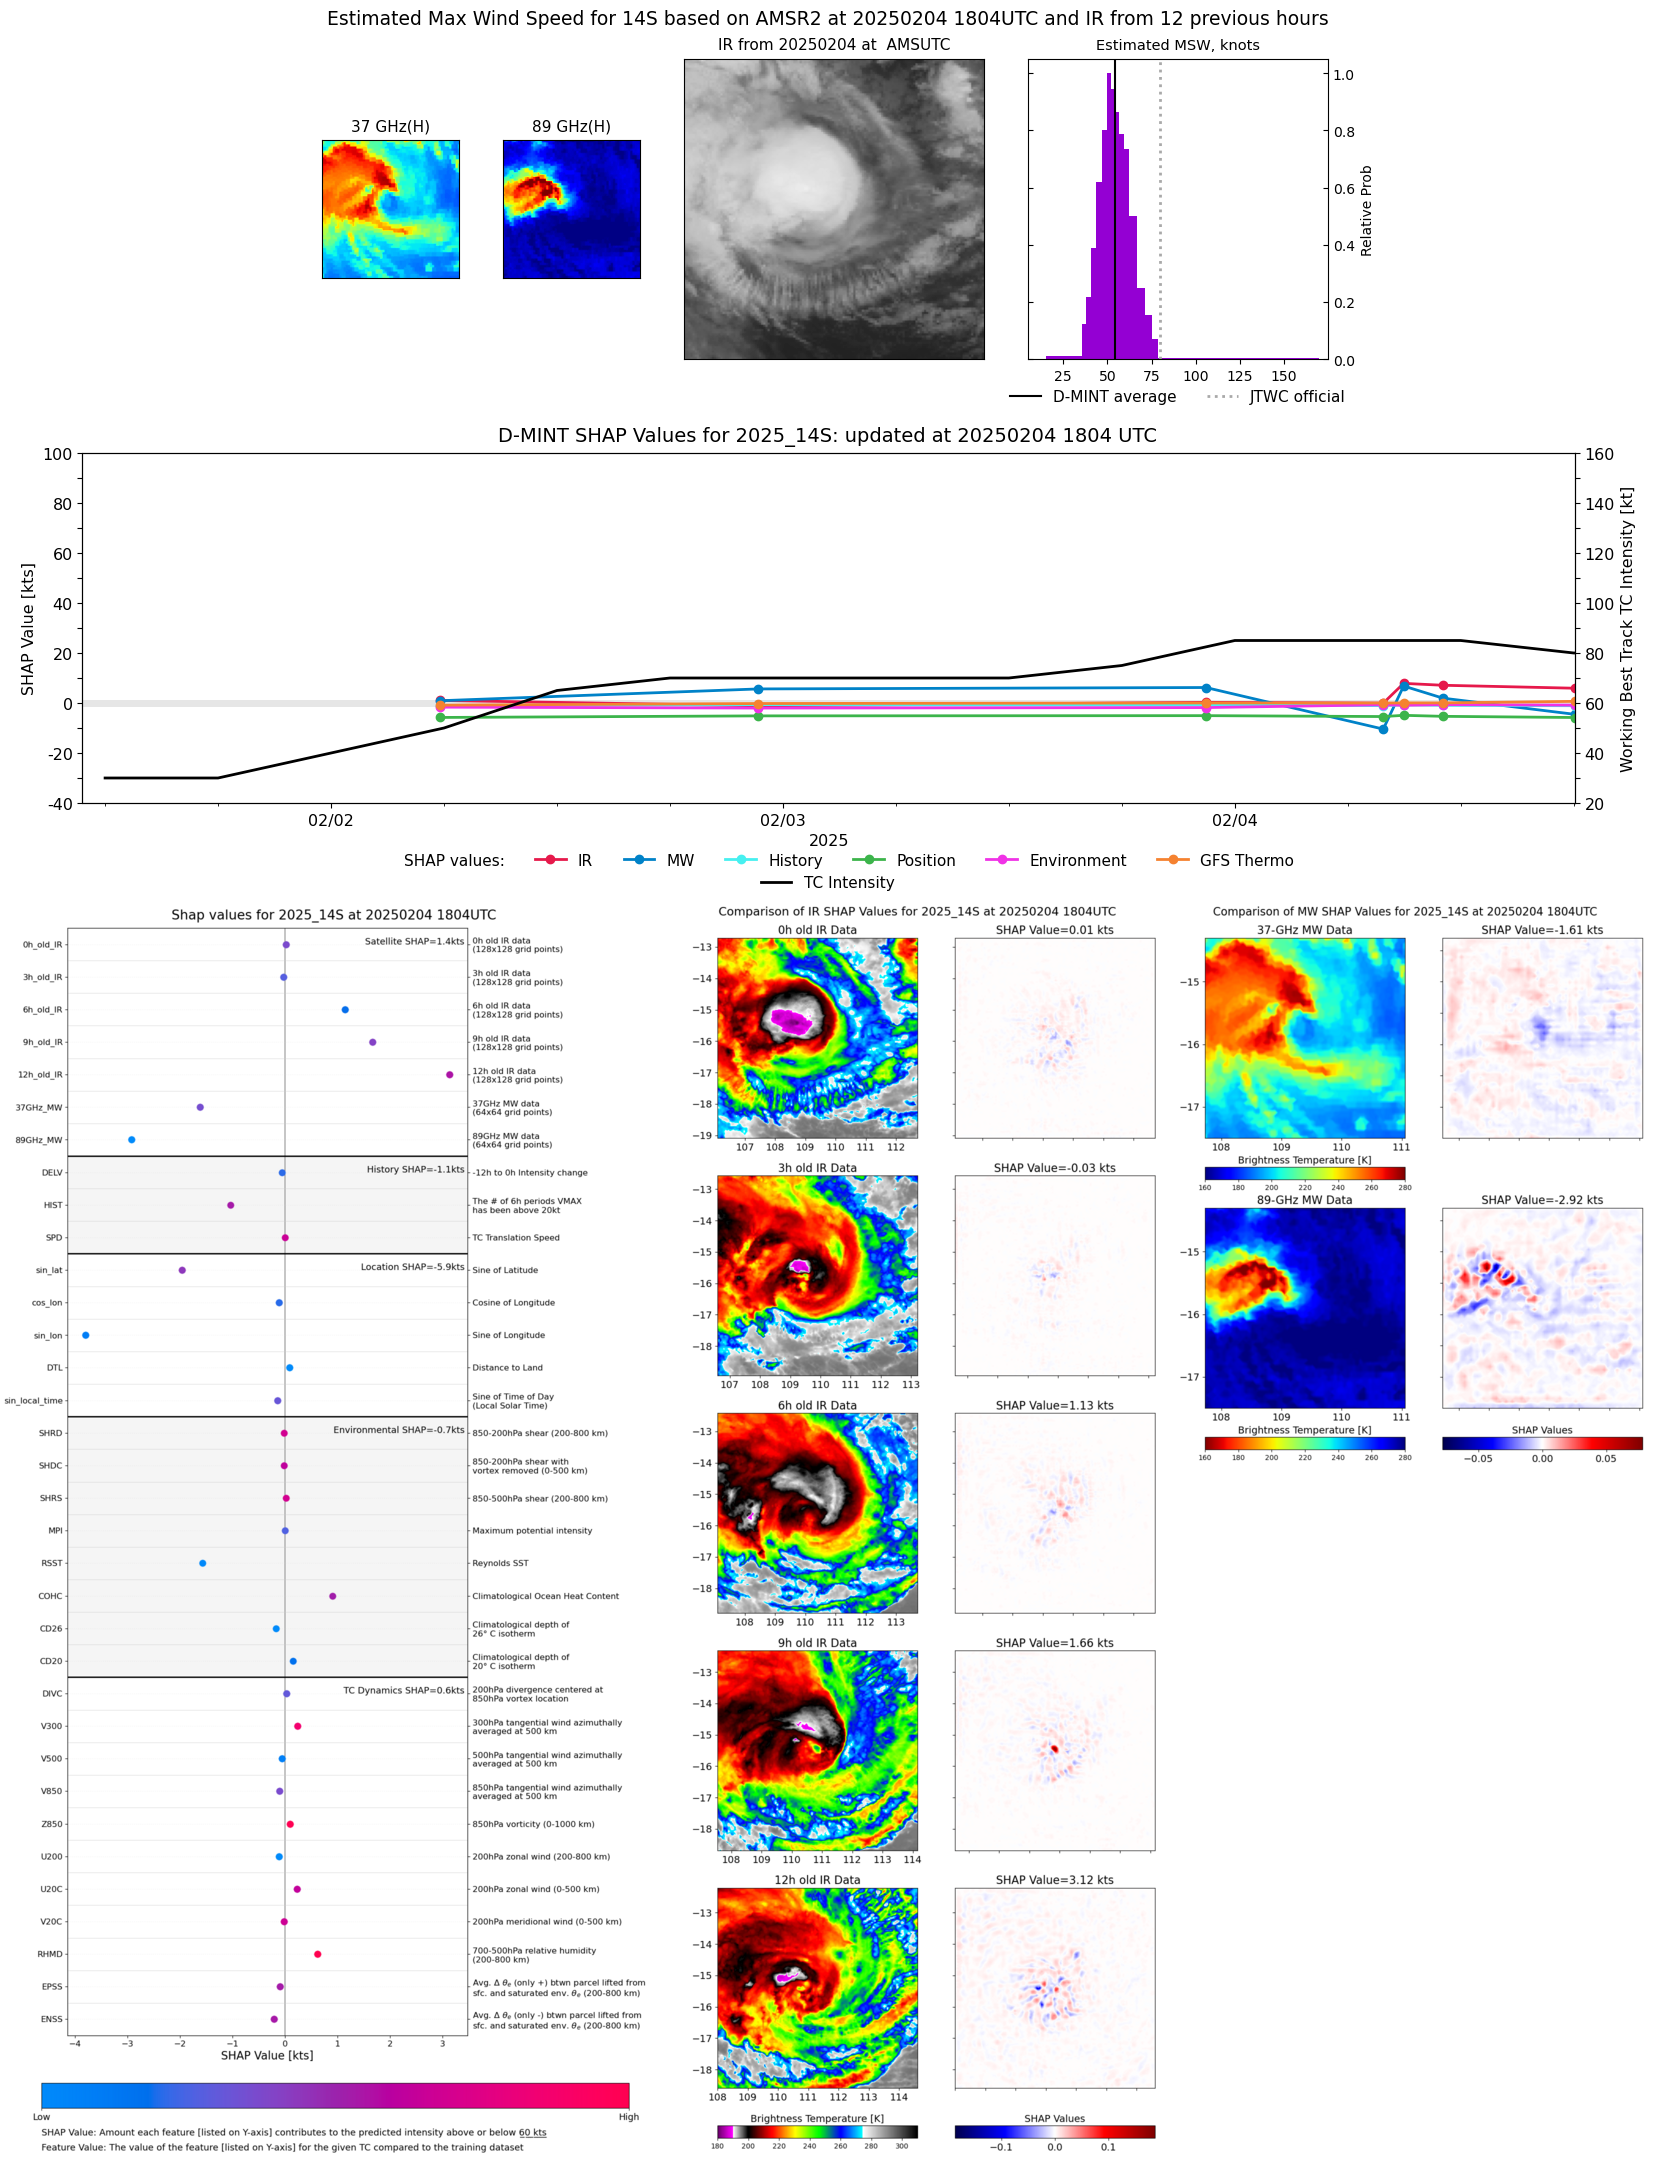 |
| 20250204 | 1801 UTC | ATMS-N20 | 975 hPa | 71 kts | 65 kts | 78 kts | 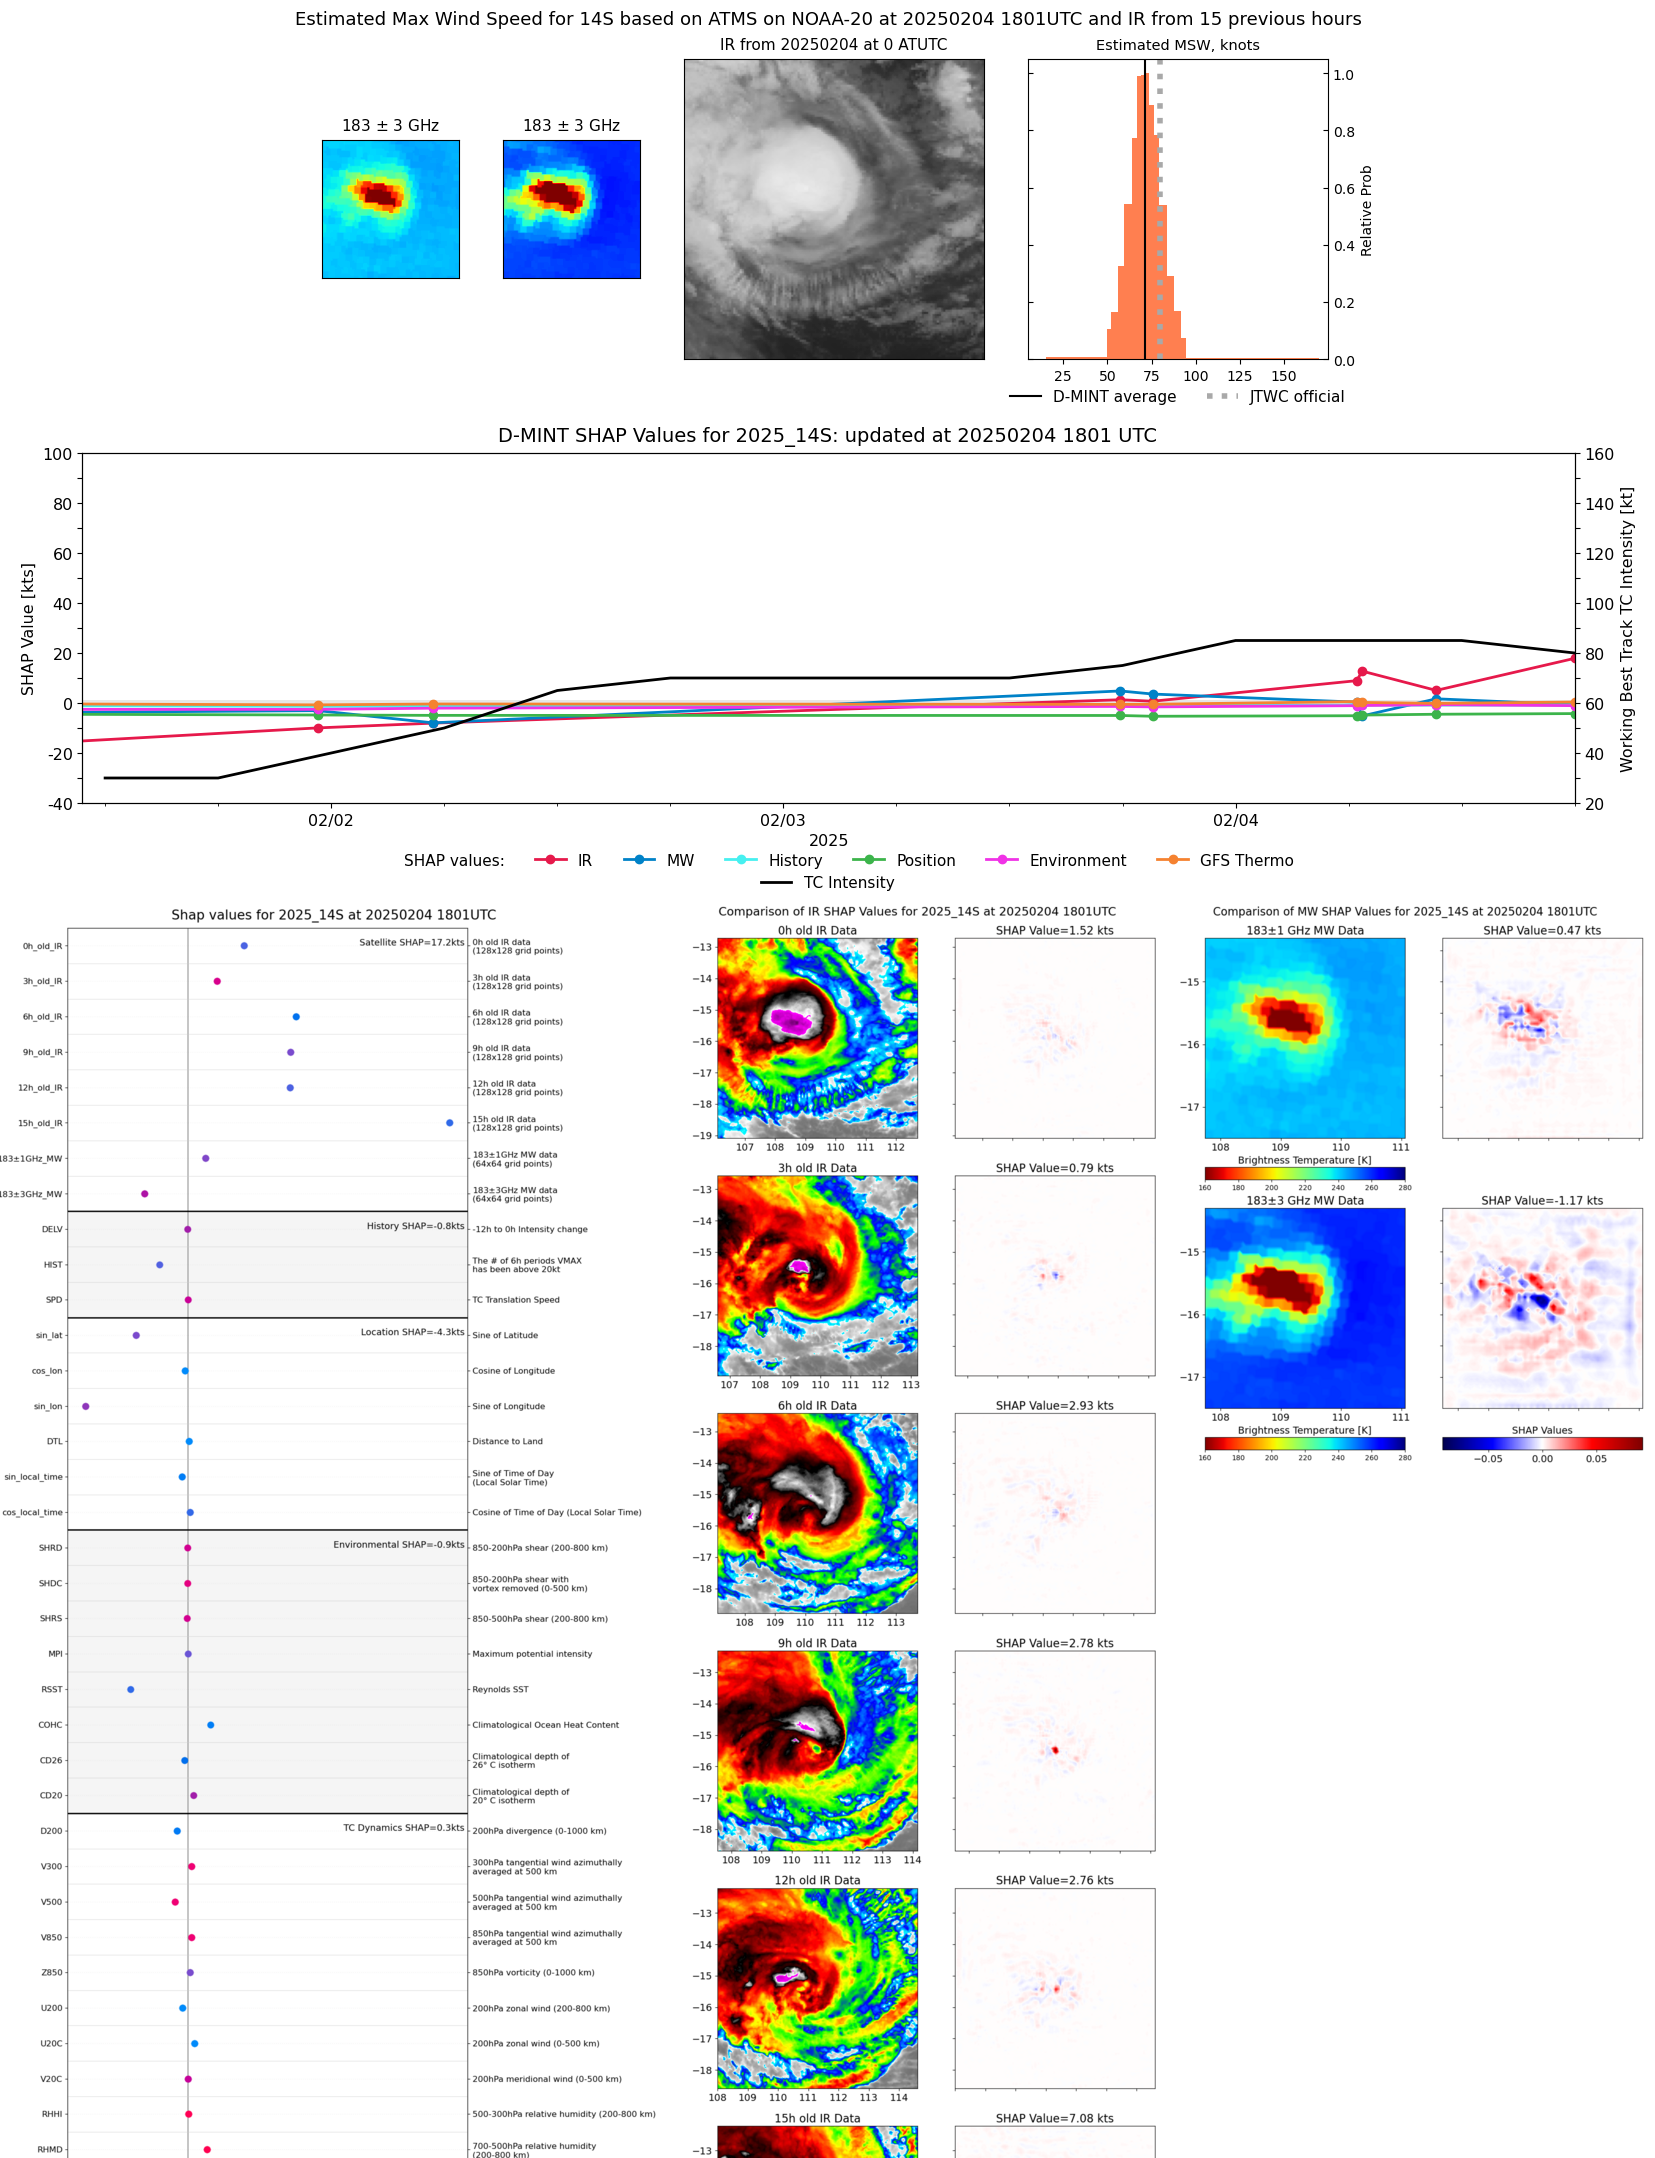 |
| 20250204 | 1140 UTC | SSMISF16 | 978 hPa | 67 kts | 60 kts | 75 kts | 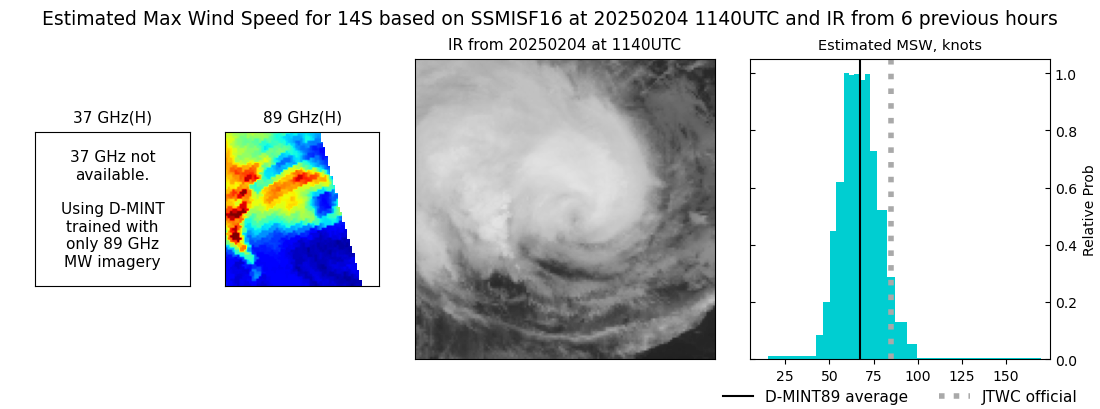 |
| 20250204 | 1103 UTC | SSMISF17 | 977 hPa | 62 kts | 56 kts | 68 kts |  |
| 20250204 | 1039 UTC | TROPICS03 | 977 hPa | 61 kts | 55 kts | 67 kts | 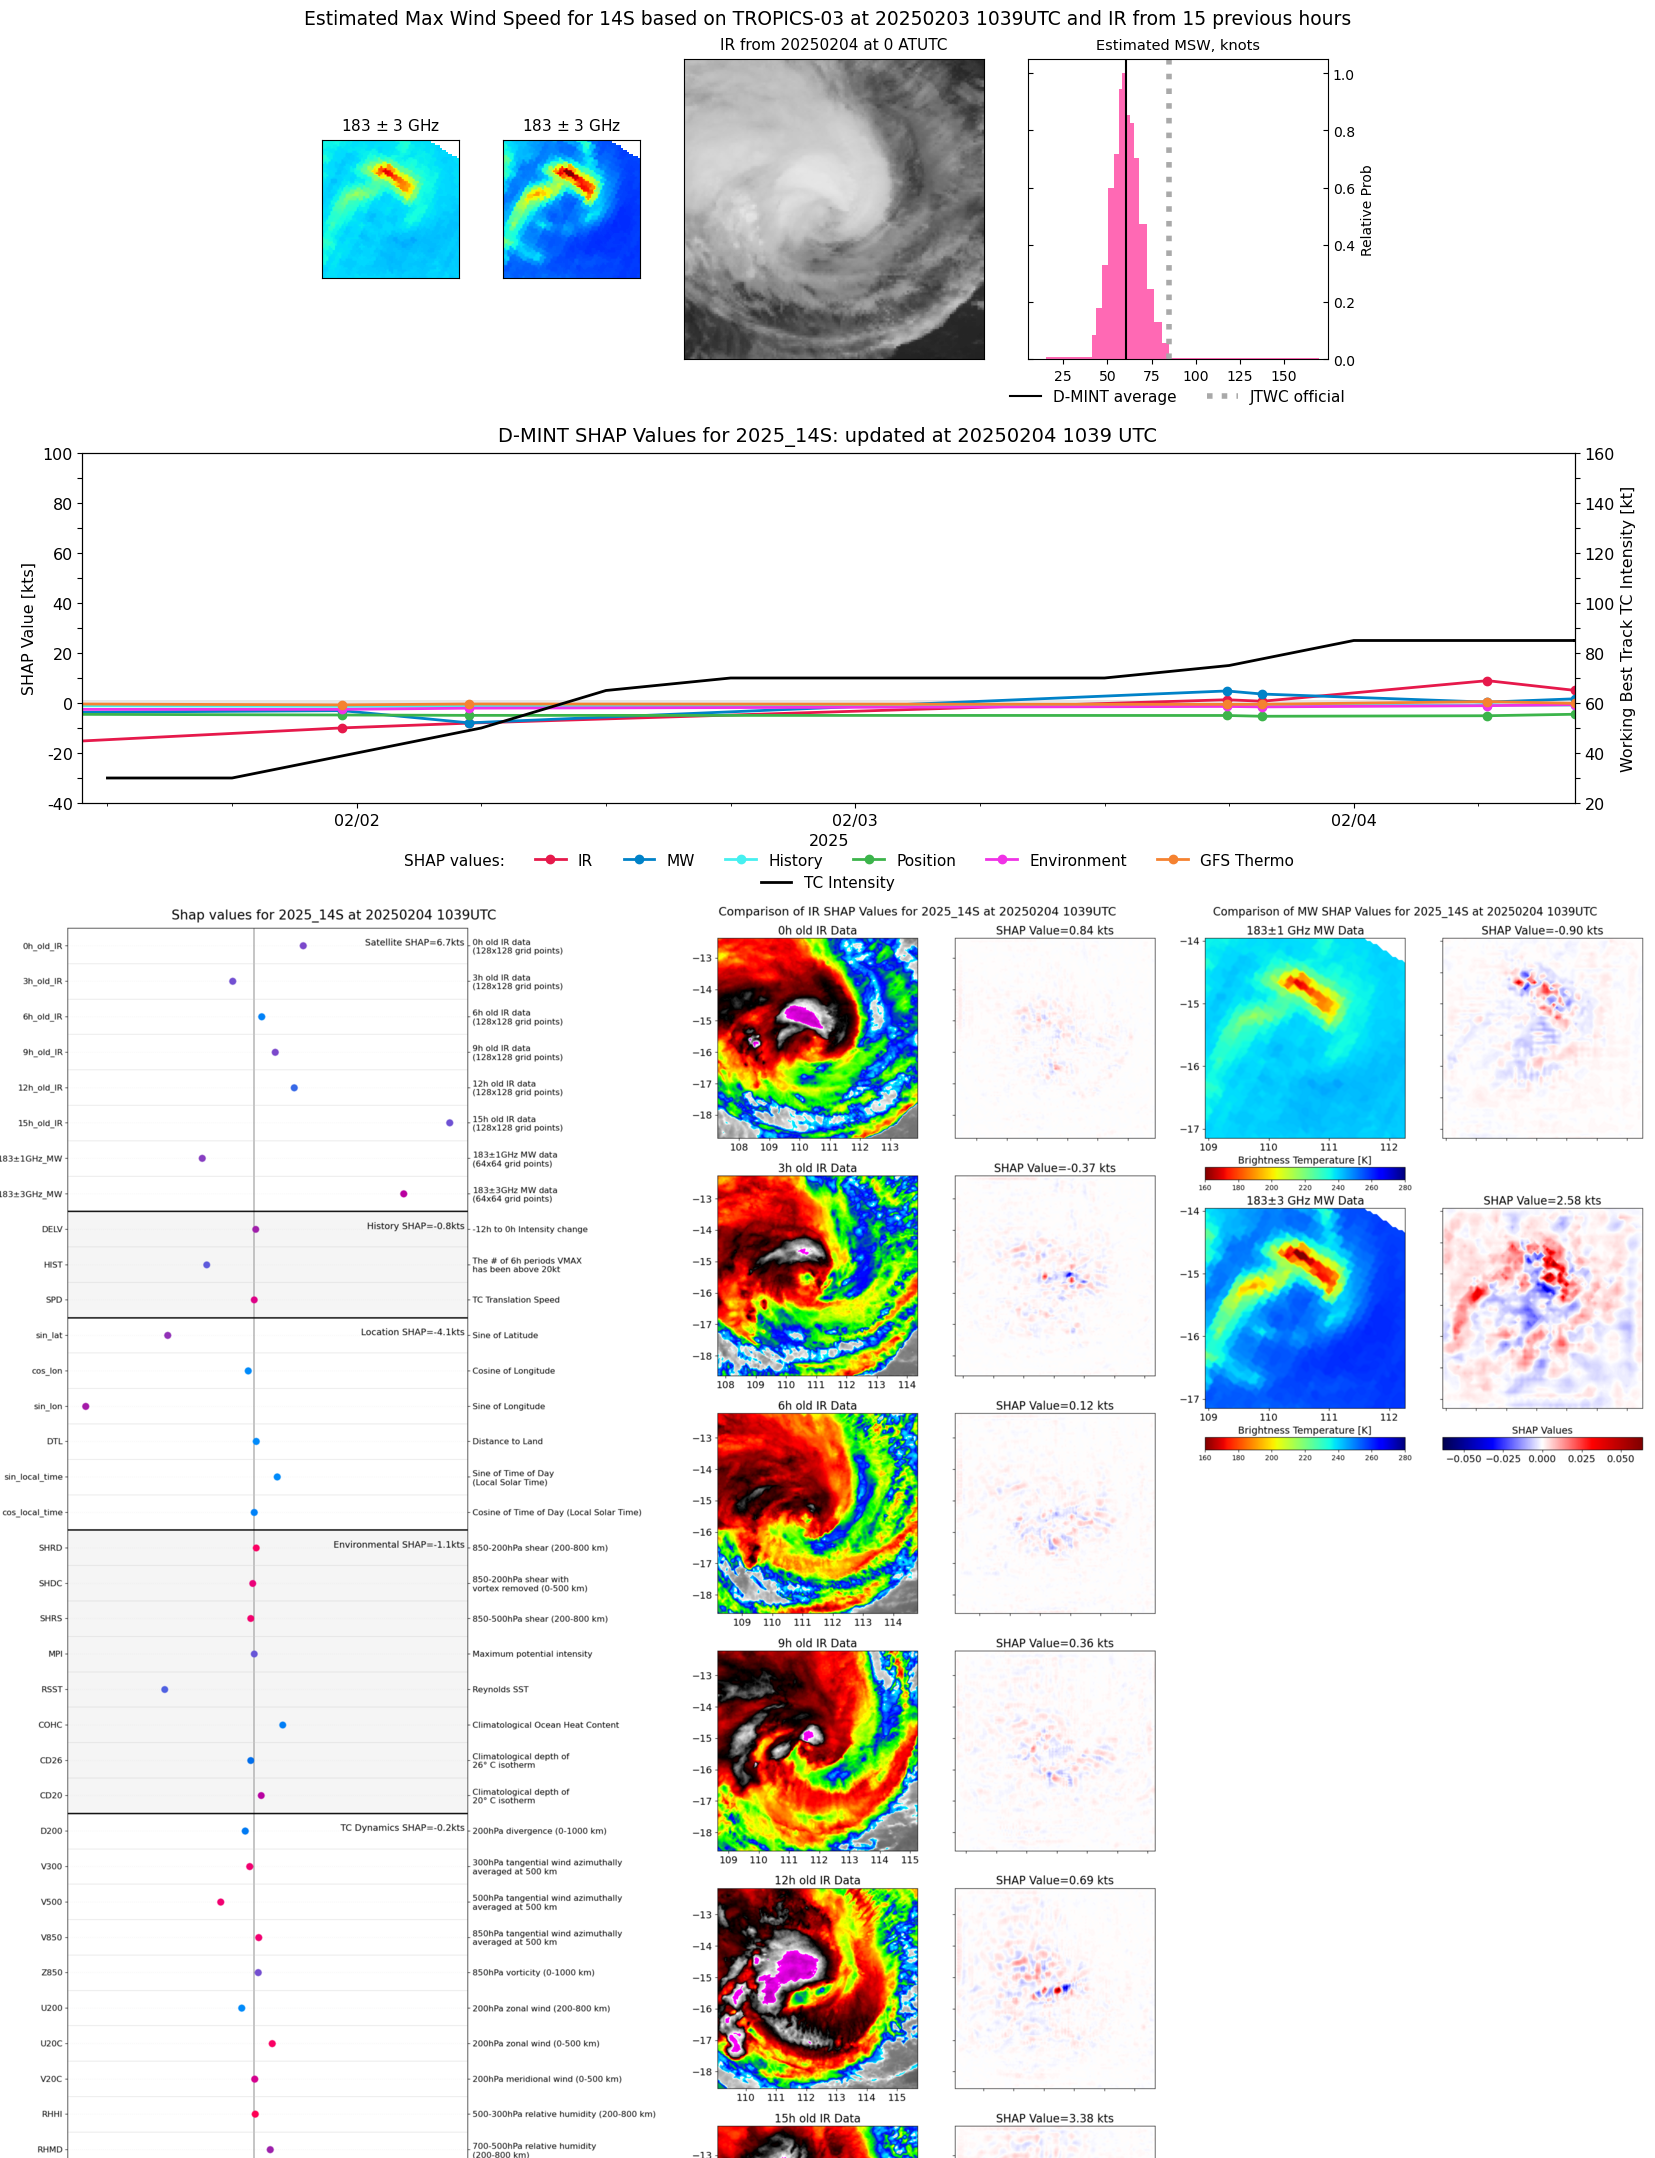 |
| 20250204 | 0858 UTC | SSMISF18 | 970 hPa | 68 kts | 62 kts | 74 kts | 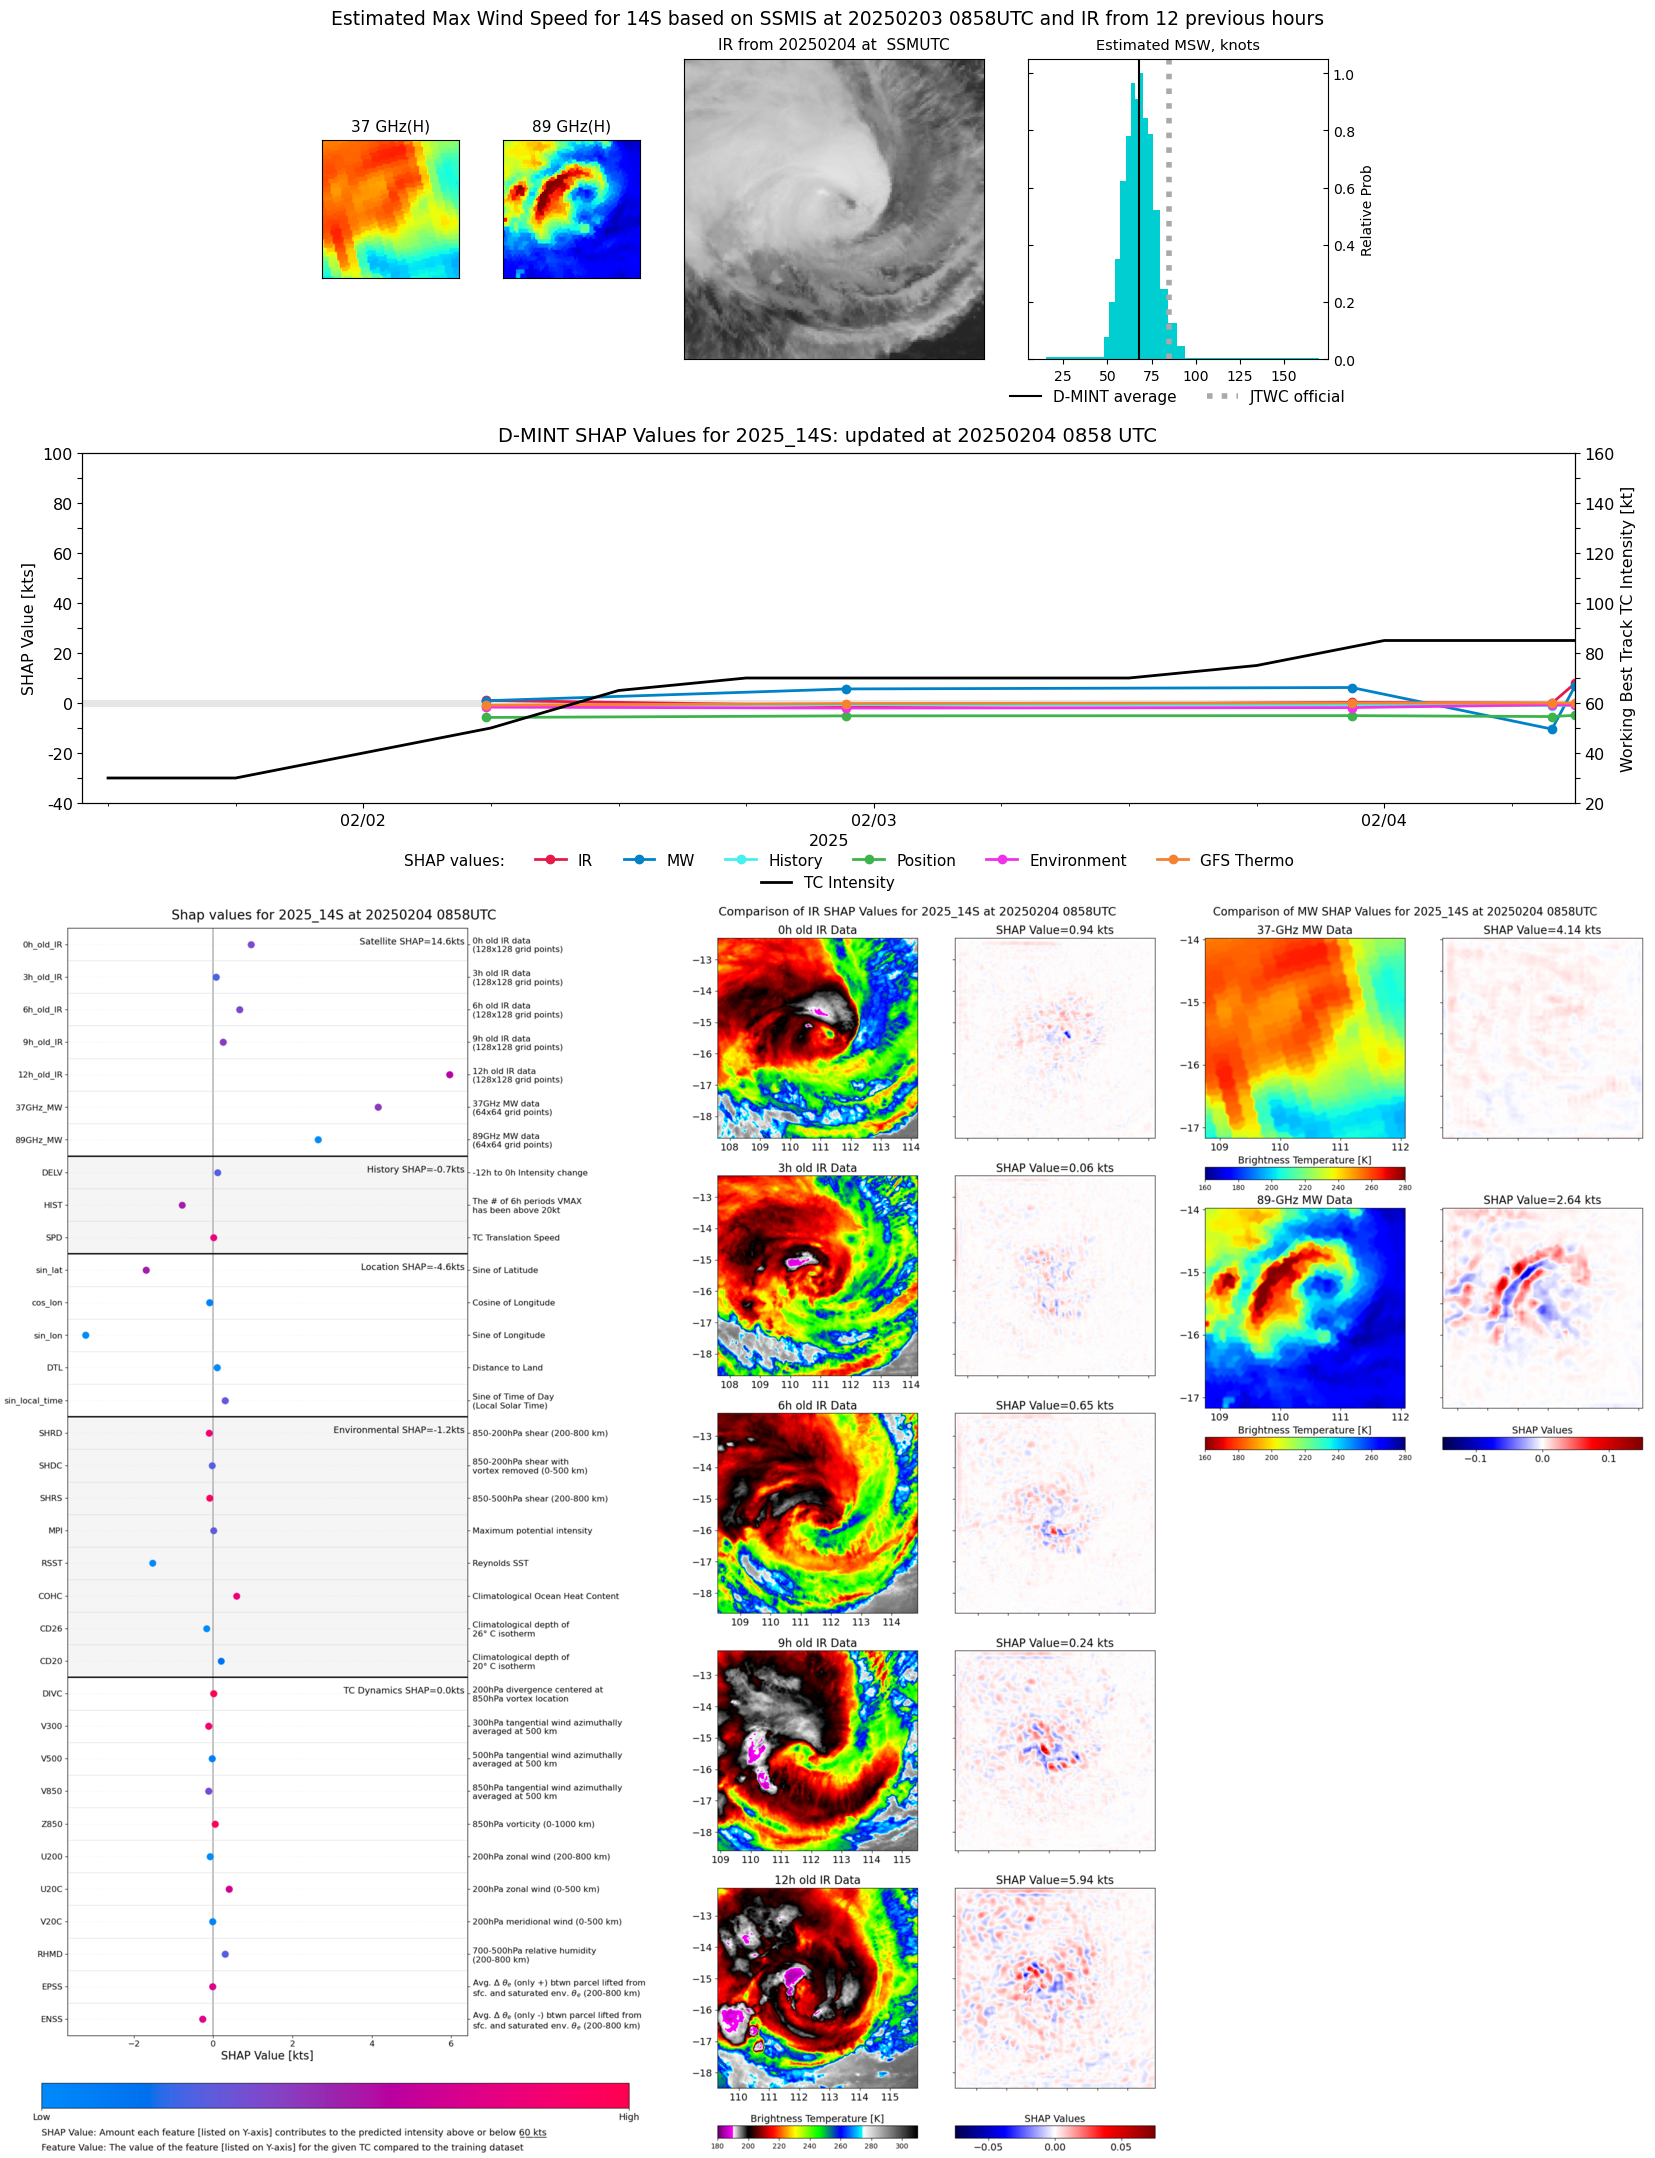 |
| 20250204 | 0643 UTC | TROPICS06 | 982 hPa | 61 kts | 56 kts | 67 kts | 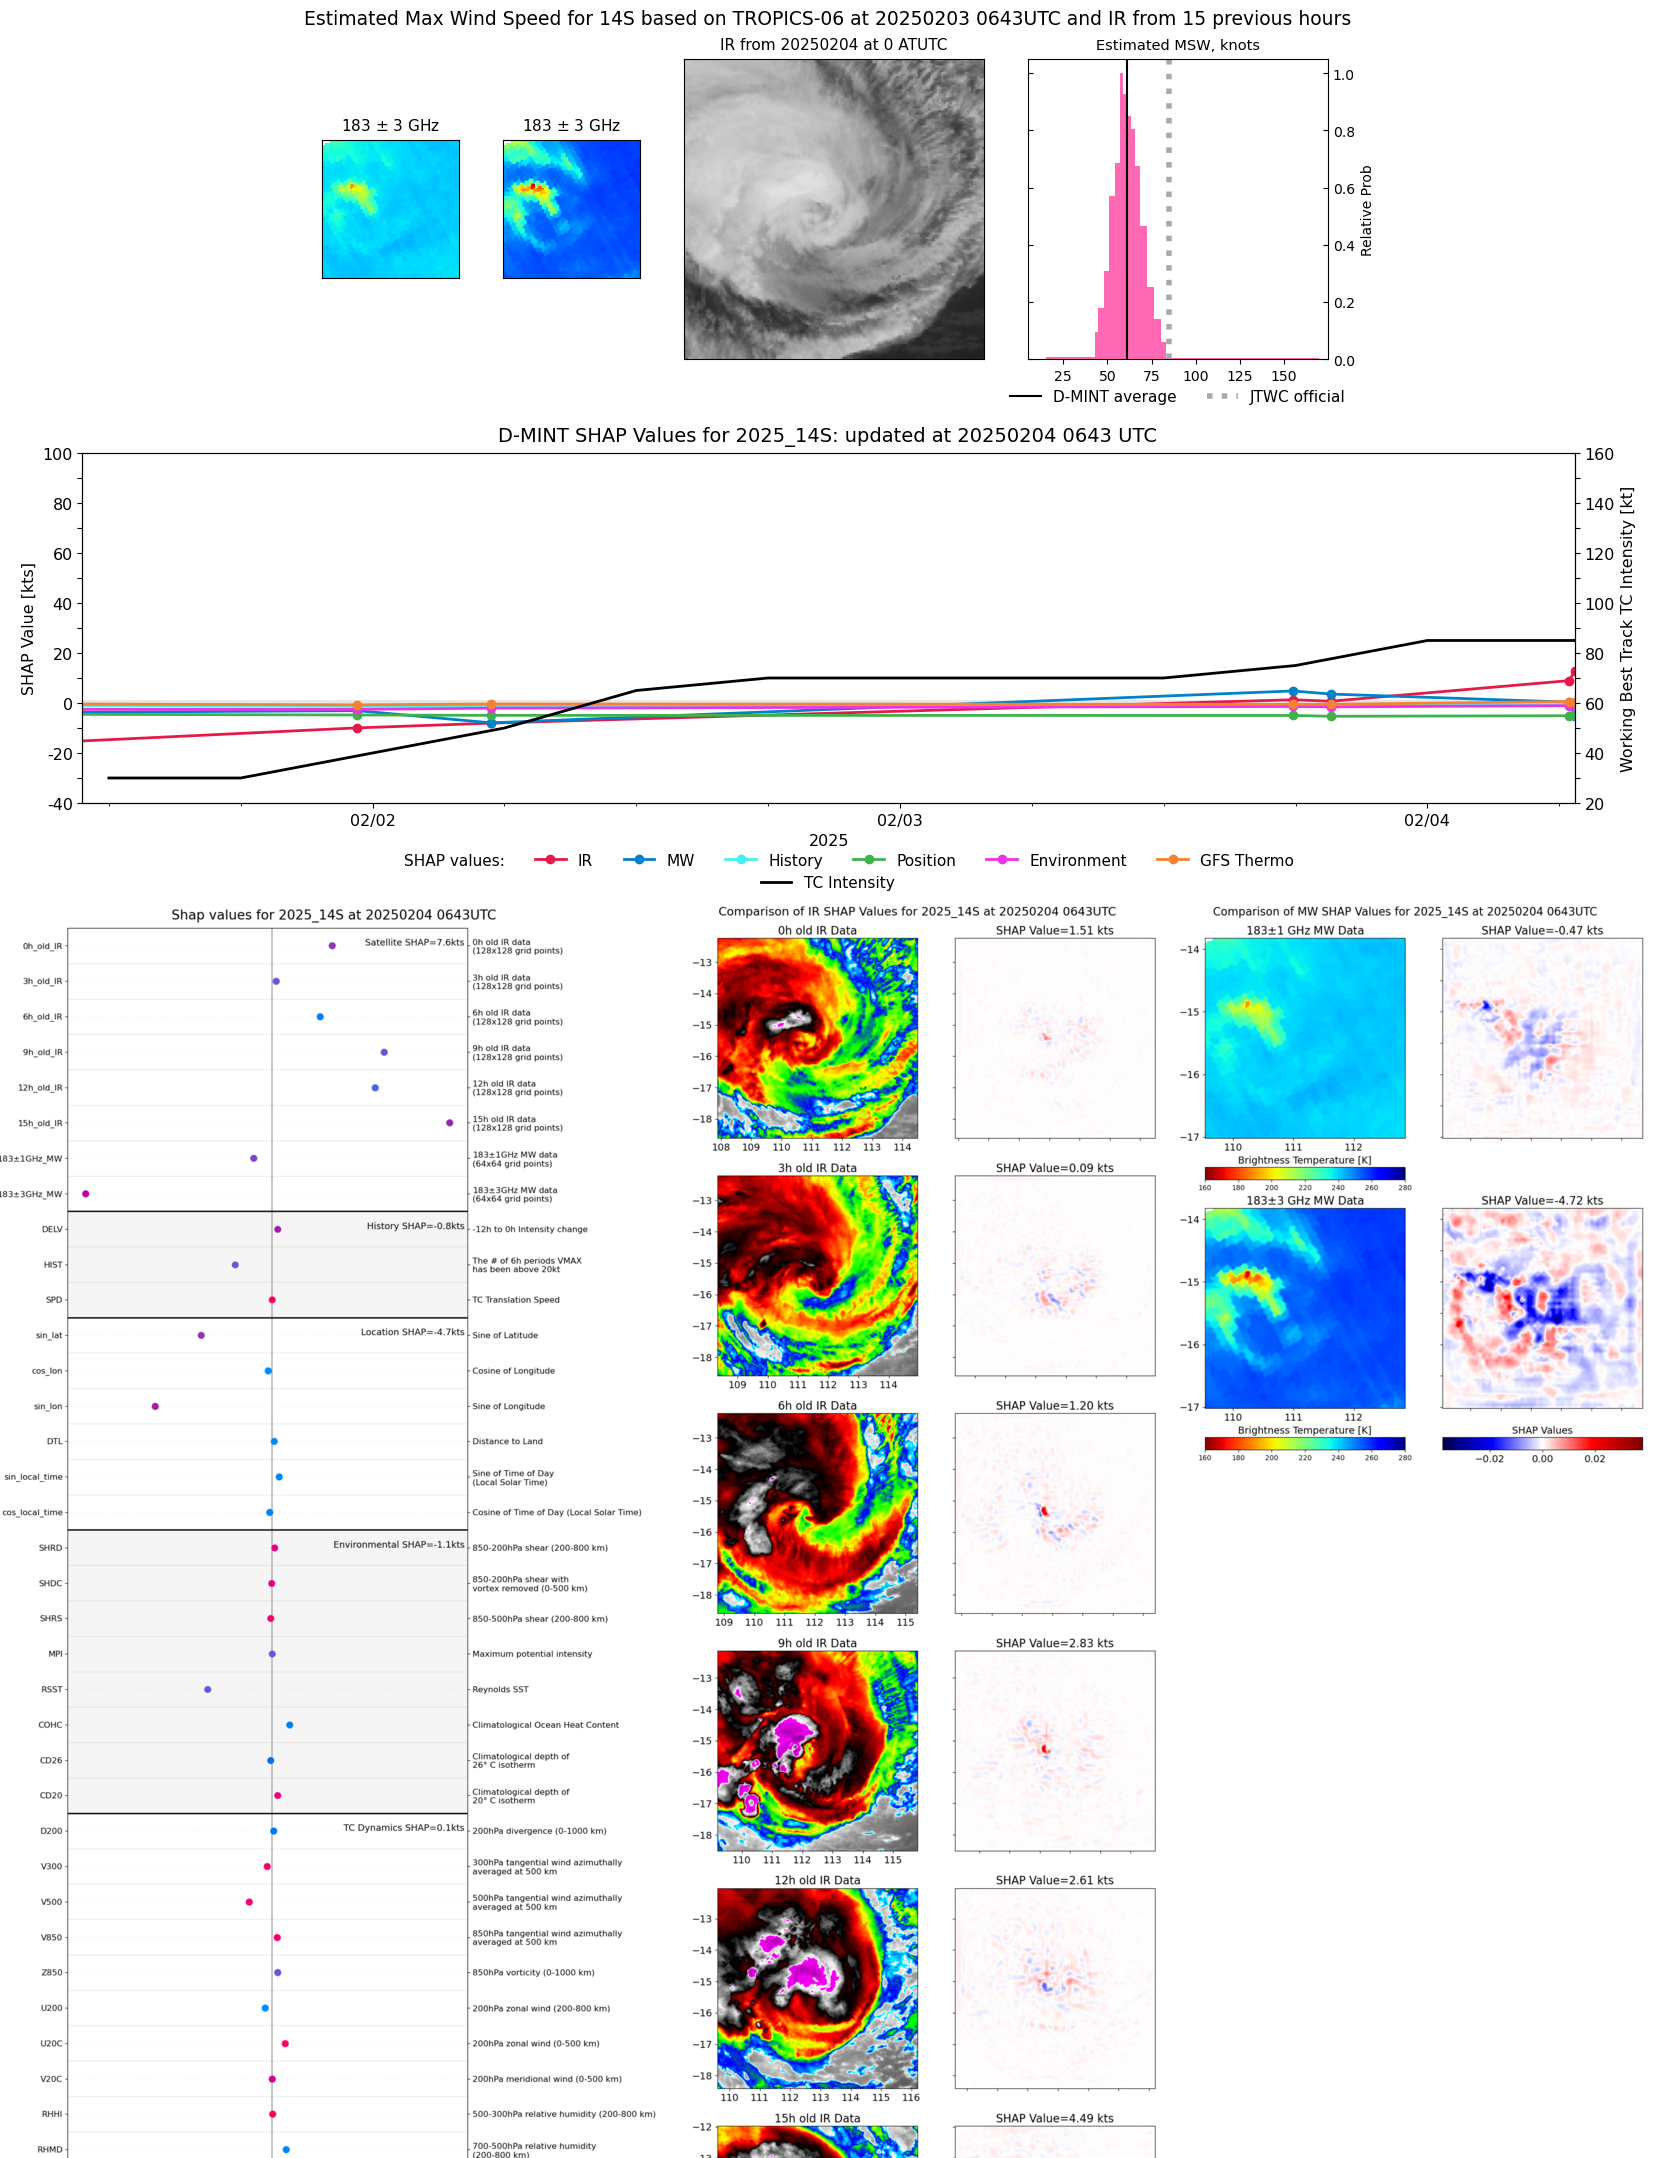 |
| 20250204 | 0626 UTC | ATMS-N20 | 978 hPa | 63 kts | 57 kts | 69 kts | 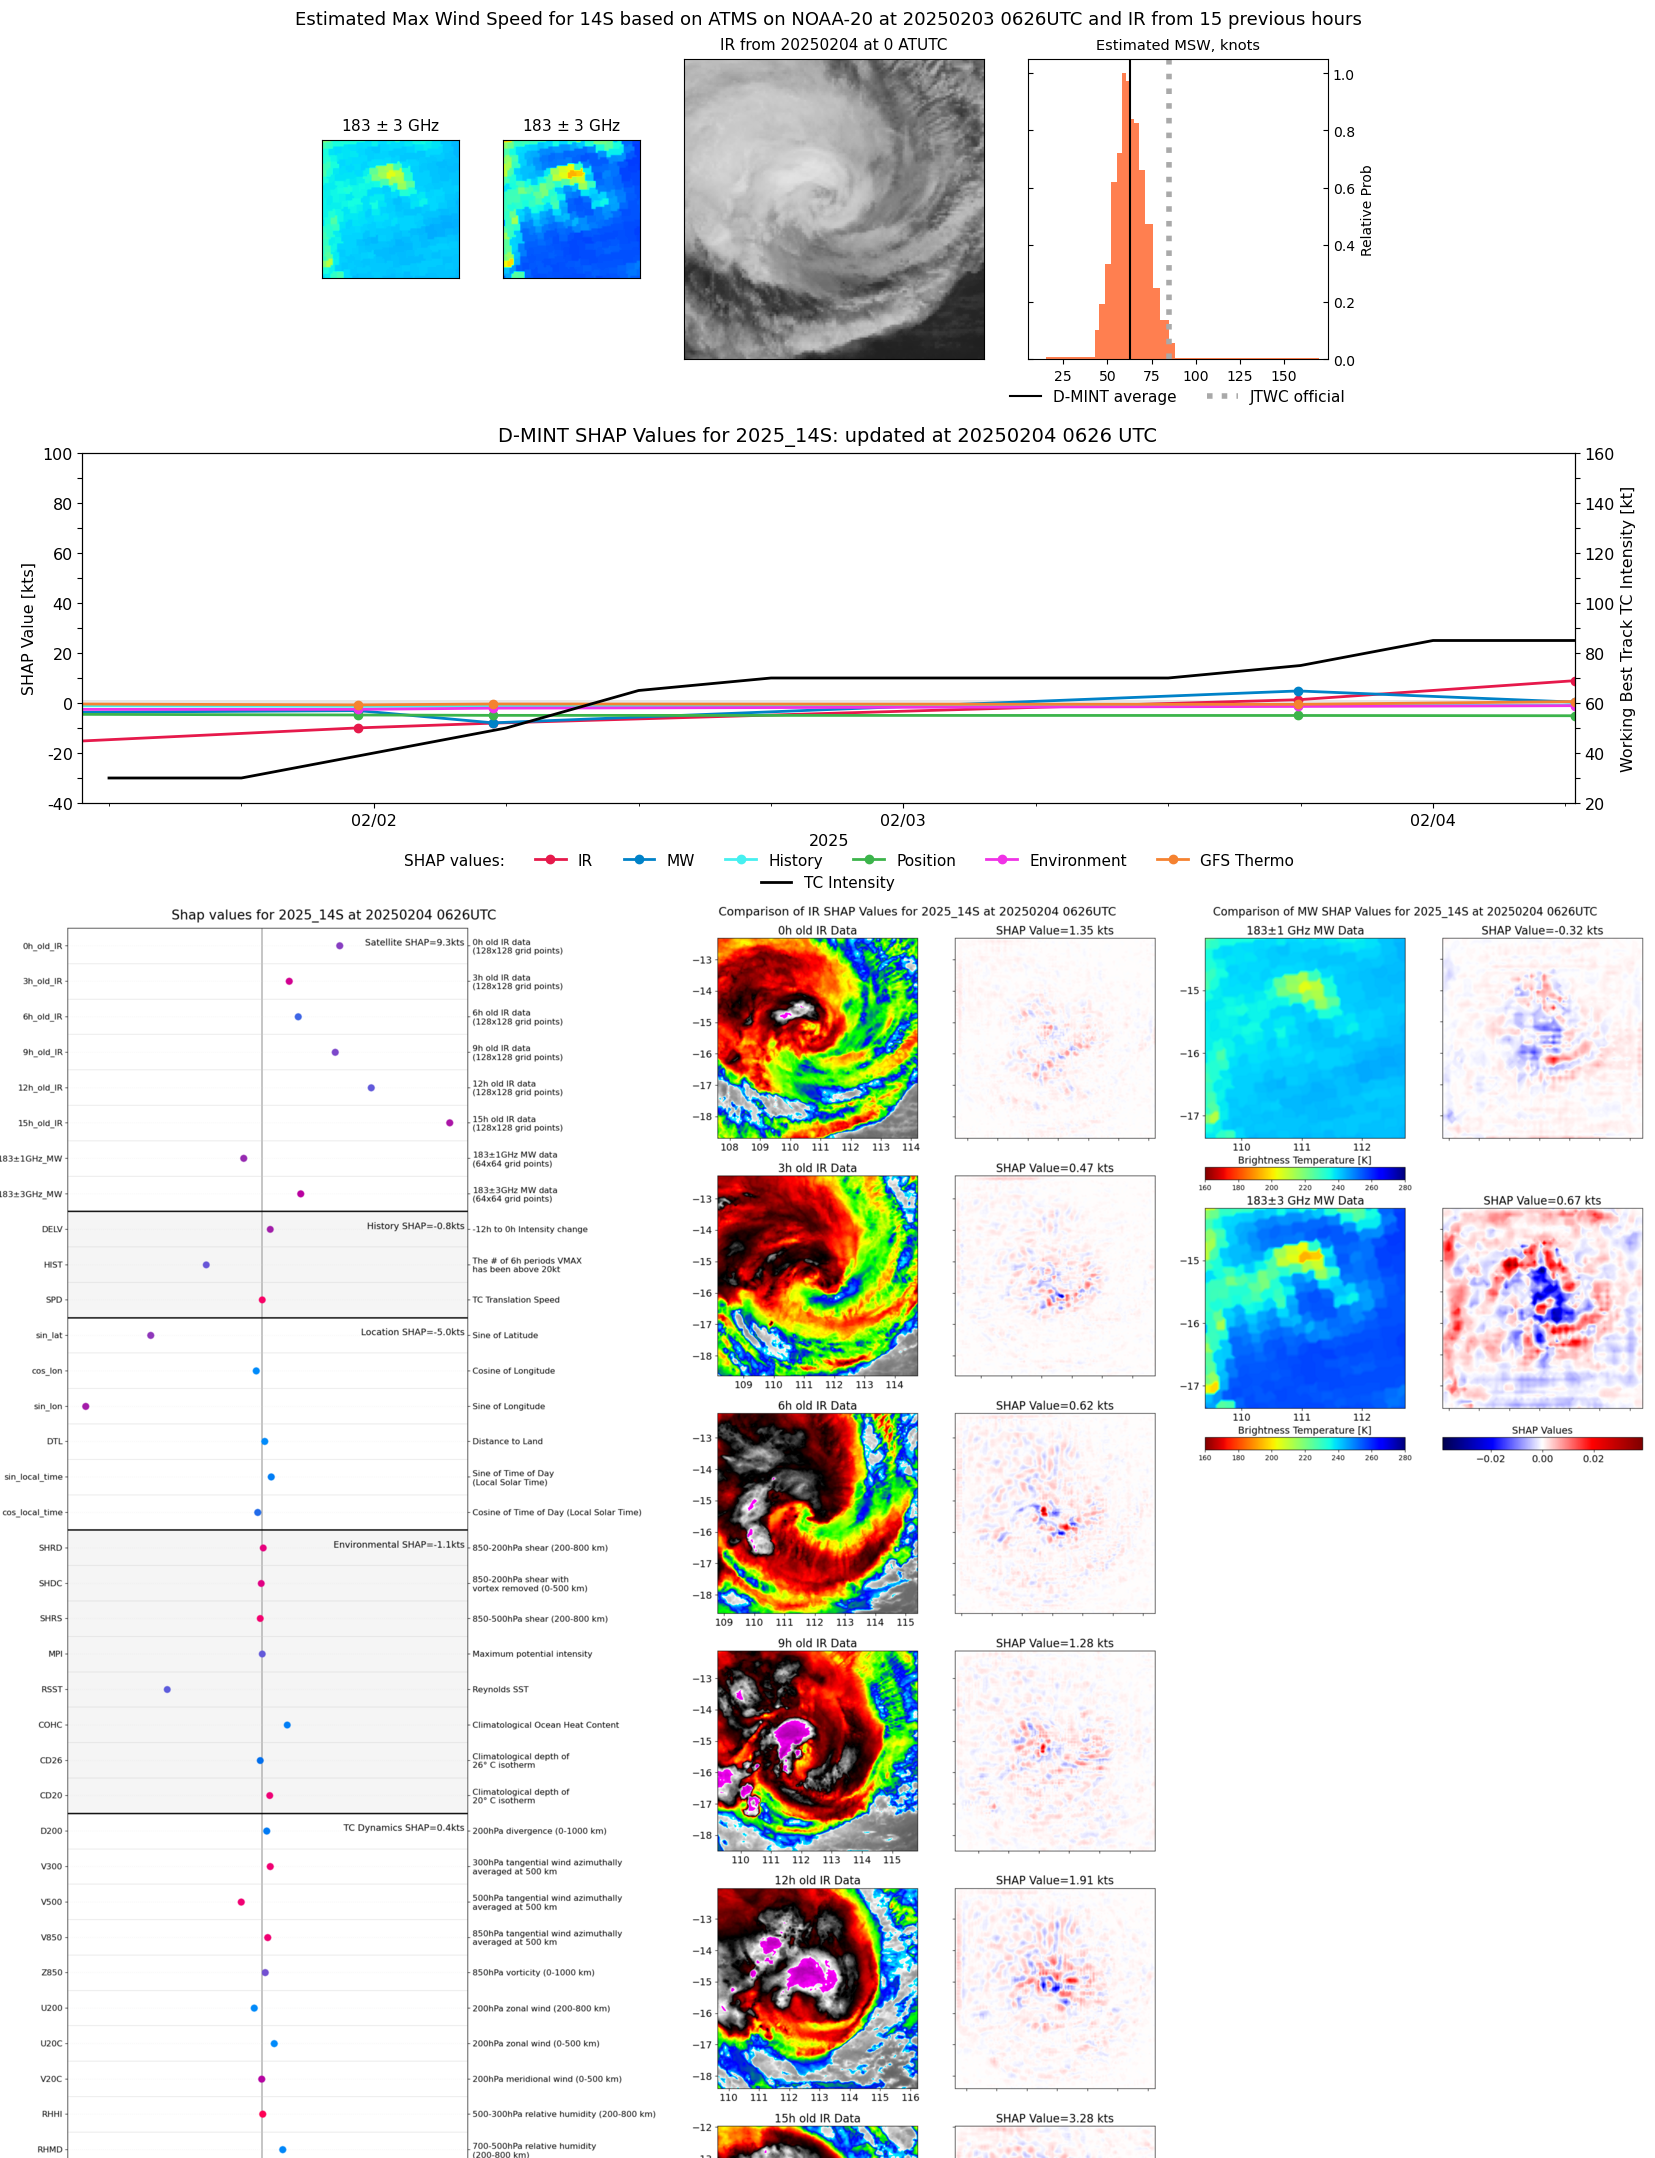 |
| 20250203 | 2304 UTC | SSMISF16 | 984 hPa | 52 kts | 46 kts | 58 kts |  |
| 20250203 | 2228 UTC | SSMISF17 | 982 hPa | 59 kts | 53 kts | 64 kts |  |
| 20250203 | 2023 UTC | SSMISF18 | 980 hPa | 57 kts | 51 kts | 63 kts | 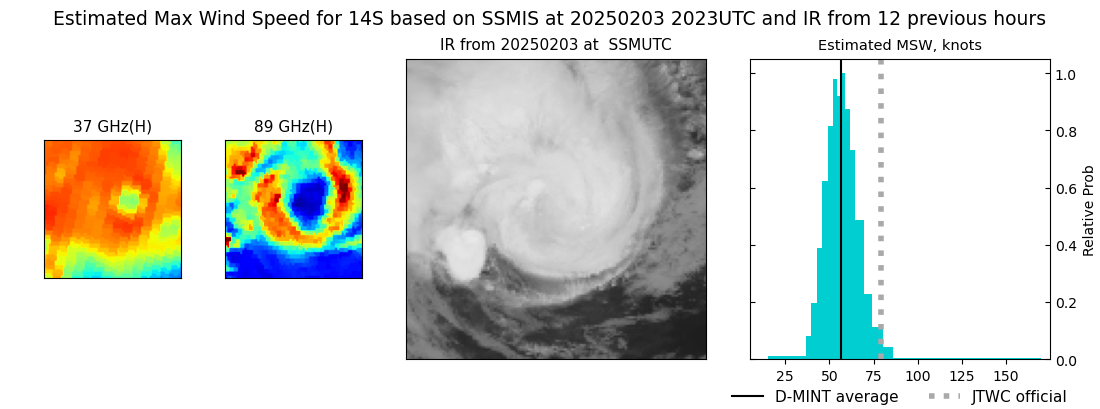 |
| 20250203 | 1936 UTC | TROPICS03 | 984 hPa | 56 kts | 50 kts | 62 kts | 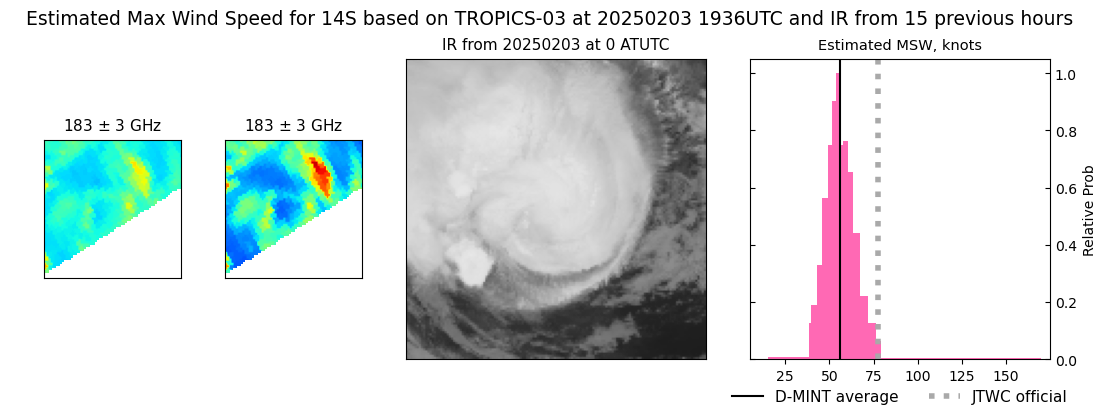 |
| 20250203 | 1753 UTC | ATMS-N20 | 981 hPa | 58 kts | 52 kts | 64 kts | 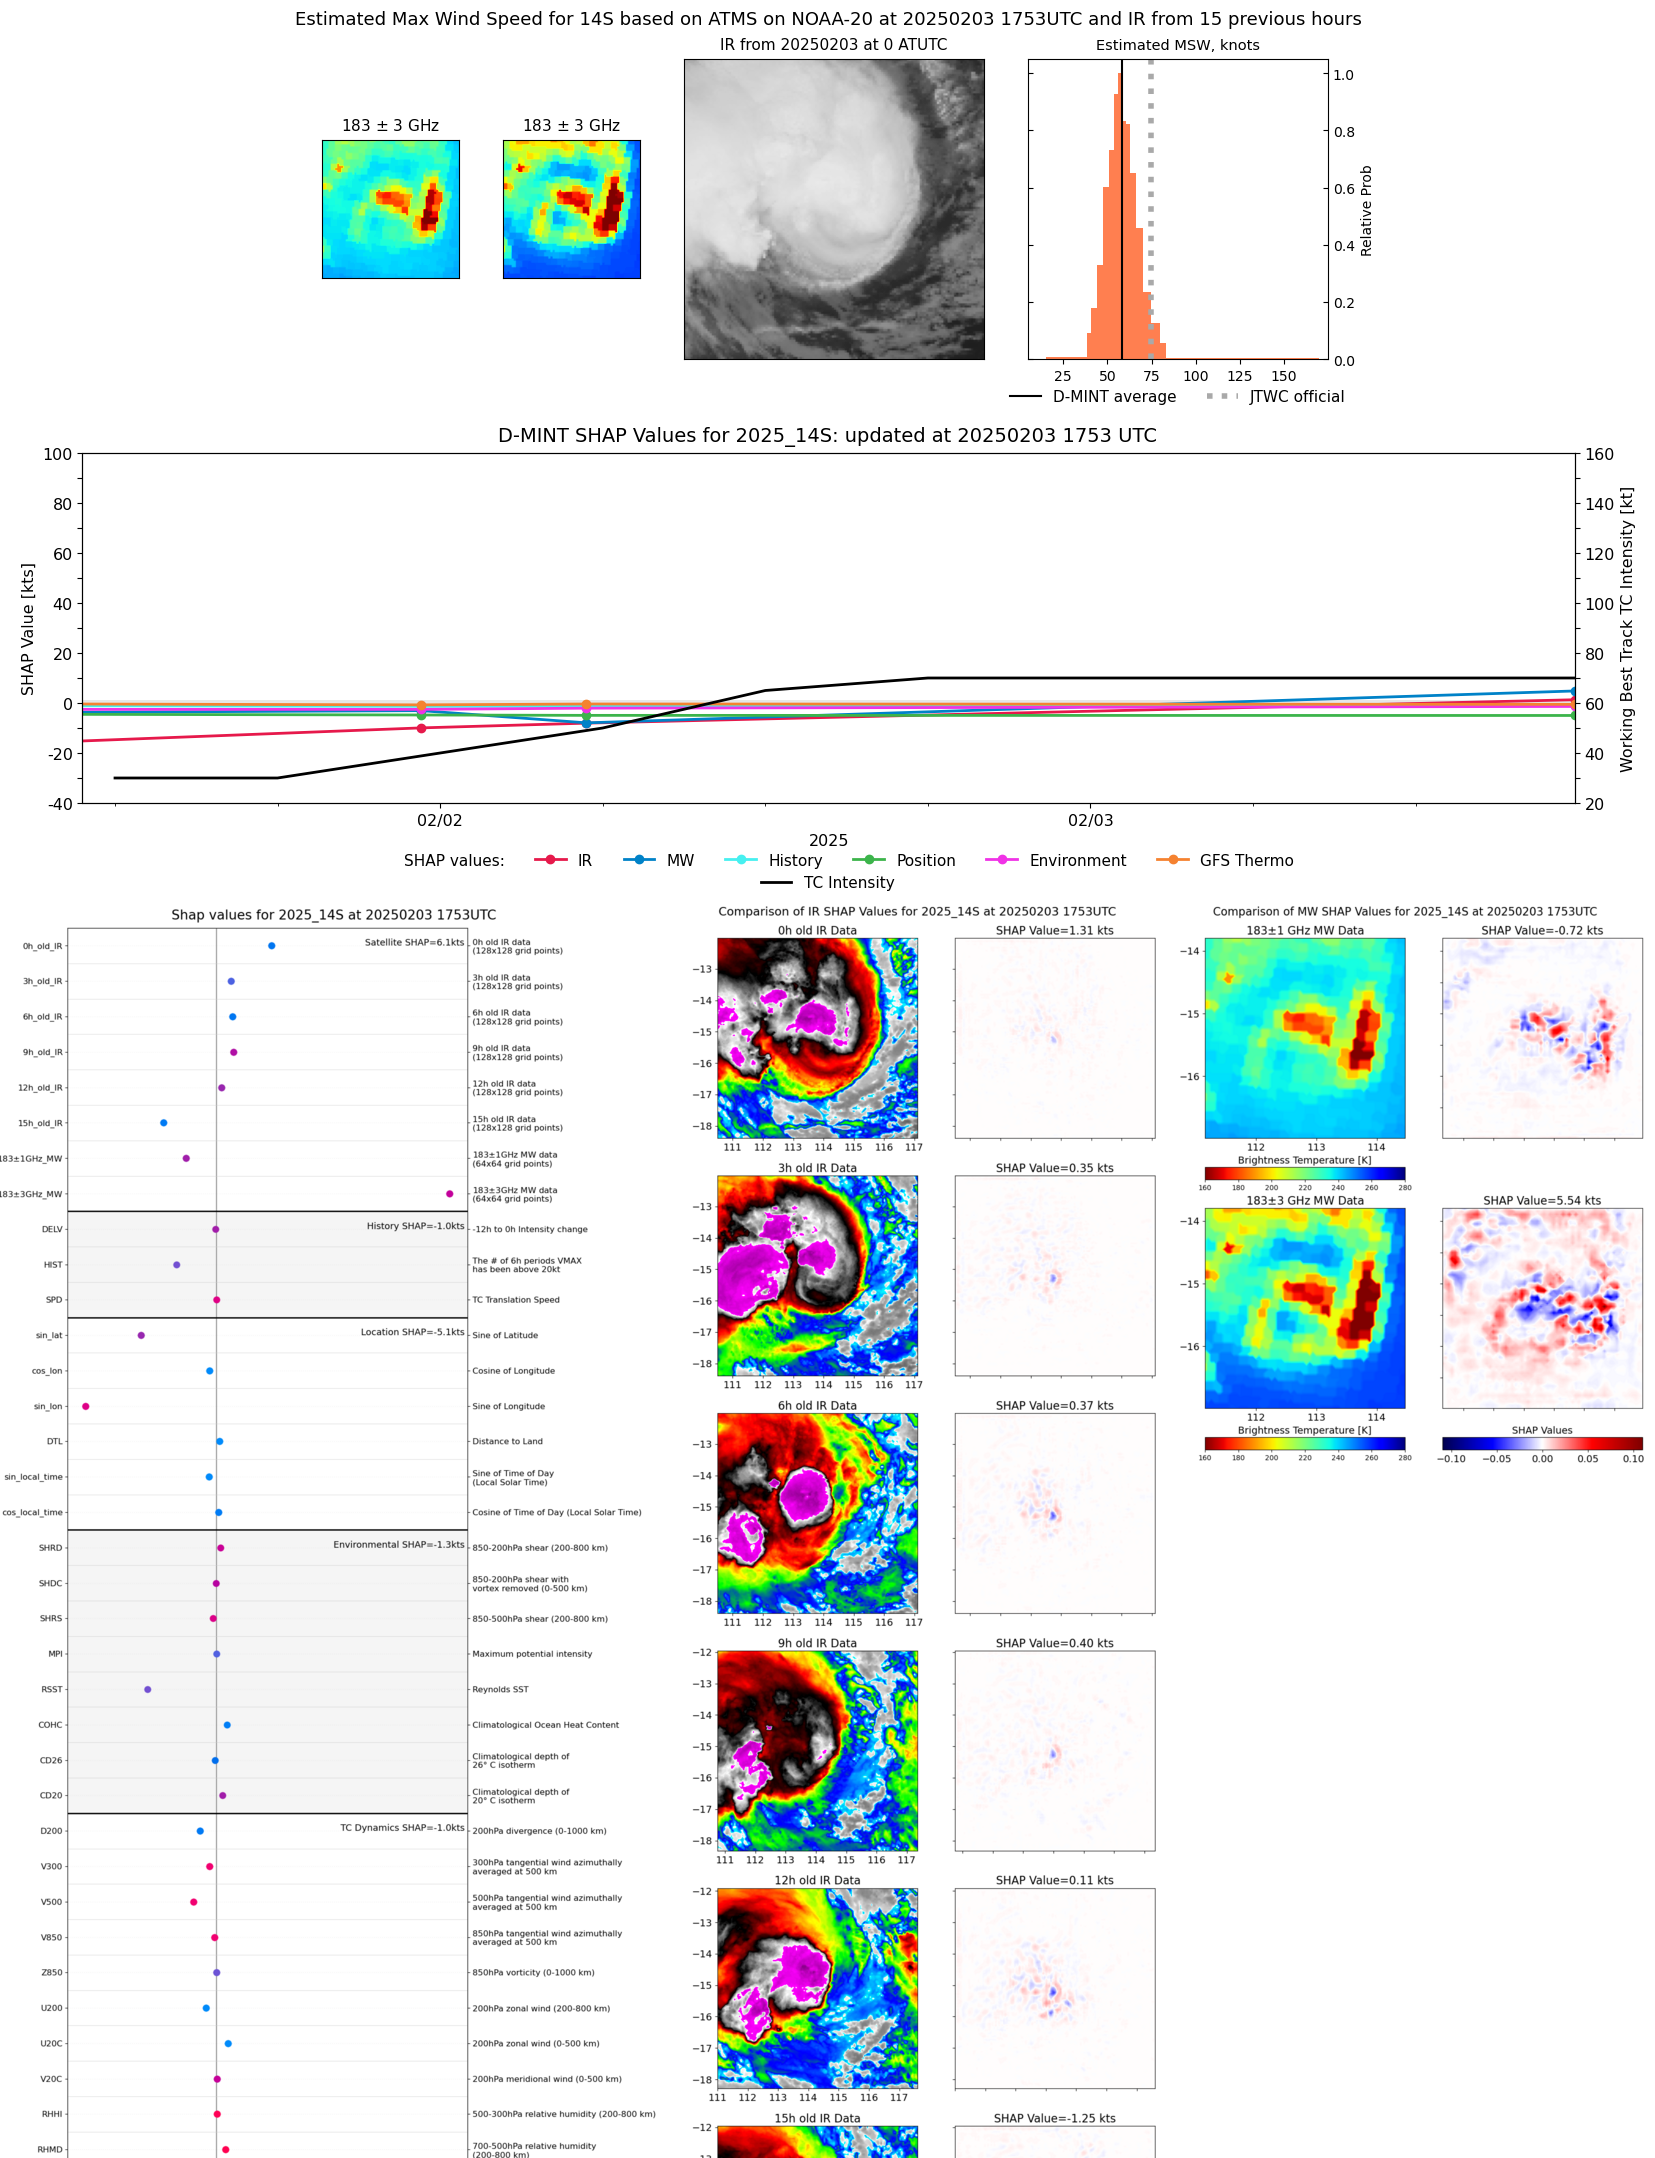 |
| 20250203 | 0631 UTC | AMSR2 | NaN hPa | 44 kts | 39 kts | 49 kts | 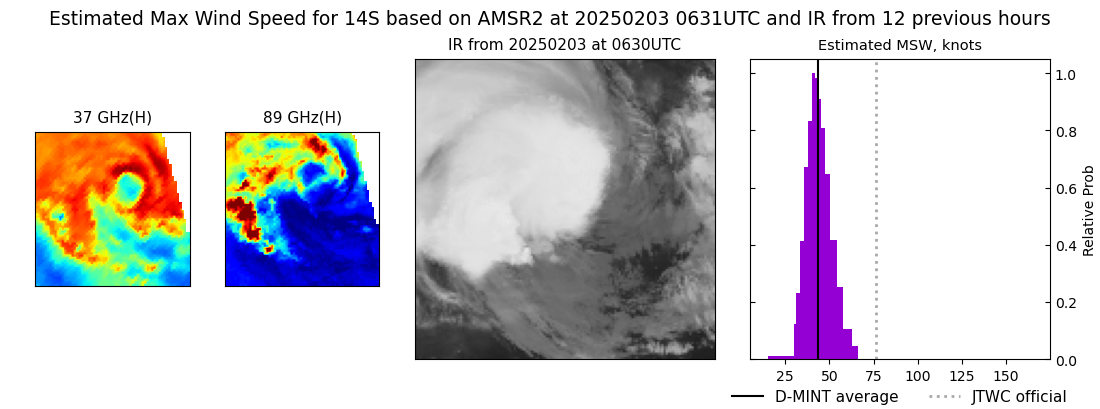 |
| 20250202 | 2242 UTC | SSMISF17 | 984 hPa | 56 kts | 51 kts | 62 kts | 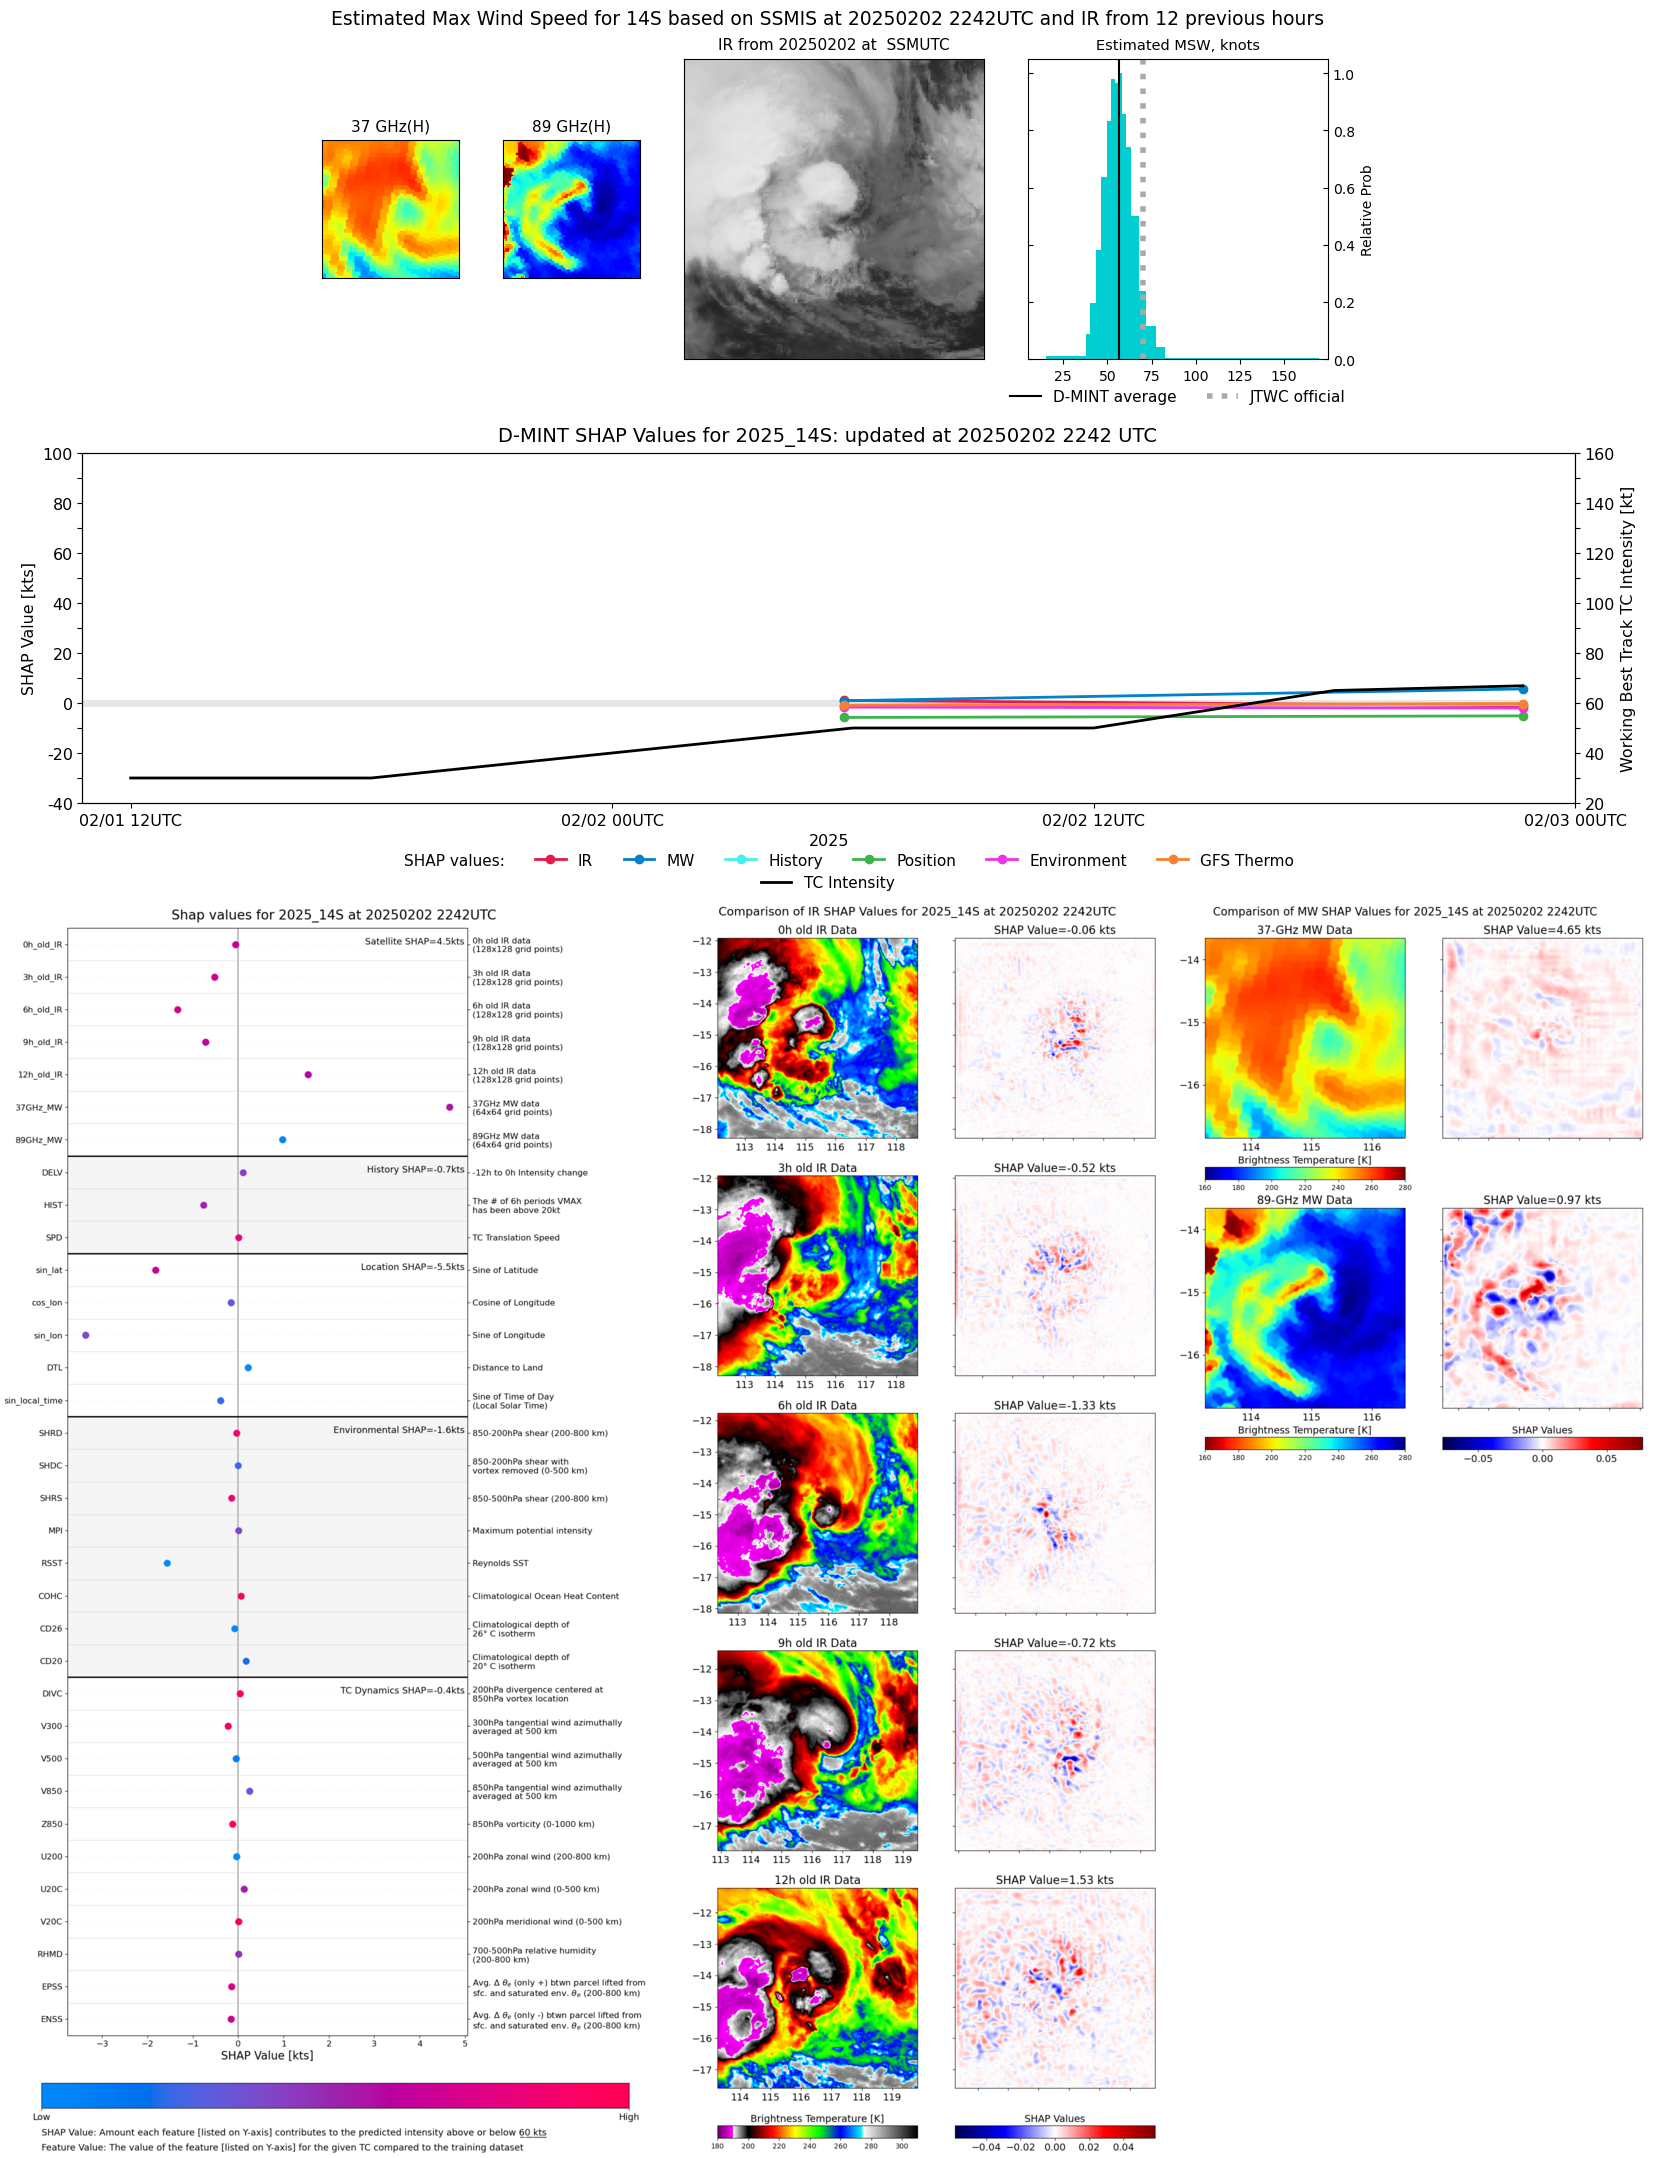 |
| 20250202 | 1913 UTC | GMI | NaN hPa | 57 kts | 51 kts | 64 kts | 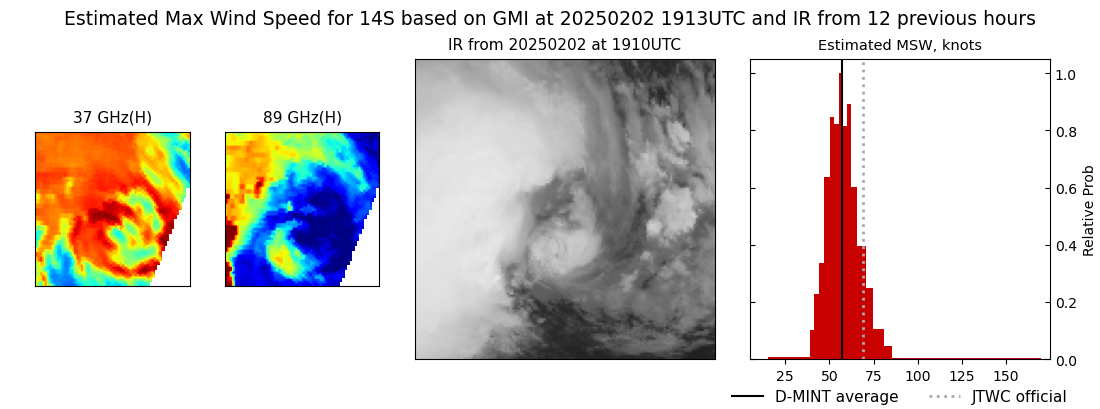 |
| 20250202 | 1025 UTC | SSMISF16 | 992 hPa | 46 kts | 40 kts | 53 kts | 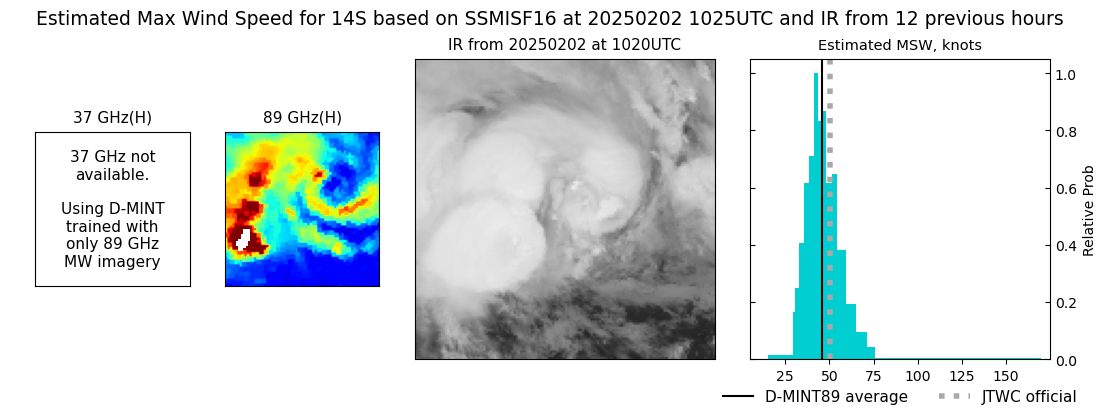 |
| 20250202 | 0547 UTC | AMSR2 | 989 hPa | 52 kts | 46 kts | 59 kts | 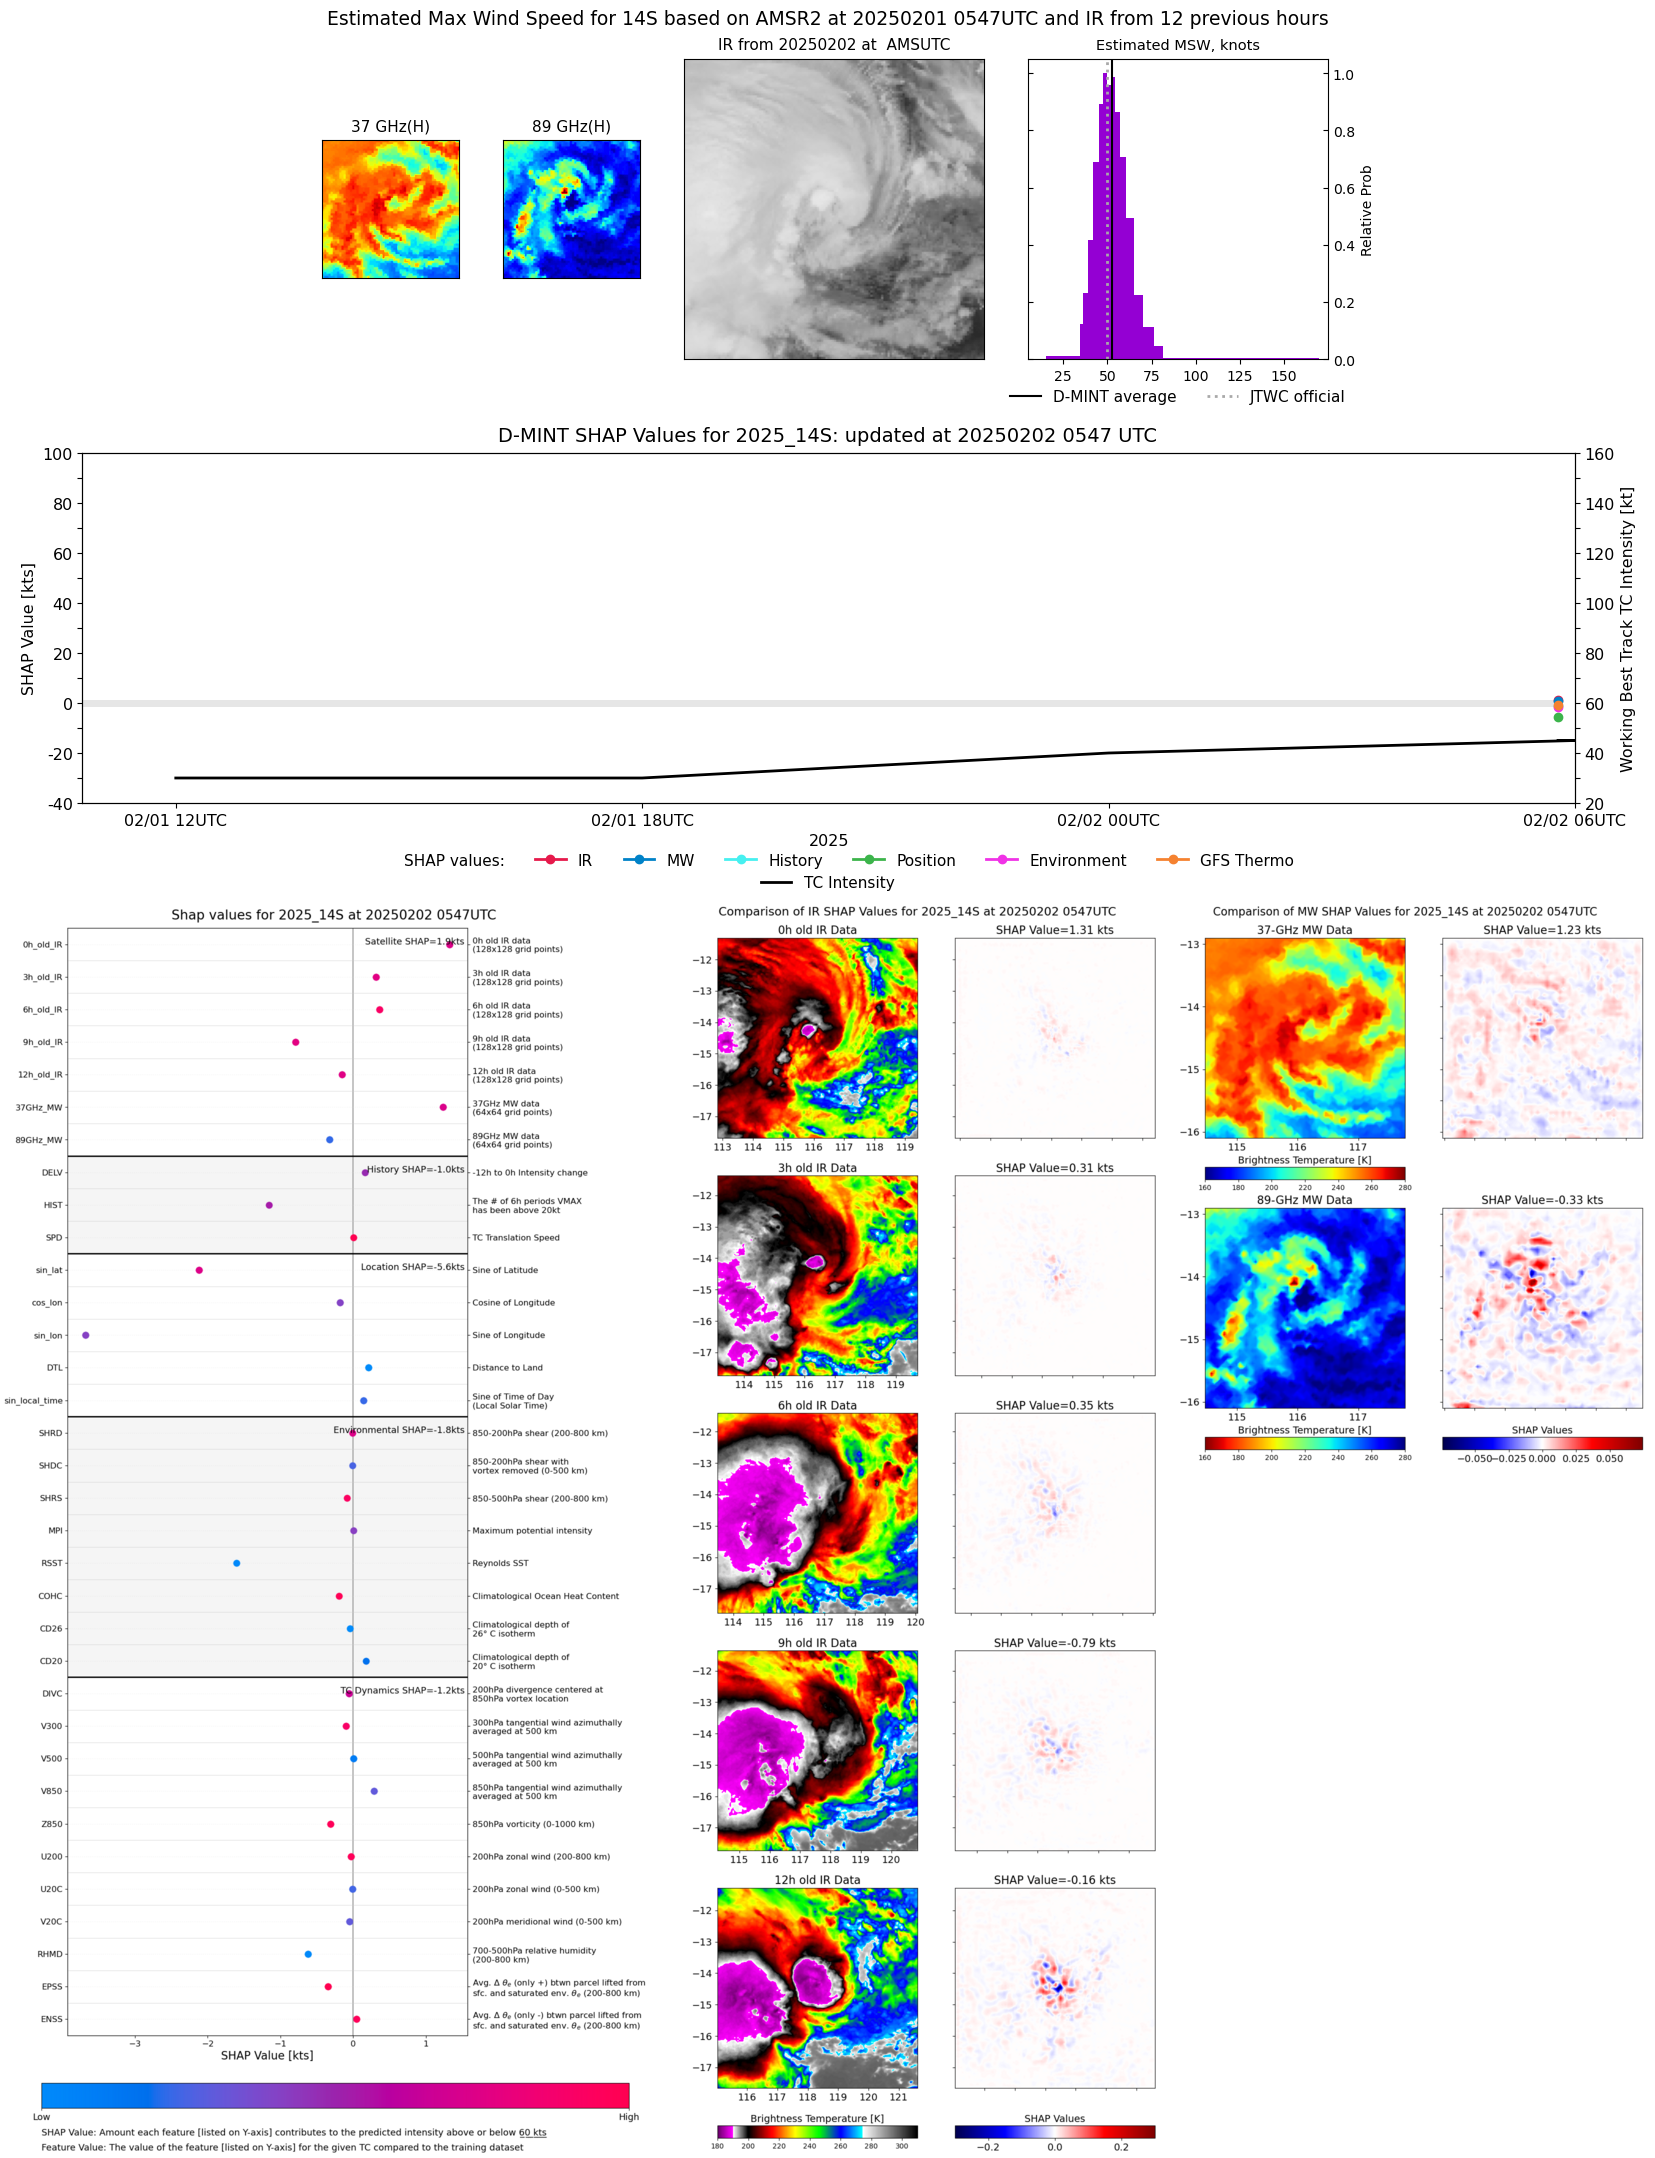 |
| 20250202 | 0524 UTC | ATMS-N20 | 998 hPa | 35 kts | 30 kts | 39 kts | 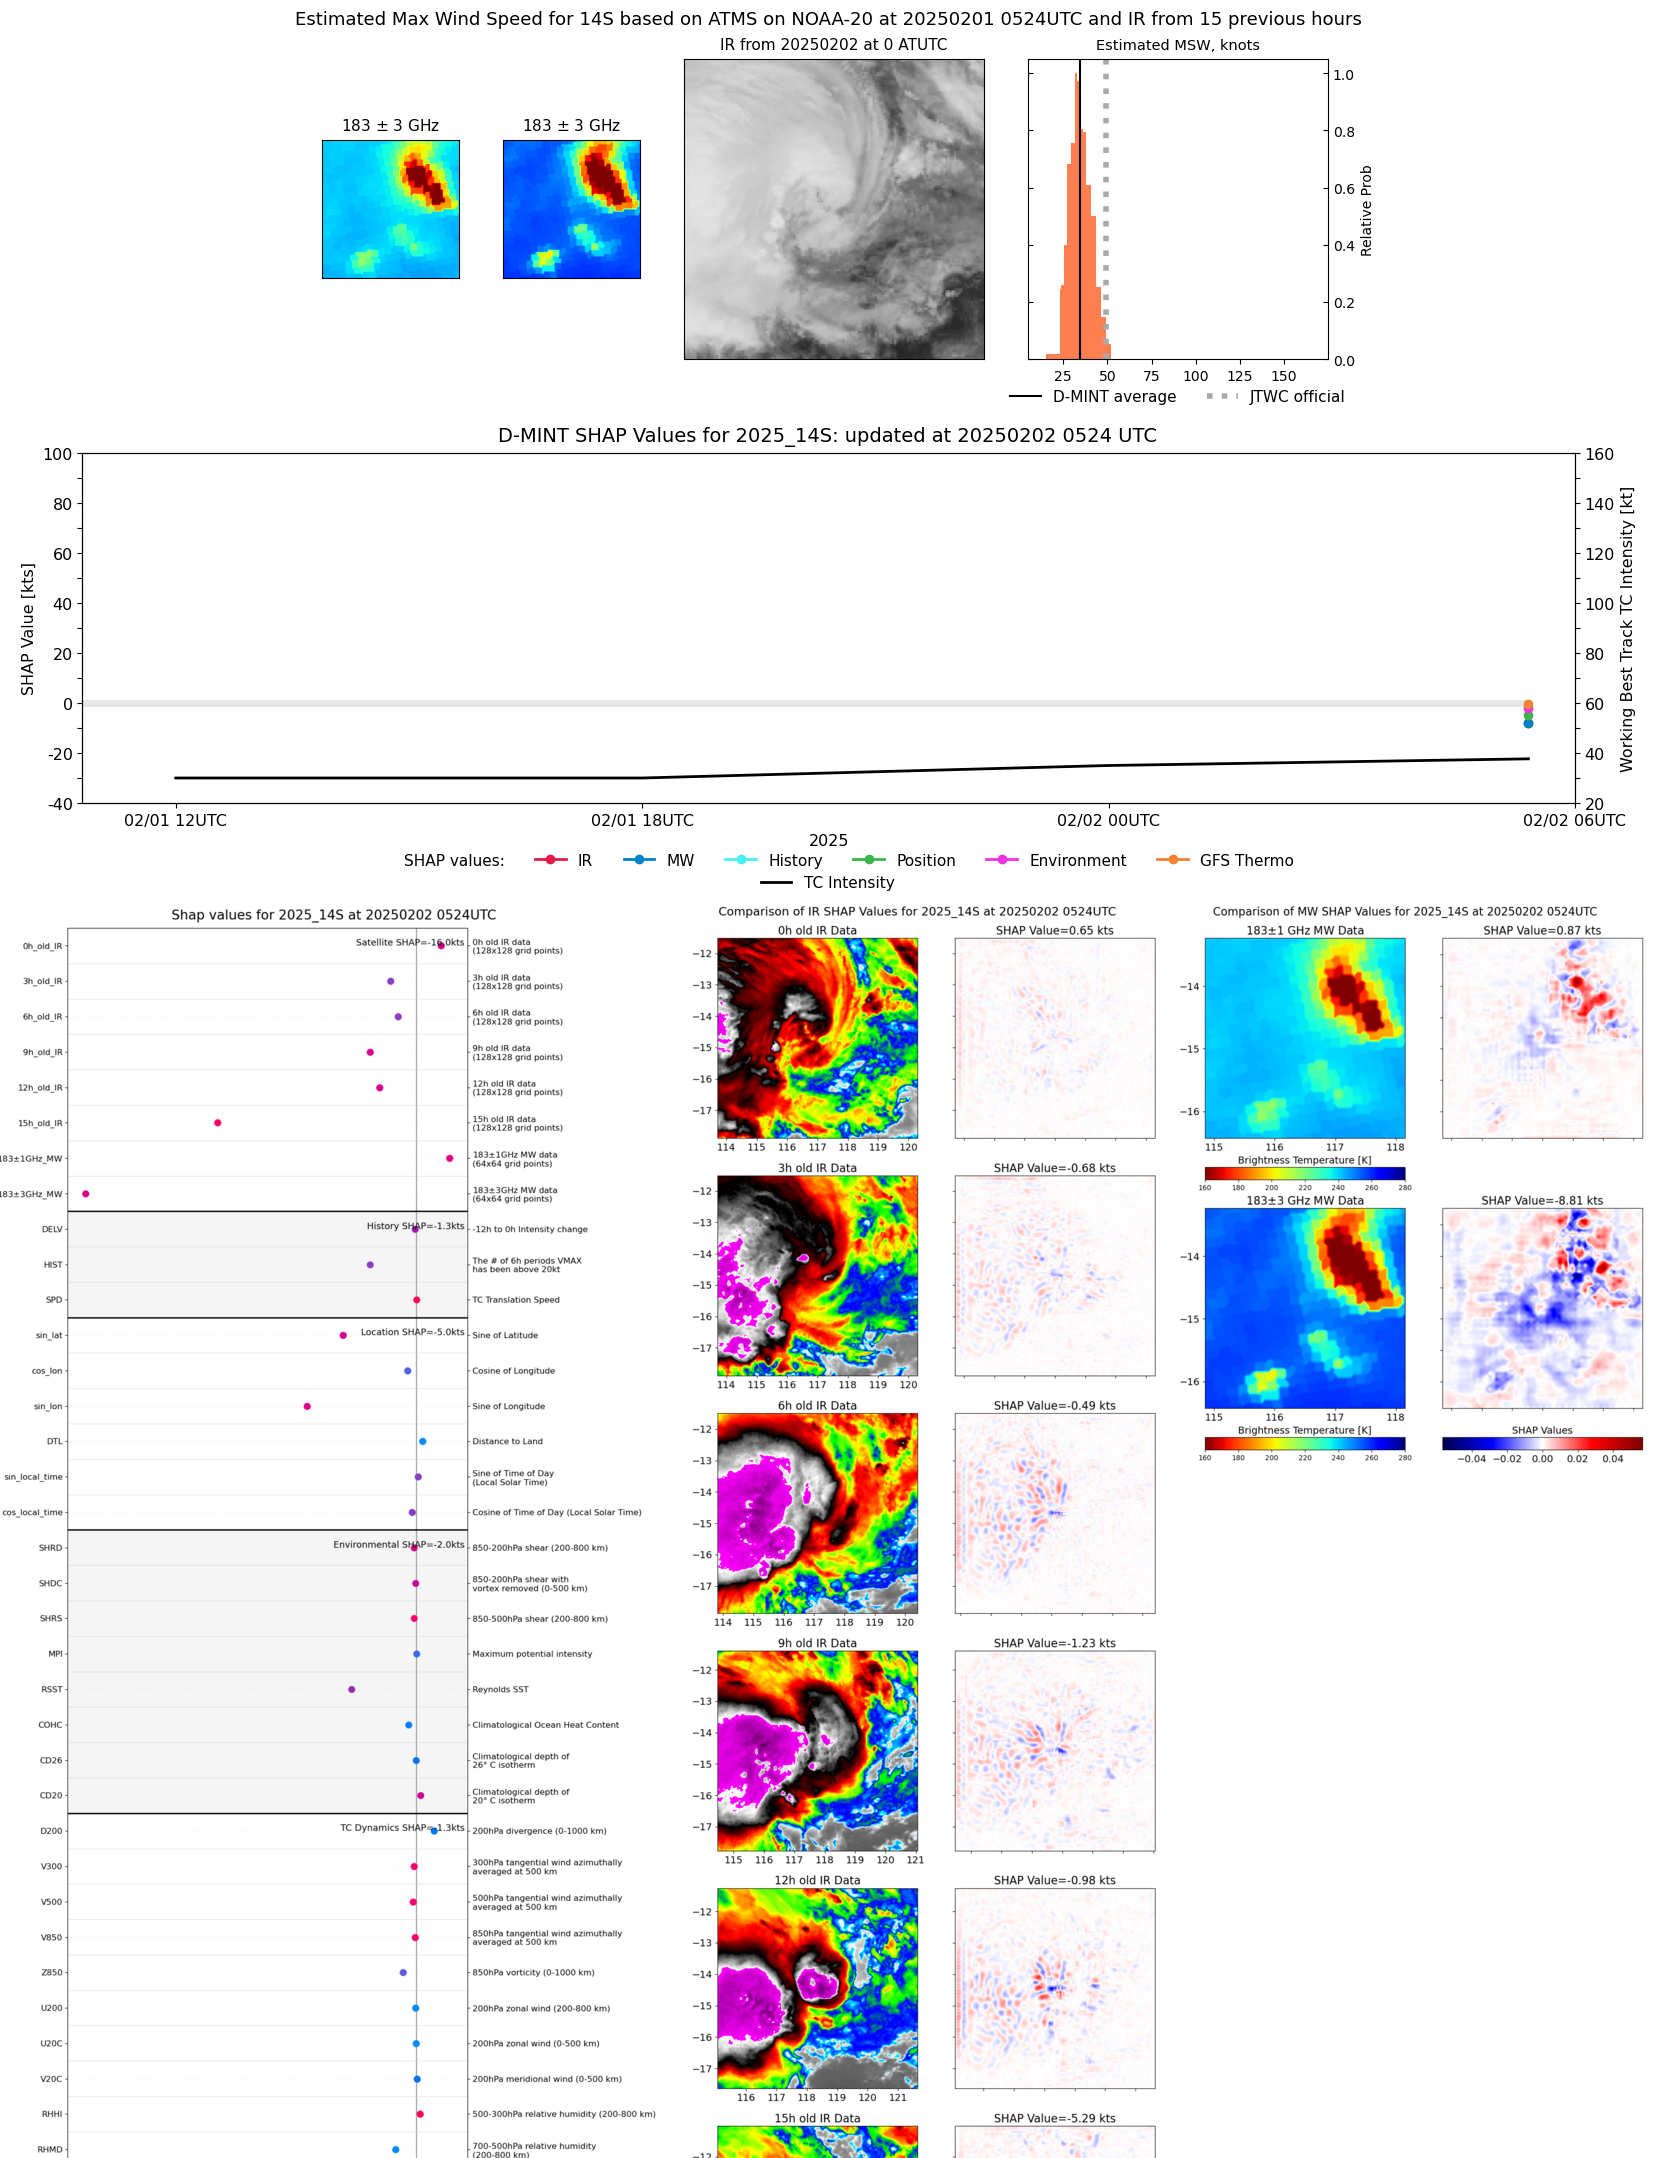 |
| 20250201 | 2318 UTC | TROPICS05 | 996 hPa | 37 kts | 33 kts | 41 kts | 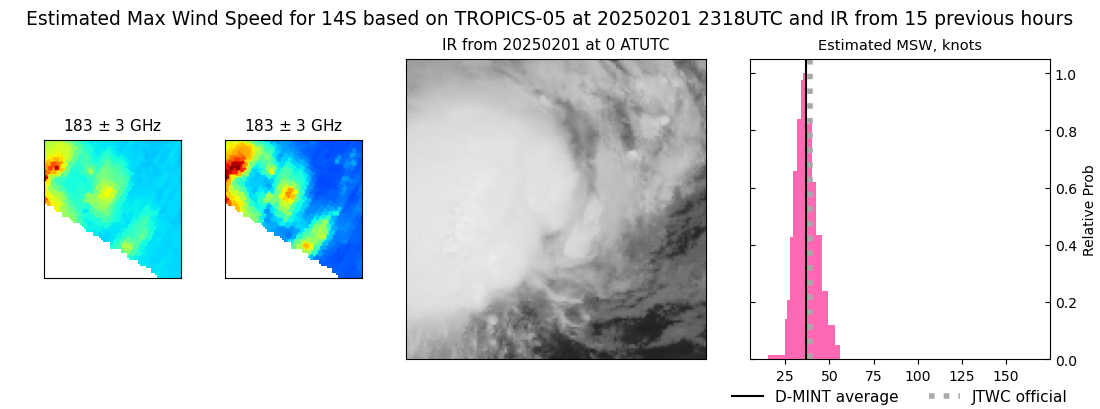 |
| 20250201 | 0542 UTC | ATMS-N20 | 1001 hPa | 24 kts | 21 kts | 27 kts | 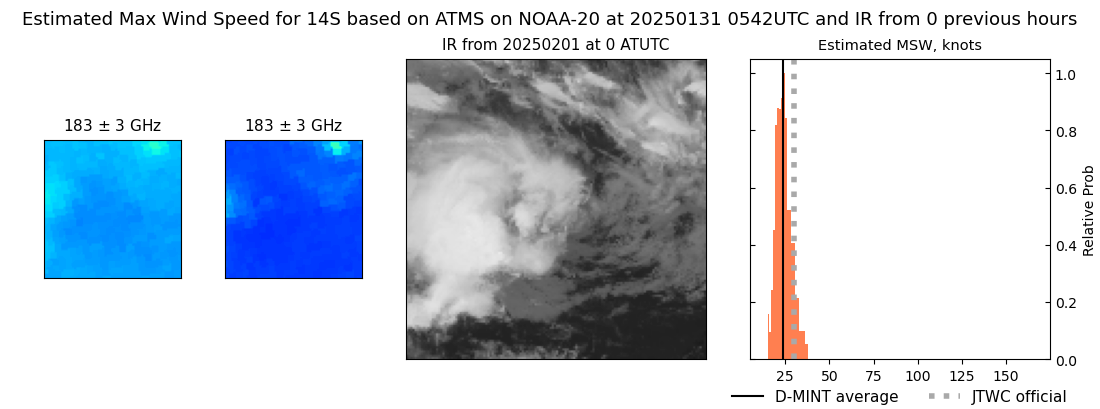 |
| 20250131 | 2357 UTC | TROPICS05 | 1002 hPa | 27 kts | 24 kts | 31 kts | 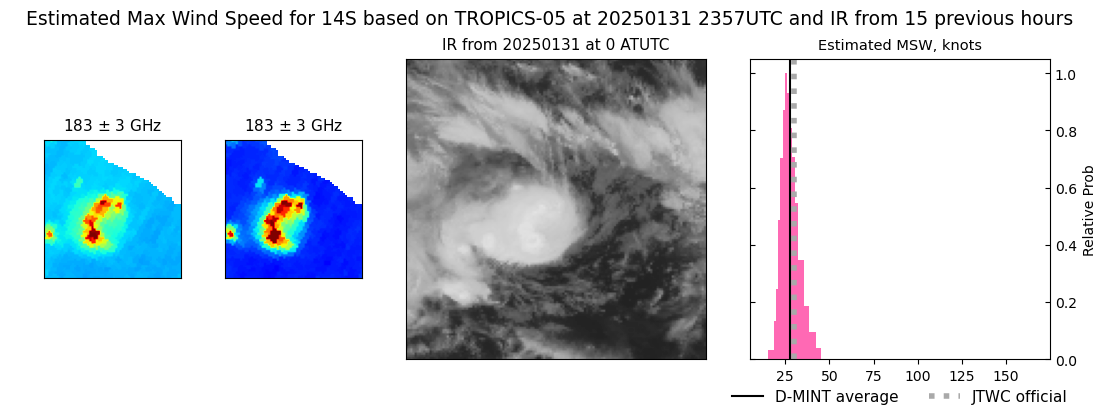 |