|
||

 |
D-MINT HISTORY FILE for 2025_16E
| Date | Time | MW Sensor | MSLP | Vmax (30th-70th percentile average) | Vmax 25th percentile | Vmax 75th percentile | Image |
| 20251010 | 2123 UTC | AMSR2 | 1006 hPa | 30 kts | 27 kts | 34 kts |  |
| 20251010 | 2100 UTC | TMS07 | 1004 hPa | 31 kts | 28 kts | 35 kts | 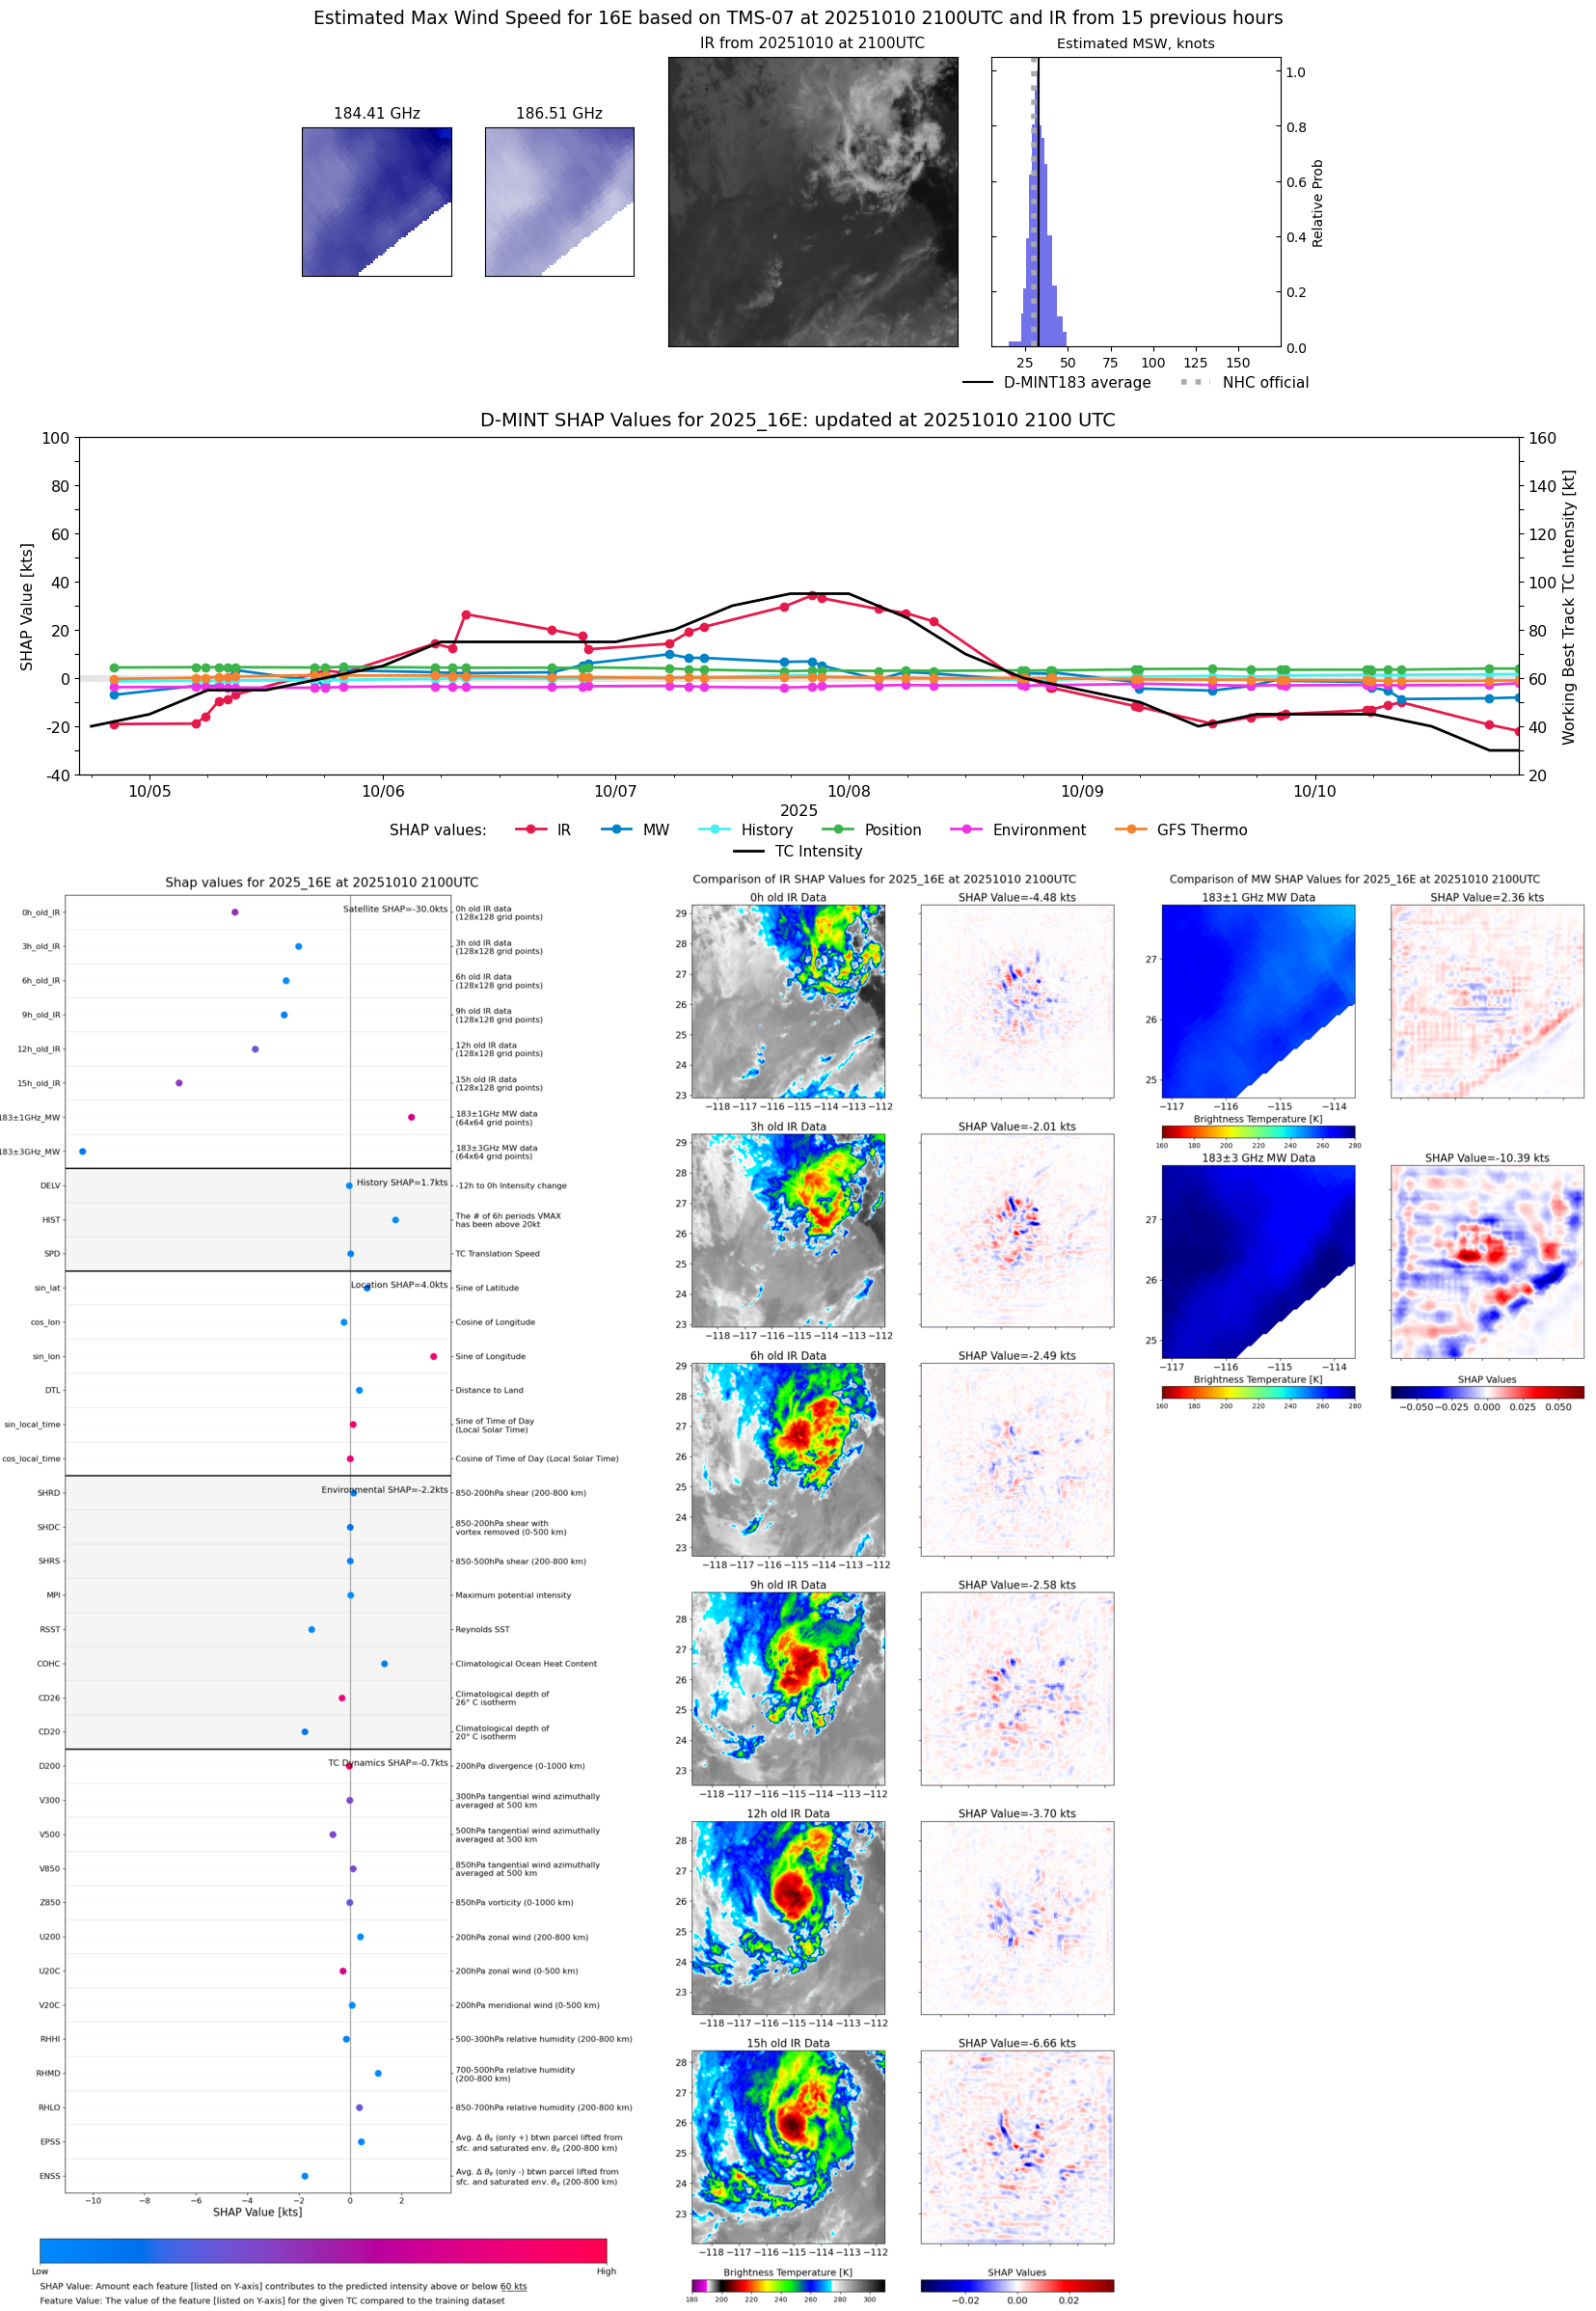 |
| 20251010 | 2100 UTC | ATMS-N21 | 1004 hPa | 31 kts | 28 kts | 35 kts | 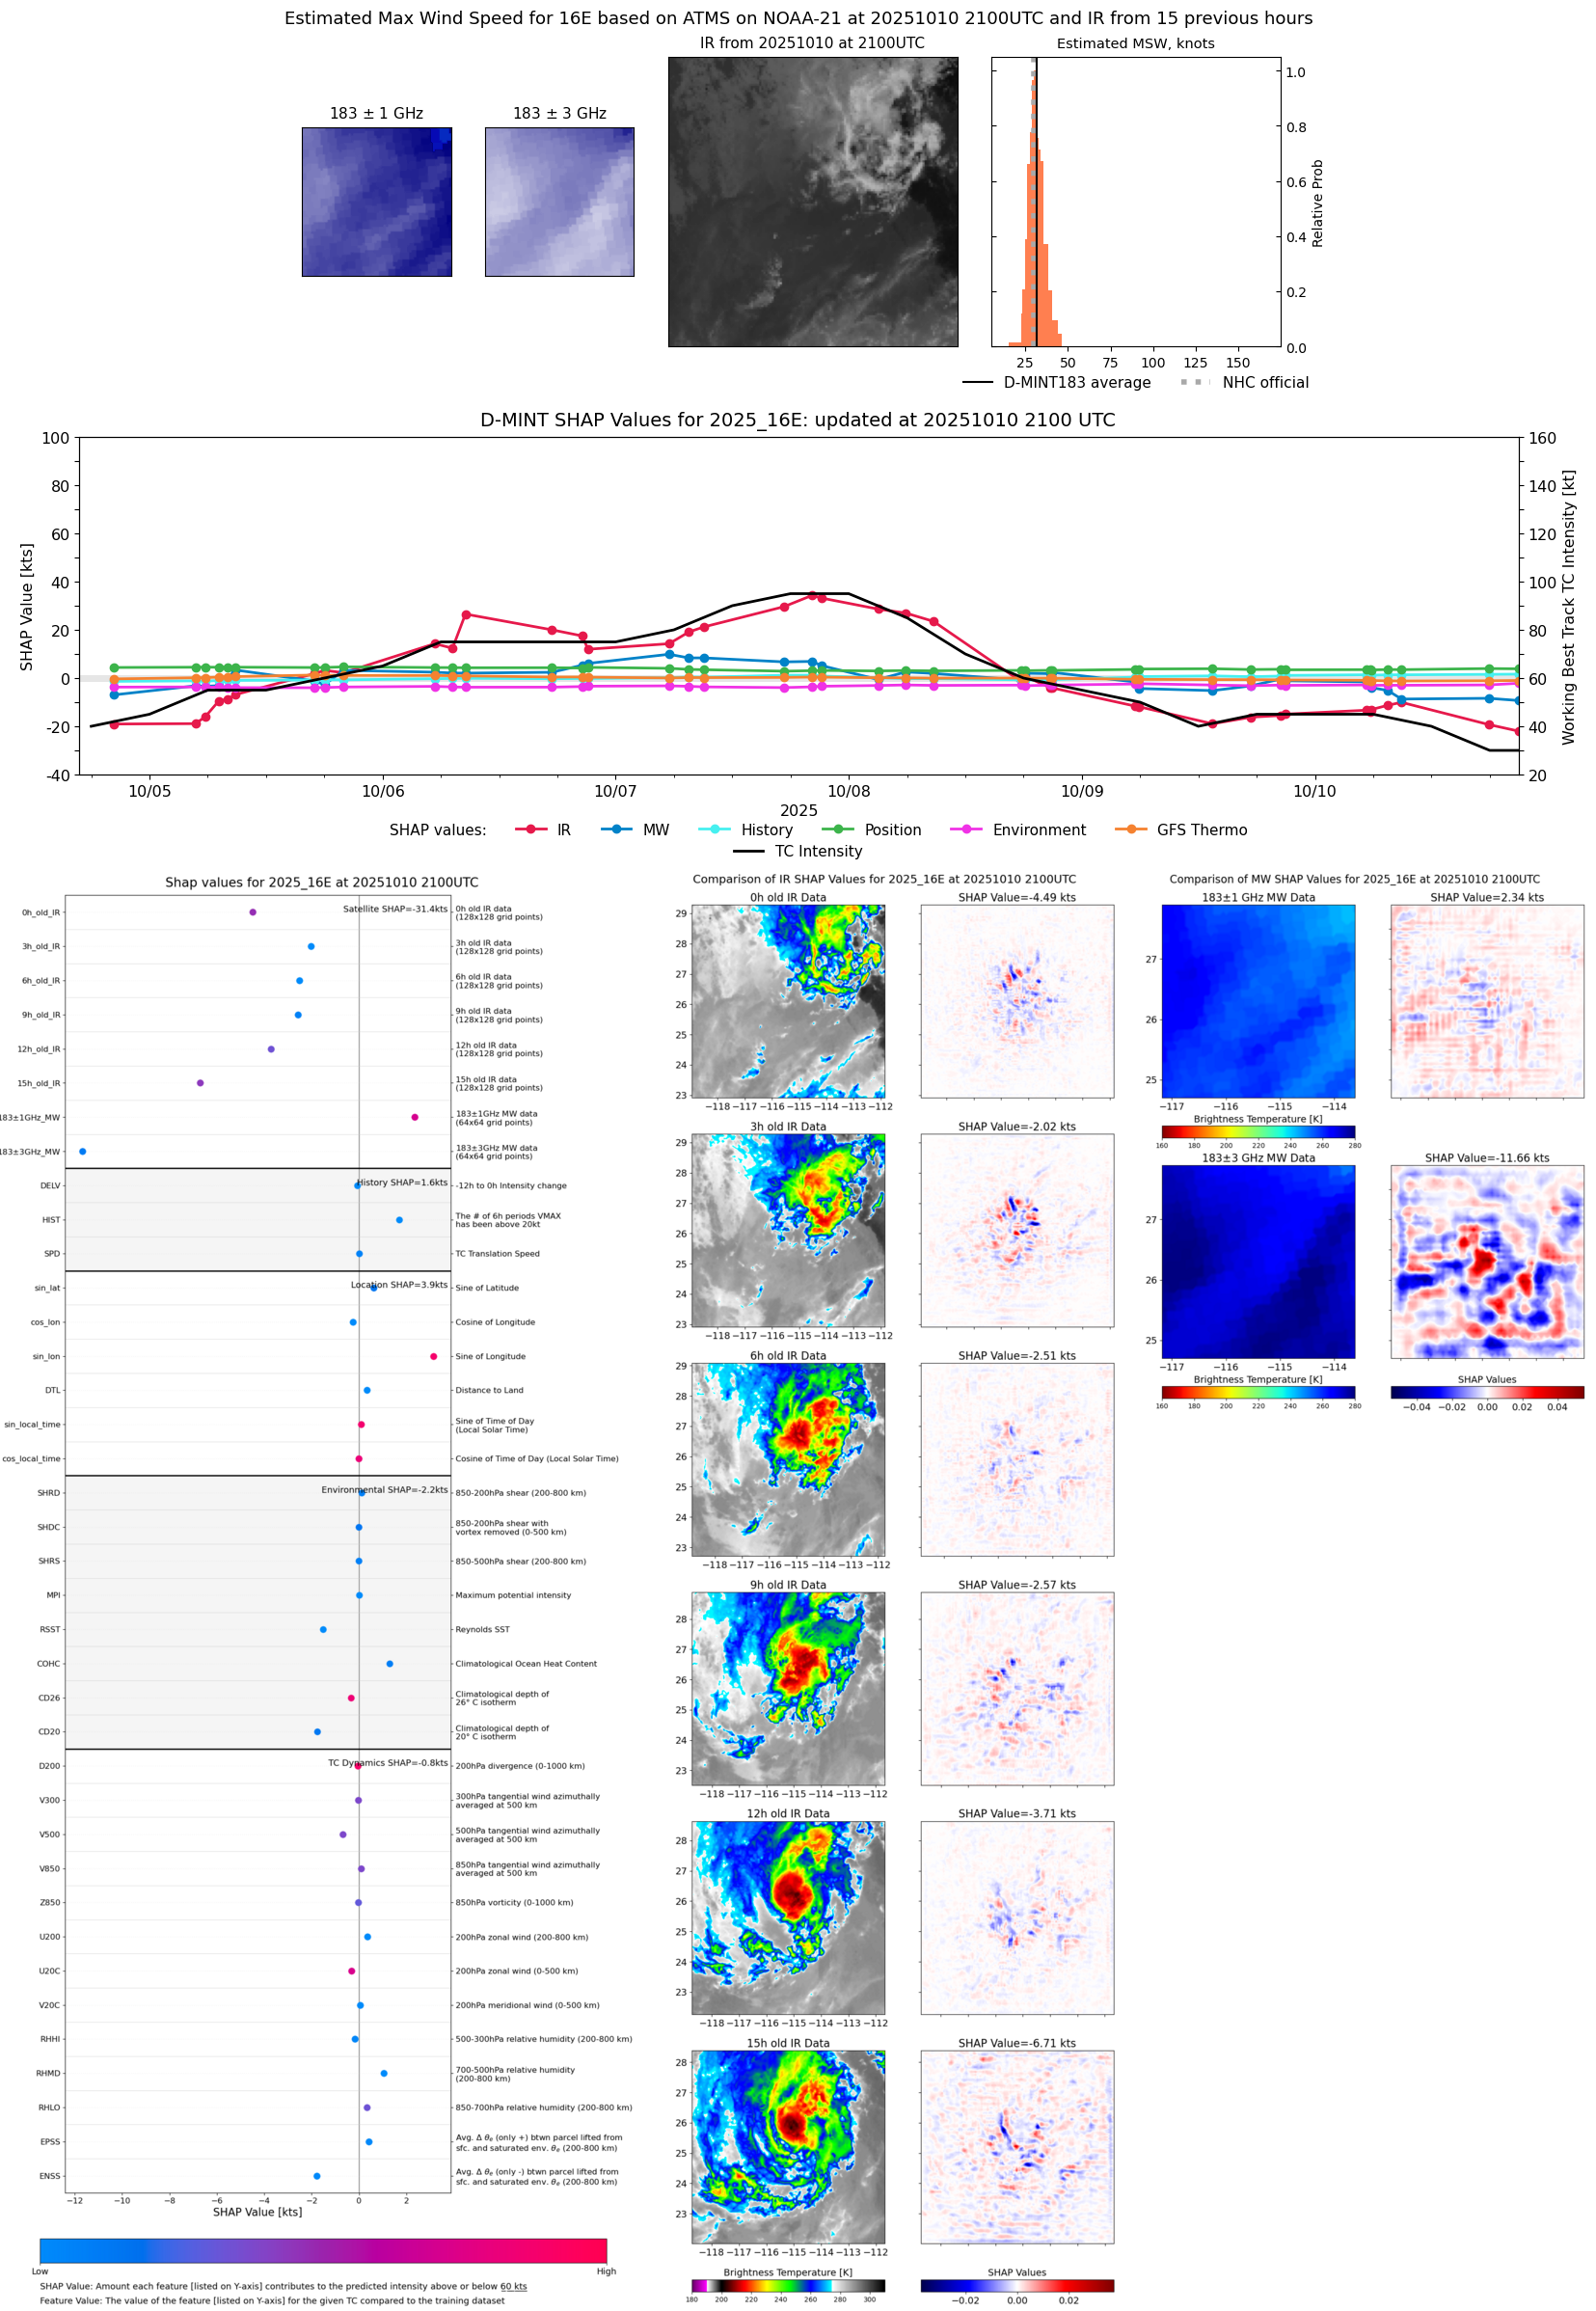 |
| 20251010 | 1753 UTC | TMS05 | 1002 hPa | 34 kts | 31 kts | 38 kts |  |
| 20251010 | 1447 UTC | SSMISF16 | 1001 hPa | 37 kts | 33 kts | 42 kts |  |
| 20251010 | 1407 UTC | WSFM01 | 1001 hPa | 40 kts | 35 kts | 45 kts | 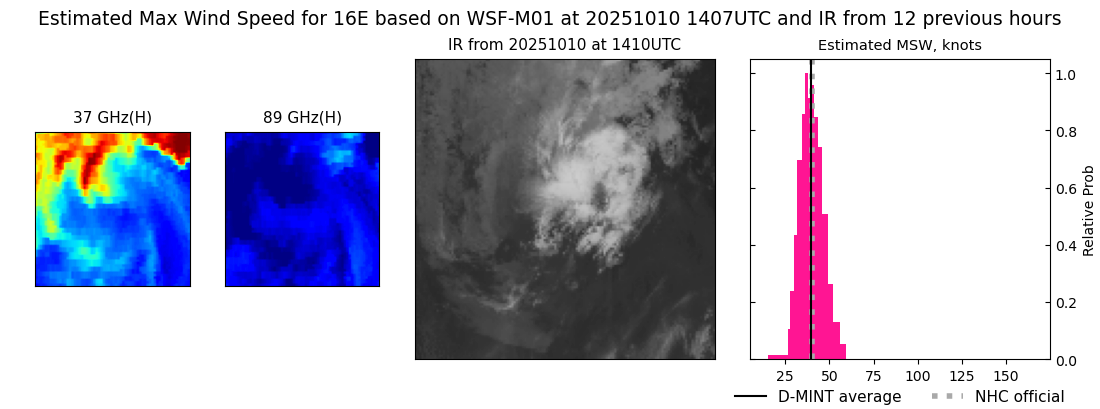 |
| 20251010 | 1353 UTC | SSMISF17 | 1003 hPa | 38 kts | 33 kts | 42 kts | 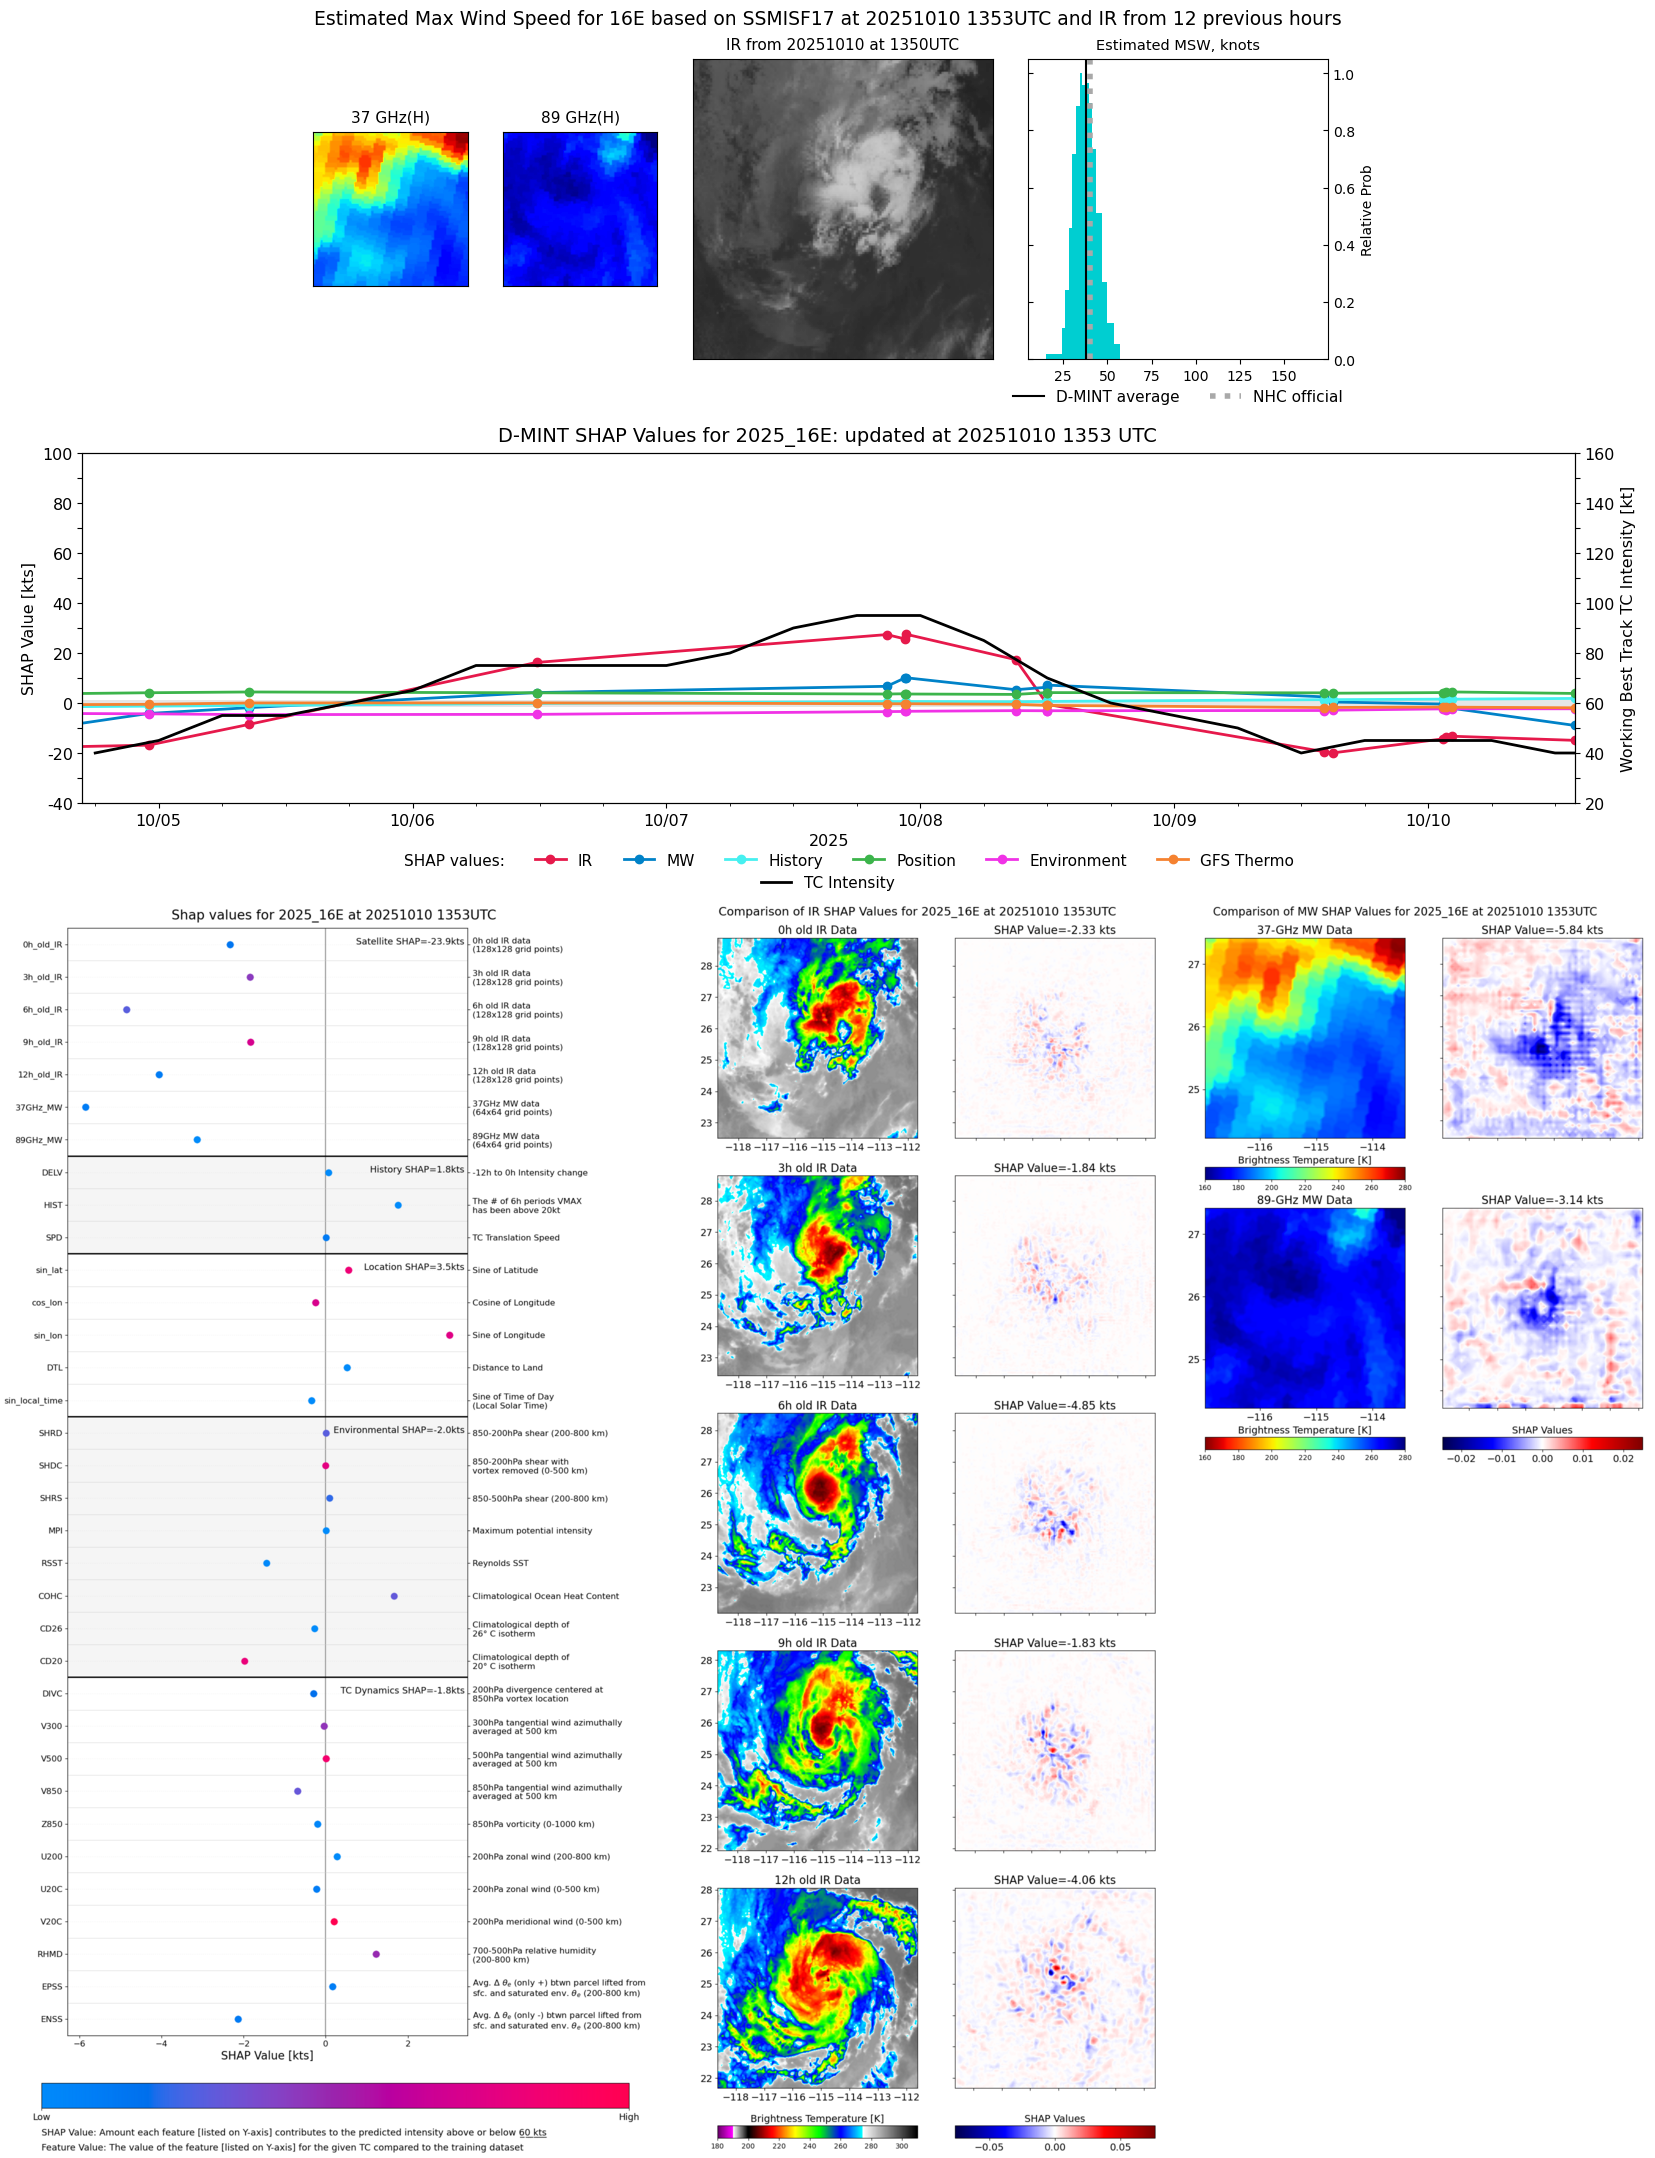 |
| 20251010 | 0855 UTC | ATMS-N20 | 1000 hPa | 42 kts | 38 kts | 46 kts | 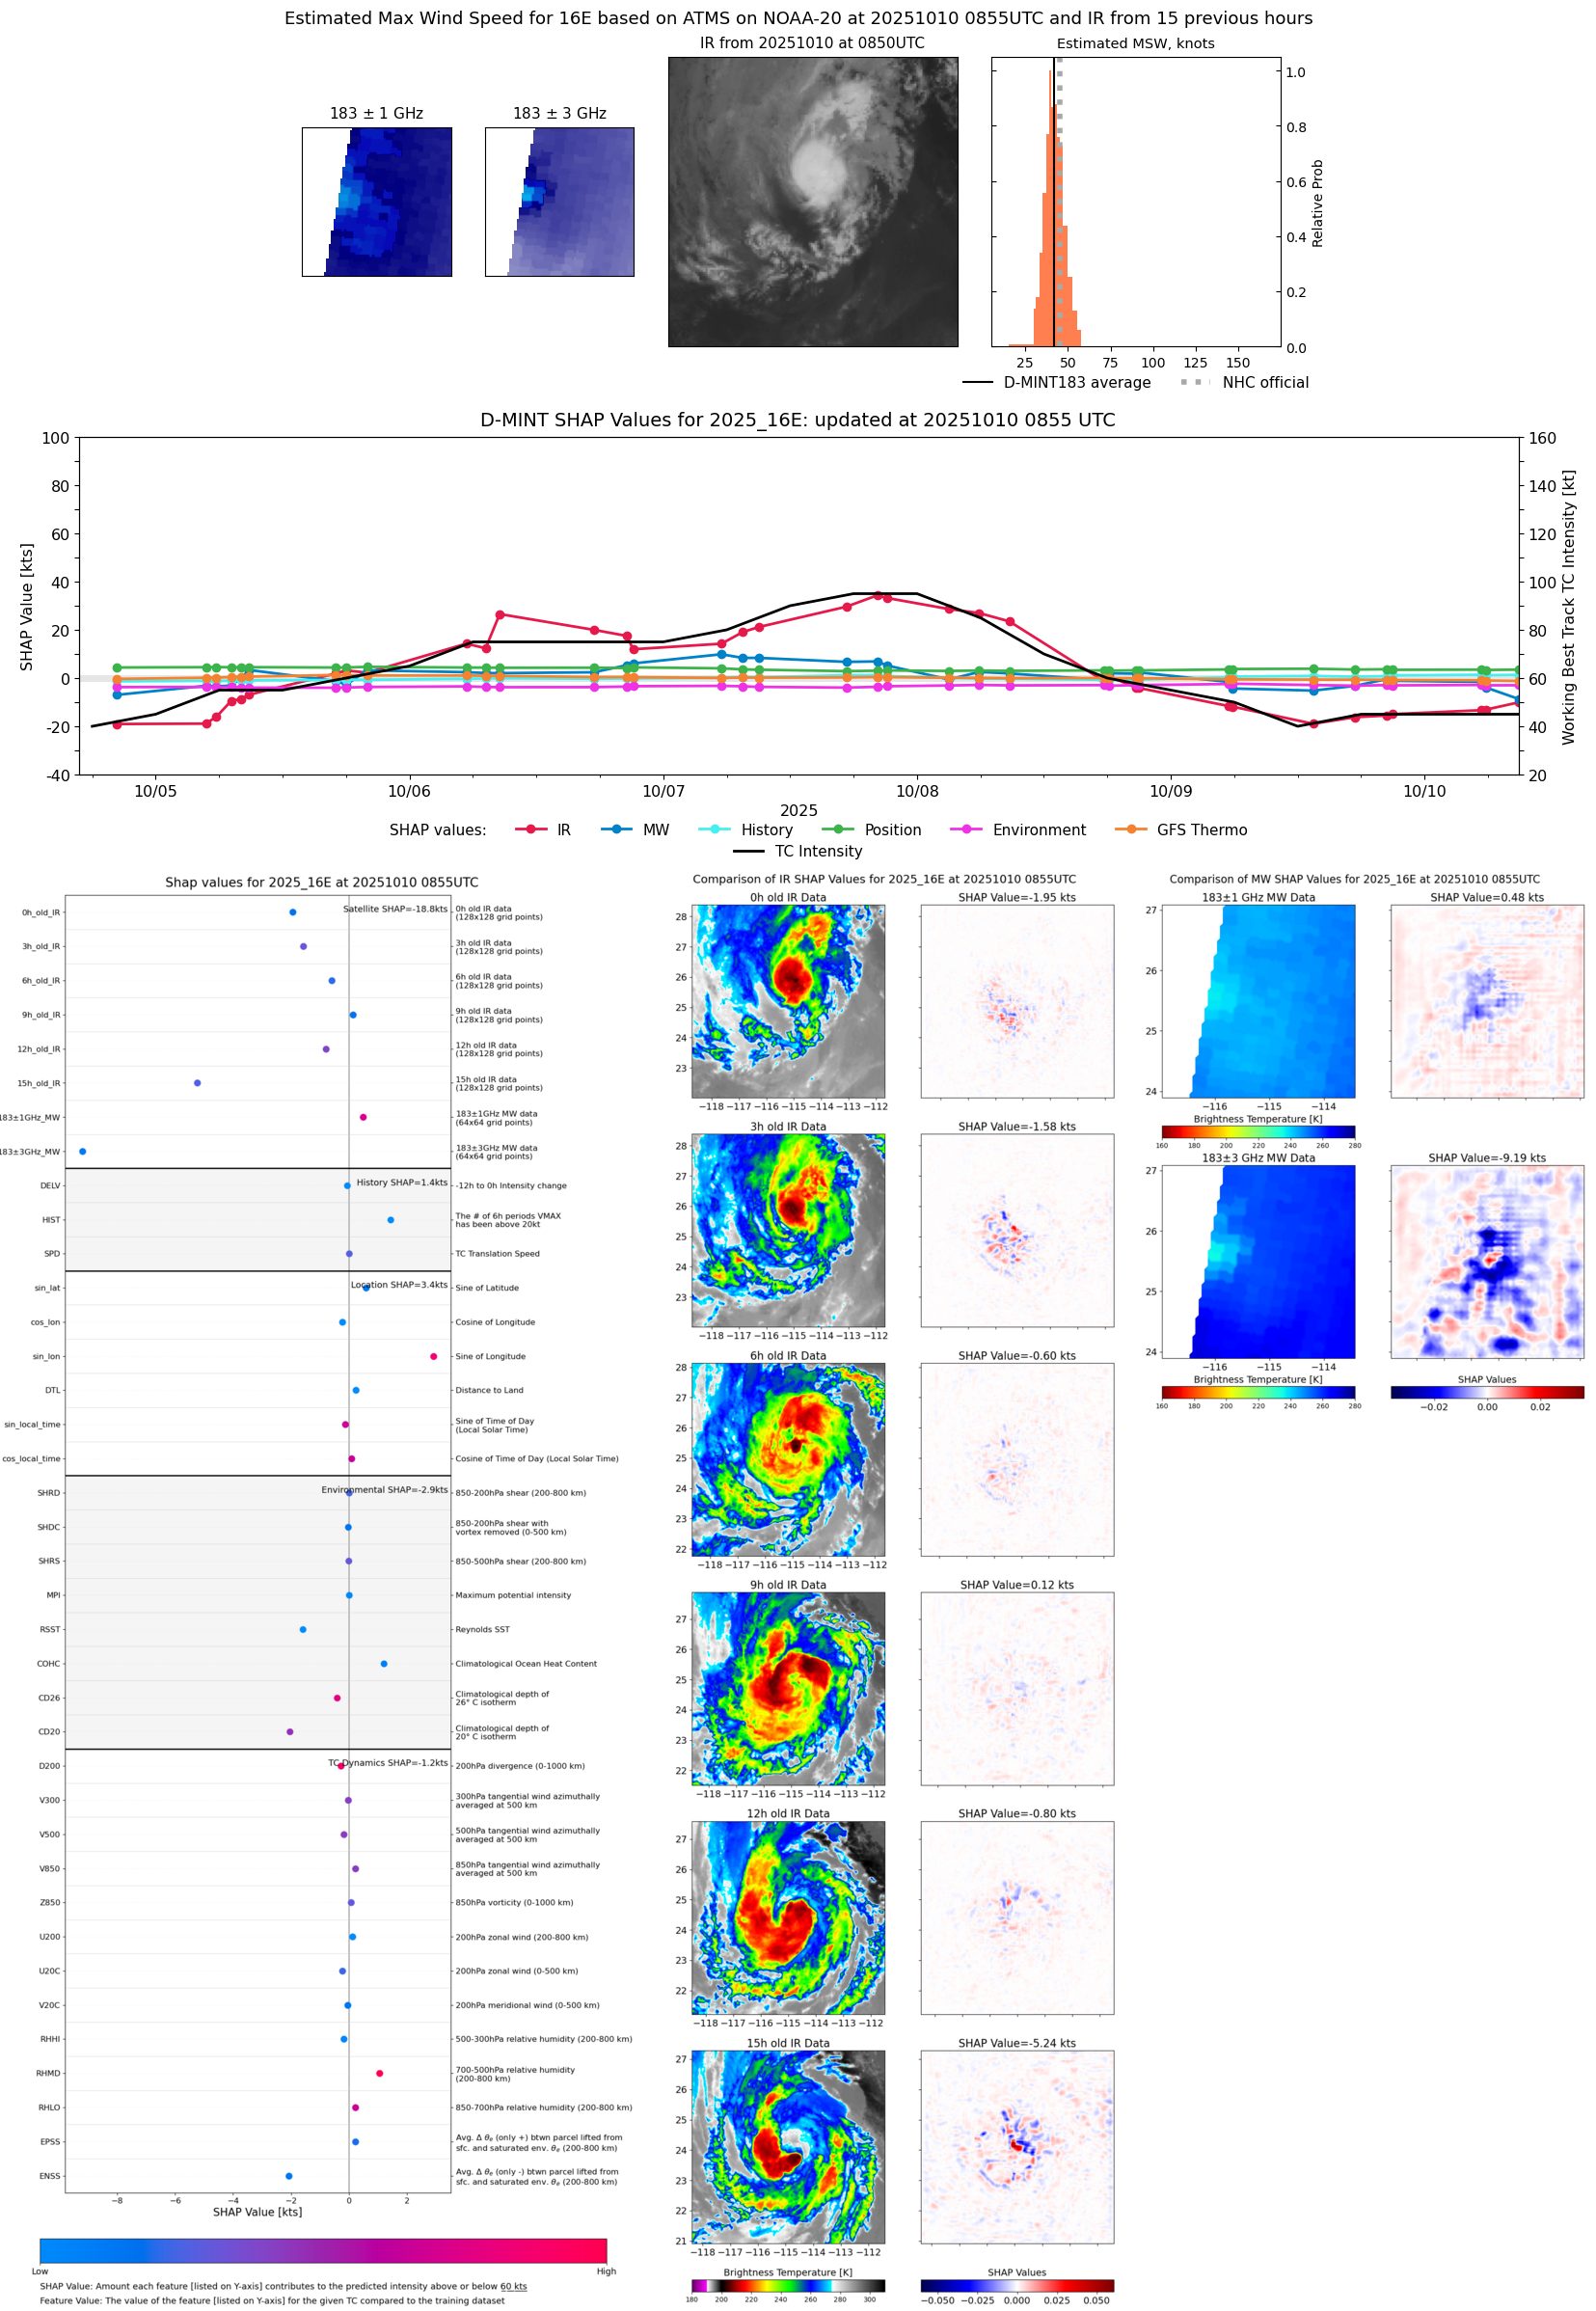 |
| 20251010 | 0730 UTC | TROPICS03 | 998 hPa | 44 kts | 41 kts | 48 kts |  |
| 20251010 | 0550 UTC | TMS02 | 997 hPa | 44 kts | 40 kts | 47 kts | 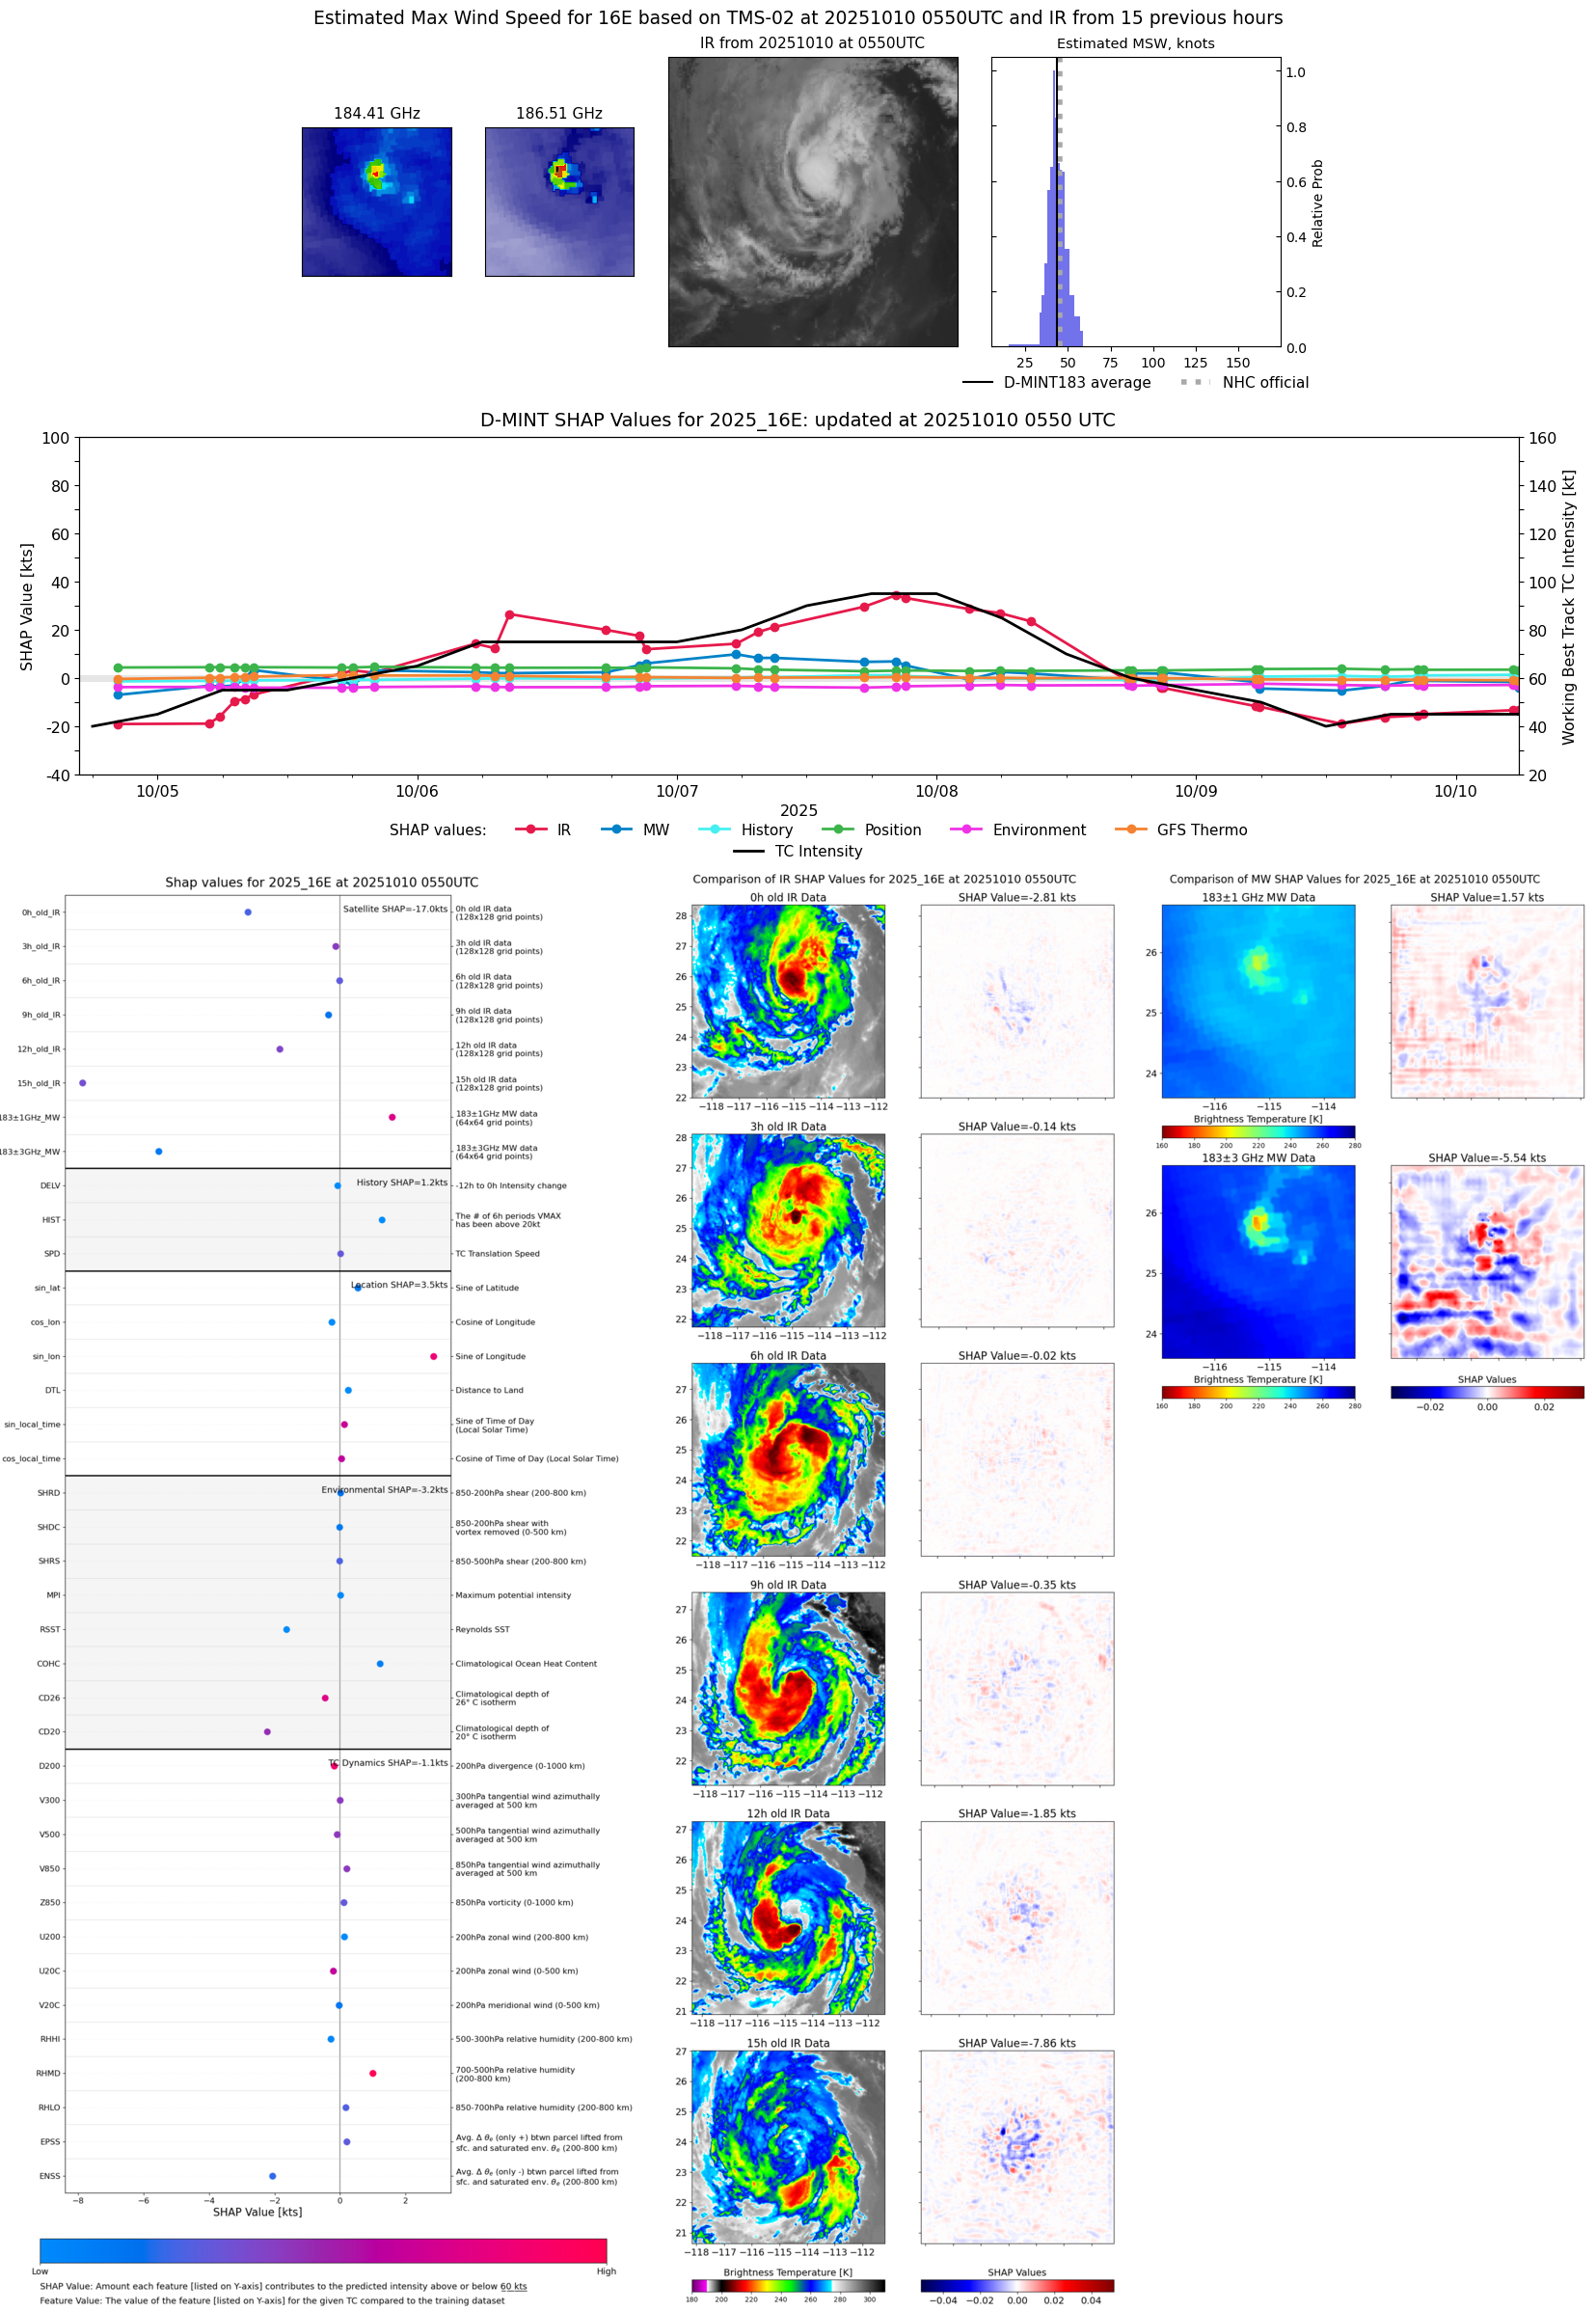 |
| 20251010 | 0544 UTC | AWS | 996 hPa | 44 kts | 41 kts | 48 kts | 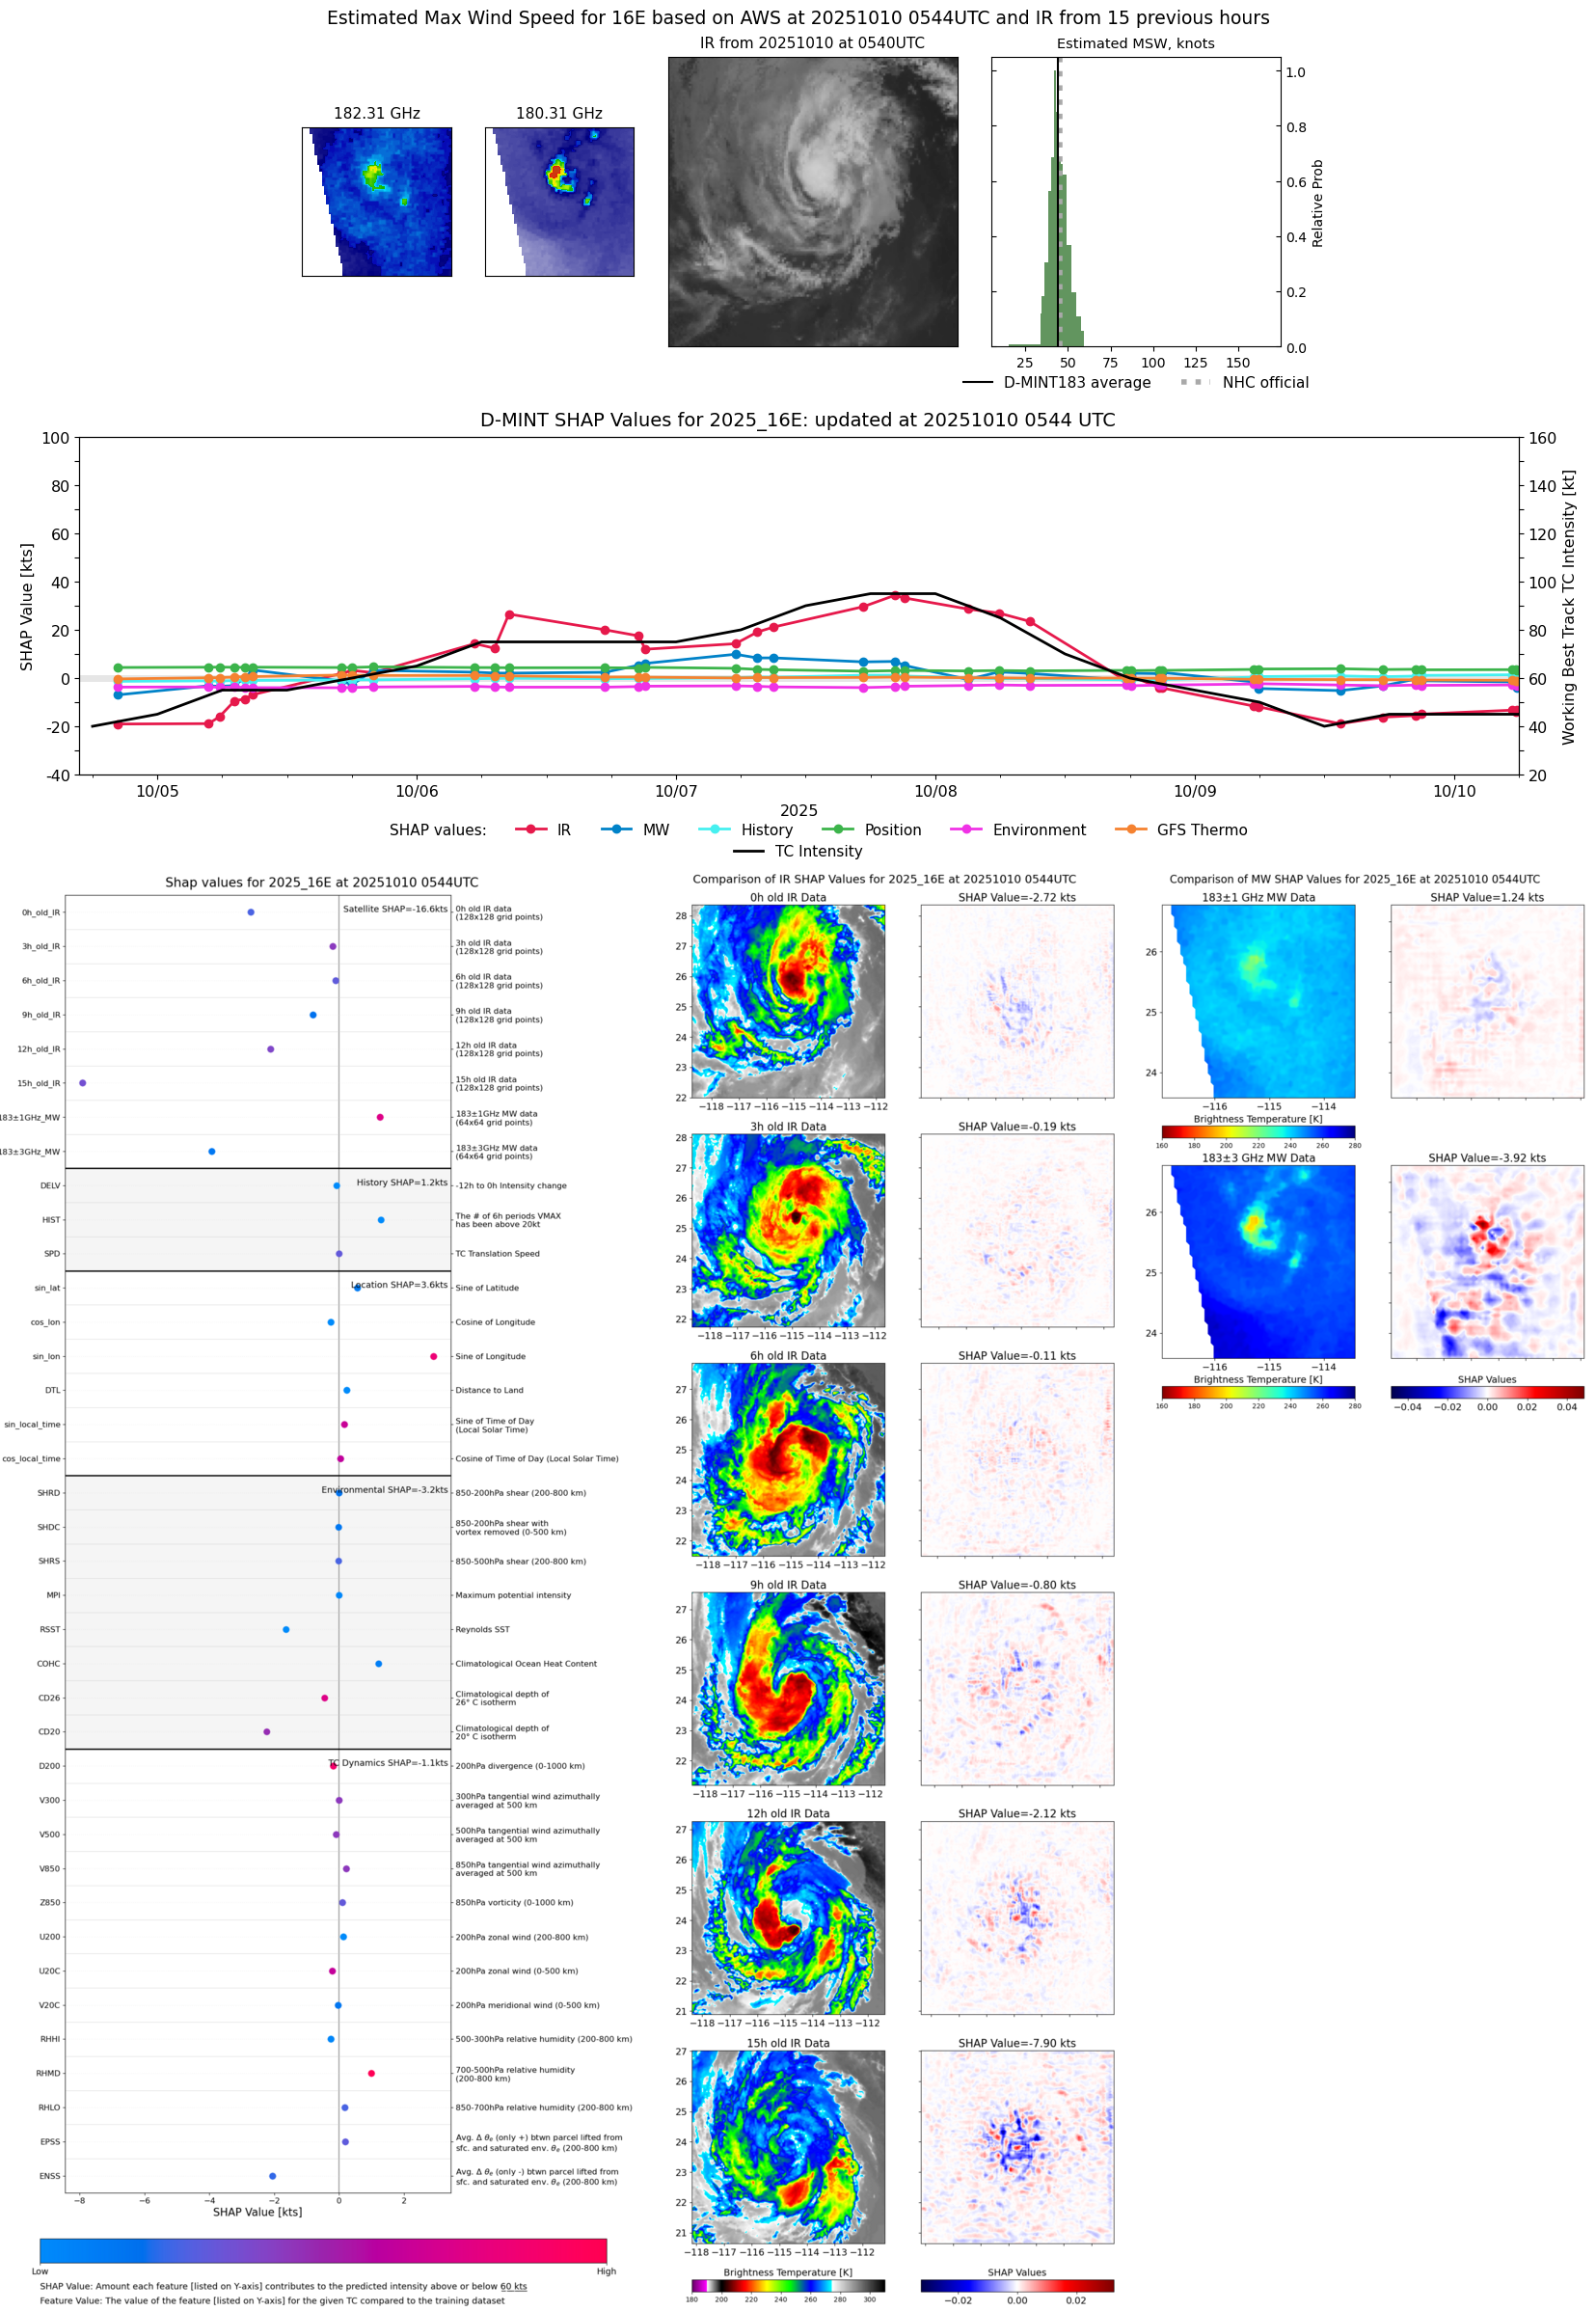 |
| 20251010 | 0520 UTC | TMS07 | 996 hPa | 46 kts | 43 kts | 50 kts | 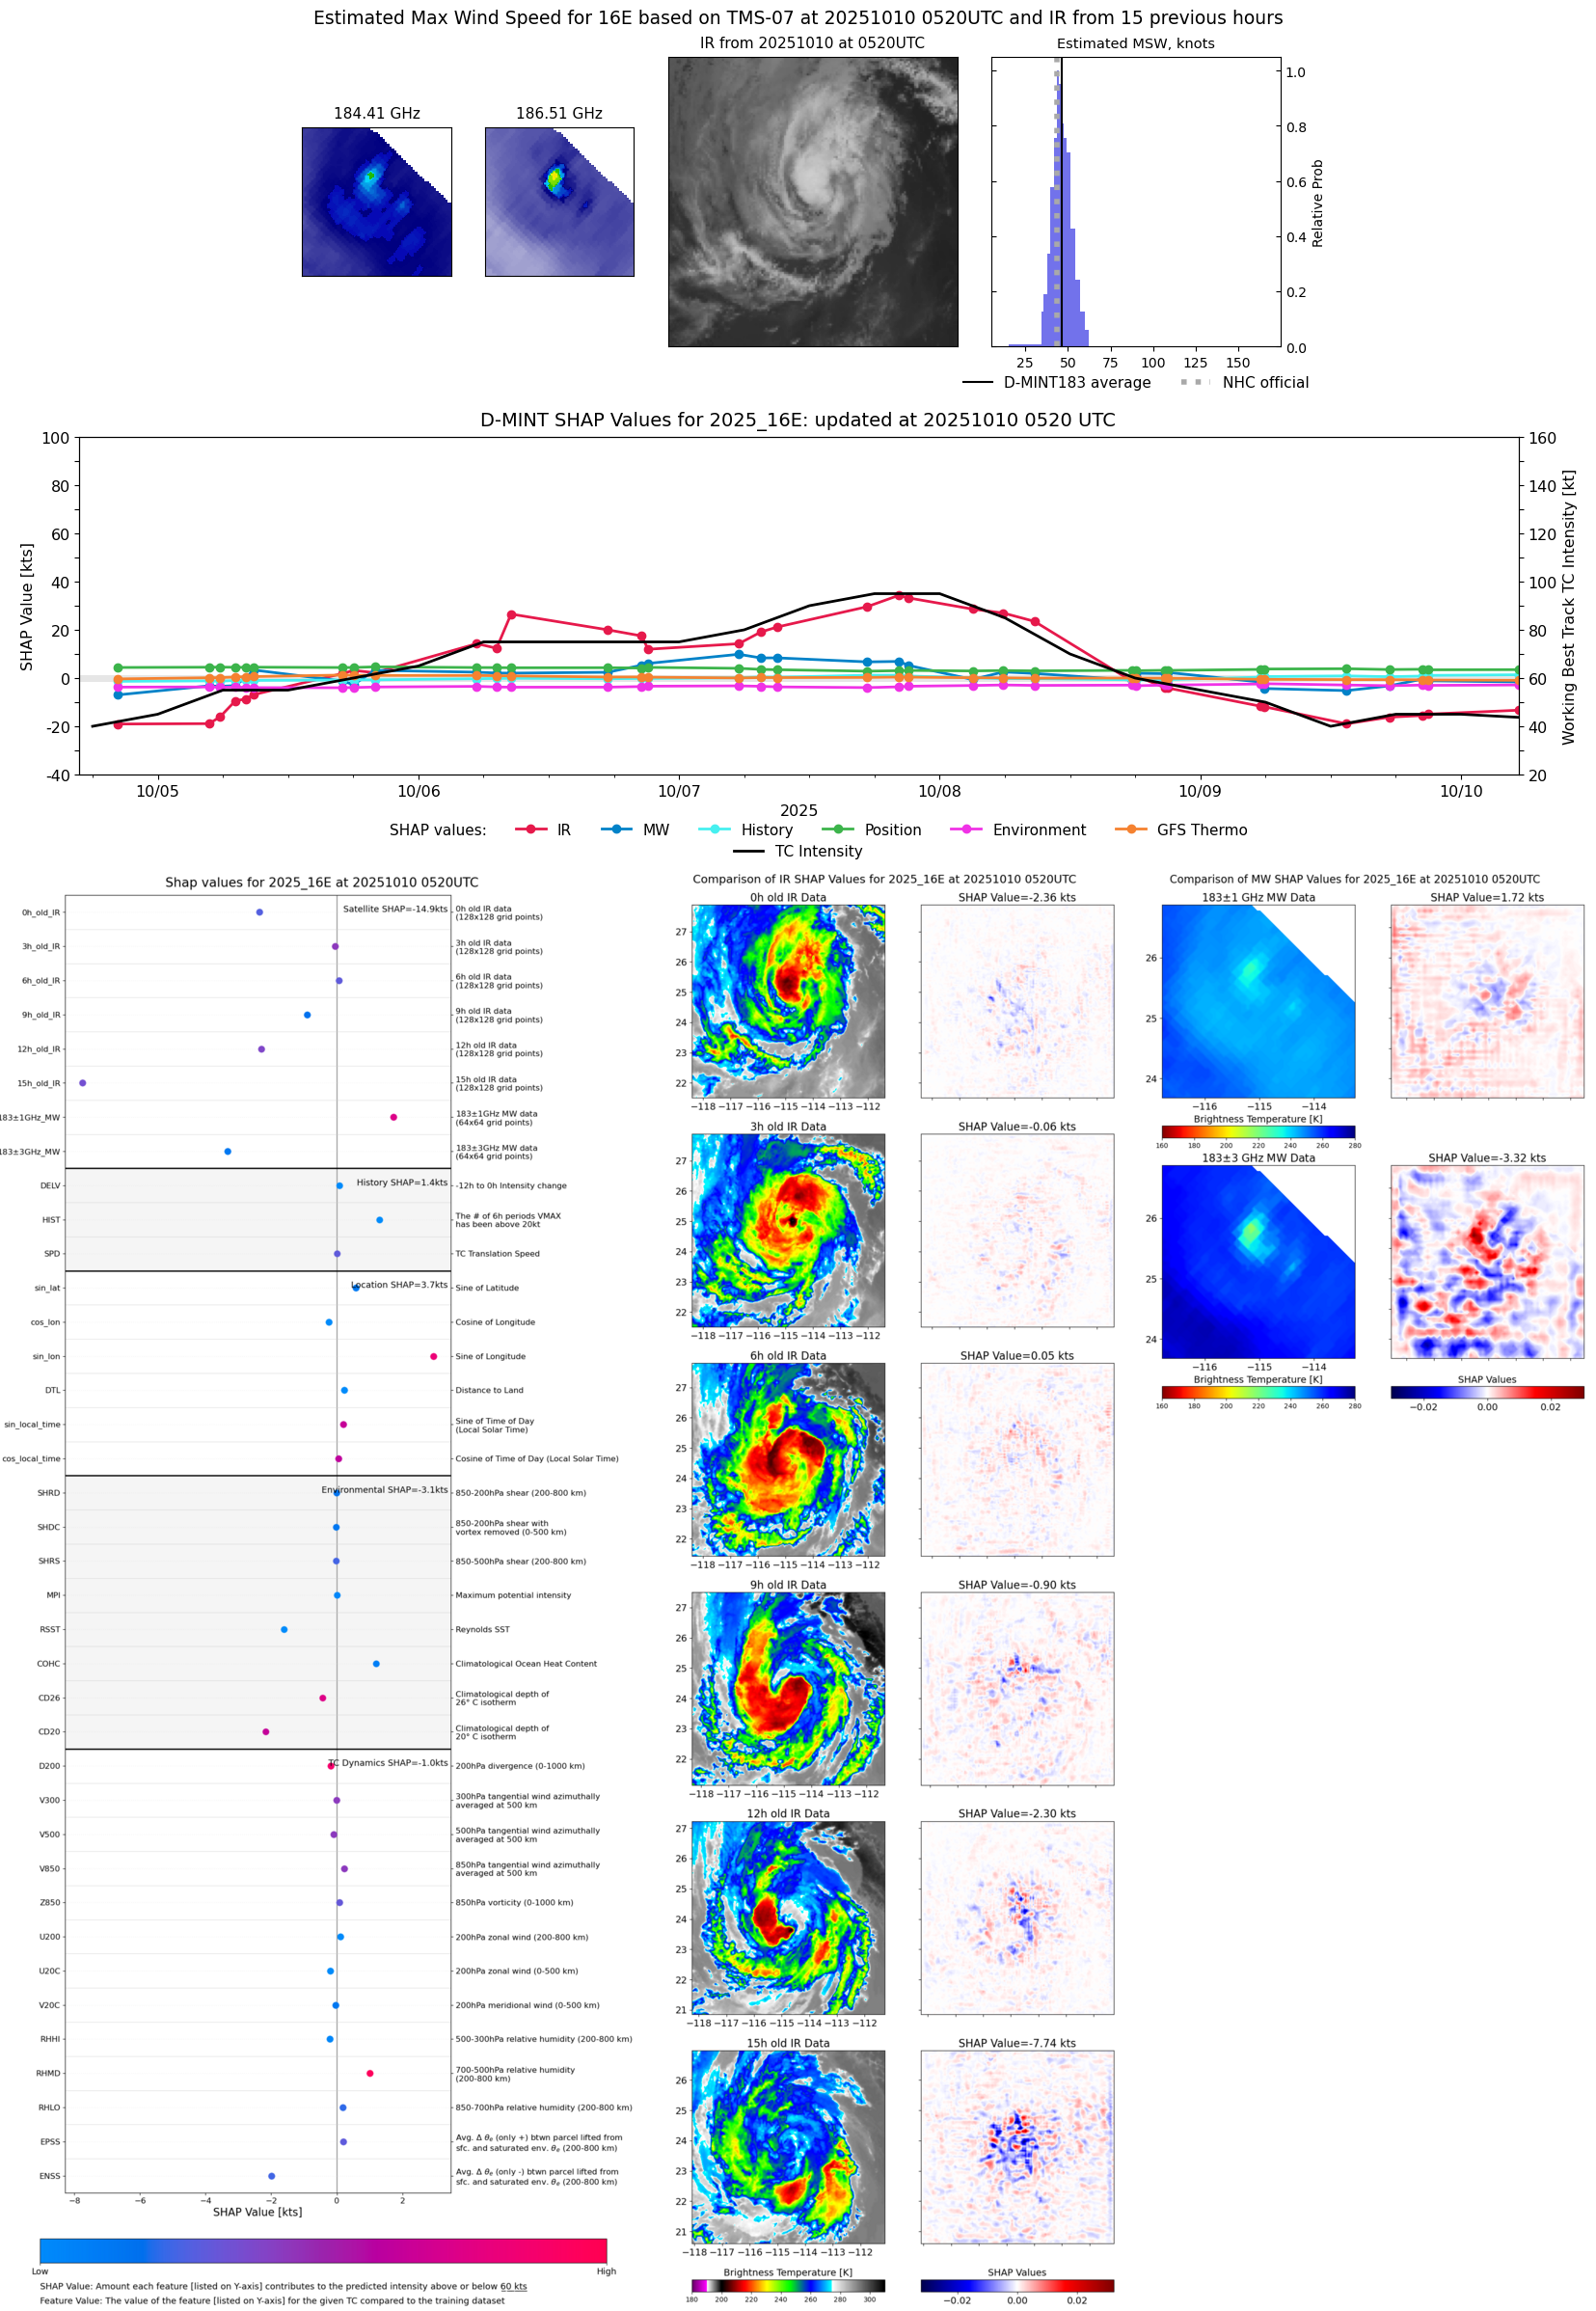 |
| 20251010 | 0218 UTC | SSMISF16 | 999 hPa | 47 kts | 42 kts | 52 kts | 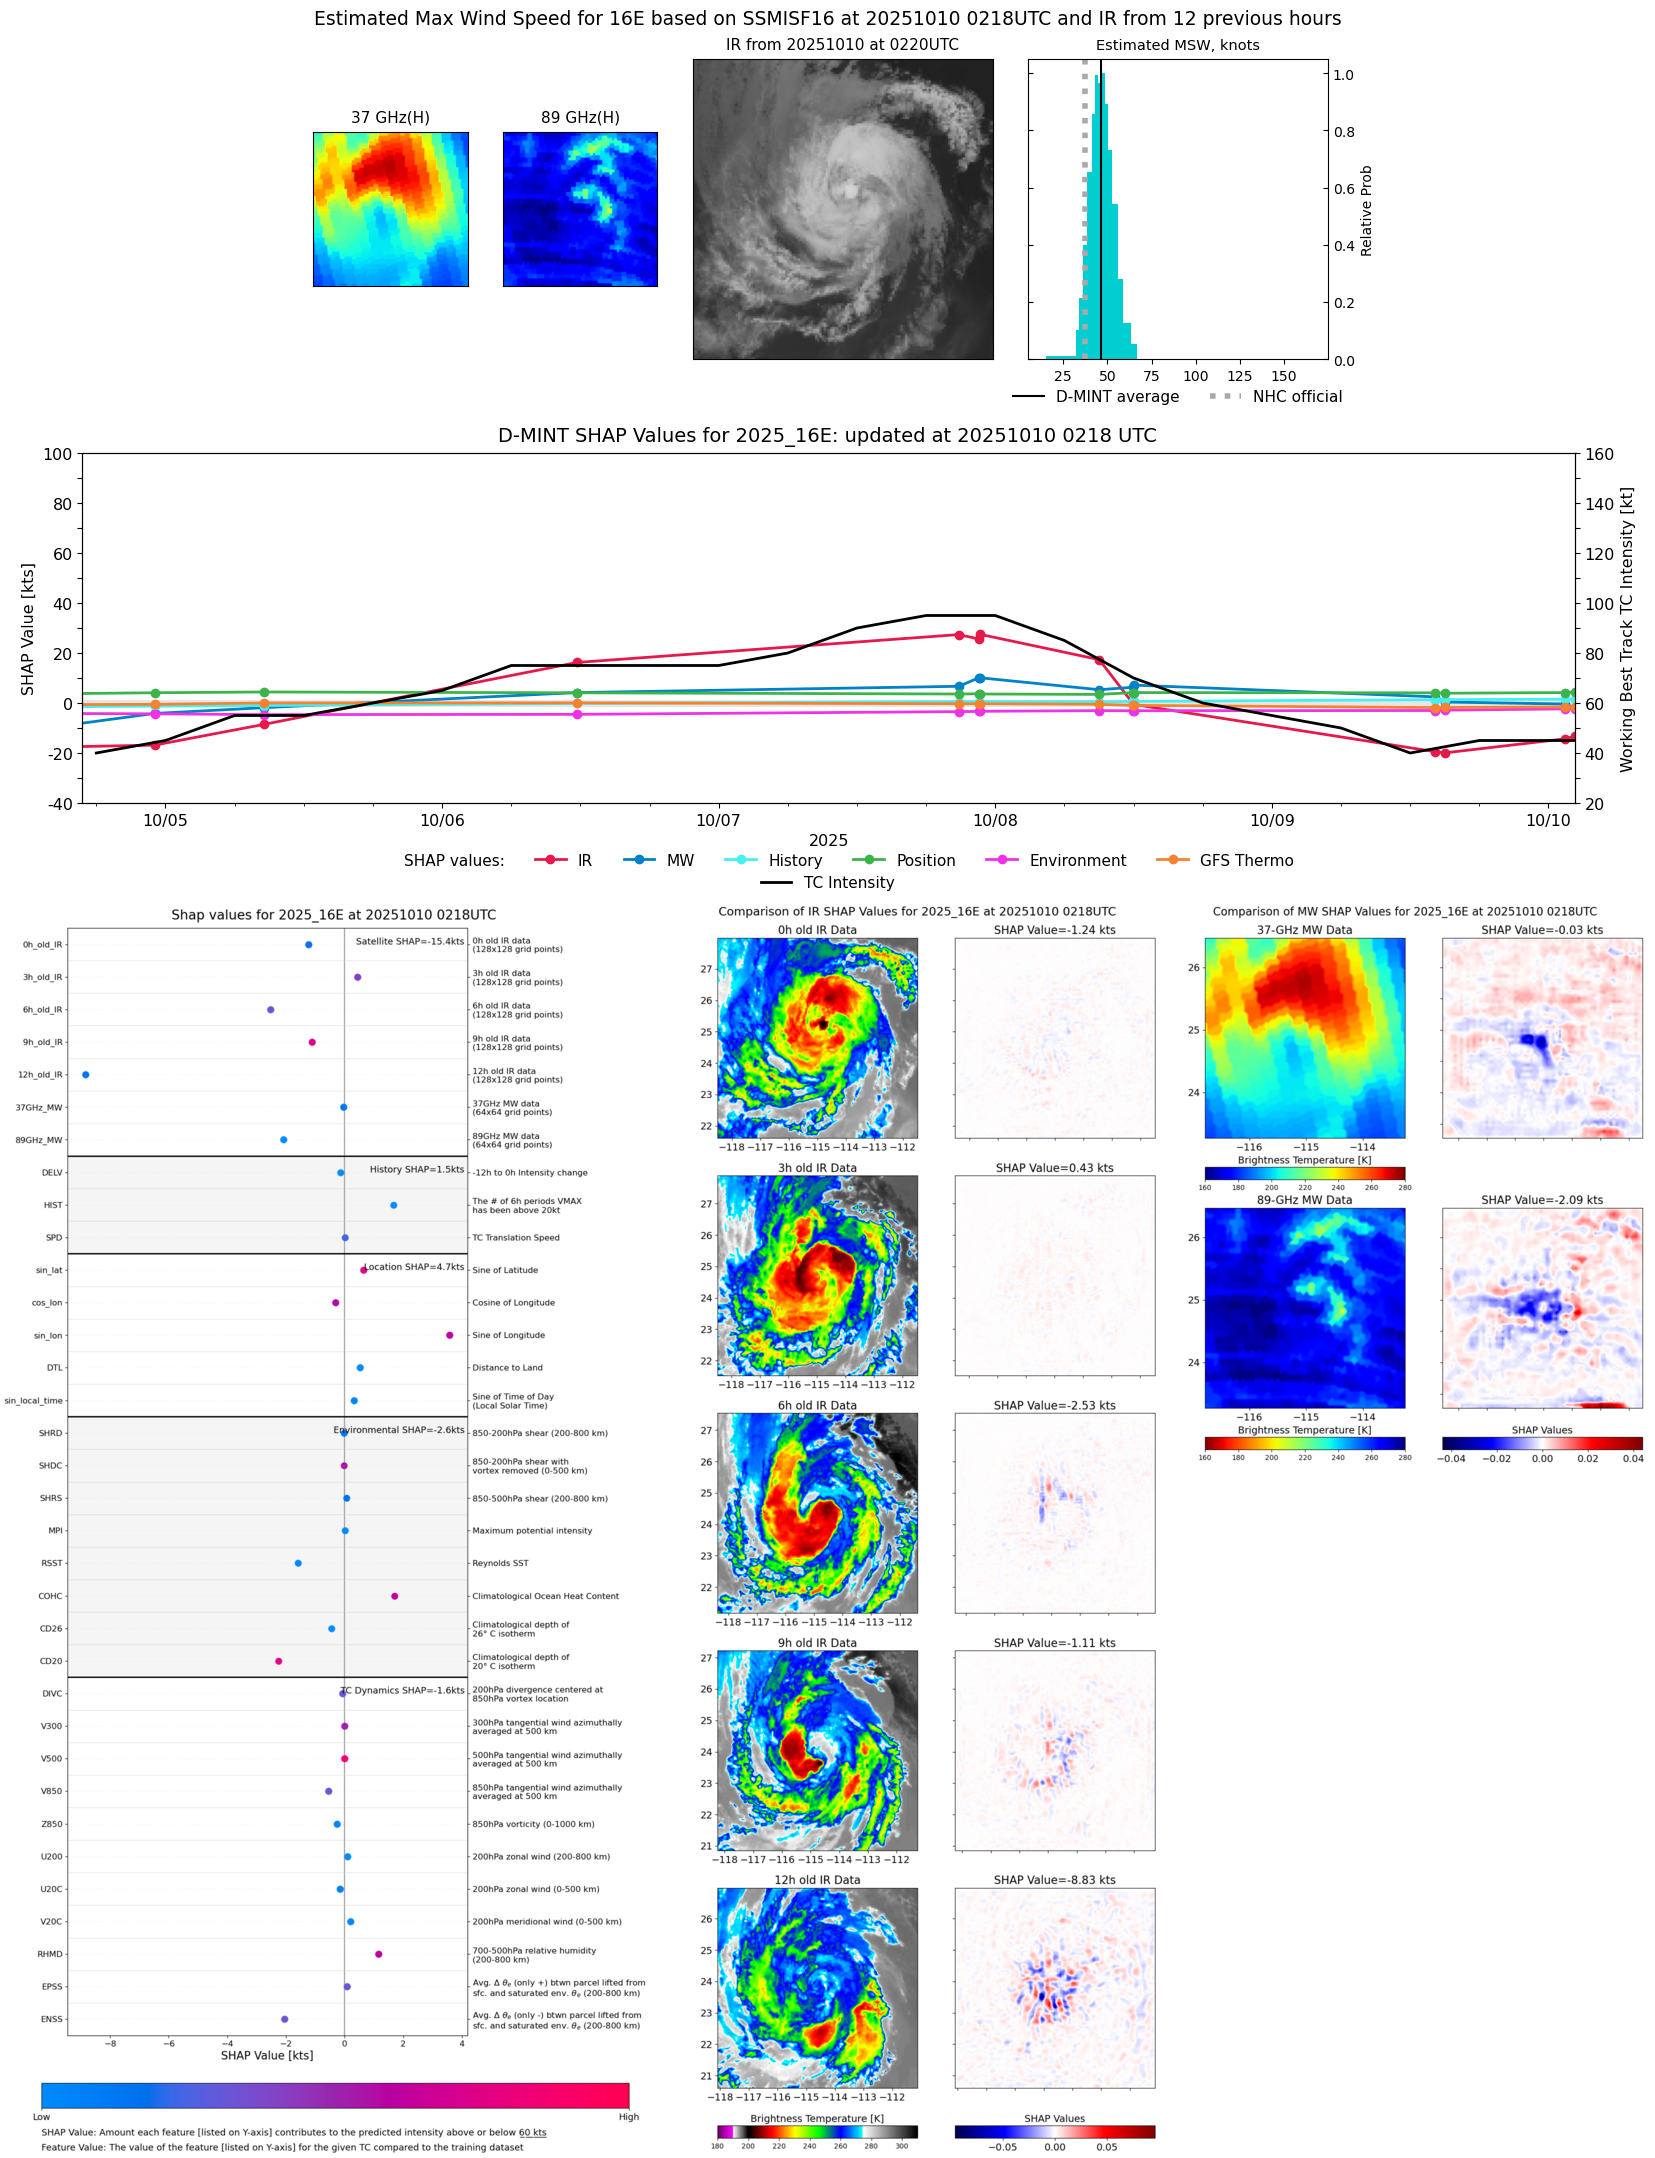 |
| 20251010 | 0141 UTC | WSFM01 | 997 hPa | 47 kts | 43 kts | 52 kts | 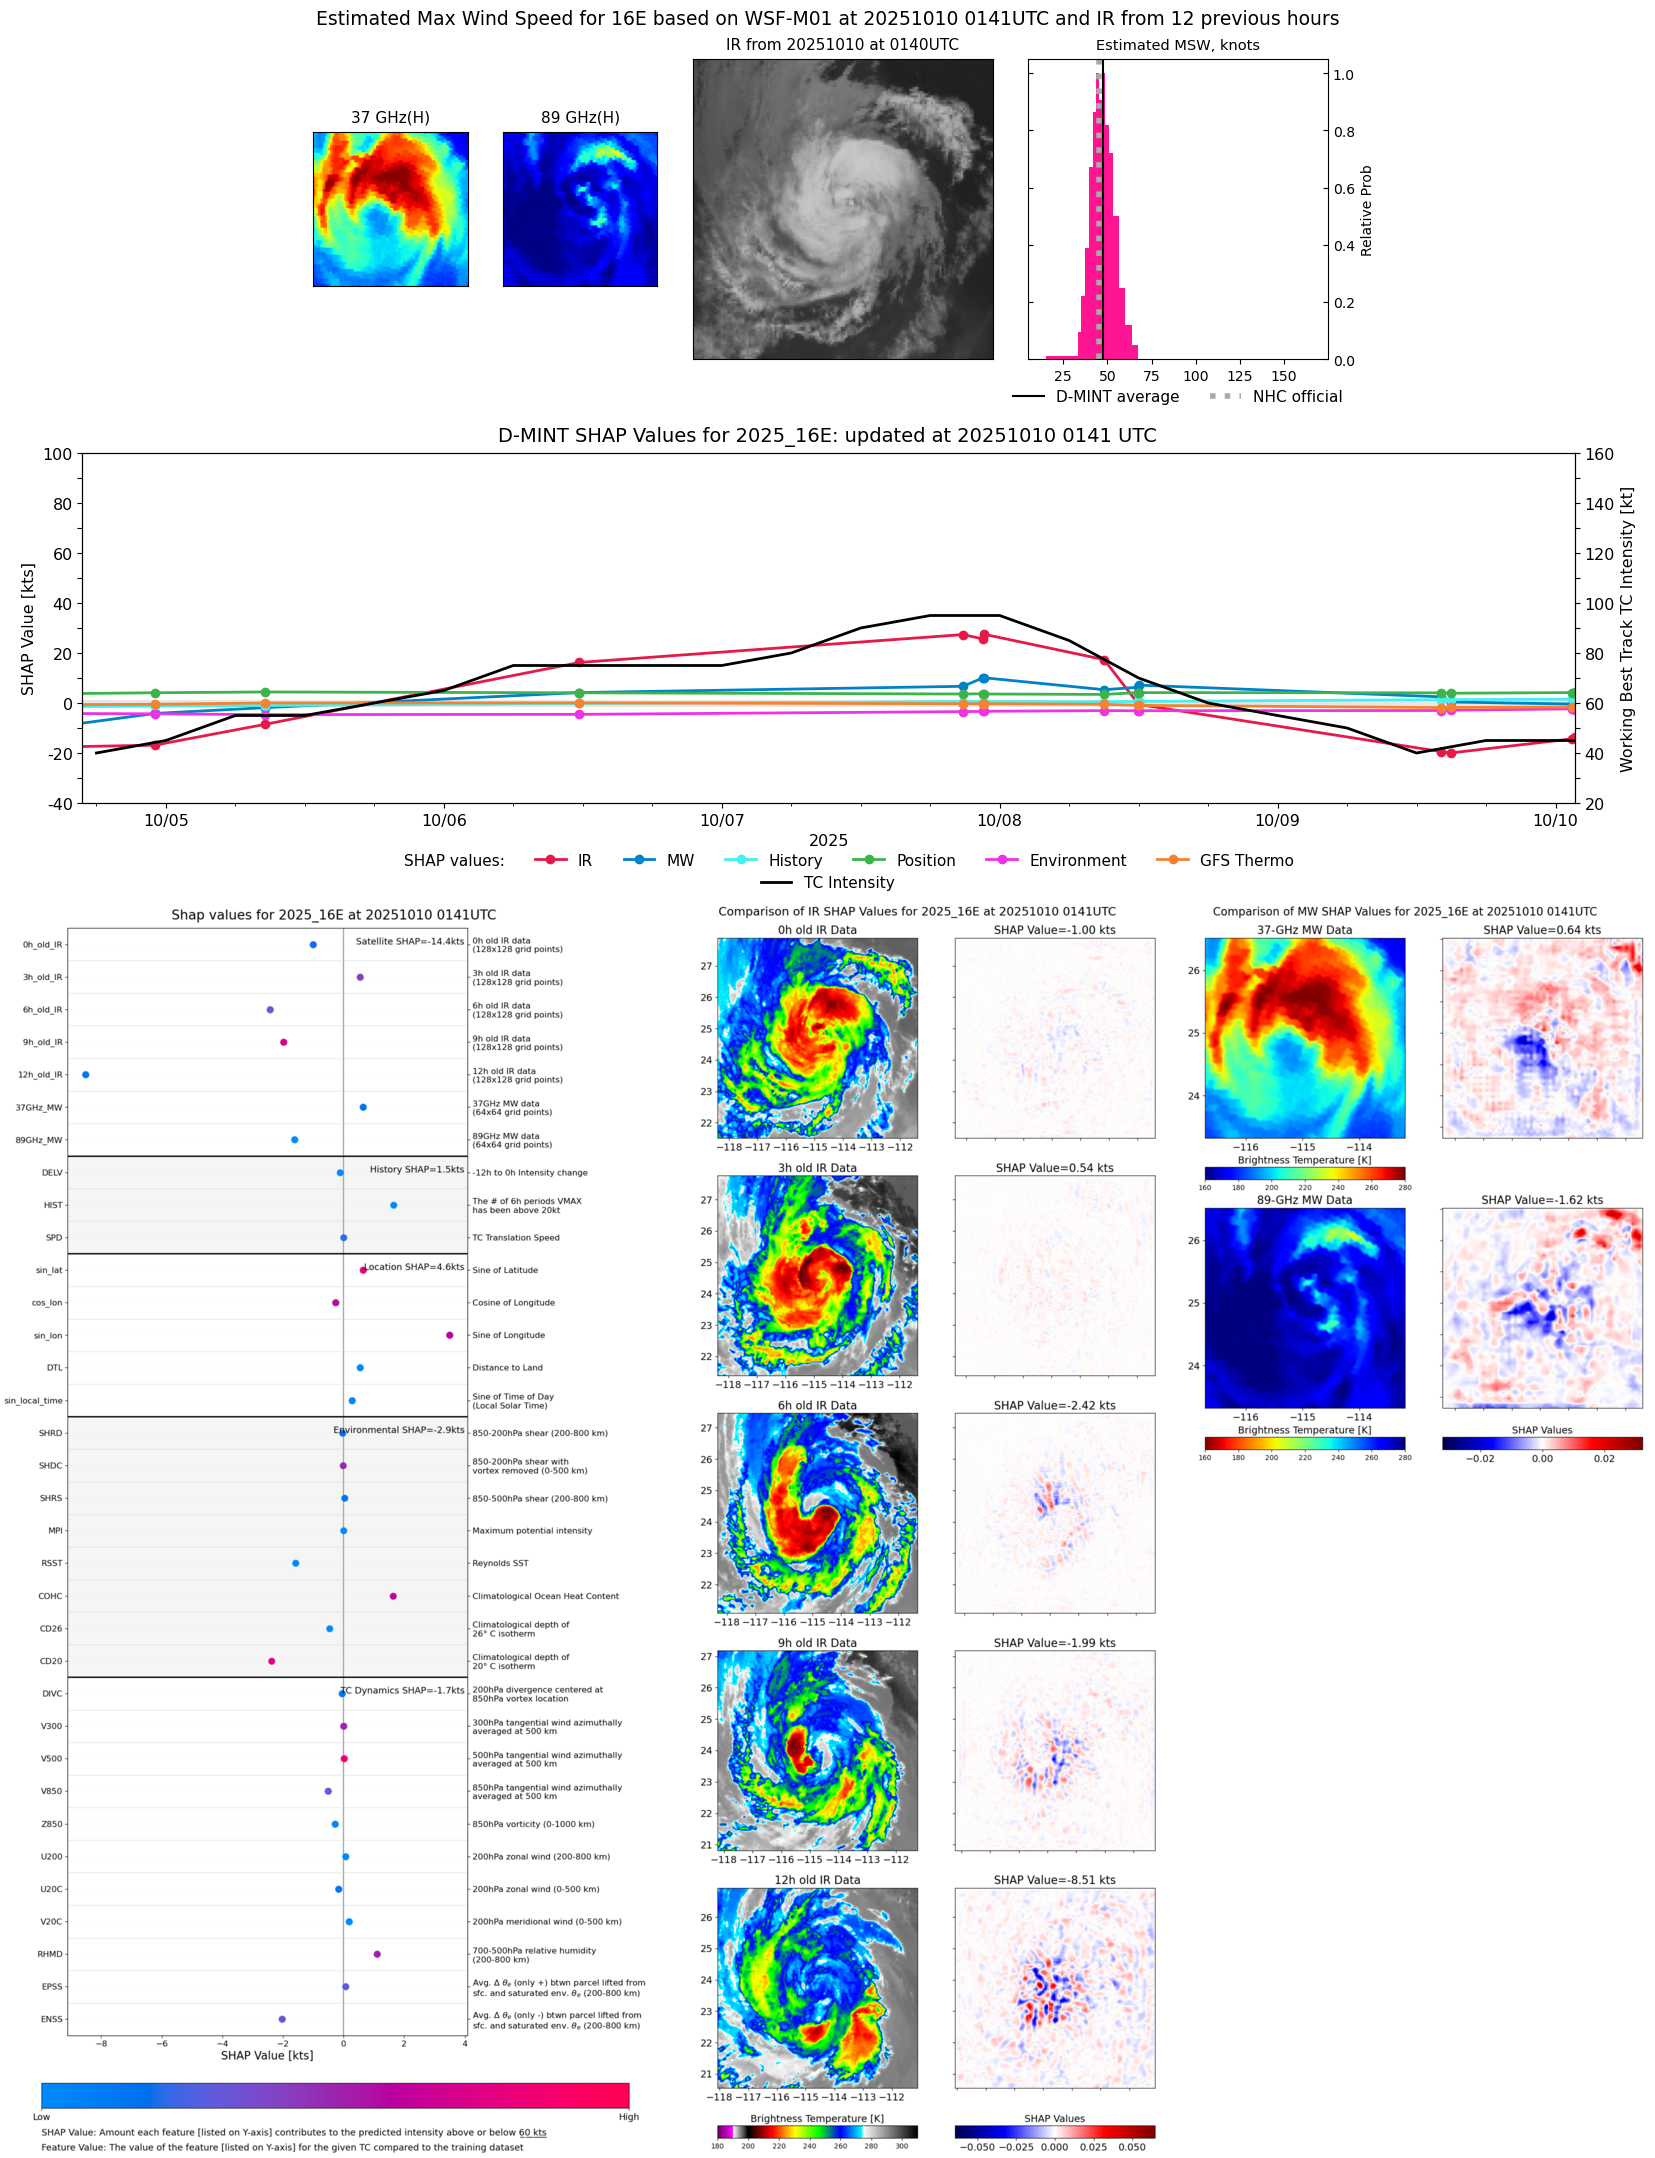 |
| 20251010 | 0124 UTC | SSMISF17 | 996 hPa | 47 kts | 42 kts | 52 kts |  |
| 20251009 | 2059 UTC | TMS07 | 995 hPa | 45 kts | 42 kts | 48 kts | 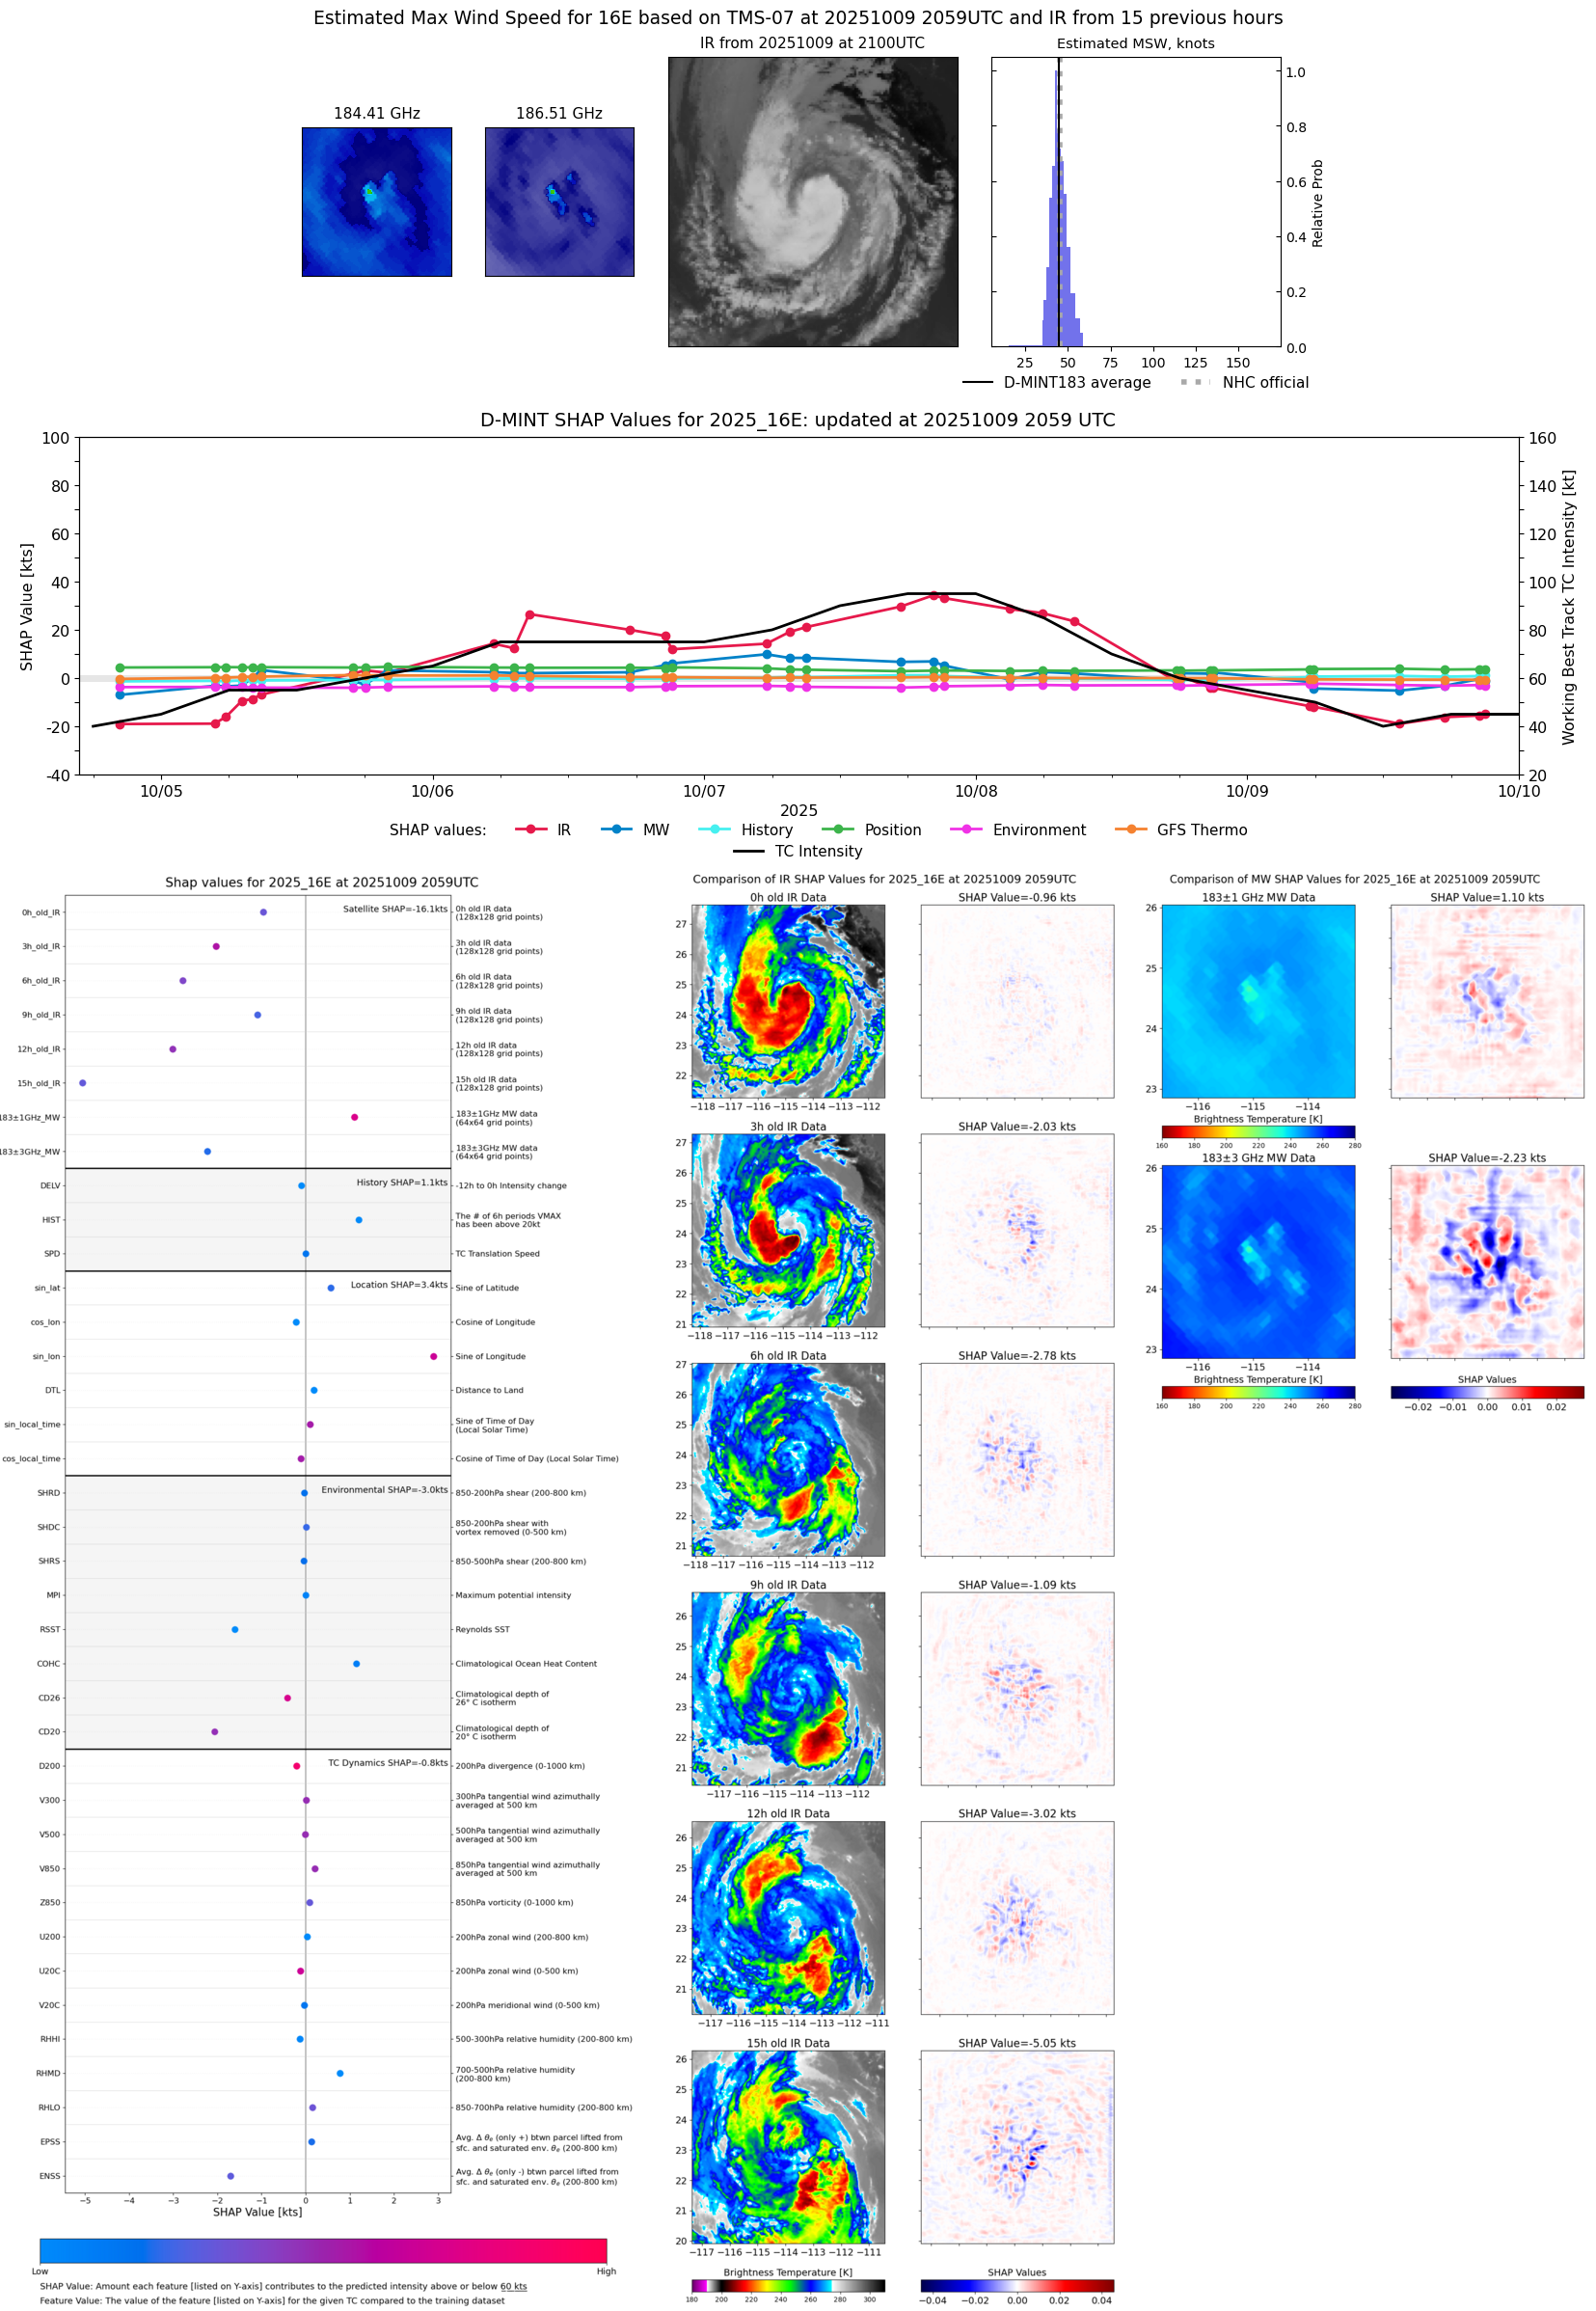 |
| 20251009 | 2040 UTC | AMSR2 | 1000 hPa | 43 kts | 39 kts | 48 kts | 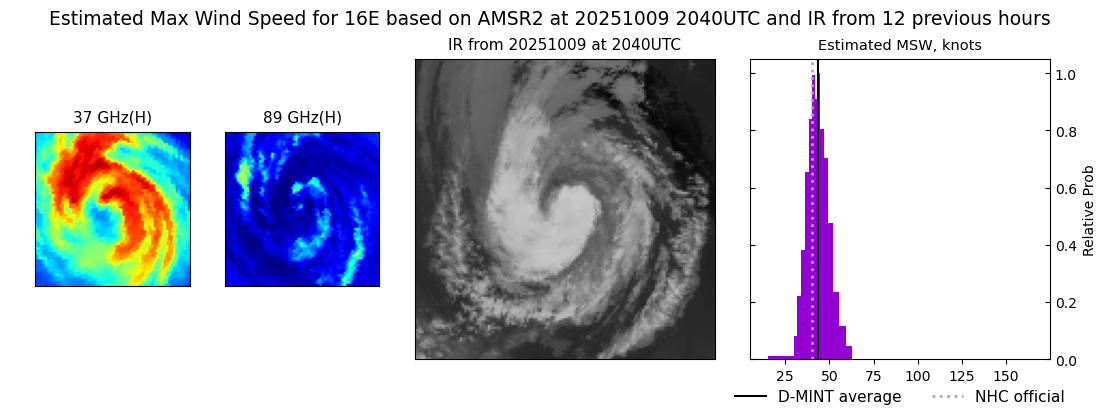 |
| 20251009 | 2028 UTC | ATMS-N20 | 996 hPa | 45 kts | 42 kts | 49 kts | 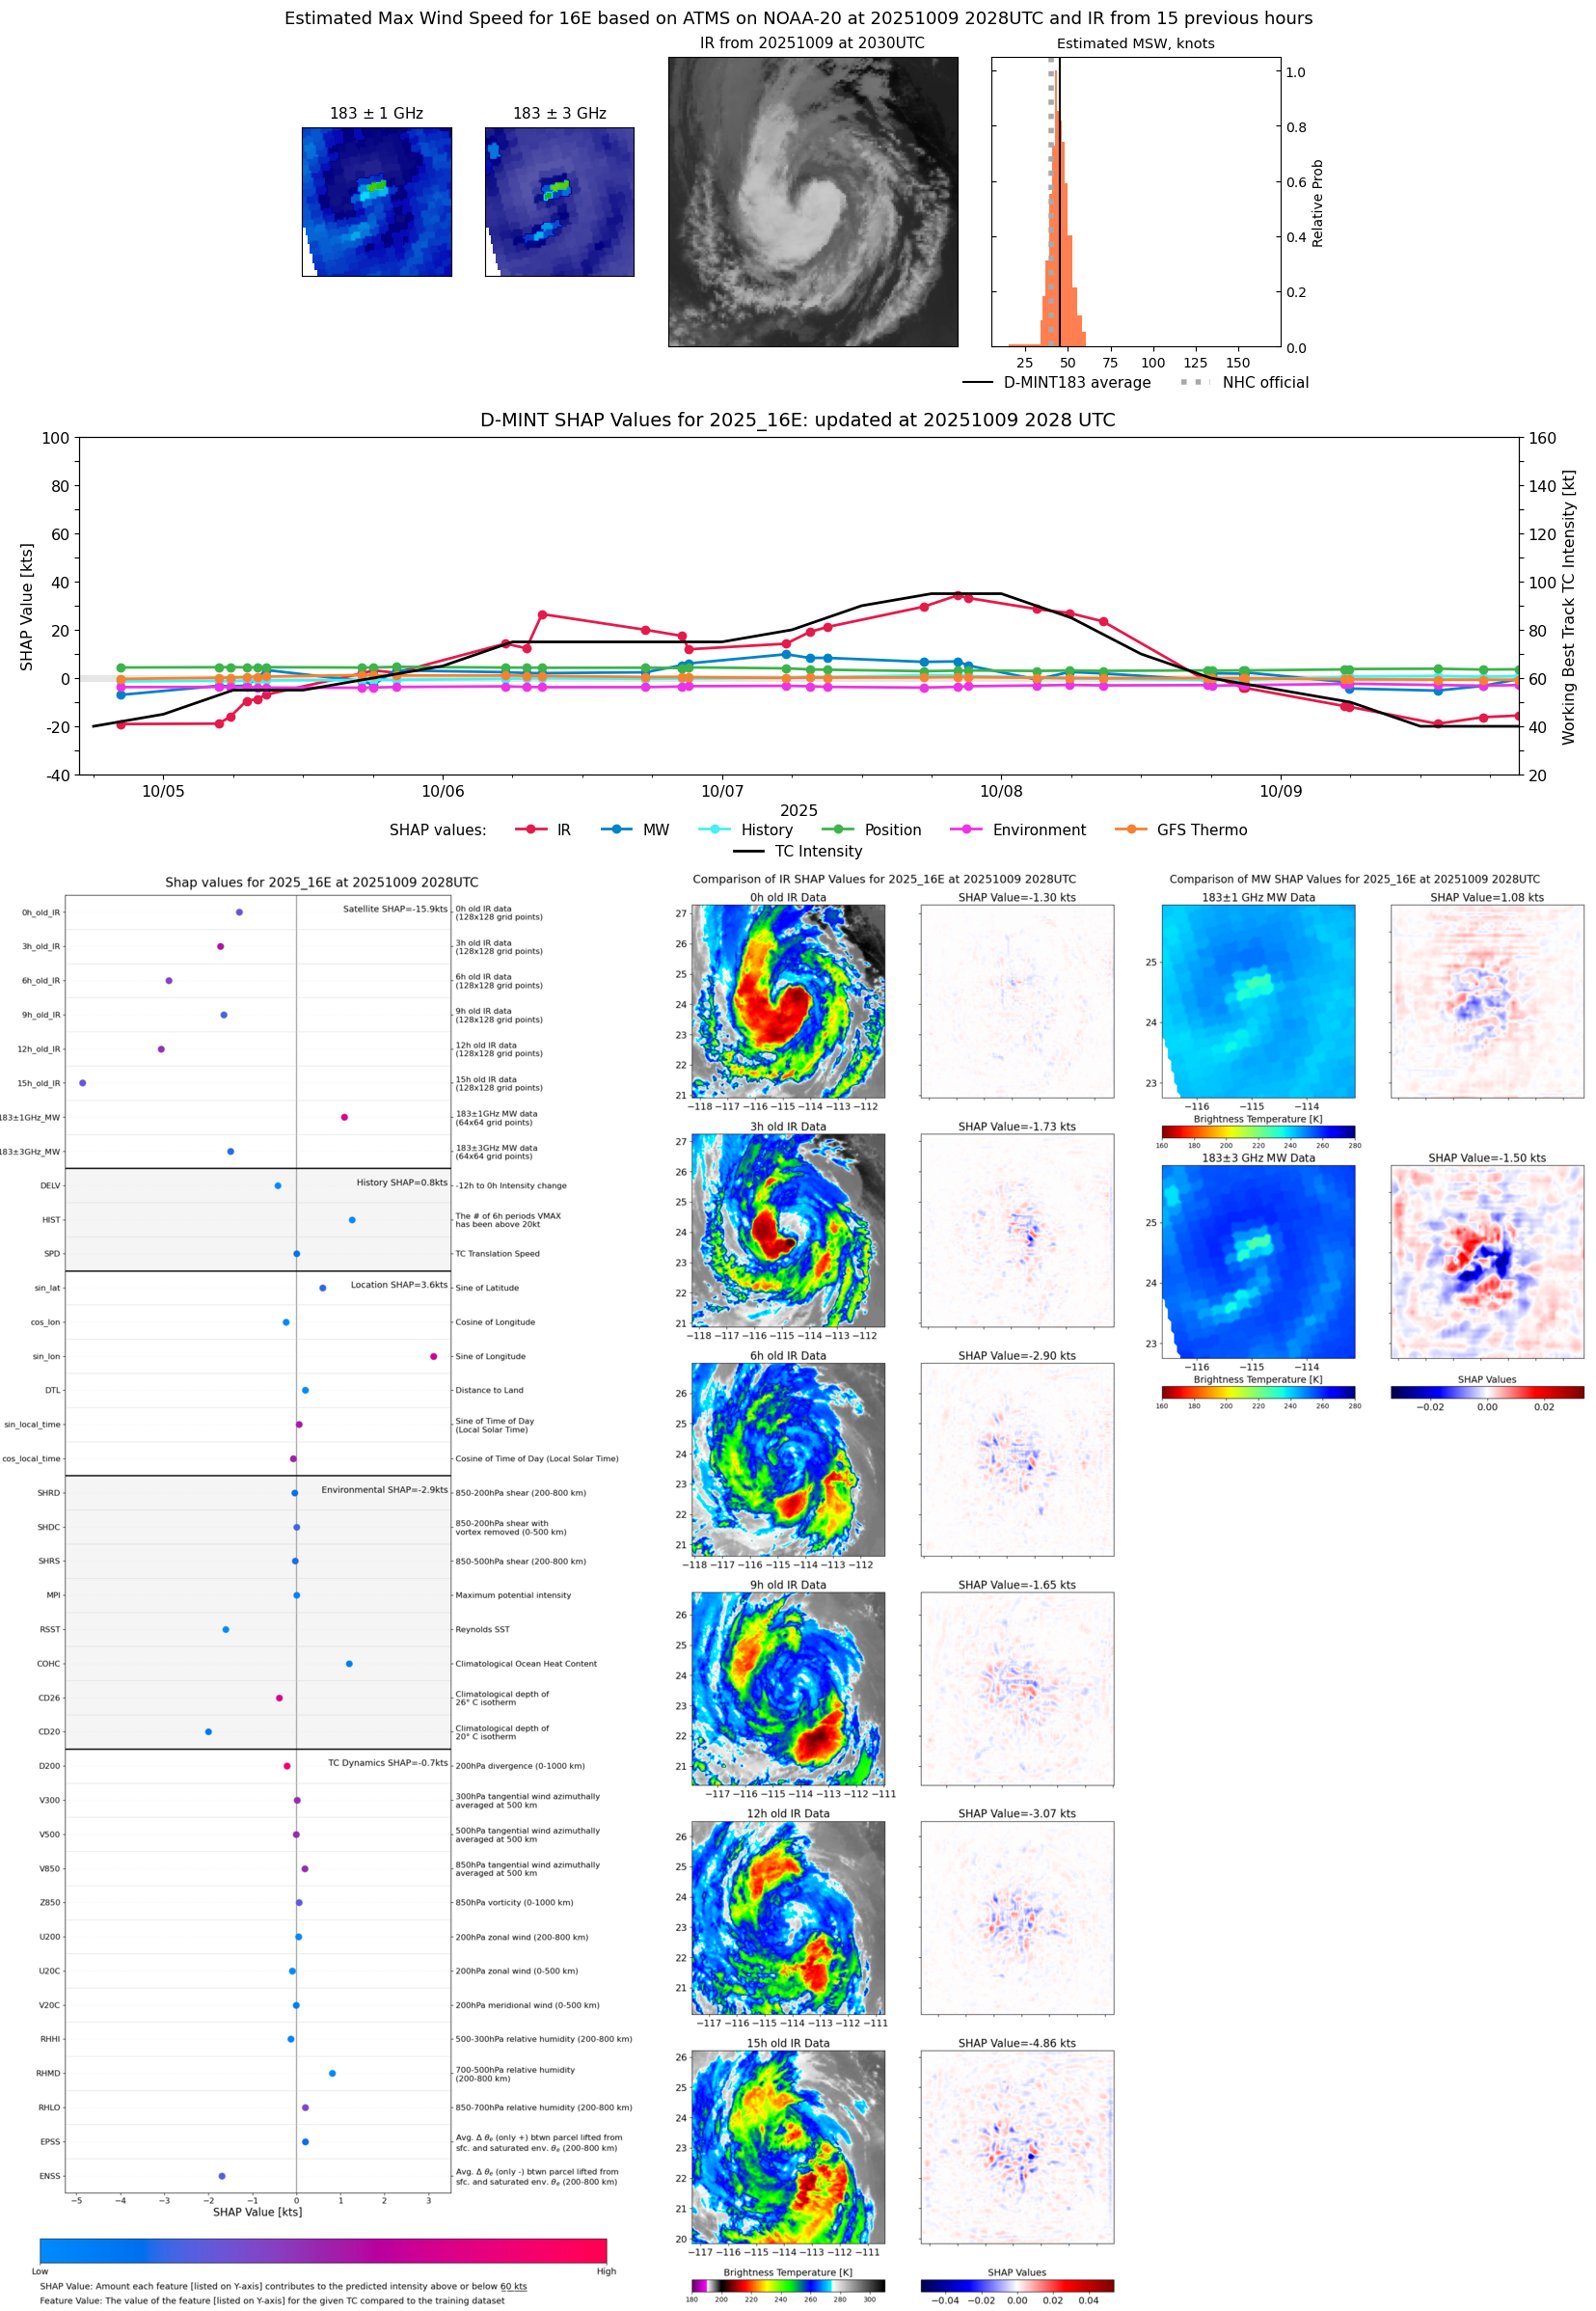 |
| 20251009 | 1724 UTC | TMS06 | 997 hPa | 41 kts | 38 kts | 45 kts | 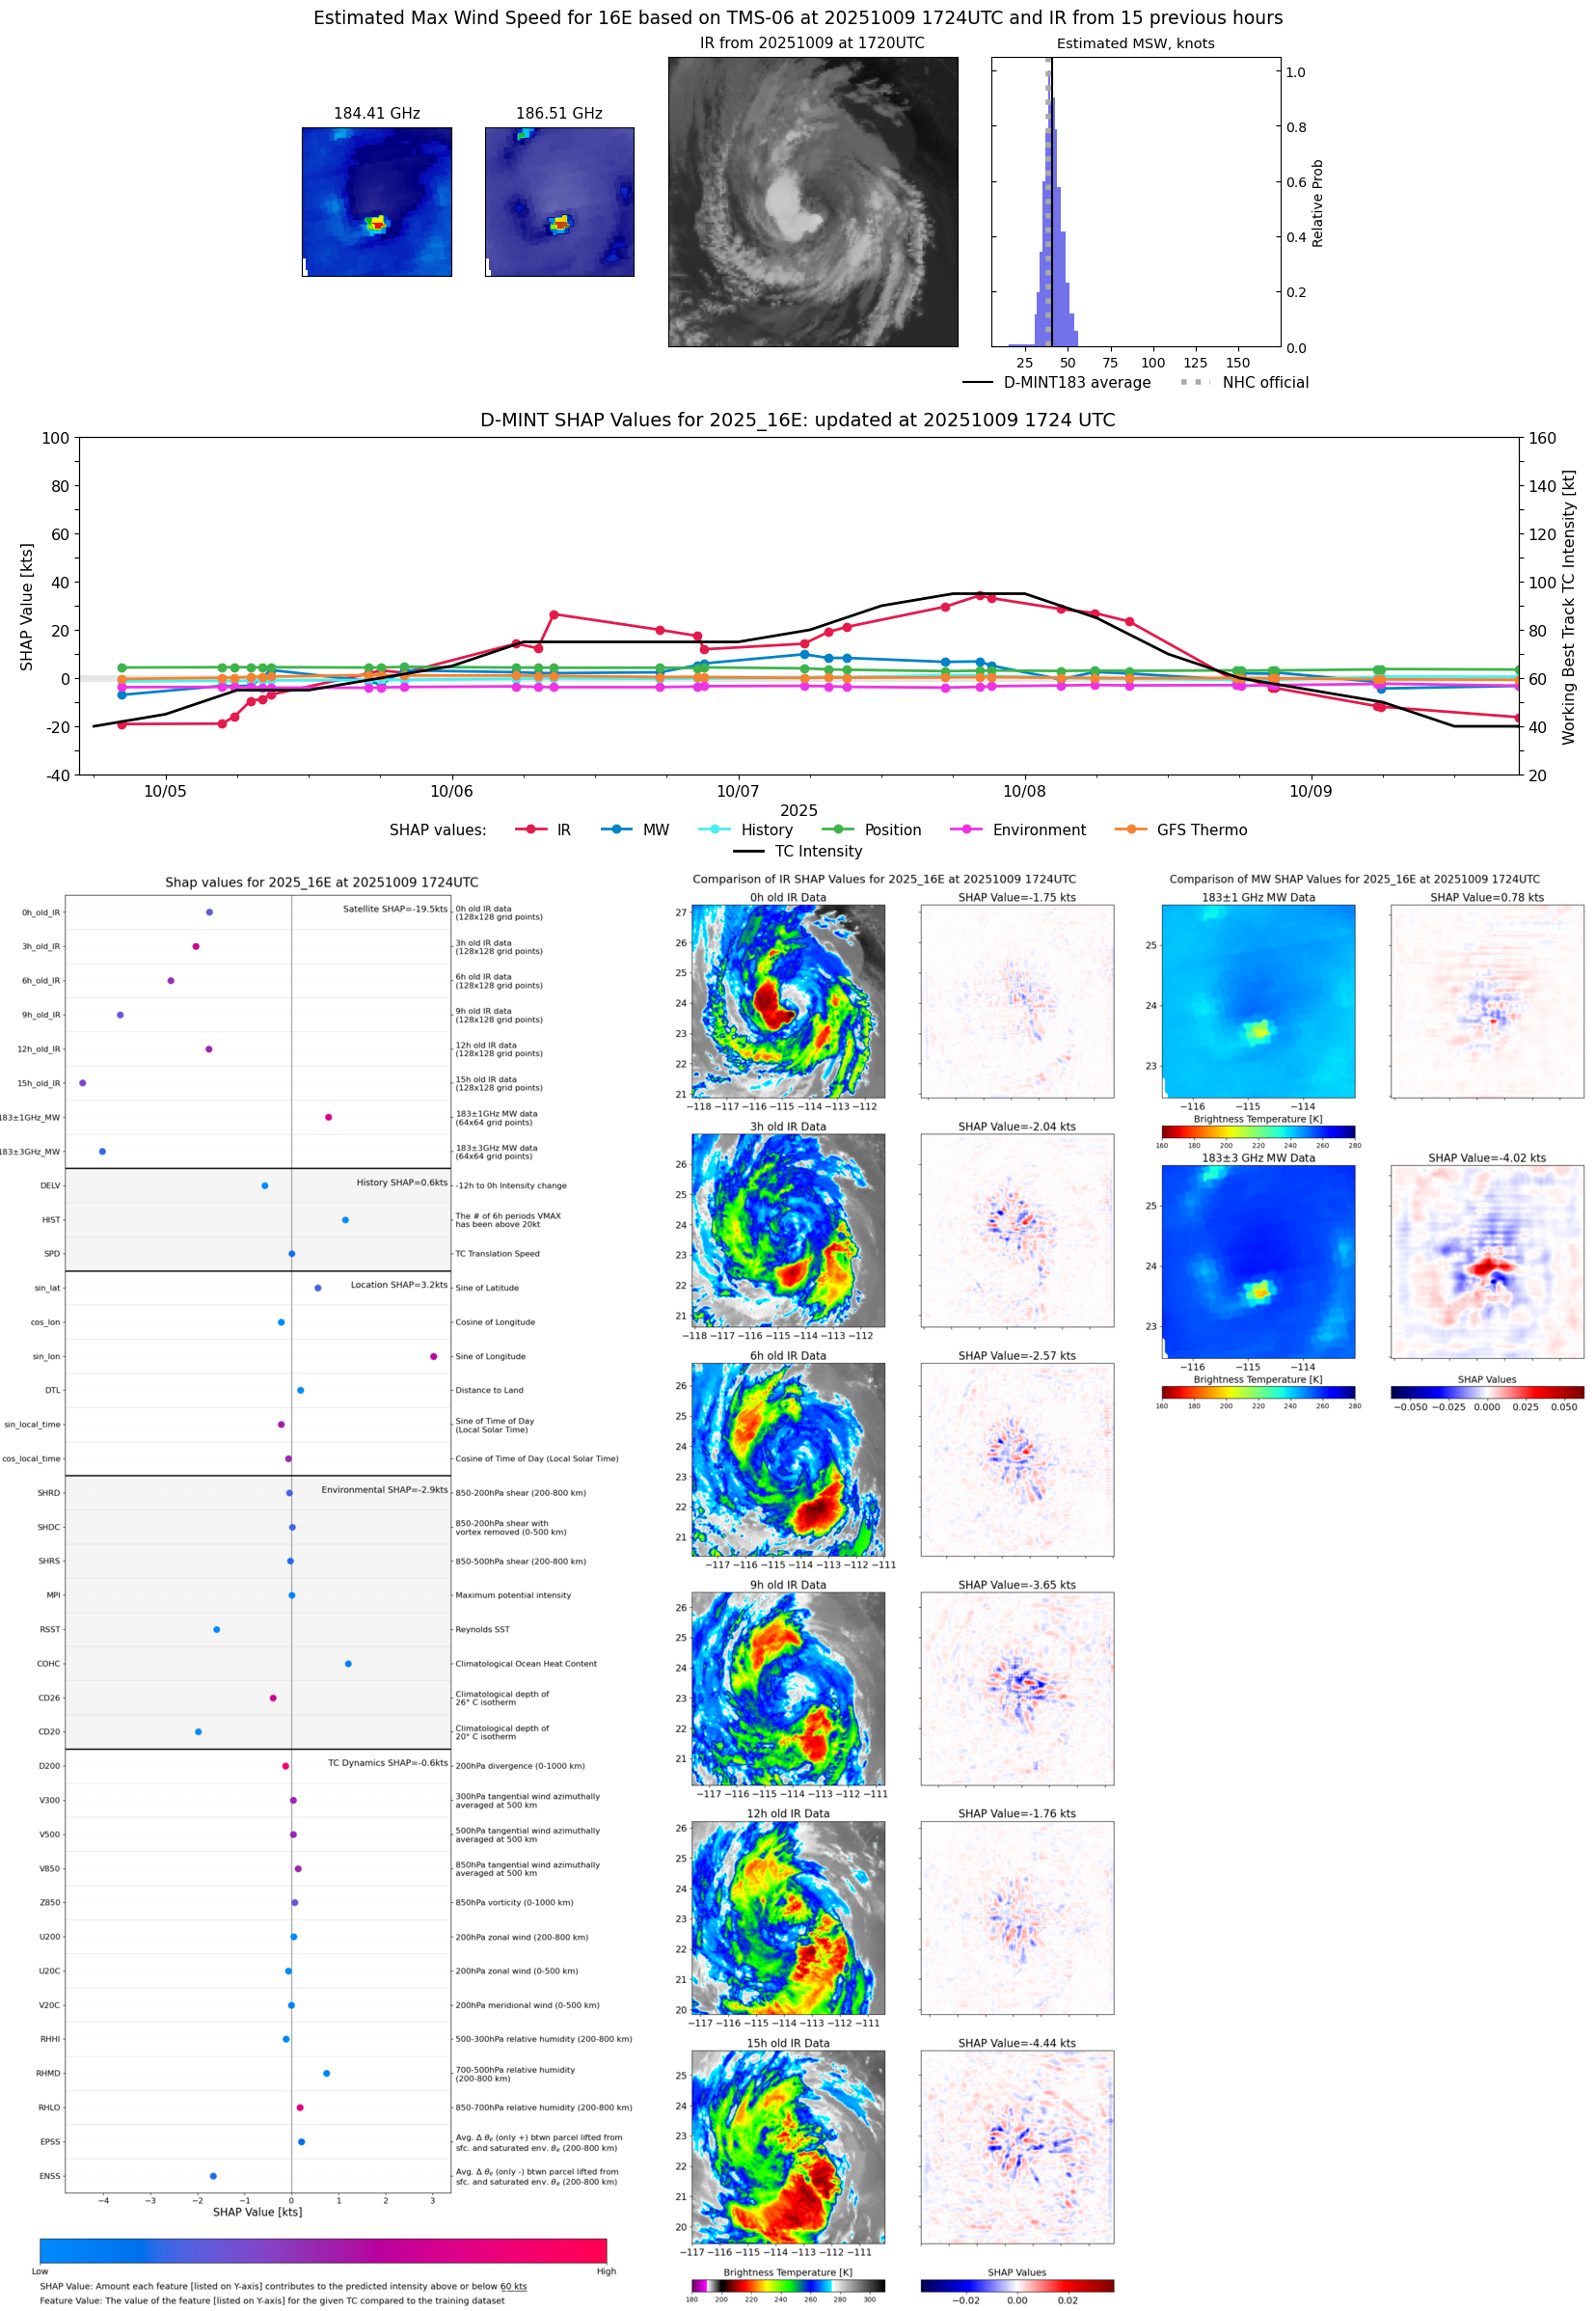 |
| 20251009 | 1501 UTC | SSMISF16 | 998 hPa | 41 kts | 37 kts | 46 kts |  |
| 20251009 | 1408 UTC | SSMISF17 | 996 hPa | 44 kts | 39 kts | 49 kts | 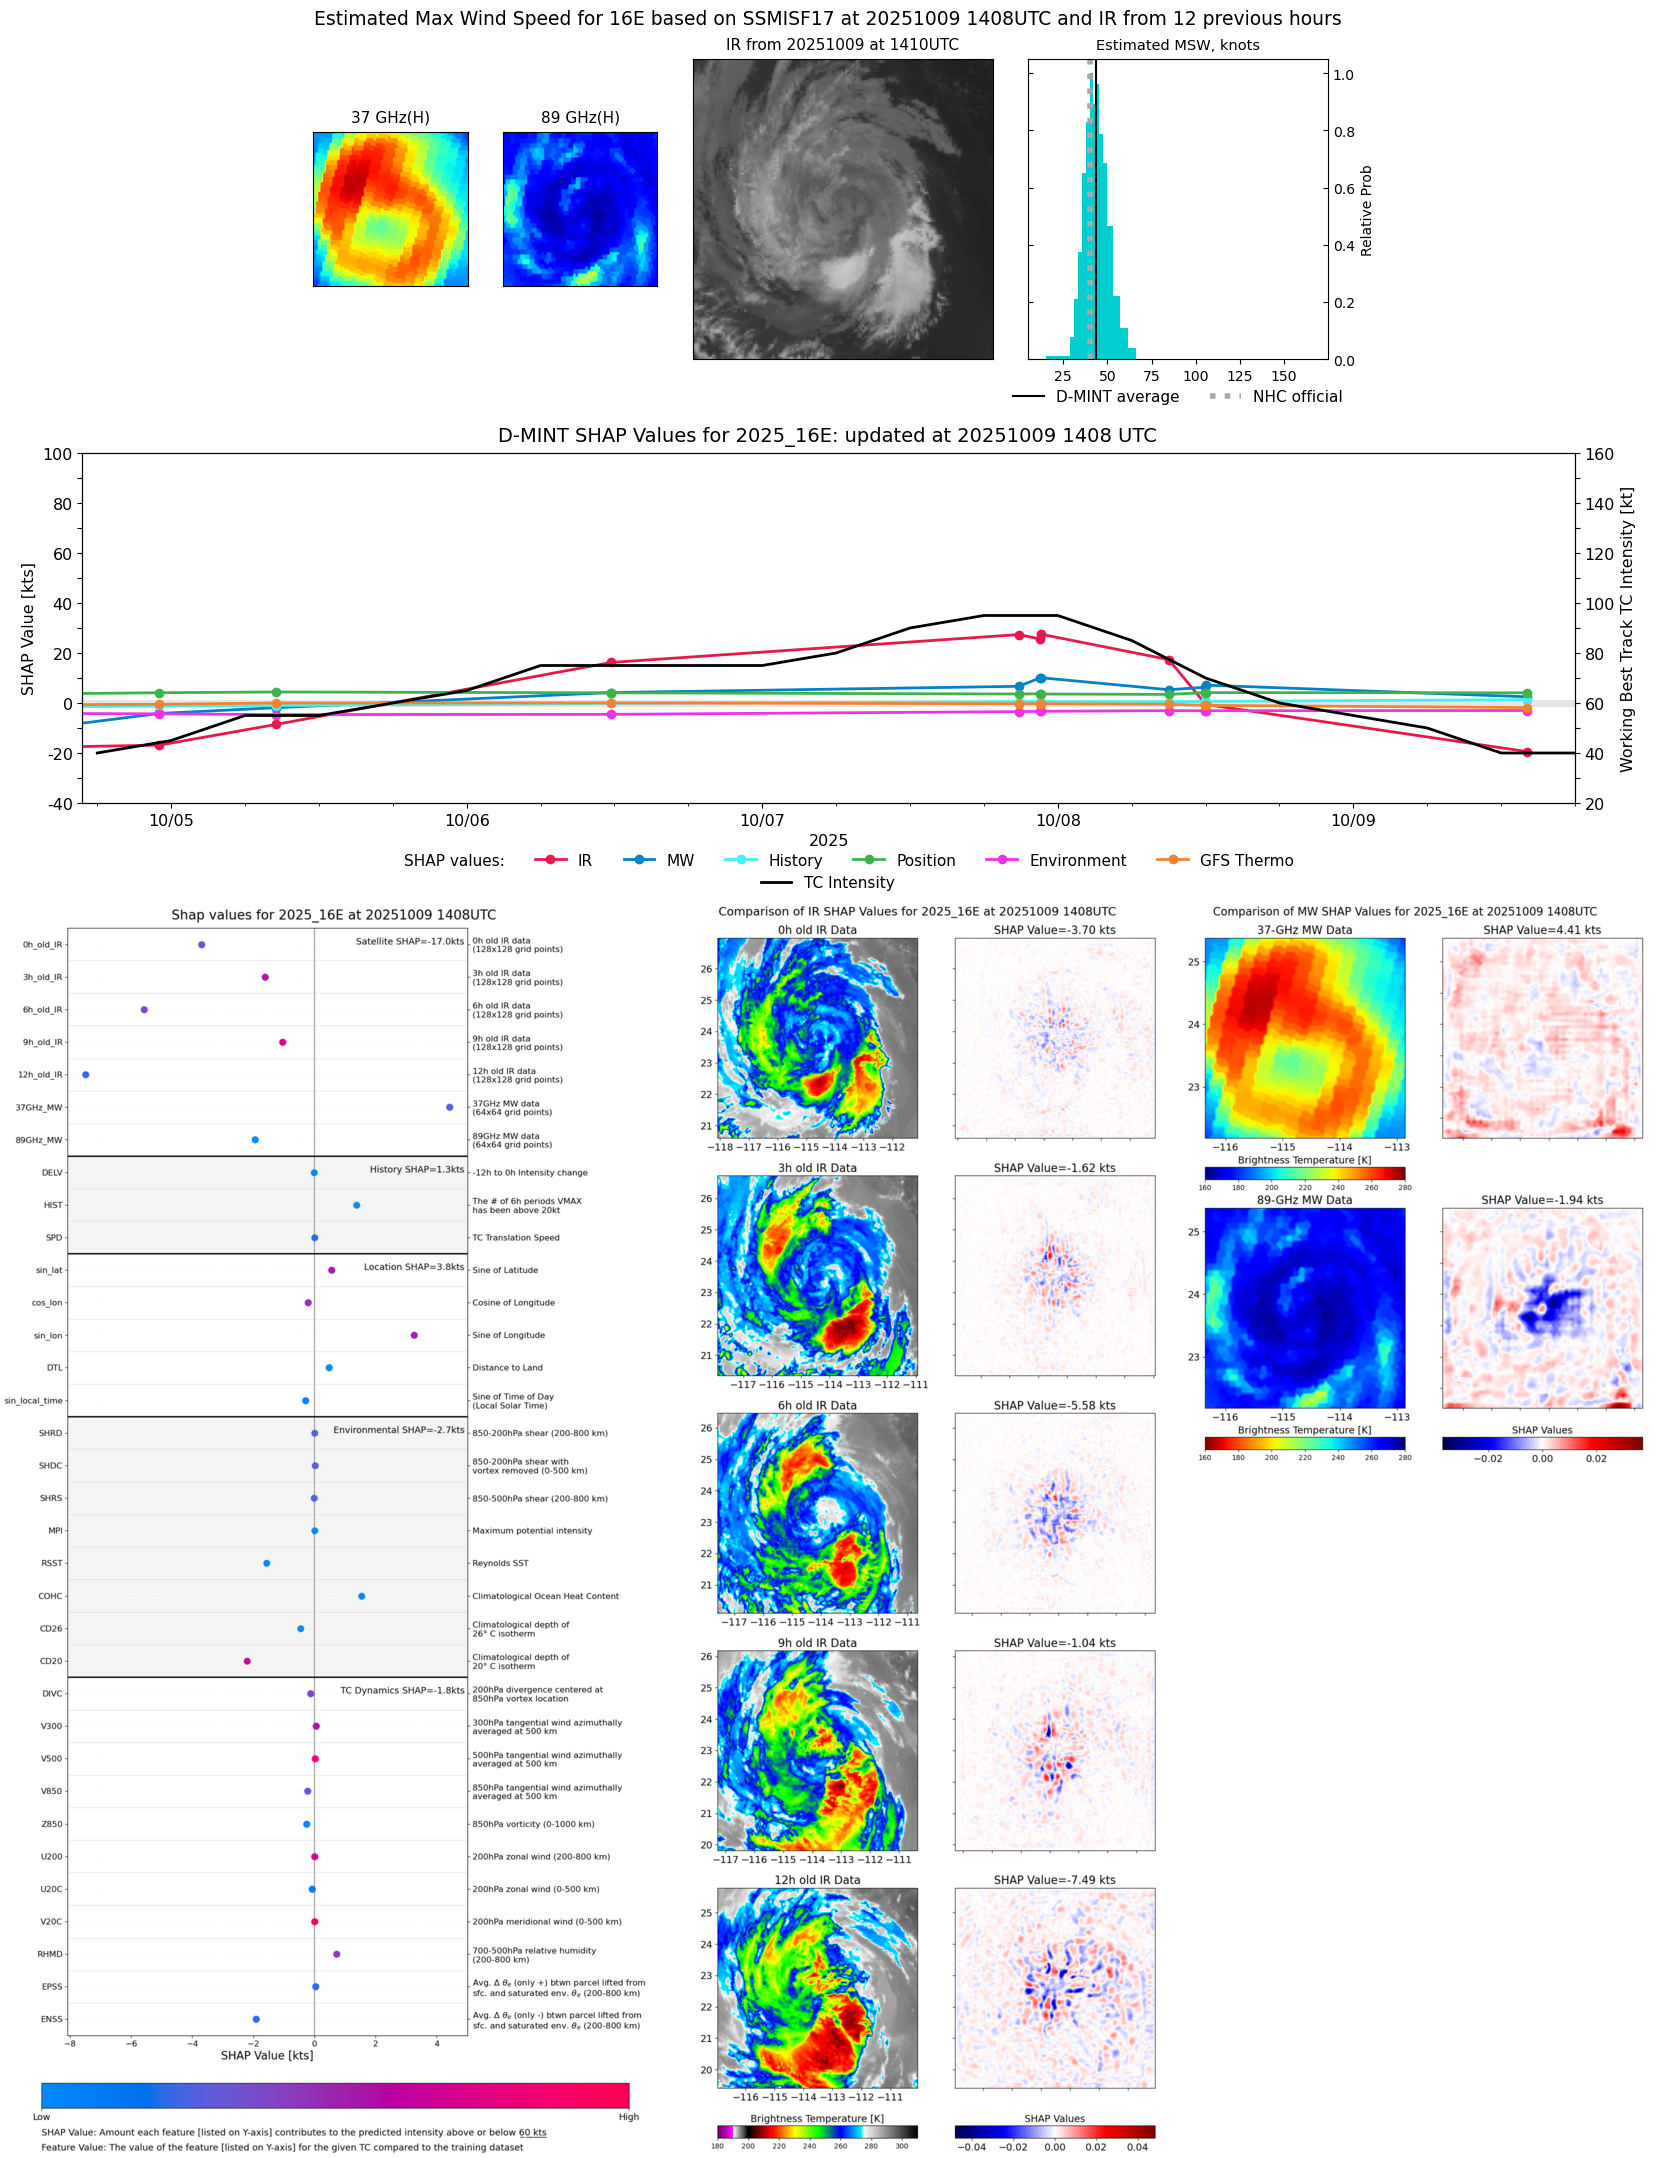 |
| 20251009 | 1328 UTC | TROPICS03 | 1000 hPa | 37 kts | 34 kts | 41 kts | 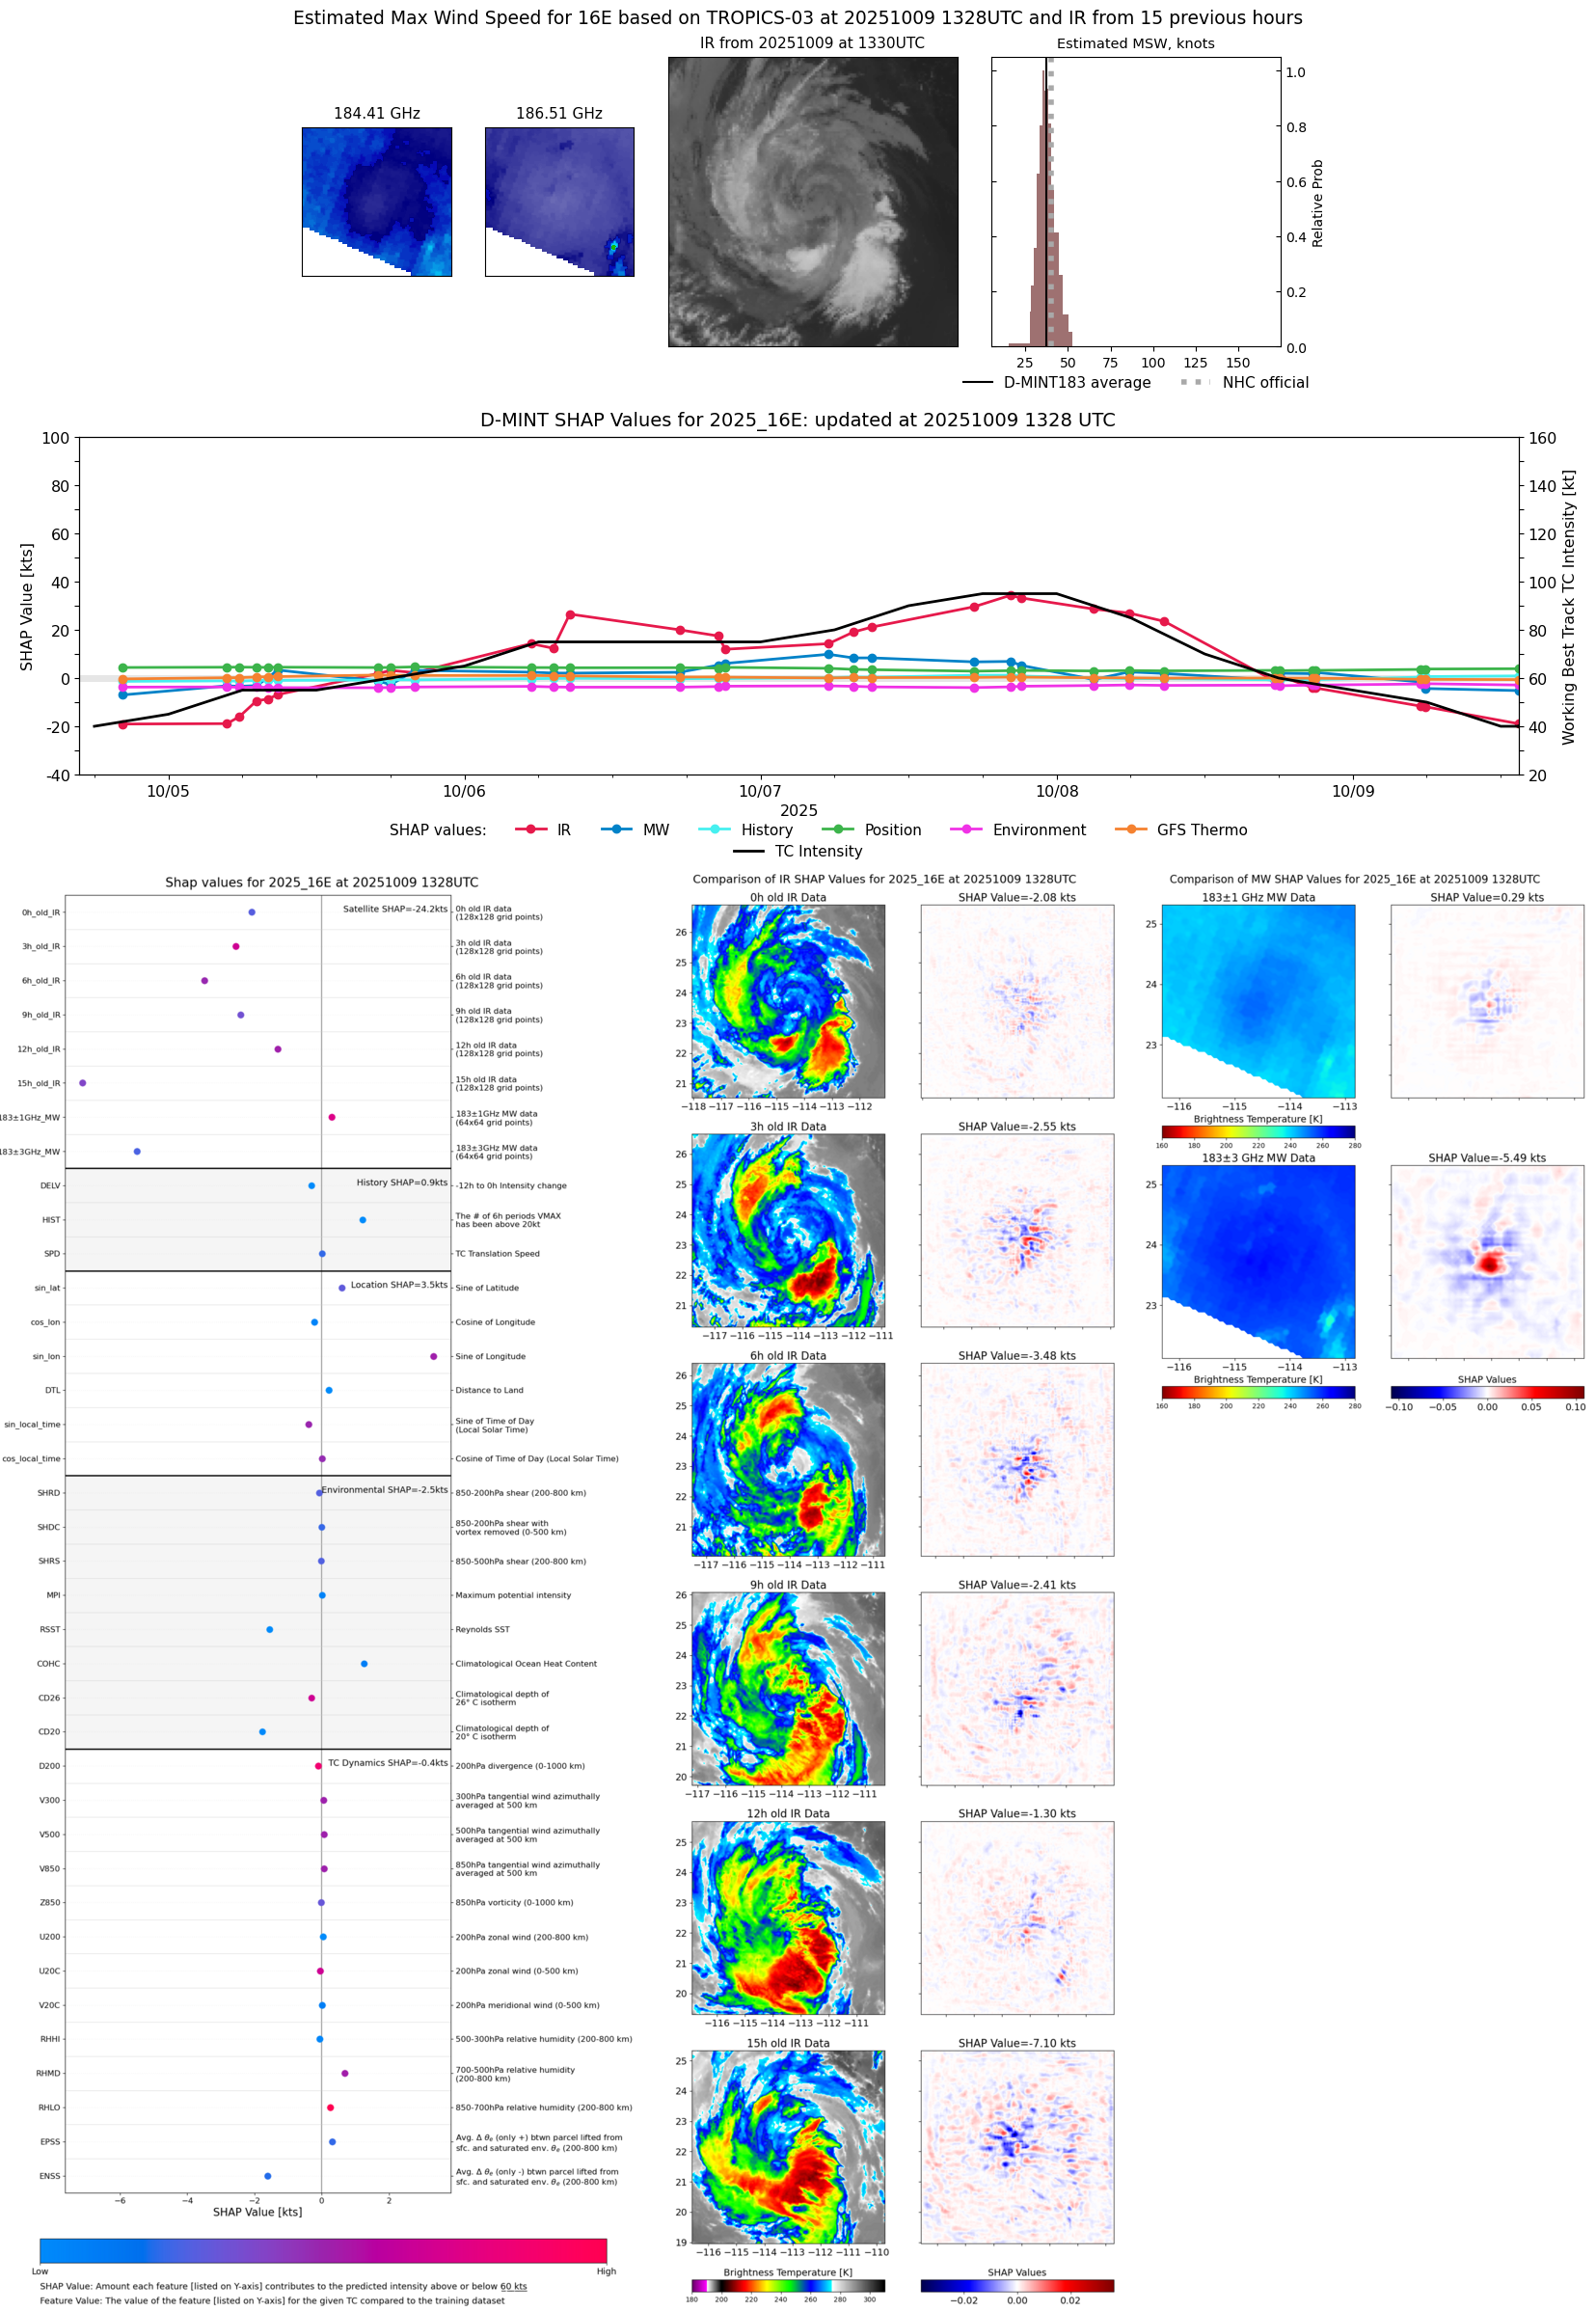 |
| 20251009 | 0943 UTC | AMSR2 | 994 hPa | 48 kts | 43 kts | 53 kts | 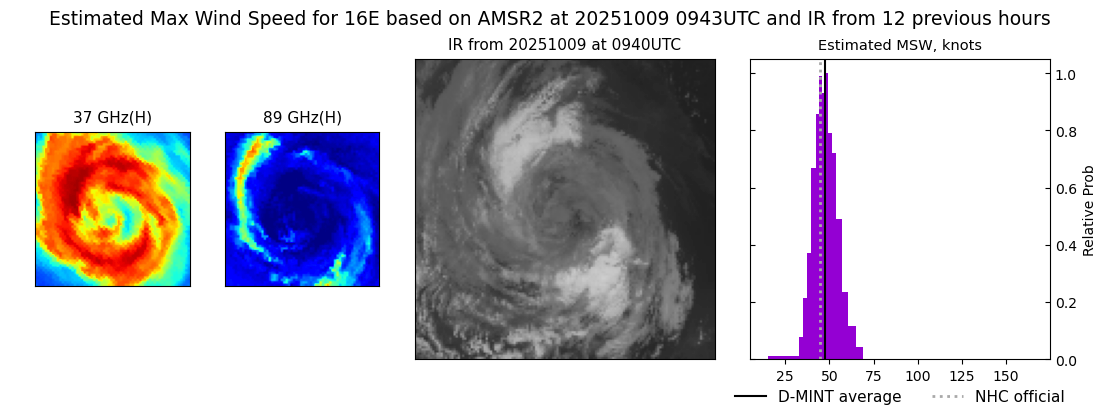 |
| 20251009 | 0914 UTC | ATMS-N20 | 999 hPa | 37 kts | 33 kts | 42 kts | 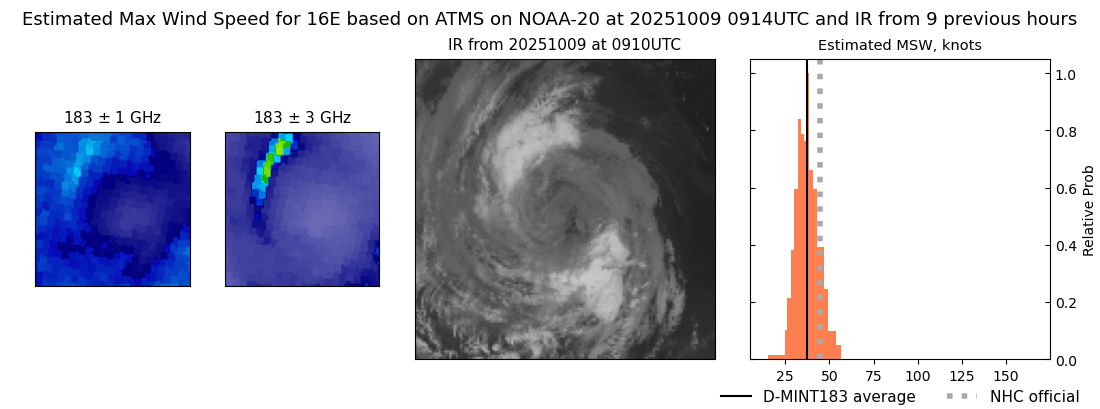 |
| 20251009 | 0552 UTC | TMS05 | 996 hPa | 46 kts | 42 kts | 50 kts | 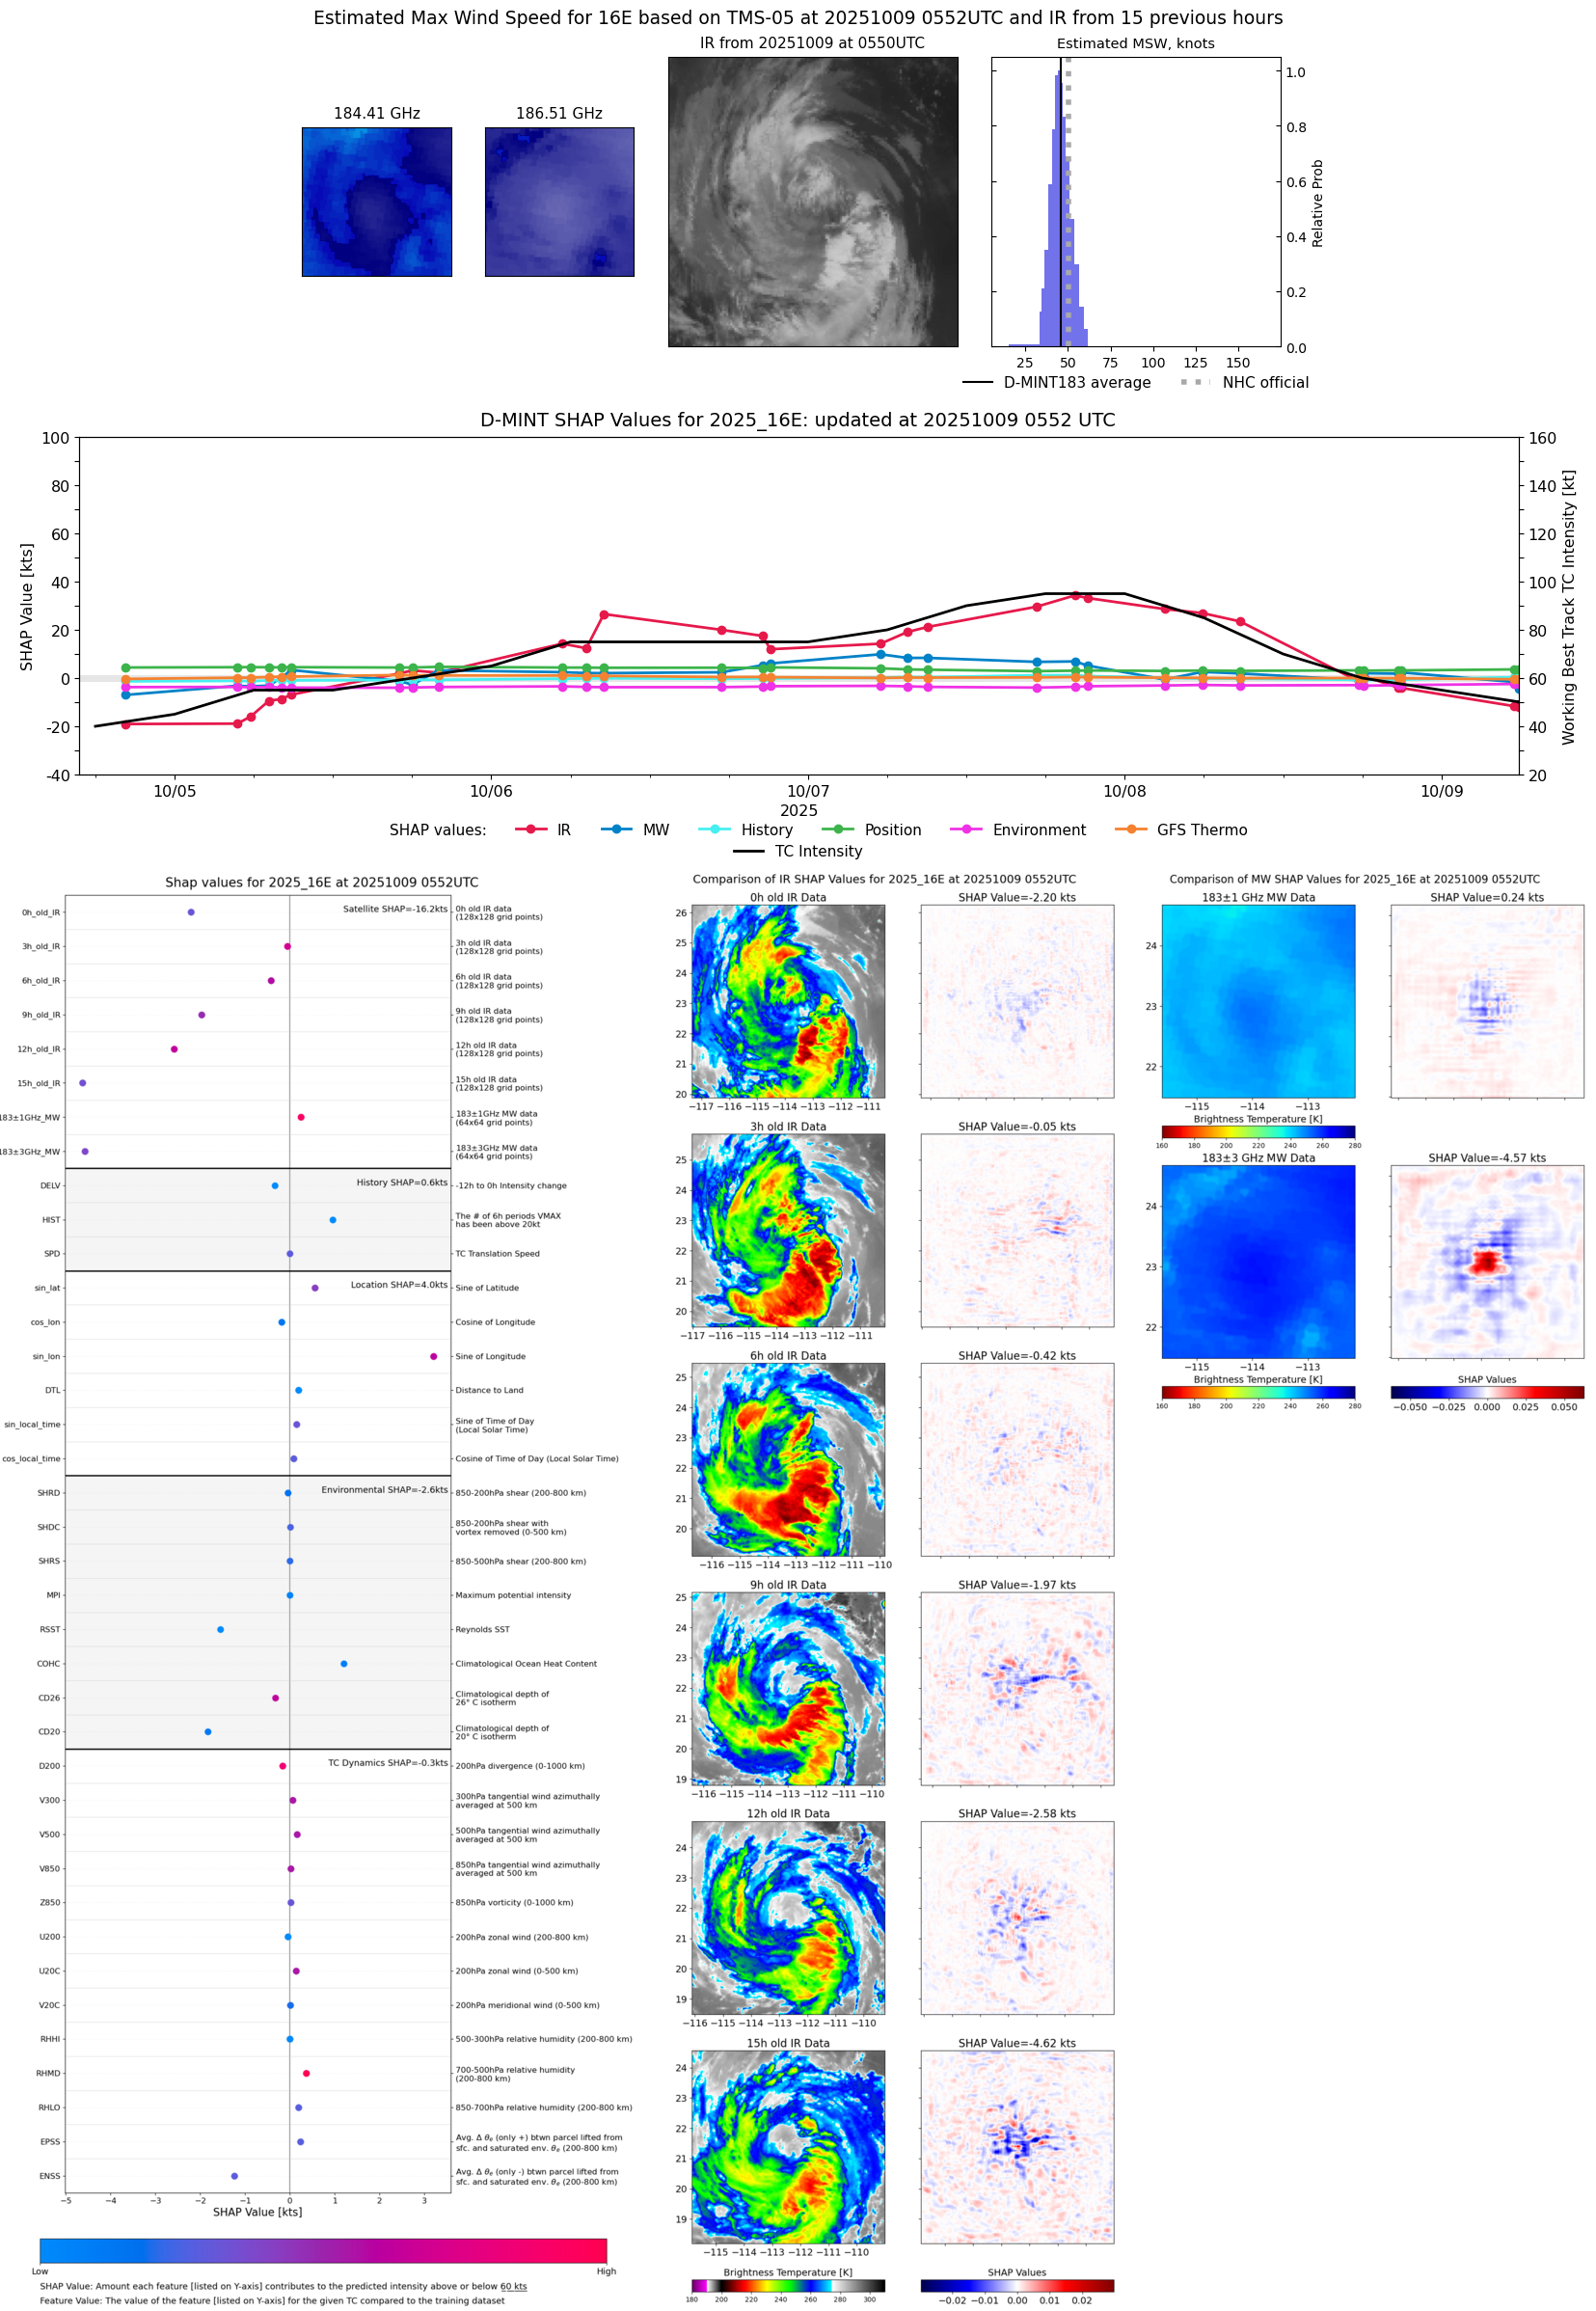 |
| 20251009 | 0530 UTC | TMS07 | 994 hPa | 48 kts | 44 kts | 52 kts | 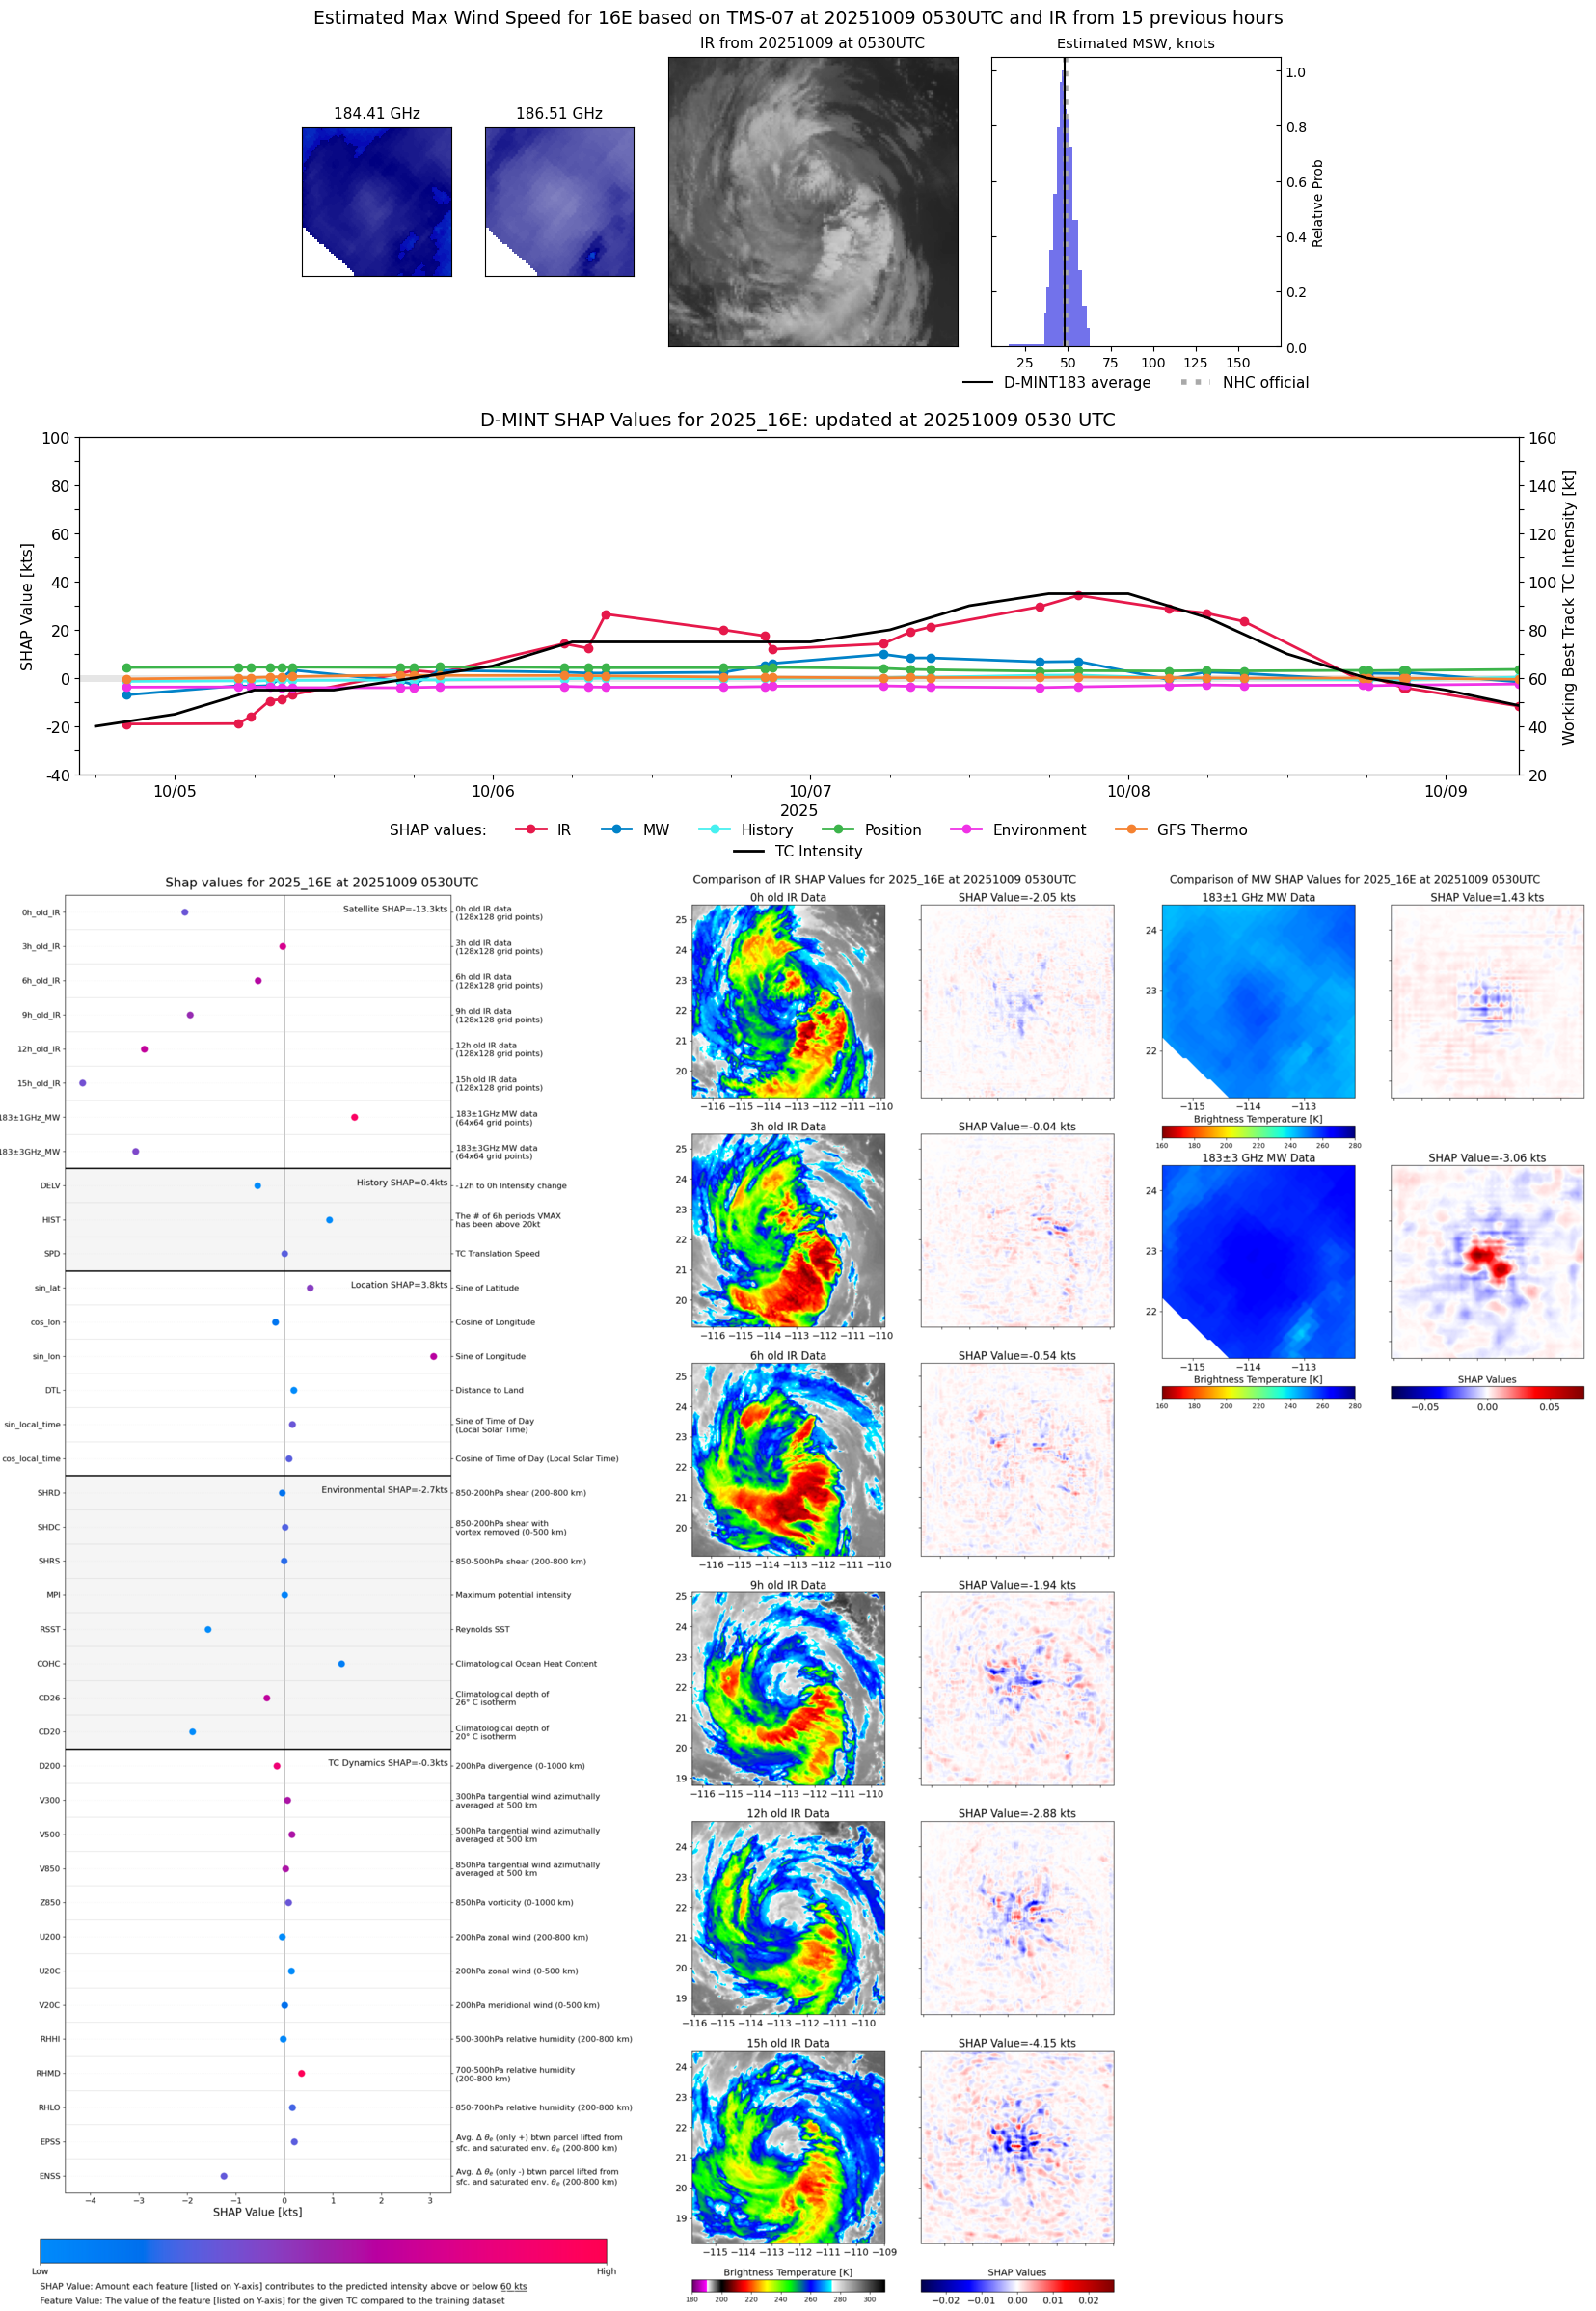 |
| 20251008 | 2058 UTC | TMS07 | 987 hPa | 58 kts | 55 kts | 62 kts |  |
| 20251008 | 2045 UTC | ATMS-N20 | 988 hPa | 58 kts | 54 kts | 61 kts | 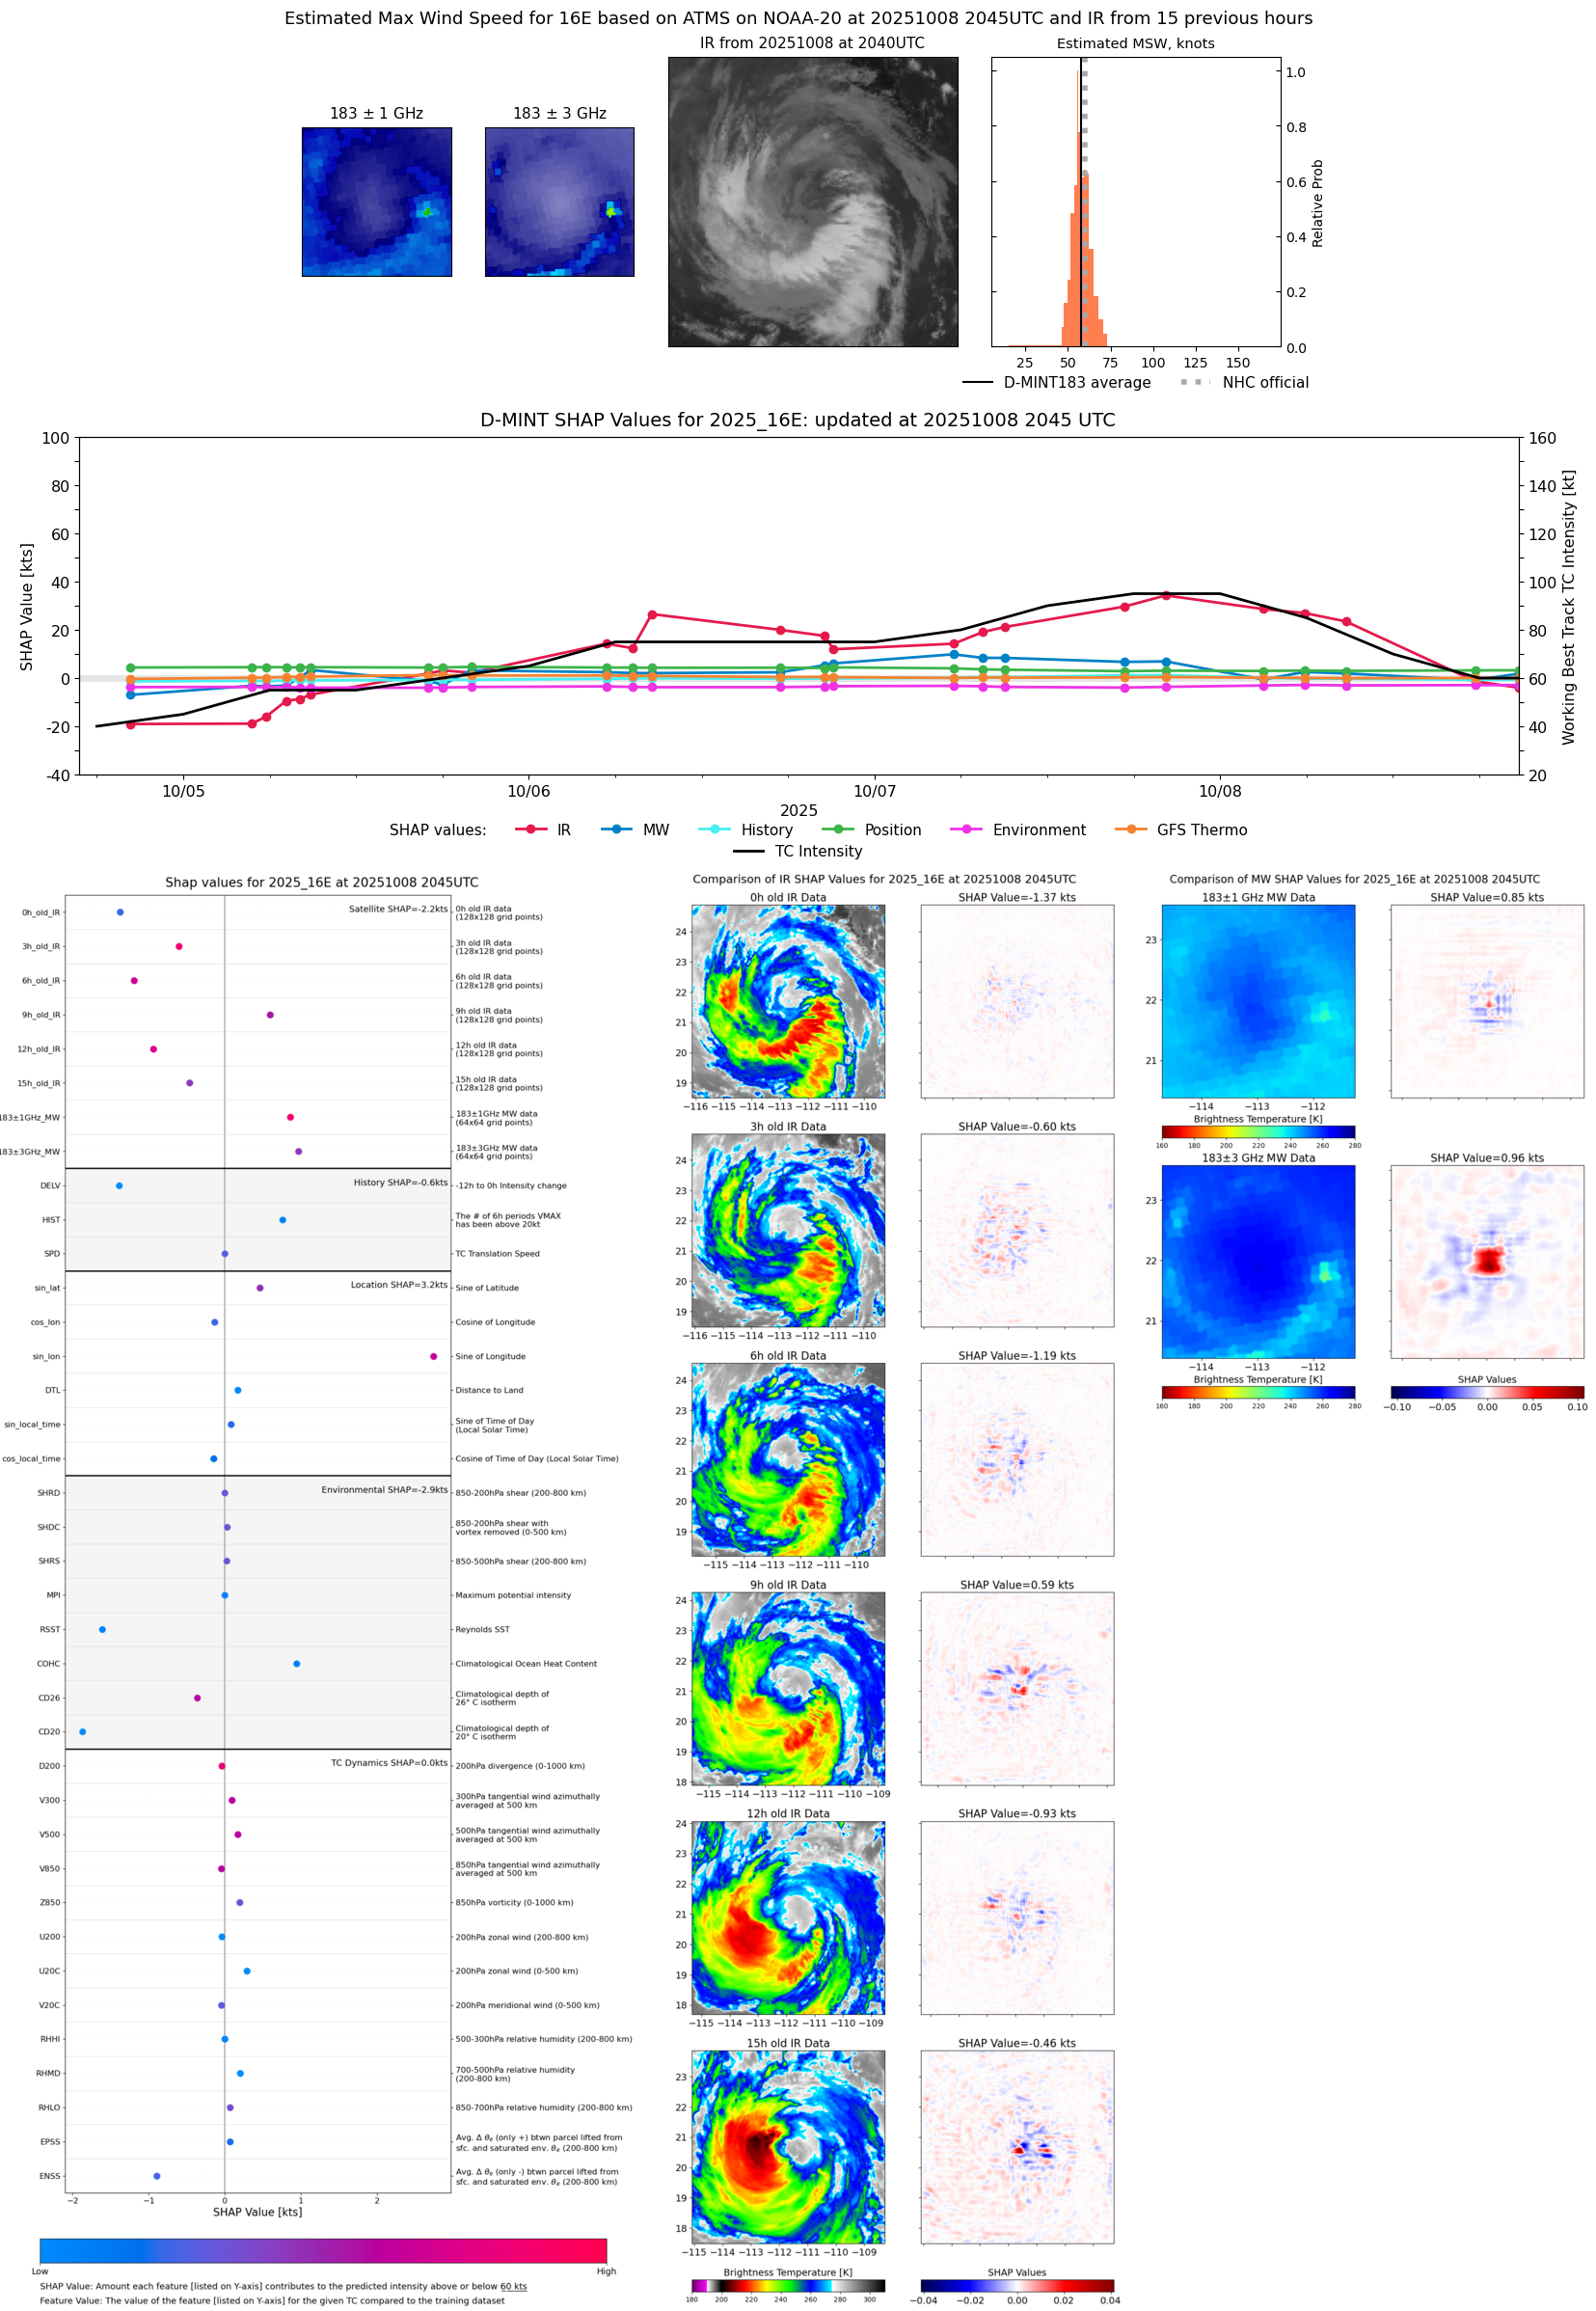 |
| 20251008 | 1807 UTC | TMS02 | 989 hPa | 62 kts | 59 kts | 66 kts | 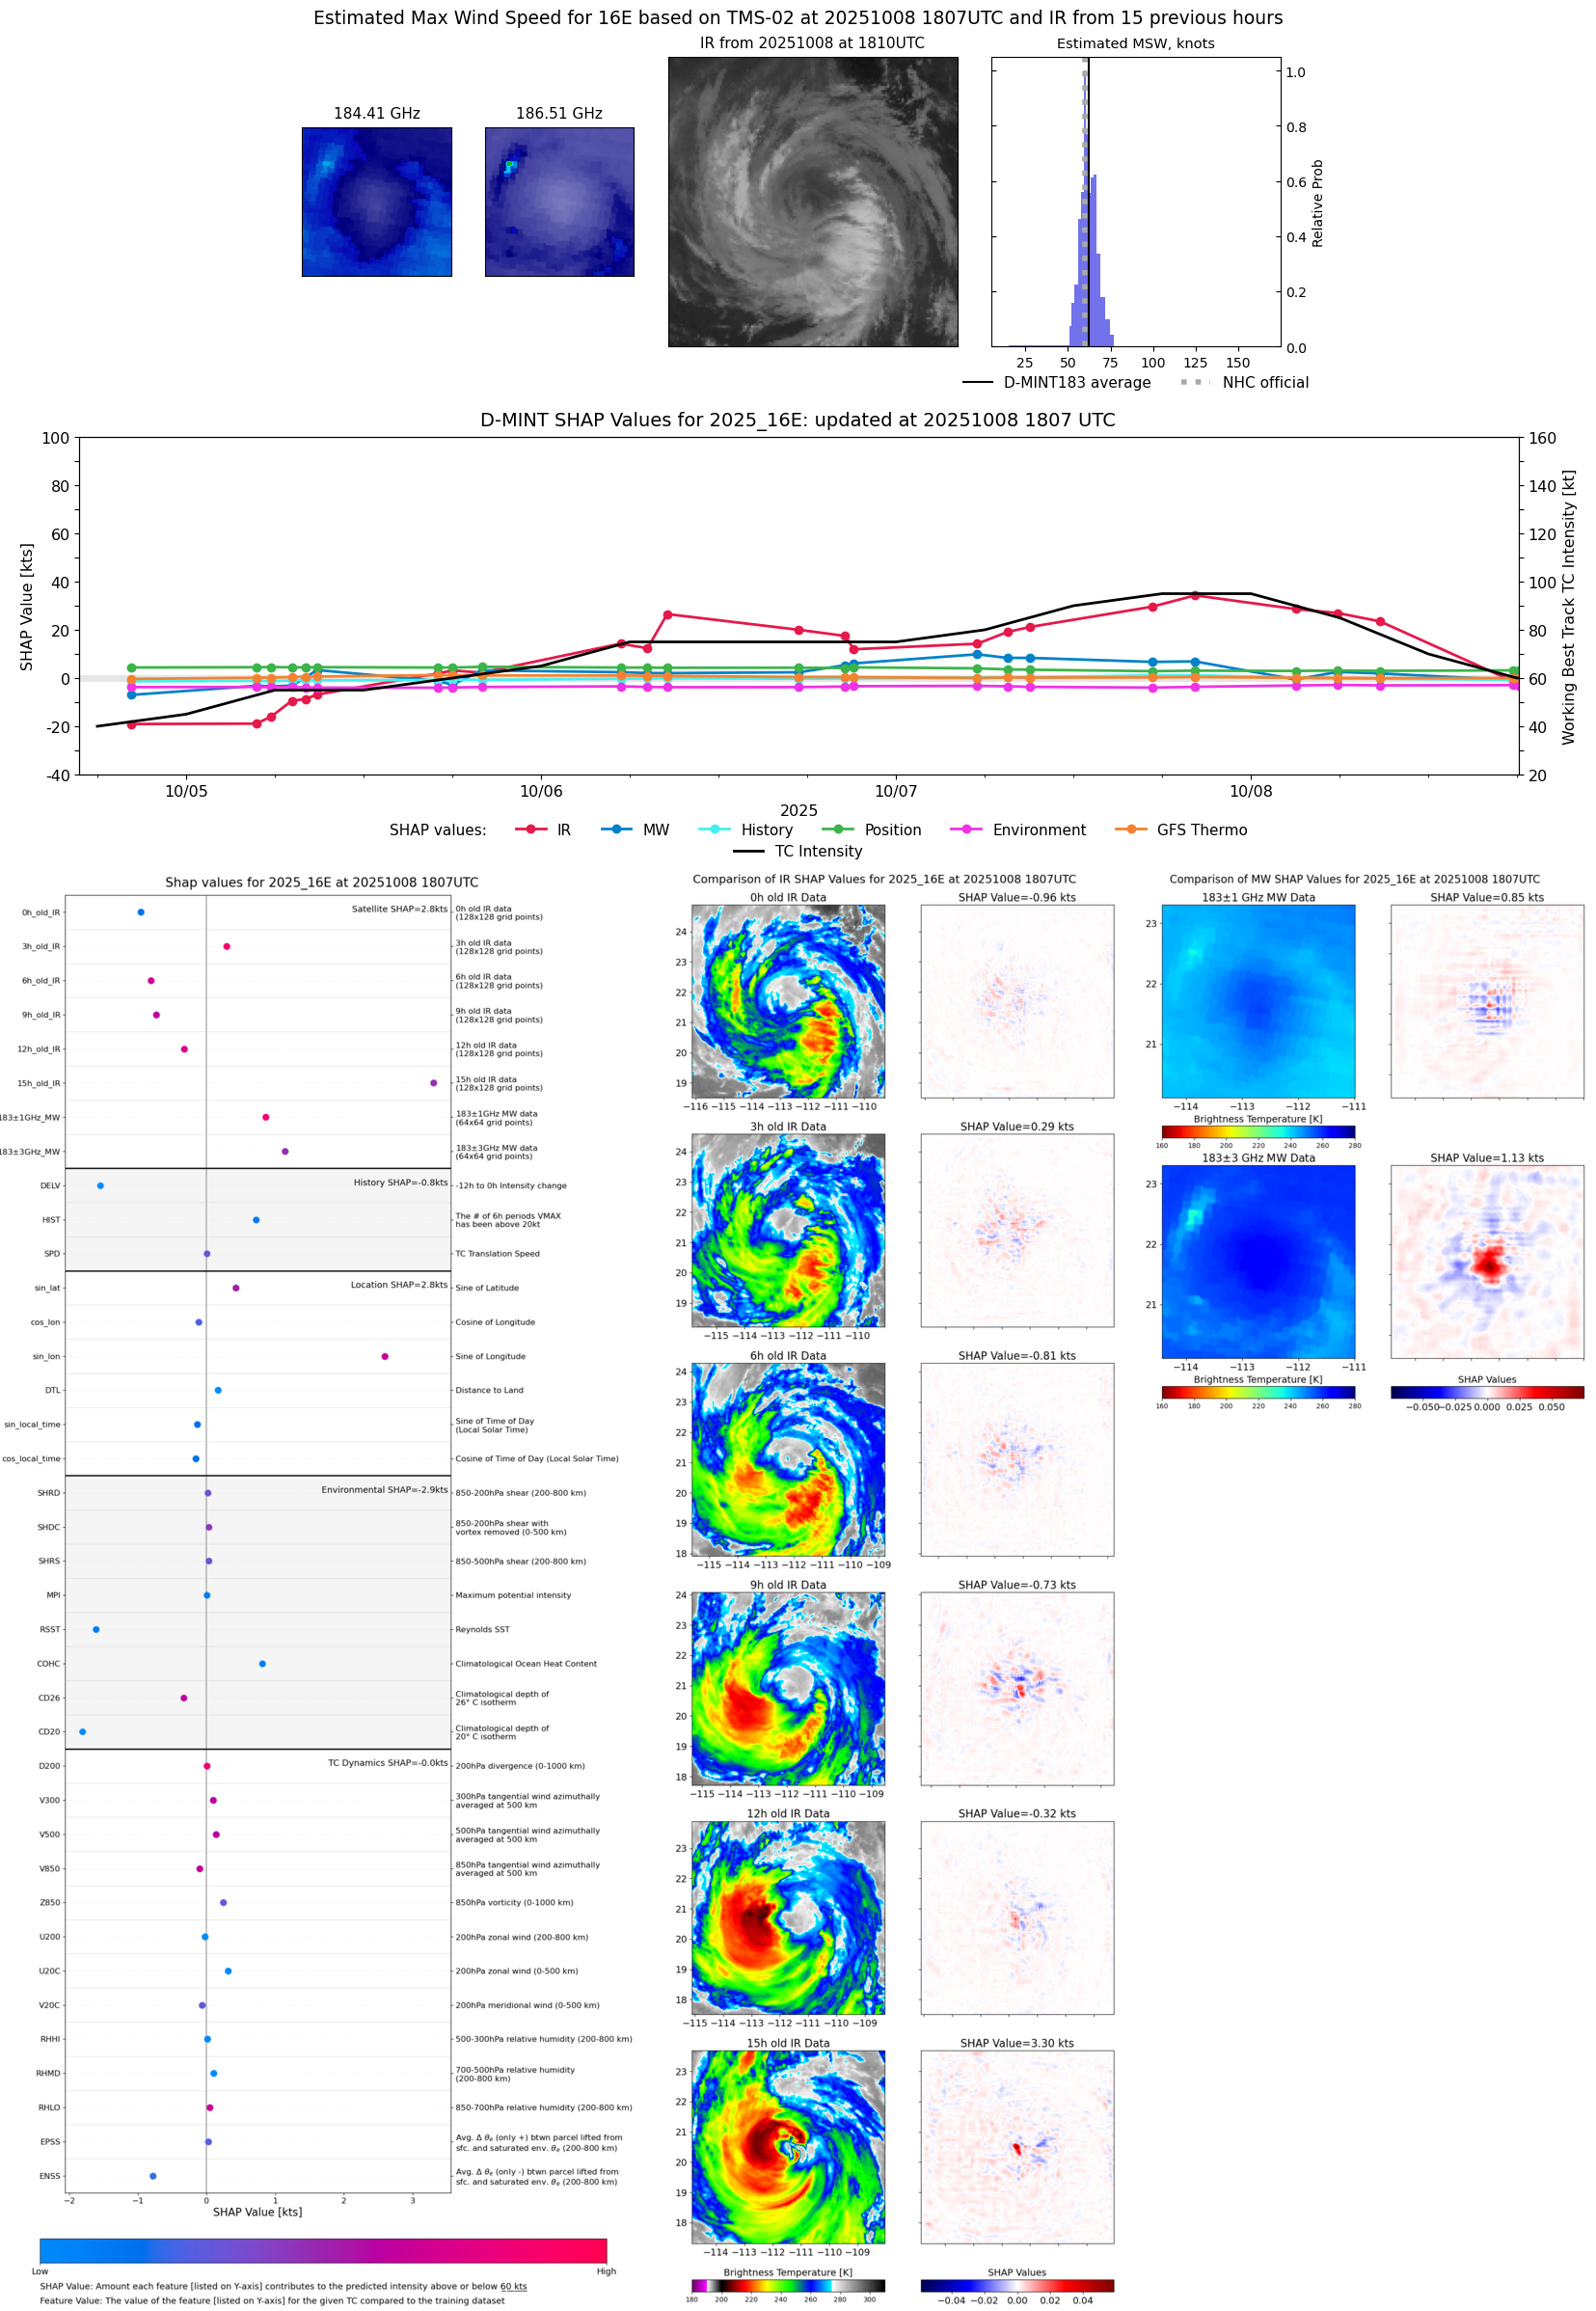 |
| 20251008 | 1743 UTC | TMS06 | 988 hPa | 58 kts | 54 kts | 61 kts |  |
| 20251008 | 1201 UTC | GMI | 984 hPa | 67 kts | 62 kts | 73 kts |  |
| 20251008 | 1158 UTC | GMI | 984 hPa | 67 kts | 62 kts | 73 kts | 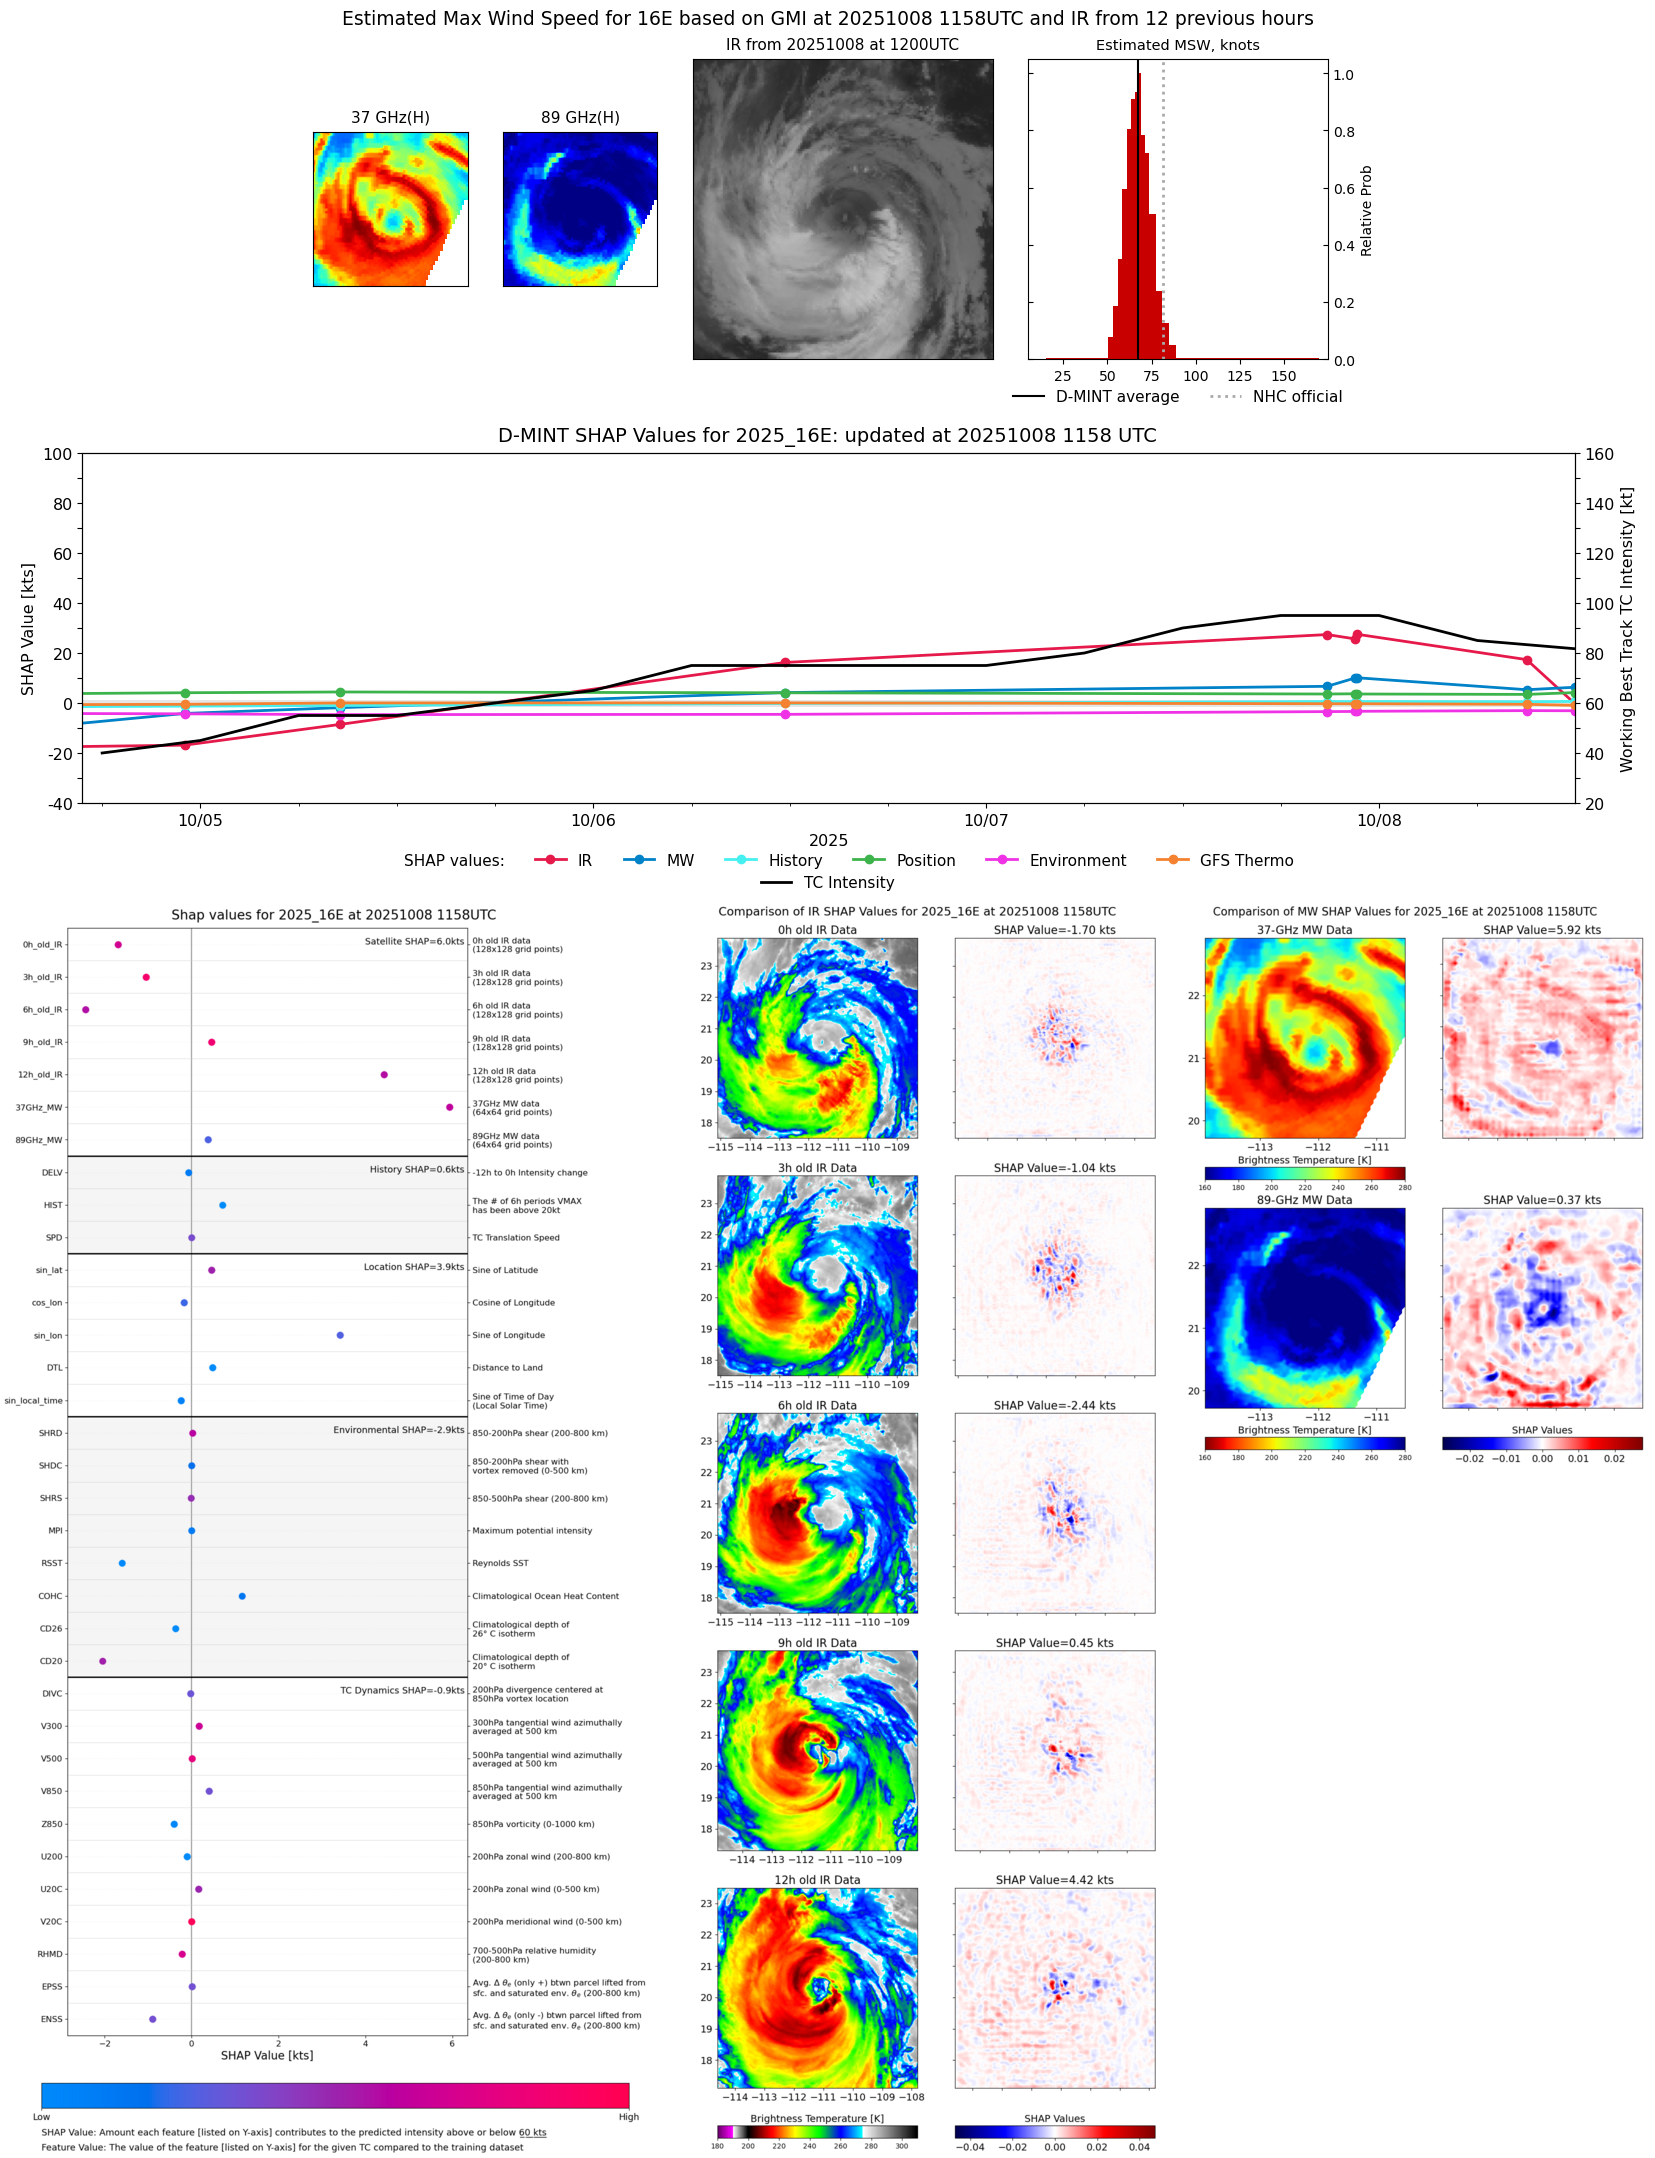 |
| 20251008 | 0901 UTC | AMSR2 | 970 hPa | 82 kts | 77 kts | 87 kts |  |
| 20251008 | 0844 UTC | ATMS-N21 | 973 hPa | 85 kts | 81 kts | 90 kts | 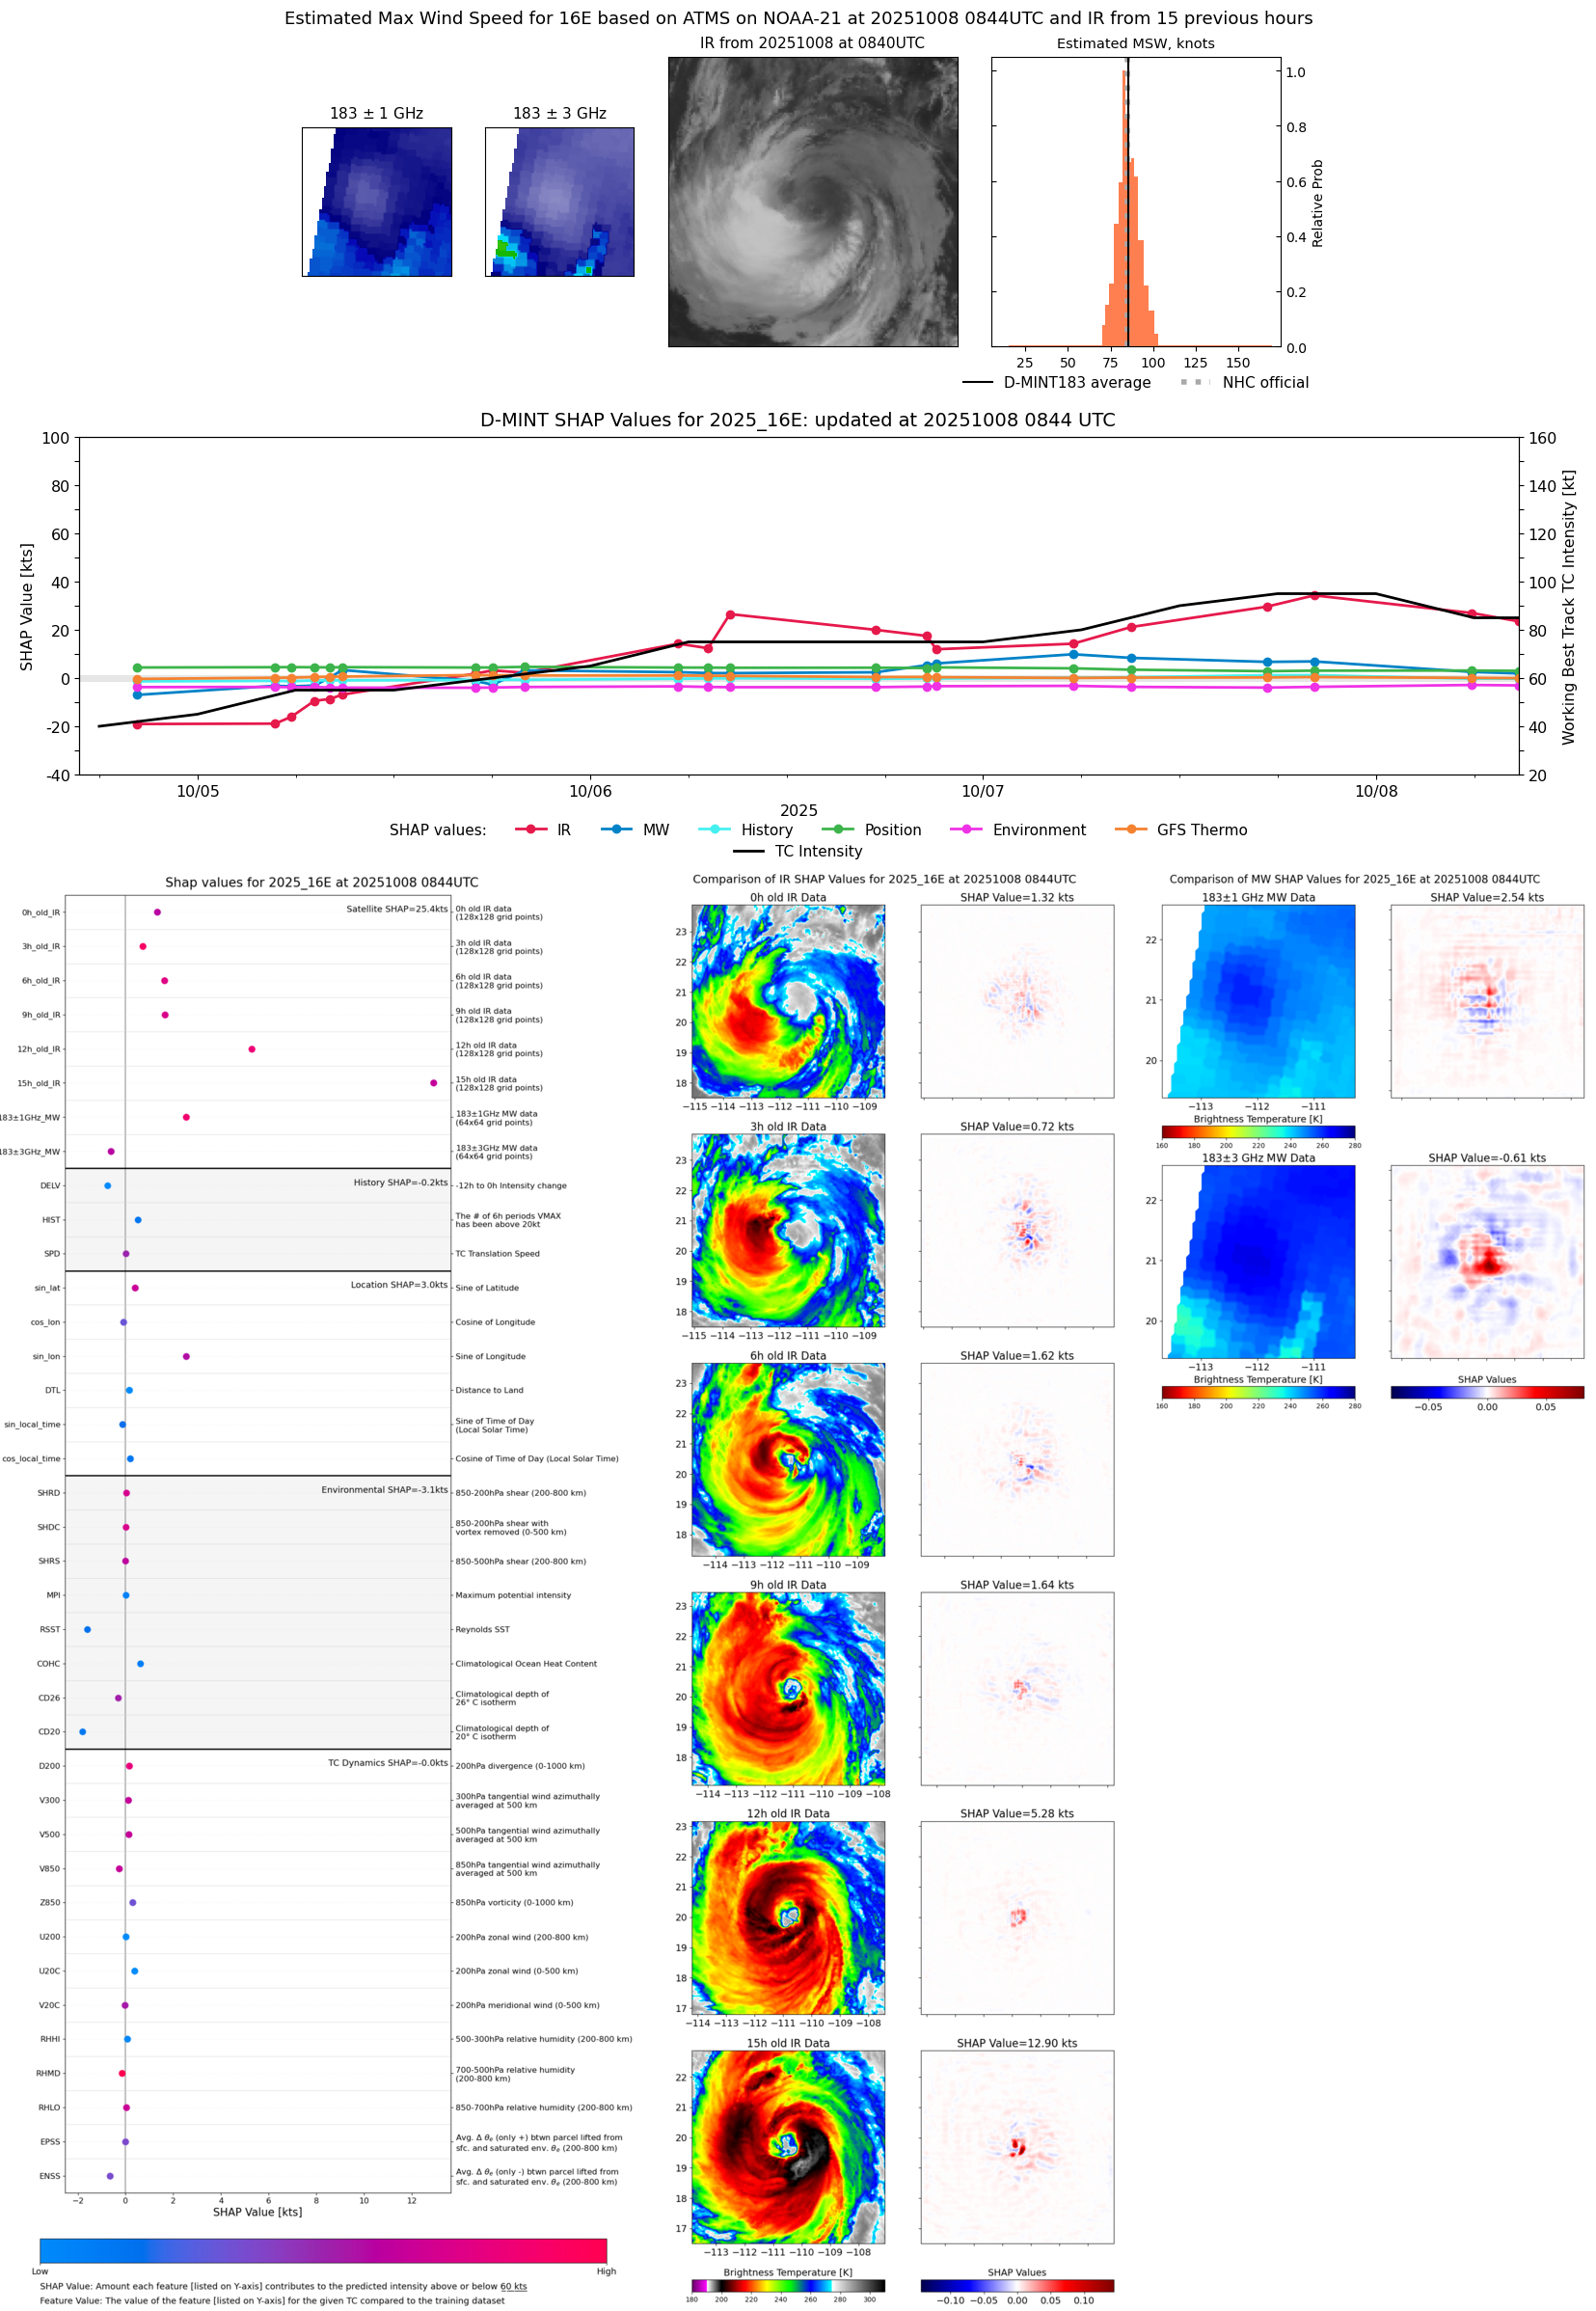 |
| 20251008 | 0552 UTC | TMS06 | 969 hPa | 90 kts | 85 kts | 95 kts | 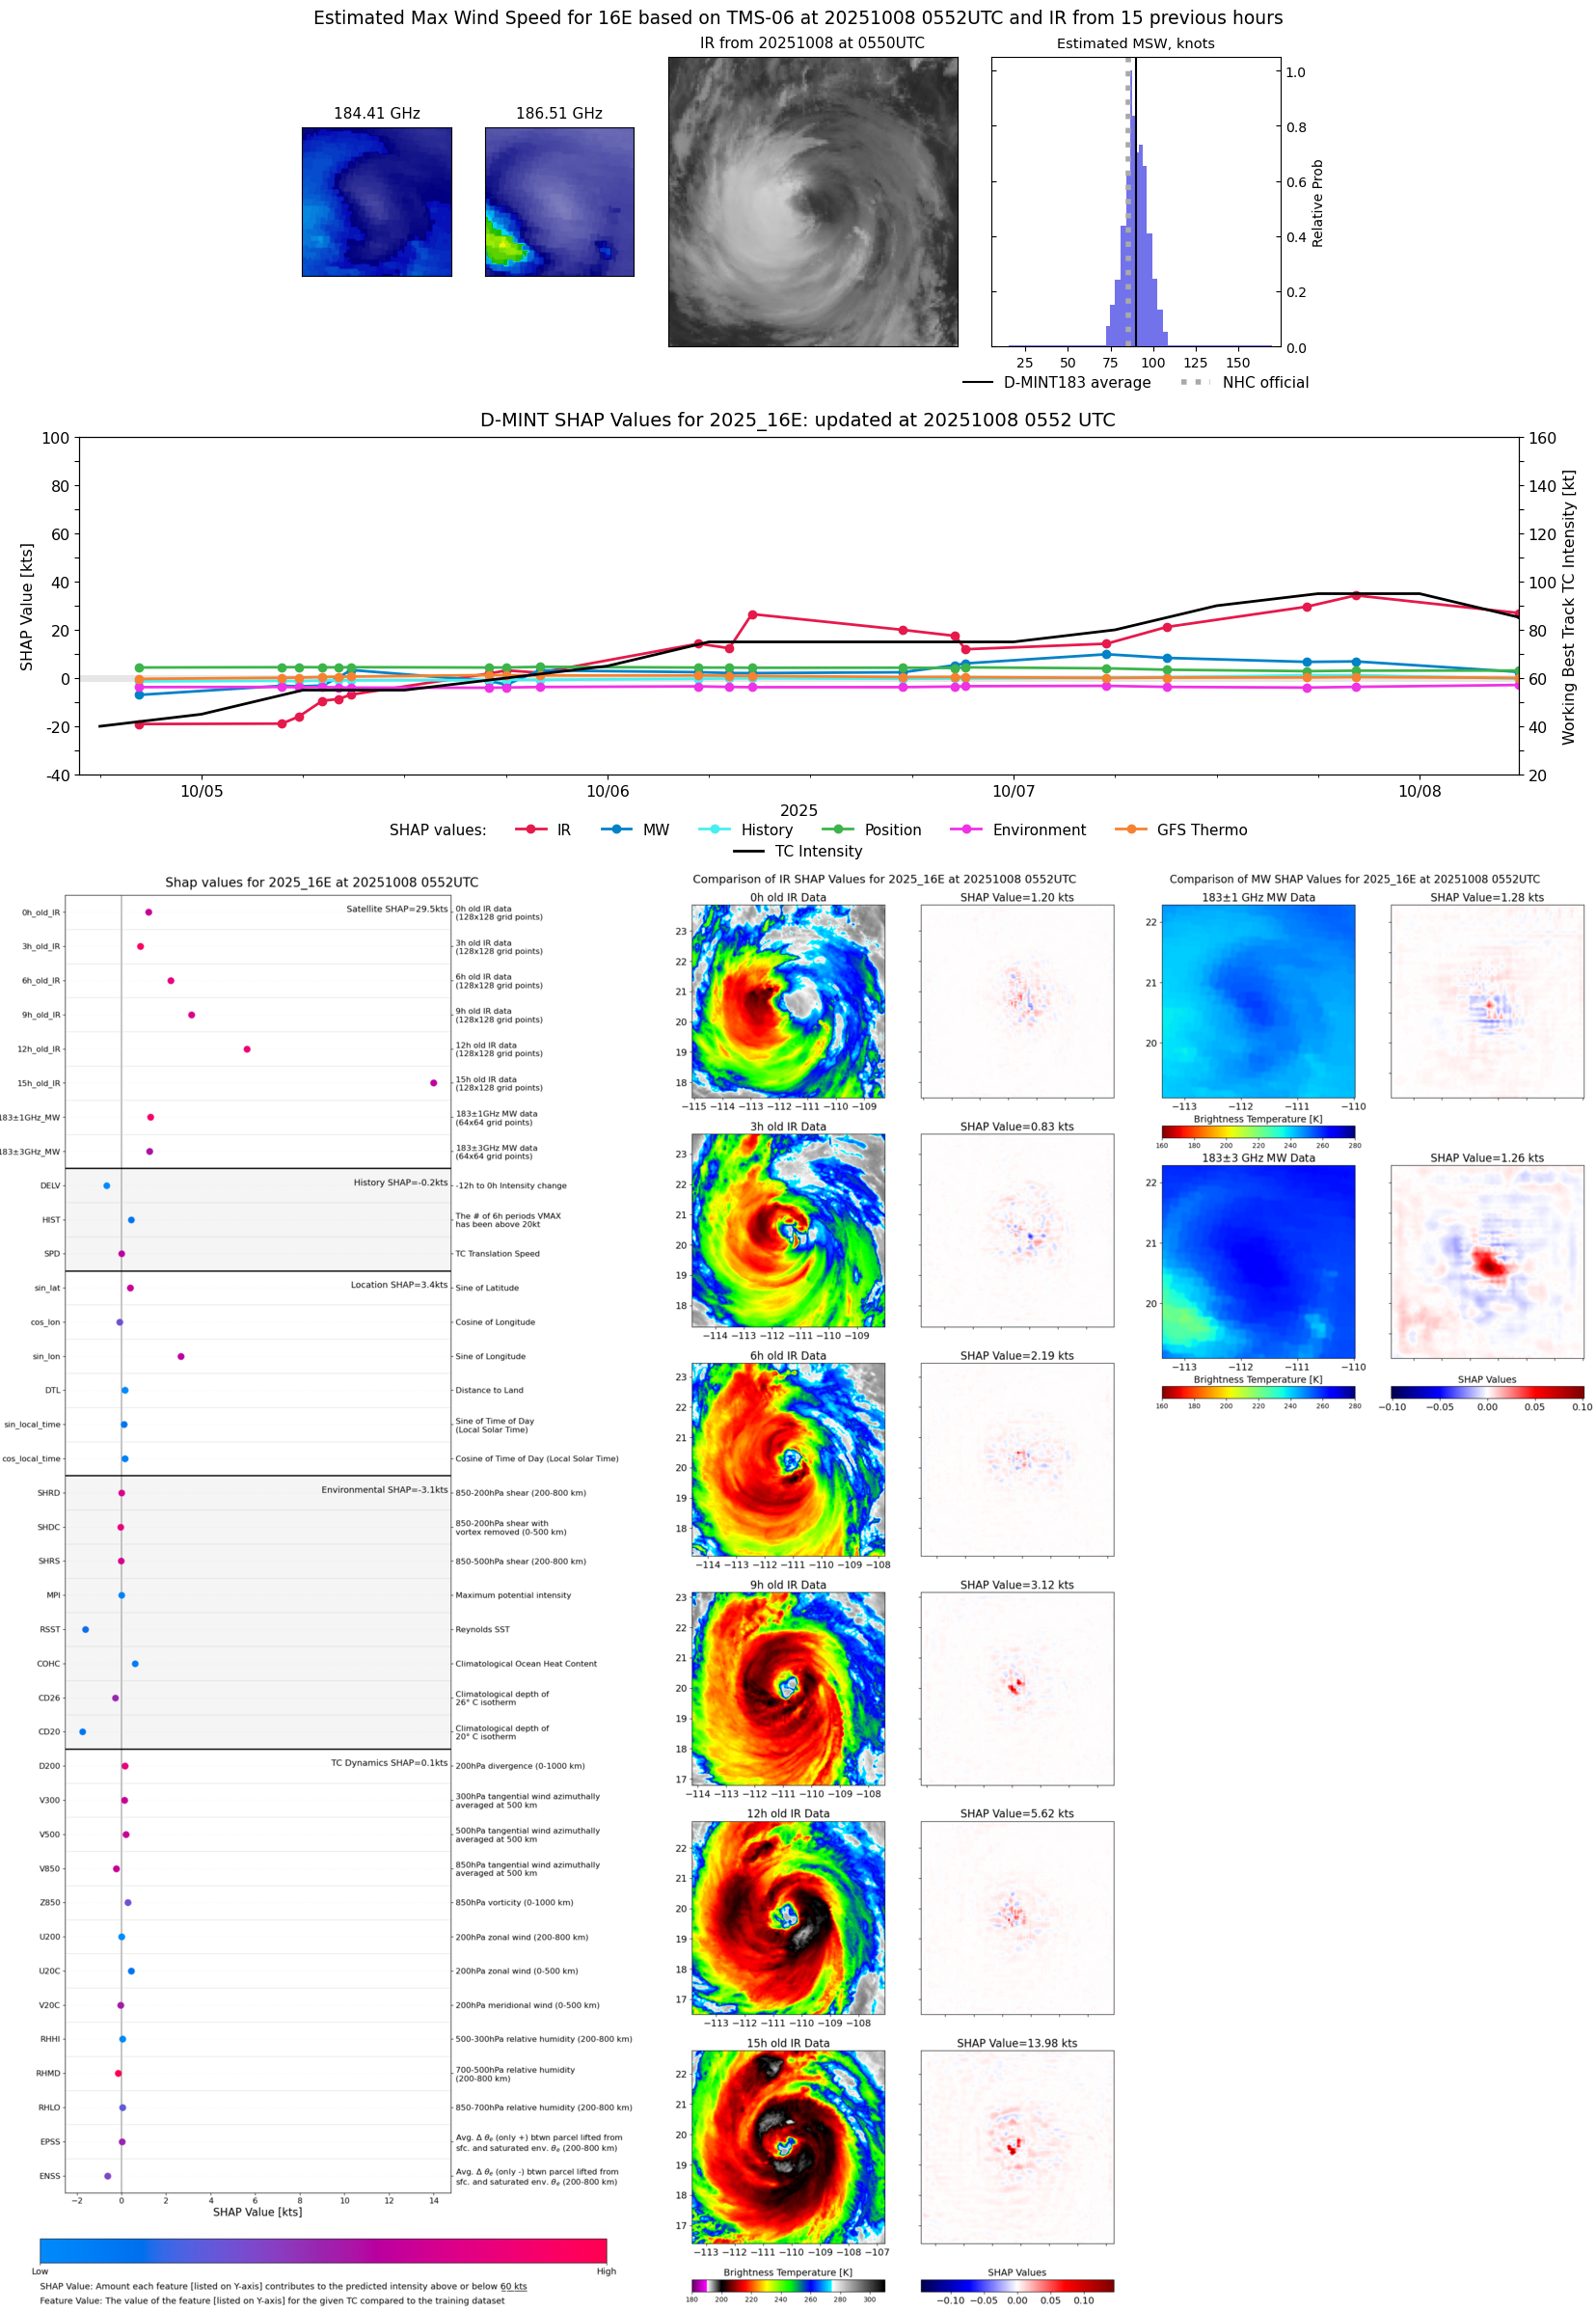 |
| 20251008 | 0302 UTC | TROPICS05 | 962 hPa | 88 kts | 84 kts | 93 kts |  |
| 20251007 | 2239 UTC | GMI | 958 hPa | 98 kts | 93 kts | 103 kts | 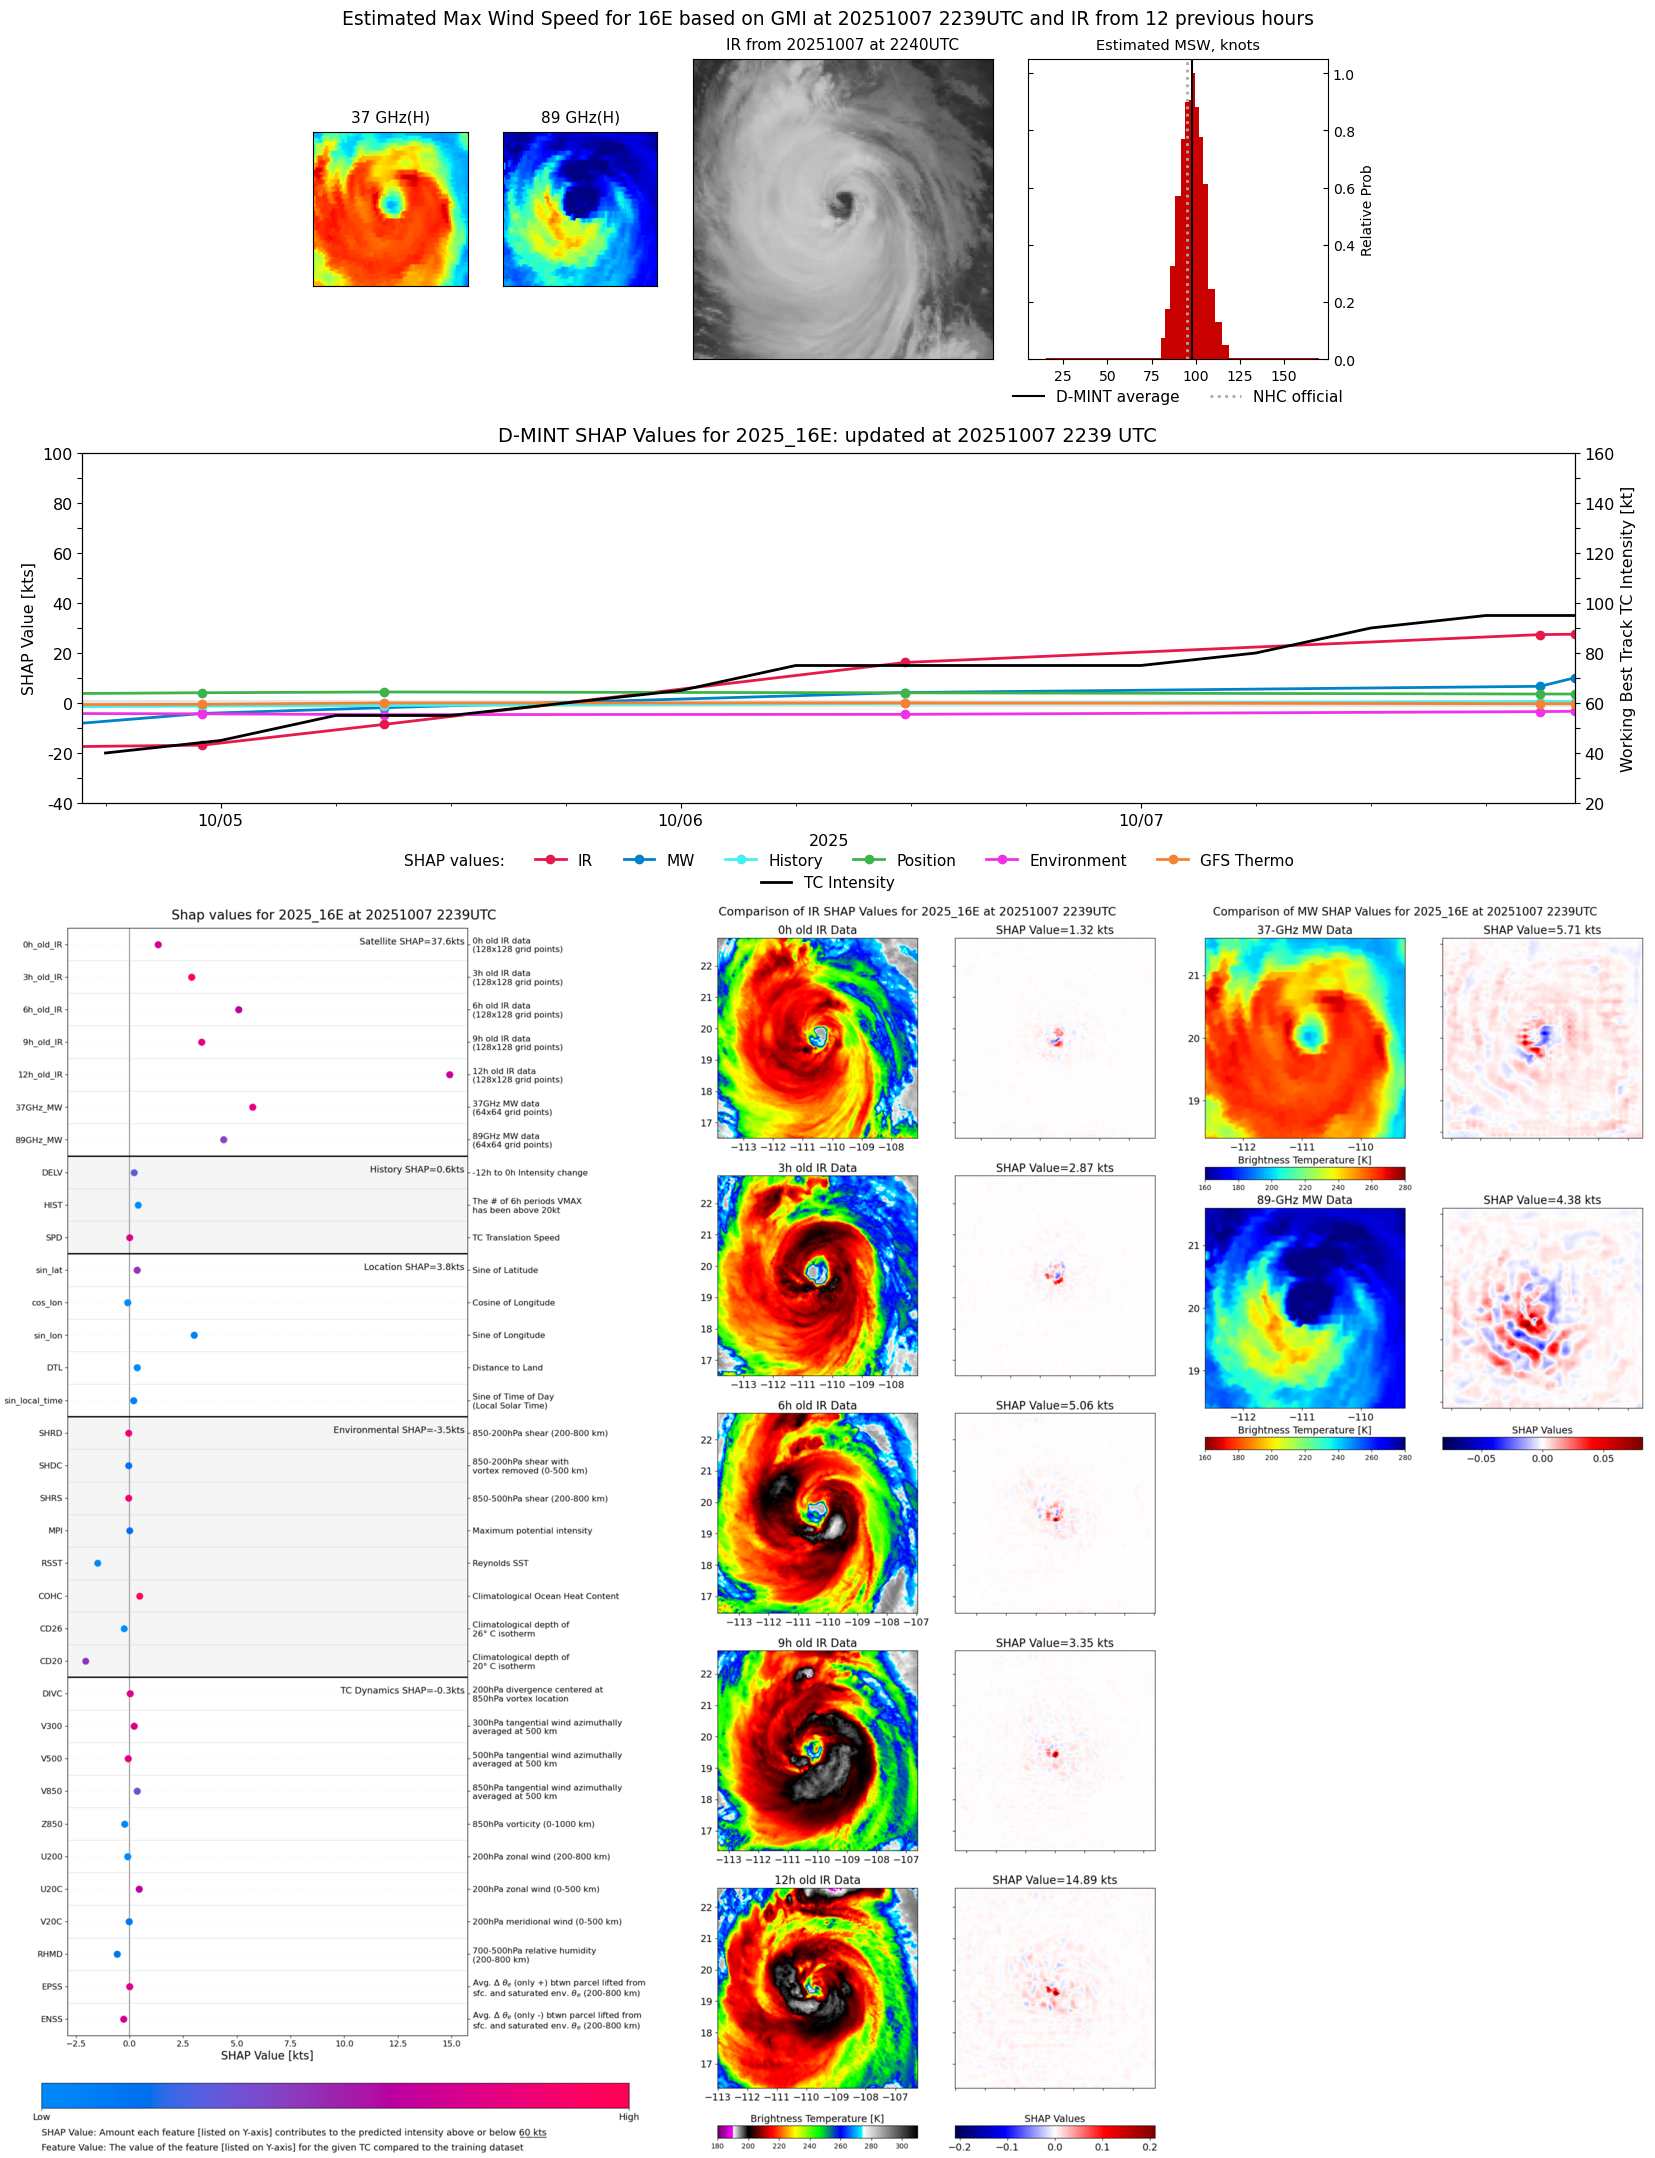 |
| 20251007 | 2233 UTC | GMI | 960 hPa | 95 kts | 90 kts | 100 kts |  |
| 20251007 | 2110 UTC | TMS07 | 960 hPa | 100 kts | 95 kts | 105 kts | 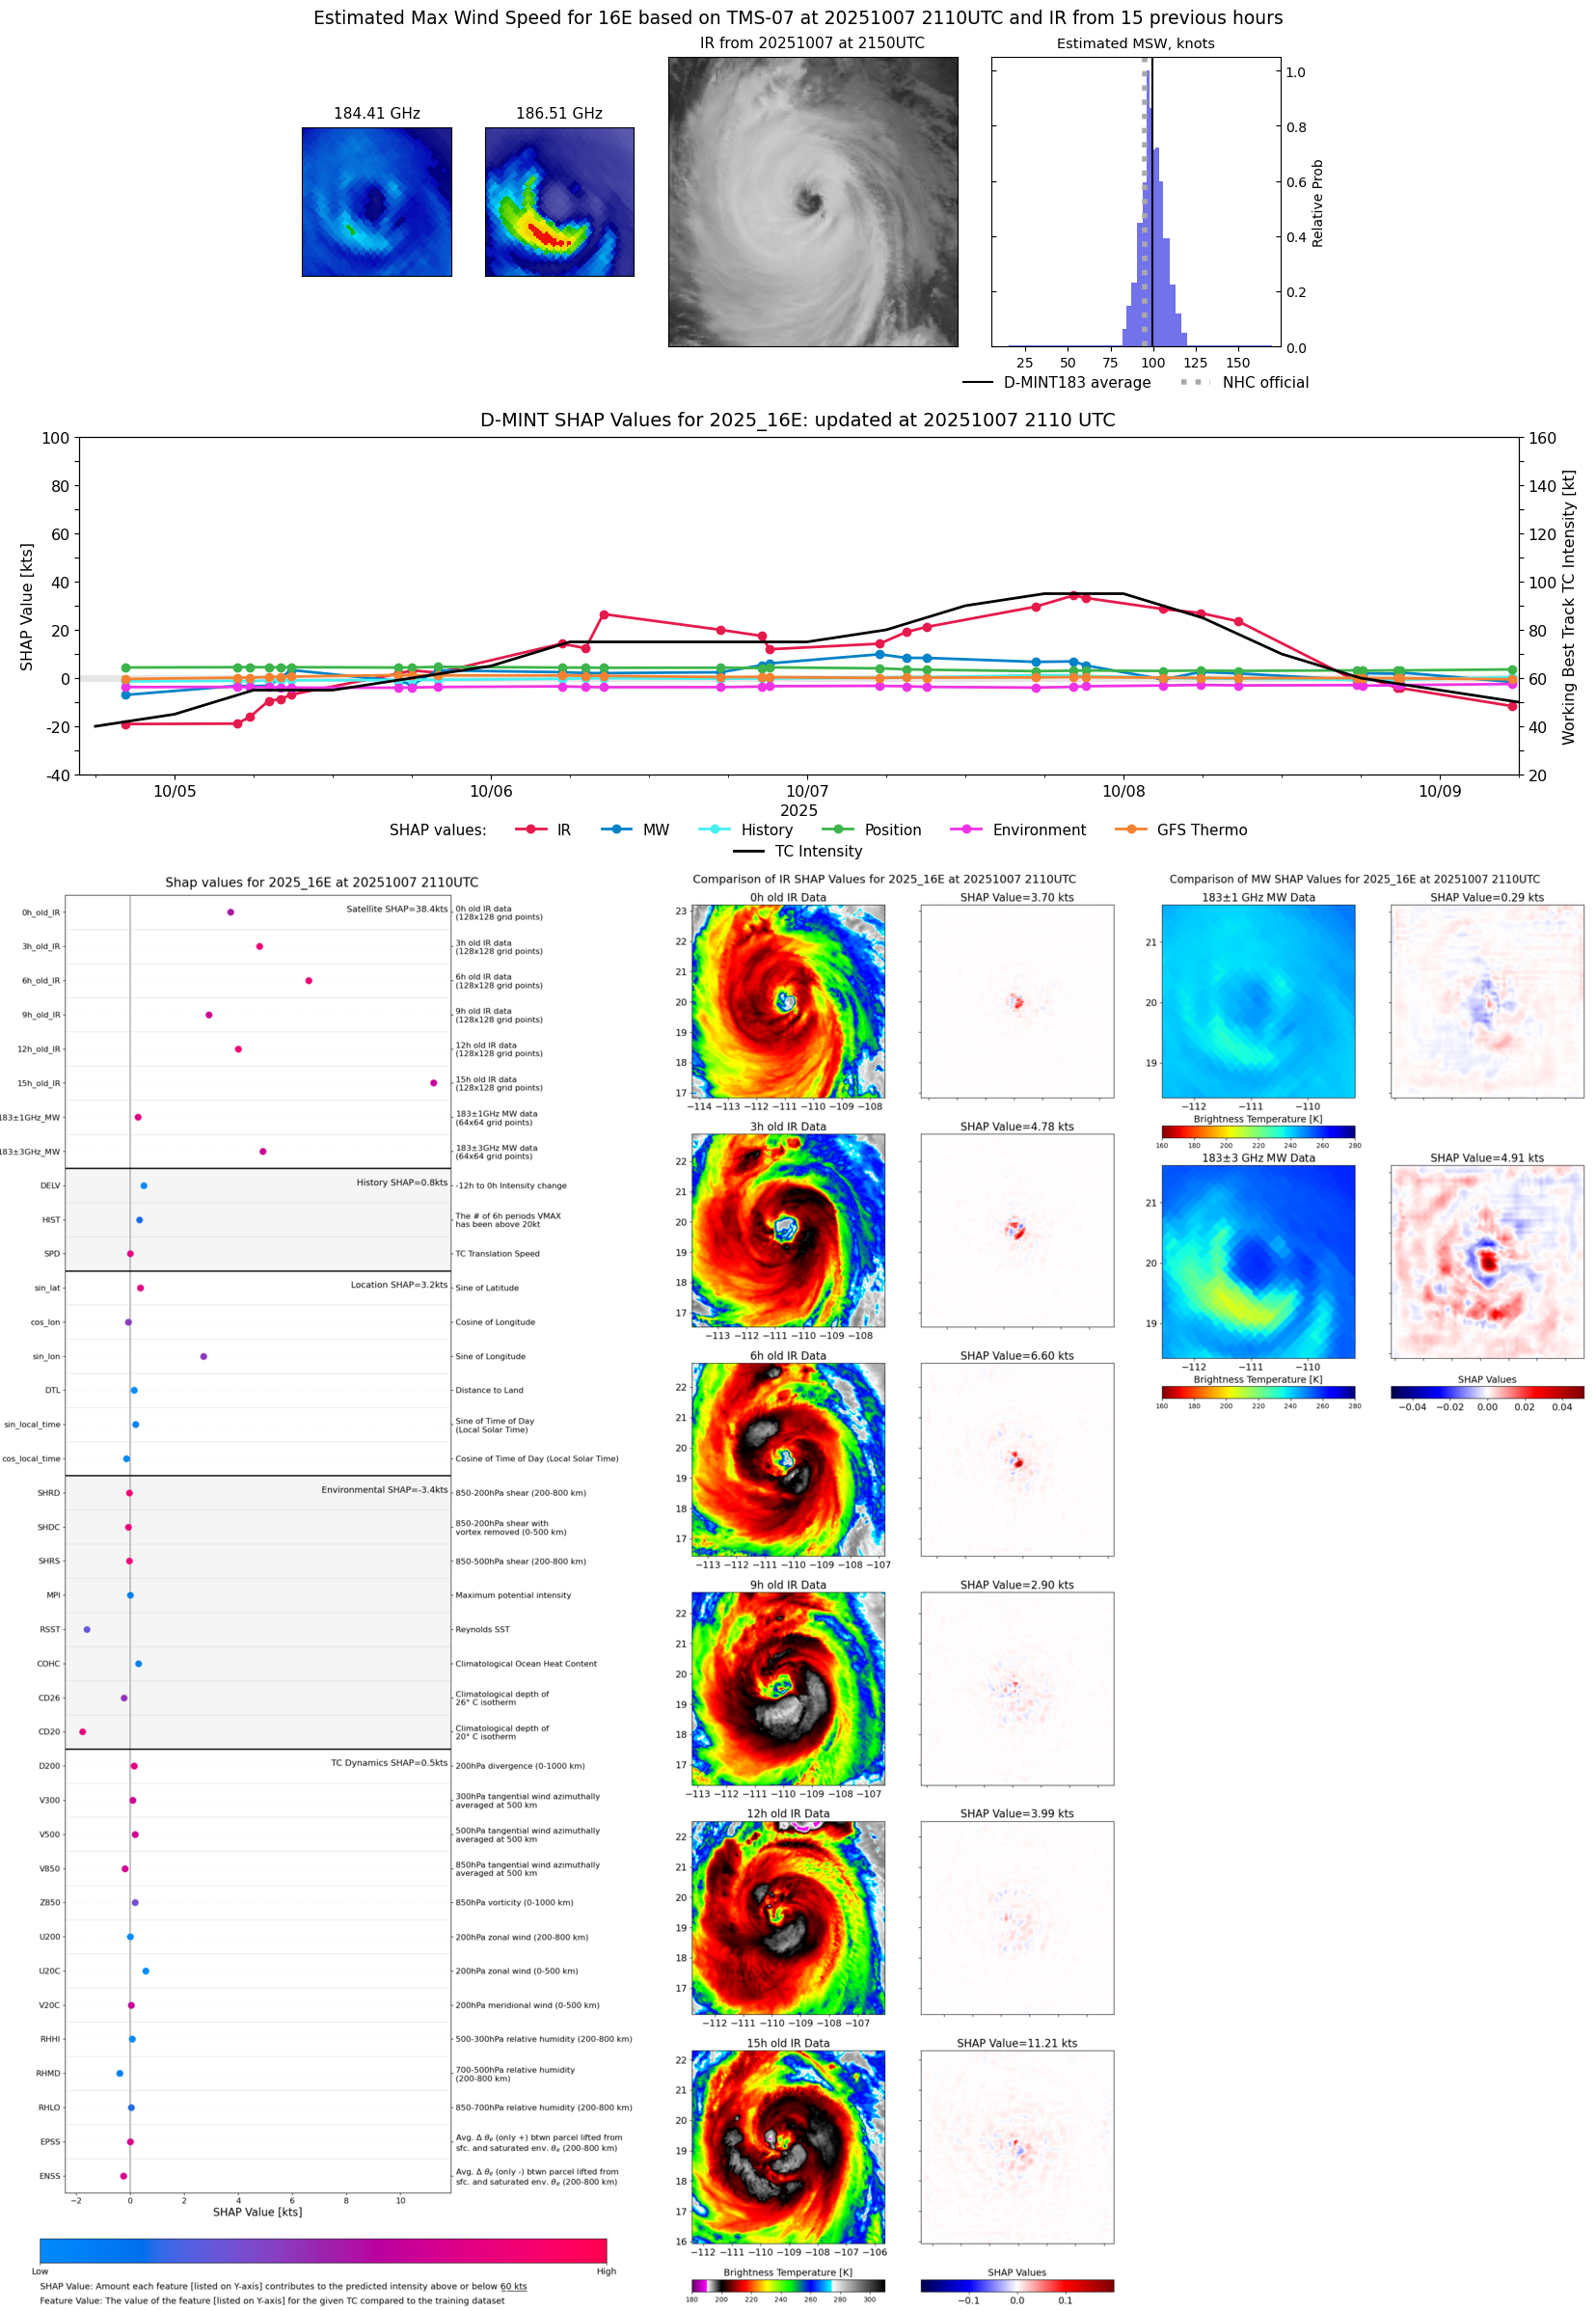 |
| 20251007 | 2050 UTC | AMSR2 | 959 hPa | 93 kts | 88 kts | 98 kts |  |
| 20251007 | 2014 UTC | ATMS-N21 | 958 hPa | 103 kts | 99 kts | 107 kts | 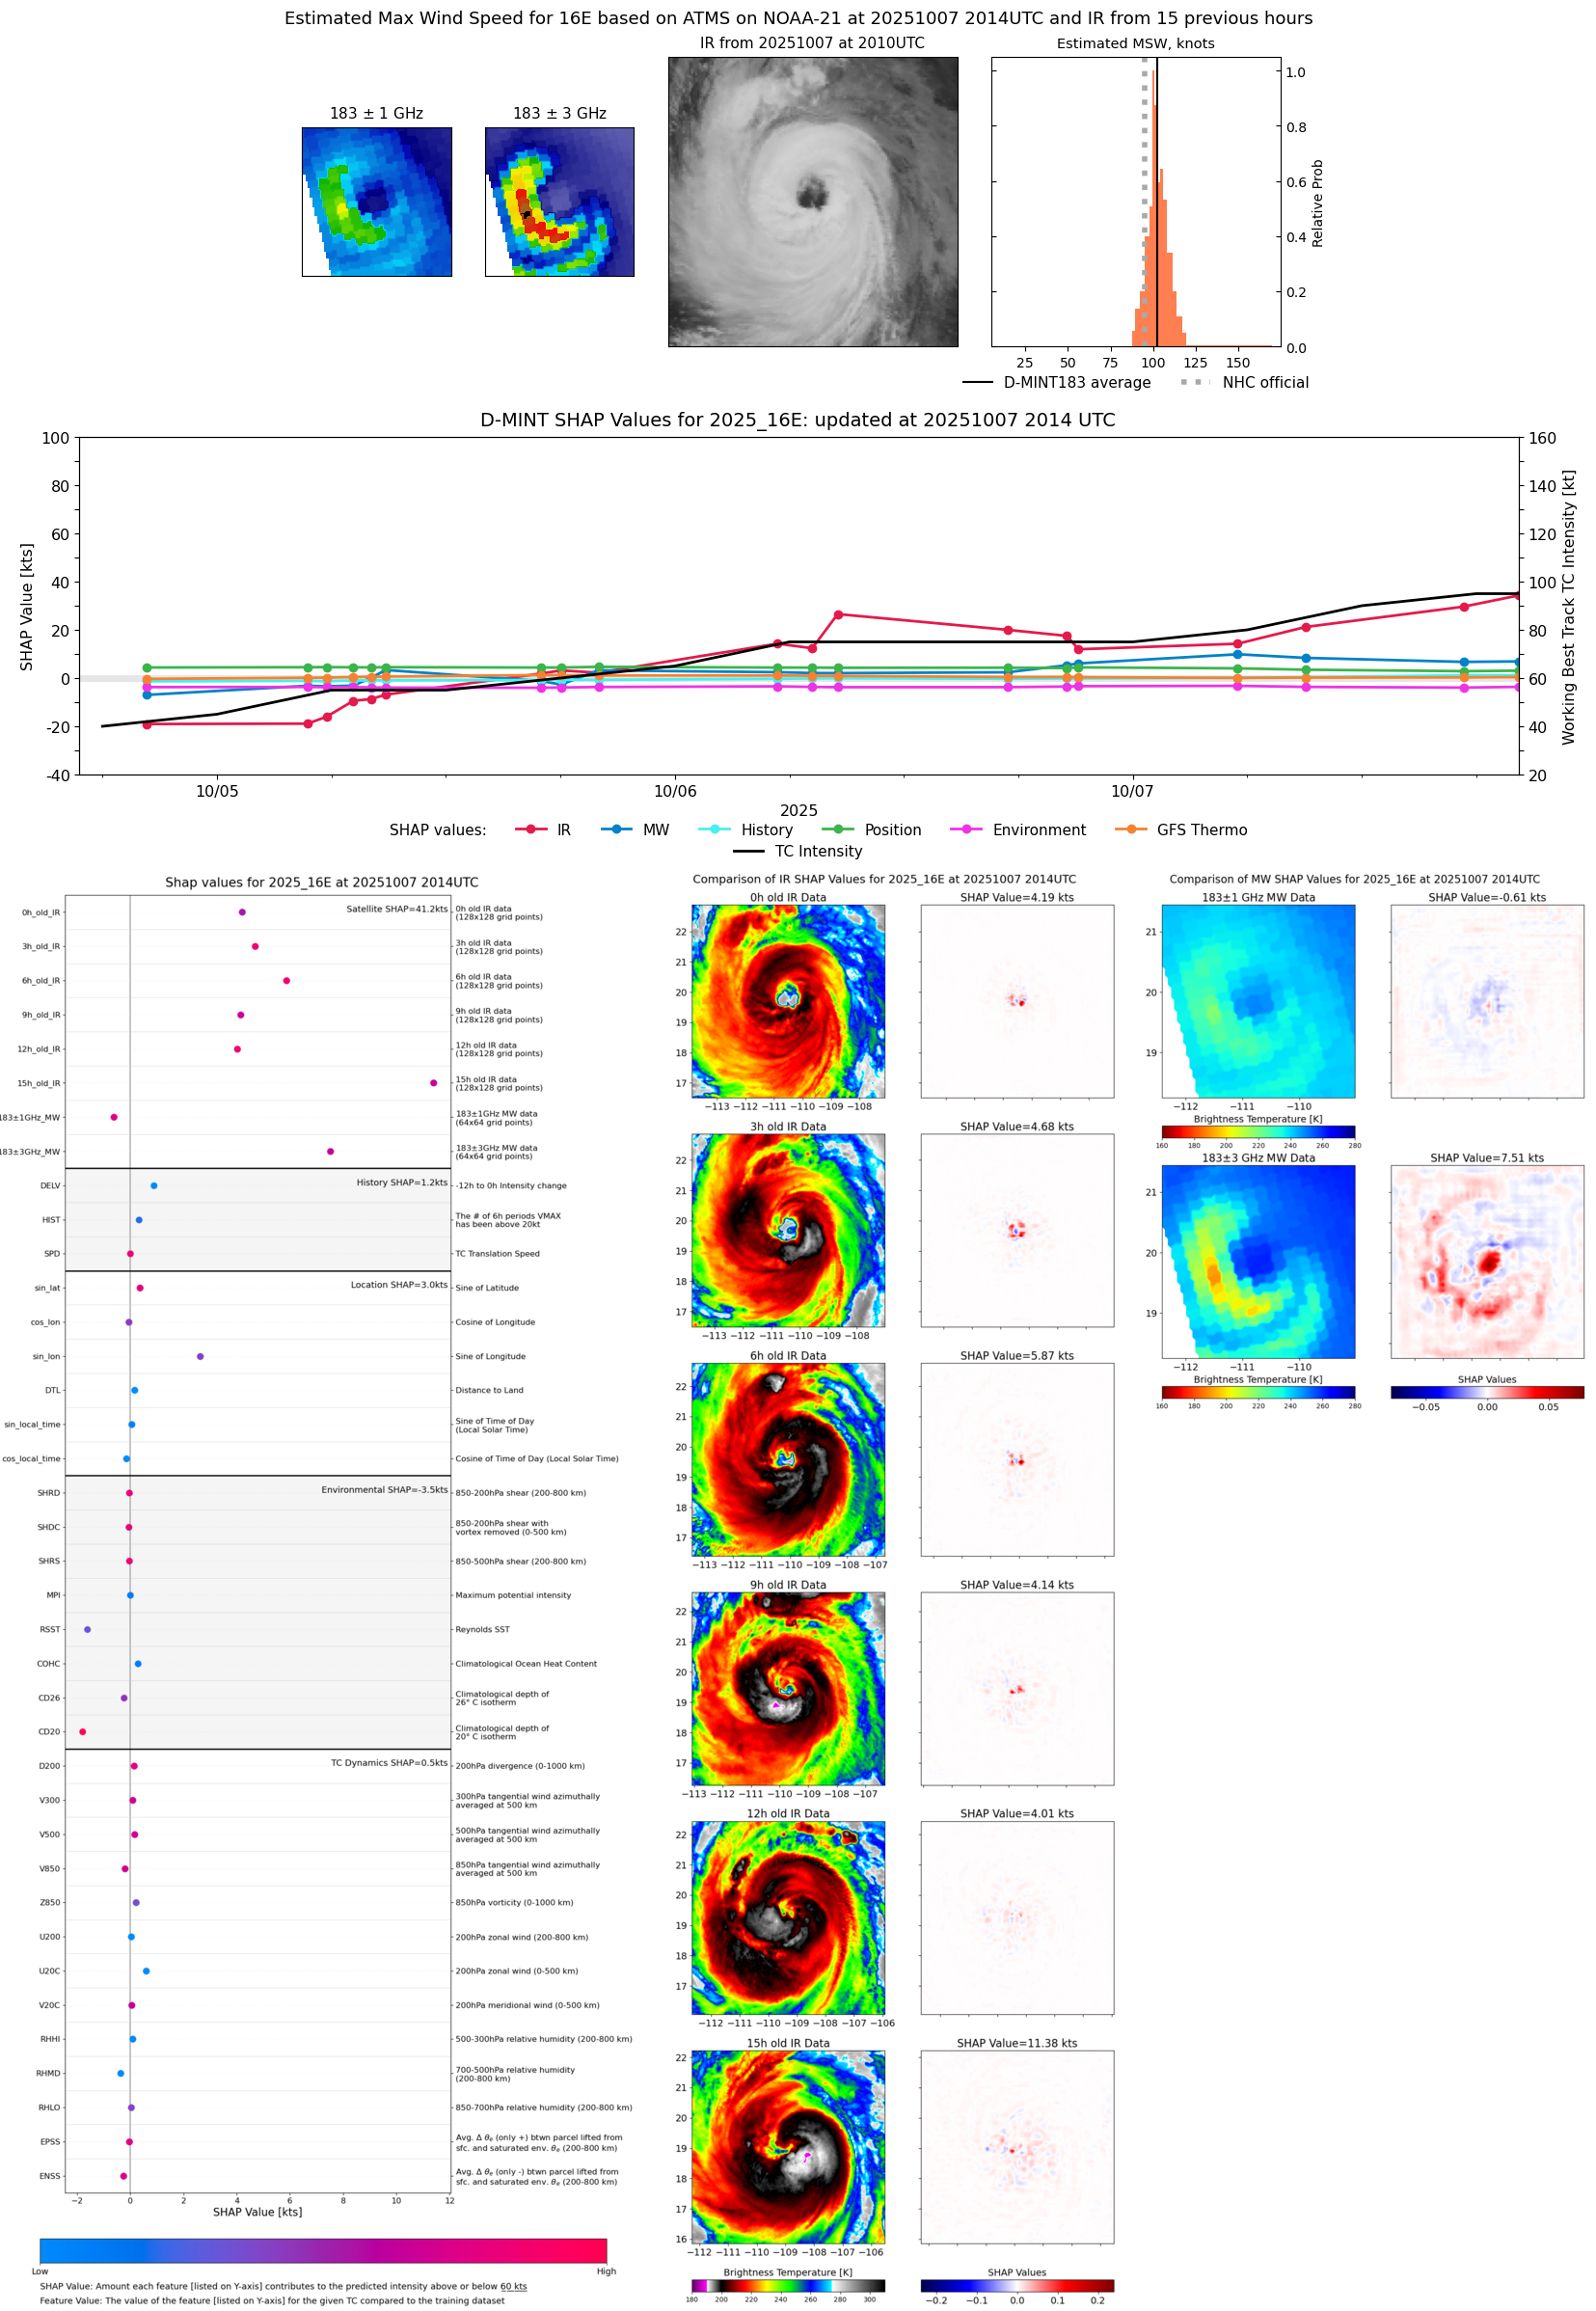 |
| 20251007 | 1720 UTC | TMS05 | 958 hPa | 97 kts | 93 kts | 101 kts | 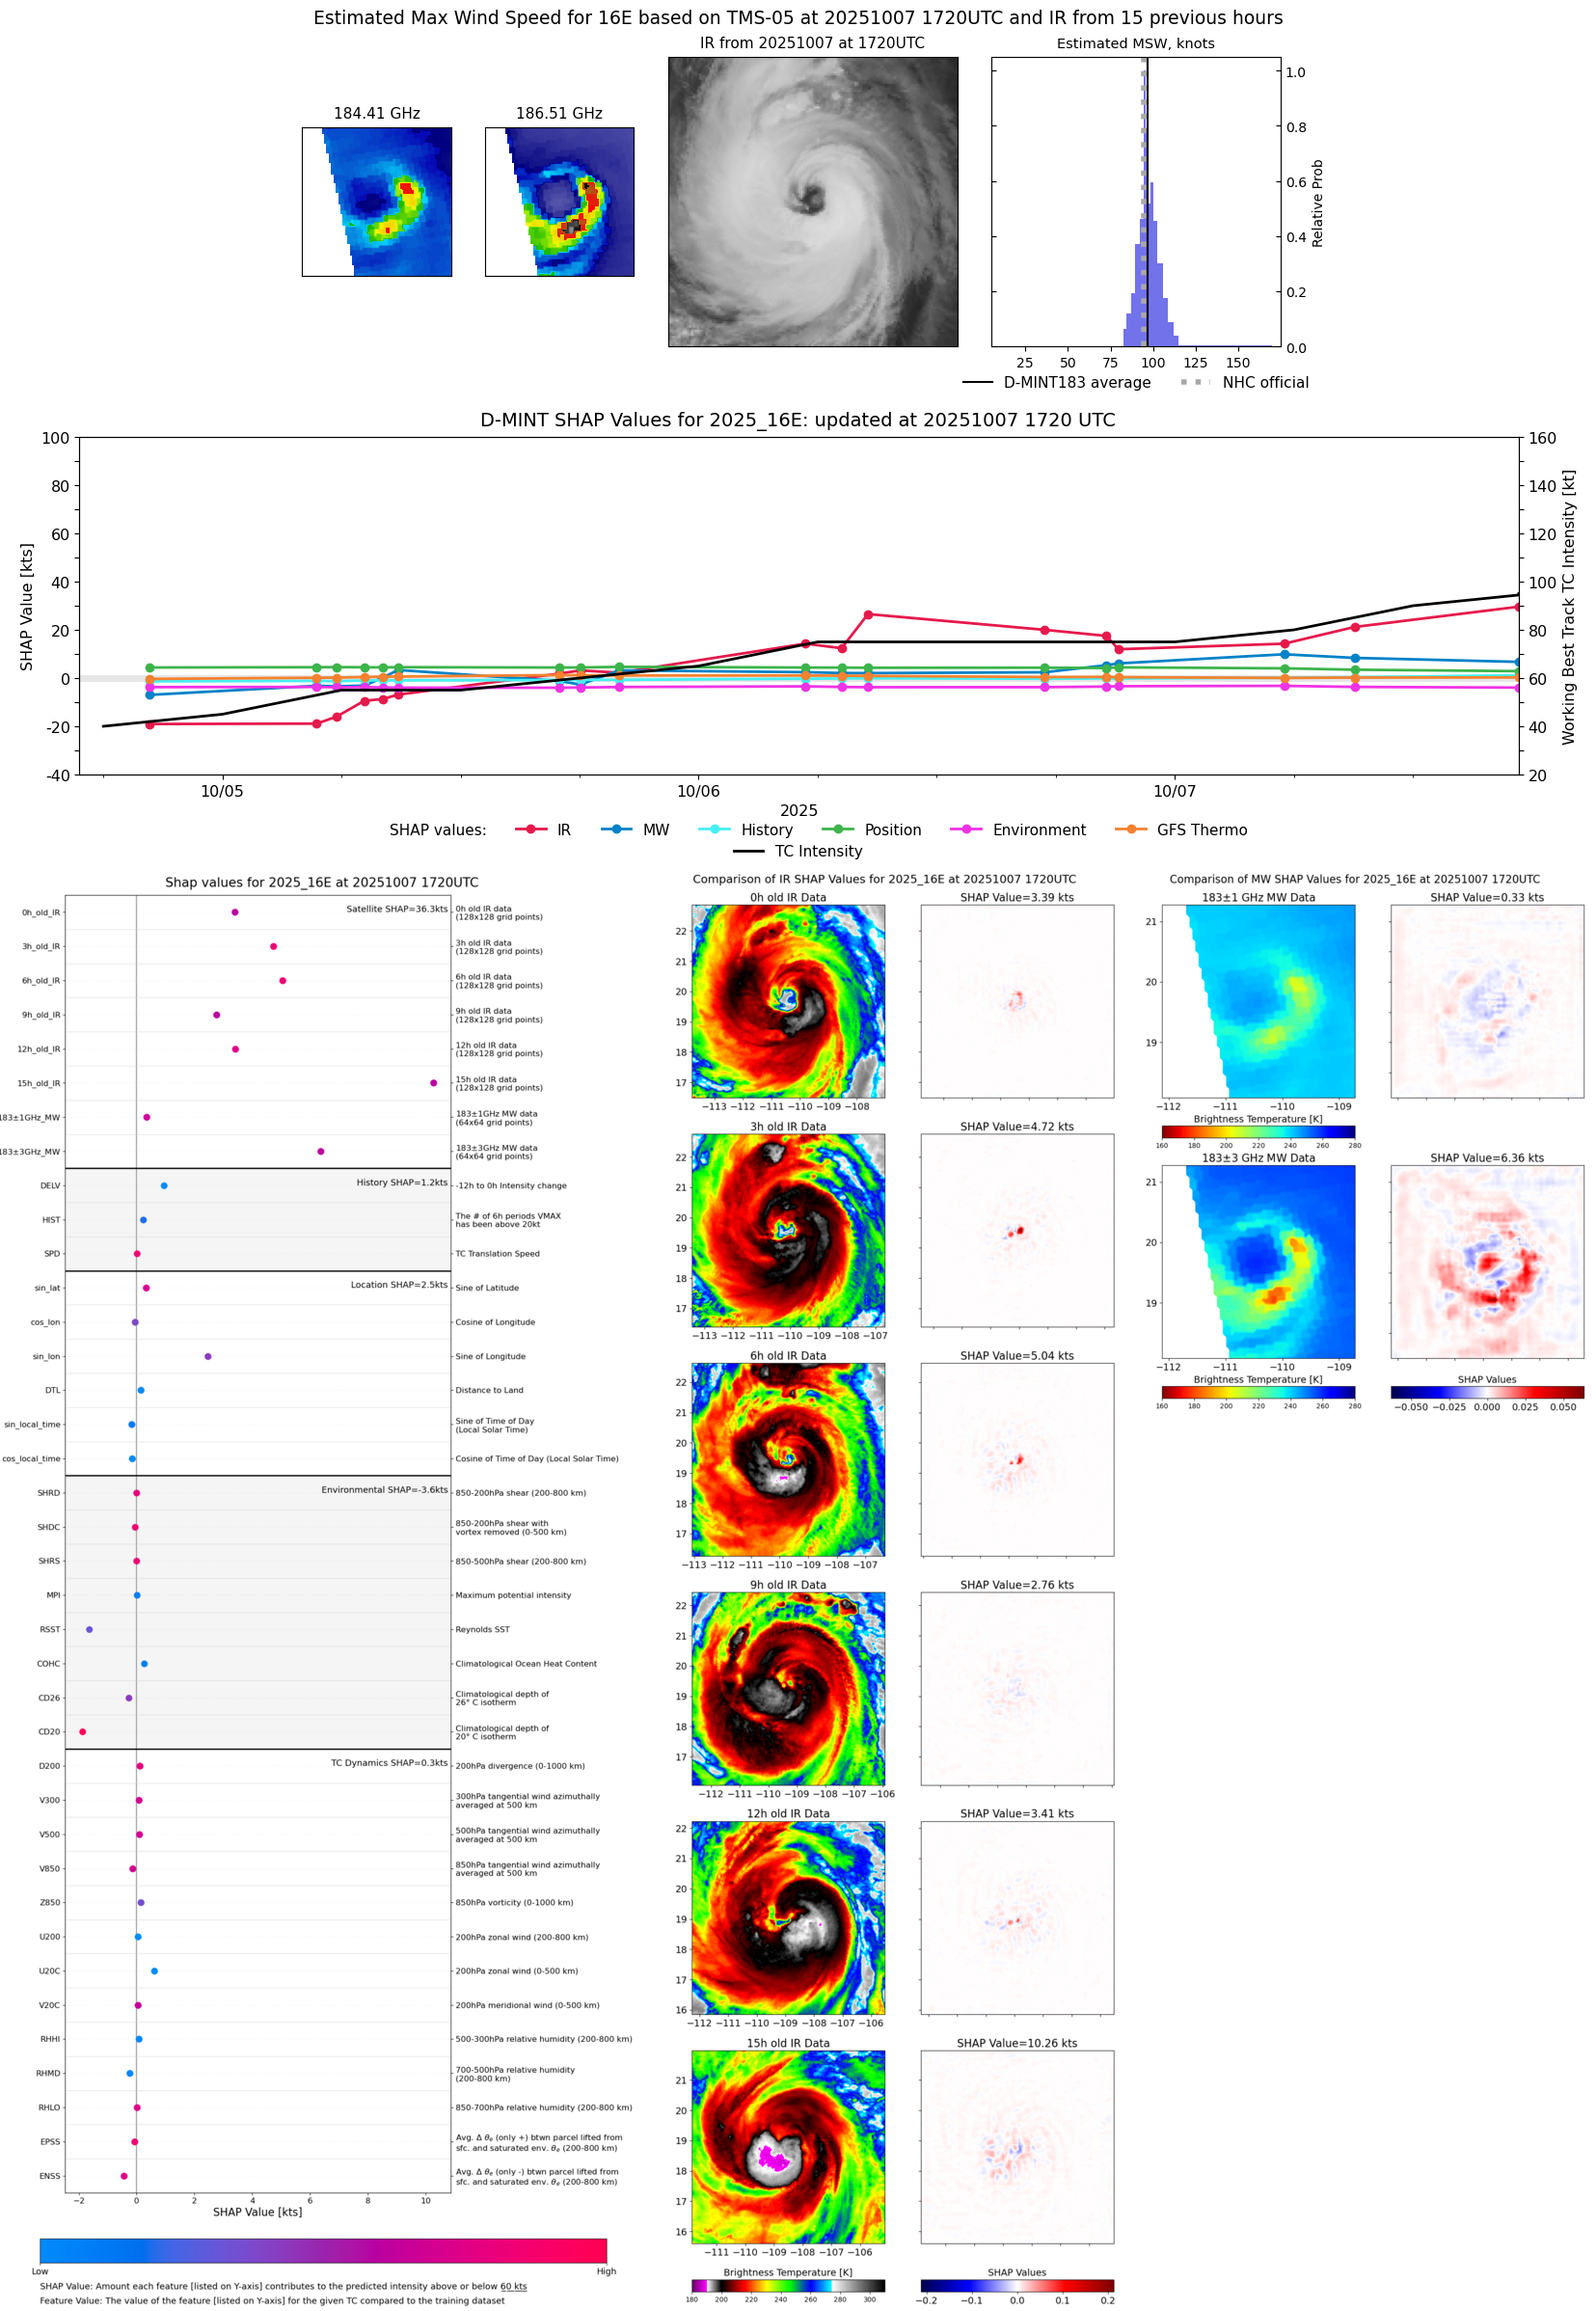 |
| 20251007 | 0903 UTC | ATMS-N21 | 963 hPa | 90 kts | 85 kts | 96 kts | 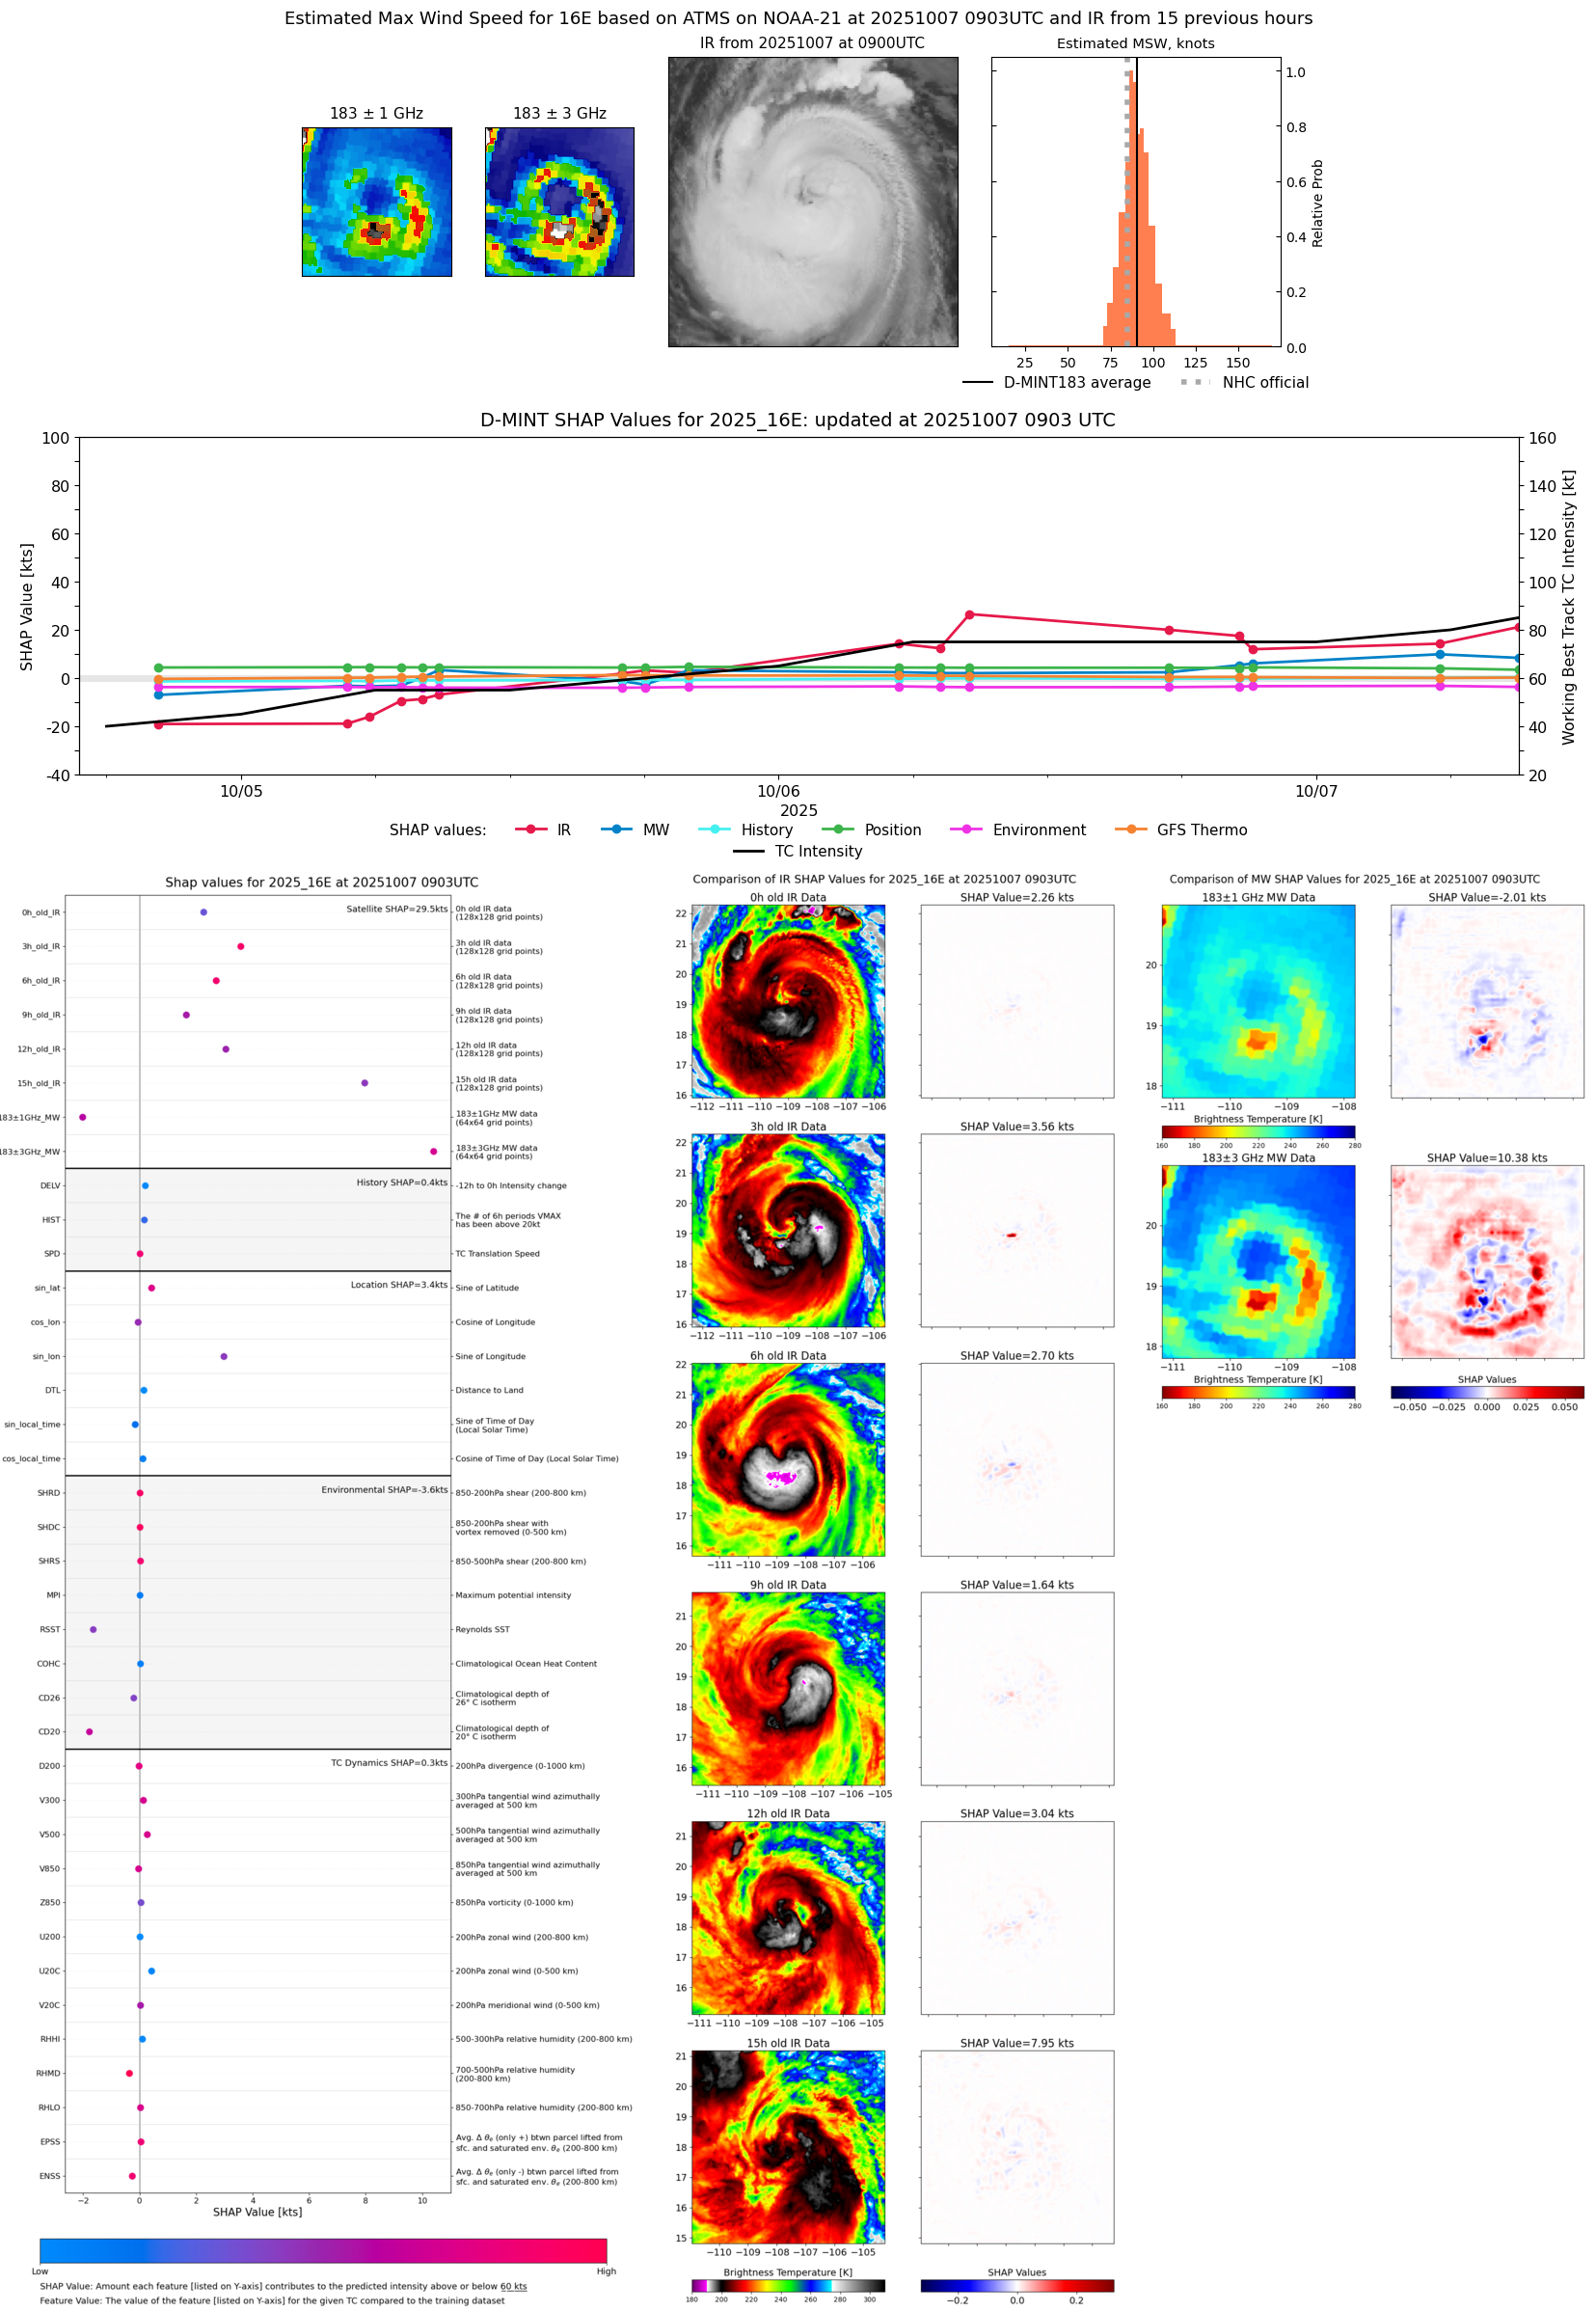 |
| 20251007 | 0732 UTC | TROPICS03 | 967 hPa | 89 kts | 83 kts | 94 kts | 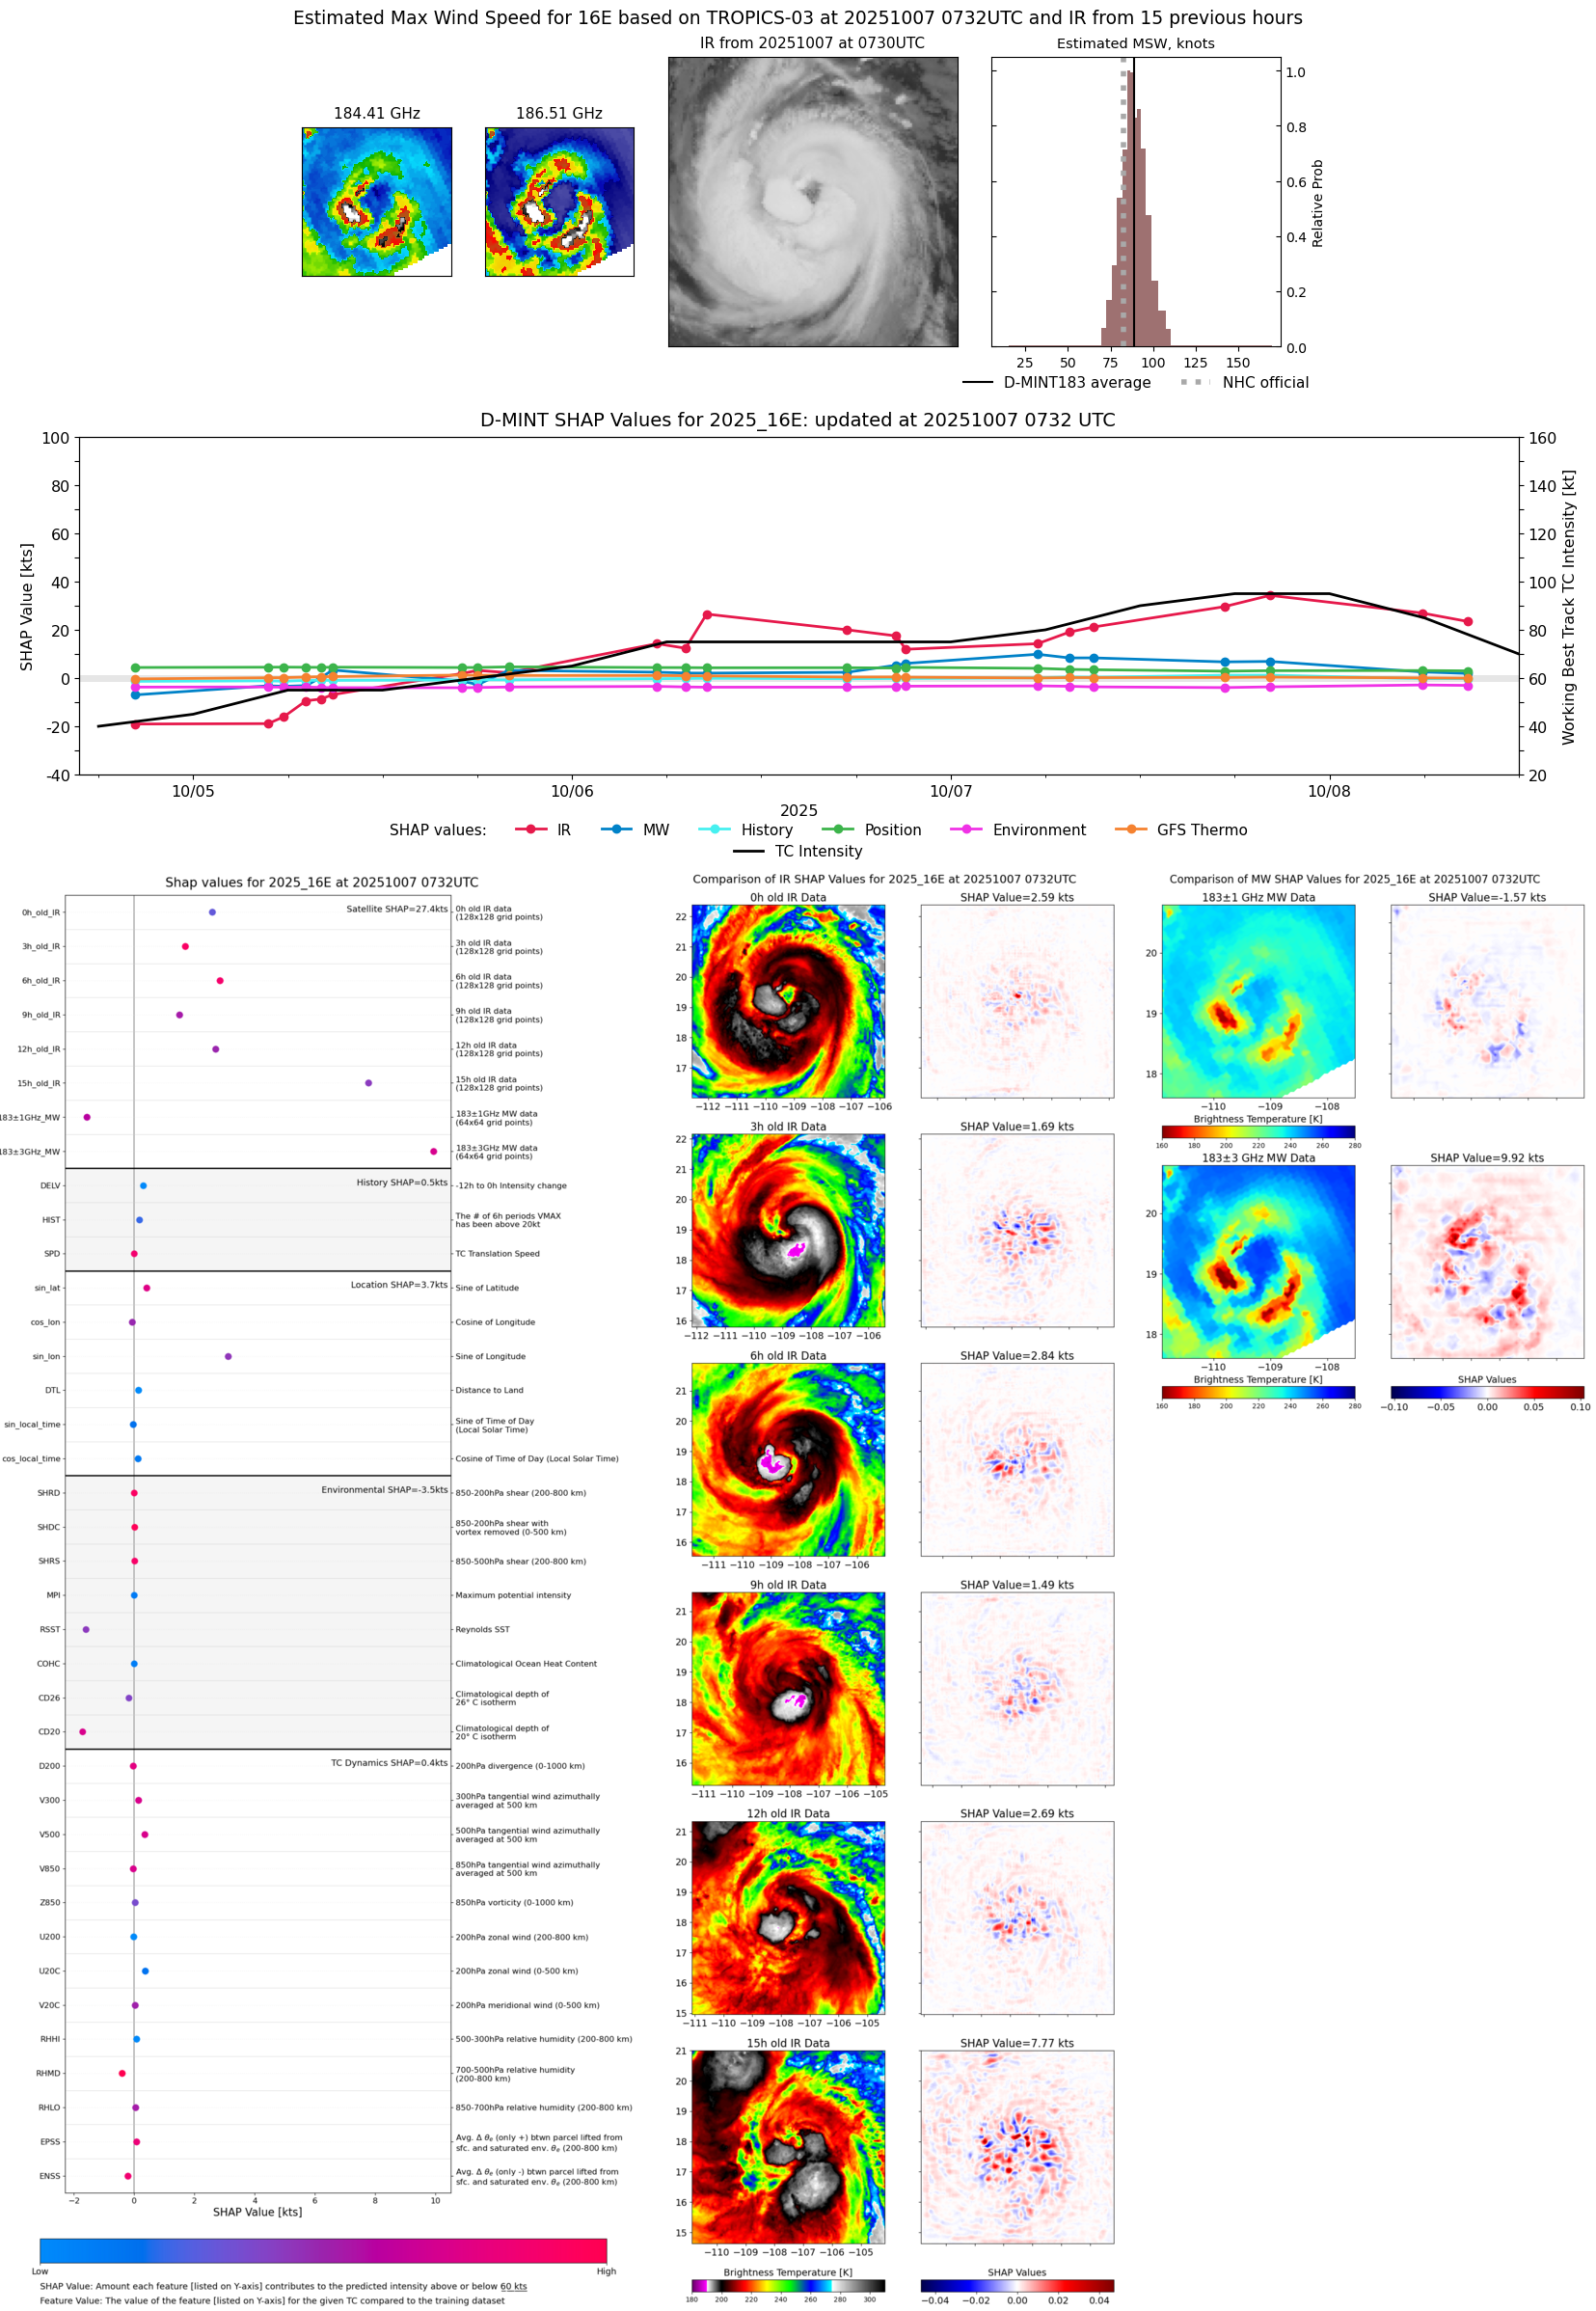 |
| 20251007 | 0530 UTC | TMS02 | 972 hPa | 86 kts | 80 kts | 91 kts | 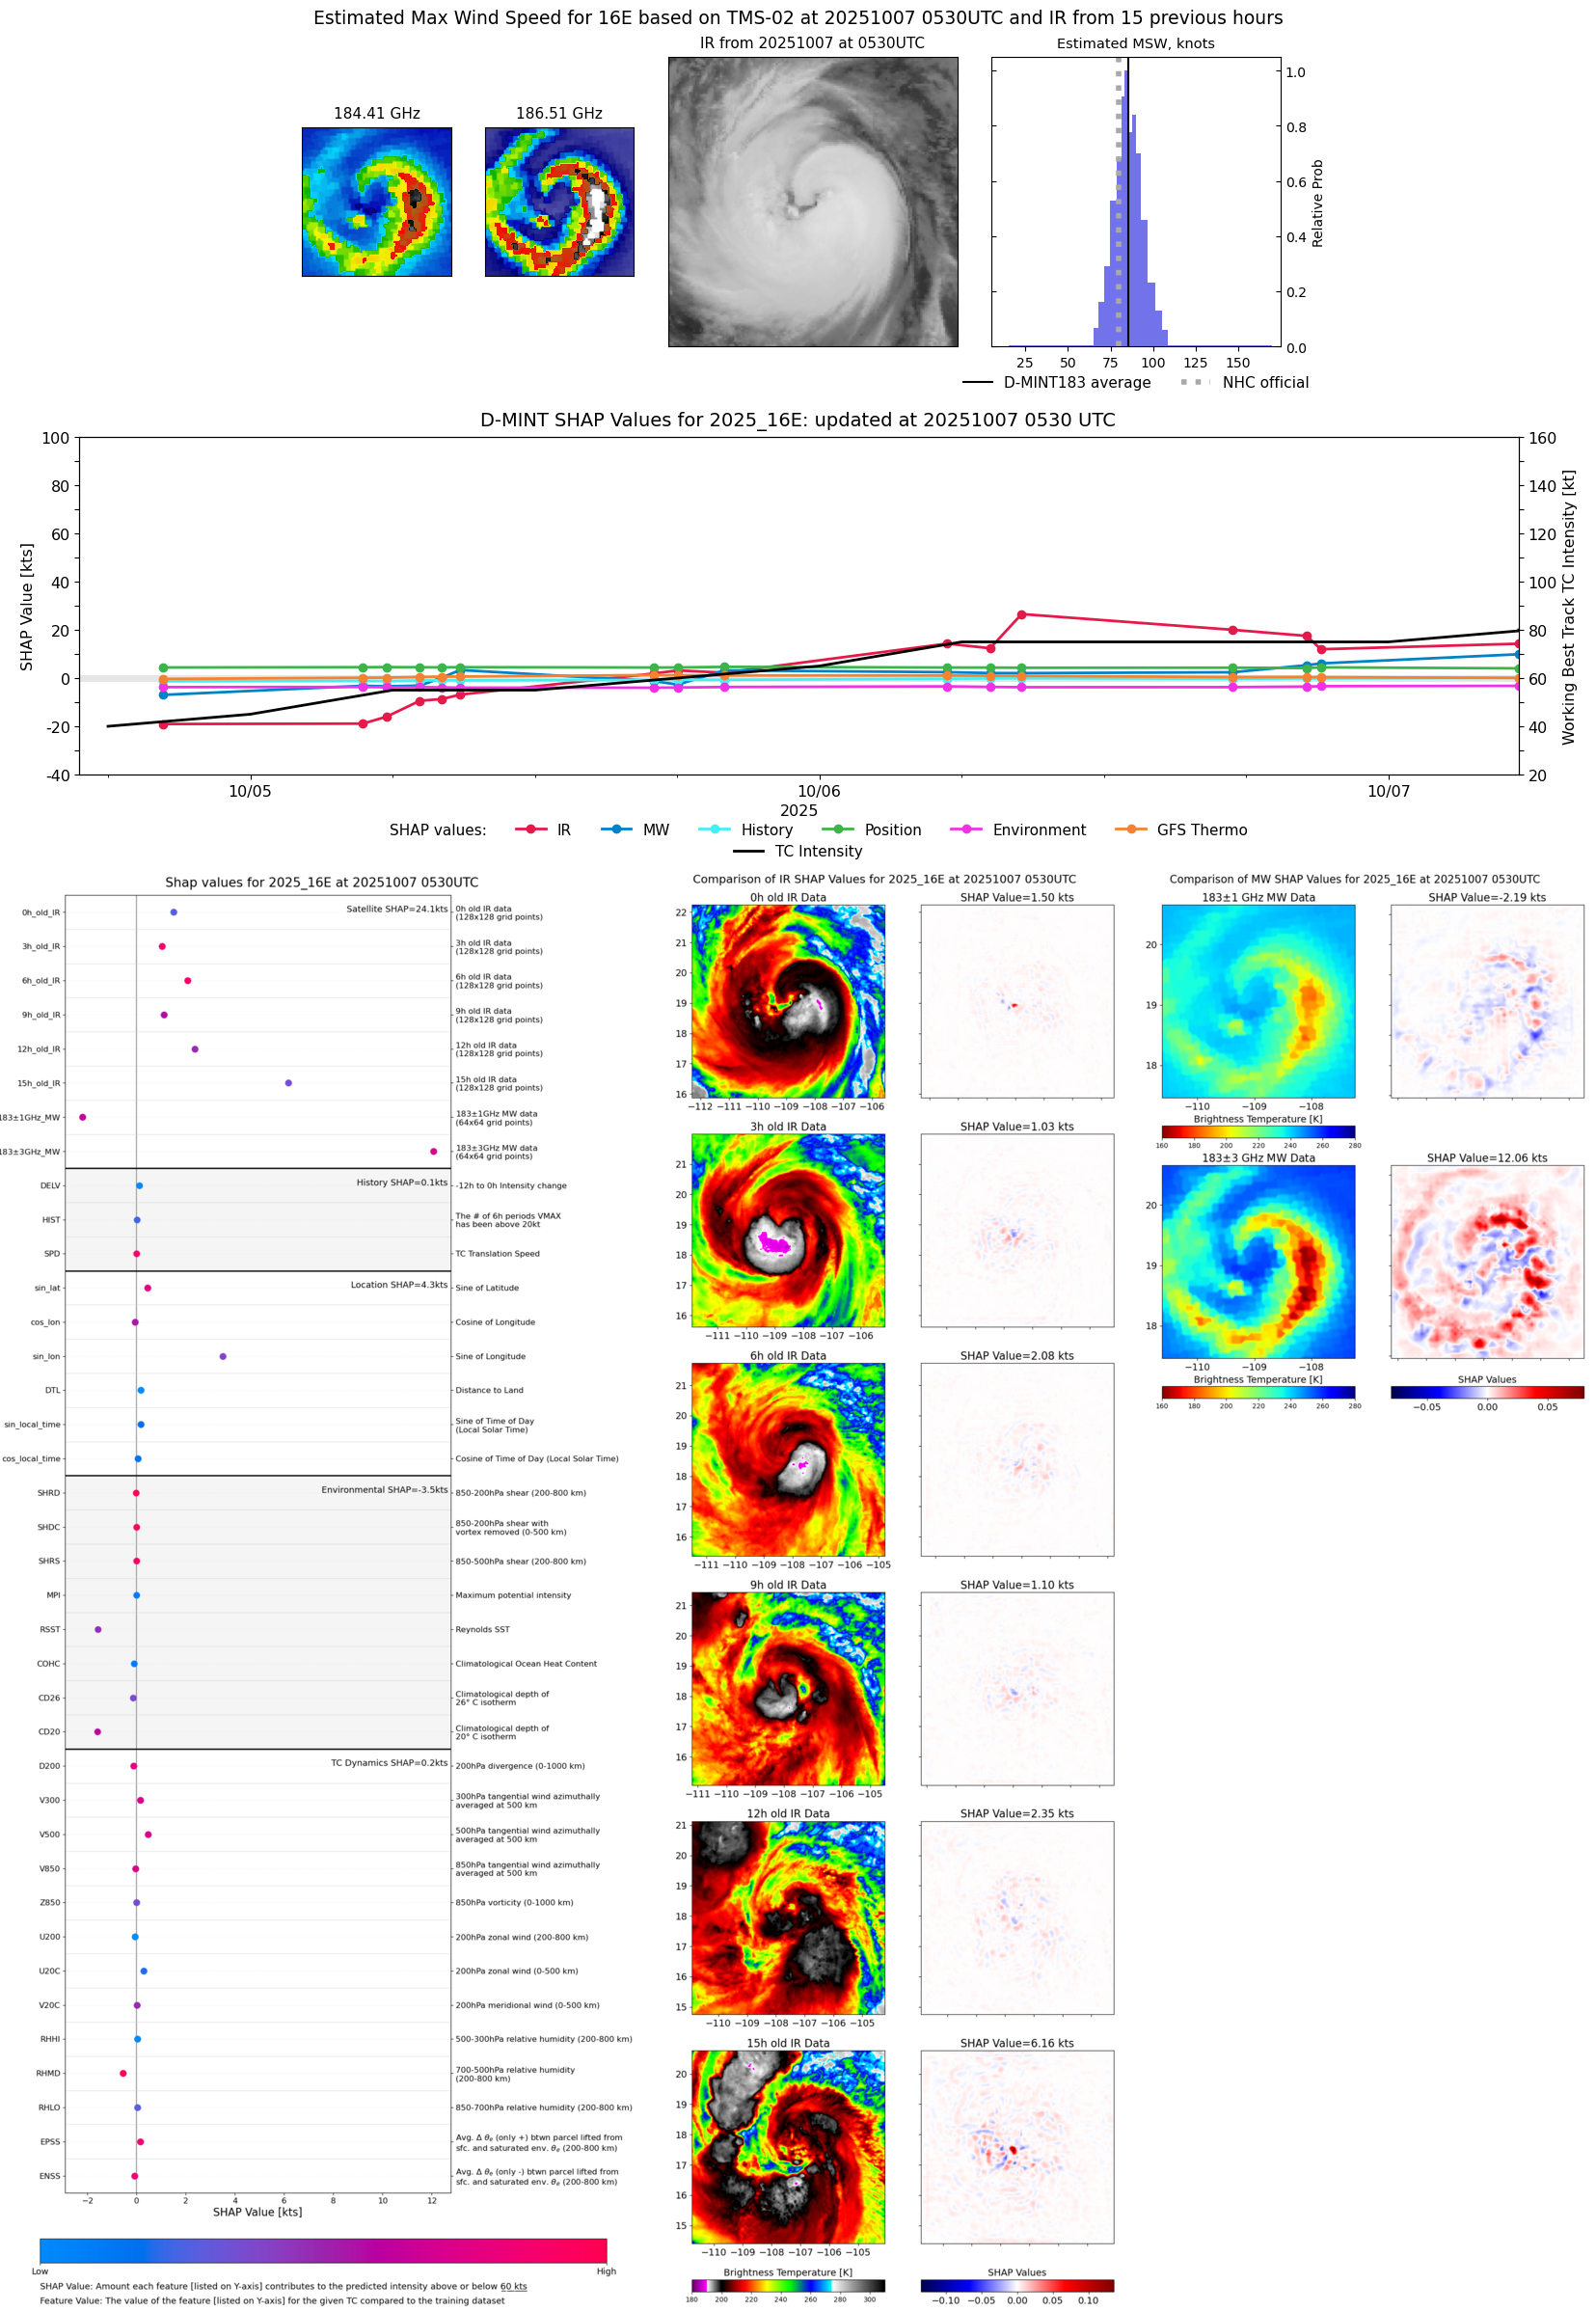 |
| 20251006 | 2308 UTC | SSMISF18 | 979 hPa | 78 kts | 72 kts | 85 kts | 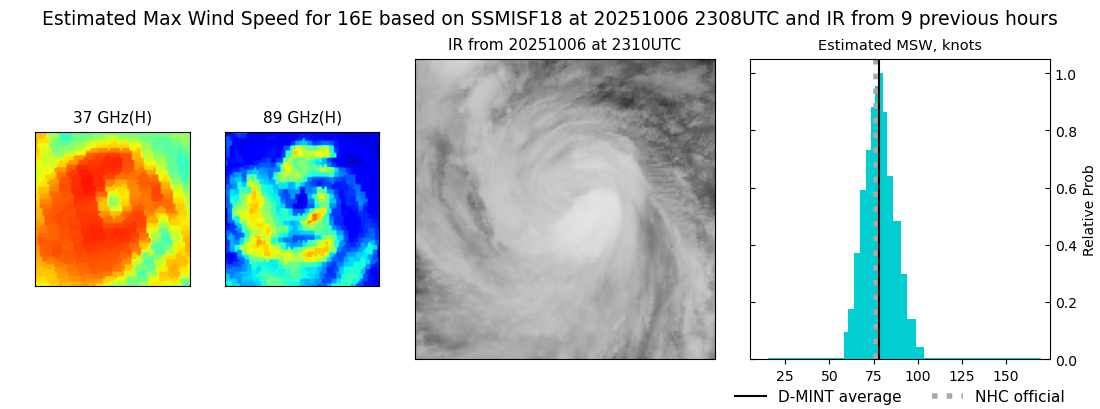 |
| 20251006 | 2109 UTC | TMS07 | 970 hPa | 80 kts | 74 kts | 86 kts | 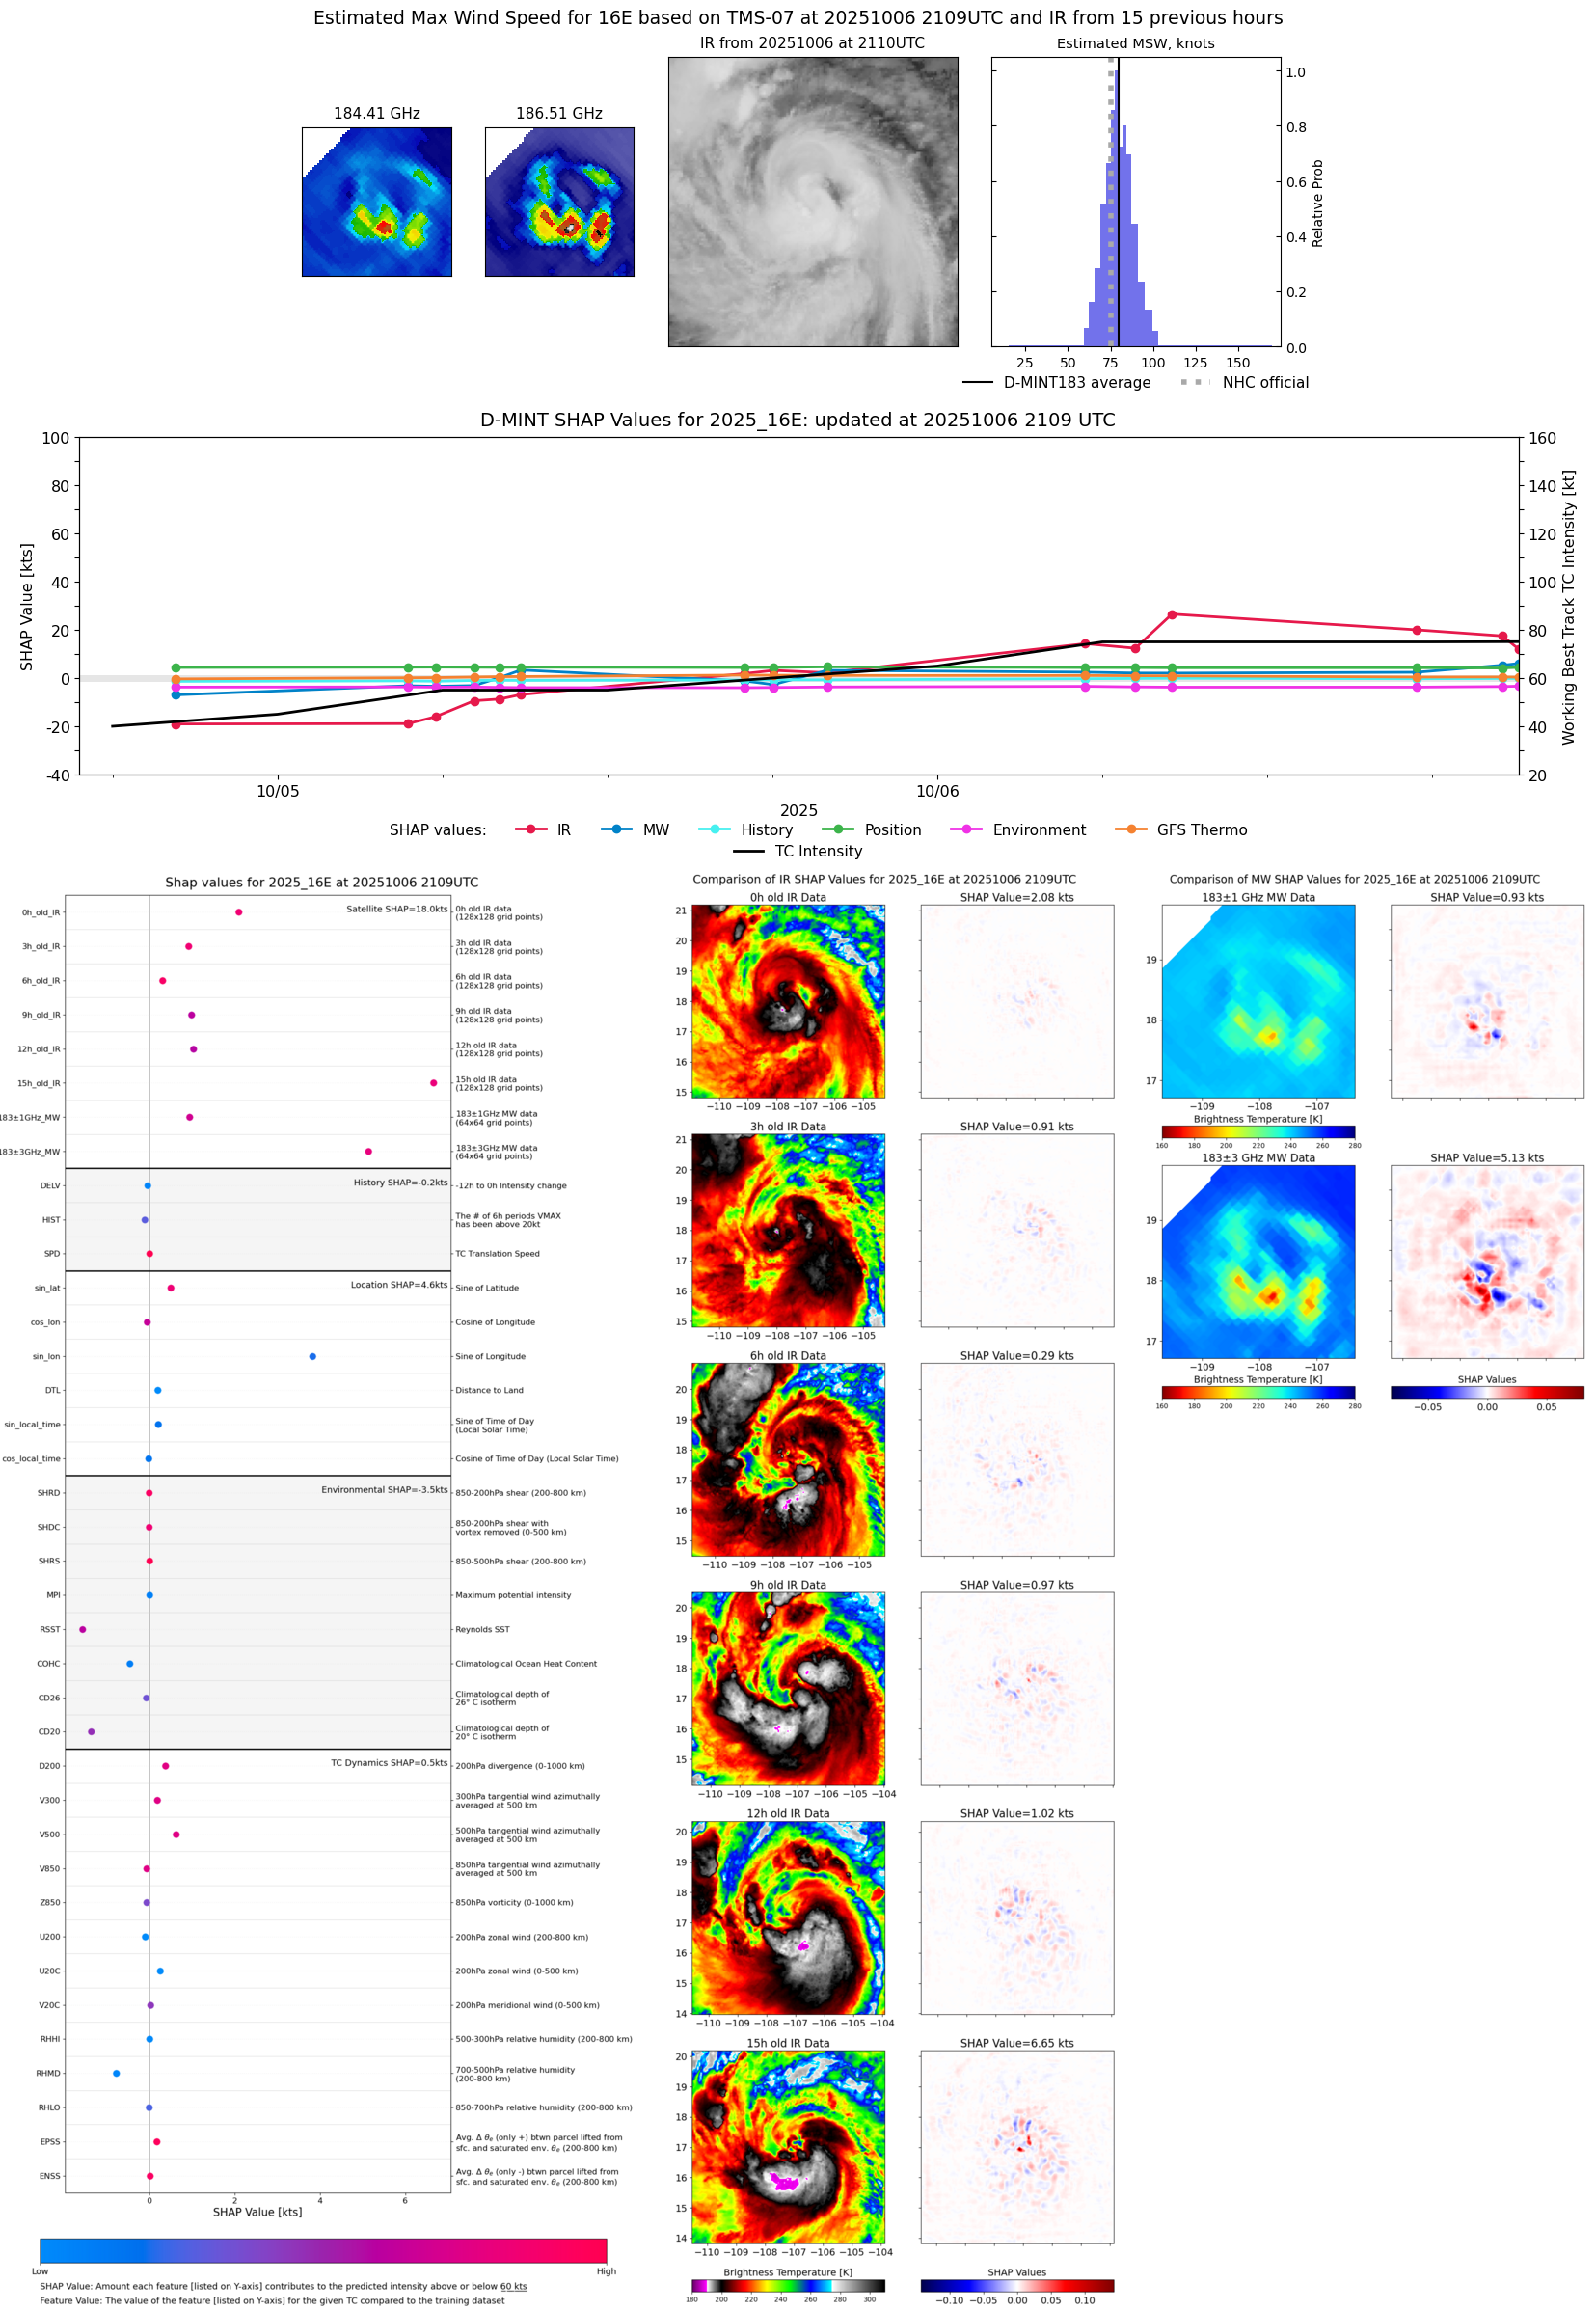 |
| 20251006 | 2033 UTC | ATMS-N21 | 970 hPa | 84 kts | 78 kts | 90 kts |  |
| 20251006 | 2008 UTC | AMSR2 | 976 hPa | 76 kts | 70 kts | 83 kts | 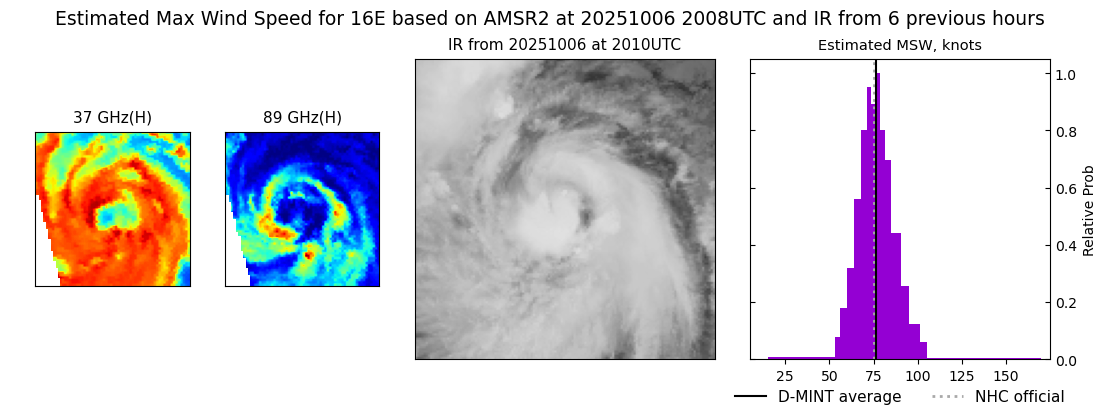 |
| 20251006 | 1726 UTC | TMS05 | 974 hPa | 83 kts | 78 kts | 89 kts |  |
| 20251006 | 1143 UTC | GMI | 975 hPa | 82 kts | 77 kts | 88 kts | 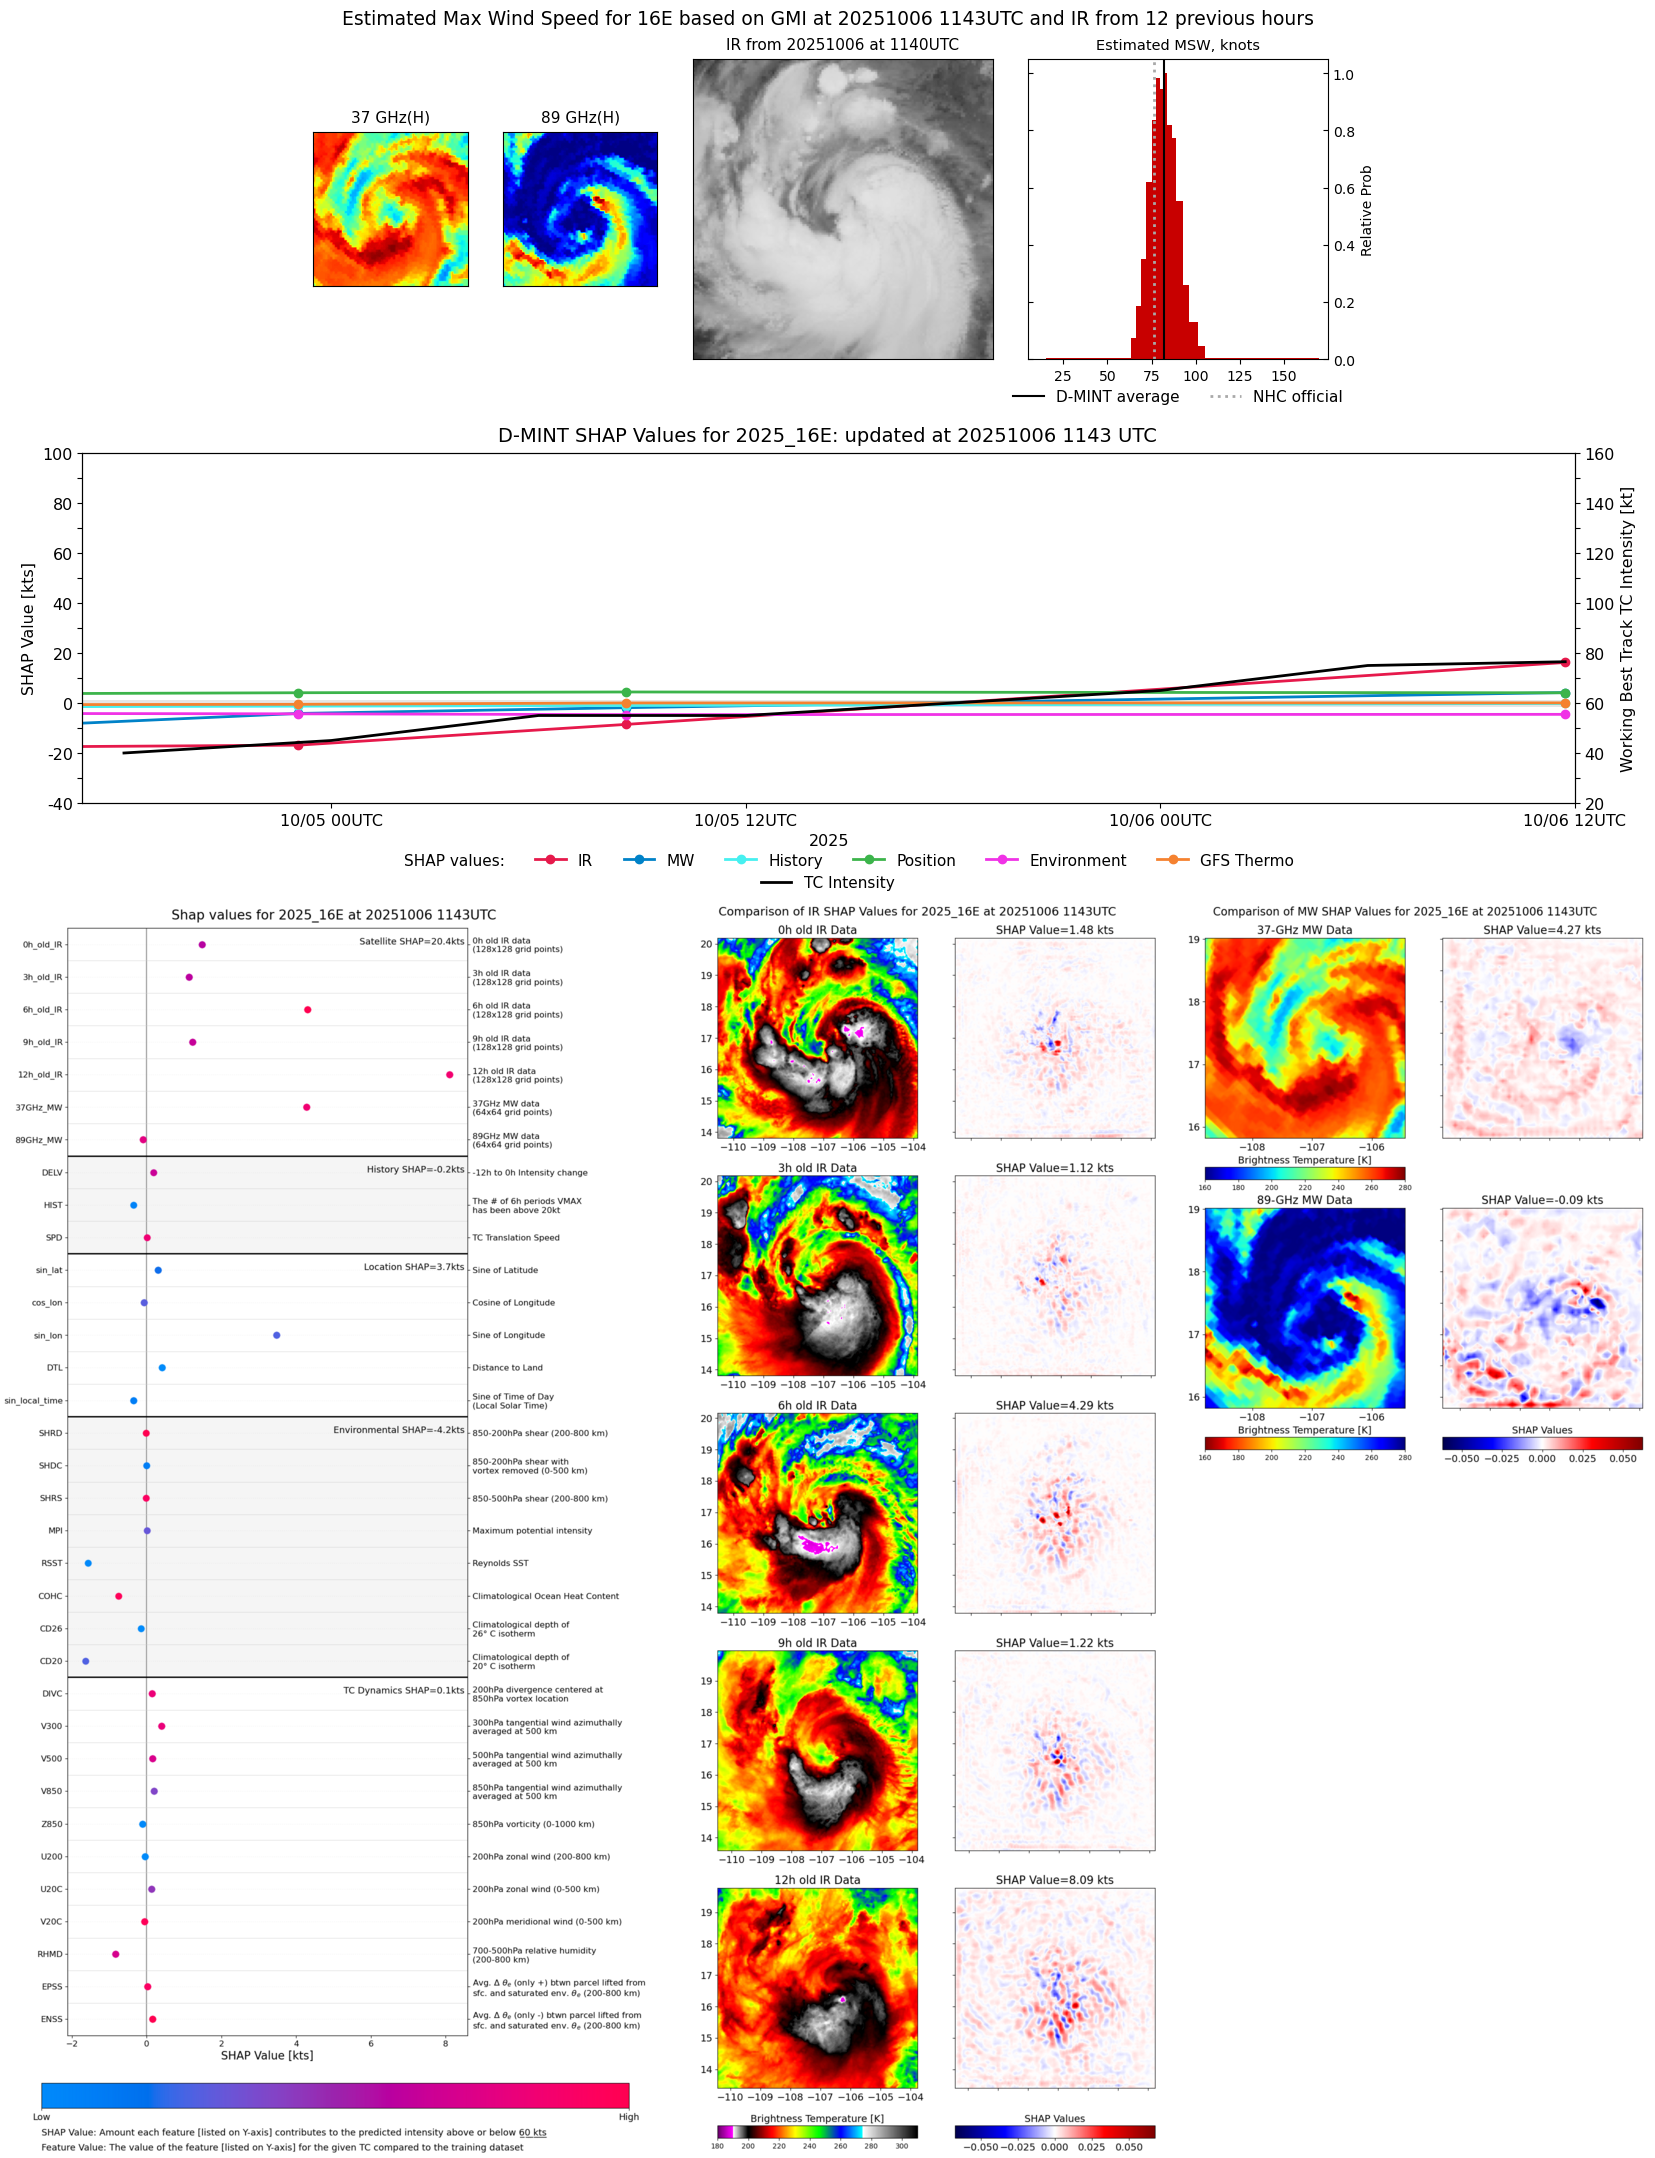 |
| 20251006 | 0832 UTC | ATMS-N20 | 970 hPa | 90 kts | 84 kts | 96 kts | 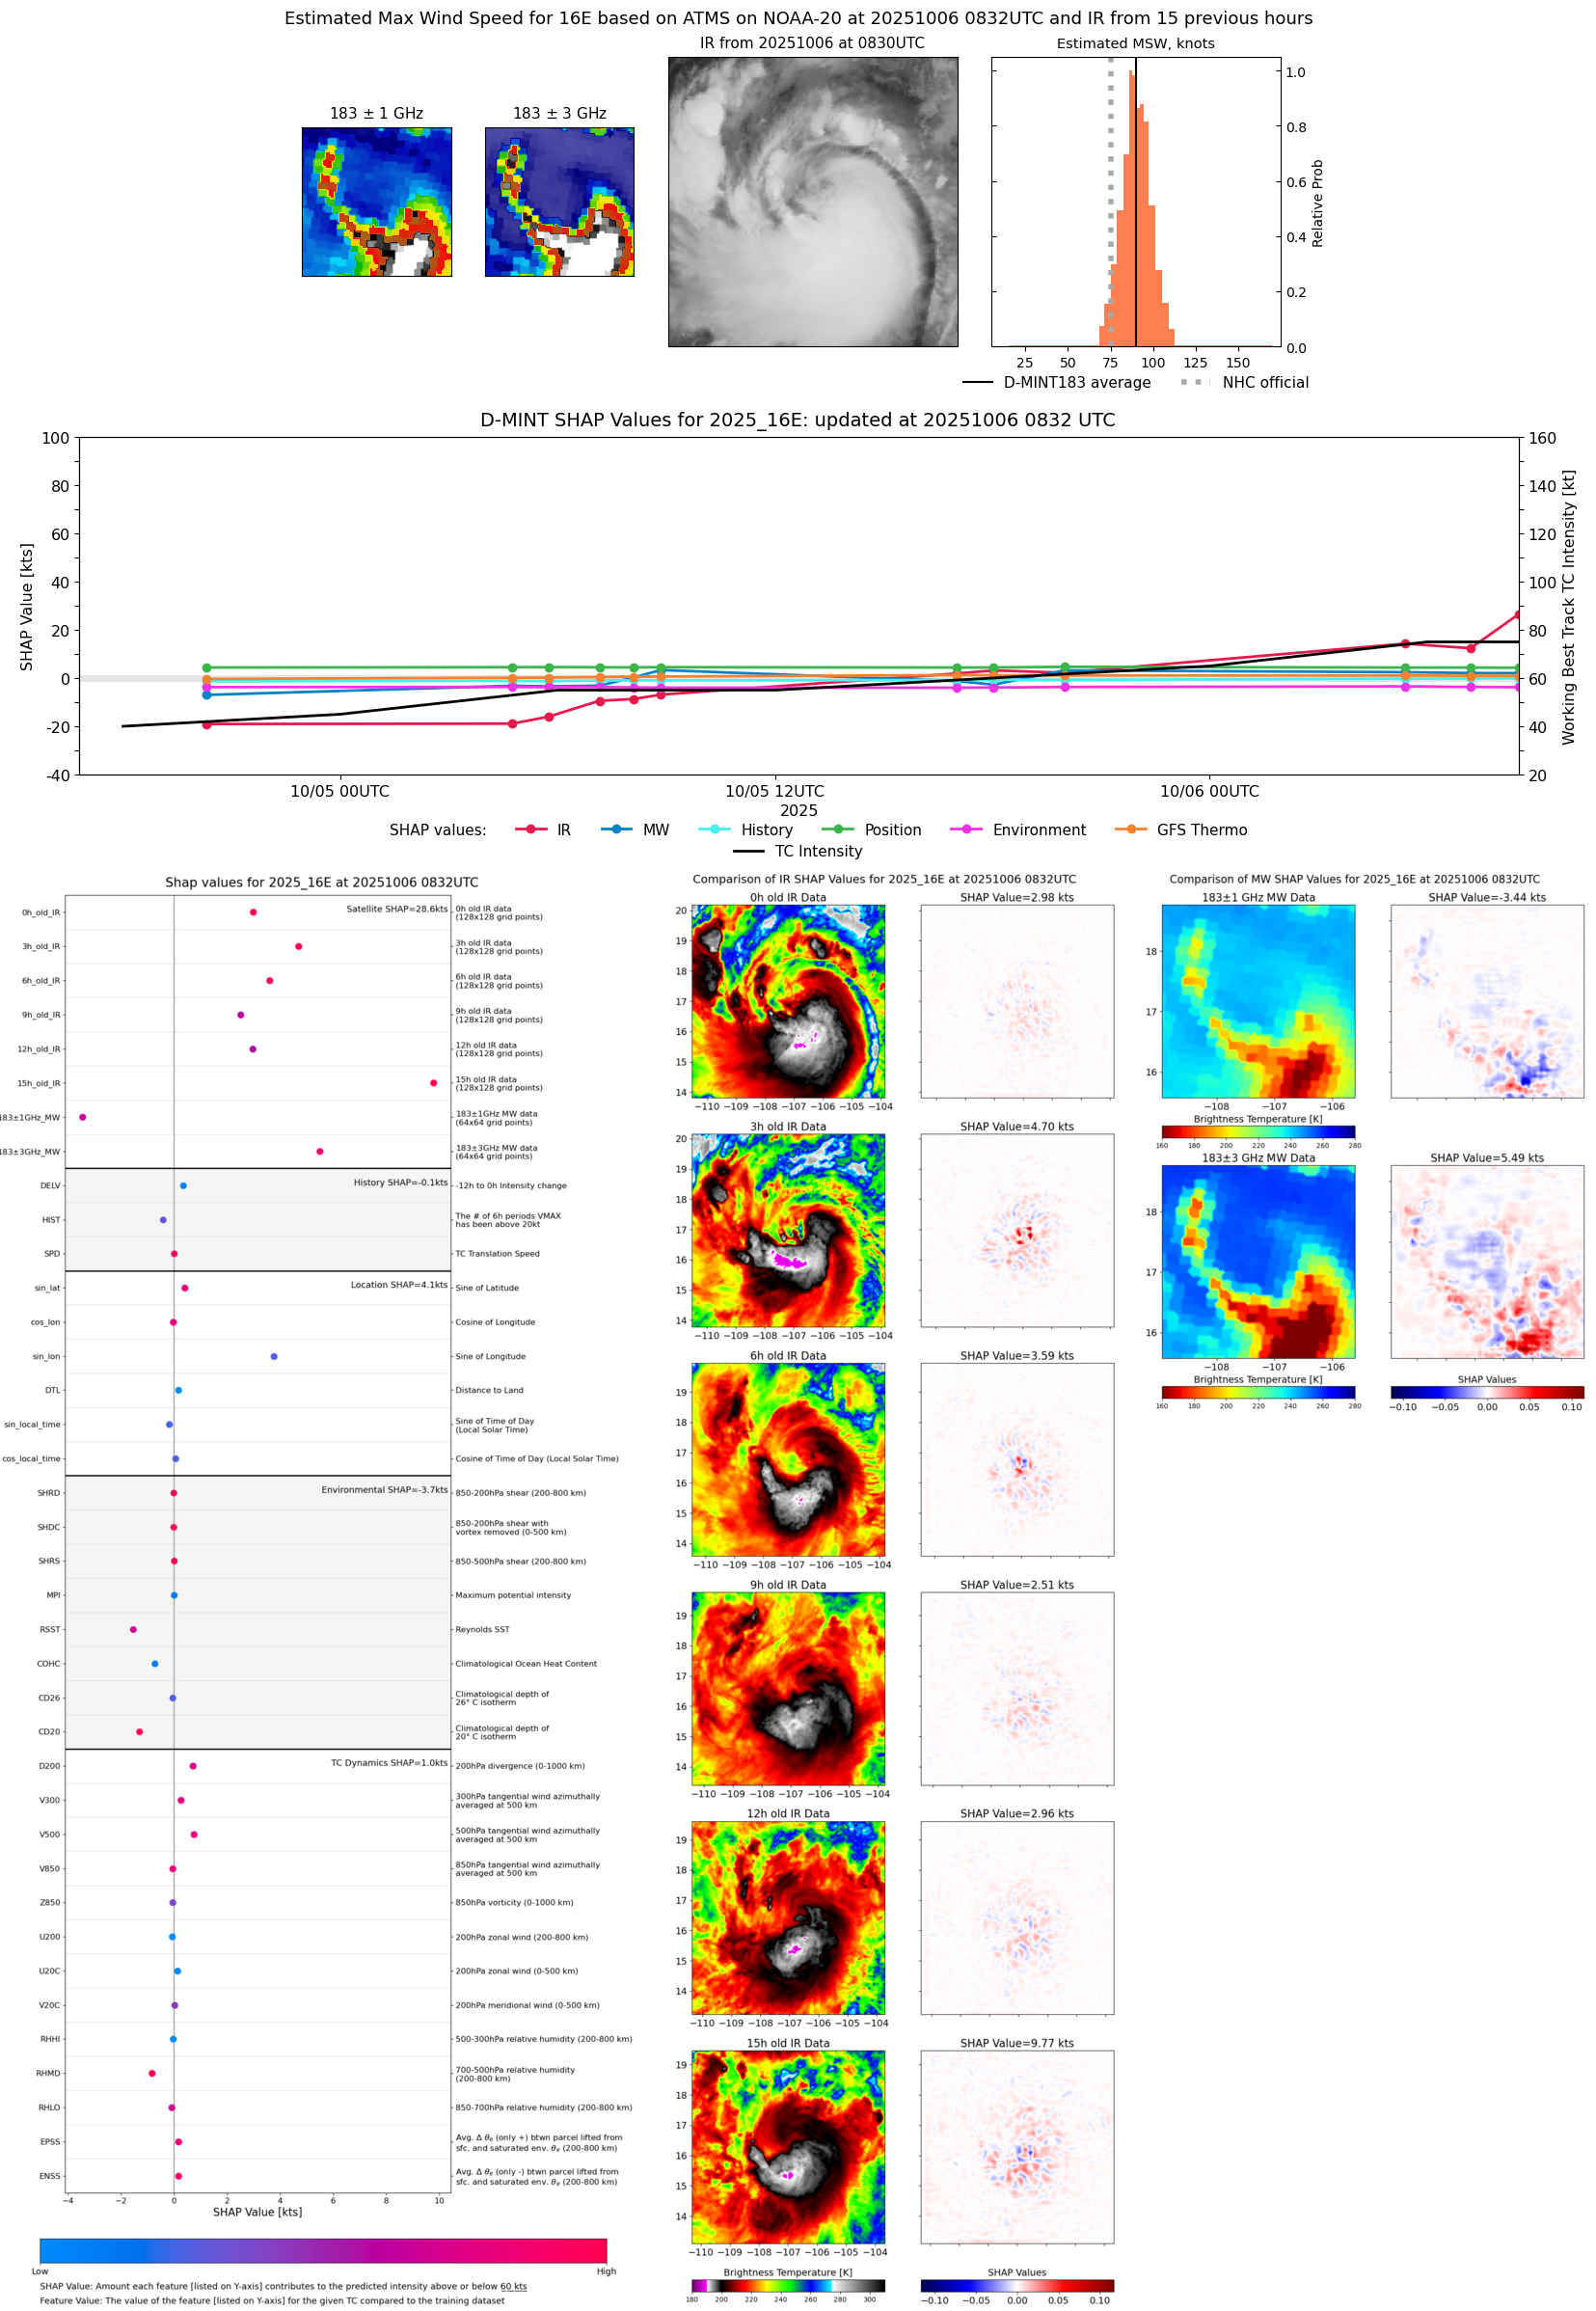 |
| 20251006 | 0712 UTC | TMS07 | 976 hPa | 76 kts | 70 kts | 82 kts | 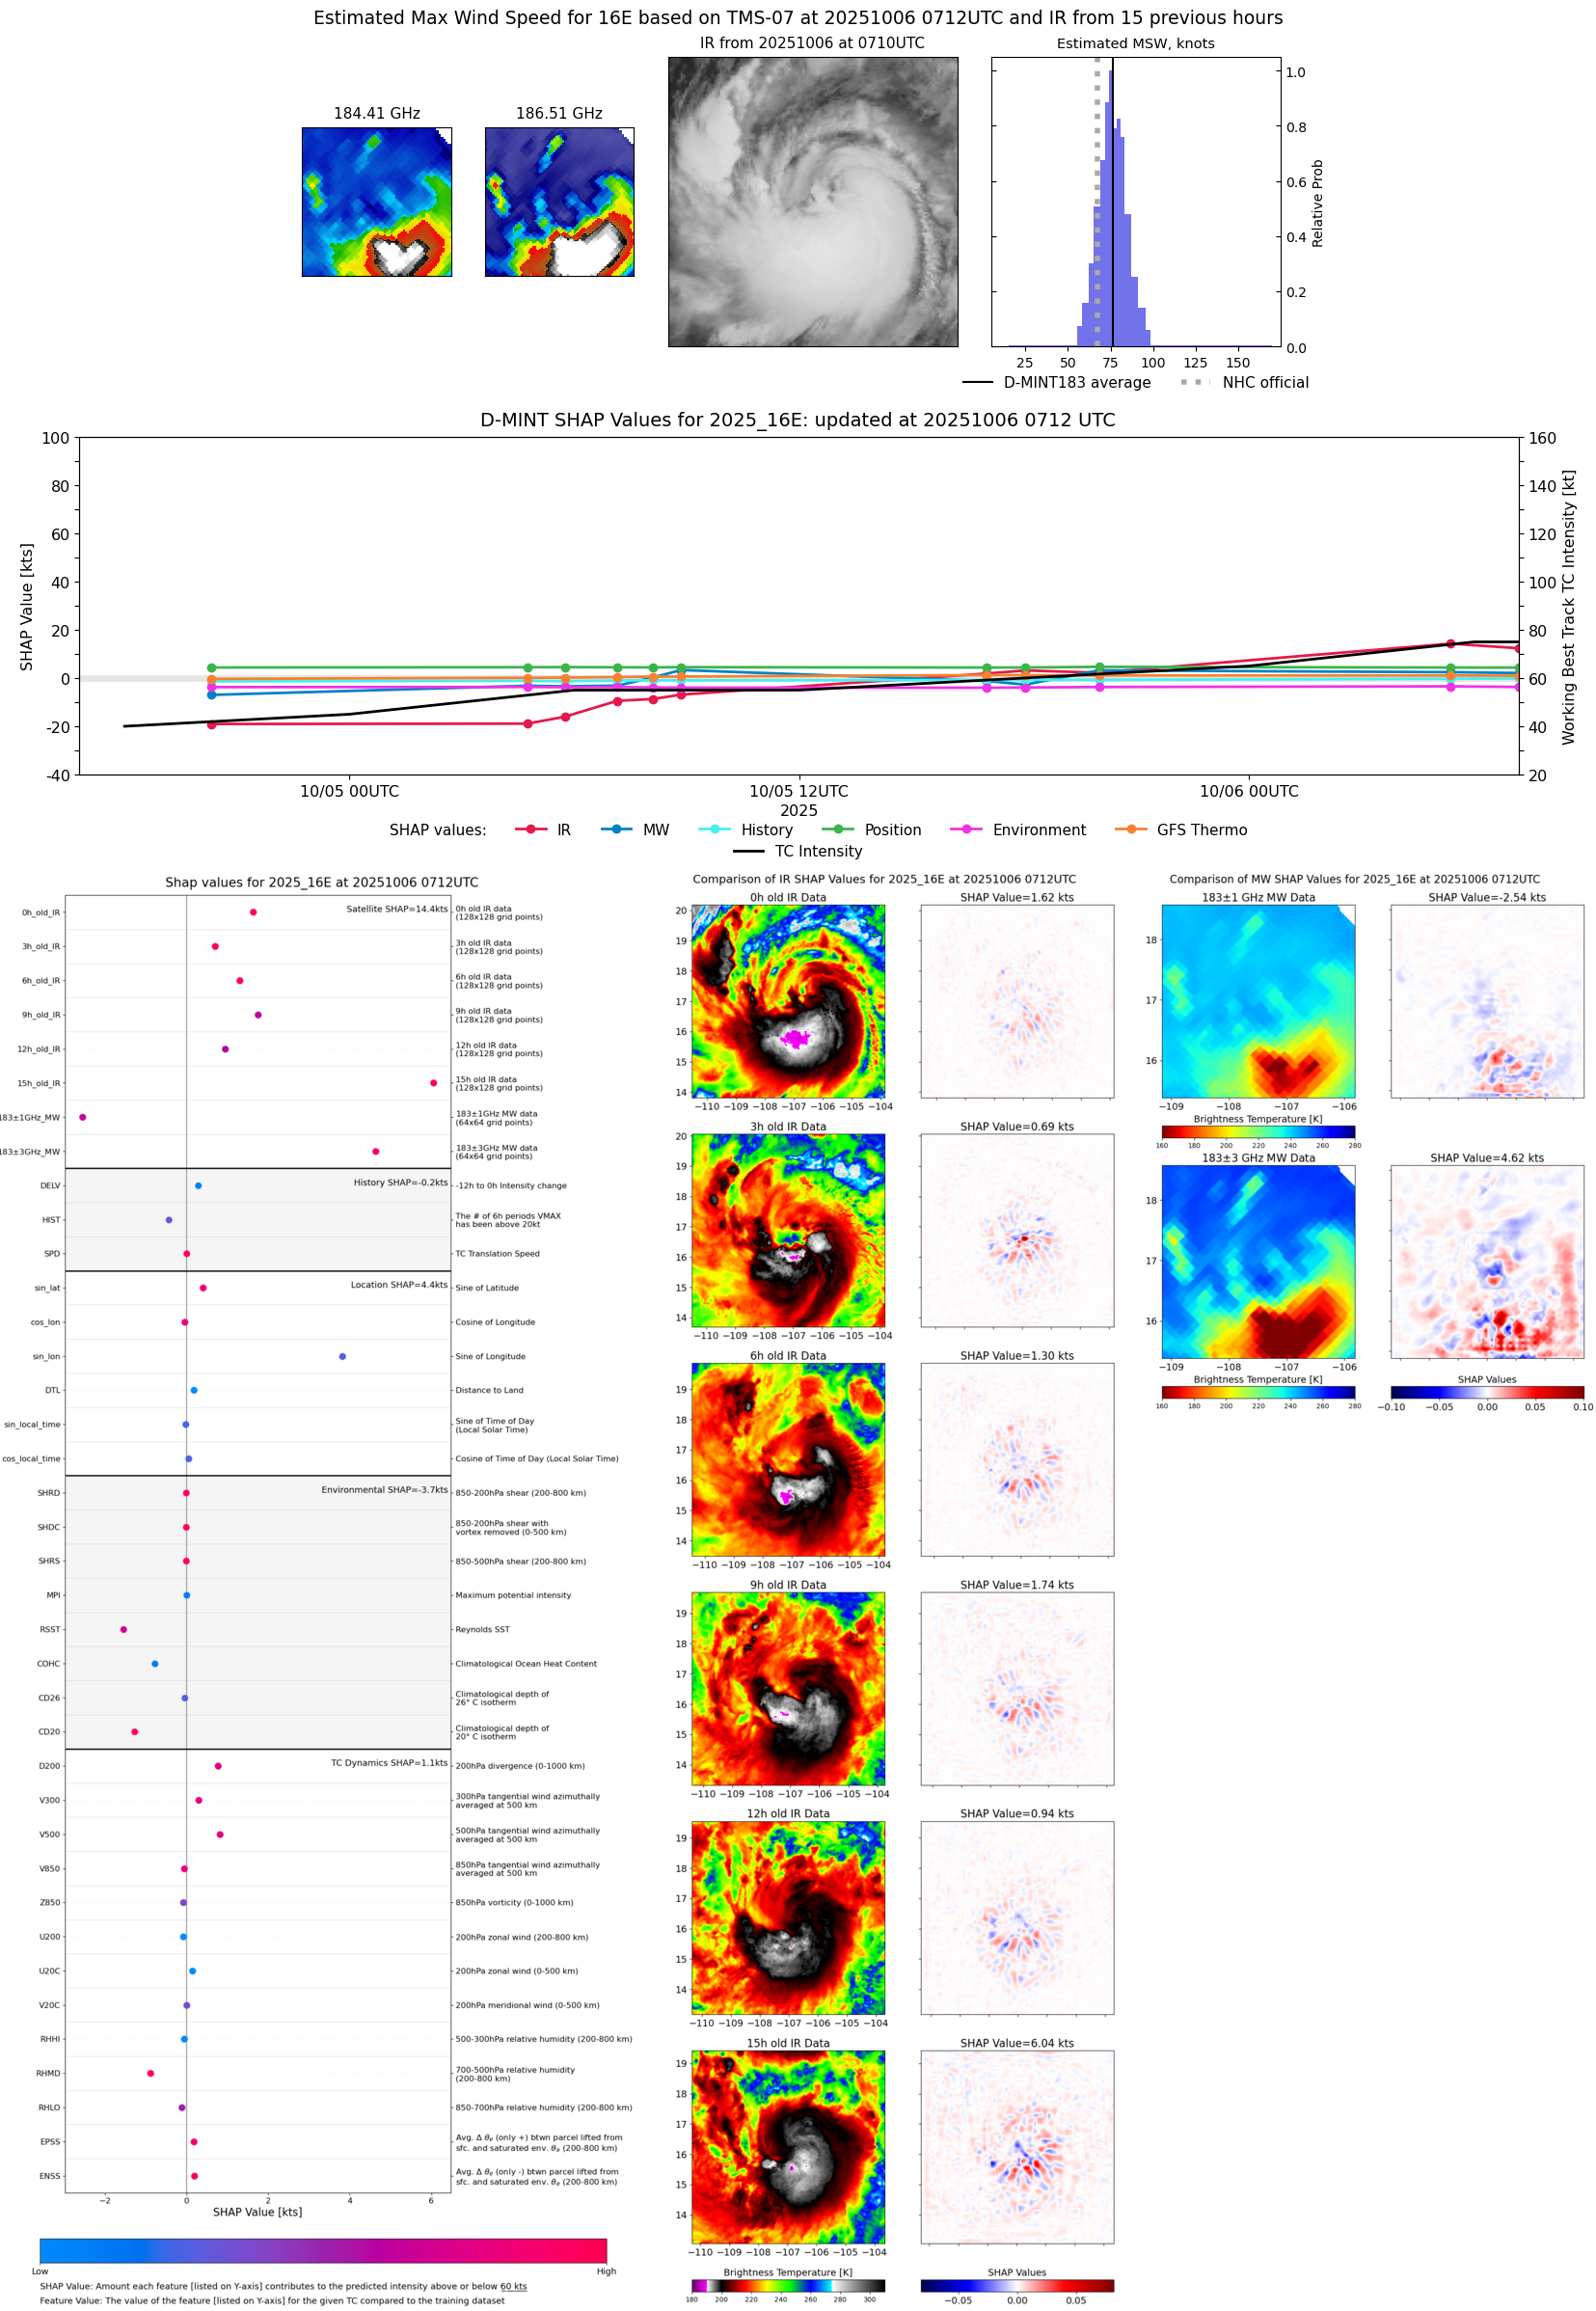 |
| 20251006 | 0523 UTC | TMS05 | 977 hPa | 79 kts | 73 kts | 85 kts | 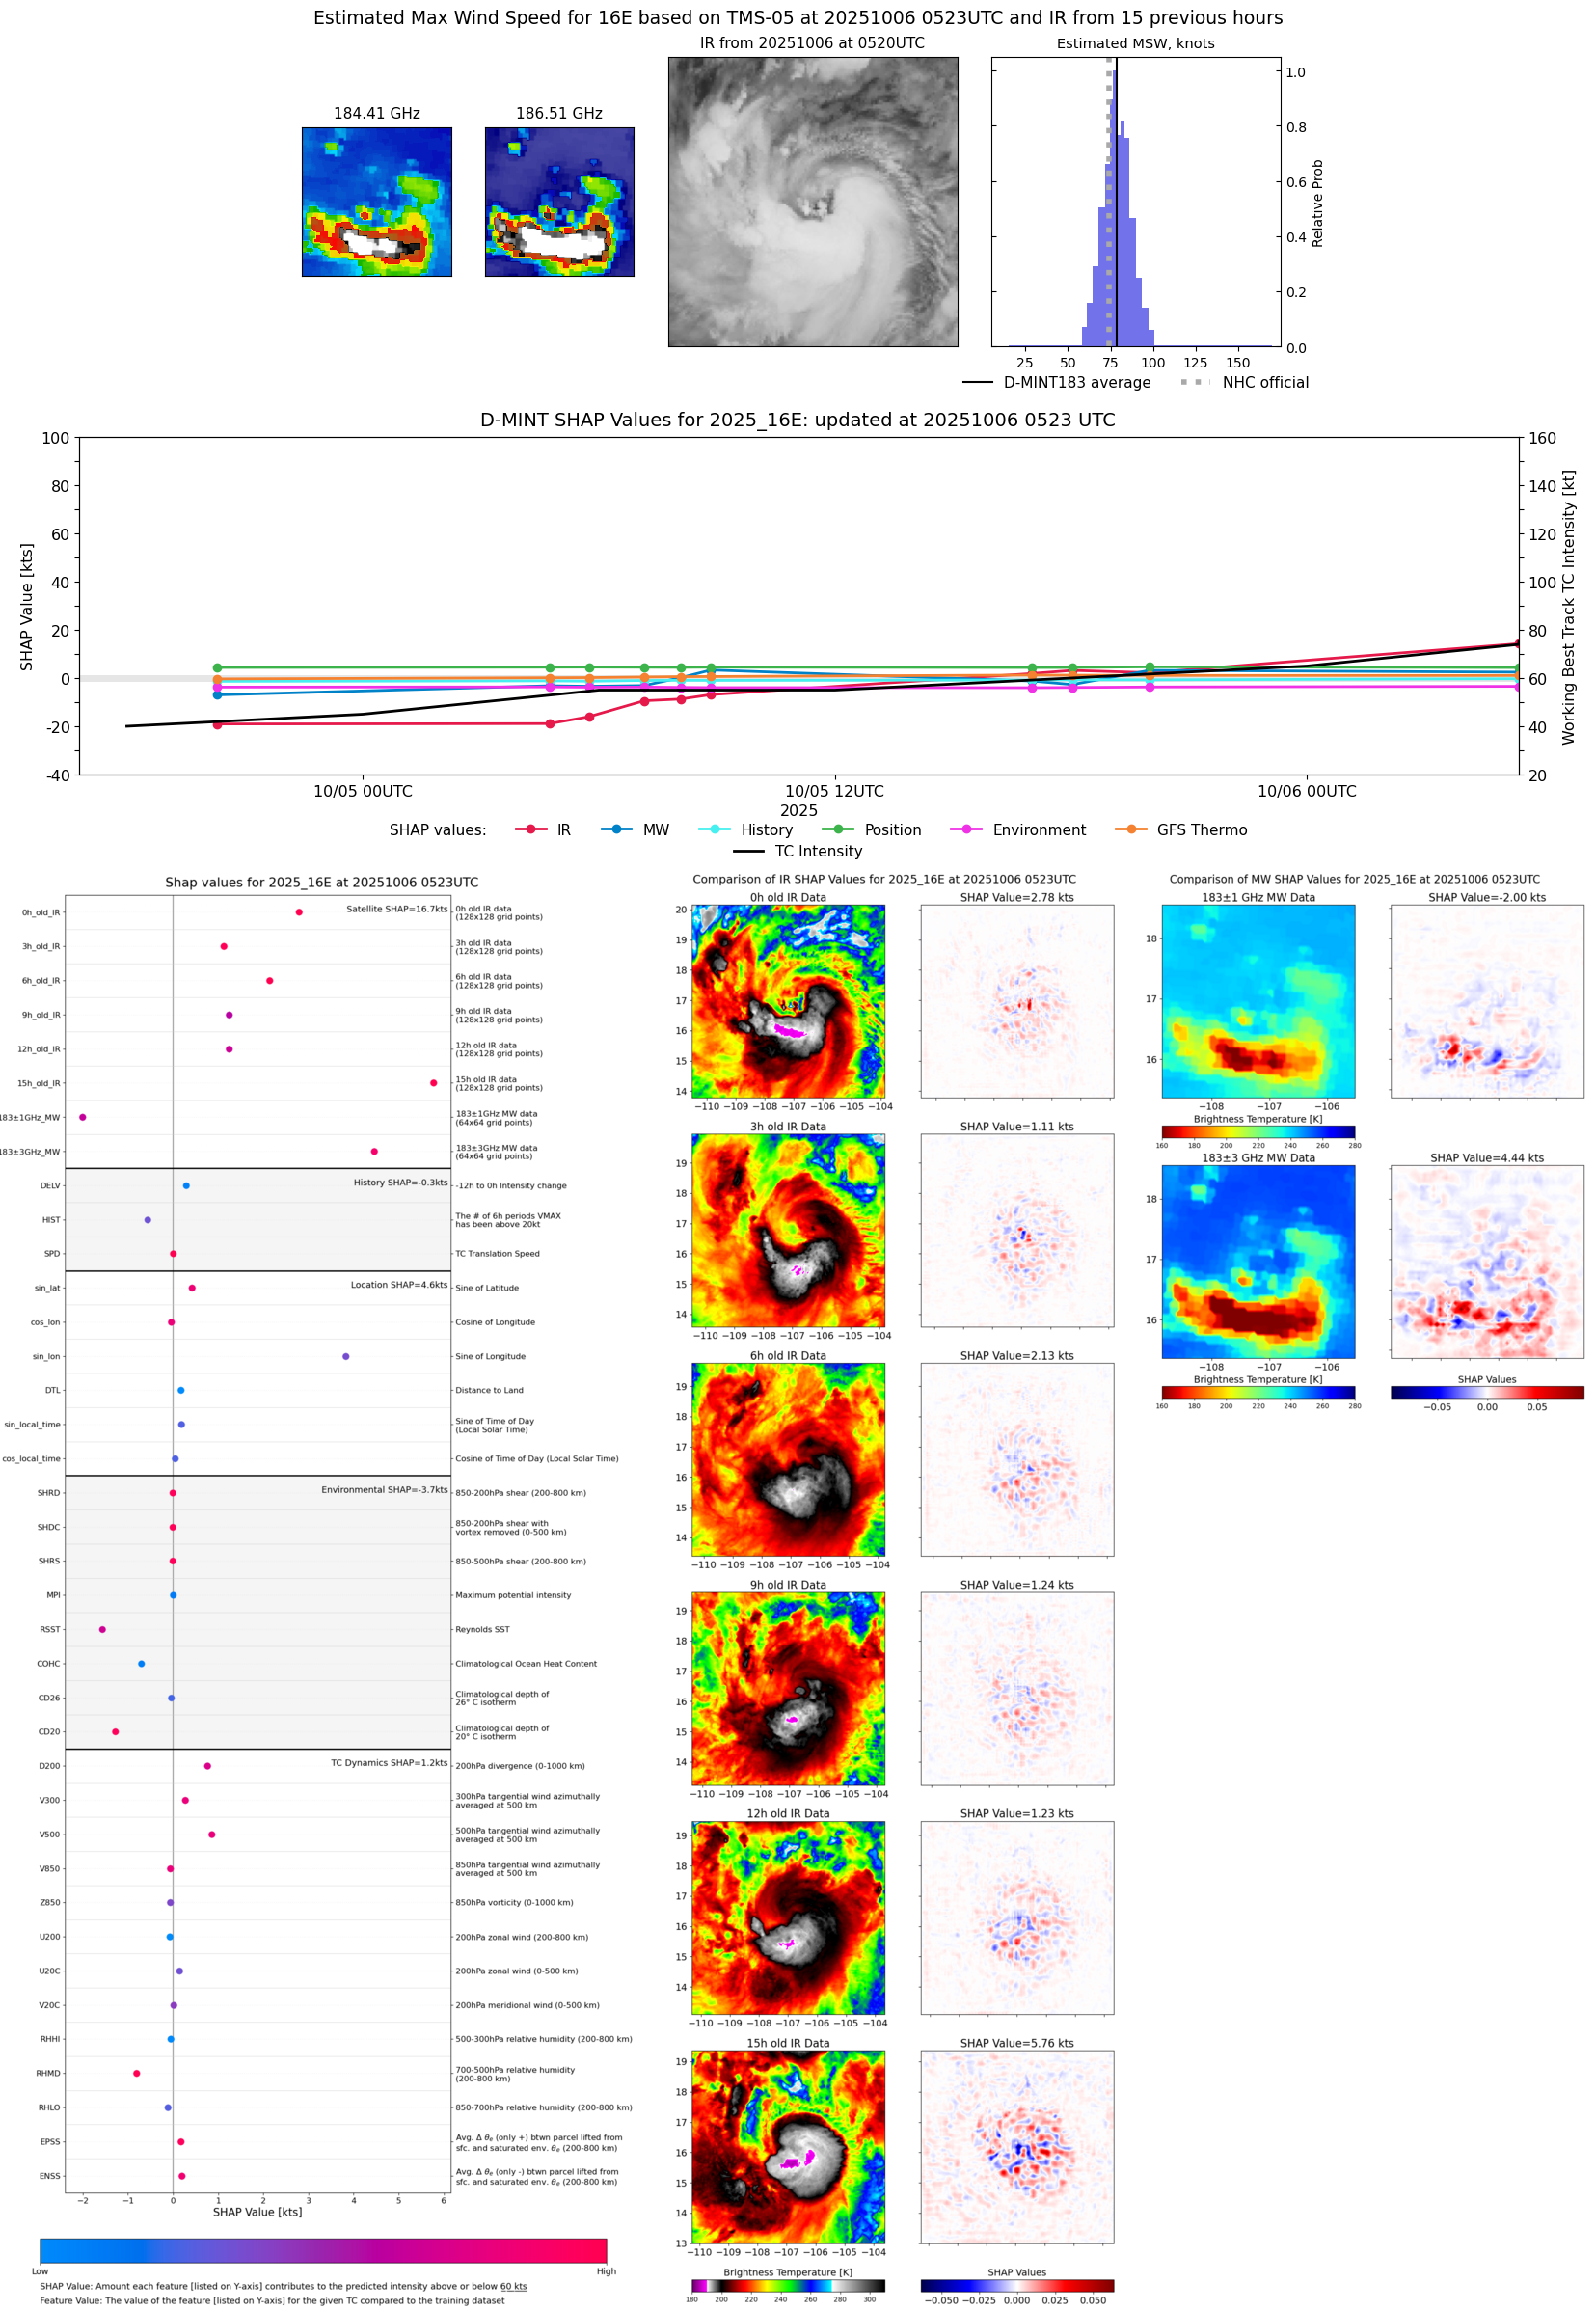 |
| 20251005 | 2000 UTC | ATMS-N20 | 980 hPa | 67 kts | 62 kts | 72 kts |  |
| 20251005 | 1802 UTC | TMS02 | 984 hPa | 62 kts | 57 kts | 67 kts | 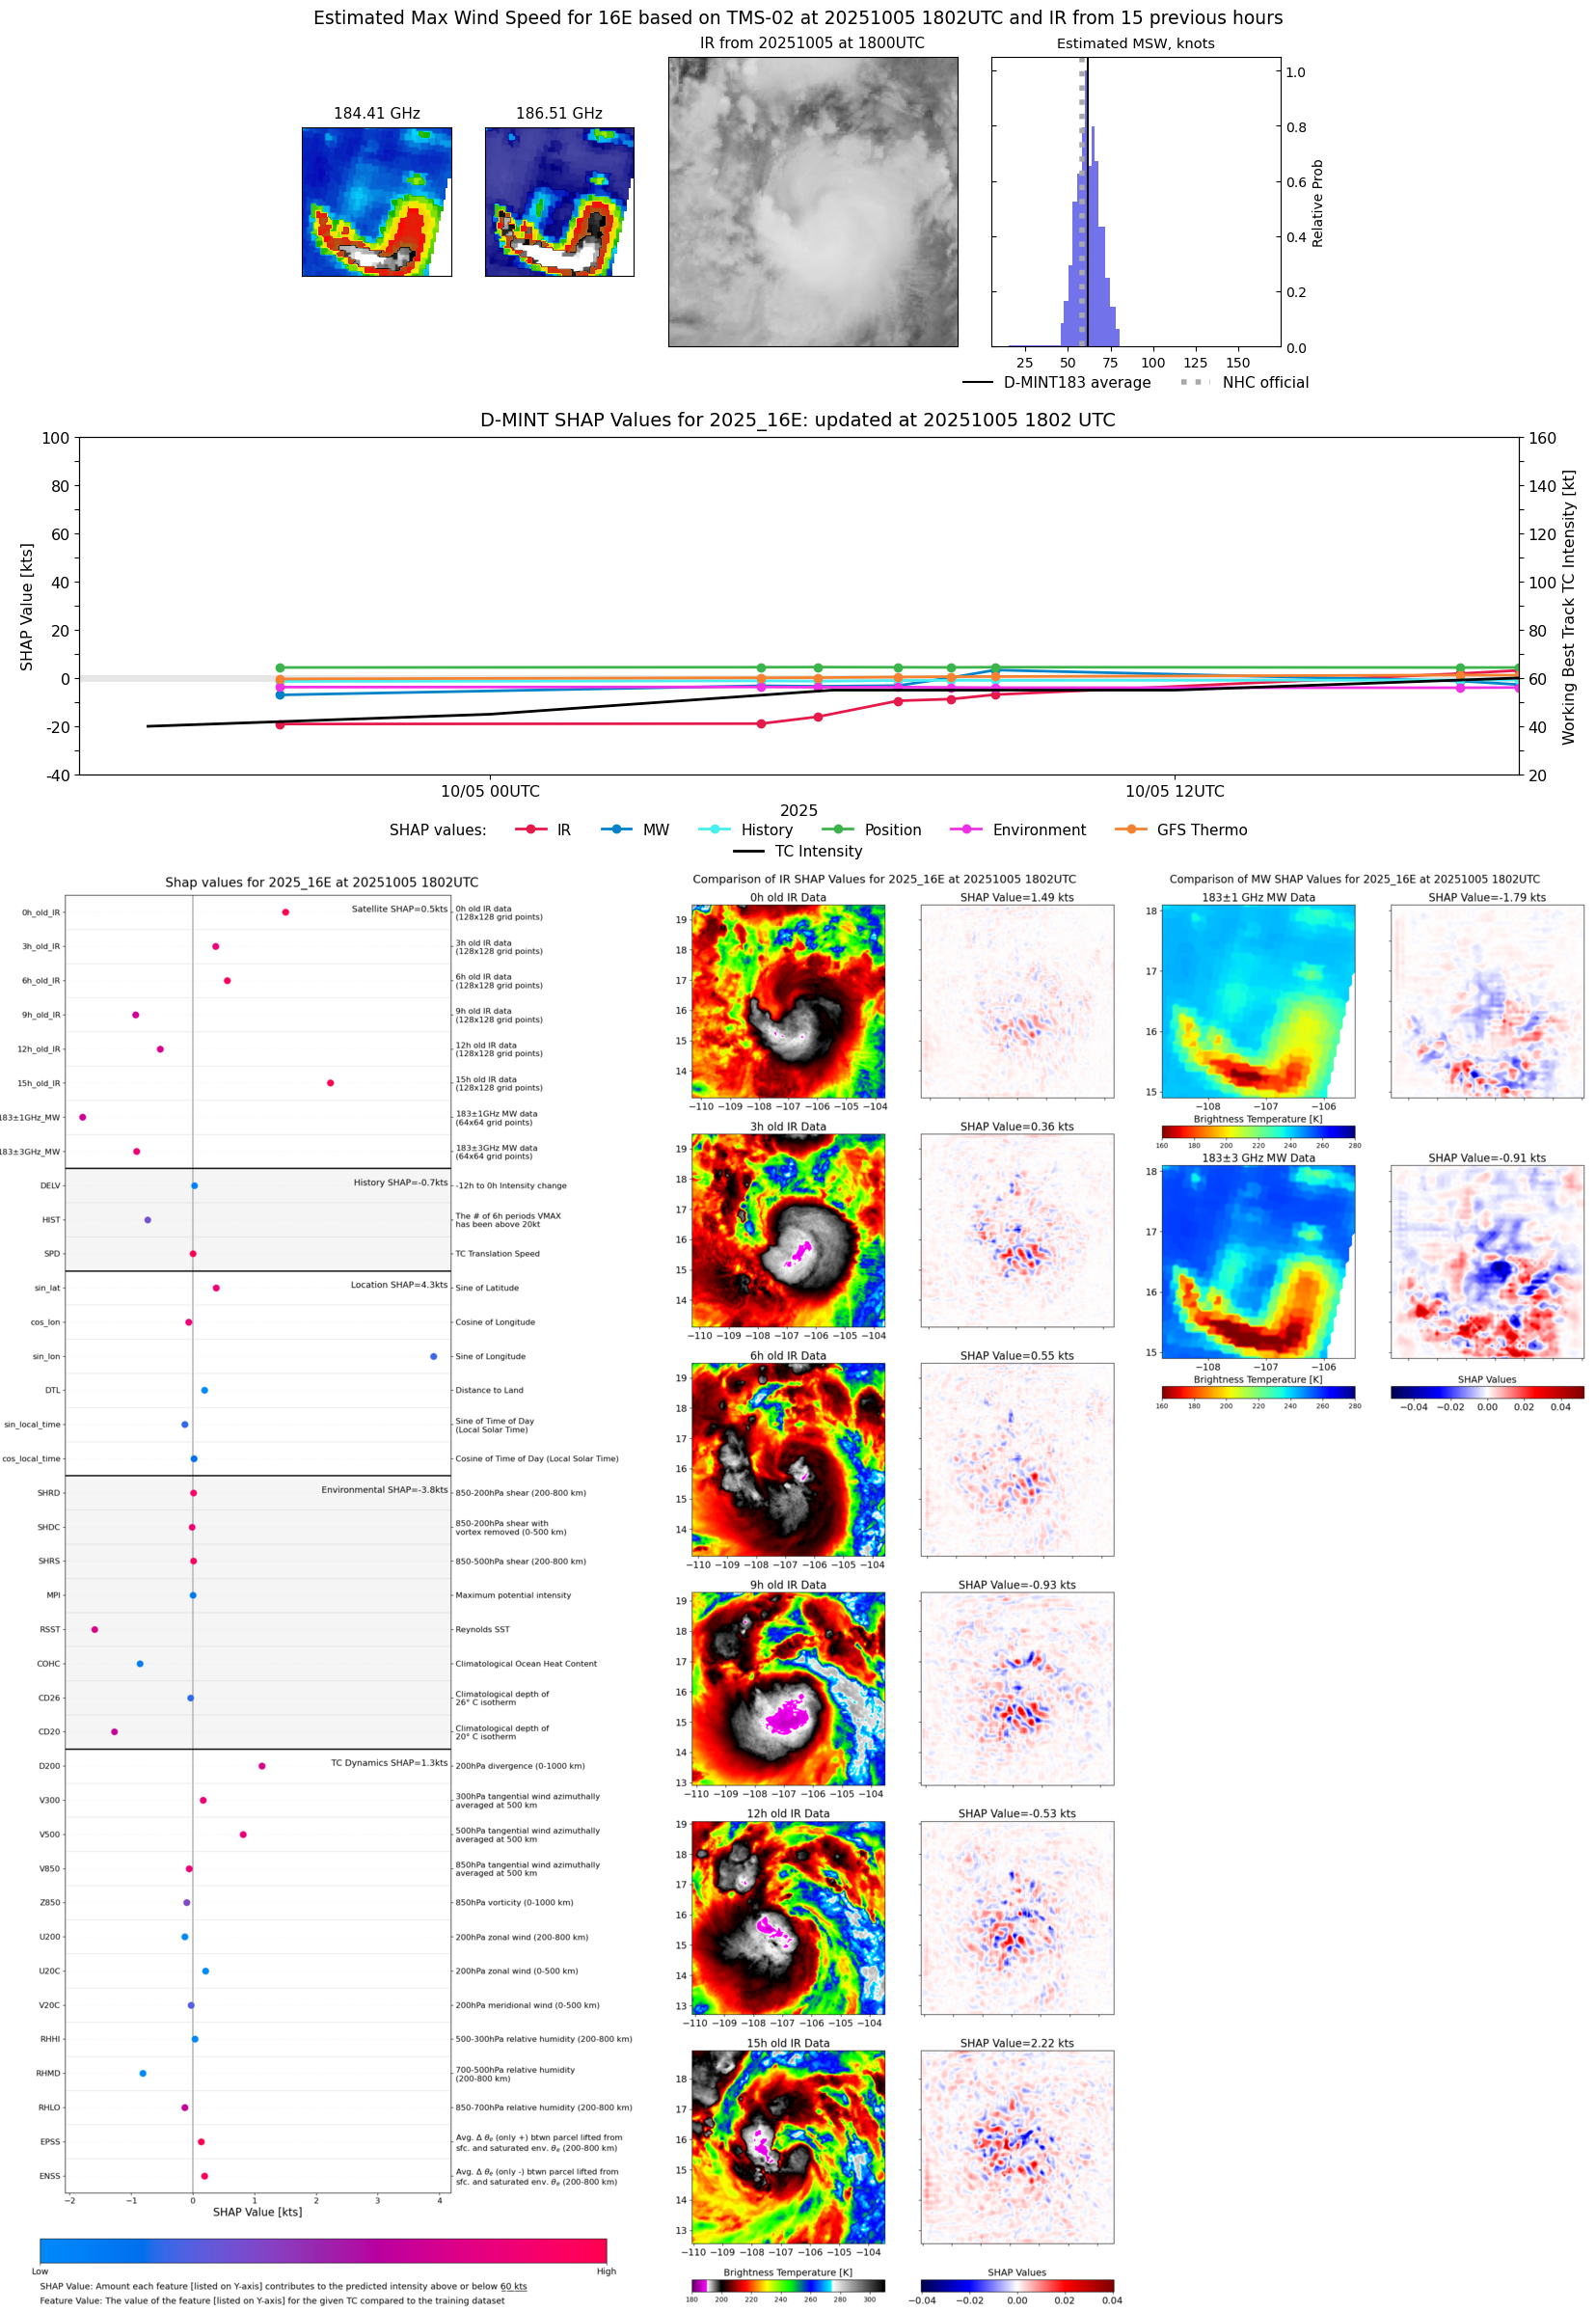 |
| 20251005 | 1700 UTC | TMS06 | 988 hPa | 62 kts | 57 kts | 67 kts | 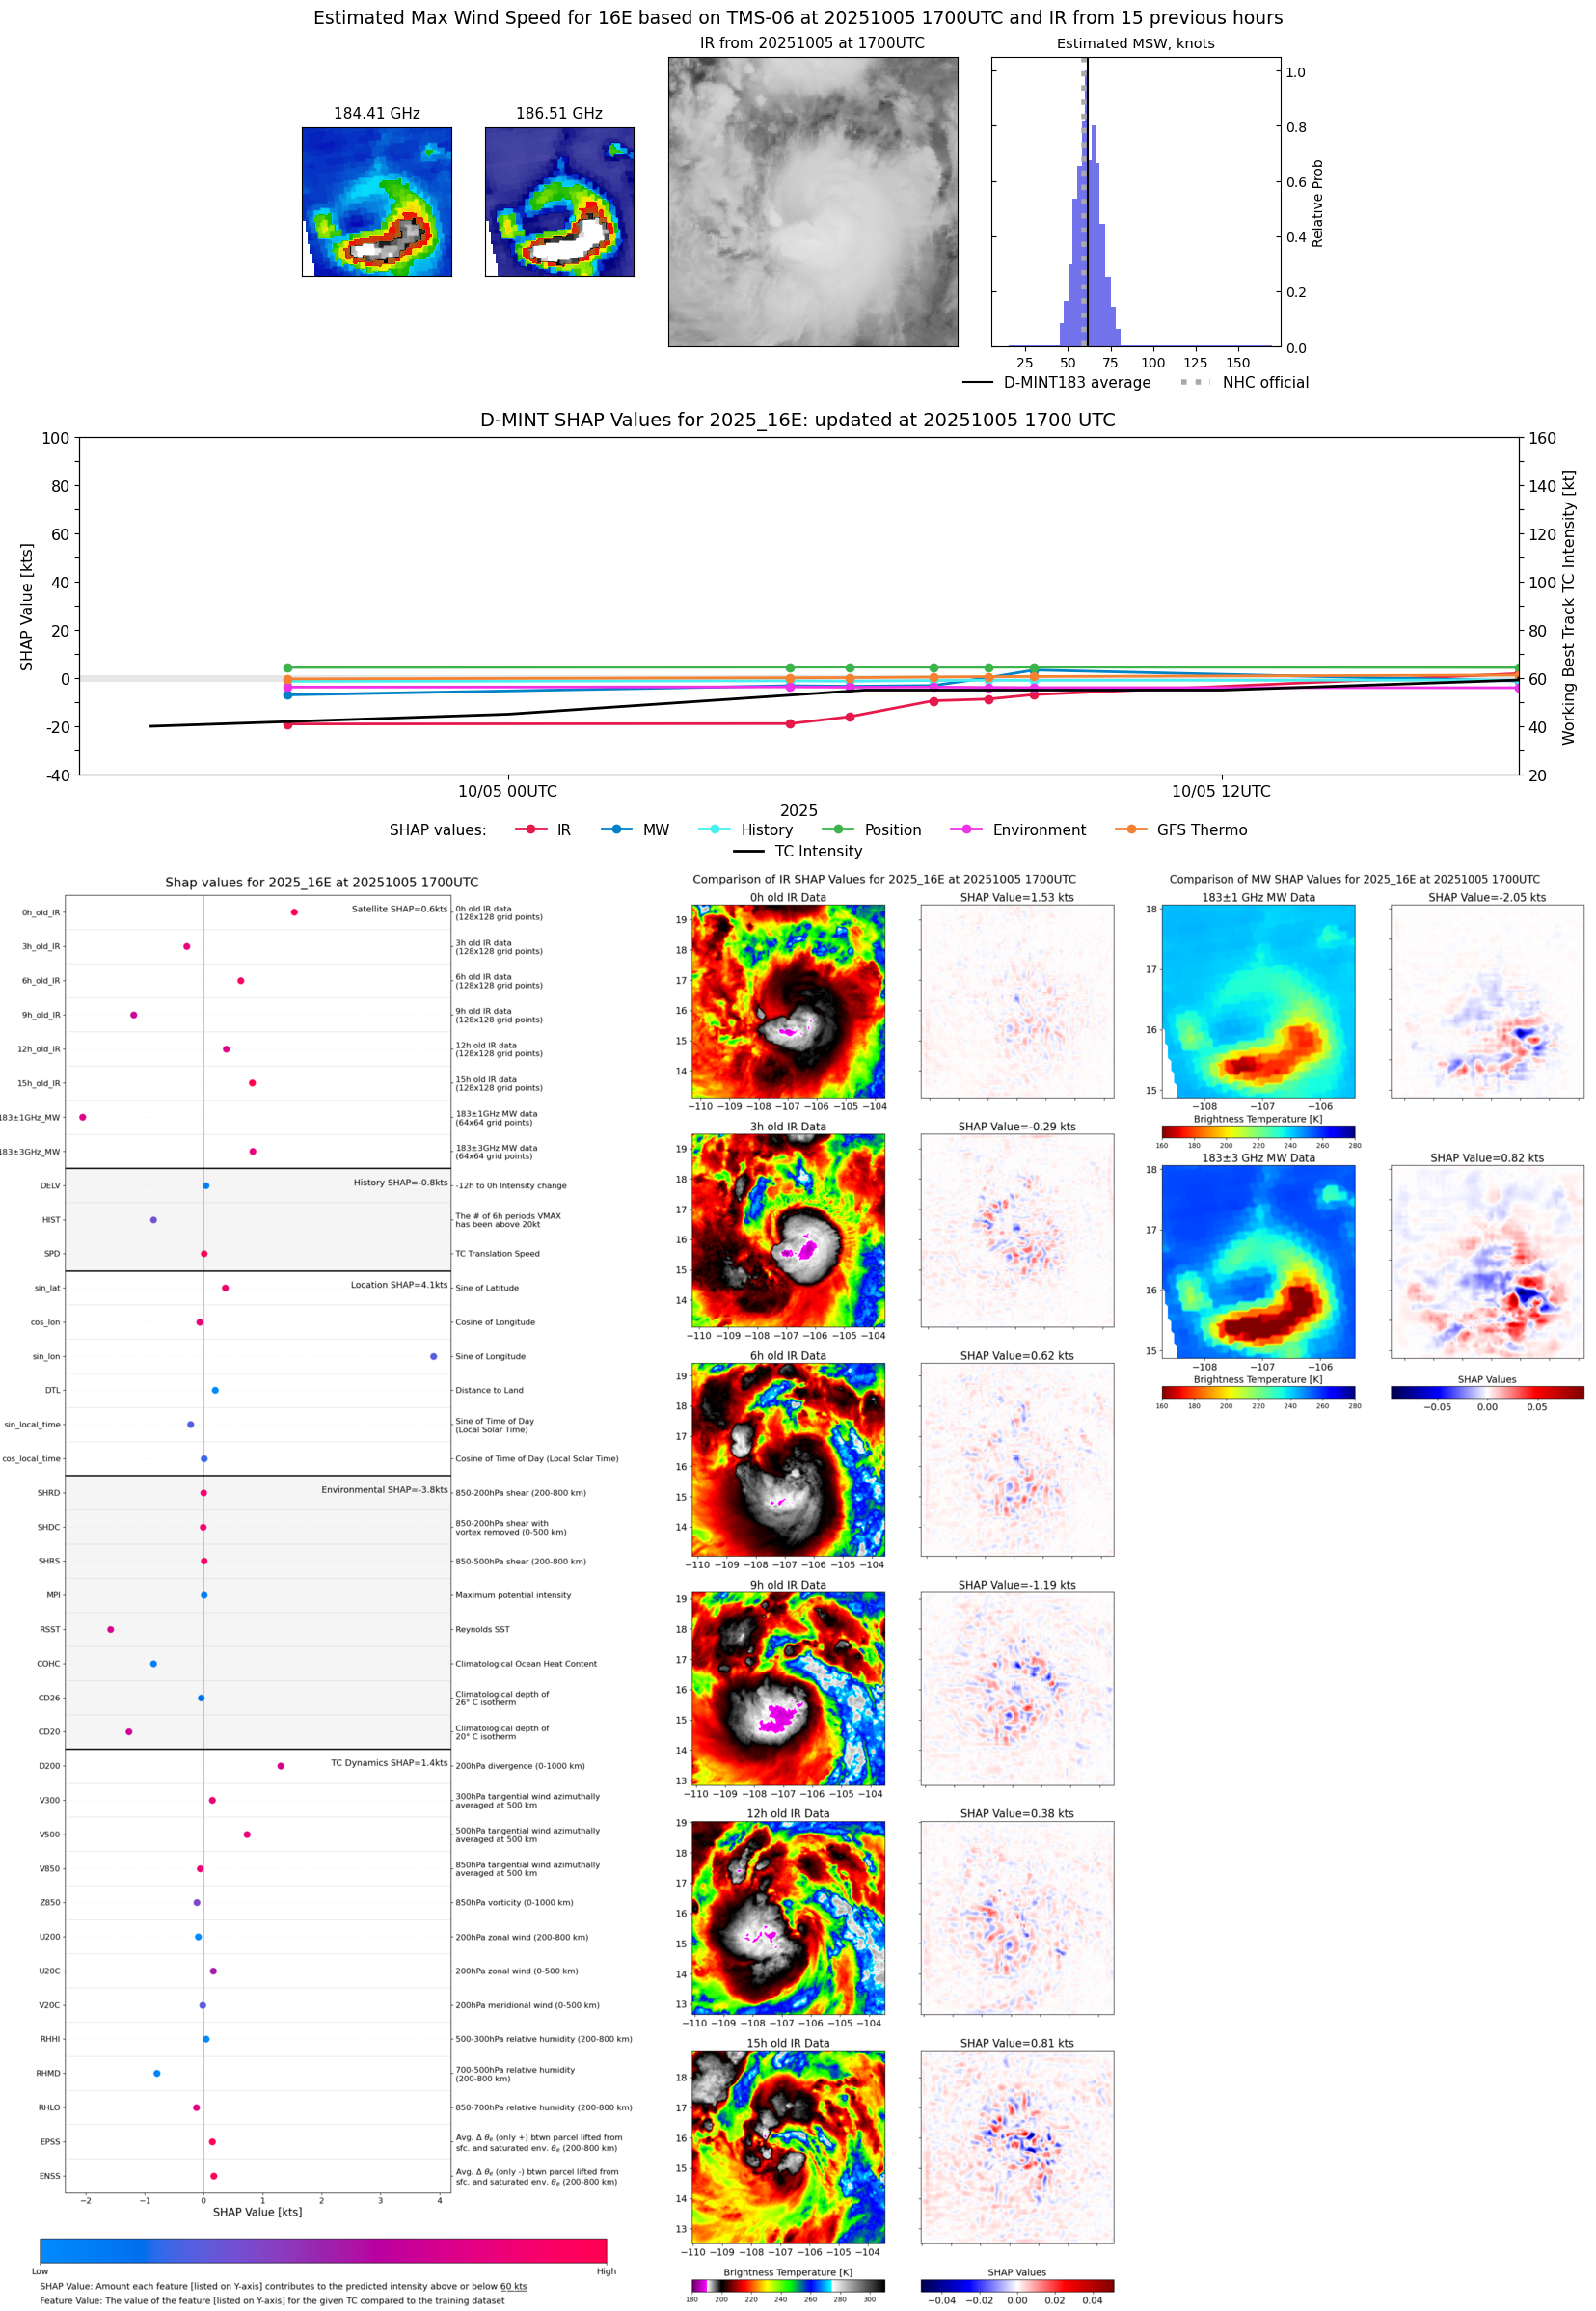 |
| 20251005 | 0851 UTC | ATMS-N20 | 993 hPa | 57 kts | 52 kts | 62 kts |  |
| 20251005 | 0832 UTC | AMSR2 | 996 hPa | 48 kts | 44 kts | 53 kts |  |
| 20251005 | 0805 UTC | TROPICS03 | 993 hPa | 52 kts | 48 kts | 57 kts |  |
| 20251005 | 0709 UTC | TMS07 | 993 hPa | 48 kts | 44 kts | 53 kts | 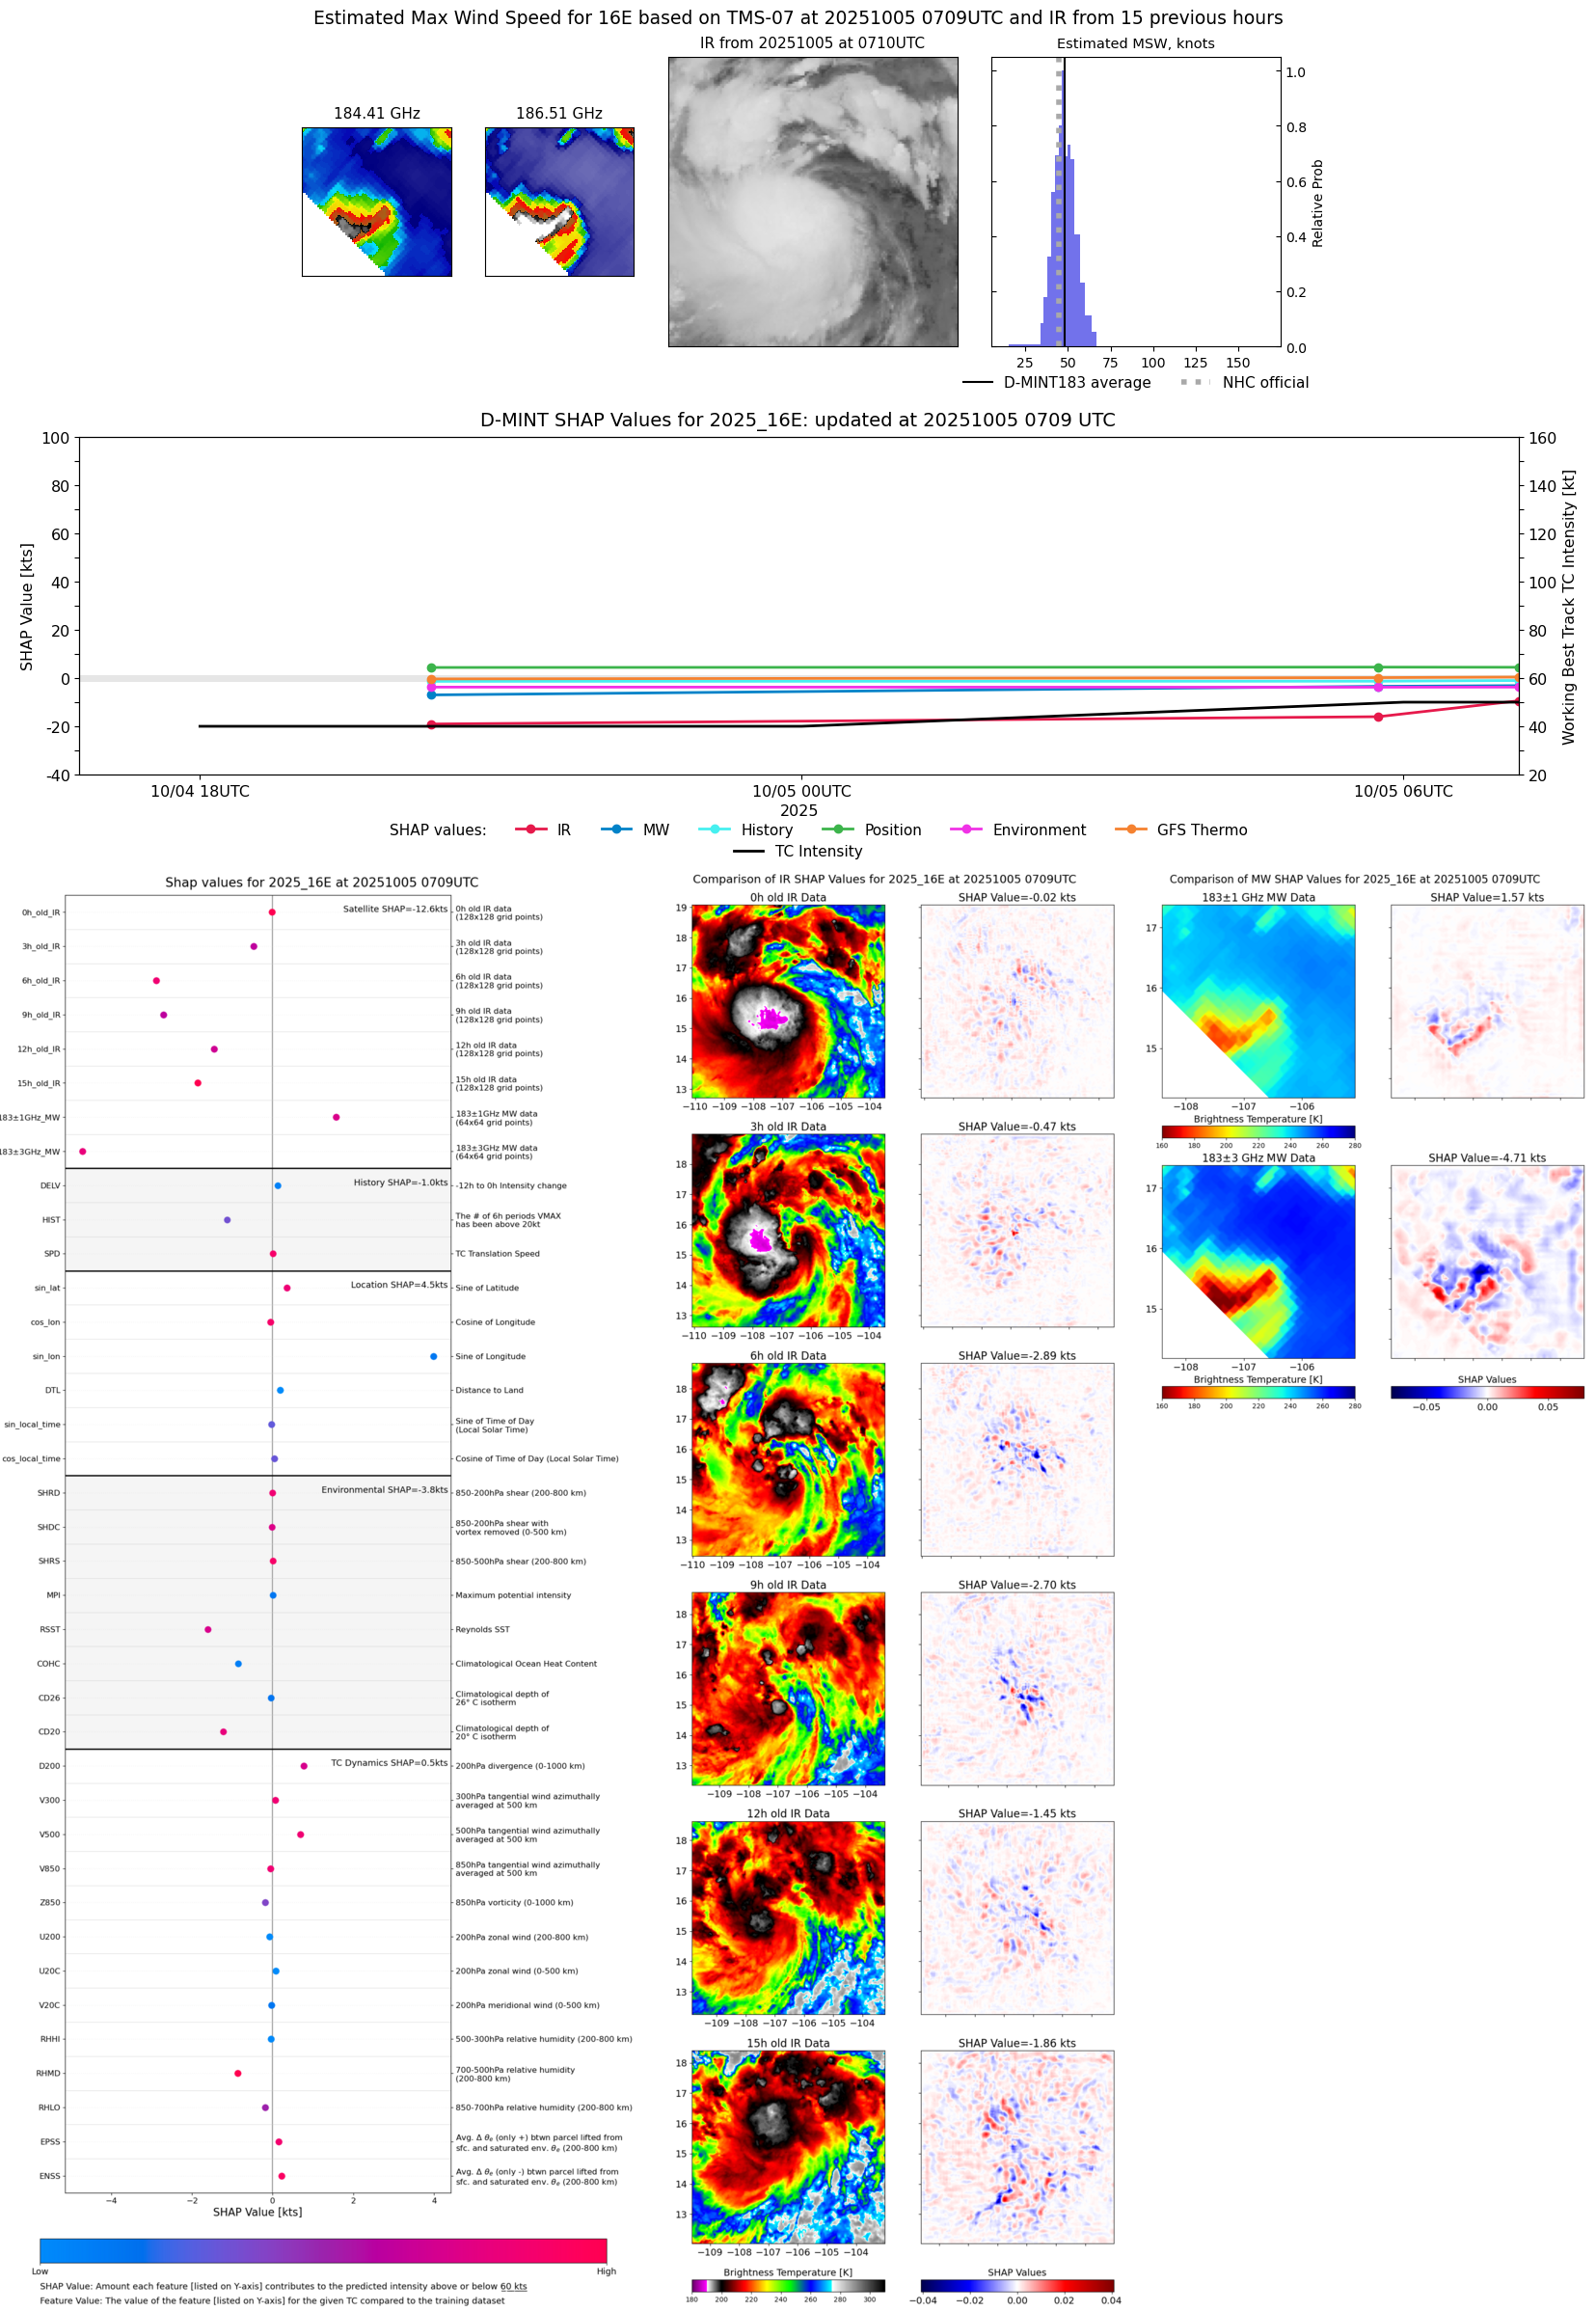 |
| 20251005 | 0545 UTC | TMS05 | 998 hPa | 41 kts | 36 kts | 45 kts | 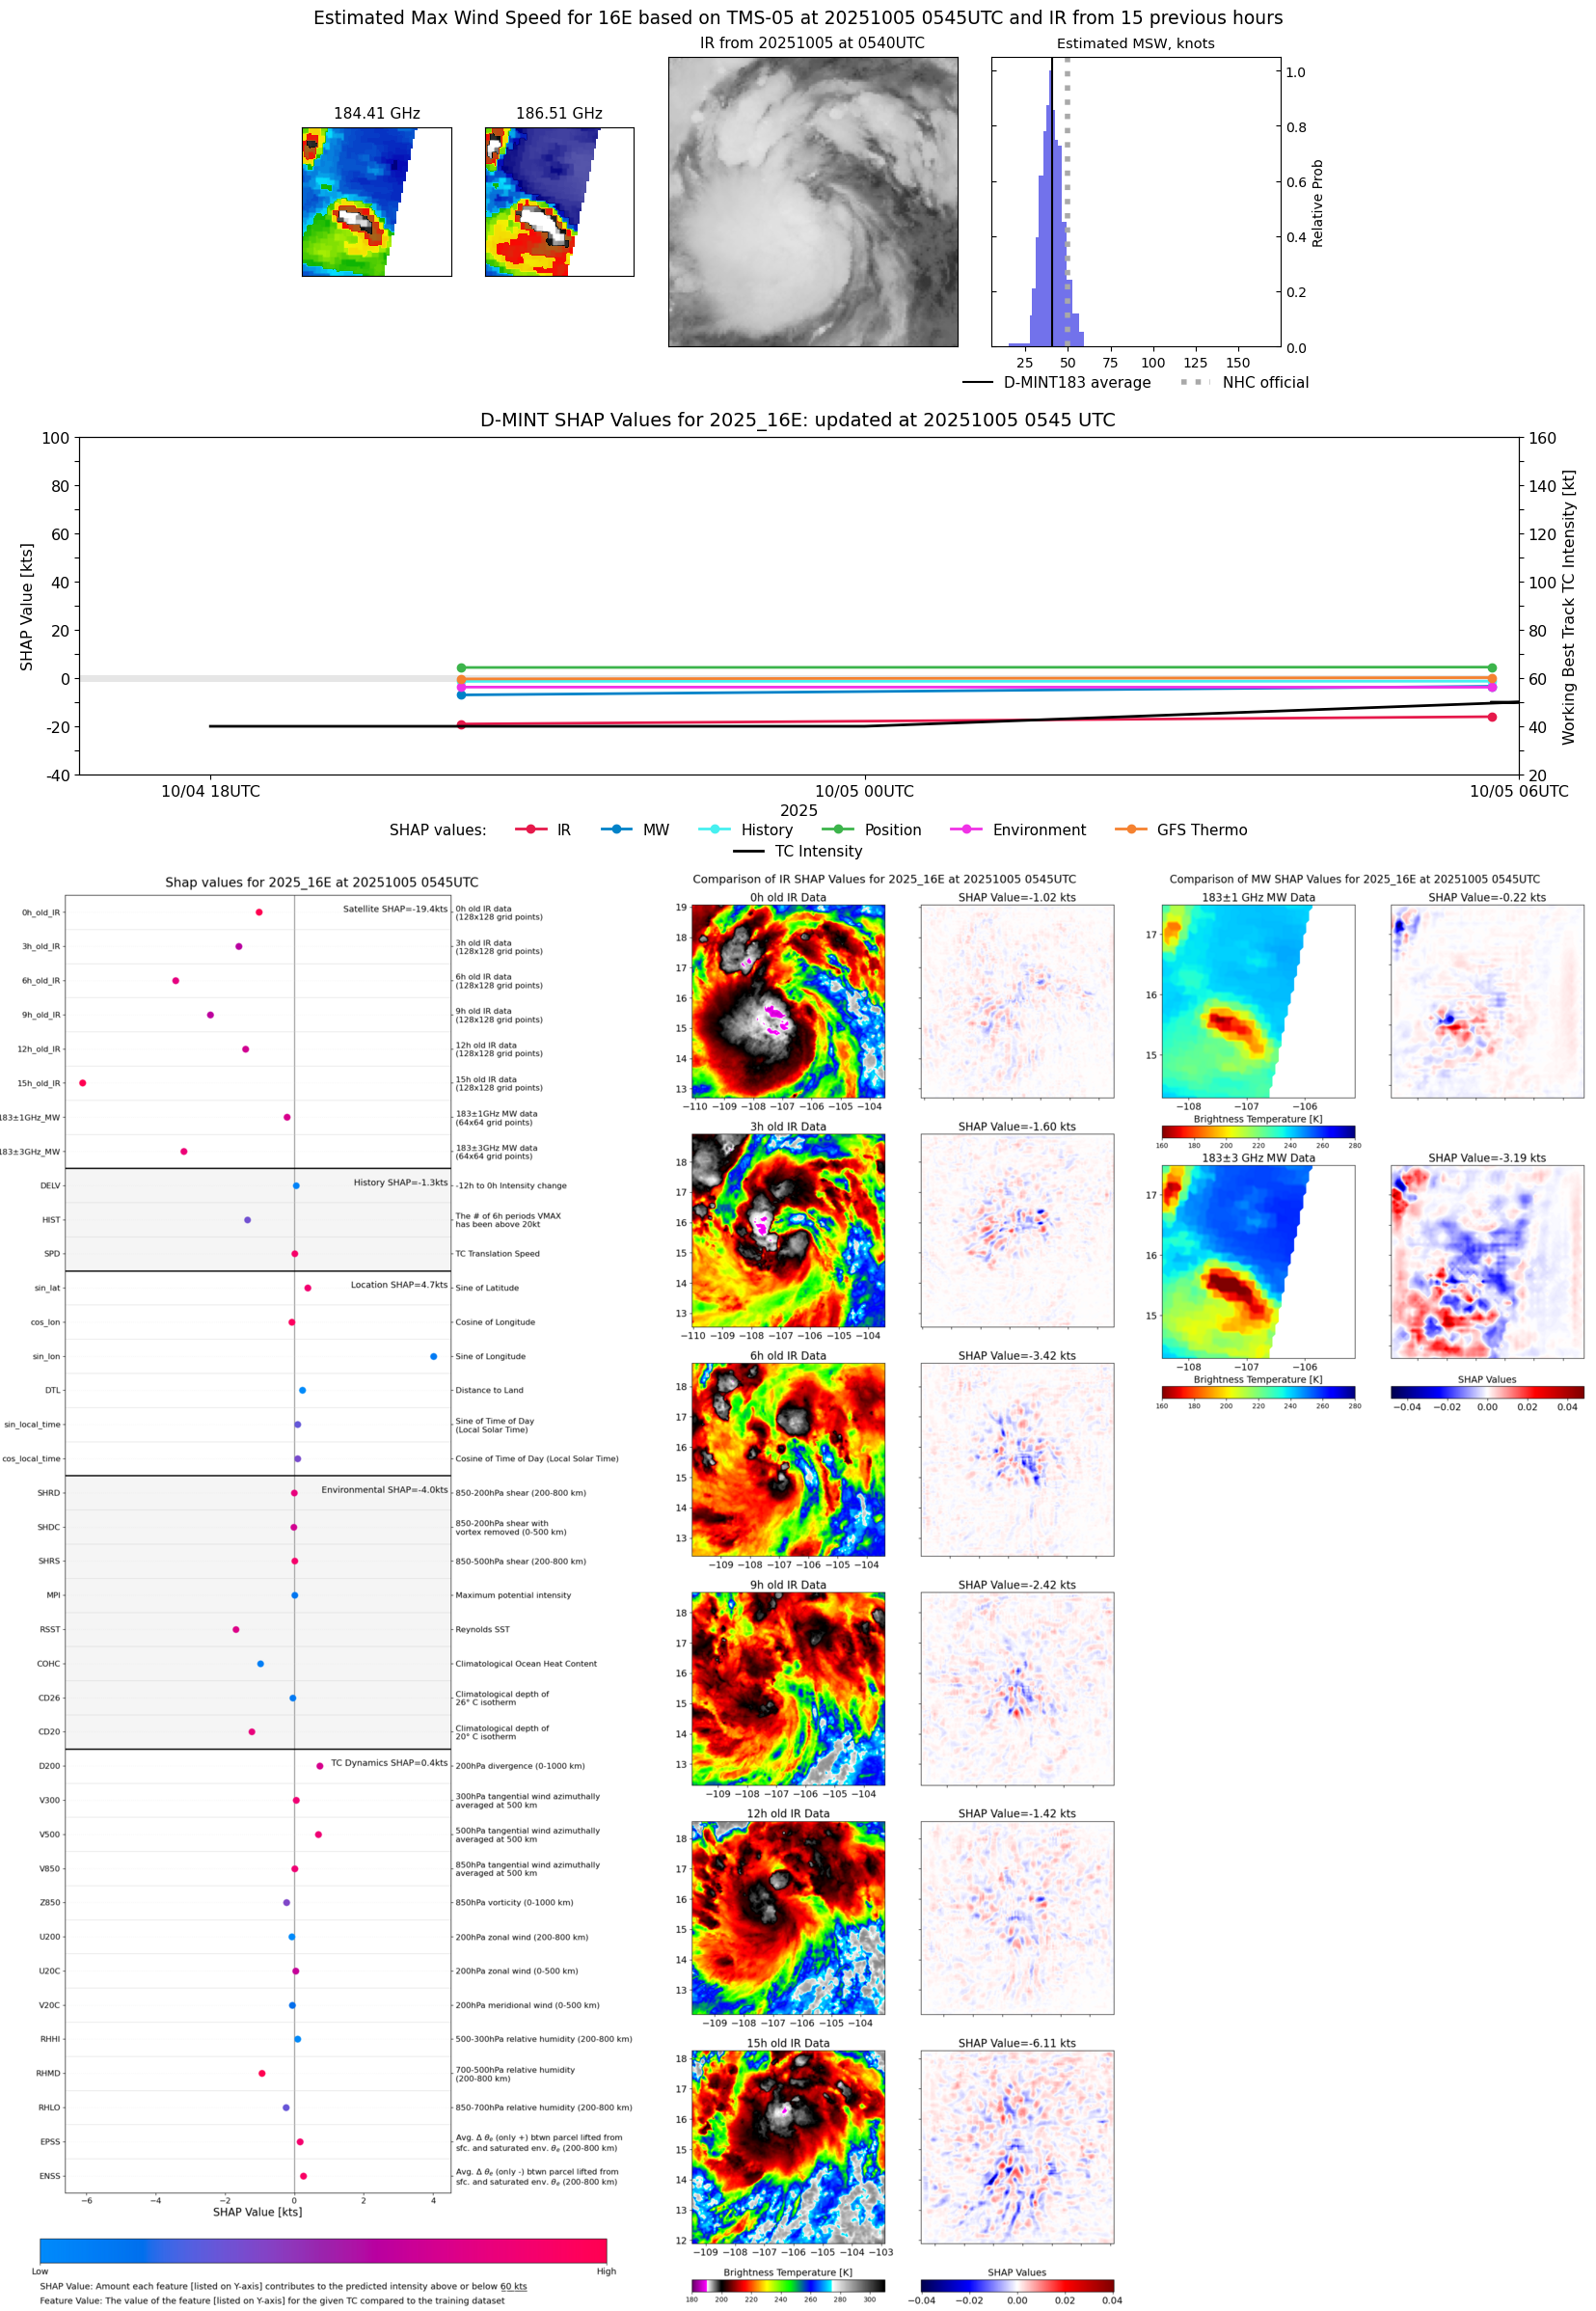 |
| 20251005 | 0445 UTC | TROPICS05 | 999 hPa | 38 kts | 34 kts | 42 kts | 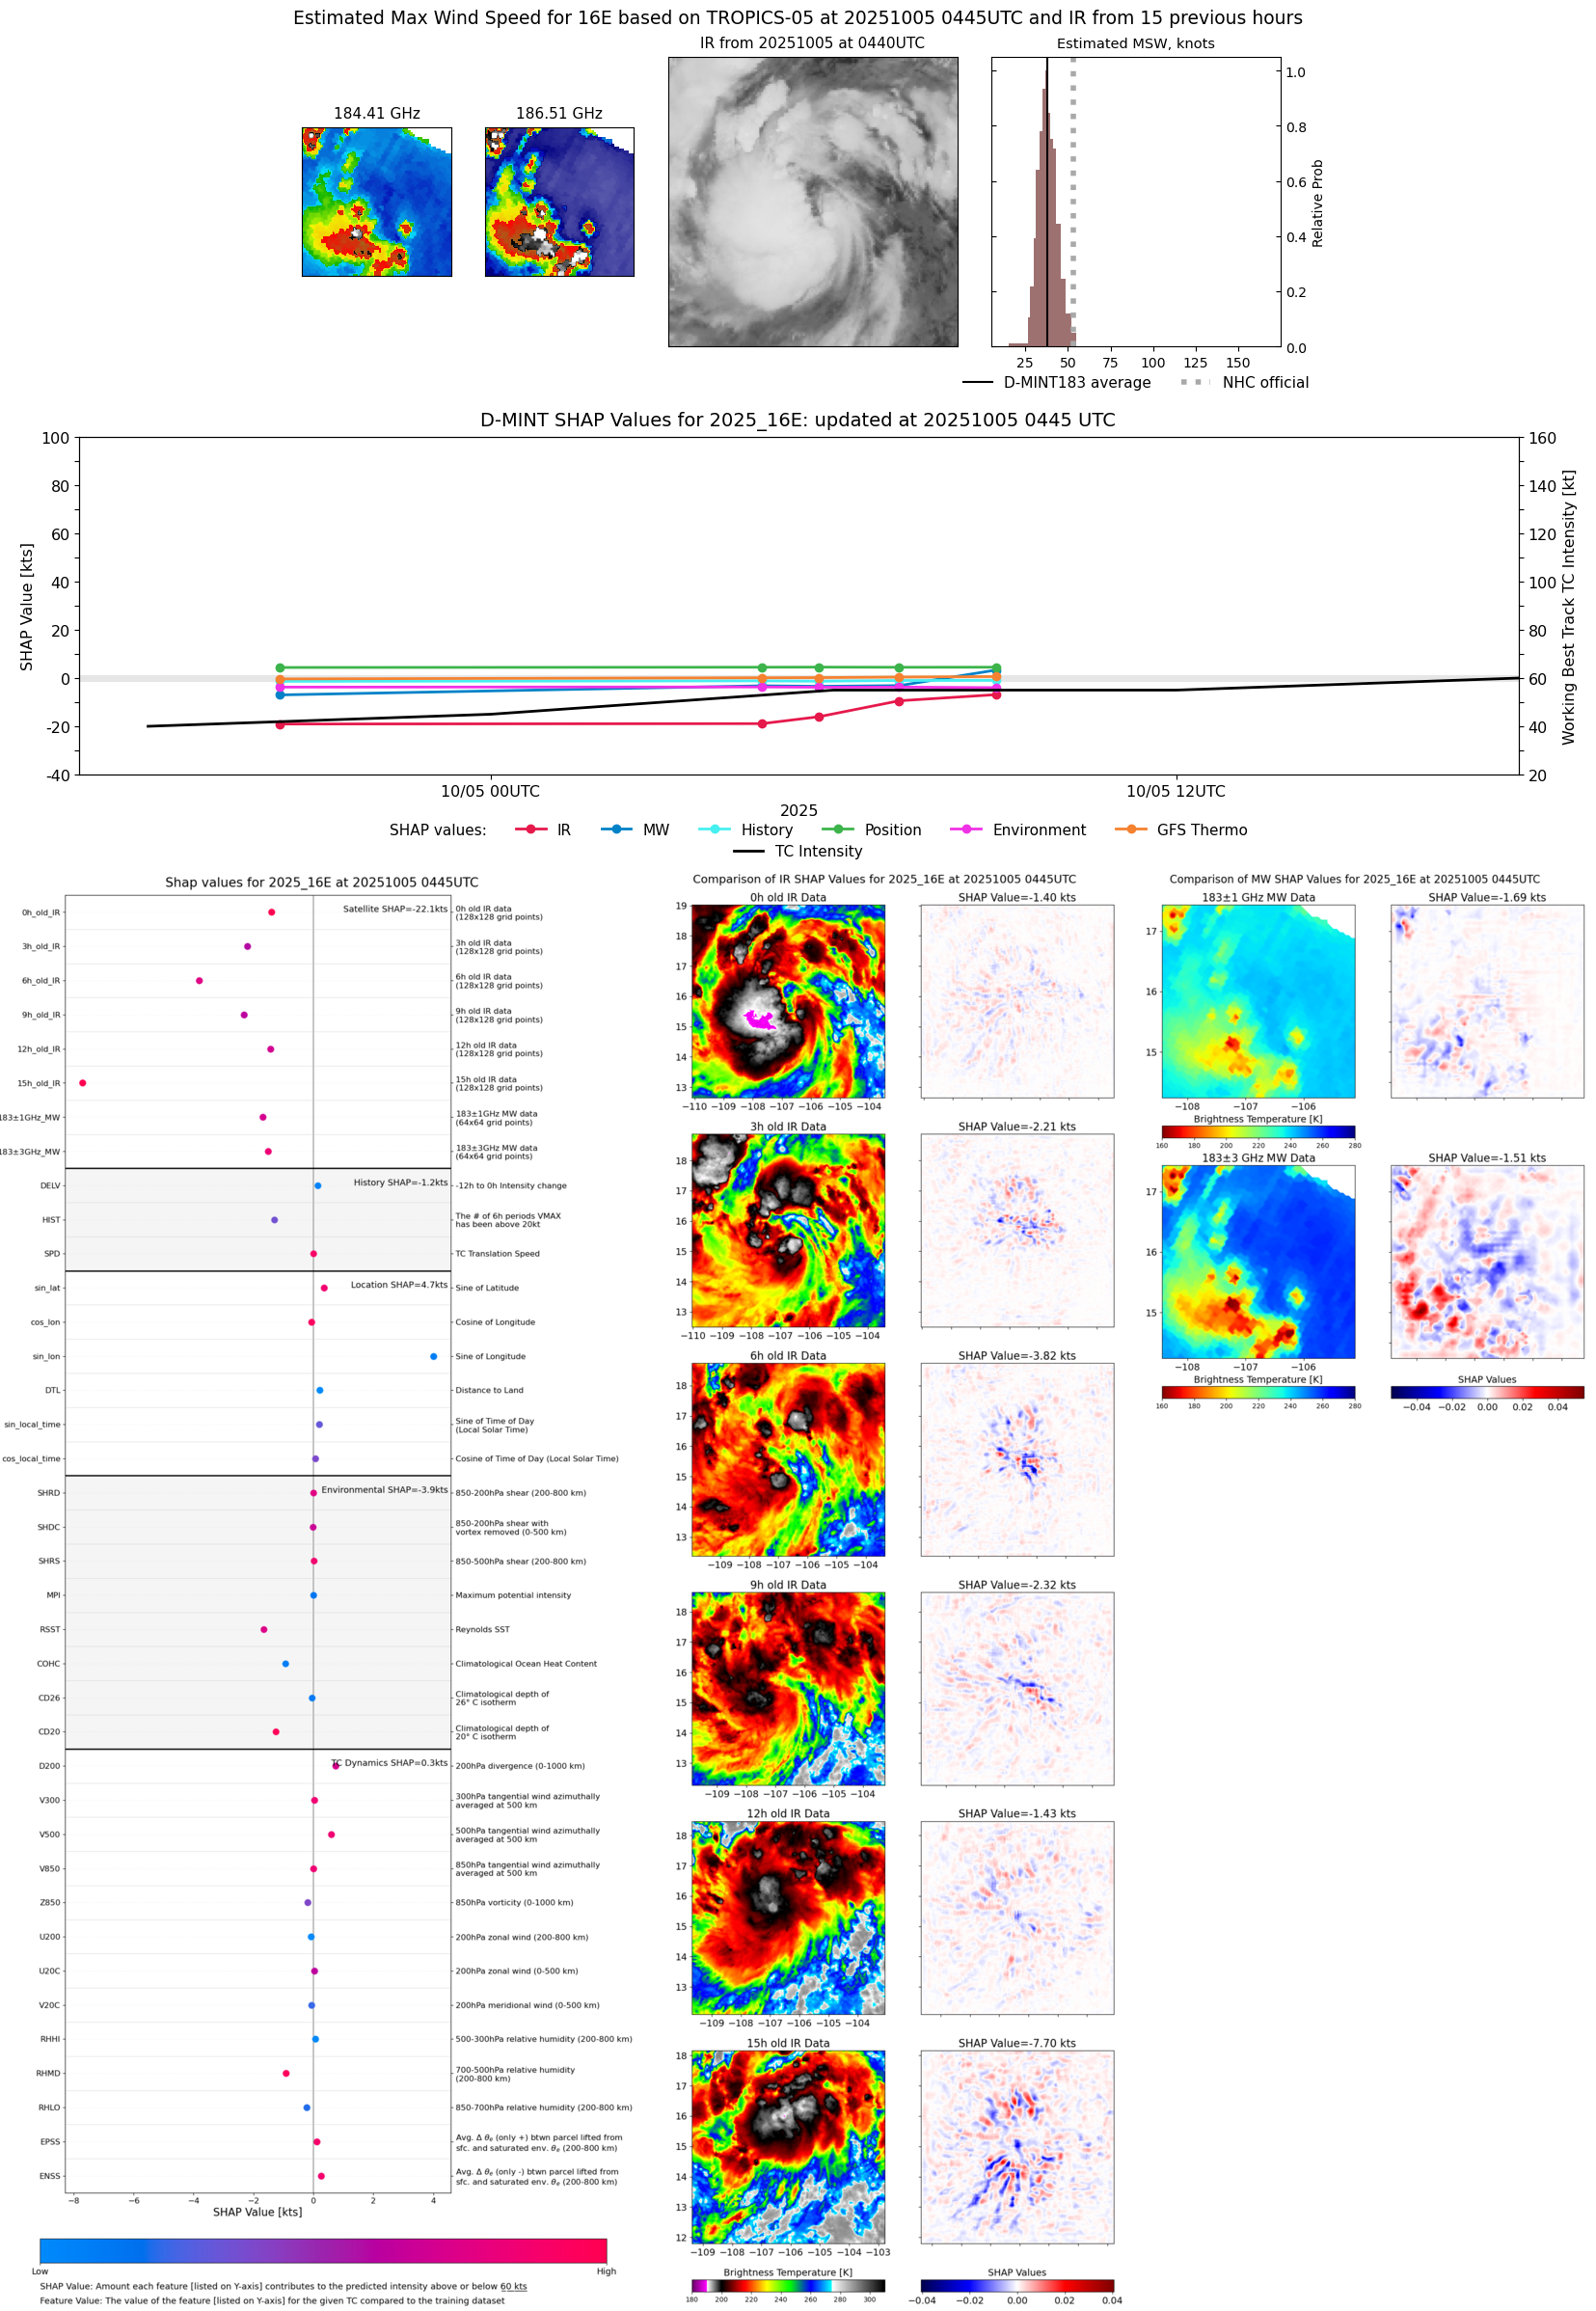 |
| 20251004 | 2303 UTC | GMI | 1001 hPa | 37 kts | 33 kts | 41 kts | 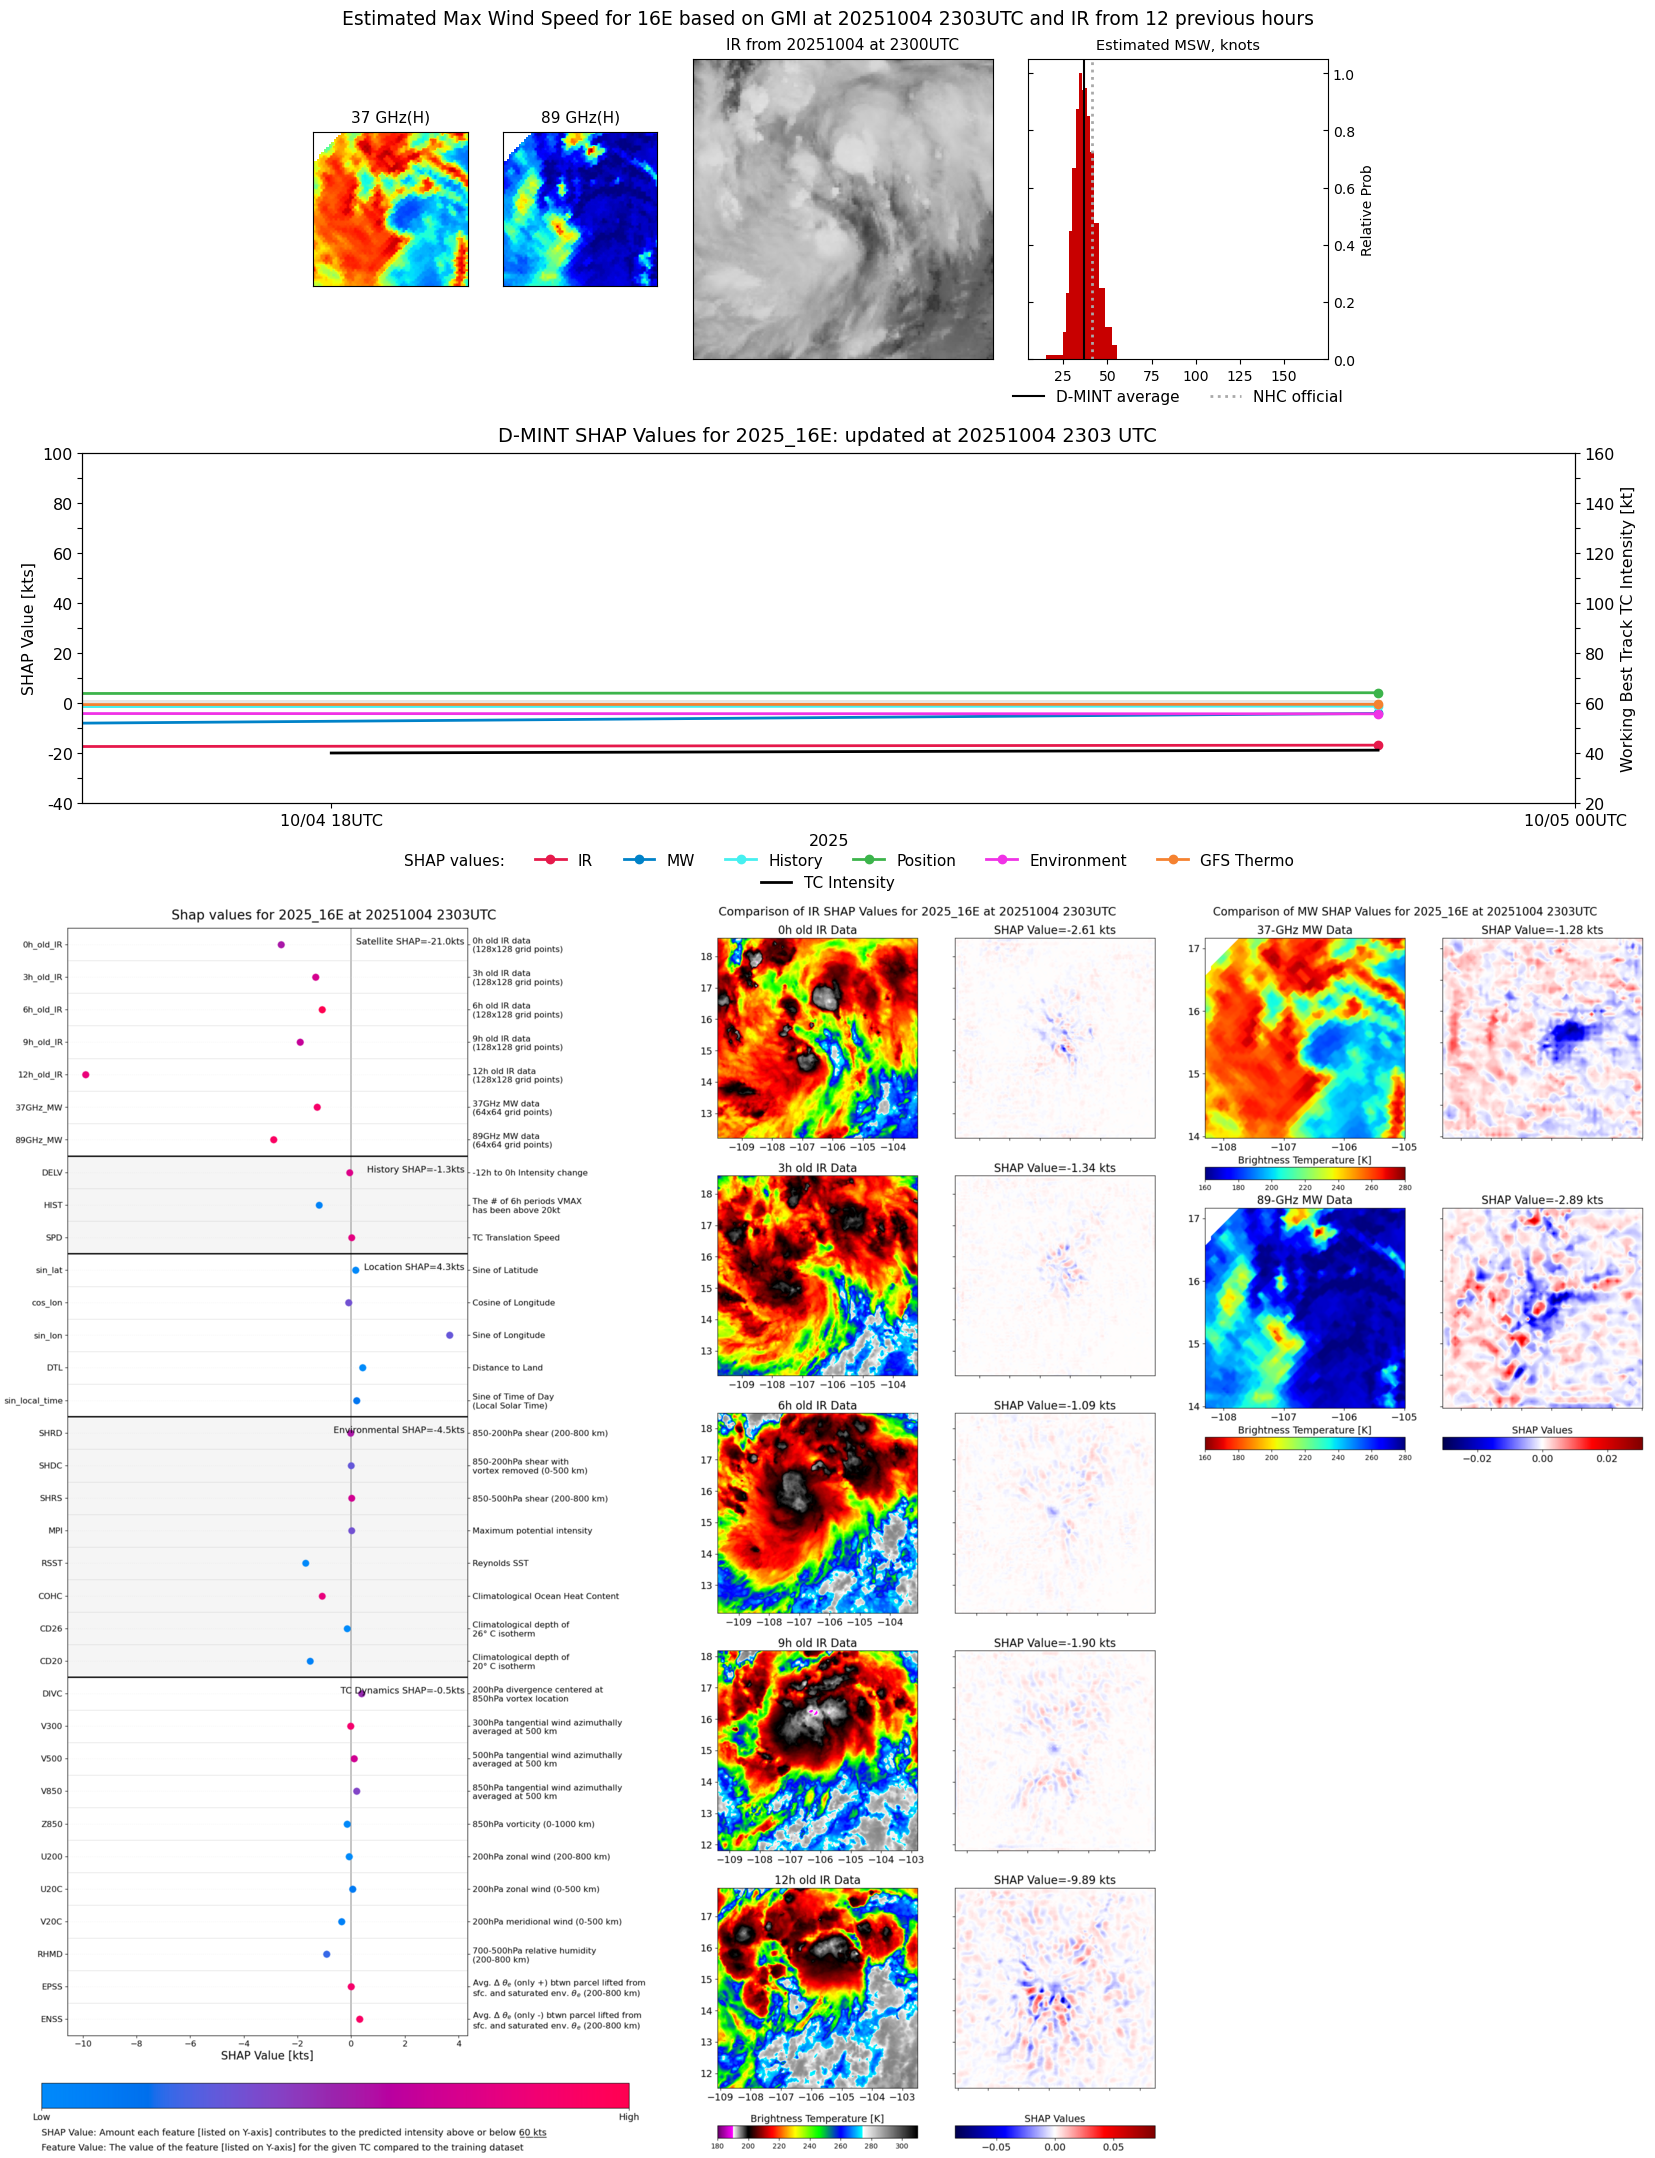 |
| 20251004 | 2018 UTC | ATMS-N20 | 1003 hPa | 33 kts | 30 kts | 37 kts |  |
| 20251004 | 1045 UTC | SSMISF18 | 1005 hPa | 27 kts | 25 kts | 31 kts |  |
| 20251003 | 1218 UTC | GMI | NaN hPa | 25 kts | 22 kts | 27 kts |  |
| 20251003 | 0844 UTC | AMSR2 | NaN hPa | 24 kts | 21 kts | 27 kts | 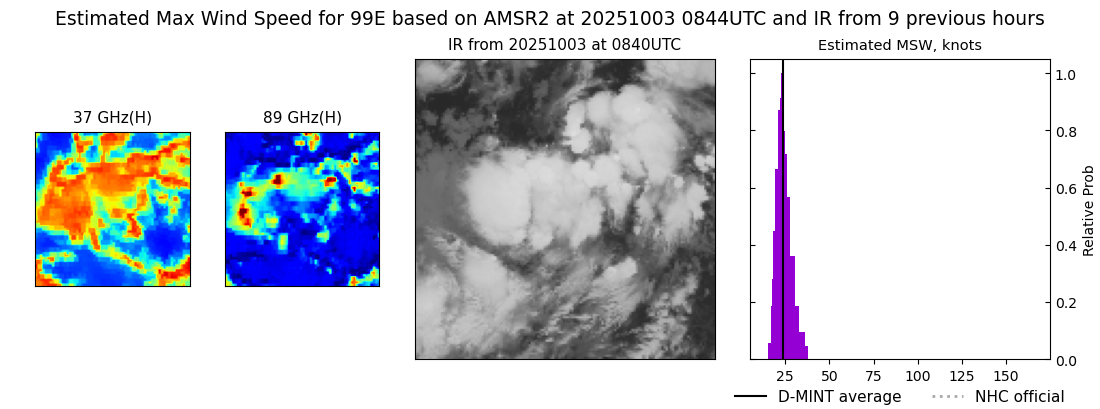 |
| 20251002 | 2030 UTC | AMSR2 | NaN hPa | 24 kts | 22 kts | 26 kts | 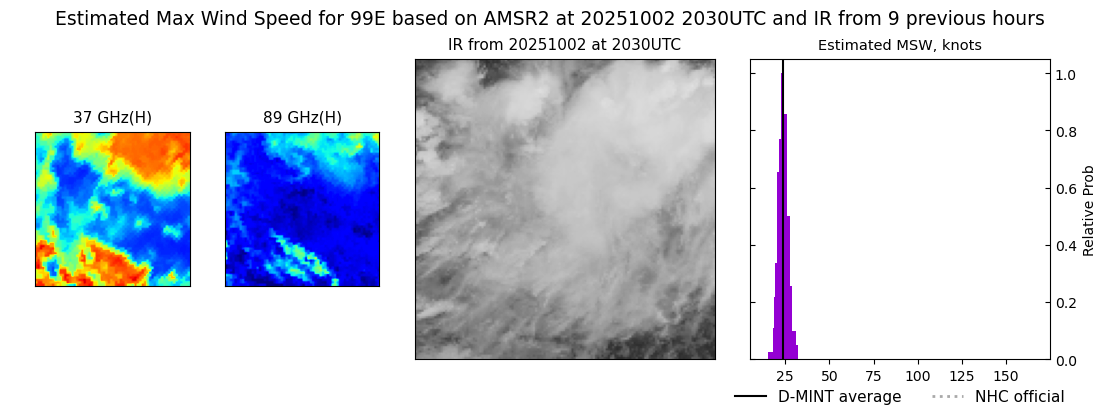 |