|
||

 |
D-MINT HISTORY FILE for 2025_17E
| Date | Time | MW Sensor | MSLP | Vmax (30th-70th percentile average) | Vmax 25th percentile | Vmax 75th percentile | Image |
| 20251012 | 1048 UTC | GMI | 1005 hPa | 29 kts | 26 kts | 33 kts | 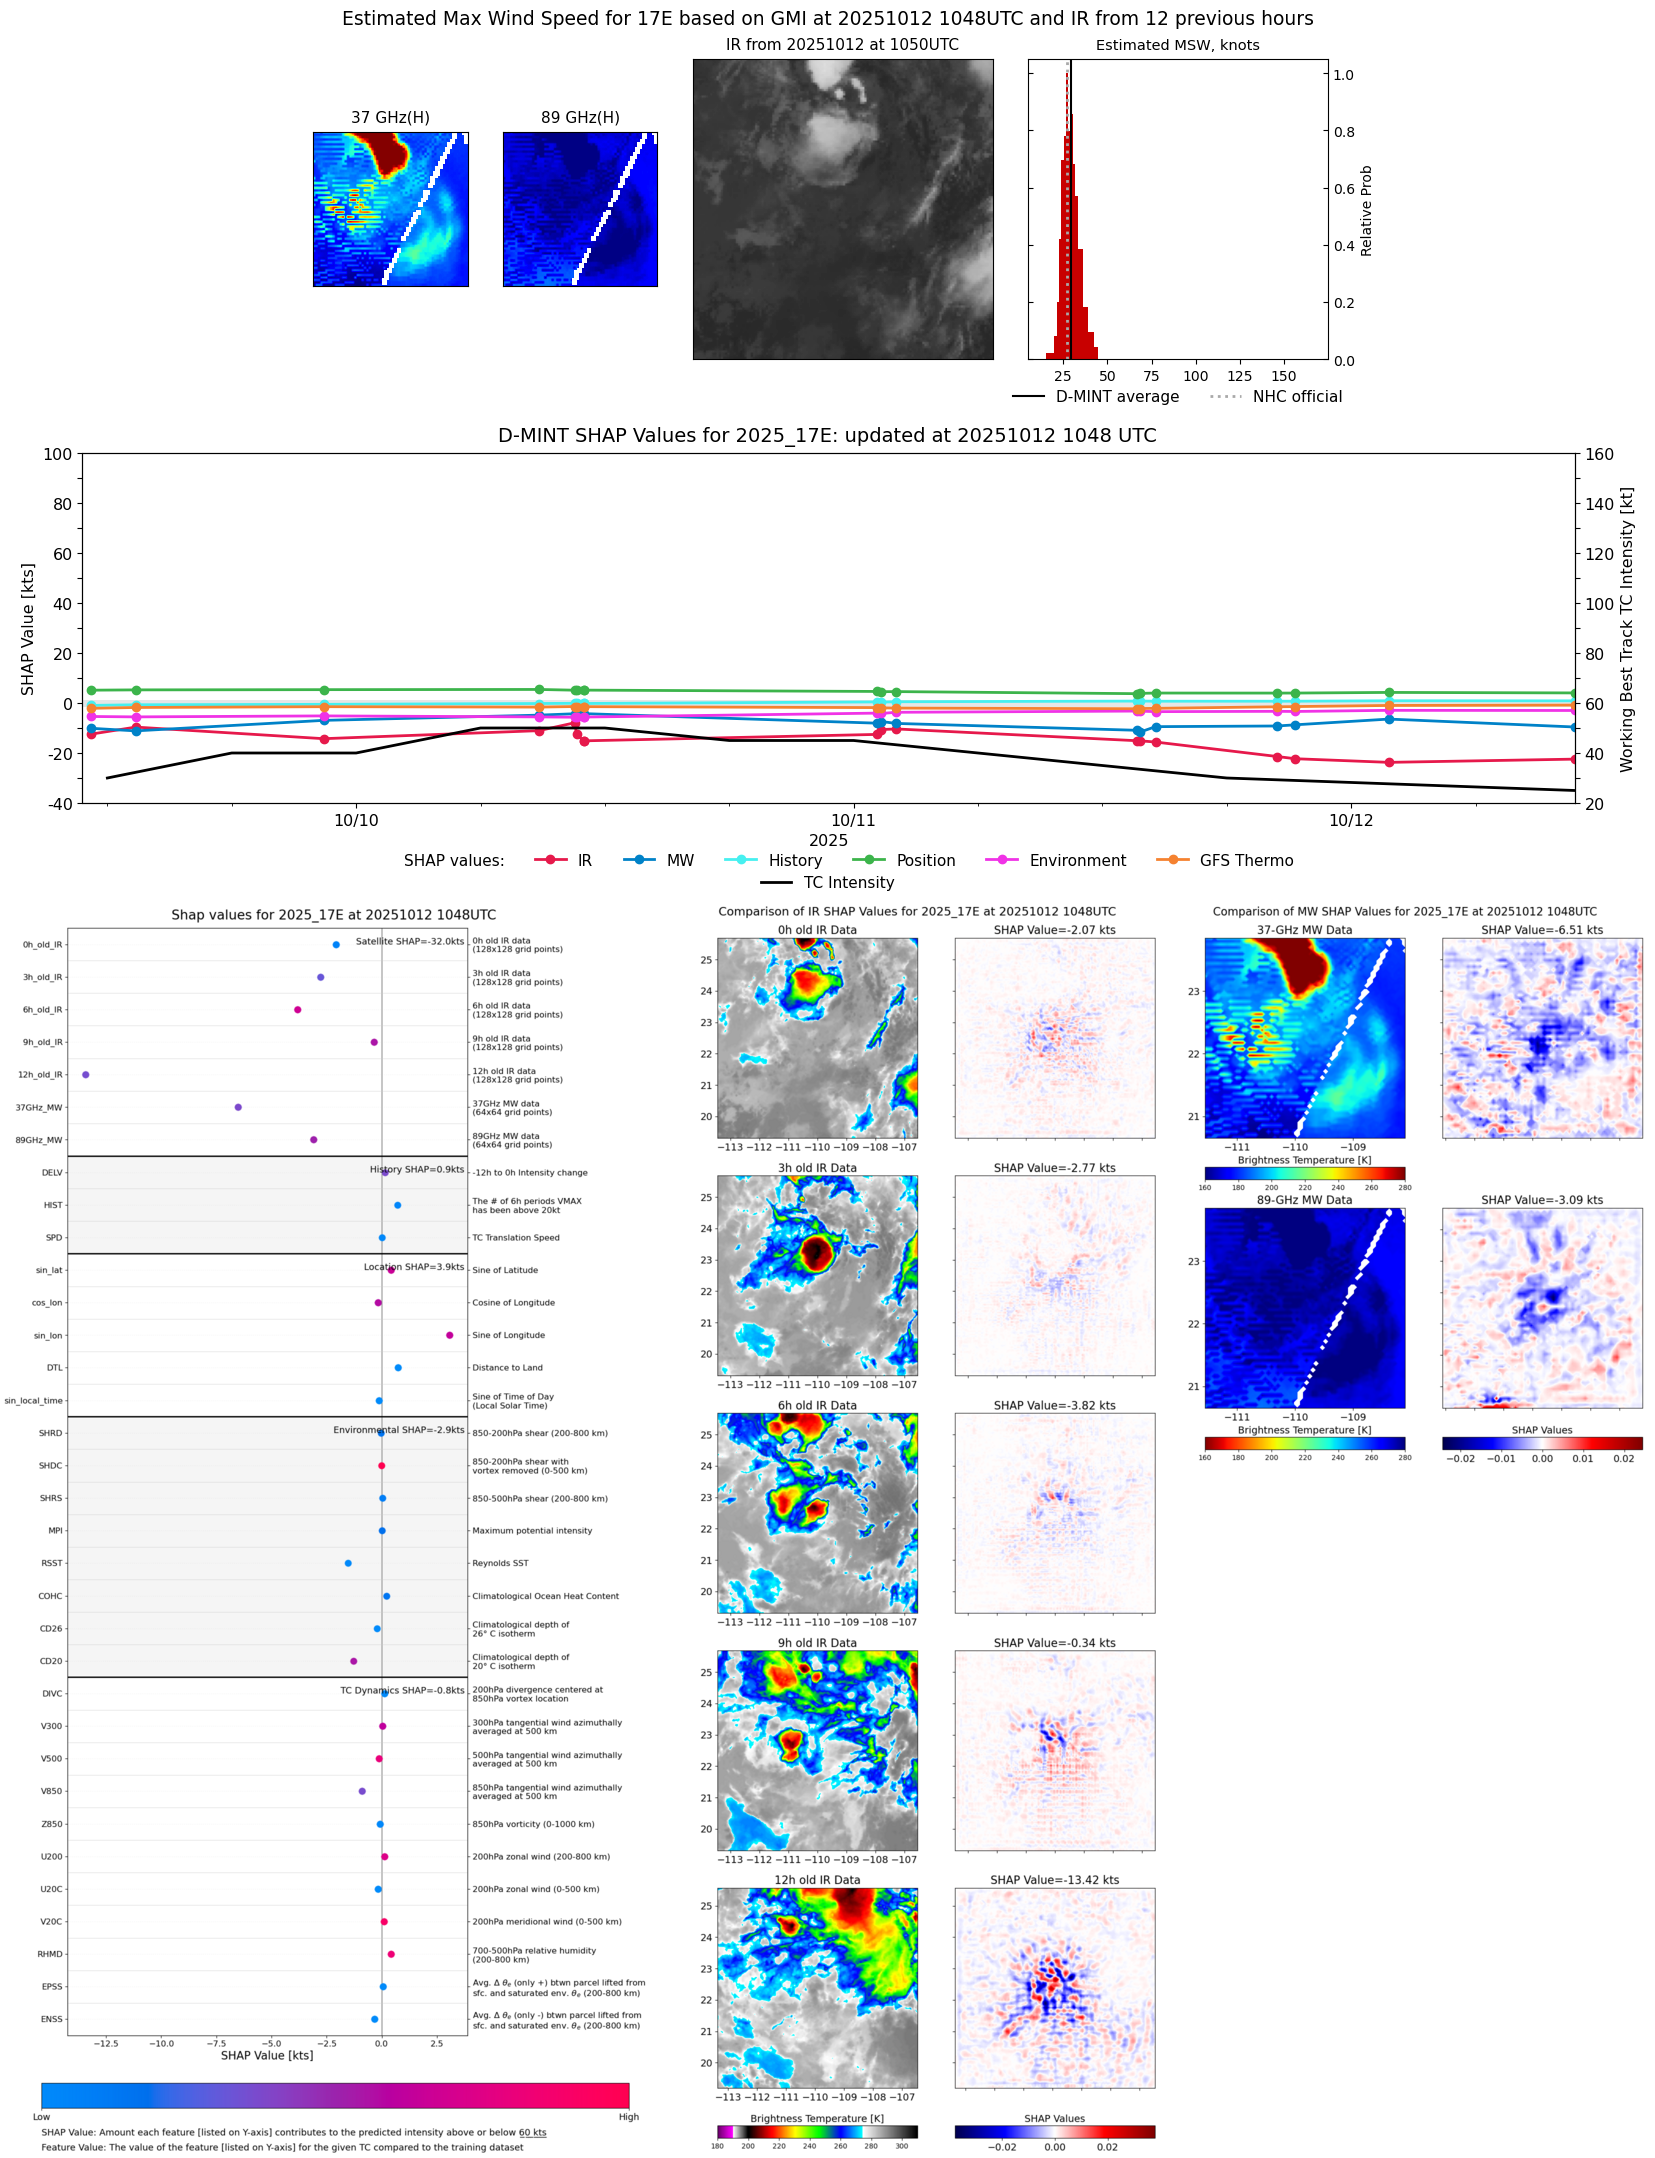 |
| 20251012 | 0149 UTC | SSMISF16 | 1004 hPa | 31 kts | 28 kts | 35 kts | 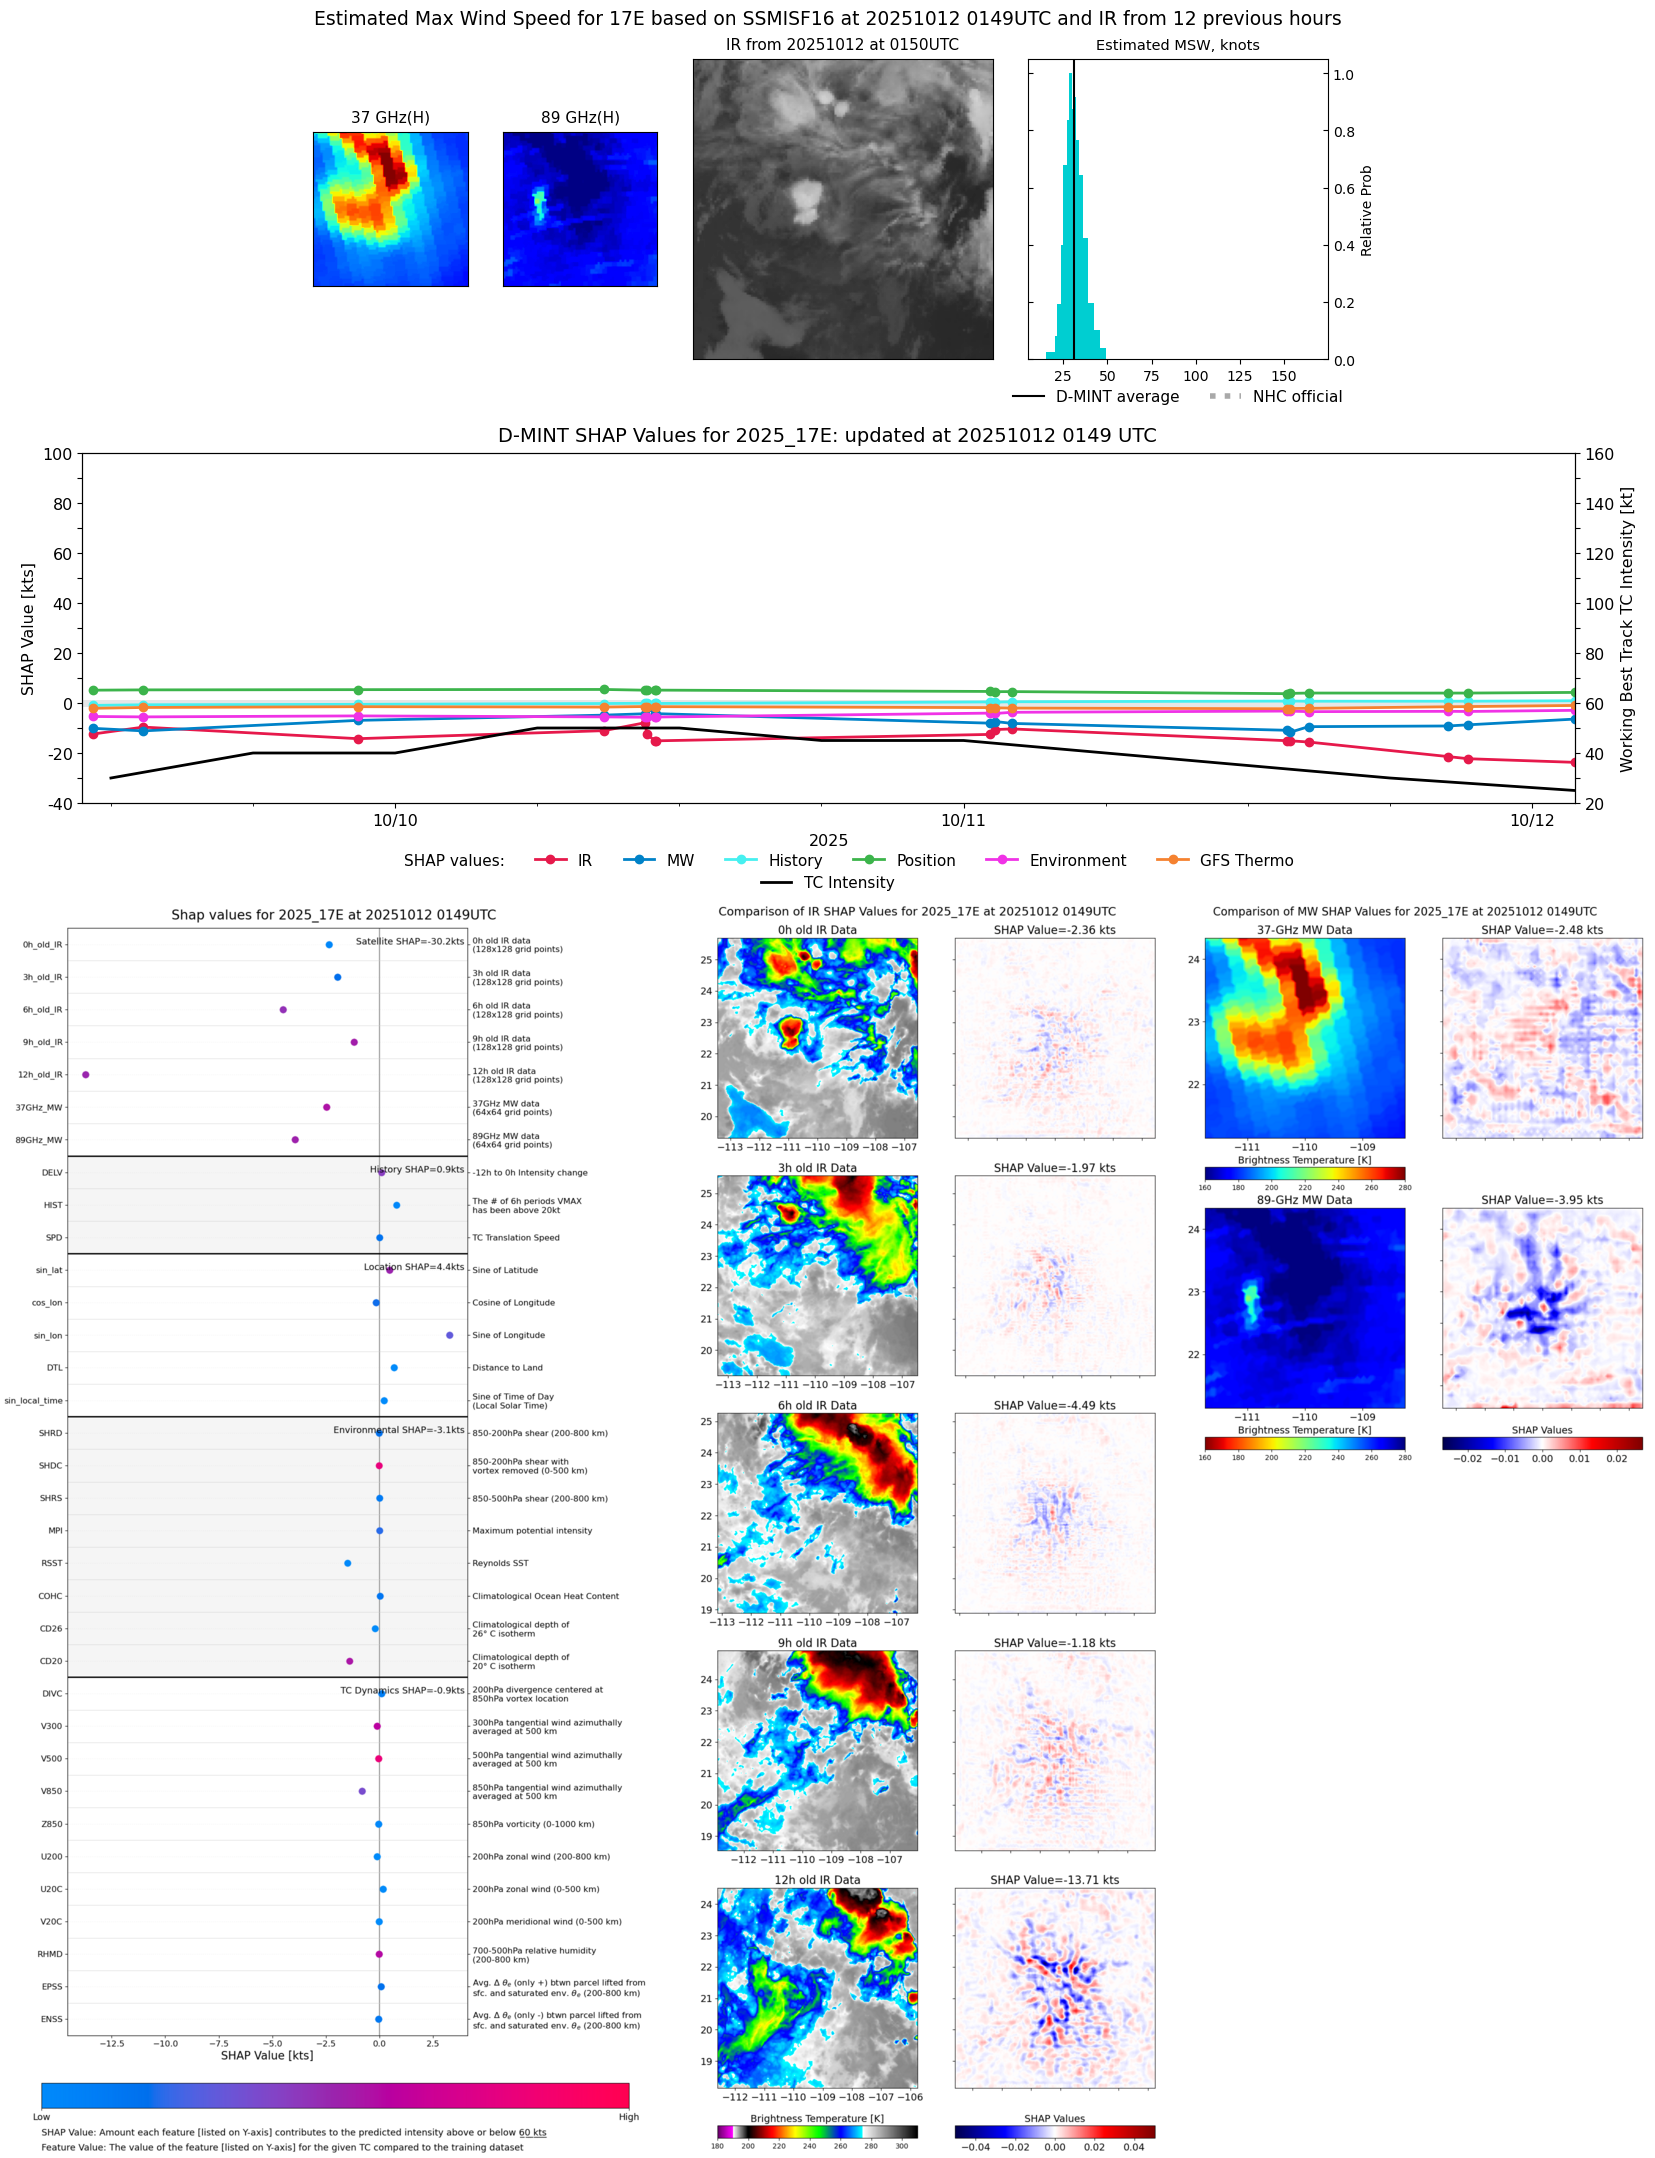 |
| 20251012 | 0054 UTC | SSMISF17 | 1004 hPa | 31 kts | 28 kts | 35 kts | 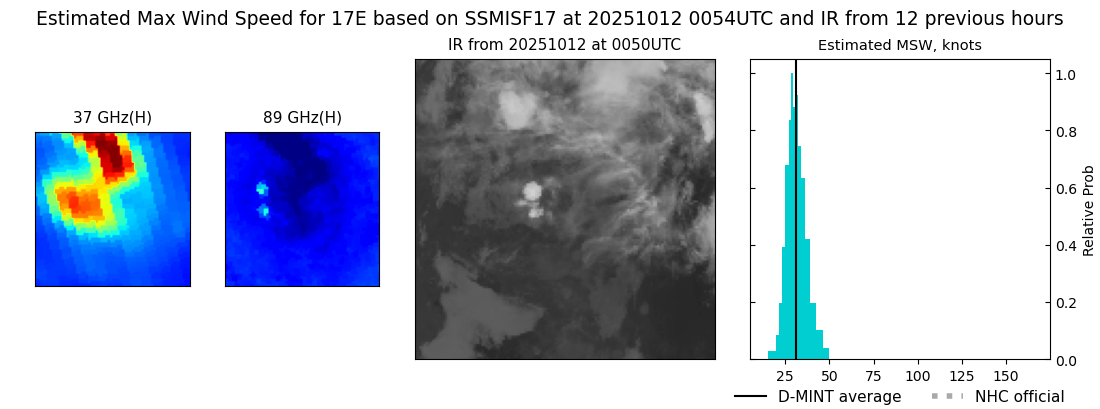 |
| 20251011 | 2118 UTC | GMI | 1005 hPa | 29 kts | 26 kts | 32 kts |  |
| 20251011 | 2040 UTC | ATMS-N21 | 1003 hPa | 32 kts | 29 kts | 36 kts | 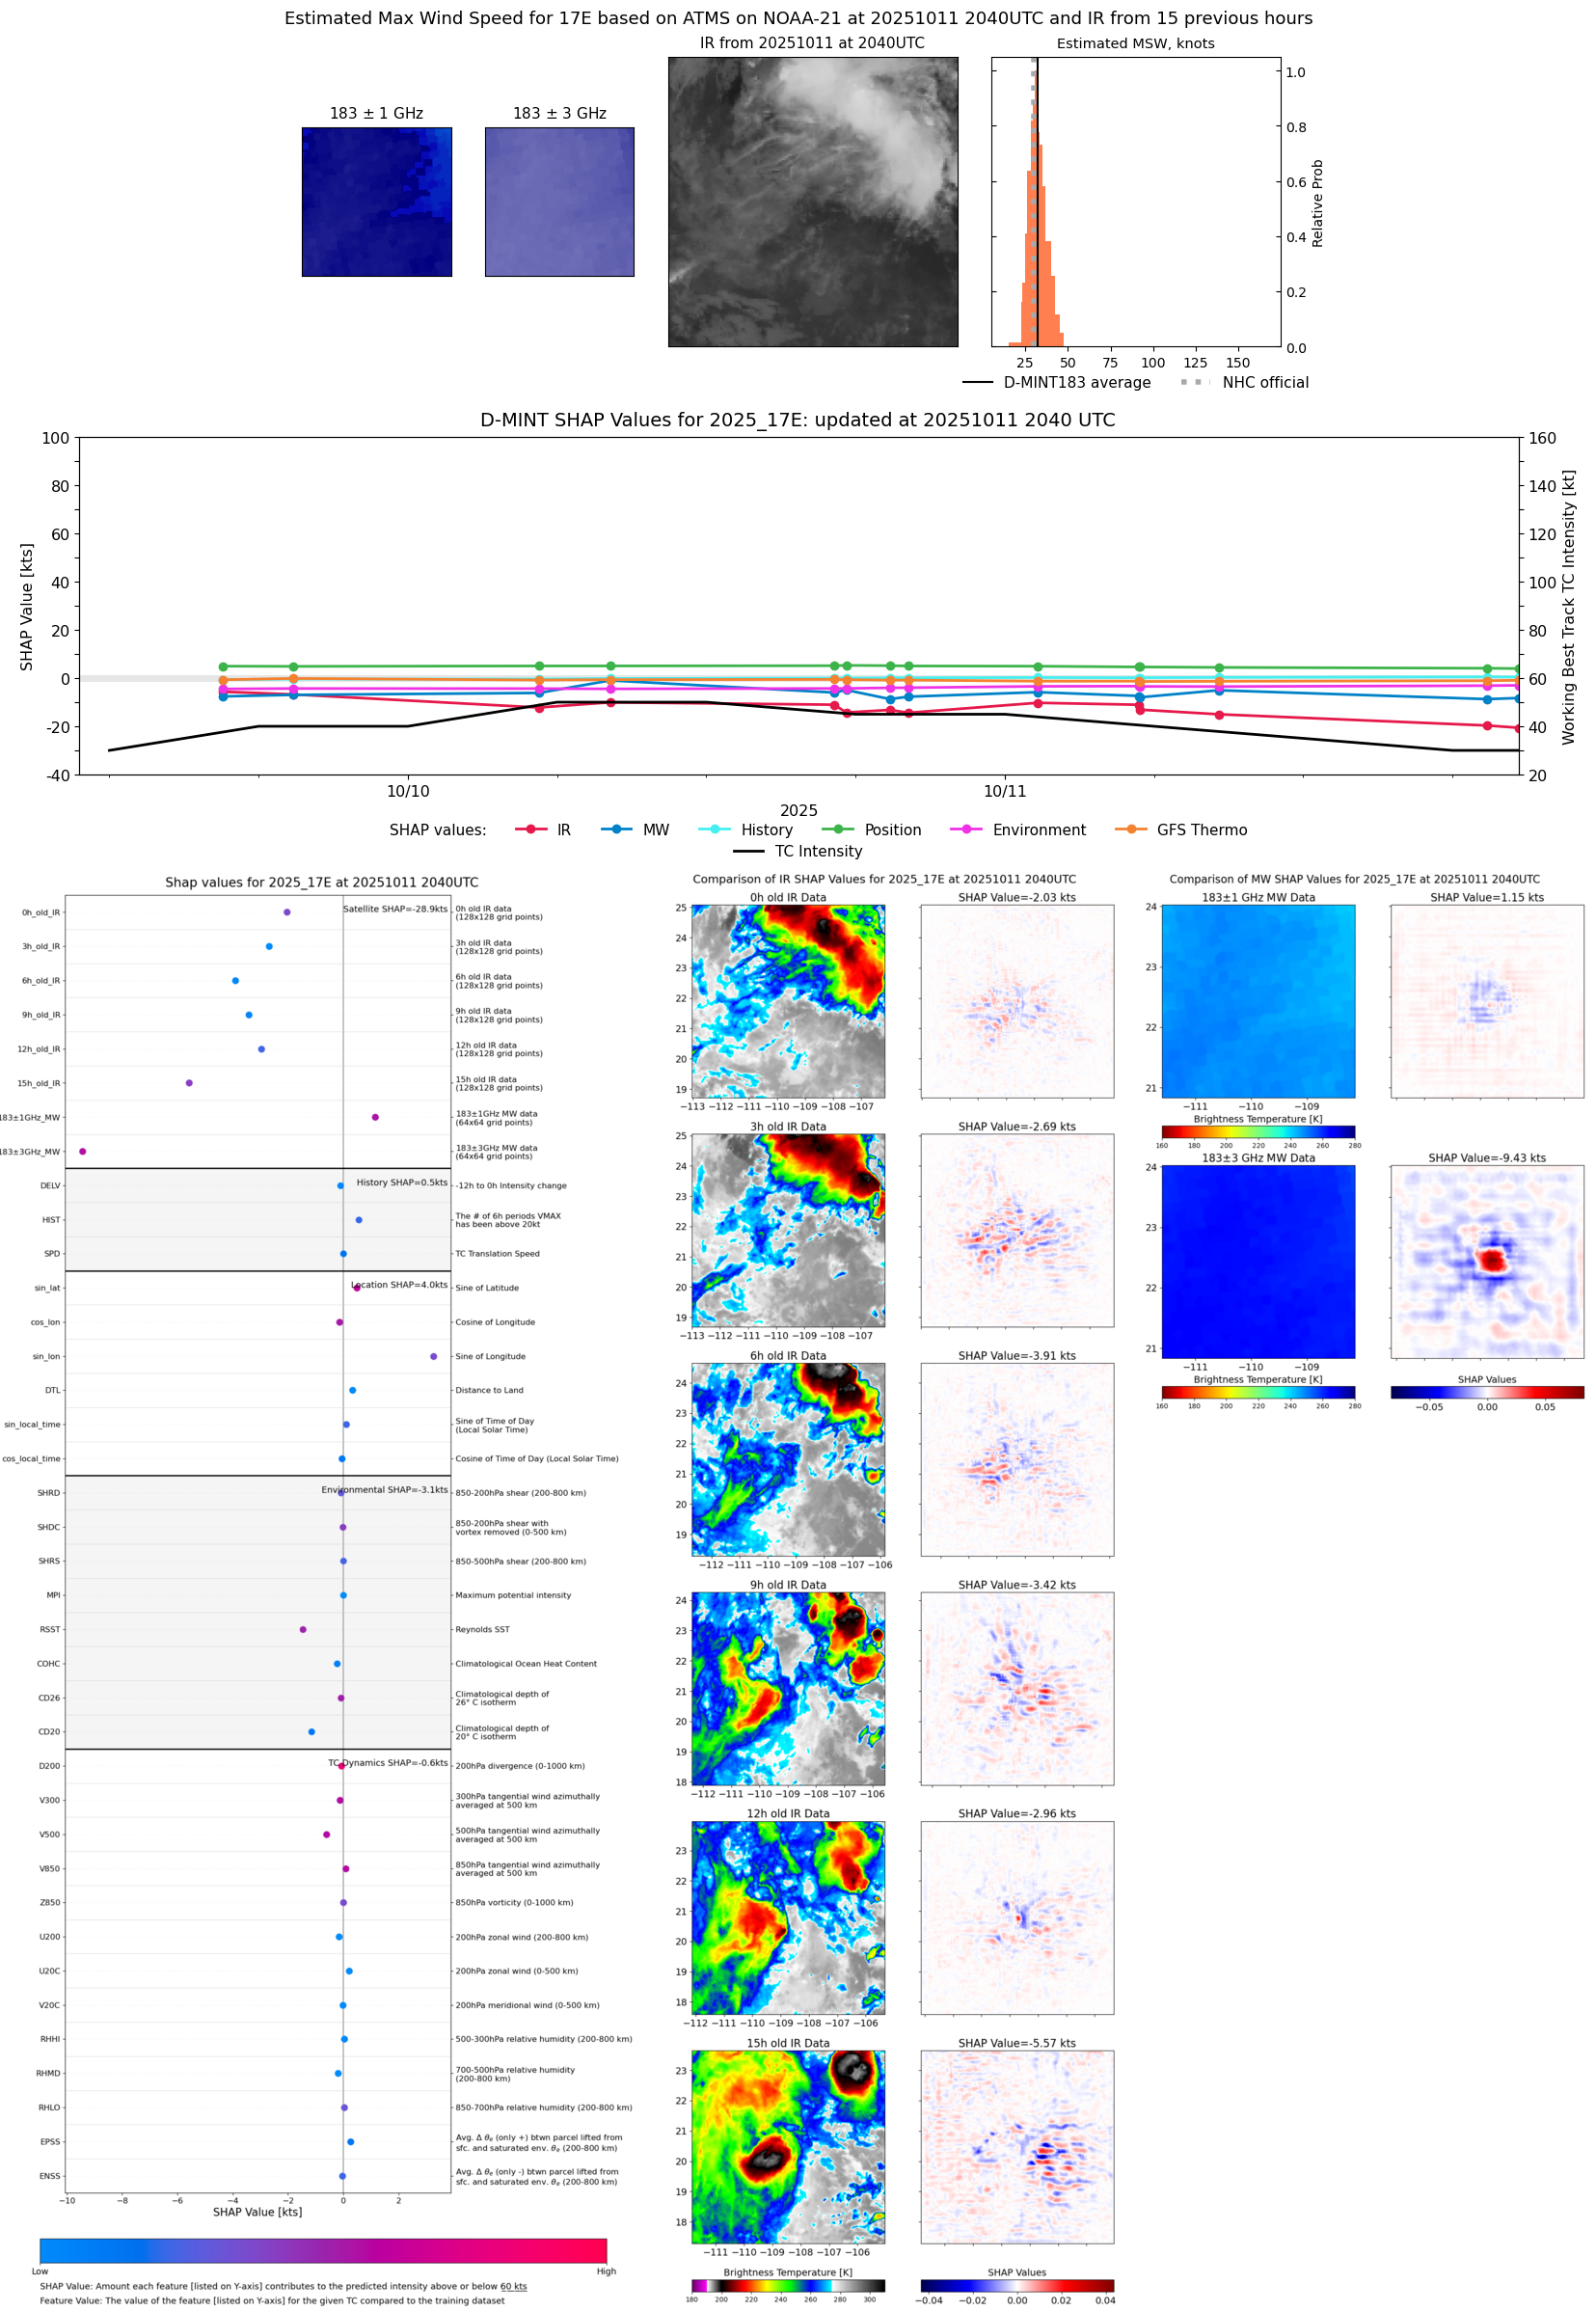 |
| 20251011 | 2026 UTC | AMSR2 | 1004 hPa | 29 kts | 26 kts | 33 kts | 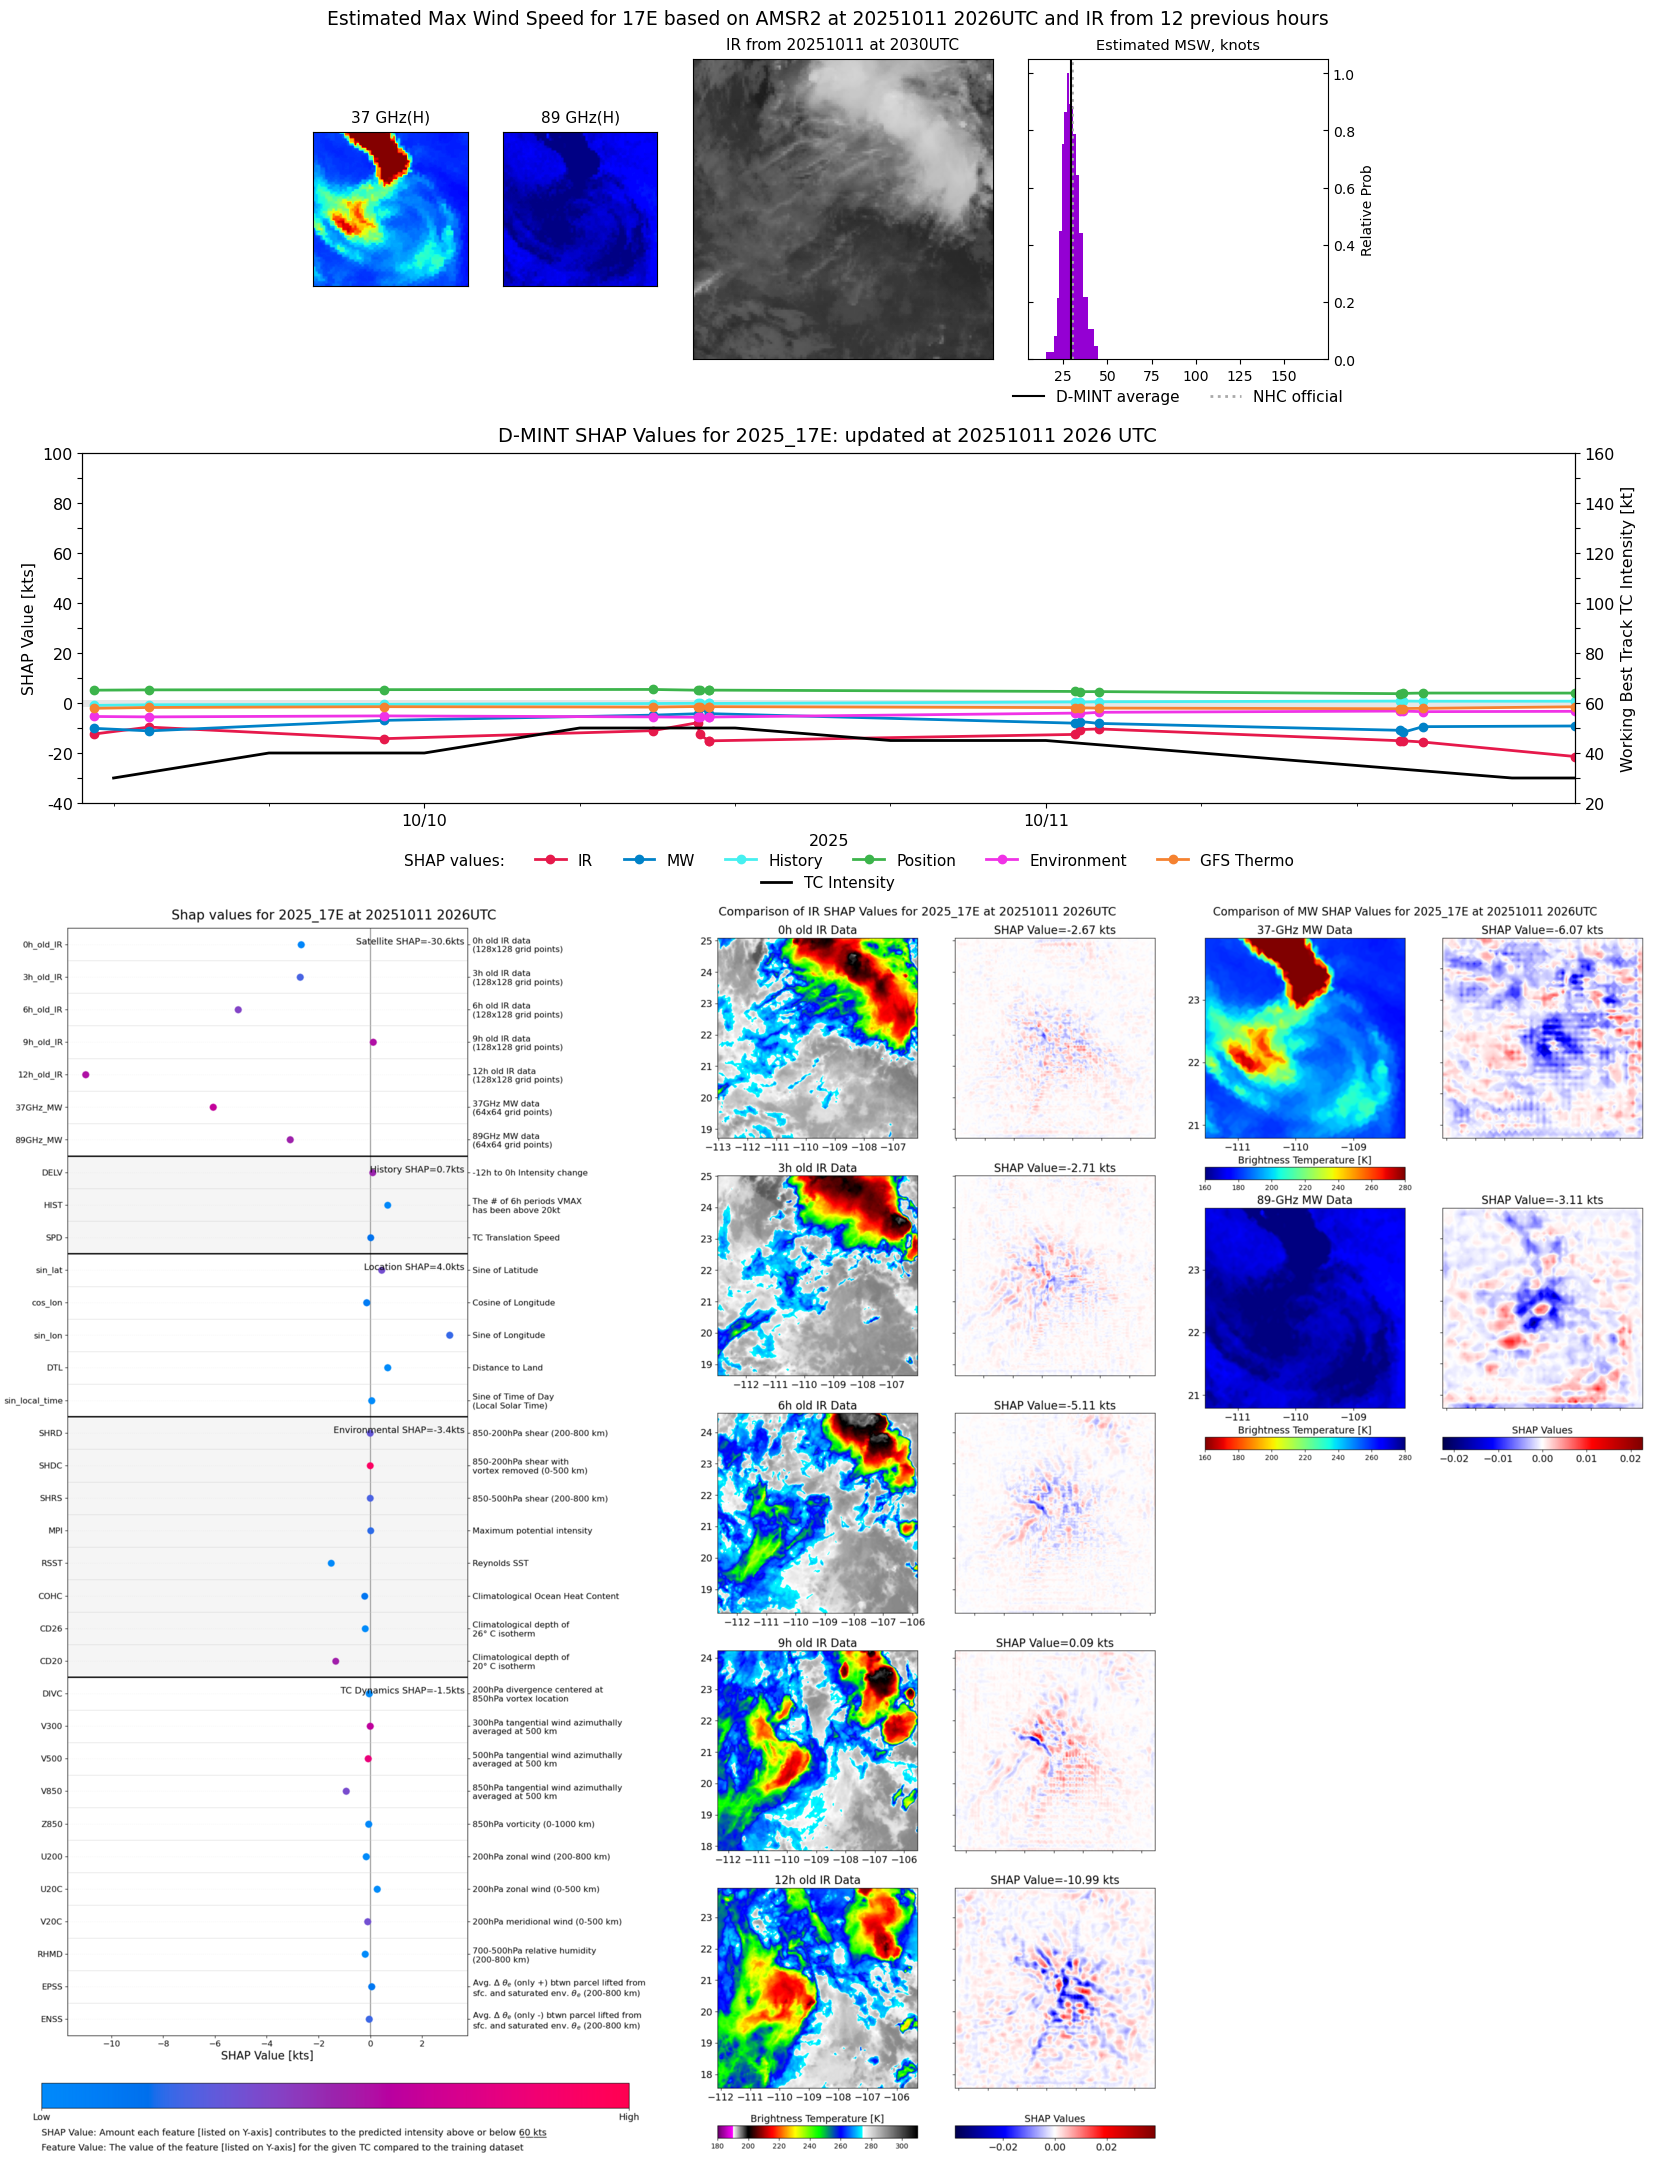 |
| 20251011 | 1924 UTC | TMS07 | 1003 hPa | 32 kts | 29 kts | 37 kts | 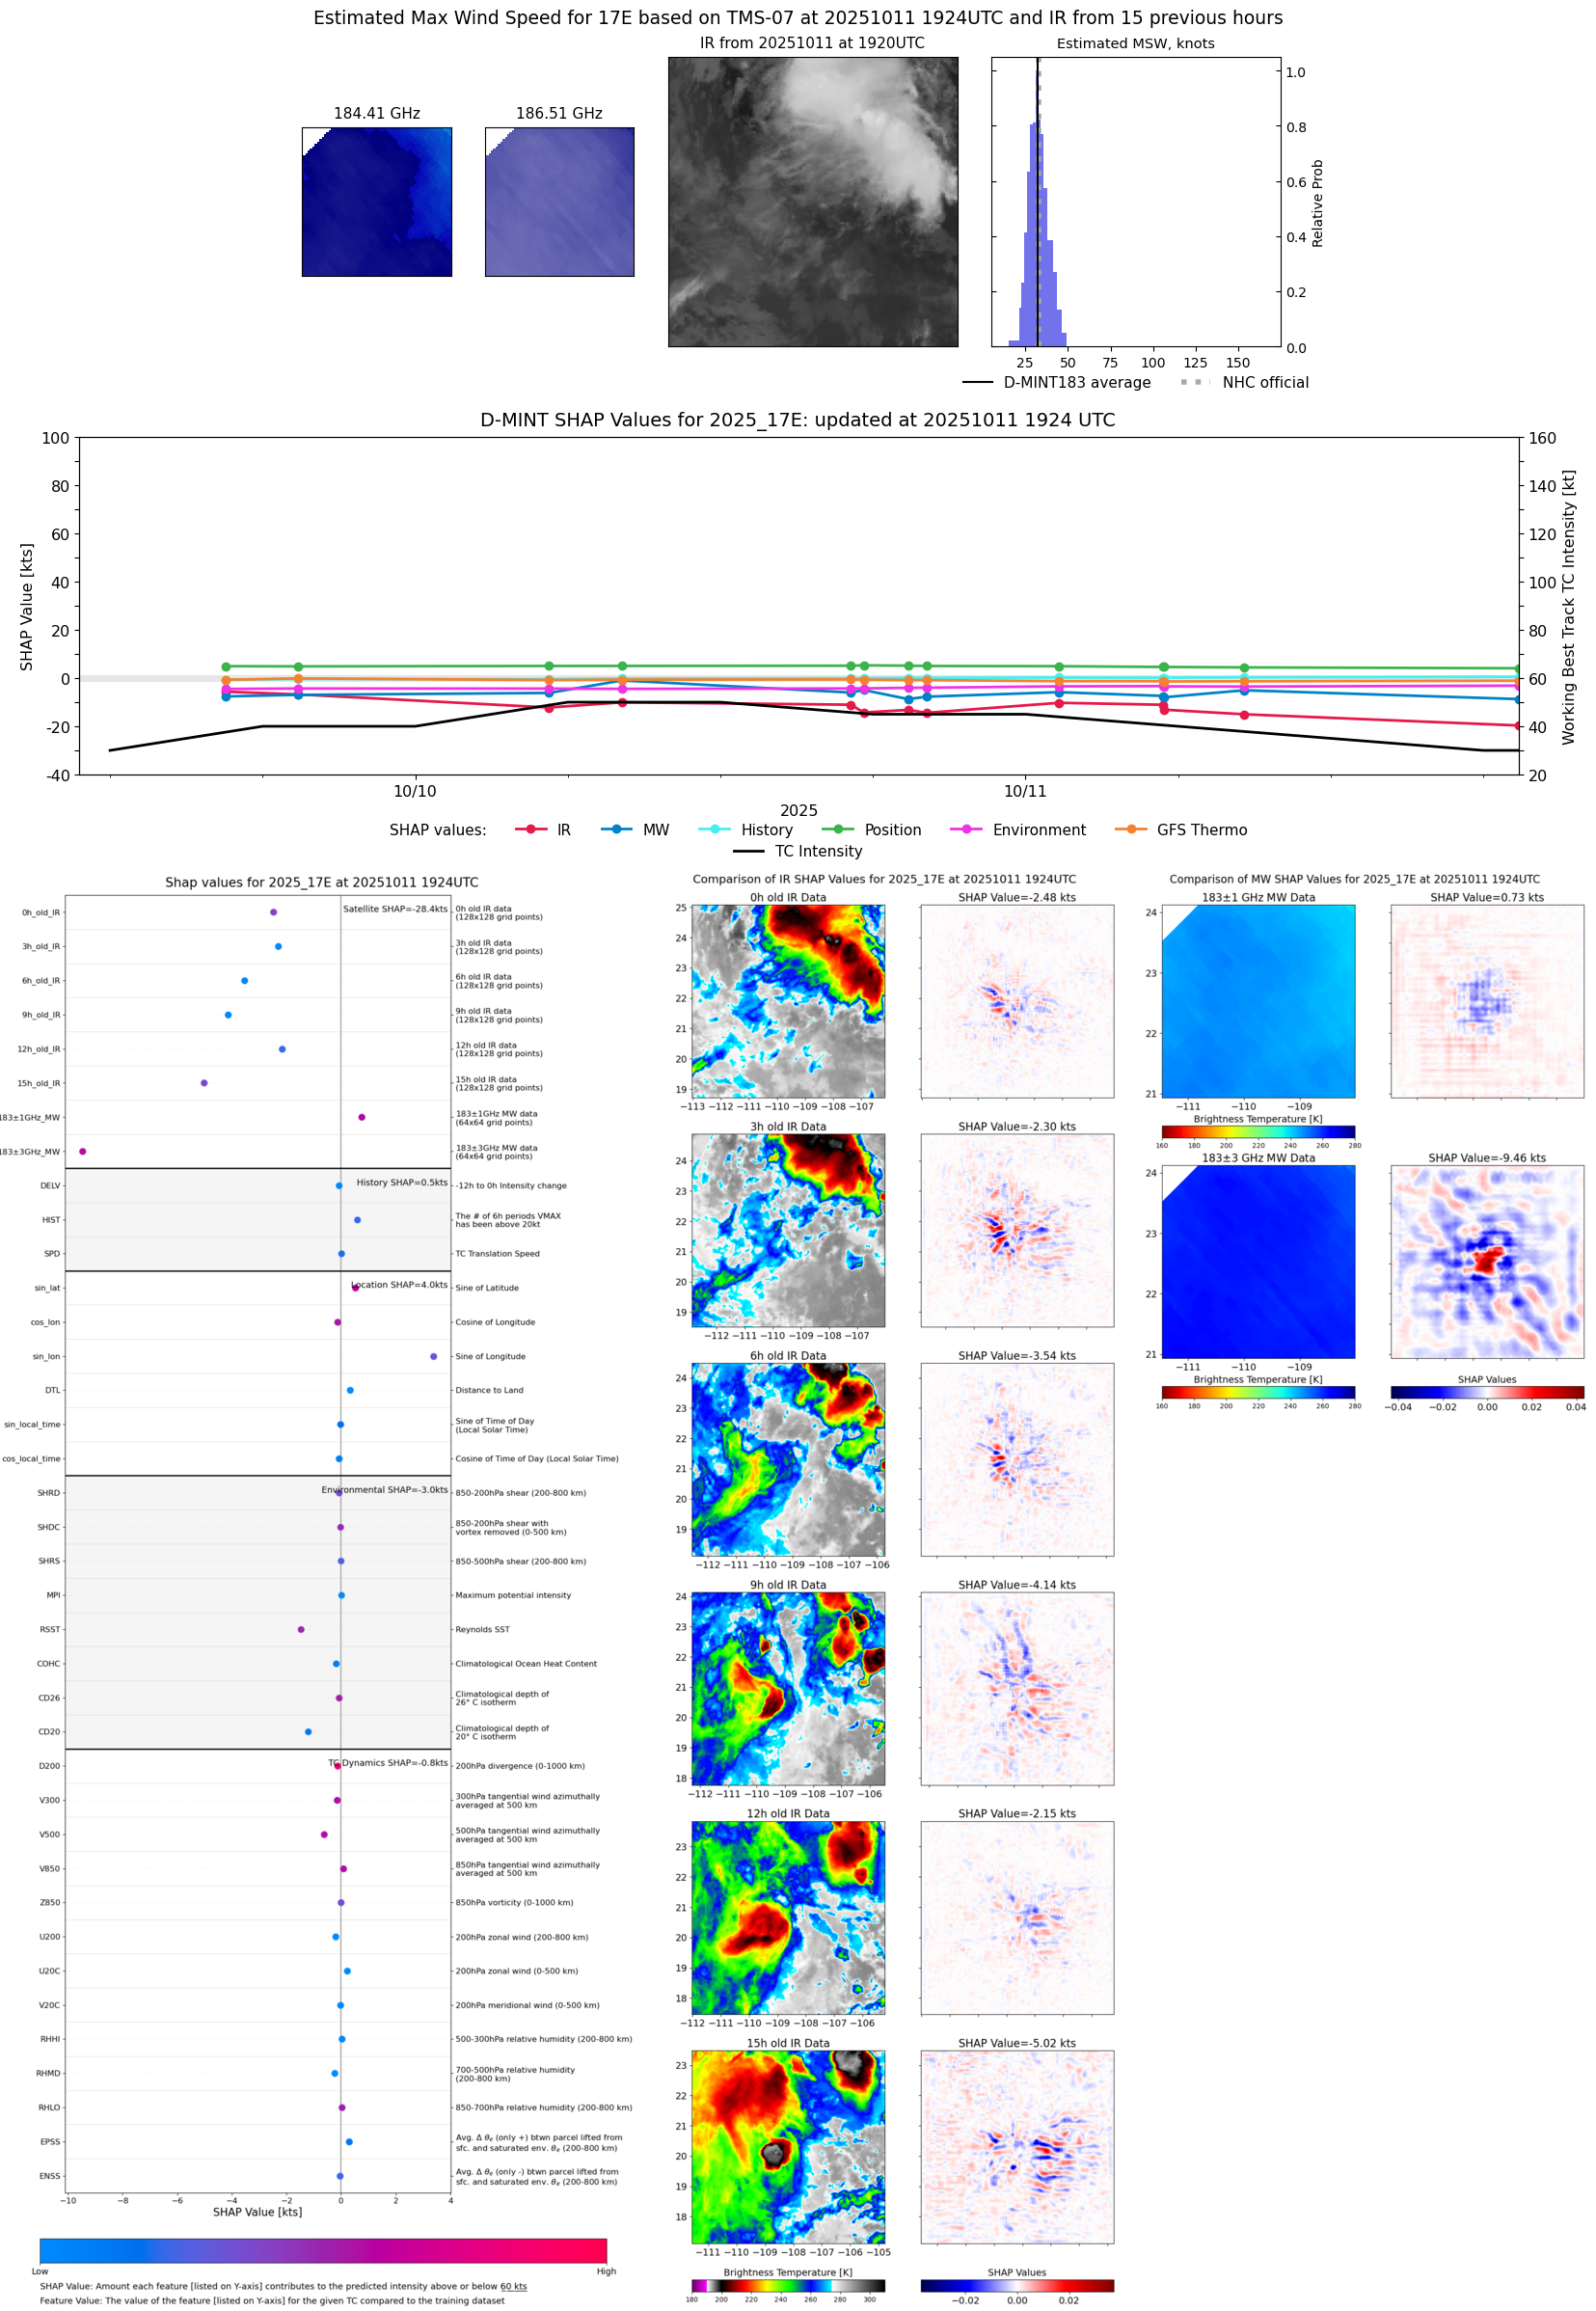 |
| 20251011 | 1434 UTC | SSMISF16 | 1004 hPa | 34 kts | 30 kts | 39 kts | 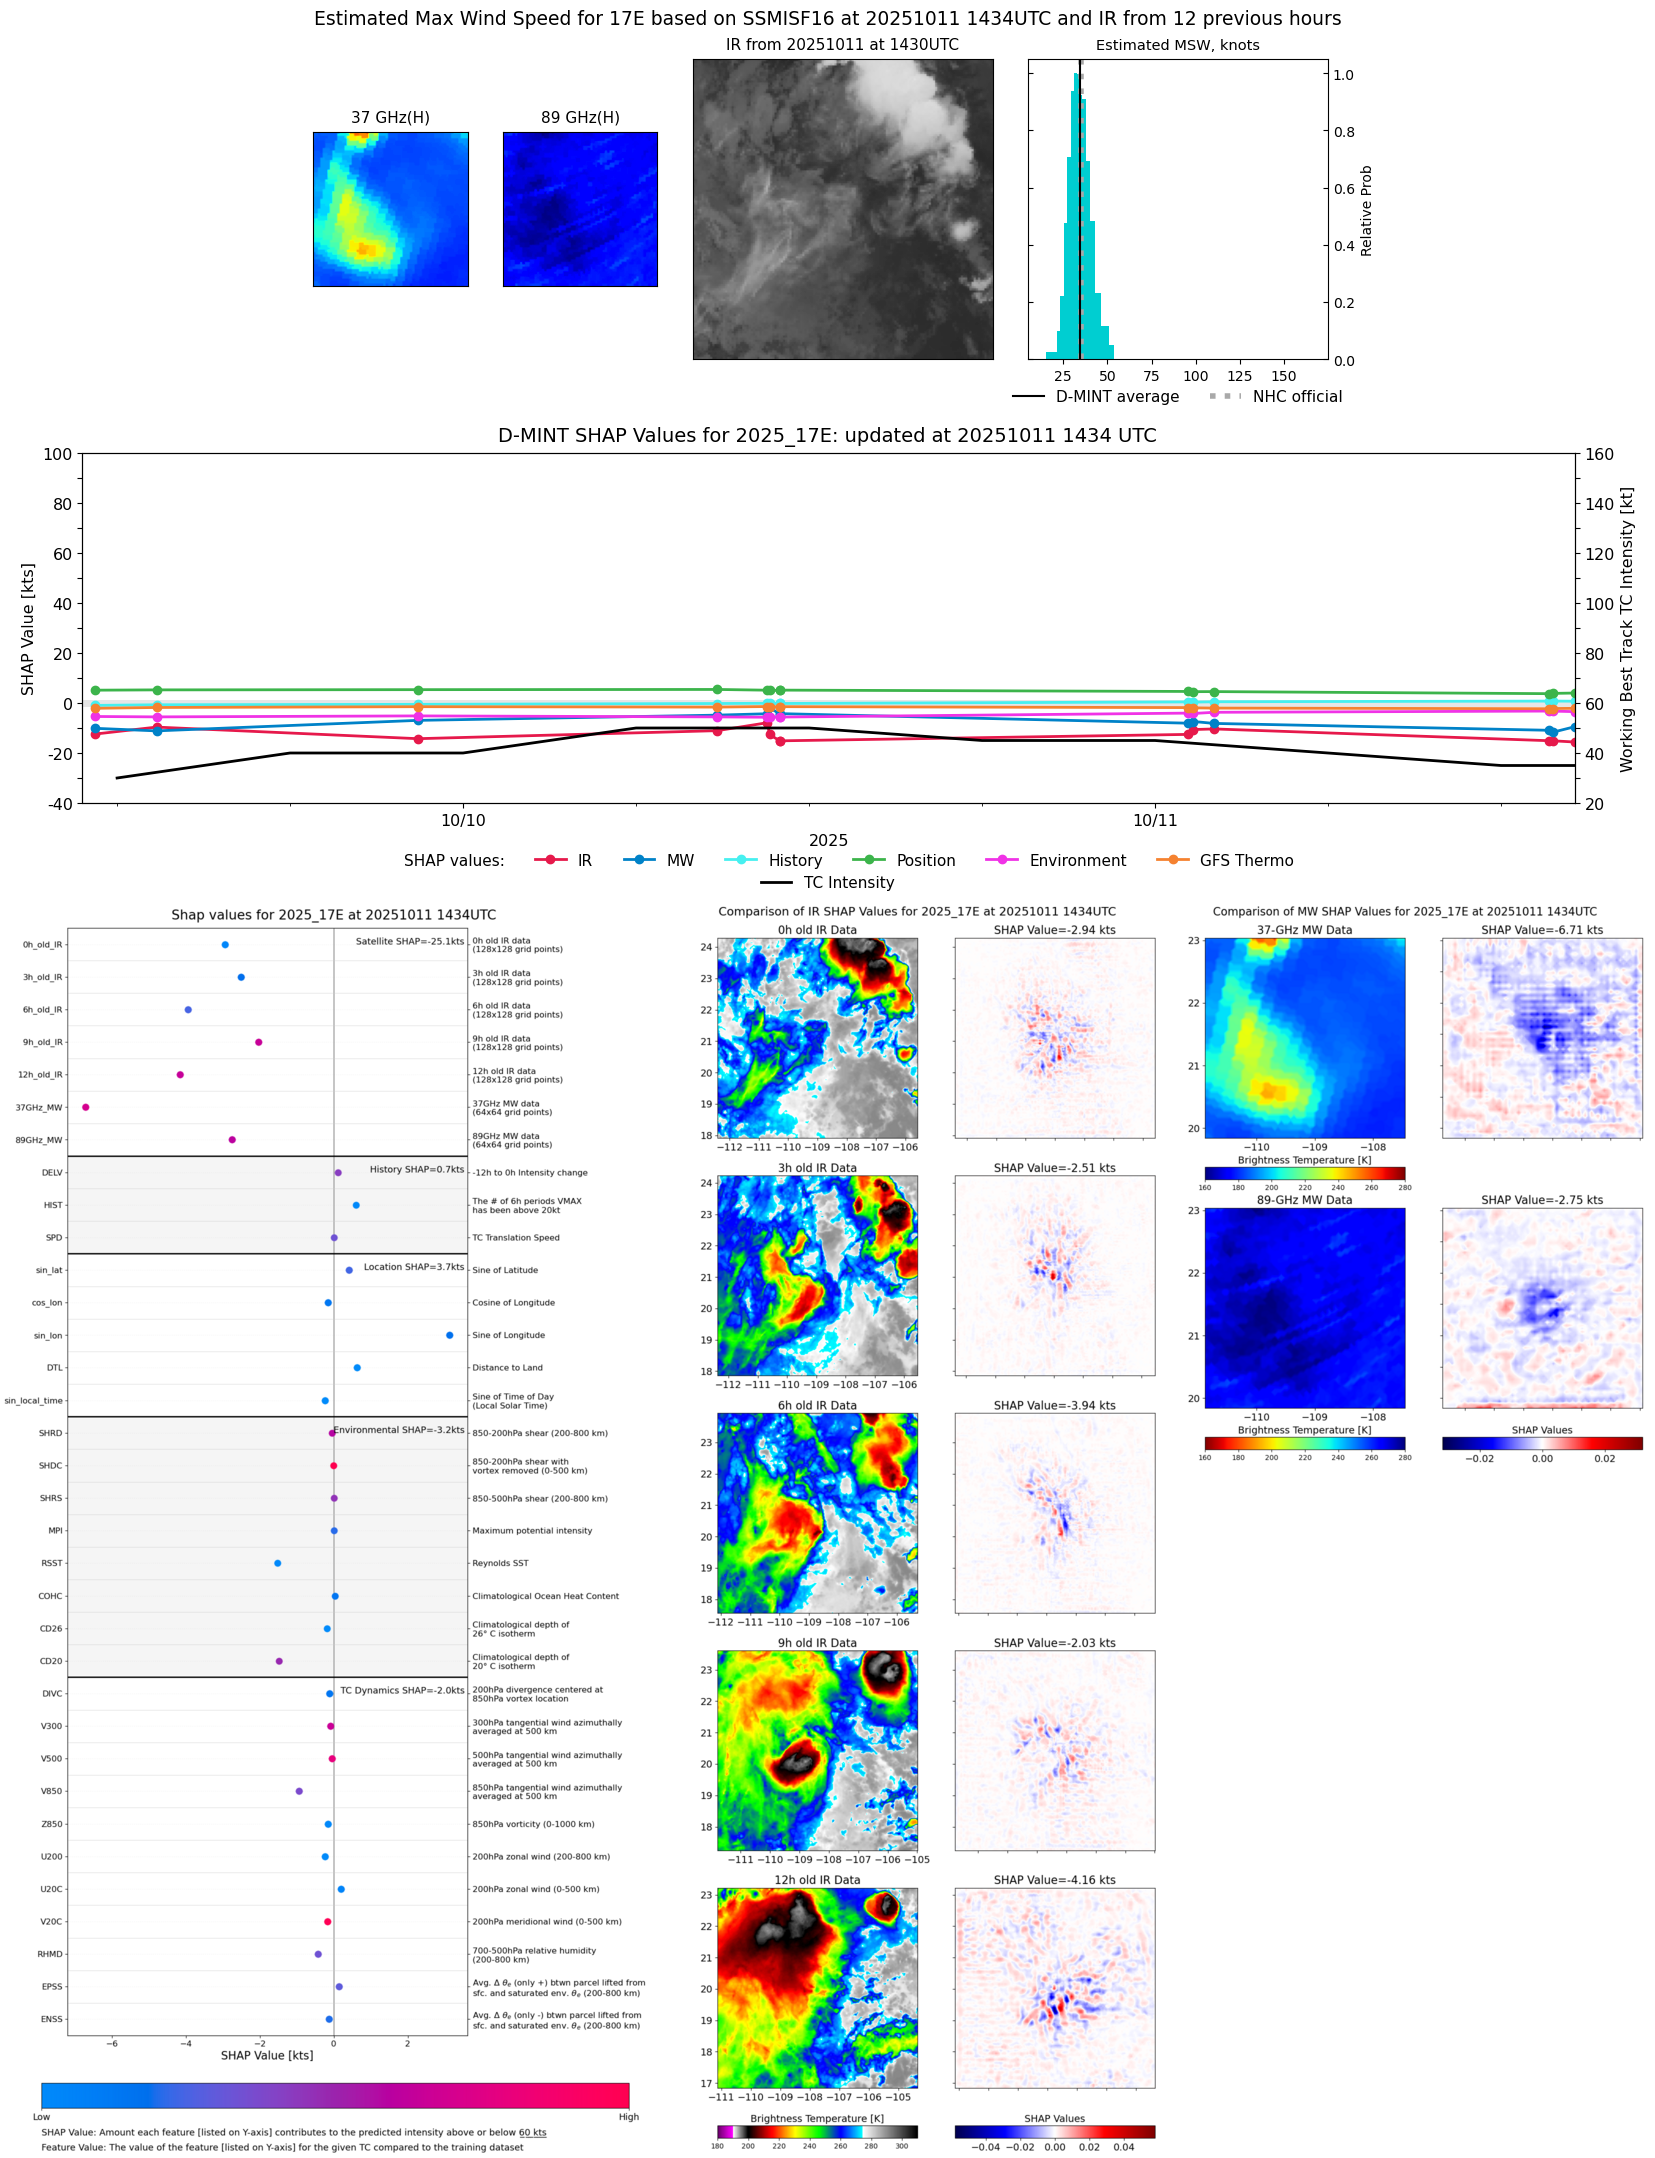 |
| 20251011 | 1348 UTC | WSFM01 | 1004 hPa | 33 kts | 29 kts | 37 kts | 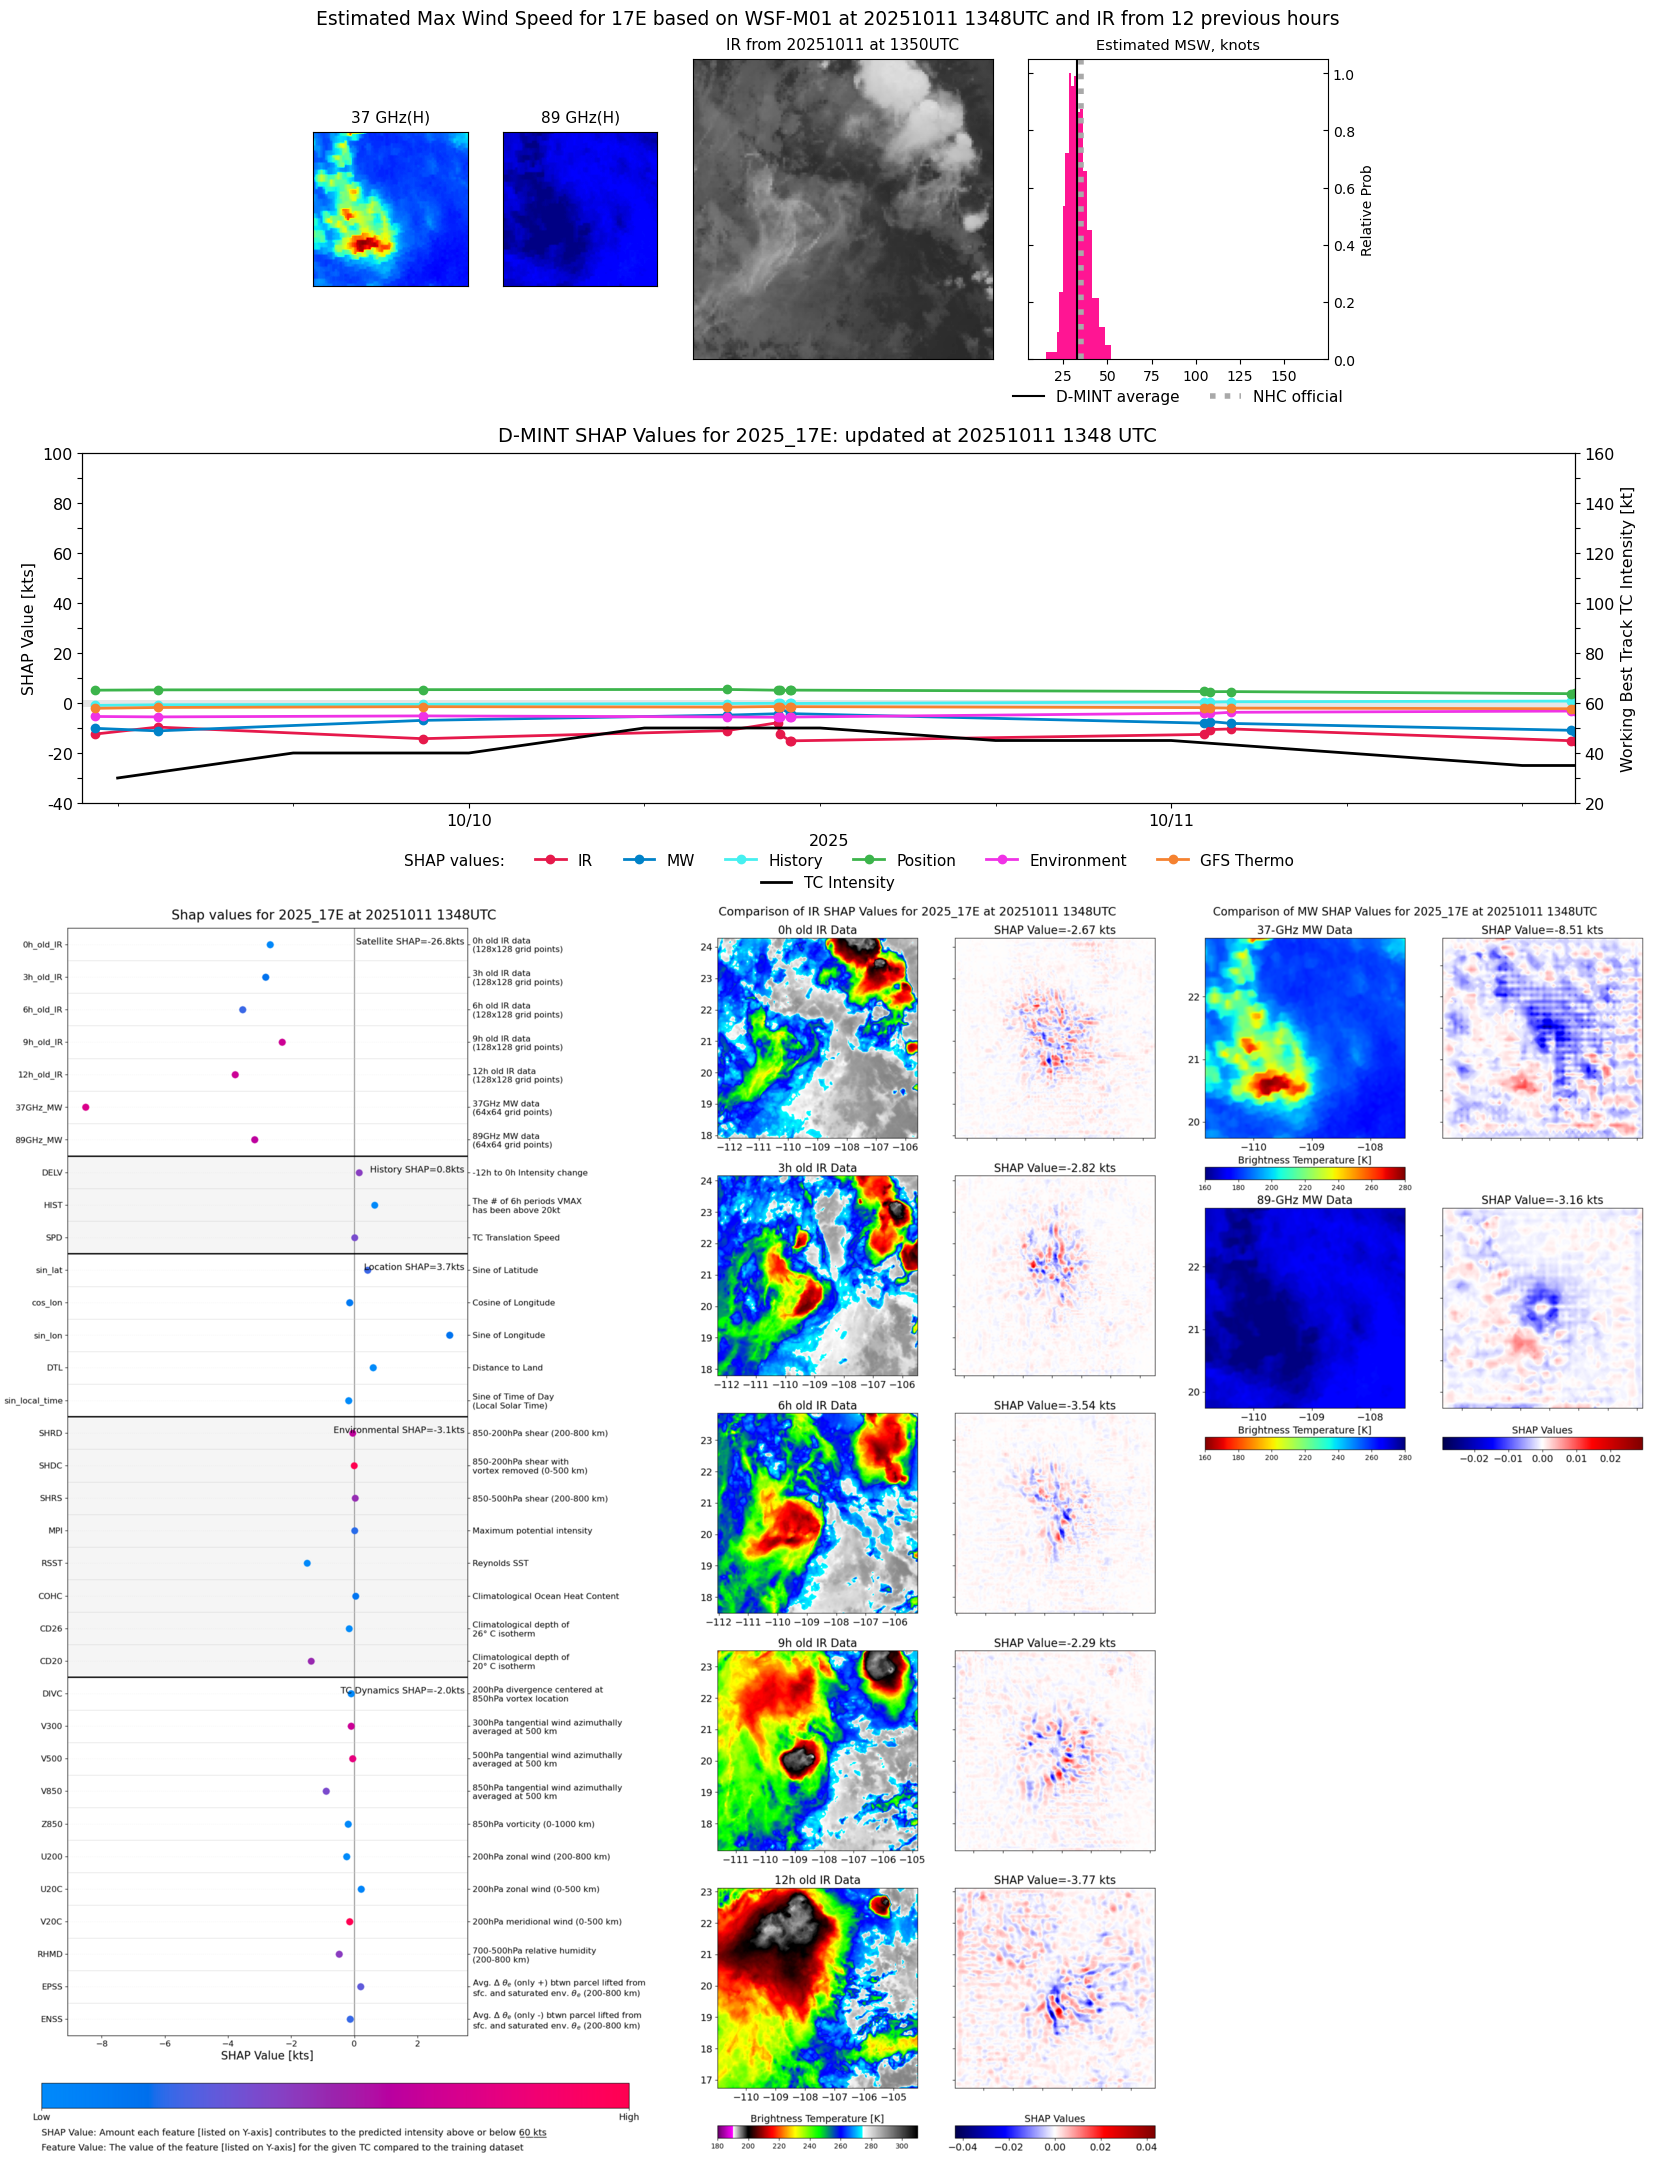 |
| 20251011 | 1340 UTC | SSMISF17 | 1004 hPa | 33 kts | 29 kts | 38 kts |  |
| 20251011 | 0836 UTC | ATMS-N20 | 1003 hPa | 40 kts | 36 kts | 45 kts |  |
| 20251011 | 0526 UTC | TMS05 | 1003 hPa | 39 kts | 35 kts | 44 kts | 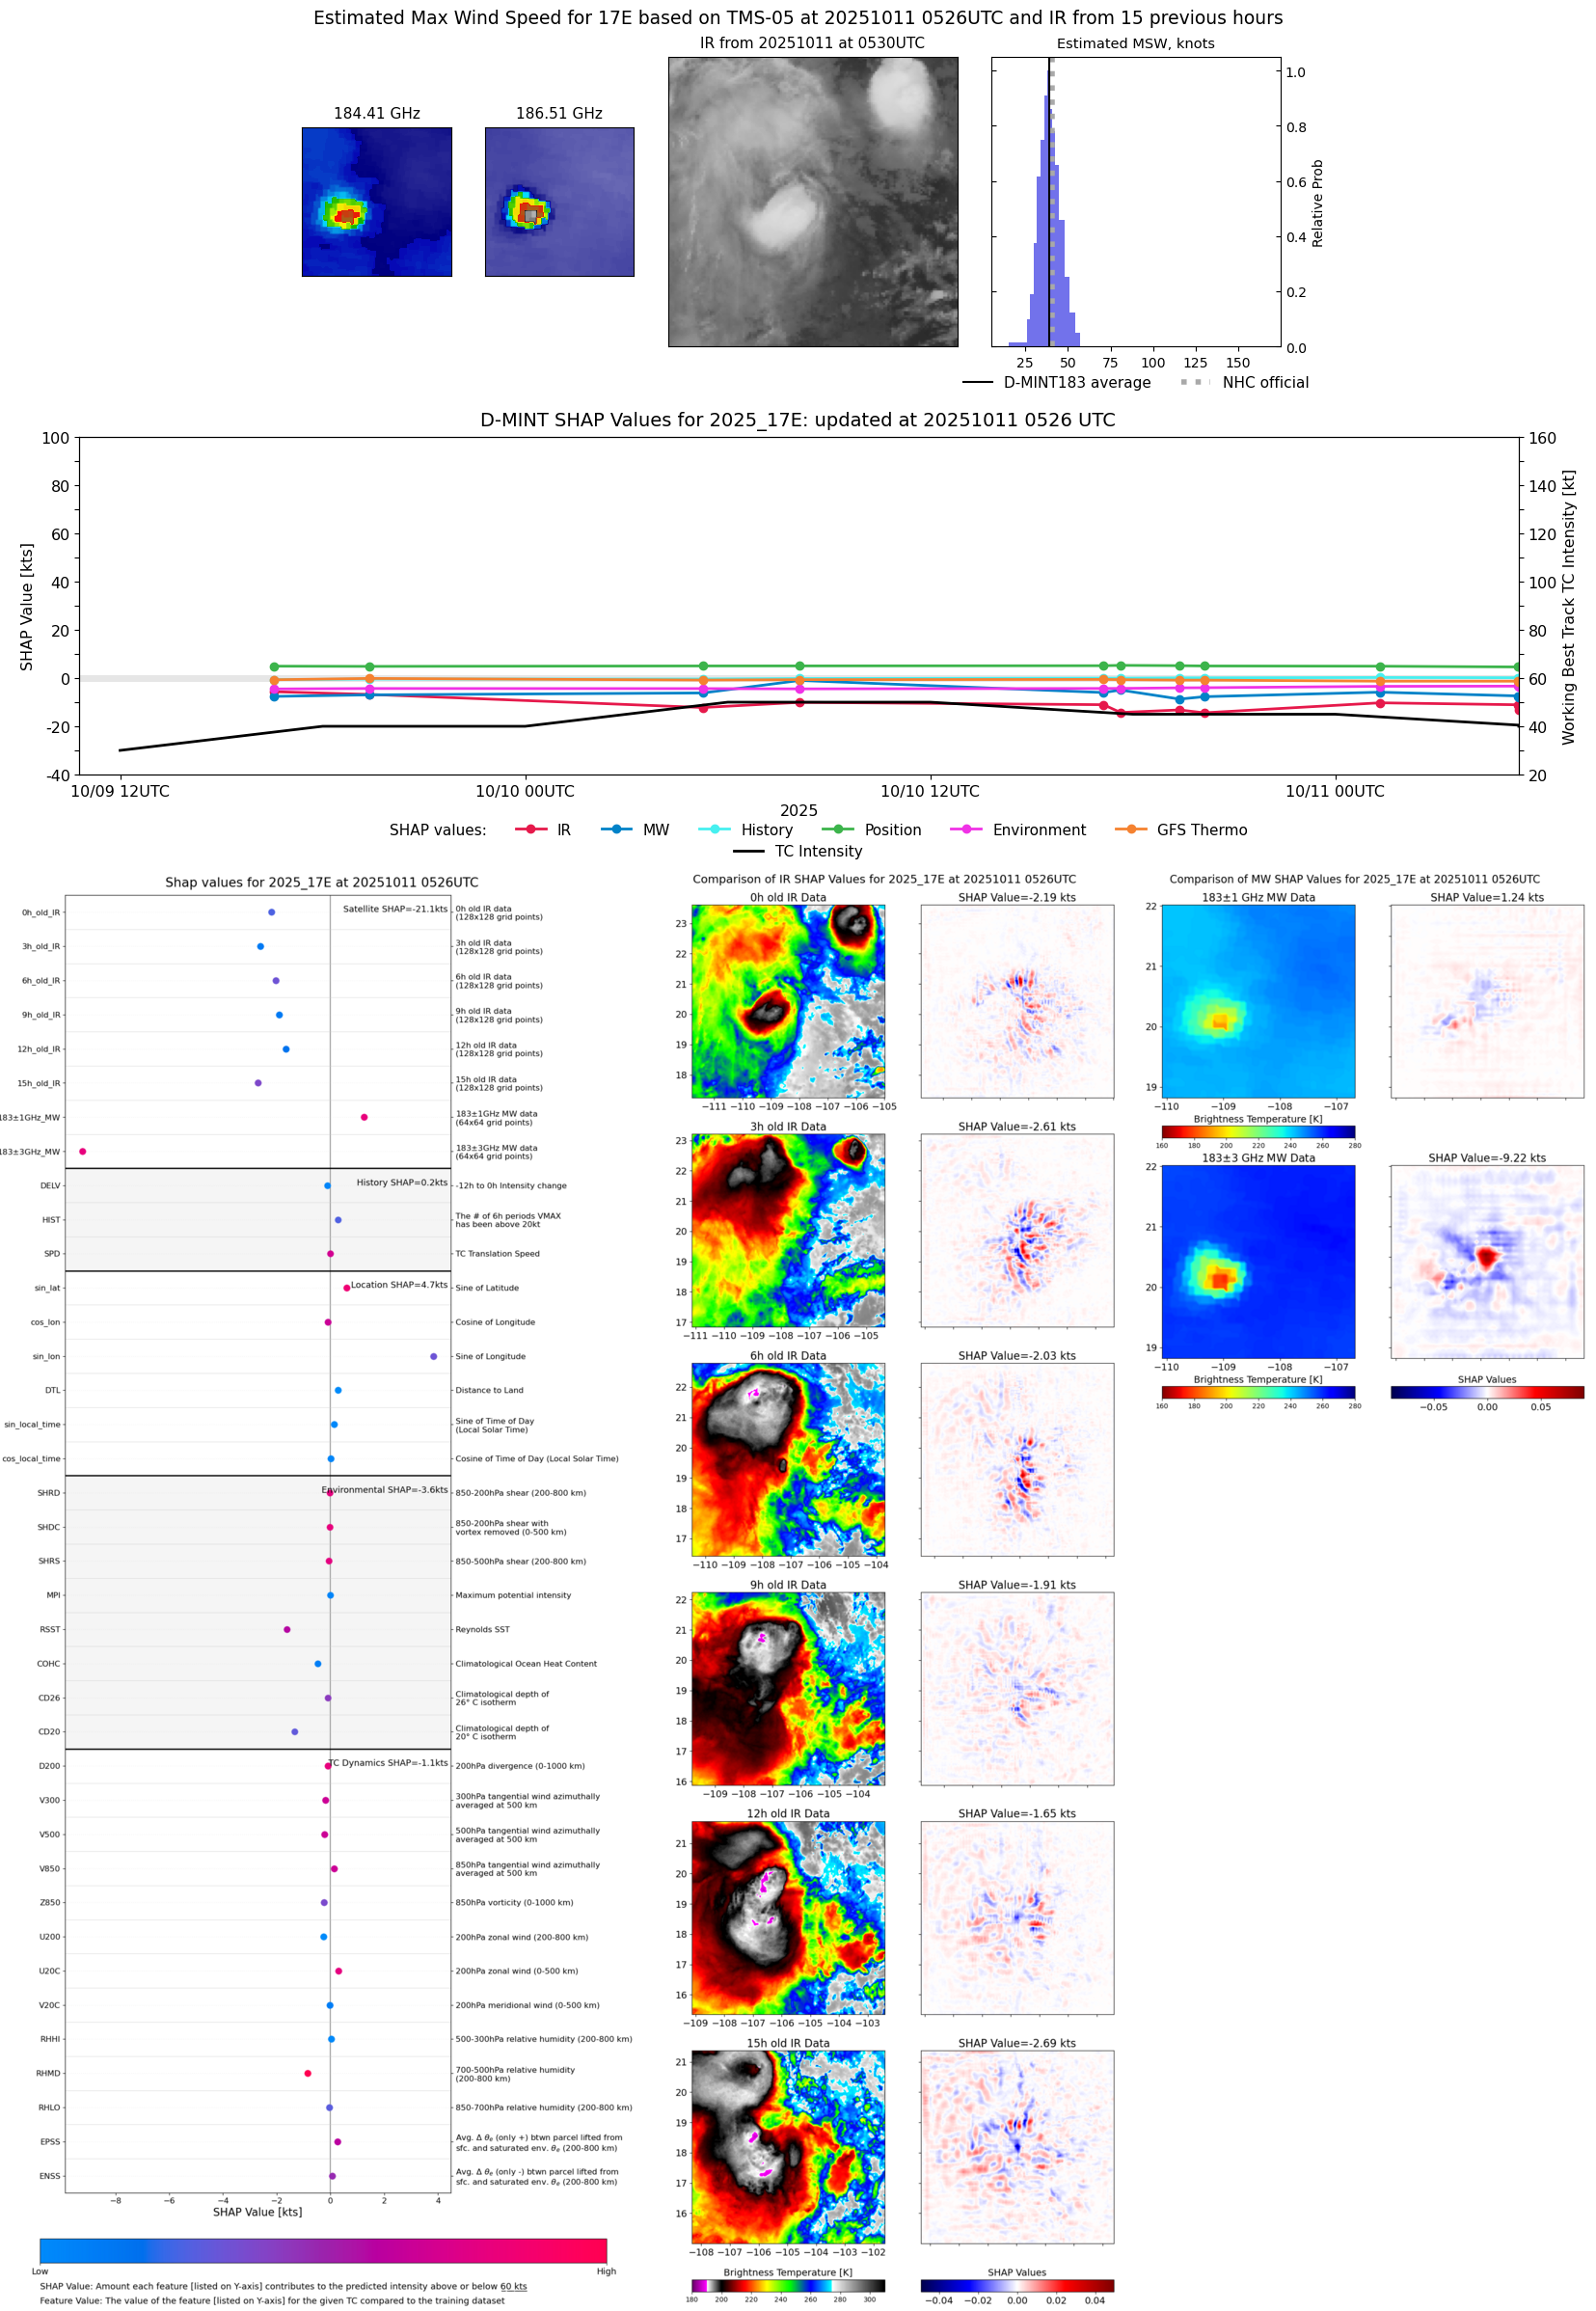 |
| 20251011 | 0524 UTC | TMS02 | 1002 hPa | 42 kts | 38 kts | 47 kts |  |
| 20251011 | 0203 UTC | SSMISF16 | 1003 hPa | 41 kts | 36 kts | 46 kts |  |
| 20251011 | 0120 UTC | WSFM01 | 1001 hPa | 41 kts | 37 kts | 46 kts |  |
| 20251011 | 0119 UTC | TROPICS05 | 998 hPa | 45 kts | 40 kts | 50 kts | 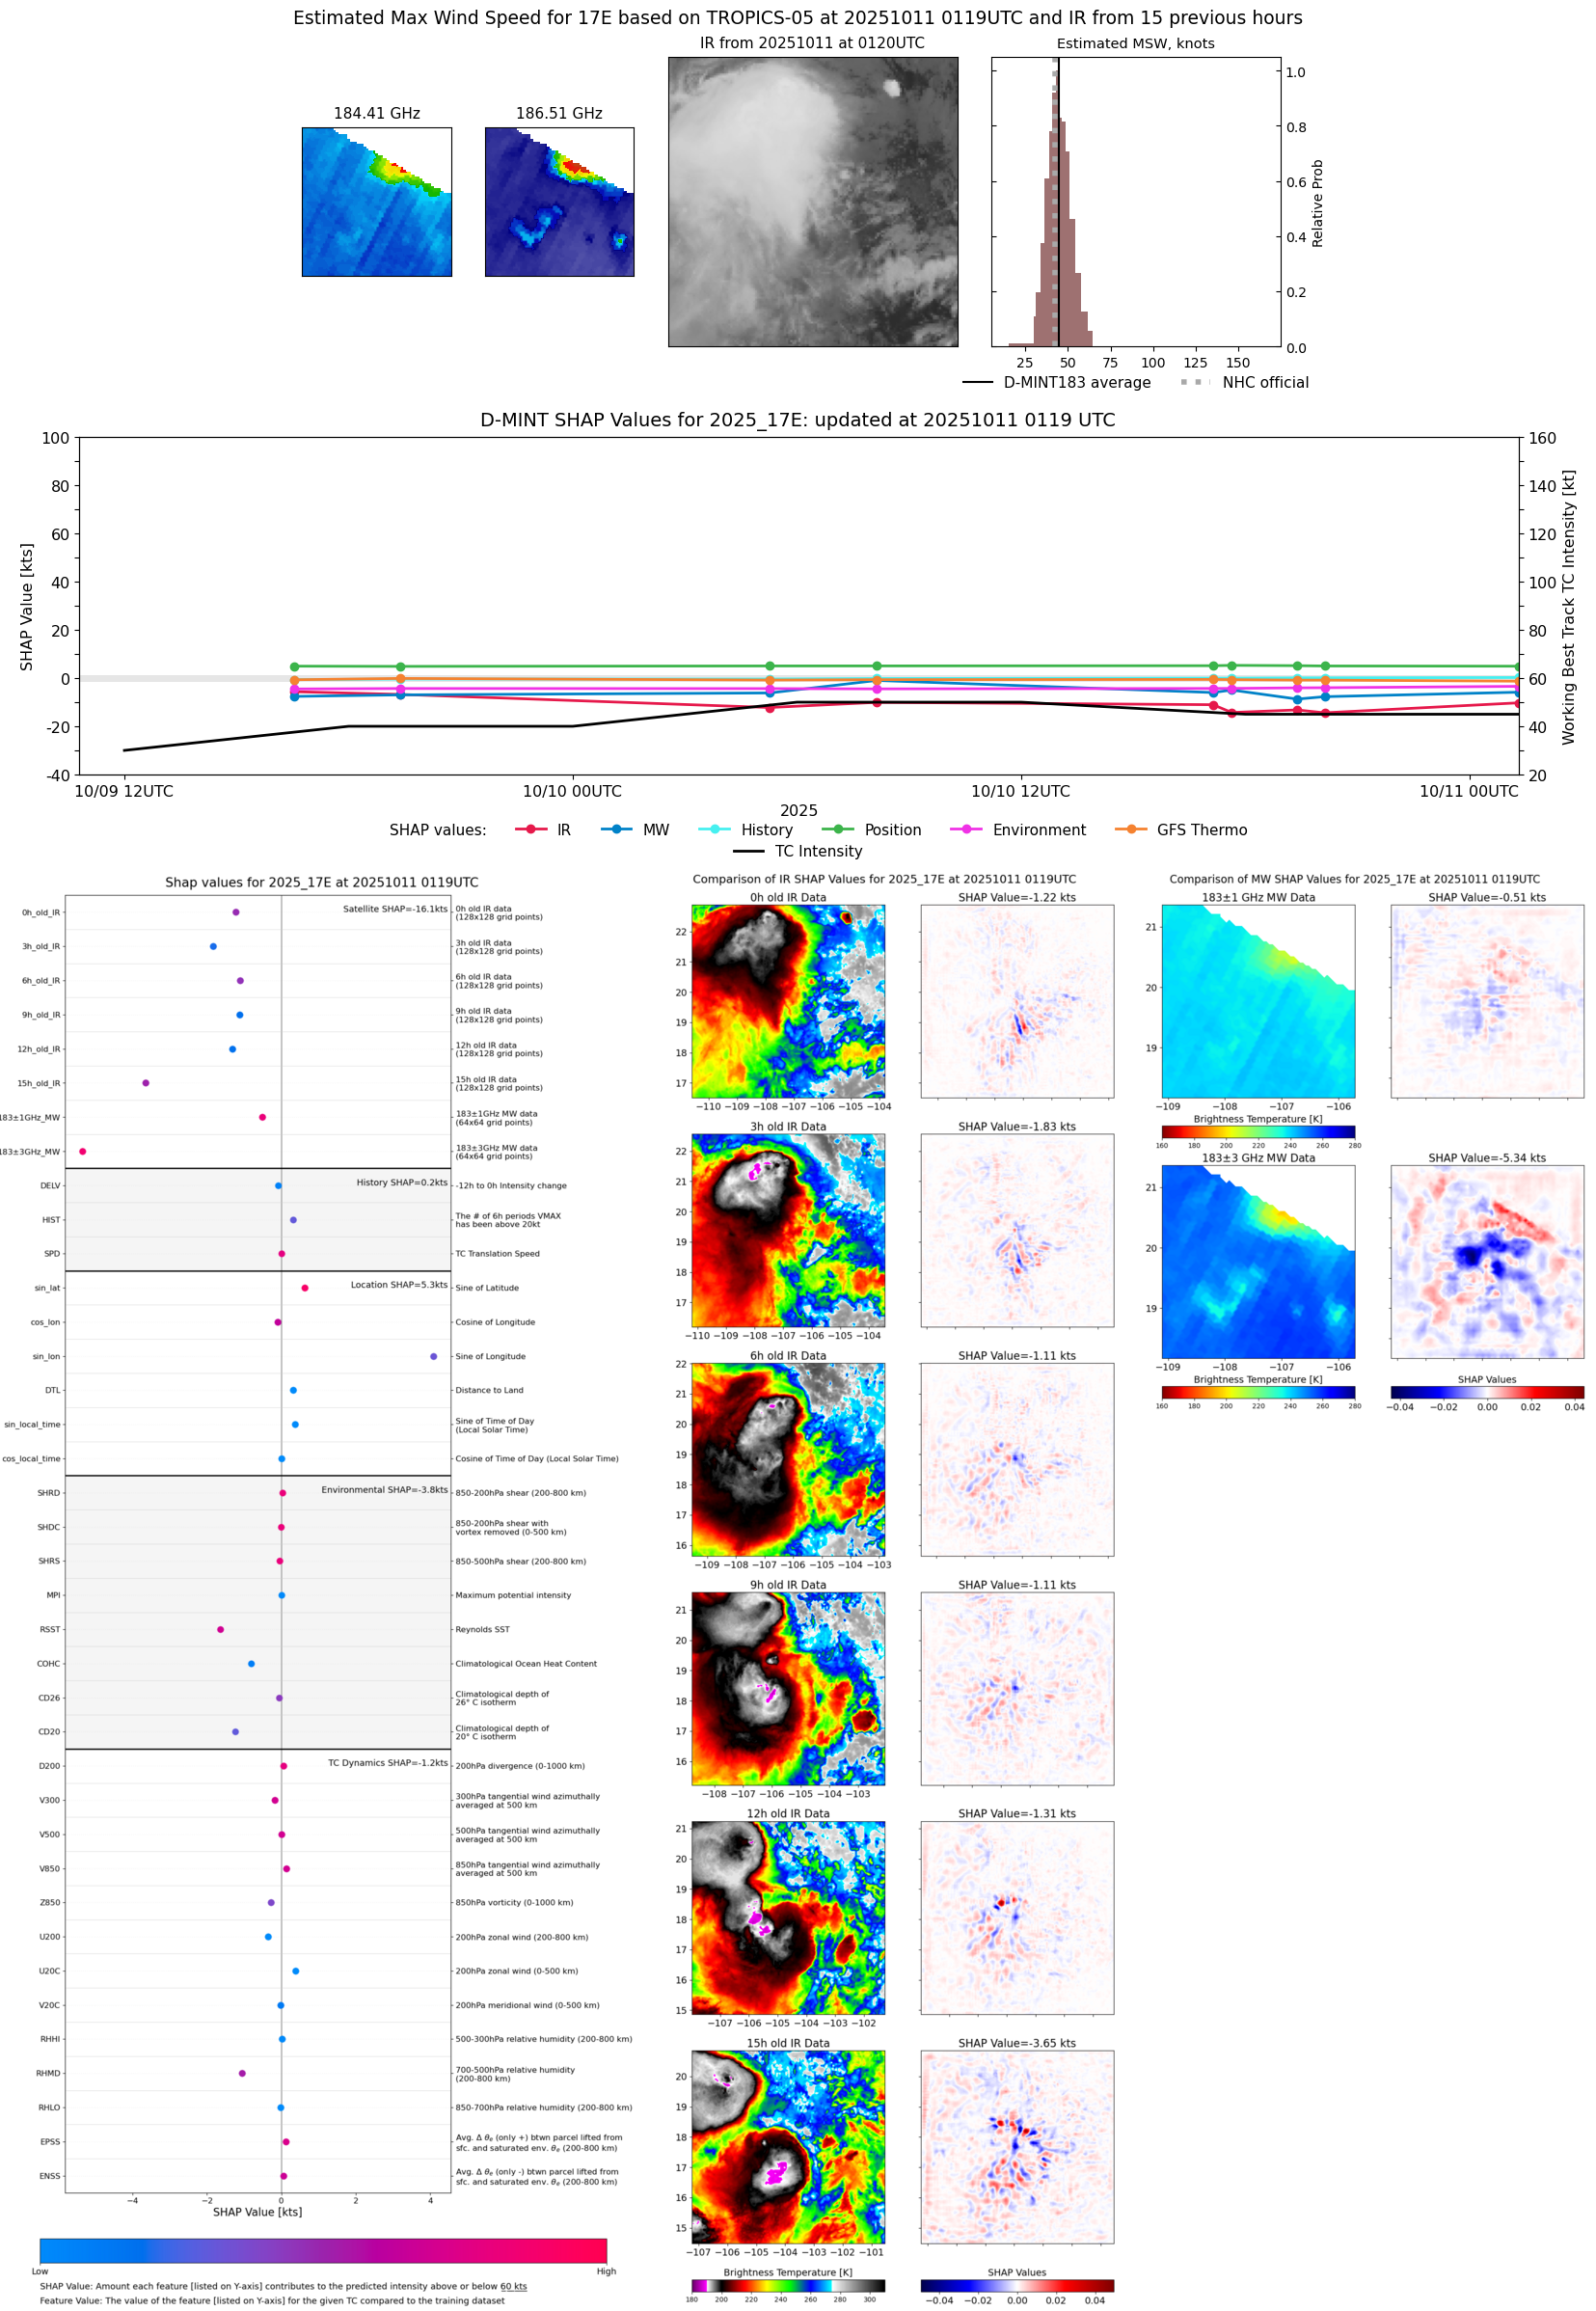 |
| 20251011 | 0108 UTC | SSMISF17 | 1001 hPa | 39 kts | 34 kts | 44 kts | 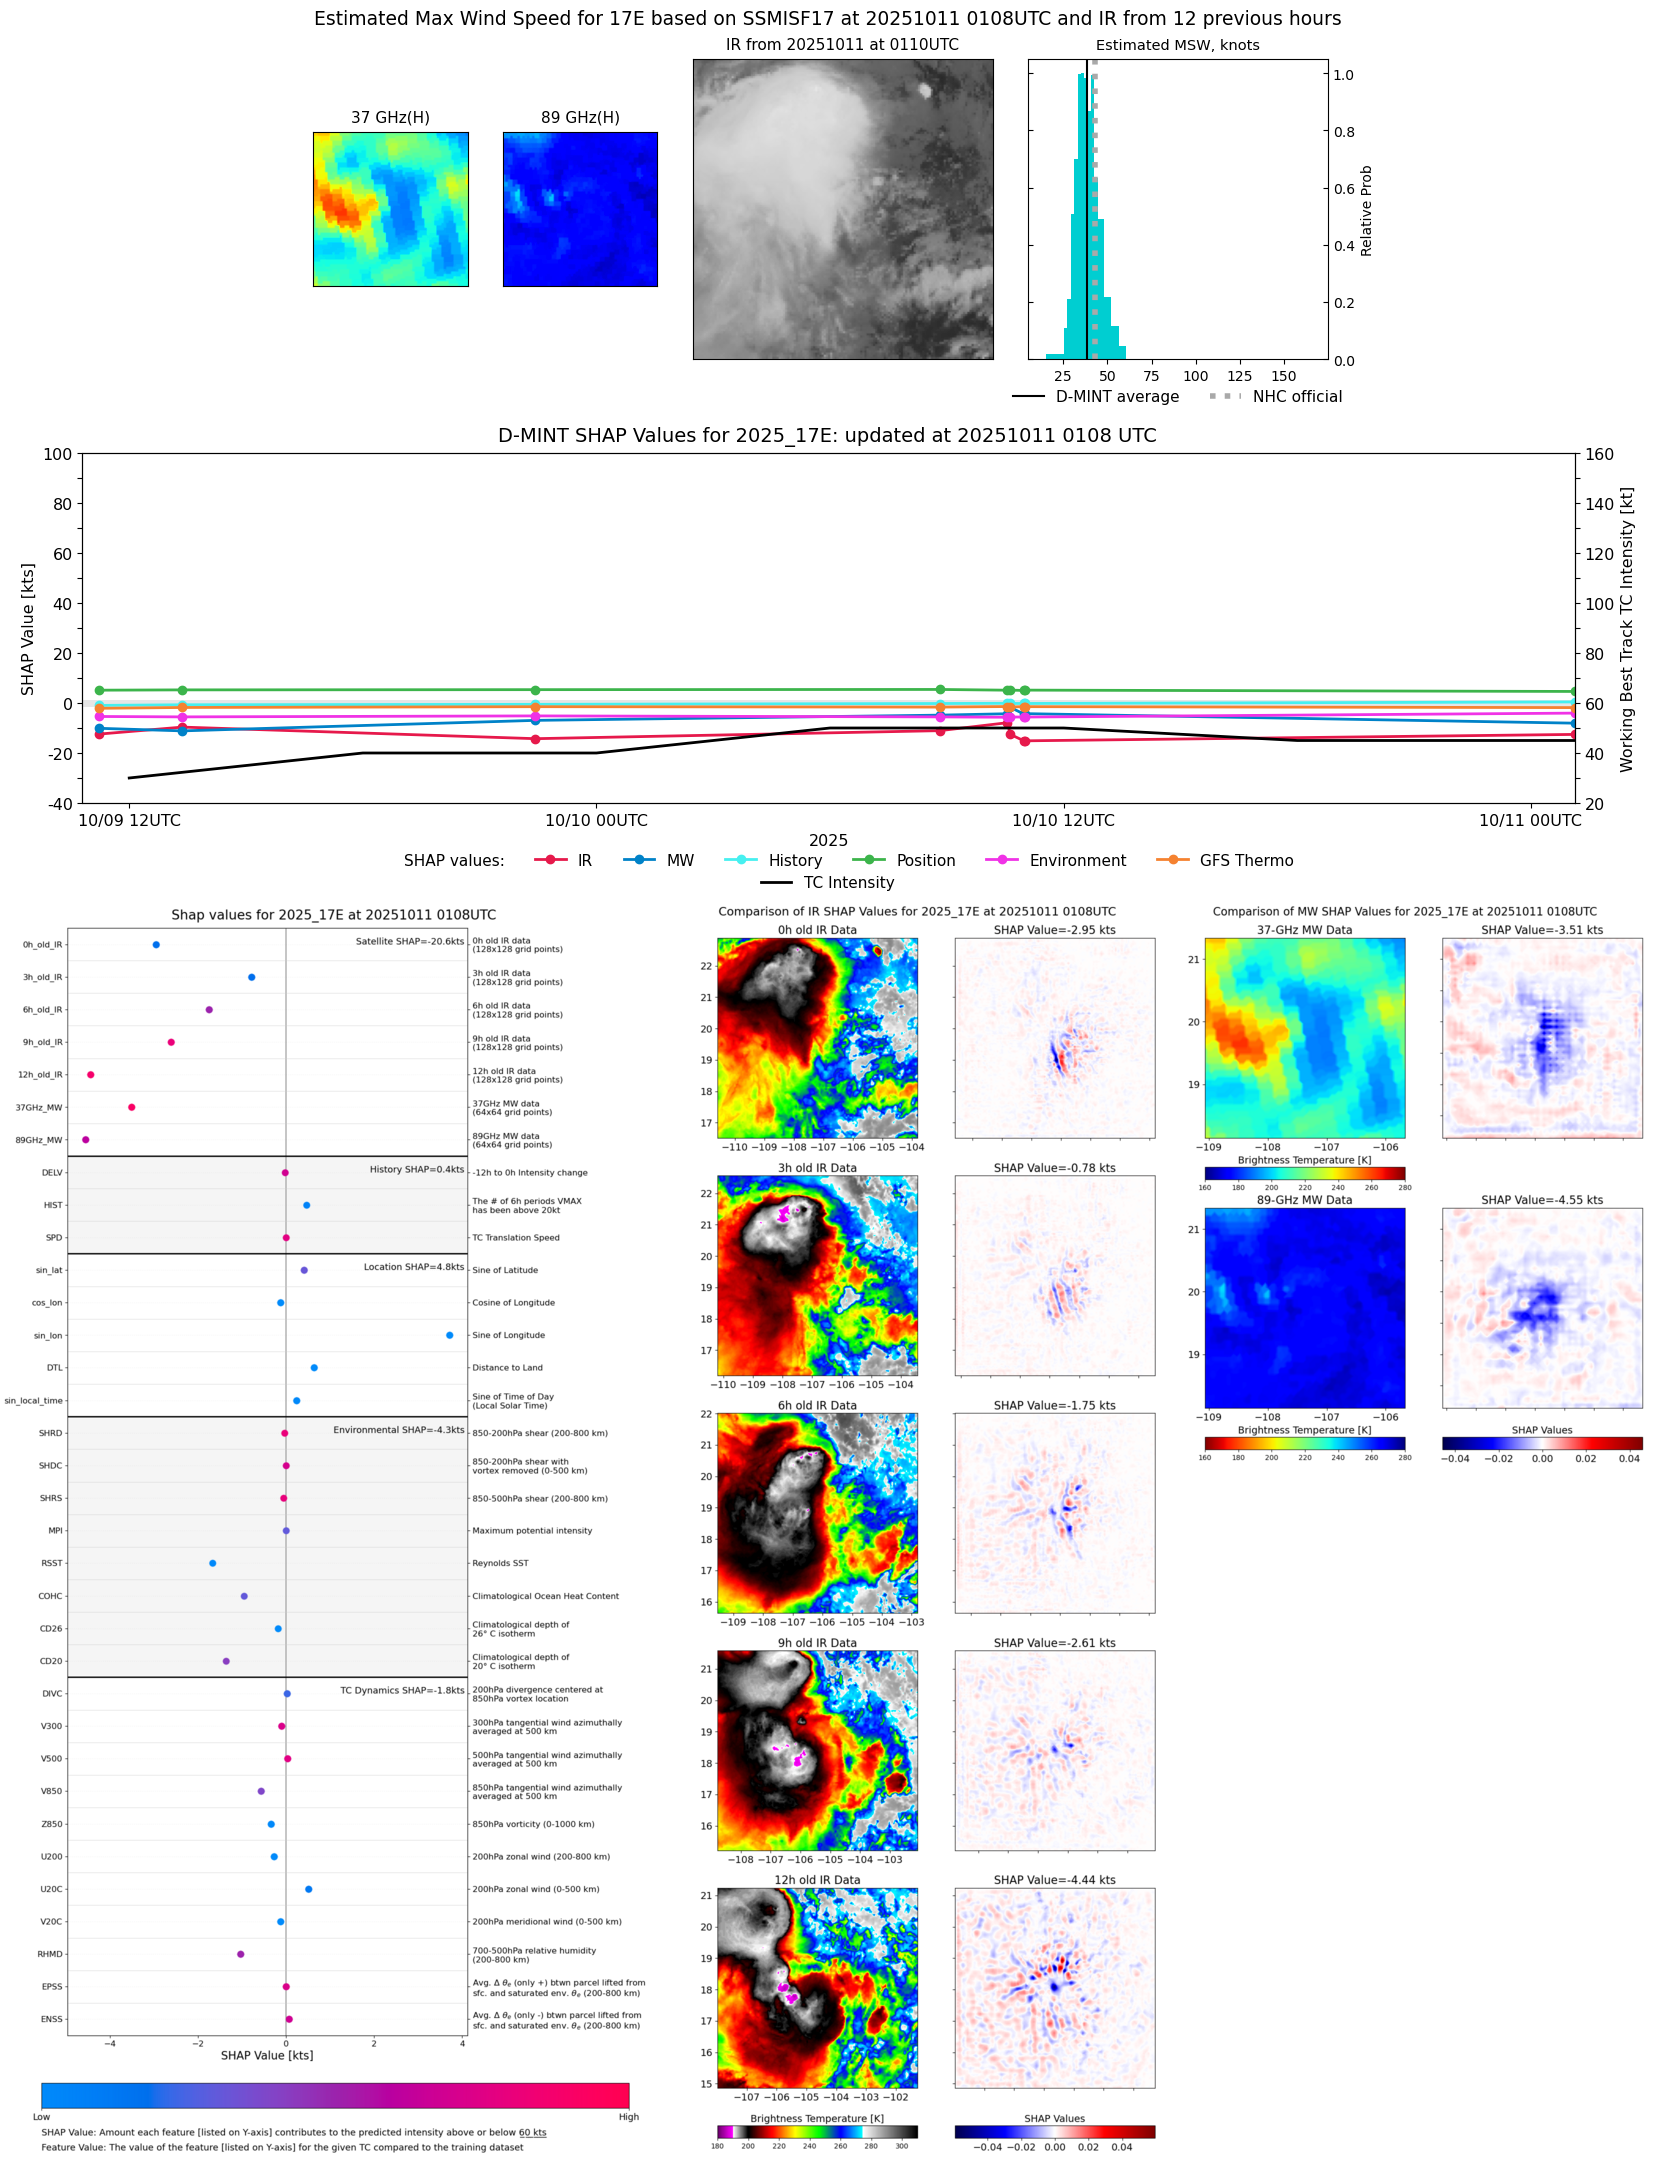 |
| 20251010 | 2007 UTC | ATMS-N20 | 1000 hPa | 38 kts | 35 kts | 42 kts |  |
| 20251010 | 1923 UTC | TMS07 | 1000 hPa | 39 kts | 35 kts | 42 kts |  |
| 20251010 | 1738 UTC | AWS | 1000 hPa | 41 kts | 38 kts | 45 kts |  |
| 20251010 | 1708 UTC | TMS06 | 1000 hPa | 43 kts | 39 kts | 47 kts | 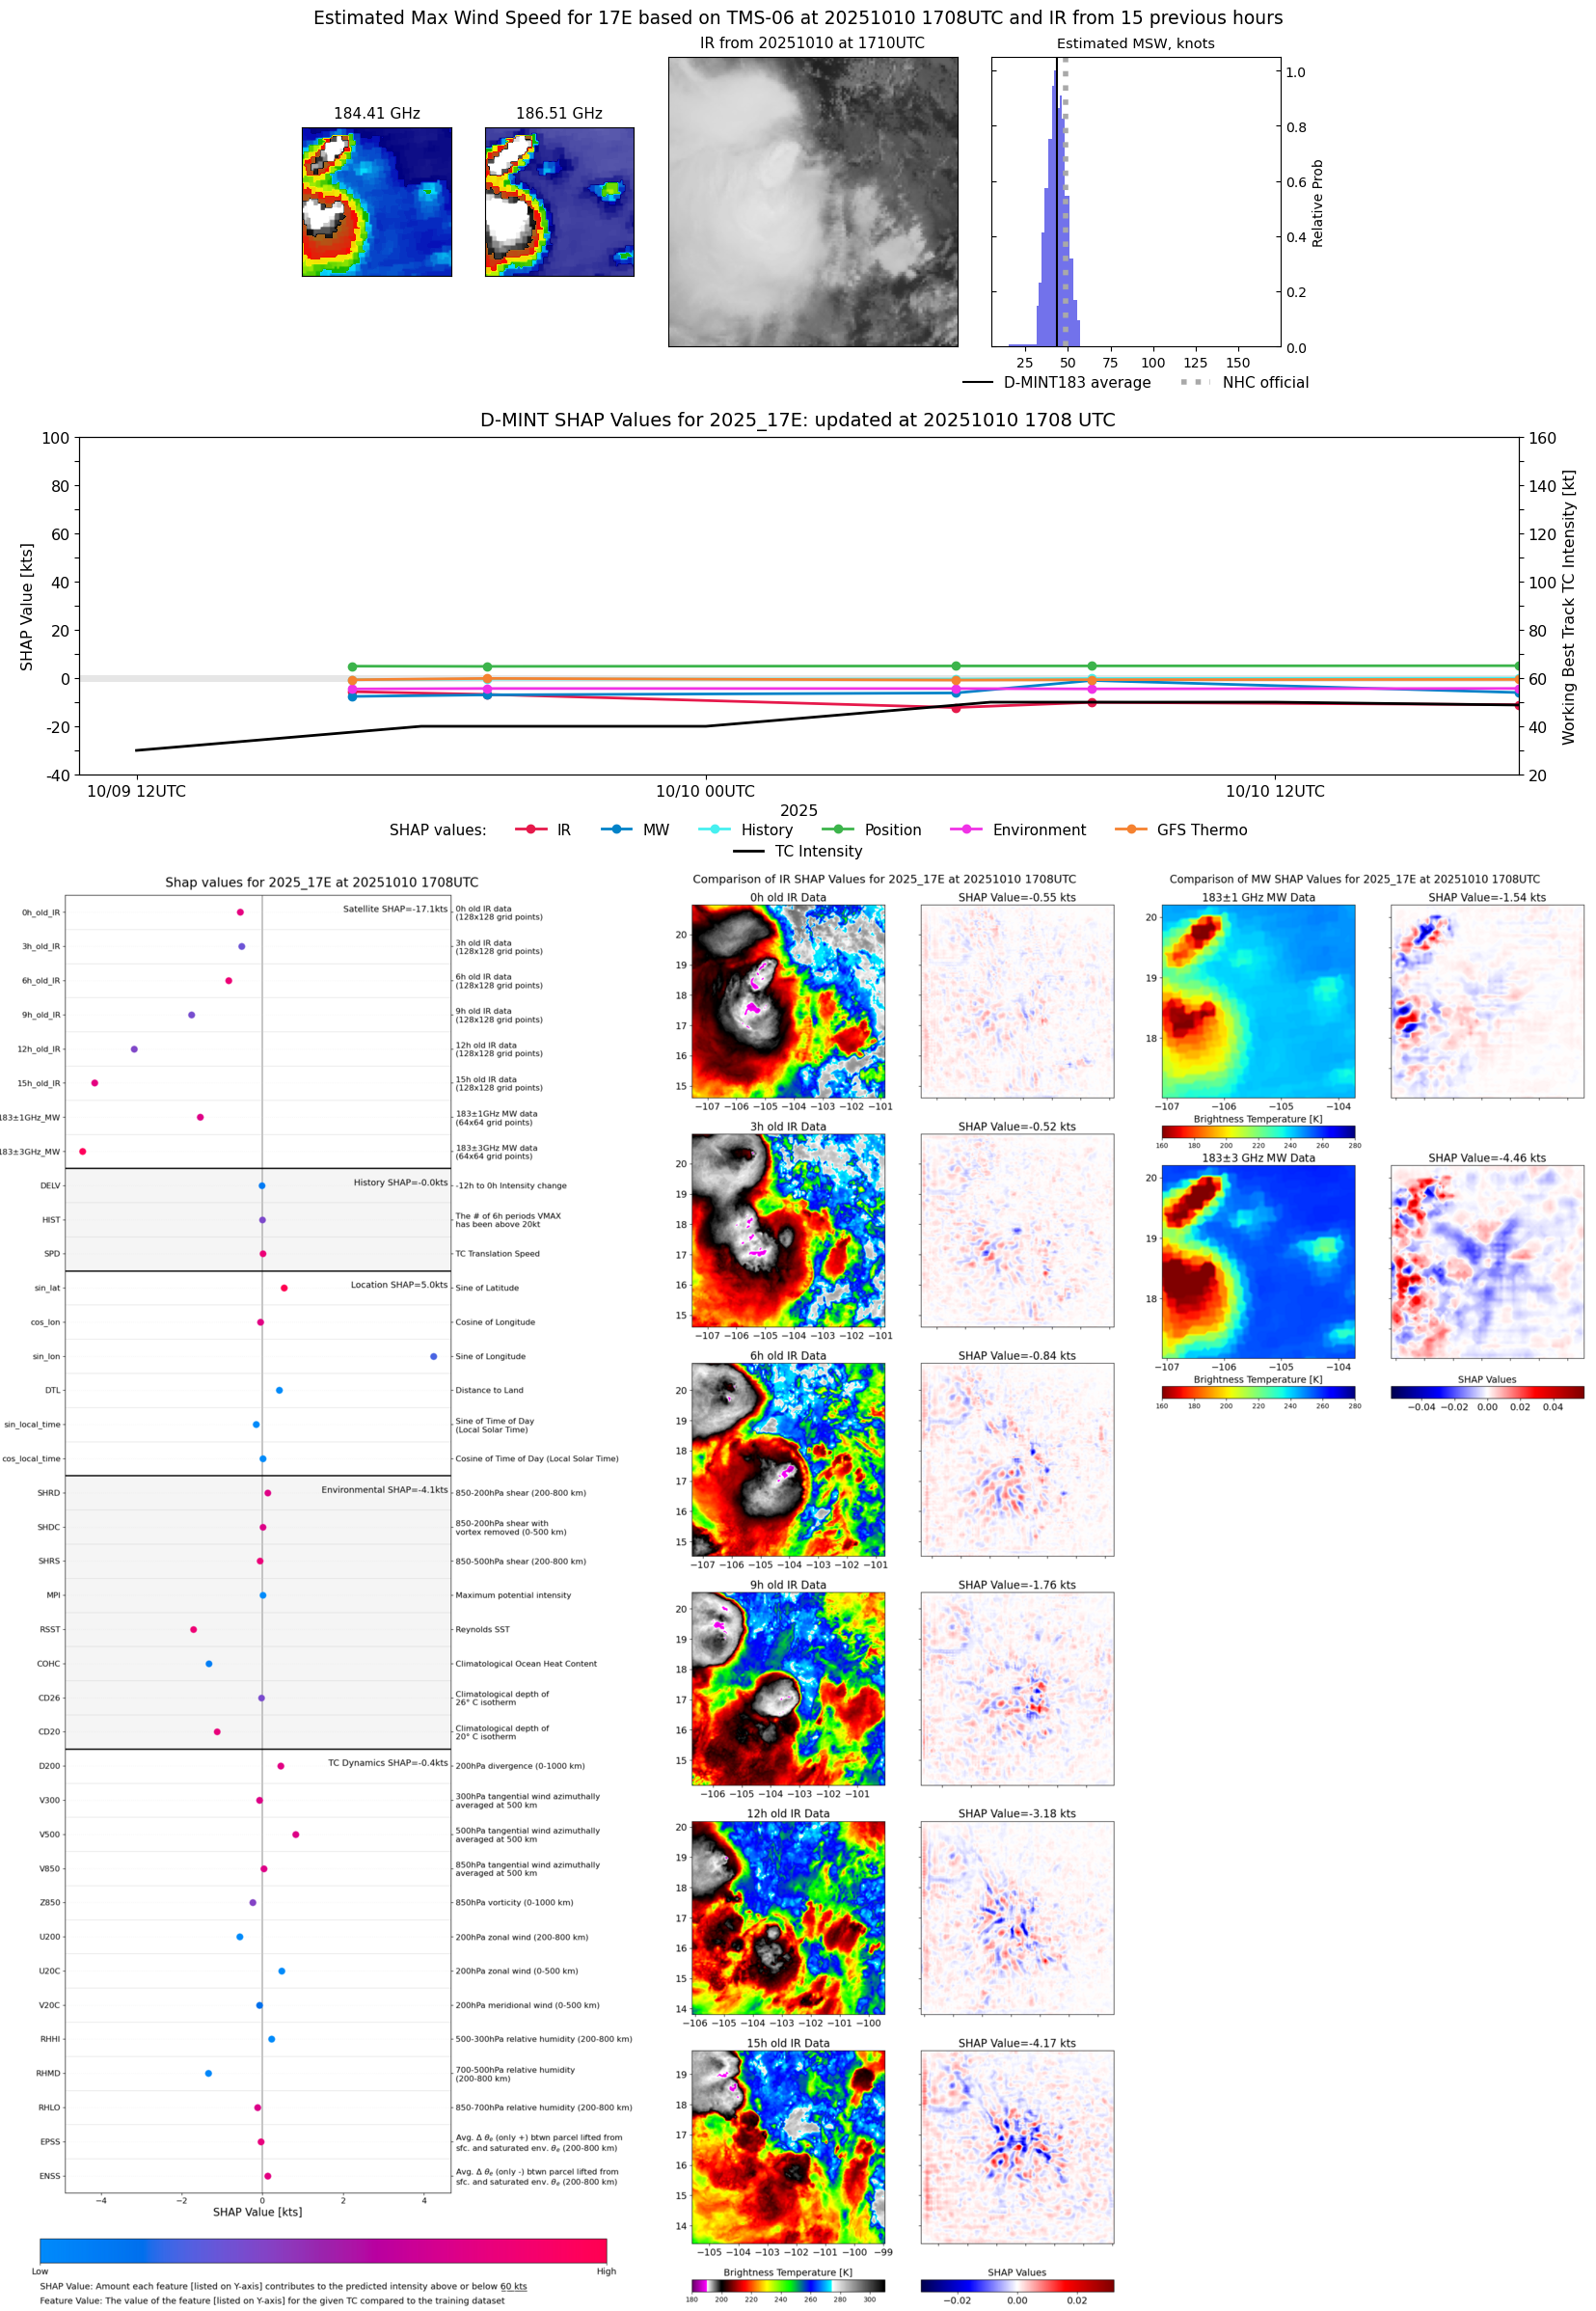 |
| 20251010 | 1100 UTC | SSMISF18 | 1003 hPa | 39 kts | 34 kts | 43 kts |  |
| 20251010 | 1059 UTC | SSMISF18 | 1002 hPa | 38 kts | 34 kts | 43 kts | 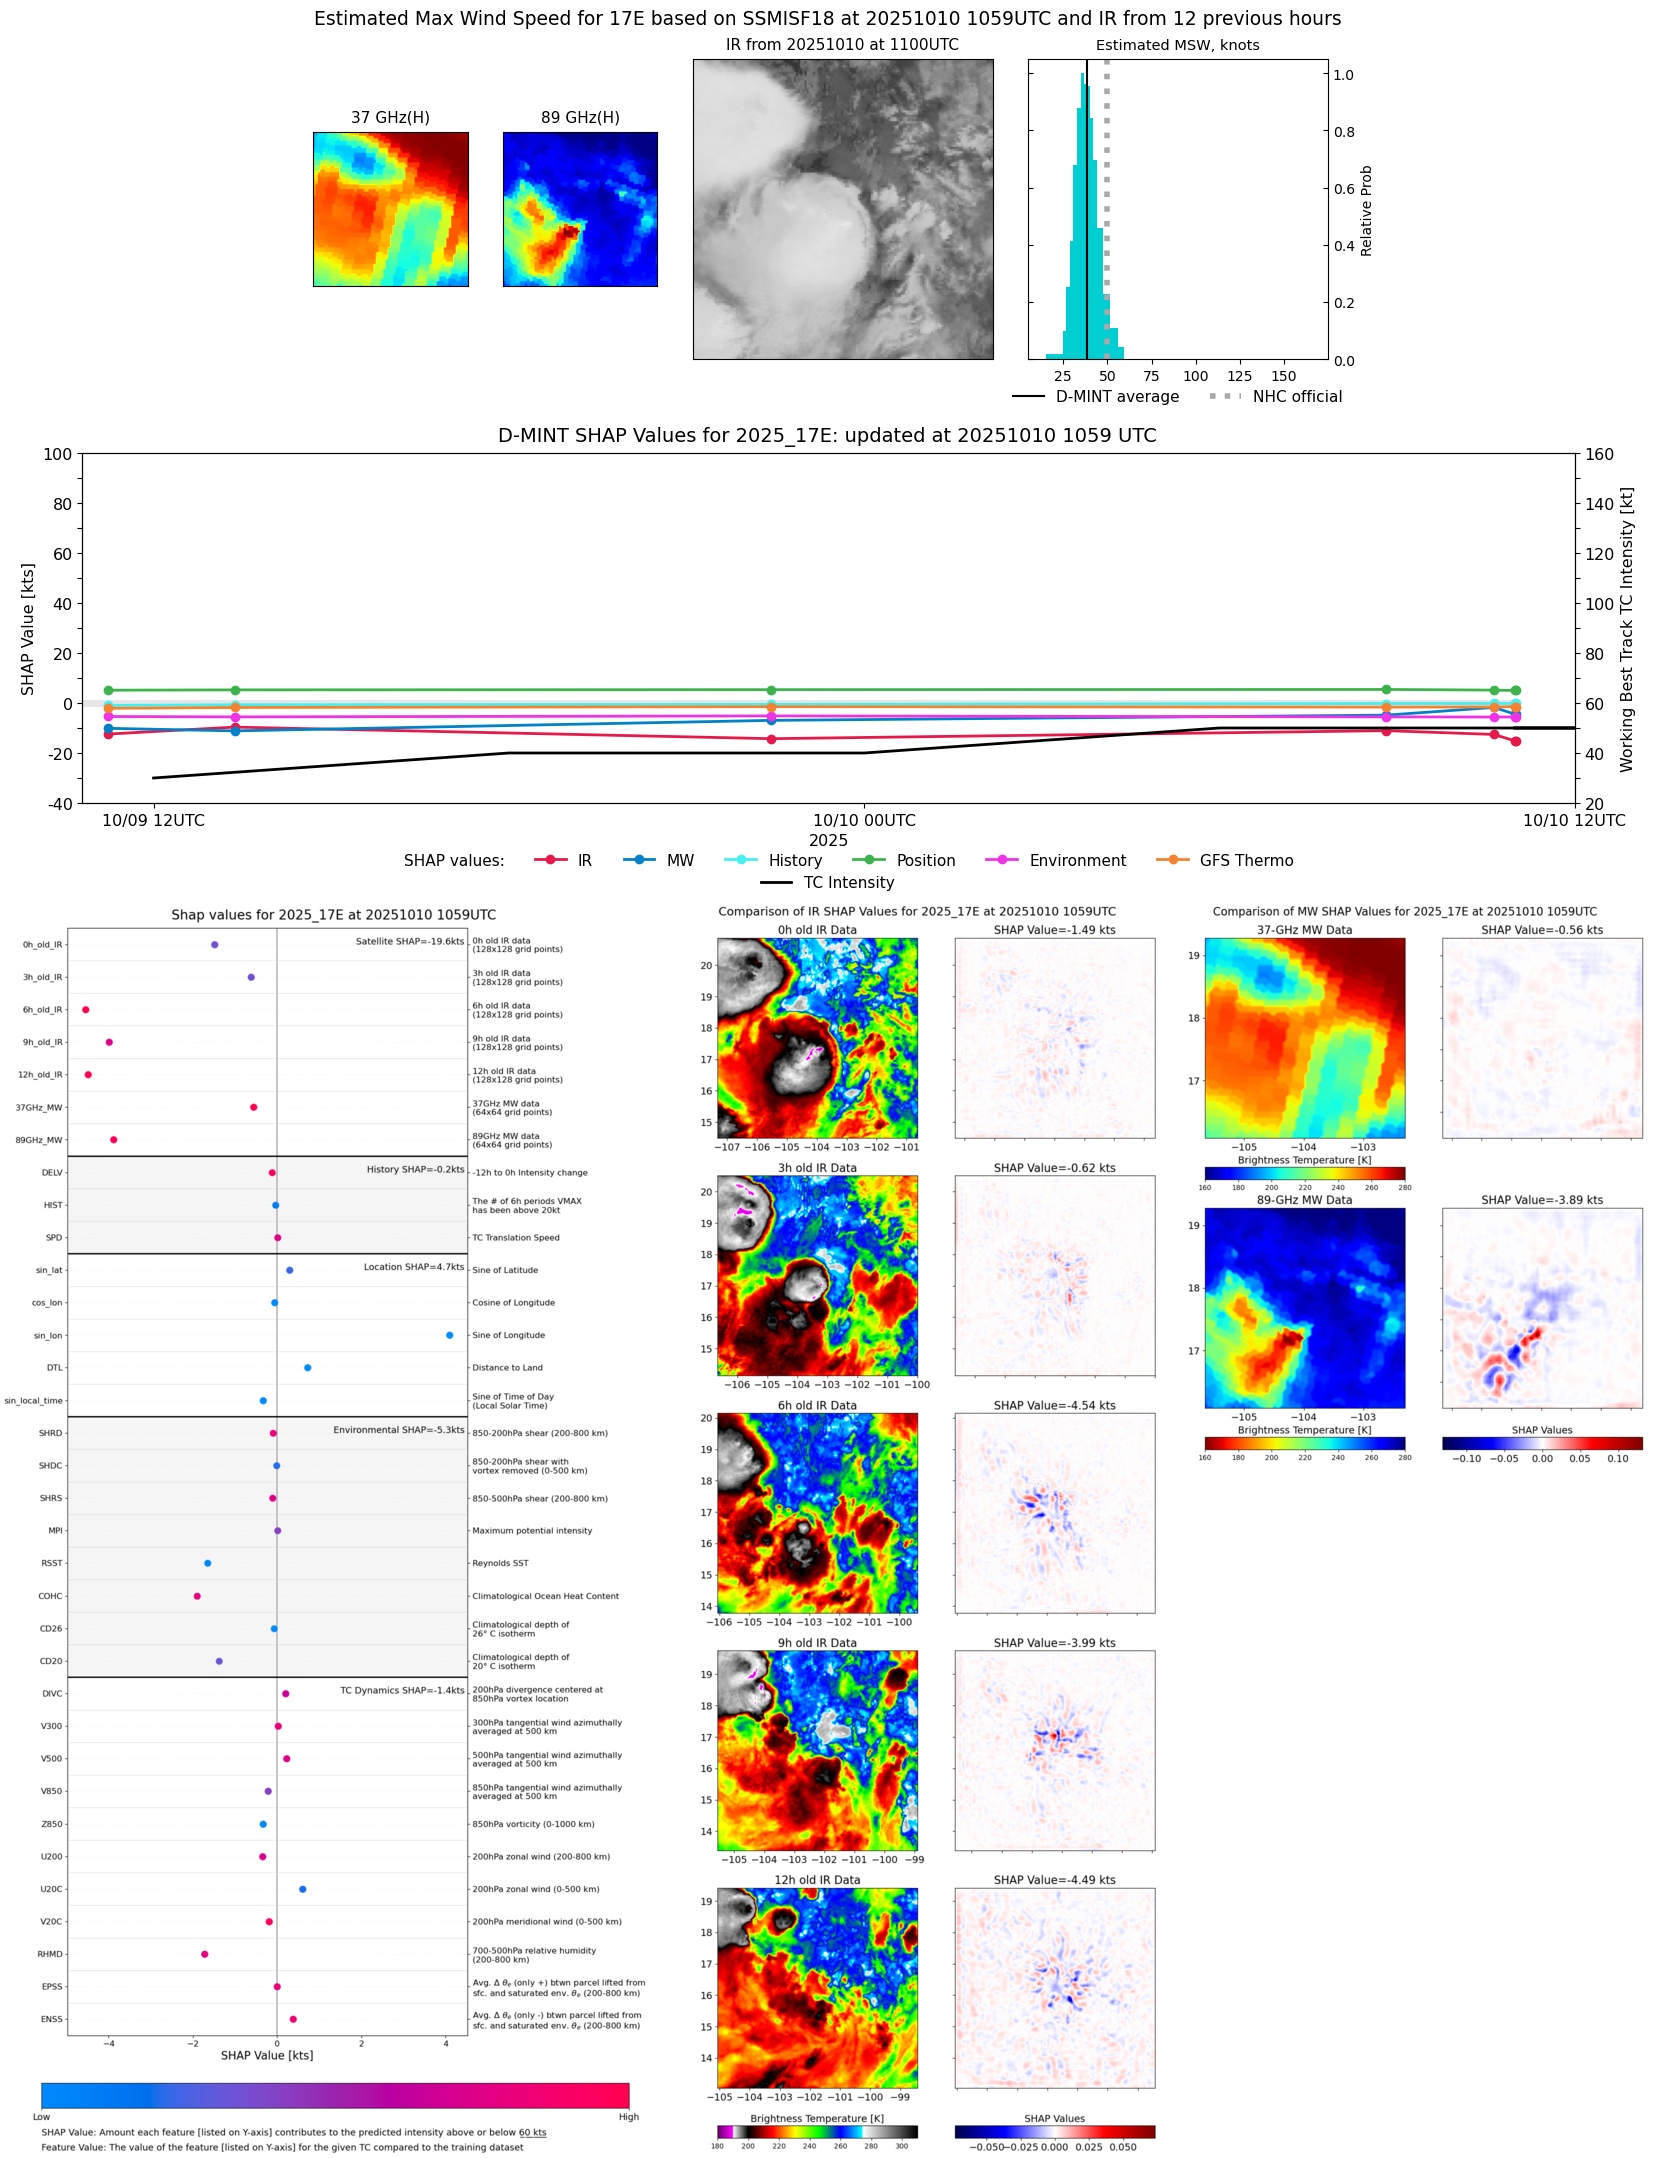 |
| 20251010 | 1033 UTC | GMI | 1003 hPa | 46 kts | 41 kts | 51 kts | 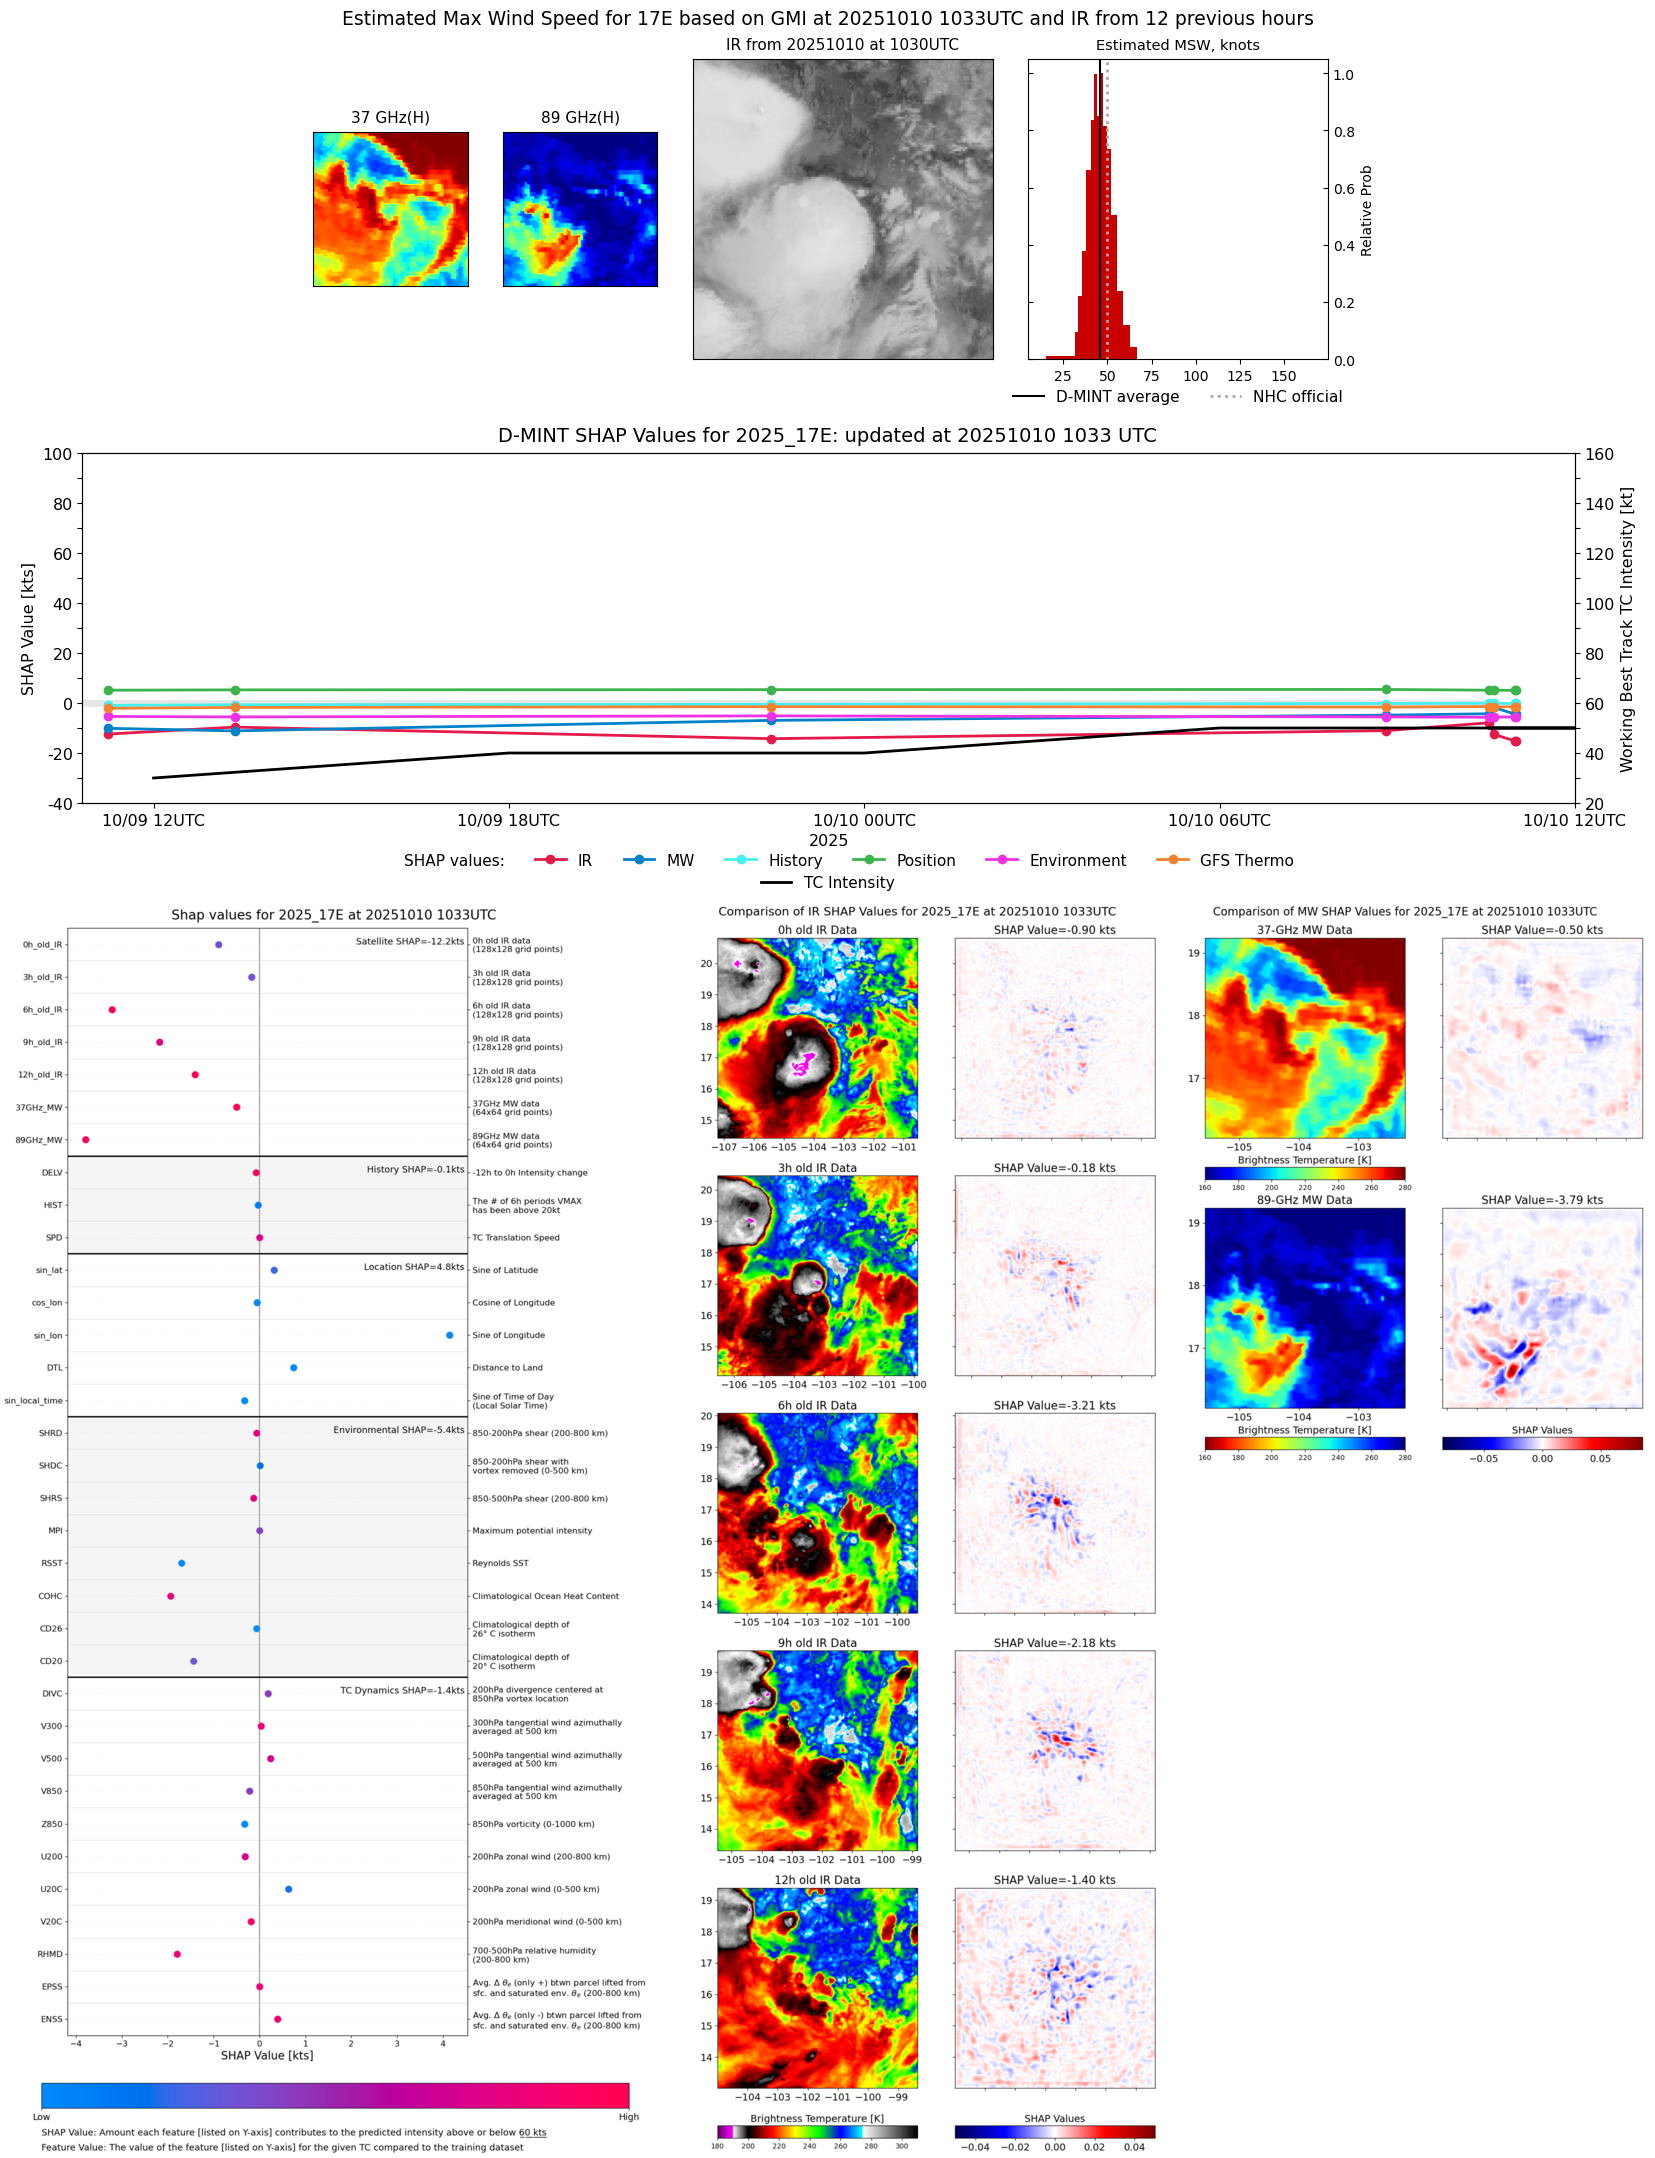 |
| 20251010 | 0849 UTC | AMSR2 | 1002 hPa | 42 kts | 37 kts | 47 kts |  |
| 20251010 | 0808 UTC | ATMS-N21 | 996 hPa | 49 kts | 44 kts | 54 kts |  |
| 20251010 | 0516 UTC | TMS06 | 999 hPa | 41 kts | 37 kts | 46 kts | 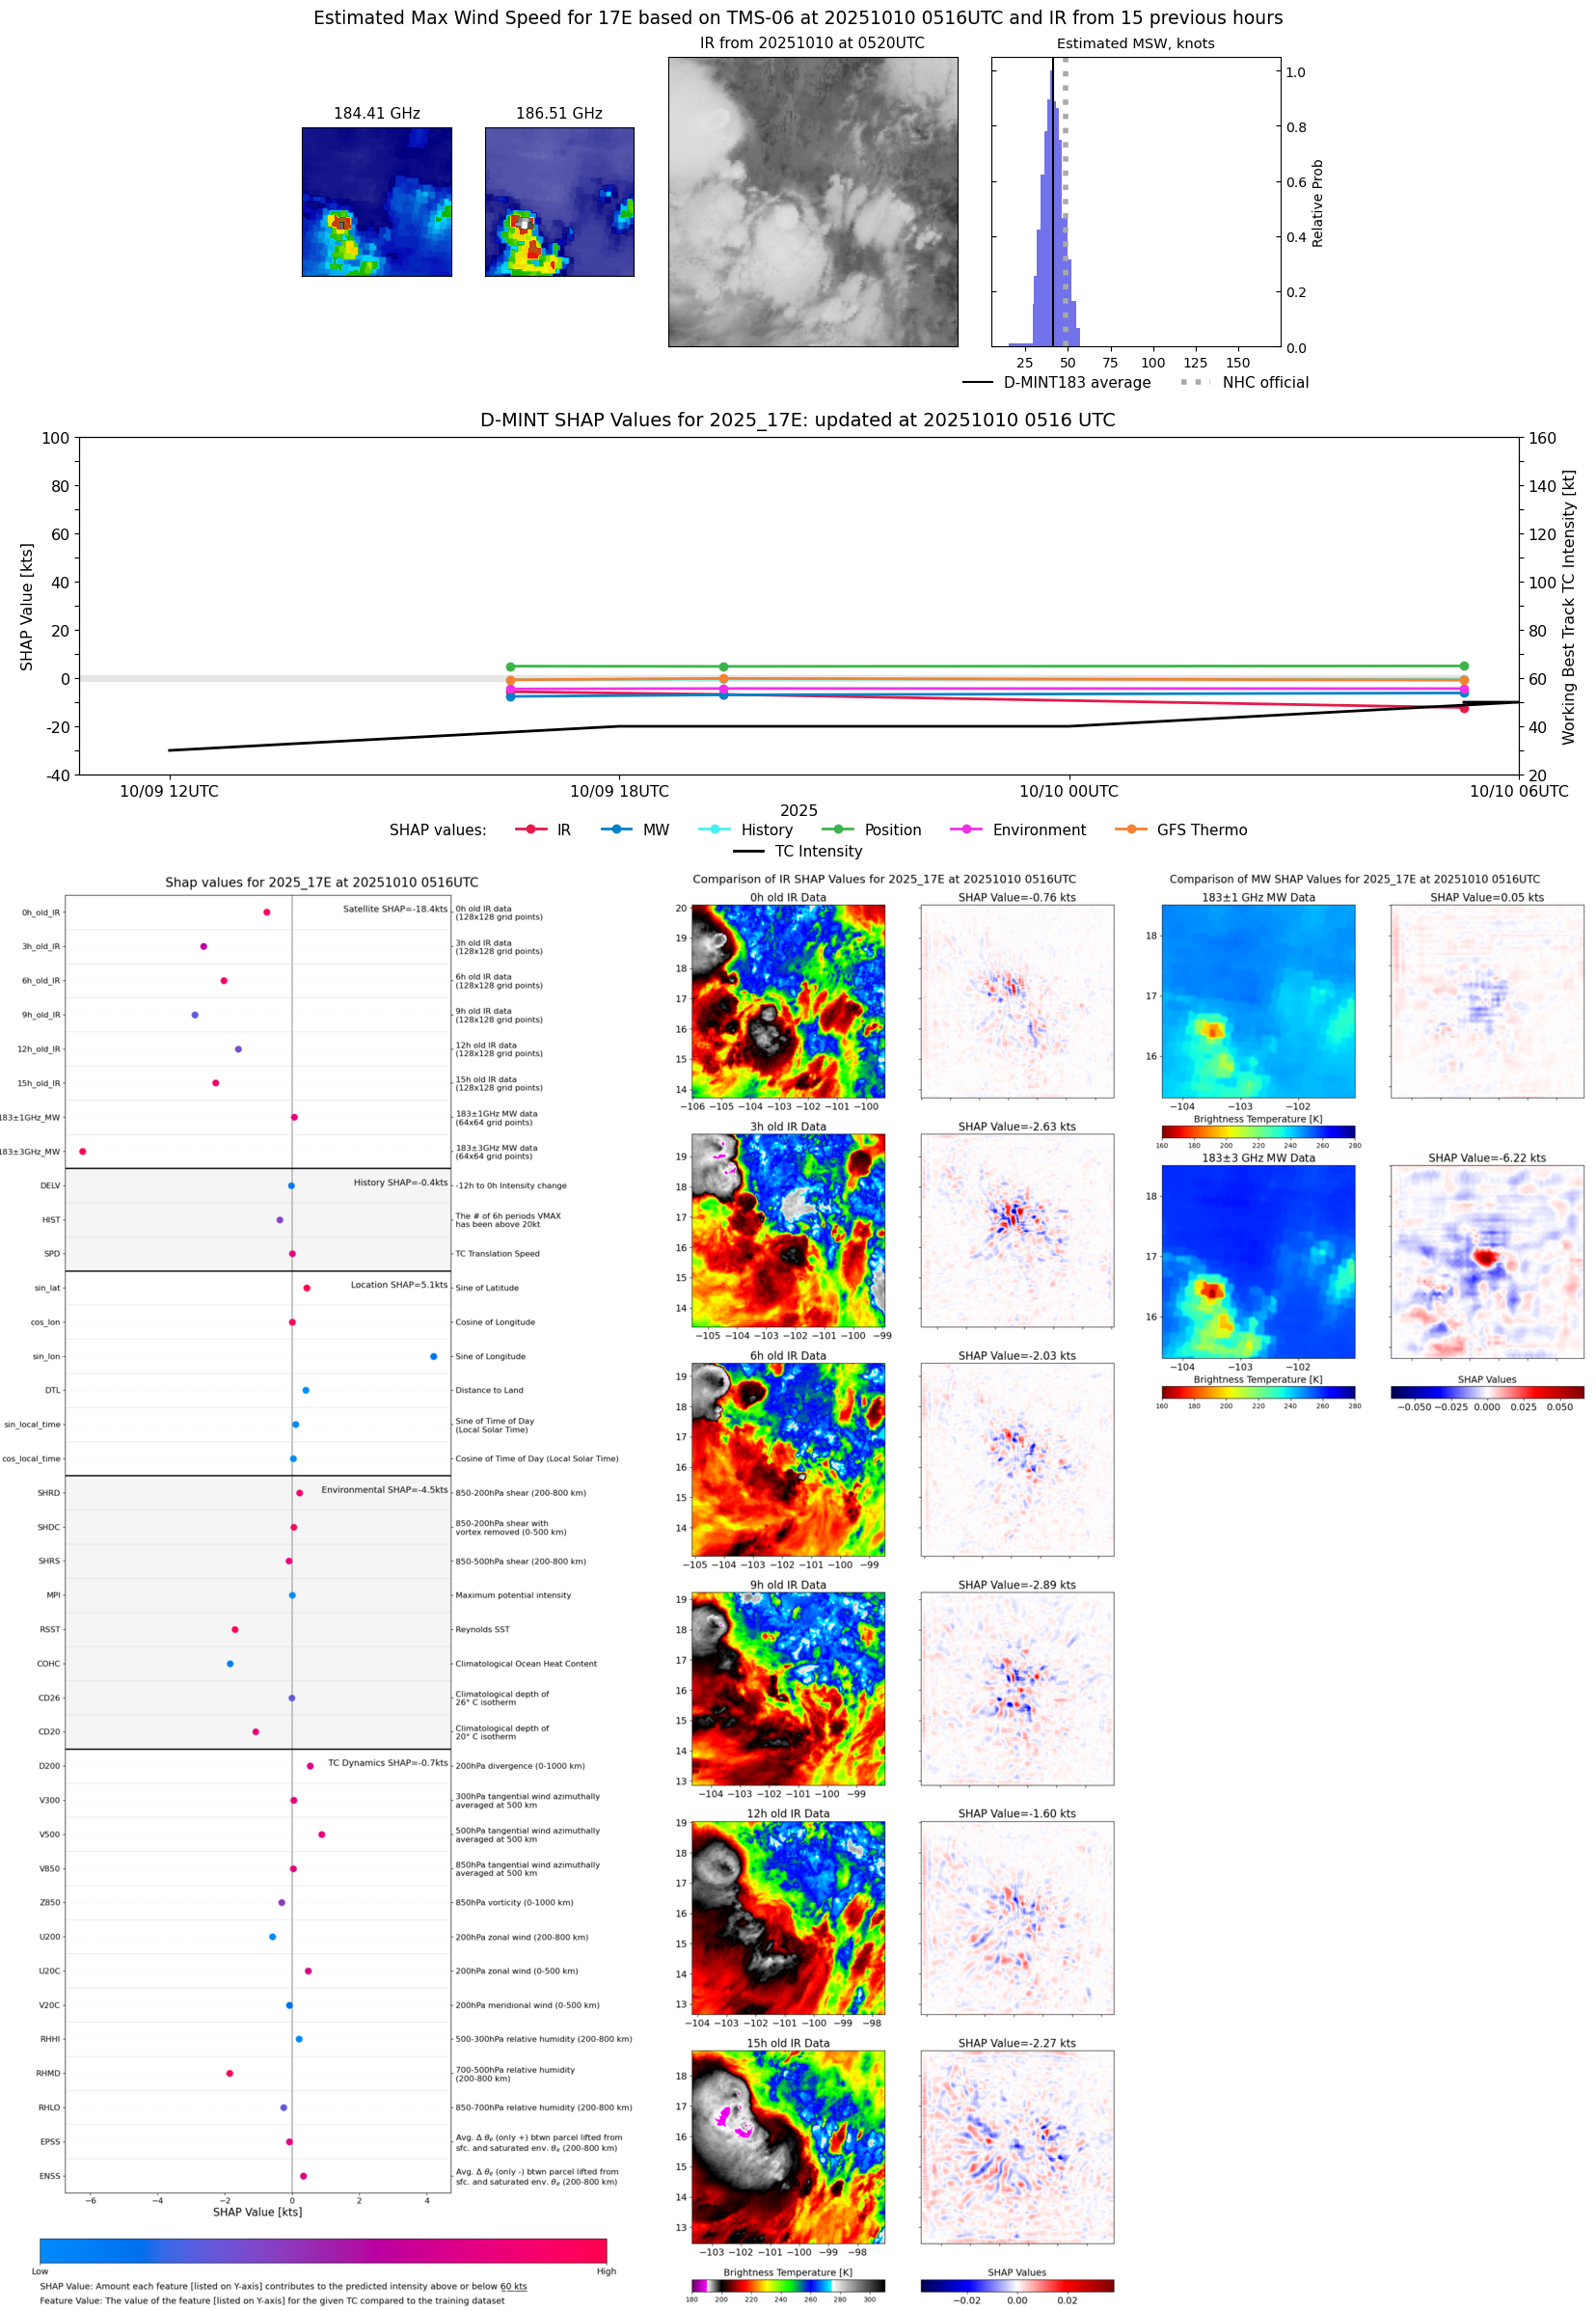 |
| 20251009 | 0807 UTC | AMSR2 | NaN hPa | 37 kts | 33 kts | 43 kts | 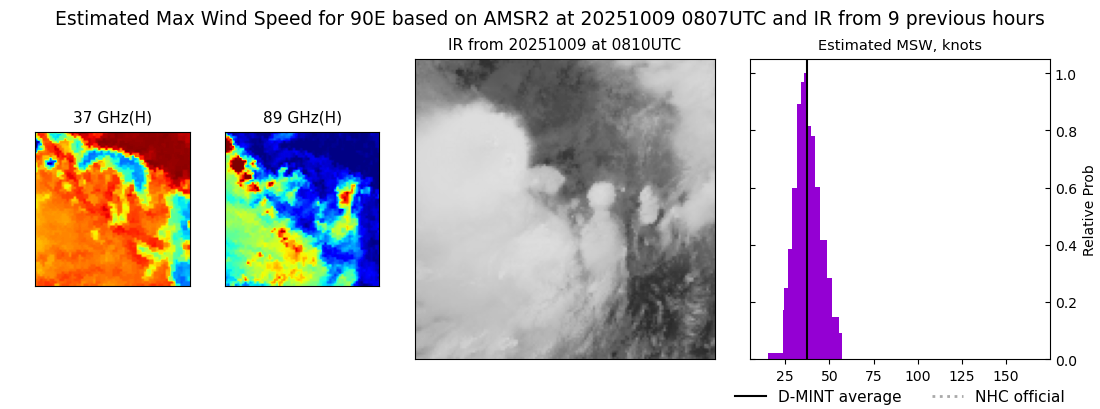 |
| 20251009 | 2226 UTC | SSMISF18 | 1000 hPa | 37 kts | 33 kts | 41 kts |  |
| 20251009 | 2226 UTC | SSMISF18 | 1000 hPa | 37 kts | 33 kts | 41 kts |  |
| 20251009 | 1923 UTC | TMS07 | 997 hPa | 46 kts | 42 kts | 51 kts | 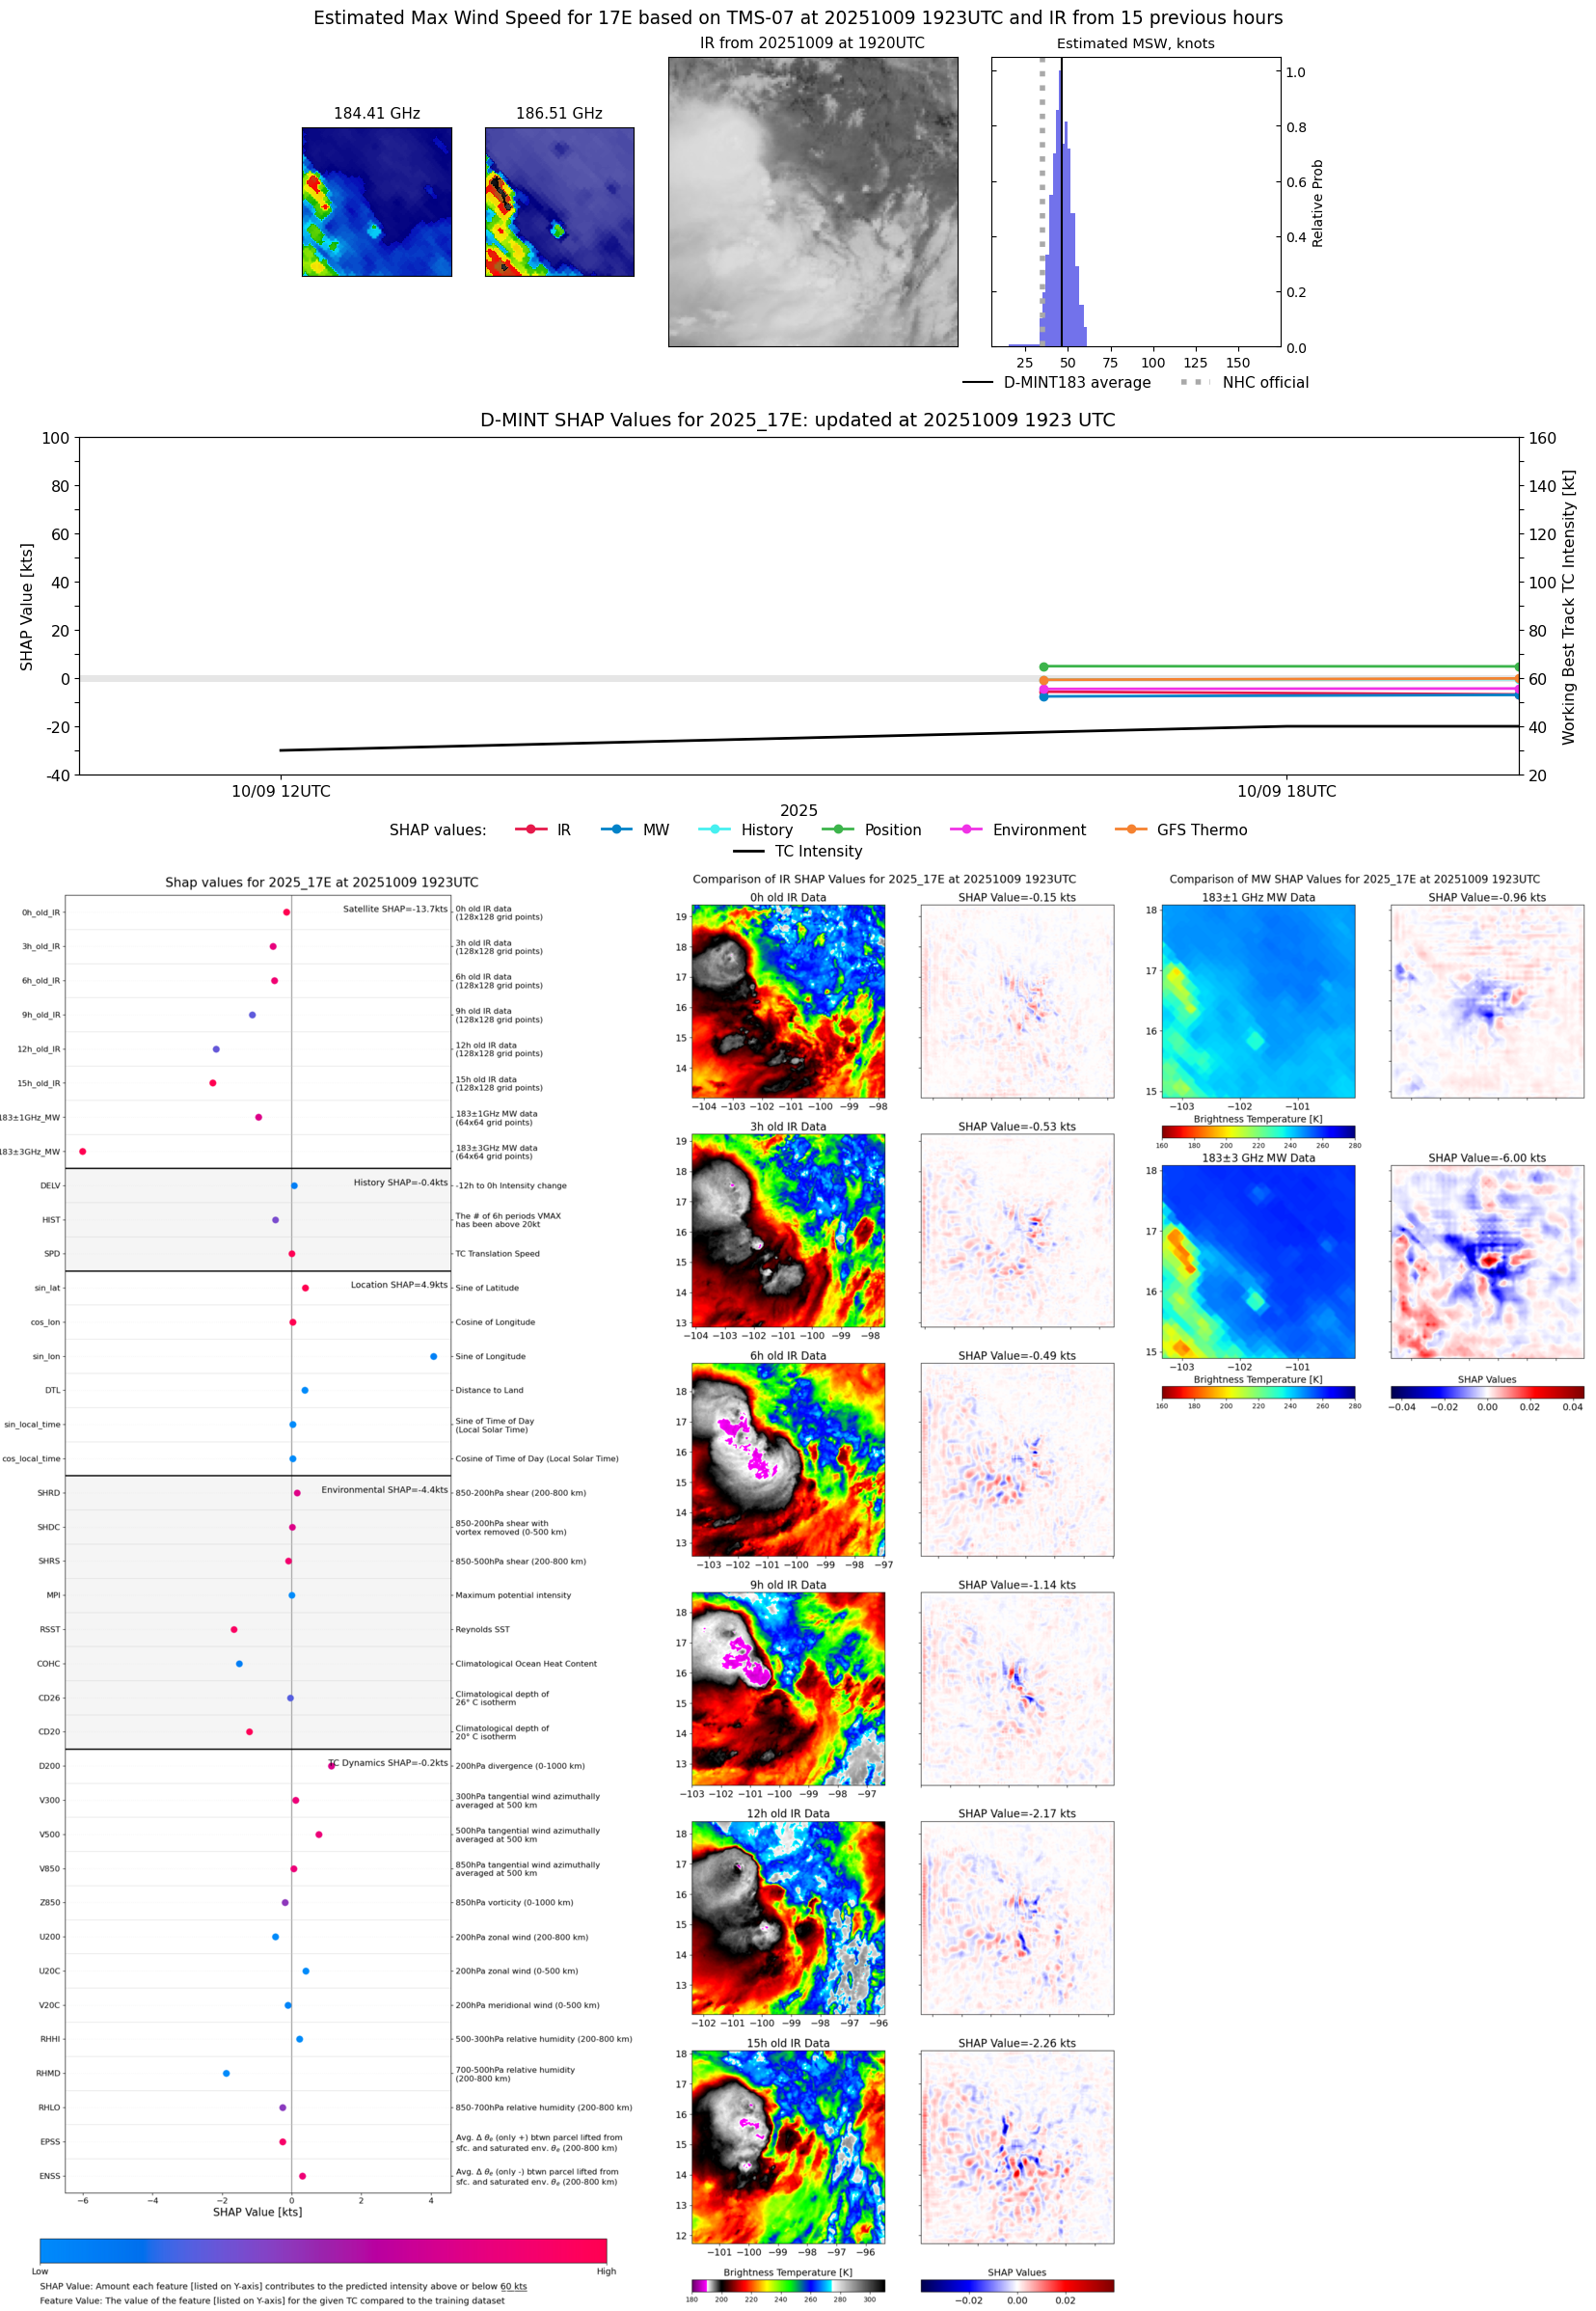 |
| 20251009 | 1633 UTC | TMS05 | 999 hPa | 46 kts | 41 kts | 50 kts | 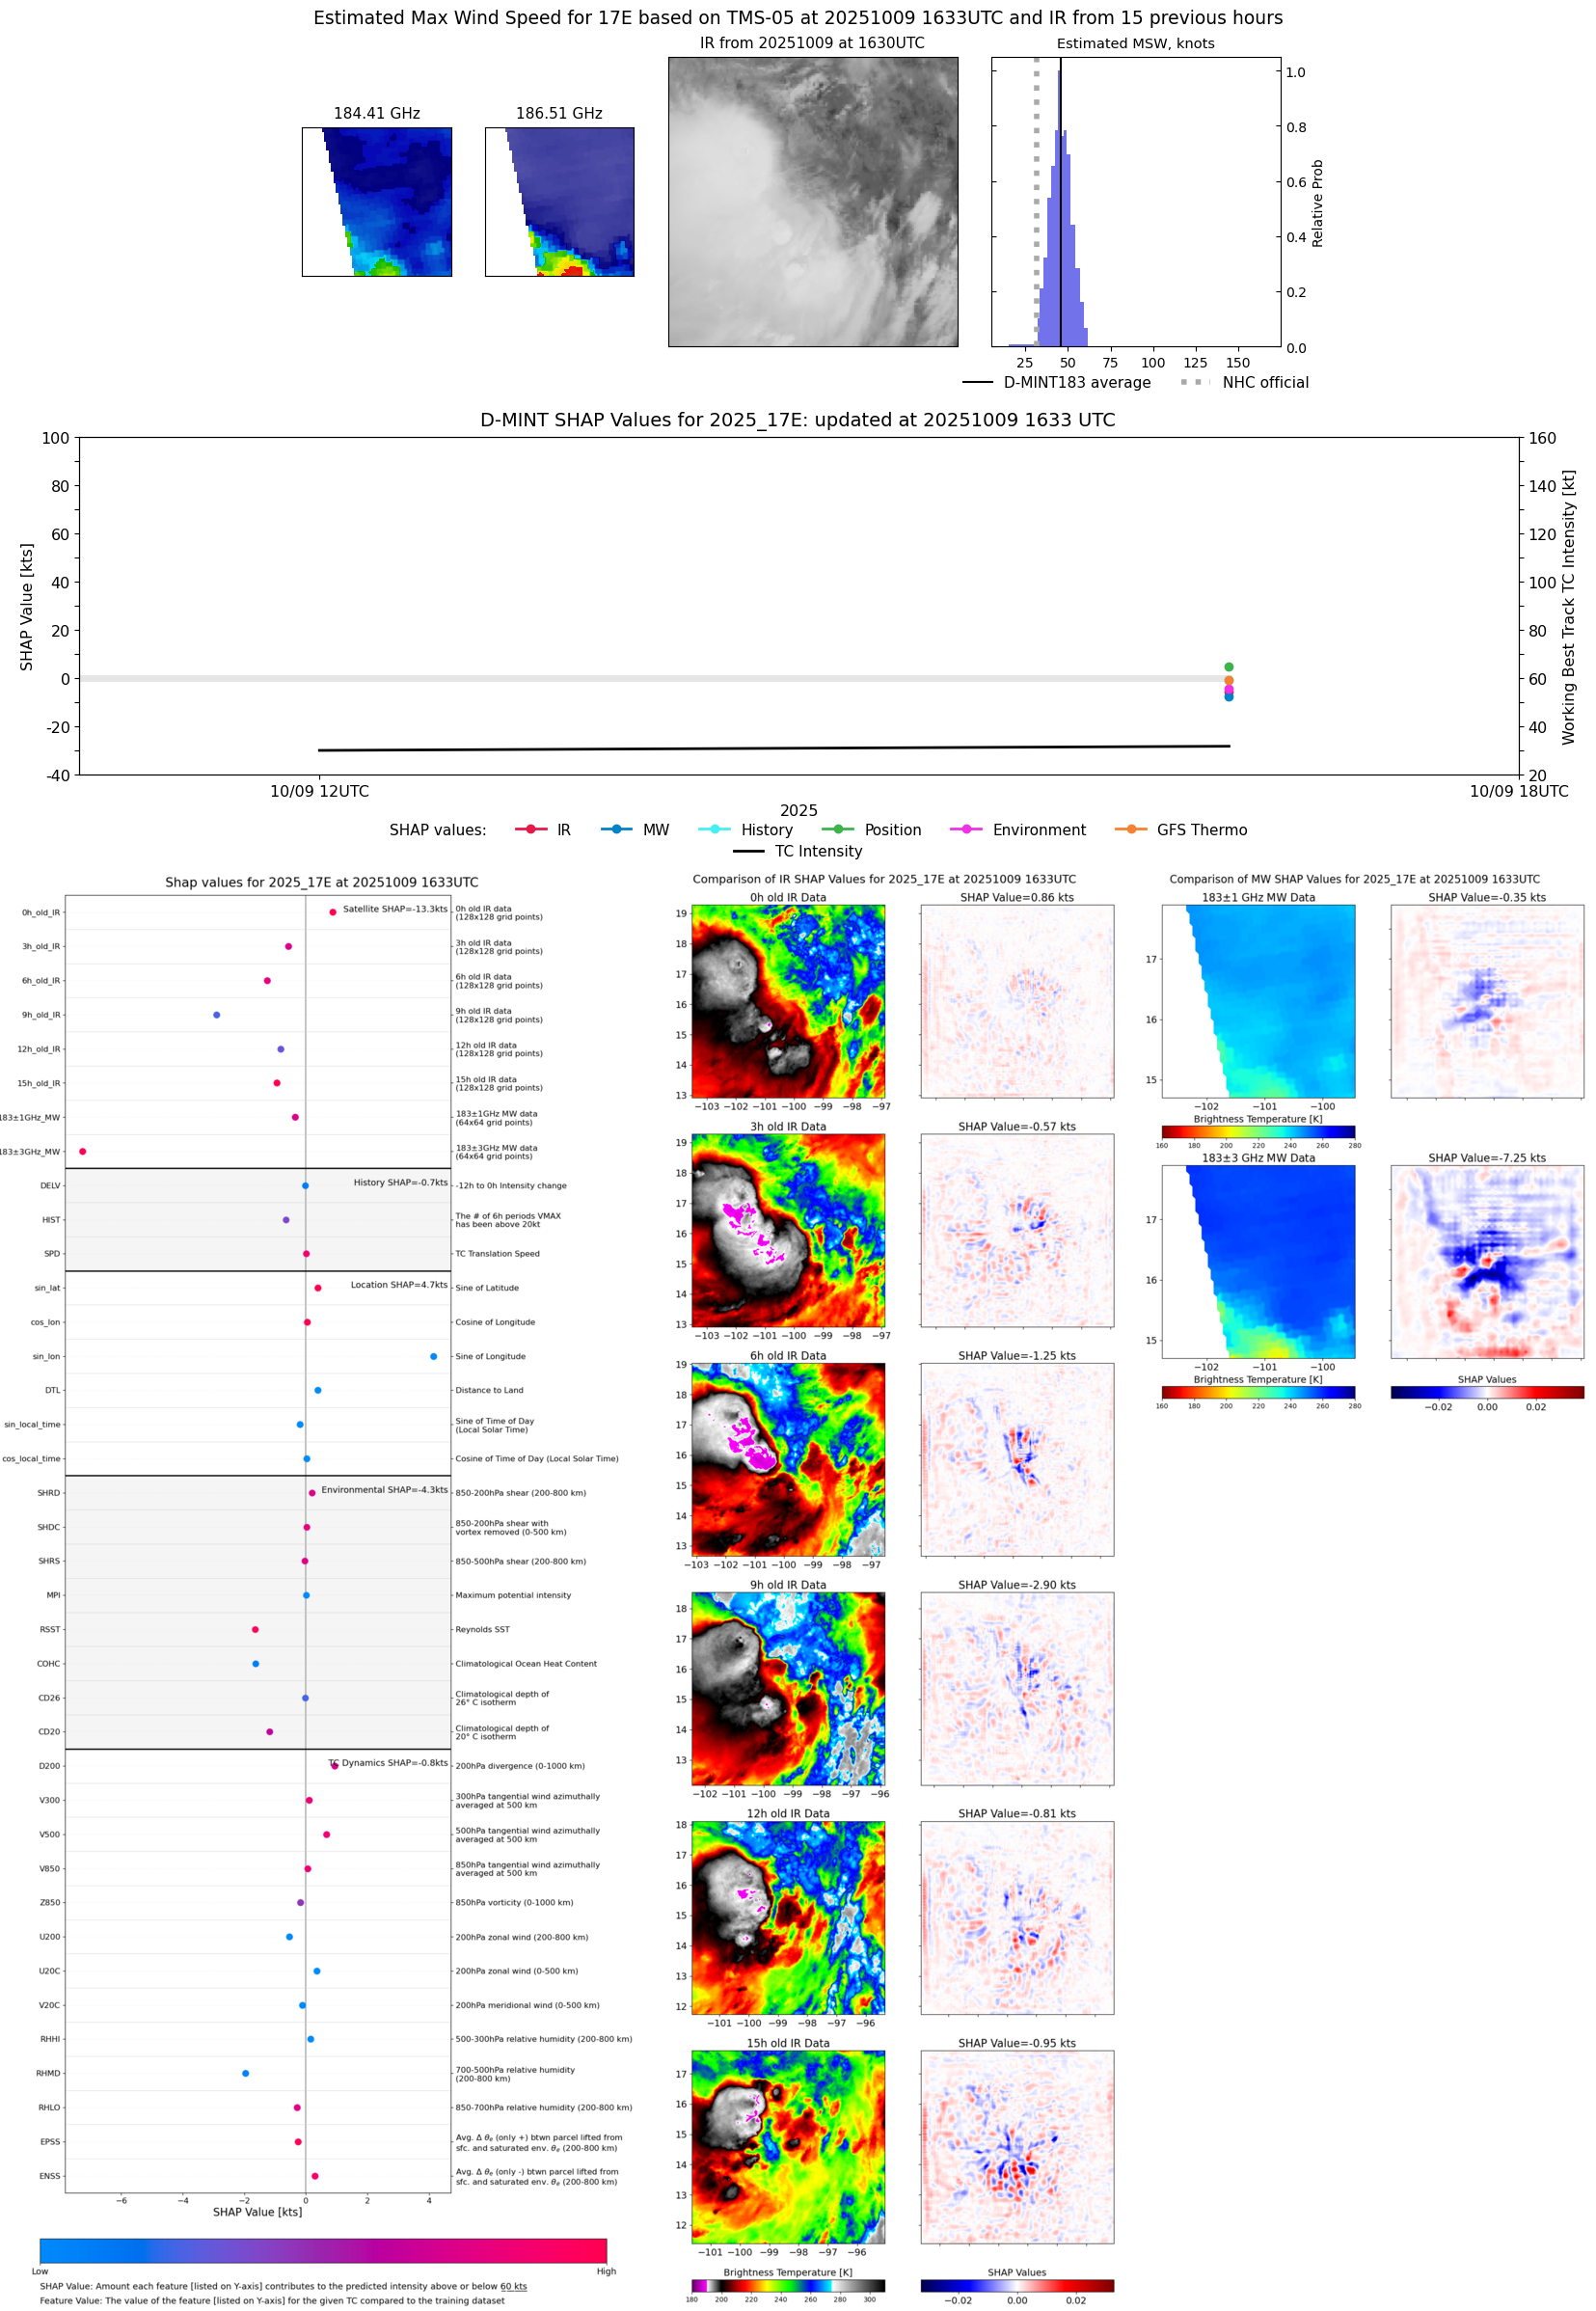 |
| 20251009 | 1322 UTC | SSMISF16 | 1002 hPa | 36 kts | 32 kts | 41 kts | 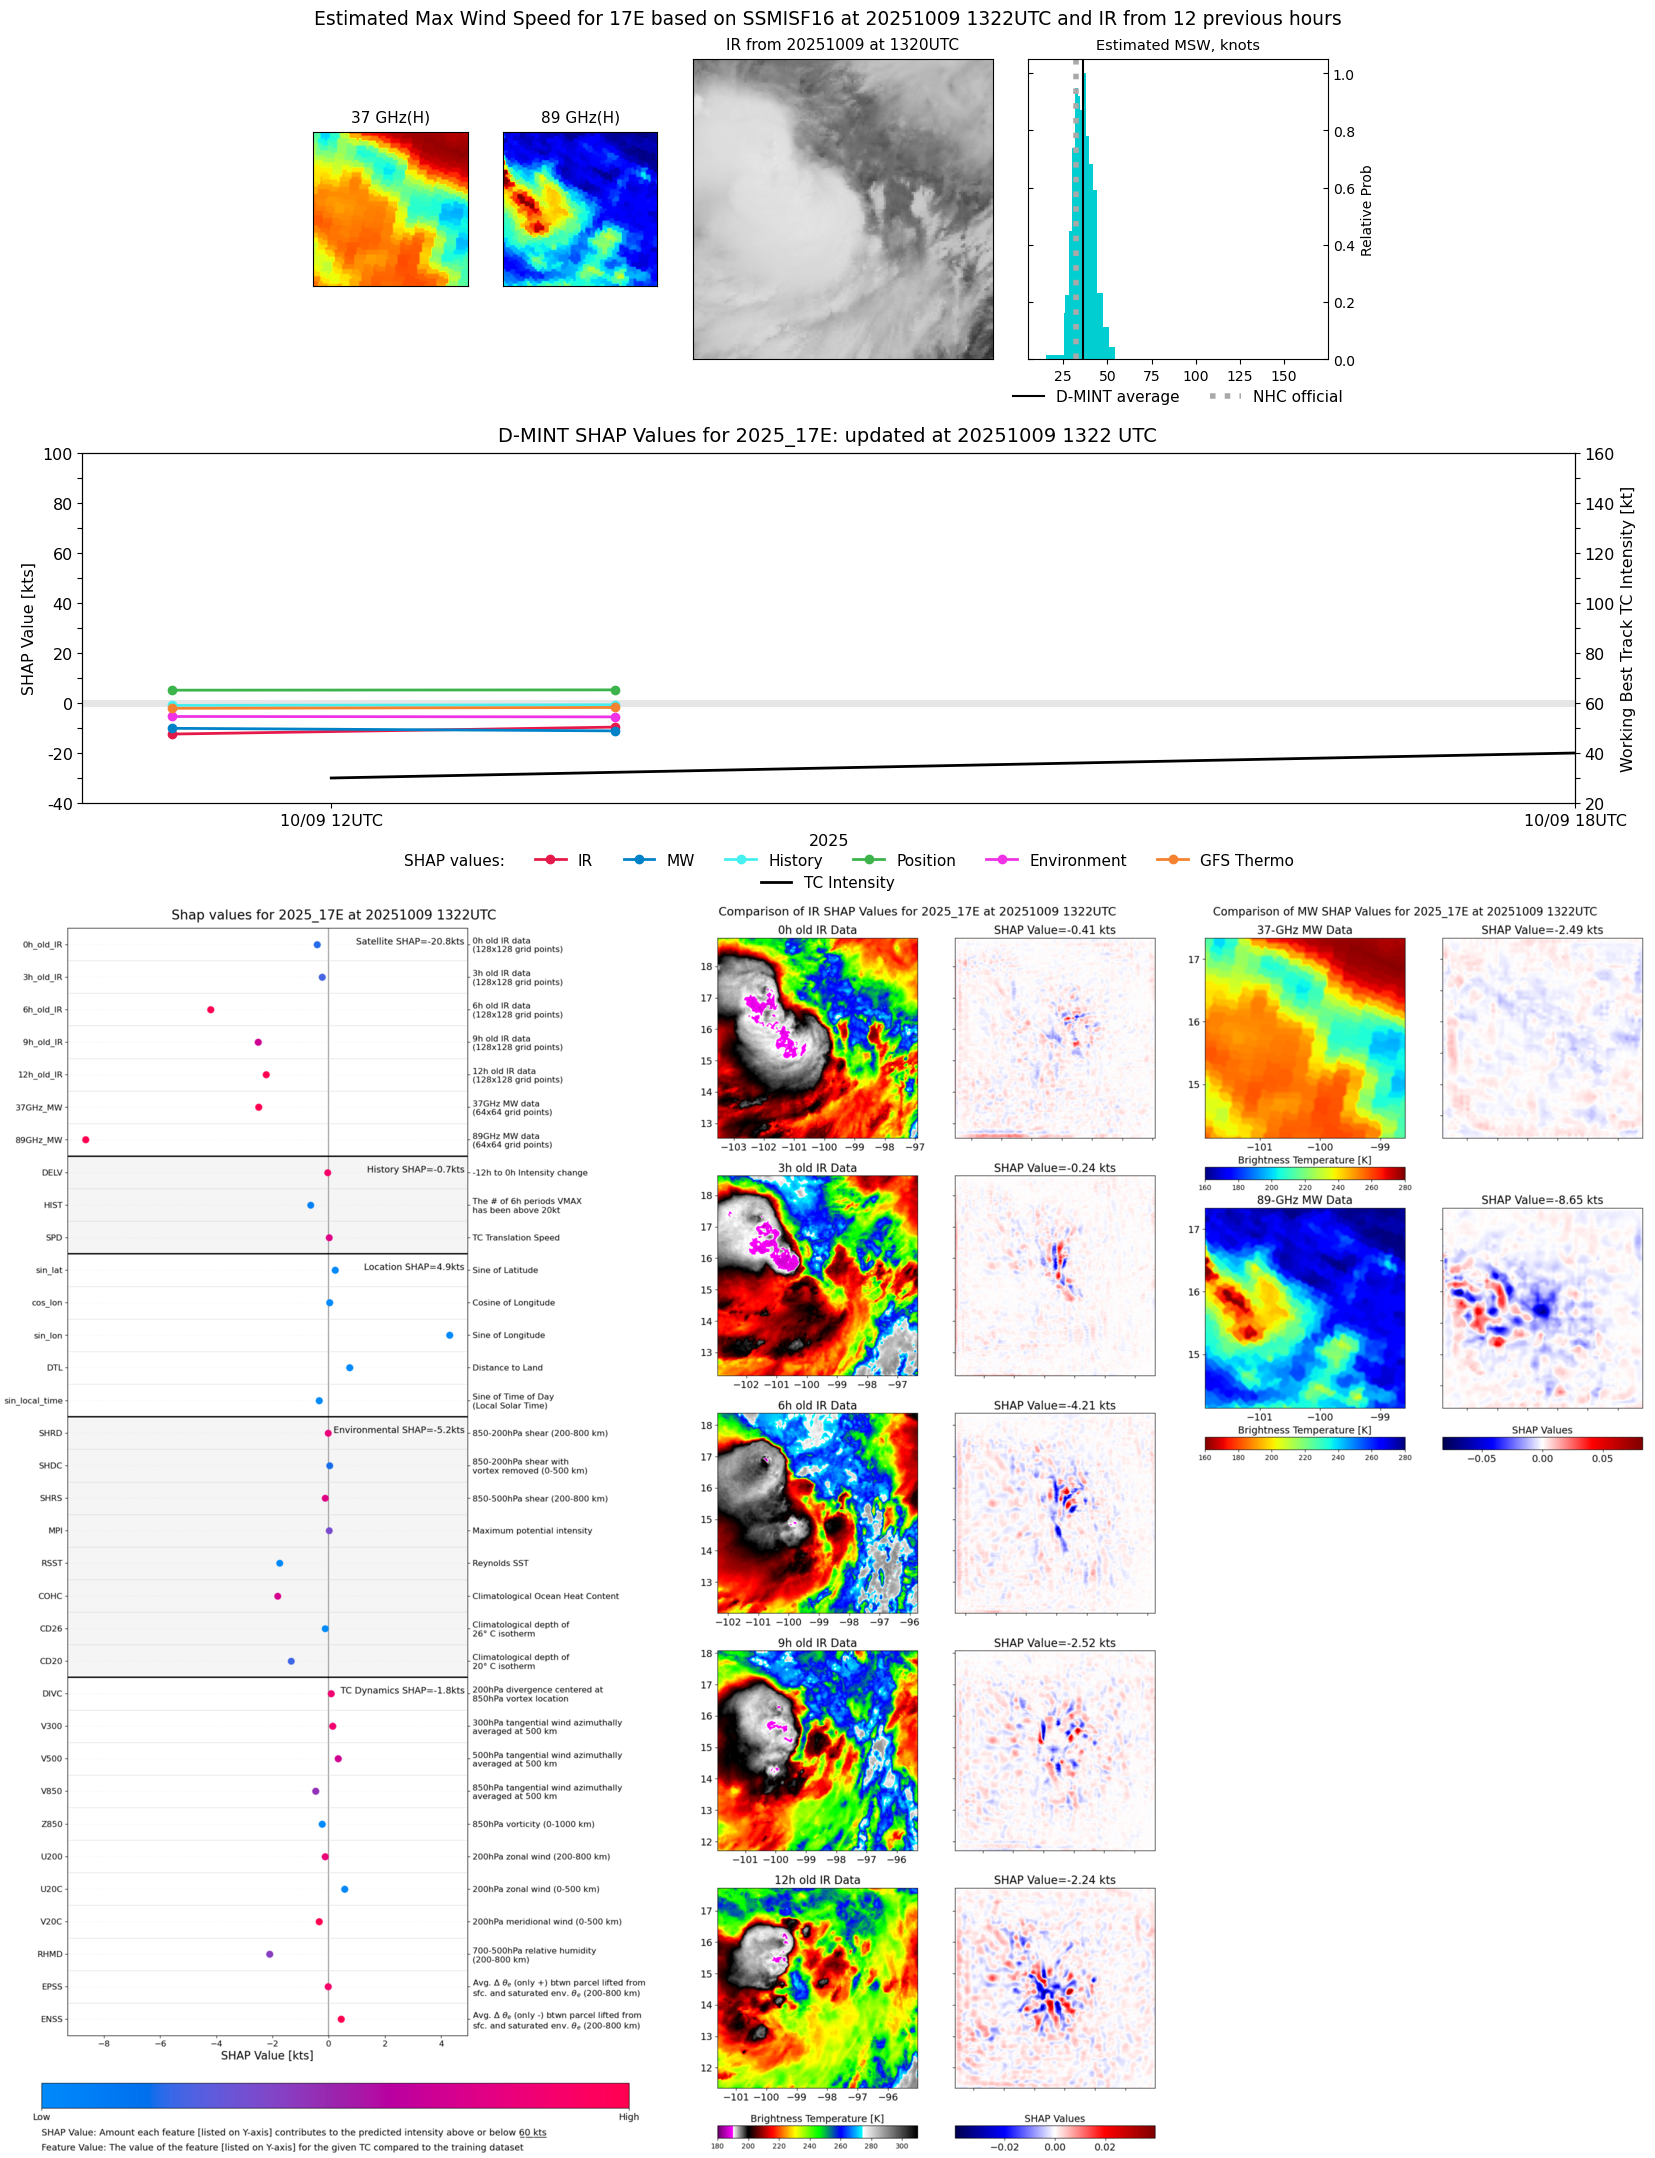 |
| 20251009 | 1249 UTC | WSFM01 | 1002 hPa | 33 kts | 29 kts | 37 kts |  |
| 20251009 | 1229 UTC | SSMISF17 | 1002 hPa | 33 kts | 29 kts | 37 kts | 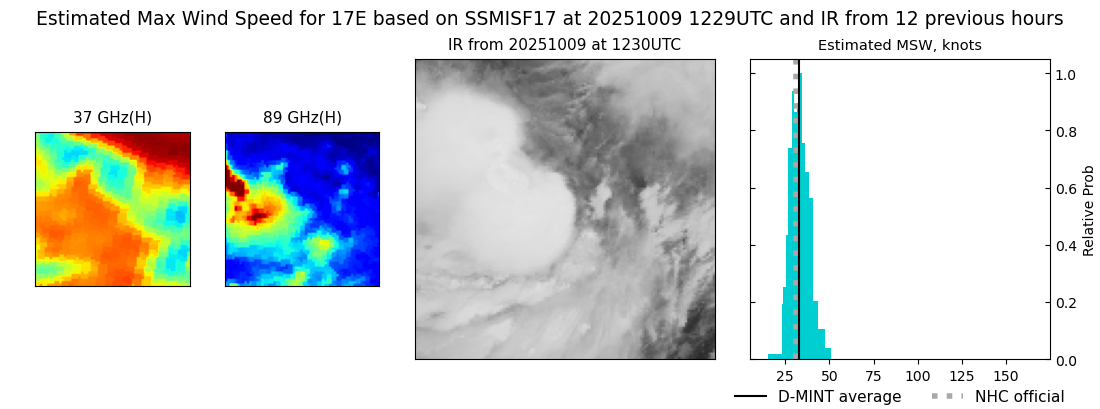 |
| 20251009 | 1114 UTC | SSMISF18 | 1004 hPa | 34 kts | 30 kts | 39 kts | 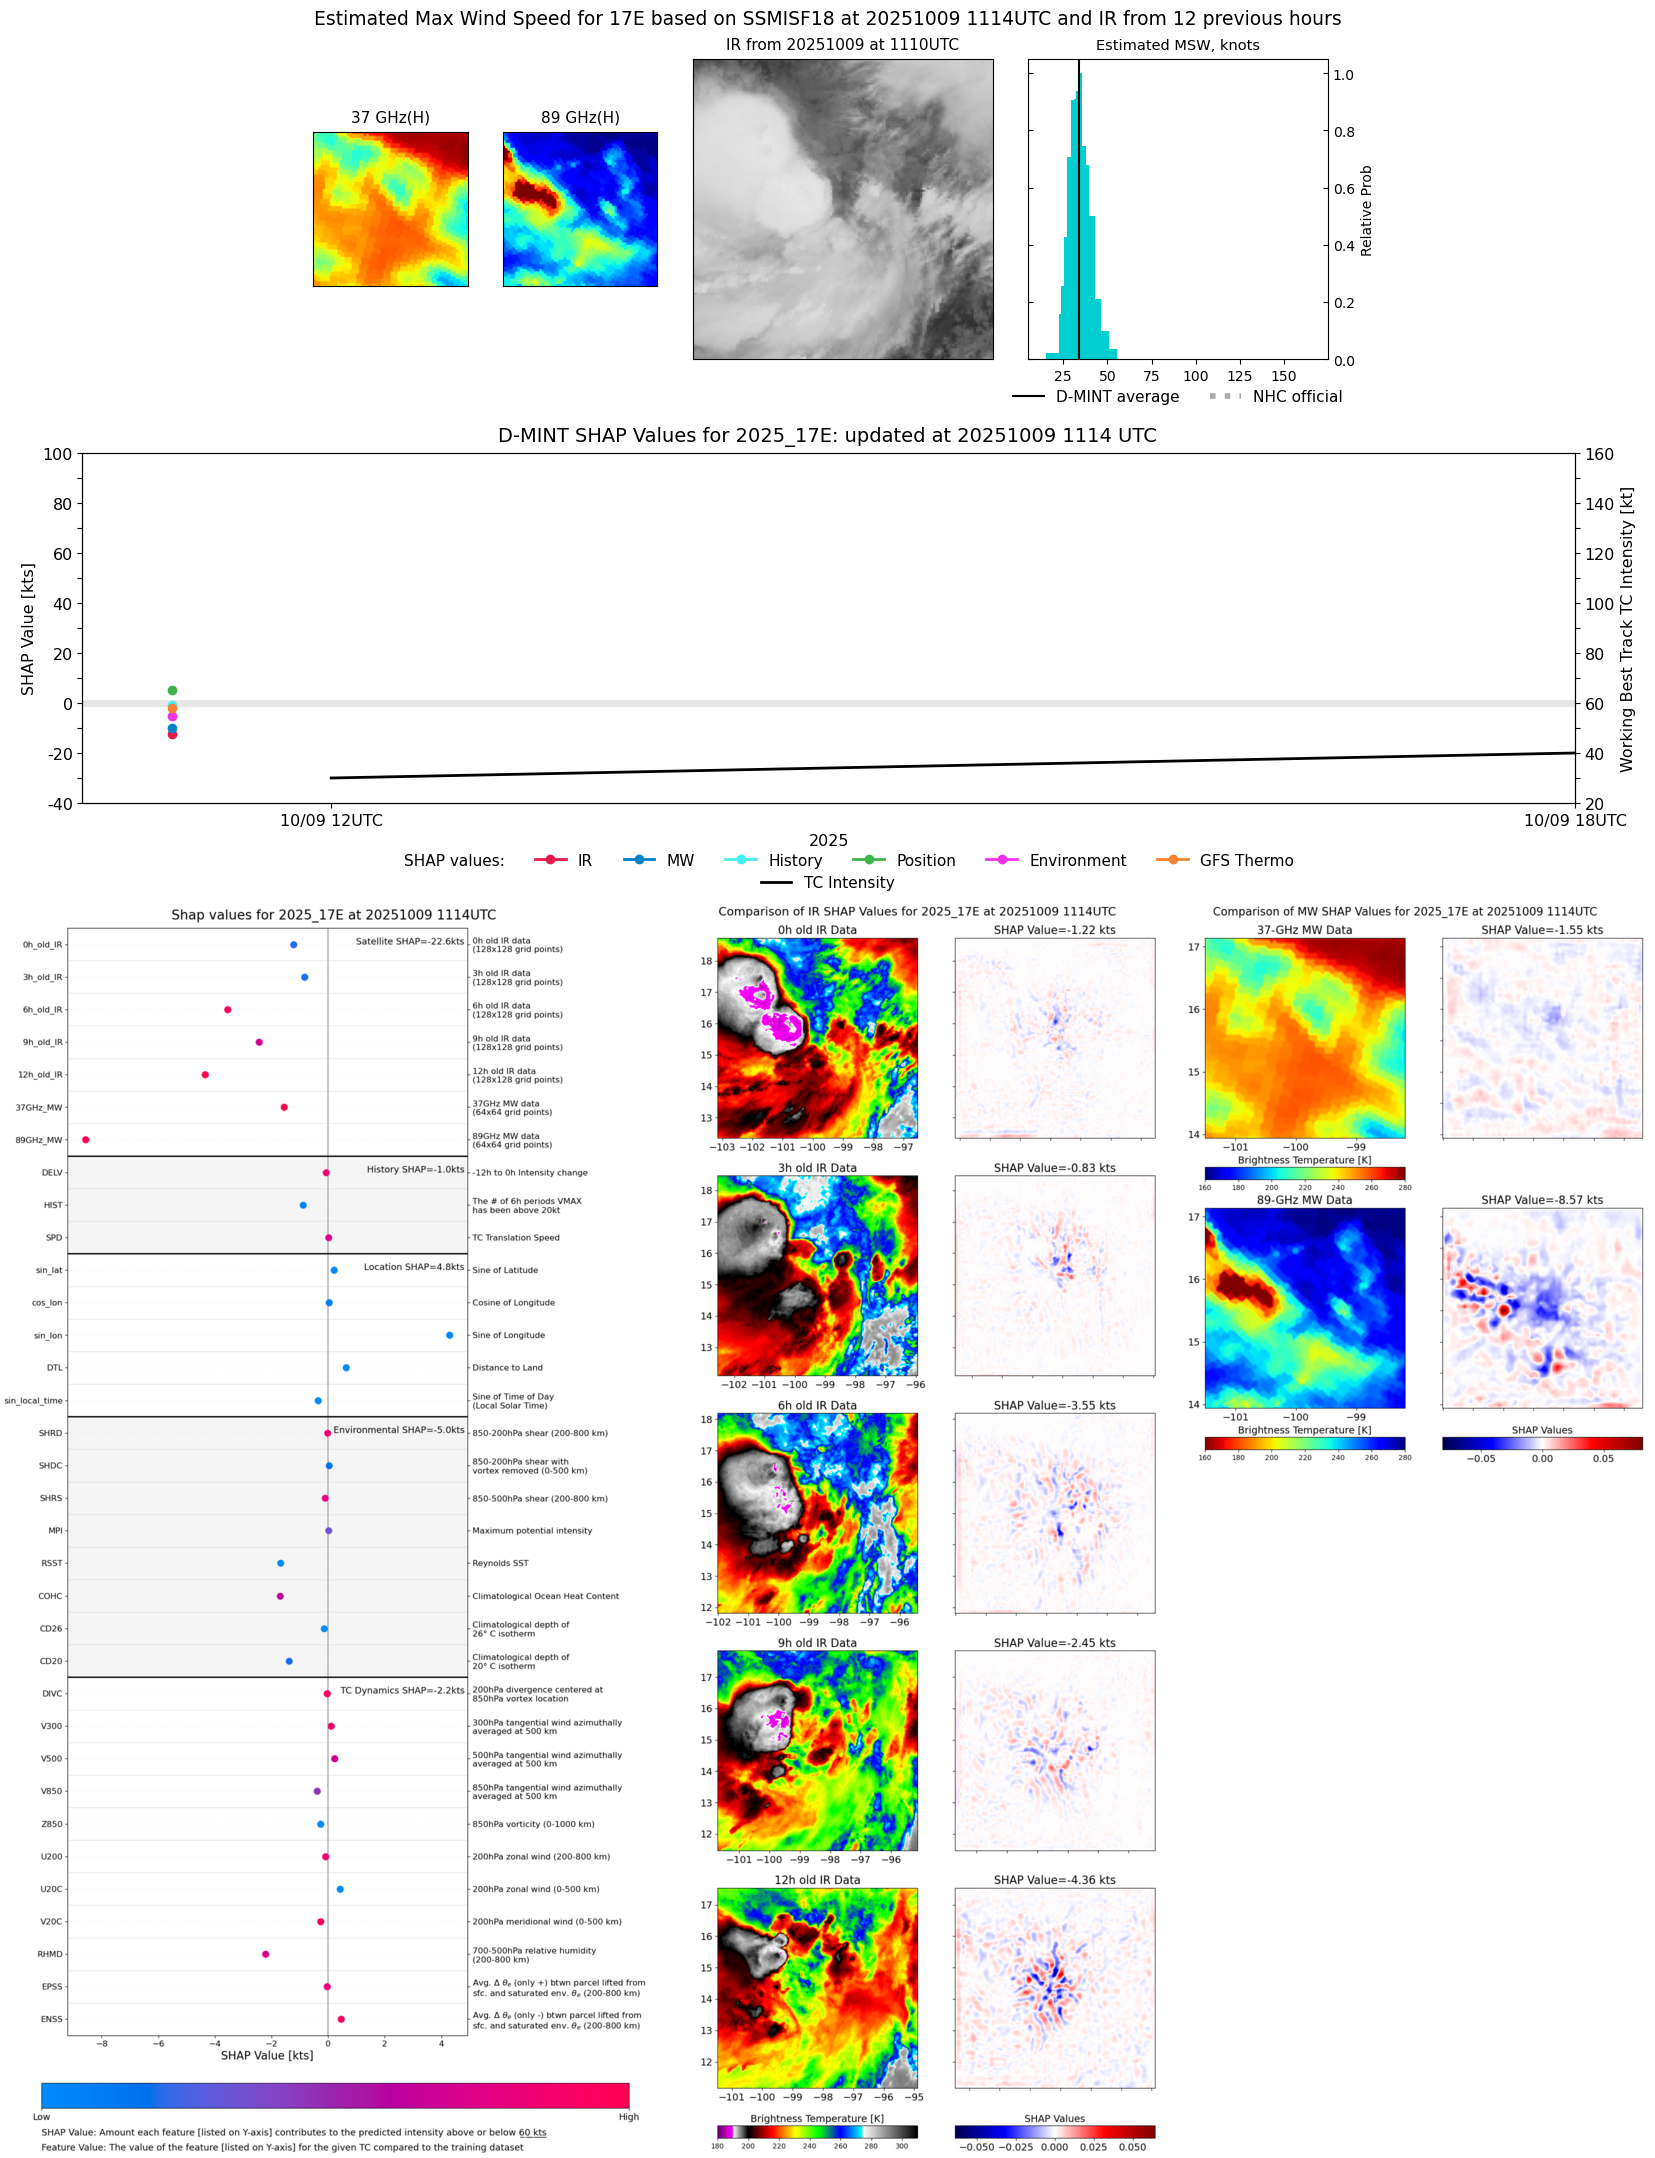 |
| 20251008 | 1953 UTC | AMSR2 | NaN hPa | 32 kts | 28 kts | 37 kts | 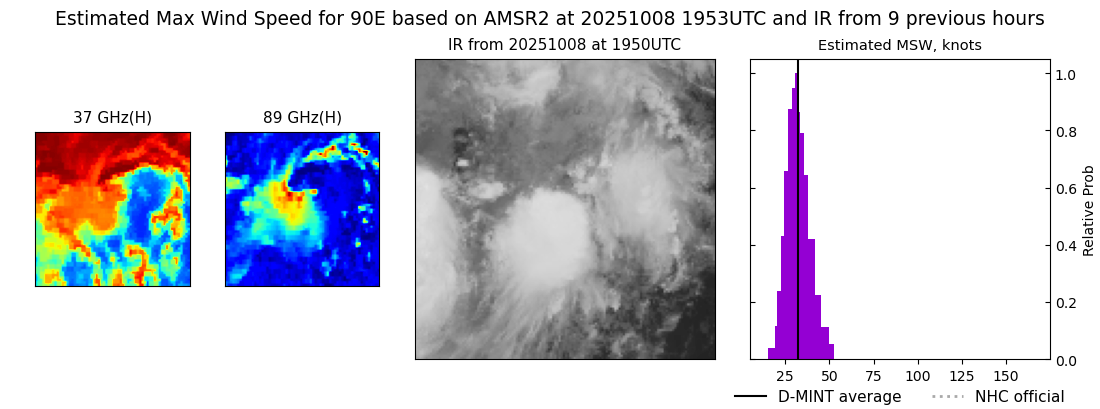 |
| 20251008 | 1026 UTC | GMI | NaN hPa | 30 kts | 26 kts | 34 kts | 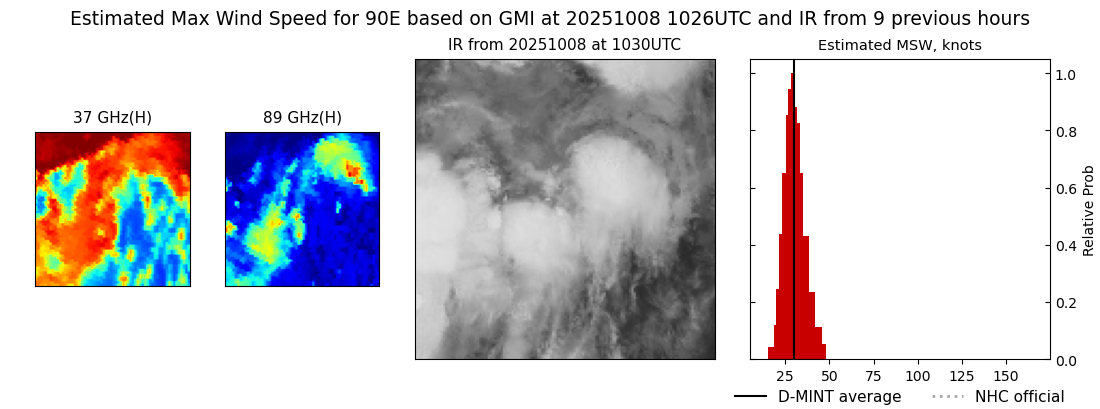 |
| 20251007 | 1911 UTC | AMSR2 | NaN hPa | 22 kts | 20 kts | 25 kts |  |