|
||

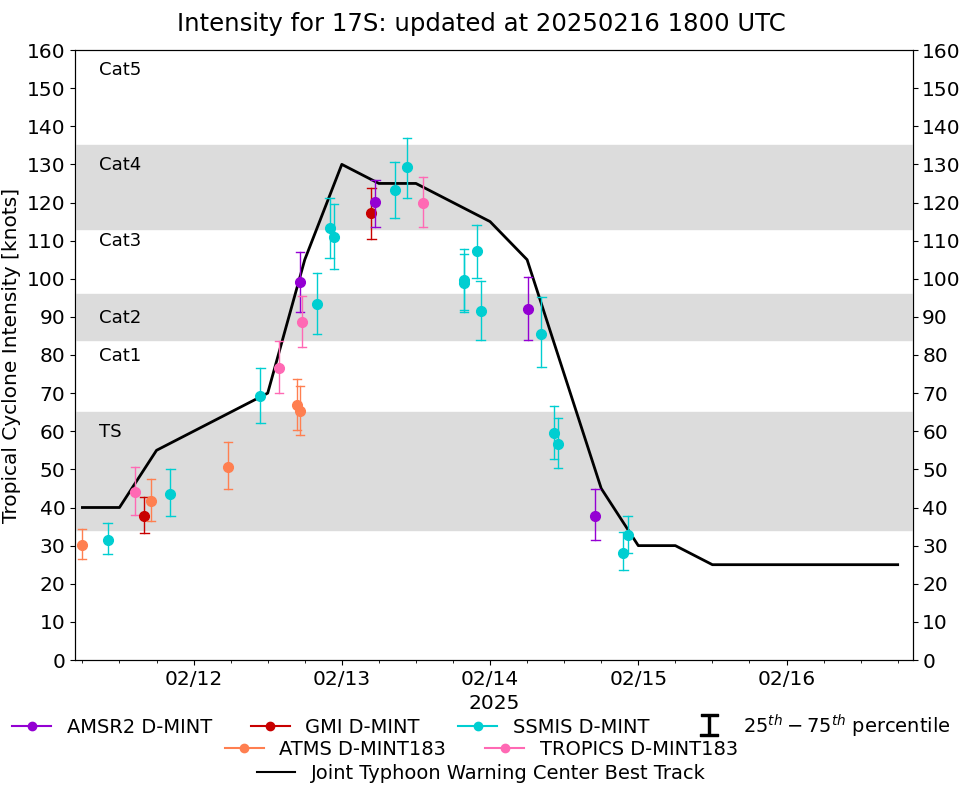 |
D-MINT HISTORY FILE for 2025_17S
| Date | Time | MW Sensor | MSLP | Vmax (30th-70th percentile average) | Vmax 25th percentile | Vmax 75th percentile | Image |
| 20250214 | 2217 UTC | SSMISF16 | 996 hPa | 33 kts | 28 kts | 38 kts | 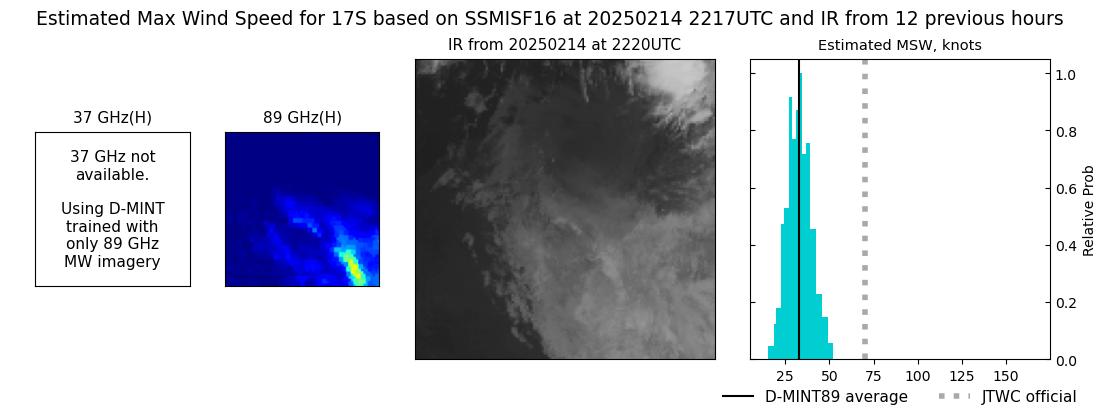 |
| 20250214 | 2135 UTC | SSMISF17 | 996 hPa | 28 kts | 24 kts | 34 kts | 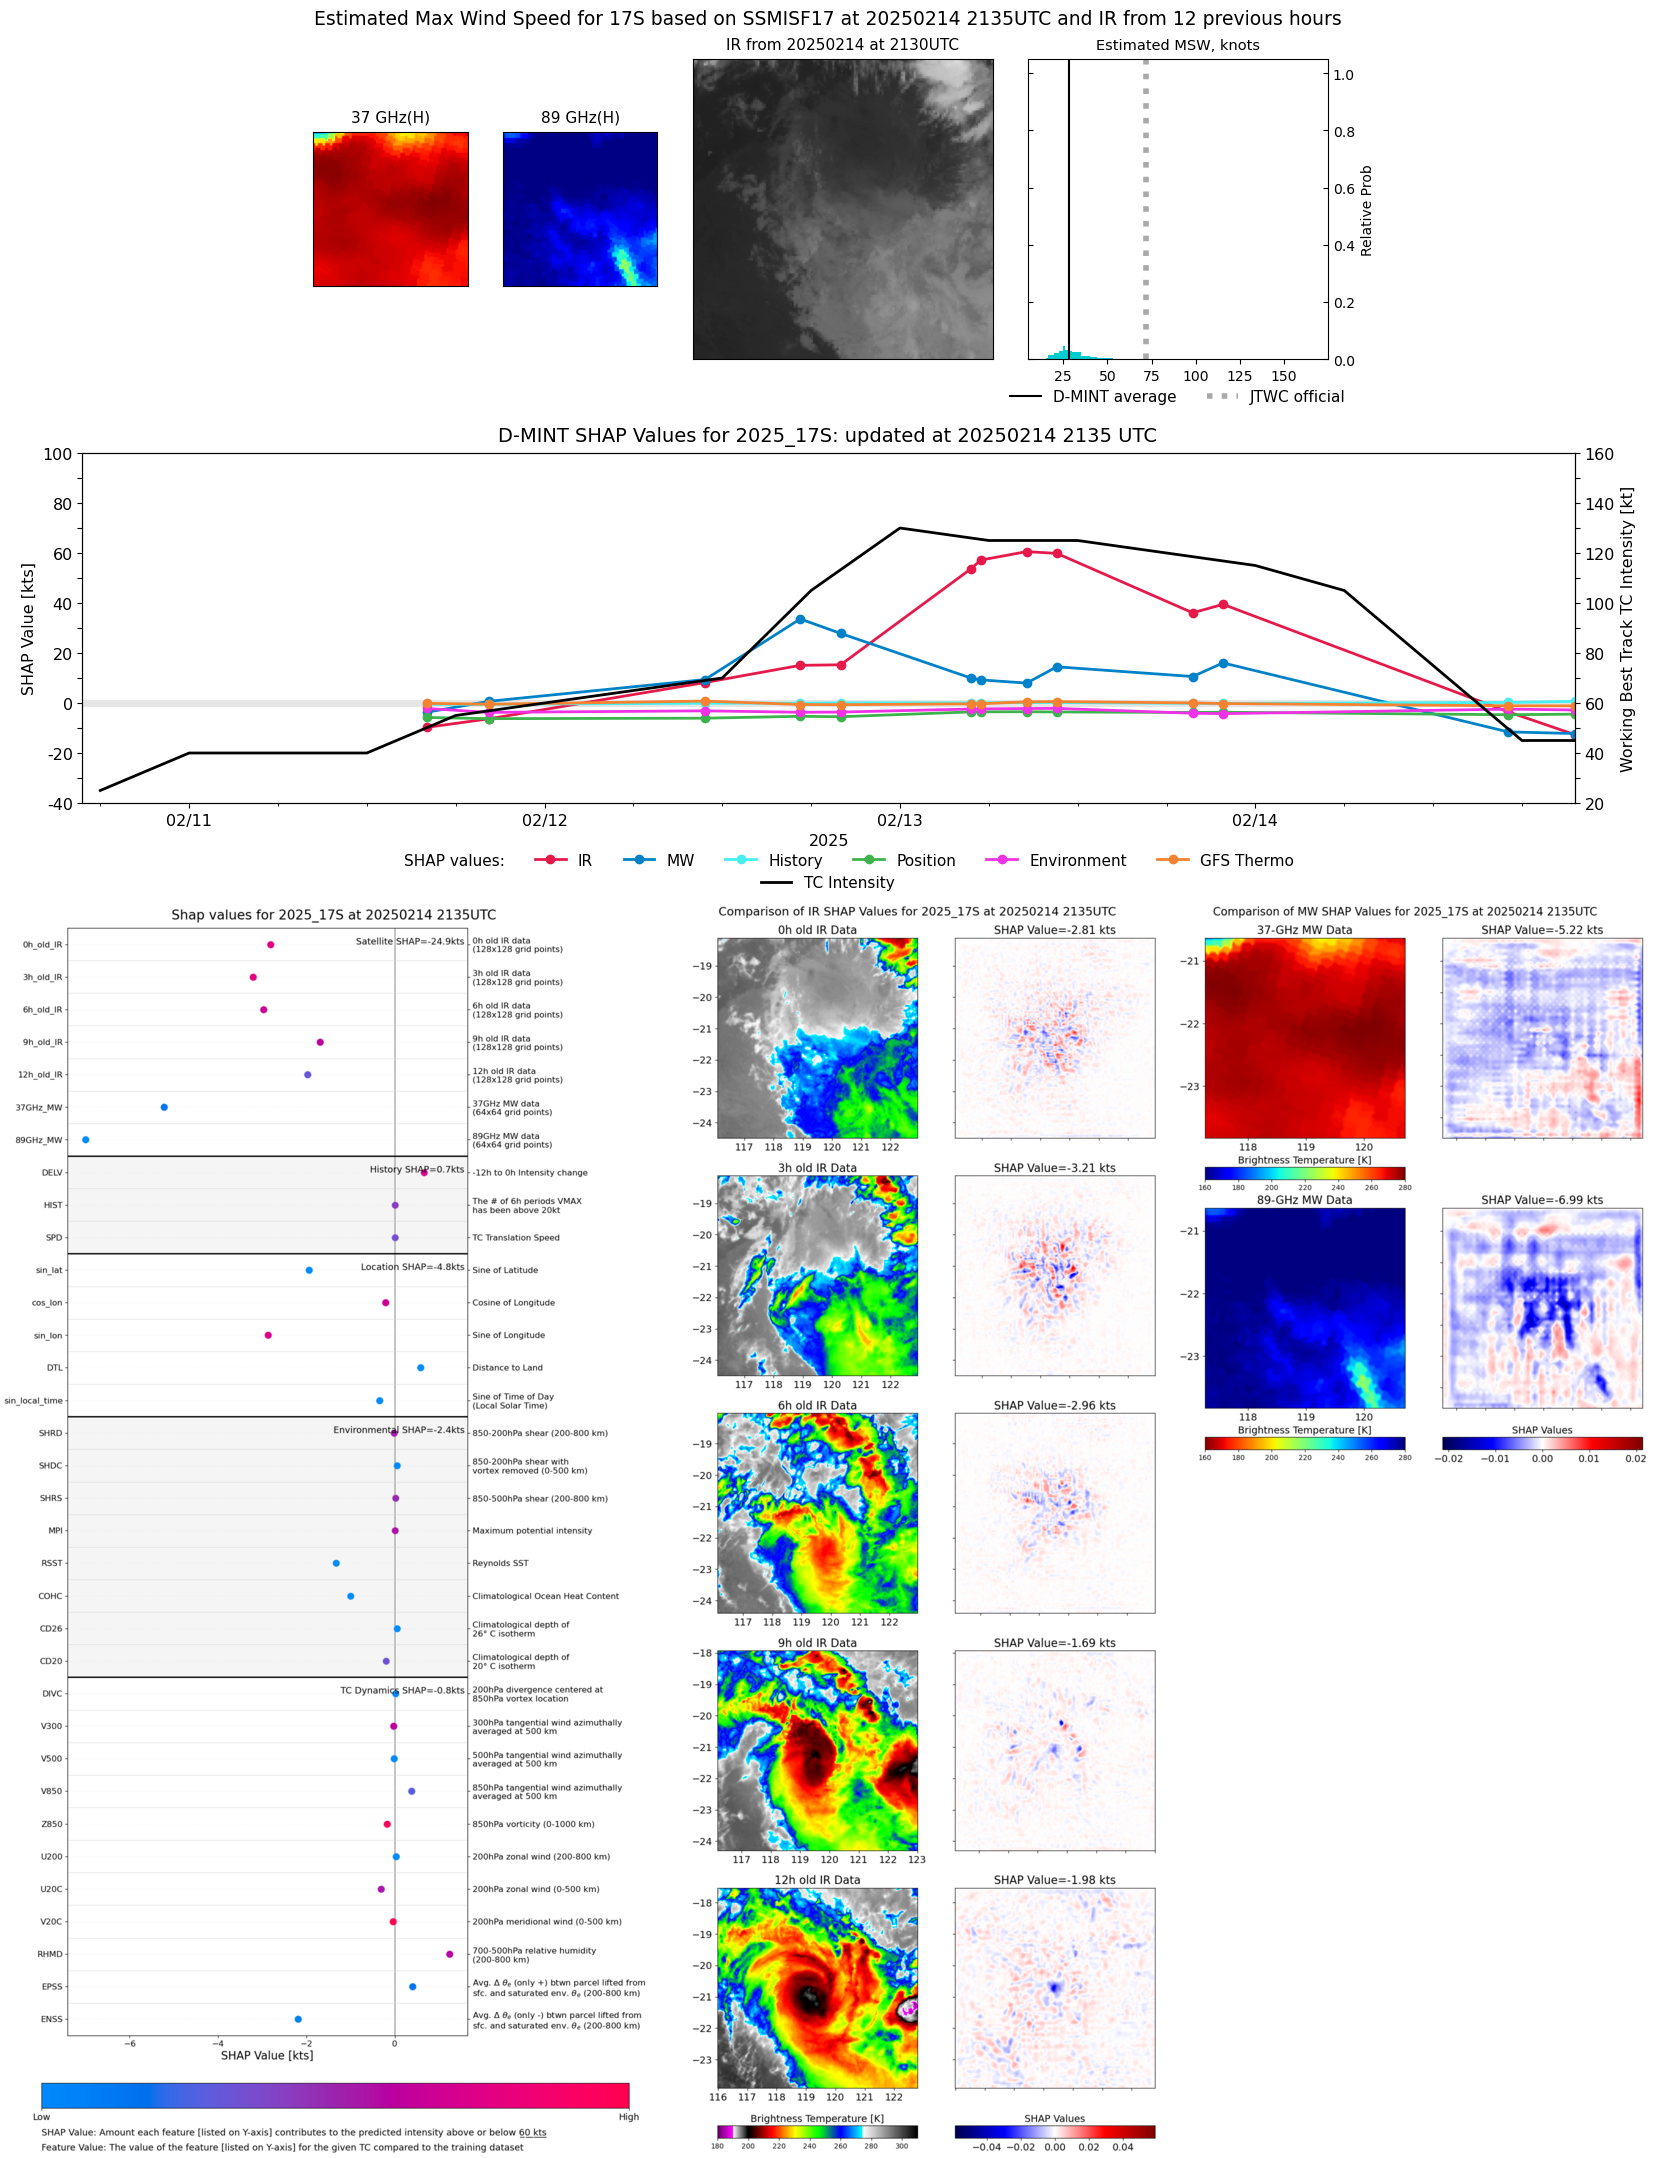 |
| 20250214 | 1704 UTC | AMSR2 | 993 hPa | 38 kts | 31 kts | 45 kts | 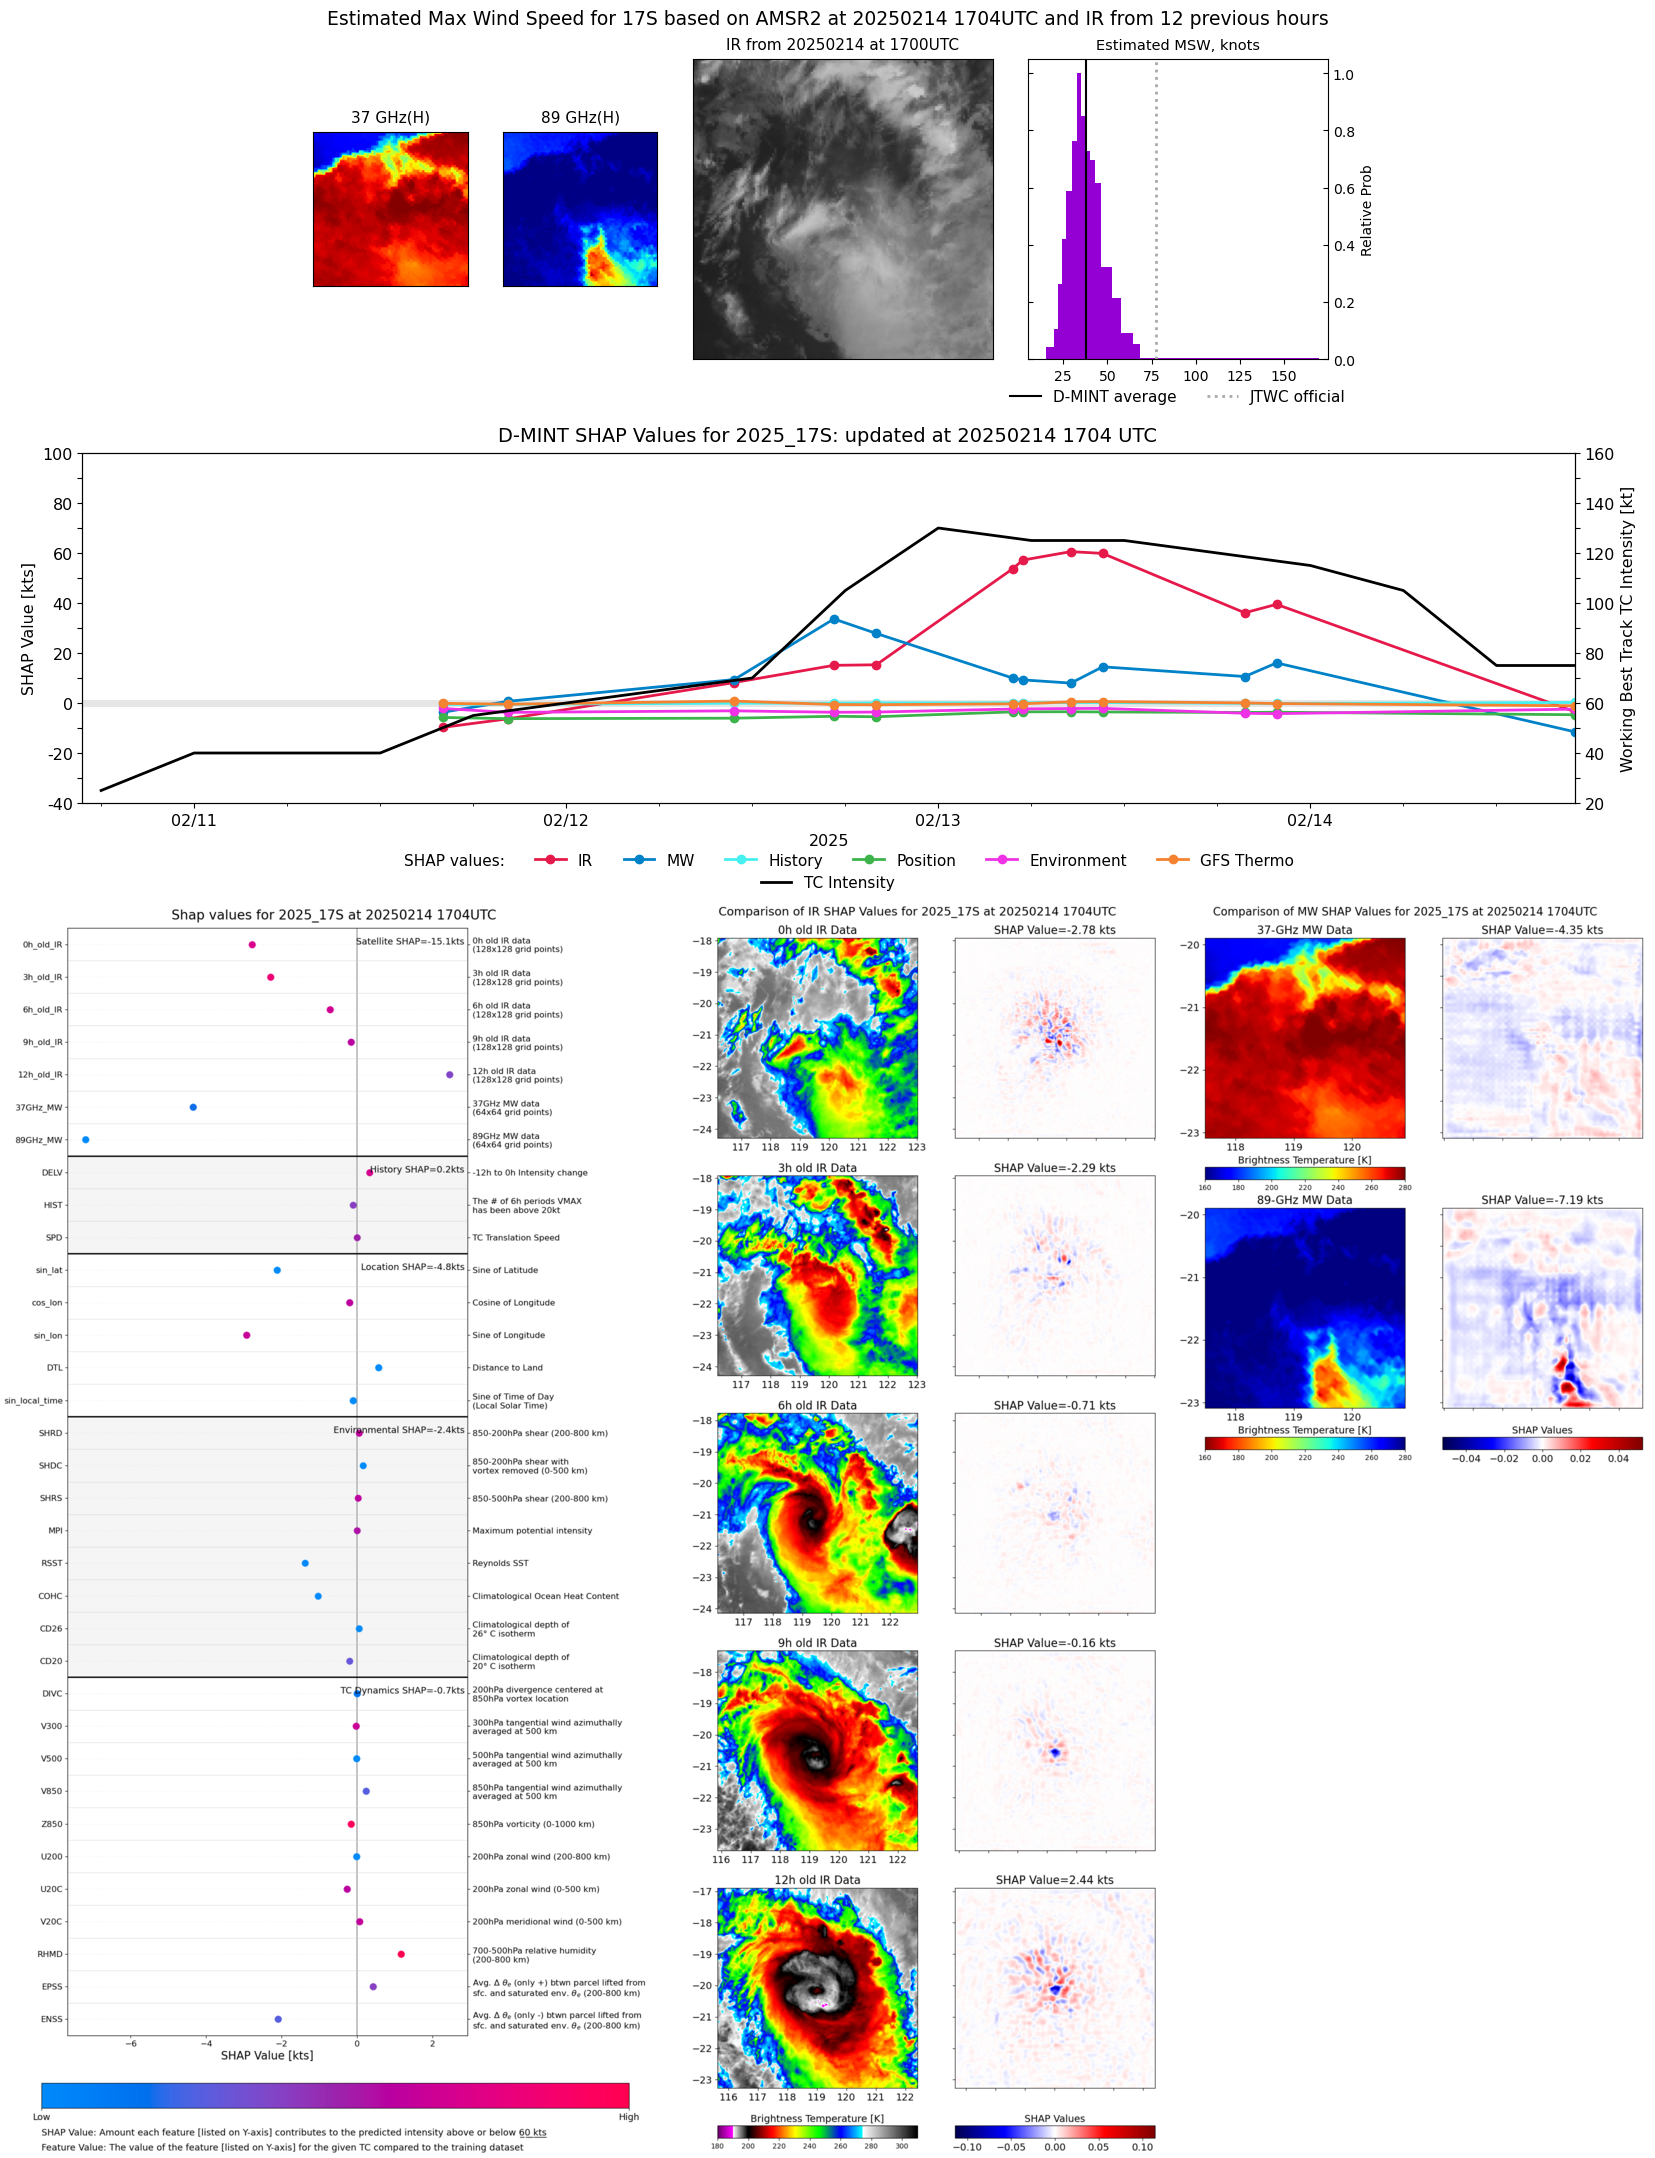 |
| 20250214 | 1103 UTC | SSMISF16 | NaN hPa | 57 kts | 50 kts | 64 kts |  |
| 20250214 | 1021 UTC | SSMISF17 | NaN hPa | 59 kts | 53 kts | 66 kts | 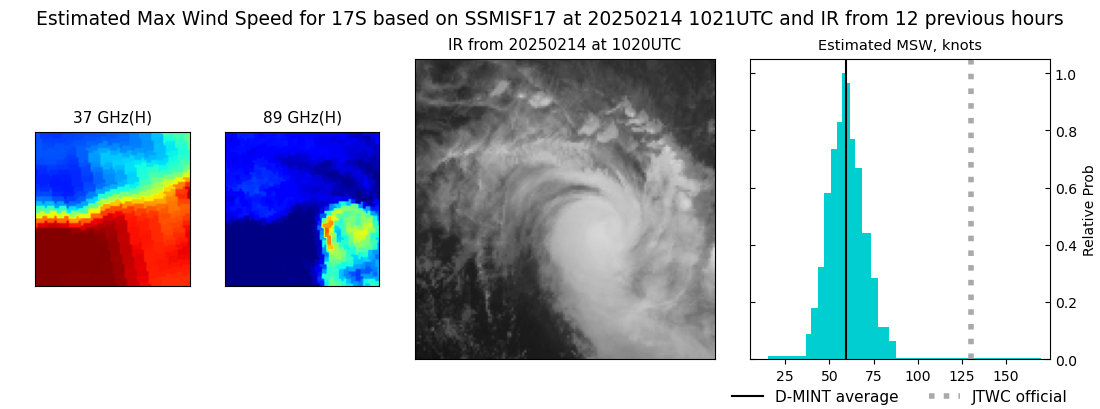 |
| 20250214 | 0819 UTC | SSMISF18 | NaN hPa | 86 kts | 77 kts | 95 kts | 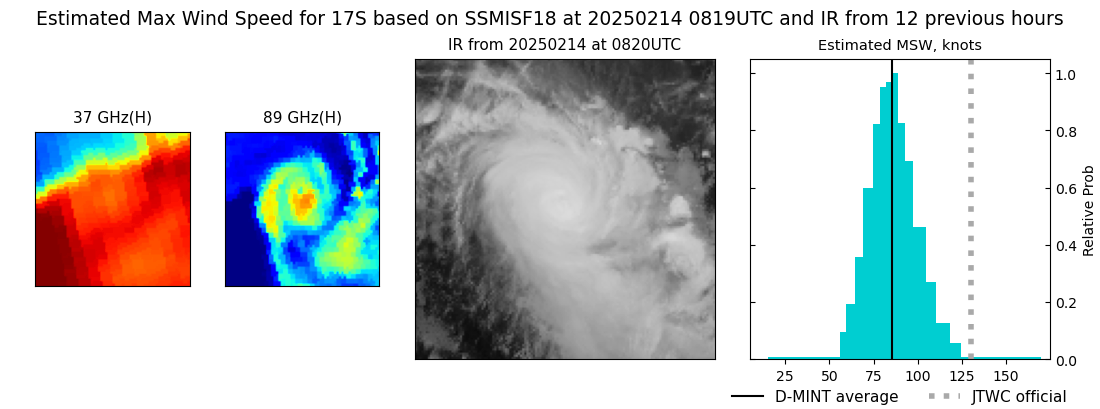 |
| 20250214 | 0610 UTC | AMSR2 | NaN hPa | 92 kts | 84 kts | 101 kts | 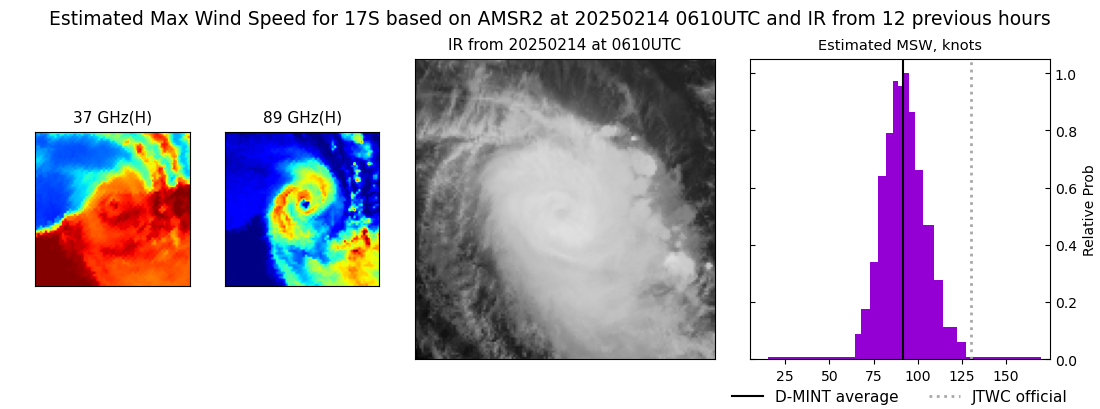 |
| 20250213 | 2229 UTC | SSMISF16 | 946 hPa | 92 kts | 84 kts | 99 kts | 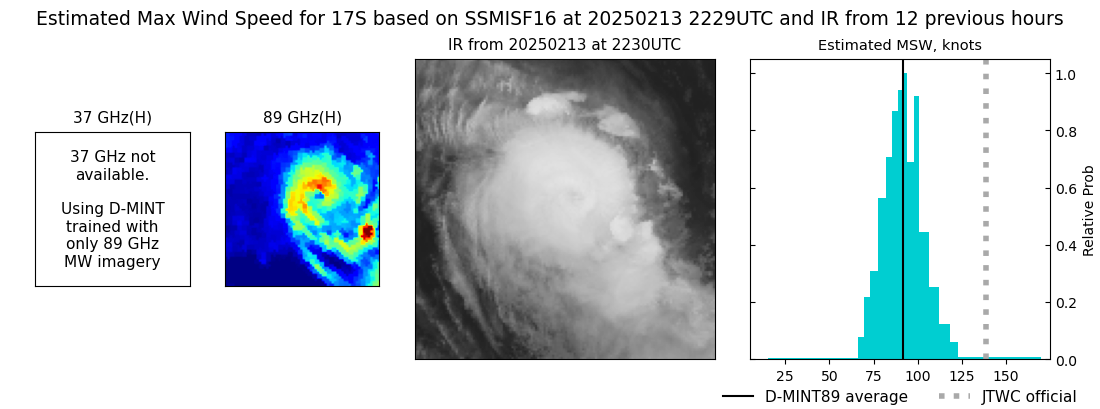 |
| 20250213 | 2149 UTC | SSMISF17 | 946 hPa | 107 kts | 100 kts | 114 kts | 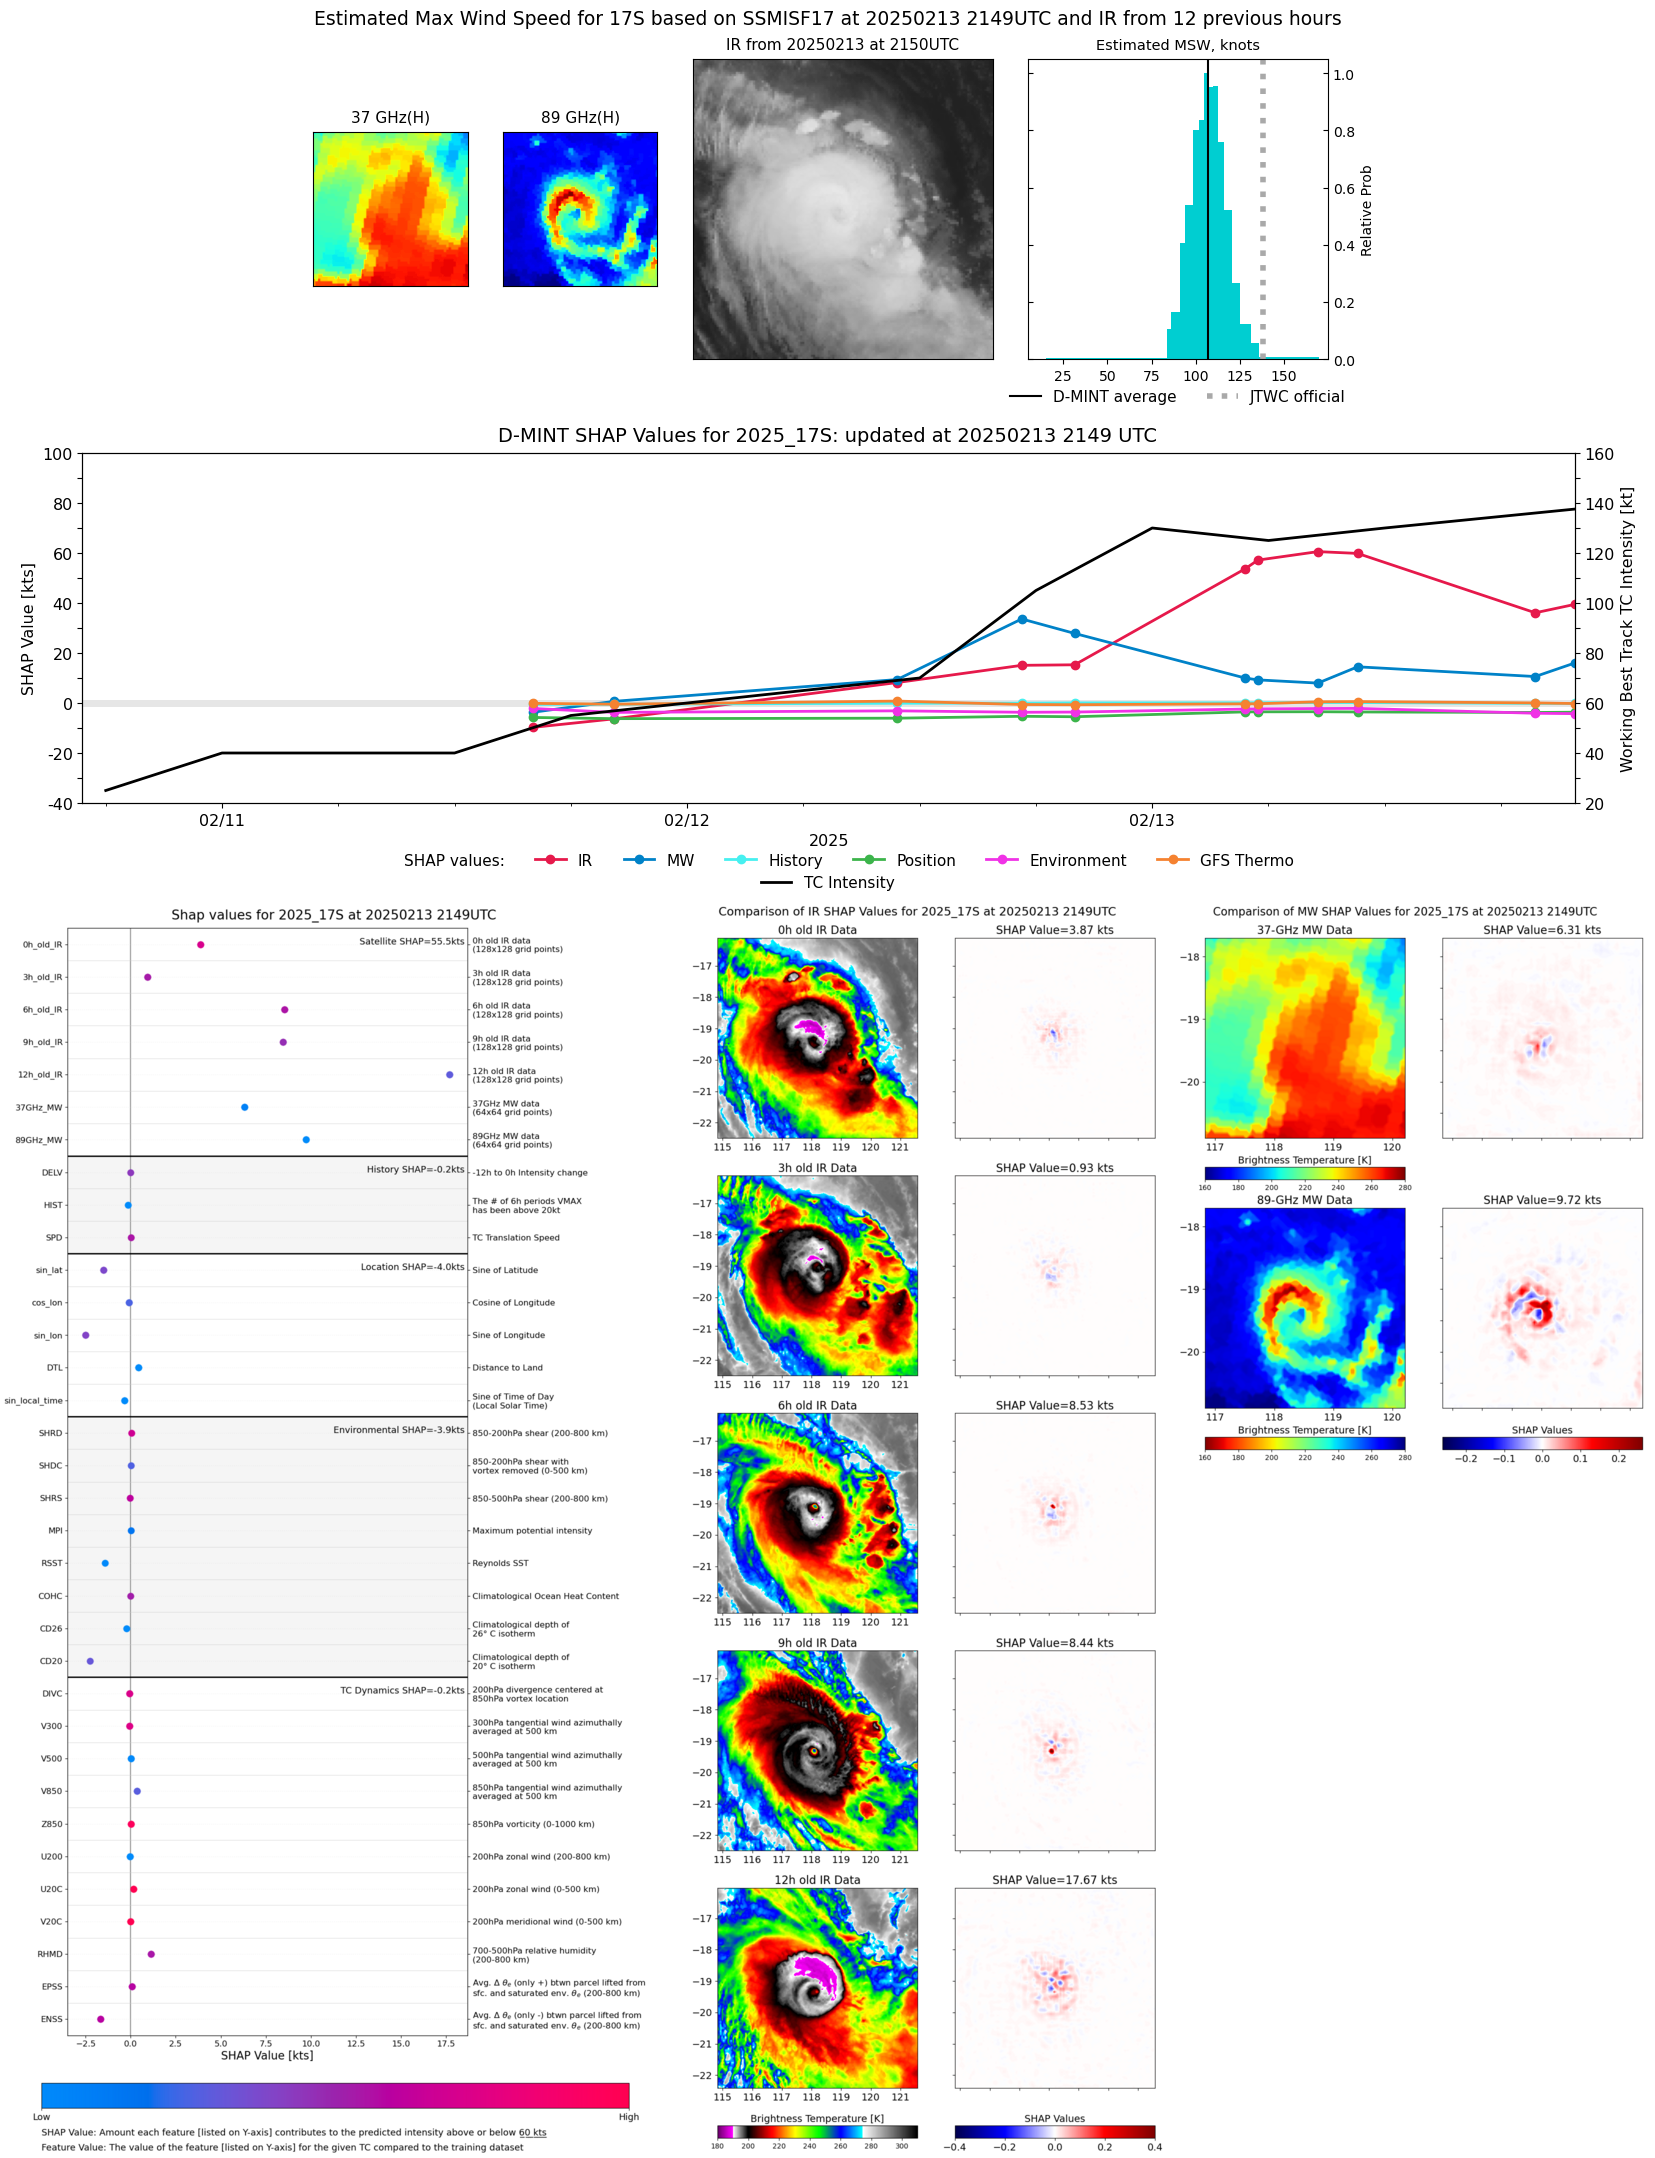 |
| 20250213 | 1946 UTC | SSMISF18 | 946 hPa | 99 kts | 91 kts | 106 kts |  |
| 20250213 | 1311 UTC | TROPICS03 | 931 hPa | 120 kts | 114 kts | 127 kts | 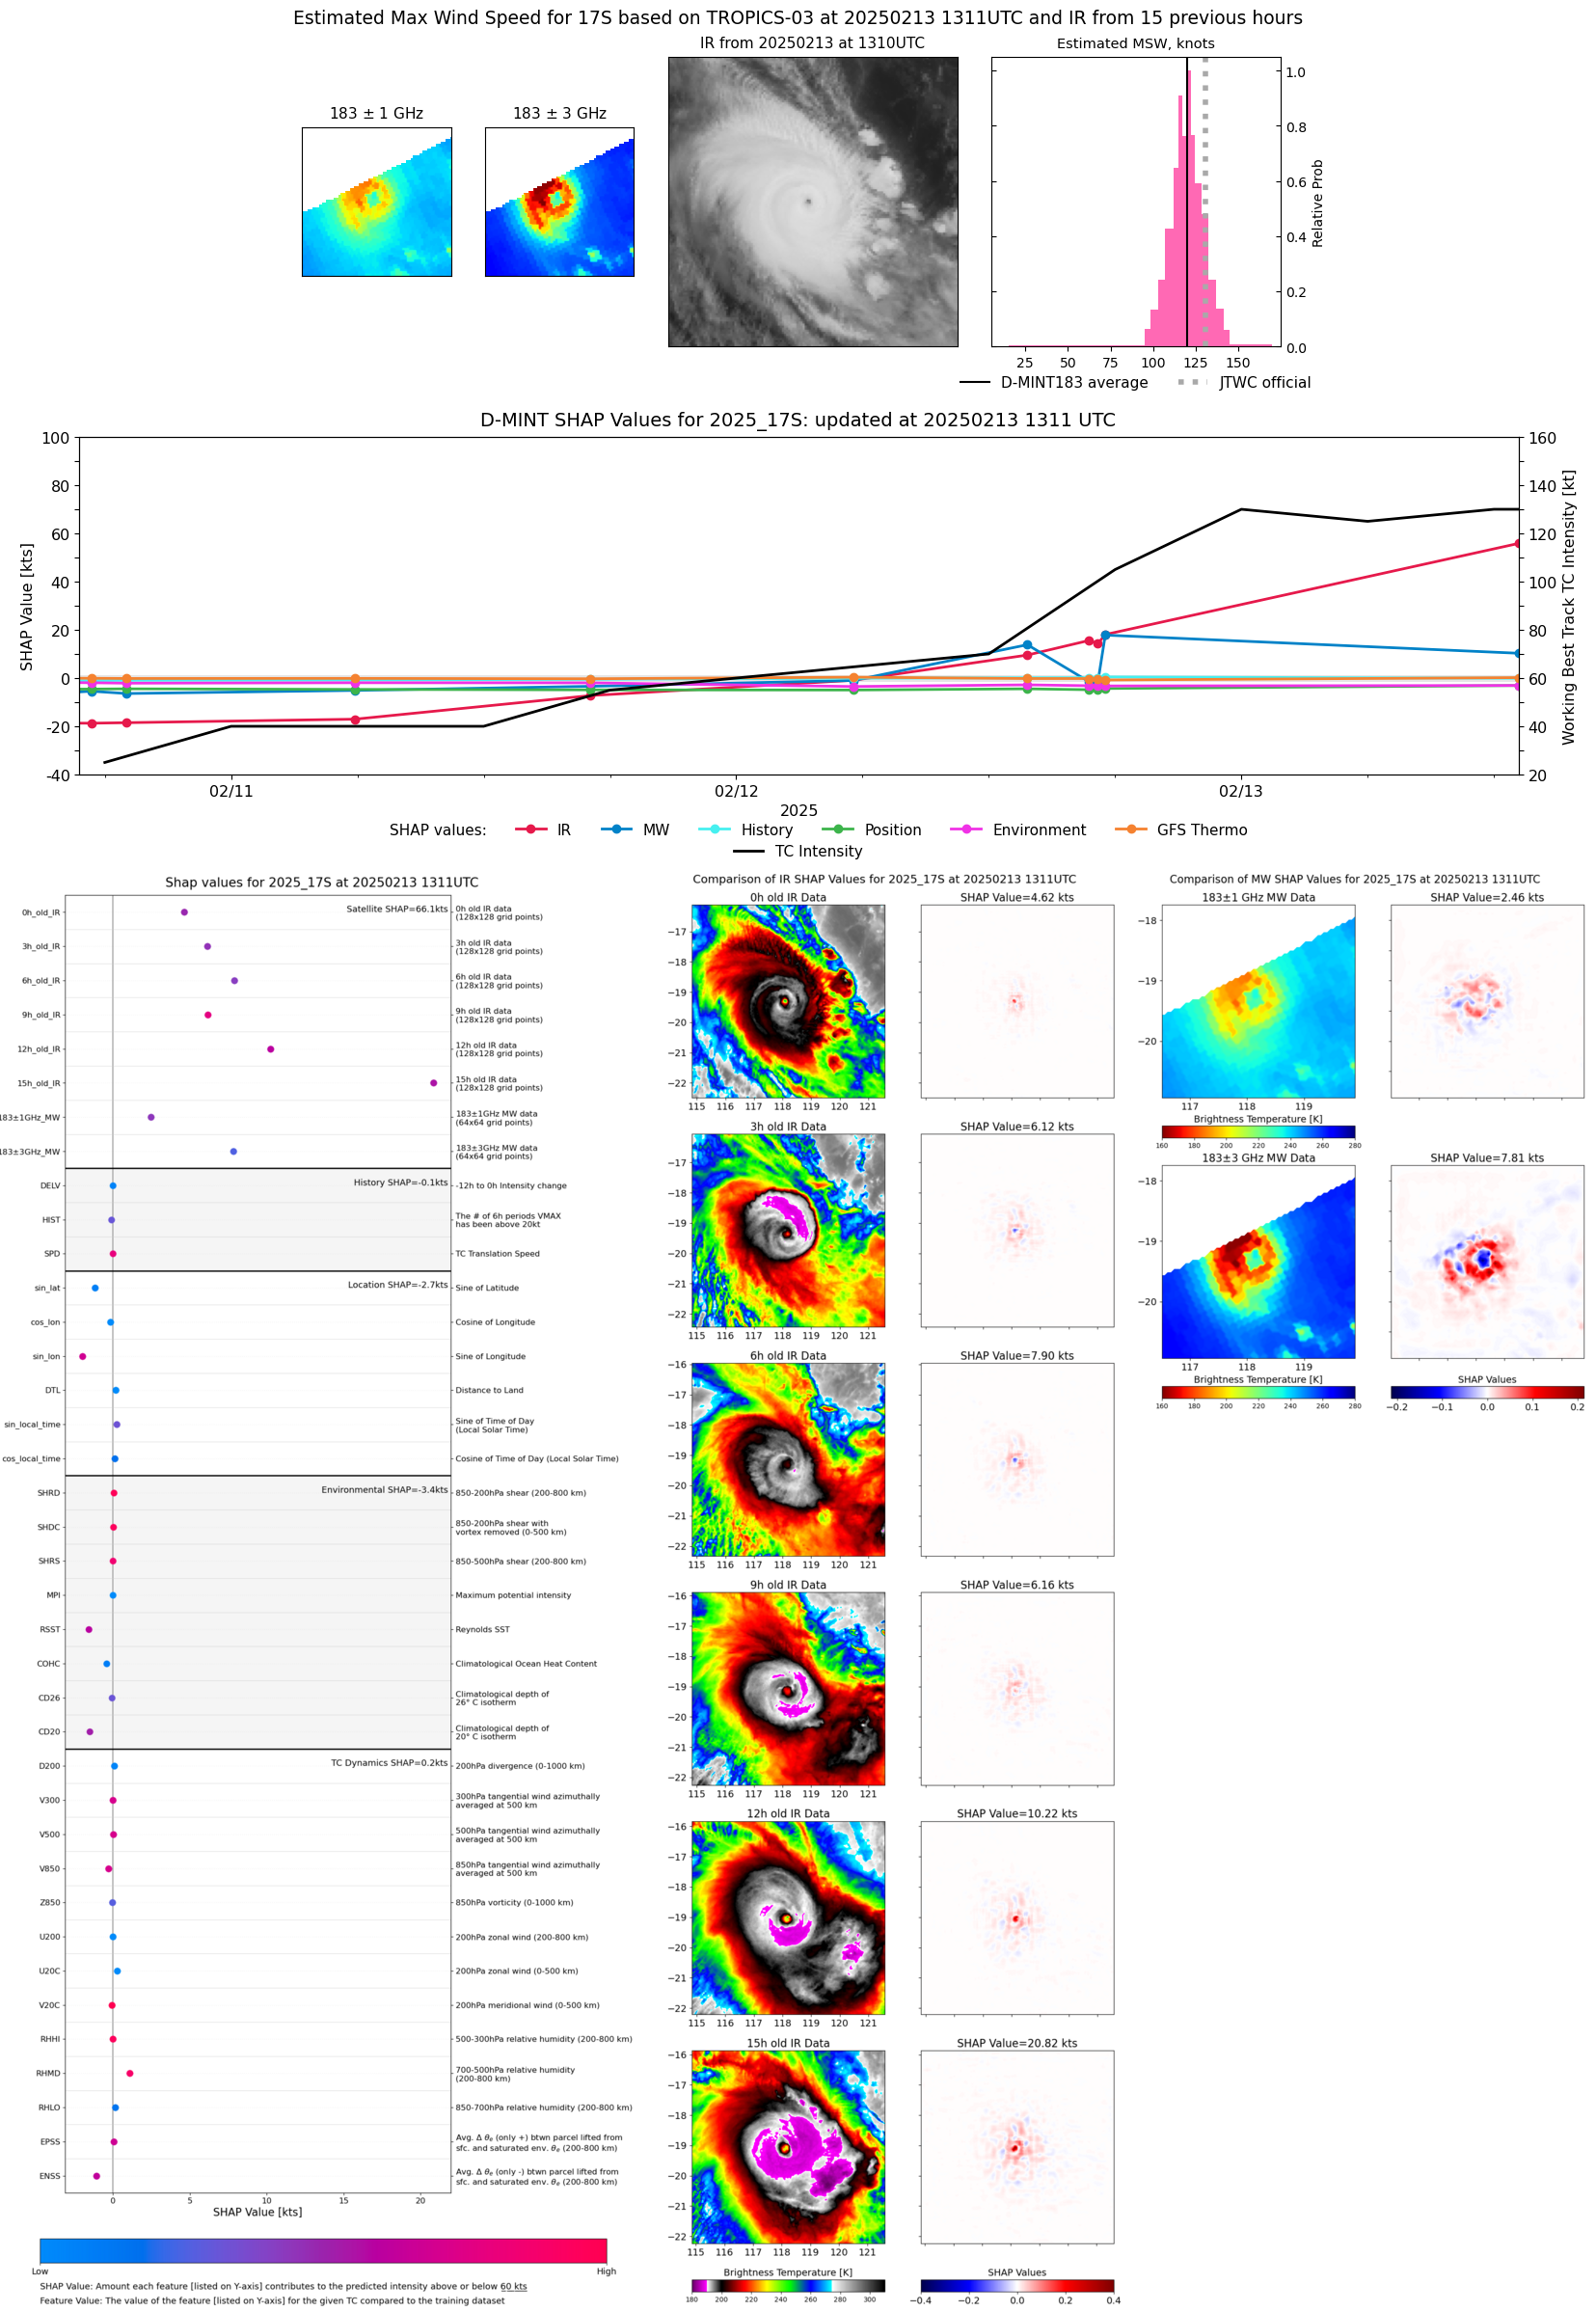 |
| 20250213 | 1036 UTC | SSMISF17 | 926 hPa | 129 kts | 121 kts | 137 kts |  |
| 20250213 | 0833 UTC | SSMISF18 | 923 hPa | 123 kts | 116 kts | 131 kts | 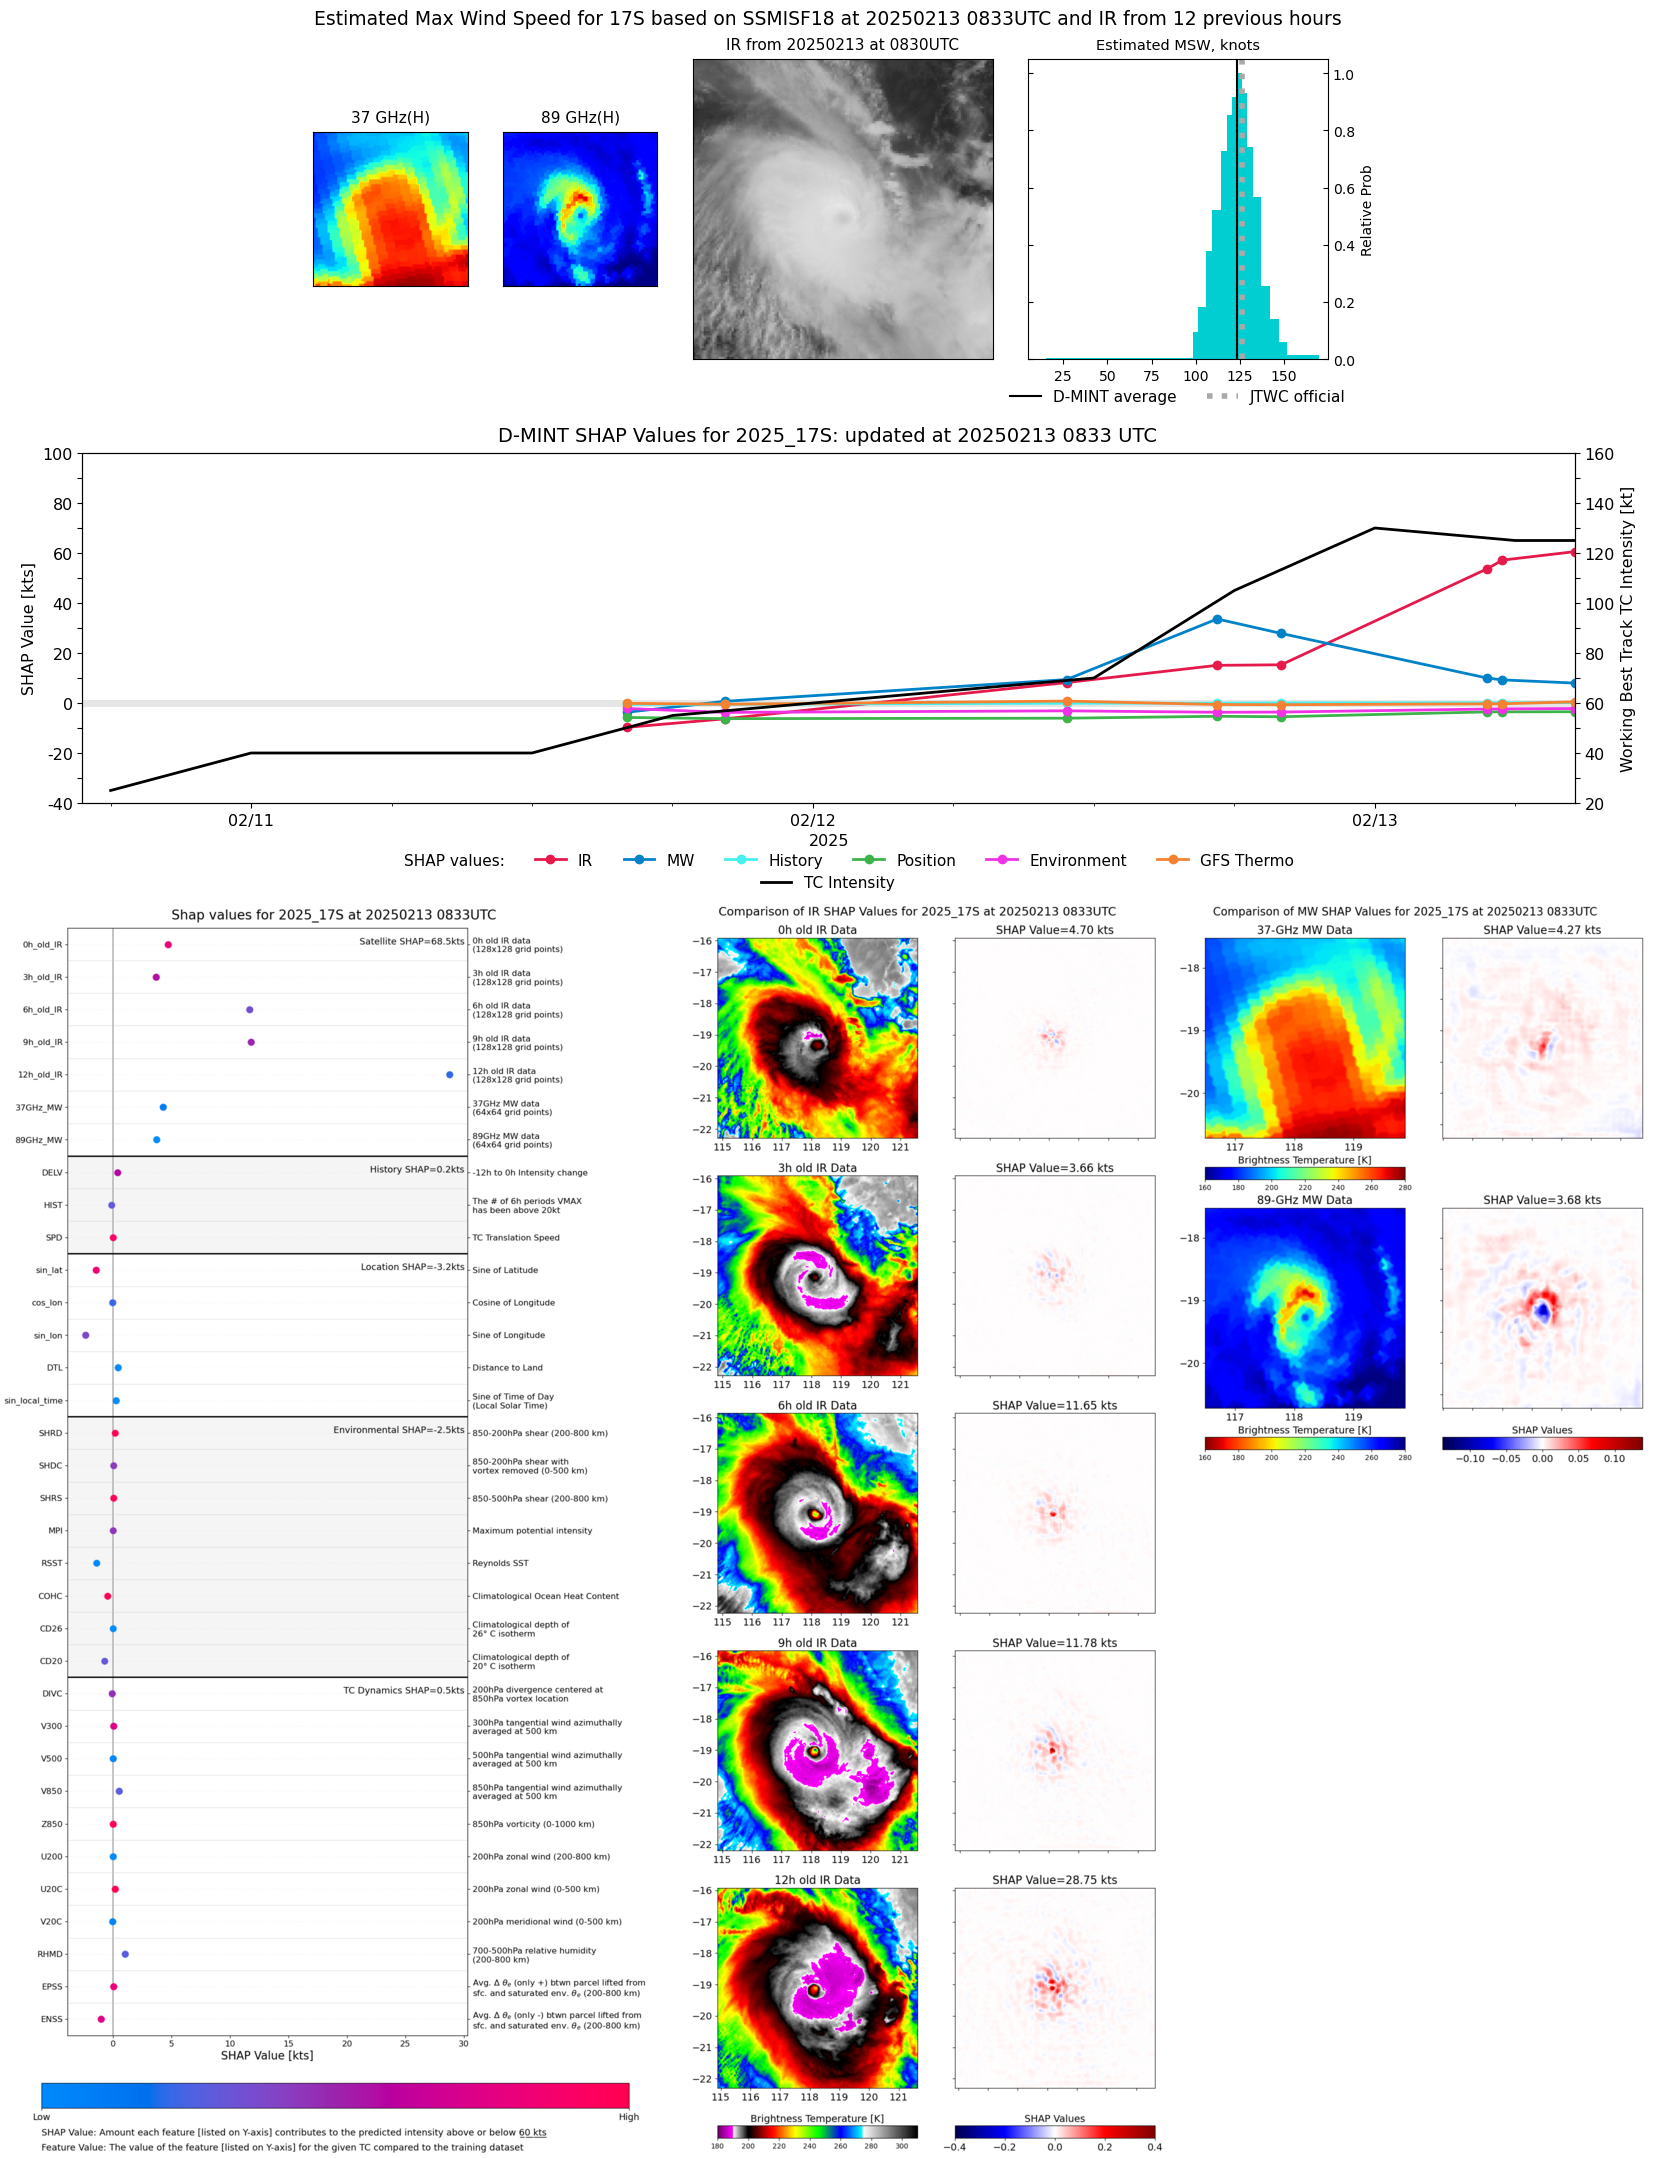 |
| 20250213 | 0527 UTC | AMSR2 | 929 hPa | 120 kts | 114 kts | 126 kts | 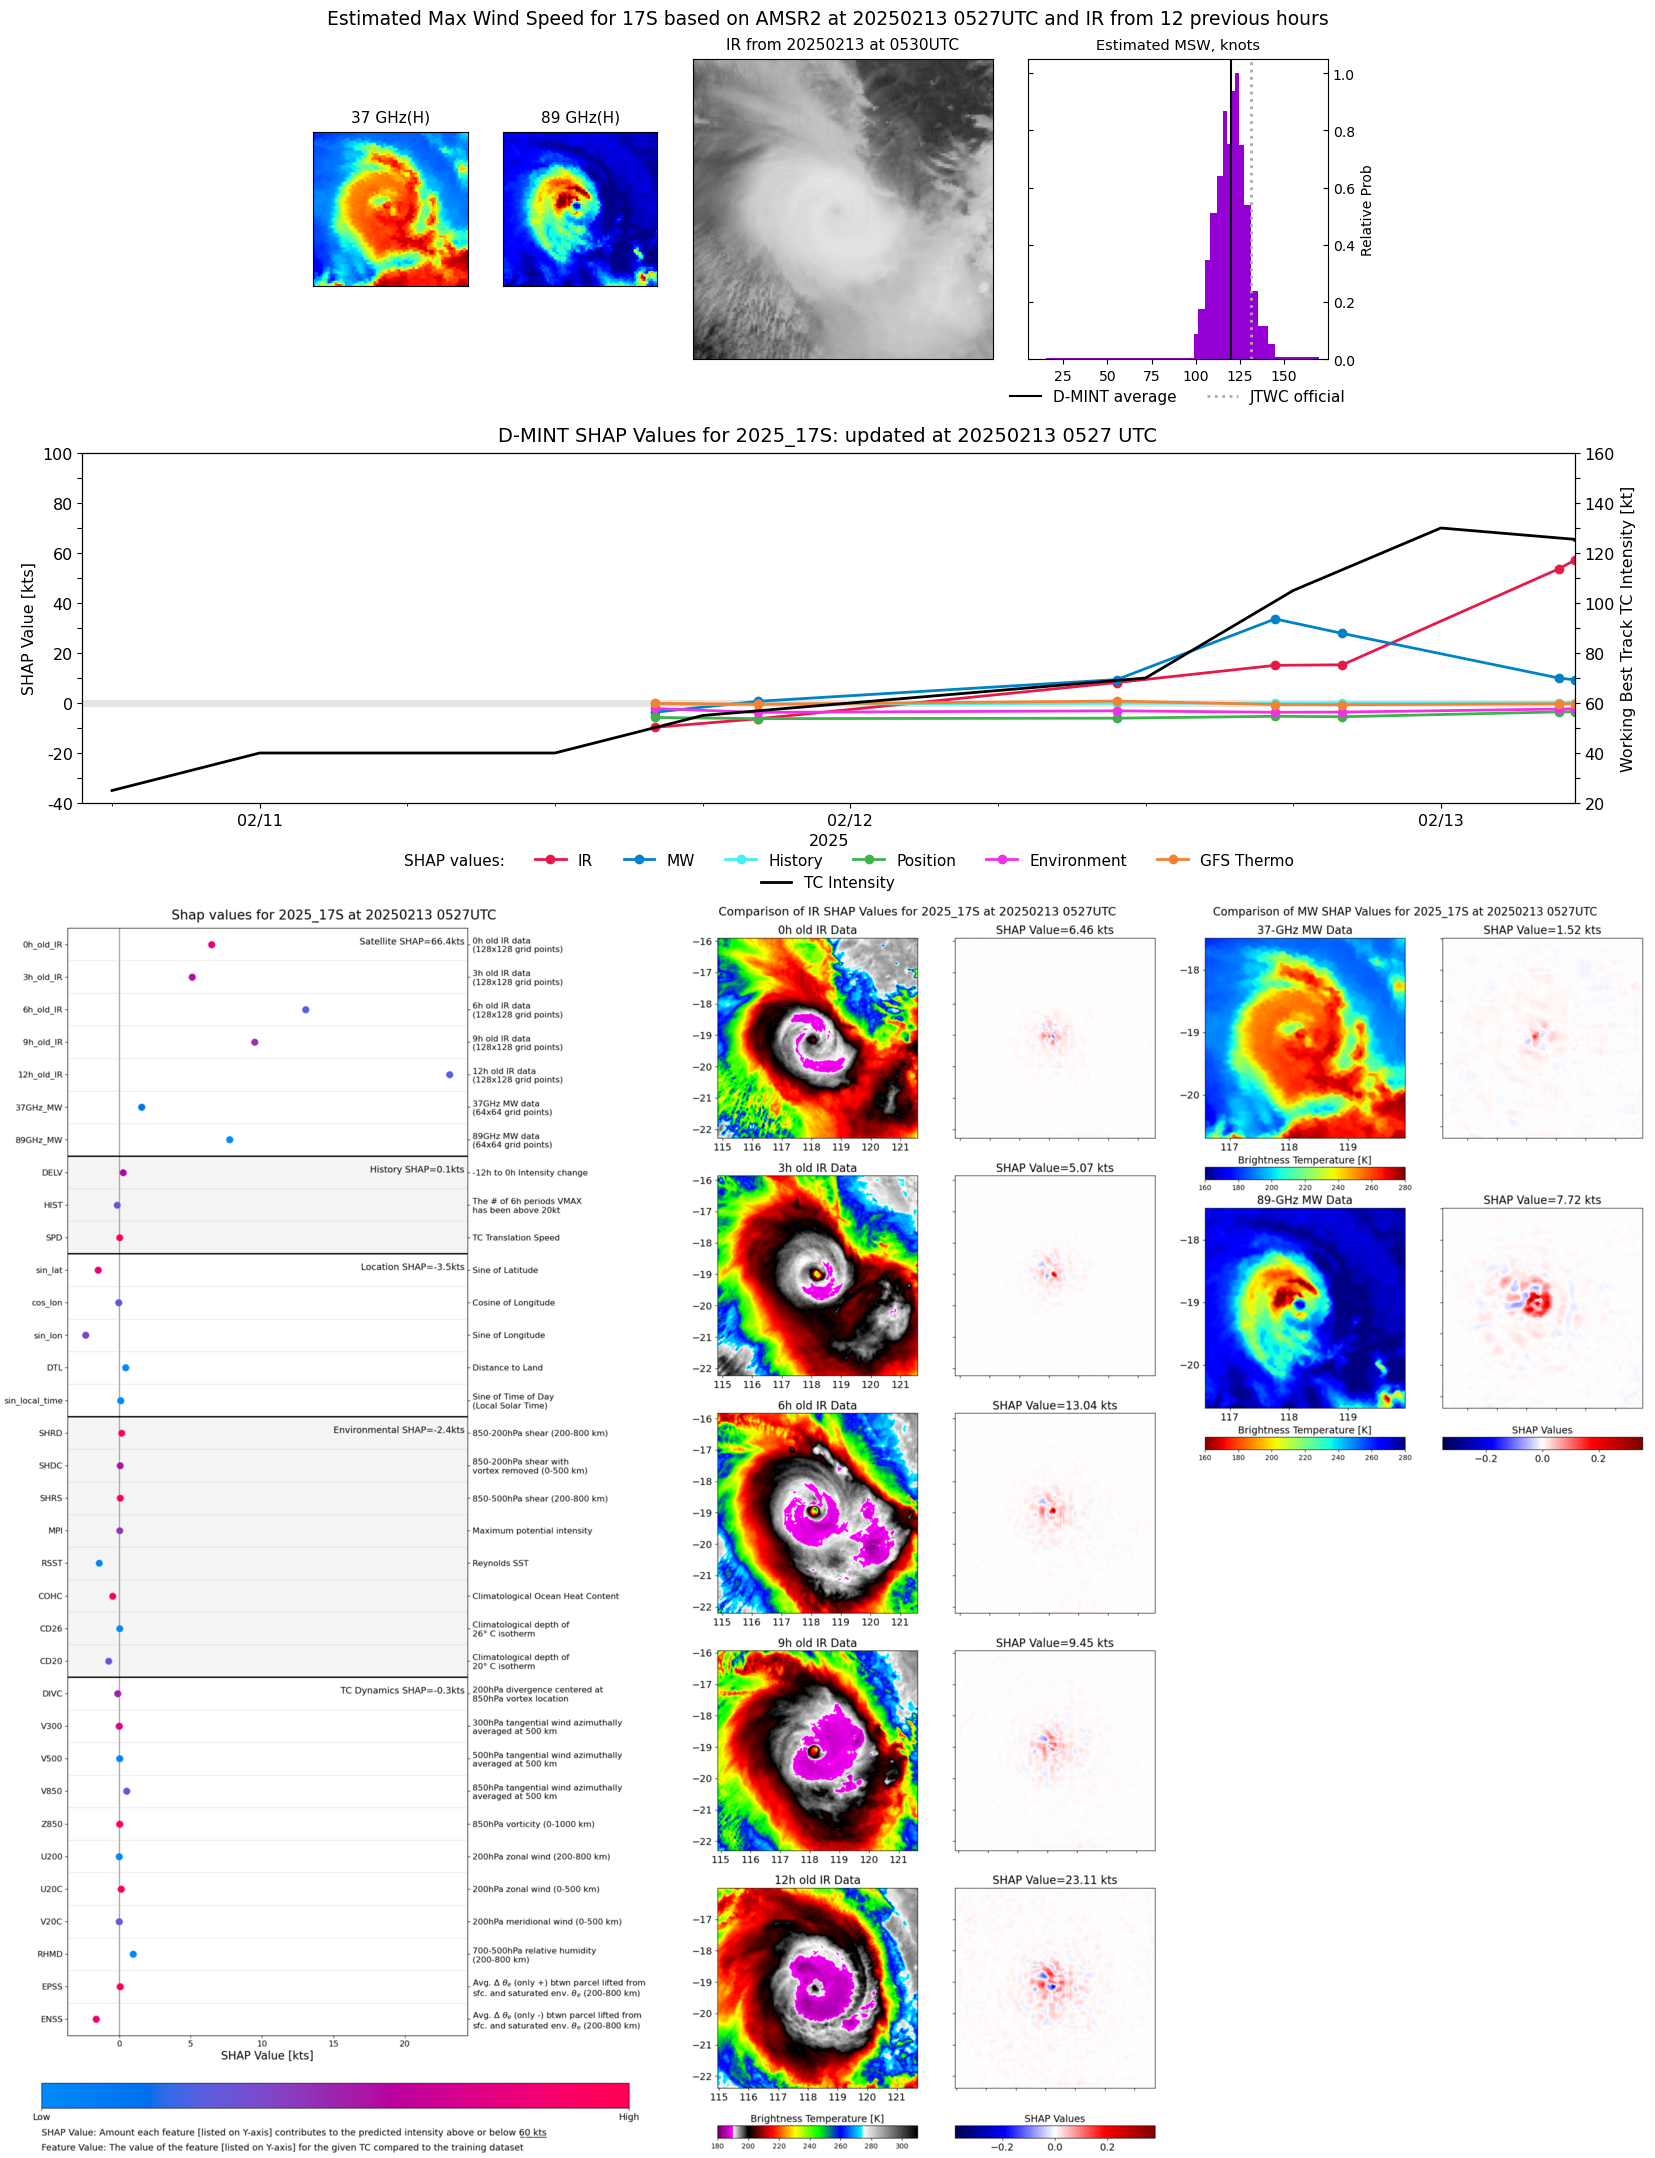 |
| 20250213 | 0448 UTC | GMI | 931 hPa | 117 kts | 110 kts | 124 kts | 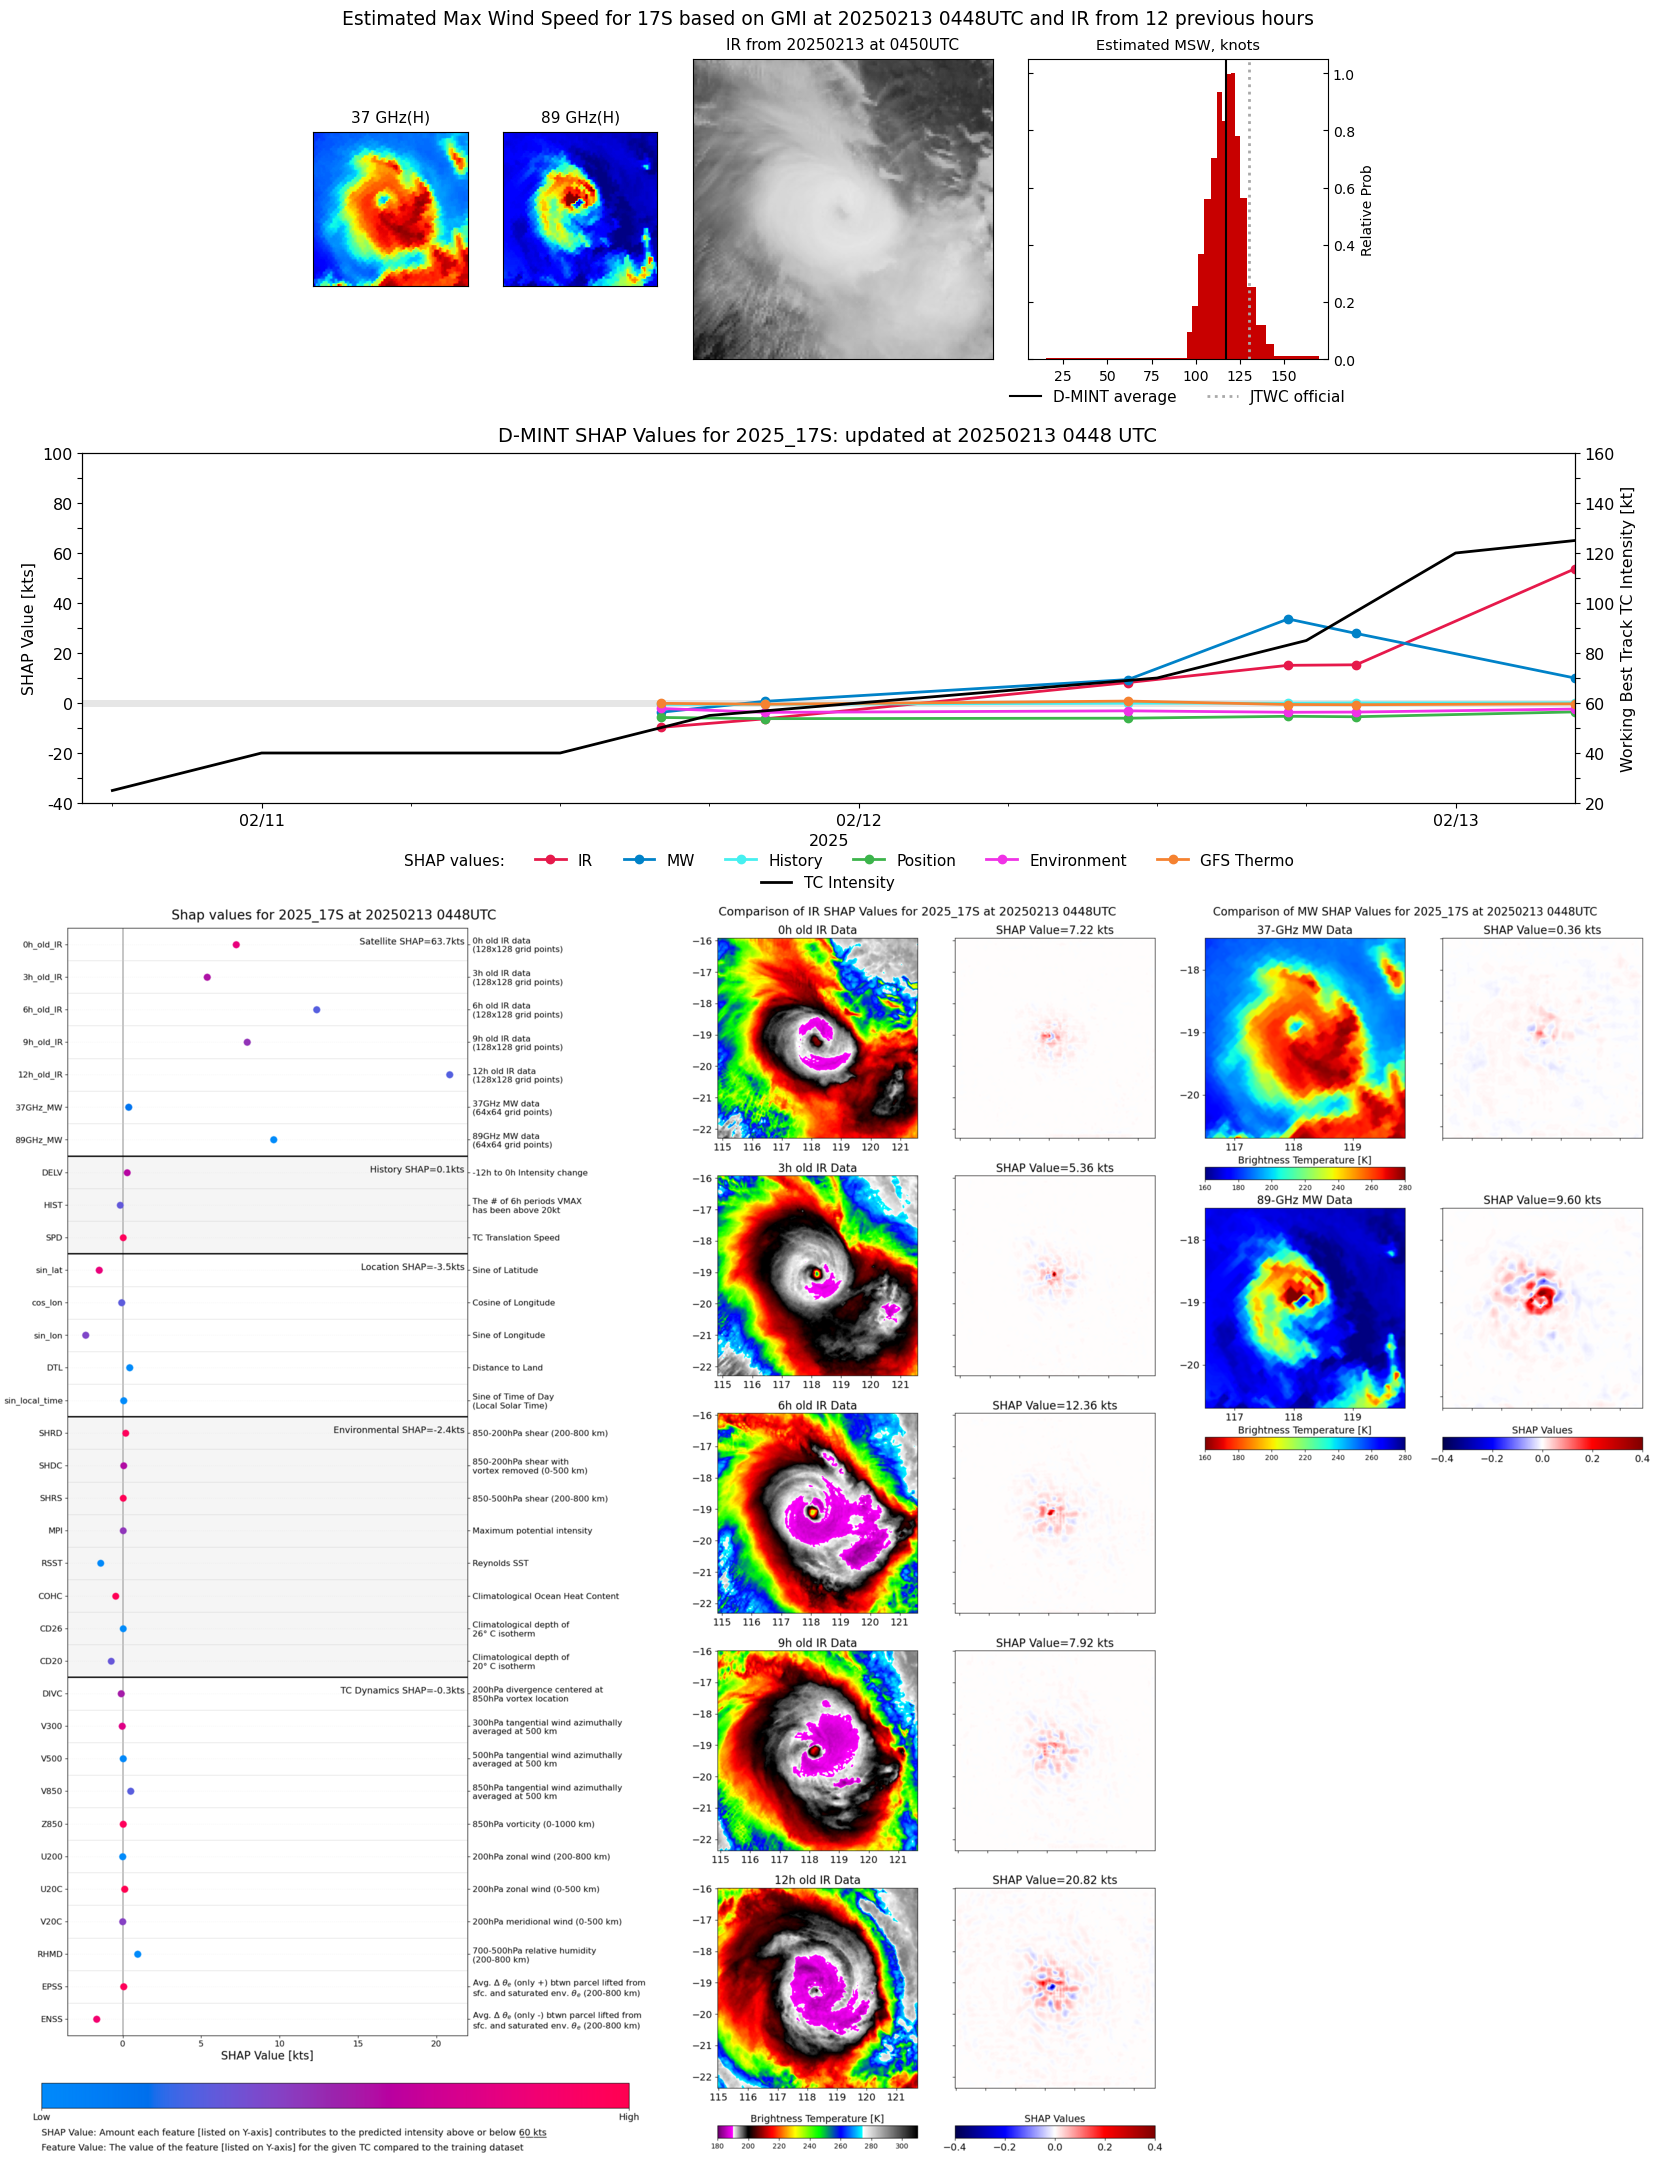 |
| 20250212 | 2244 UTC | SSMISF16 | 938 hPa | 111 kts | 102 kts | 120 kts |  |
| 20250212 | 2202 UTC | SSMISF17 | 941 hPa | 113 kts | 105 kts | 121 kts | 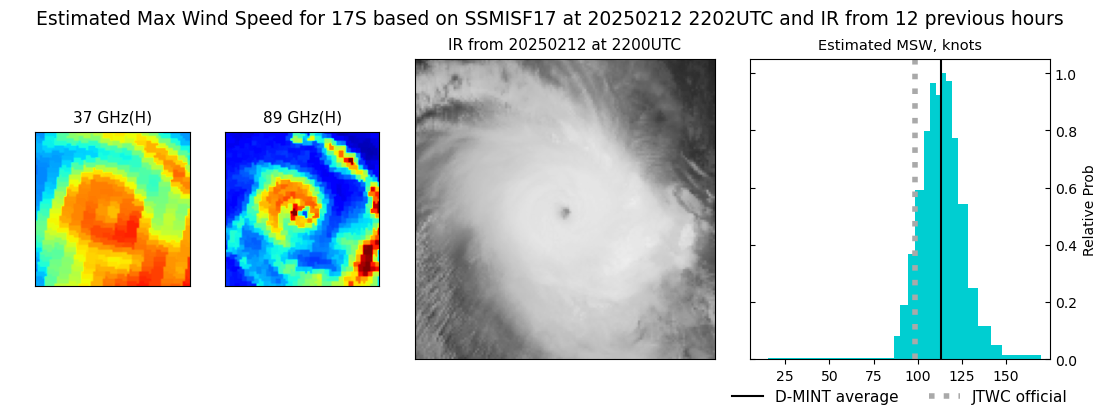 |
| 20250212 | 2000 UTC | SSMISF18 | 953 hPa | 93 kts | 86 kts | 101 kts | 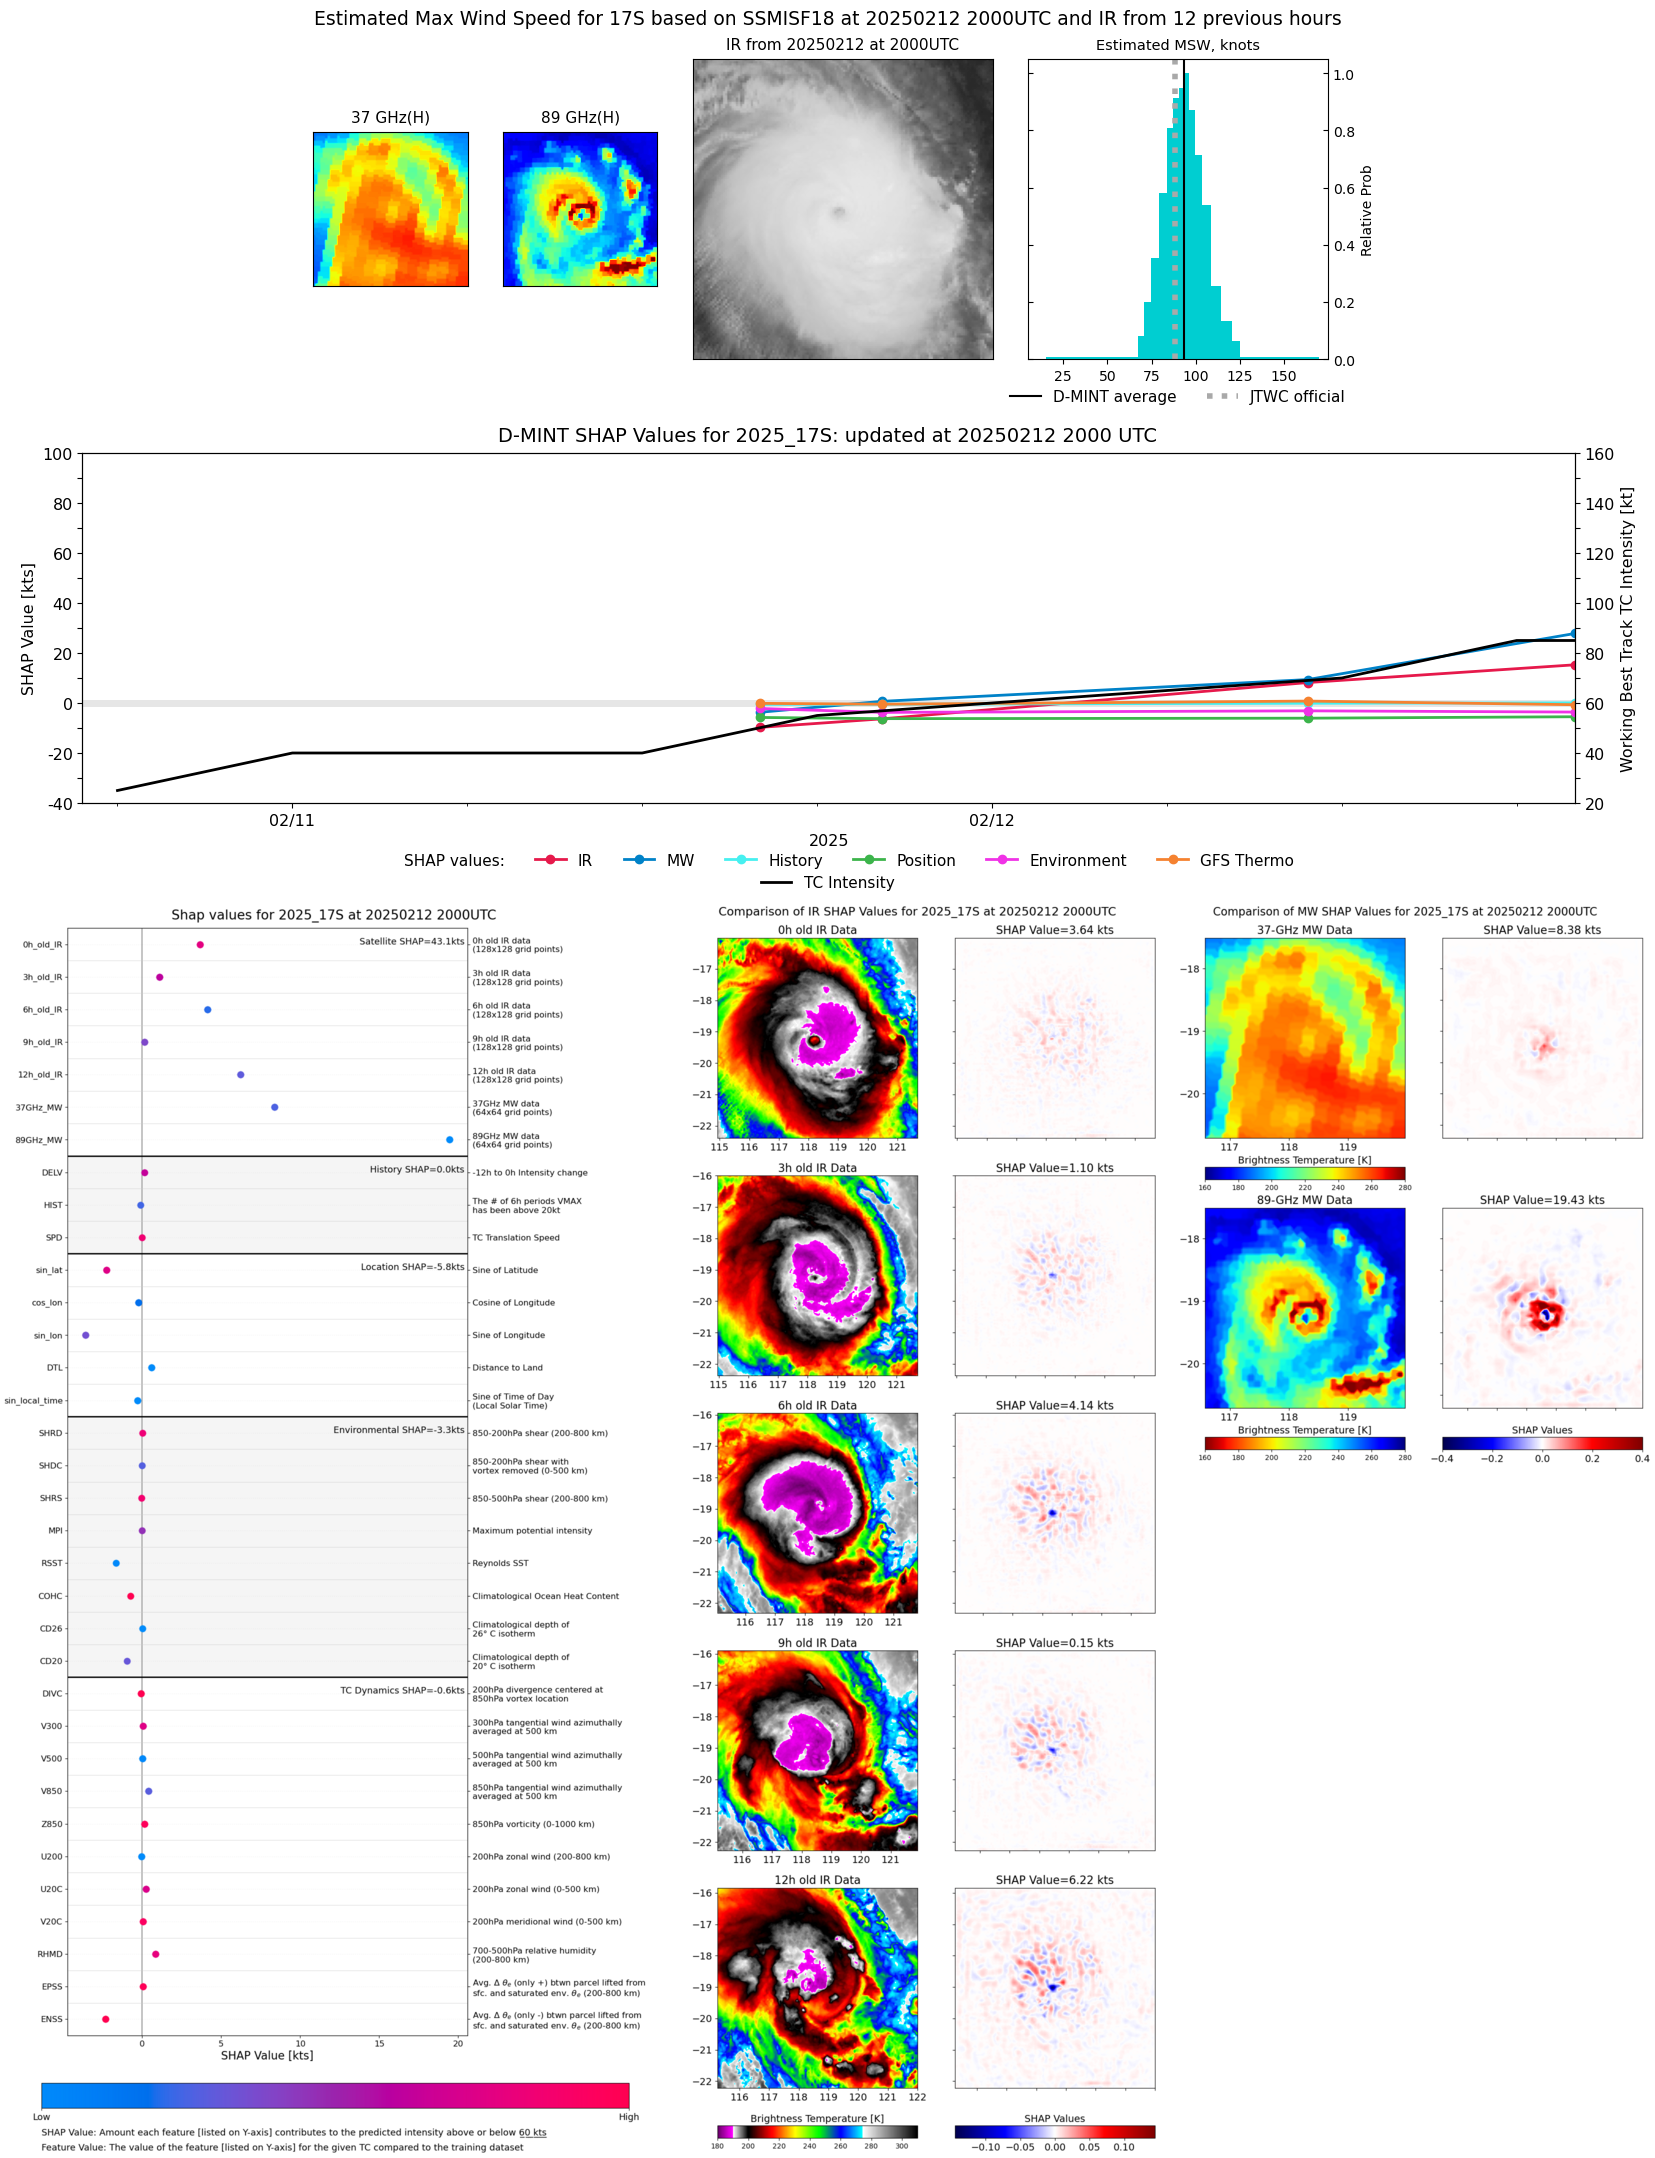 |
| 20250212 | 1732 UTC | TROPICS06 | 958 hPa | 89 kts | 82 kts | 95 kts | 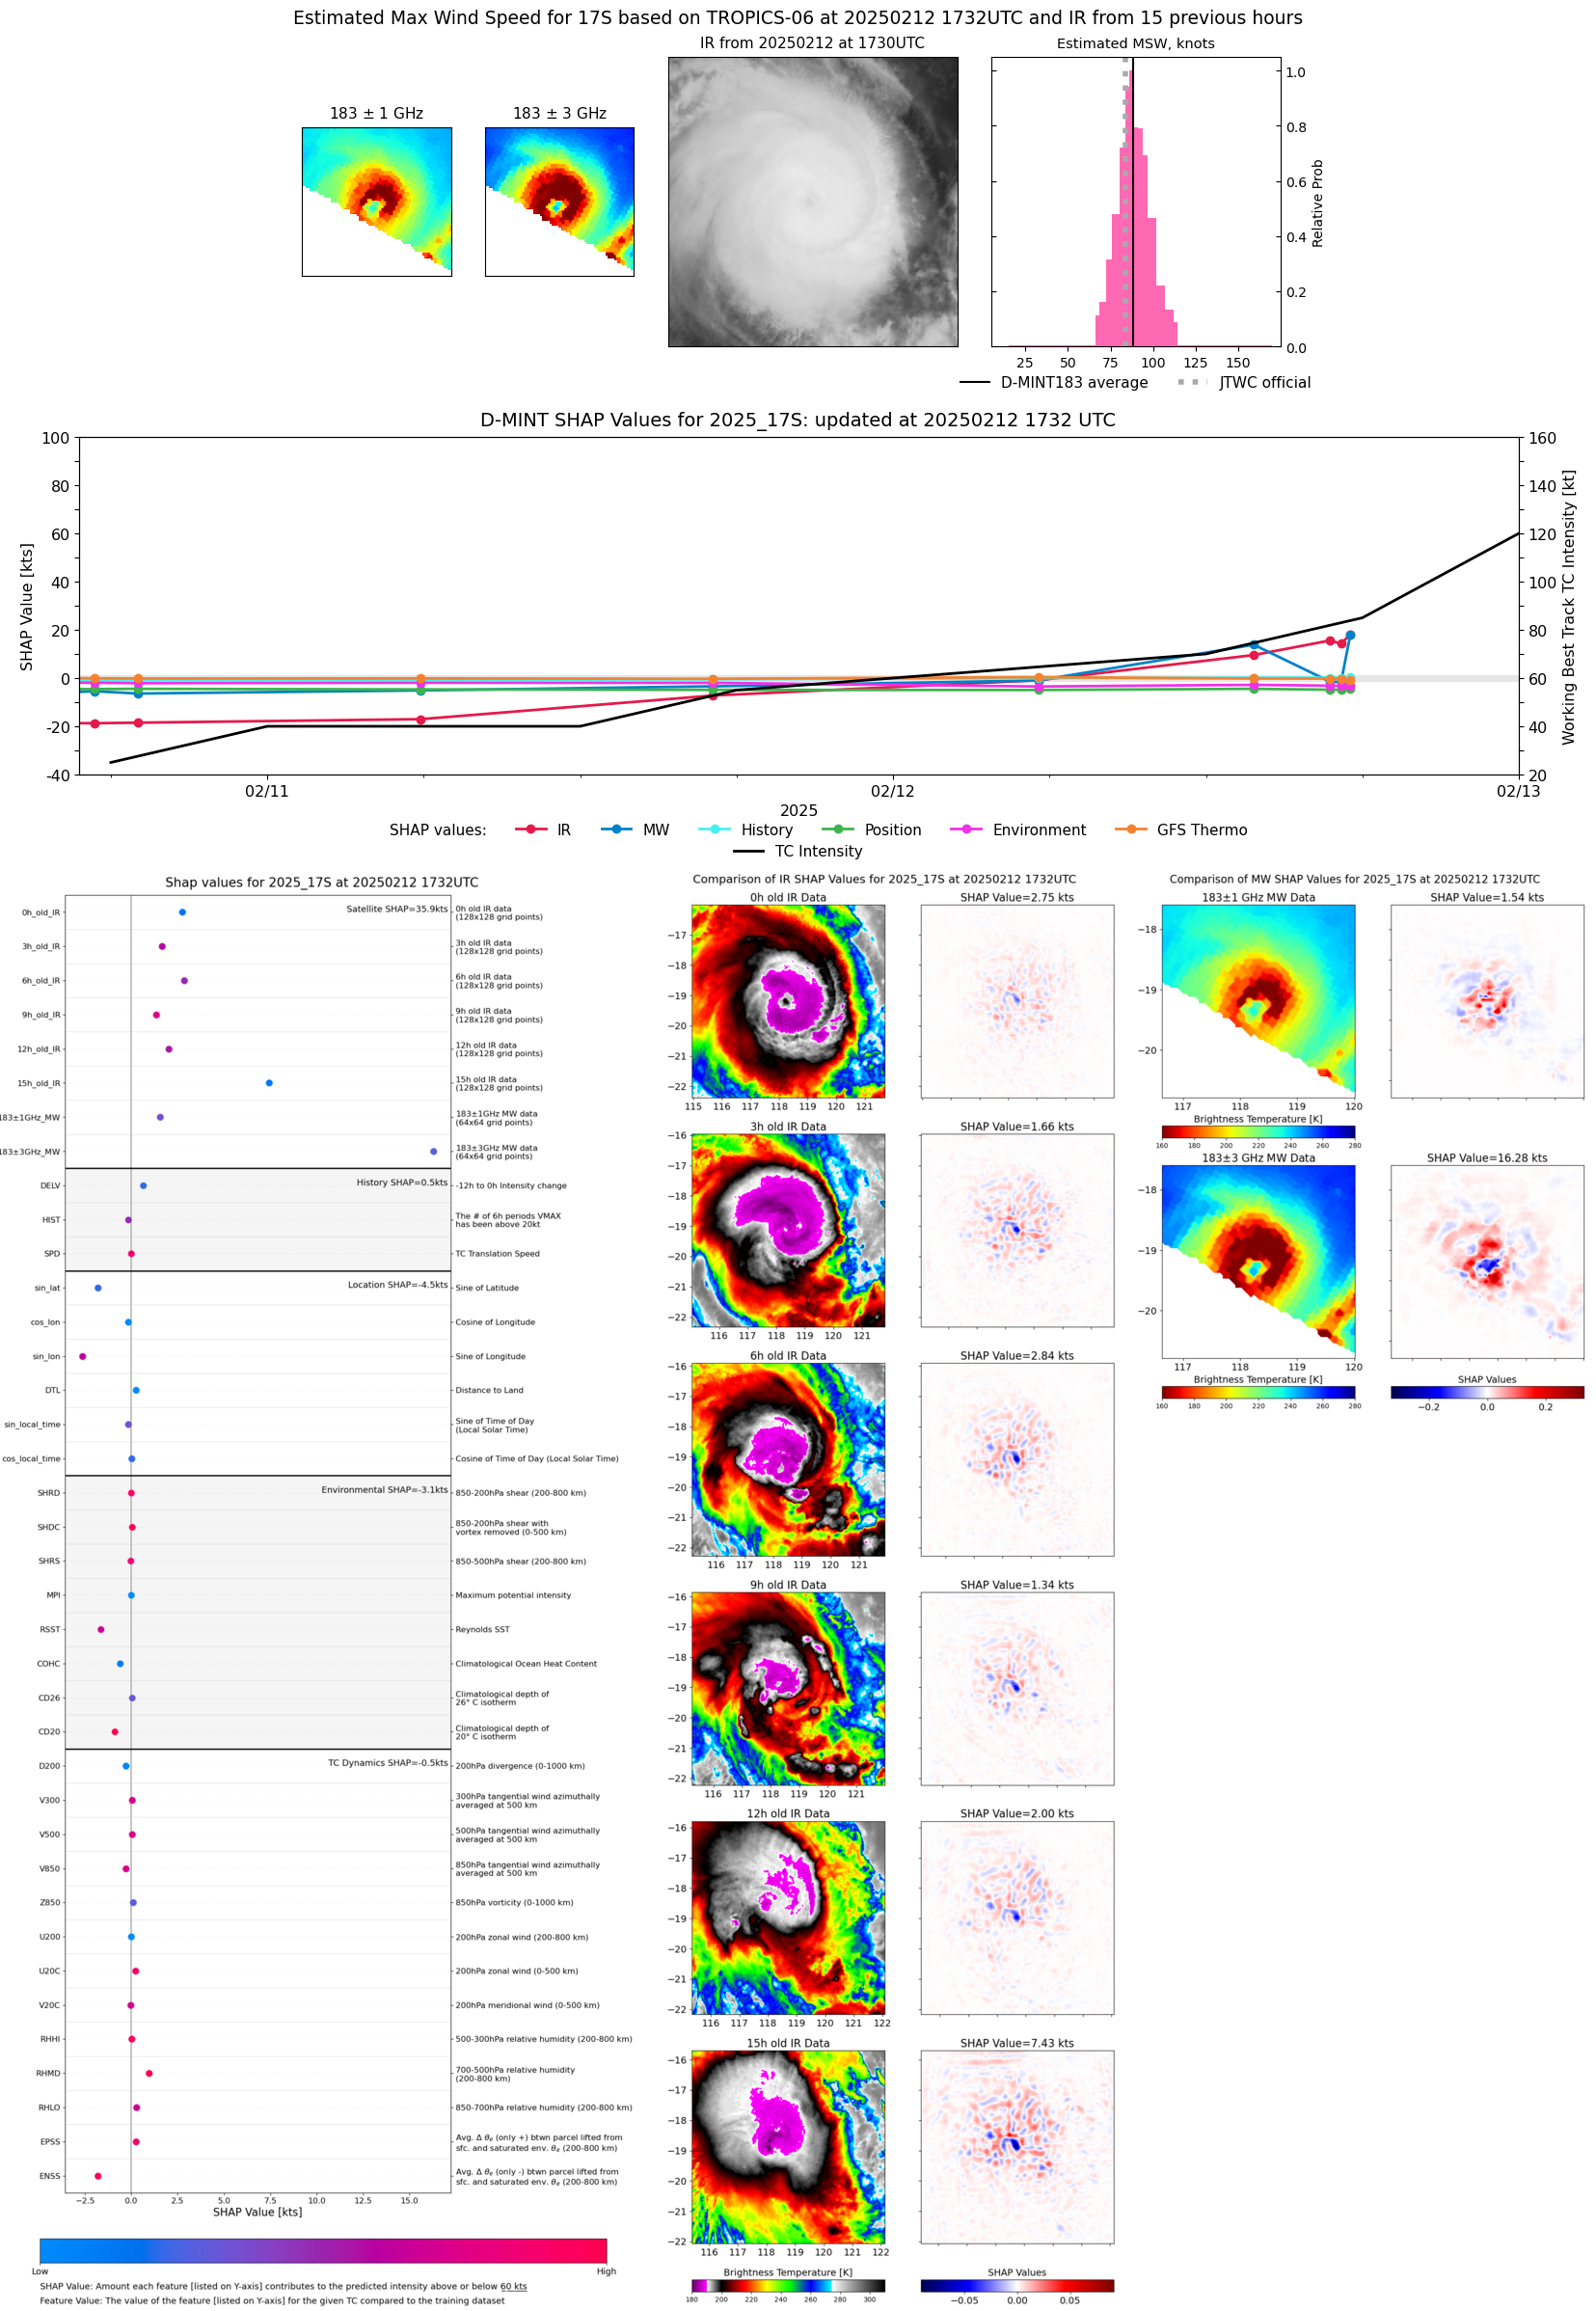 |
| 20250212 | 1716 UTC | AMSR2 | 959 hPa | 99 kts | 91 kts | 107 kts | 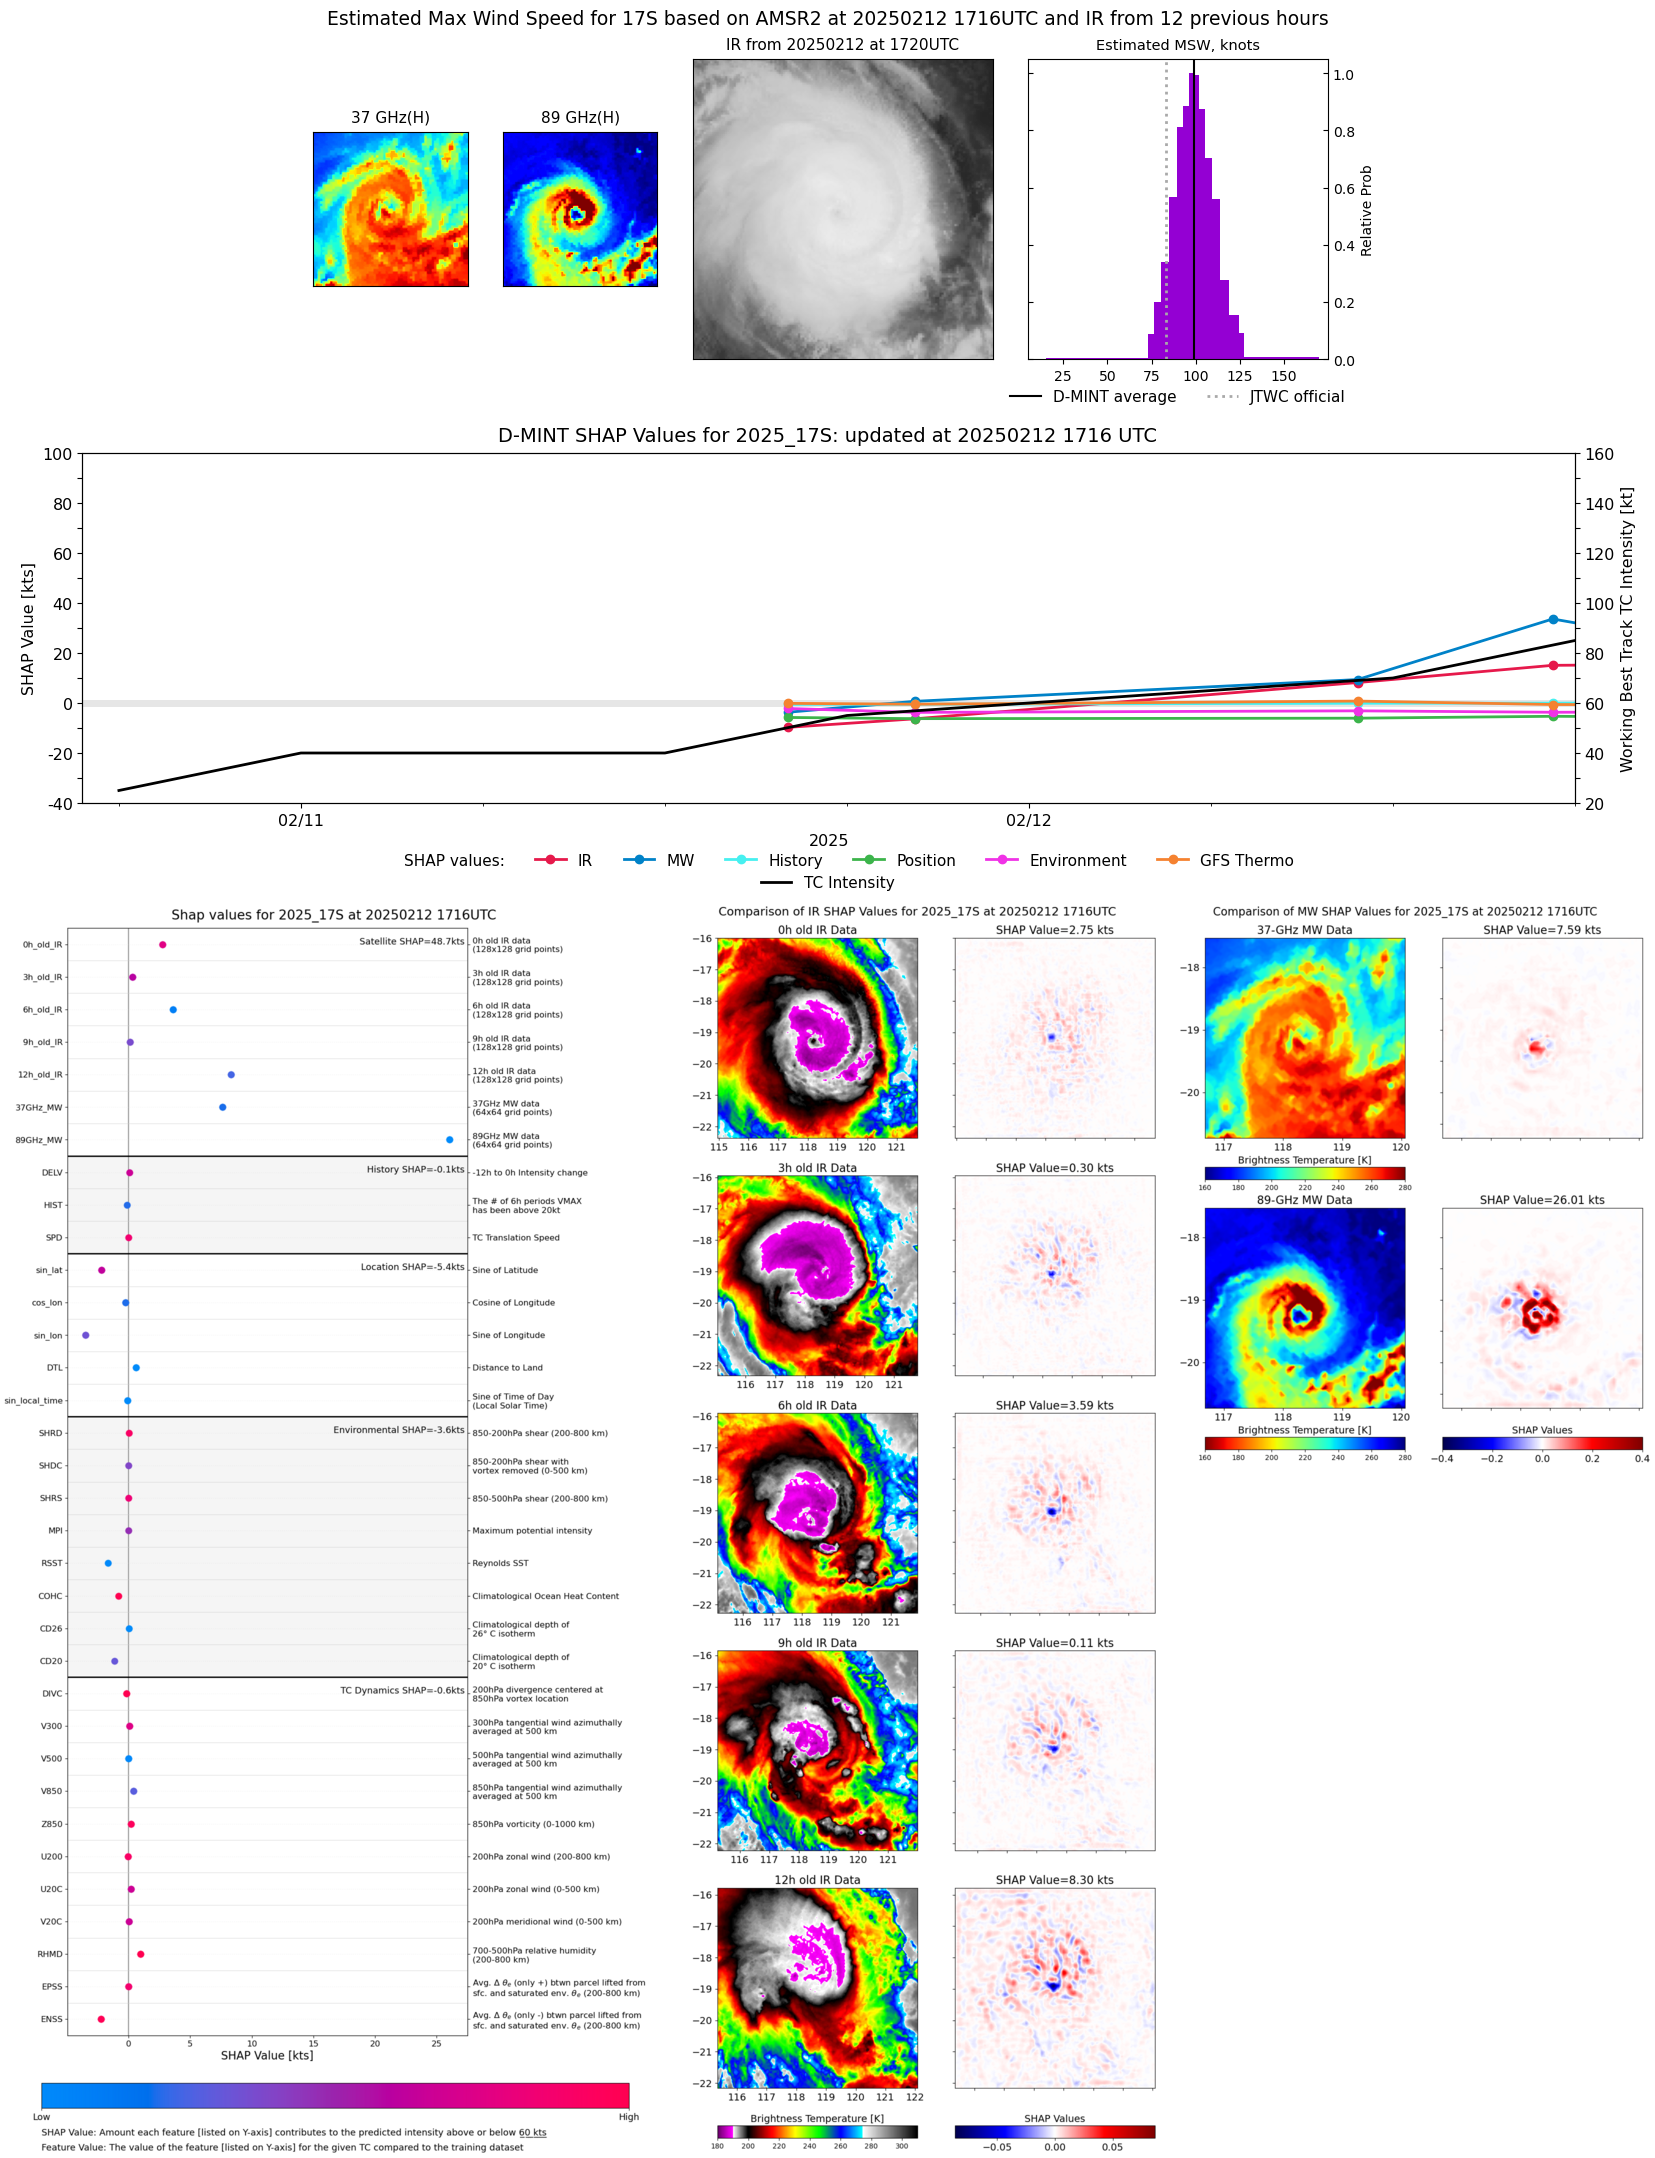 |
| 20250212 | 1711 UTC | ATMS-N20 | 976 hPa | 65 kts | 59 kts | 72 kts | 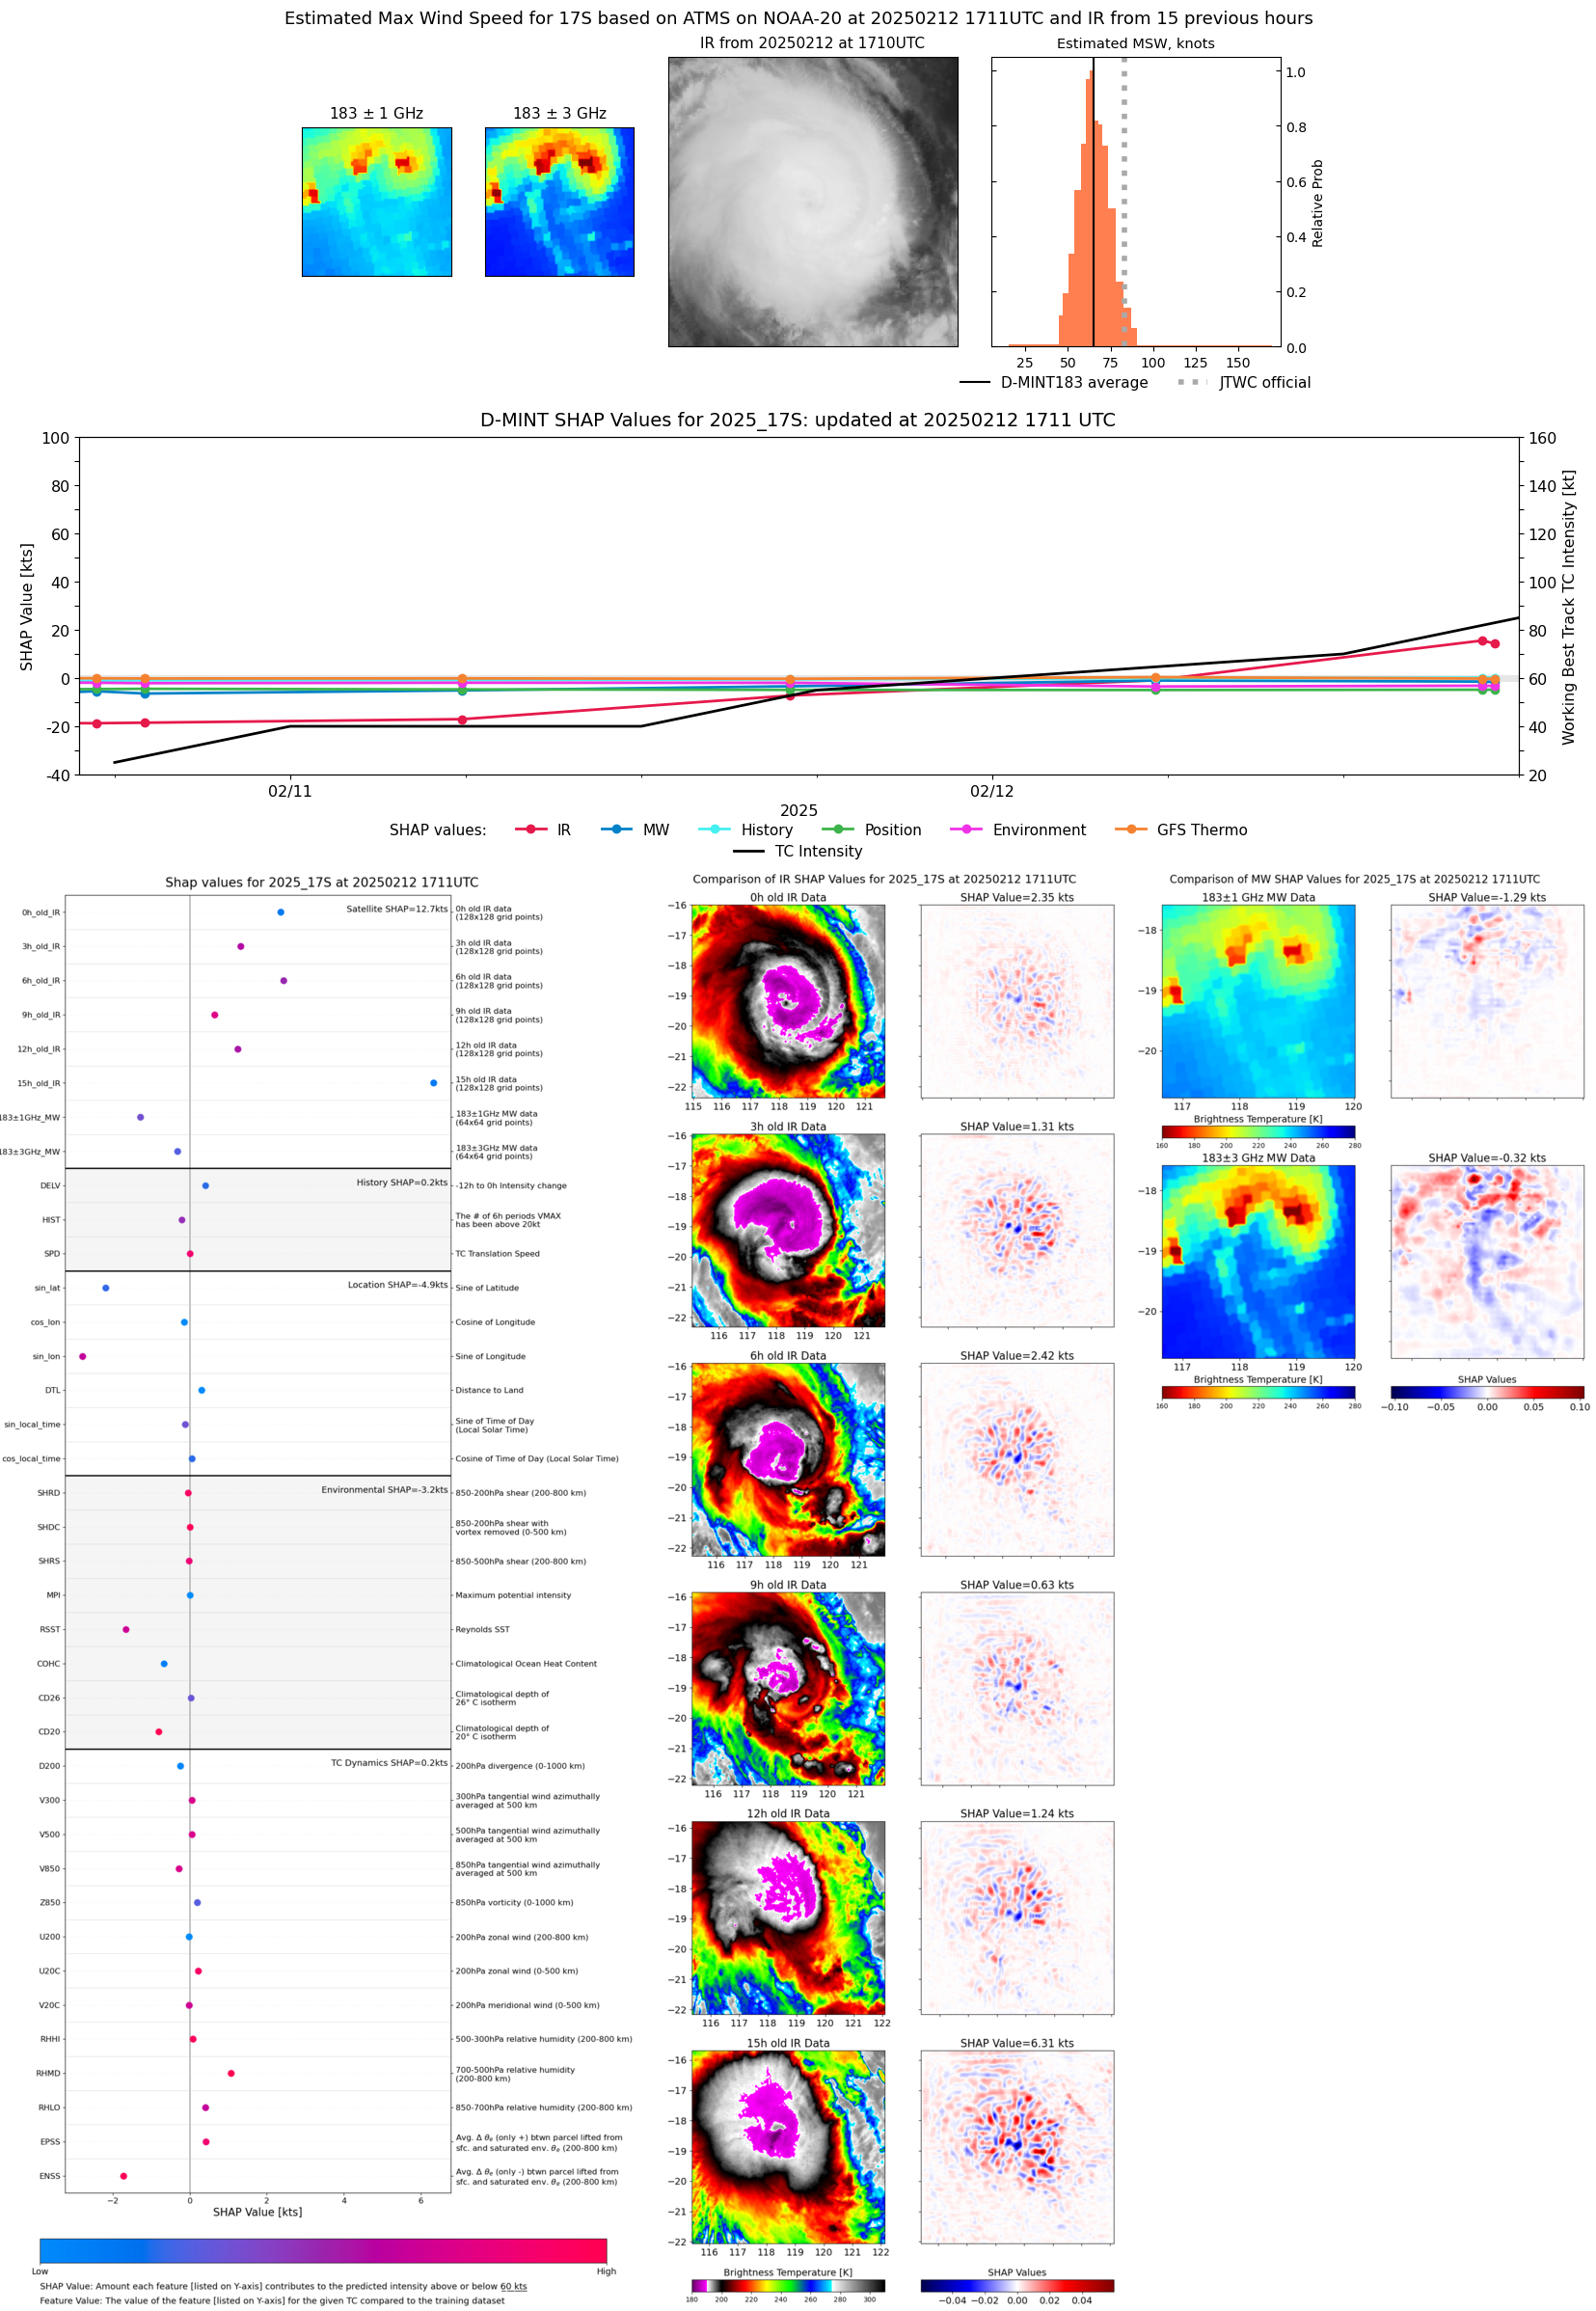 |
| 20250212 | 1645 UTC | ATMS-N20 | 974 hPa | 67 kts | 60 kts | 74 kts | 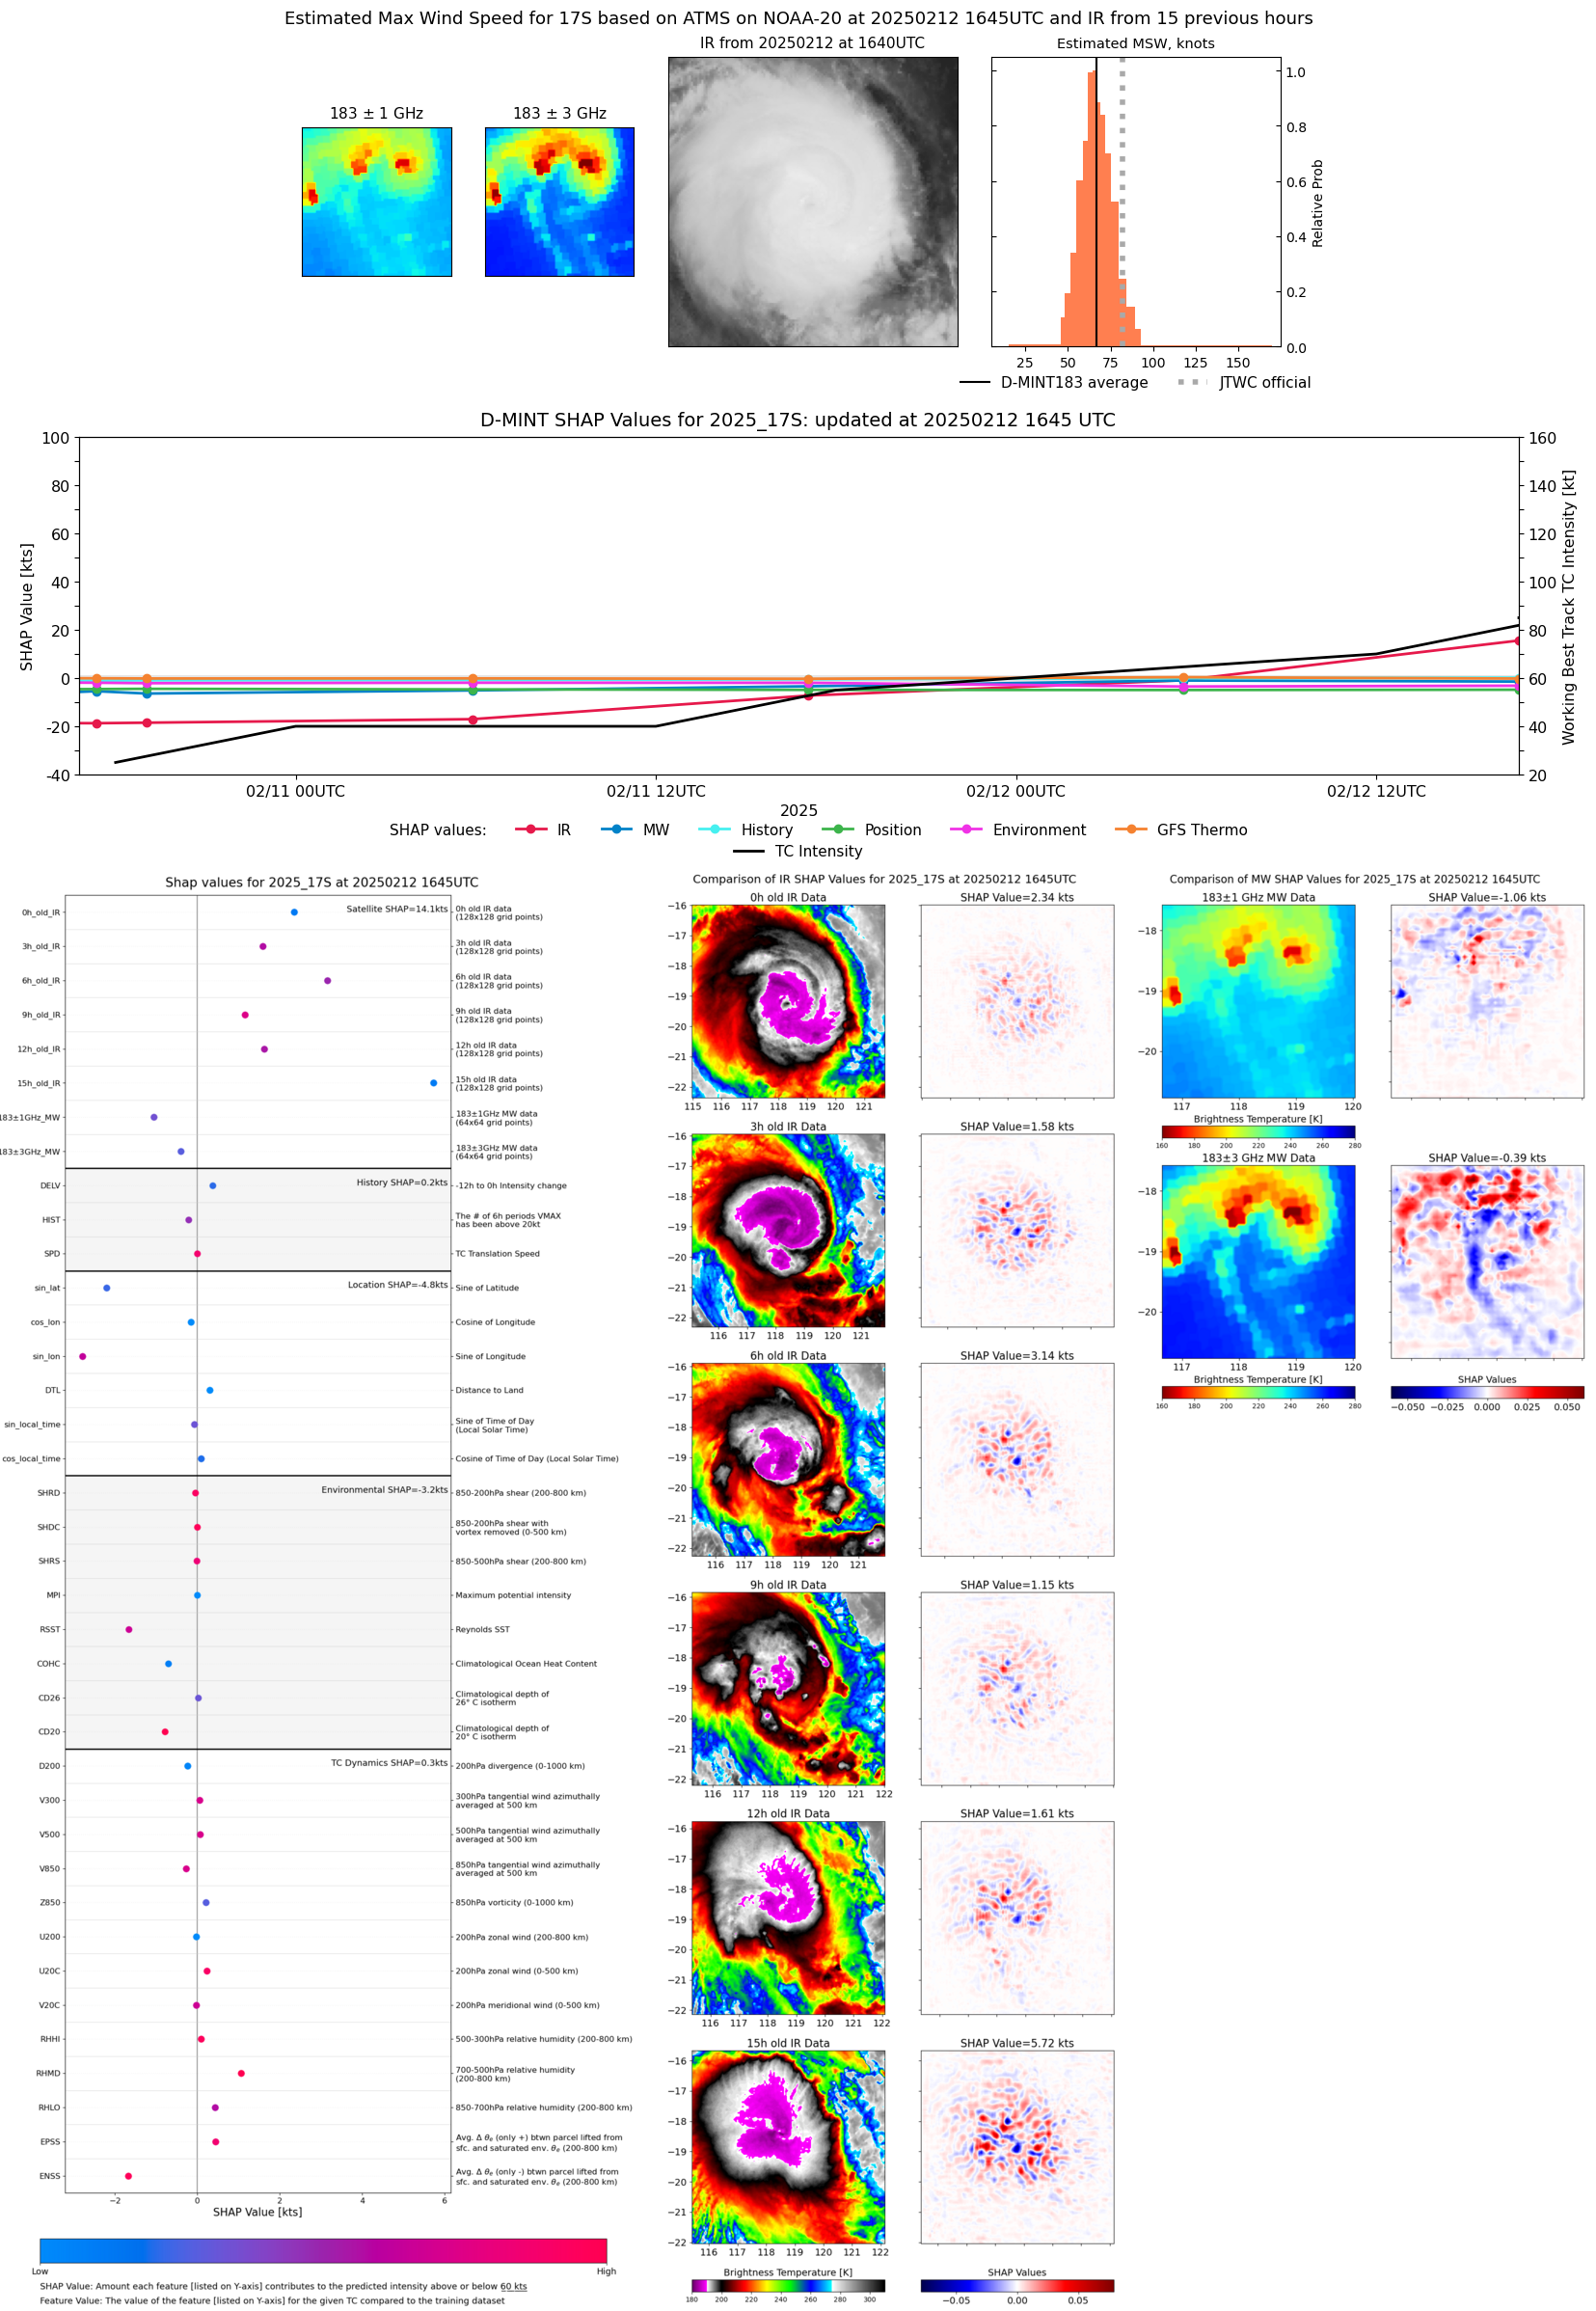 |
| 20250212 | 1350 UTC | TROPICS03 | 961 hPa | 77 kts | 70 kts | 84 kts | 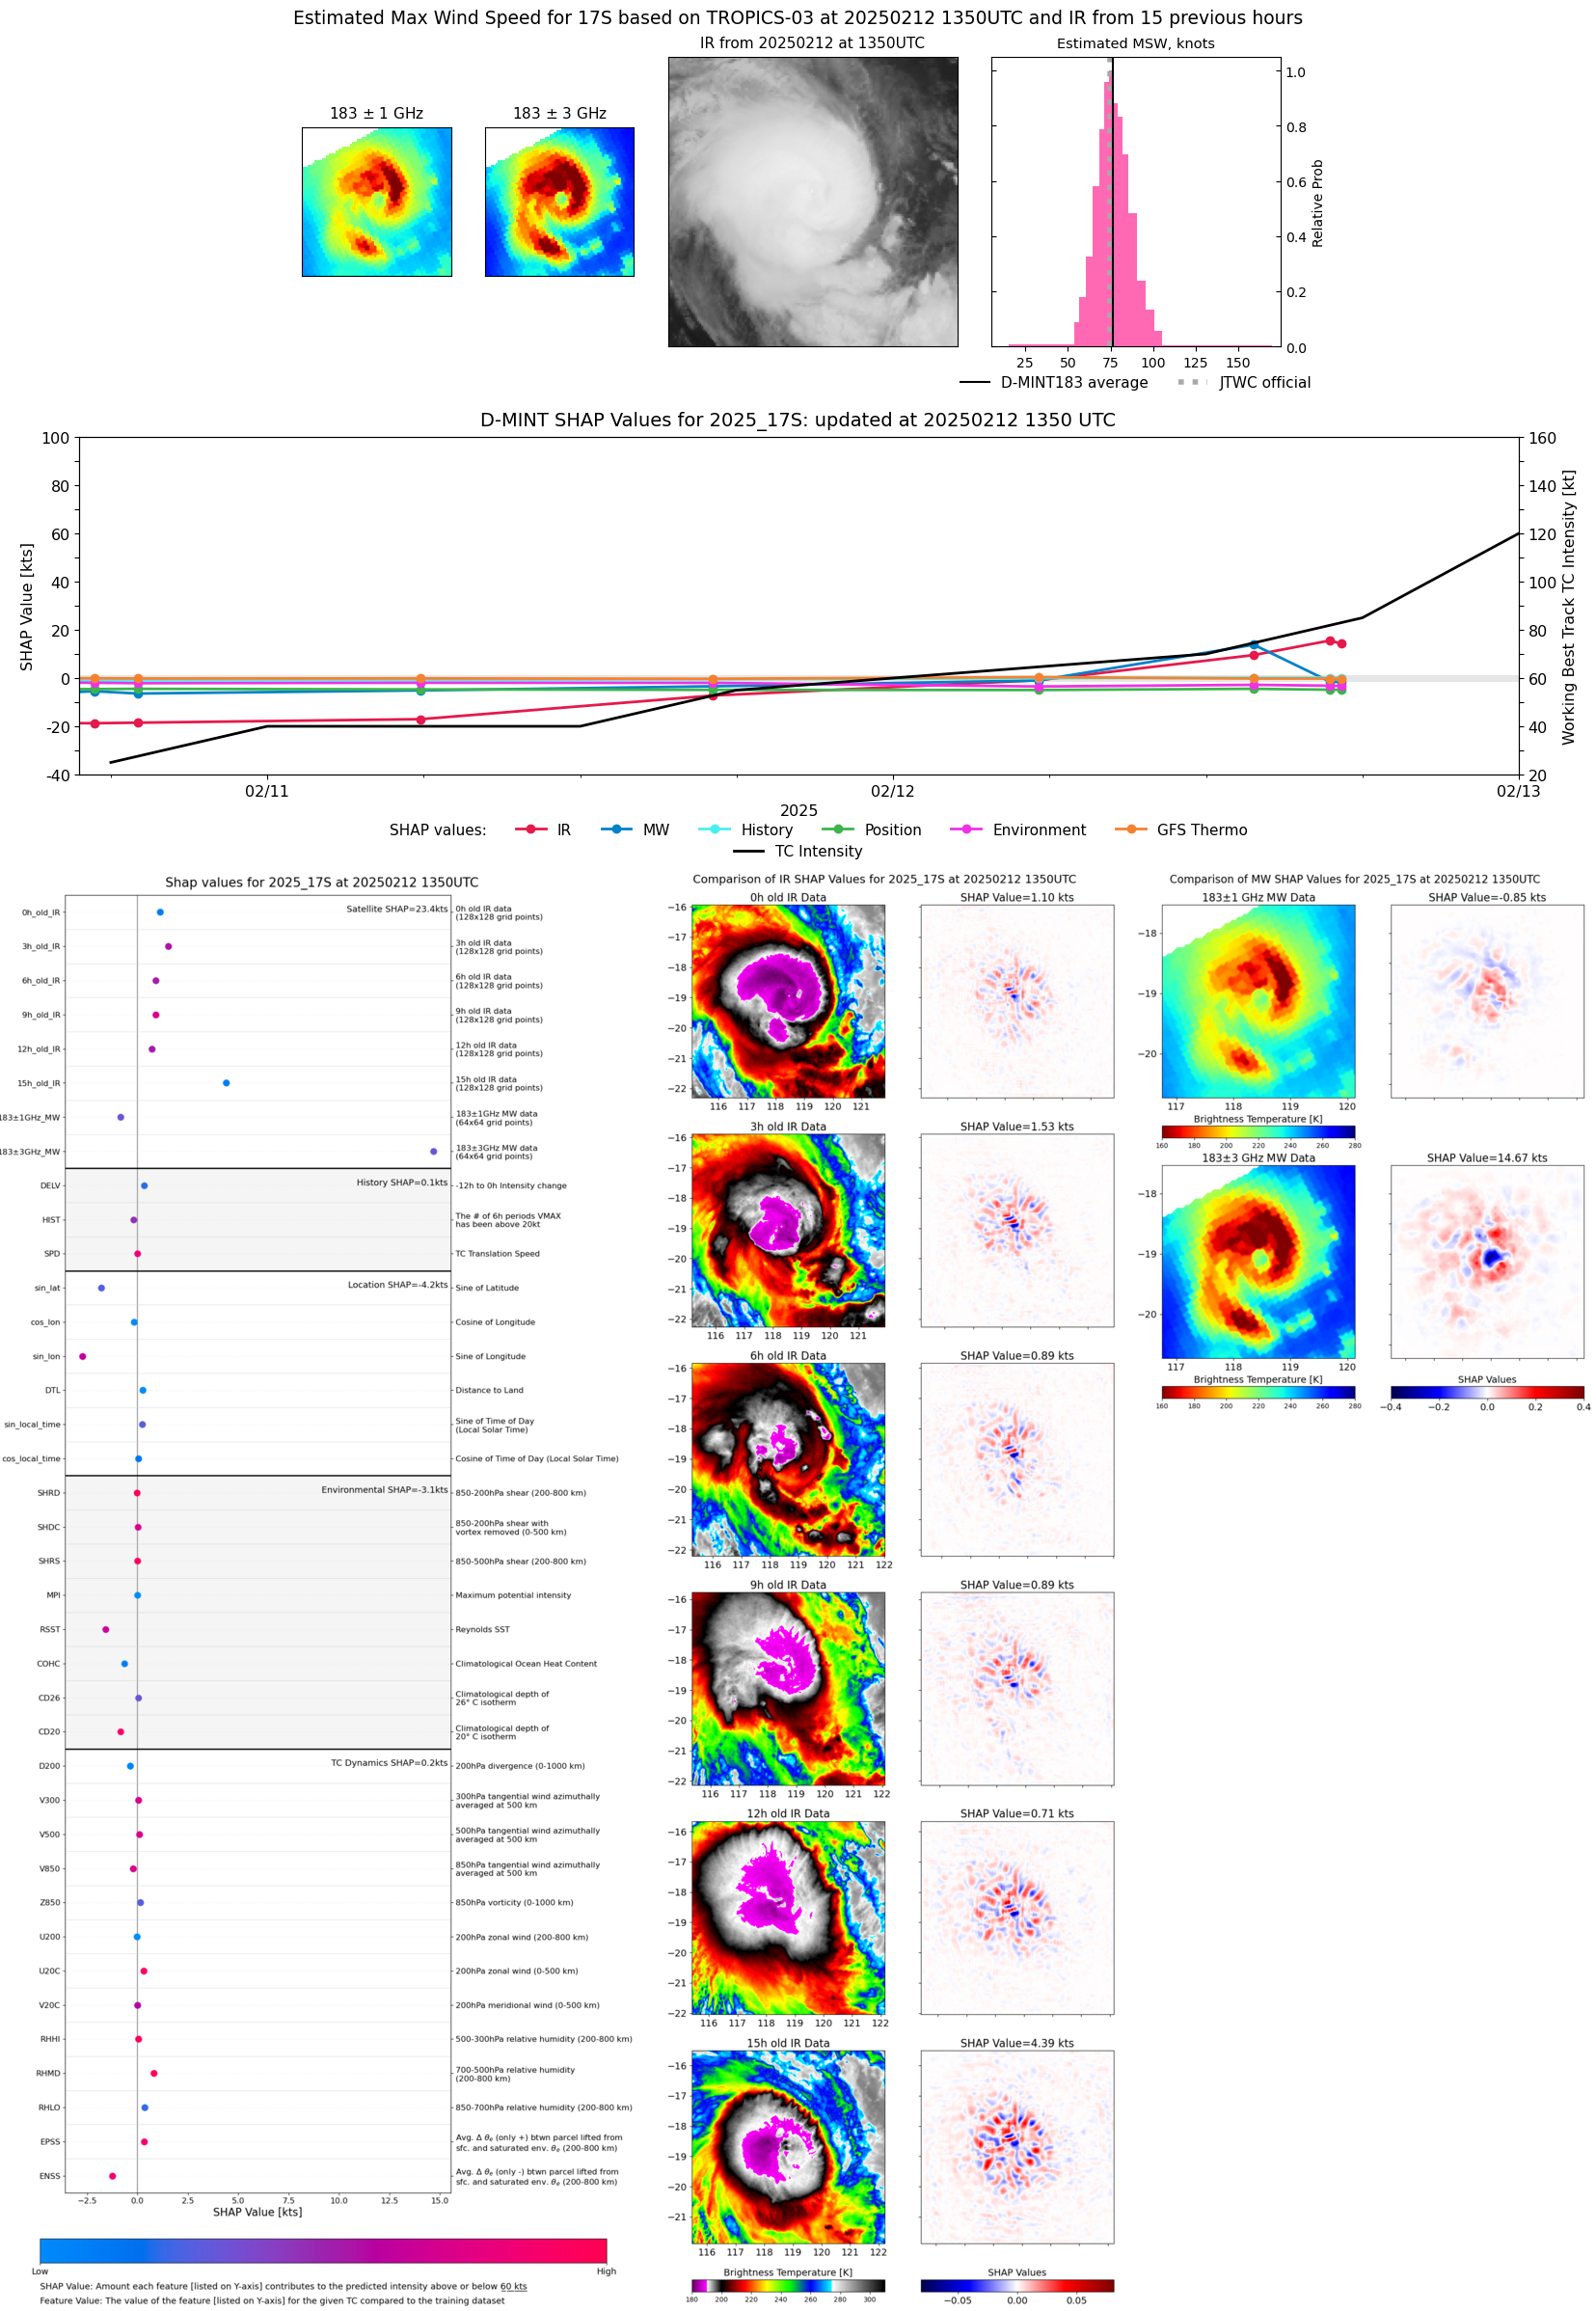 |
| 20250212 | 1050 UTC | SSMISF17 | 966 hPa | 69 kts | 62 kts | 77 kts | 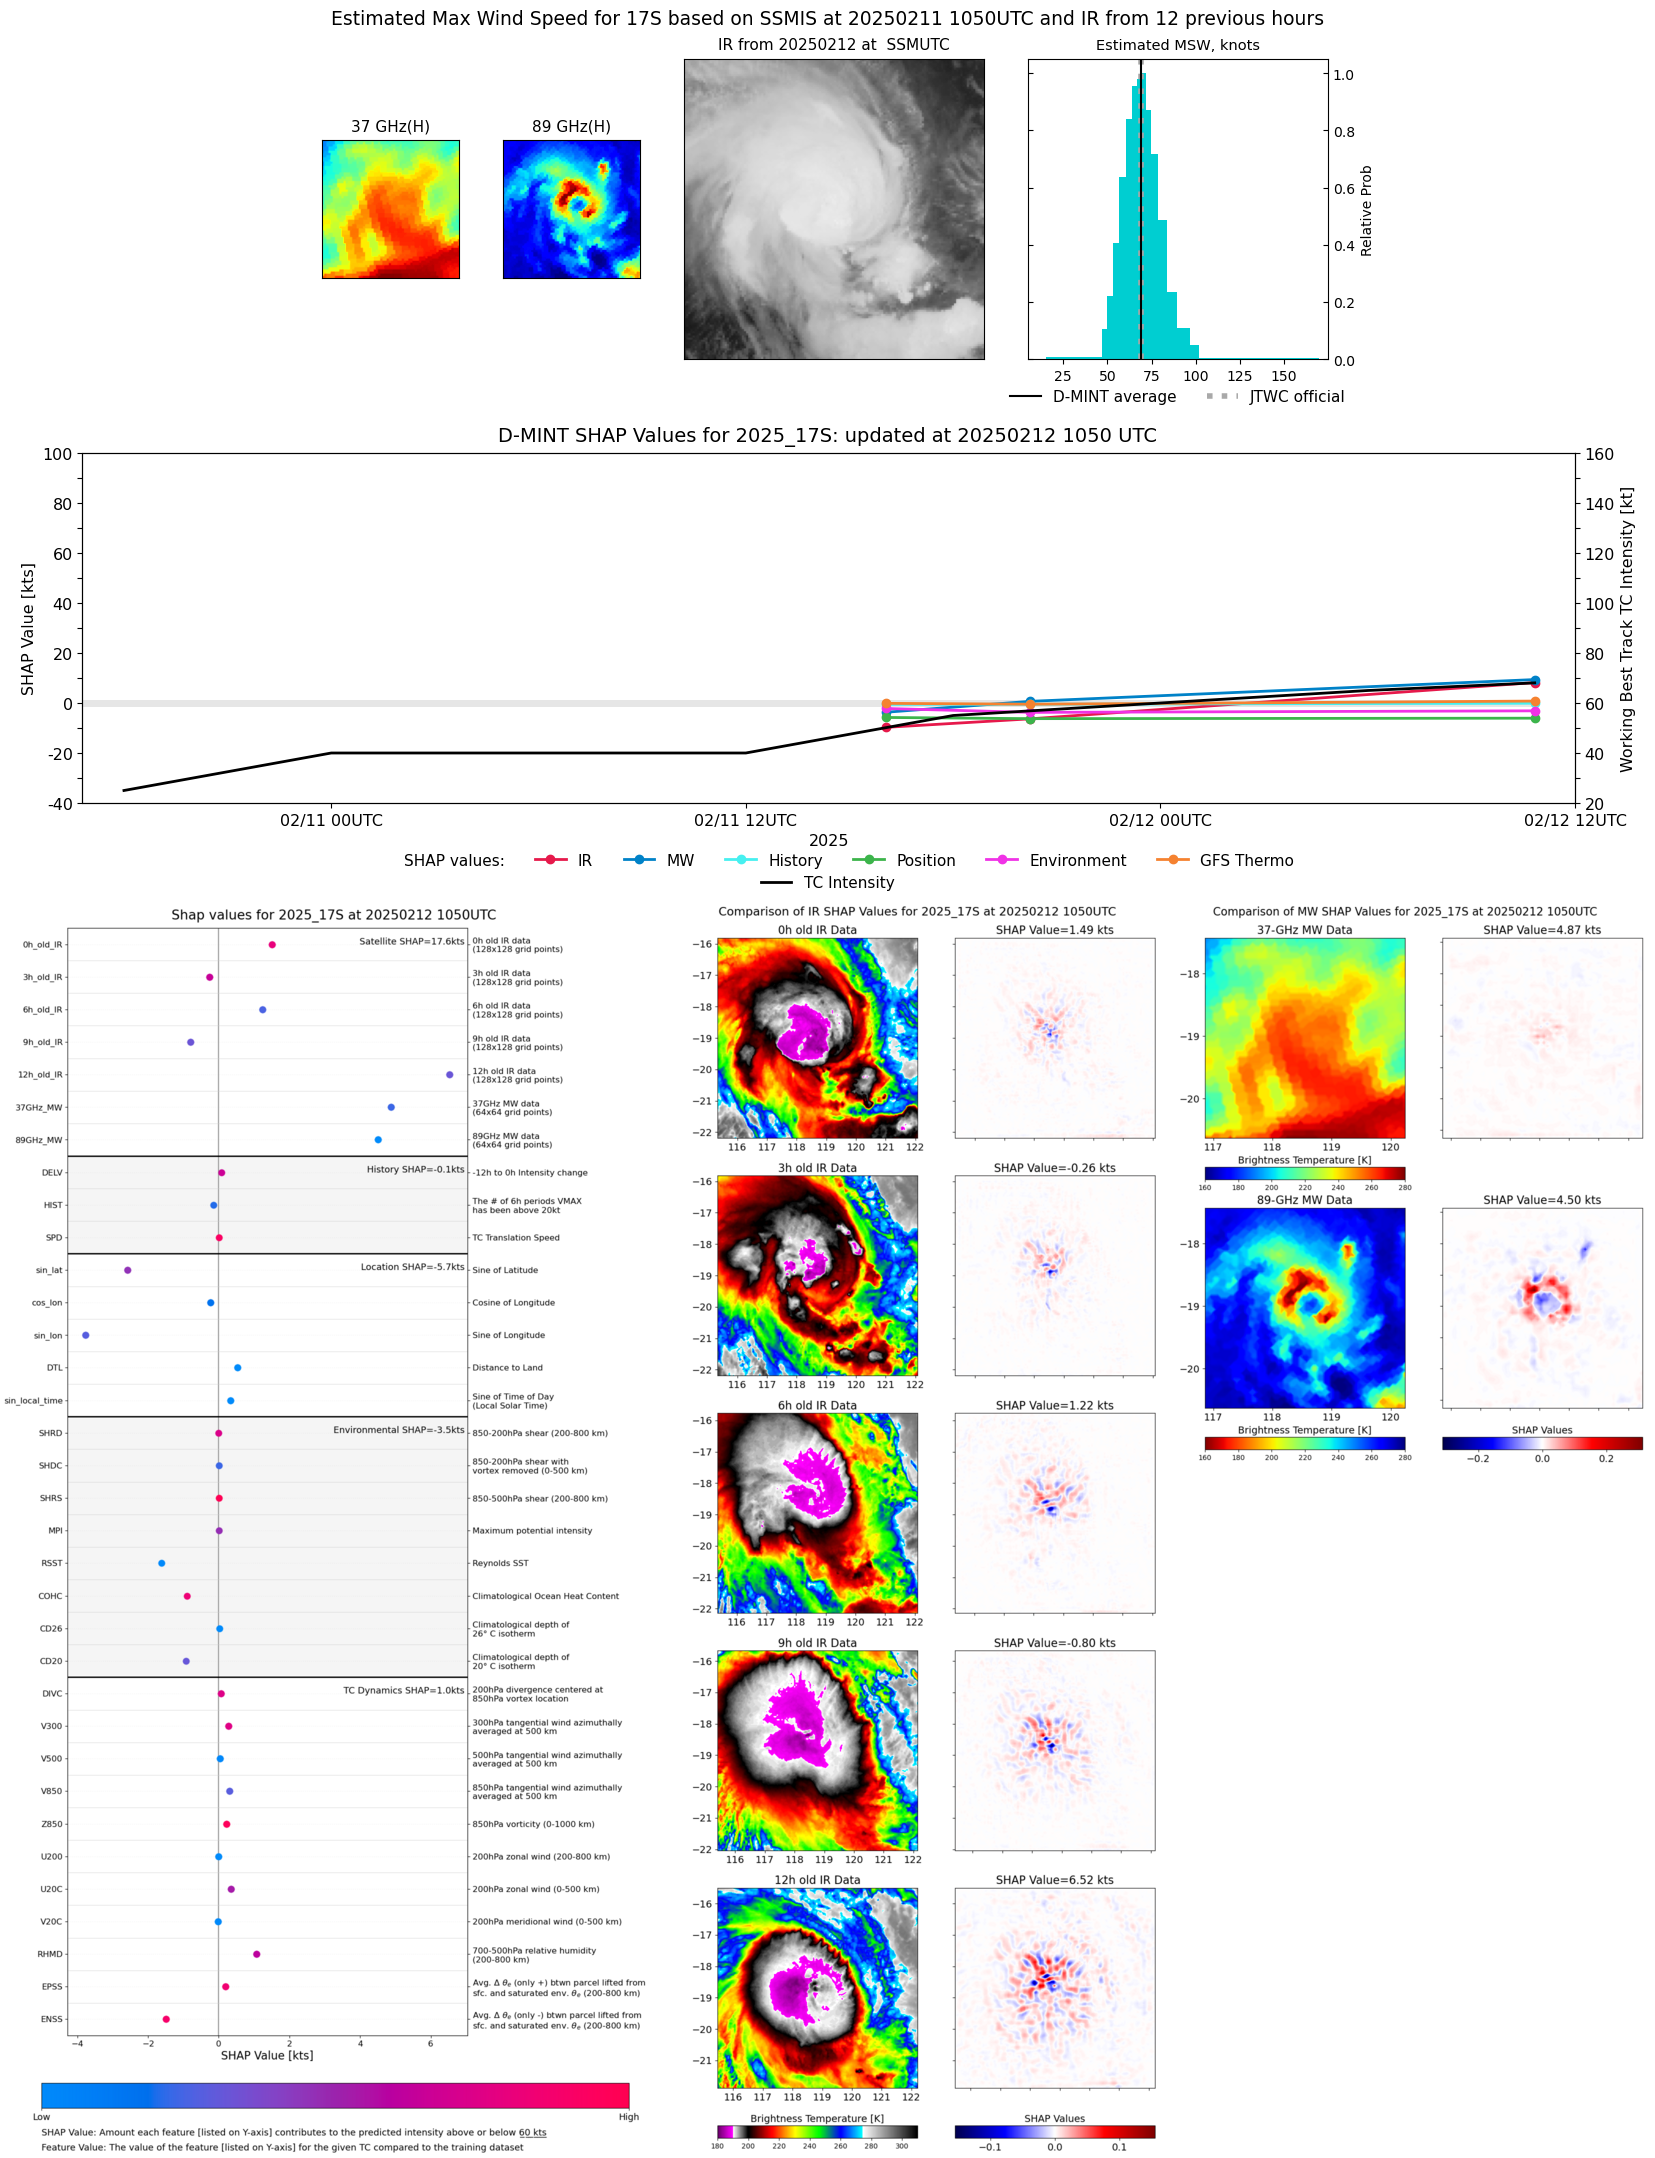 |
| 20250212 | 0534 UTC | ATMS-N20 | 982 hPa | 51 kts | 45 kts | 57 kts | 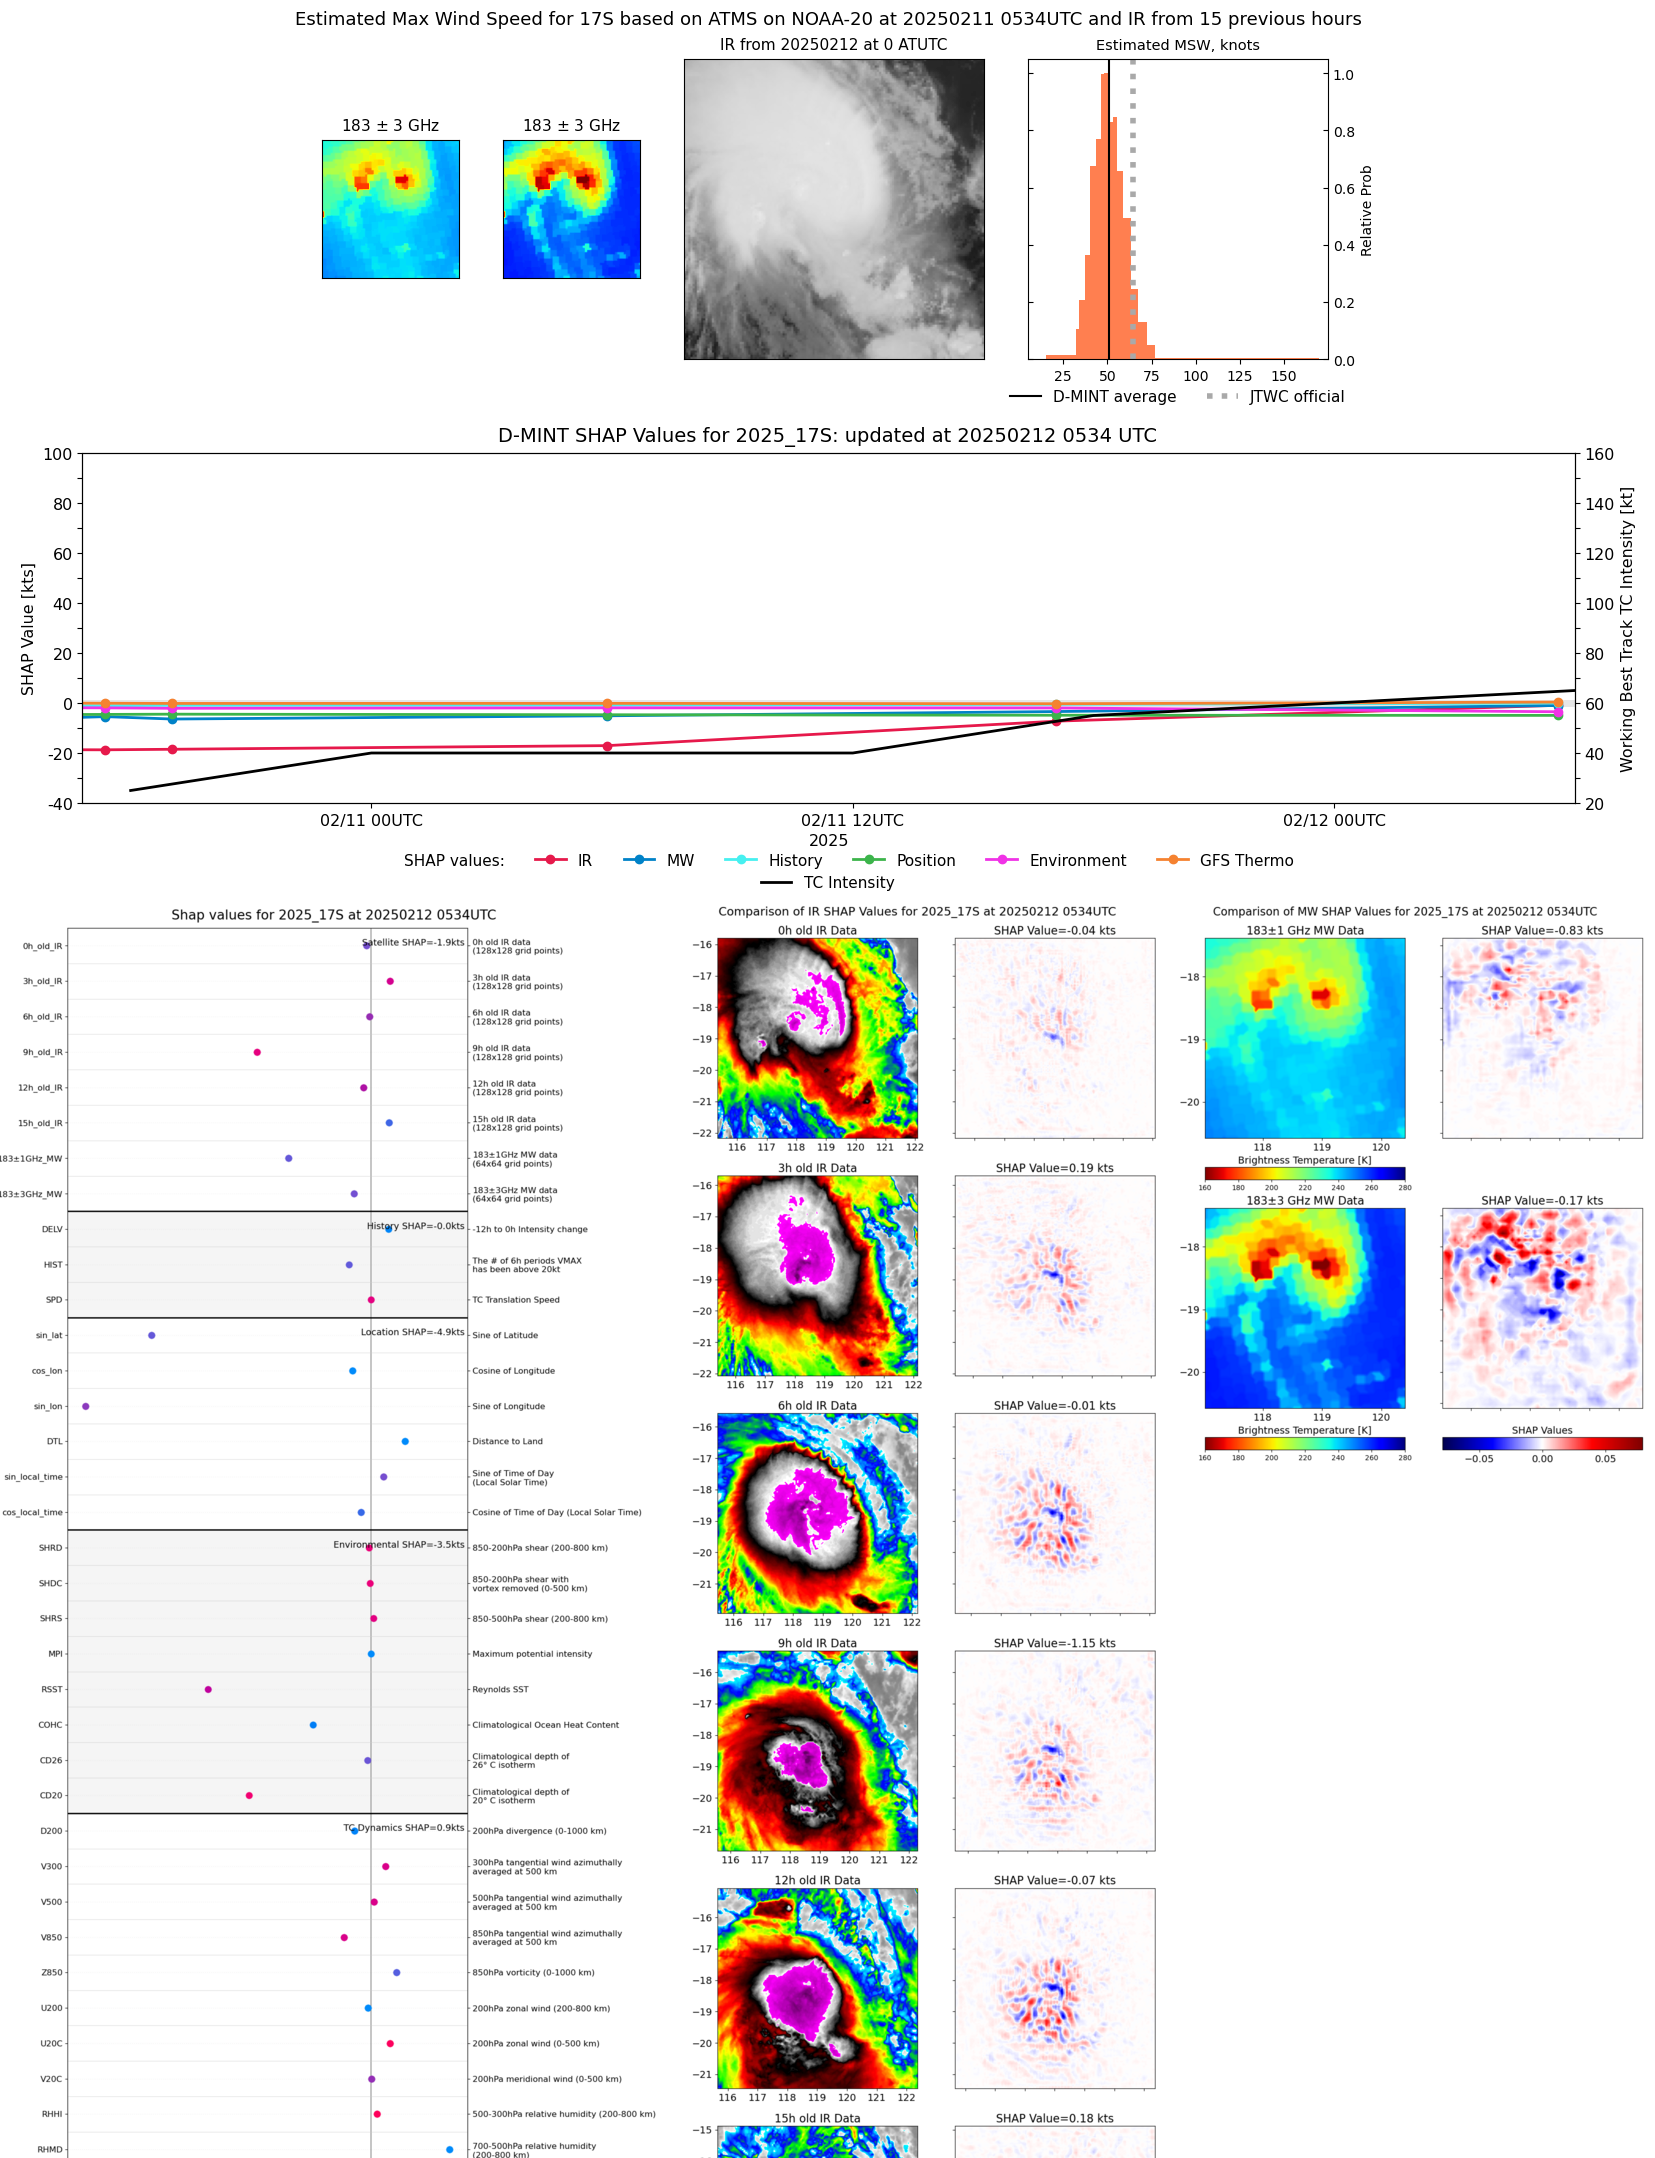 |
| 20250211 | 2014 UTC | SSMISF18 | 991 hPa | 44 kts | 38 kts | 50 kts |  |
| 20250211 | 1704 UTC | ATMS-N20 | 989 hPa | 42 kts | 37 kts | 47 kts | 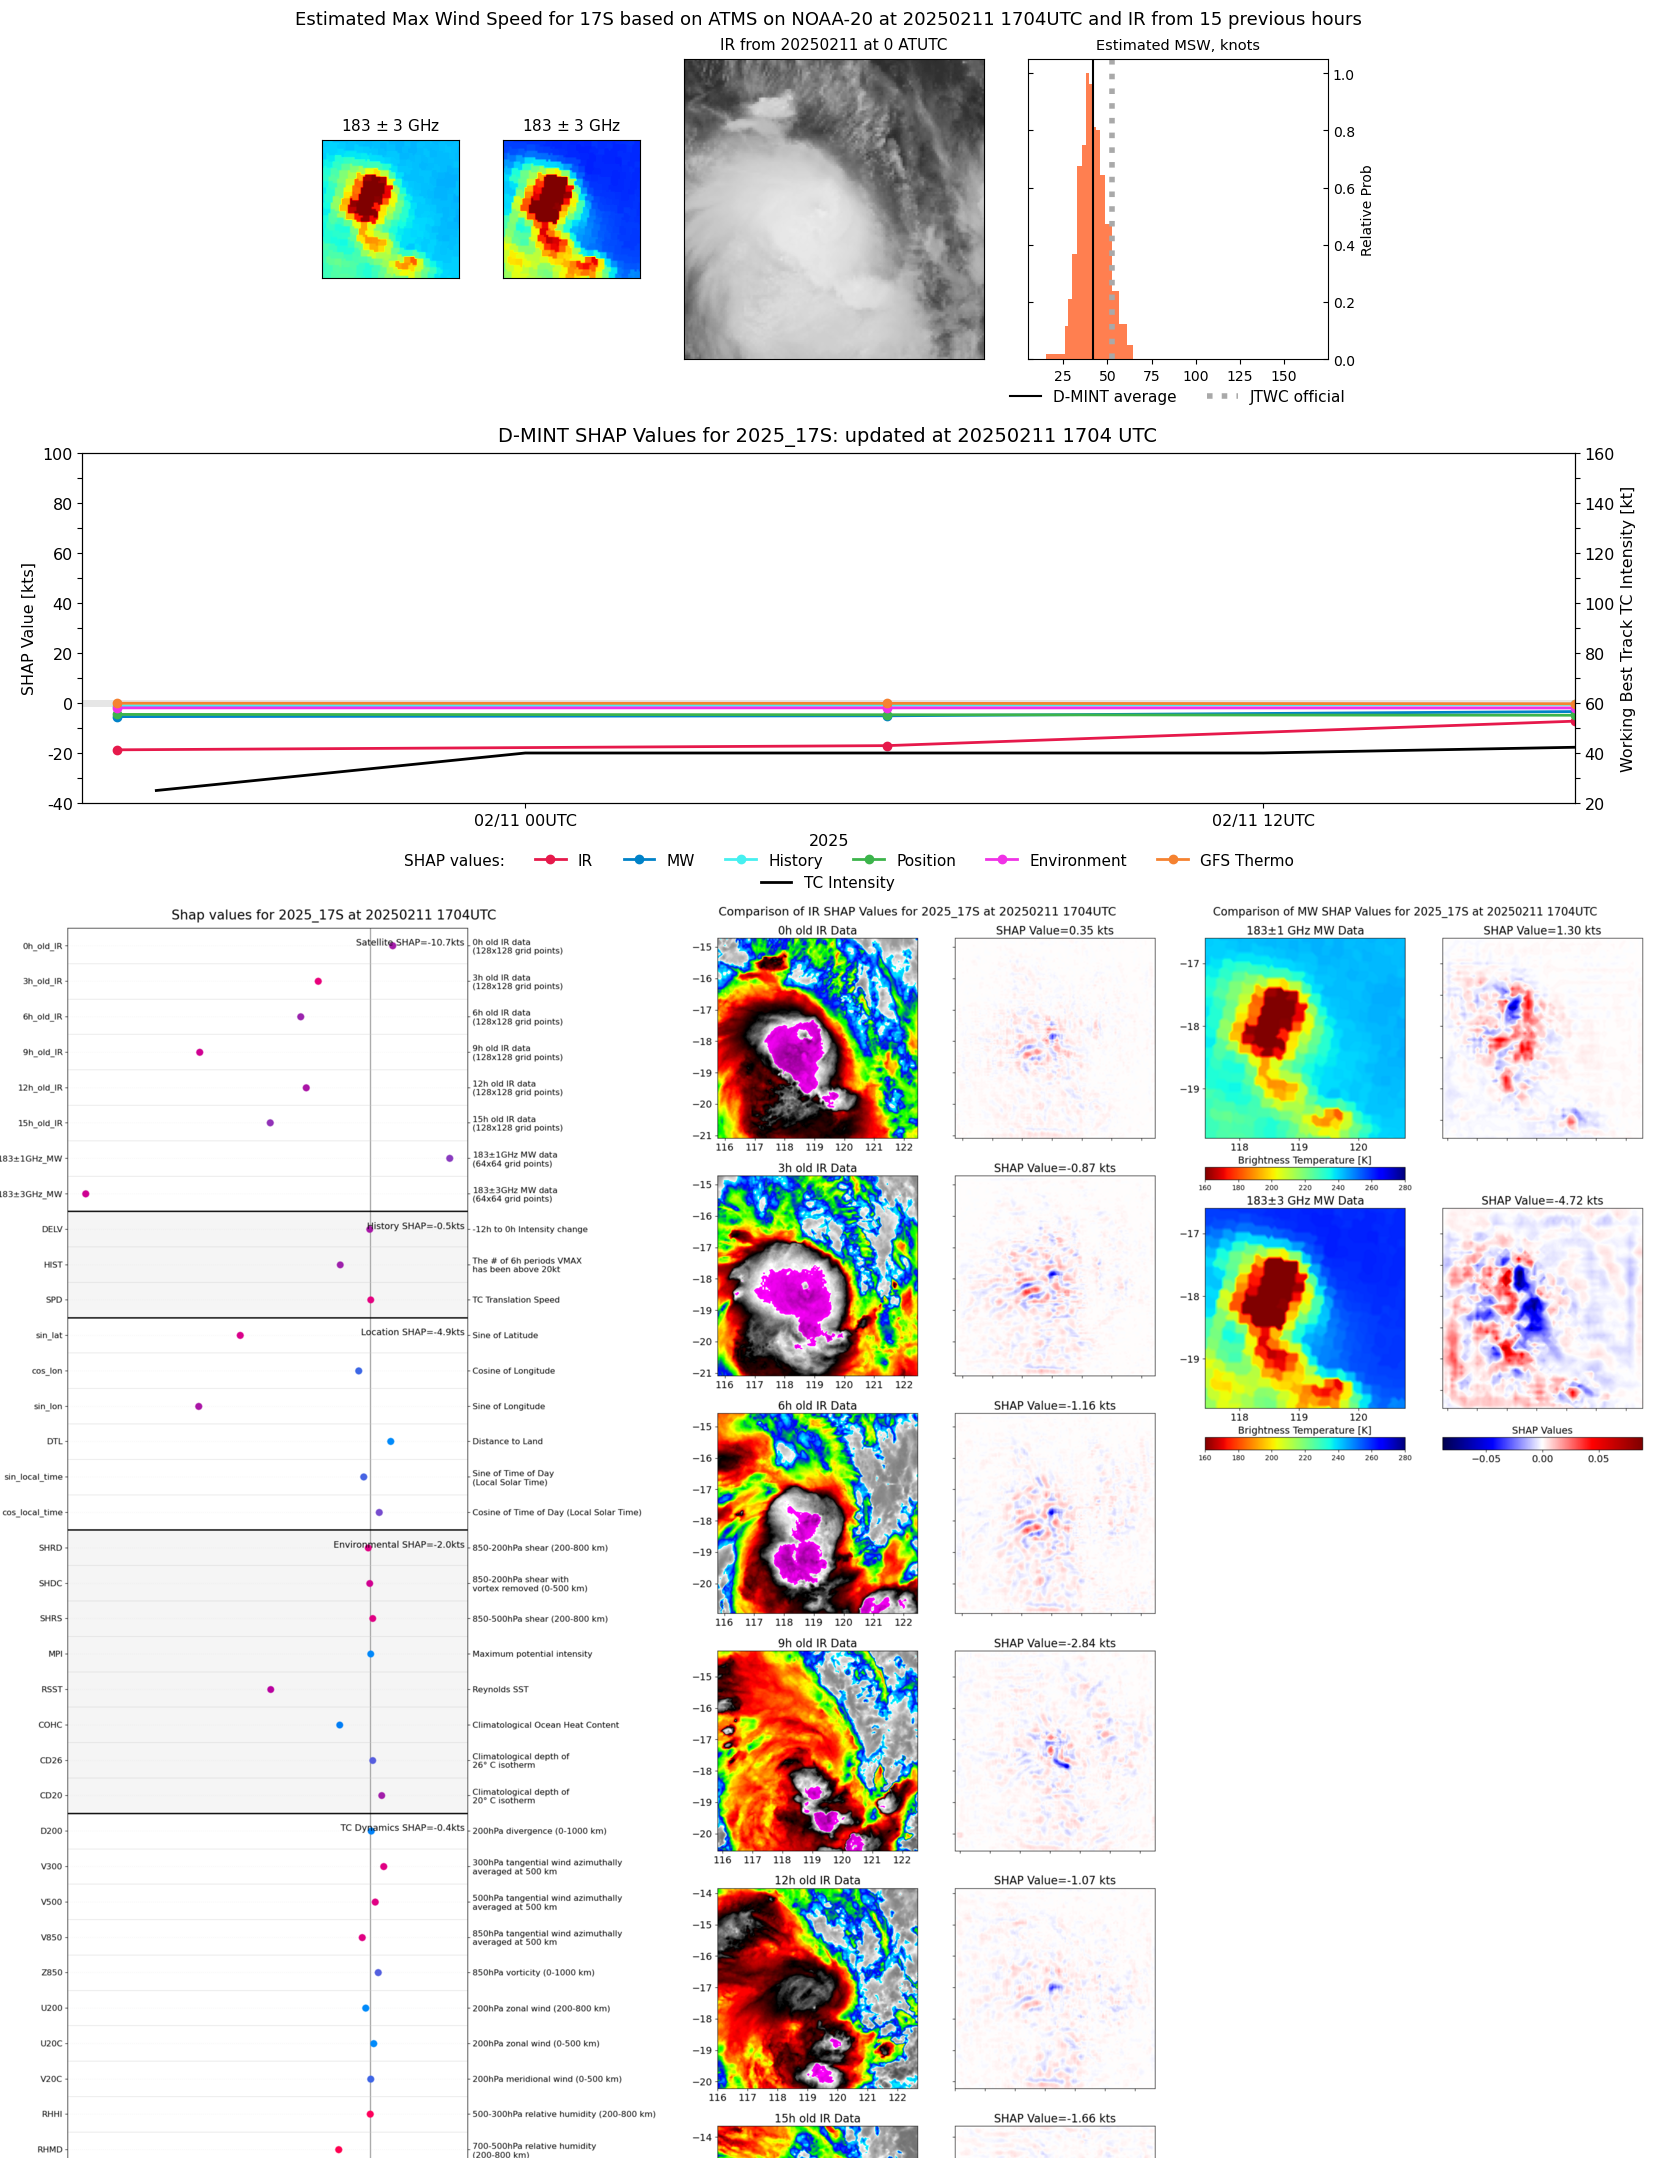 |
| 20250211 | 1603 UTC | GMI | 991 hPa | 38 kts | 33 kts | 43 kts | 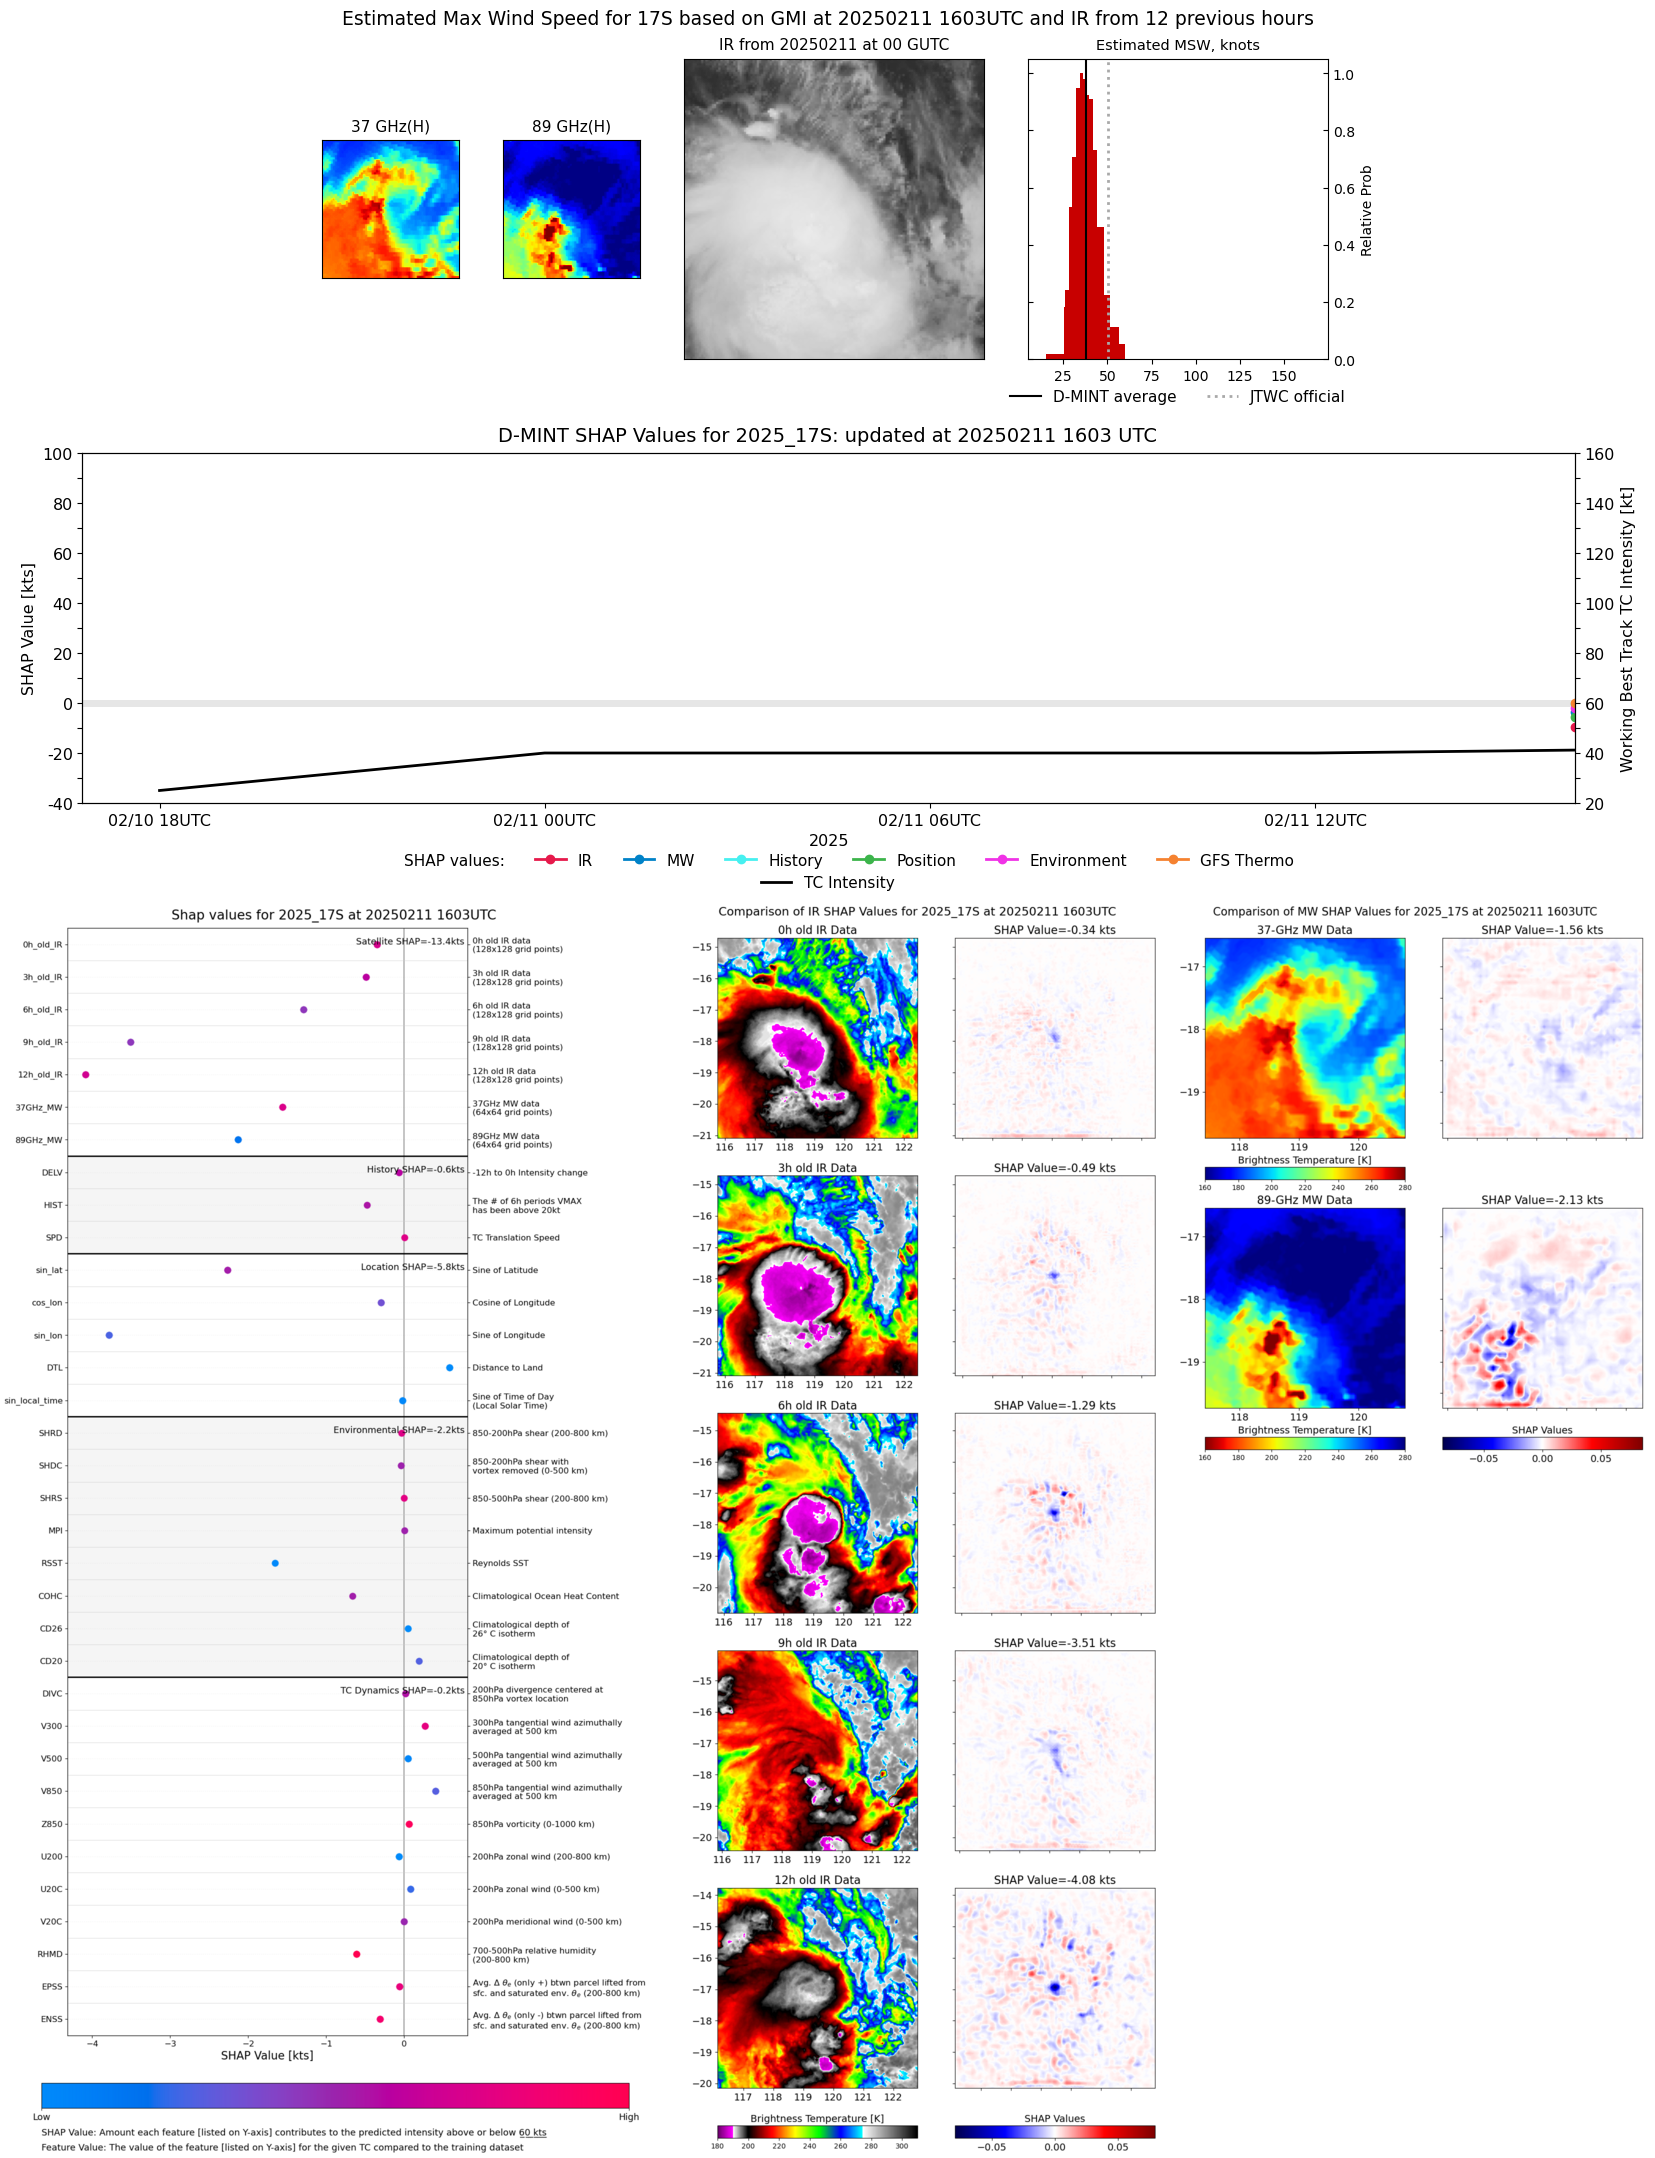 |
| 20250211 | 1429 UTC | TROPICS03 | 989 hPa | 44 kts | 38 kts | 51 kts | 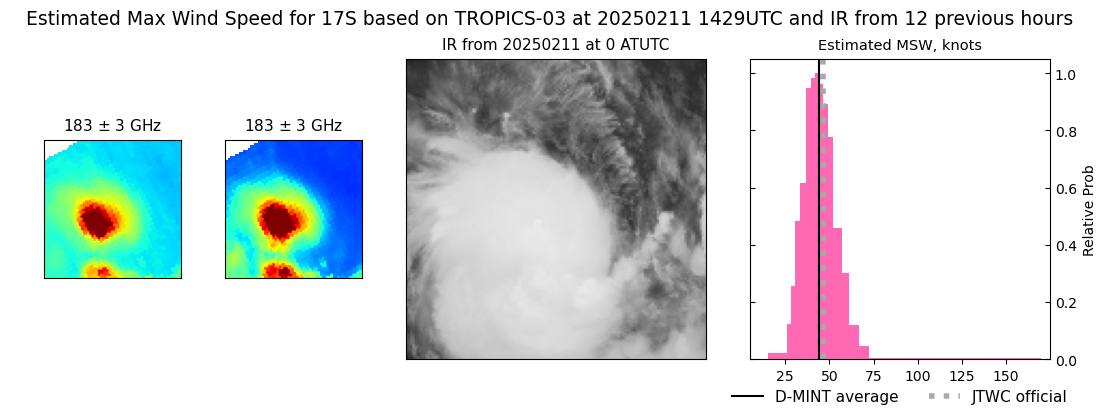 |
| 20250211 | 1004 UTC | SSMISF16 | 993 hPa | 31 kts | 28 kts | 36 kts |  |
| 20250211 | 0553 UTC | ATMS-N20 | 990 hPa | 30 kts | 27 kts | 34 kts | 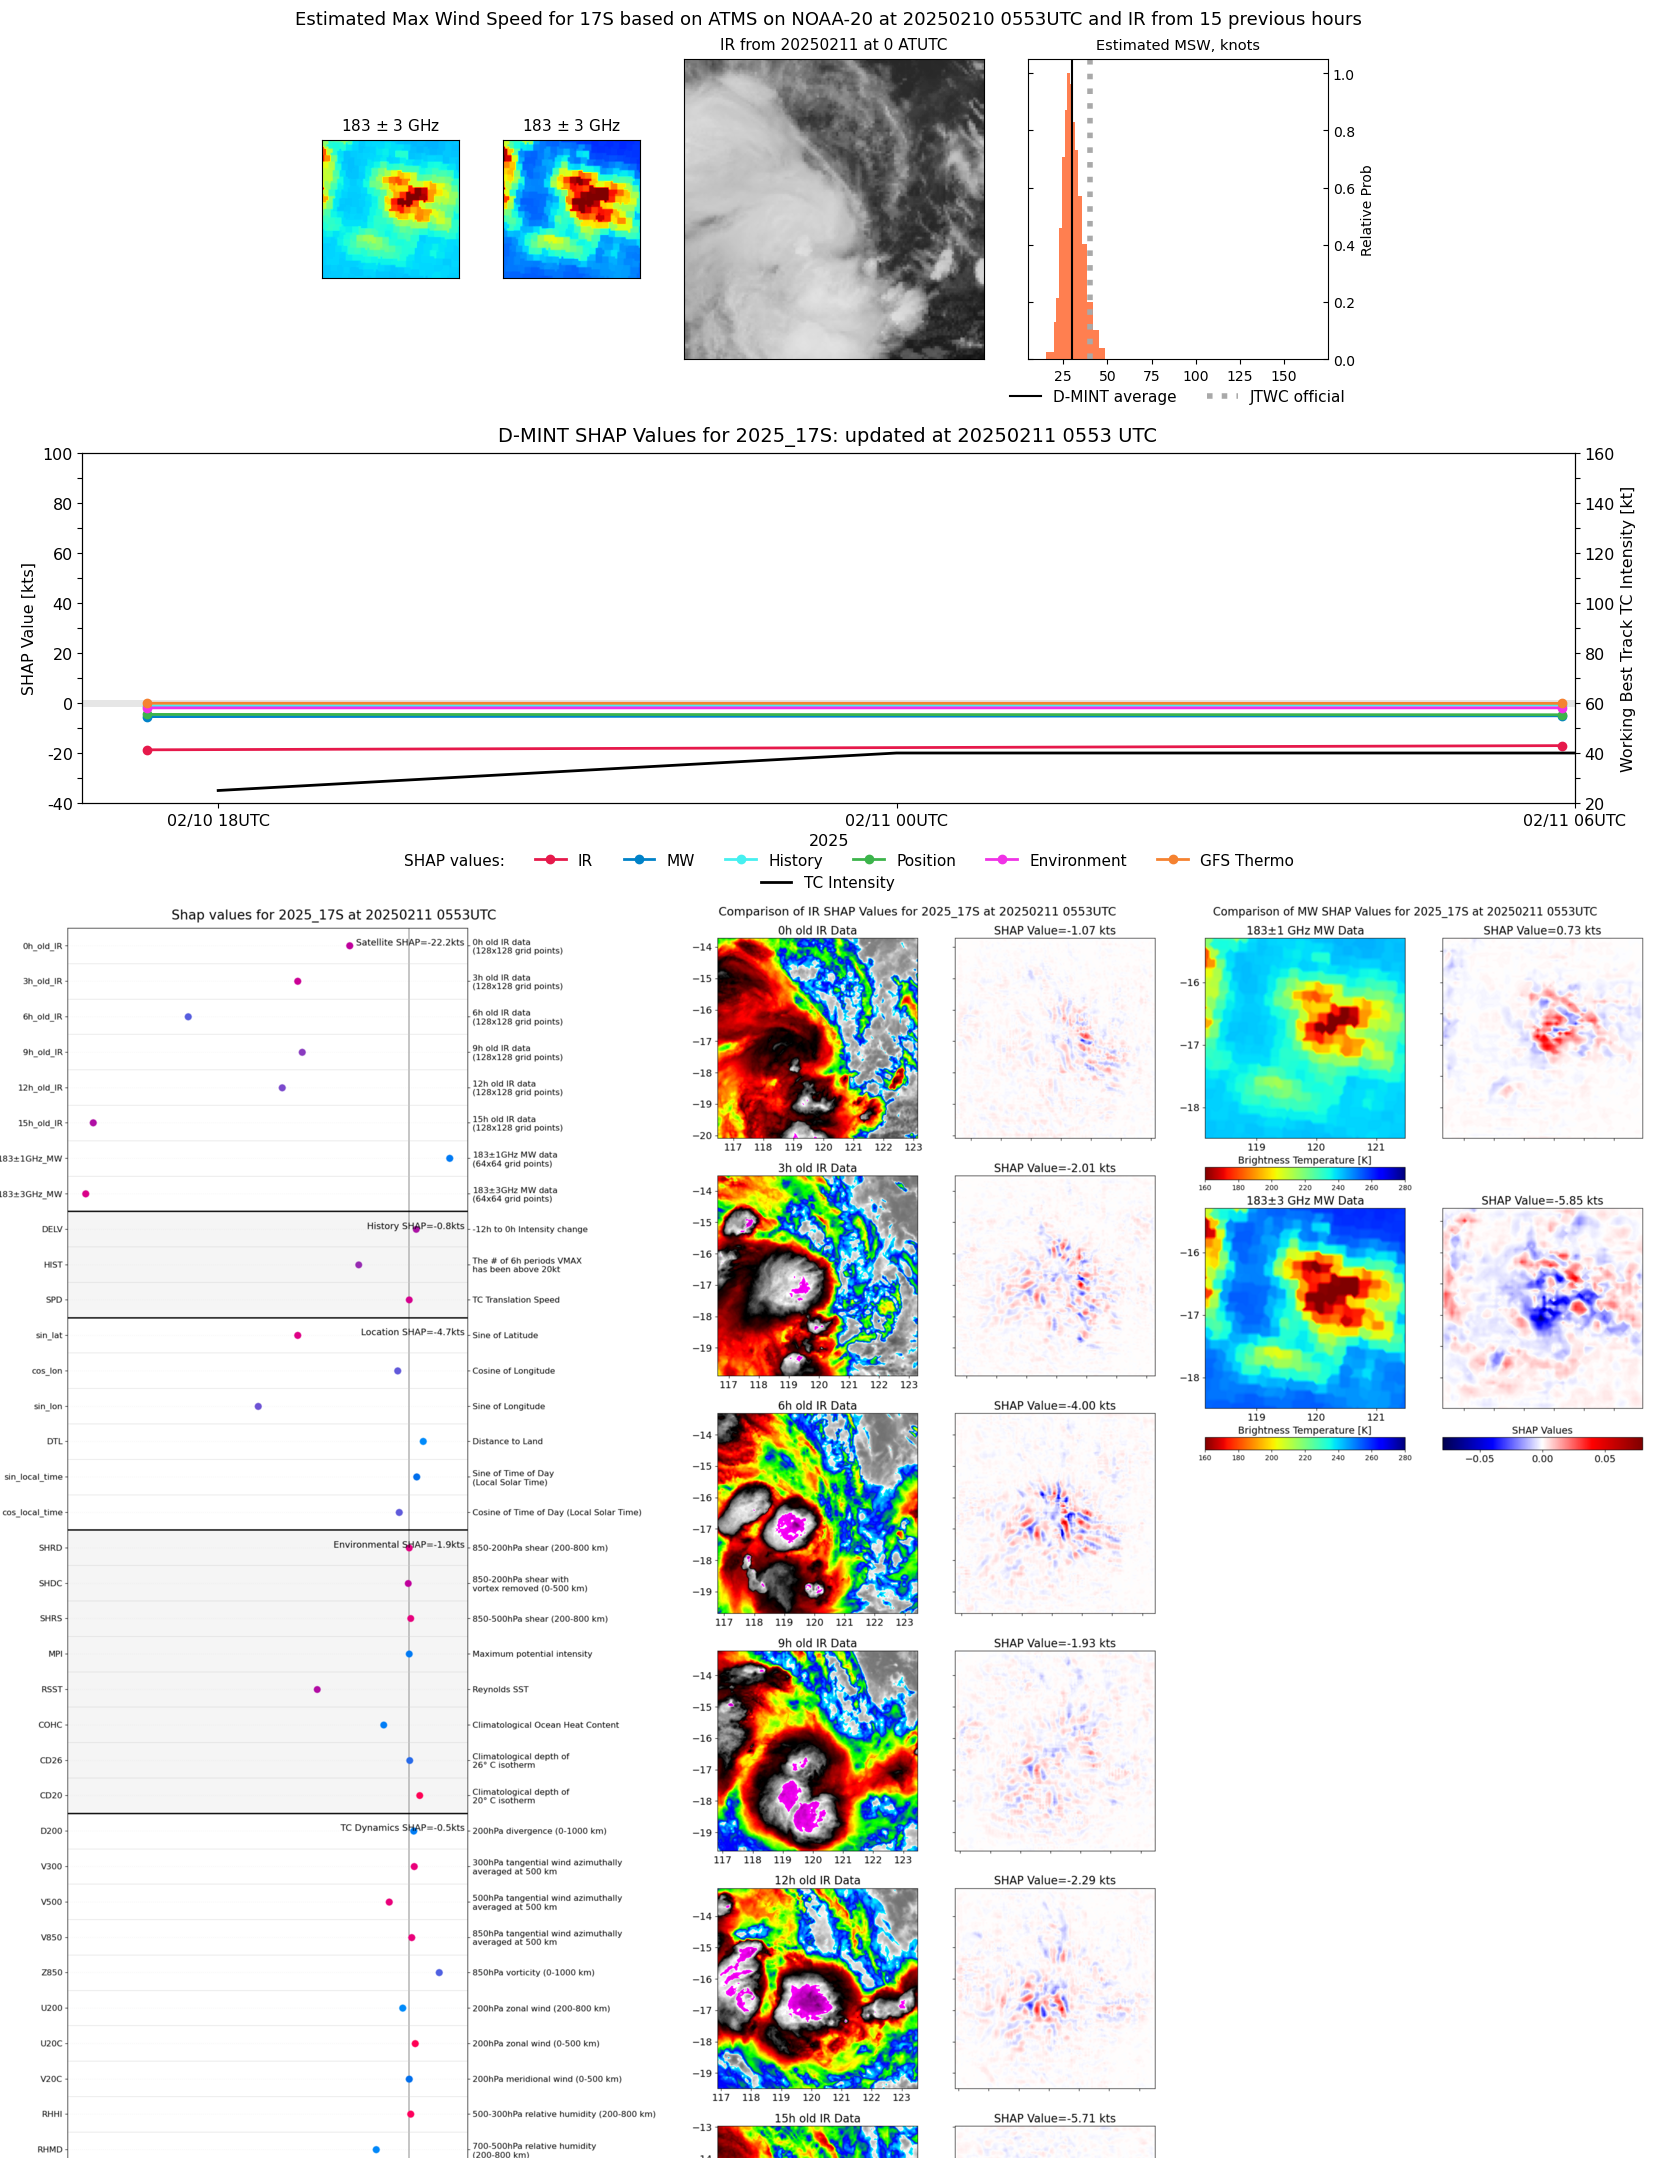 |
| 20250210 | 1902 UTC | TROPICS05 | 997 hPa | 27 kts | 24 kts | 31 kts | 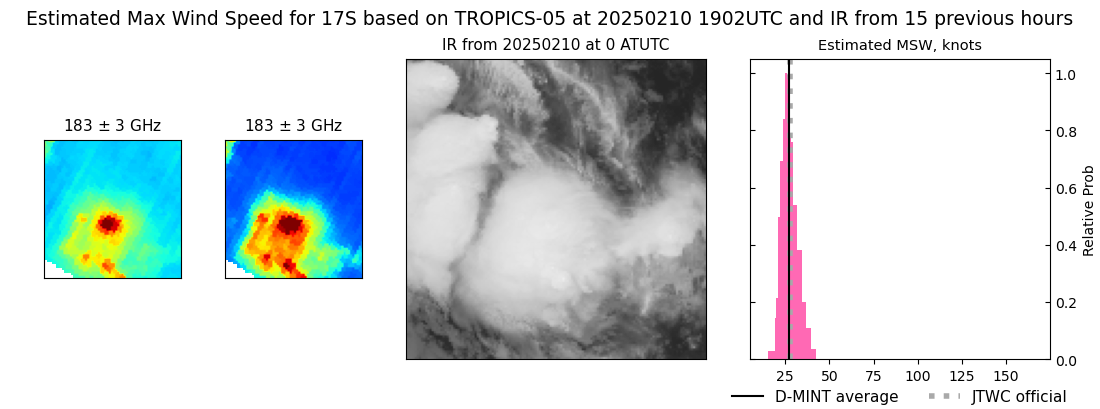 |
| 20250210 | 1722 UTC | ATMS-N20 | 994 hPa | 28 kts | 24 kts | 32 kts | 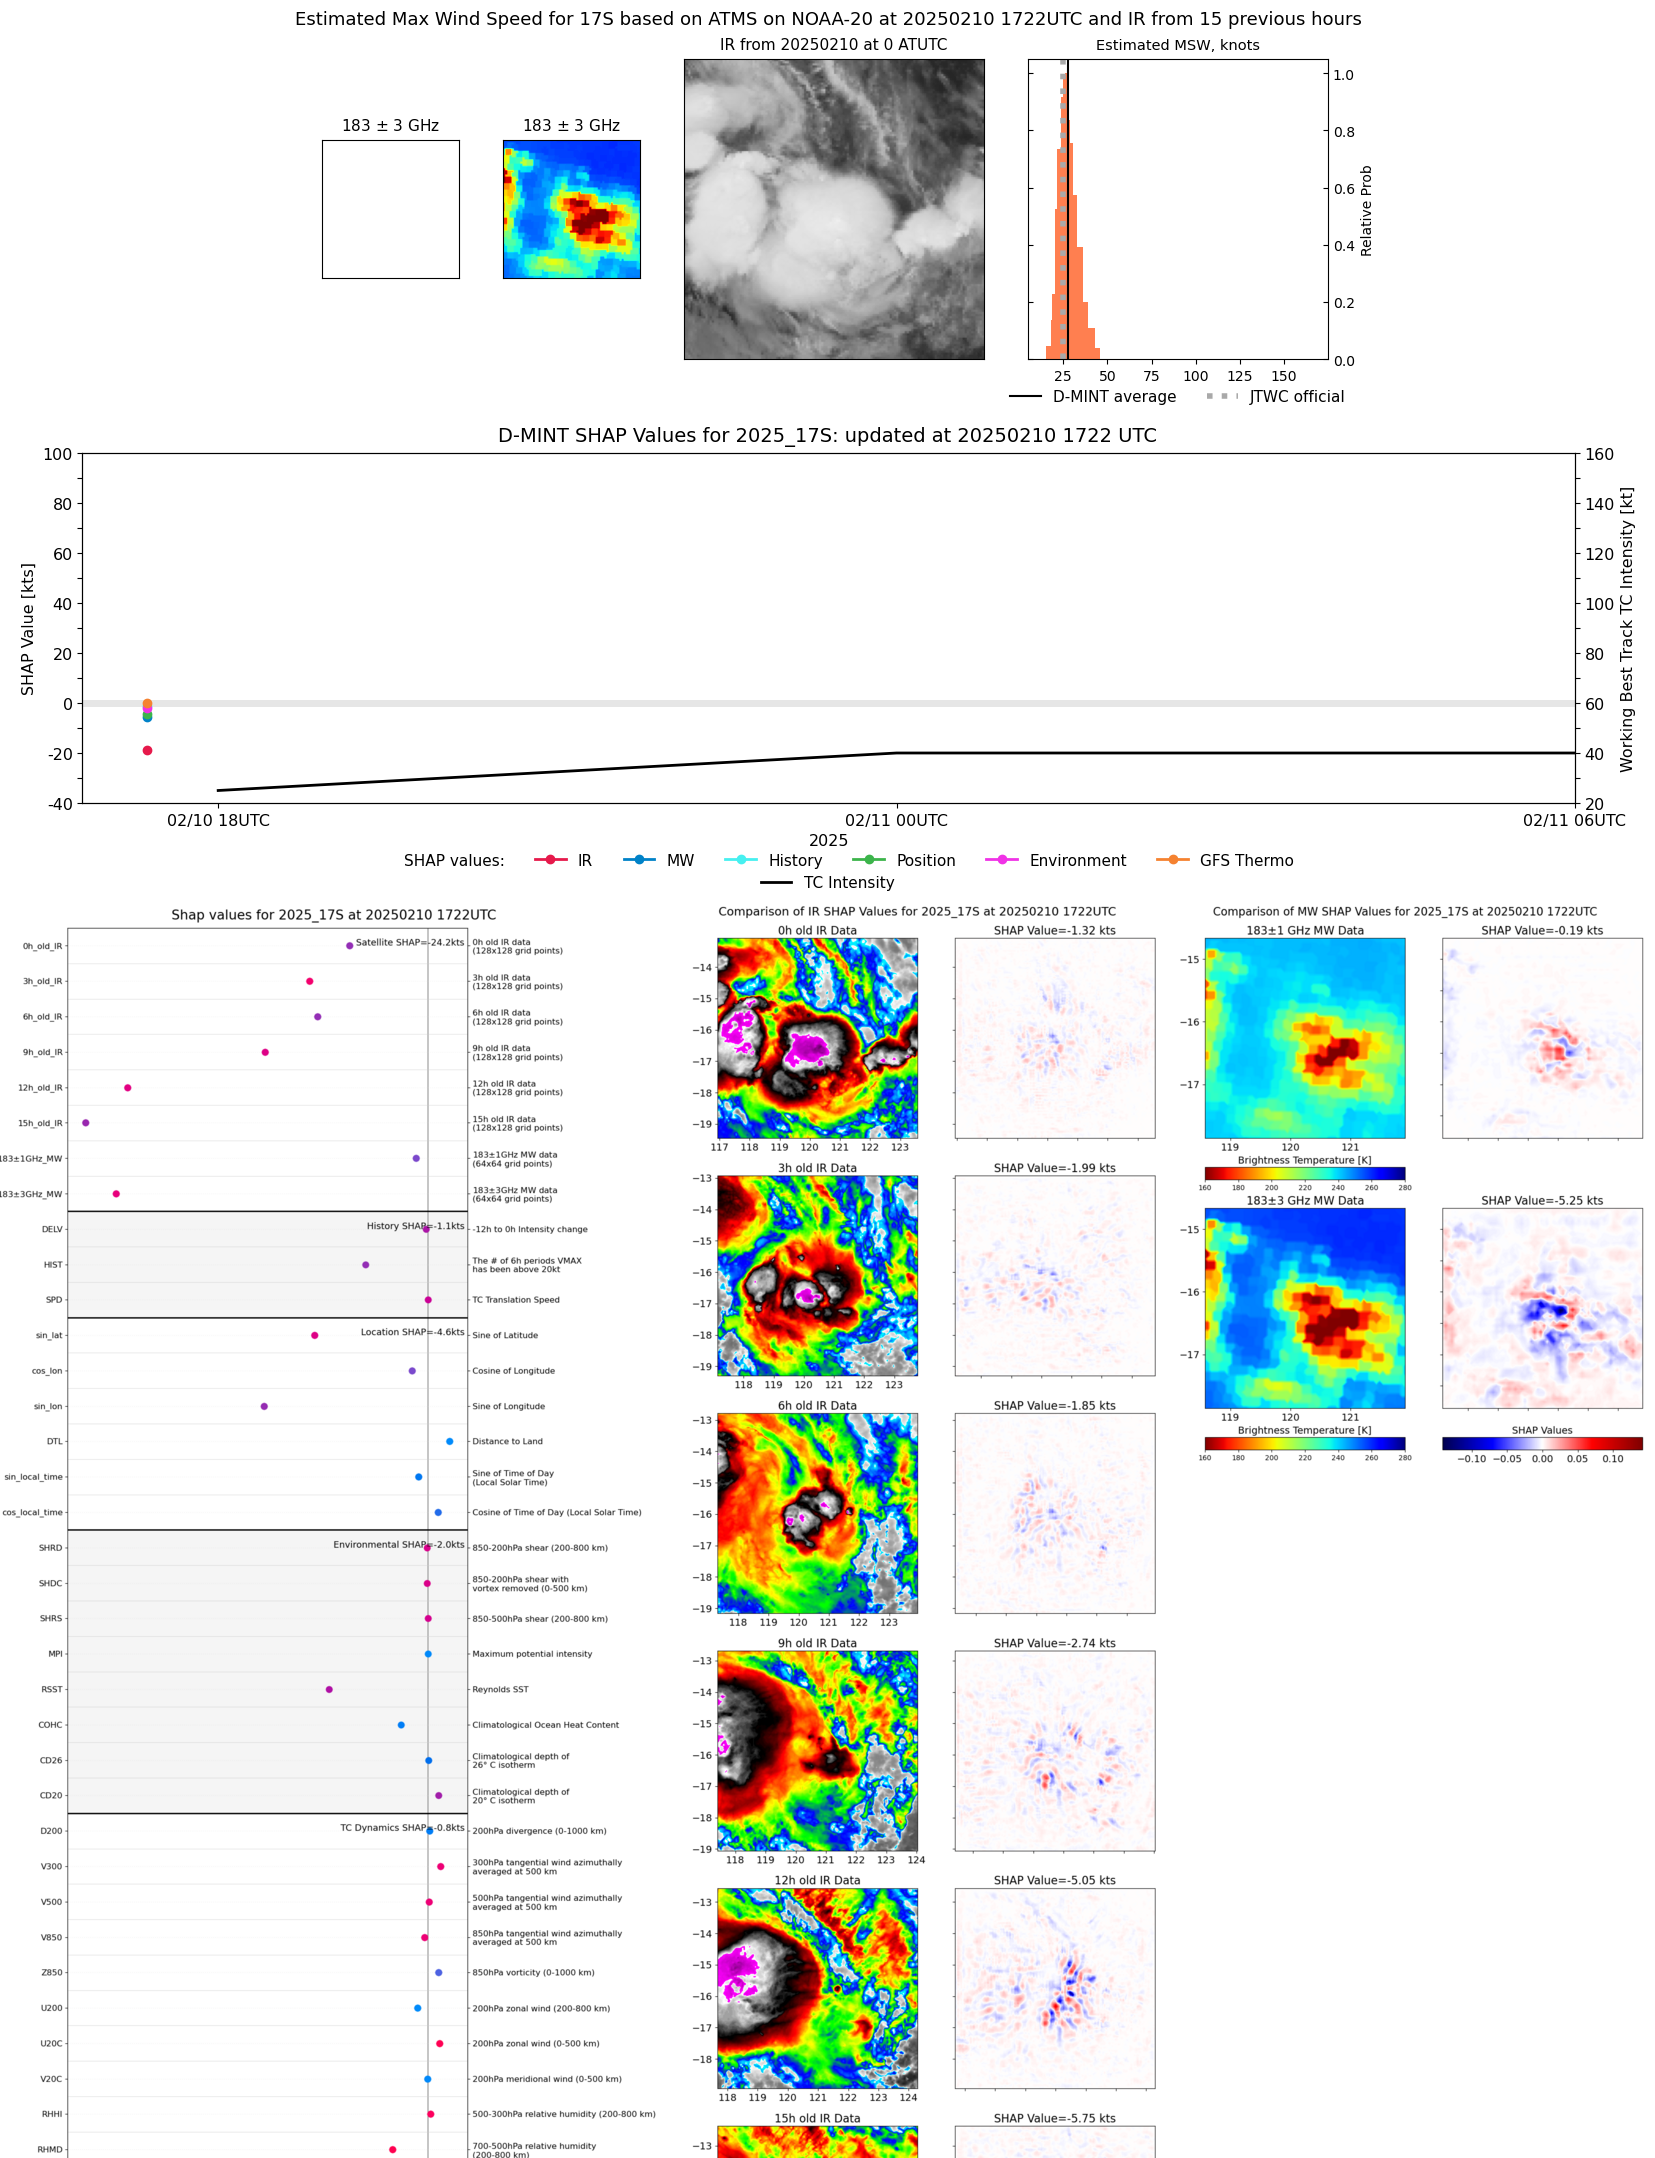 |
| 20250210 | 1509 UTC | TROPICS03 | 995 hPa | 26 kts | 23 kts | 31 kts | 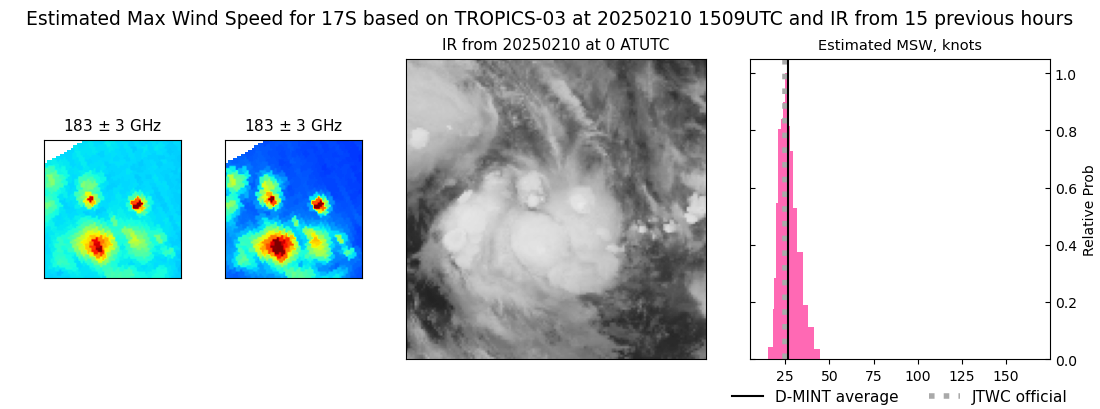 |
| 20250210 | 0651 UTC | TROPICS03 | 997 hPa | 27 kts | 25 kts | 30 kts | 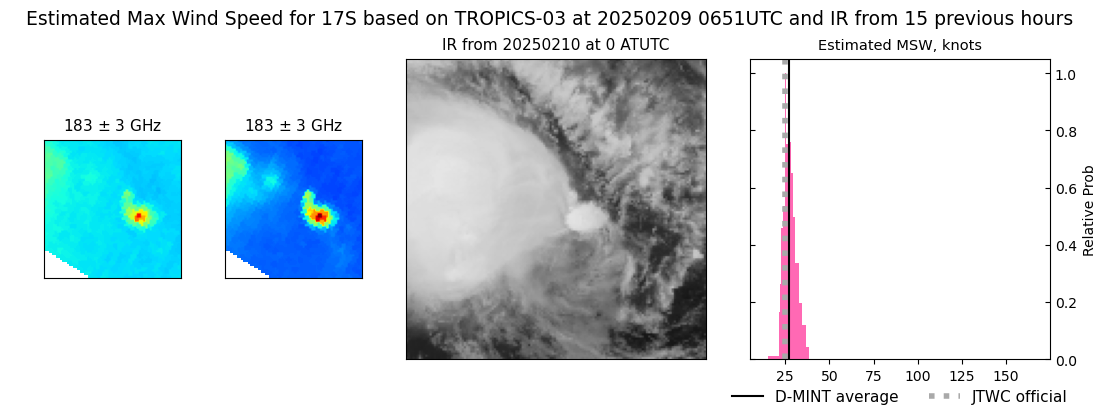 |
| 20250210 | 0400 UTC | TROPICS05 | 996 hPa | 25 kts | 23 kts | 27 kts | 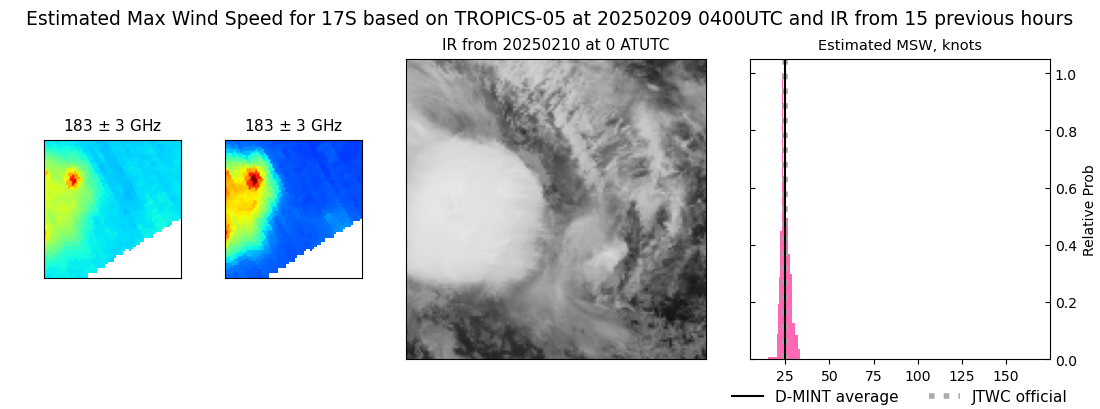 |