|
||

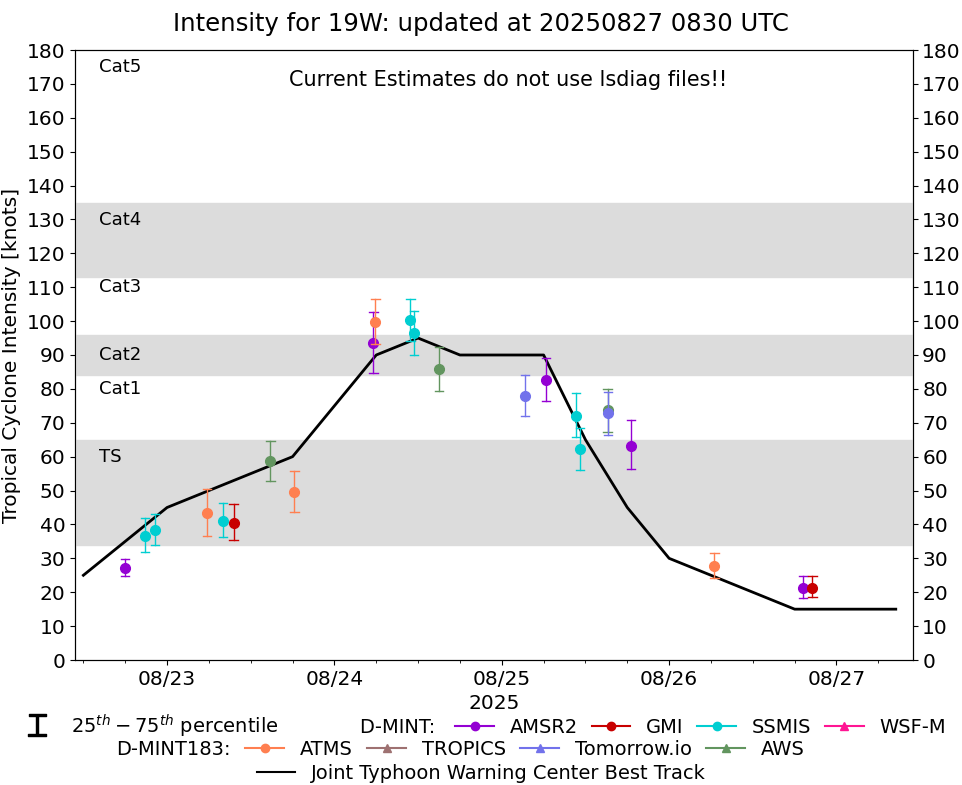 |
D-MINT HISTORY FILE for 2025_19W
| Date | Time | MW Sensor | MSLP | Vmax (30th-70th percentile average) | Vmax 25th percentile | Vmax 75th percentile | Image |
| 20250826 | 2033 UTC | GMI | 1001 hPa | 21 kts | 19 kts | 25 kts | 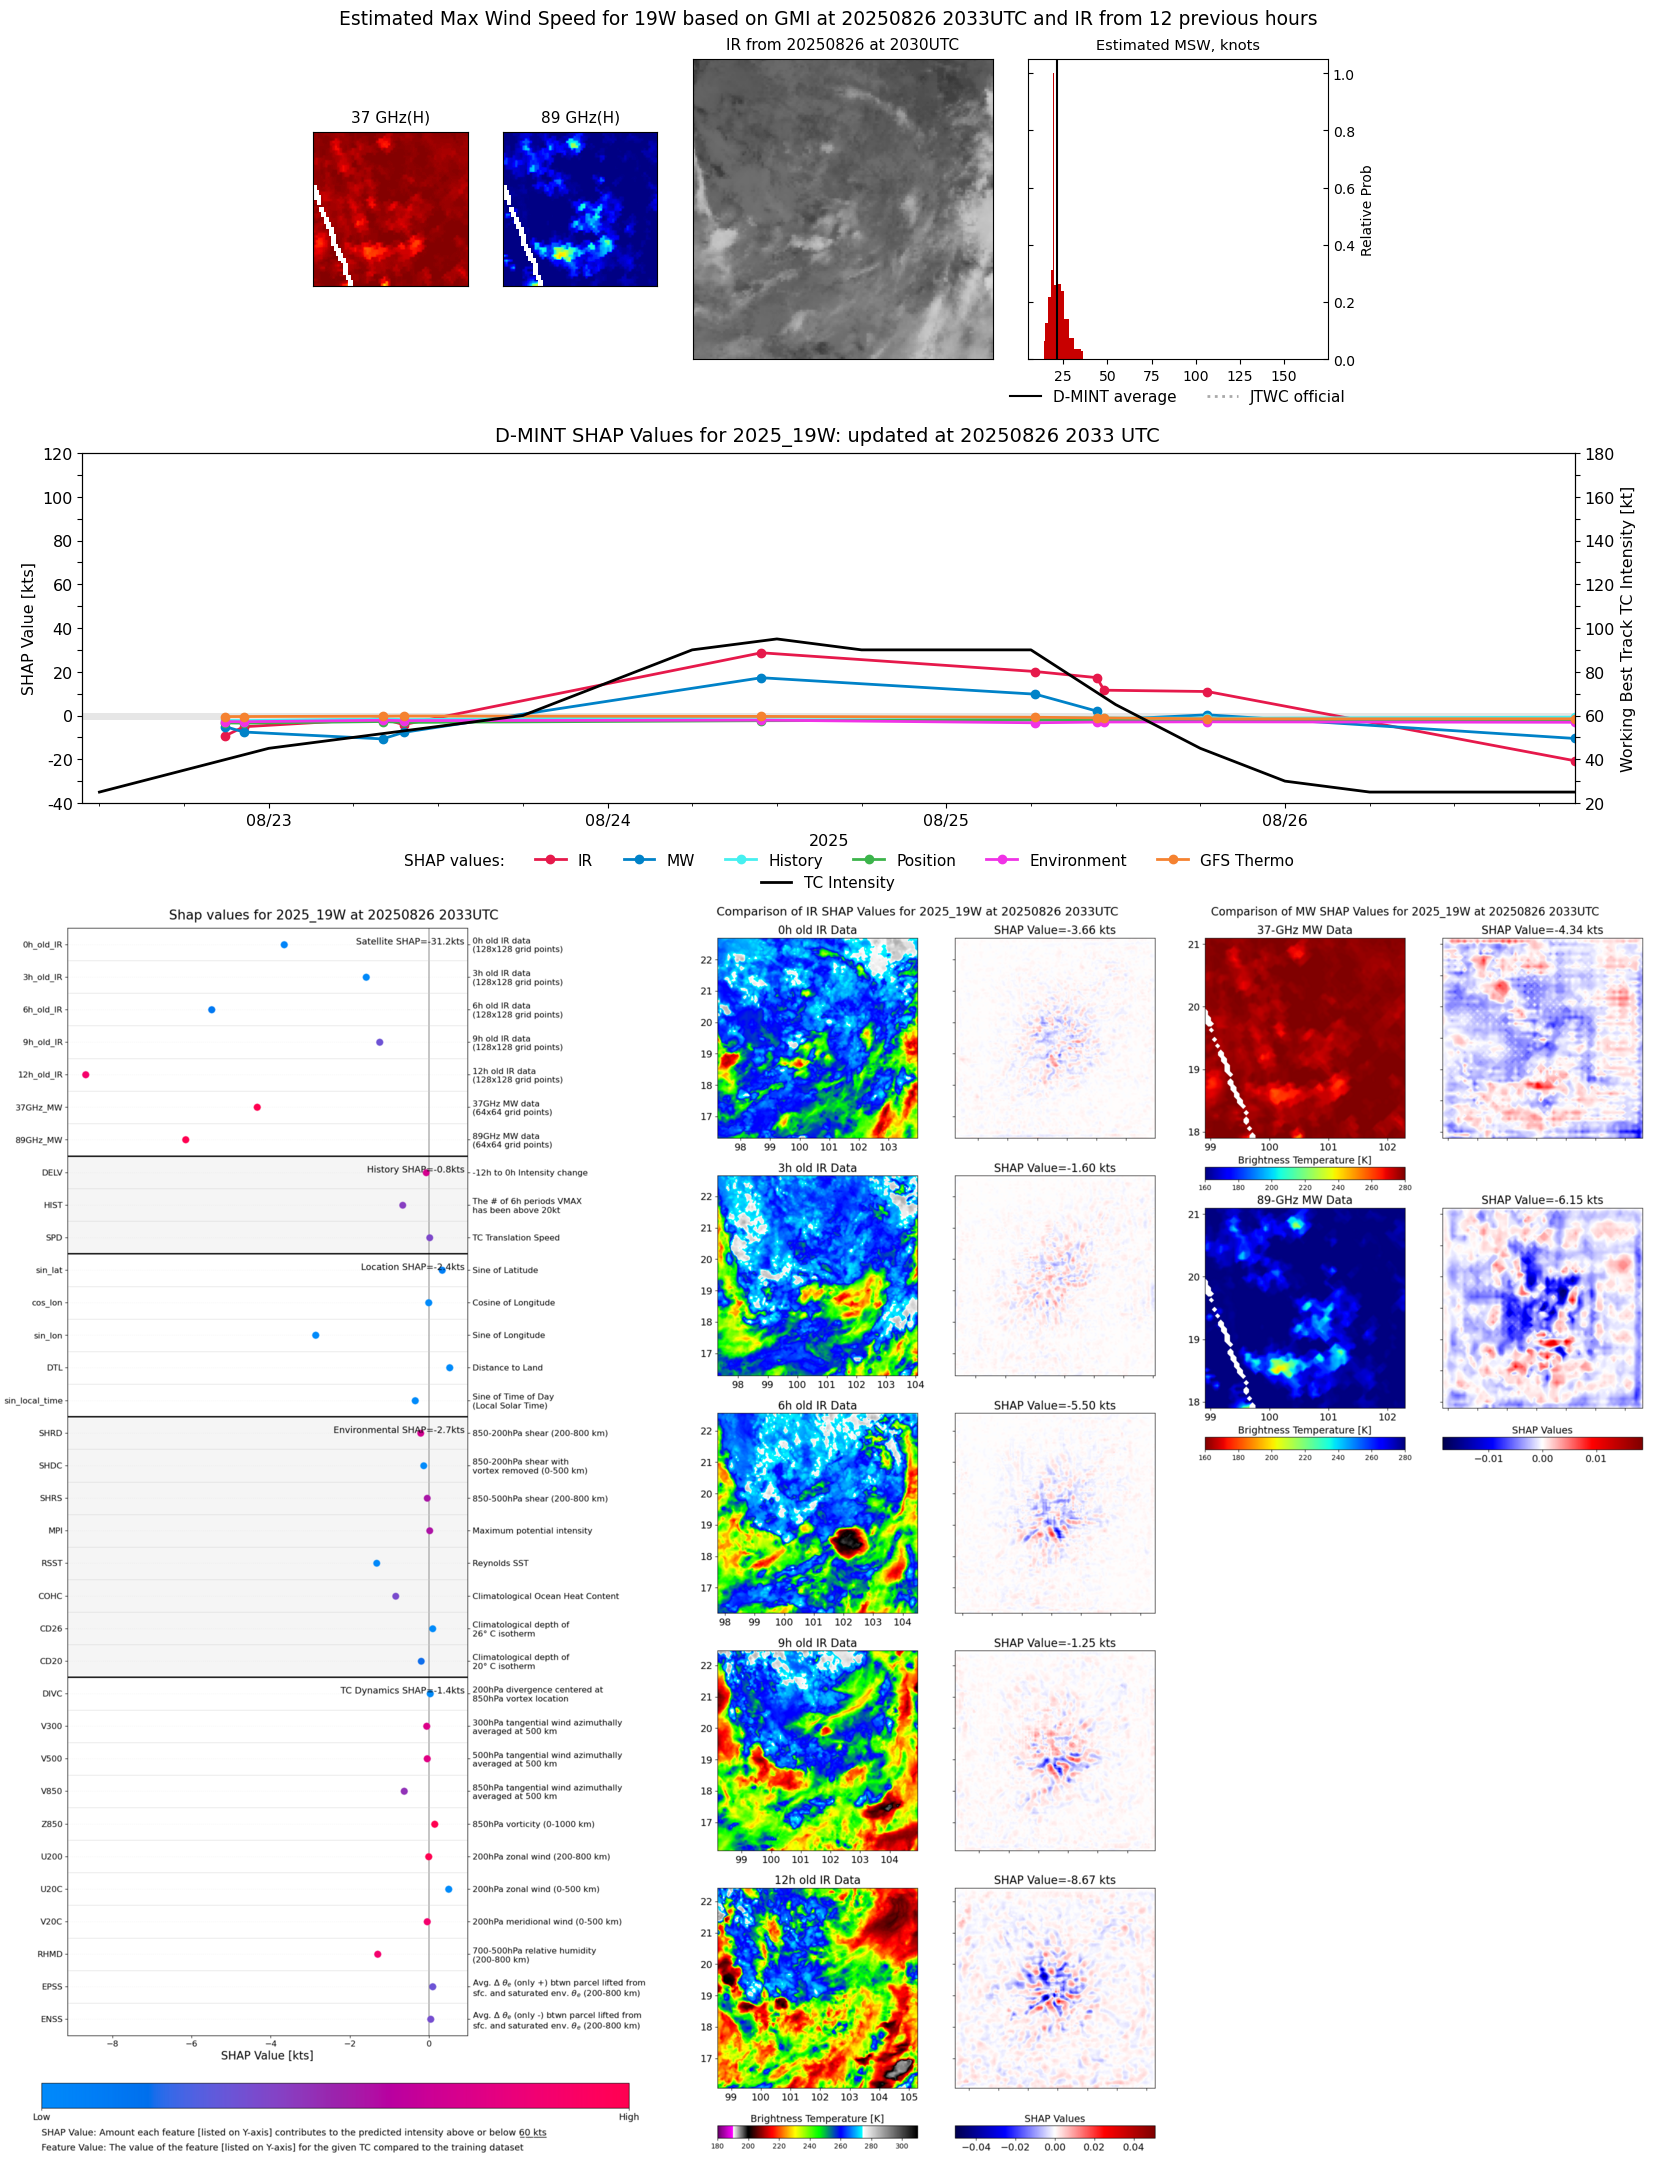 |
| 20250826 | 1913 UTC | AMSR2 | 1002 hPa | 21 kts | 18 kts | 25 kts | 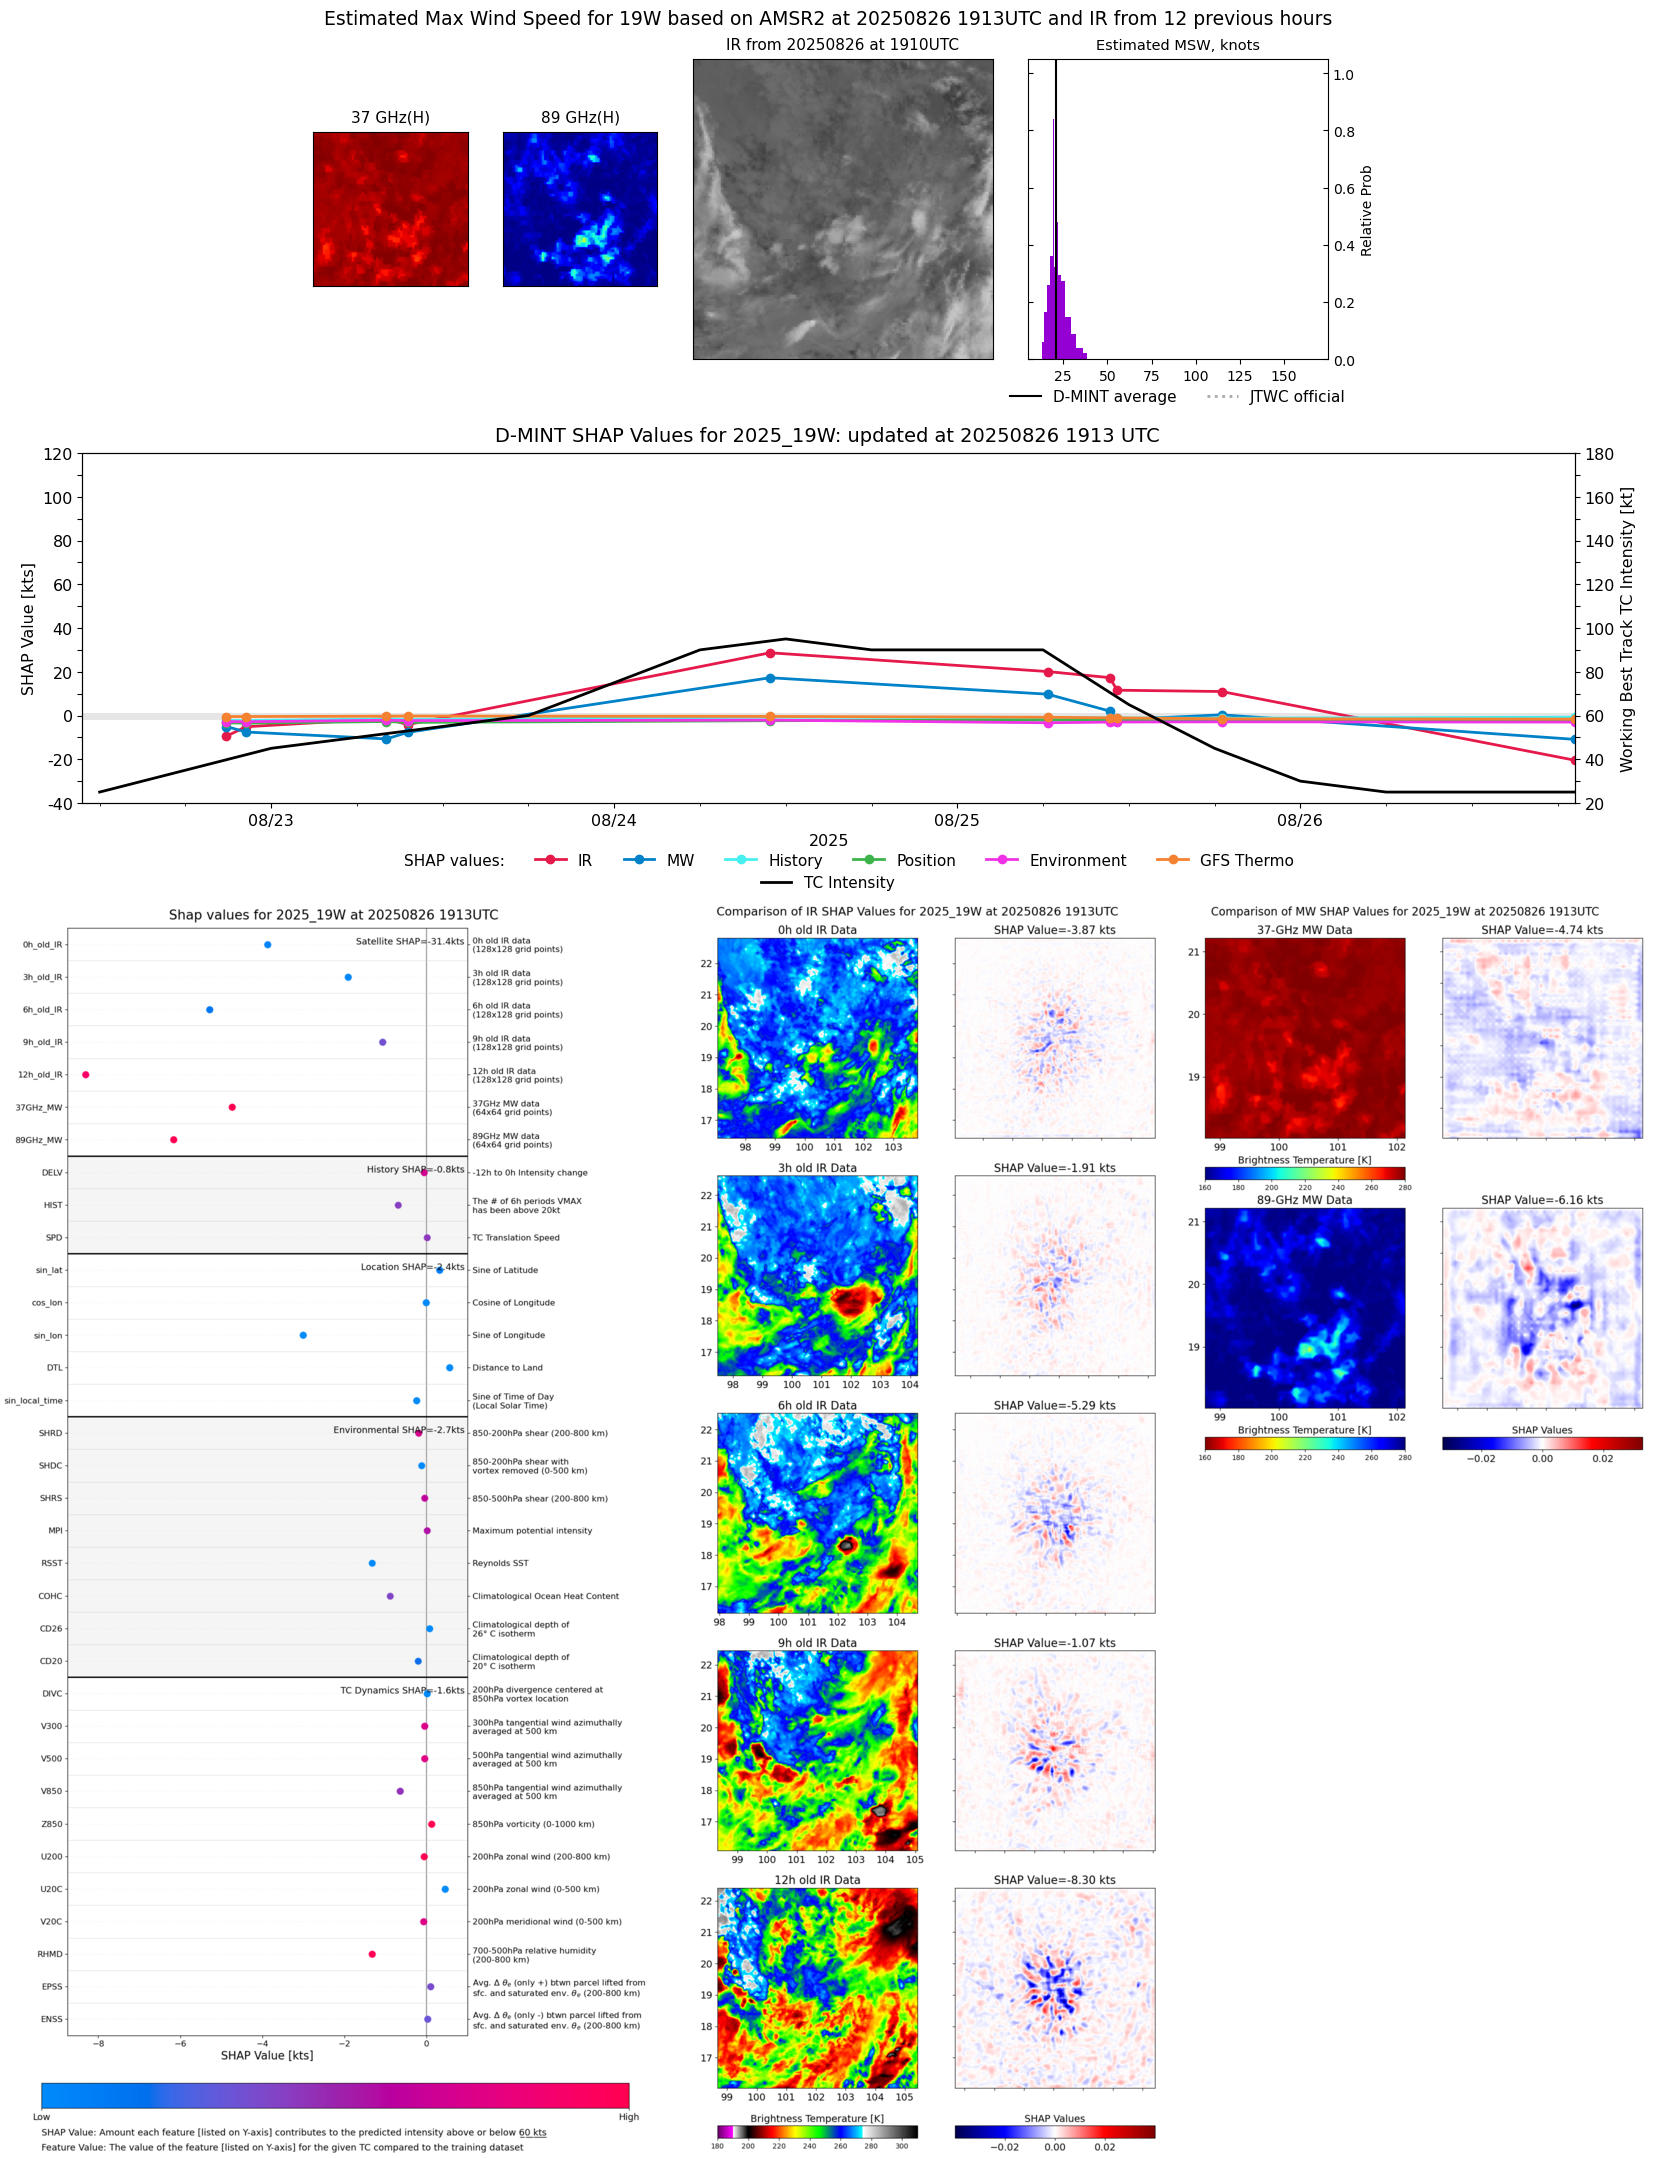 |
| 20250826 | 0630 UTC | ATMS-N21 | 996 hPa | 28 kts | 24 kts | 32 kts |  |
| 20250825 | 1830 UTC | AMSR2 | 989 hPa | 63 kts | 56 kts | 71 kts | 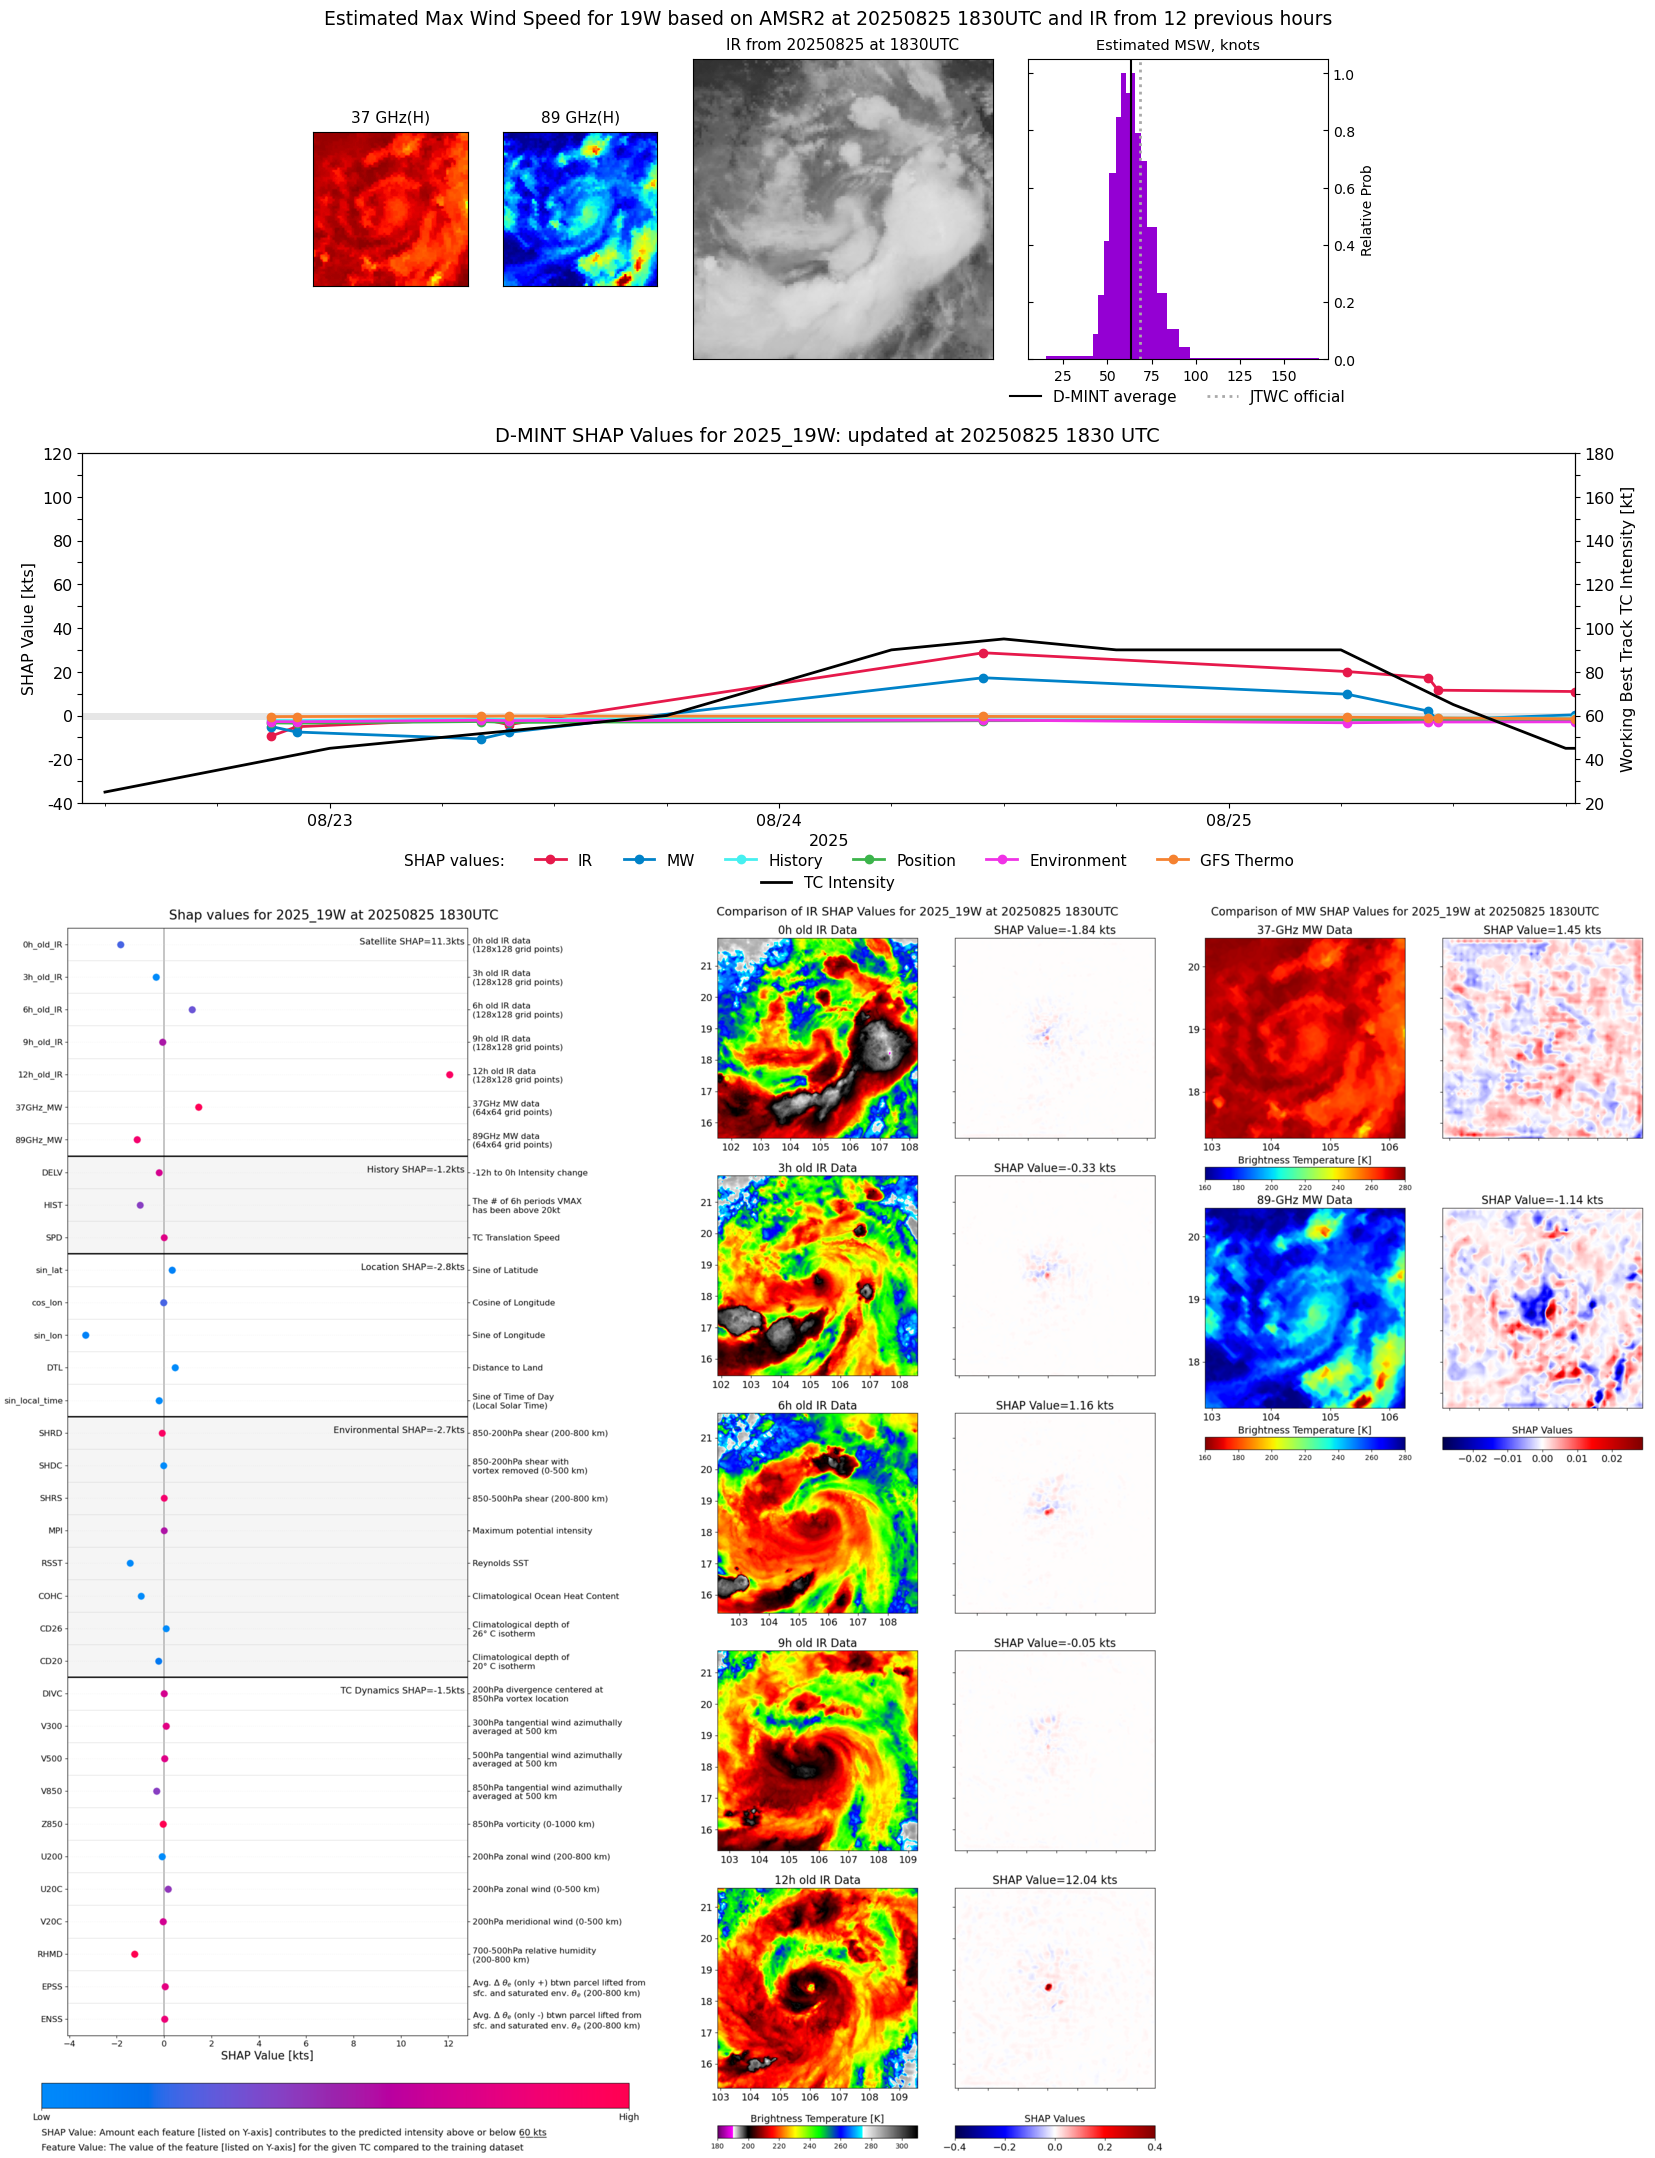 |
| 20250825 | 1513 UTC | TMS02 | 984 hPa | 73 kts | 67 kts | 79 kts | 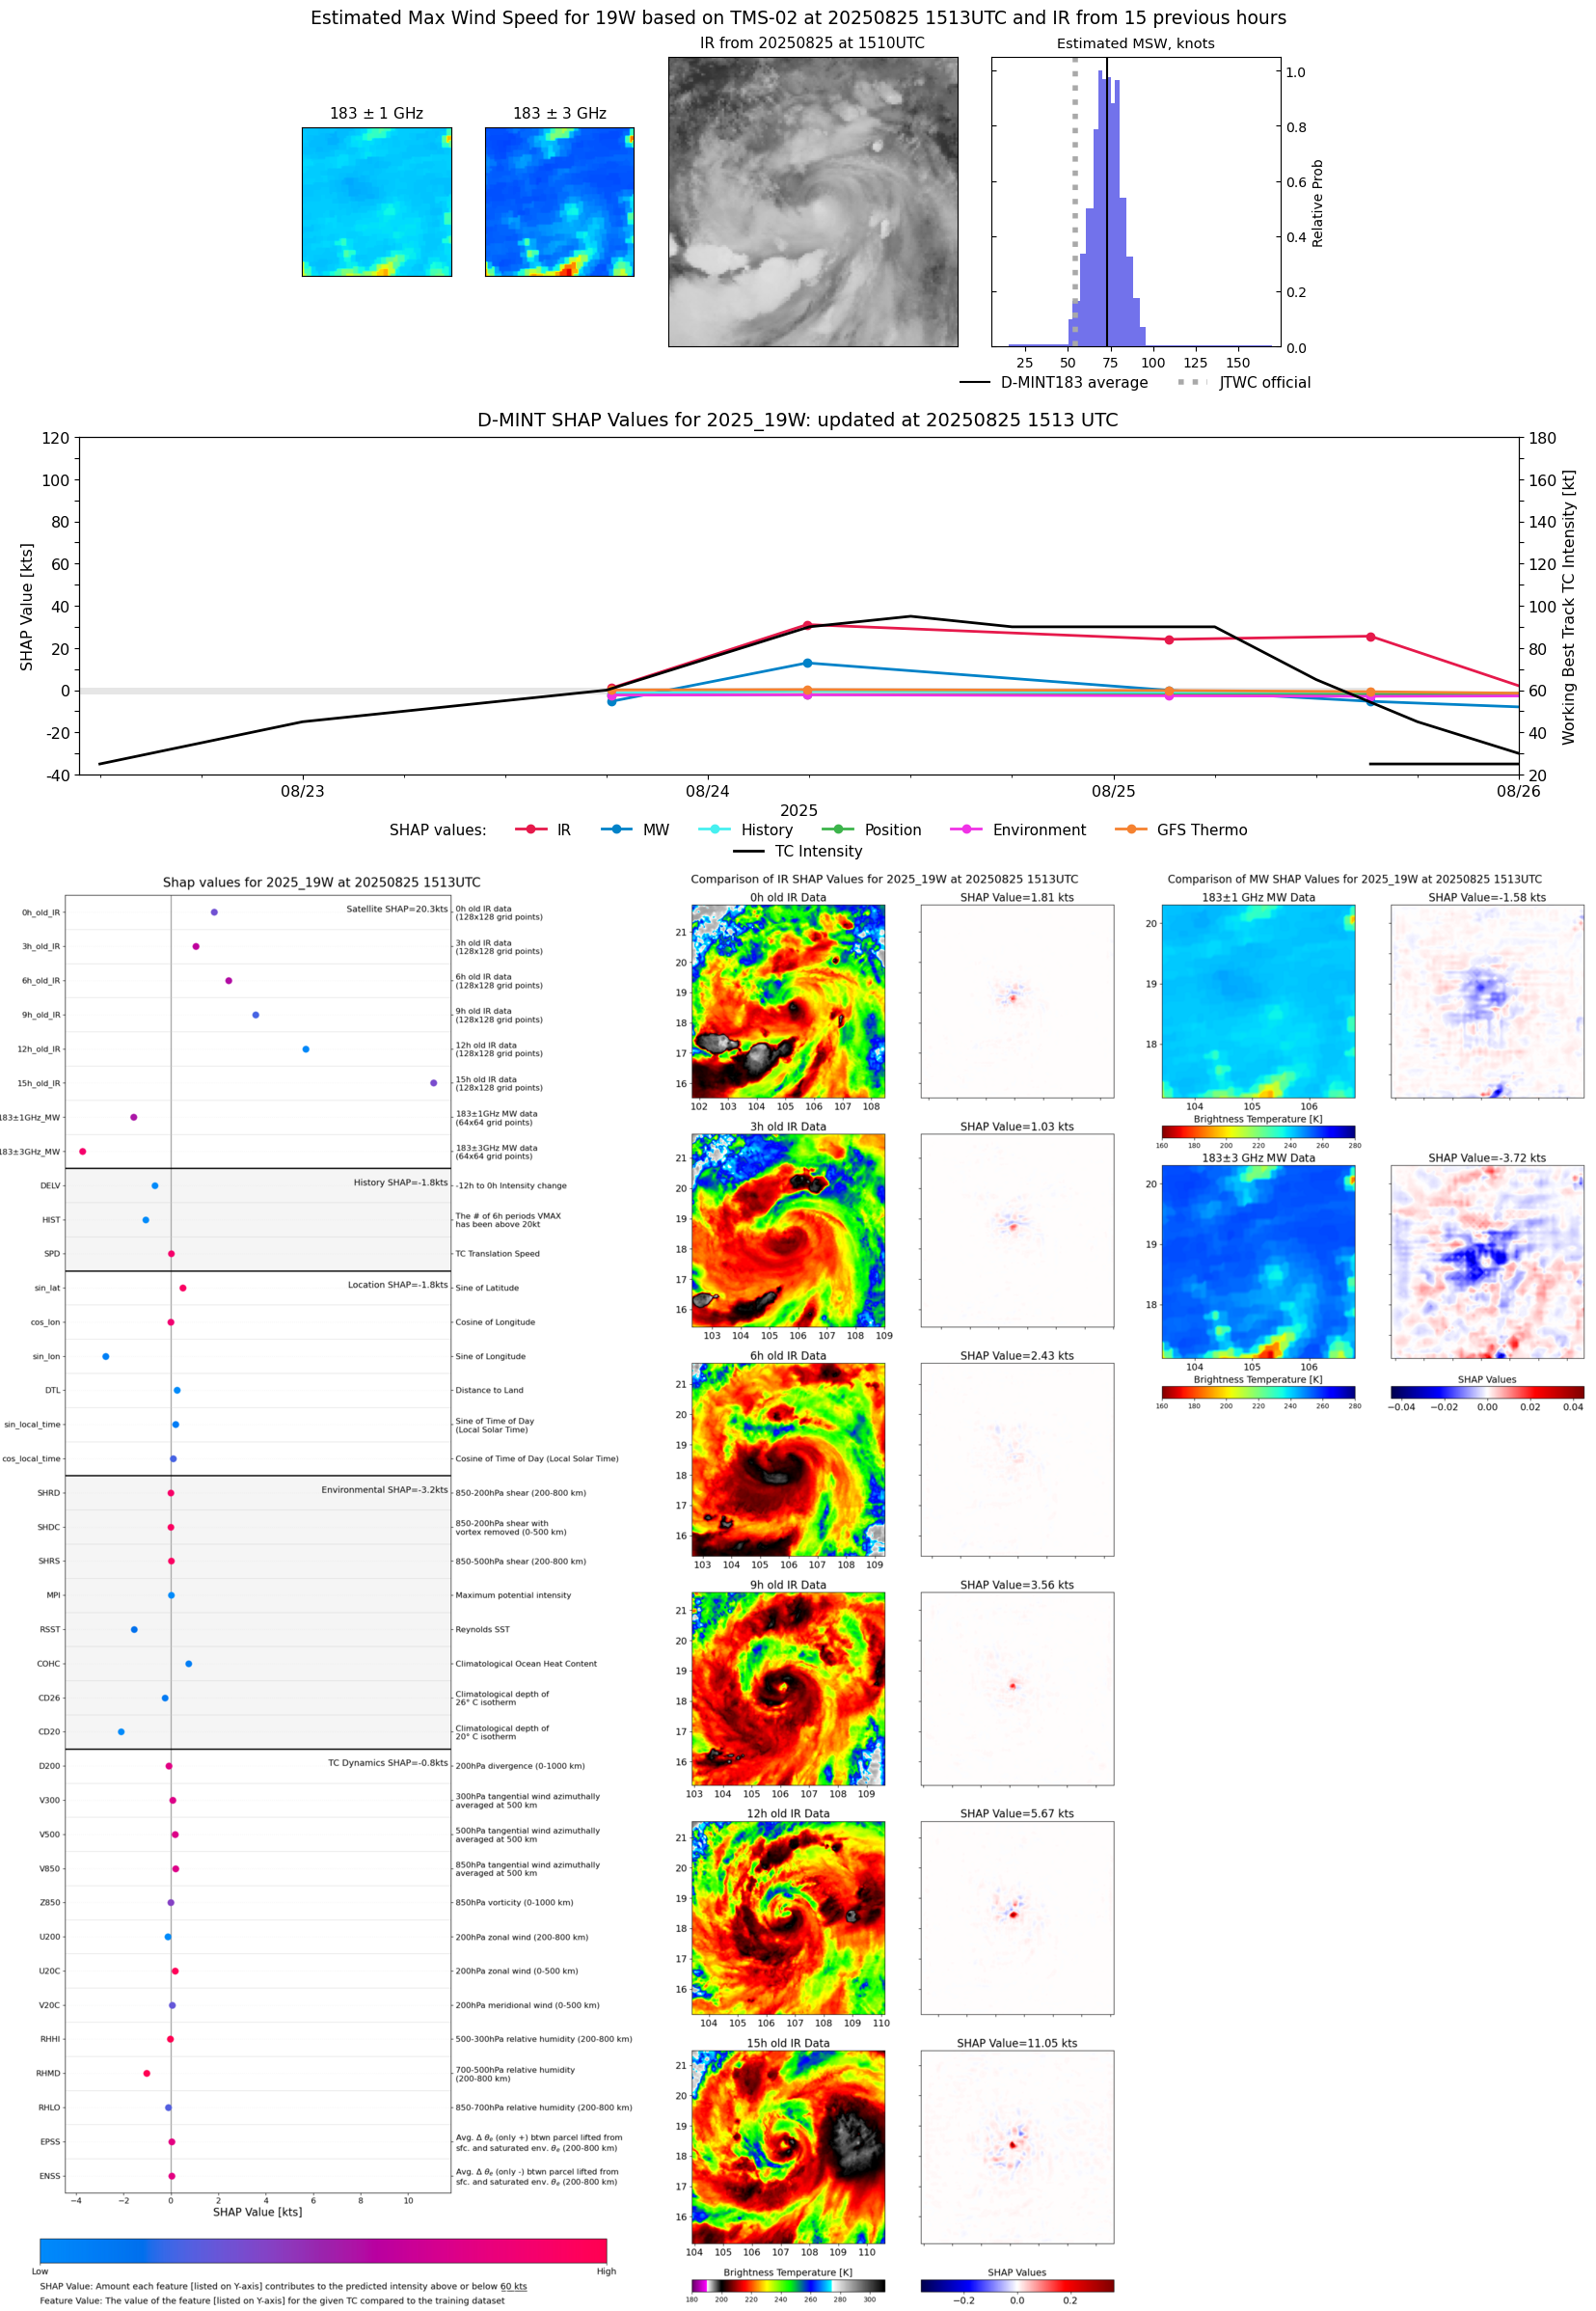 |
| 20250825 | 1111 UTC | SSMISF16 | 982 hPa | 62 kts | 56 kts | 69 kts |  |
| 20250825 | 1040 UTC | SSMISF17 | 976 hPa | 72 kts | 66 kts | 79 kts | 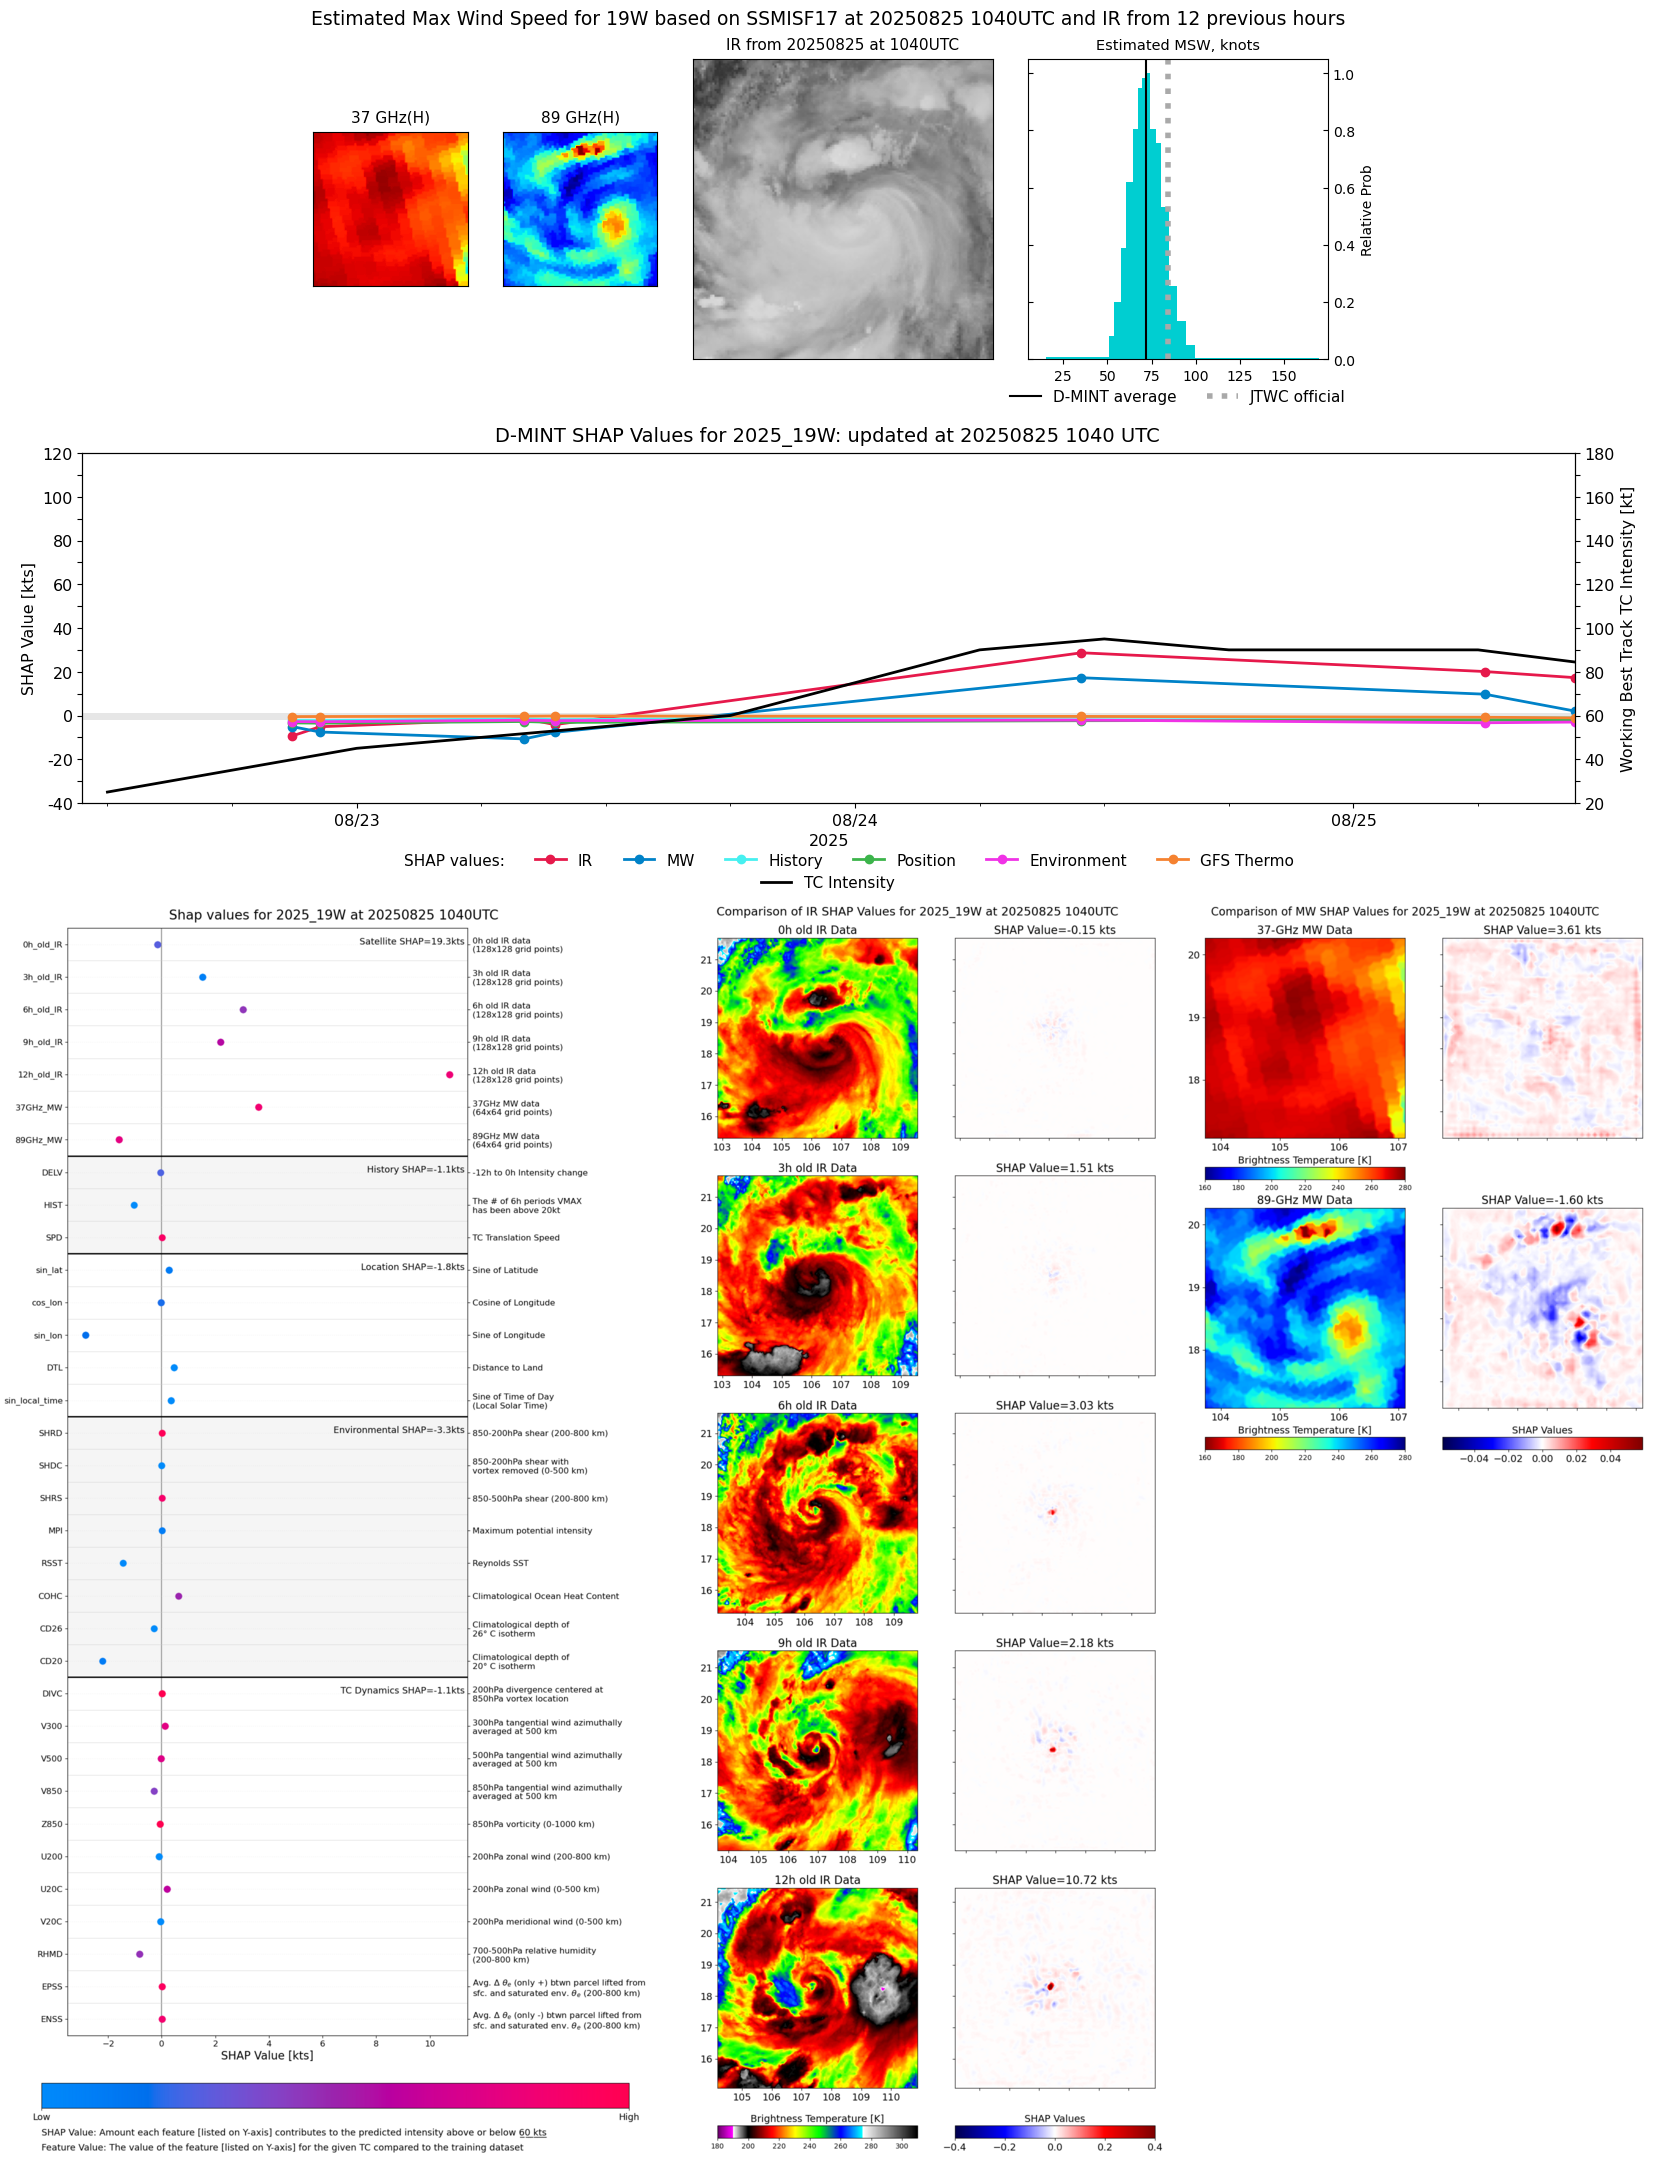 |
| 20250825 | 0619 UTC | AMSR2 | 963 hPa | 83 kts | 76 kts | 89 kts | 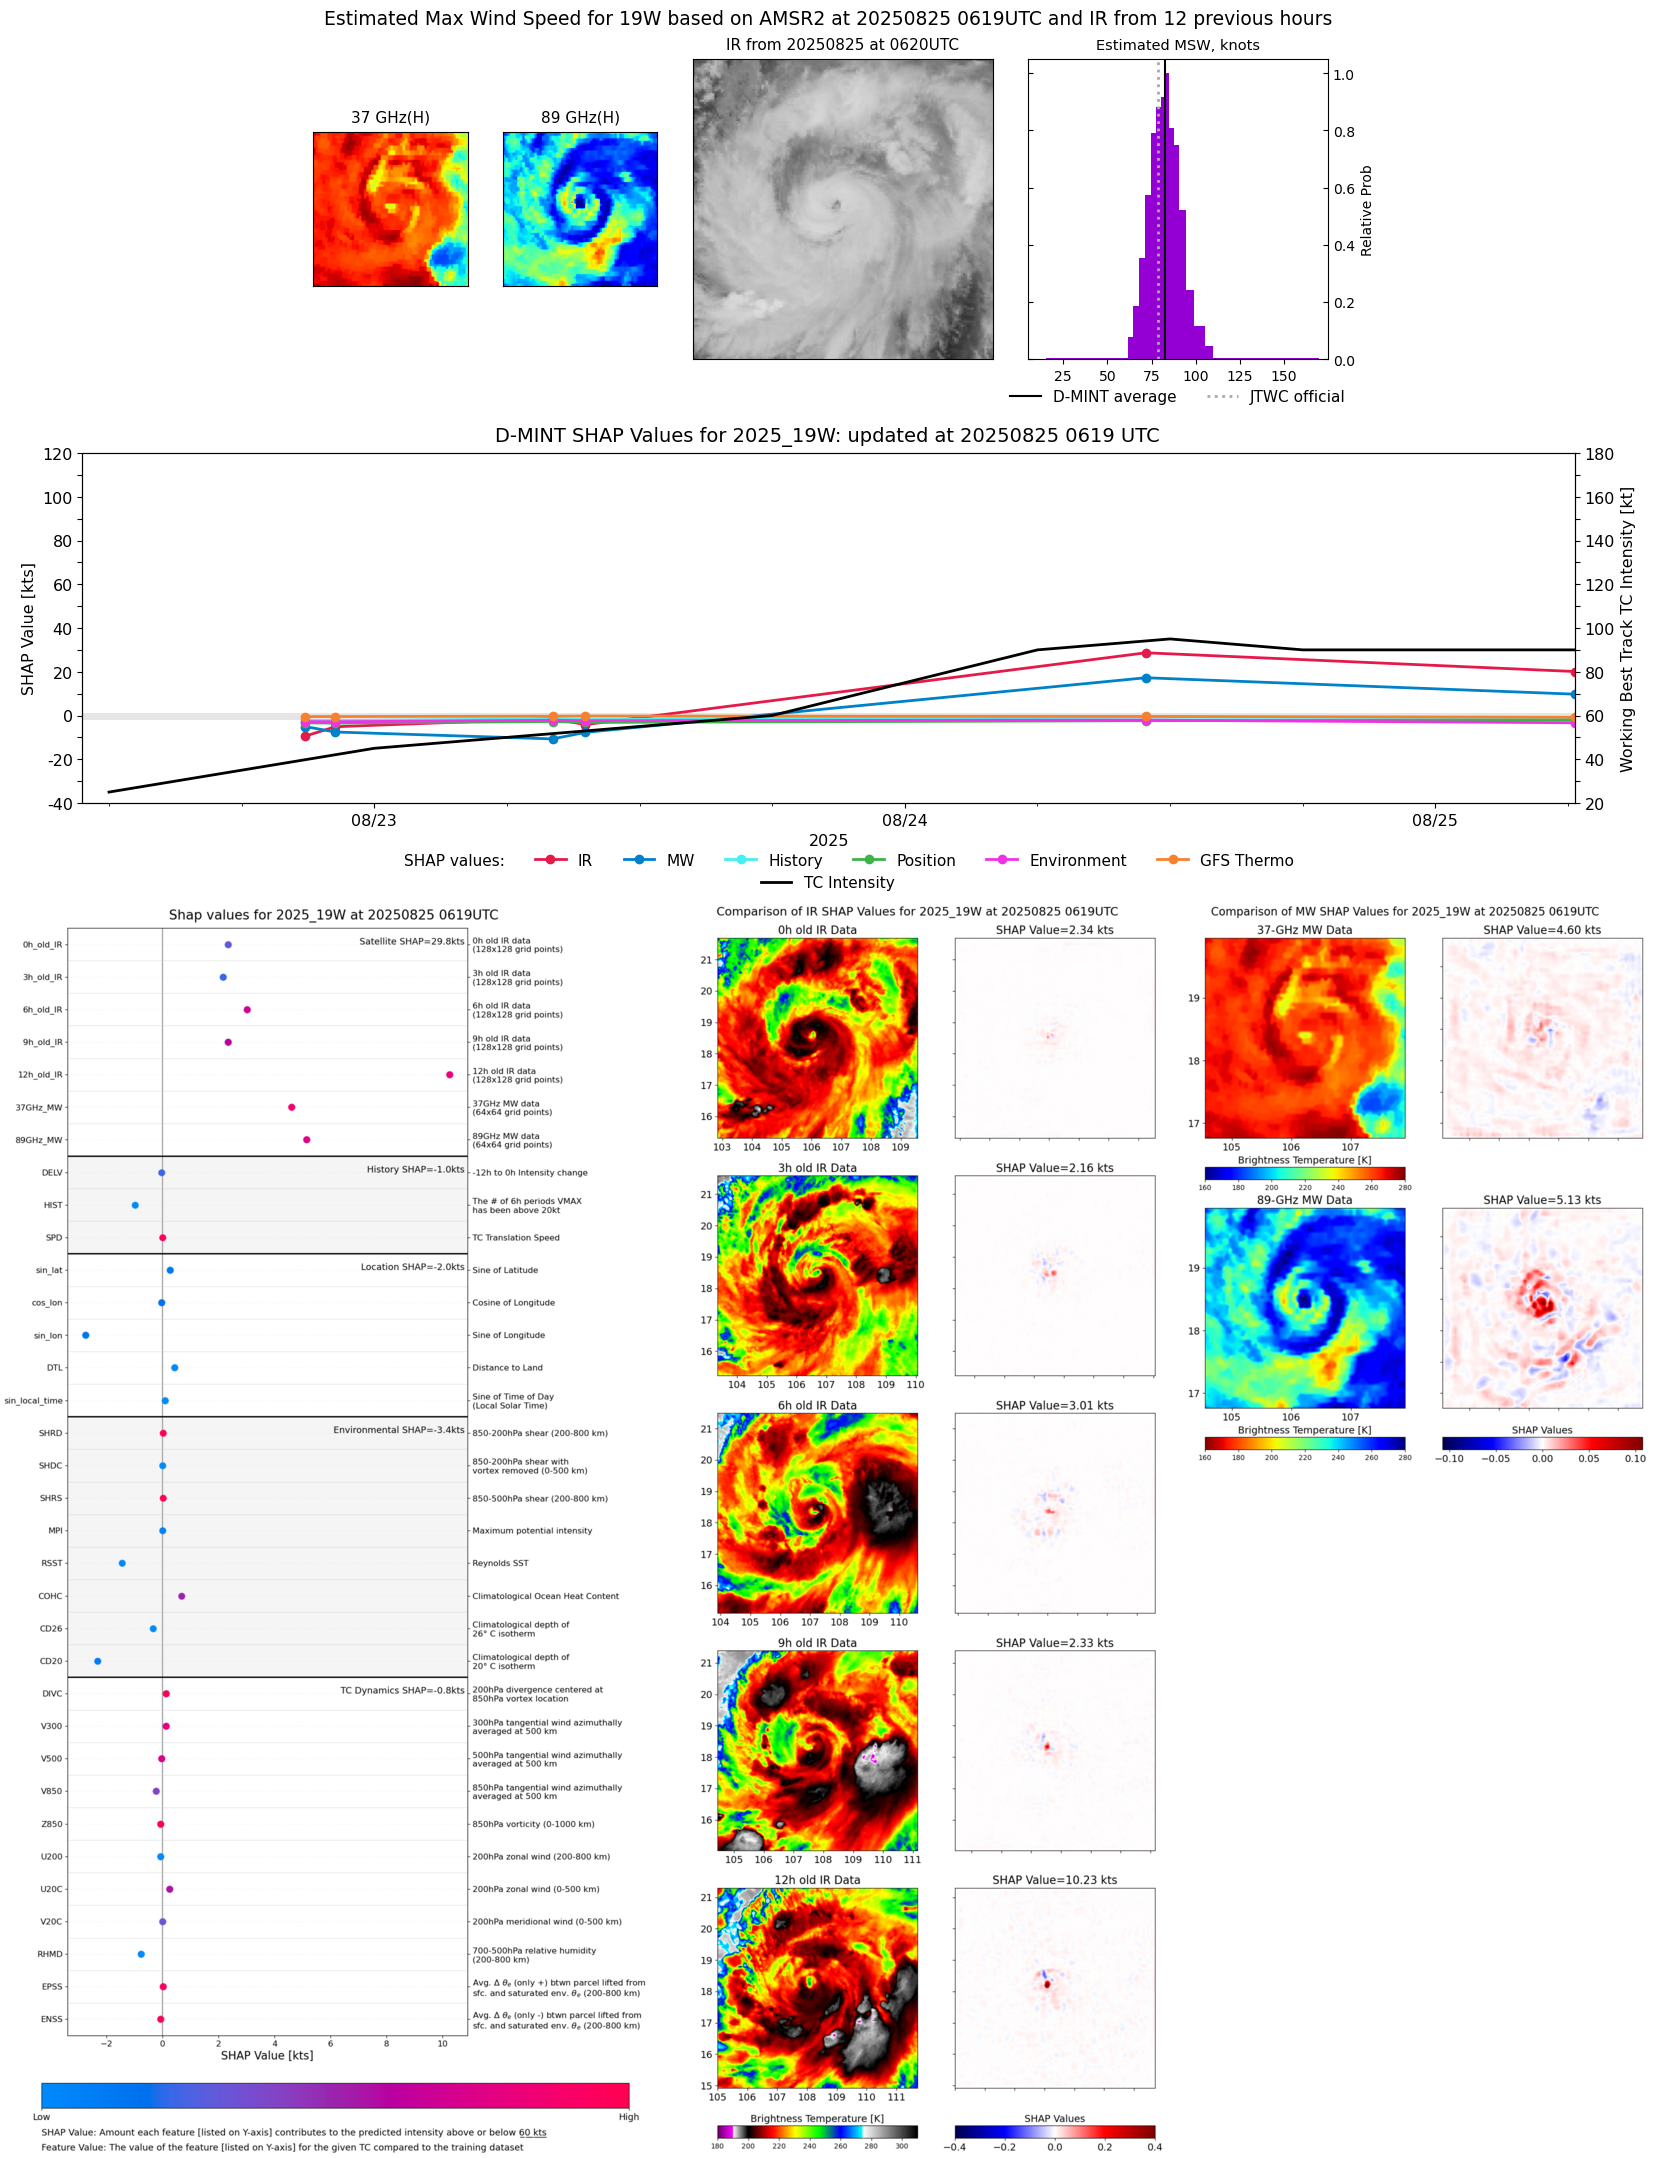 |
| 20250825 | 0318 UTC | TMS02 | 970 hPa | 78 kts | 72 kts | 84 kts | 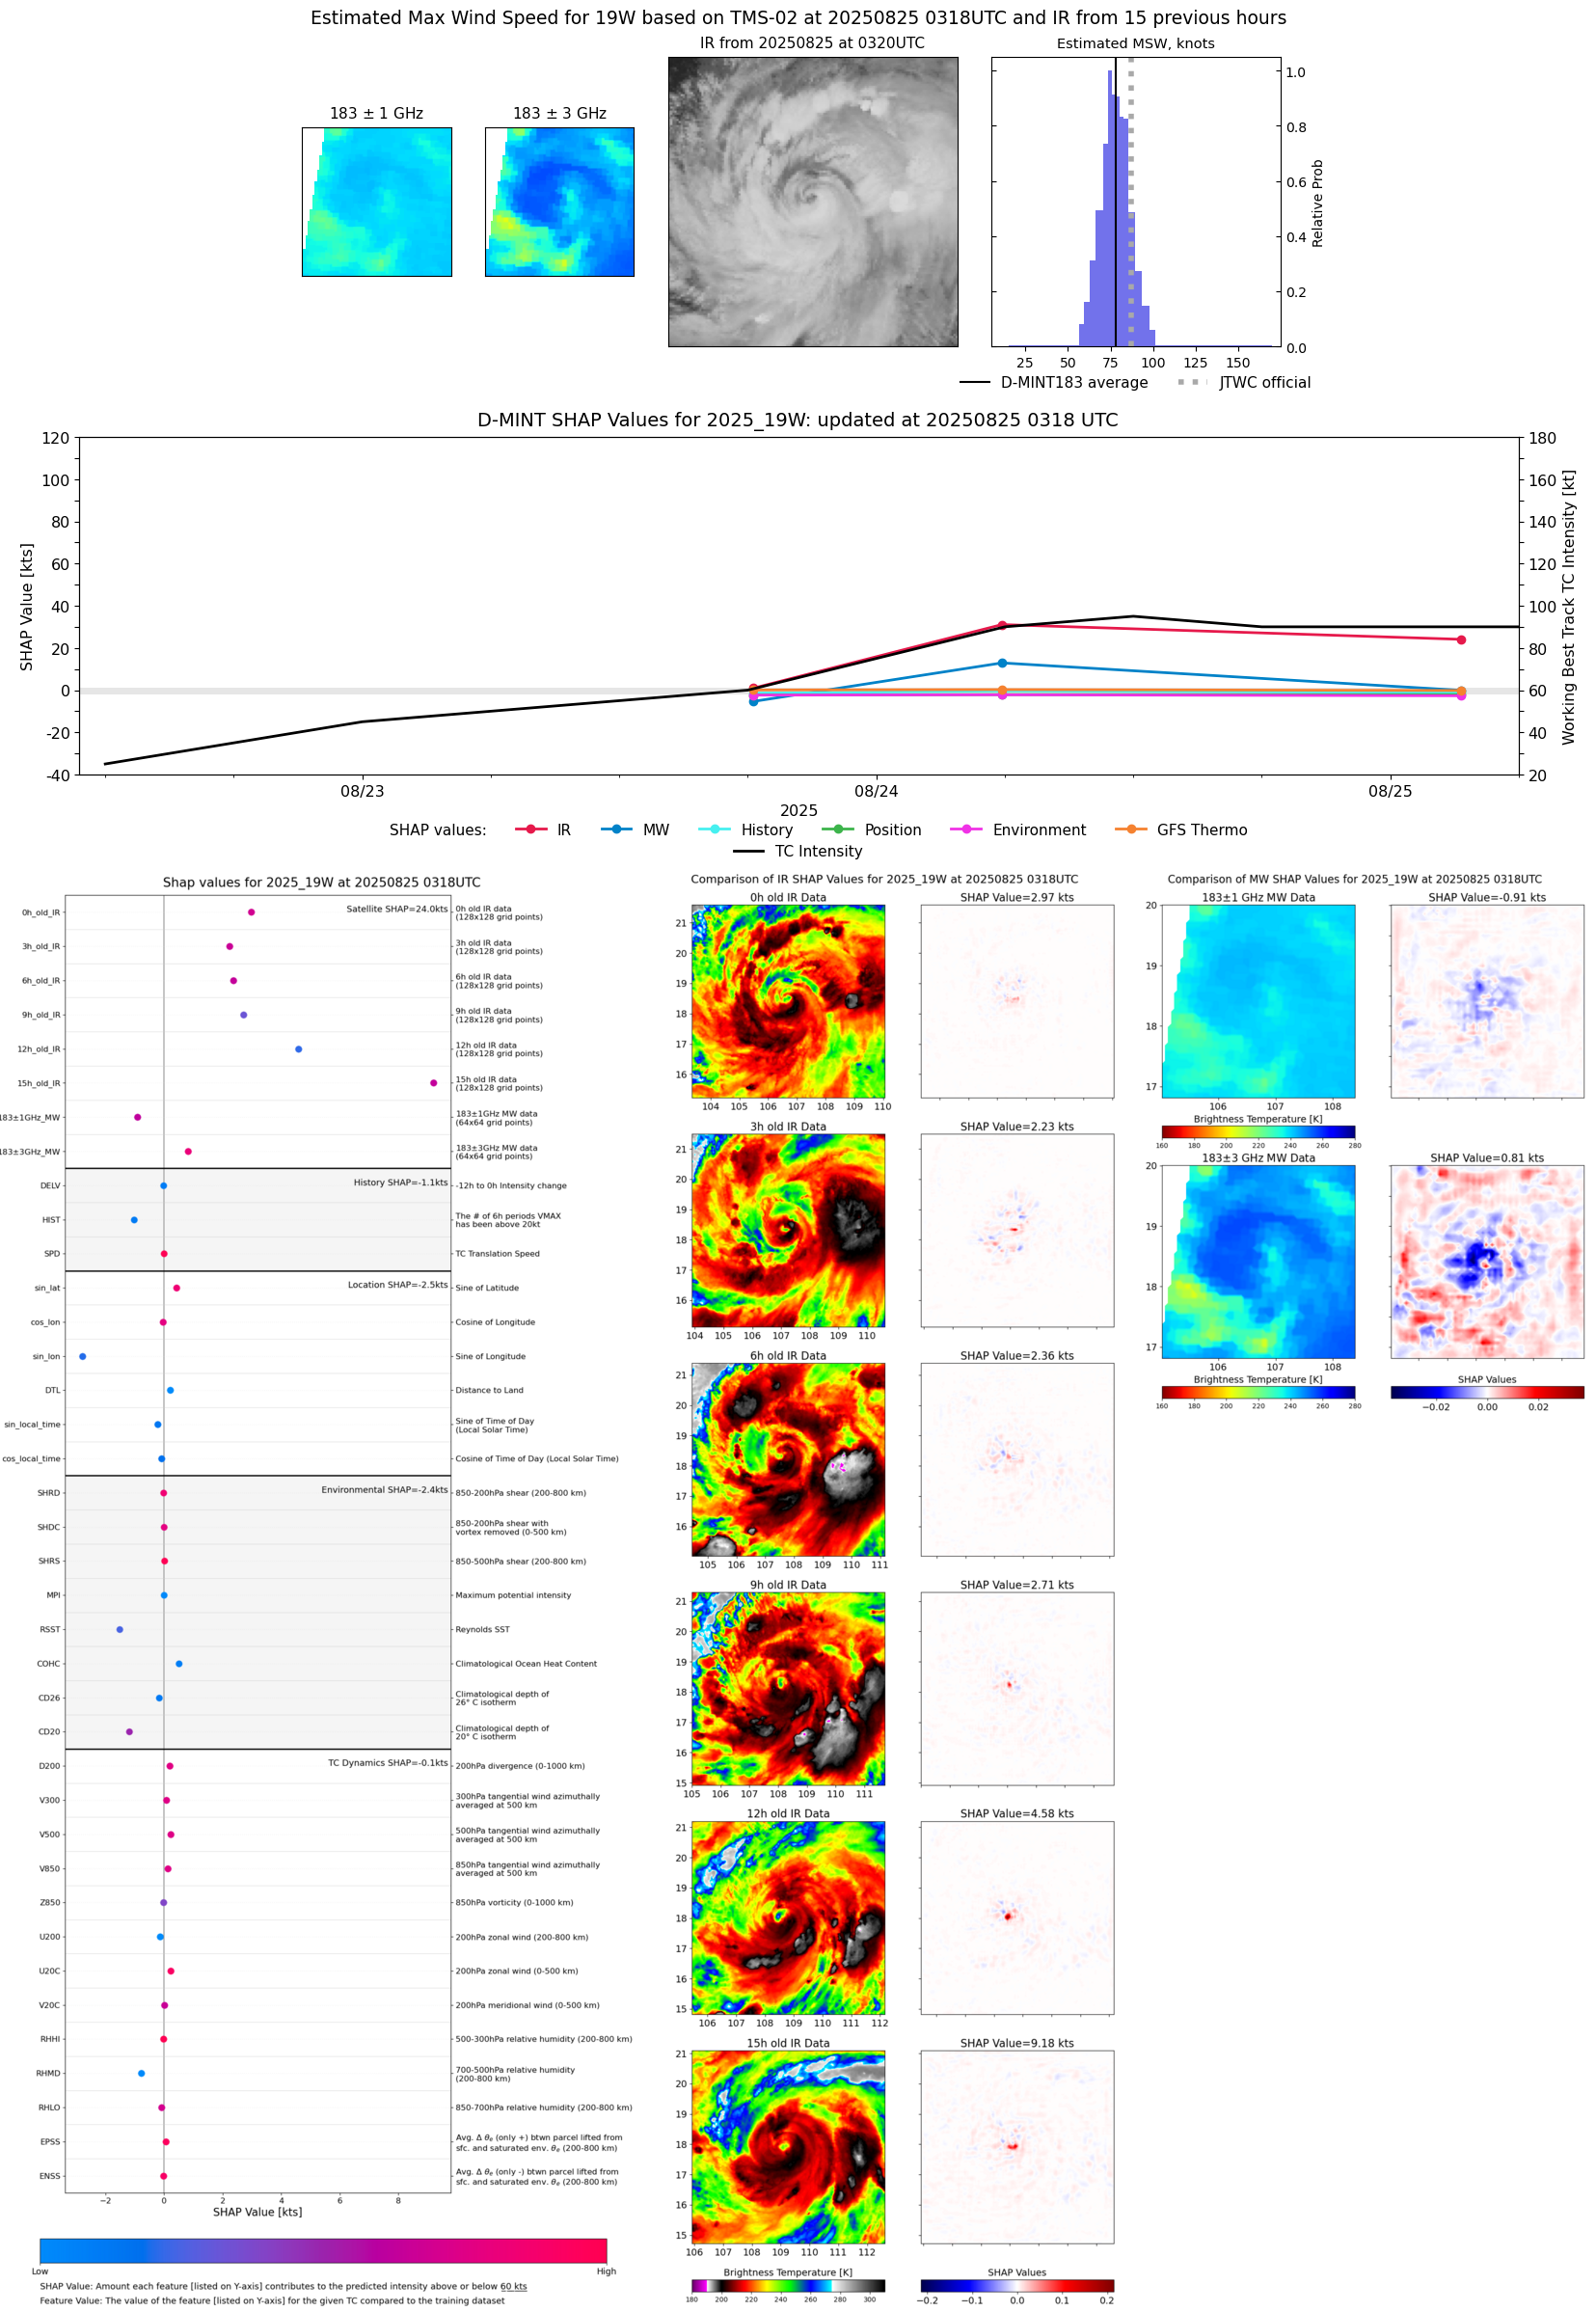 |
| 20250824 | 1124 UTC | SSMISF16 | 955 hPa | 97 kts | 90 kts | 103 kts |  |
| 20250824 | 1054 UTC | SSMISF17 | 957 hPa | 100 kts | 94 kts | 106 kts | 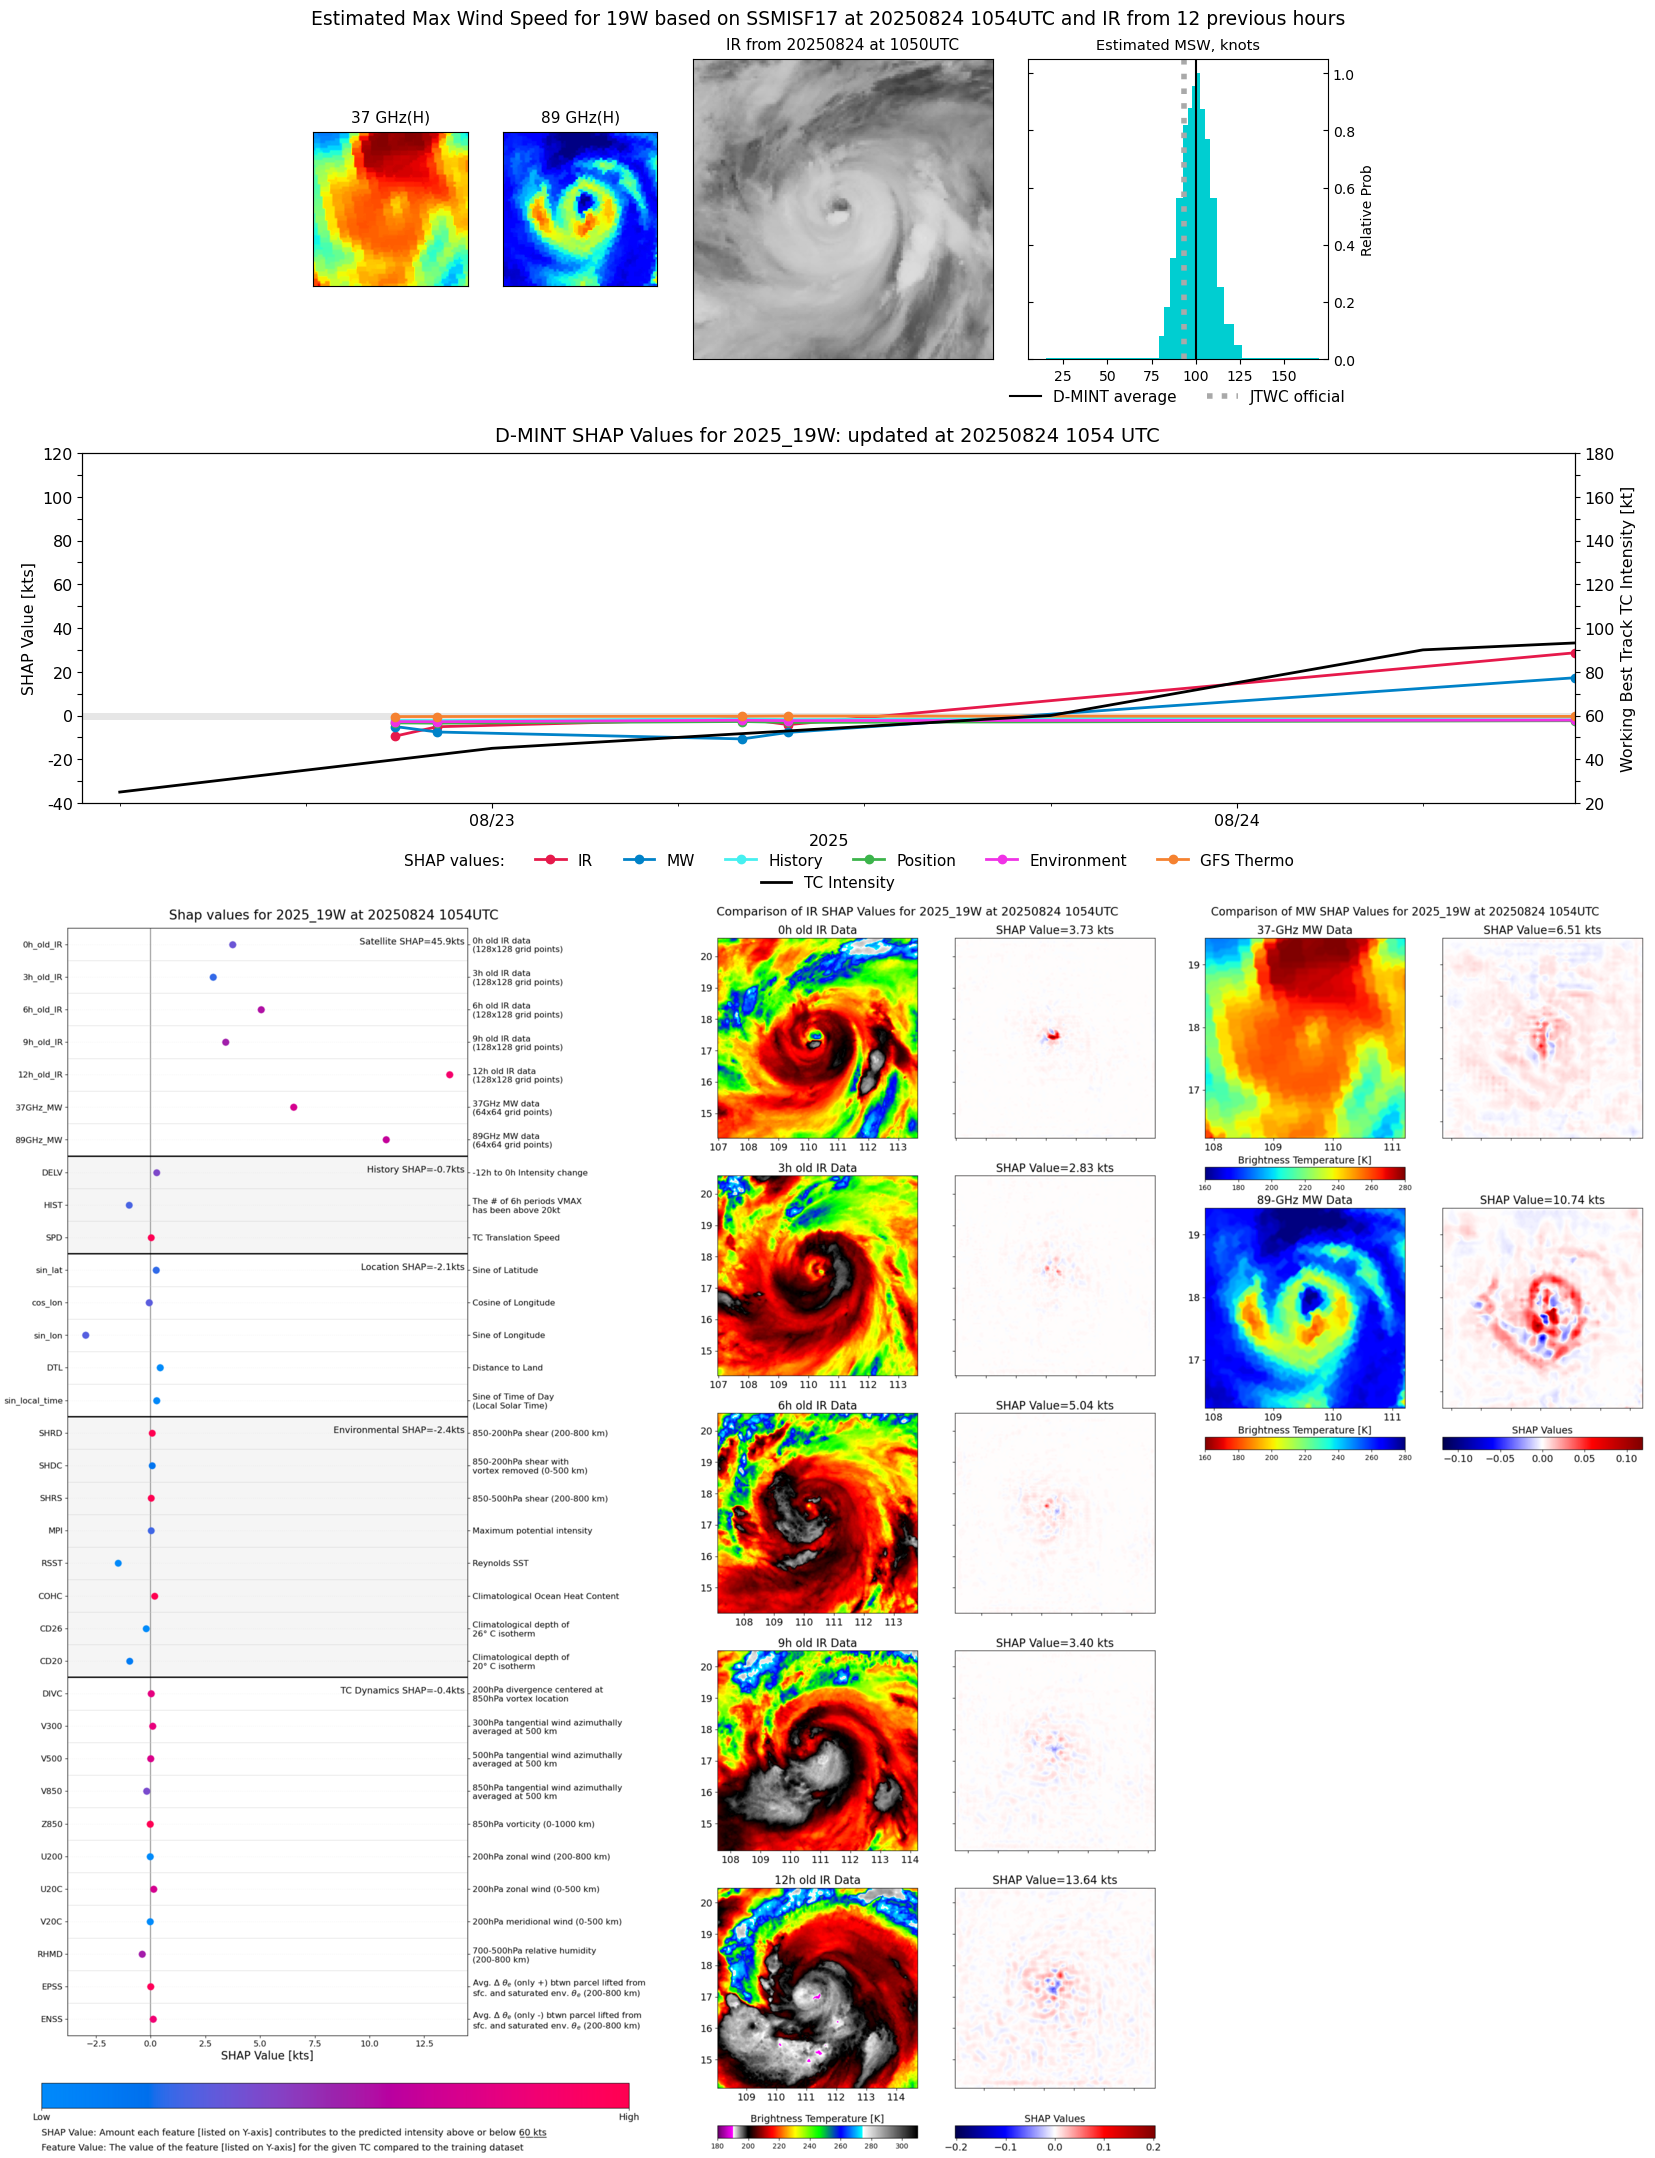 |
| 20250824 | 0552 UTC | ATMS-NPP | 950 hPa | 100 kts | 93 kts | 107 kts | 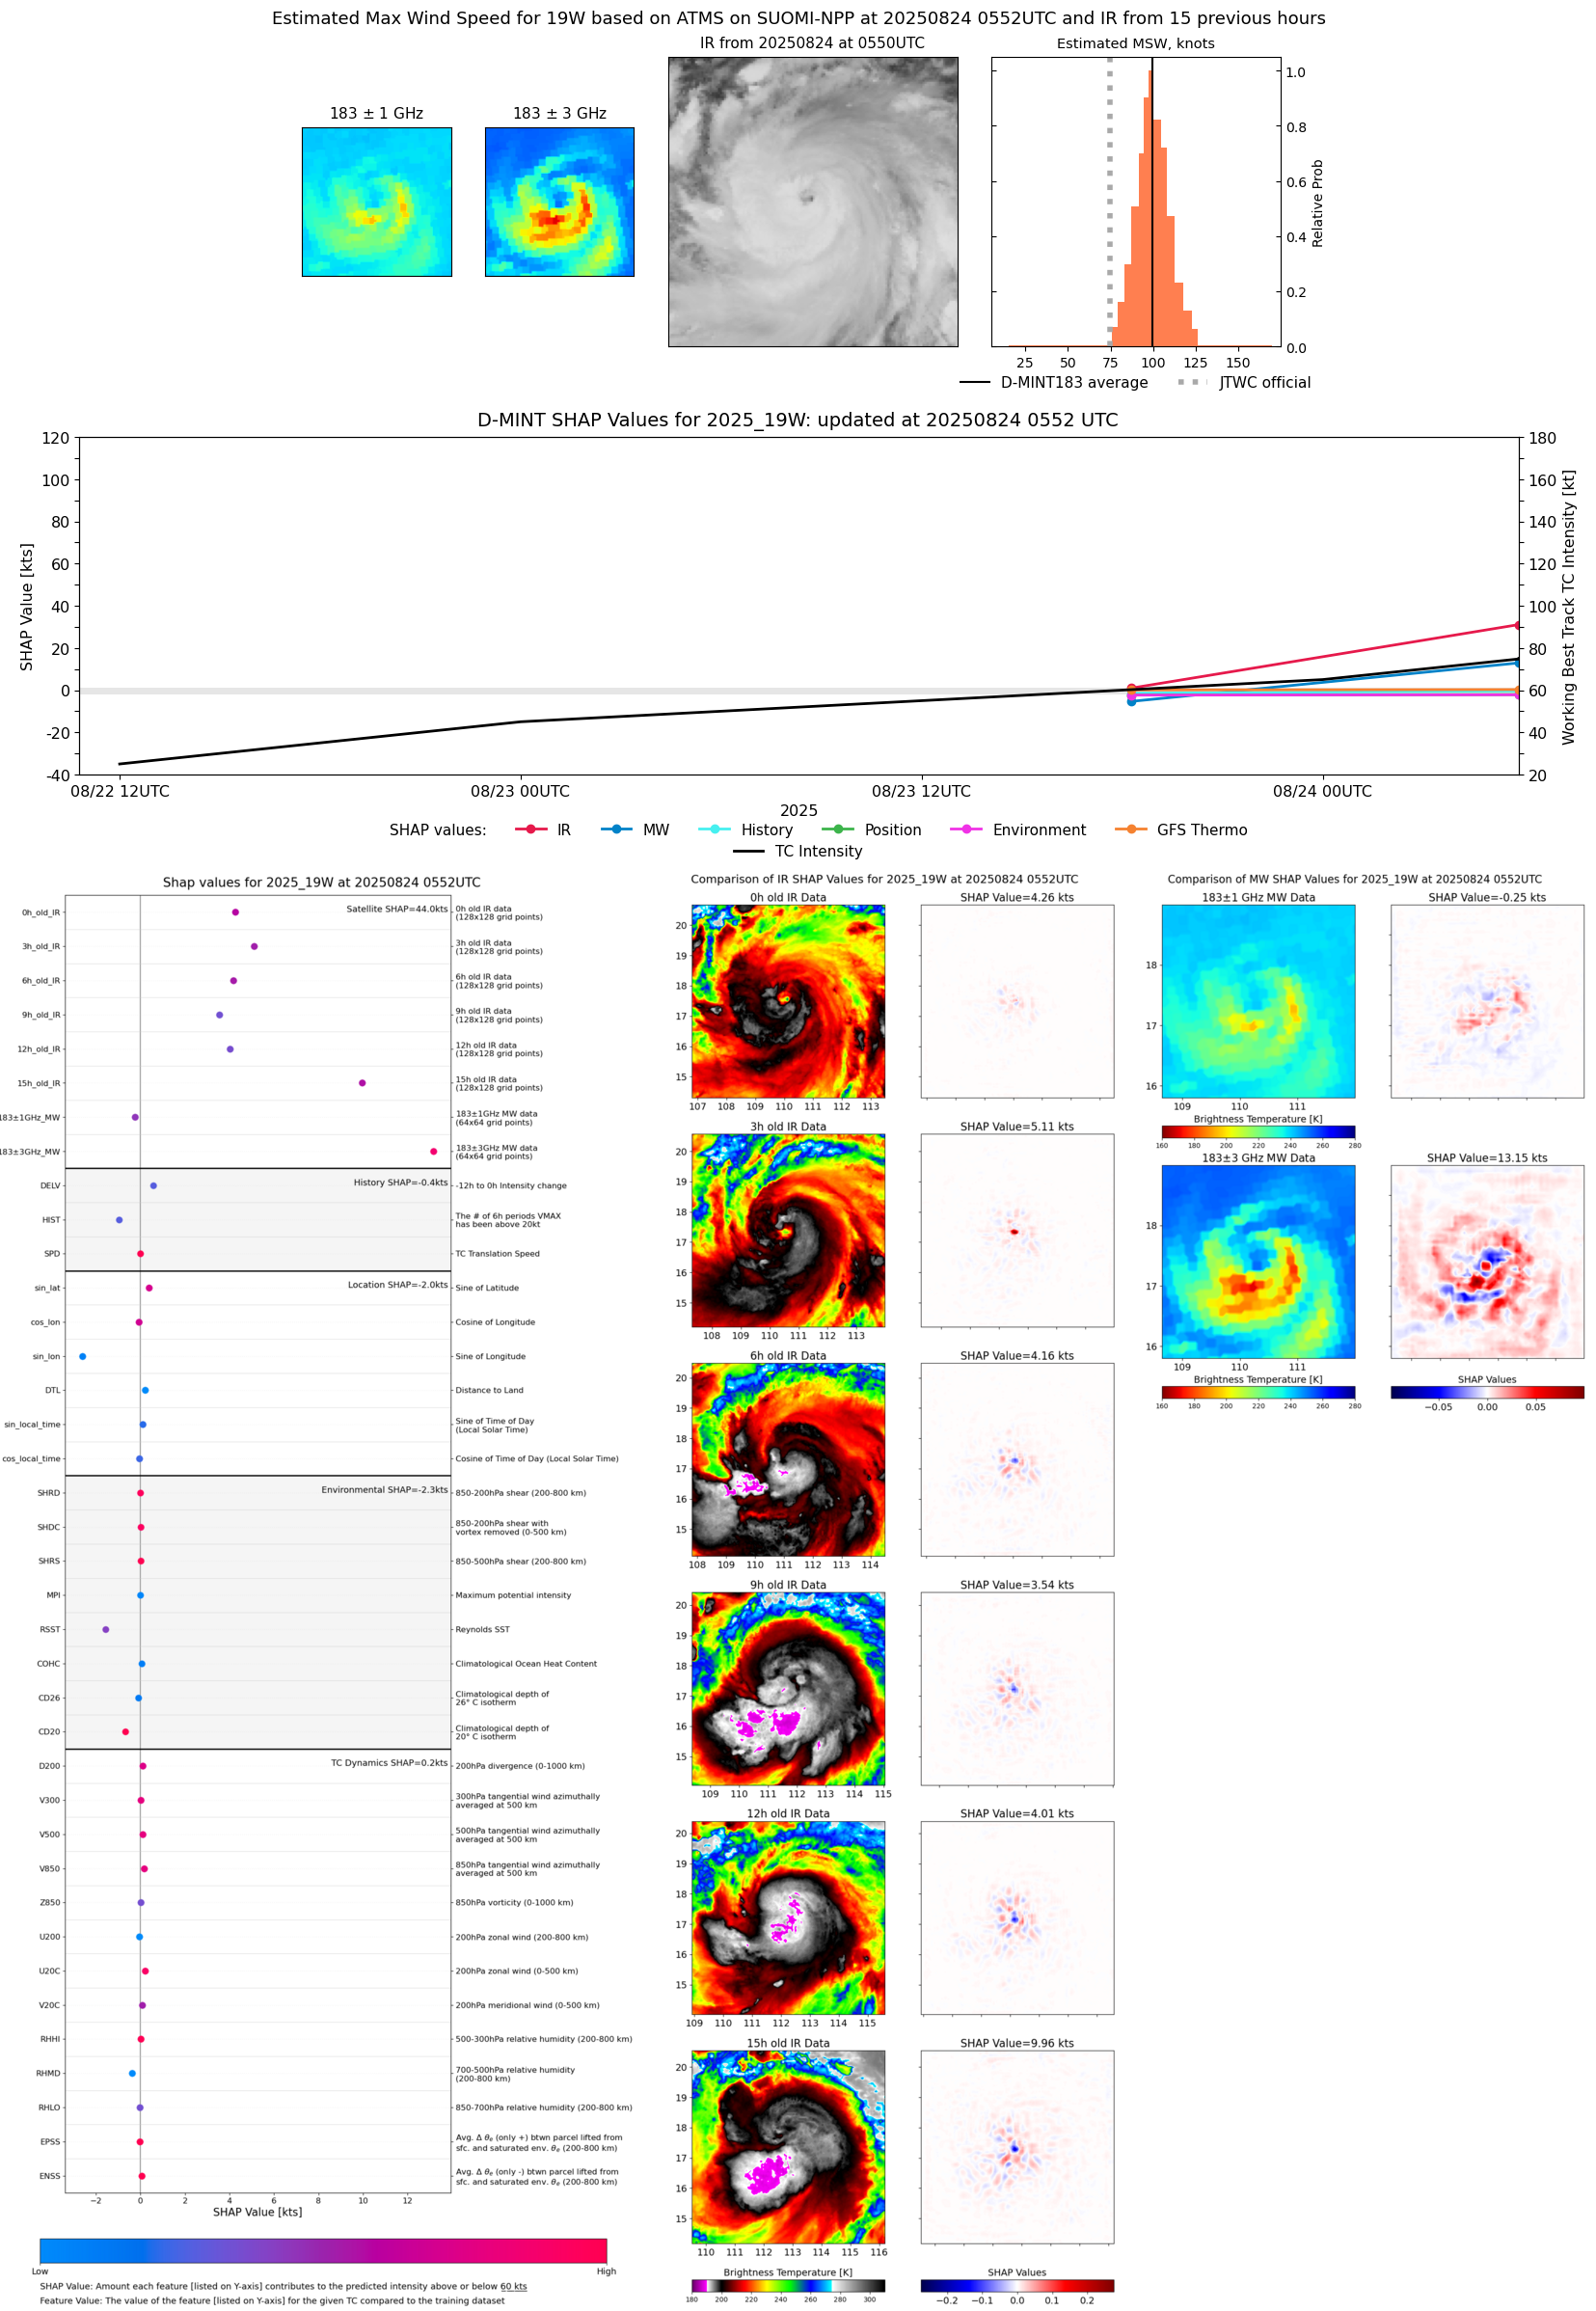 |
| 20250824 | 0536 UTC | AMSR2 | 958 hPa | 93 kts | 85 kts | 103 kts | 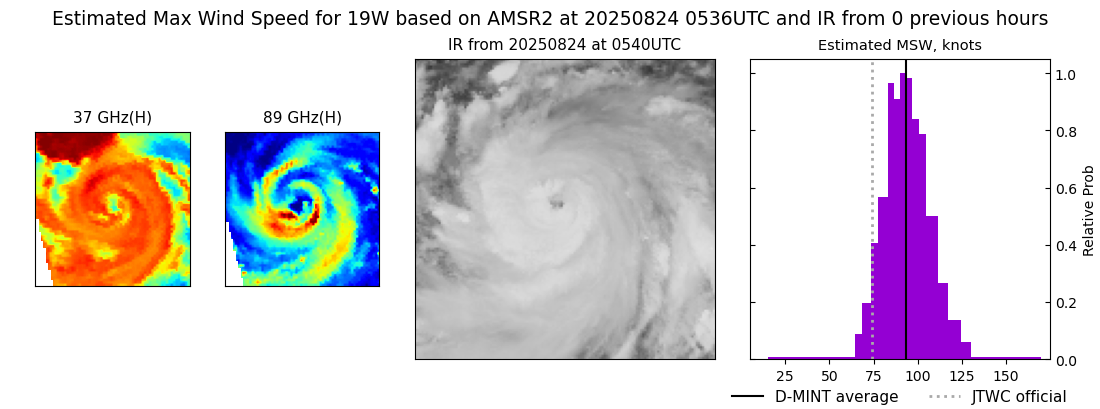 |
| 20250823 | 1816 UTC | ATMS-N21 | 987 hPa | 49 kts | 44 kts | 56 kts | 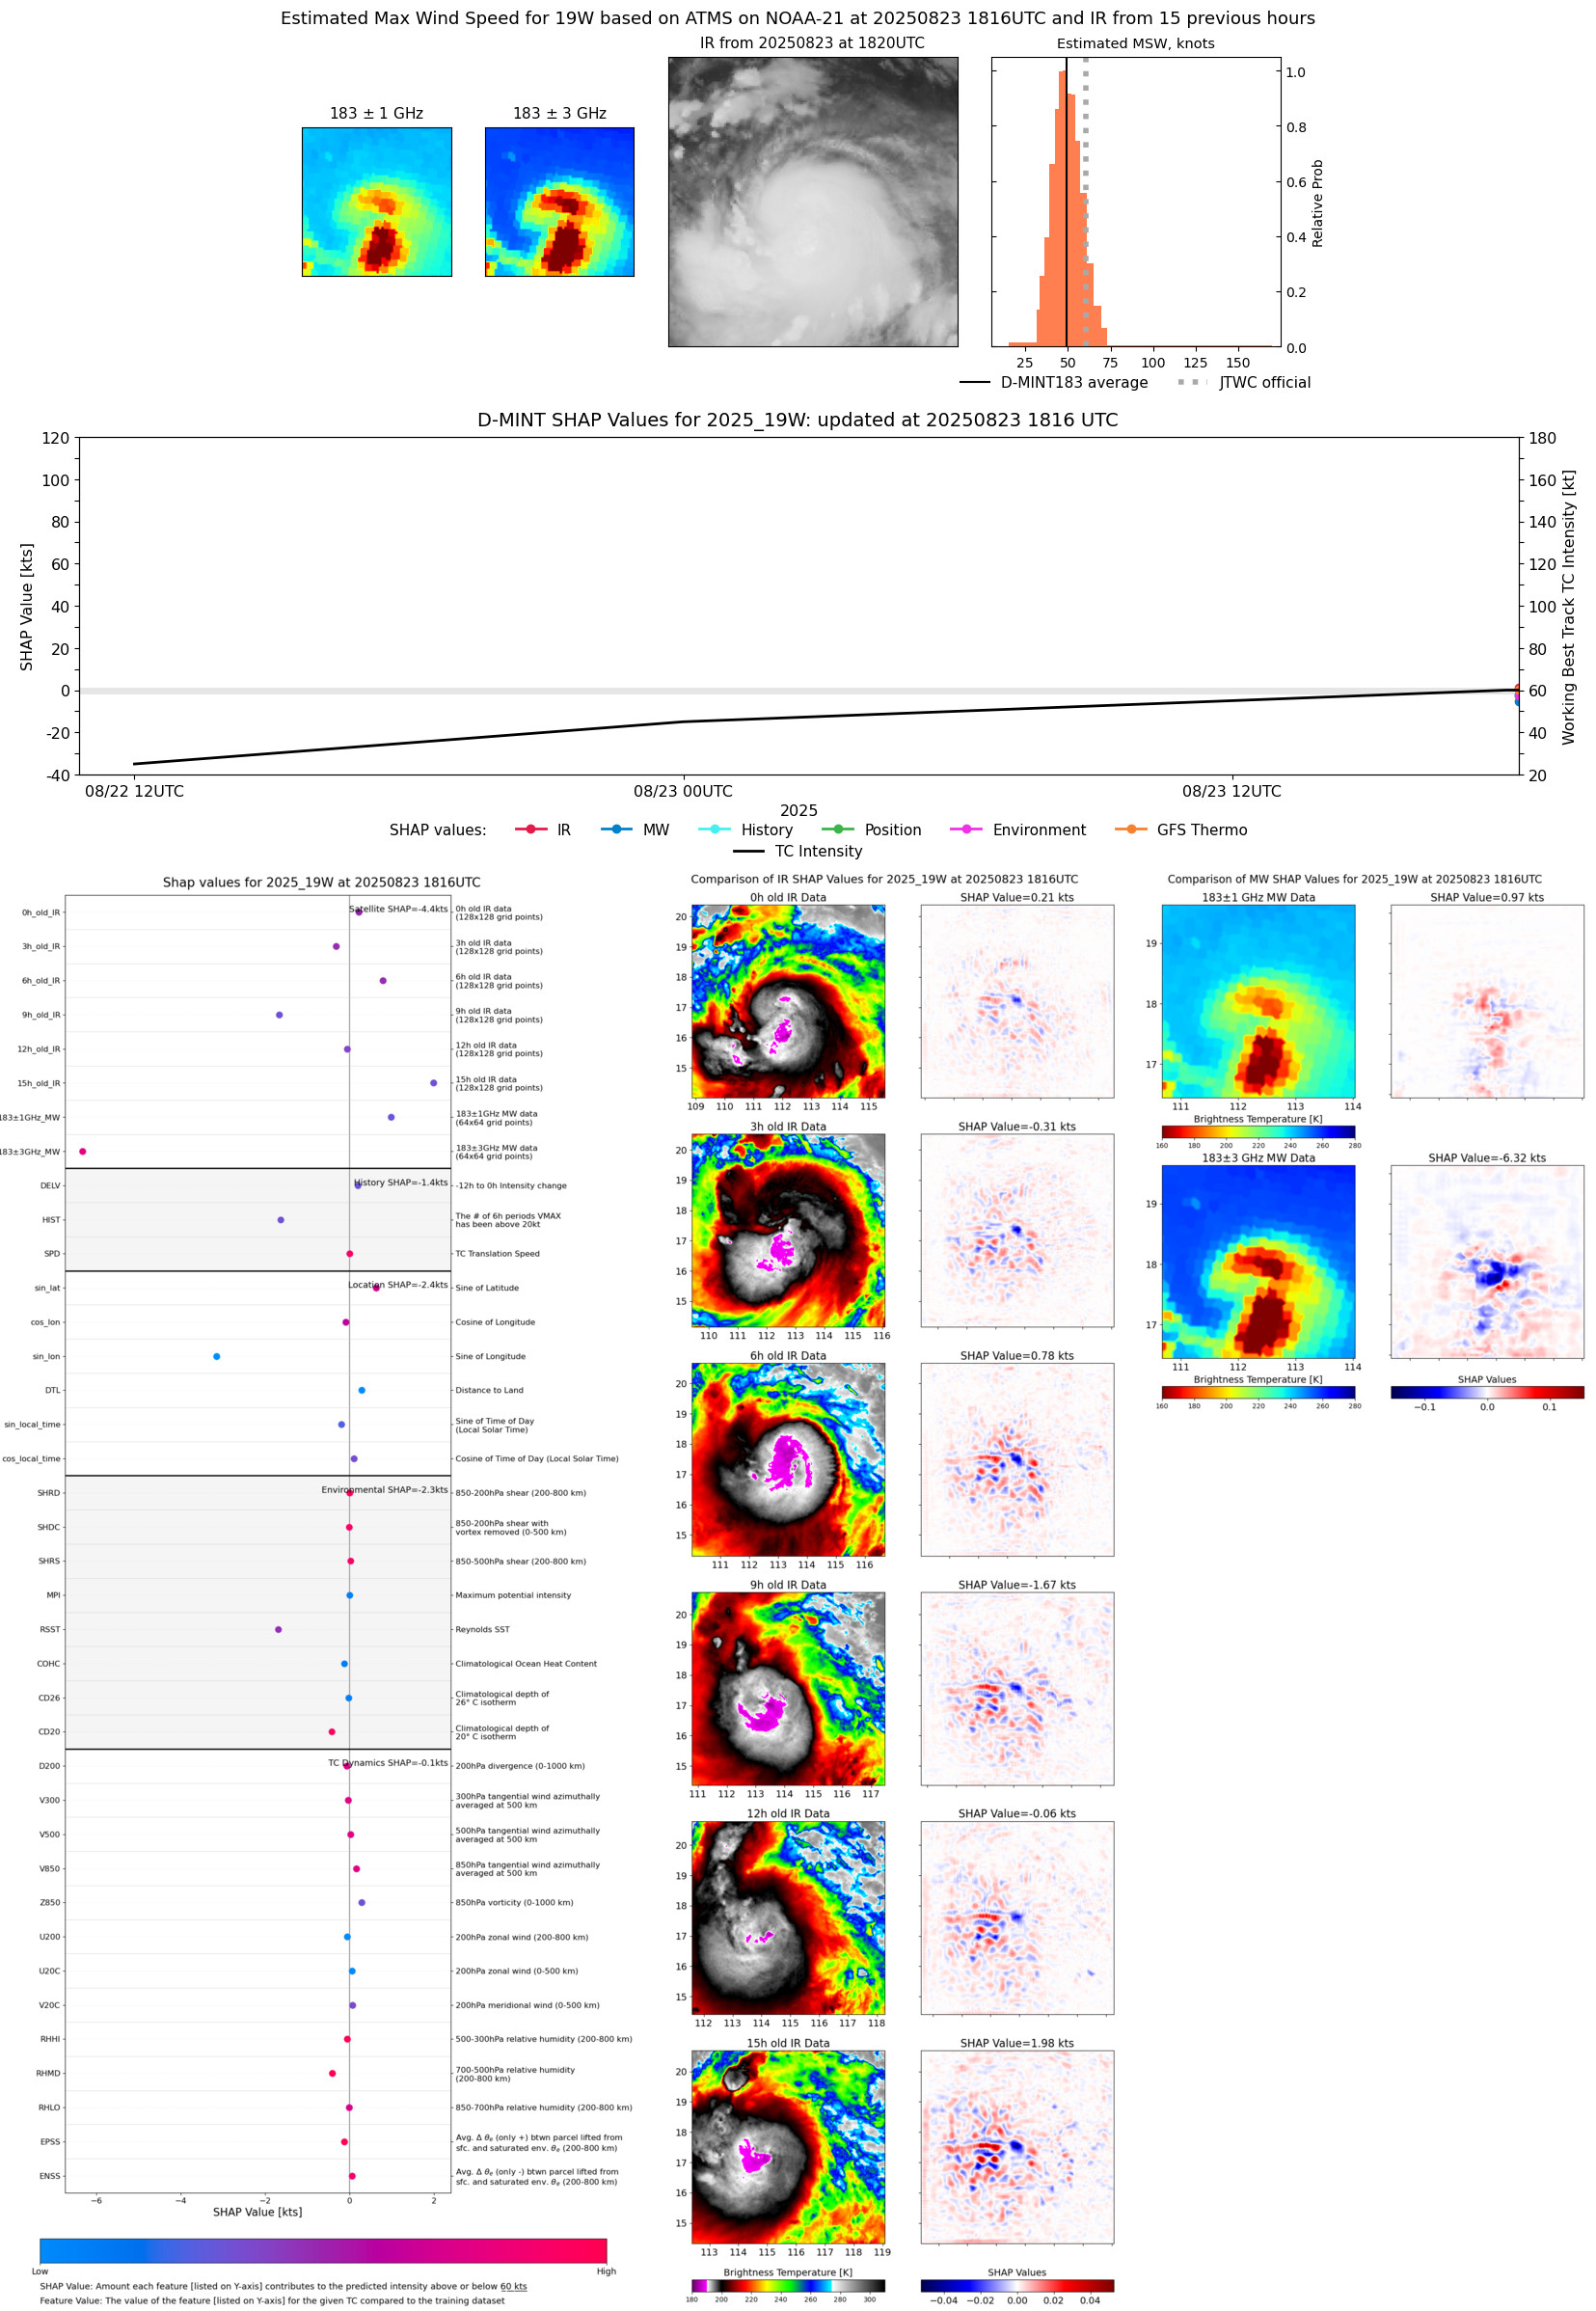 |
| 20250823 | 0933 UTC | GMI | 992 hPa | 40 kts | 35 kts | 46 kts |  |
| 20250823 | 0804 UTC | SSMISF18 | 993 hPa | 41 kts | 36 kts | 46 kts | 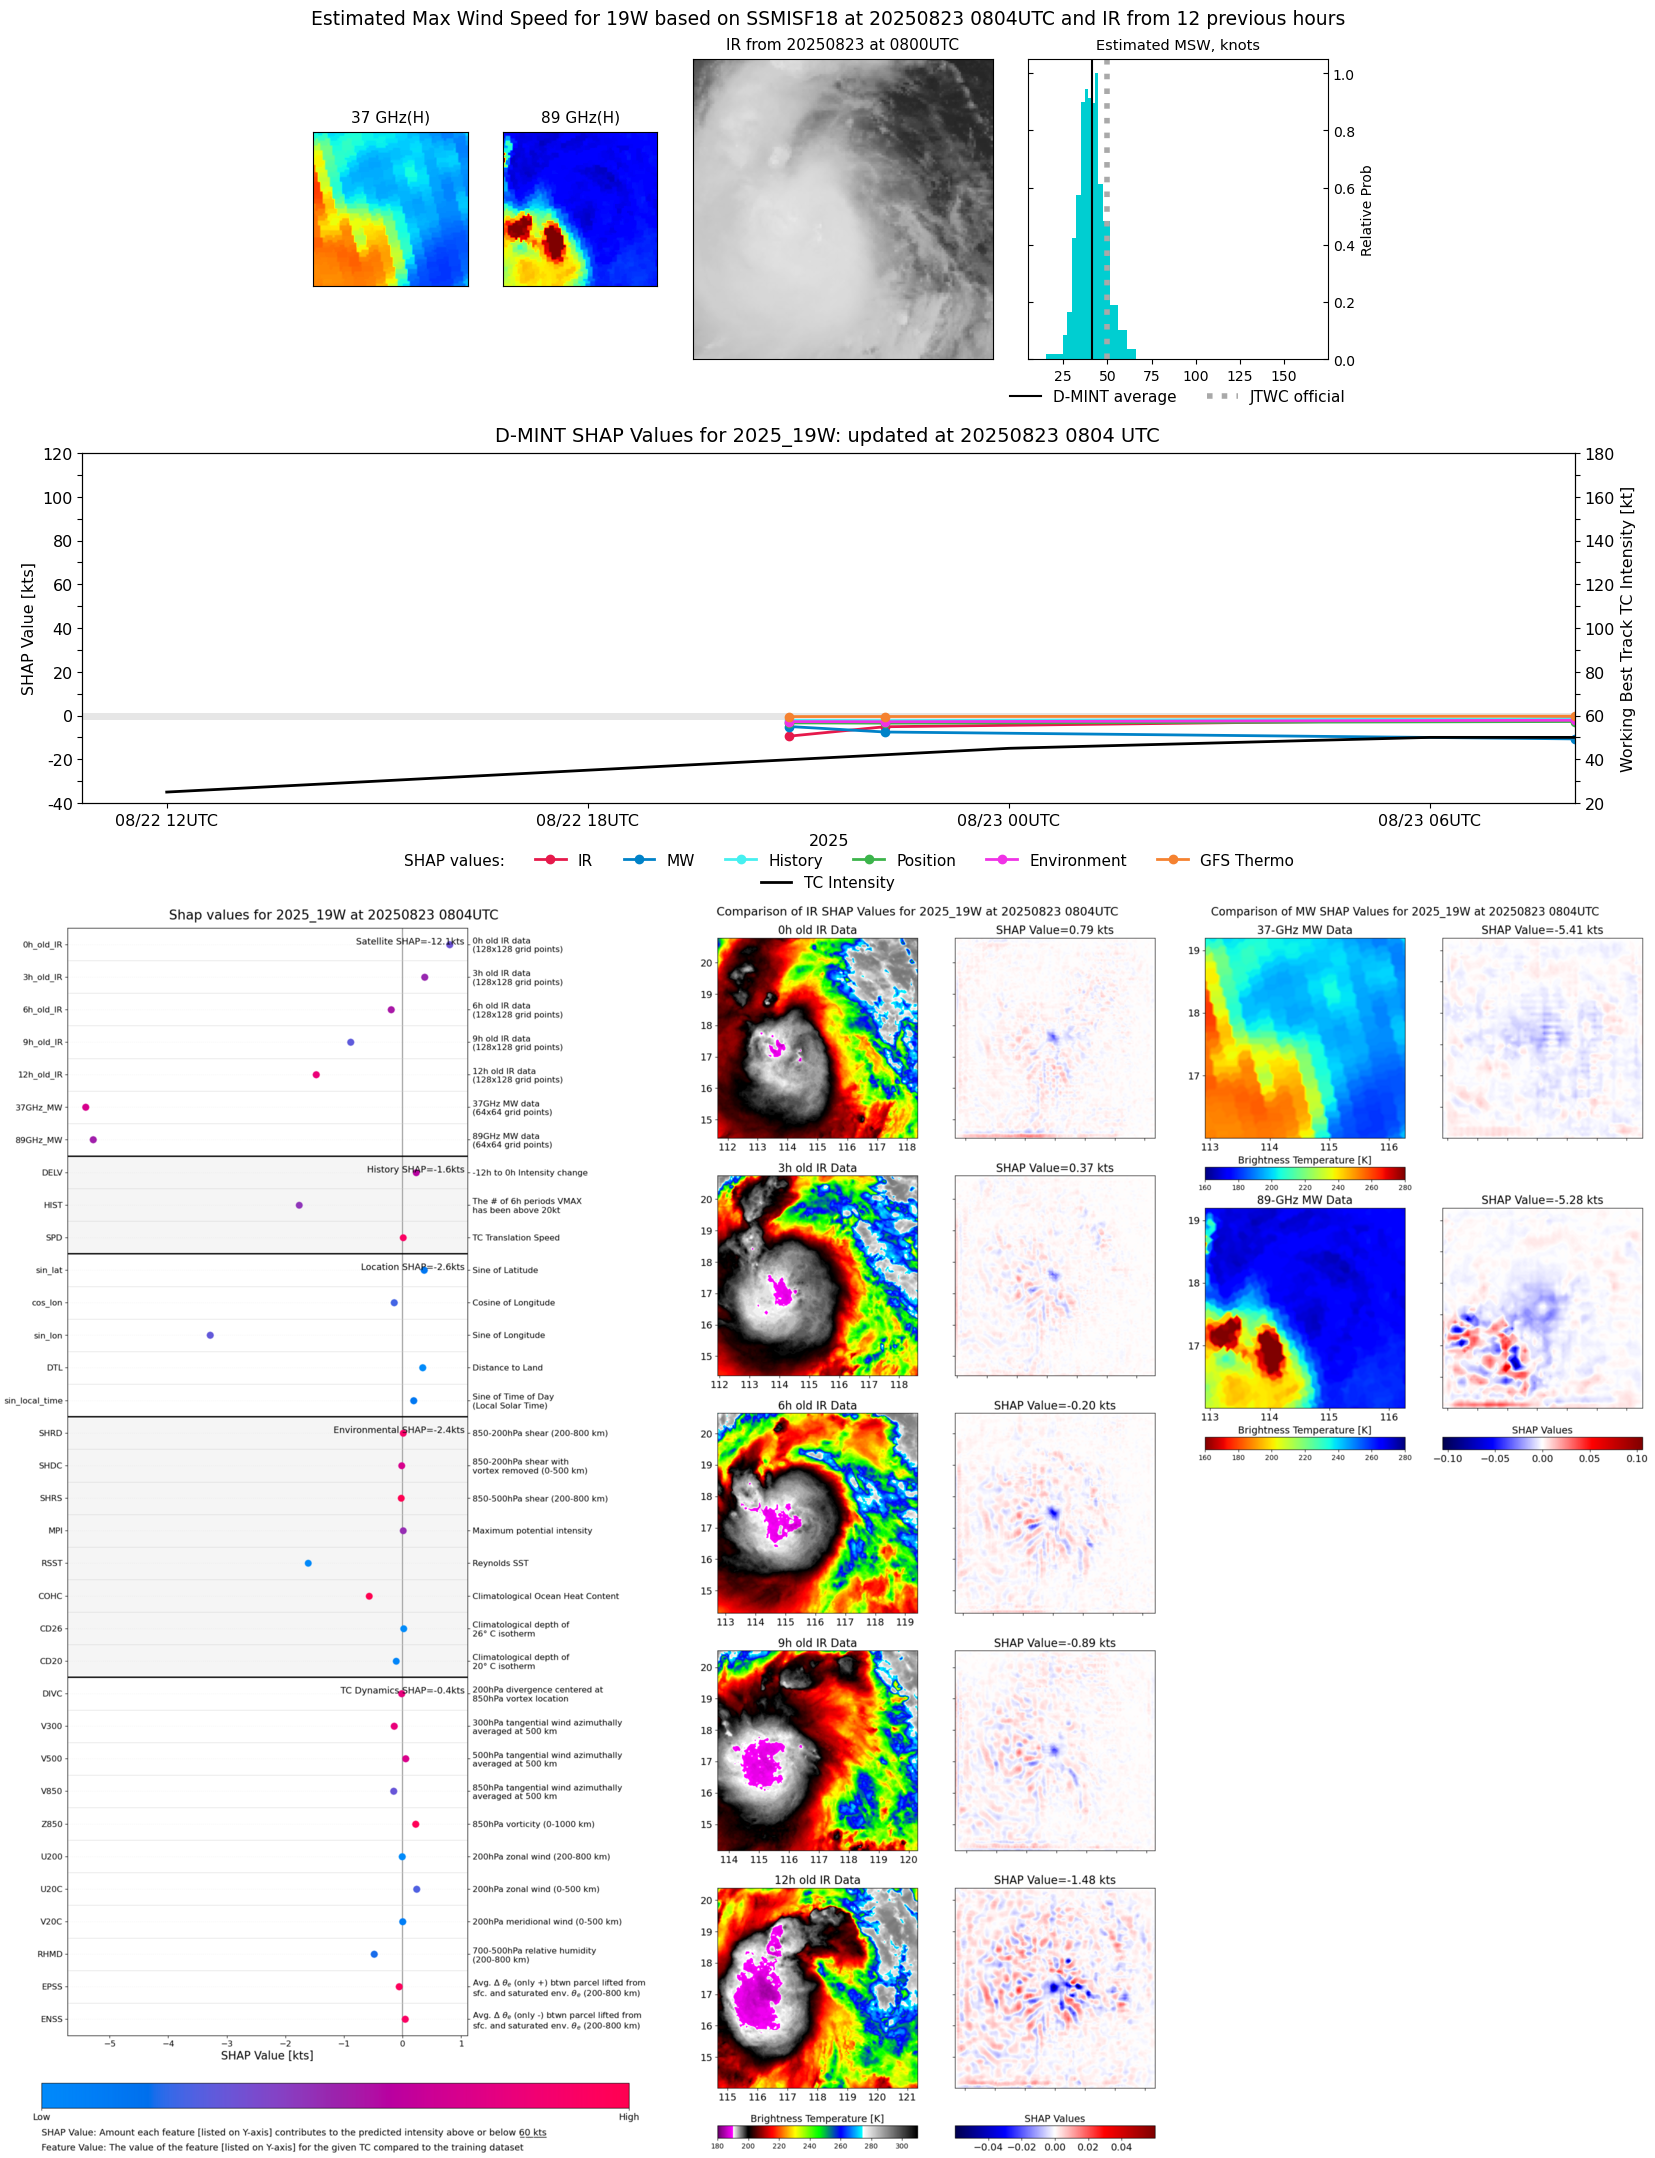 |
| 20250823 | 0545 UTC | ATMS-N21 | 997 hPa | 43 kts | 37 kts | 50 kts |  |
| 20250822 | 2214 UTC | SSMISF17 | 996 hPa | 38 kts | 34 kts | 43 kts |  |
| 20250822 | 2052 UTC | SSMISF18 | 998 hPa | 37 kts | 32 kts | 42 kts |  |
| 20250822 | 1759 UTC | AMSR2 | 1001 hPa | 27 kts | 25 kts | 30 kts |  |