|
||

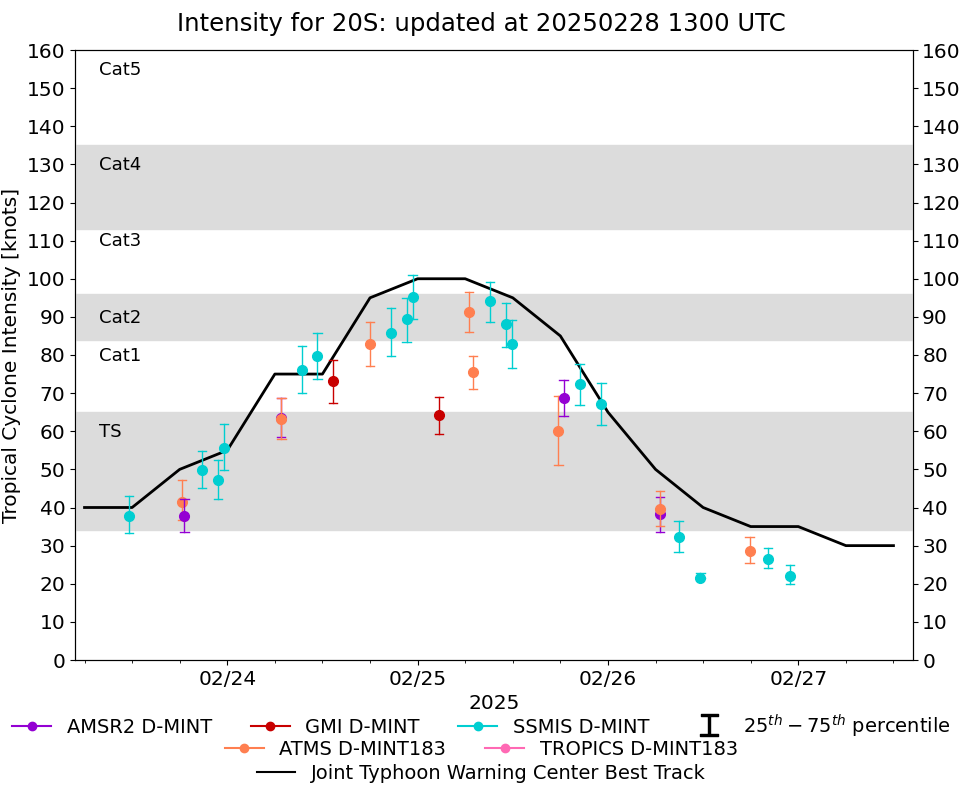 |
D-MINT HISTORY FILE for 2025_20S
| Date | Time | MW Sensor | MSLP | Vmax (30th-70th percentile average) | Vmax 25th percentile | Vmax 75th percentile | Image |
| 20250228 | 0213 UTC | GMI | 1009 hPa | 25 kts | 24 kts | 27 kts | 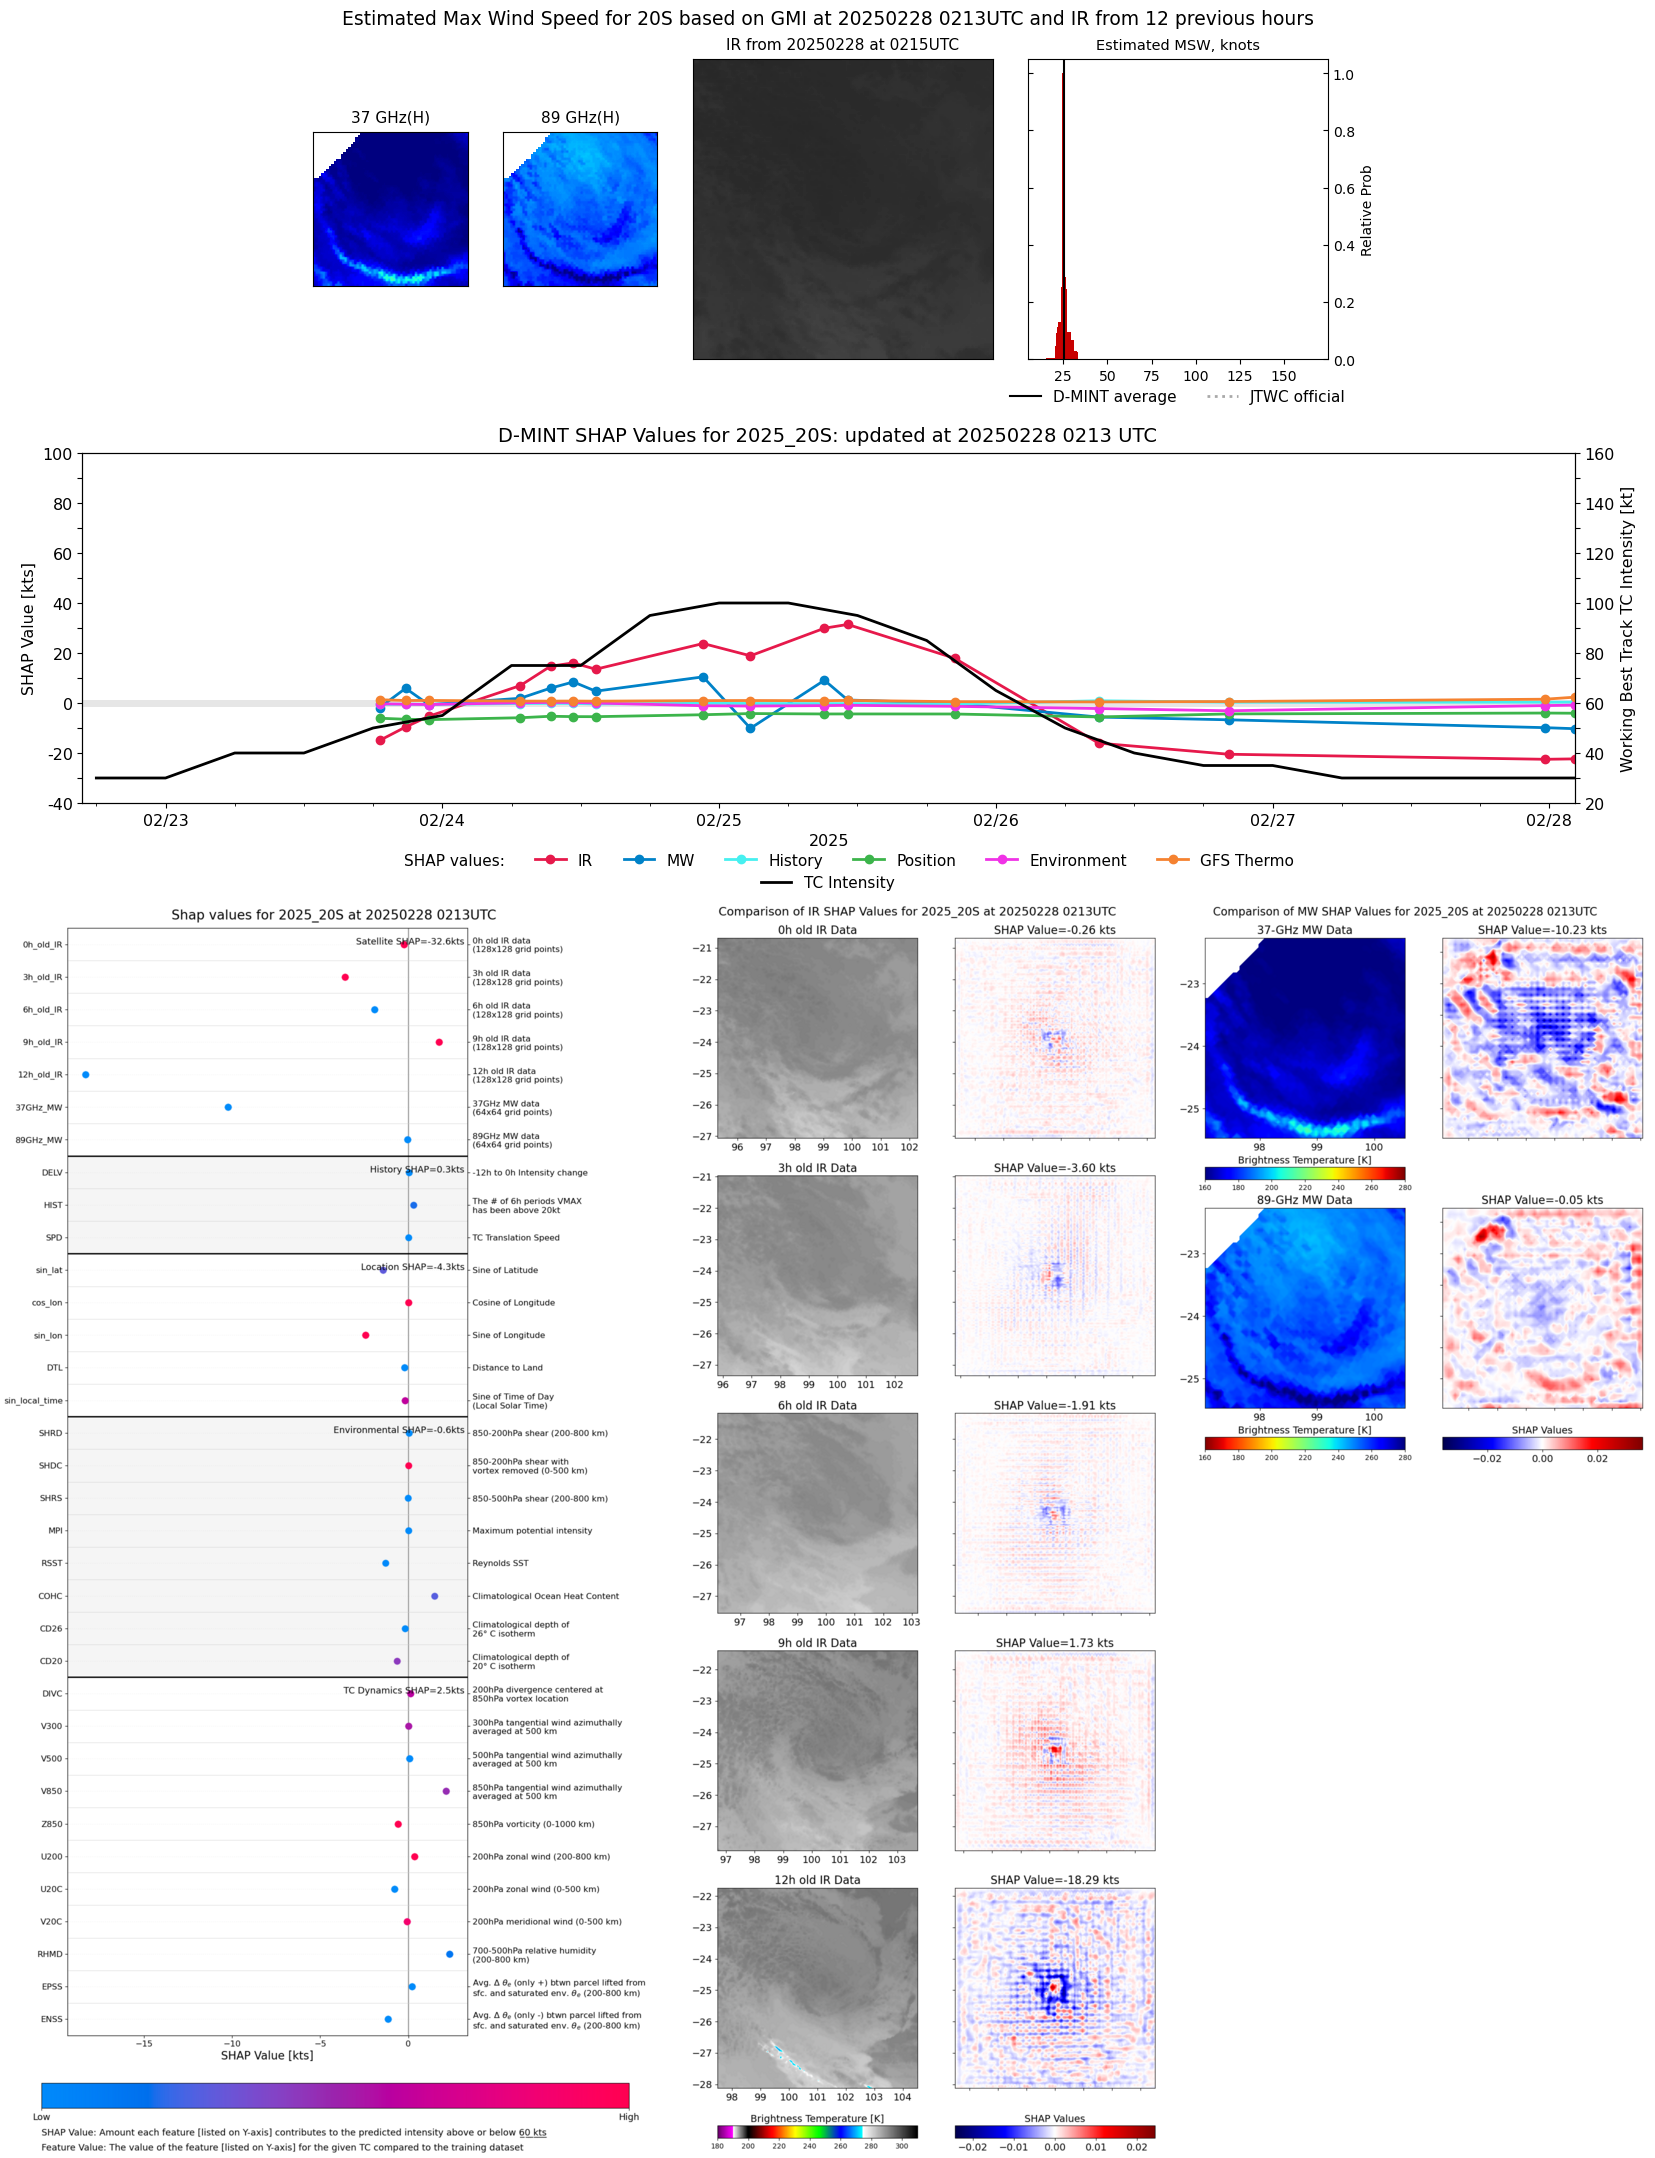 |
| 20250227 | 2337 UTC | SSMISF17 | 1008 hPa | 25 kts | 23 kts | 26 kts |  |
| 20250227 | 1813 UTC | AMSR2 | 1006 hPa | 23 kts | 21 kts | 25 kts |  |
| 20250226 | 2256 UTC | SSMISF16 | 1005 hPa | 22 kts | 20 kts | 25 kts |  |
| 20250226 | 2011 UTC | SSMISF18 | 1004 hPa | 27 kts | 24 kts | 29 kts |  |
| 20250226 | 1751 UTC | ATMS-N20 | 1004 hPa | 29 kts | 25 kts | 32 kts |  |
| 20250226 | 1140 UTC | SSMISF16 | 1007 hPa | 22 kts | 23 kts | 21 kts |  |
| 20250226 | 0854 UTC | SSMISF18 | 1001 hPa | 32 kts | 28 kts | 36 kts |  |
| 20250226 | 0636 UTC | ATMS-N20 | 998 hPa | 40 kts | 35 kts | 44 kts |  |
| 20250226 | 0633 UTC | AMSR2 | 997 hPa | 38 kts | 34 kts | 43 kts |  |
| 20250225 | 2310 UTC | SSMISF16 | 985 hPa | 67 kts | 62 kts | 73 kts |  |
| 20250225 | 2025 UTC | SSMISF18 | 978 hPa | 72 kts | 67 kts | 78 kts |  |
| 20250225 | 1824 UTC | AMSR2 | 980 hPa | 69 kts | 64 kts | 74 kts |  |
| 20250225 | 1745 UTC | ATMS-N20 | 987 hPa | 60 kts | 51 kts | 69 kts |  |
| 20250225 | 1154 UTC | SSMISF16 | 969 hPa | 83 kts | 77 kts | 89 kts |  |
| 20250225 | 1109 UTC | SSMISF17 | 963 hPa | 88 kts | 82 kts | 94 kts |  |
| 20250225 | 0908 UTC | SSMISF18 | 963 hPa | 94 kts | 89 kts | 99 kts |  |
| 20250225 | 0657 UTC | ATMS-N20 | 976 hPa | 76 kts | 71 kts | 80 kts |  |
| 20250225 | 0631 UTC | ATMS-N20 | 968 hPa | 91 kts | 86 kts | 97 kts |  |
| 20250225 | 0243 UTC | GMI | 981 hPa | 64 kts | 59 kts | 69 kts | 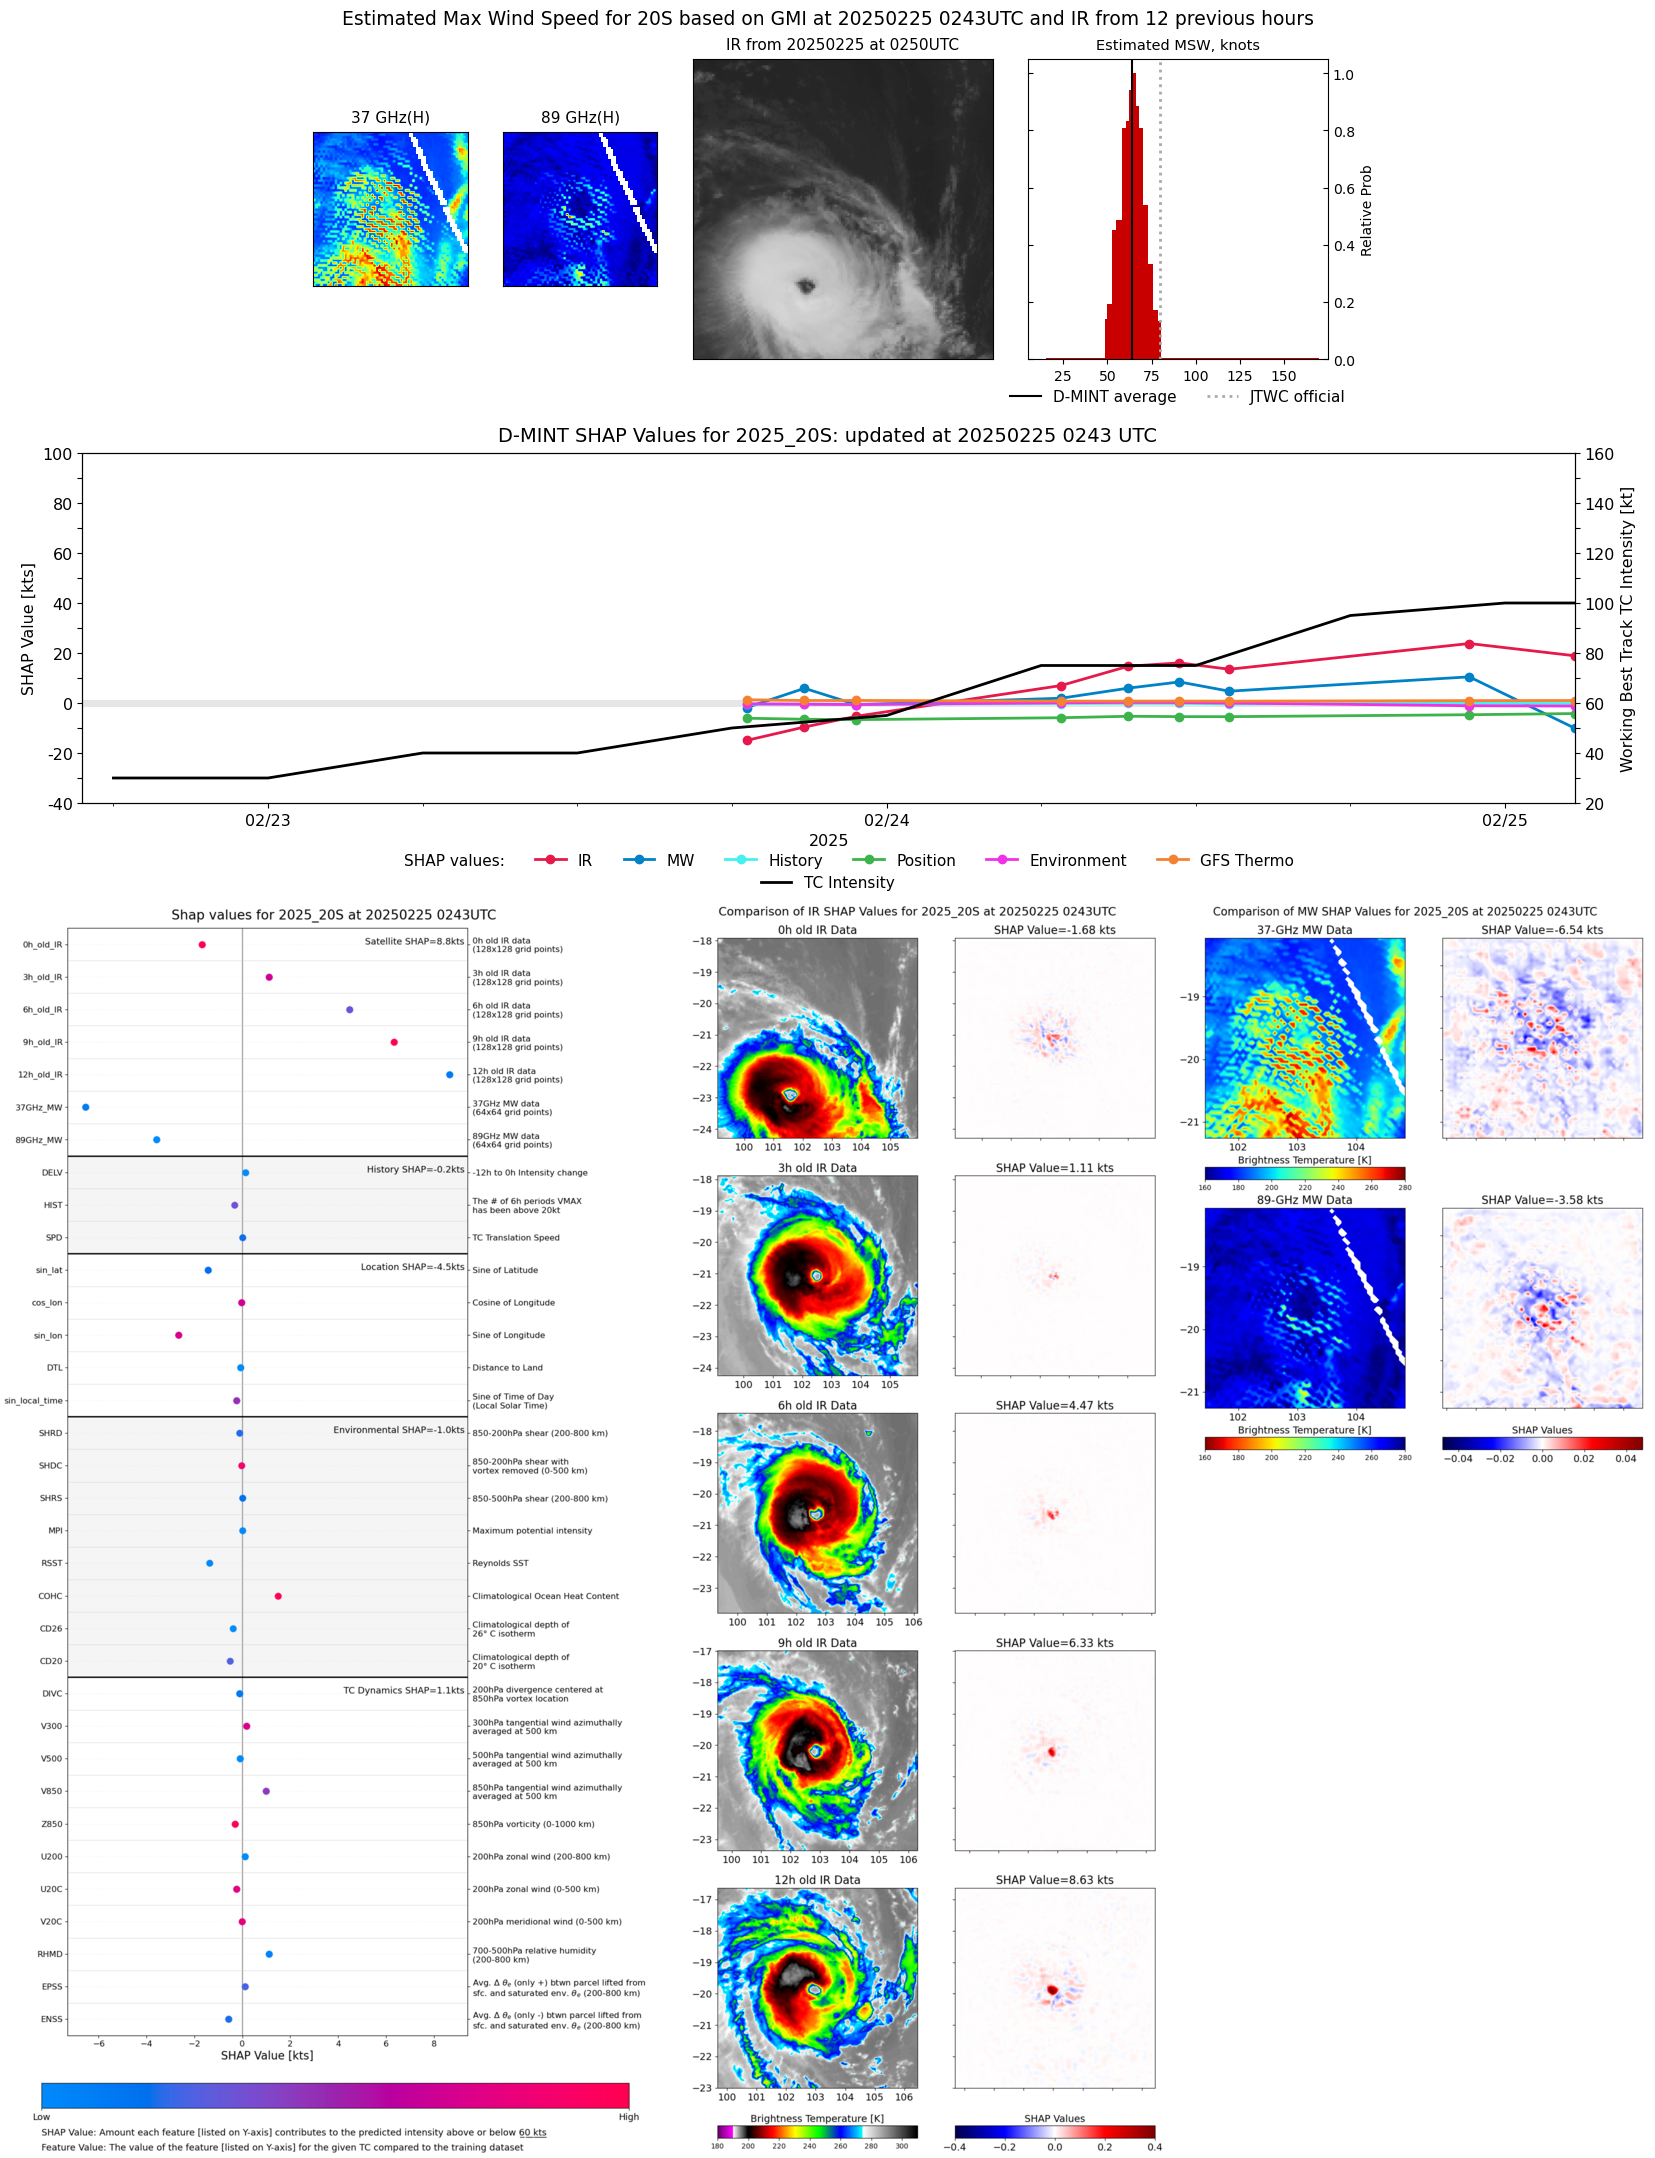 |
| 20250224 | 2322 UTC | SSMISF16 | 964 hPa | 95 kts | 89 kts | 101 kts |  |
| 20250224 | 2237 UTC | SSMISF17 | 964 hPa | 89 kts | 83 kts | 95 kts |  |
| 20250224 | 2037 UTC | SSMISF18 | 965 hPa | 86 kts | 80 kts | 92 kts |  |
| 20250224 | 1801 UTC | ATMS-N20 | 973 hPa | 83 kts | 77 kts | 89 kts | 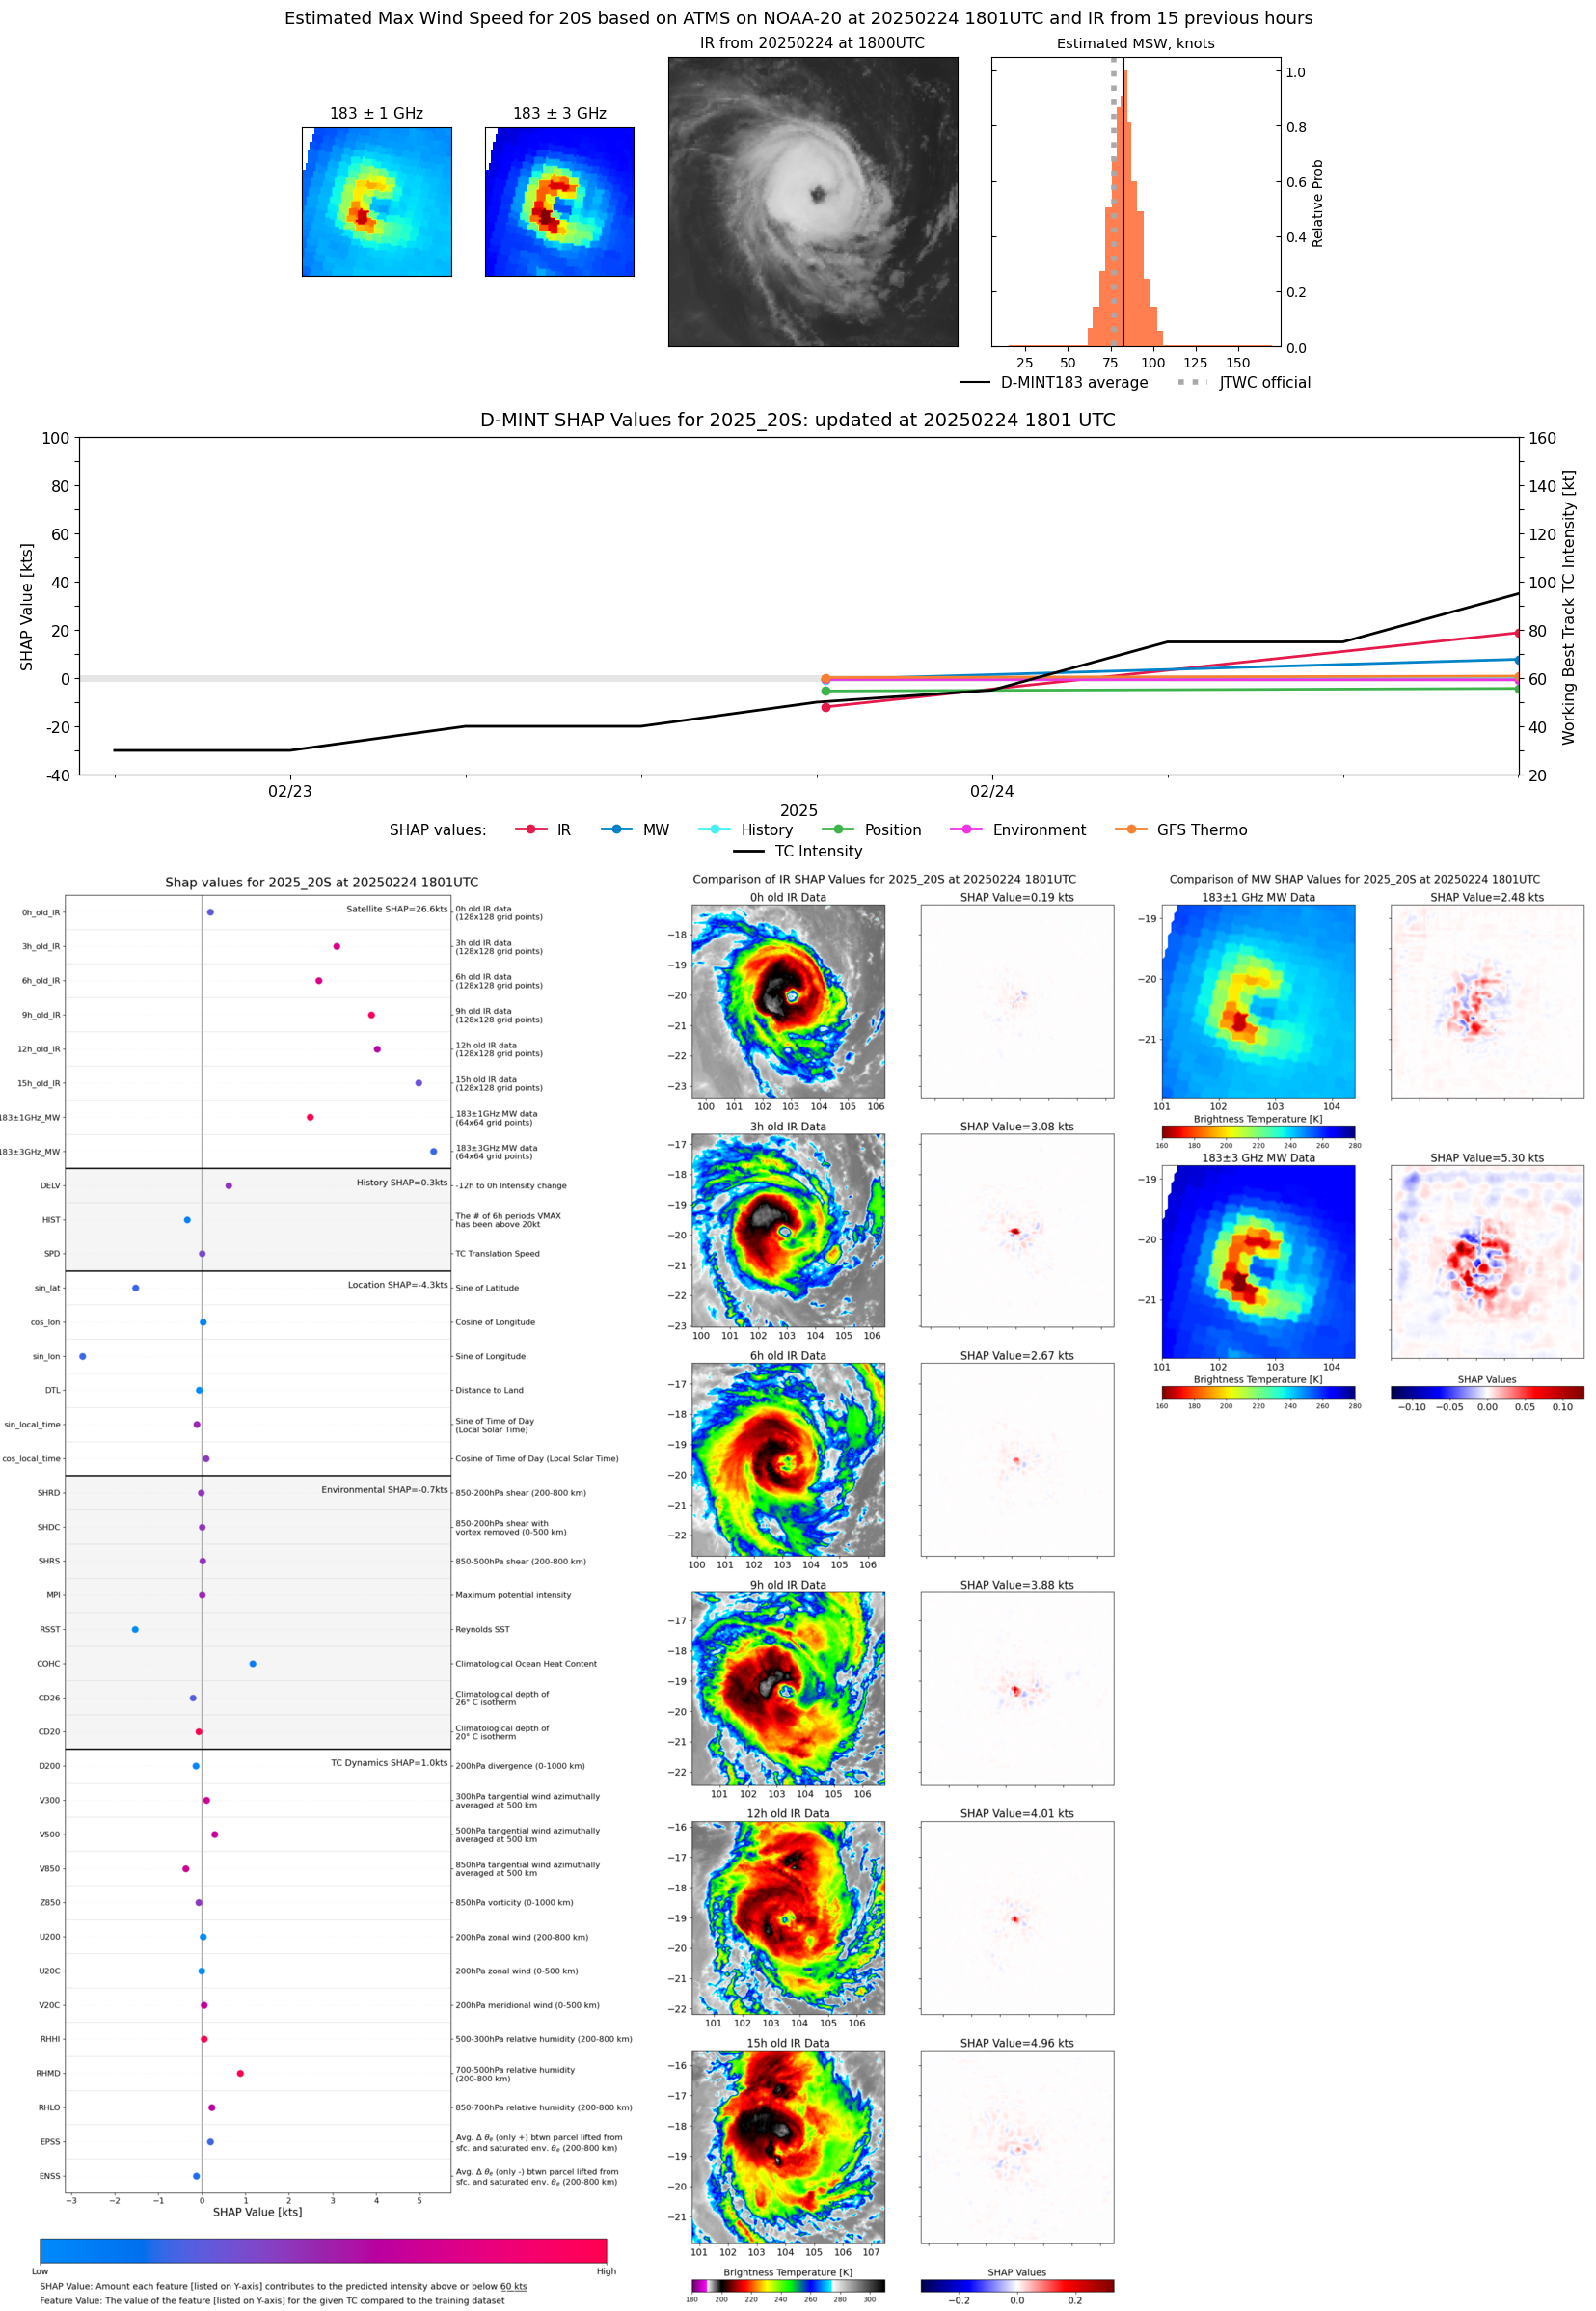 |
| 20250224 | 1318 UTC | GMI | 979 hPa | 73 kts | 68 kts | 79 kts | 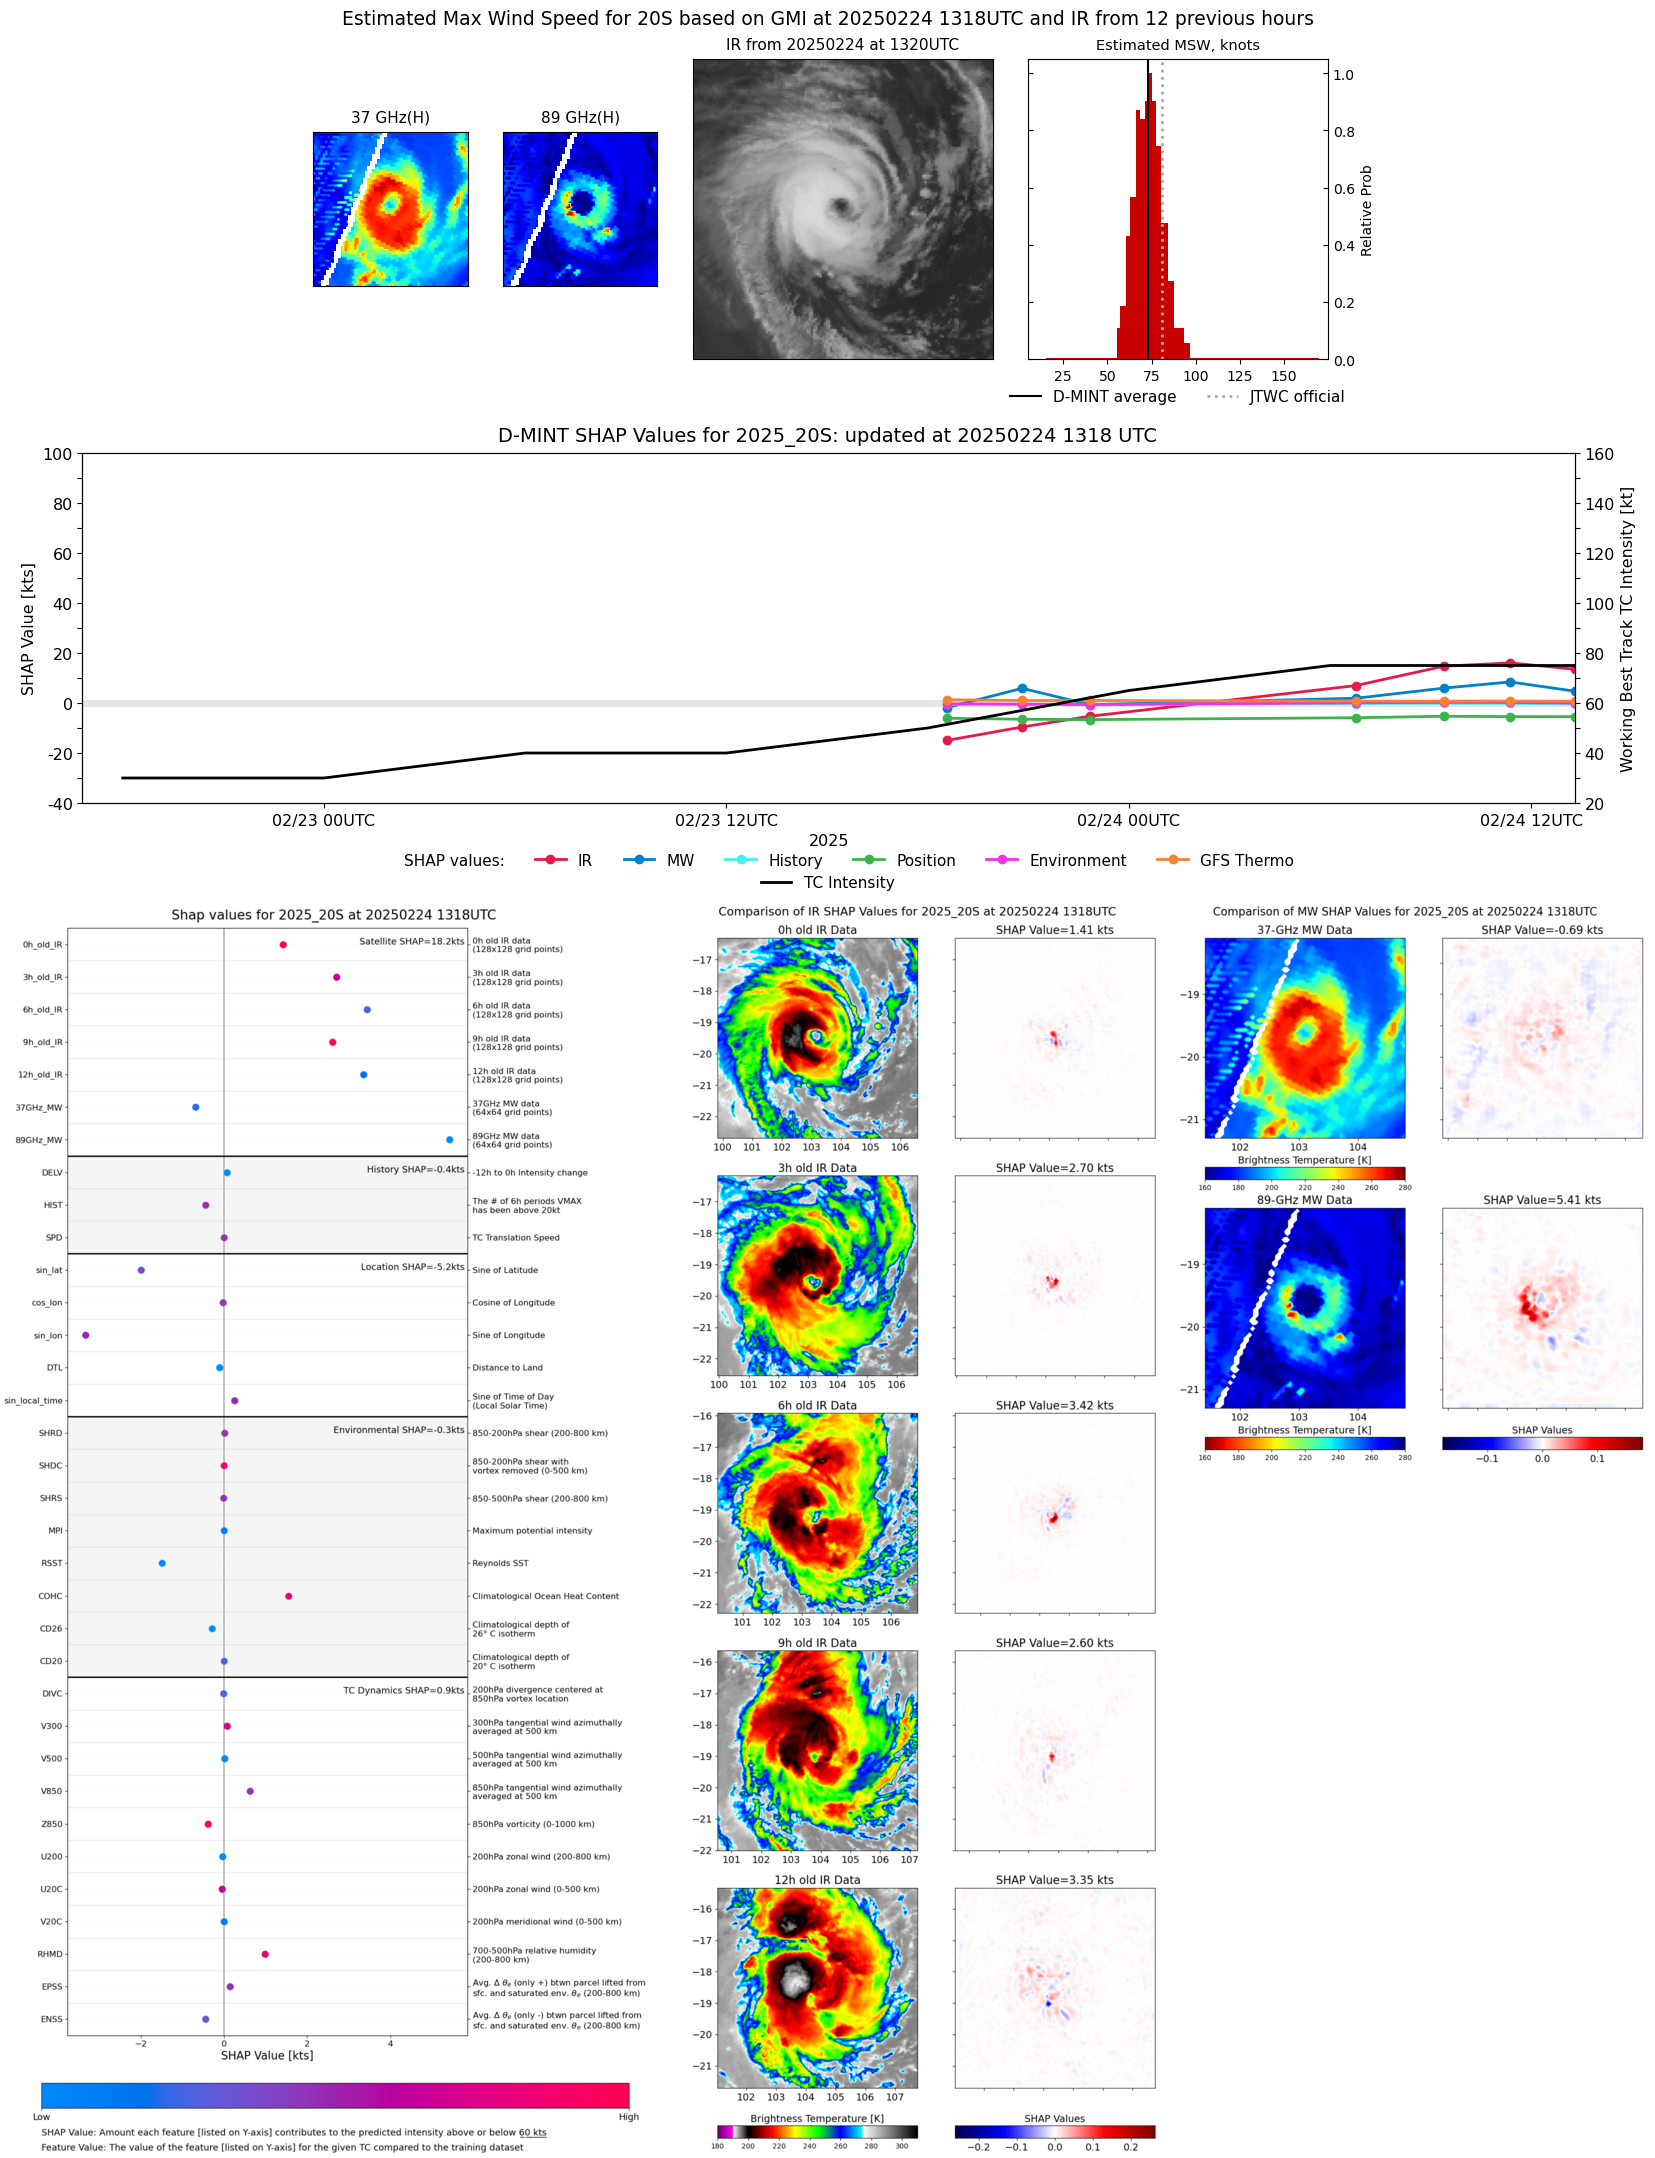 |
| 20250224 | 1122 UTC | SSMISF17 | 972 hPa | 80 kts | 74 kts | 86 kts |  |
| 20250224 | 0923 UTC | SSMISF18 | 971 hPa | 76 kts | 70 kts | 82 kts |  |
| 20250224 | 0650 UTC | ATMS-N20 | 982 hPa | 63 kts | 58 kts | 69 kts |  |
| 20250224 | 0646 UTC | AMSR2 | 985 hPa | 64 kts | 58 kts | 69 kts |  |
| 20250223 | 2336 UTC | SSMISF16 | 985 hPa | 56 kts | 50 kts | 62 kts |  |
| 20250223 | 2250 UTC | SSMISF17 | 987 hPa | 47 kts | 42 kts | 53 kts |  |
| 20250223 | 2049 UTC | SSMISF18 | 984 hPa | 50 kts | 45 kts | 55 kts |  |
| 20250223 | 1835 UTC | AMSR2 | 995 hPa | 38 kts | 33 kts | 42 kts |  |
| 20250223 | 1819 UTC | ATMS-N20 | 999 hPa | 41 kts | 37 kts | 47 kts | 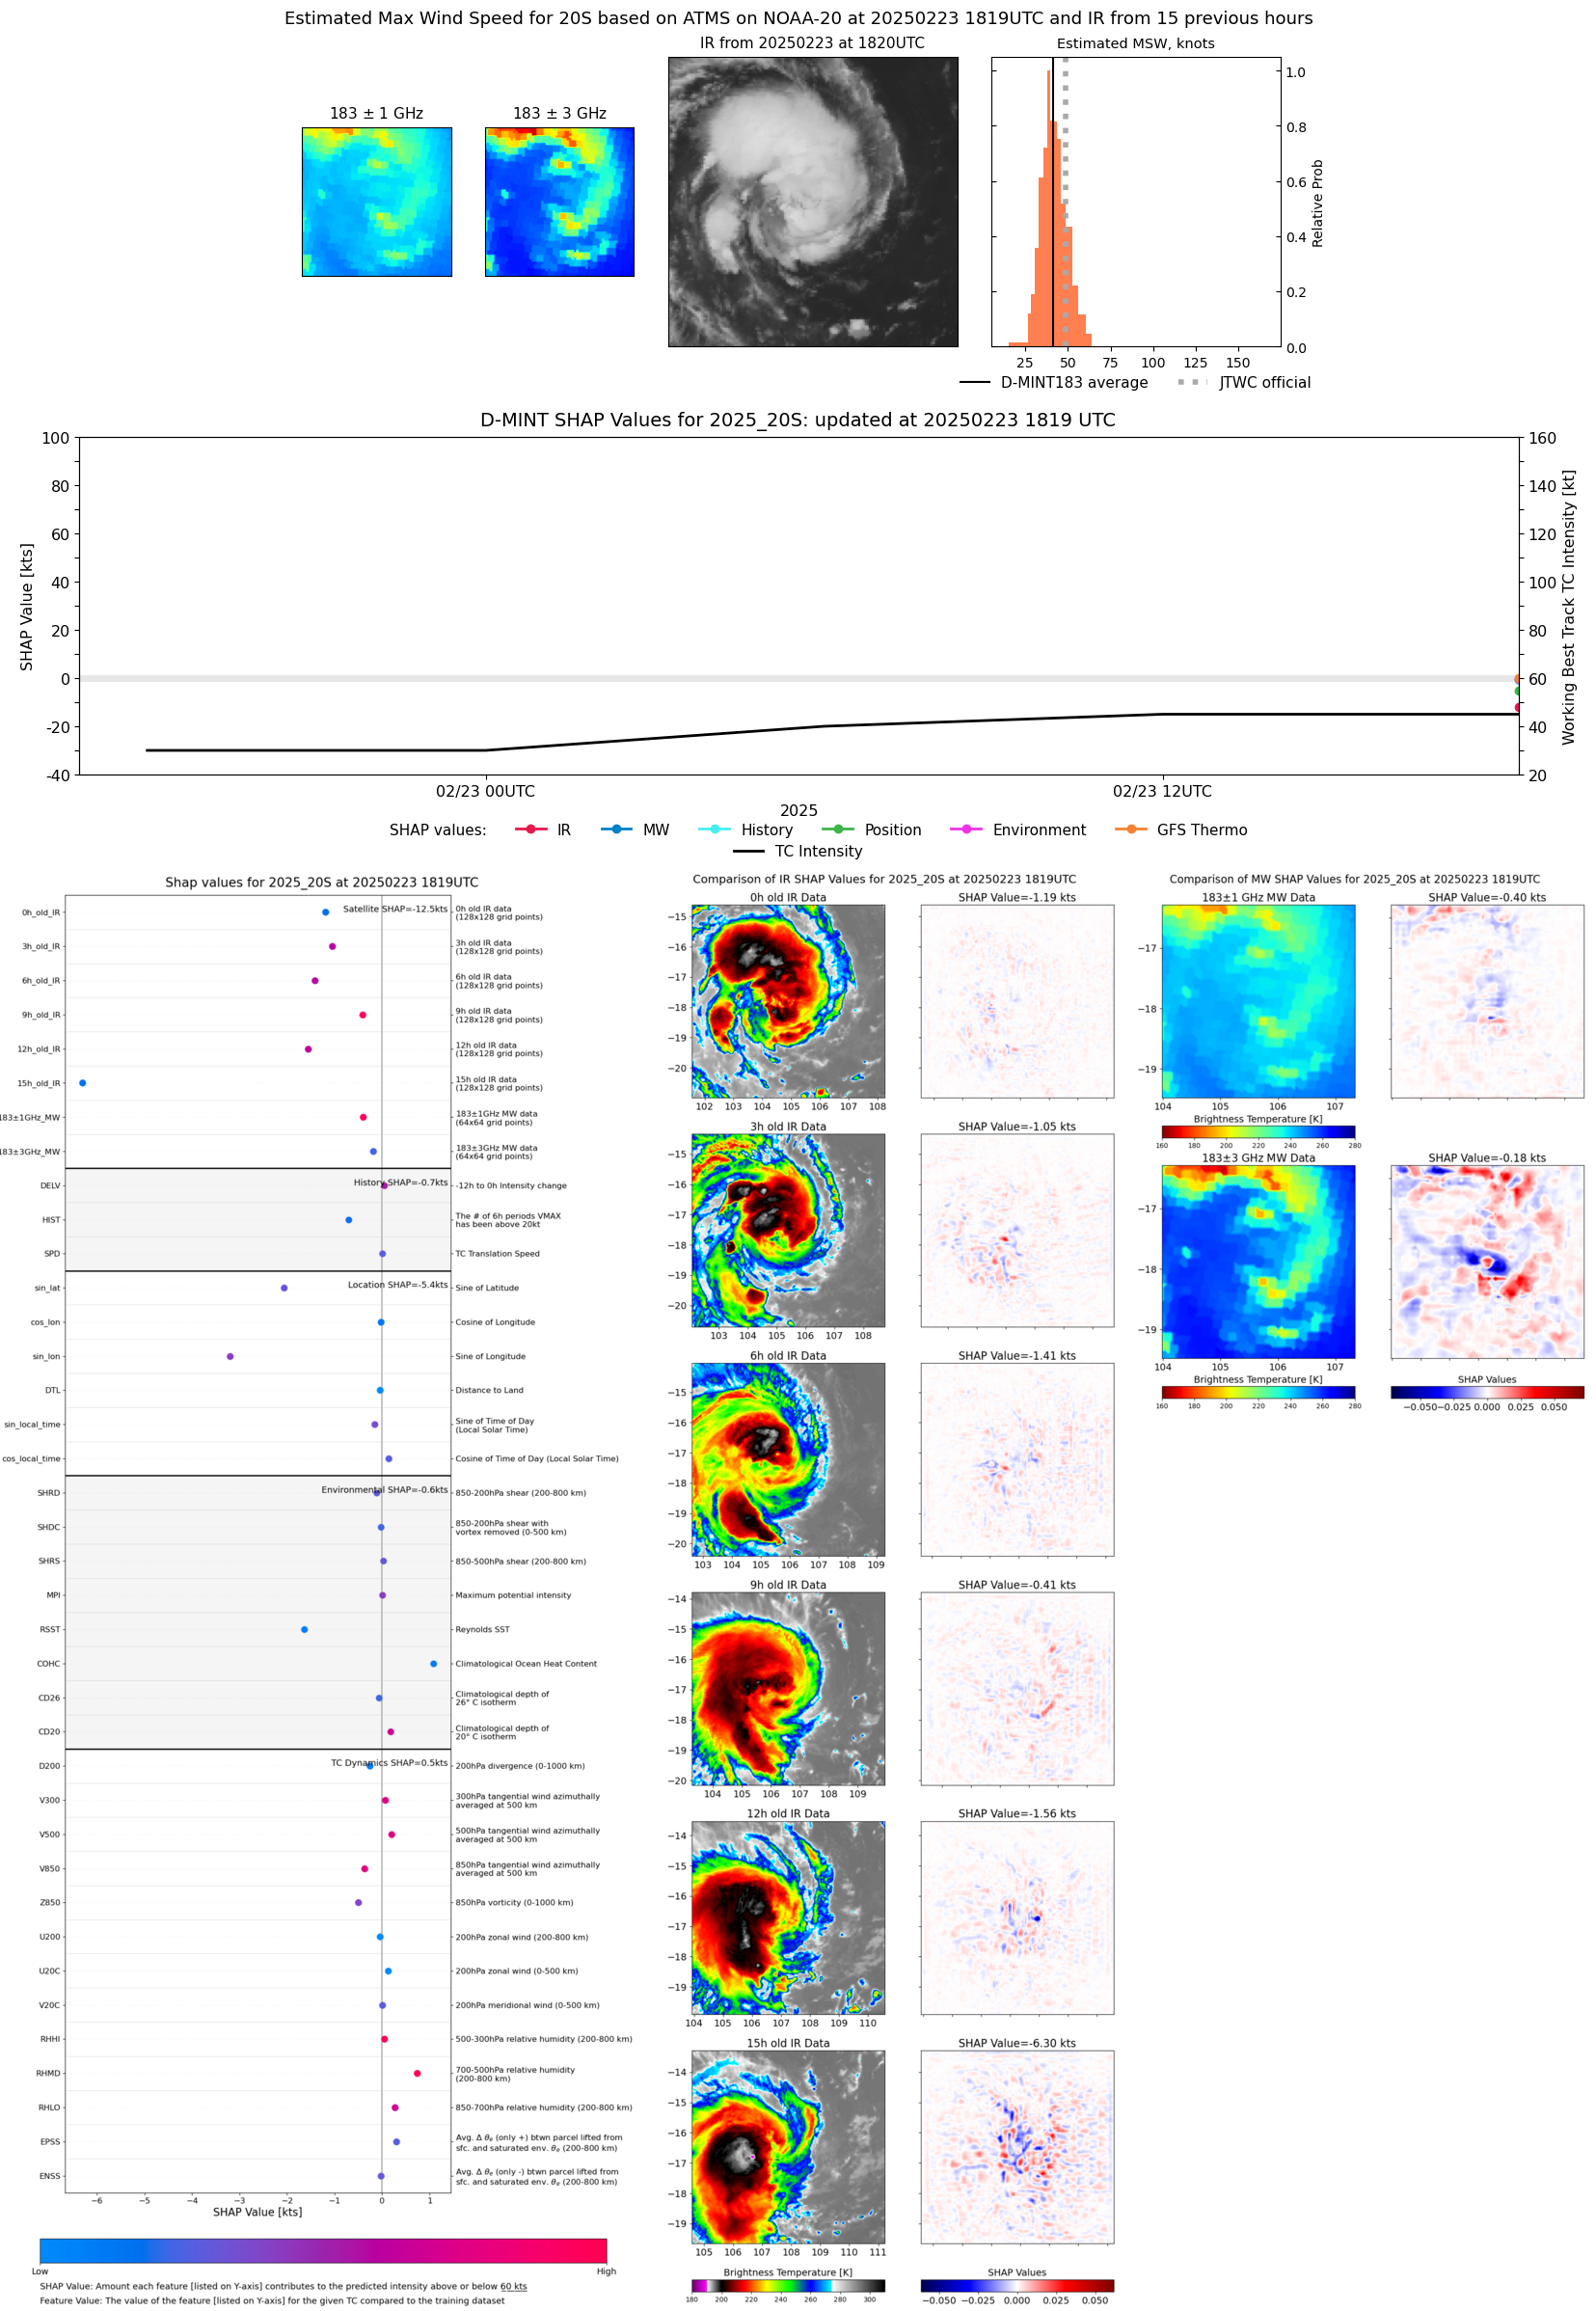 |
| 20250223 | 1138 UTC | SSMISF17 | 997 hPa | 38 kts | 33 kts | 43 kts |  |