|
||

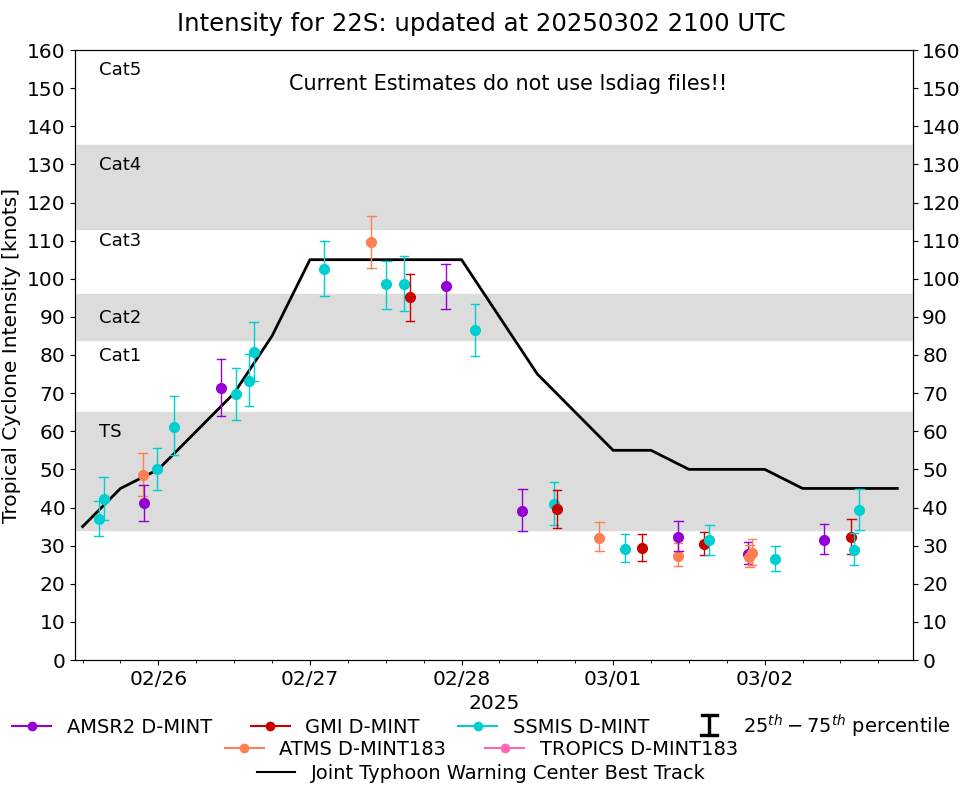 |
D-MINT HISTORY FILE for 2025_22S
| Date | Time | MW Sensor | MSLP | Vmax (30th-70th percentile average) | Vmax 25th percentile | Vmax 75th percentile | Image |
| 20250302 | 1459 UTC | SSMISF17 | NaN hPa | 39 kts | 34 kts | 45 kts |  |
| 20250302 | 1407 UTC | SSMISF16 | NaN hPa | 29 kts | 25 kts | 33 kts |  |
| 20250302 | 1343 UTC | GMI | NaN hPa | 32 kts | 28 kts | 37 kts | 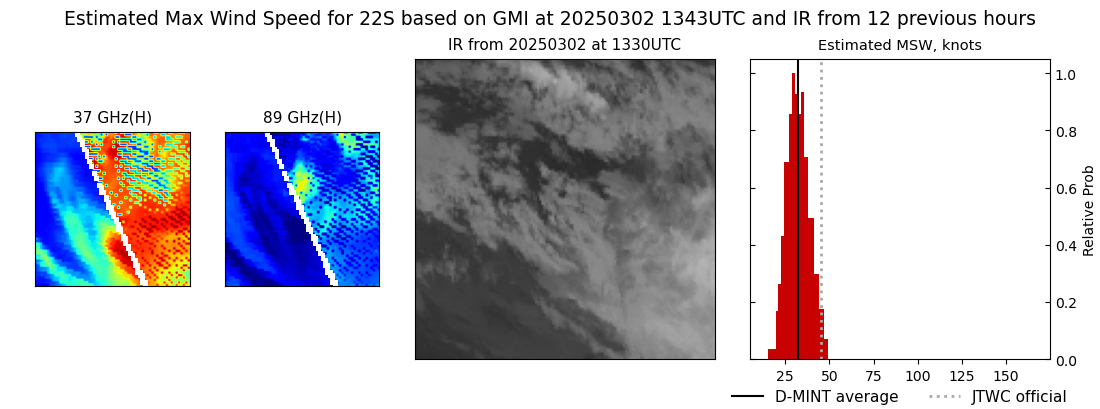 |
| 20250302 | 0924 UTC | AMSR2 | NaN hPa | 31 kts | 28 kts | 36 kts |  |
| 20250302 | 0142 UTC | SSMISF16 | NaN hPa | 26 kts | 23 kts | 30 kts |  |
| 20250301 | 2159 UTC | ATMS-N20 | NaN hPa | 28 kts | 25 kts | 32 kts |  |
| 20250301 | 2134 UTC | ATMS-N20 | NaN hPa | 27 kts | 24 kts | 30 kts |  |
| 20250301 | 2119 UTC | AMSR2 | NaN hPa | 28 kts | 25 kts | 31 kts |  |
| 20250301 | 1514 UTC | SSMISF17 | NaN hPa | 31 kts | 28 kts | 36 kts |  |
| 20250301 | 1423 UTC | GMI | NaN hPa | 30 kts | 27 kts | 34 kts | 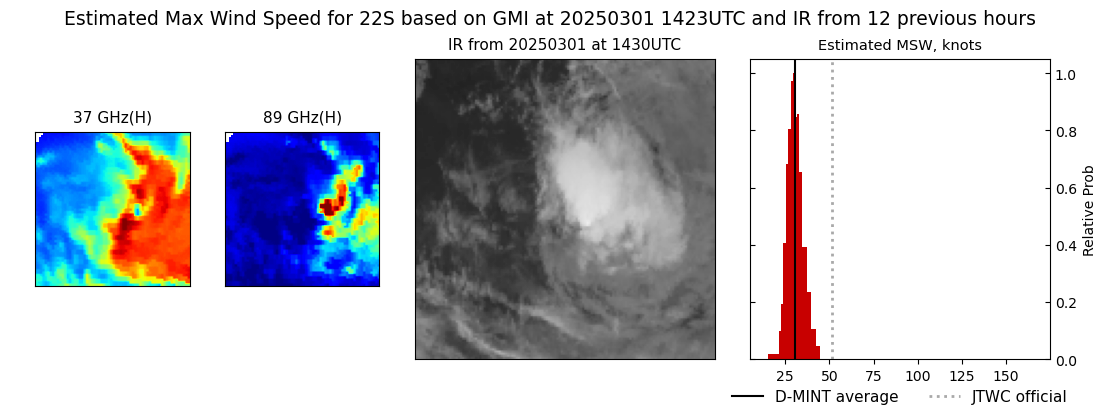 |
| 20250301 | 1020 UTC | AMSR2 | NaN hPa | 32 kts | 29 kts | 36 kts |  |
| 20250301 | 1017 UTC | ATMS-N20 | NaN hPa | 27 kts | 25 kts | 31 kts |  |
| 20250301 | 0433 UTC | GMI | 998 hPa | 29 kts | 26 kts | 33 kts | 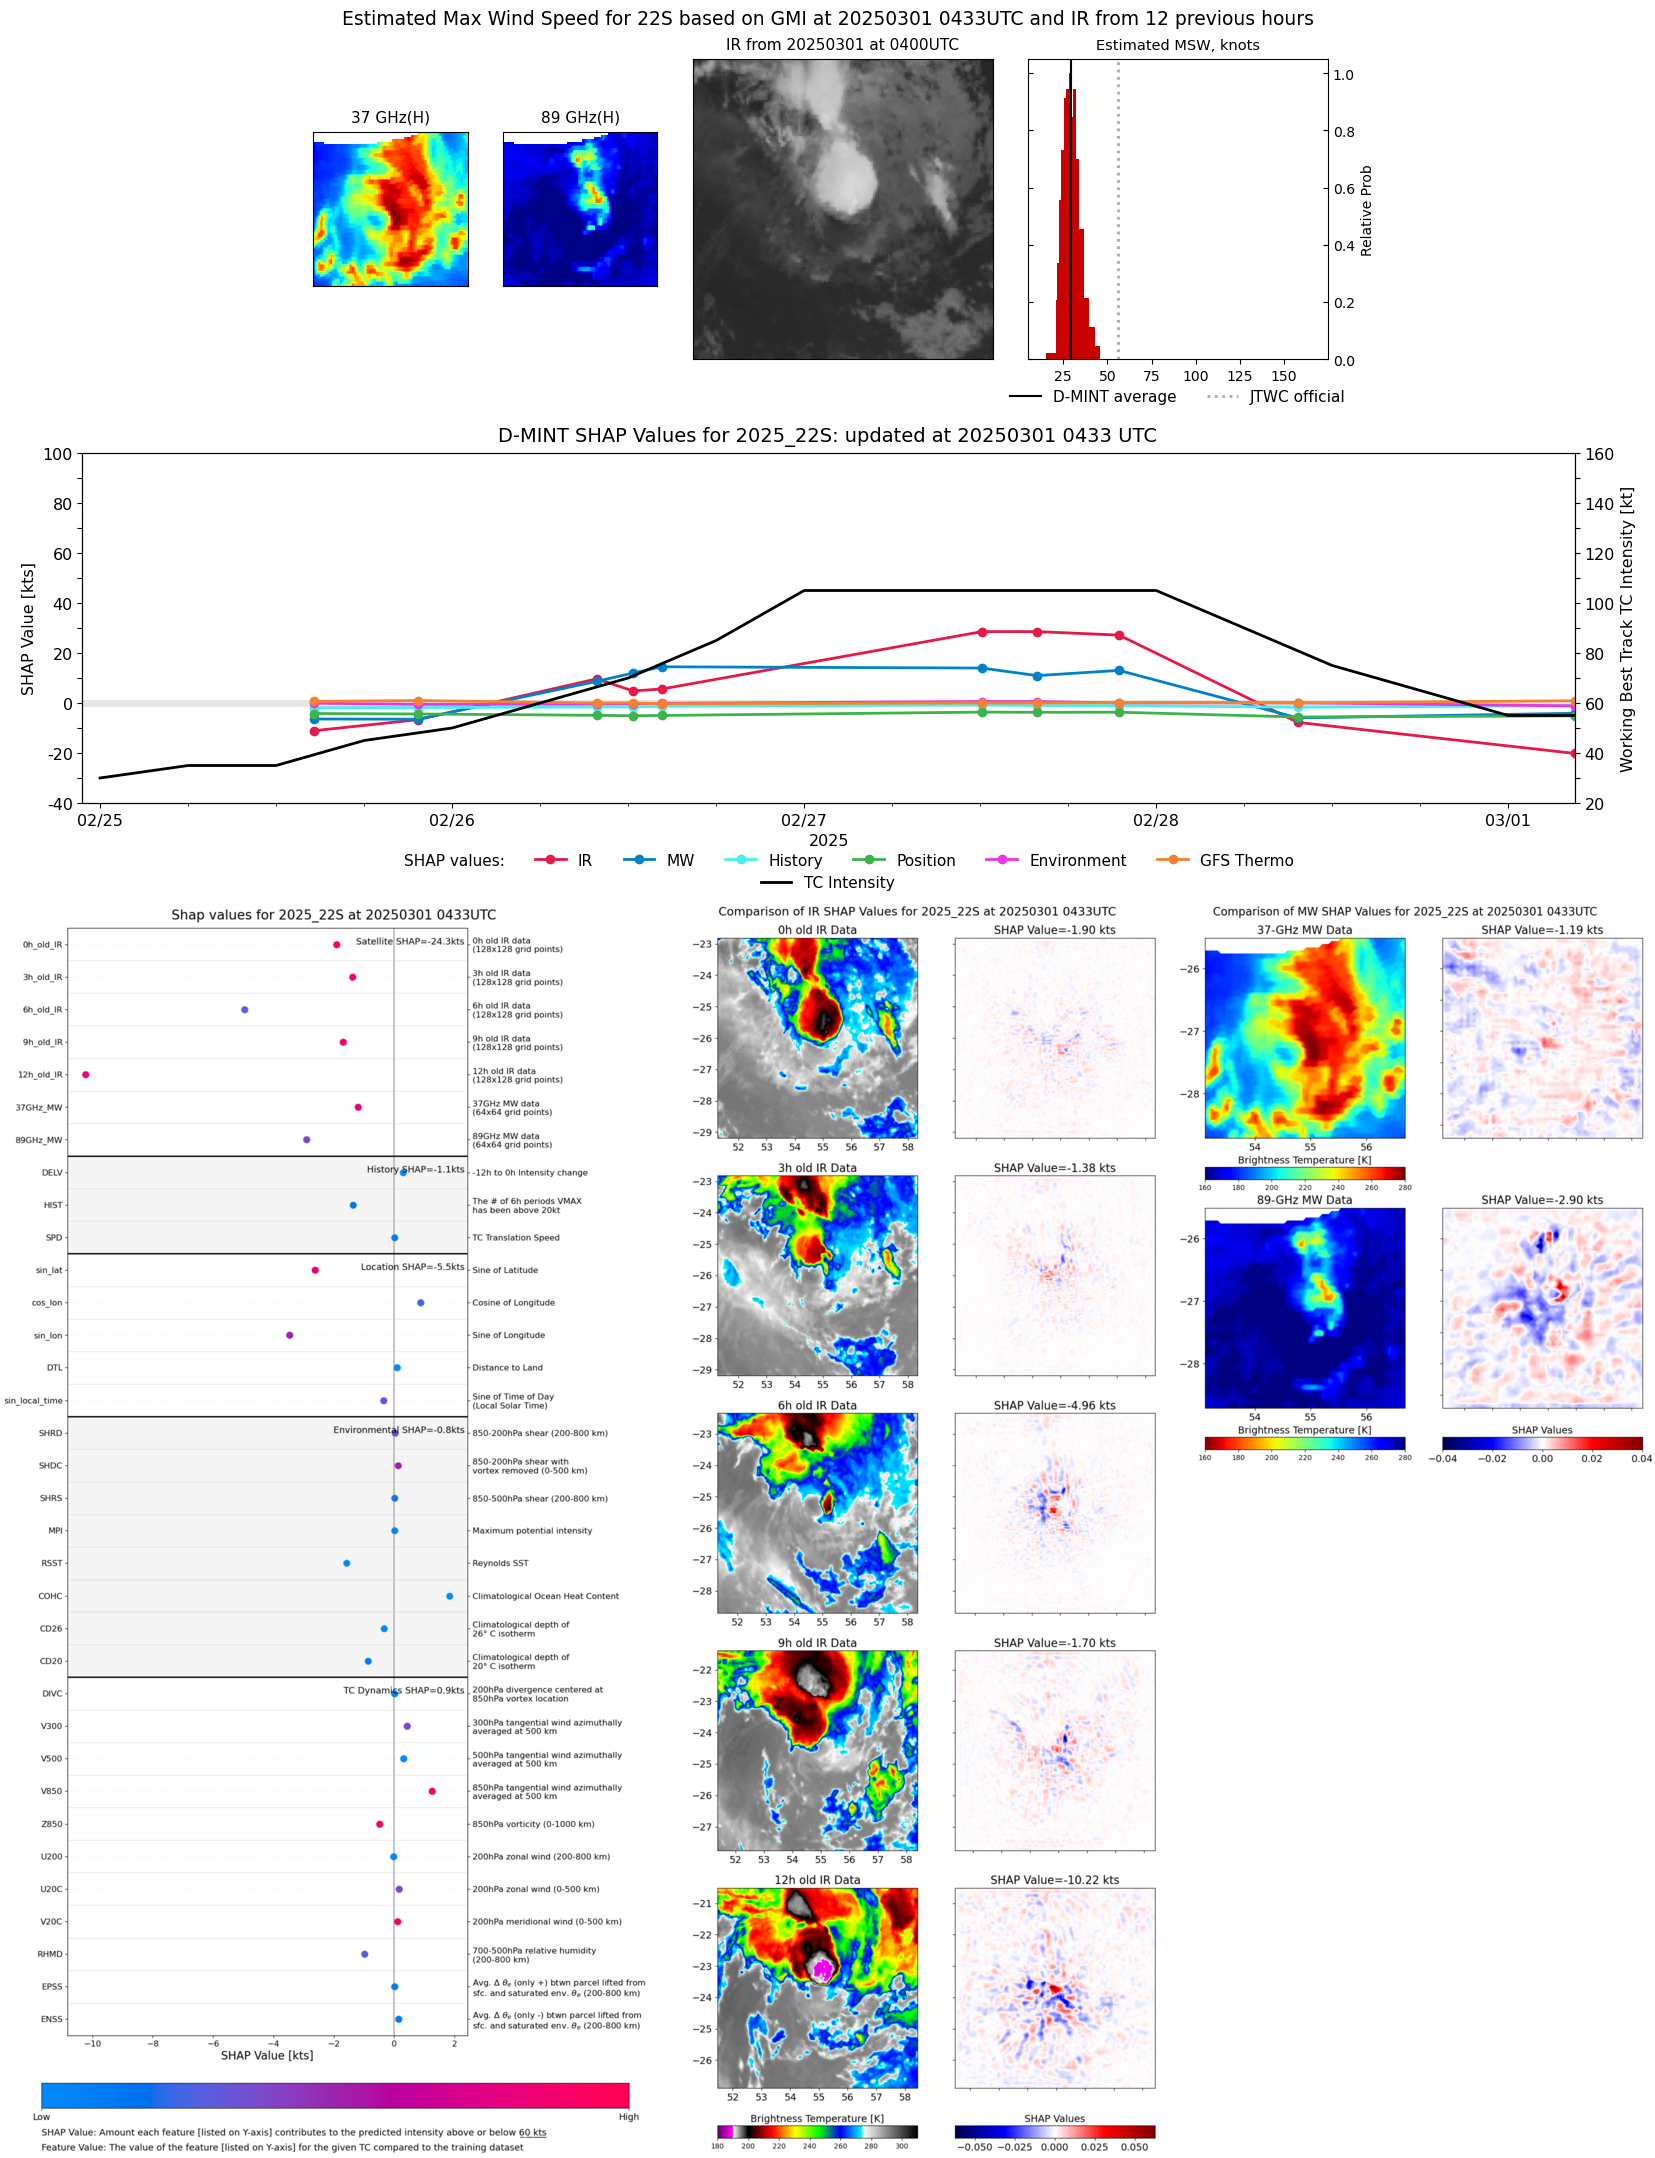 |
| 20250301 | 0154 UTC | SSMISF16 | 999 hPa | 29 kts | 26 kts | 33 kts |  |
| 20250228 | 2150 UTC | ATMS-N20 | 996 hPa | 32 kts | 28 kts | 36 kts |  |
| 20250228 | 1508 UTC | GMI | 993 hPa | 40 kts | 35 kts | 45 kts | 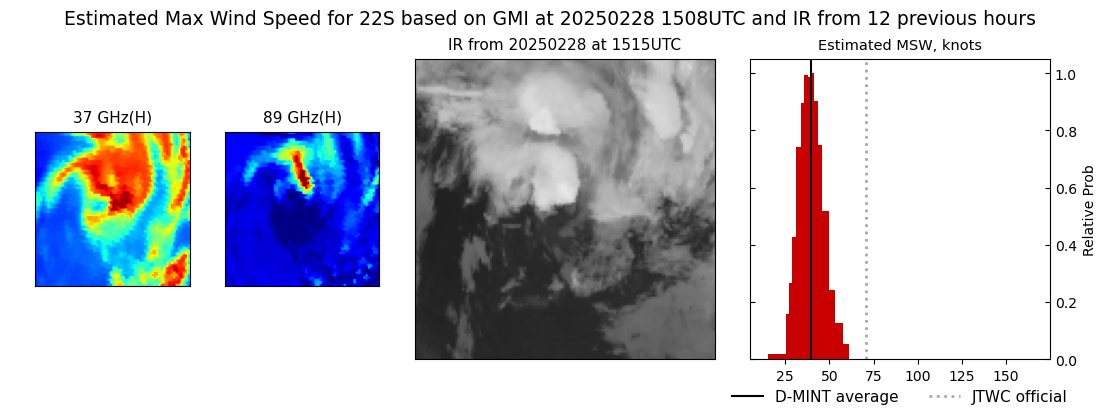 |
| 20250228 | 1437 UTC | SSMISF16 | 992 hPa | 41 kts | 35 kts | 47 kts |  |
| 20250228 | 0939 UTC | AMSR2 | 988 hPa | 39 kts | 34 kts | 45 kts |  |
| 20250228 | 0206 UTC | SSMISF16 | 963 hPa | 87 kts | 80 kts | 93 kts |  |
| 20250227 | 2128 UTC | AMSR2 | 951 hPa | 98 kts | 92 kts | 104 kts |  |
| 20250227 | 1553 UTC | GMI | 948 hPa | 95 kts | 89 kts | 101 kts | 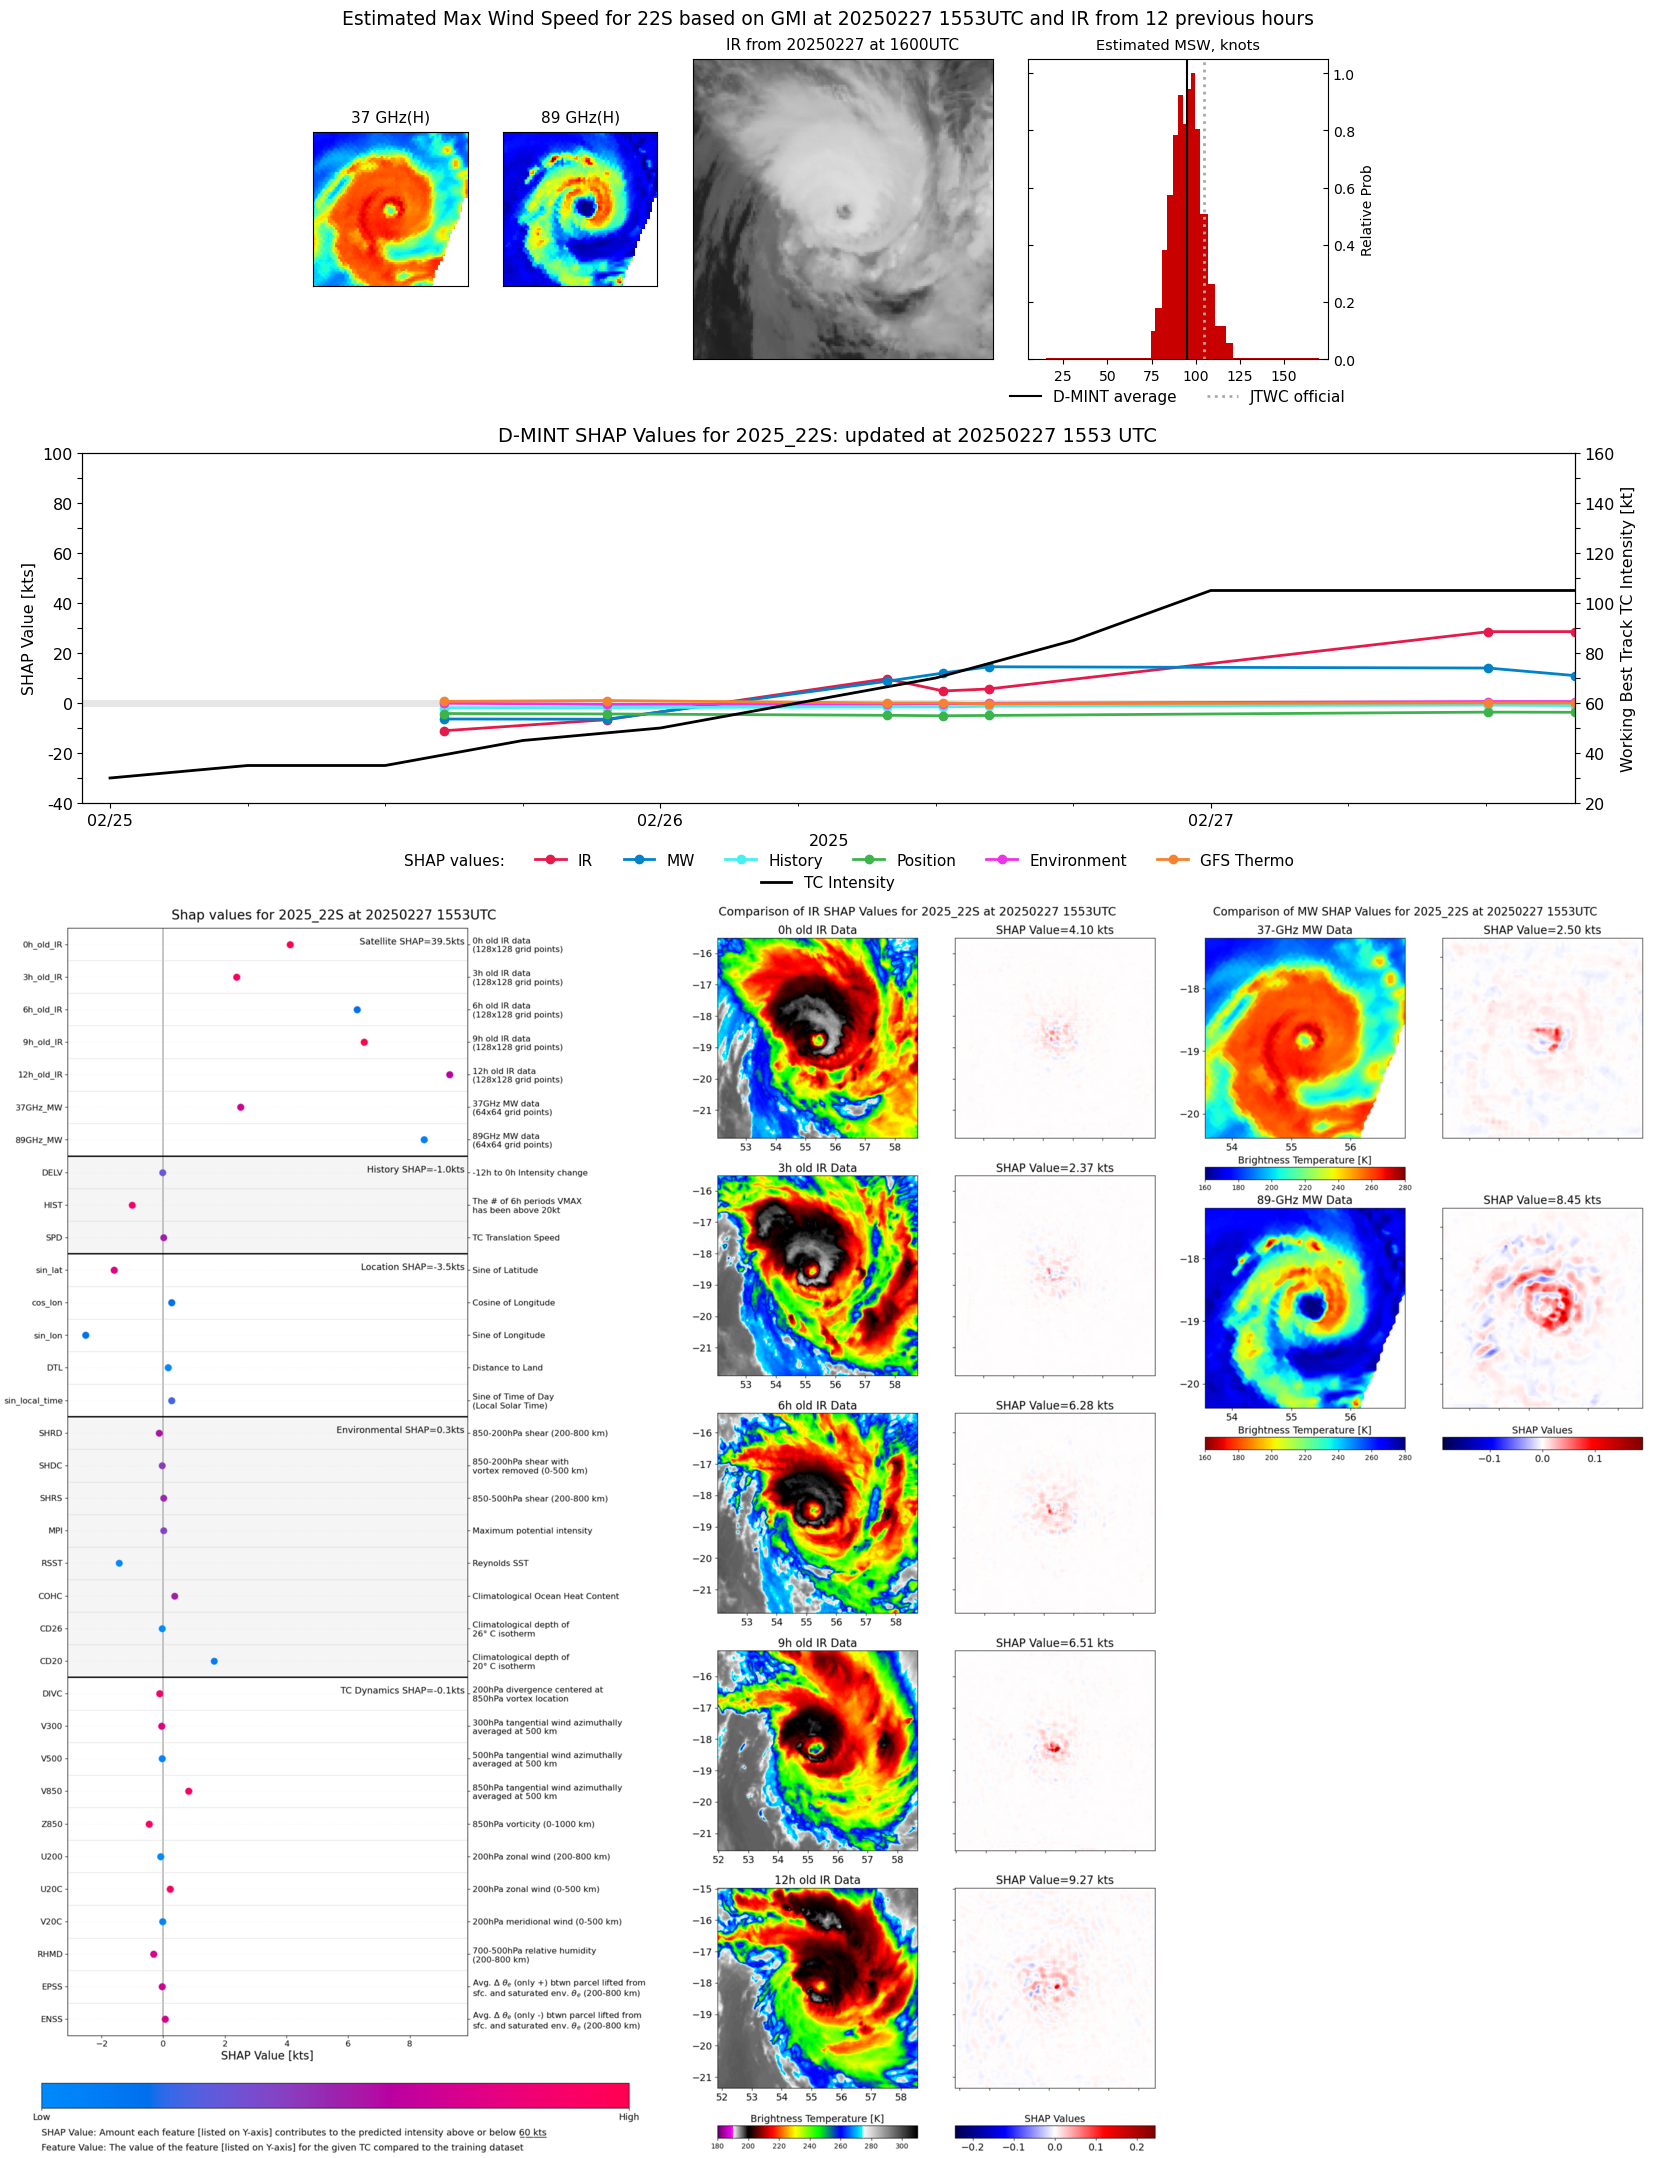 |
| 20250227 | 1451 UTC | SSMISF16 | 949 hPa | 99 kts | 91 kts | 106 kts |  |
| 20250227 | 1206 UTC | SSMISF18 | 950 hPa | 99 kts | 92 kts | 105 kts |  |
| 20250227 | 0943 UTC | ATMS-N20 | 951 hPa | 110 kts | 103 kts | 116 kts |  |
| 20250227 | 0218 UTC | SSMISF16 | 952 hPa | 103 kts | 95 kts | 110 kts |  |
| 20250226 | 1505 UTC | SSMISF16 | 974 hPa | 81 kts | 73 kts | 89 kts |  |
| 20250226 | 1419 UTC | SSMISF17 | 976 hPa | 73 kts | 66 kts | 80 kts |  |
| 20250226 | 1220 UTC | SSMISF18 | 979 hPa | 70 kts | 63 kts | 76 kts |  |
| 20250226 | 0952 UTC | AMSR2 | 975 hPa | 71 kts | 64 kts | 79 kts |  |
| 20250226 | 0231 UTC | SSMISF16 | 984 hPa | 61 kts | 54 kts | 69 kts |  |
| 20250225 | 2346 UTC | SSMISF18 | 990 hPa | 50 kts | 45 kts | 56 kts |  |
| 20250225 | 2140 UTC | AMSR2 | 998 hPa | 41 kts | 37 kts | 46 kts |  |
| 20250225 | 2131 UTC | ATMS-N20 | 989 hPa | 48 kts | 43 kts | 54 kts |  |
| 20250225 | 1519 UTC | SSMISF16 | 998 hPa | 42 kts | 37 kts | 48 kts |  |
| 20250225 | 1433 UTC | SSMISF17 | 996 hPa | 37 kts | 32 kts | 42 kts |  |
| 20250225 | 0955 UTC | ATMS-N20 | 998 hPa | 39 kts | 35 kts | 44 kts |  |