|
||

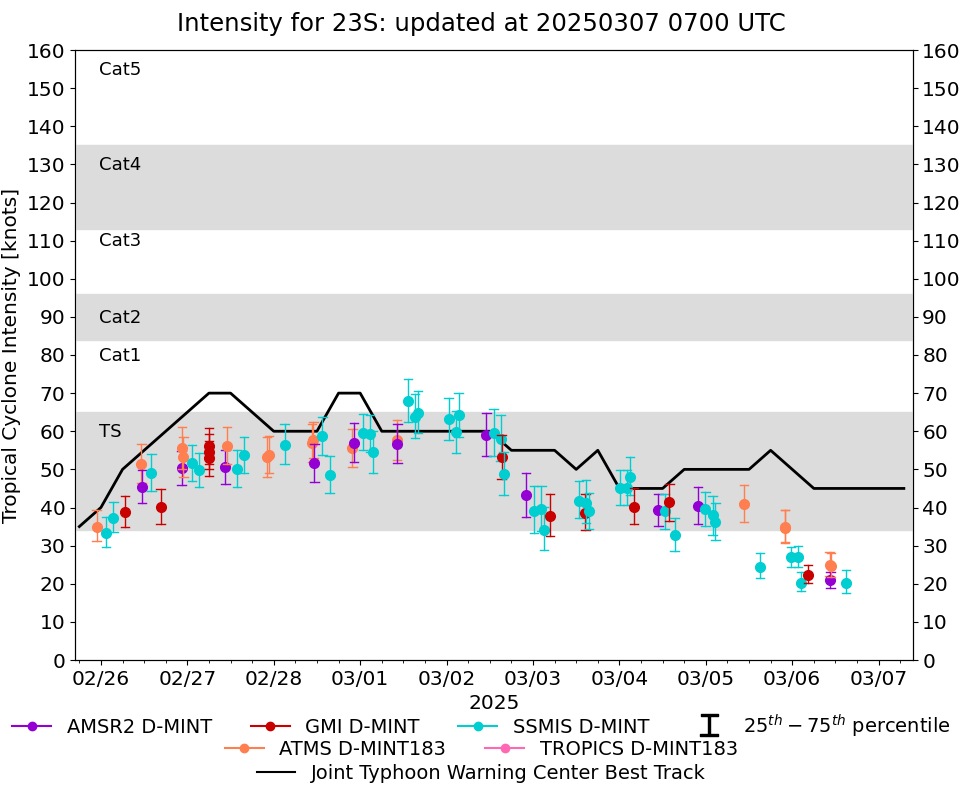 |
D-MINT HISTORY FILE for 2025_23S
| Date | Time | MW Sensor | MSLP | Vmax (30th-70th percentile average) | Vmax 25th percentile | Vmax 75th percentile | Image |
| 20250306 | 1452 UTC | SSMISF16 | 1012 hPa | 20 kts | 18 kts | 24 kts |  |
| 20250306 | 1047 UTC | ATMS-N20 | 1010 hPa | 25 kts | 22 kts | 28 kts |  |
| 20250306 | 1036 UTC | AMSR2 | 1011 hPa | 21 kts | 19 kts | 23 kts |  |
| 20250306 | 1022 UTC | ATMS-N20 | 1011 hPa | 25 kts | 22 kts | 28 kts |  |
| 20250306 | 0418 UTC | GMI | 1010 hPa | 22 kts | 20 kts | 25 kts | 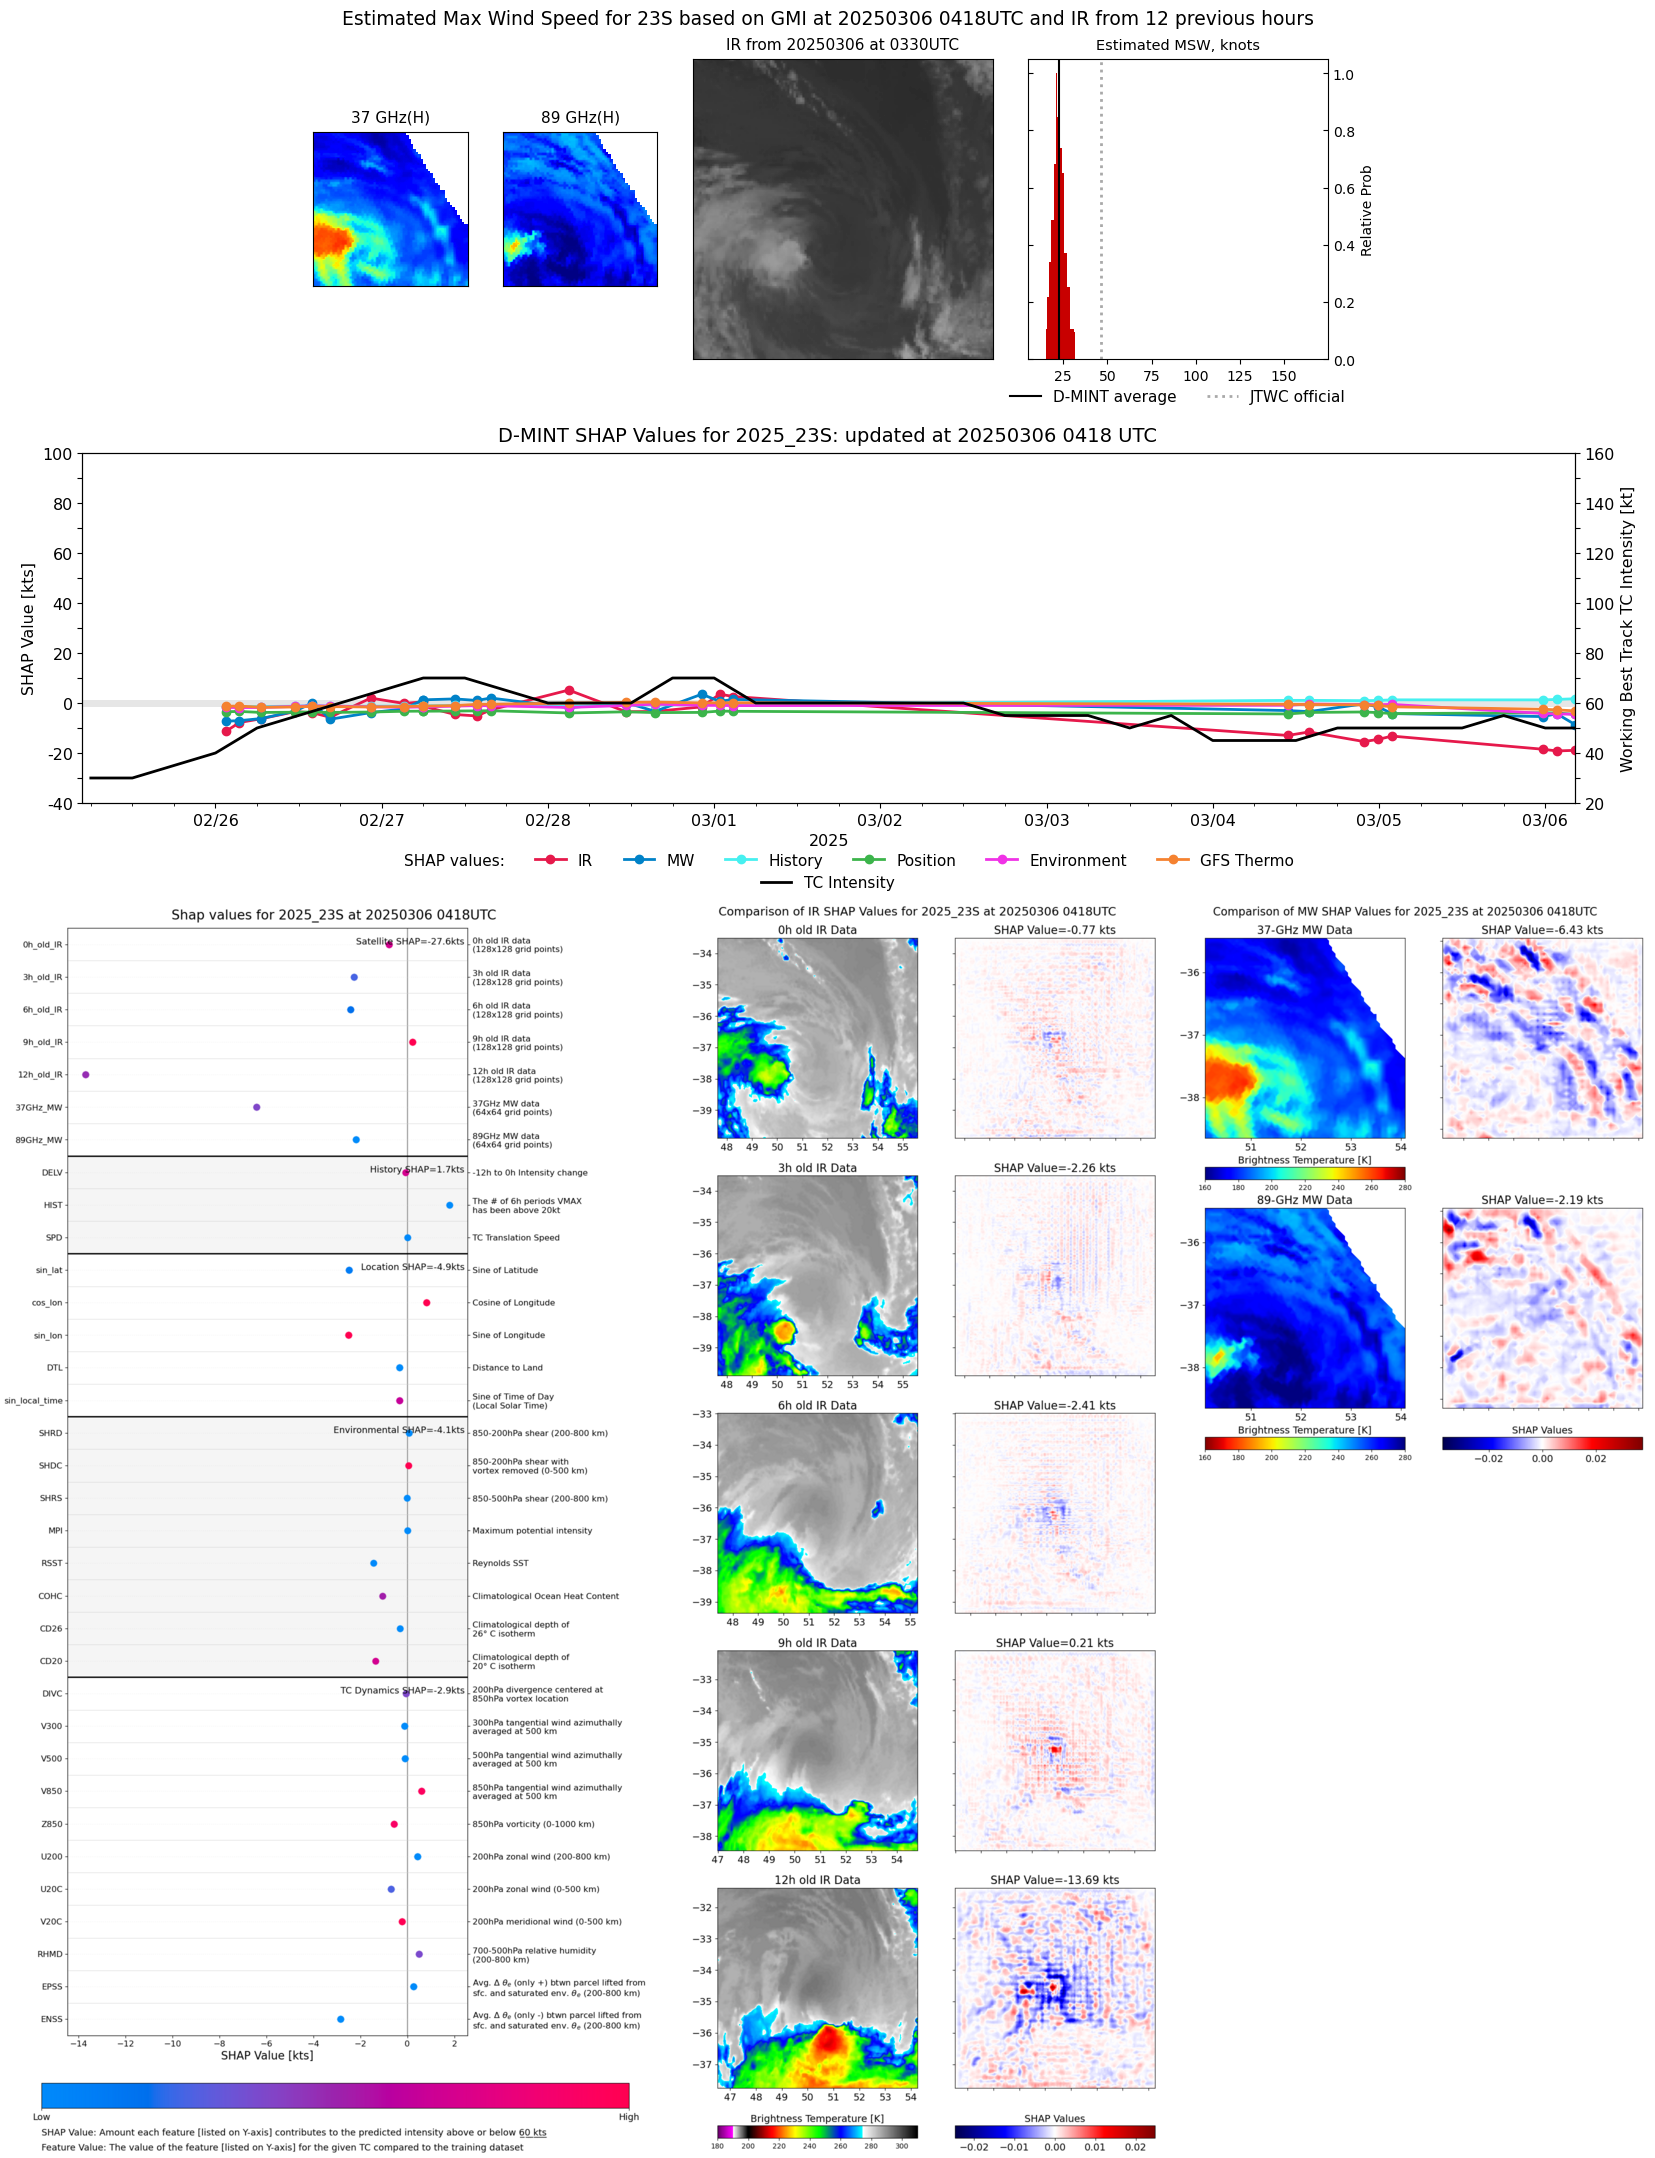 |
| 20250306 | 0228 UTC | SSMISF16 | 1010 hPa | 20 kts | 18 kts | 23 kts |  |
| 20250306 | 0140 UTC | SSMISF17 | 1011 hPa | 27 kts | 24 kts | 30 kts |  |
| 20250305 | 2341 UTC | SSMISF18 | 1010 hPa | 27 kts | 24 kts | 30 kts |  |
| 20250305 | 2200 UTC | ATMS-N20 | 1005 hPa | 35 kts | 31 kts | 39 kts | 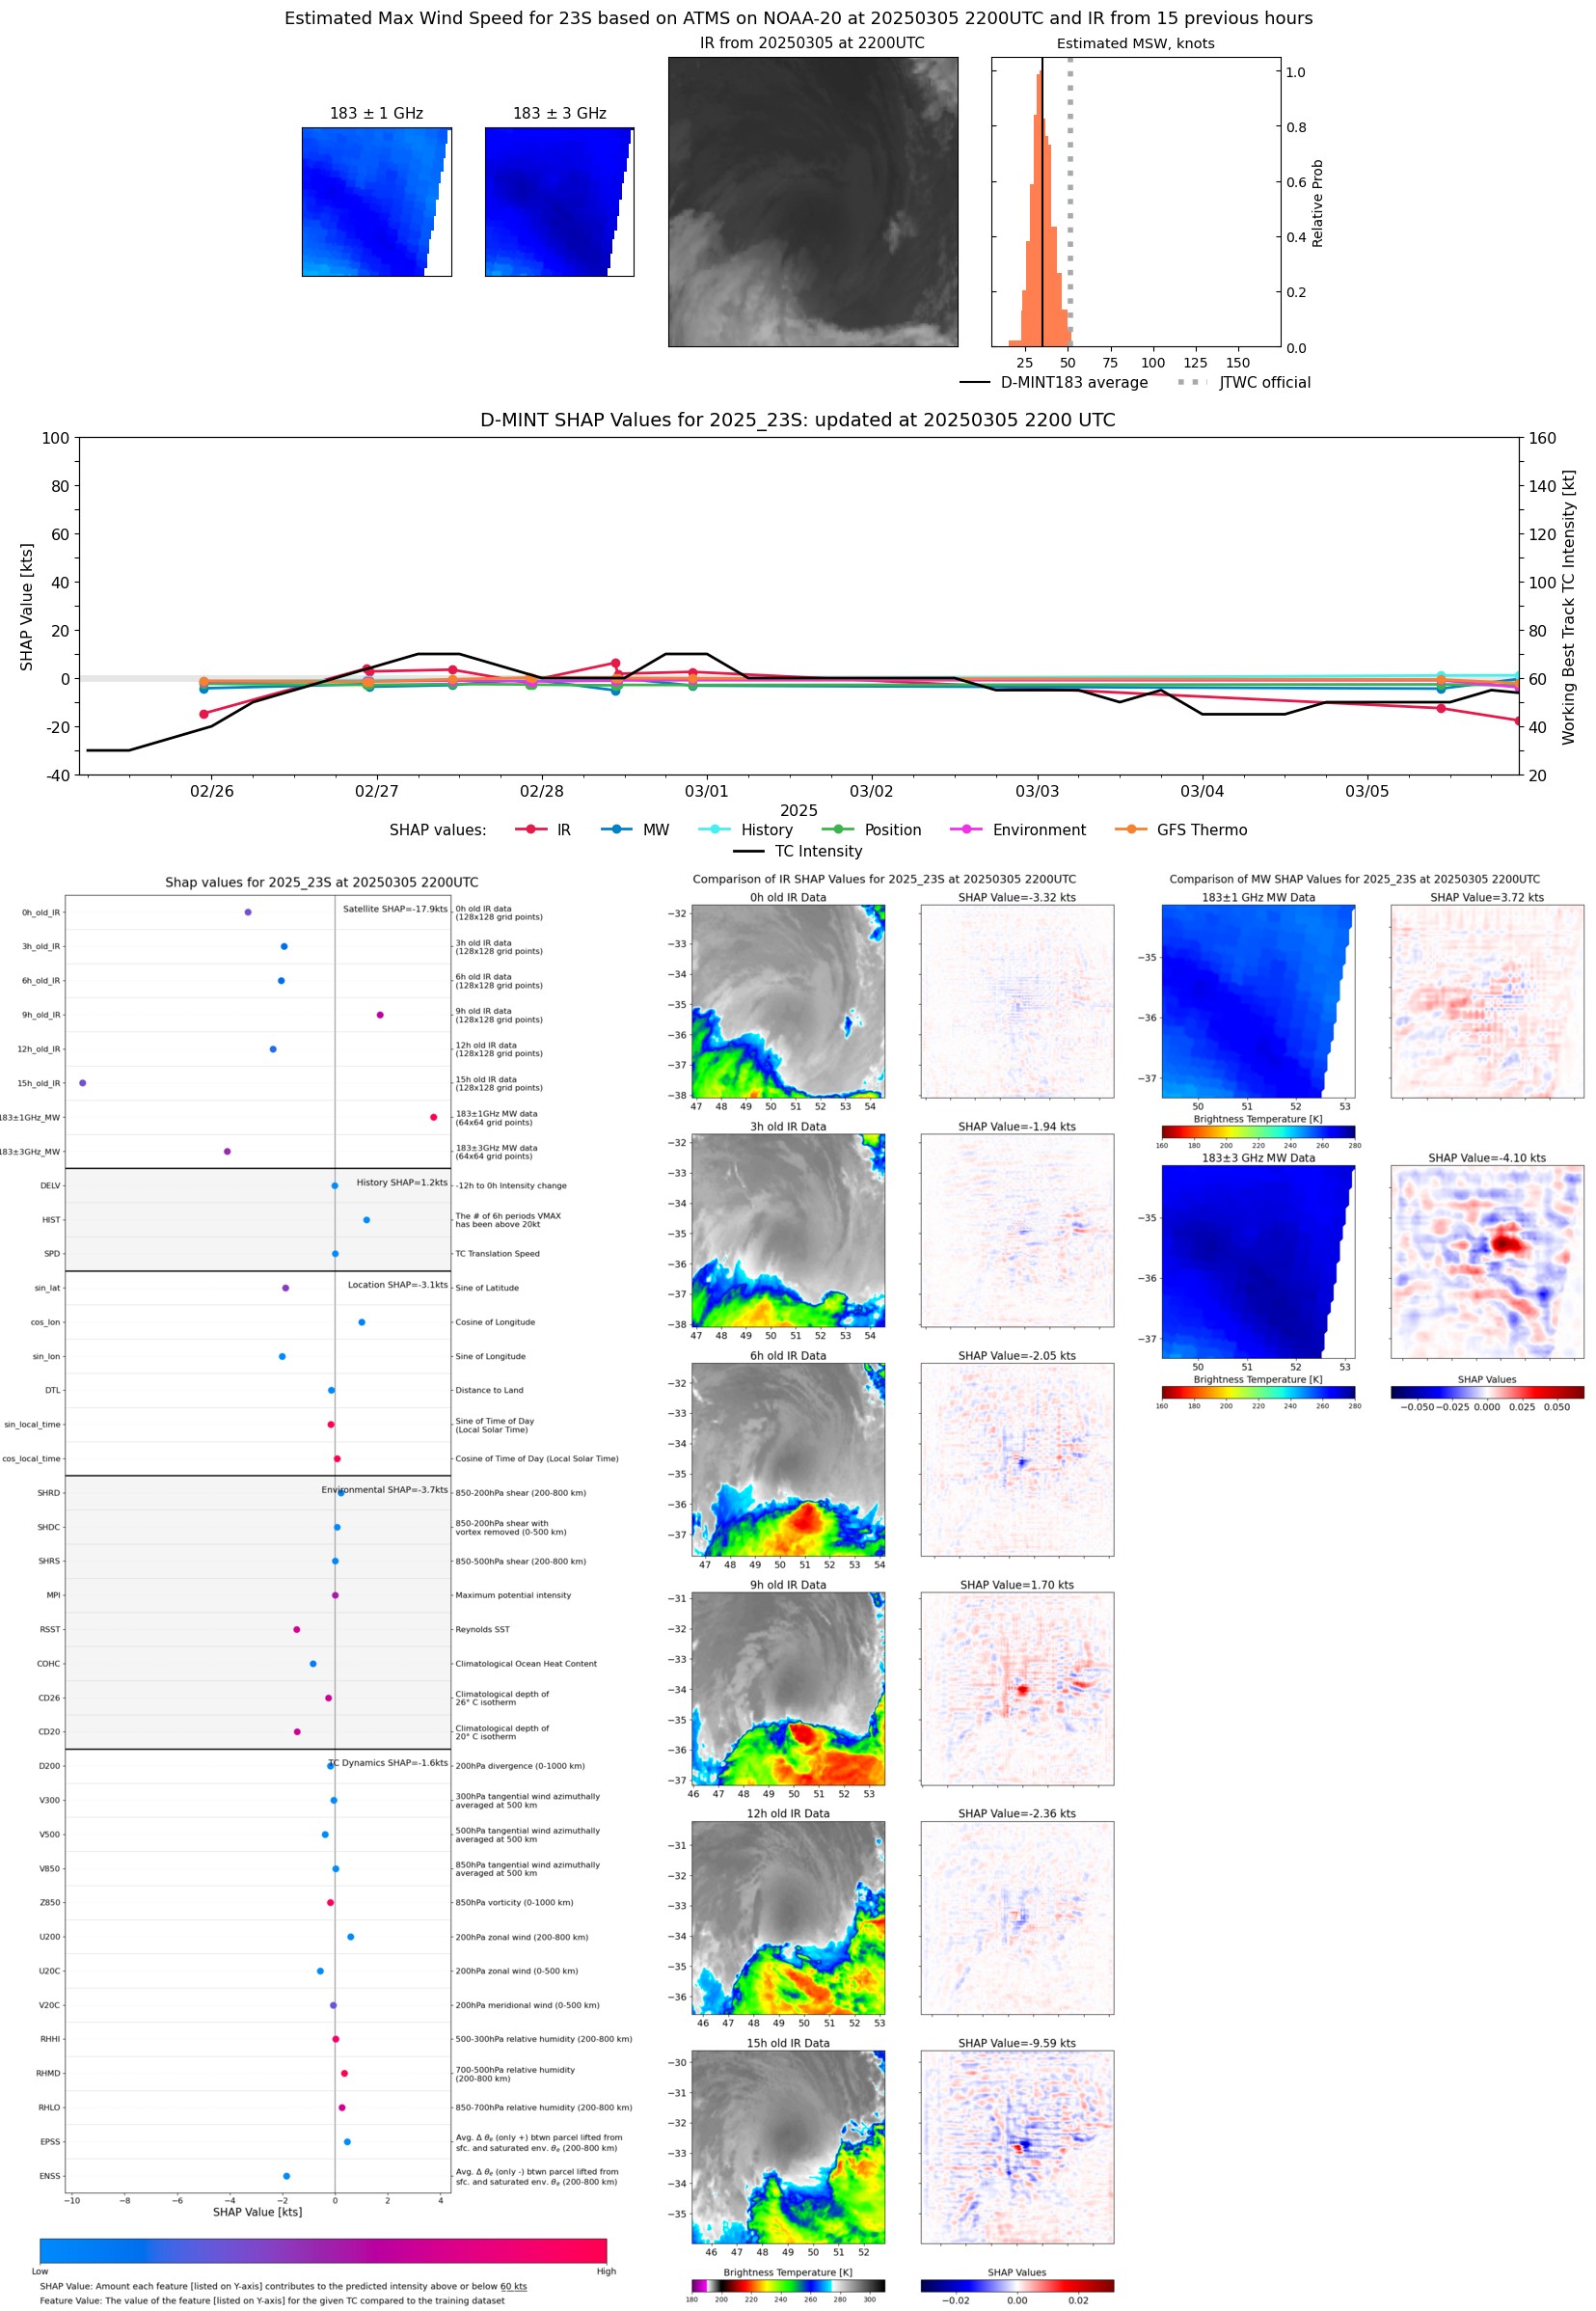 |
| 20250305 | 2159 UTC | ATMS-N20 | 1005 hPa | 35 kts | 31 kts | 39 kts |  |
| 20250305 | 1507 UTC | SSMISF16 | 1005 hPa | 24 kts | 22 kts | 28 kts |  |
| 20250305 | 1041 UTC | ATMS-N20 | 998 hPa | 41 kts | 36 kts | 46 kts |  |
| 20250305 | 0241 UTC | SSMISF16 | 998 hPa | 36 kts | 31 kts | 41 kts | 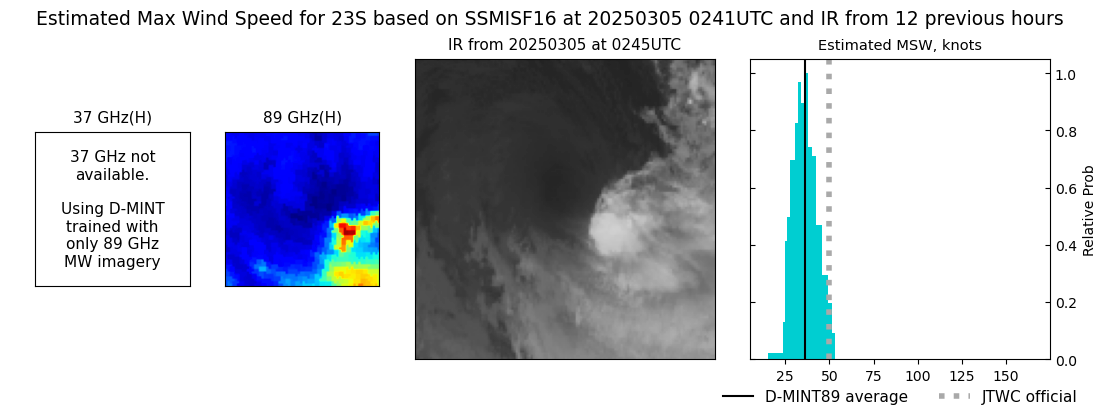 |
| 20250305 | 0153 UTC | SSMISF17 | 993 hPa | 38 kts | 33 kts | 43 kts |  |
| 20250304 | 2354 UTC | SSMISF18 | 994 hPa | 40 kts | 35 kts | 44 kts |  |
| 20250304 | 2150 UTC | AMSR2 | 997 hPa | 41 kts | 36 kts | 45 kts |  |
| 20250304 | 1521 UTC | SSMISF16 | 999 hPa | 33 kts | 28 kts | 37 kts |  |
| 20250304 | 1353 UTC | GMI | 993 hPa | 41 kts | 37 kts | 46 kts | 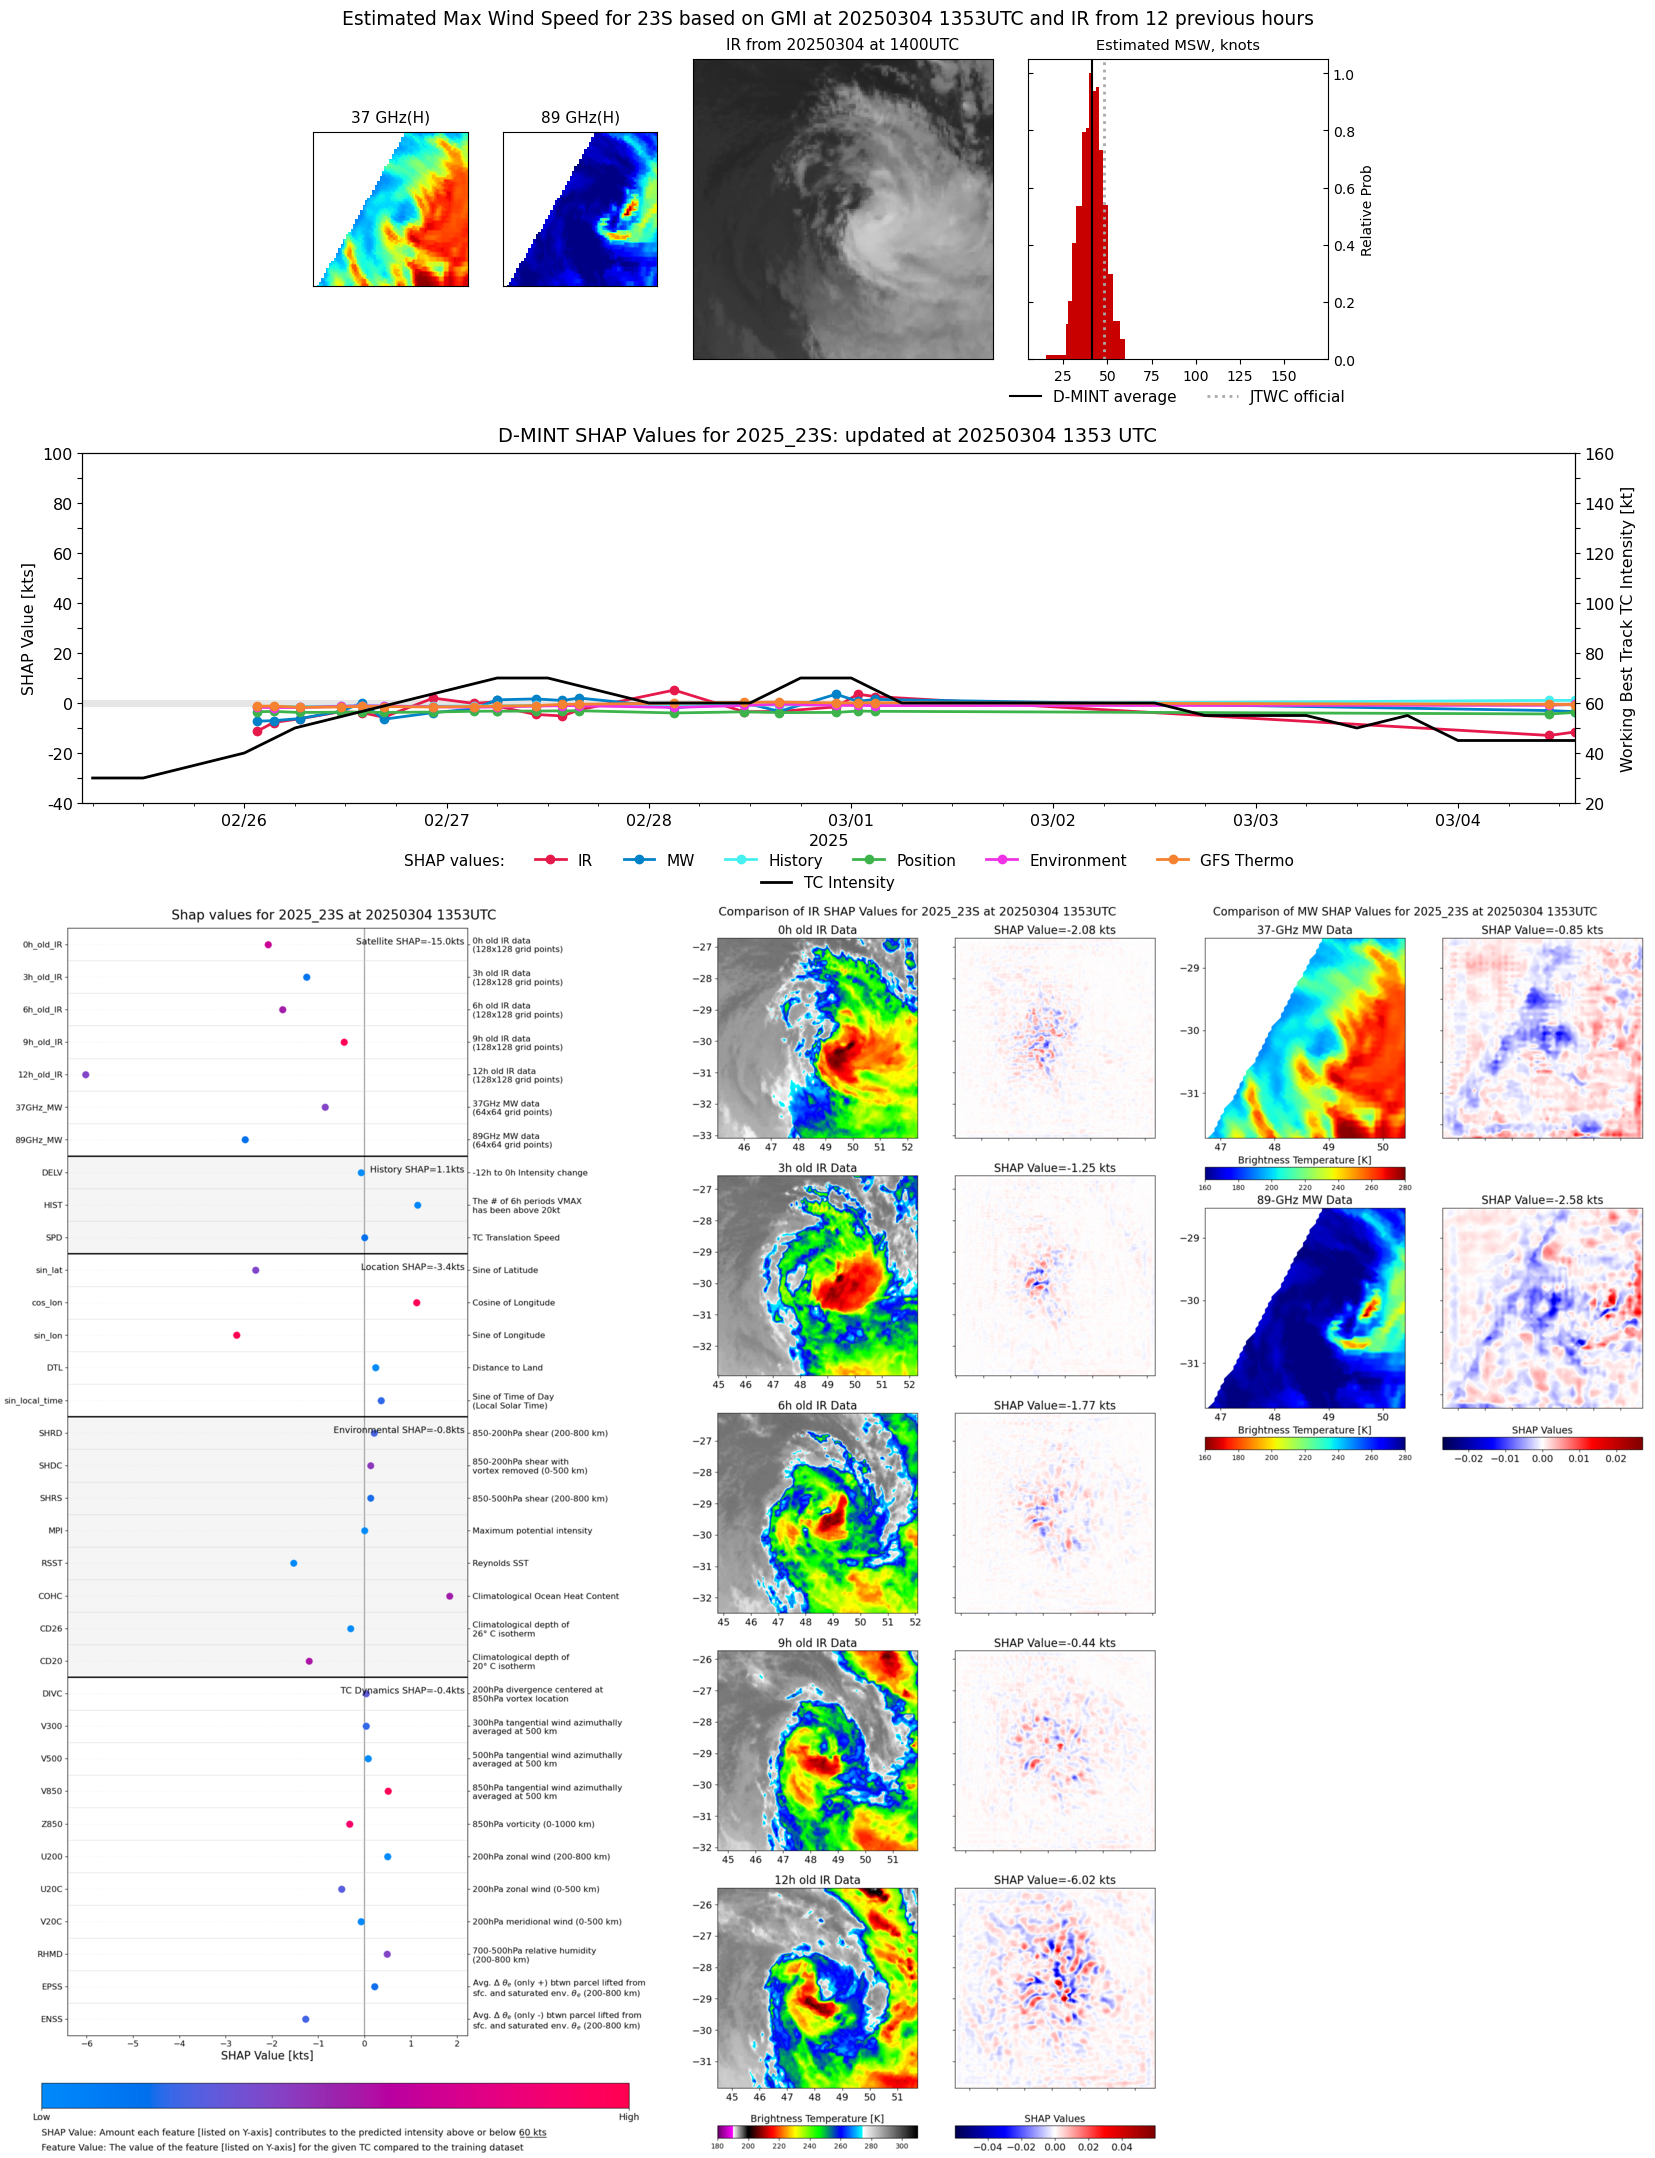 |
| 20250304 | 1234 UTC | SSMISF18 | 995 hPa | 39 kts | 34 kts | 44 kts |  |
| 20250304 | 1051 UTC | AMSR2 | 995 hPa | 39 kts | 35 kts | 44 kts |  |
| 20250304 | 0403 UTC | GMI | NaN hPa | 40 kts | 36 kts | 45 kts | 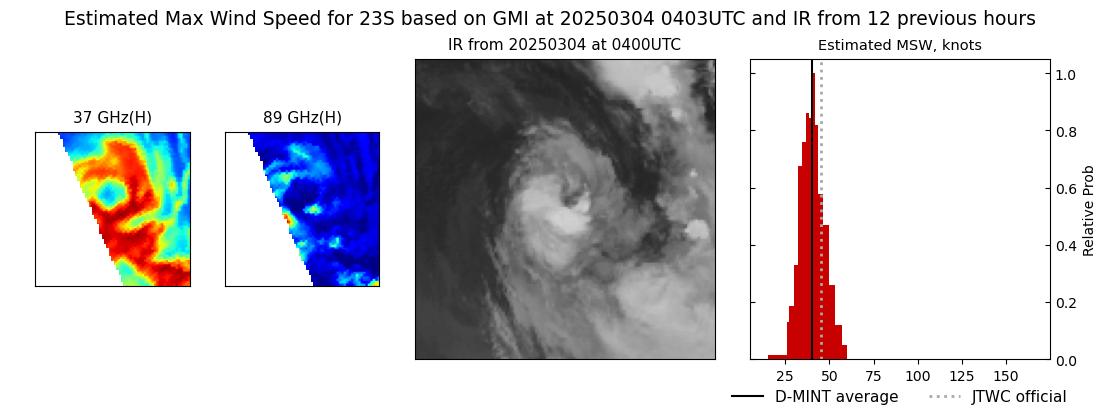 |
| 20250304 | 0254 UTC | SSMISF16 | NaN hPa | 48 kts | 43 kts | 53 kts |  |
| 20250304 | 0206 UTC | SSMISF17 | NaN hPa | 45 kts | 41 kts | 50 kts |  |
| 20250304 | 0006 UTC | SSMISF18 | NaN hPa | 45 kts | 41 kts | 50 kts |  |
| 20250303 | 1536 UTC | SSMISF16 | NaN hPa | 39 kts | 34 kts | 44 kts | 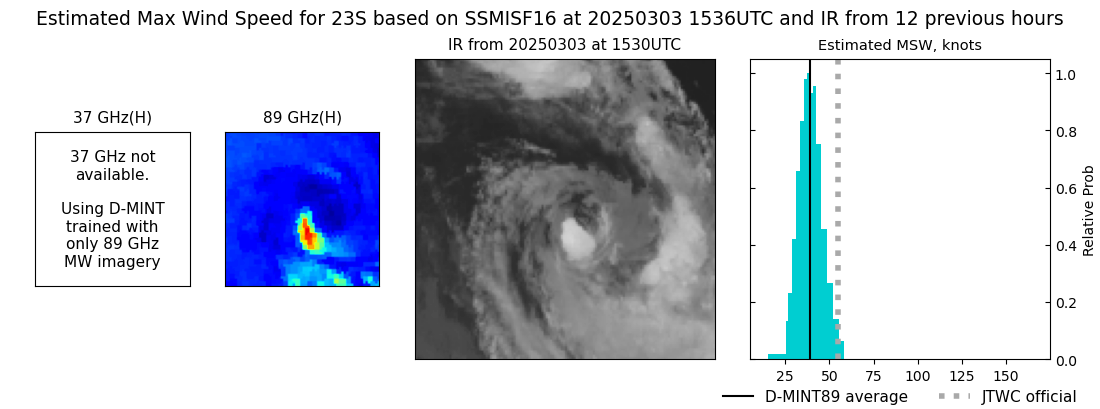 |
| 20250303 | 1448 UTC | SSMISF17 | NaN hPa | 41 kts | 36 kts | 47 kts |  |
| 20250303 | 1433 UTC | GMI | NaN hPa | 39 kts | 34 kts | 43 kts |  |
| 20250303 | 1249 UTC | SSMISF18 | NaN hPa | 42 kts | 37 kts | 47 kts |  |
| 20250303 | 0443 UTC | GMI | NaN hPa | 38 kts | 33 kts | 44 kts |  |
| 20250303 | 0307 UTC | SSMISF16 | NaN hPa | 34 kts | 29 kts | 40 kts | 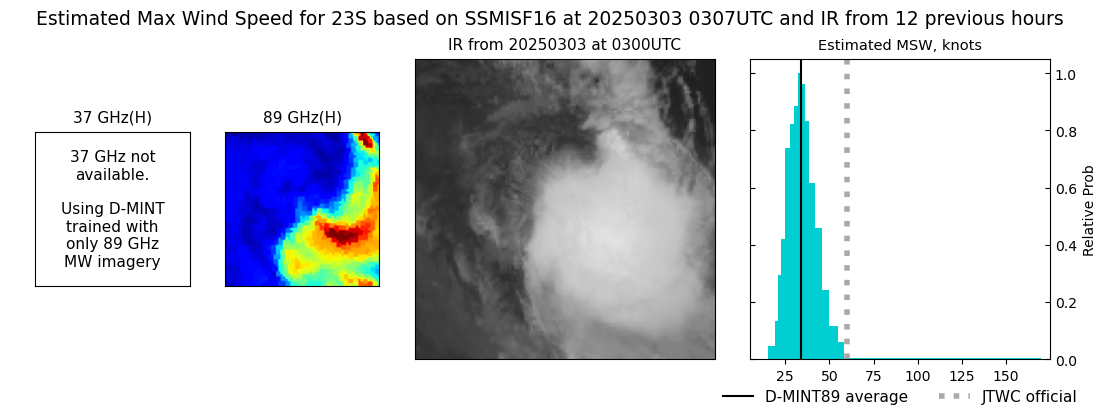 |
| 20250303 | 0219 UTC | SSMISF17 | NaN hPa | 40 kts | 34 kts | 46 kts |  |
| 20250303 | 0020 UTC | SSMISF18 | NaN hPa | 39 kts | 33 kts | 46 kts |  |
| 20250302 | 2201 UTC | AMSR2 | NaN hPa | 43 kts | 38 kts | 49 kts |  |
| 20250302 | 1550 UTC | SSMISF16 | NaN hPa | 49 kts | 43 kts | 54 kts | 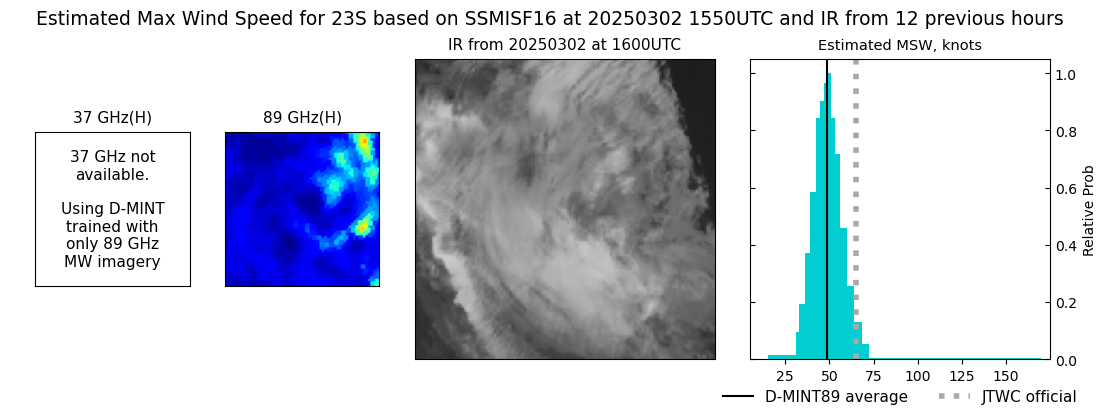 |
| 20250302 | 1518 UTC | GMI | NaN hPa | 53 kts | 47 kts | 59 kts | 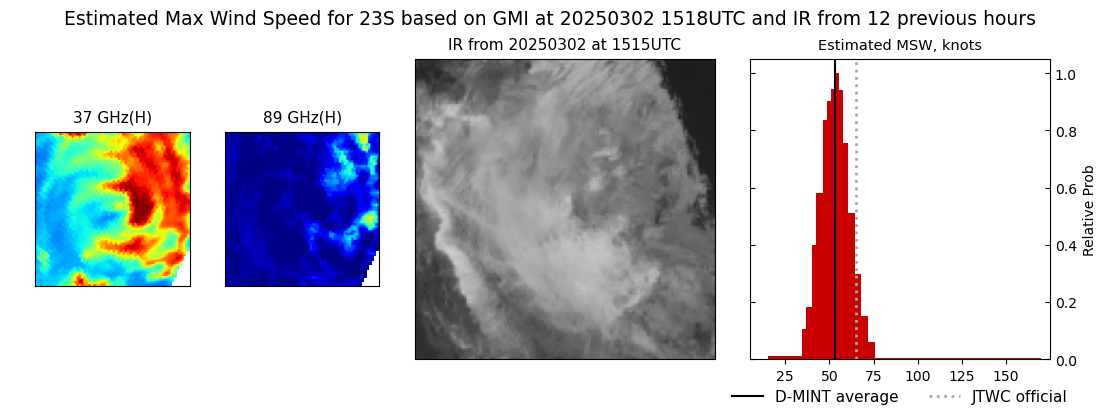 |
| 20250302 | 1501 UTC | SSMISF17 | NaN hPa | 58 kts | 52 kts | 64 kts |  |
| 20250302 | 1303 UTC | SSMISF18 | NaN hPa | 59 kts | 53 kts | 66 kts |  |
| 20250302 | 1104 UTC | AMSR2 | NaN hPa | 59 kts | 53 kts | 65 kts |  |
| 20250302 | 0321 UTC | SSMISF16 | NaN hPa | 64 kts | 58 kts | 70 kts | 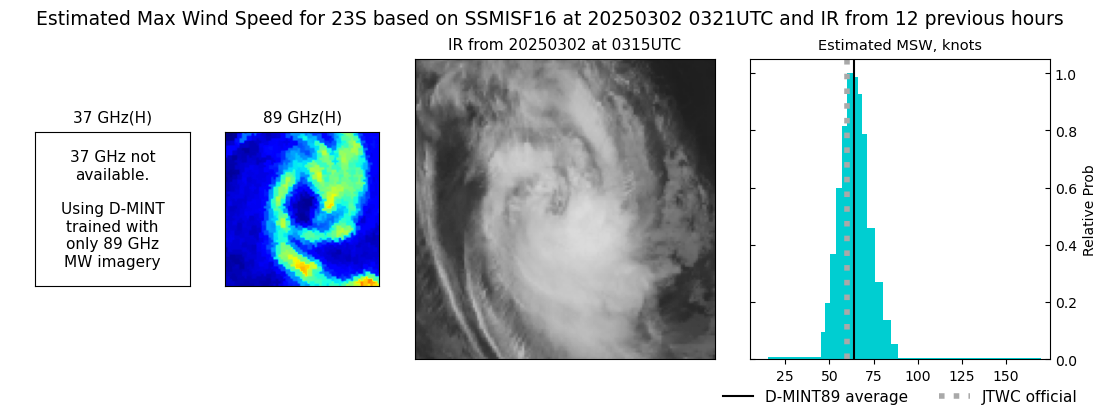 |
| 20250302 | 0232 UTC | SSMISF17 | NaN hPa | 60 kts | 54 kts | 65 kts |  |
| 20250302 | 0034 UTC | SSMISF18 | NaN hPa | 63 kts | 58 kts | 69 kts |  |
| 20250301 | 1604 UTC | SSMISF16 | NaN hPa | 65 kts | 59 kts | 70 kts | 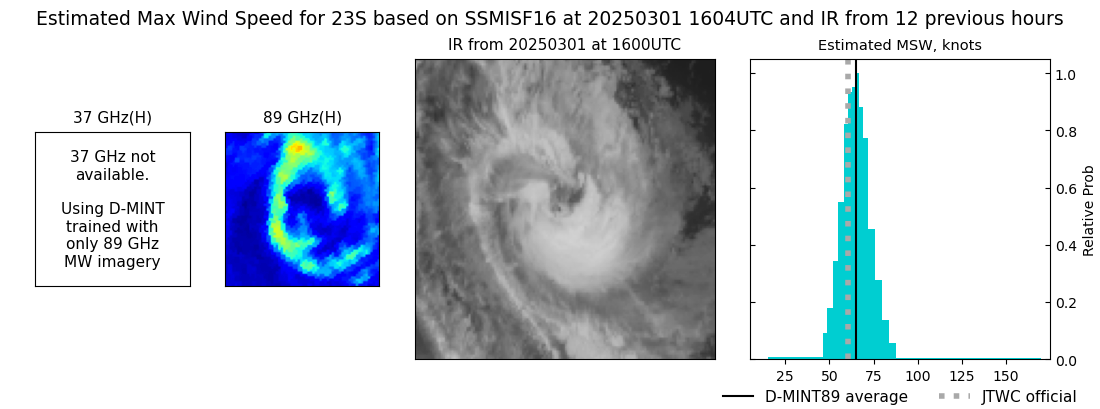 |
| 20250301 | 1515 UTC | SSMISF17 | NaN hPa | 64 kts | 58 kts | 70 kts |  |
| 20250301 | 1316 UTC | SSMISF18 | NaN hPa | 68 kts | 62 kts | 74 kts |  |
| 20250301 | 1021 UTC | AMSR2 | NaN hPa | 57 kts | 52 kts | 62 kts |  |
| 20250301 | 1018 UTC | ATMS-N20 | NaN hPa | 58 kts | 53 kts | 63 kts |  |
| 20250301 | 0335 UTC | SSMISF16 | 986 hPa | 54 kts | 49 kts | 60 kts |  |
| 20250301 | 0247 UTC | SSMISF17 | 980 hPa | 59 kts | 54 kts | 64 kts |  |
| 20250301 | 0048 UTC | SSMISF18 | 982 hPa | 60 kts | 55 kts | 64 kts |  |
| 20250228 | 2213 UTC | AMSR2 | 987 hPa | 57 kts | 52 kts | 62 kts |  |
| 20250228 | 2152 UTC | ATMS-N20 | 986 hPa | 56 kts | 51 kts | 61 kts |  |
| 20250228 | 1529 UTC | SSMISF17 | 985 hPa | 49 kts | 44 kts | 53 kts |  |
| 20250228 | 1330 UTC | SSMISF18 | 981 hPa | 59 kts | 54 kts | 64 kts |  |
| 20250228 | 1117 UTC | AMSR2 | 987 hPa | 52 kts | 47 kts | 57 kts |  |
| 20250228 | 1102 UTC | ATMS-N20 | 983 hPa | 58 kts | 53 kts | 62 kts |  |
| 20250228 | 1037 UTC | ATMS-N20 | 987 hPa | 57 kts | 52 kts | 62 kts |  |
| 20250228 | 0300 UTC | SSMISF17 | 984 hPa | 56 kts | 51 kts | 62 kts |  |
| 20250227 | 2236 UTC | ATMS-N20 | 986 hPa | 54 kts | 49 kts | 59 kts |  |
| 20250227 | 2211 UTC | ATMS-N20 | 985 hPa | 53 kts | 48 kts | 59 kts |  |
| 20250227 | 1544 UTC | SSMISF17 | 986 hPa | 54 kts | 49 kts | 59 kts |  |
| 20250227 | 1345 UTC | SSMISF18 | 990 hPa | 50 kts | 45 kts | 55 kts |  |
| 20250227 | 1057 UTC | ATMS-N20 | 986 hPa | 56 kts | 51 kts | 61 kts |  |
| 20250227 | 1034 UTC | AMSR2 | 992 hPa | 51 kts | 46 kts | 55 kts |  |
| 20250227 | 0601 UTC | GMI | 988 hPa | 53 kts | 48 kts | 57 kts | 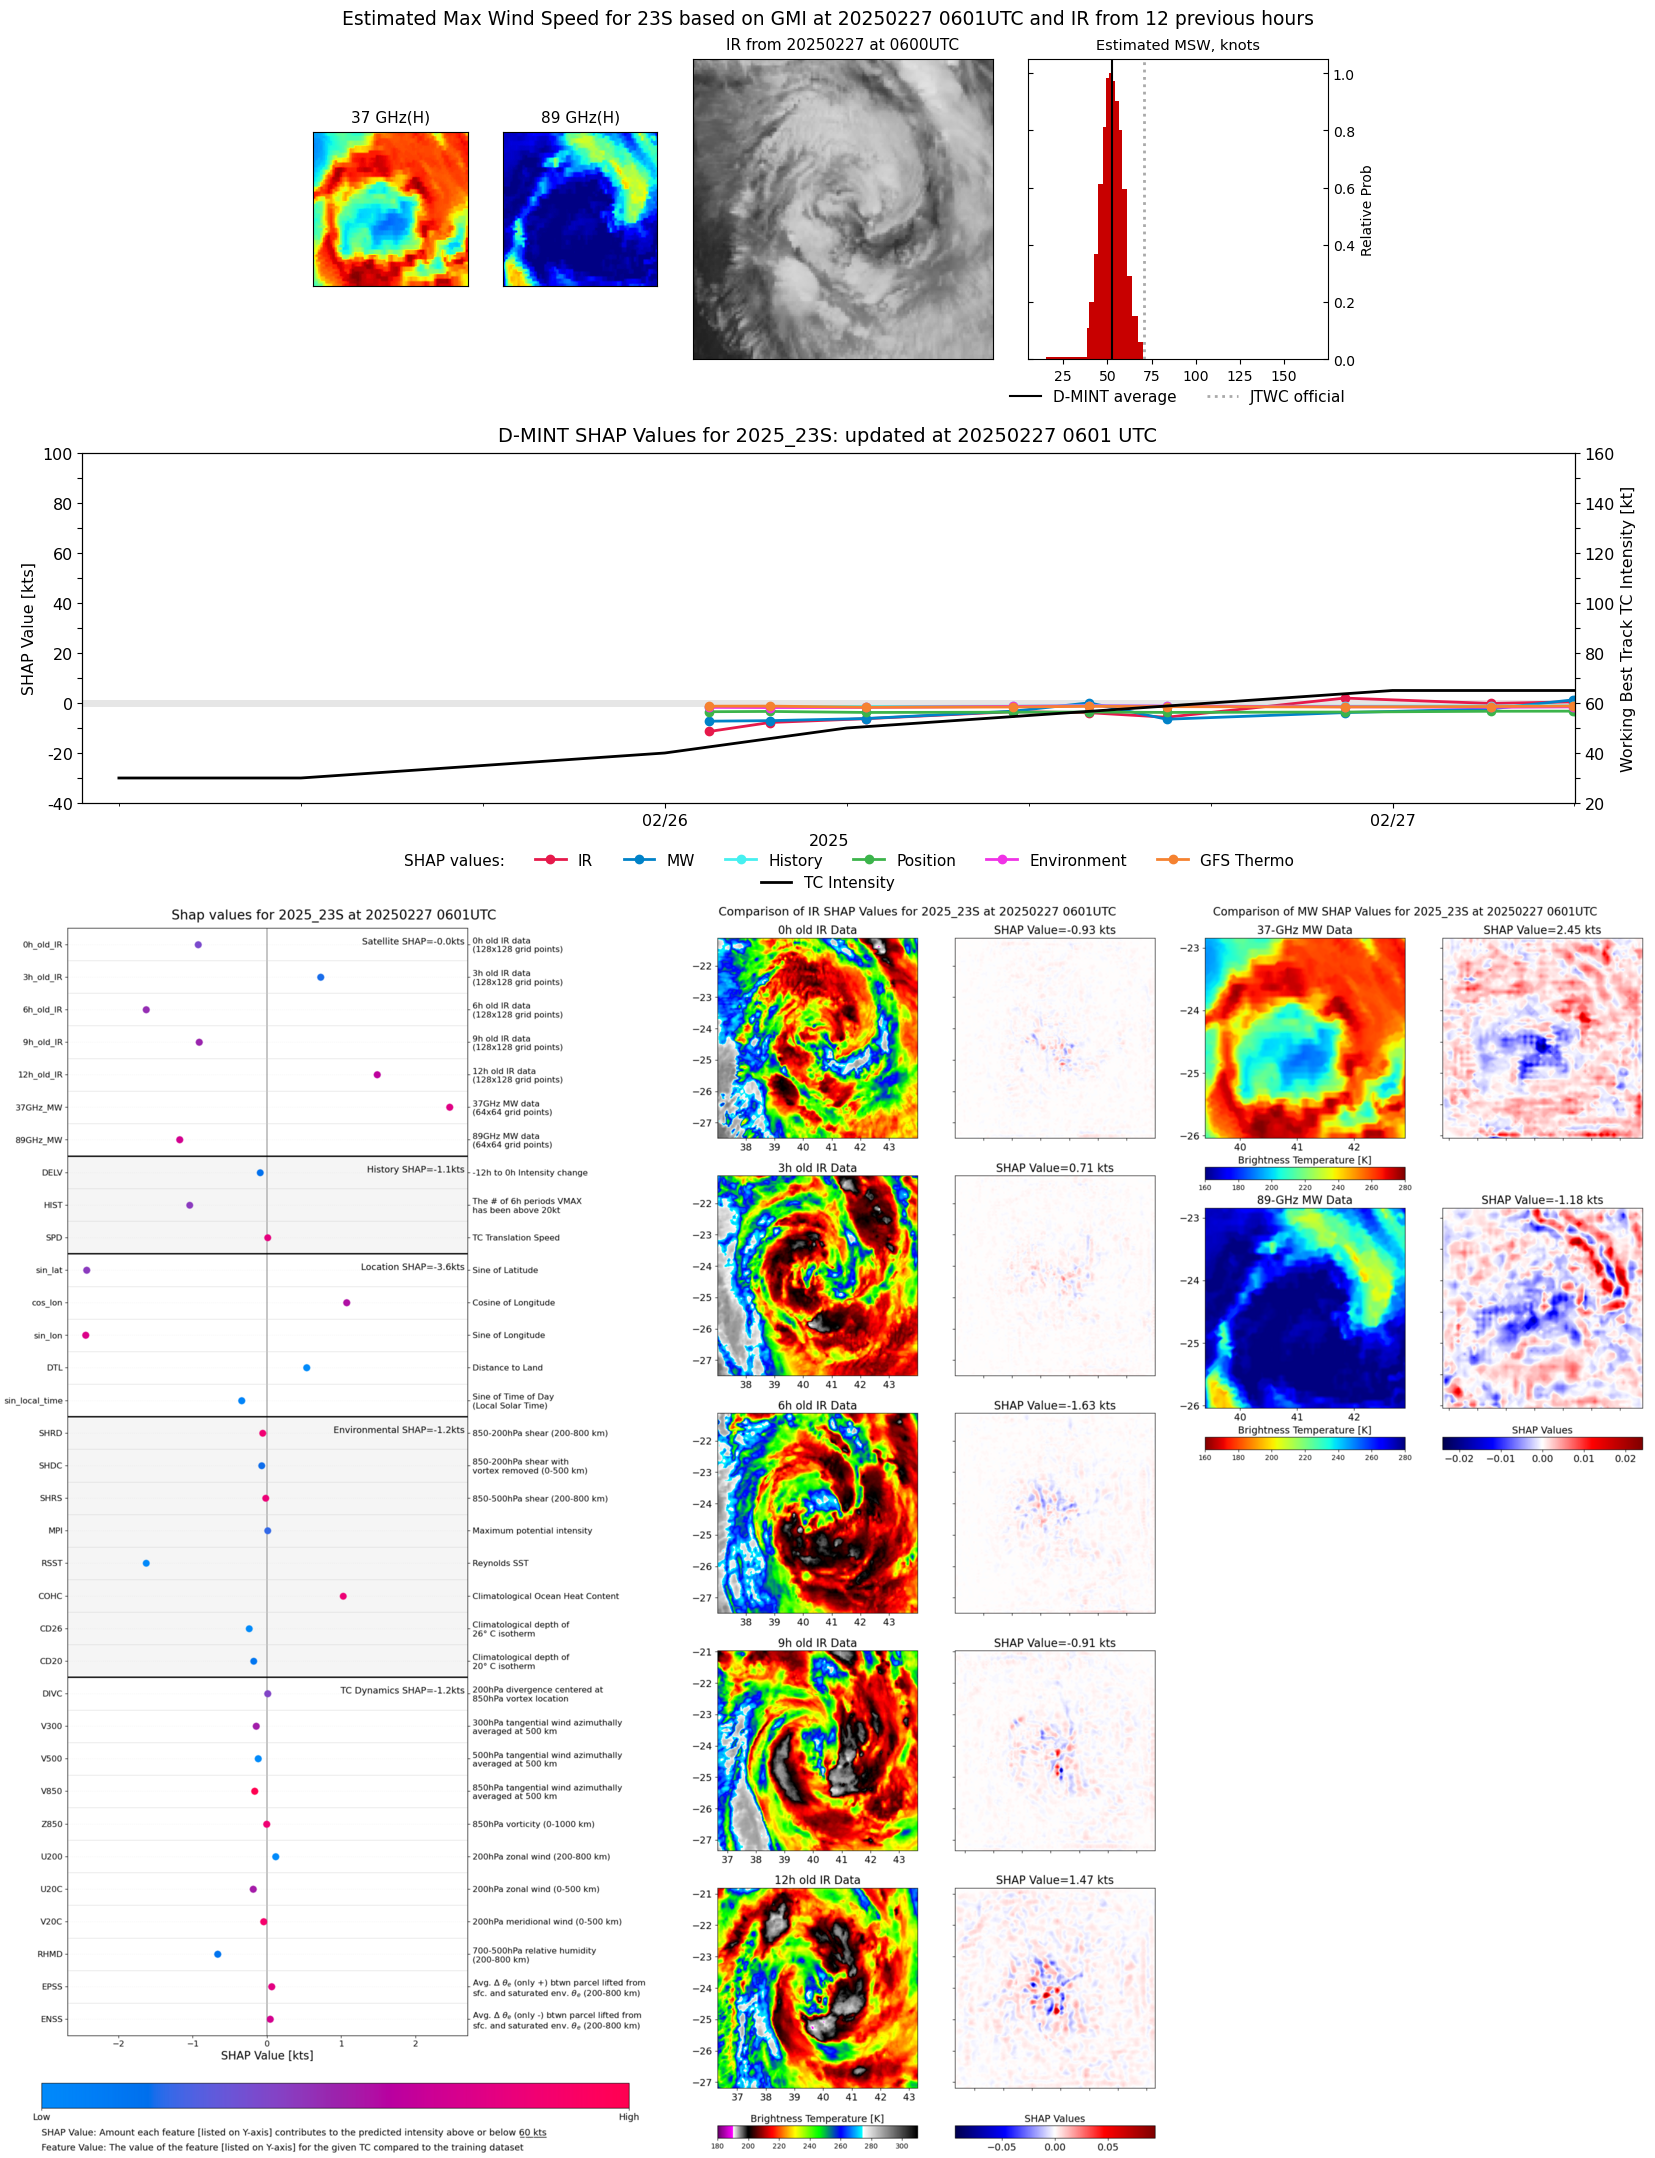 |
| 20250227 | 0559 UTC | GMI | 987 hPa | 56 kts | 51 kts | 61 kts | 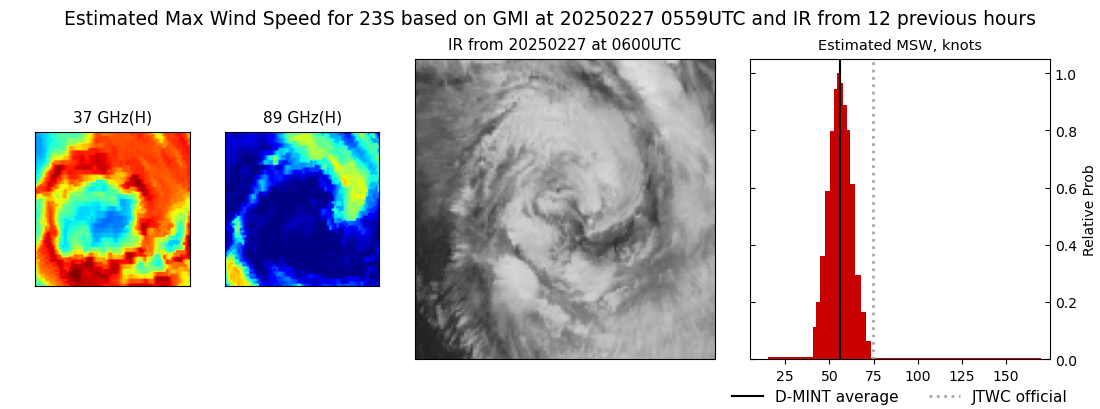 |
| 20250227 | 0558 UTC | GMI | 987 hPa | 55 kts | 50 kts | 59 kts |  |
| 20250227 | 0314 UTC | SSMISF17 | 992 hPa | 50 kts | 45 kts | 54 kts |  |
| 20250227 | 0115 UTC | SSMISF18 | 990 hPa | 52 kts | 47 kts | 56 kts |  |
| 20250226 | 2255 UTC | ATMS-N20 | 988 hPa | 53 kts | 48 kts | 59 kts |  |
| 20250226 | 2229 UTC | ATMS-N20 | 988 hPa | 56 kts | 50 kts | 61 kts |  |
| 20250226 | 2225 UTC | AMSR2 | 990 hPa | 50 kts | 46 kts | 55 kts |  |
| 20250226 | 1633 UTC | GMI | 995 hPa | 40 kts | 36 kts | 45 kts | 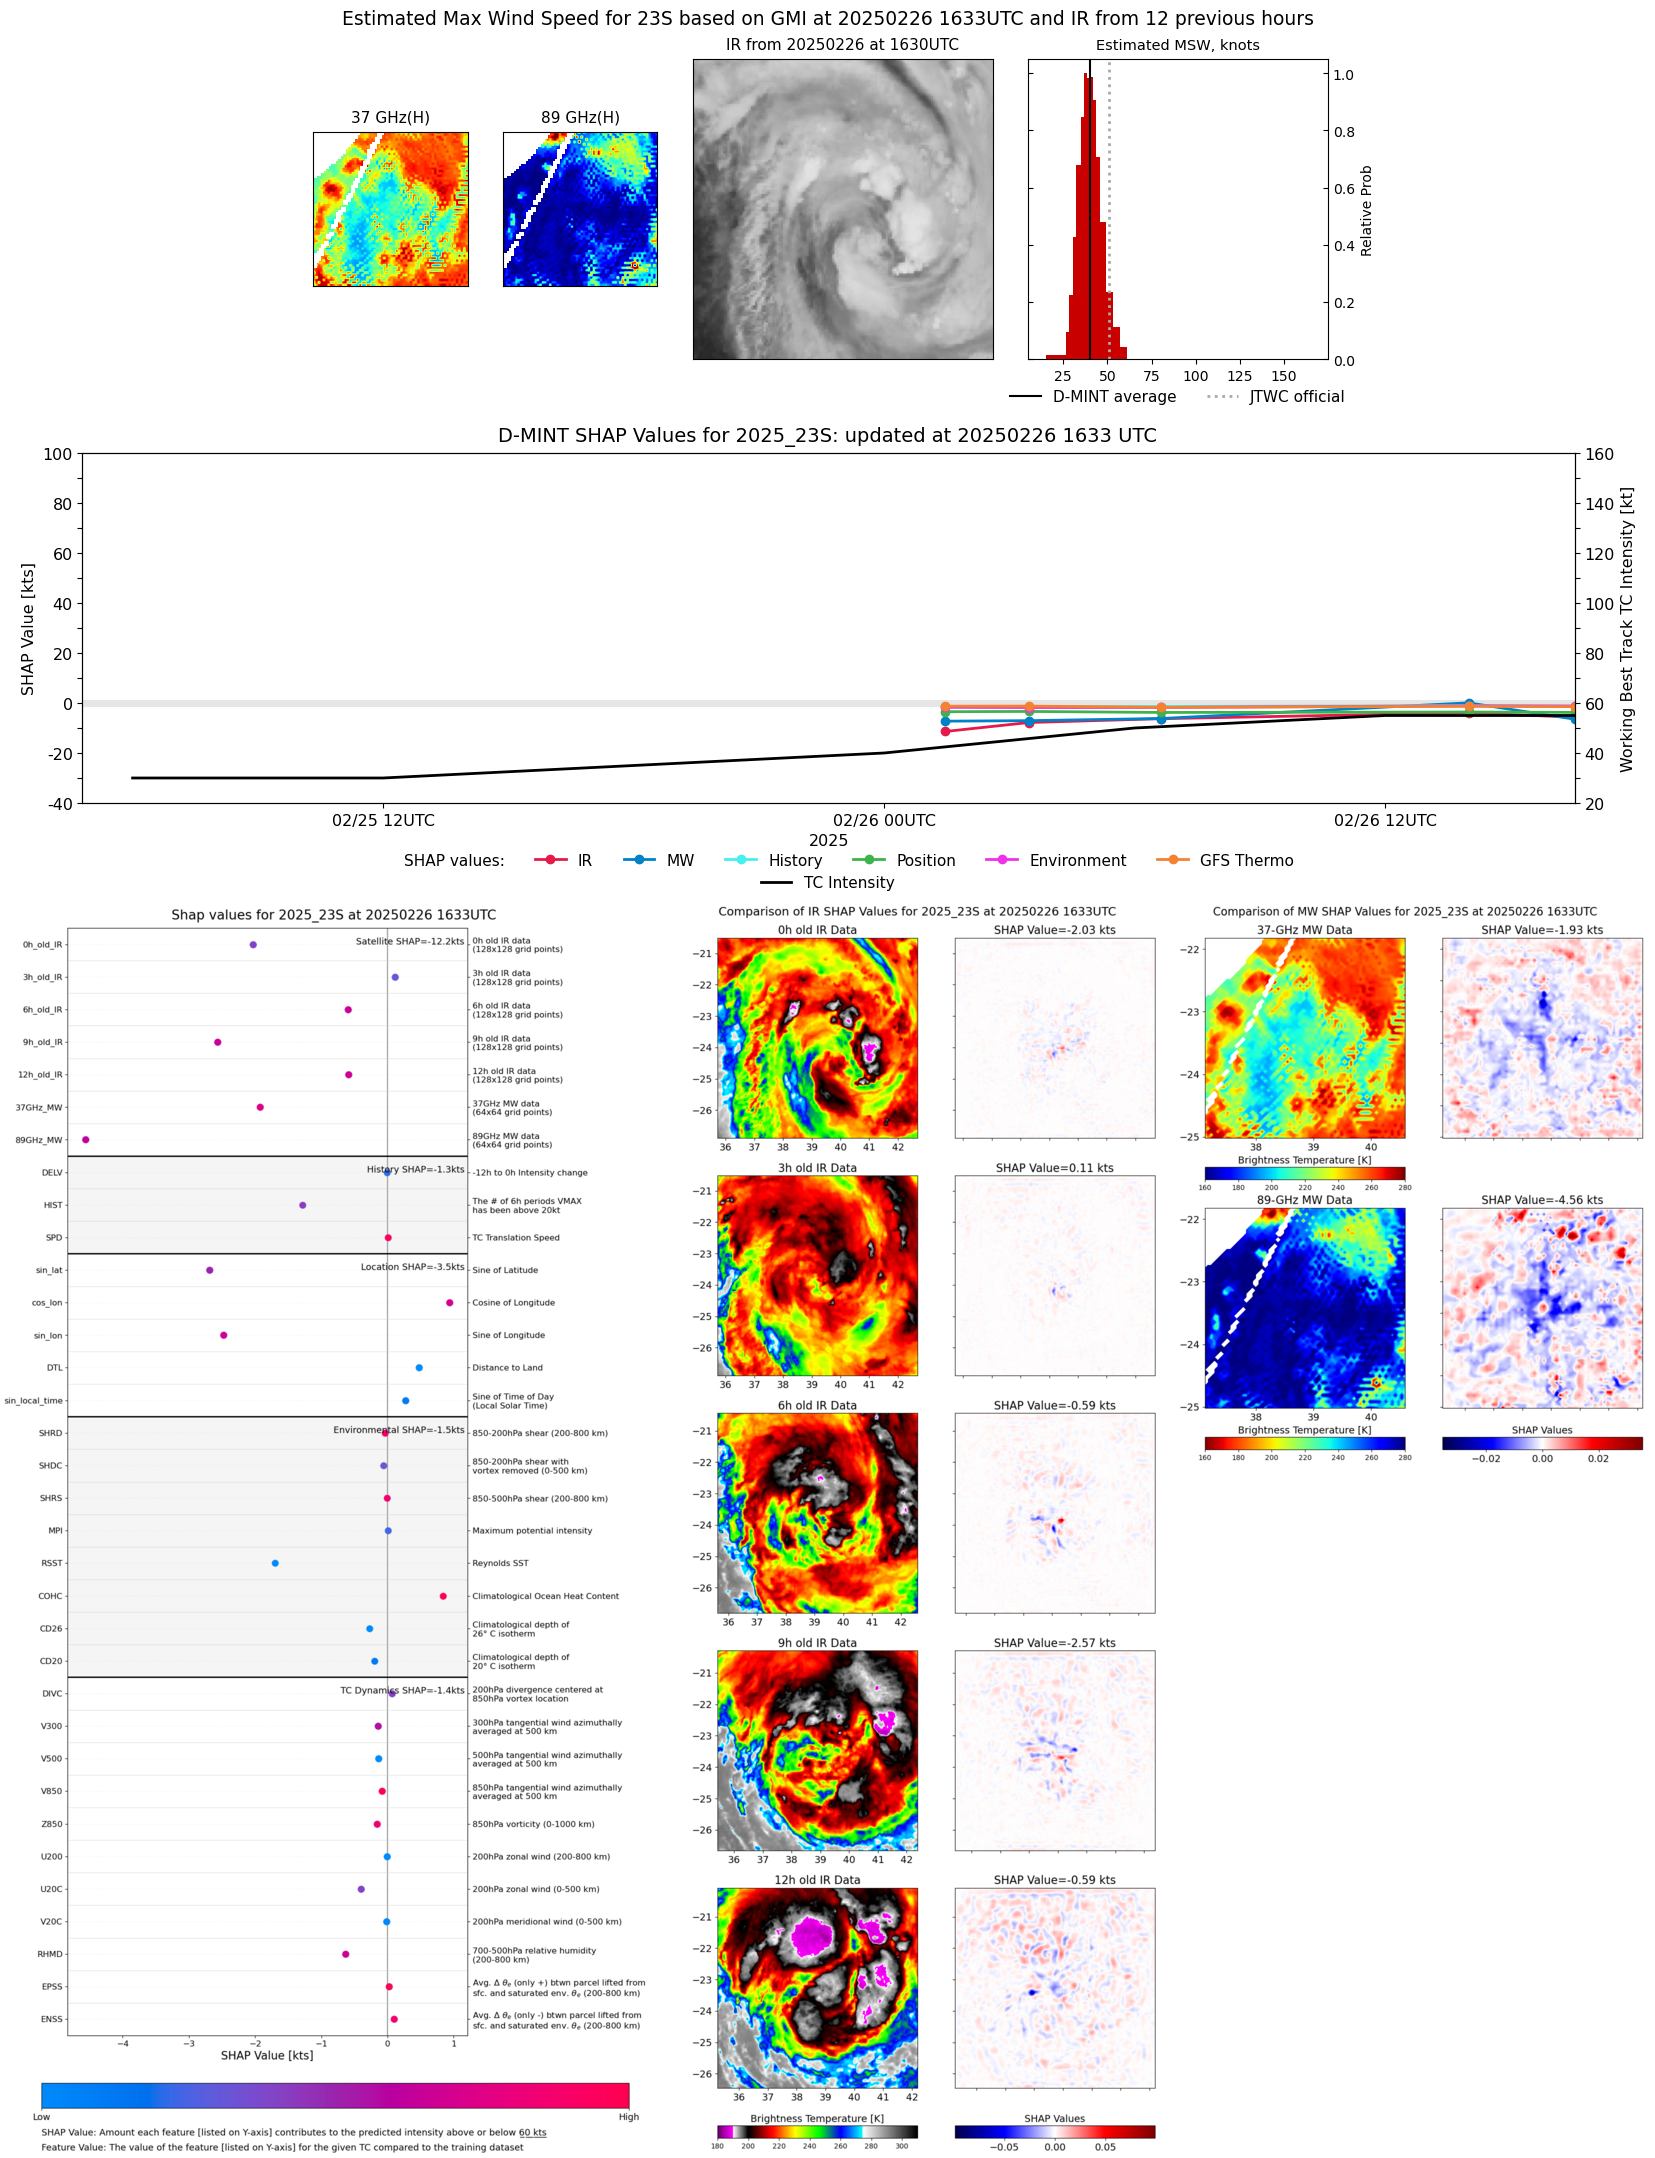 |
| 20250226 | 1400 UTC | SSMISF18 | 992 hPa | 49 kts | 44 kts | 54 kts |  |
| 20250226 | 1129 UTC | AMSR2 | 995 hPa | 45 kts | 41 kts | 50 kts |  |
| 20250226 | 1116 UTC | ATMS-N20 | 988 hPa | 51 kts | 46 kts | 57 kts |  |
| 20250226 | 0638 UTC | GMI | 996 hPa | 39 kts | 35 kts | 43 kts | 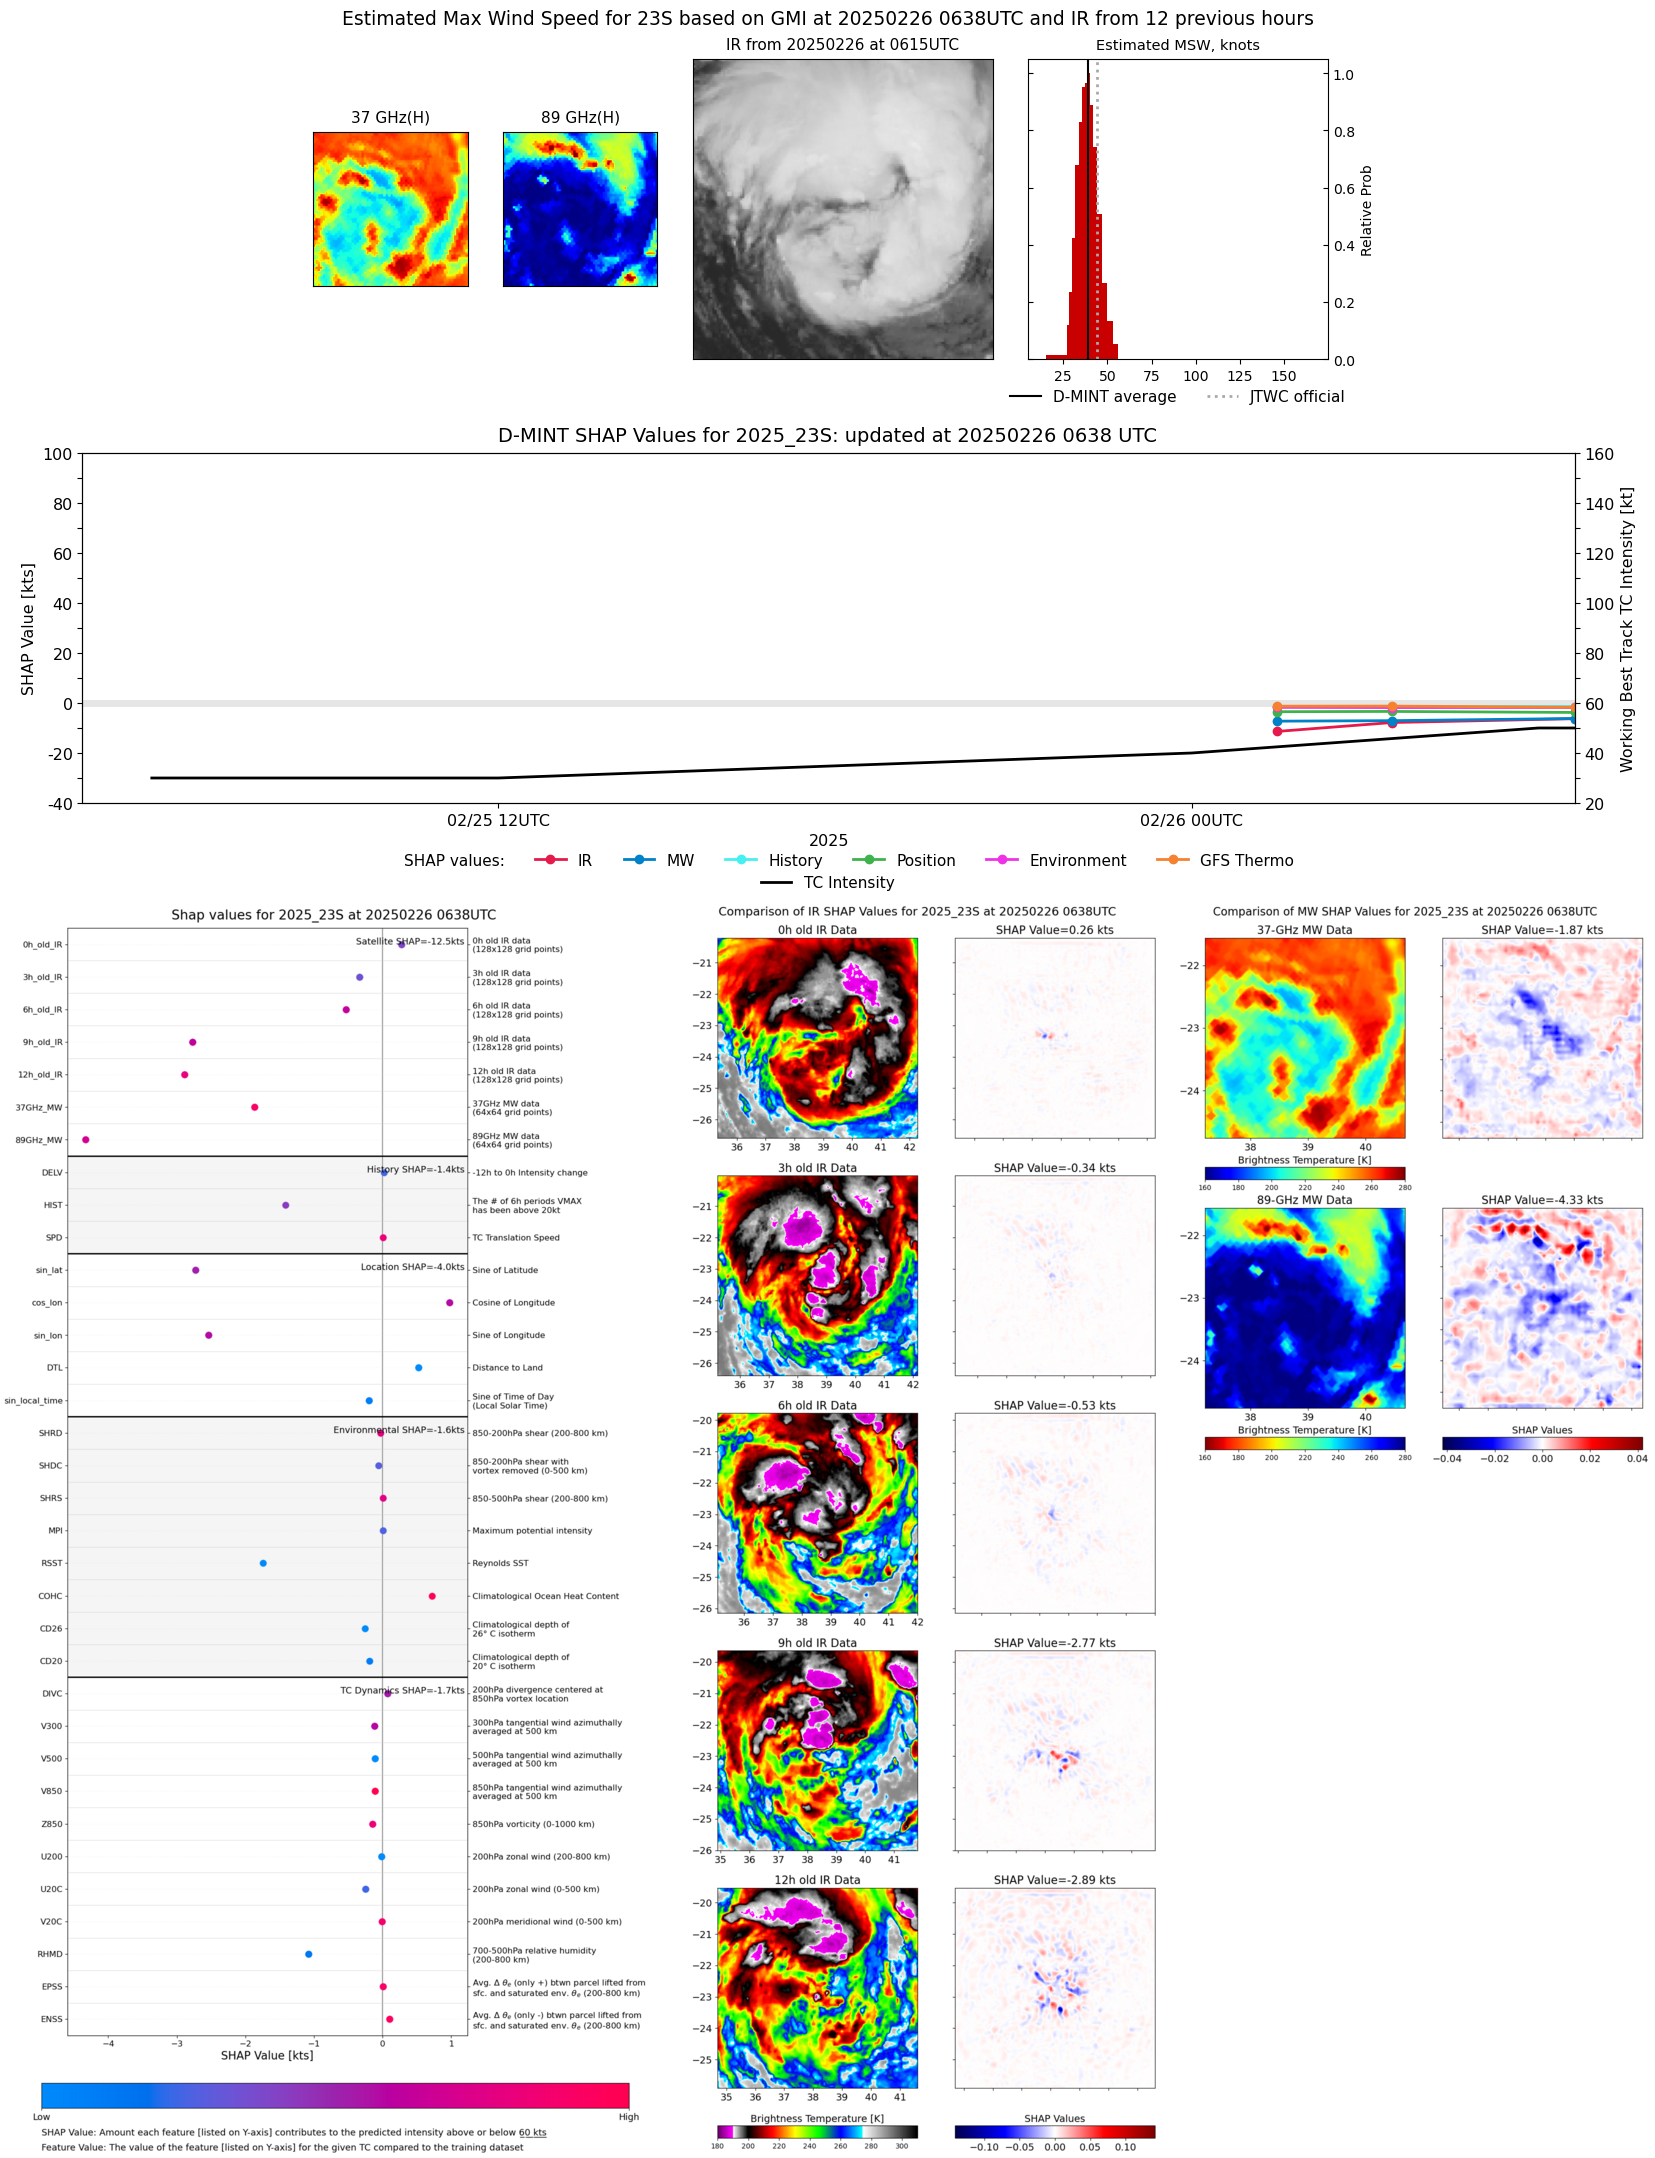 |
| 20250226 | 0328 UTC | SSMISF17 | 995 hPa | 37 kts | 34 kts | 41 kts |  |
| 20250226 | 0128 UTC | SSMISF18 | 995 hPa | 33 kts | 30 kts | 38 kts |  |
| 20250225 | 2247 UTC | ATMS-N20 | 1001 hPa | 35 kts | 31 kts | 39 kts |  |