|
||

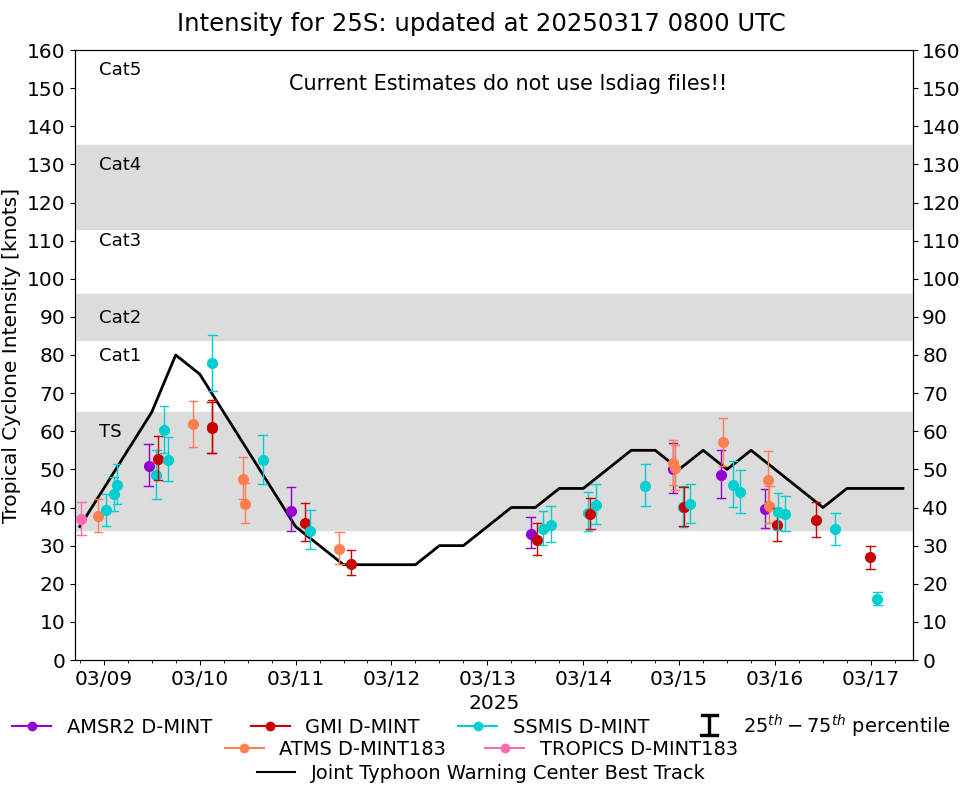 |
D-MINT HISTORY FILE for 2025_25S
| Date | Time | MW Sensor | MSLP | Vmax (30th-70th percentile average) | Vmax 25th percentile | Vmax 75th percentile | Image |
| 20250317 | 0138 UTC | SSMISF16 | 1001 hPa | 16 kts | 14 kts | 18 kts |  |
| 20250316 | 2352 UTC | GMI | 995 hPa | 27 kts | 24 kts | 30 kts | 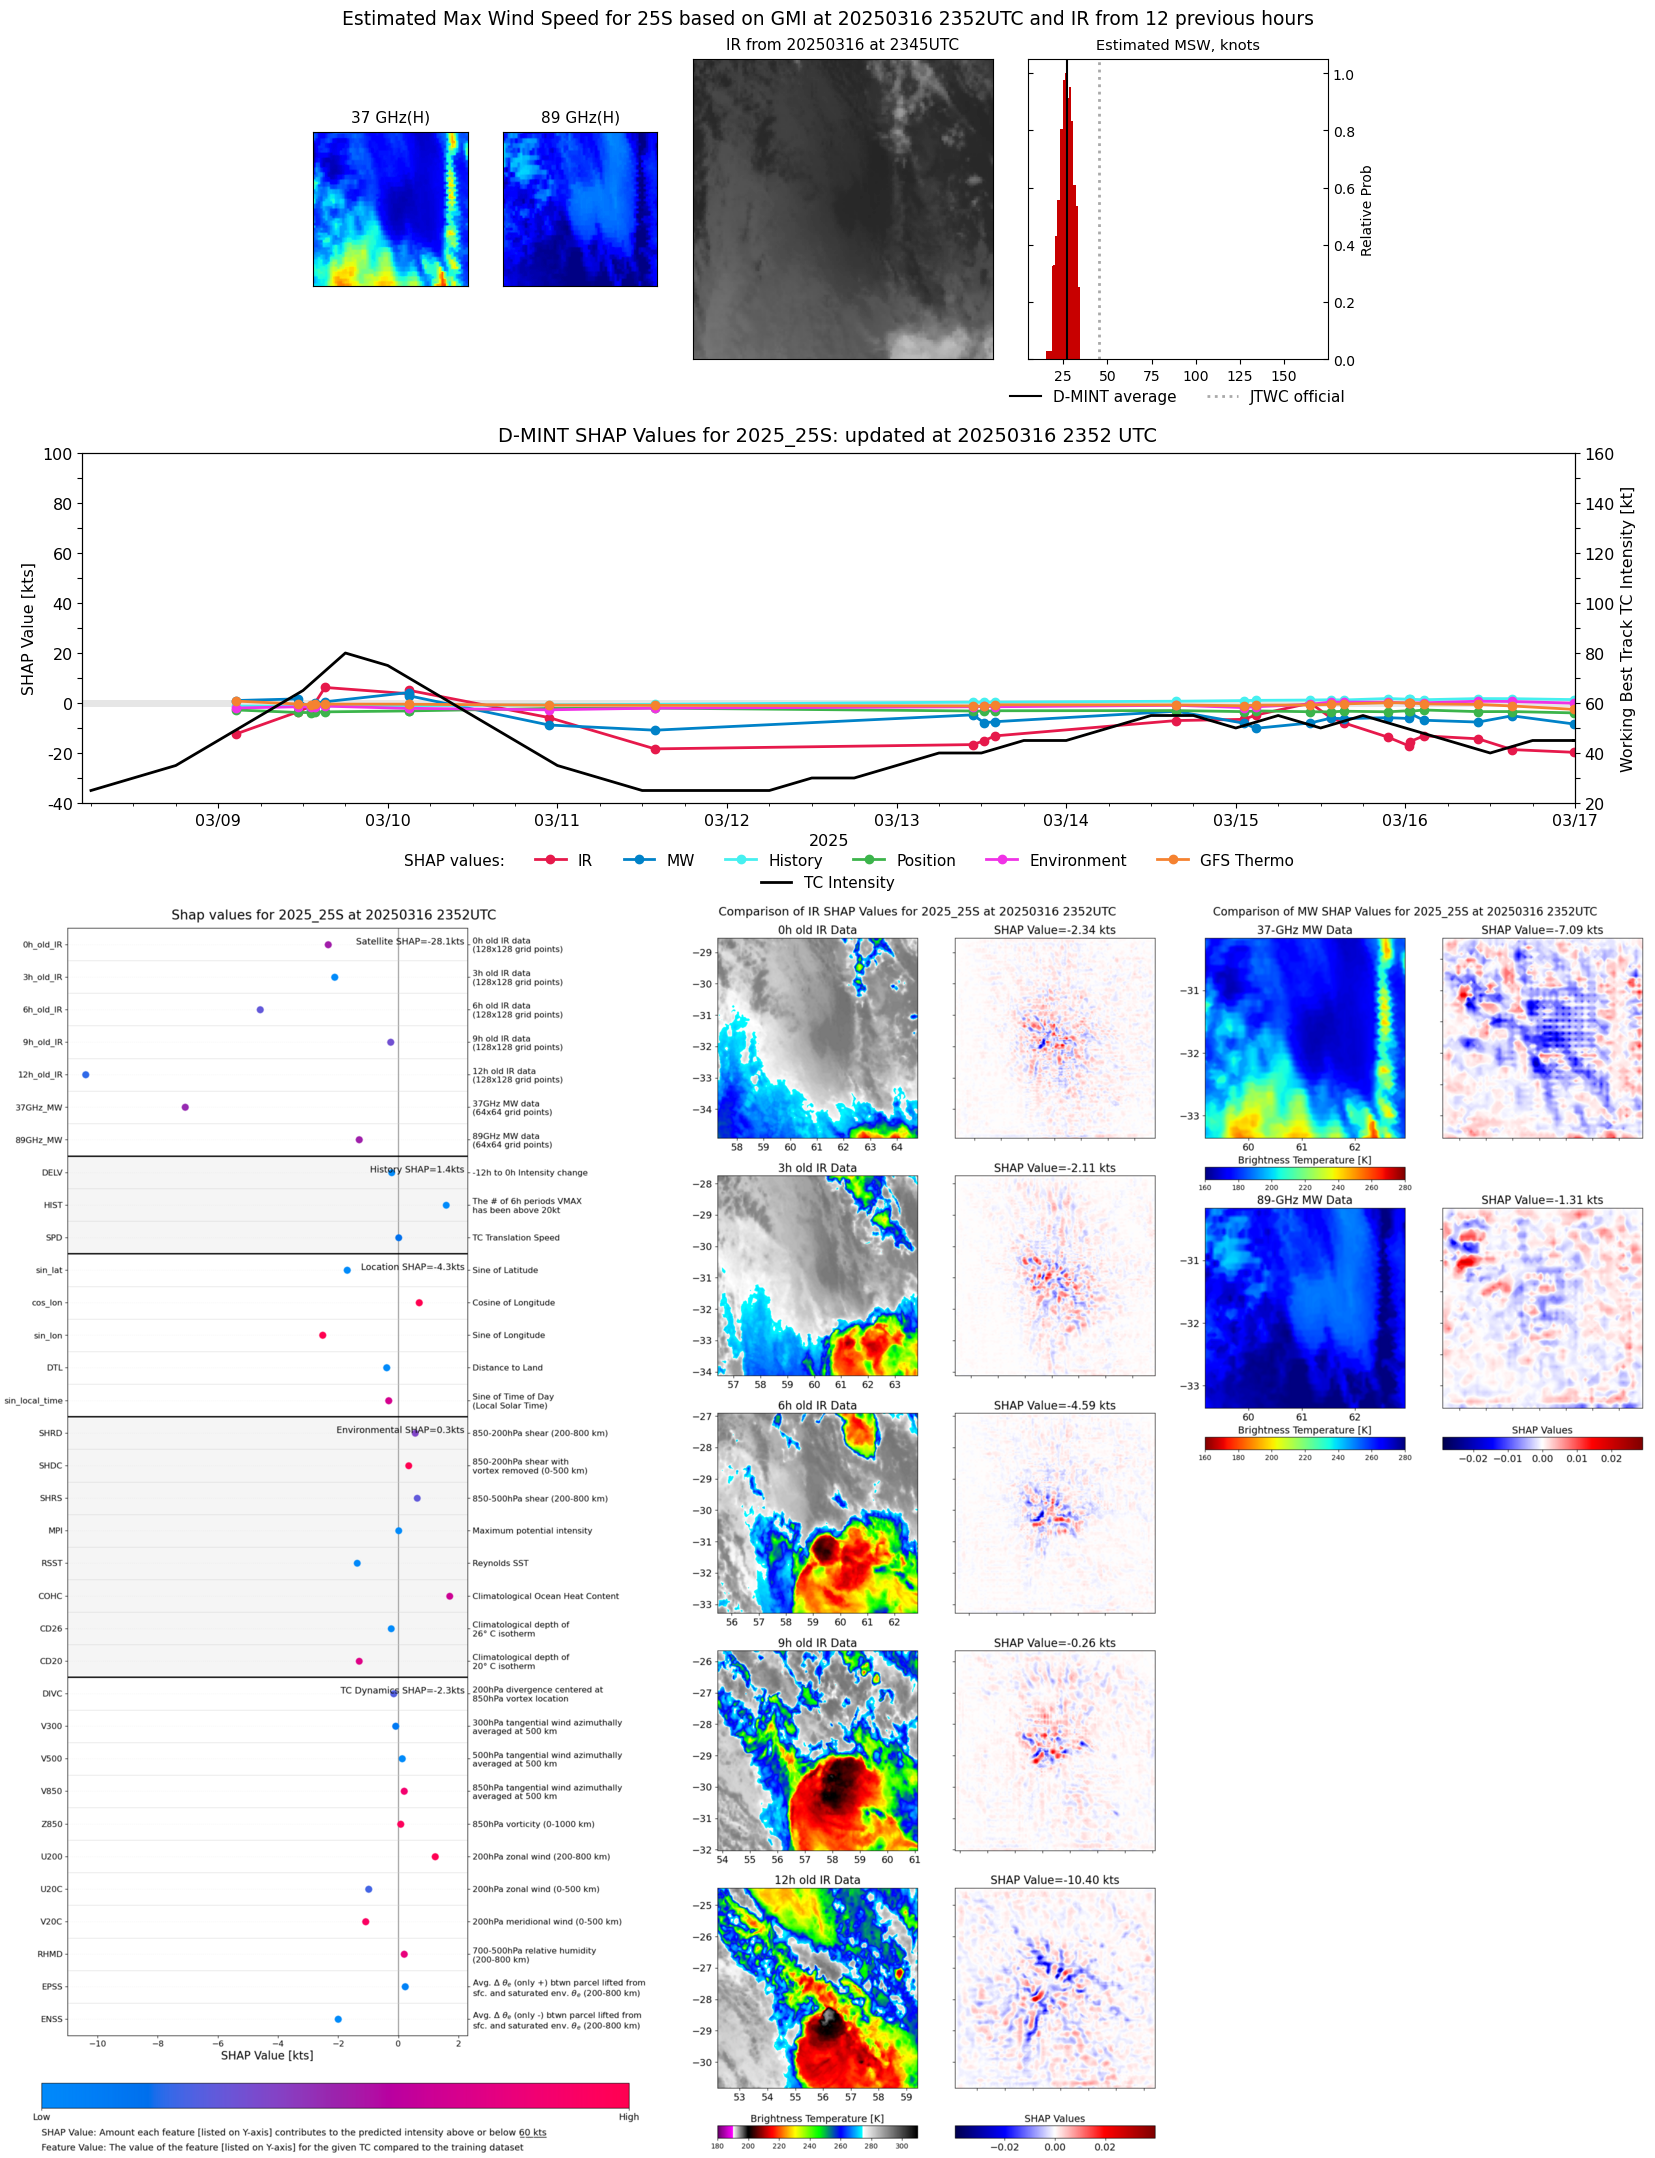 |
| 20250316 | 1505 UTC | SSMISF17 | 994 hPa | 34 kts | 30 kts | 39 kts |  |
| 20250316 | 1018 UTC | GMI | 995 hPa | 37 kts | 32 kts | 41 kts | 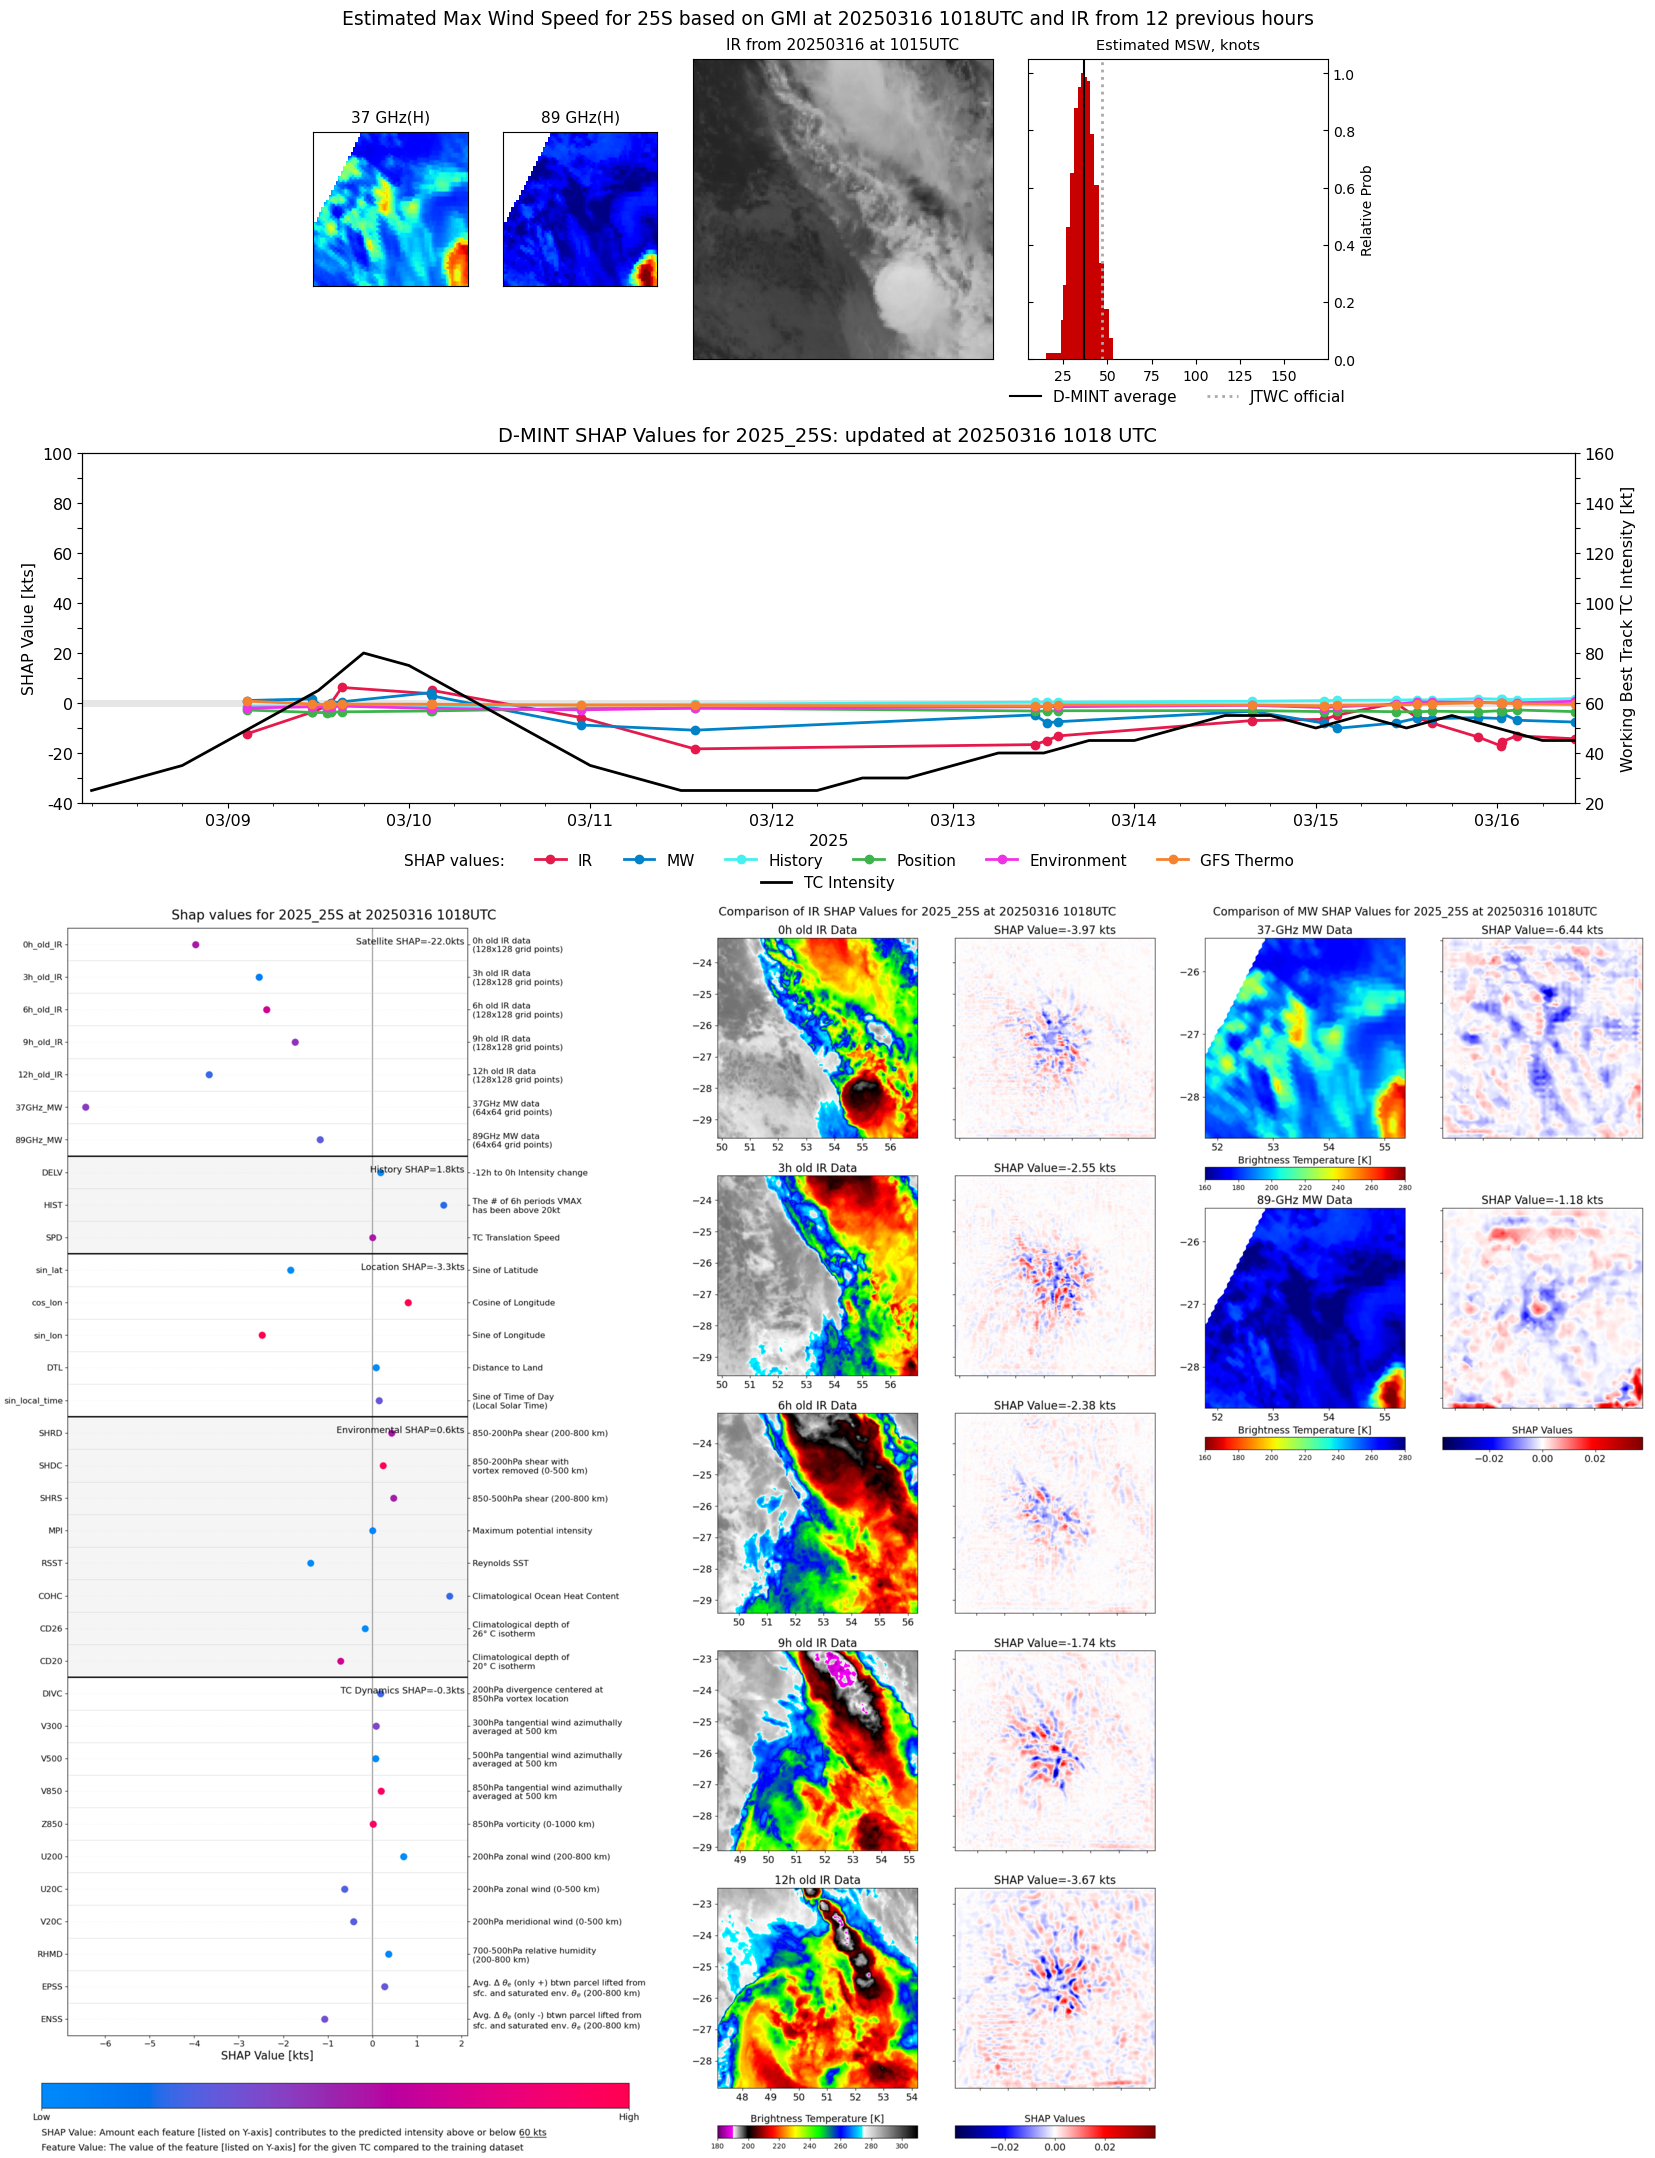 |
| 20250316 | 0236 UTC | SSMISF17 | 992 hPa | 38 kts | 34 kts | 43 kts |  |
| 20250316 | 0041 UTC | SSMISF18 | 991 hPa | 39 kts | 34 kts | 44 kts |  |
| 20250316 | 0028 UTC | GMI | 992 hPa | 35 kts | 31 kts | 40 kts | 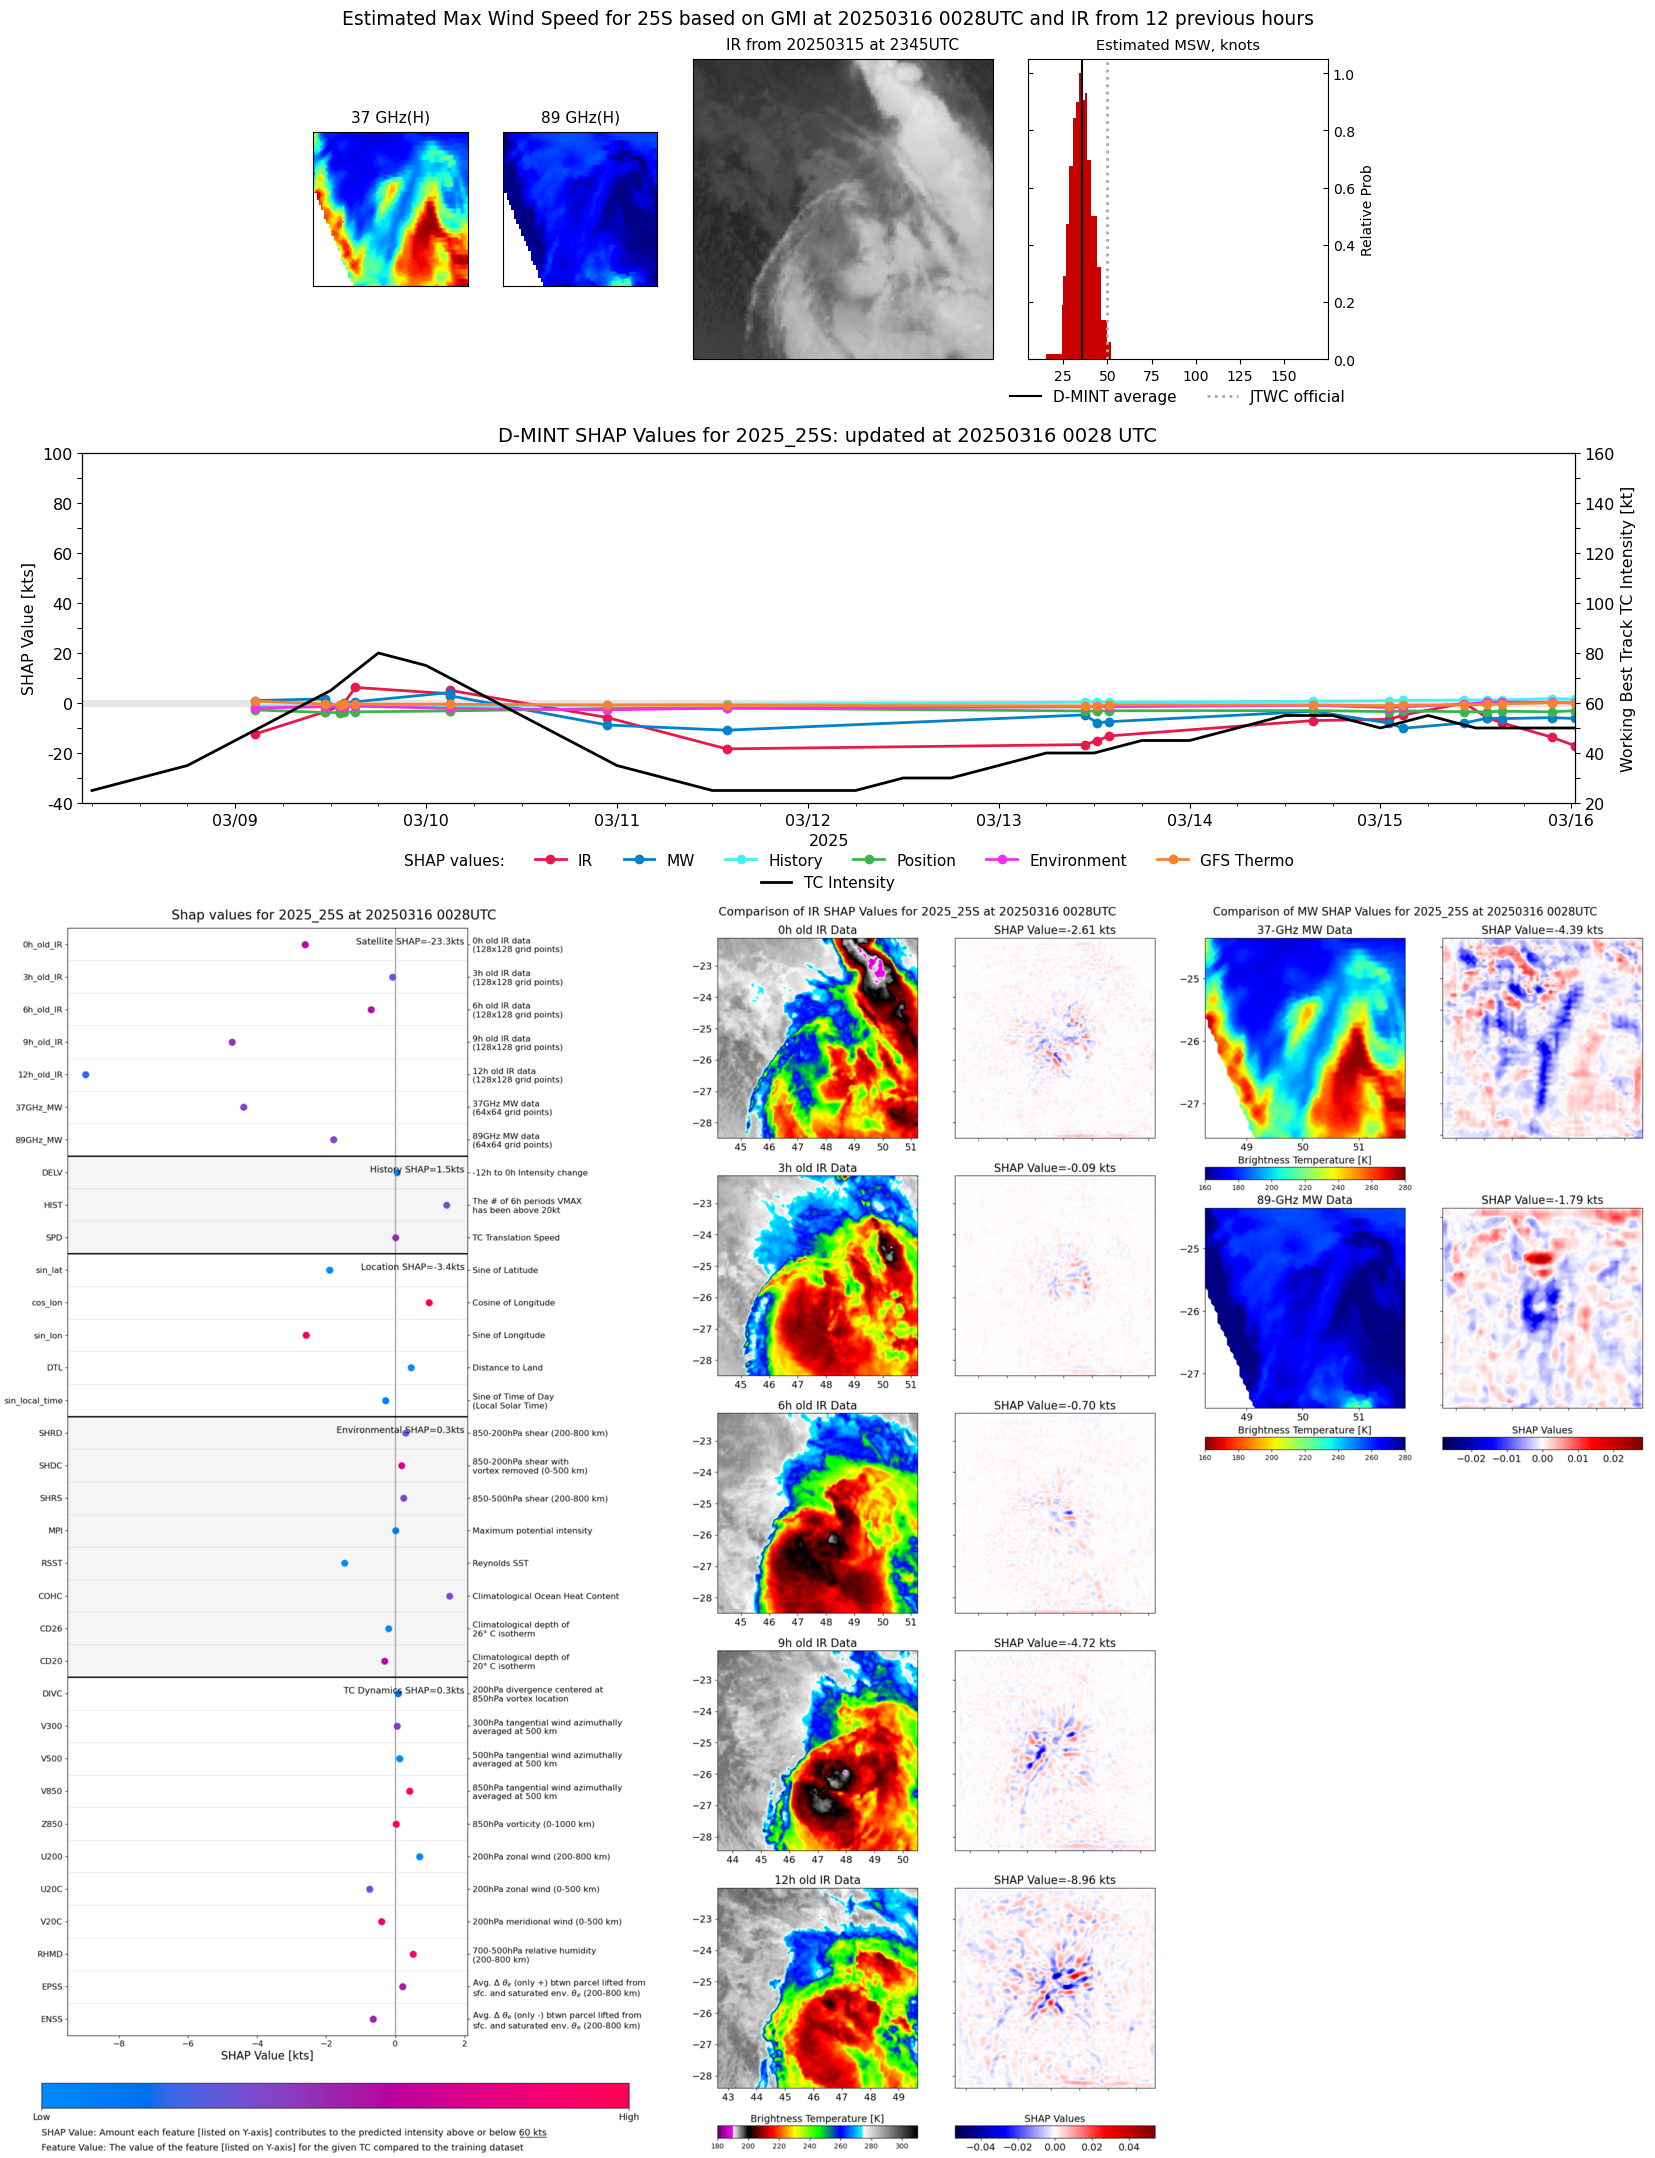 |
| 20250315 | 2236 UTC | ATMS-N20 | 987 hPa | 40 kts | 36 kts | 46 kts |  |
| 20250315 | 2211 UTC | ATMS-N20 | 982 hPa | 47 kts | 40 kts | 55 kts |  |
| 20250315 | 2131 UTC | AMSR2 | 989 hPa | 40 kts | 35 kts | 45 kts |  |
| 20250315 | 1520 UTC | SSMISF17 | 993 hPa | 44 kts | 39 kts | 50 kts |  |
| 20250315 | 1325 UTC | SSMISF18 | 991 hPa | 46 kts | 40 kts | 52 kts |  |
| 20250315 | 1056 UTC | ATMS-N20 | 981 hPa | 57 kts | 51 kts | 64 kts |  |
| 20250315 | 1033 UTC | AMSR2 | 991 hPa | 49 kts | 43 kts | 55 kts |  |
| 20250315 | 0250 UTC | SSMISF17 | 990 hPa | 41 kts | 36 kts | 46 kts |  |
| 20250315 | 0108 UTC | GMI | 994 hPa | 40 kts | 35 kts | 45 kts | 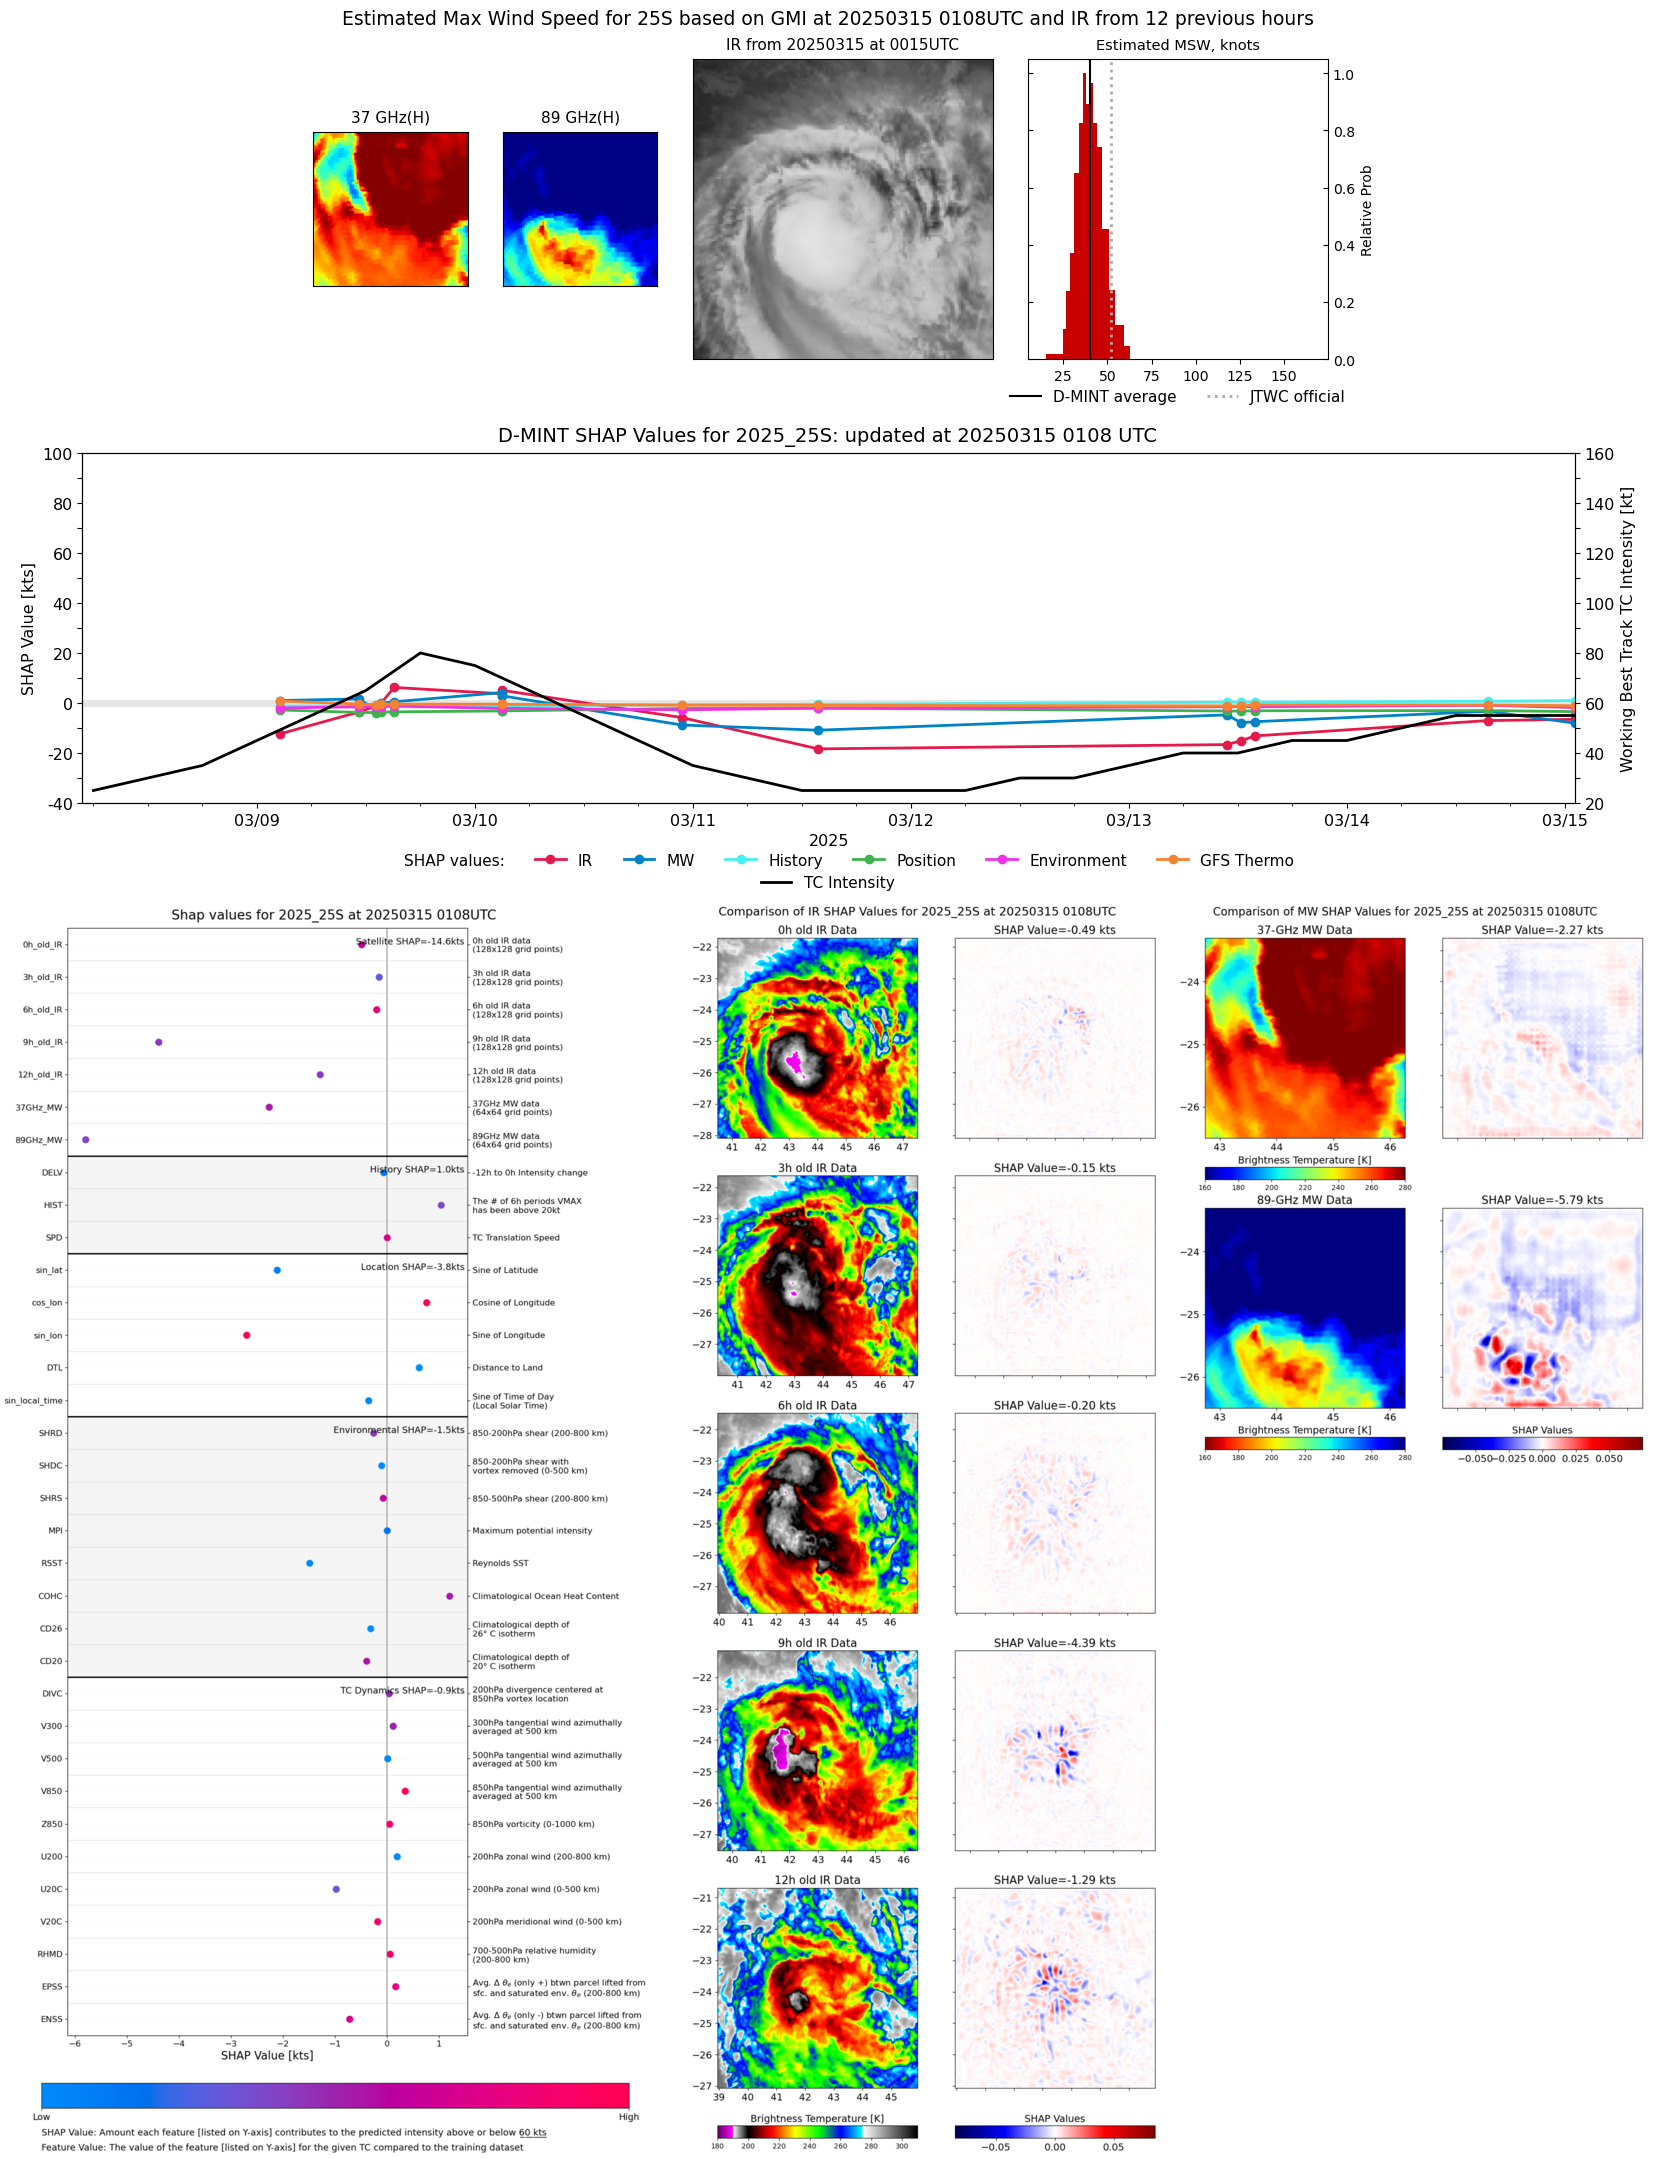 |
| 20250315 | 0055 UTC | SSMISF18 | 992 hPa | 40 kts | 35 kts | 46 kts |  |
| 20250314 | 2254 UTC | ATMS-N20 | 986 hPa | 50 kts | 45 kts | 56 kts |  |
| 20250314 | 2229 UTC | ATMS-N20 | 985 hPa | 52 kts | 46 kts | 58 kts |  |
| 20250314 | 2225 UTC | AMSR2 | 993 hPa | 50 kts | 44 kts | 57 kts |  |
| 20250314 | 1534 UTC | SSMISF17 | 991 hPa | 46 kts | 40 kts | 51 kts |  |
| 20250314 | 0304 UTC | SSMISF17 | NaN hPa | 41 kts | 36 kts | 46 kts |  |
| 20250314 | 0148 UTC | GMI | NaN hPa | 38 kts | 34 kts | 43 kts |  |
| 20250314 | 0108 UTC | SSMISF18 | NaN hPa | 39 kts | 34 kts | 44 kts |  |
| 20250313 | 1550 UTC | SSMISF17 | 999 hPa | 35 kts | 31 kts | 40 kts |  |
| 20250313 | 1354 UTC | SSMISF18 | 999 hPa | 34 kts | 30 kts | 39 kts |  |
| 20250313 | 1223 UTC | GMI | 1001 hPa | 32 kts | 28 kts | 36 kts | 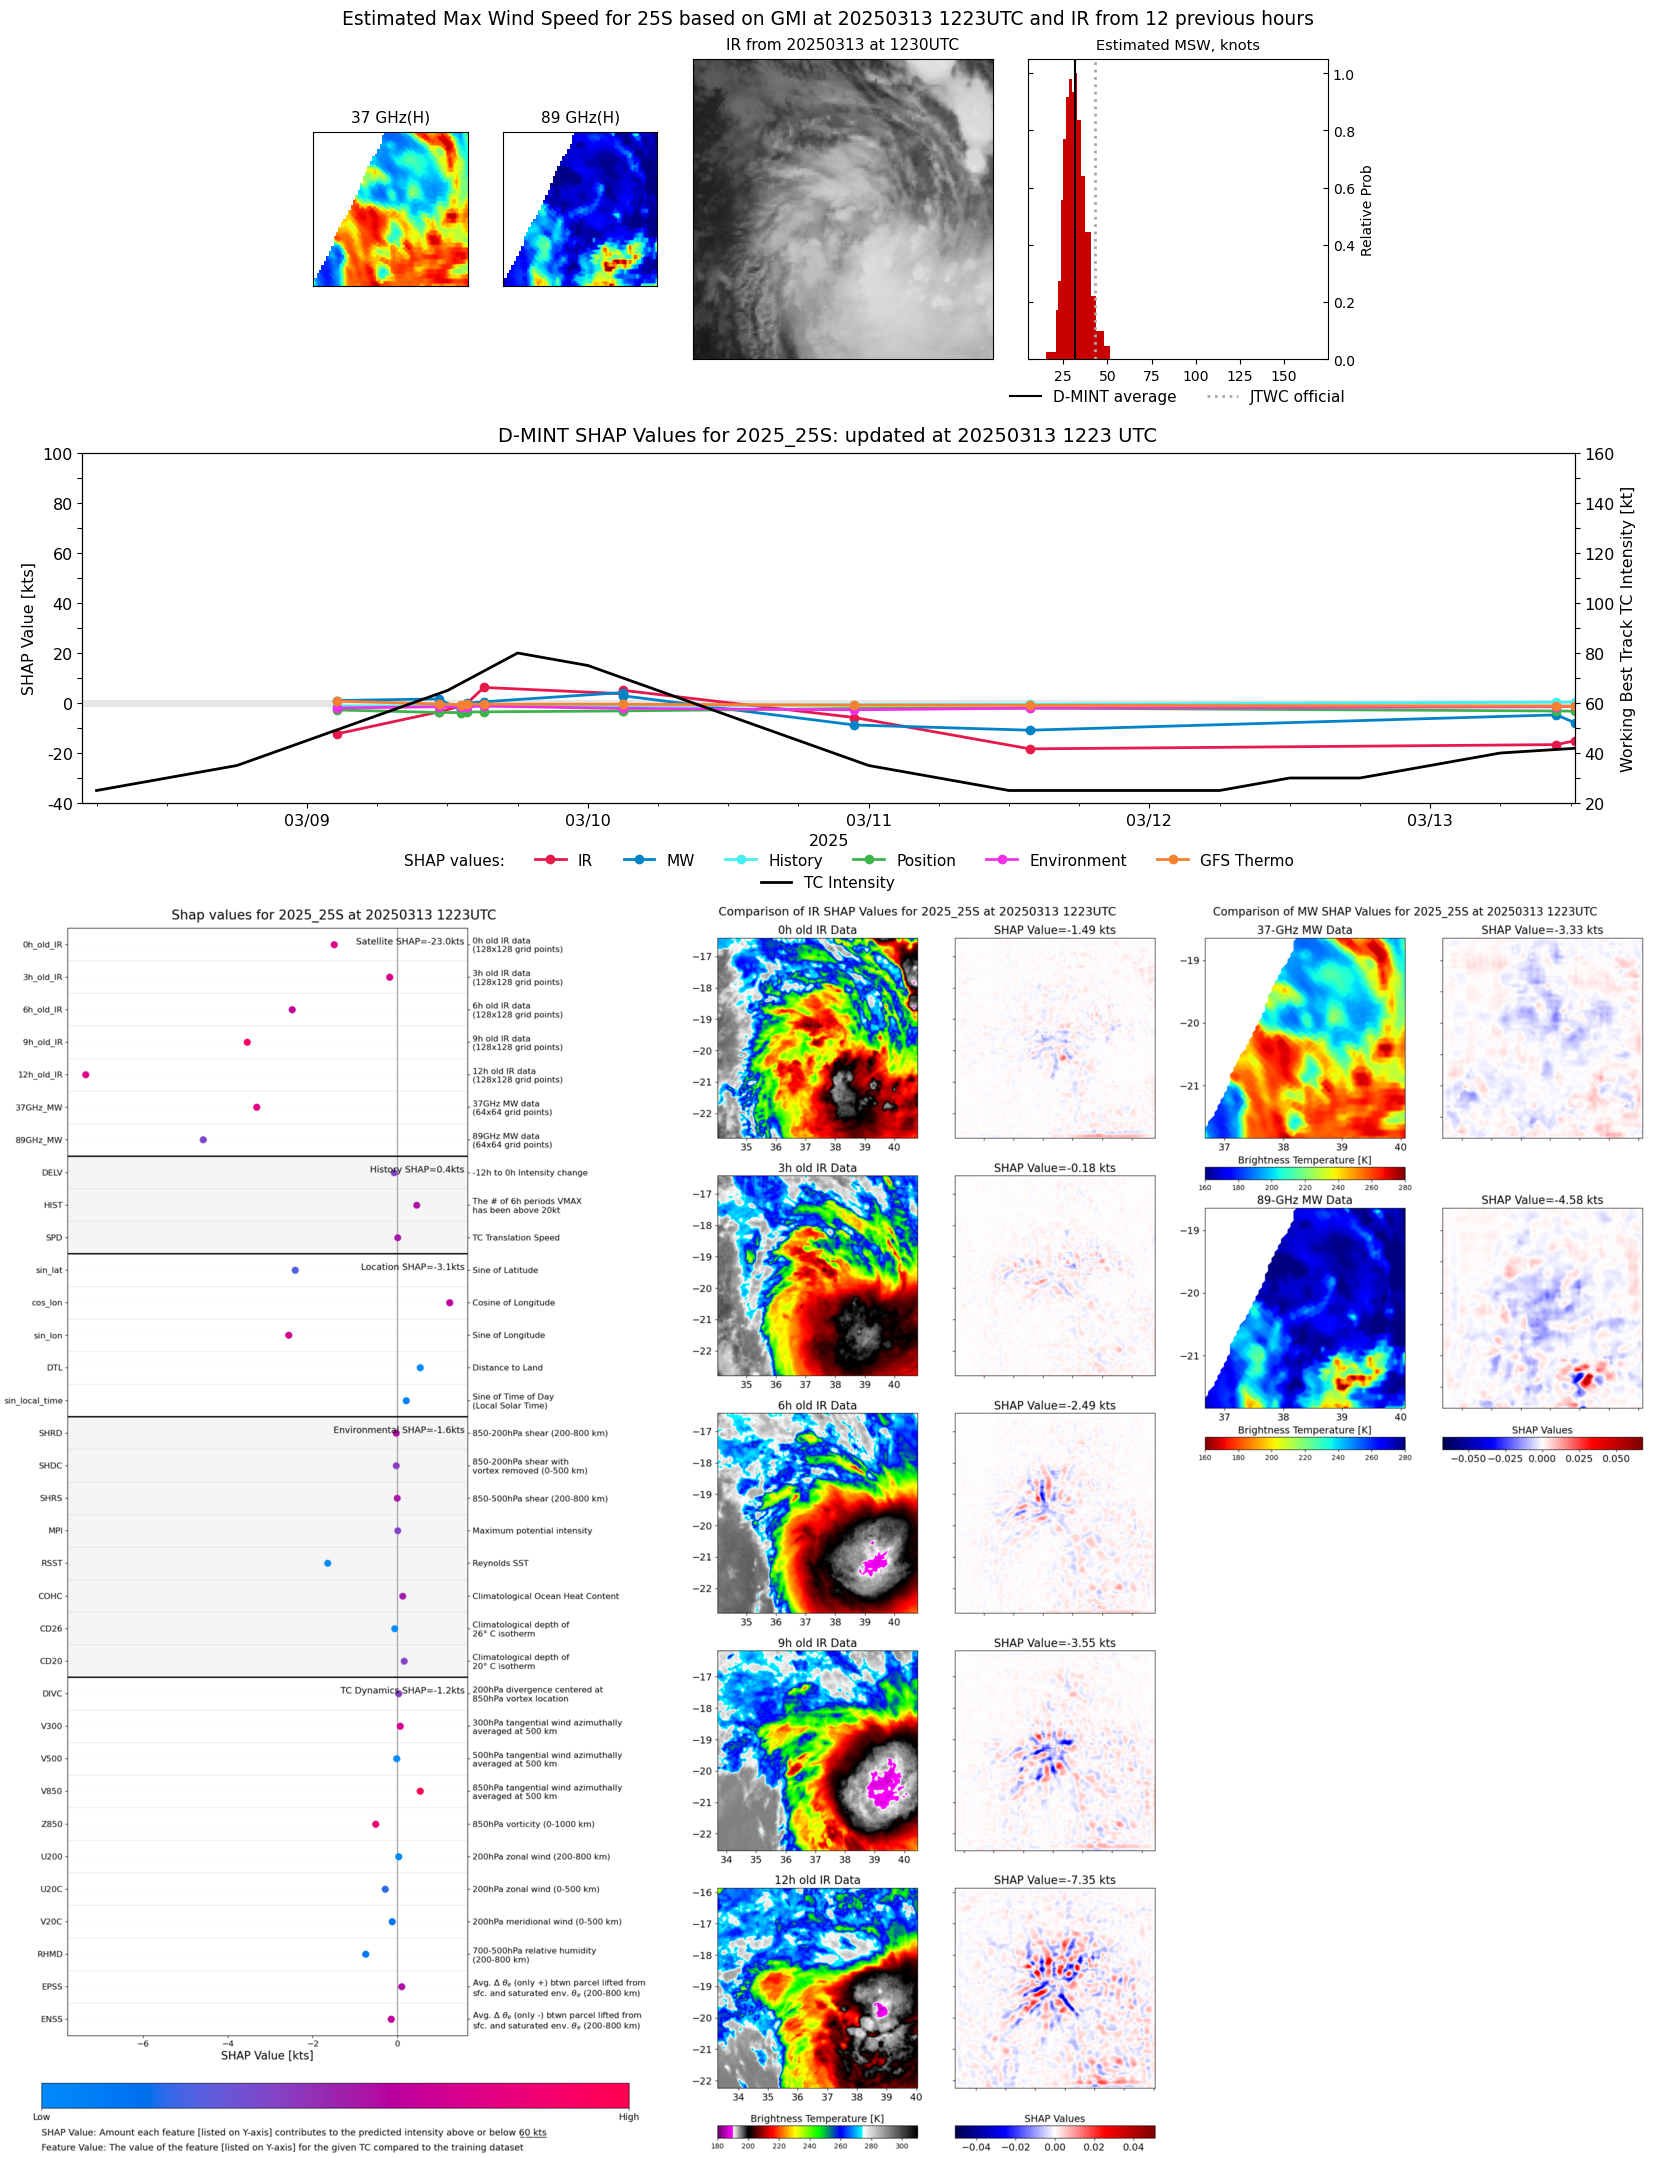 |
| 20250313 | 1048 UTC | AMSR2 | 999 hPa | 33 kts | 29 kts | 37 kts |  |
| 20250311 | 1348 UTC | GMI | 1003 hPa | 25 kts | 22 kts | 29 kts | 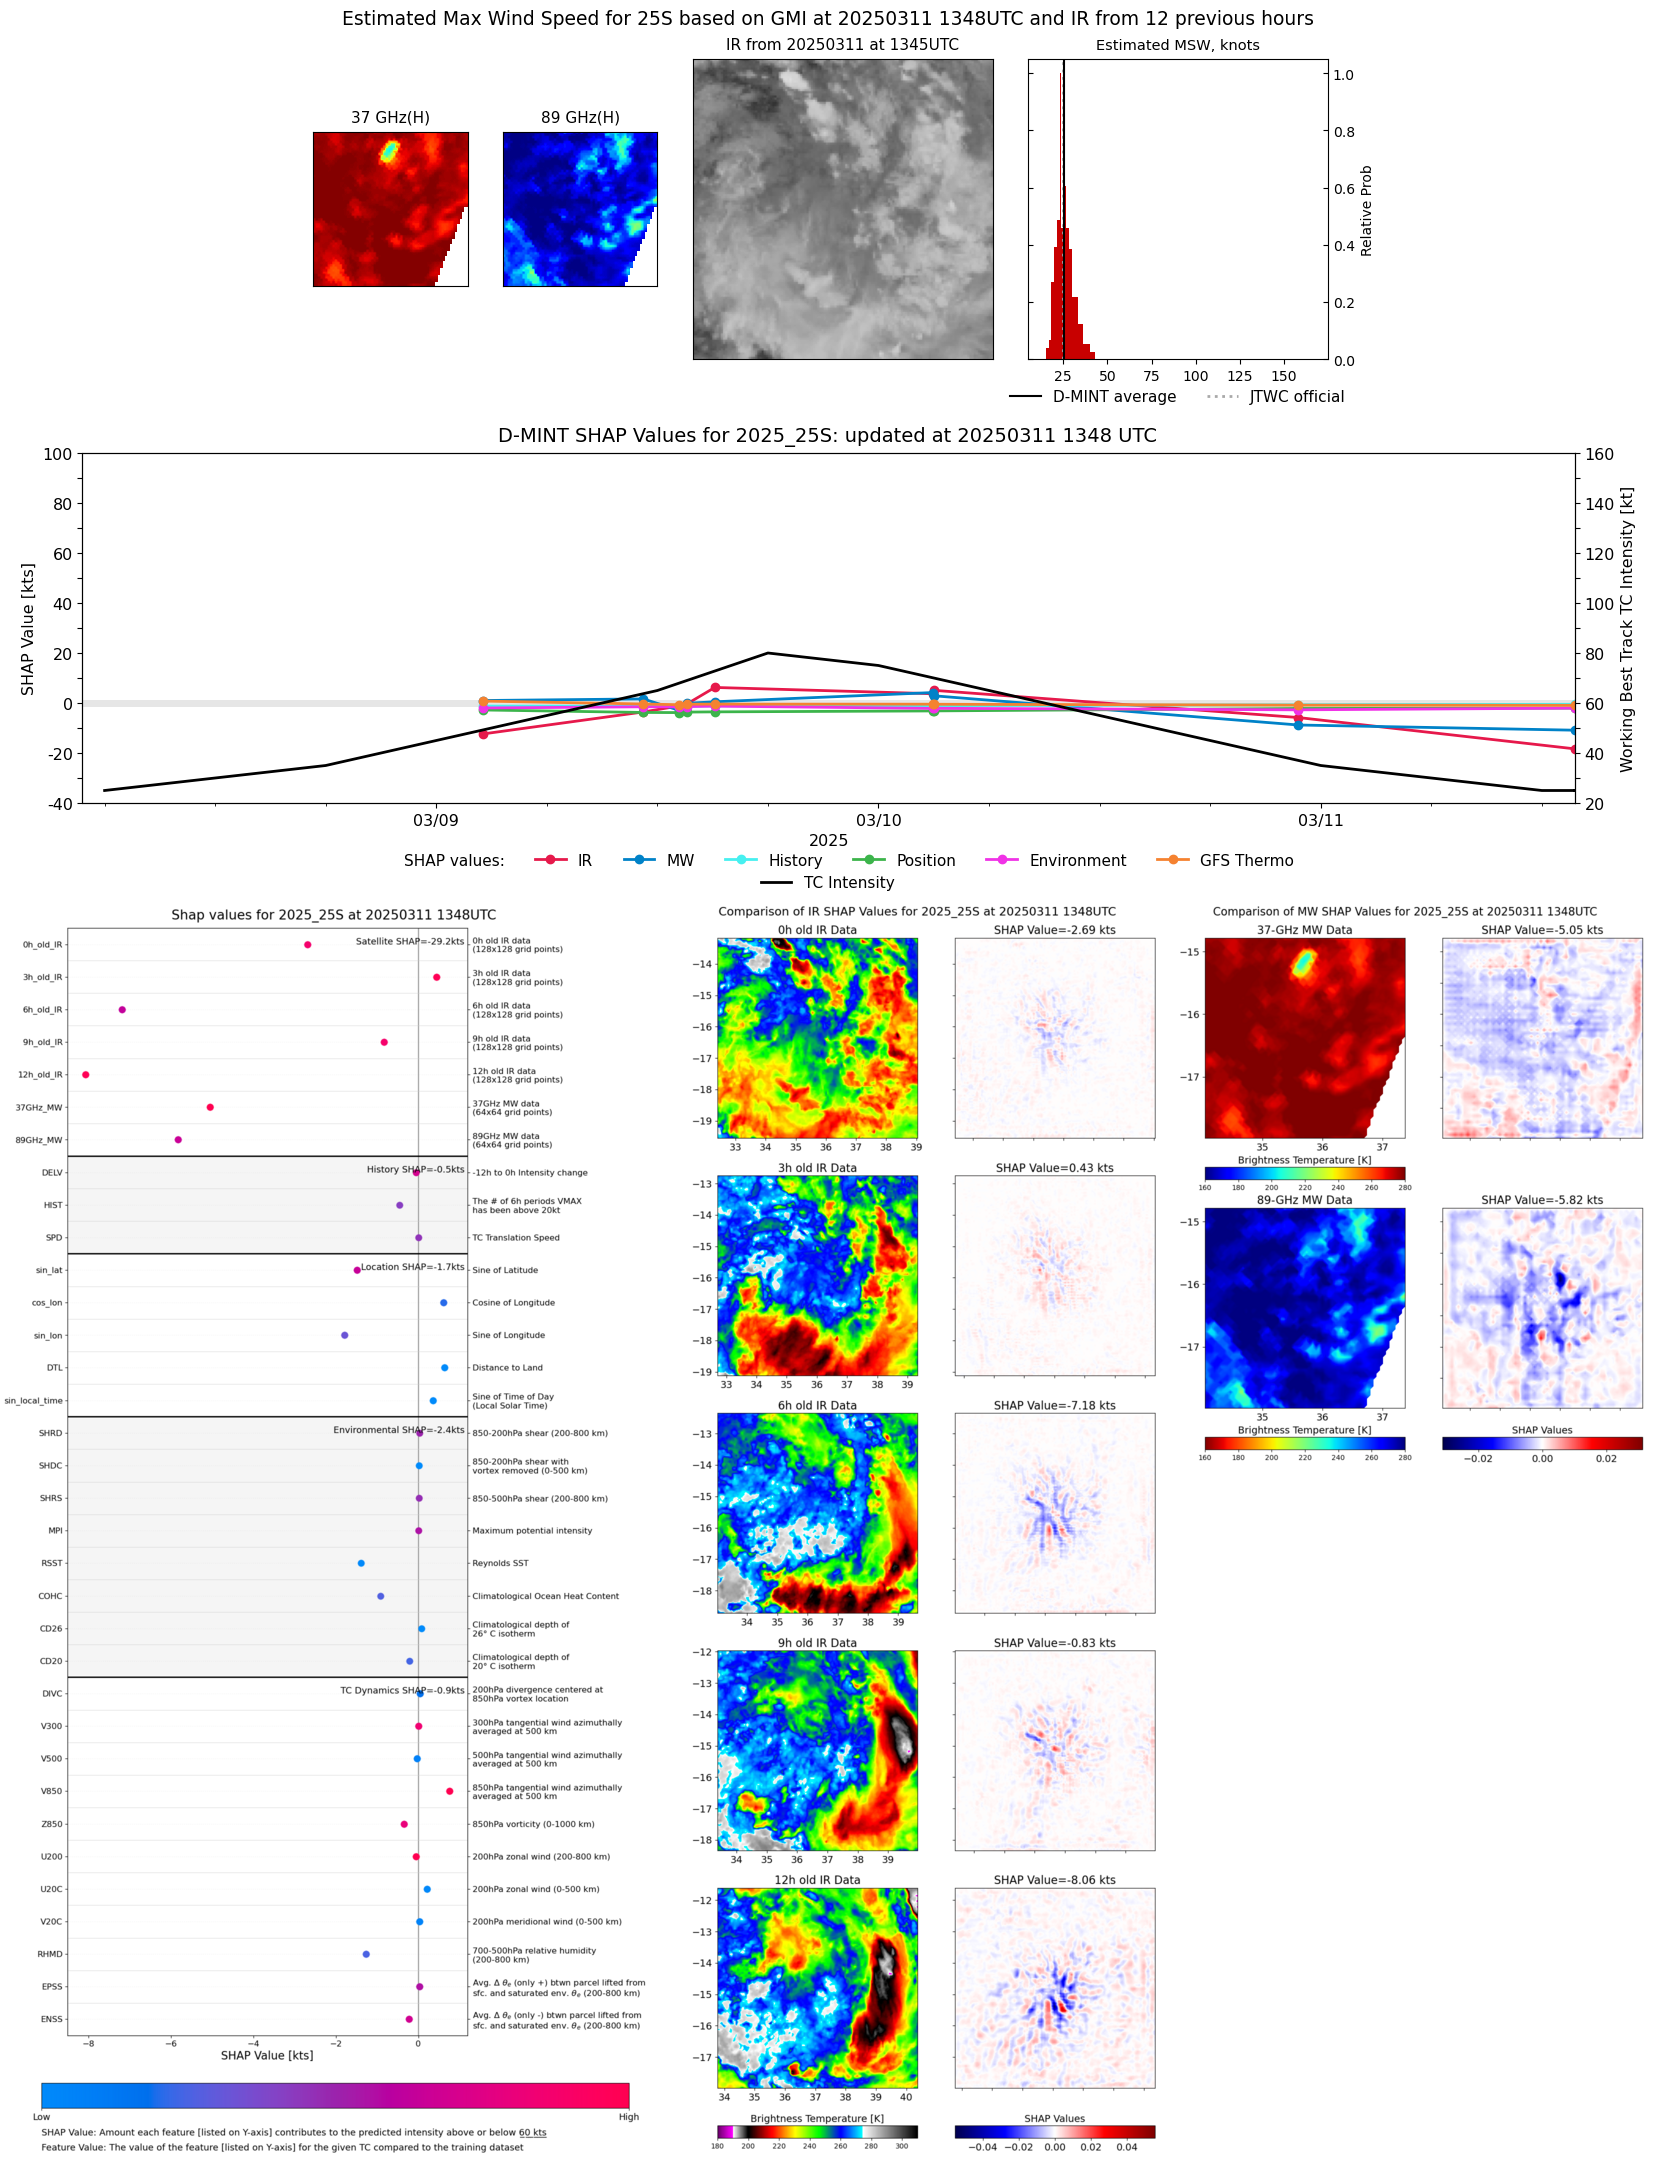 |
| 20250311 | 1059 UTC | ATMS-N20 | 1004 hPa | 29 kts | 25 kts | 34 kts |  |
| 20250311 | 0344 UTC | SSMISF17 | 999 hPa | 34 kts | 29 kts | 39 kts |  |
| 20250311 | 0218 UTC | GMI | 1000 hPa | 36 kts | 31 kts | 41 kts |  |
| 20250310 | 2247 UTC | AMSR2 | 998 hPa | 39 kts | 34 kts | 45 kts |  |
| 20250310 | 1545 UTC | SSMISF16 | 991 hPa | 53 kts | 46 kts | 59 kts |  |
| 20250310 | 1118 UTC | ATMS-N20 | 985 hPa | 41 kts | 36 kts | 46 kts |  |
| 20250310 | 1053 UTC | ATMS-N20 | 982 hPa | 48 kts | 42 kts | 53 kts |  |
| 20250310 | 0310 UTC | SSMISF16 | 966 hPa | 78 kts | 71 kts | 85 kts |  |
| 20250310 | 0302 UTC | GMI | 978 hPa | 61 kts | 54 kts | 68 kts | 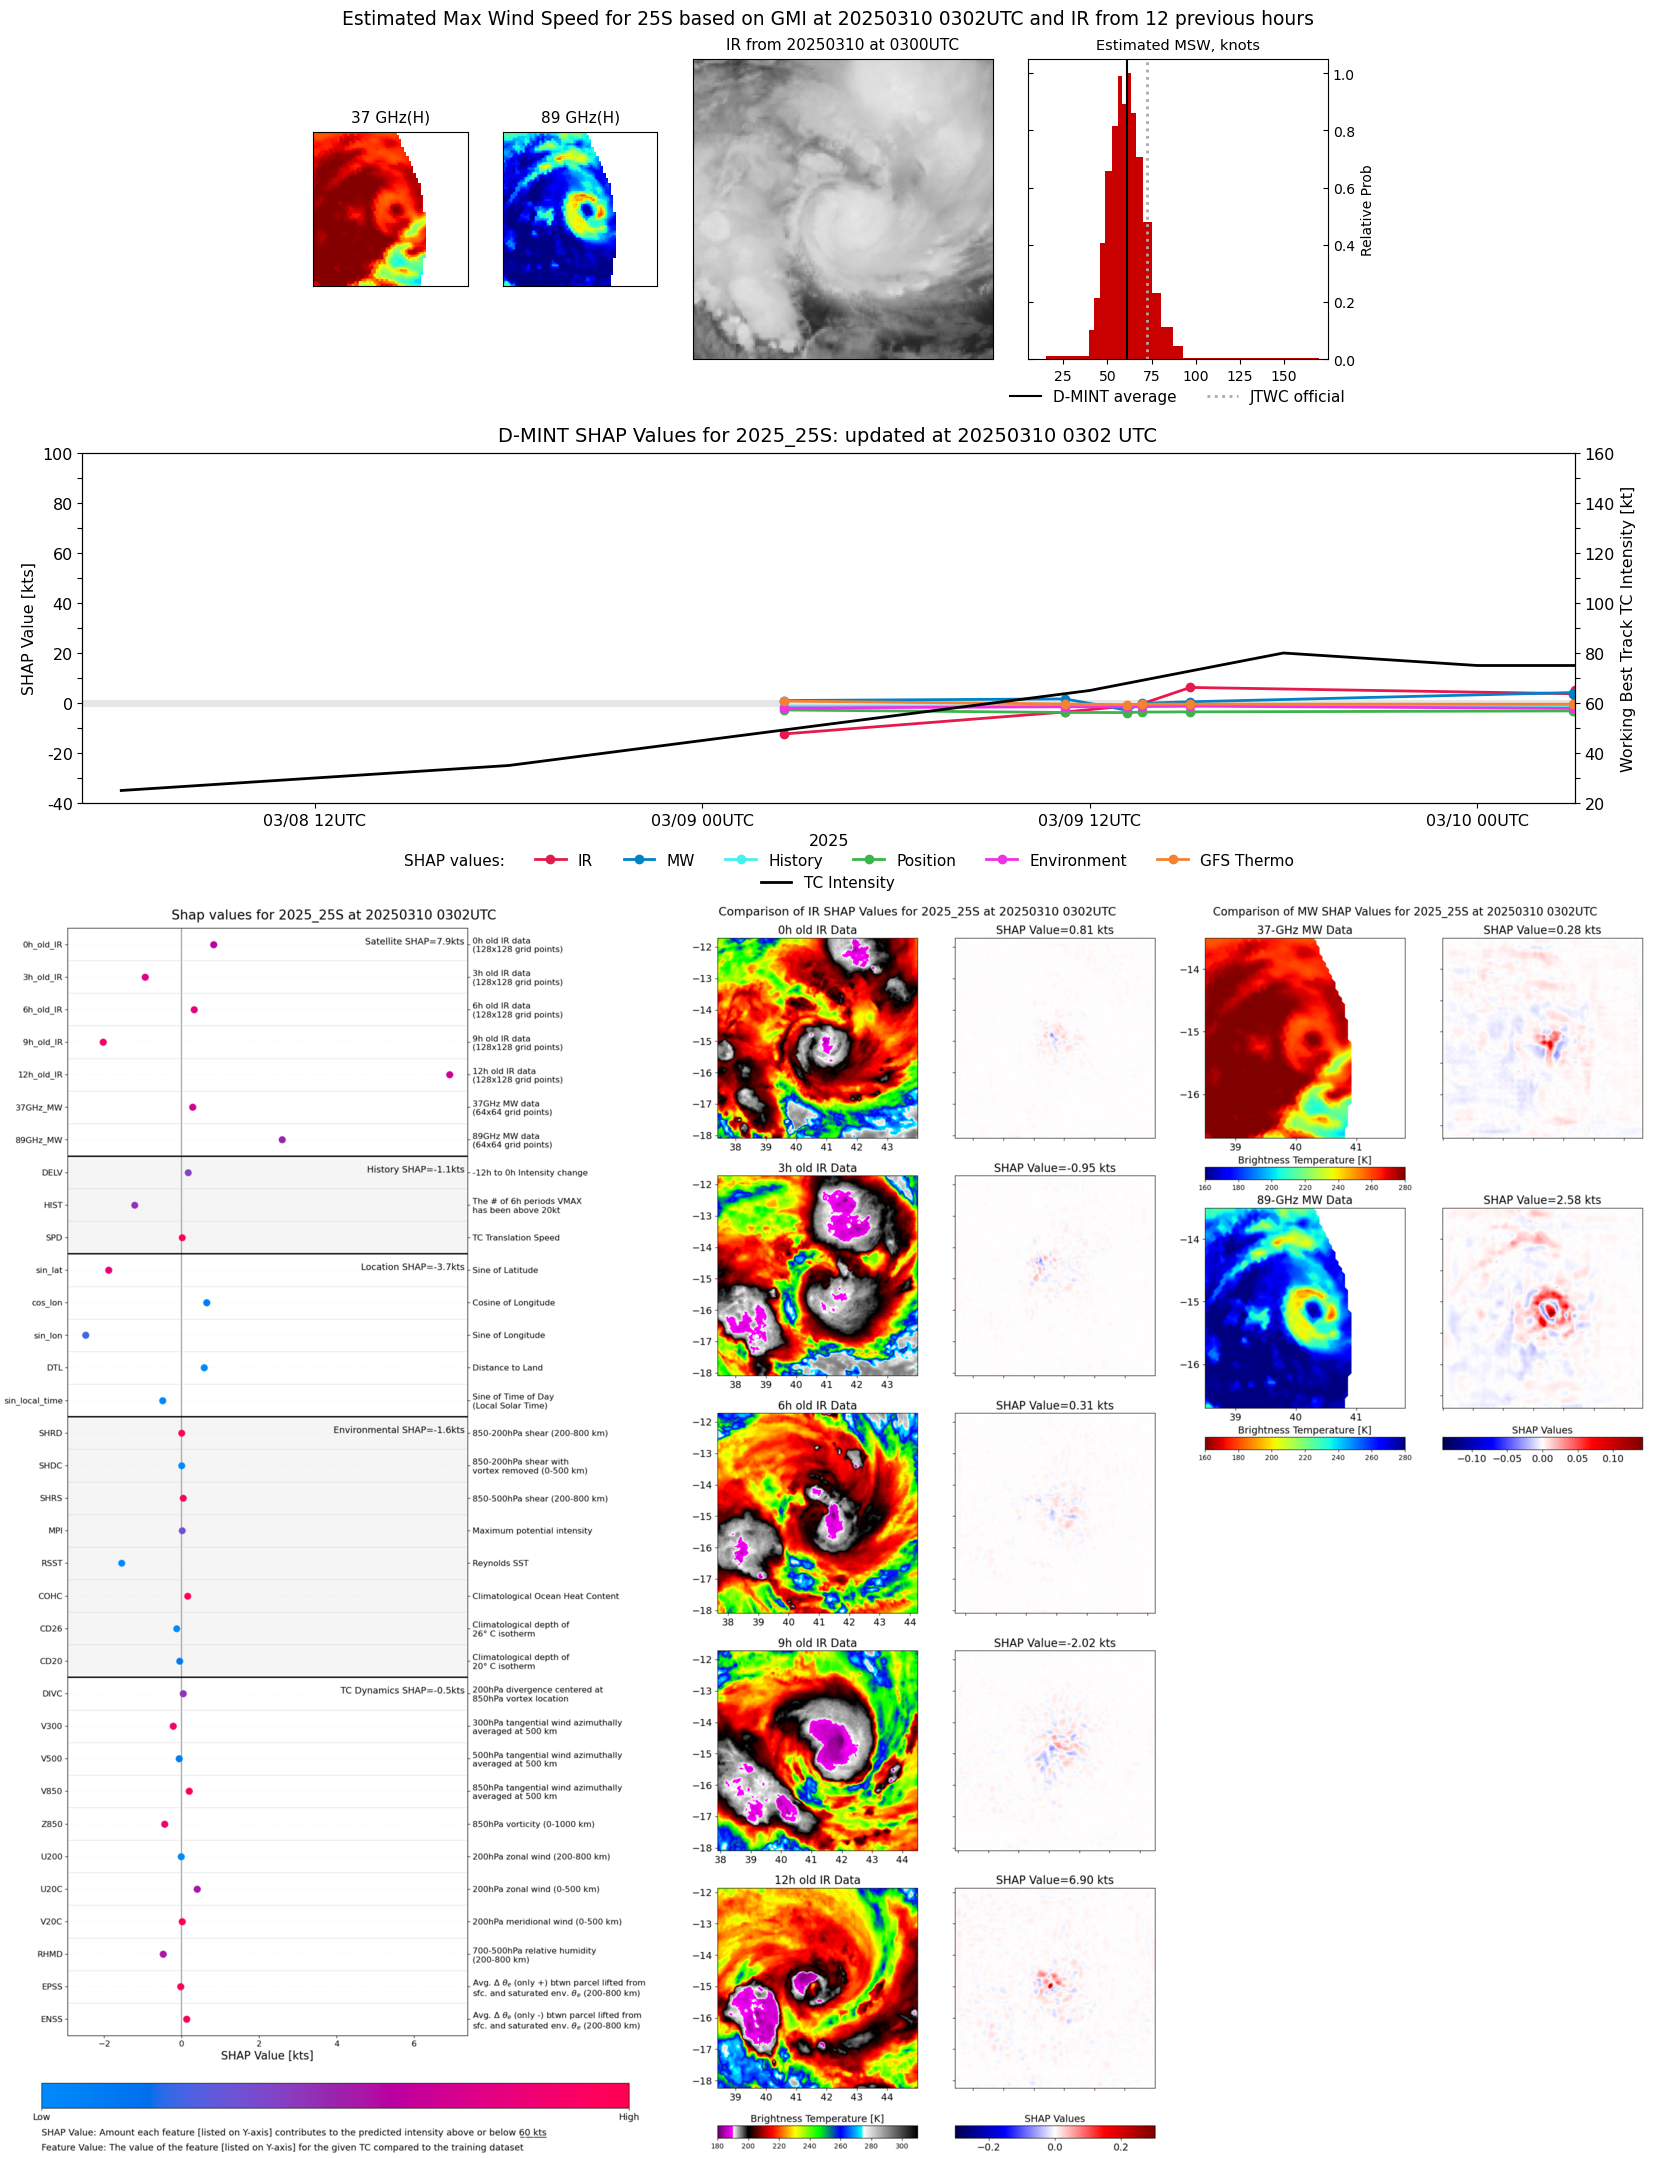 |
| 20250310 | 0258 UTC | GMI | 976 hPa | 61 kts | 54 kts | 68 kts | 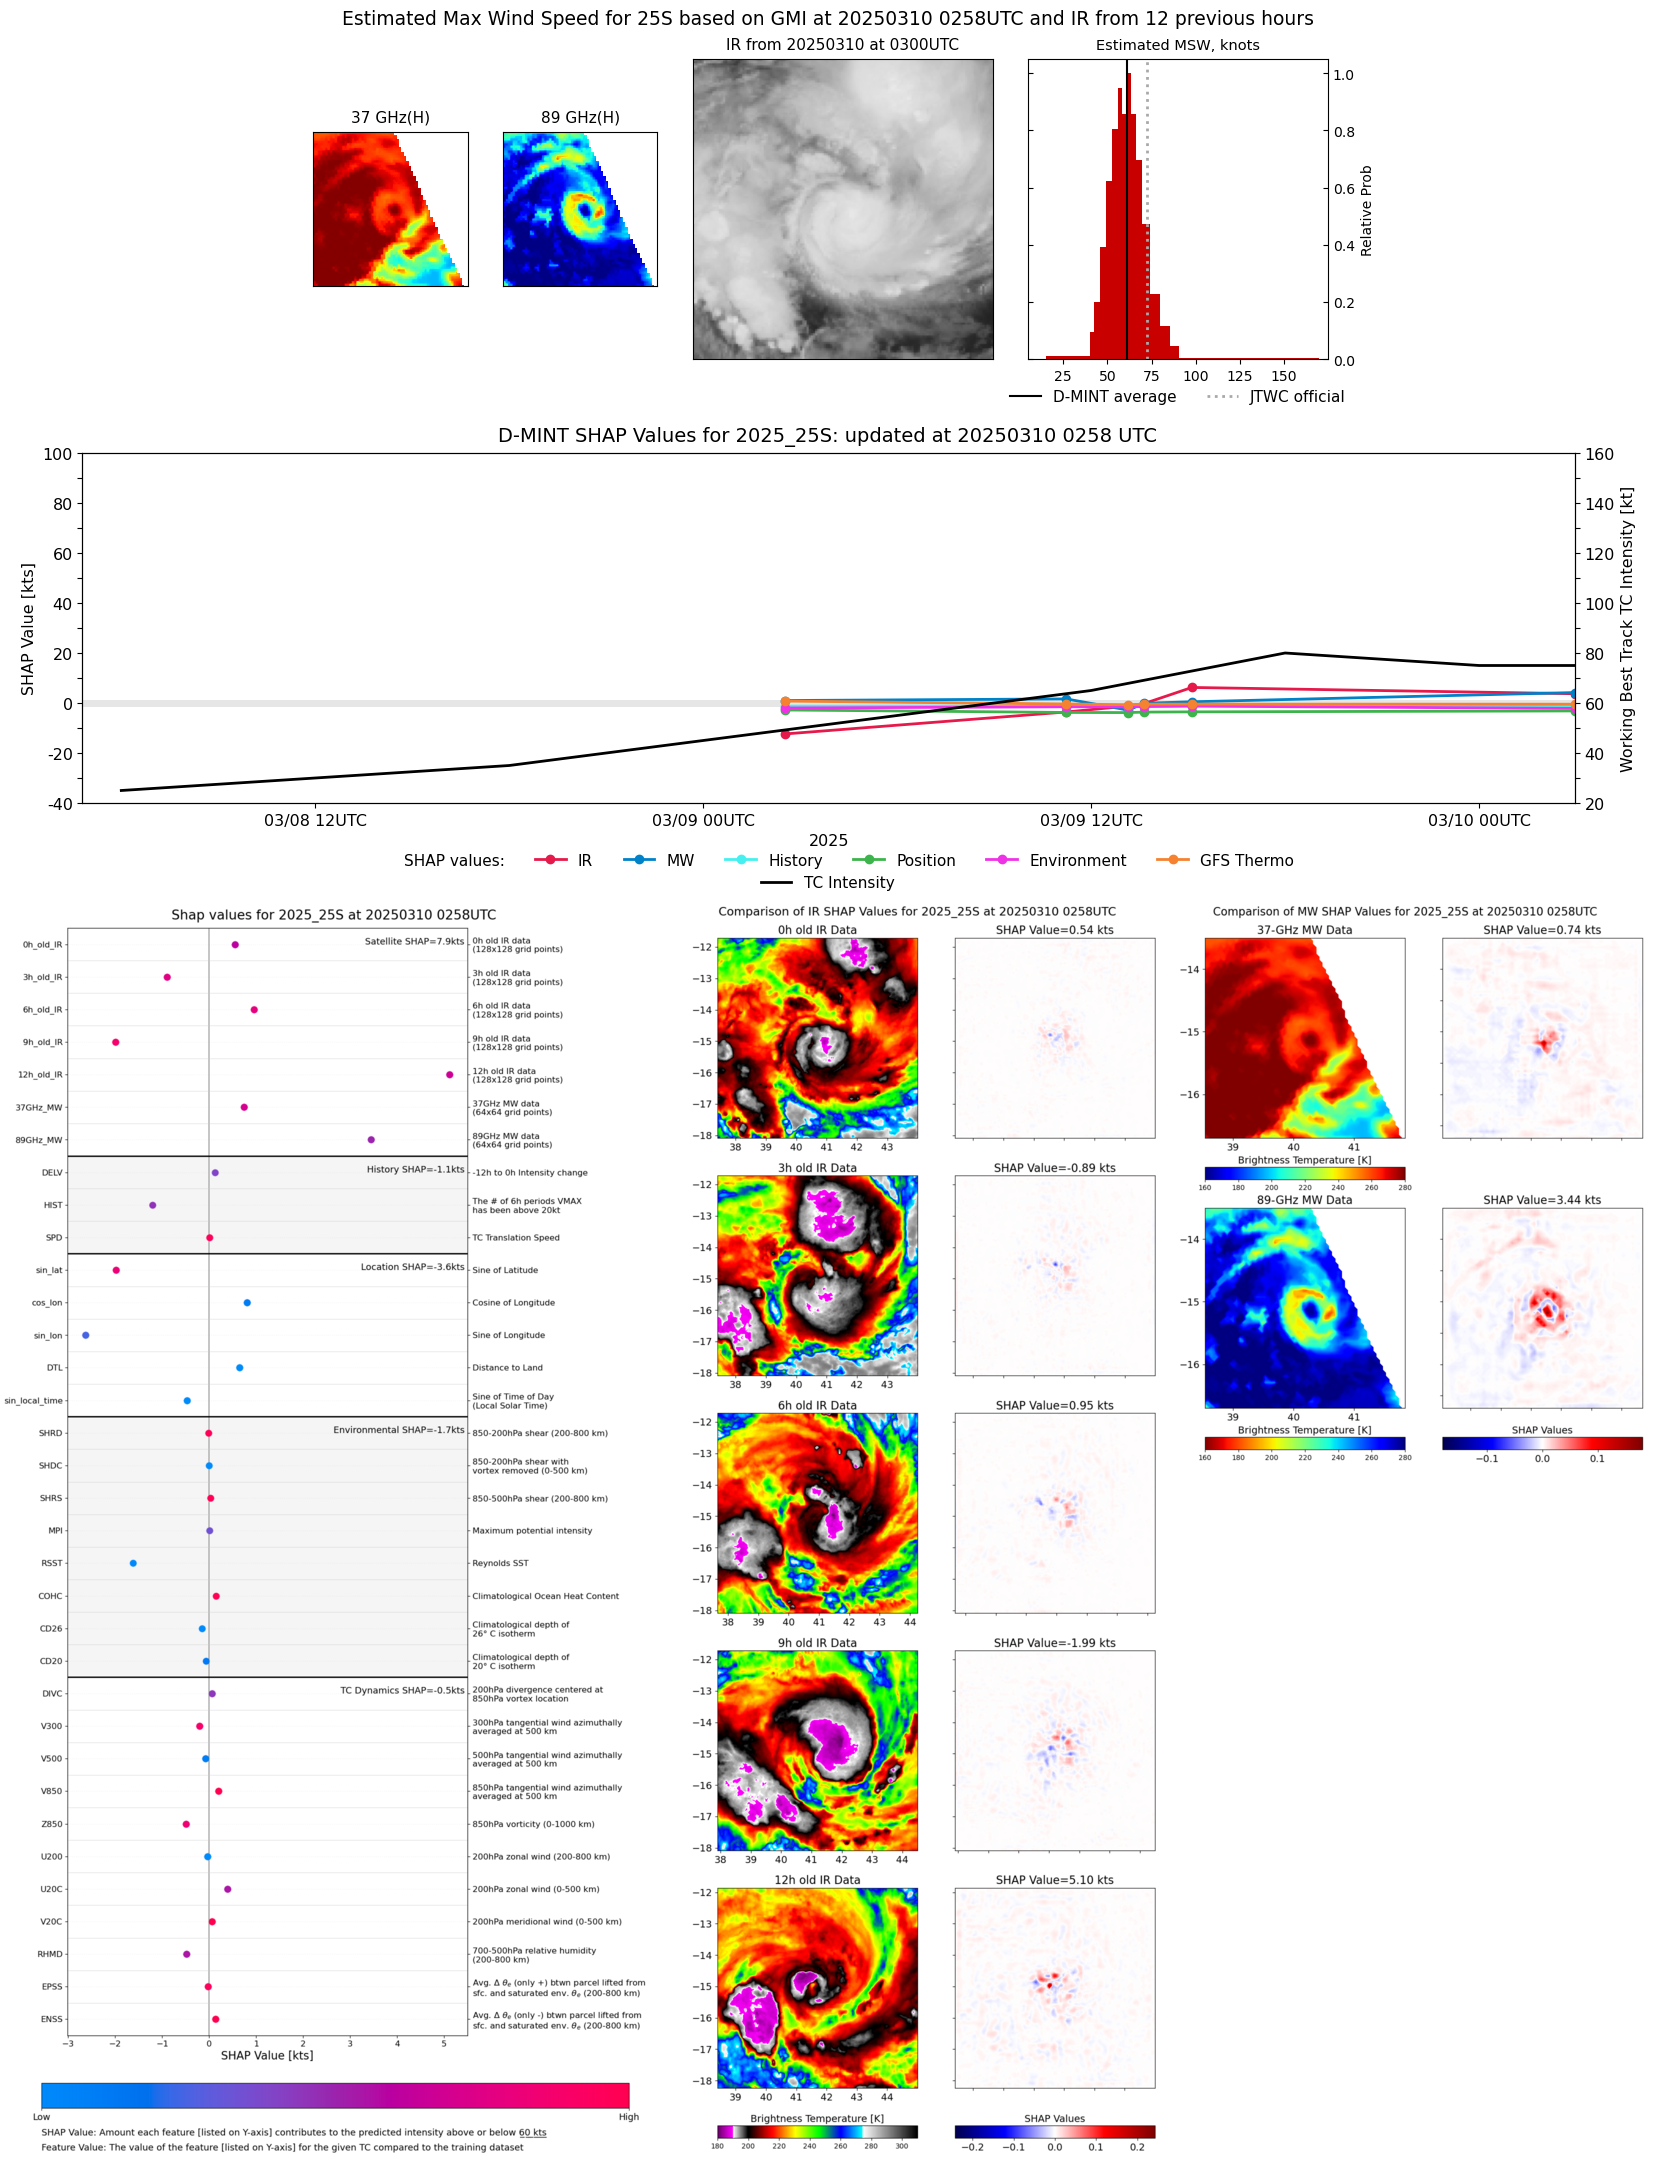 |
| 20250309 | 2220 UTC | ATMS-N20 | 983 hPa | 62 kts | 56 kts | 68 kts |  |
| 20250309 | 1559 UTC | SSMISF16 | 982 hPa | 53 kts | 47 kts | 59 kts |  |
| 20250309 | 1507 UTC | SSMISF17 | 982 hPa | 60 kts | 54 kts | 67 kts |  |
| 20250309 | 1338 UTC | GMI | 979 hPa | 53 kts | 47 kts | 59 kts | 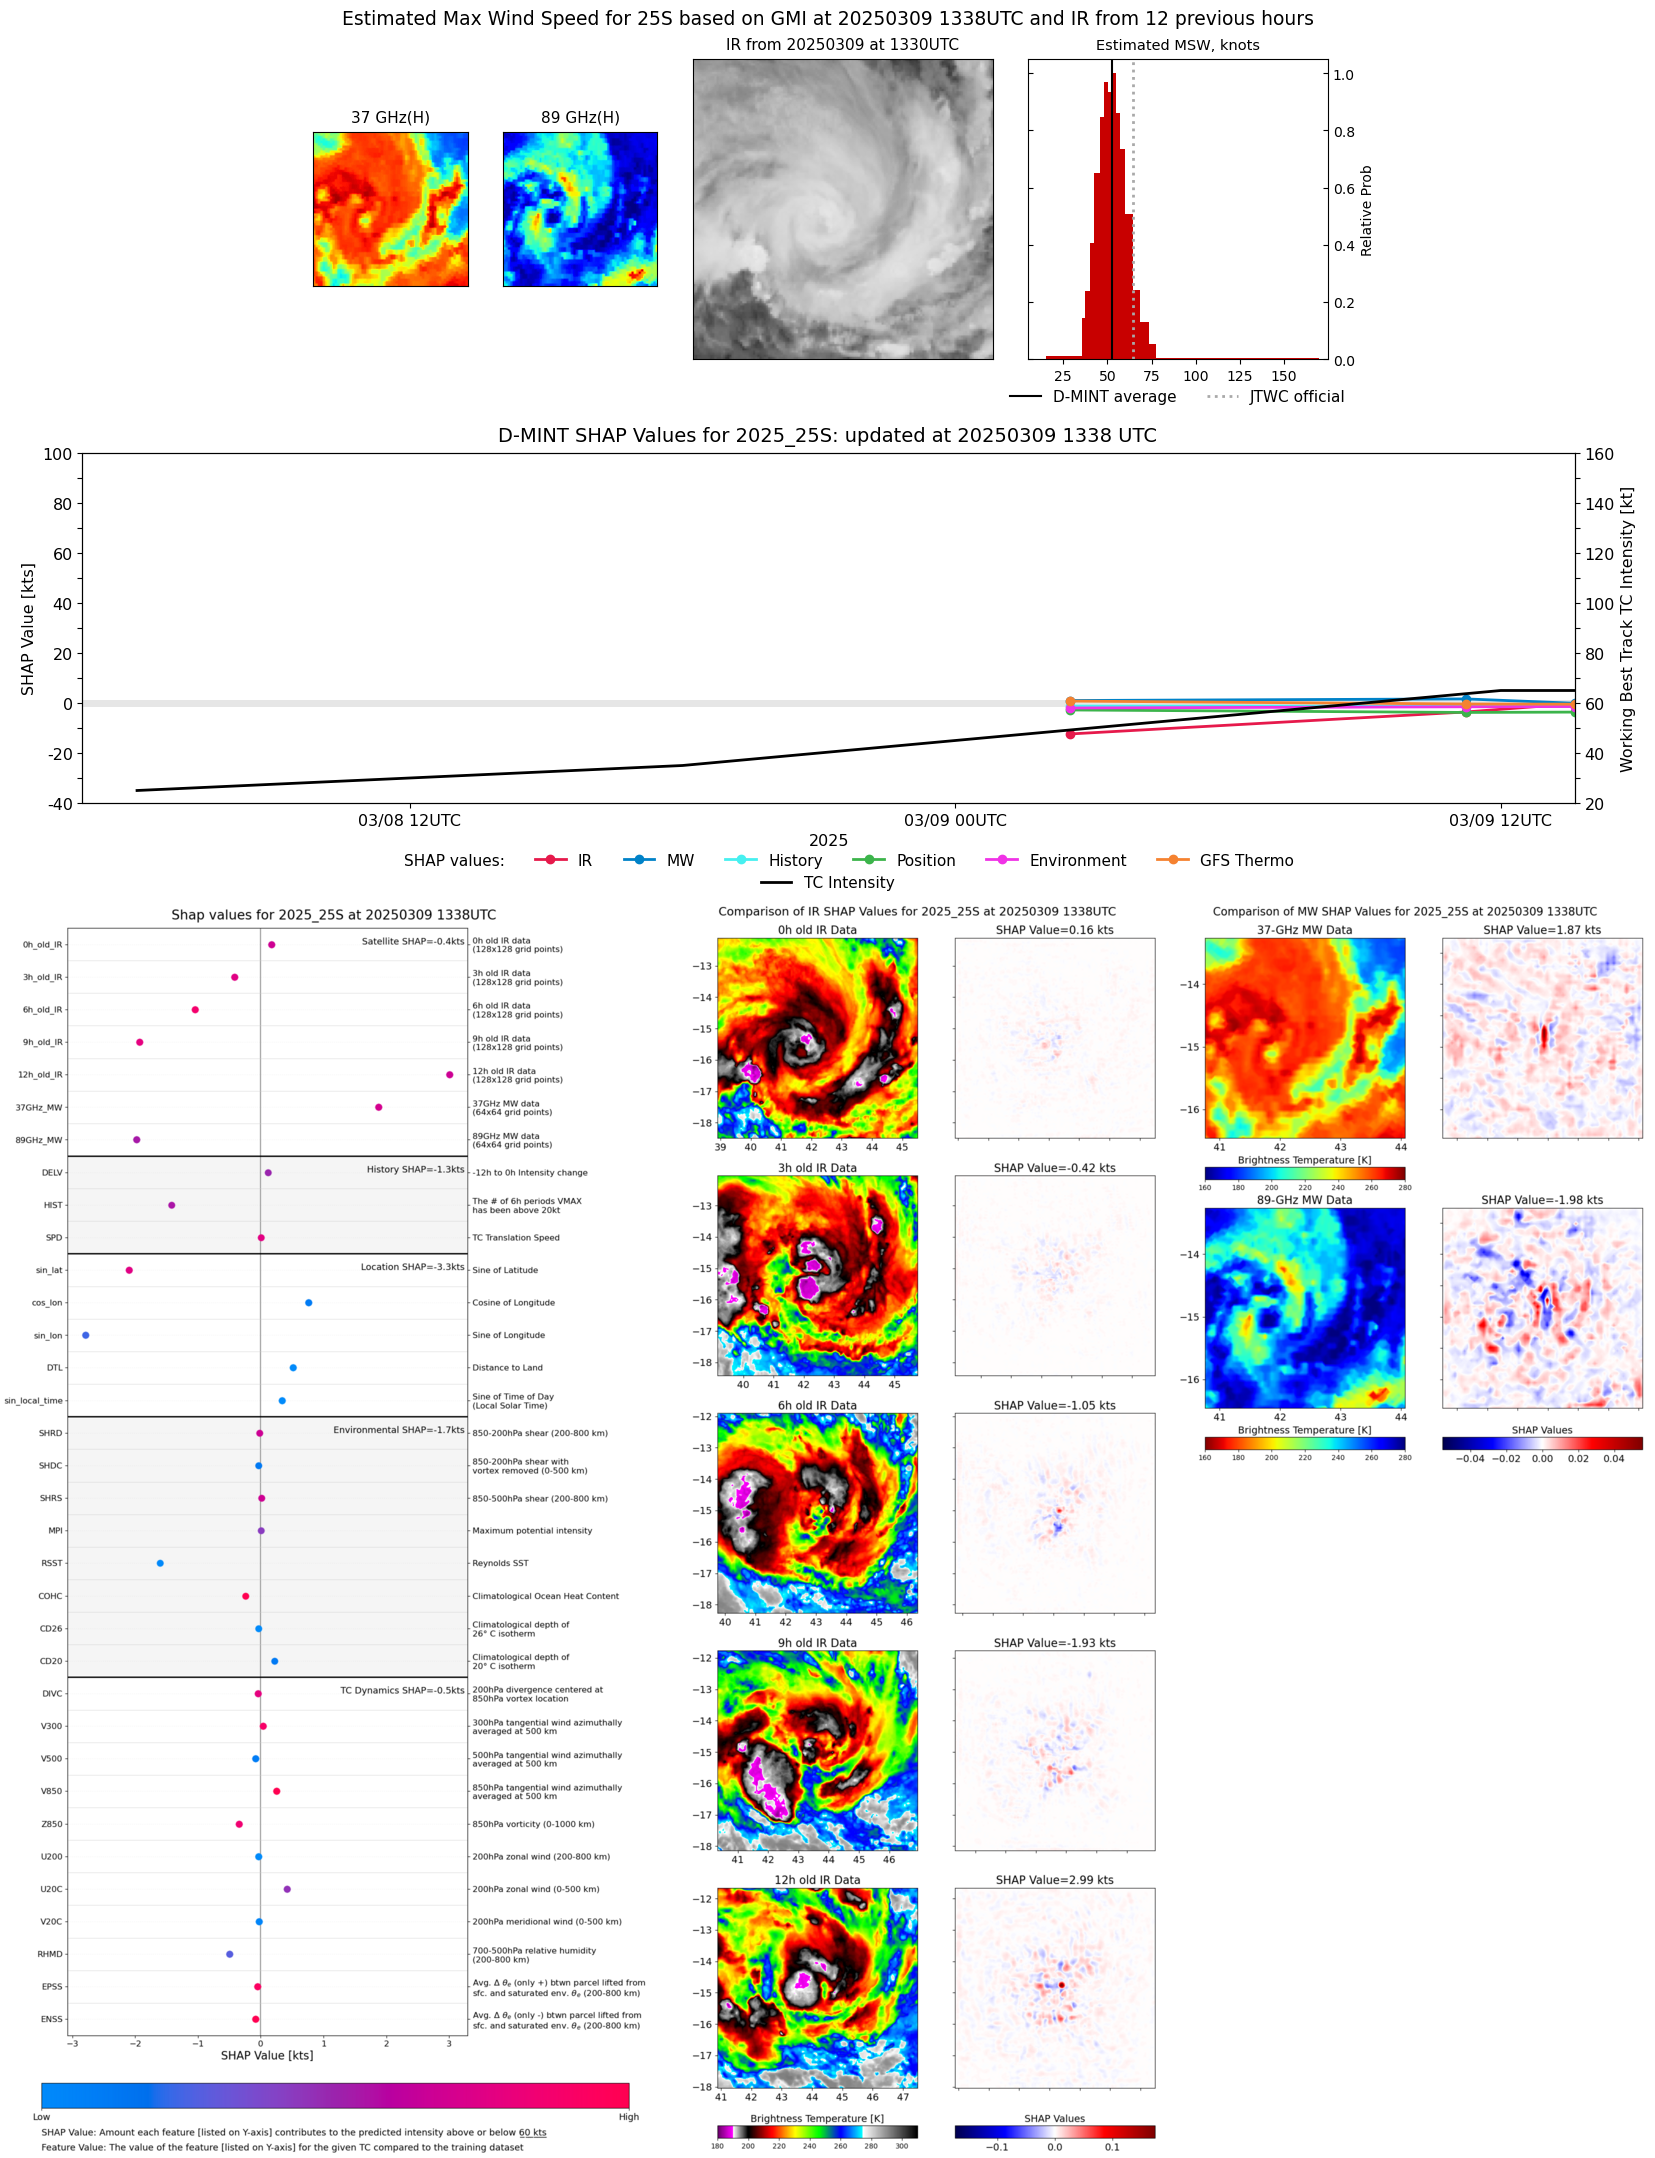 |
| 20250309 | 1309 UTC | SSMISF18 | 983 hPa | 48 kts | 42 kts | 55 kts |  |
| 20250309 | 1114 UTC | AMSR2 | 986 hPa | 51 kts | 46 kts | 57 kts |  |
| 20250309 | 0323 UTC | SSMISF16 | 988 hPa | 46 kts | 41 kts | 51 kts |  |
| 20250309 | 0232 UTC | SSMISF17 | 989 hPa | 43 kts | 39 kts | 48 kts |  |
| 20250309 | 0035 UTC | SSMISF18 | 991 hPa | 39 kts | 35 kts | 44 kts |  |
| 20250308 | 2238 UTC | ATMS-N20 | 994 hPa | 38 kts | 33 kts | 42 kts |  |
| 20250308 | 1825 UTC | TROPICS06 | 996 hPa | 37 kts | 33 kts | 41 kts |  |
| 20250308 | 1015 UTC | ATMS-N20 | 1004 hPa | 30 kts | 26 kts | 35 kts |  |
| 20250307 | 1935 UTC | TROPICS05 | 1004 hPa | 28 kts | 26 kts | 31 kts |  |