|
||

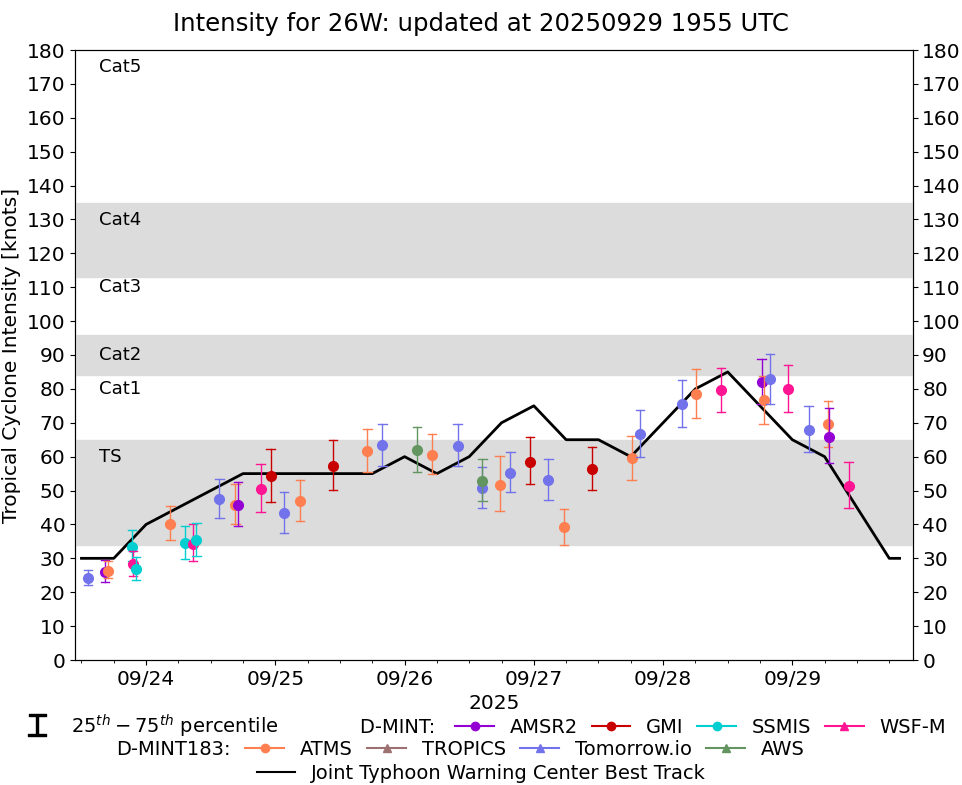 |
D-MINT HISTORY FILE for 2025_26W
| Date | Time | MW Sensor | MSLP | Vmax (30th-70th percentile average) | Vmax 25th percentile | Vmax 75th percentile | Image |
| 20250929 | 1027 UTC | WSFM01 | 989 hPa | 51 kts | 45 kts | 58 kts | 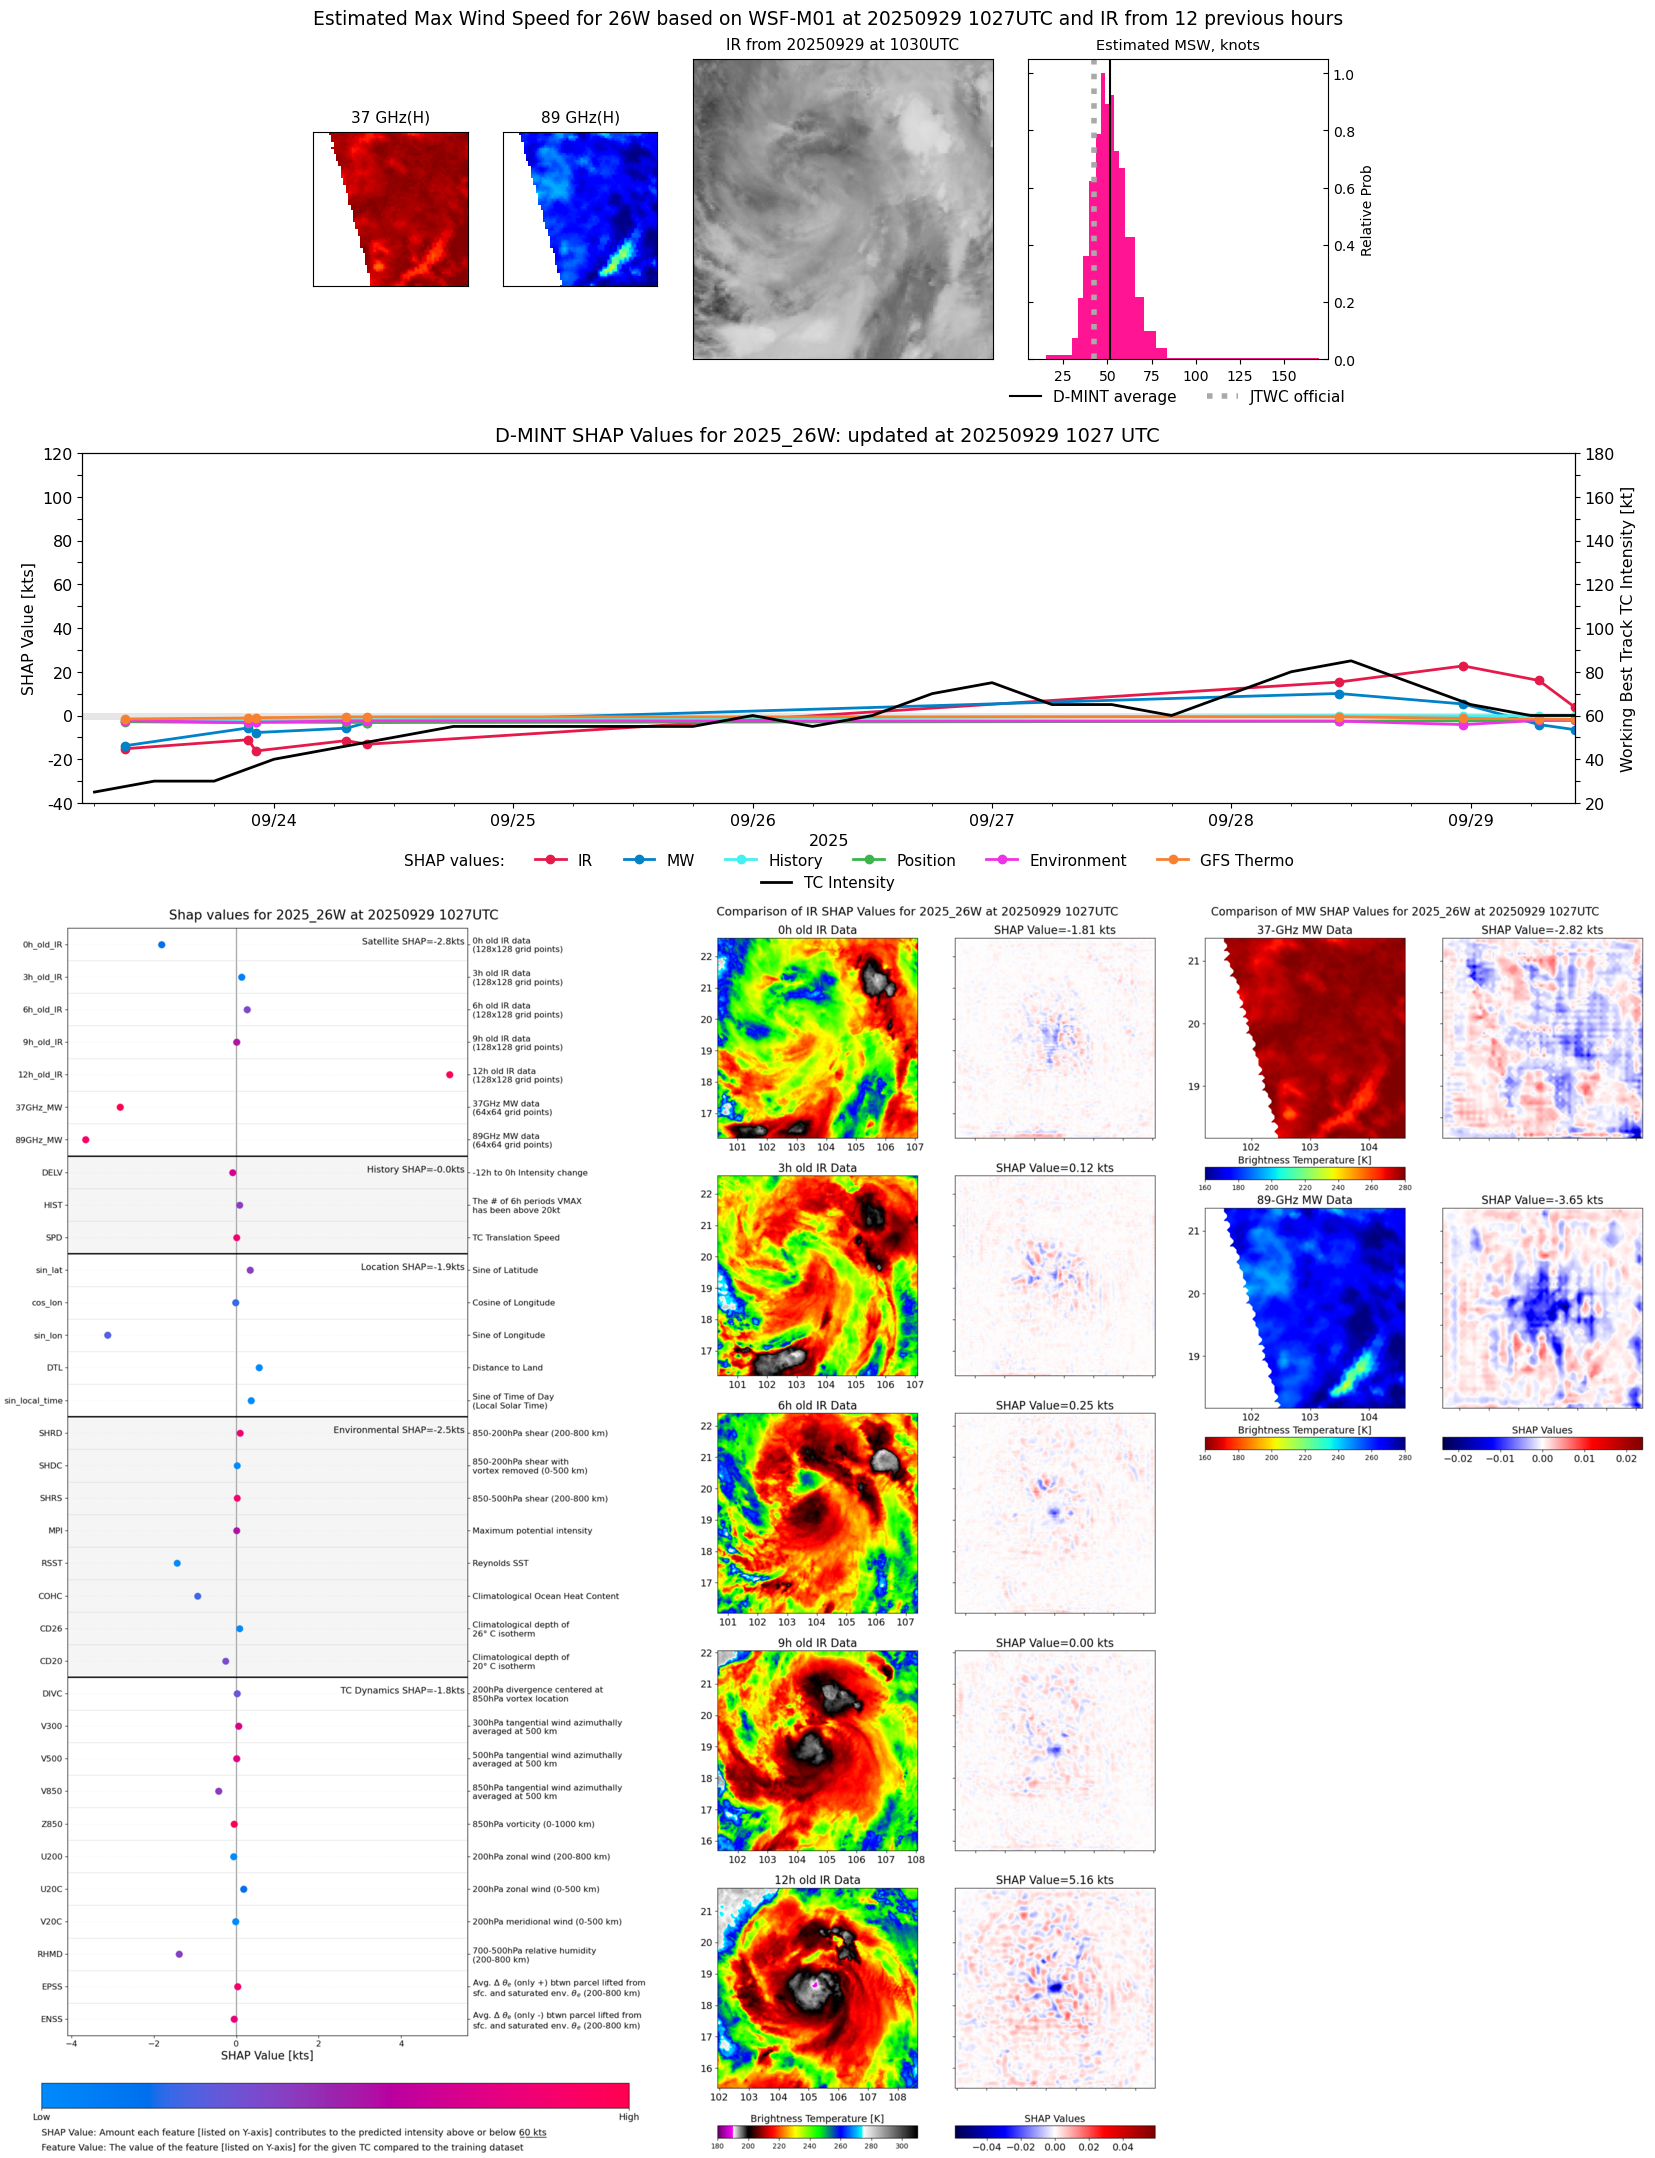 |
| 20250929 | 0650 UTC | AMSR2 | 984 hPa | 66 kts | 58 kts | 74 kts | 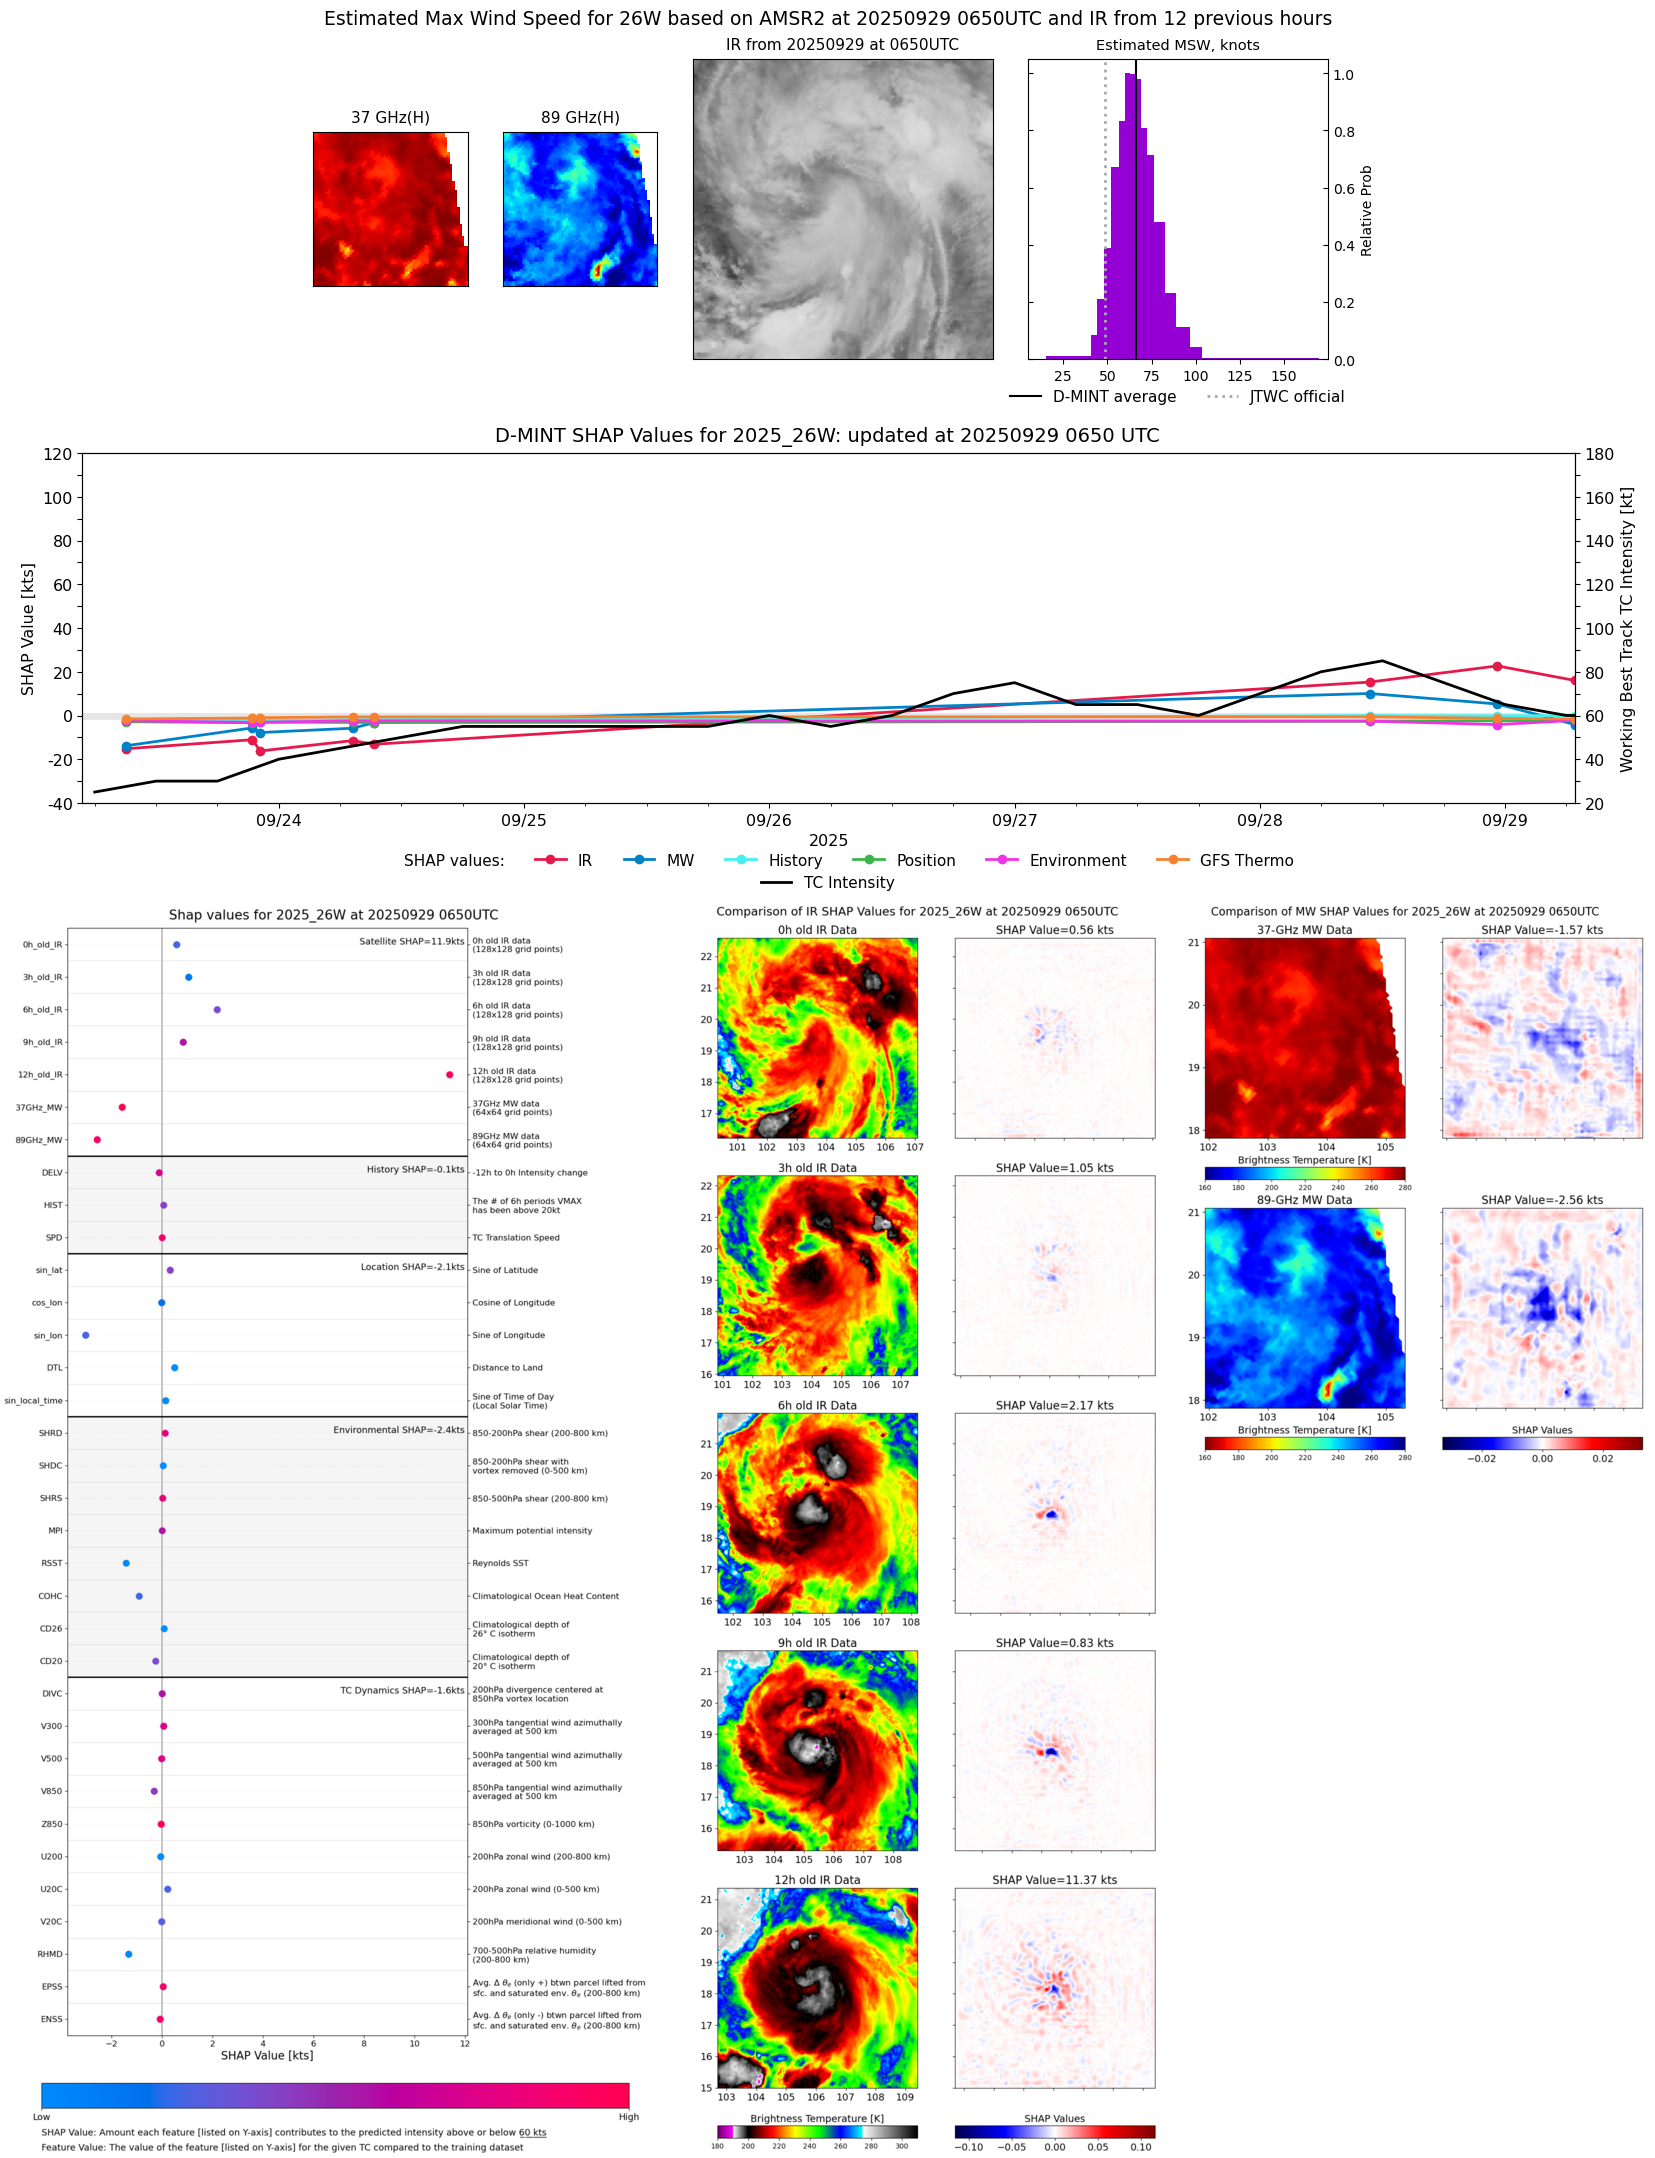 |
| 20250929 | 0640 UTC | ATMS-N20 | 974 hPa | 70 kts | 63 kts | 77 kts | 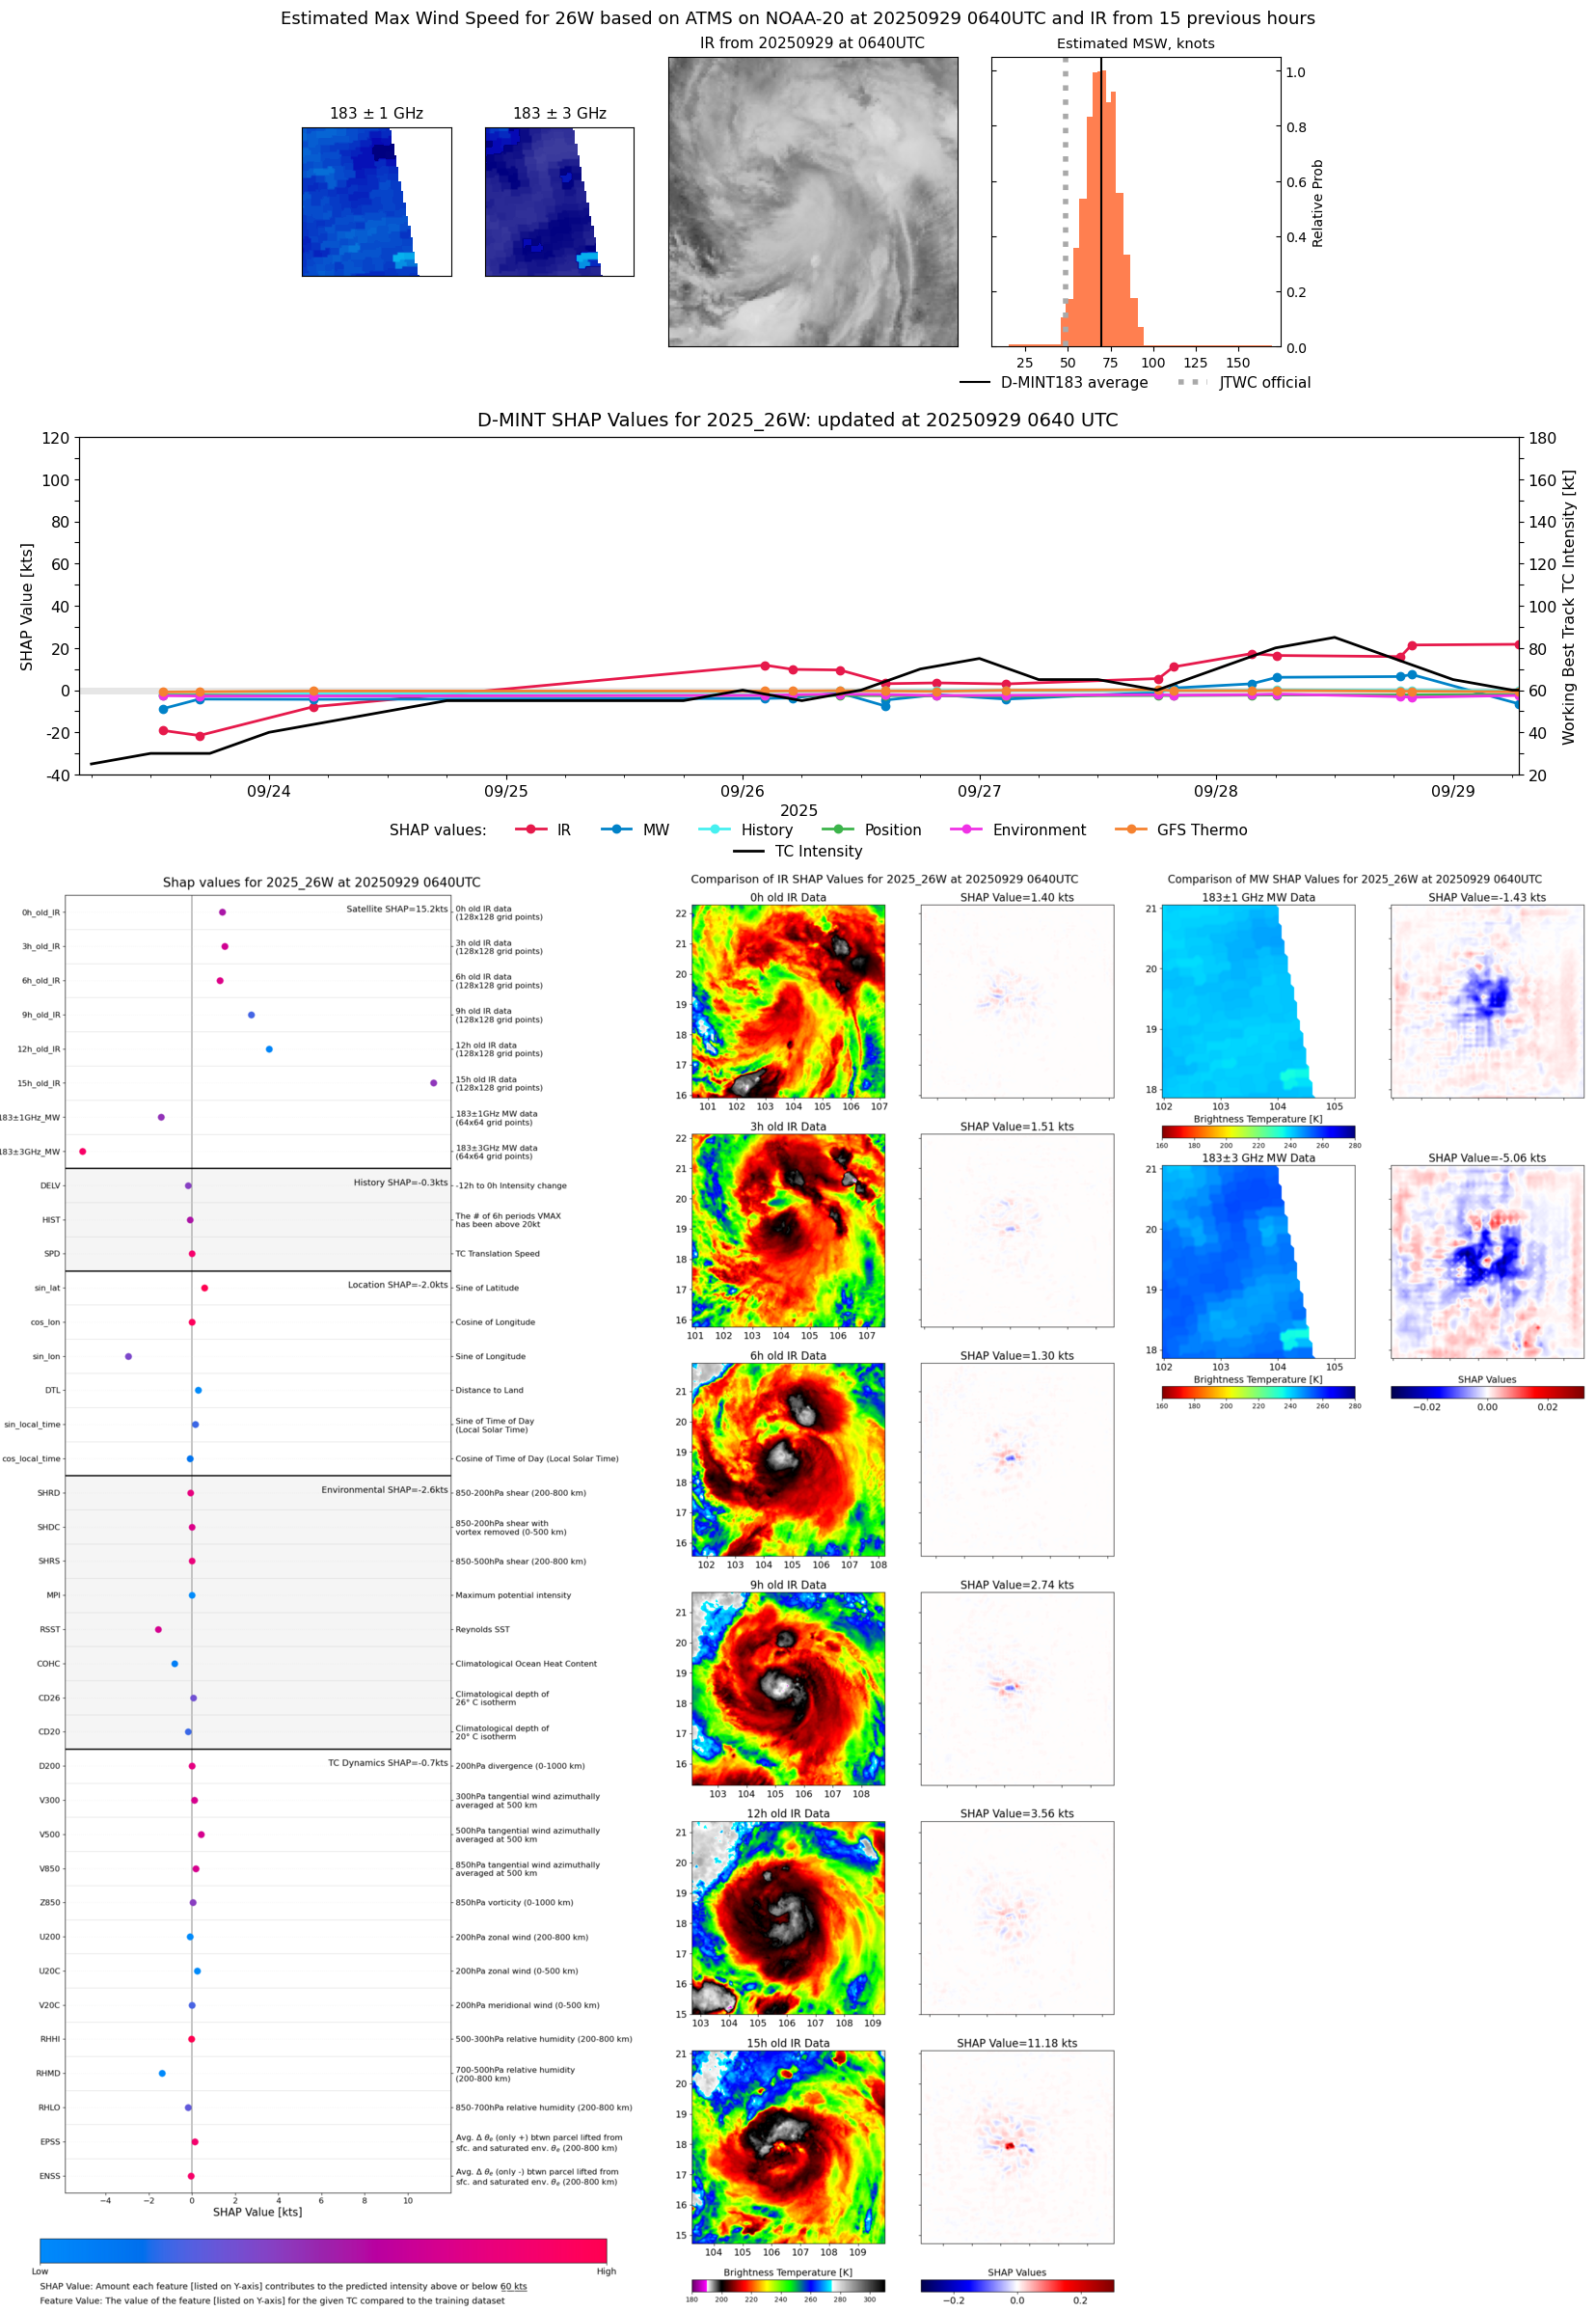 |
| 20250929 | 0302 UTC | TMS06 | 967 hPa | 68 kts | 61 kts | 75 kts | 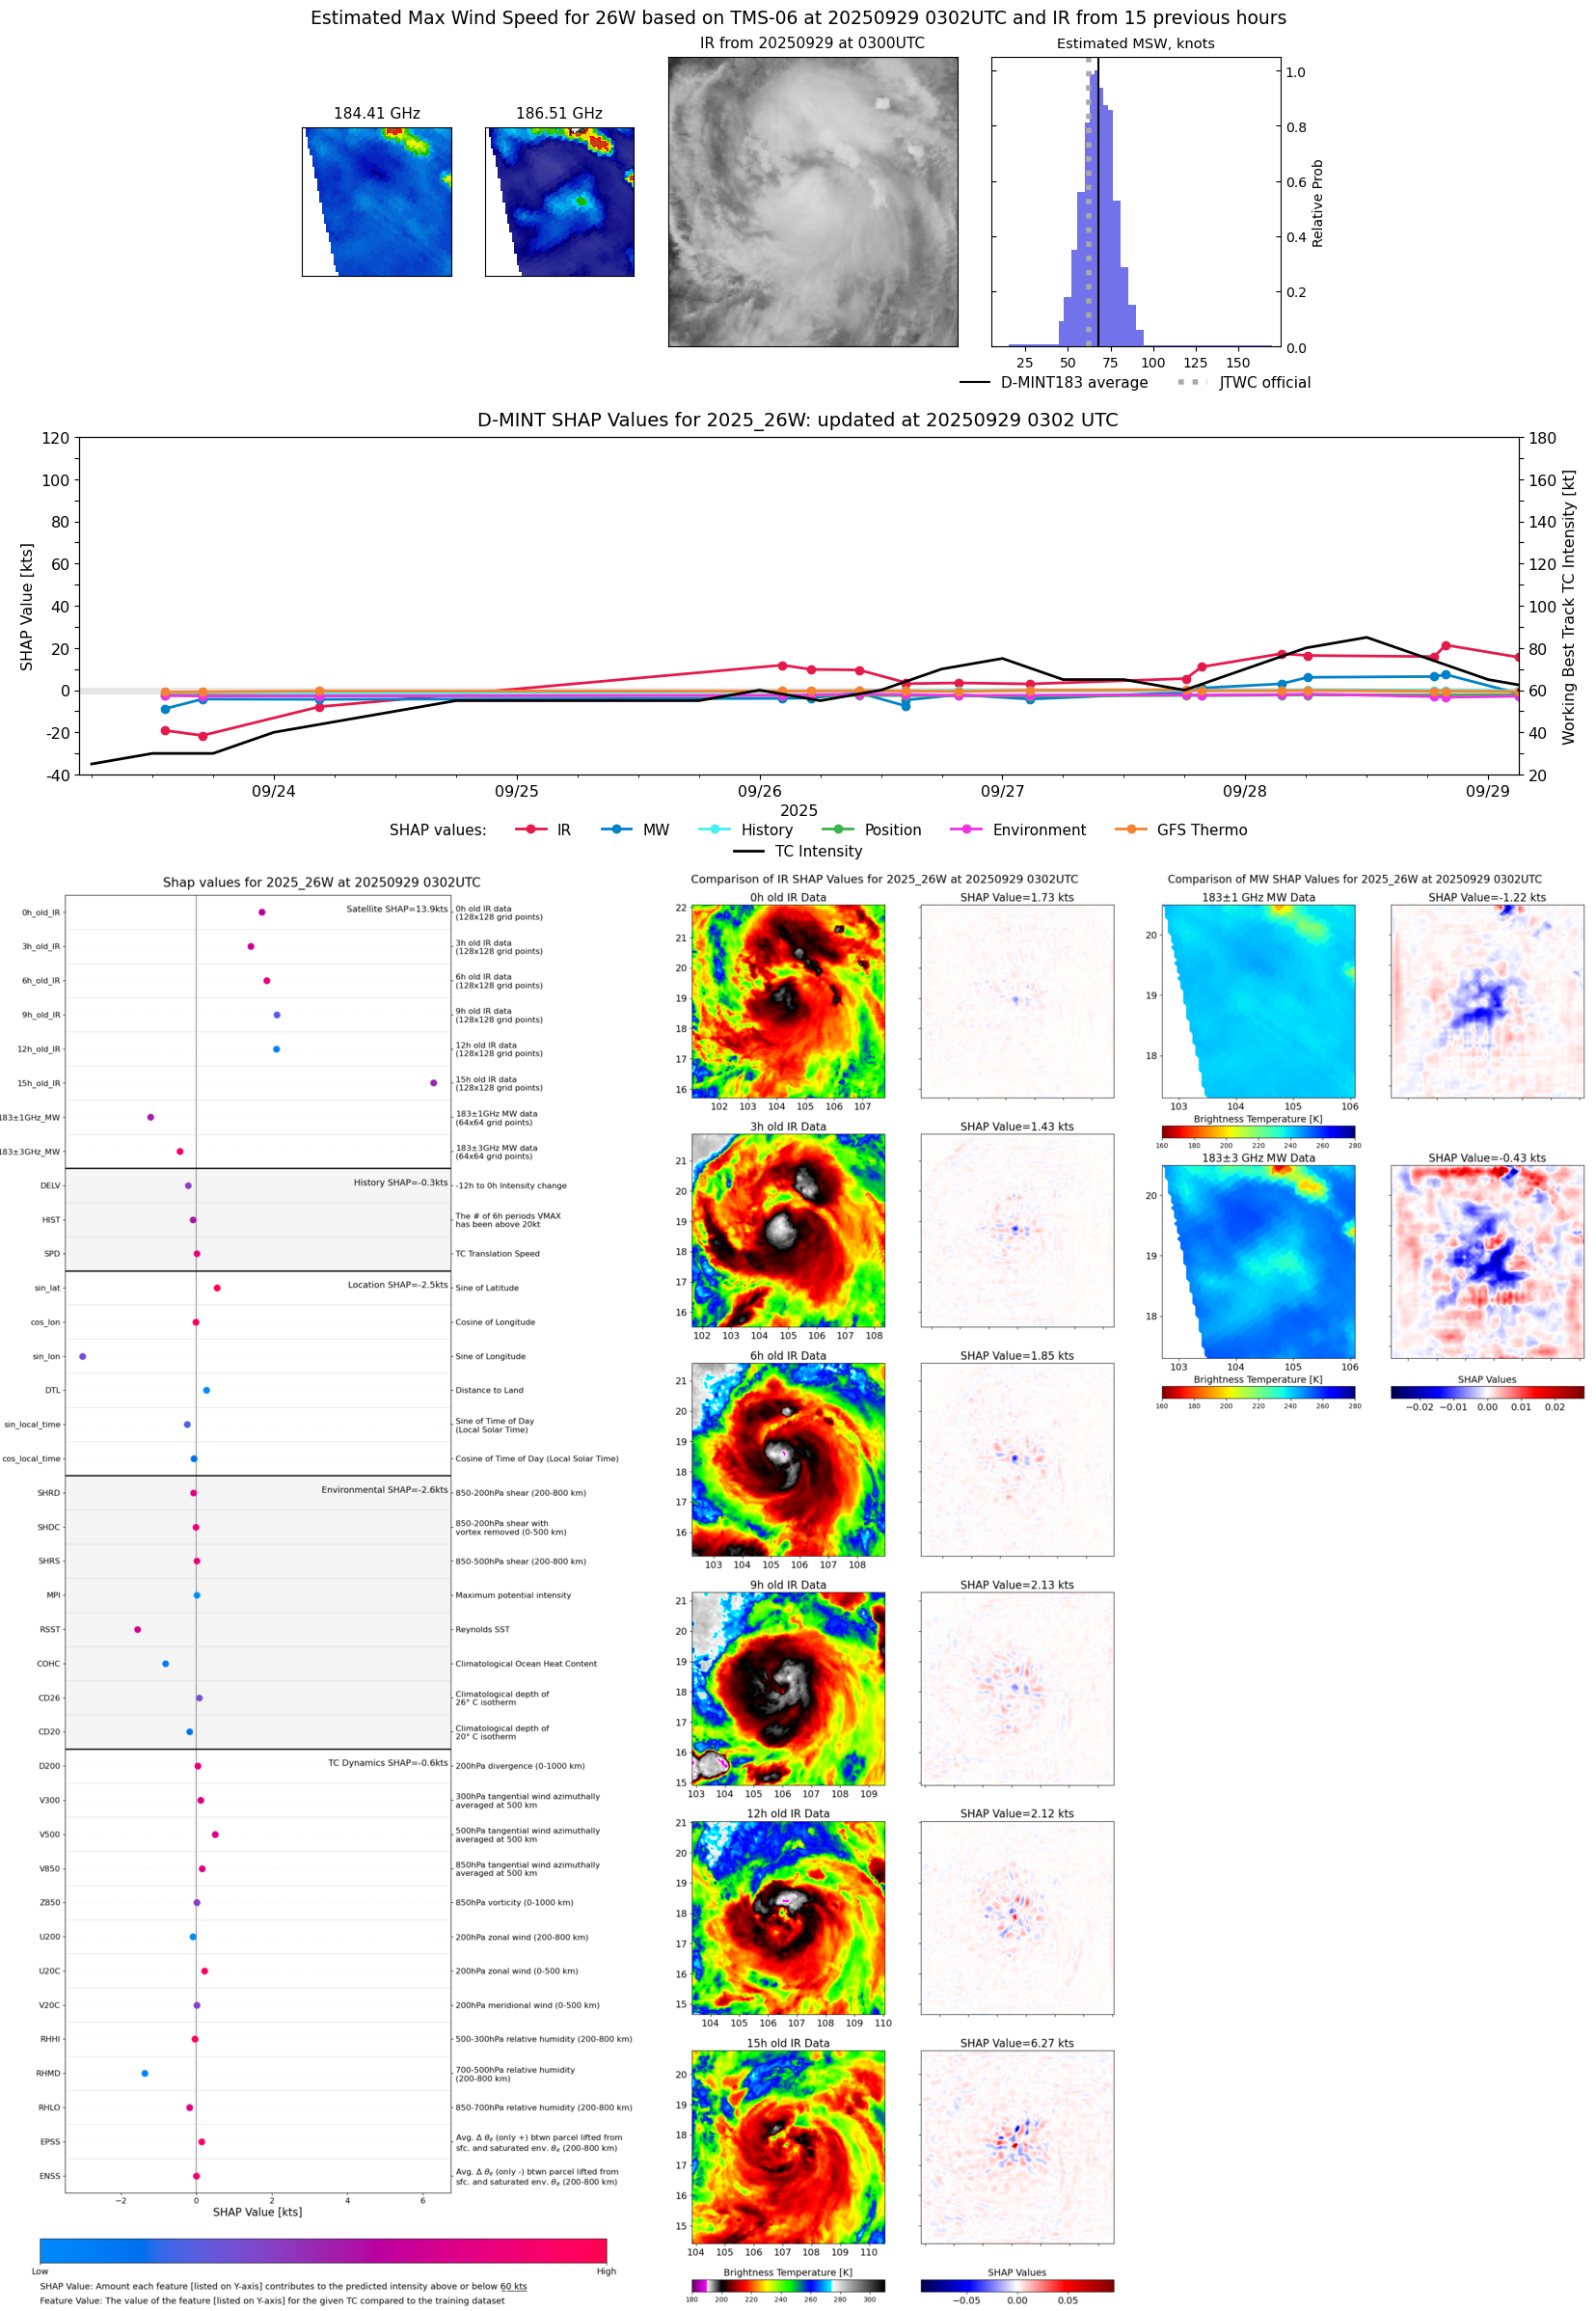 |
| 20250928 | 2315 UTC | WSFM01 | 972 hPa | 80 kts | 73 kts | 87 kts | 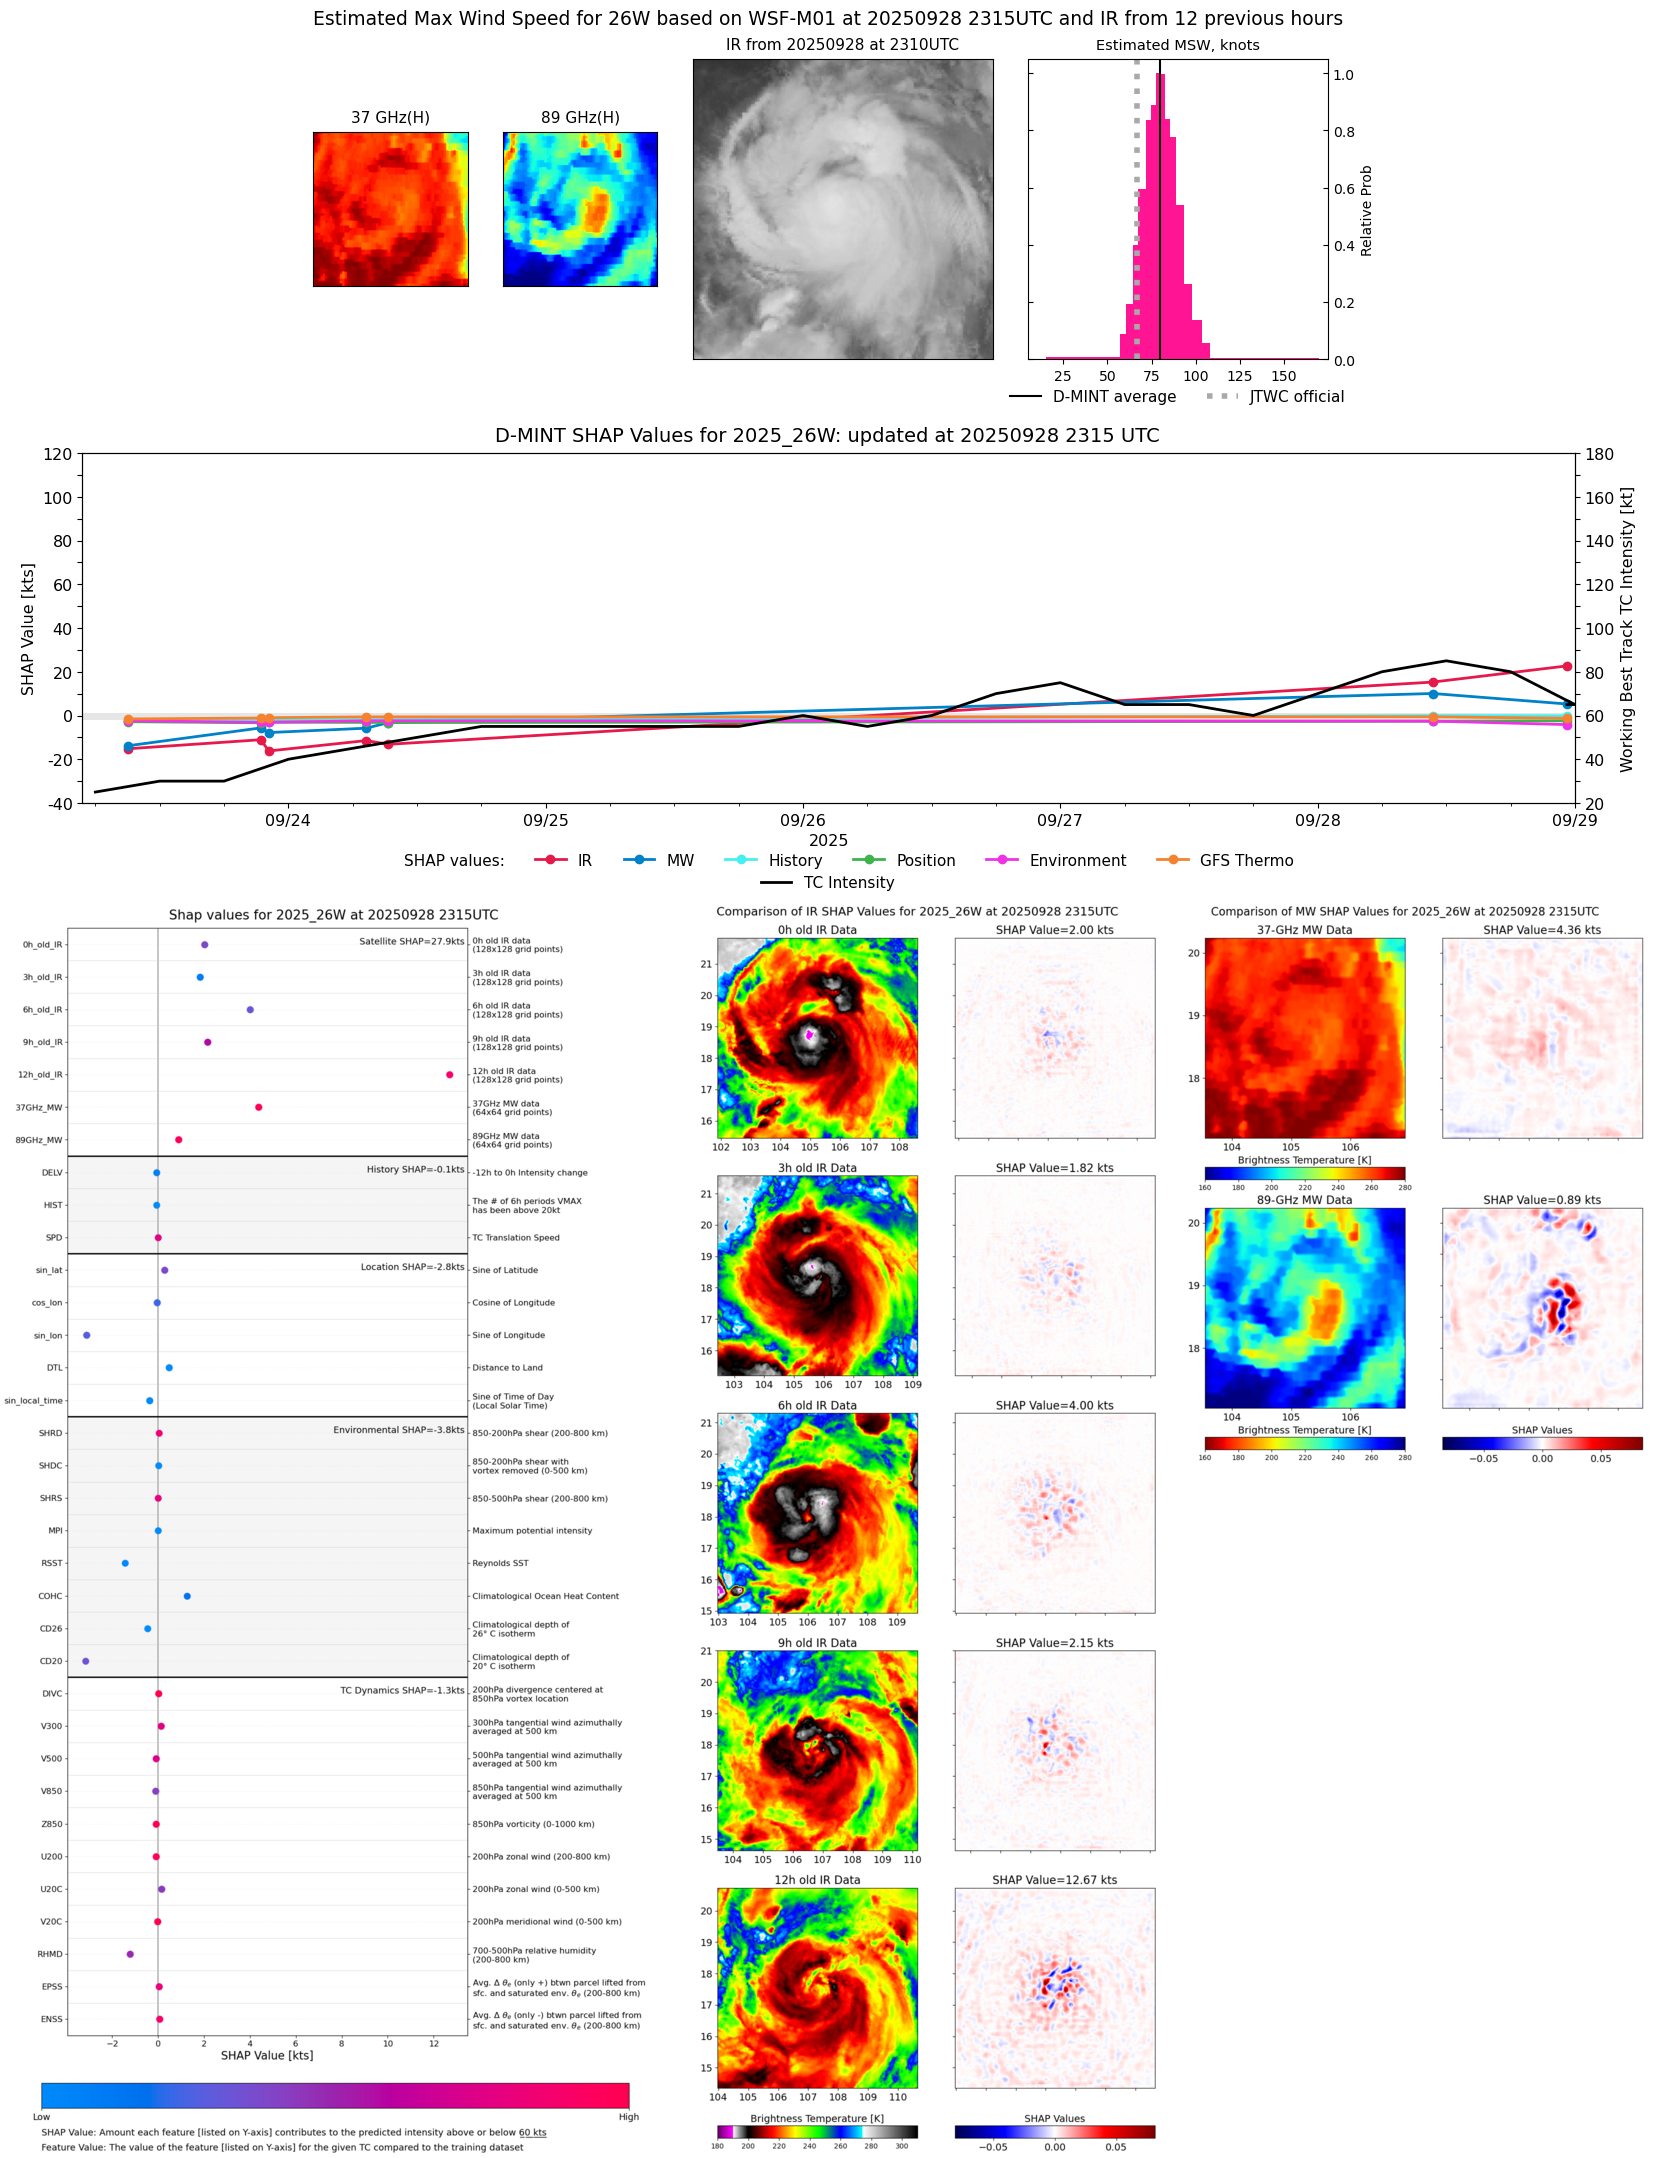 |
| 20250928 | 1948 UTC | TMS07 | 963 hPa | 83 kts | 76 kts | 90 kts | 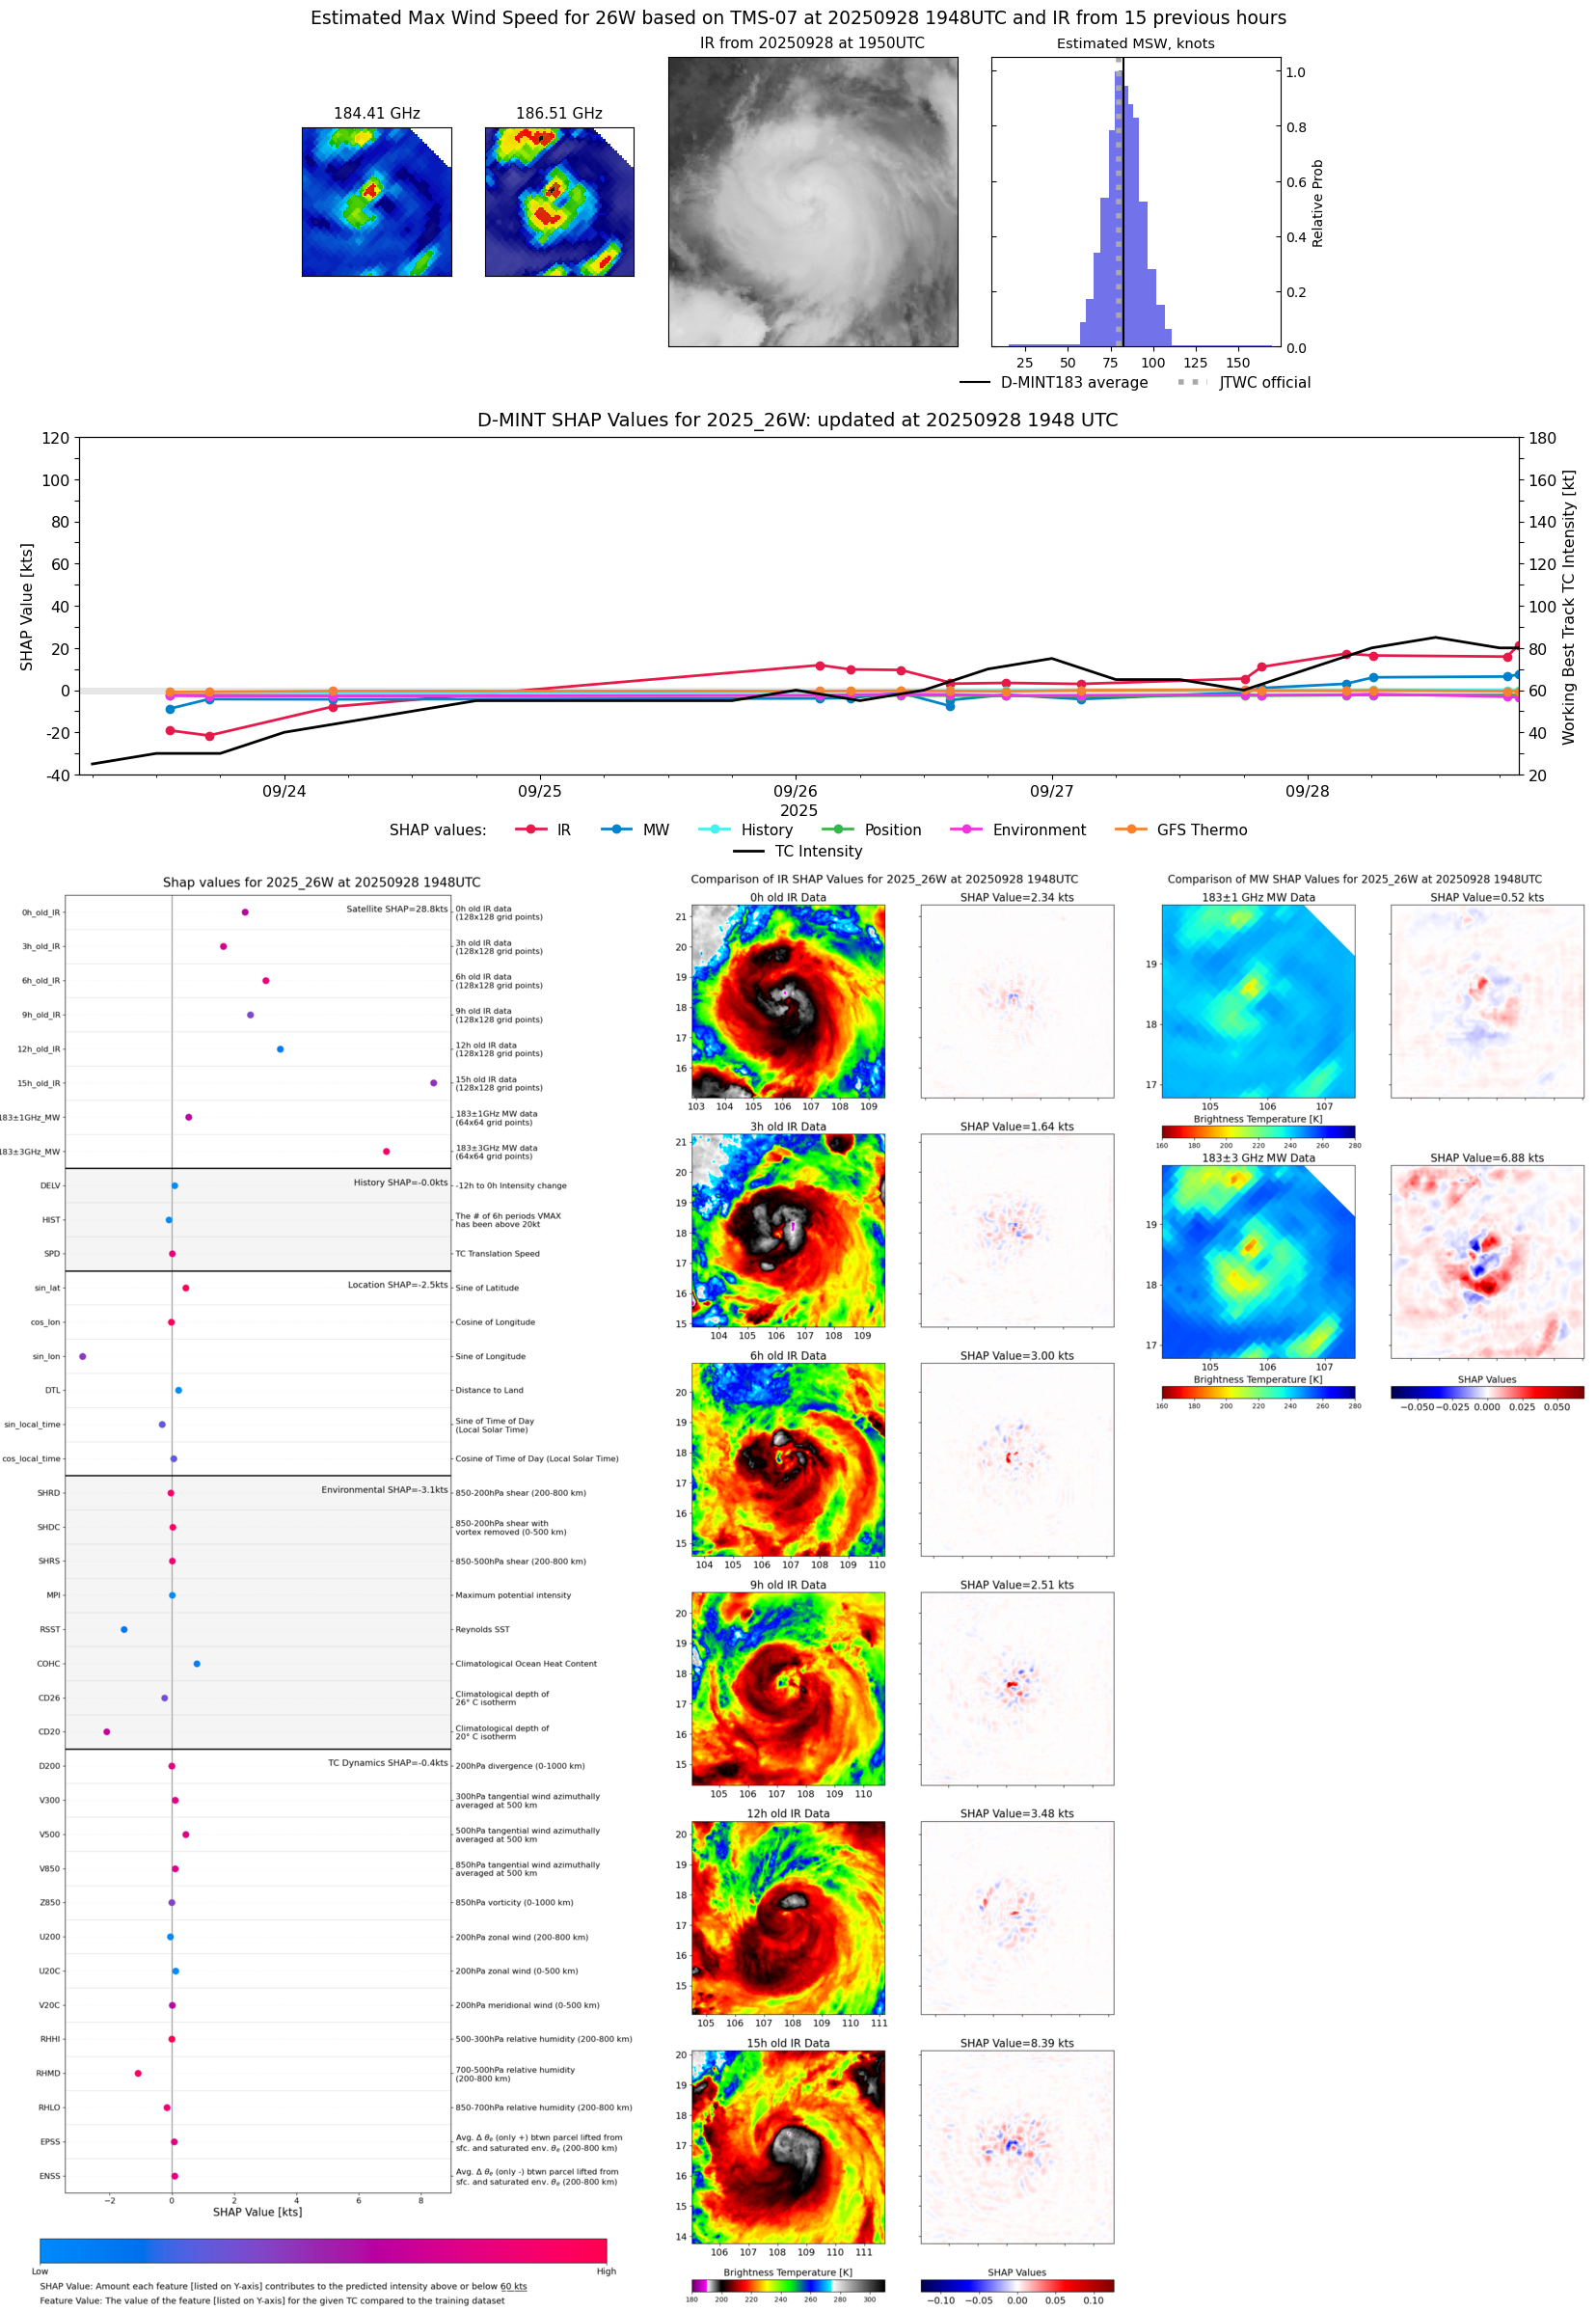 |
| 20250928 | 1841 UTC | ATMS-N21 | 962 hPa | 77 kts | 70 kts | 84 kts |  |
| 20250928 | 1818 UTC | AMSR2 | 962 hPa | 82 kts | 76 kts | 89 kts | 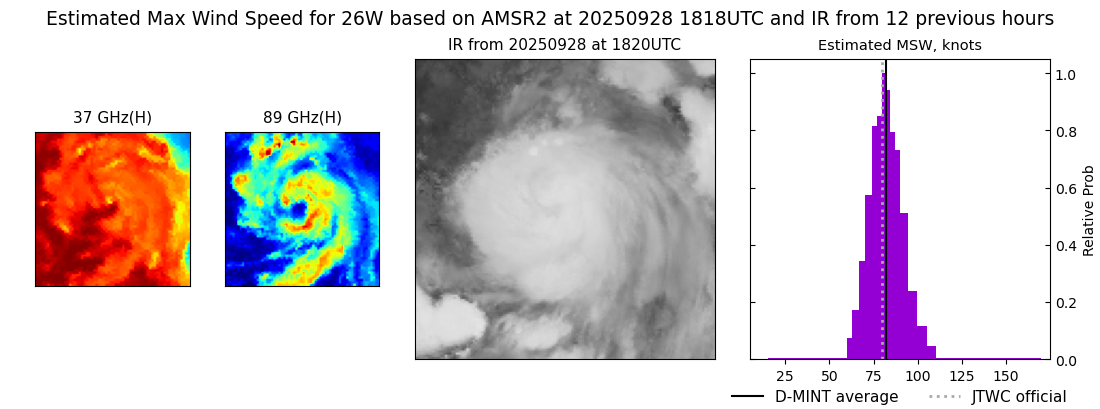 |
| 20250928 | 1045 UTC | WSFM01 | 966 hPa | 80 kts | 73 kts | 86 kts | 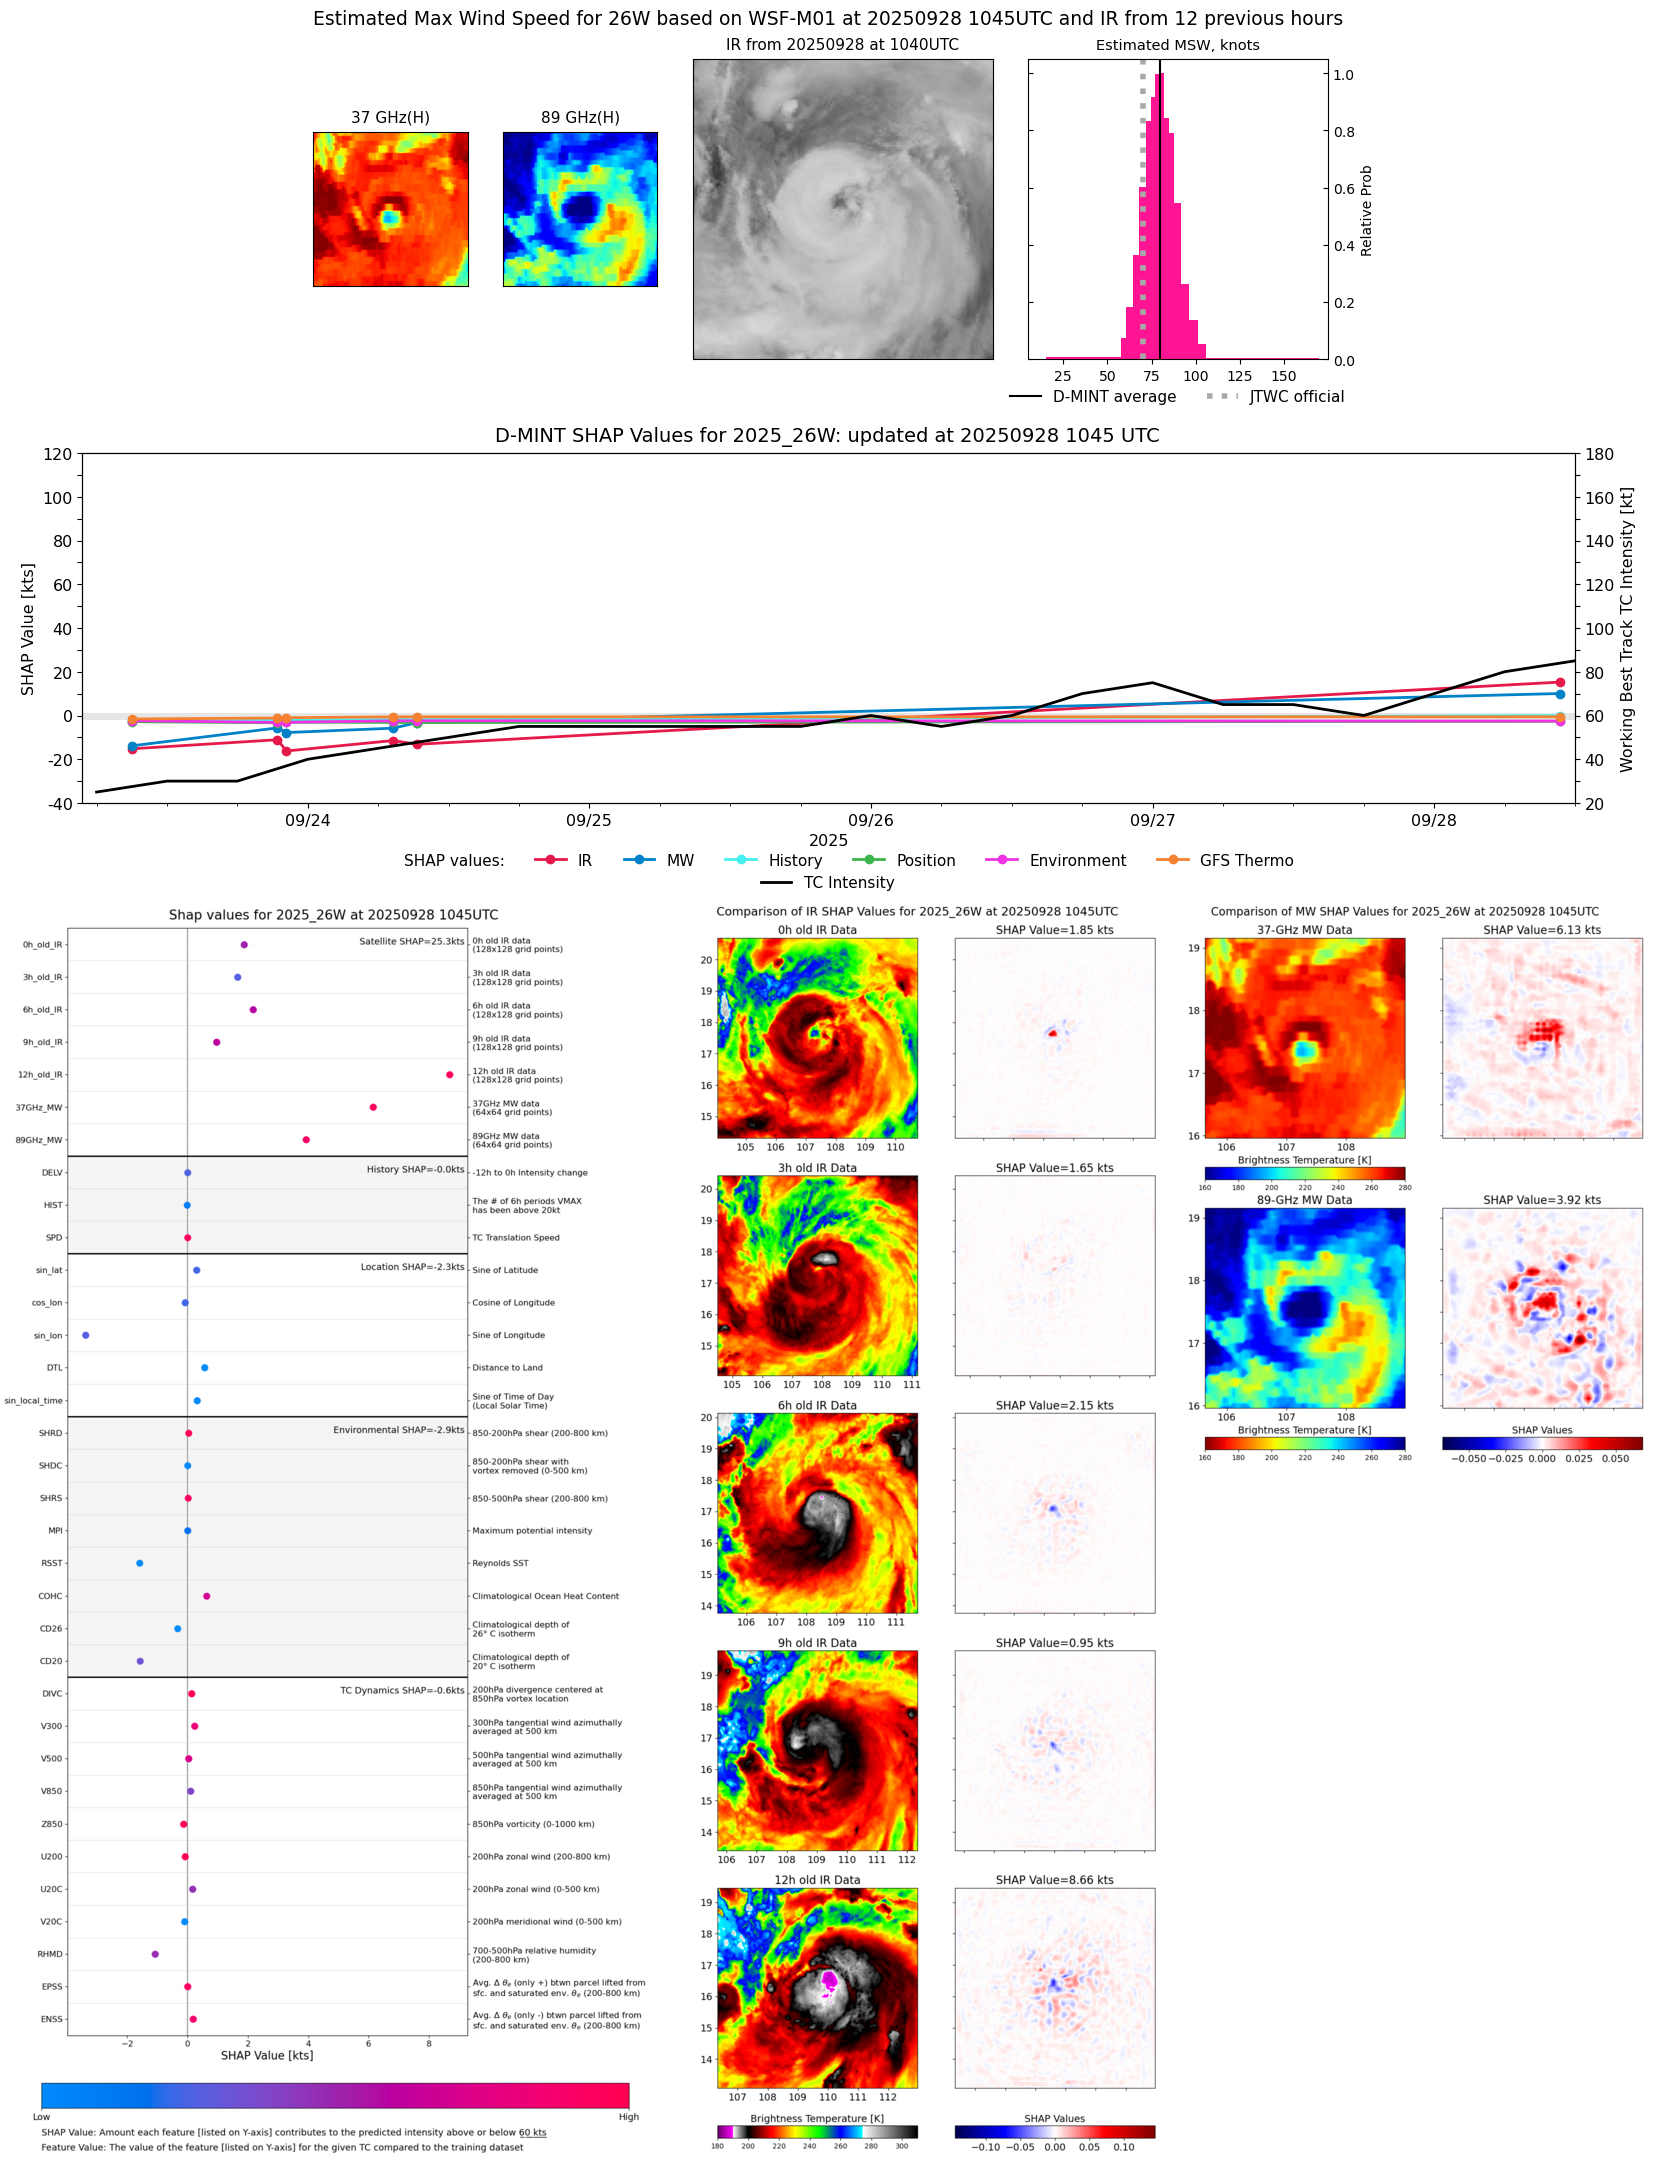 |
| 20250928 | 0610 UTC | ATMS-N21 | 967 hPa | 79 kts | 72 kts | 86 kts |  |
| 20250928 | 0334 UTC | TMS02 | 971 hPa | 76 kts | 69 kts | 83 kts |  |
| 20250927 | 1940 UTC | TMS07 | 979 hPa | 67 kts | 60 kts | 74 kts |  |
| 20250927 | 1809 UTC | ATMS-N20 | 979 hPa | 59 kts | 53 kts | 66 kts | 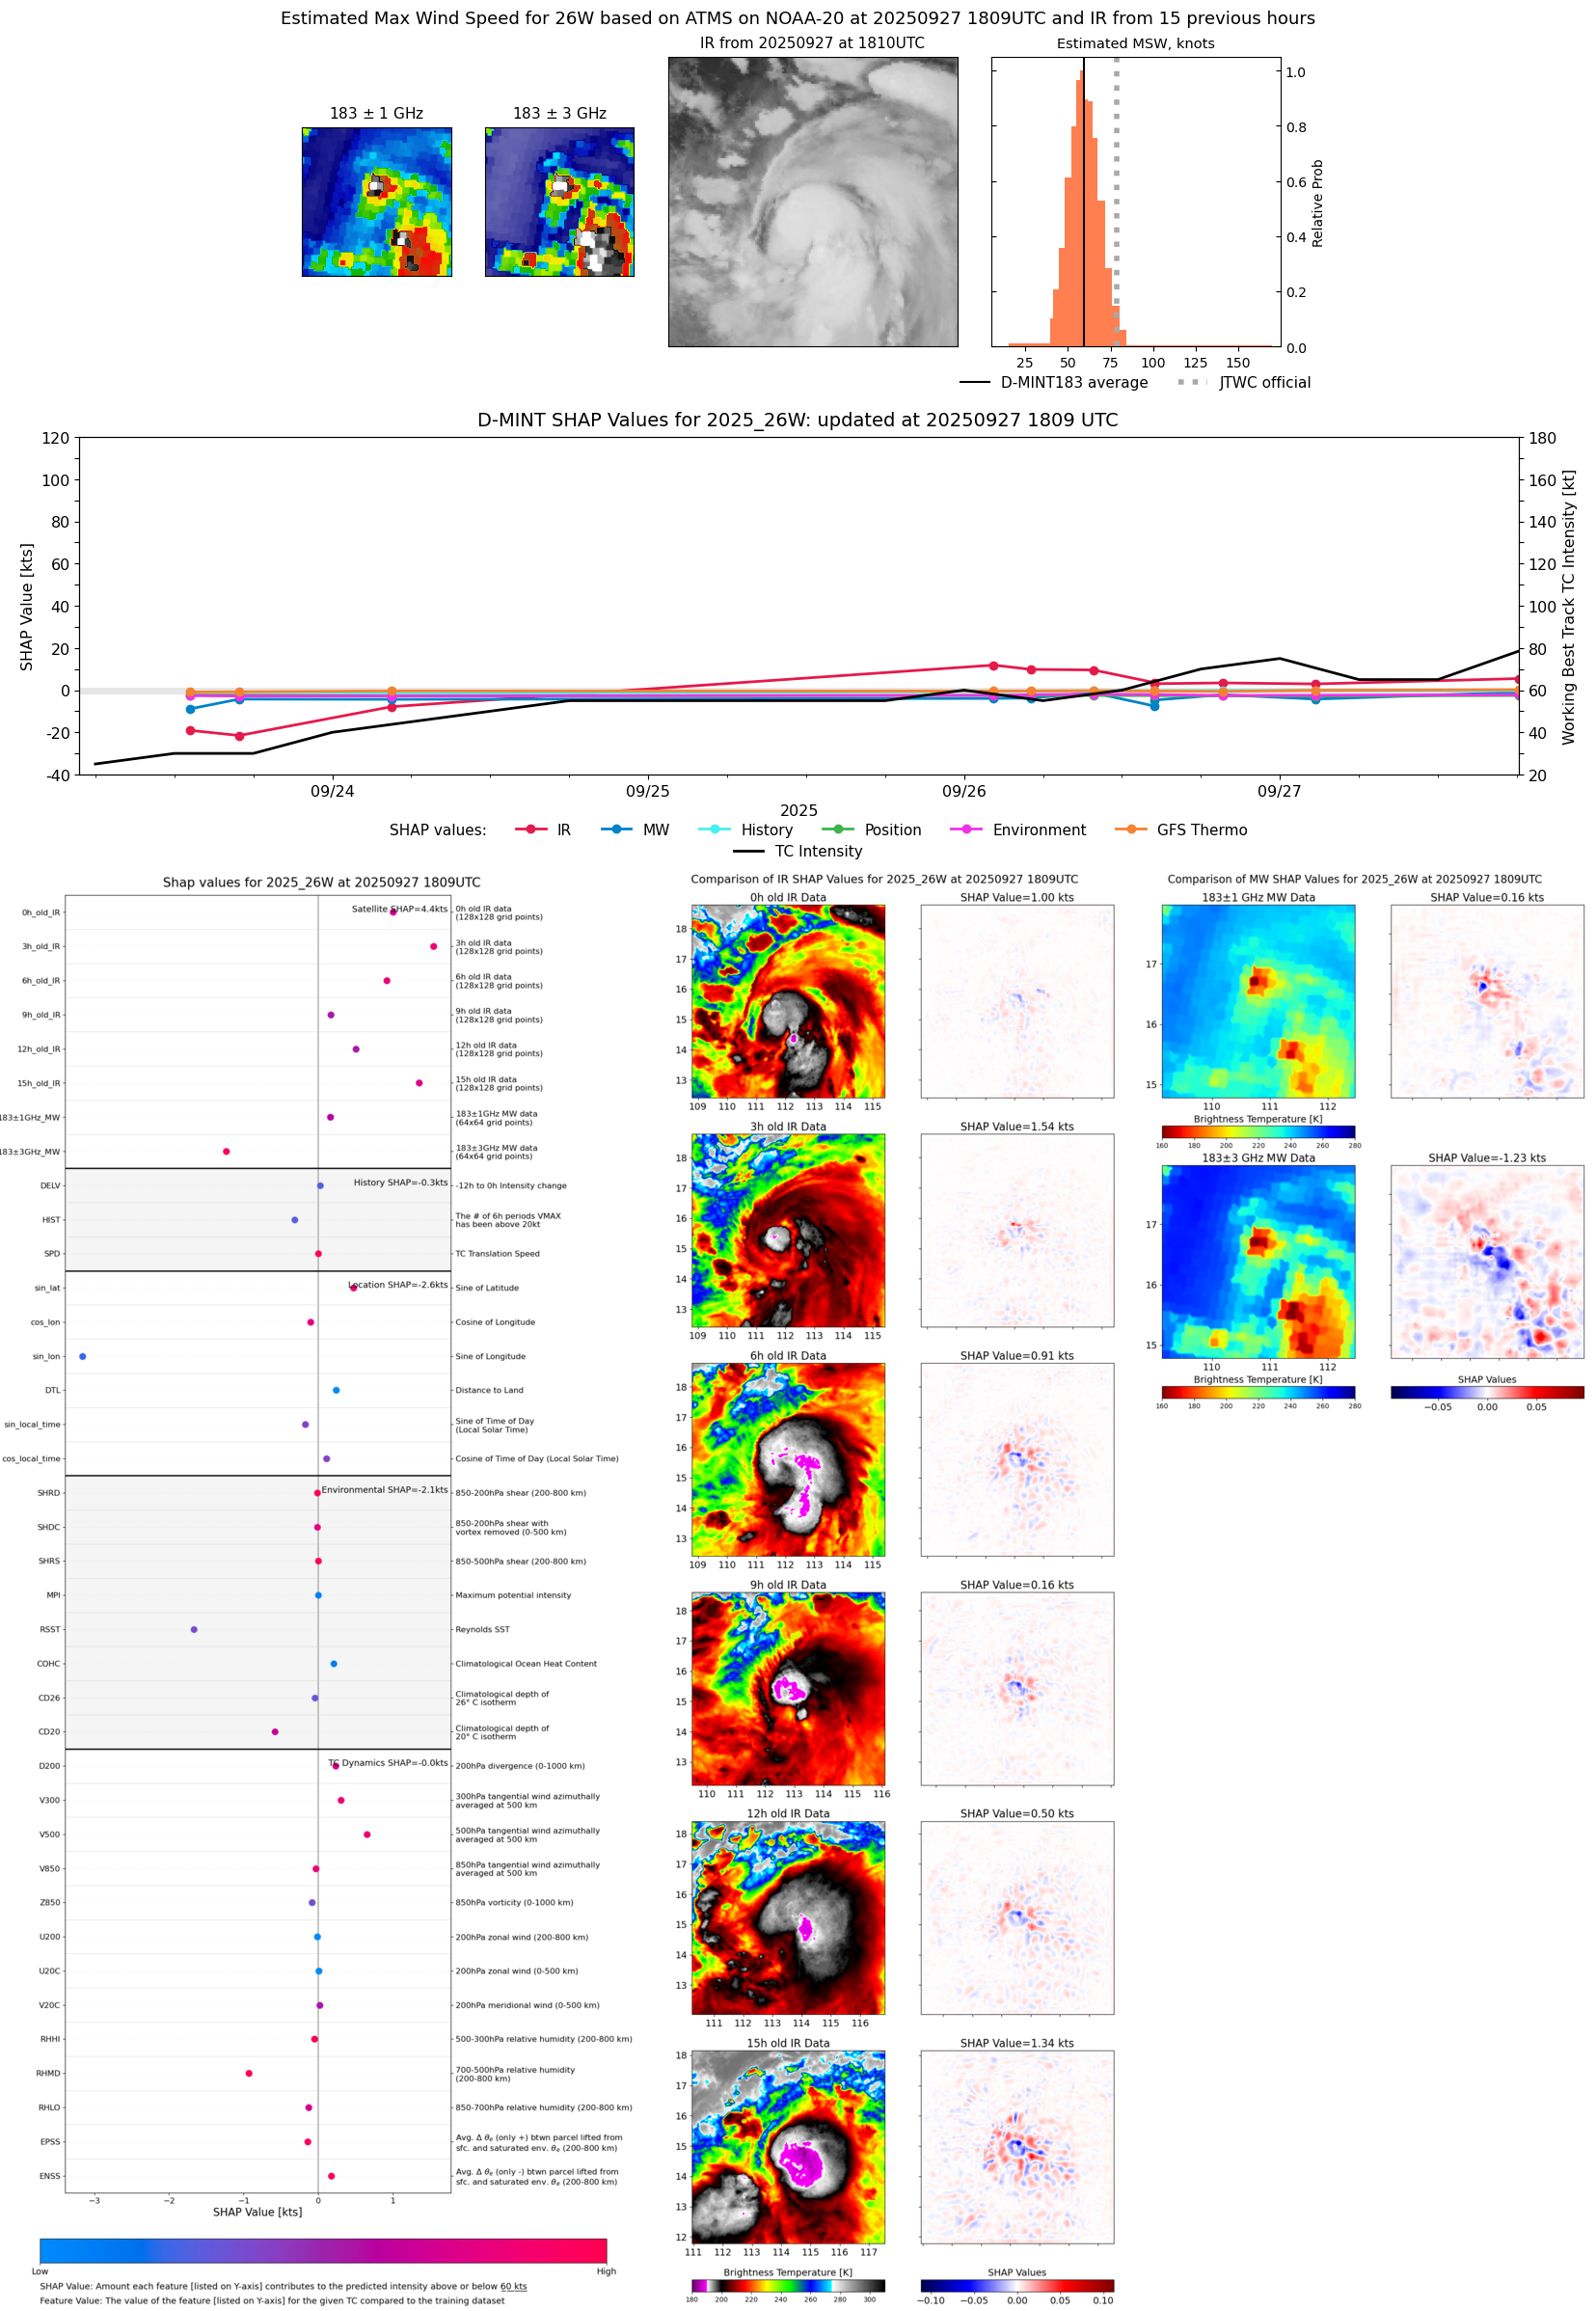 |
| 20250927 | 1048 UTC | GMI | 984 hPa | 56 kts | 50 kts | 63 kts | 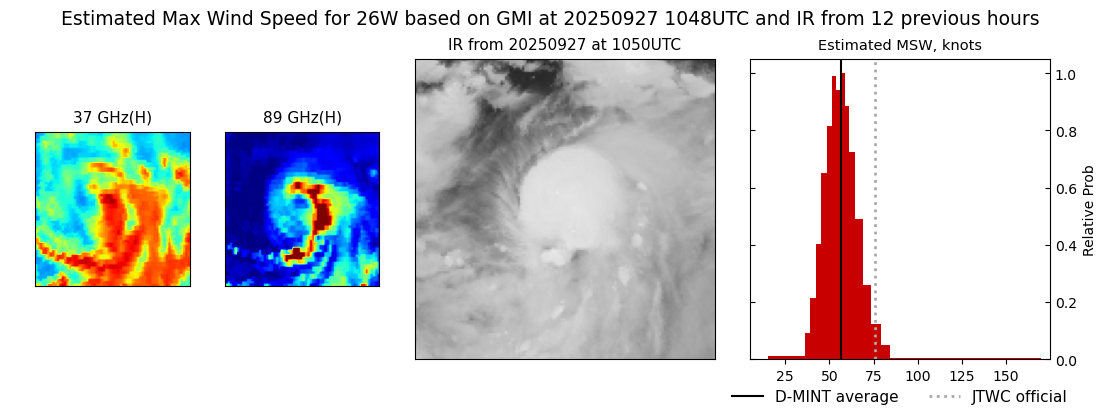 |
| 20250927 | 0537 UTC | ATMS-N20 | 992 hPa | 39 kts | 34 kts | 45 kts |  |
| 20250927 | 0243 UTC | TMS05 | 989 hPa | 53 kts | 47 kts | 59 kts | 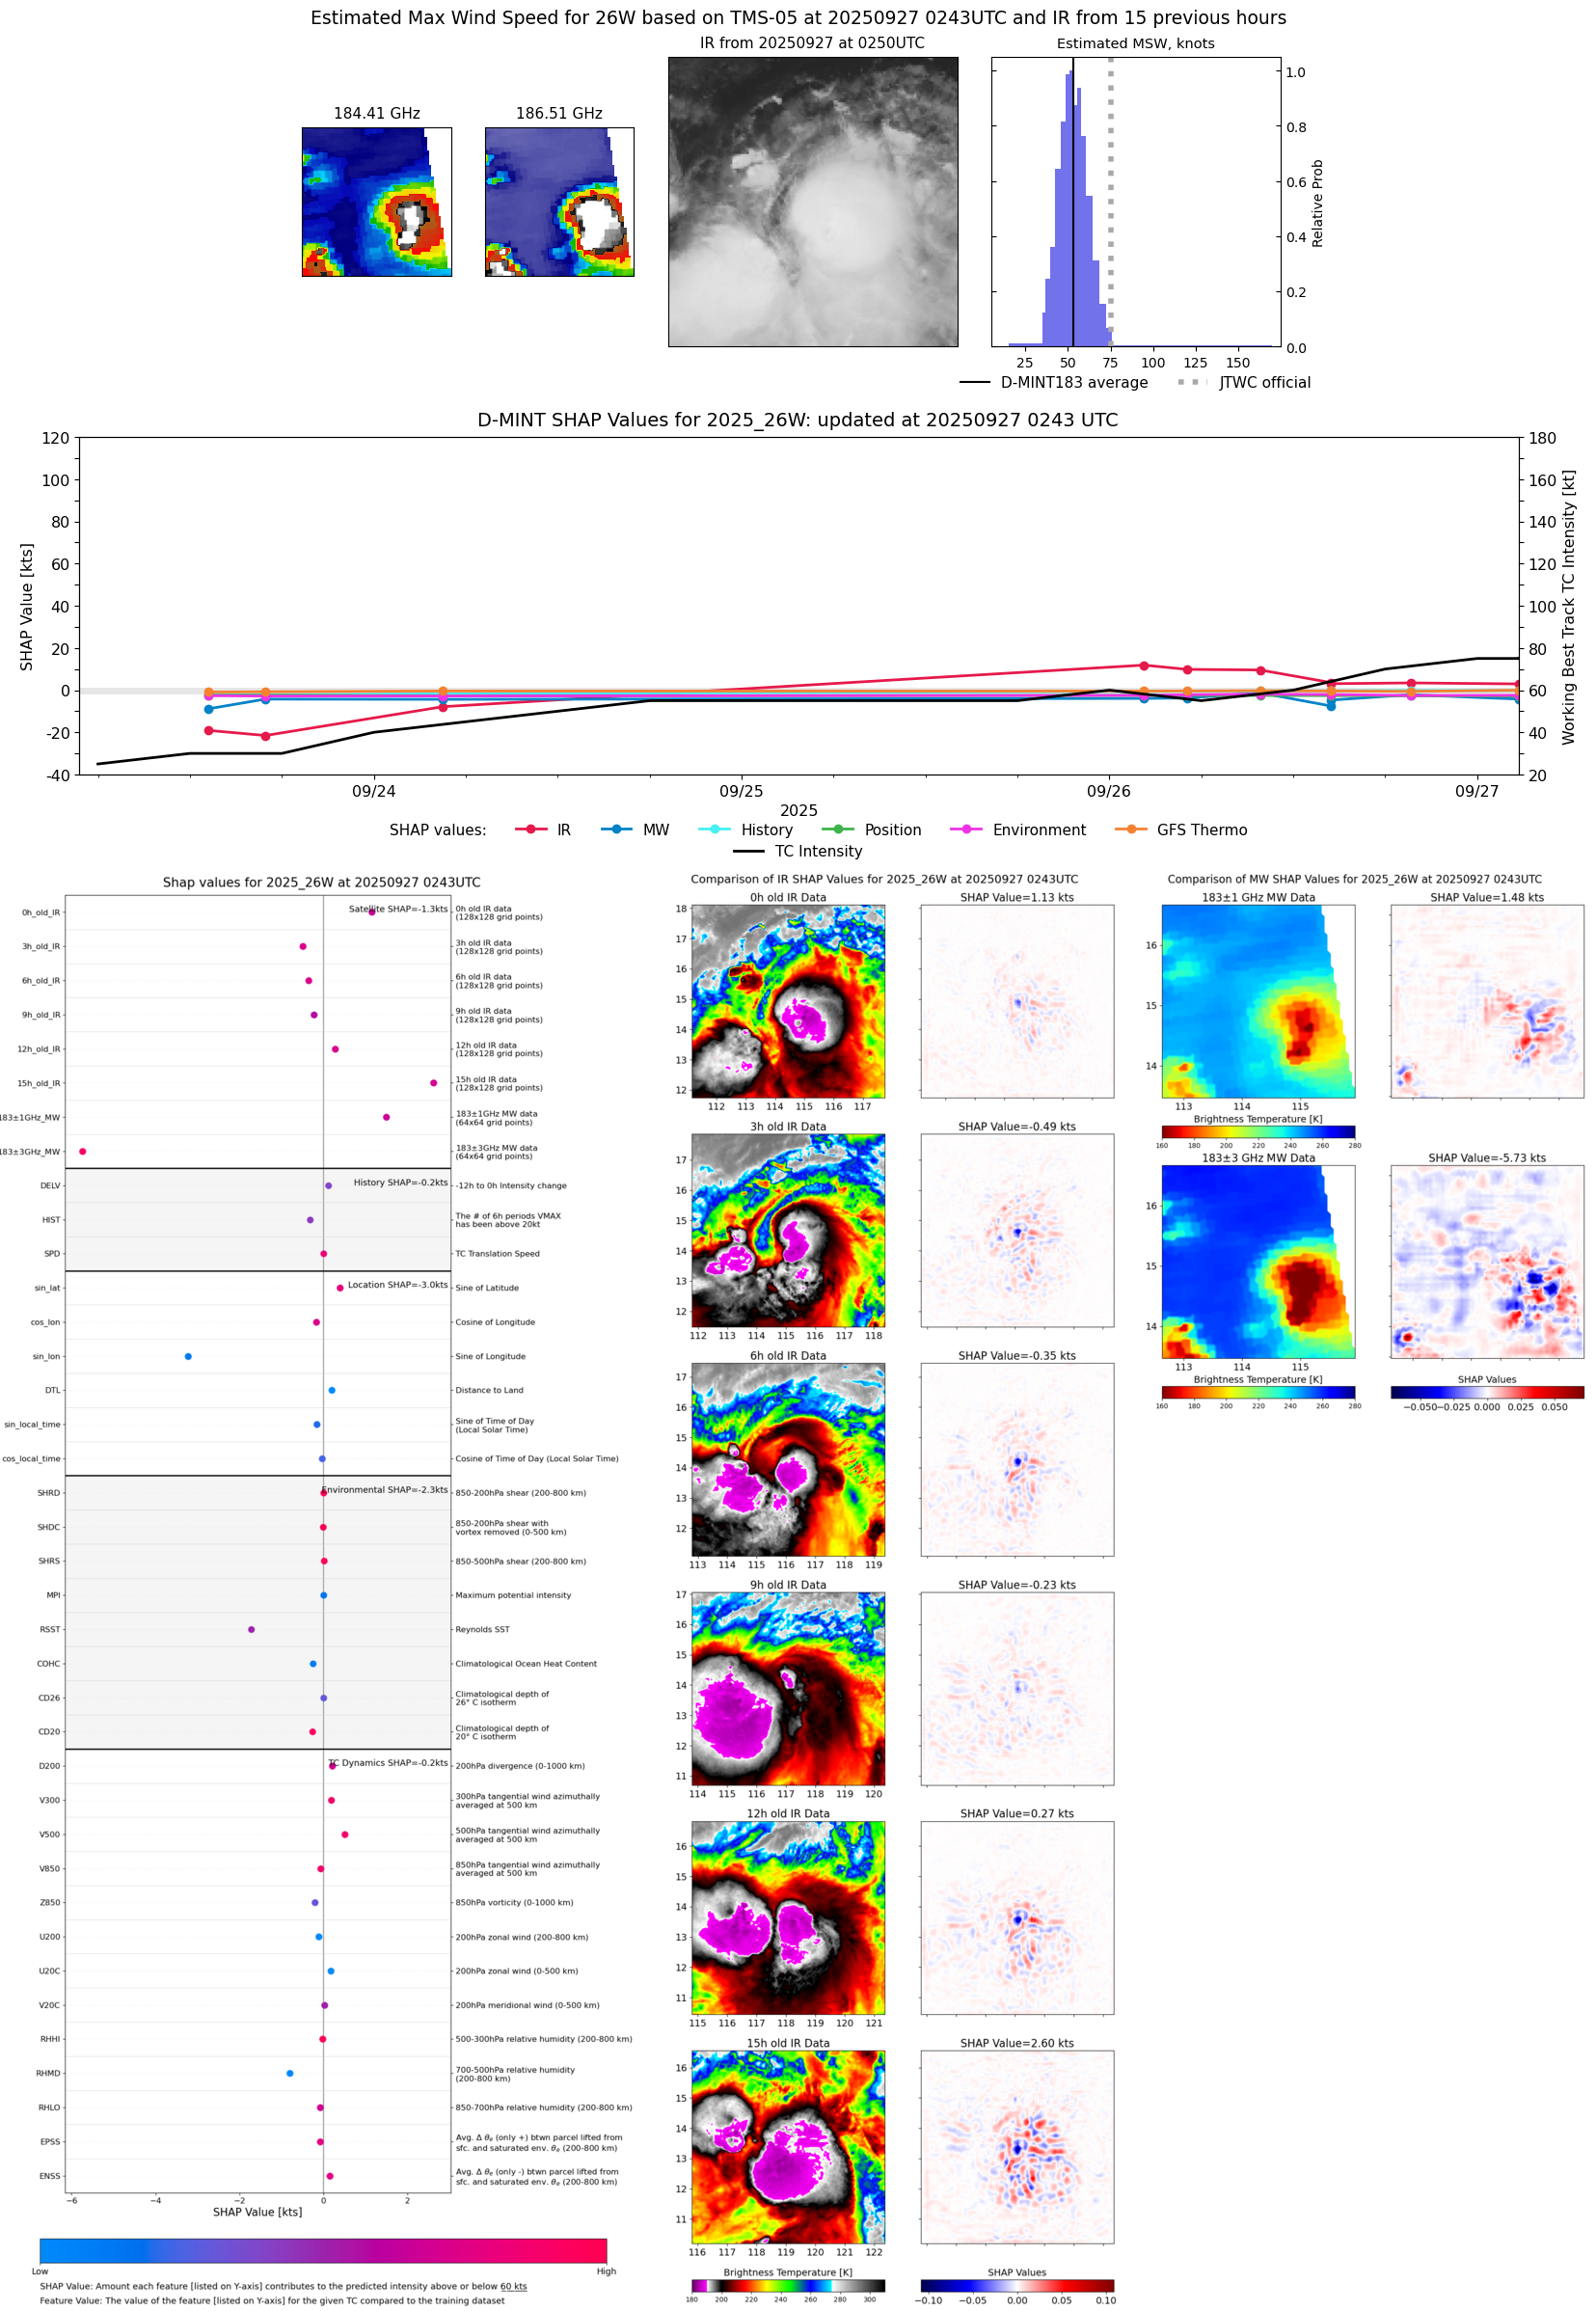 |
| 20250926 | 2318 UTC | GMI | 987 hPa | 59 kts | 52 kts | 66 kts |  |
| 20250926 | 1939 UTC | TMS07 | 983 hPa | 55 kts | 50 kts | 61 kts |  |
| 20250926 | 1739 UTC | ATMS-N21 | 989 hPa | 52 kts | 44 kts | 60 kts | 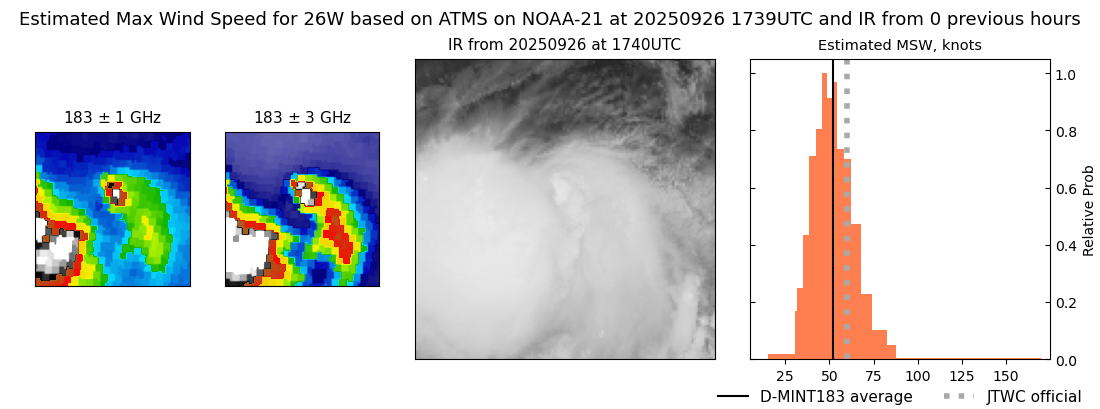 |
| 20250926 | 1427 UTC | AWS | 986 hPa | 53 kts | 47 kts | 59 kts | 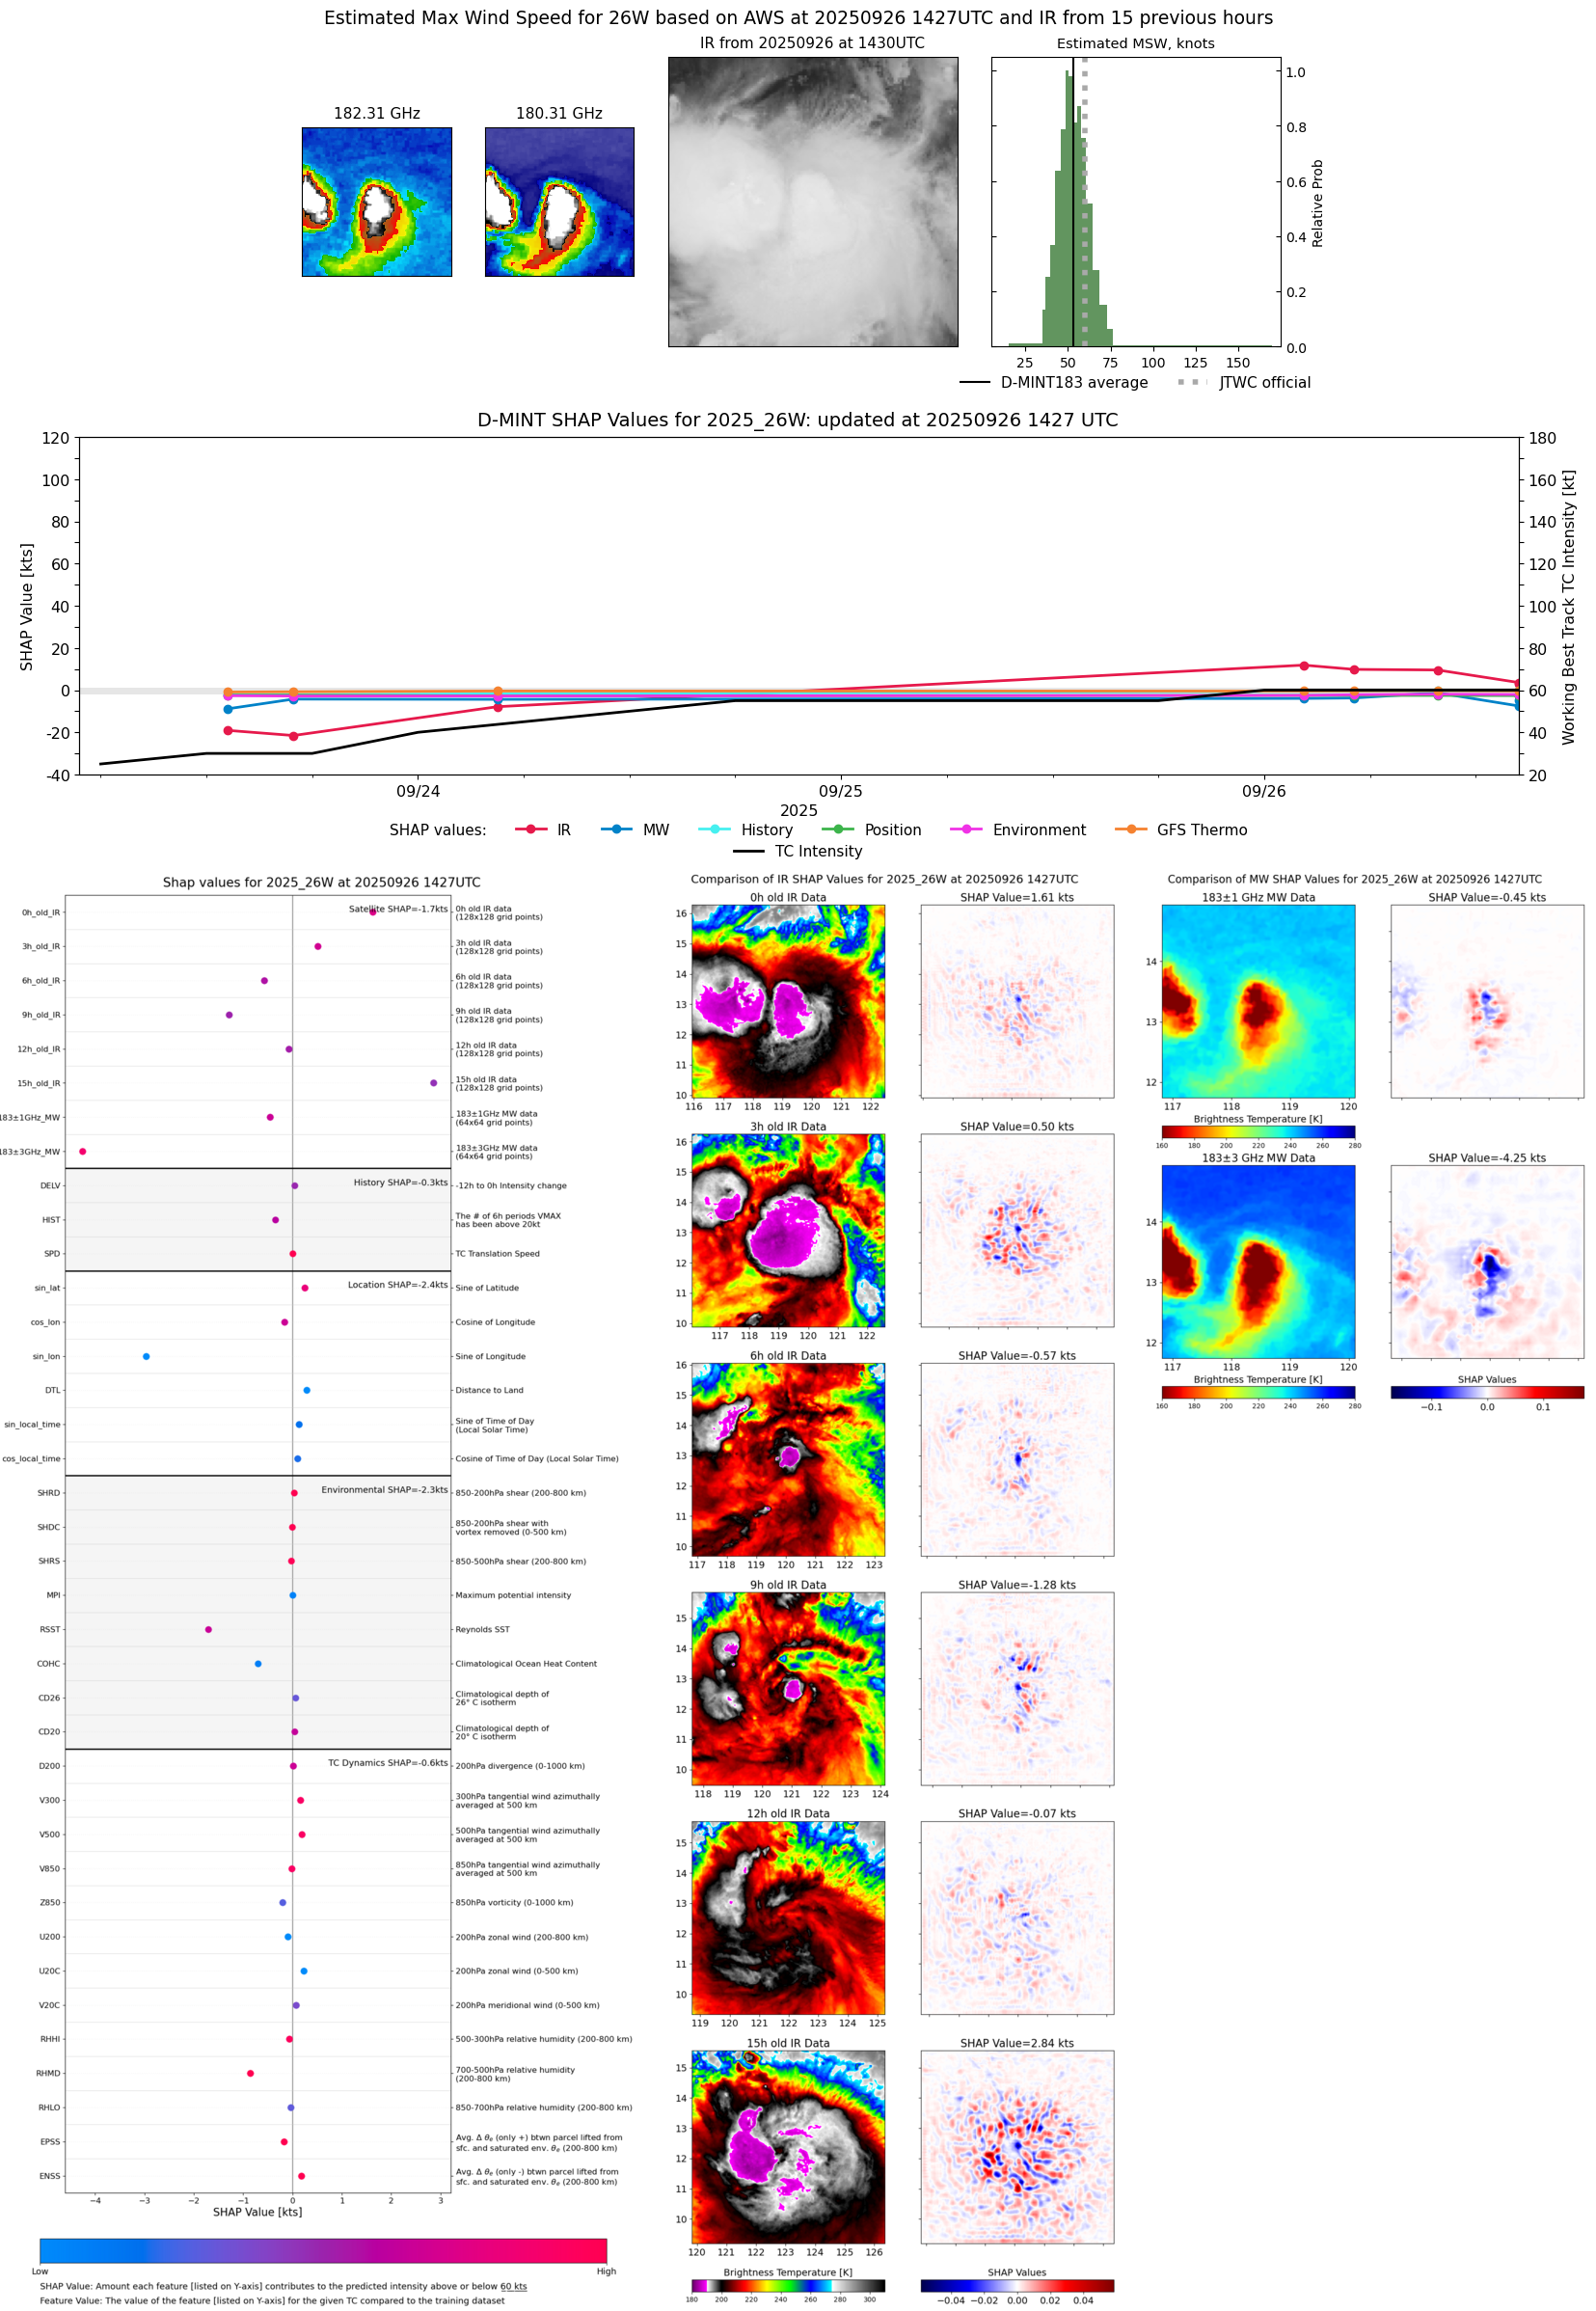 |
| 20250926 | 1426 UTC | TMS05 | 988 hPa | 51 kts | 45 kts | 57 kts | 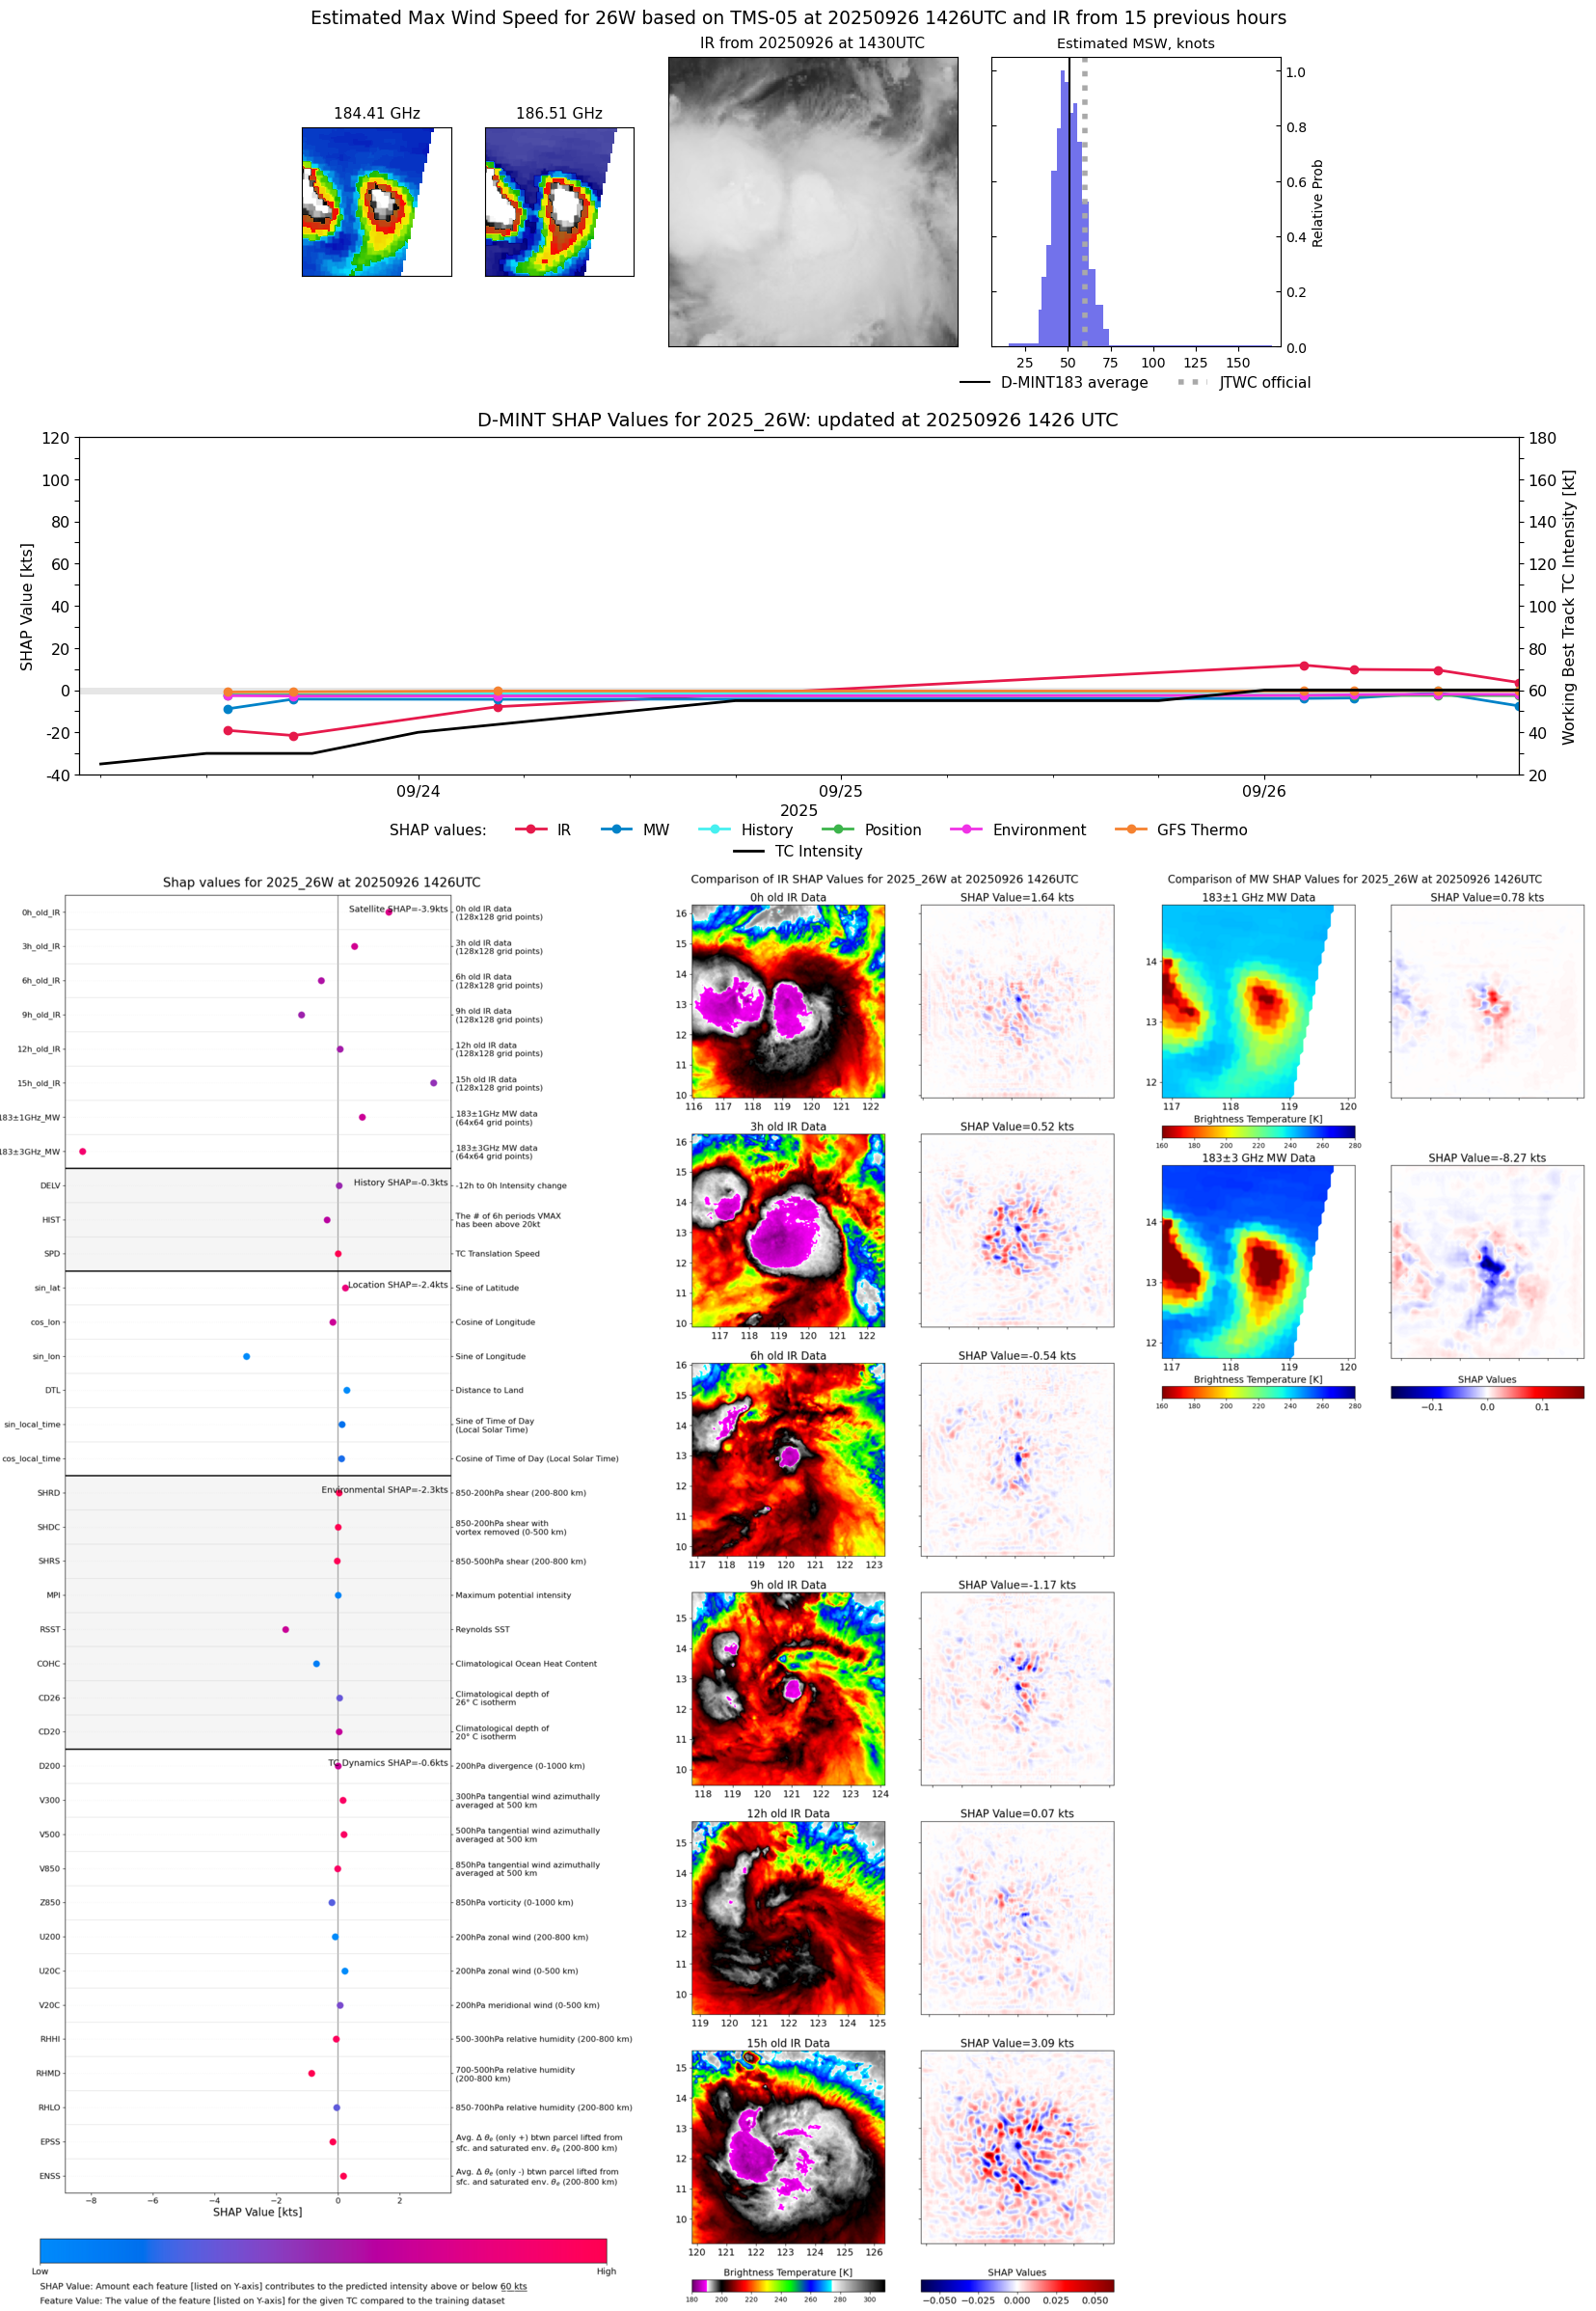 |
| 20250926 | 0950 UTC | TMS07 | 981 hPa | 63 kts | 57 kts | 70 kts | 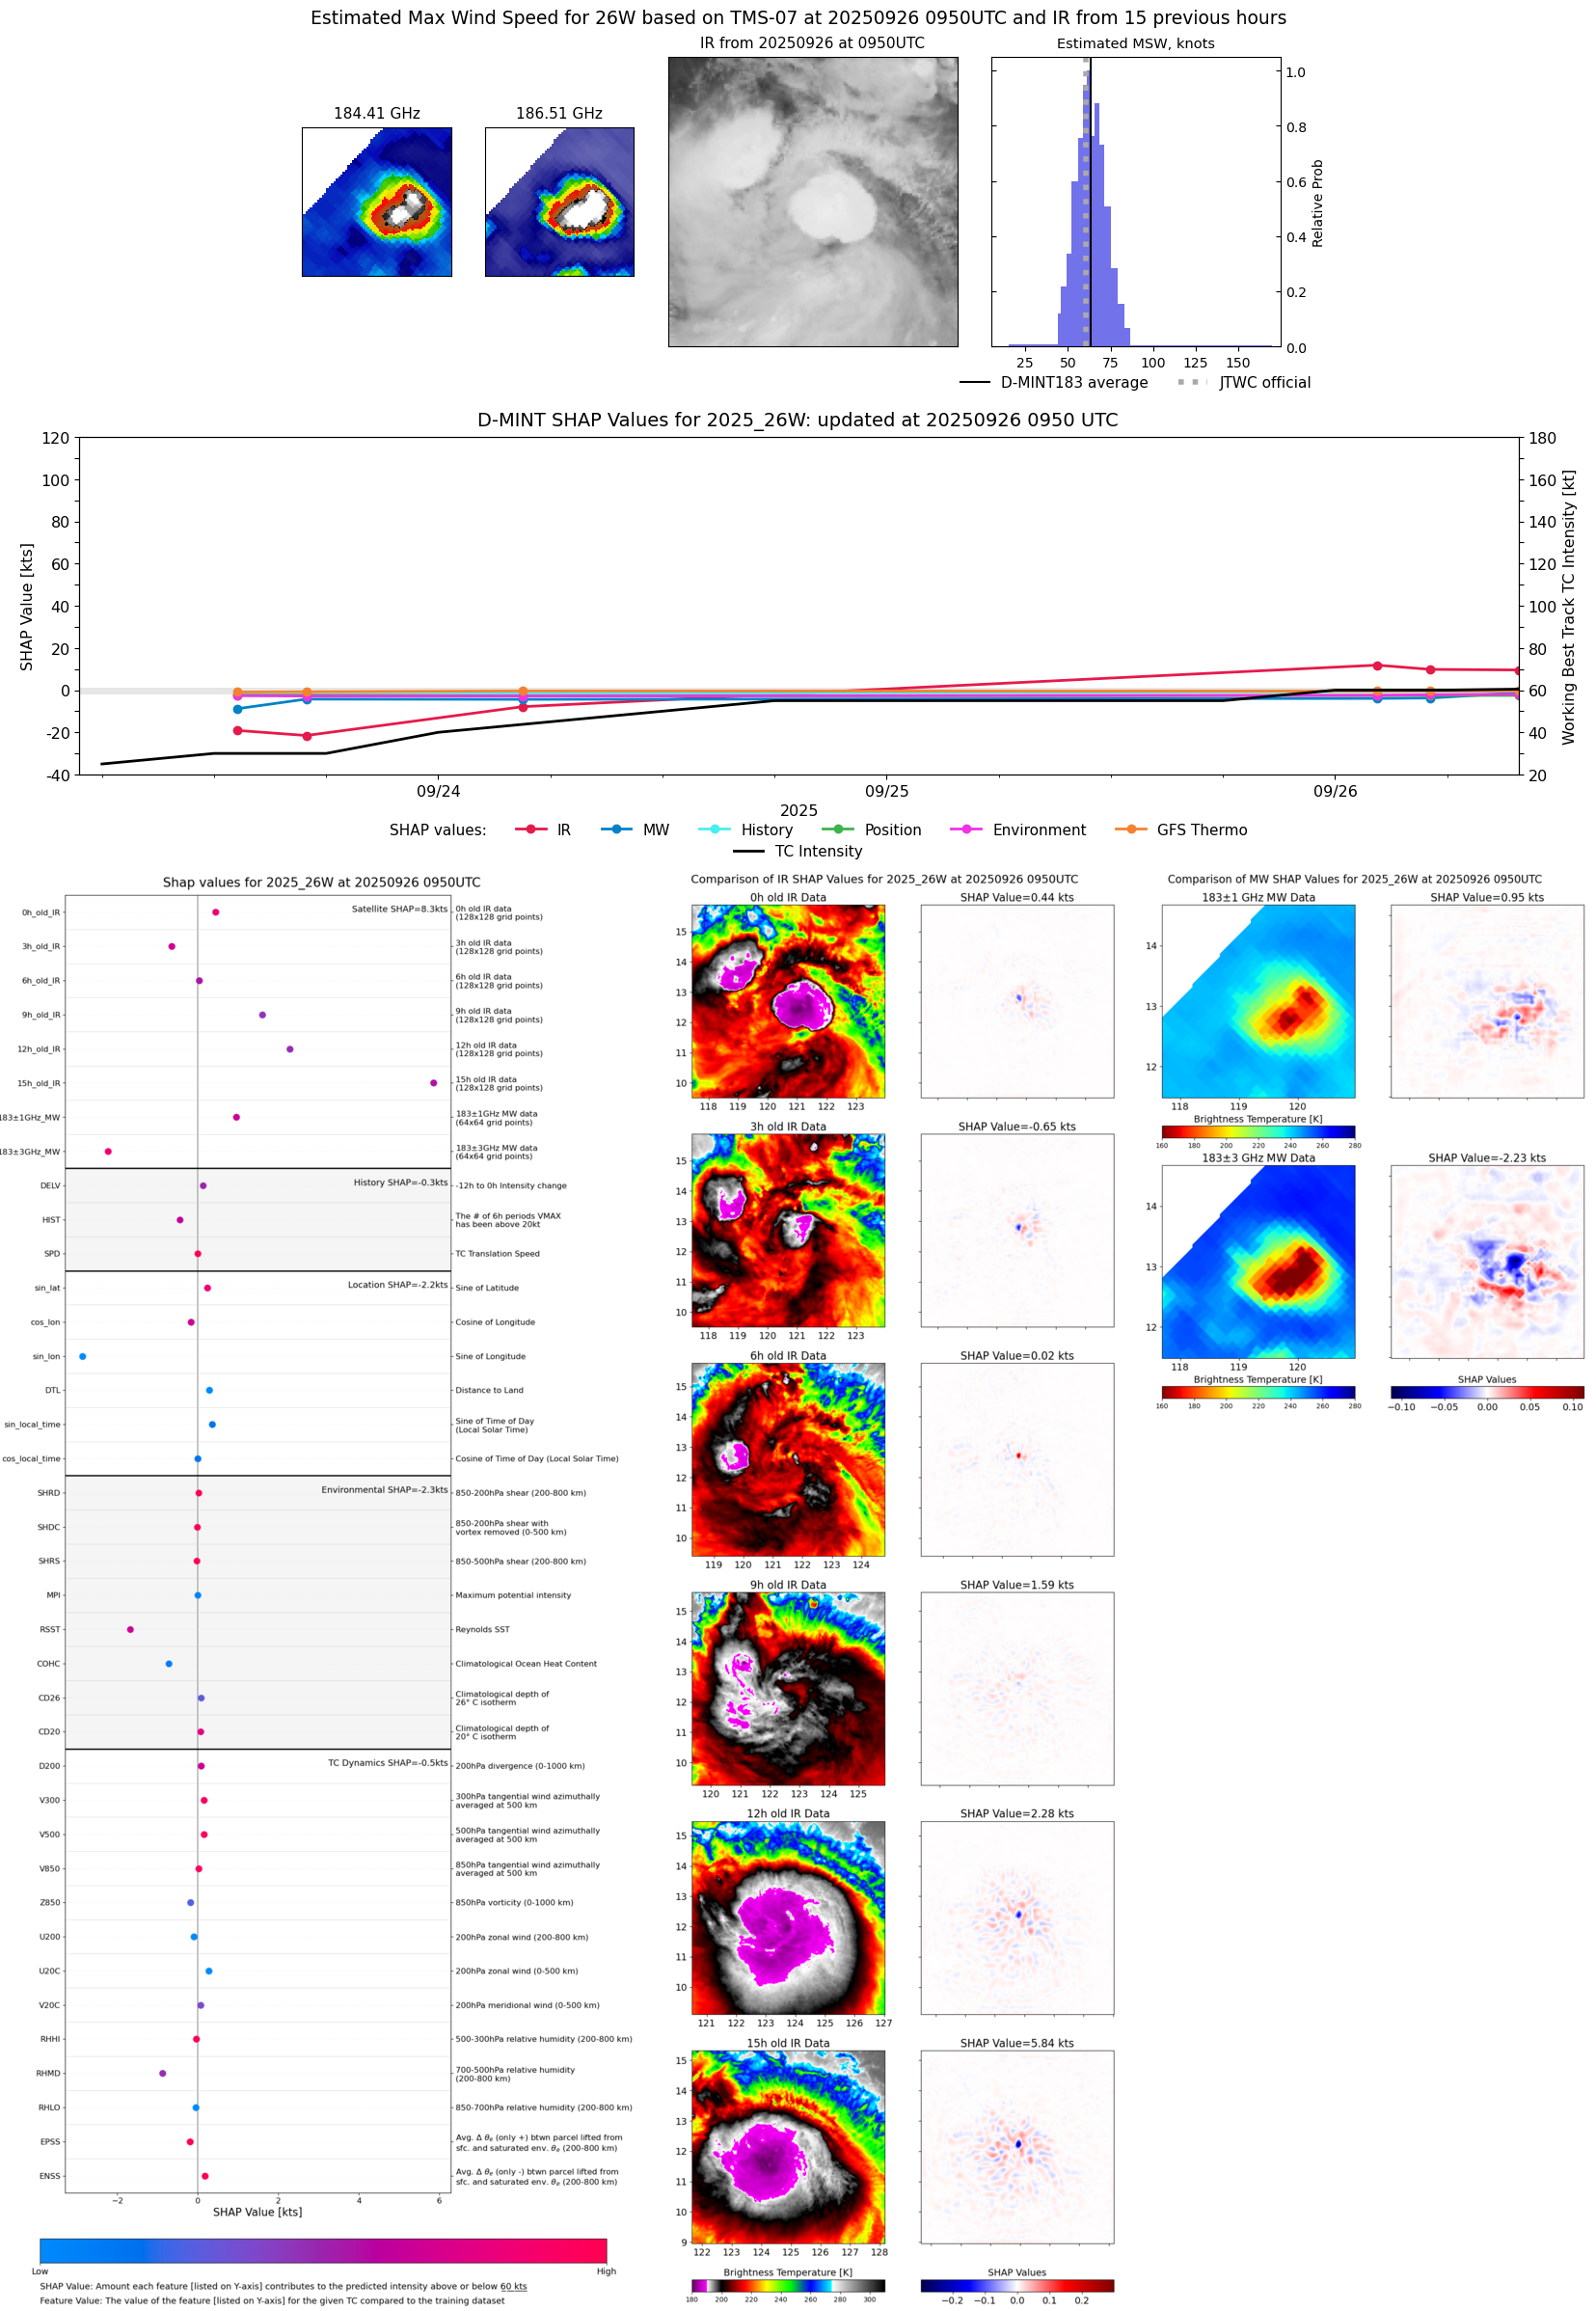 |
| 20250926 | 0505 UTC | ATMS-N21 | 982 hPa | 61 kts | 55 kts | 67 kts | 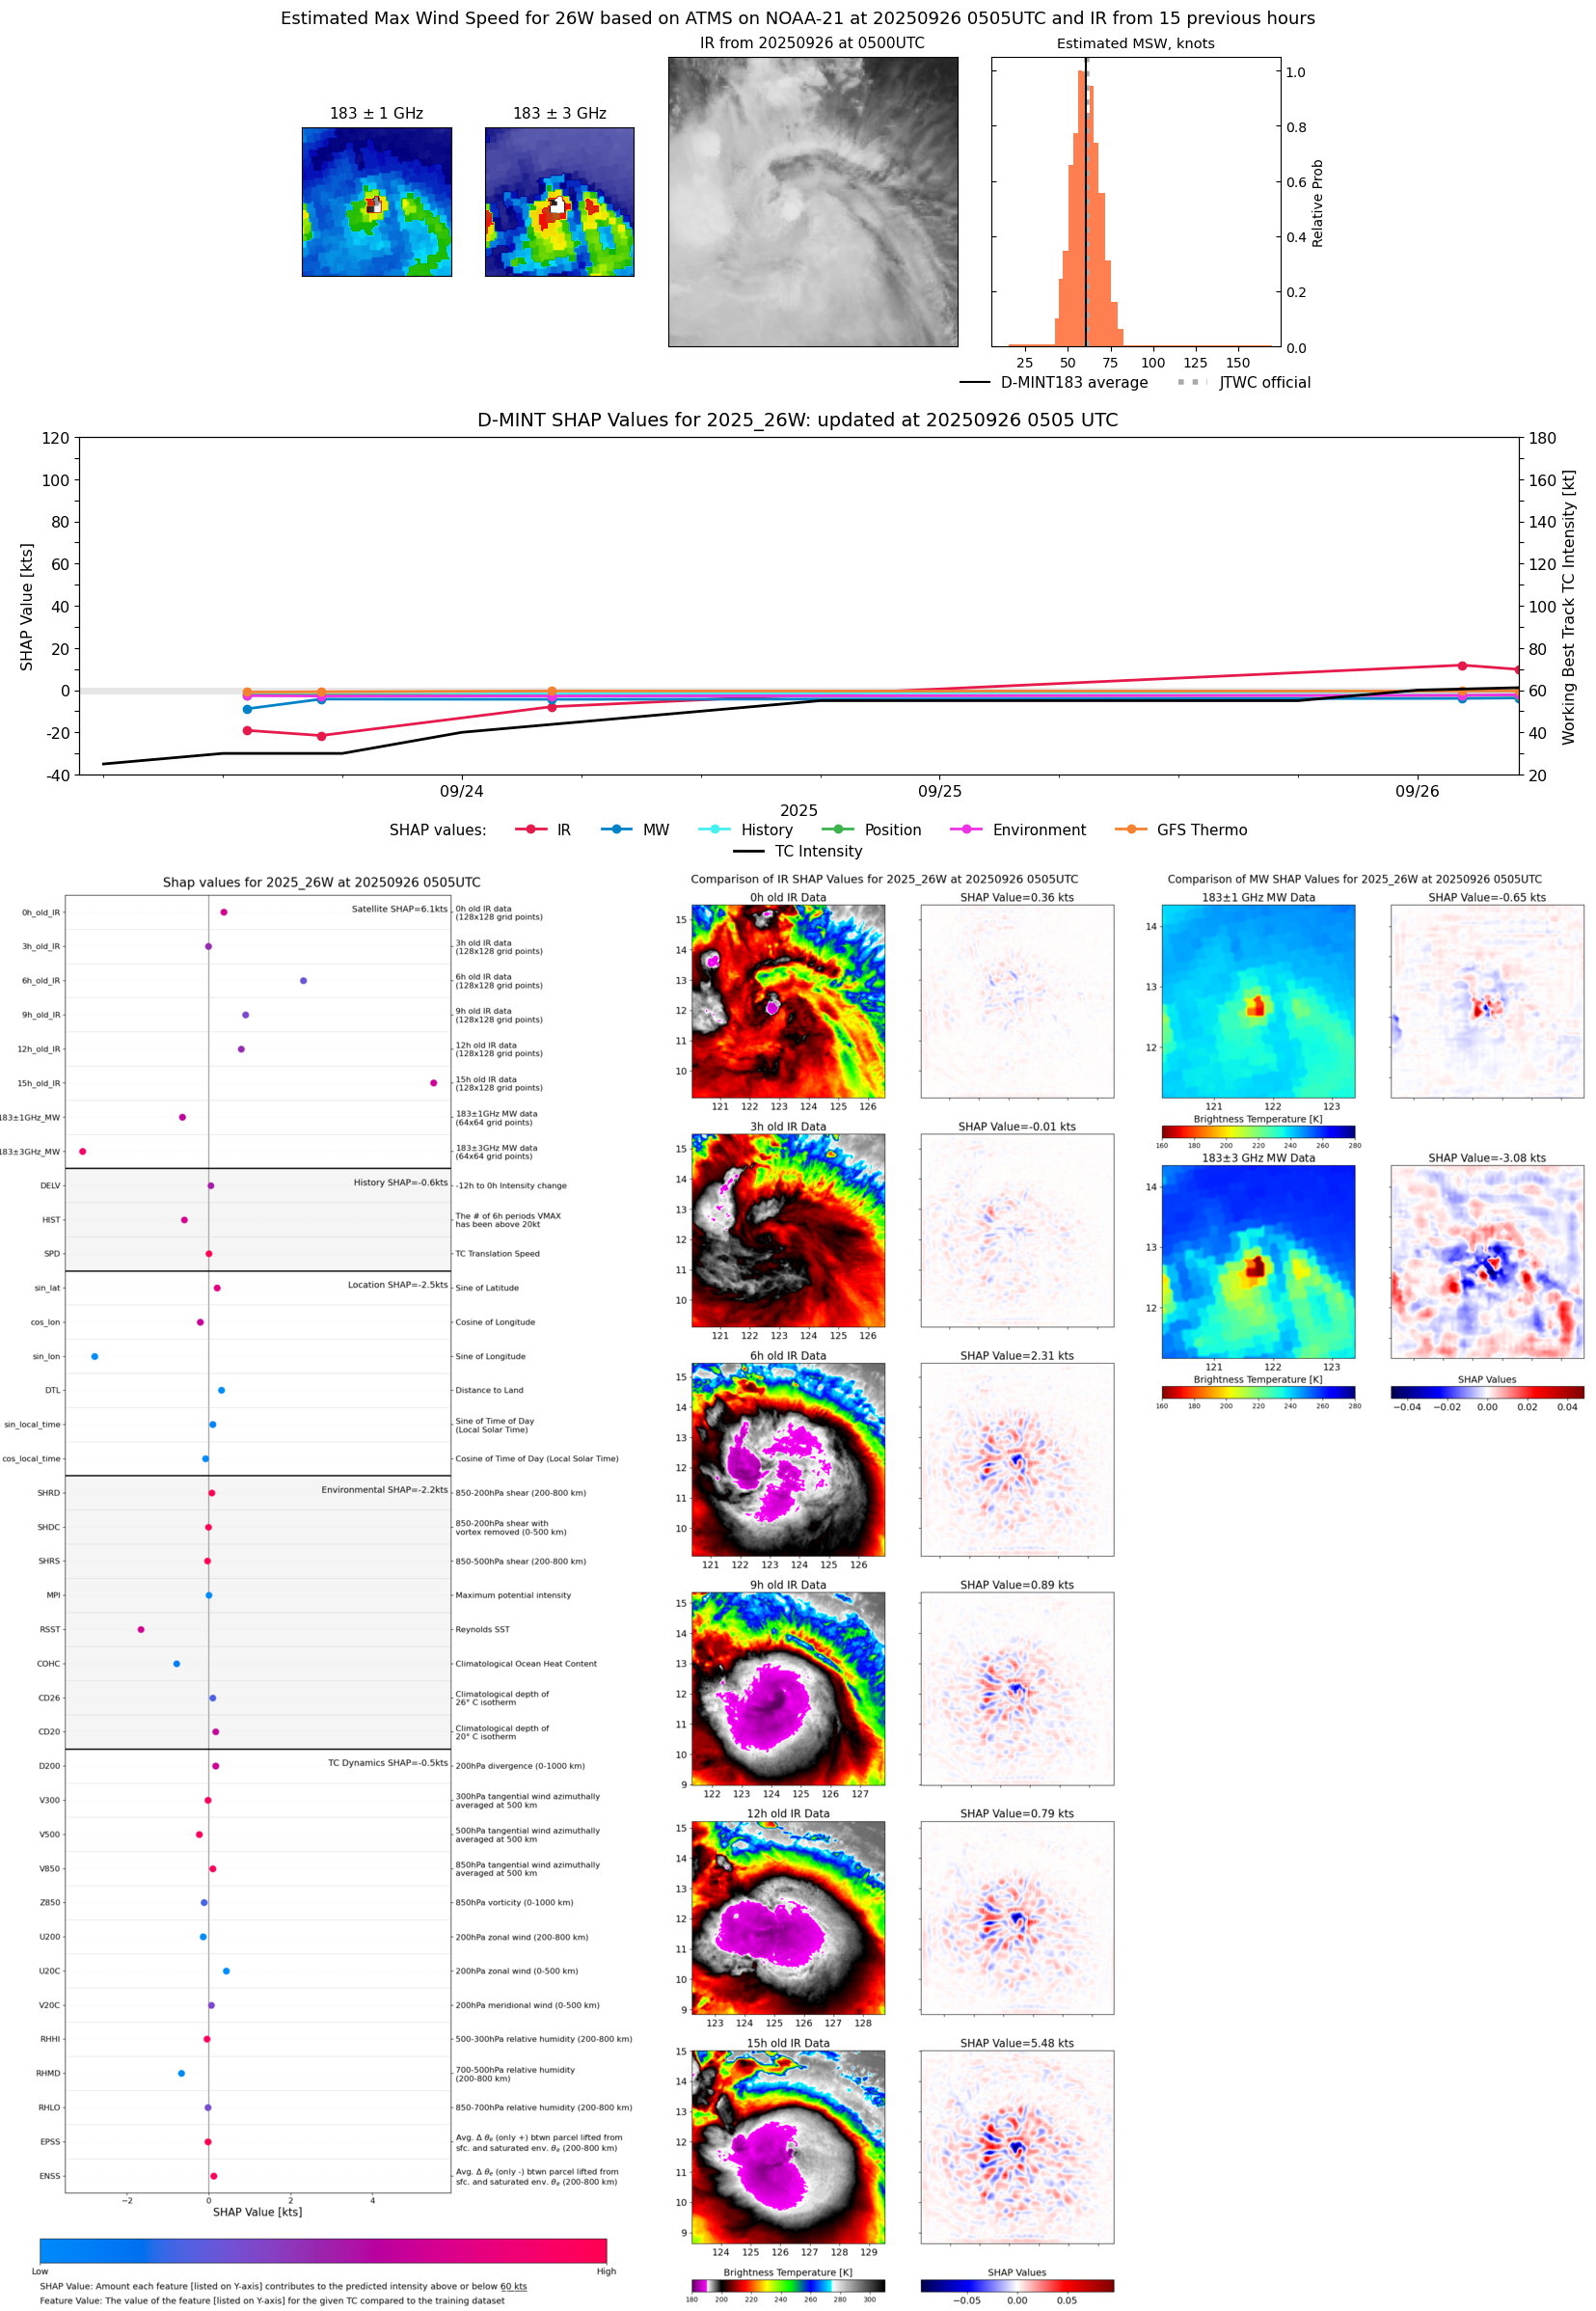 |
| 20250926 | 0215 UTC | AWS | 982 hPa | 62 kts | 56 kts | 69 kts | 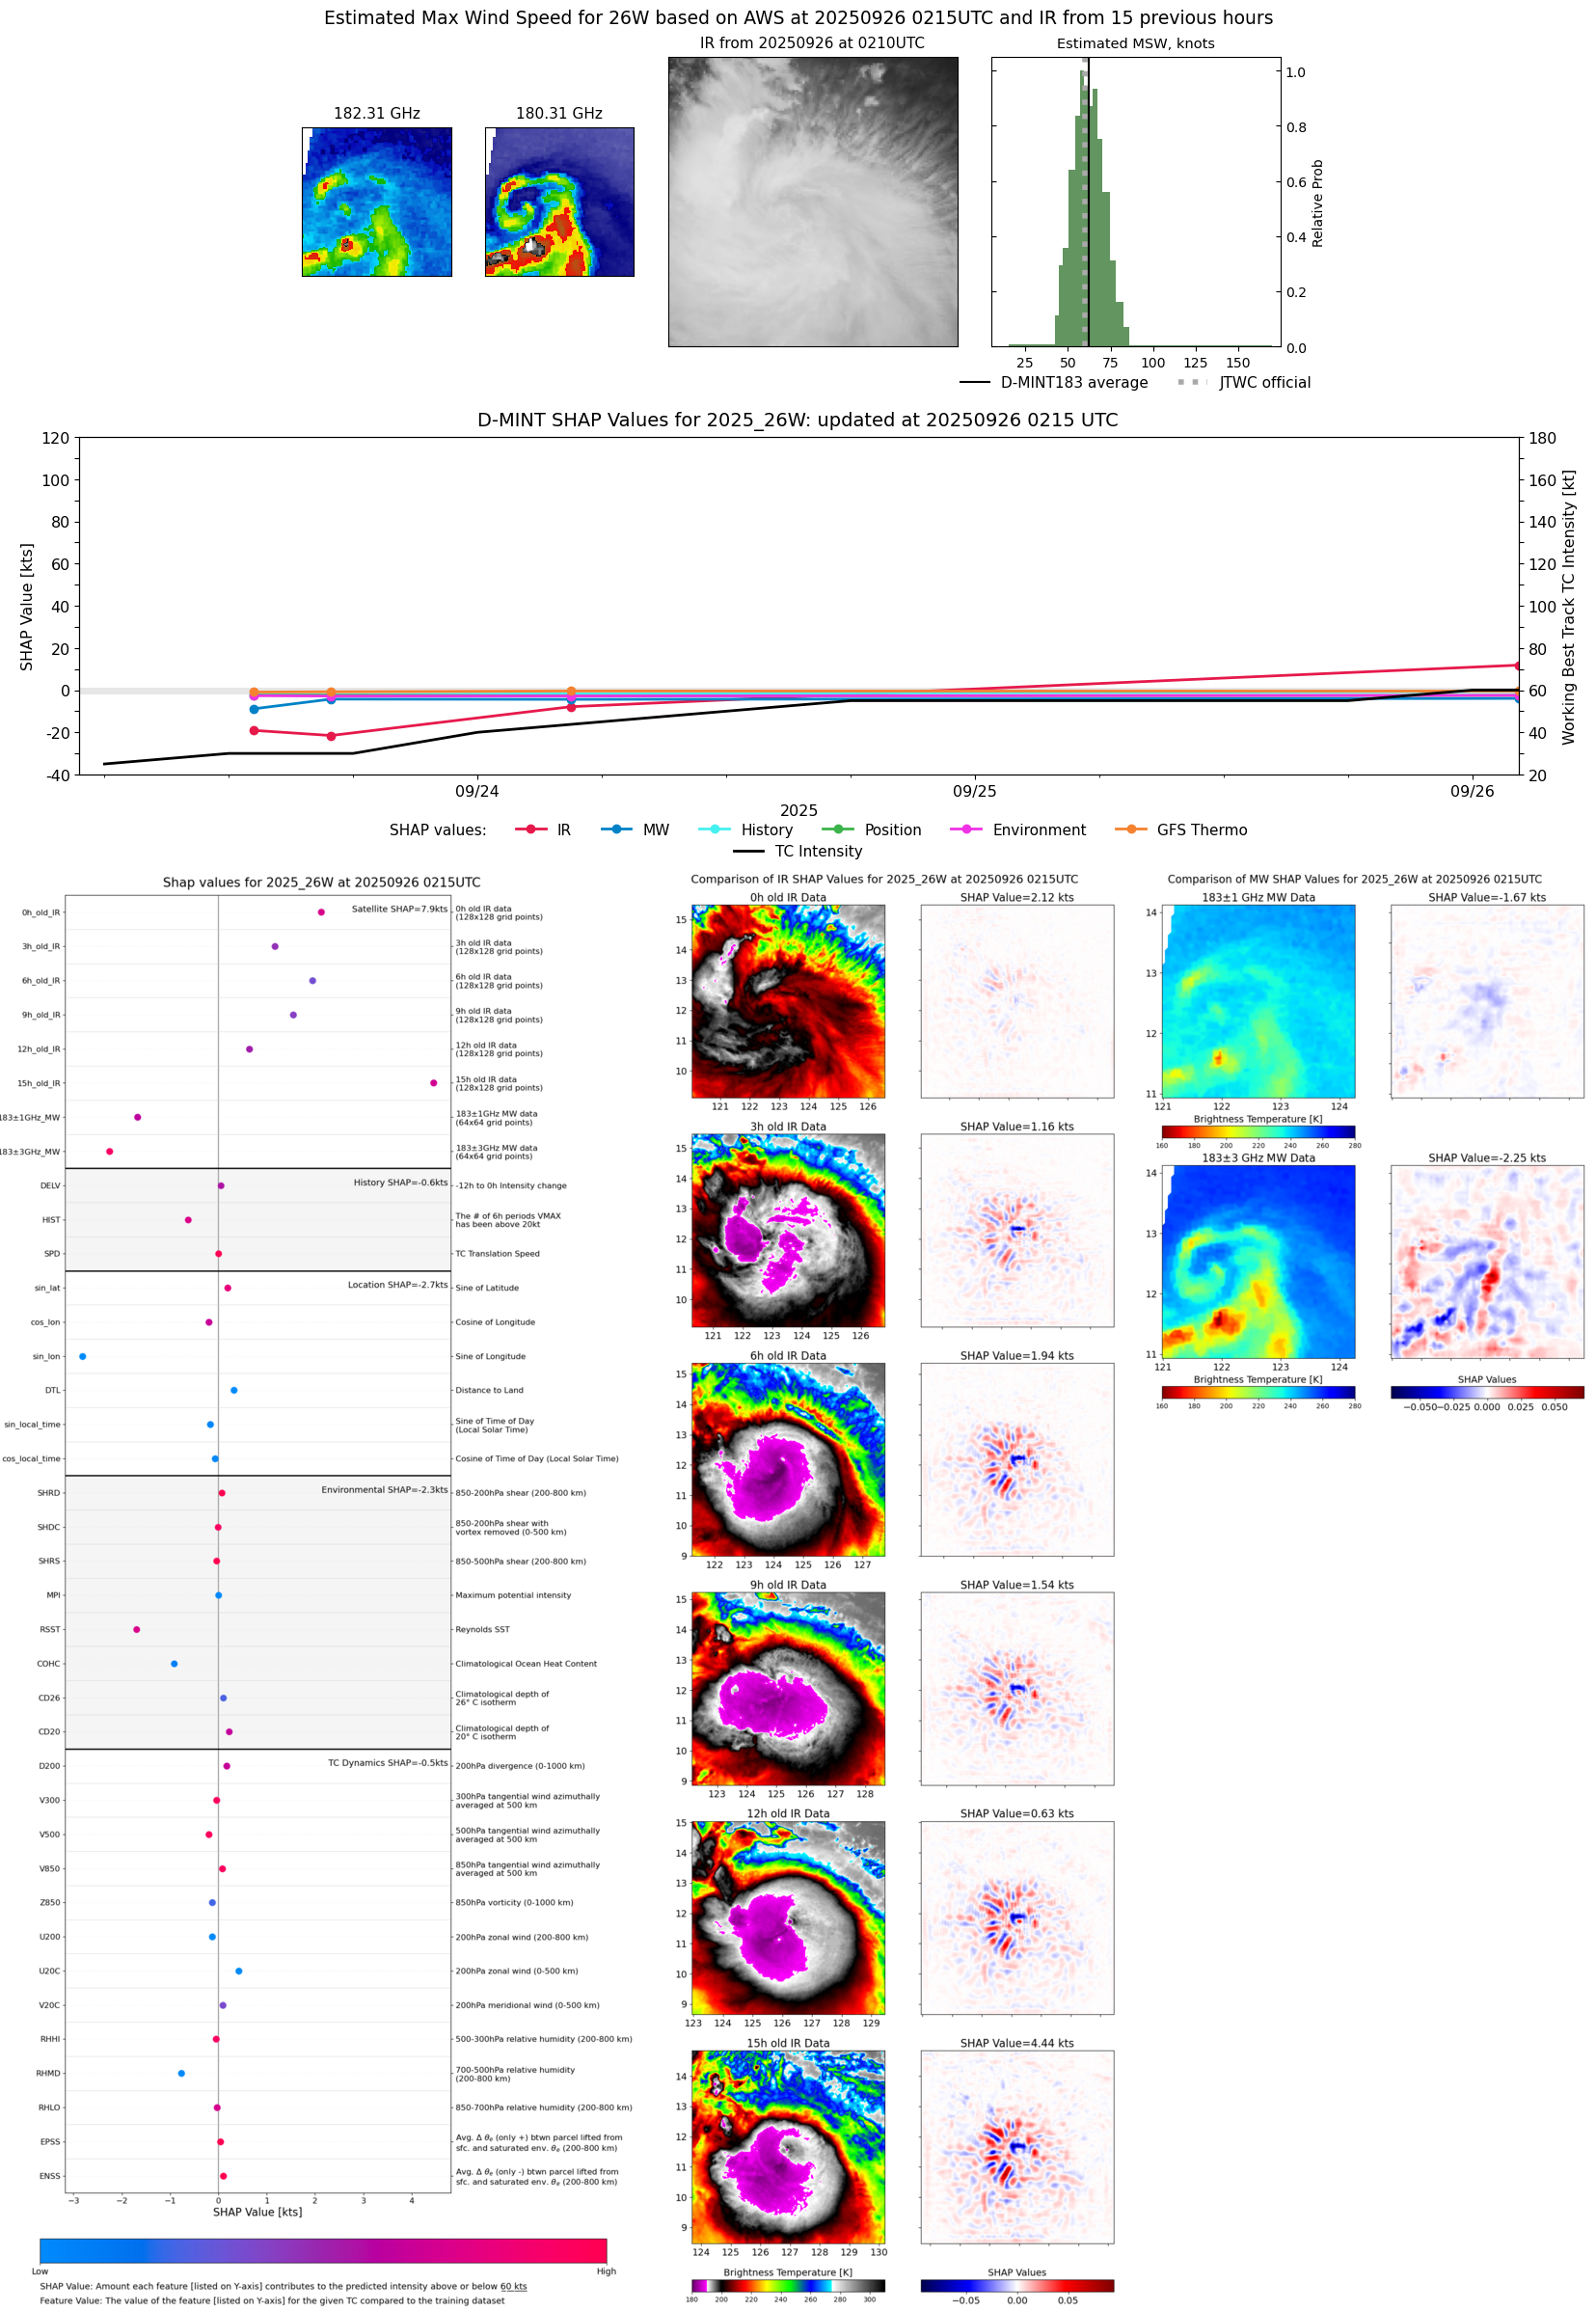 |
| 20250925 | 1952 UTC | TMS07 | NaN hPa | 63 kts | 57 kts | 70 kts | 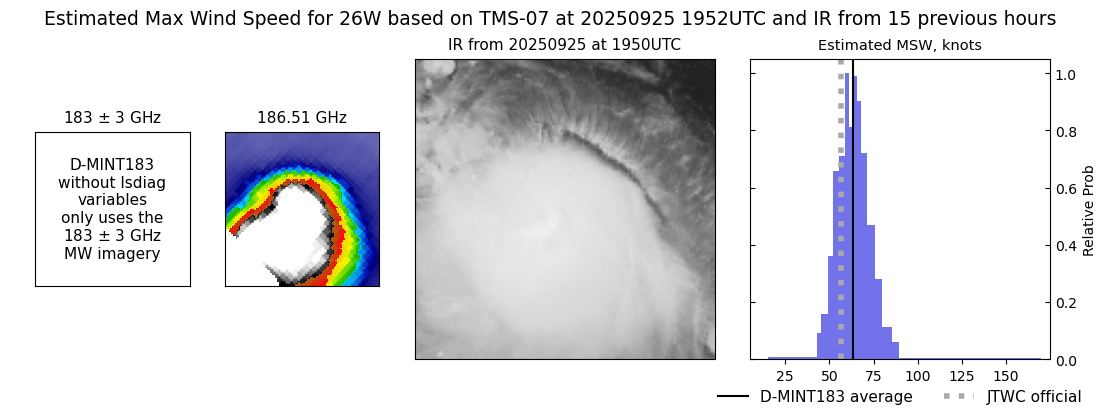 |
| 20250925 | 1043 UTC | GMI | NaN hPa | 57 kts | 50 kts | 65 kts | 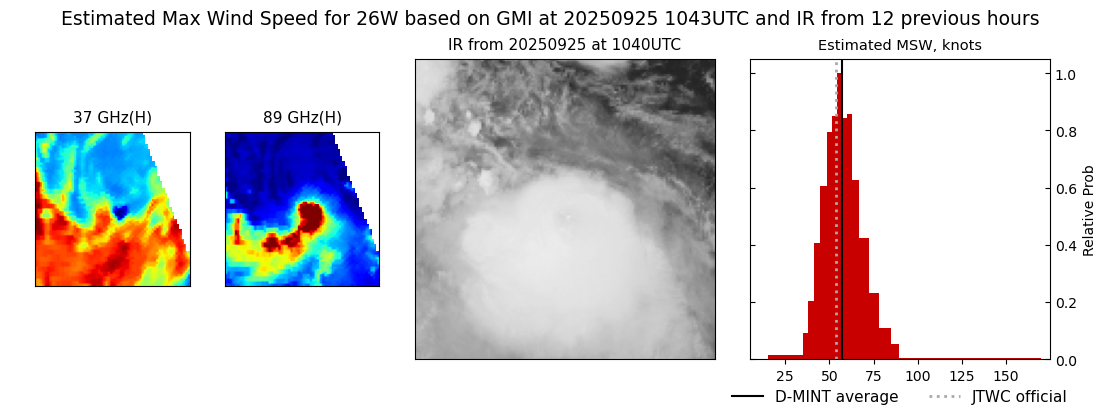 |
| 20250925 | 0139 UTC | TMS05 | NaN hPa | 43 kts | 37 kts | 50 kts | 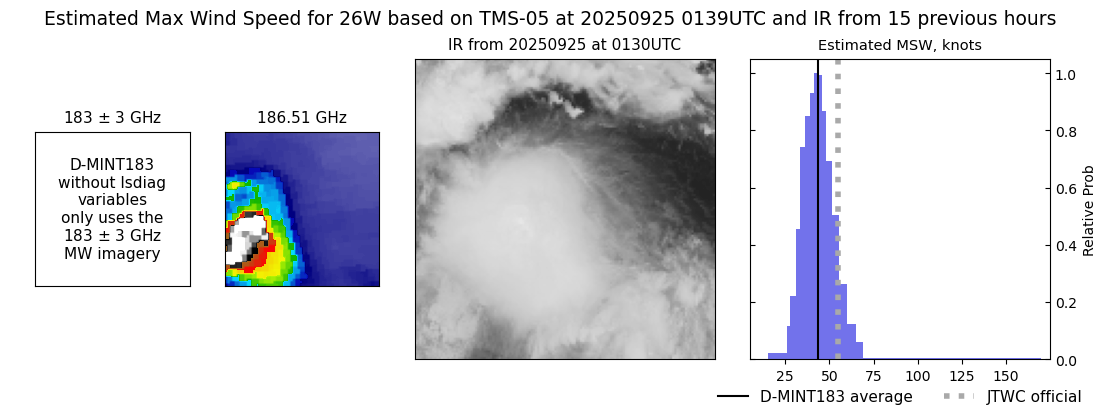 |
| 20250924 | 2308 UTC | GMI | NaN hPa | 54 kts | 47 kts | 62 kts | 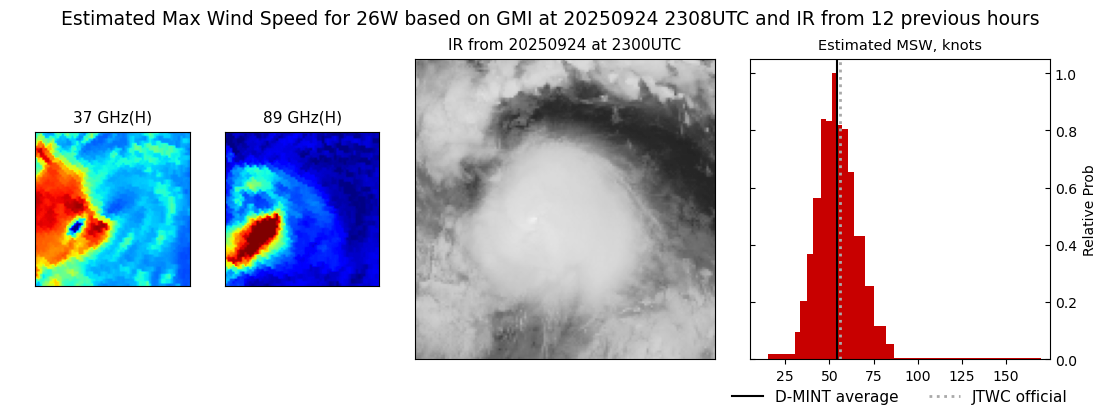 |
| 20250924 | 2116 UTC | WSFM01 | NaN hPa | 51 kts | 44 kts | 58 kts | 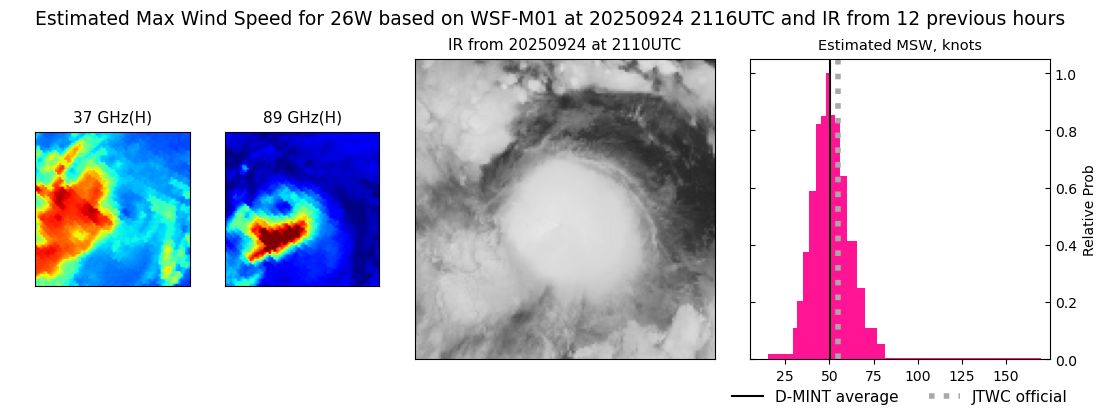 |
| 20250924 | 1705 UTC | AMSR2 | NaN hPa | 46 kts | 39 kts | 52 kts | 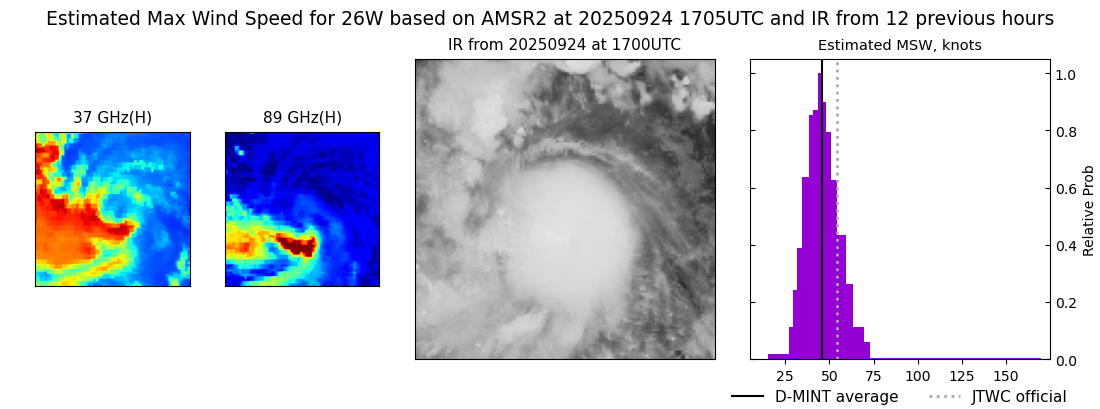 |
| 20250924 | 1336 UTC | TMS05 | NaN hPa | 47 kts | 42 kts | 53 kts | 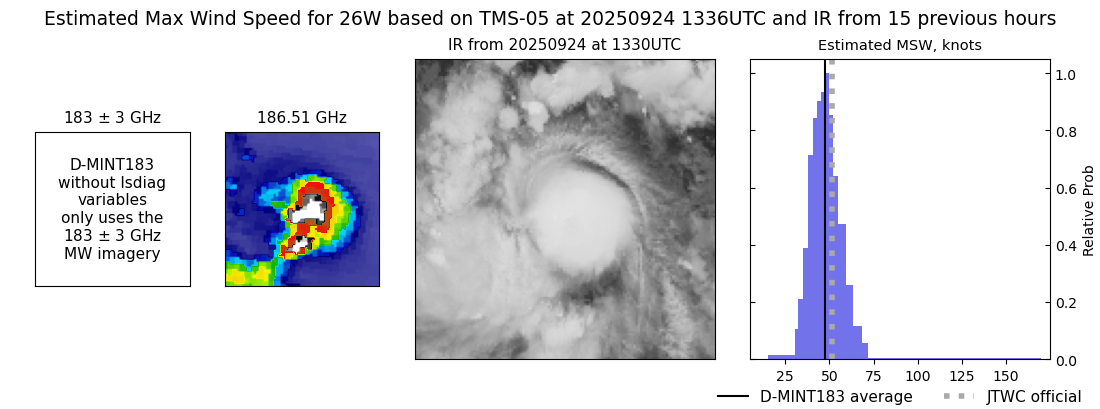 |
| 20250924 | 0920 UTC | SSMISF16 | 997 hPa | 35 kts | 31 kts | 40 kts |  |
| 20250924 | 0842 UTC | WSFM01 | 1002 hPa | 34 kts | 29 kts | 40 kts | 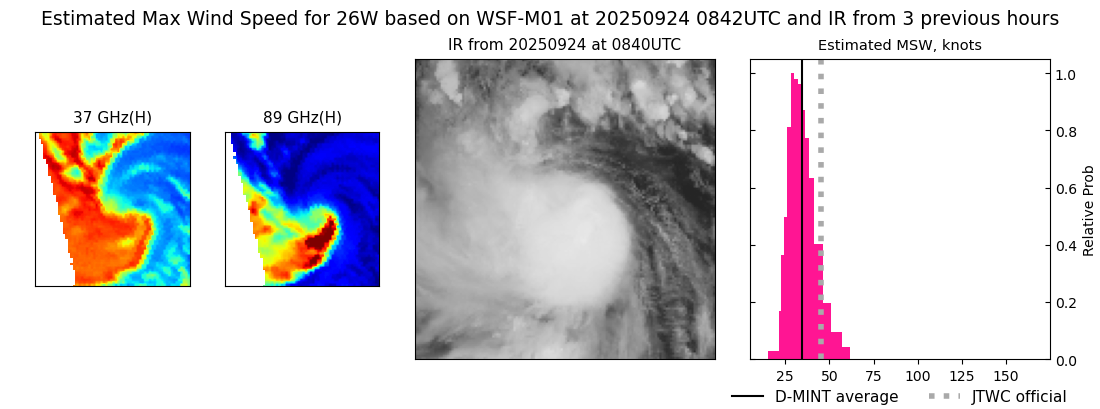 |
| 20250924 | 0715 UTC | SSMISF18 | 1001 hPa | 35 kts | 30 kts | 40 kts | 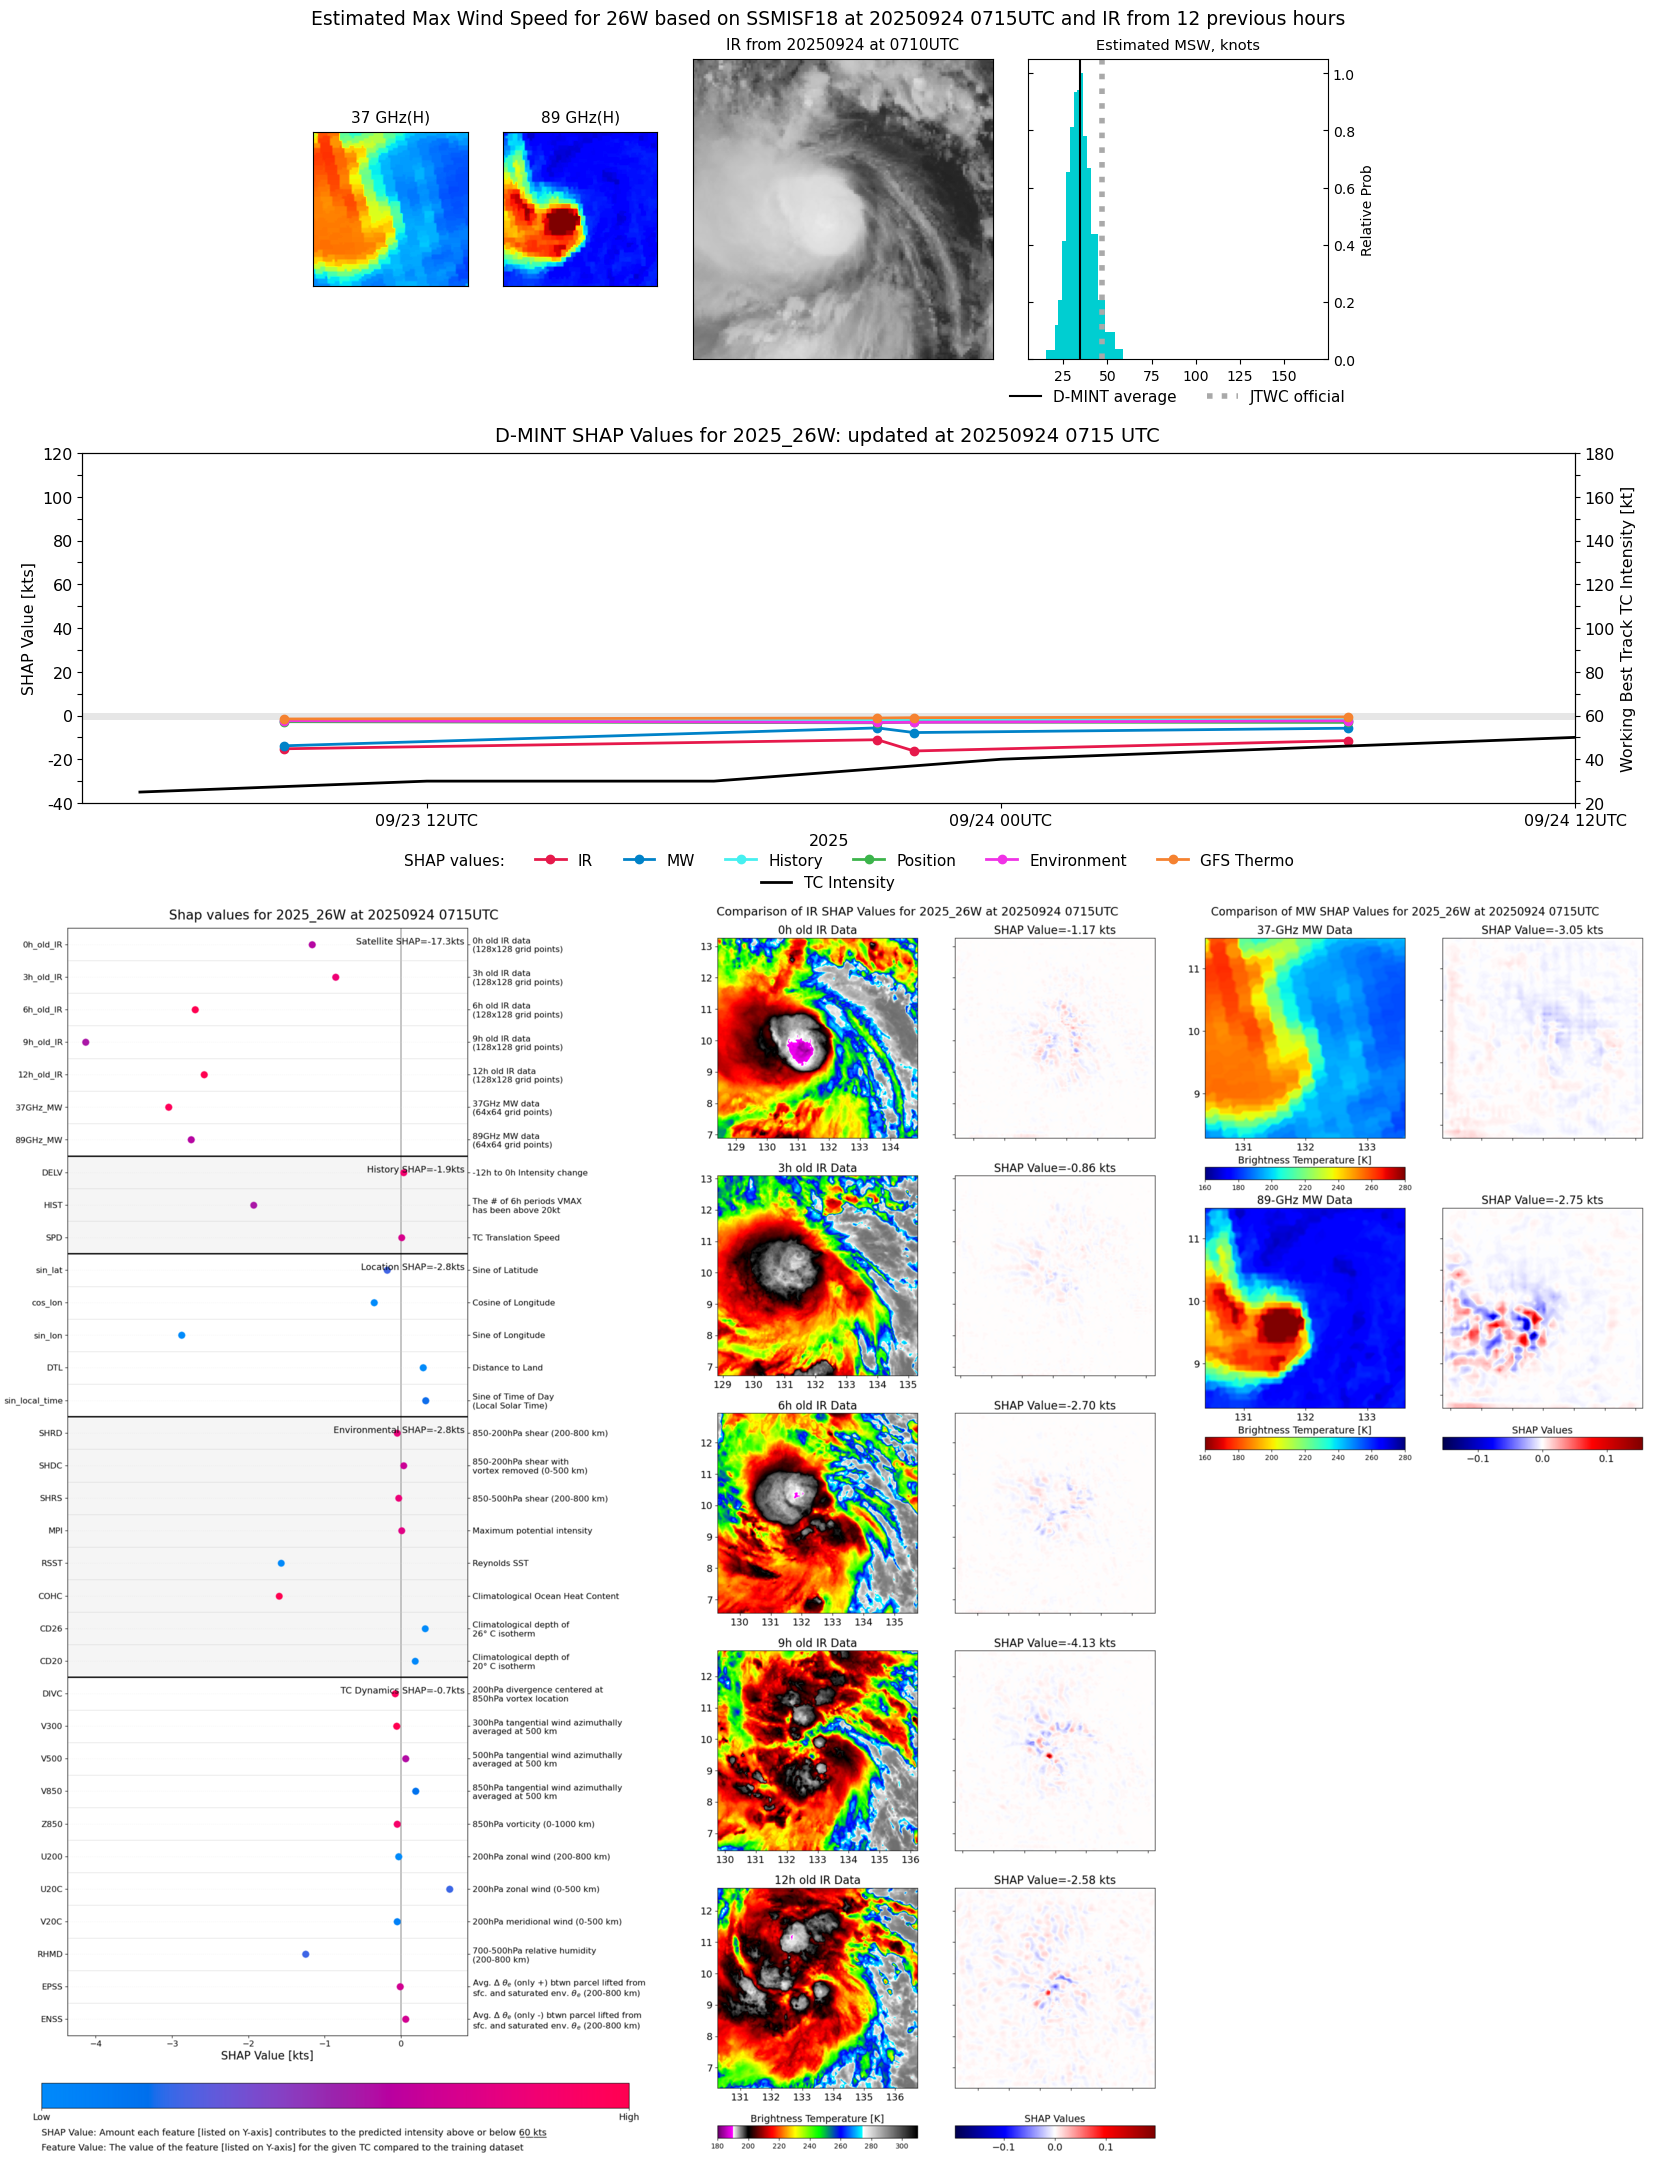 |
| 20250924 | 0430 UTC | ATMS-NPP | 996 hPa | 40 kts | 35 kts | 46 kts |  |
| 20250923 | 2211 UTC | SSMISF16 | 1003 hPa | 27 kts | 24 kts | 30 kts | 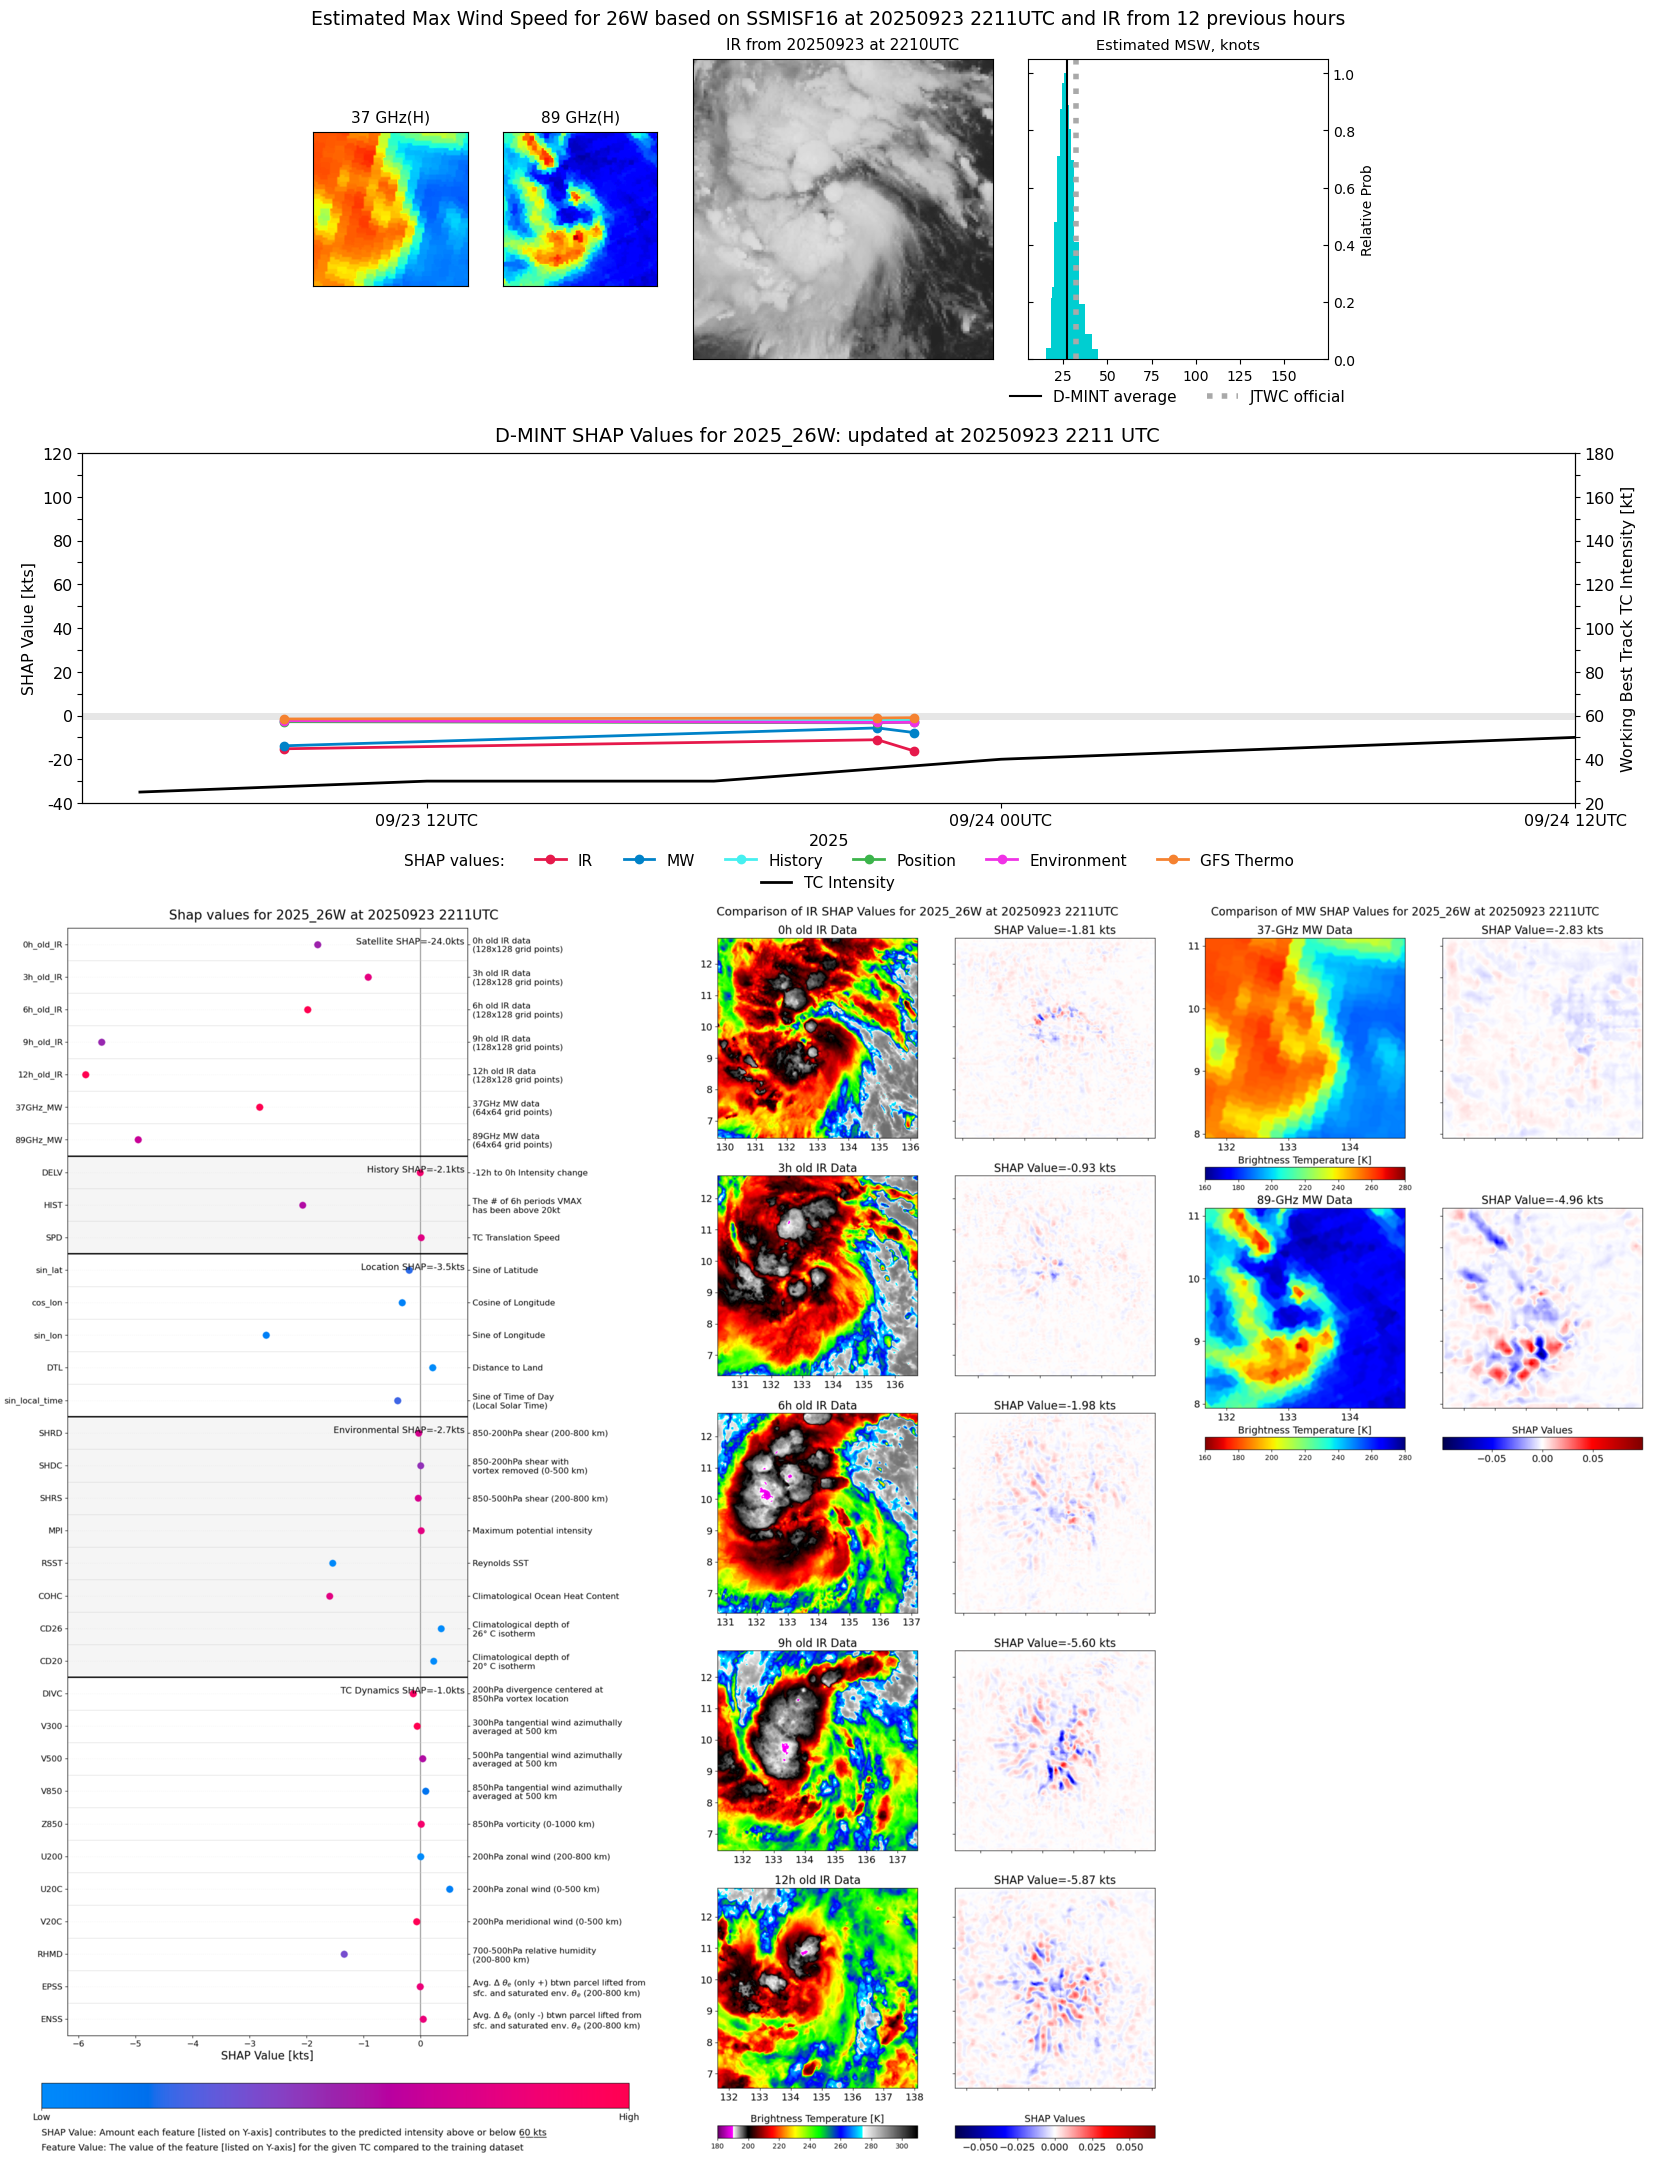 |
| 20250923 | 2136 UTC | WSFM01 | 1002 hPa | 28 kts | 25 kts | 32 kts | 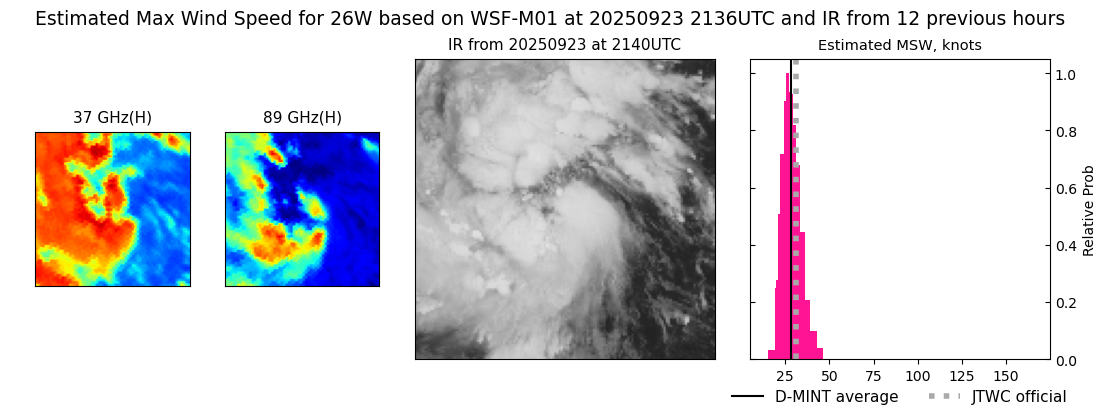 |
| 20250923 | 2125 UTC | SSMISF17 | 1001 hPa | 33 kts | 29 kts | 38 kts | 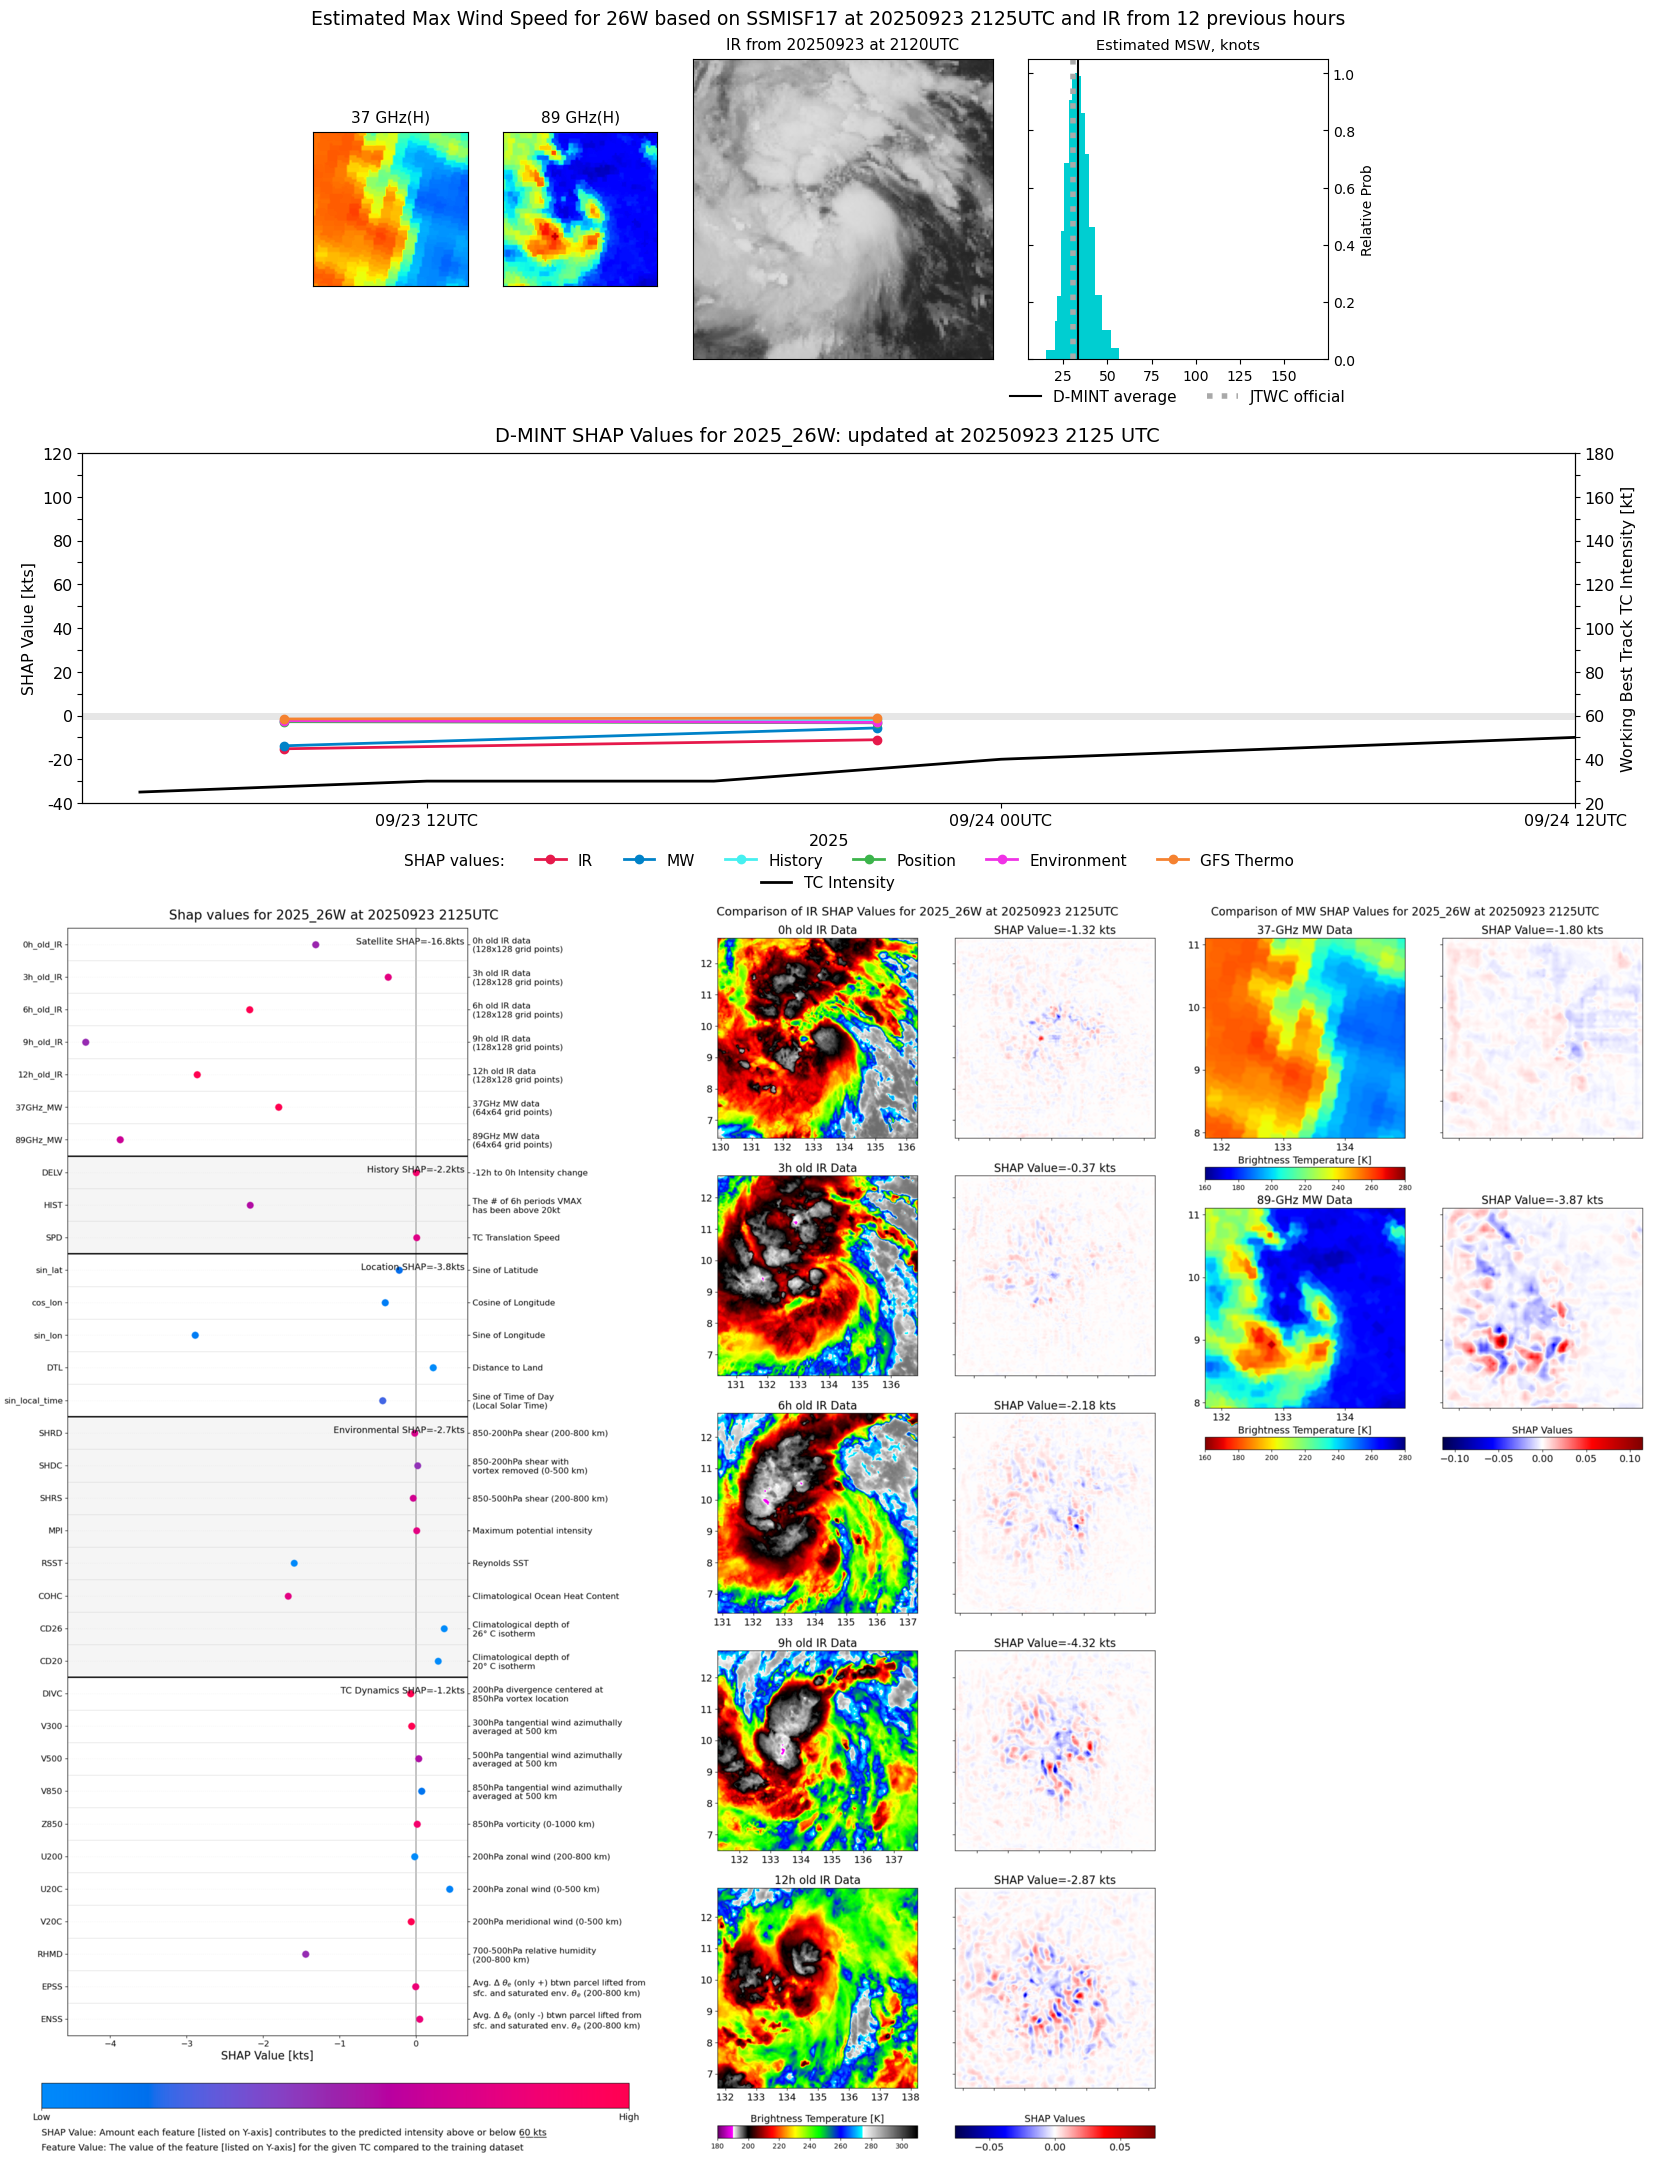 |
| 20250923 | 1656 UTC | ATMS-N21 | 1001 hPa | 26 kts | 24 kts | 29 kts | 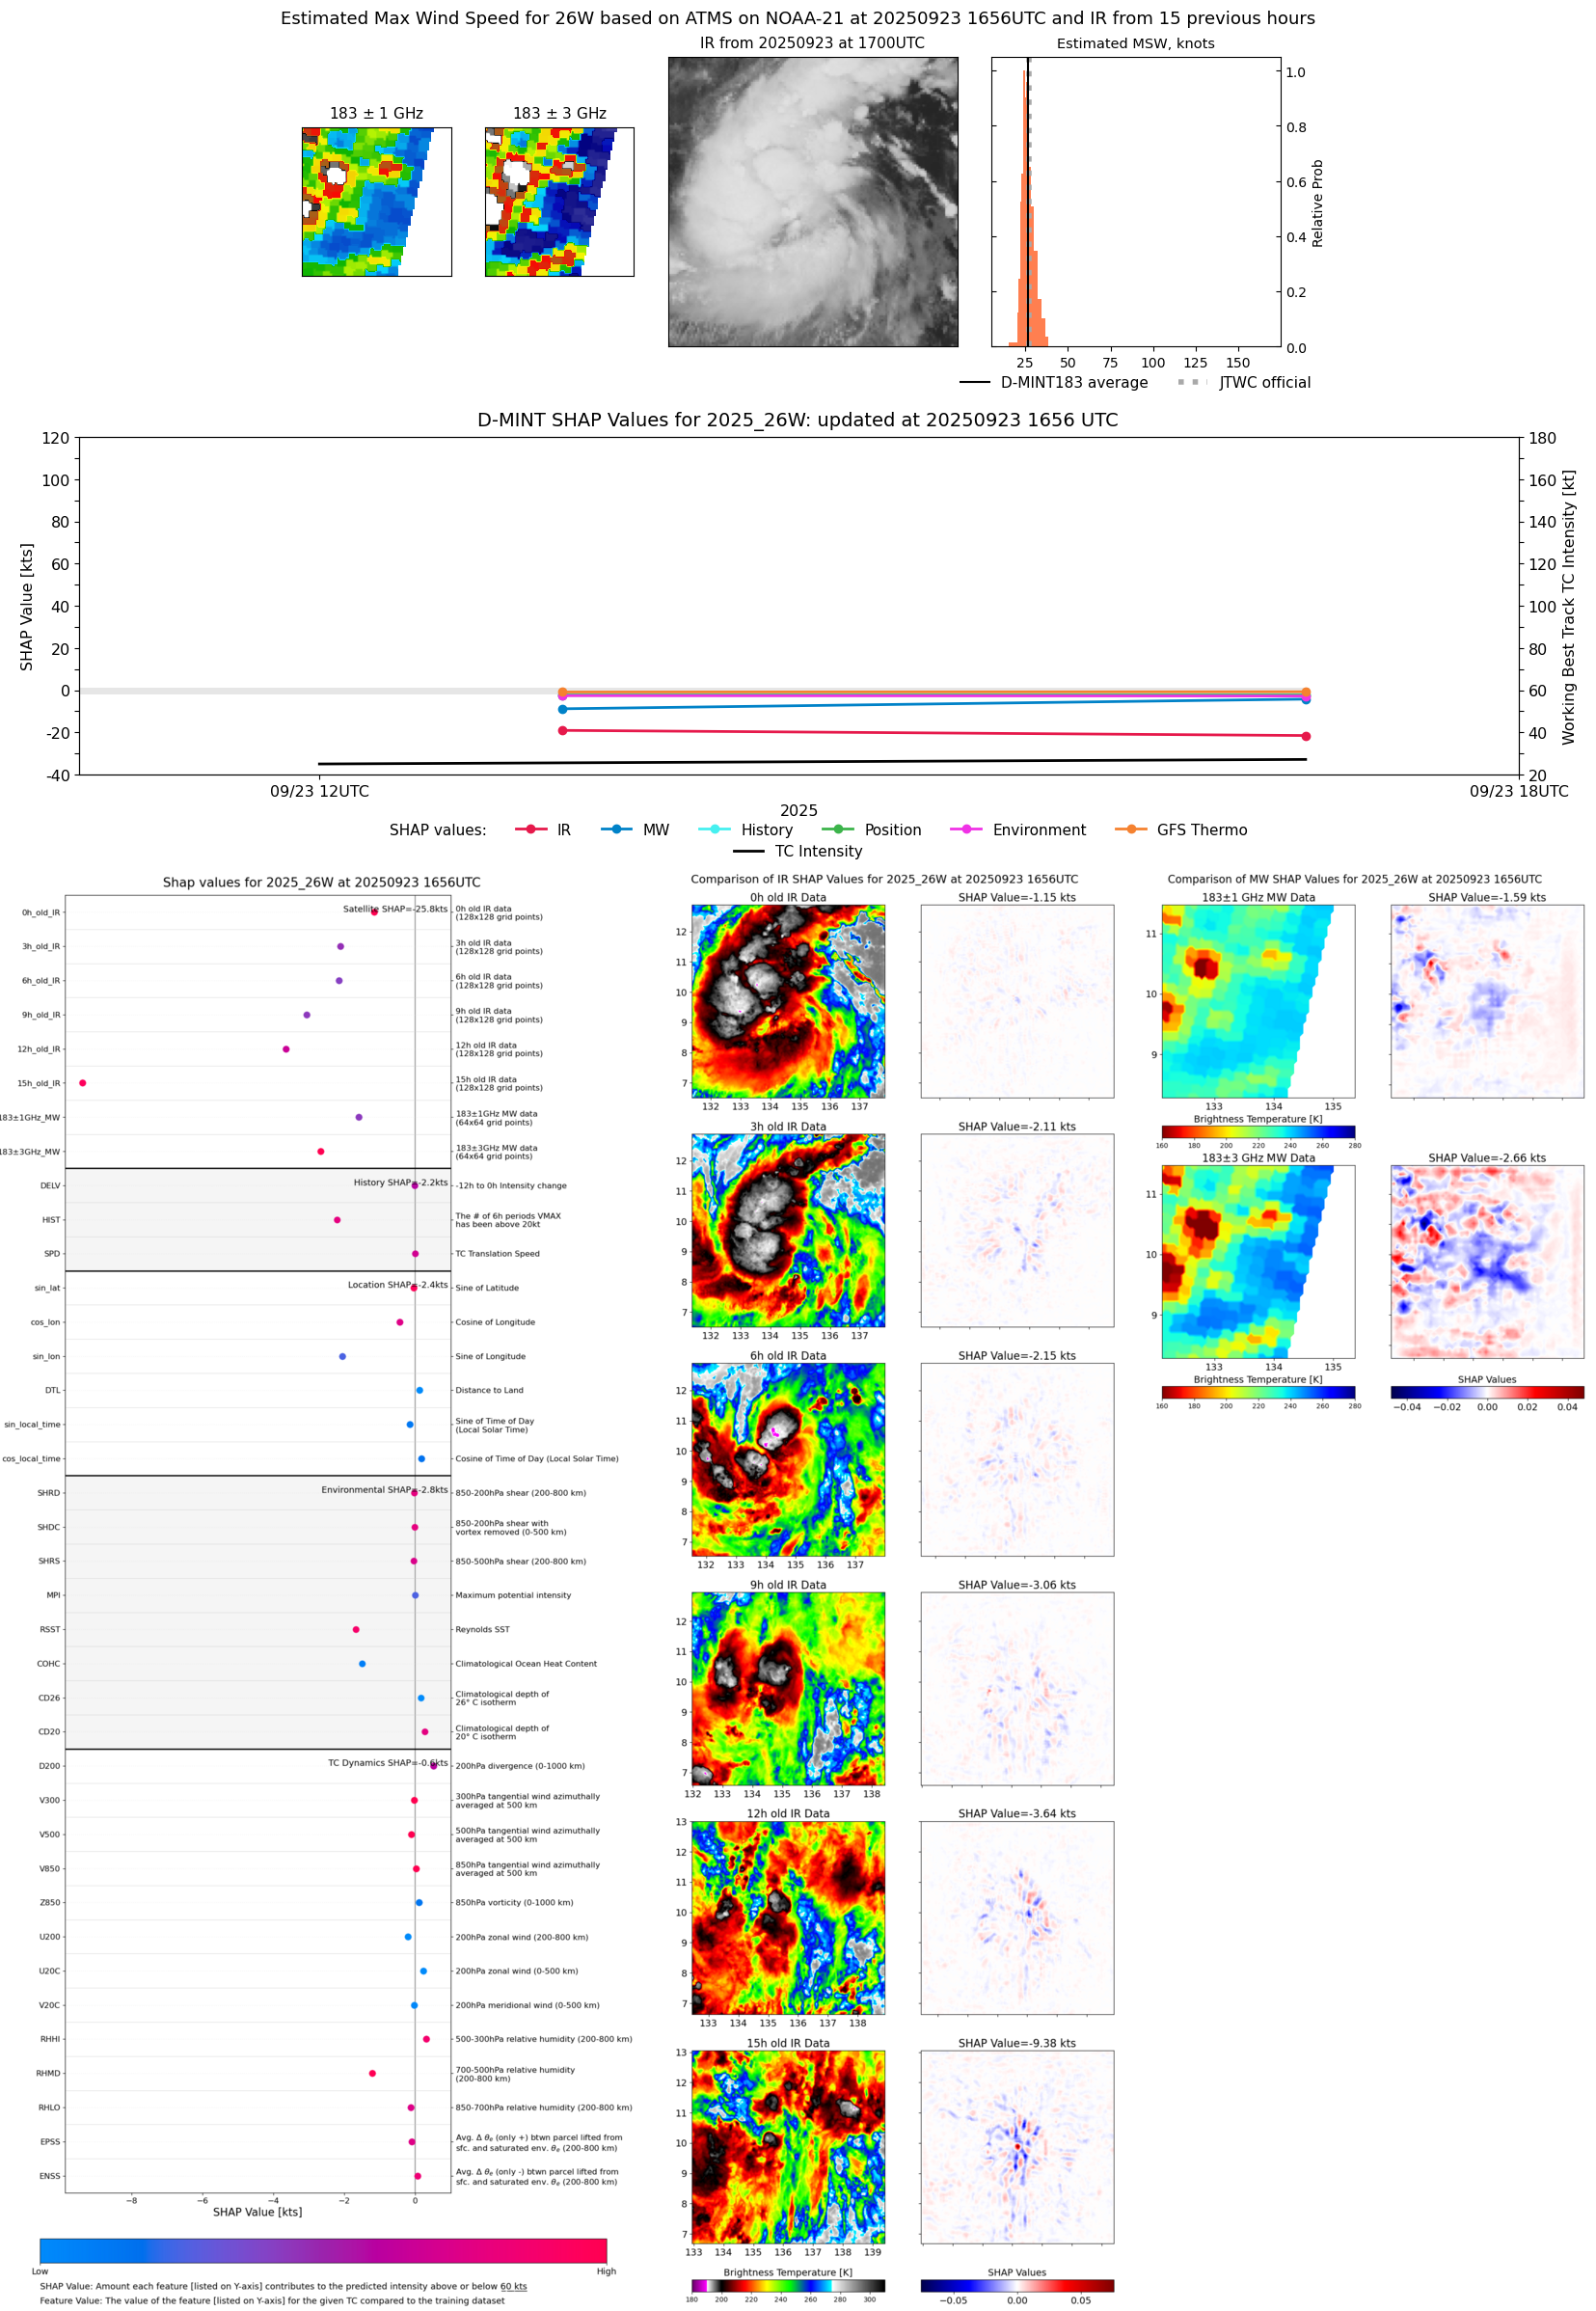 |
| 20250923 | 1623 UTC | AMSR2 | 1004 hPa | 26 kts | 23 kts | 29 kts |  |
| 20250923 | 1313 UTC | TMS06 | 1003 hPa | 24 kts | 22 kts | 27 kts |  |
| 20250923 | 0901 UTC | WSFM01 | 1004 hPa | 22 kts | 20 kts | 24 kts | 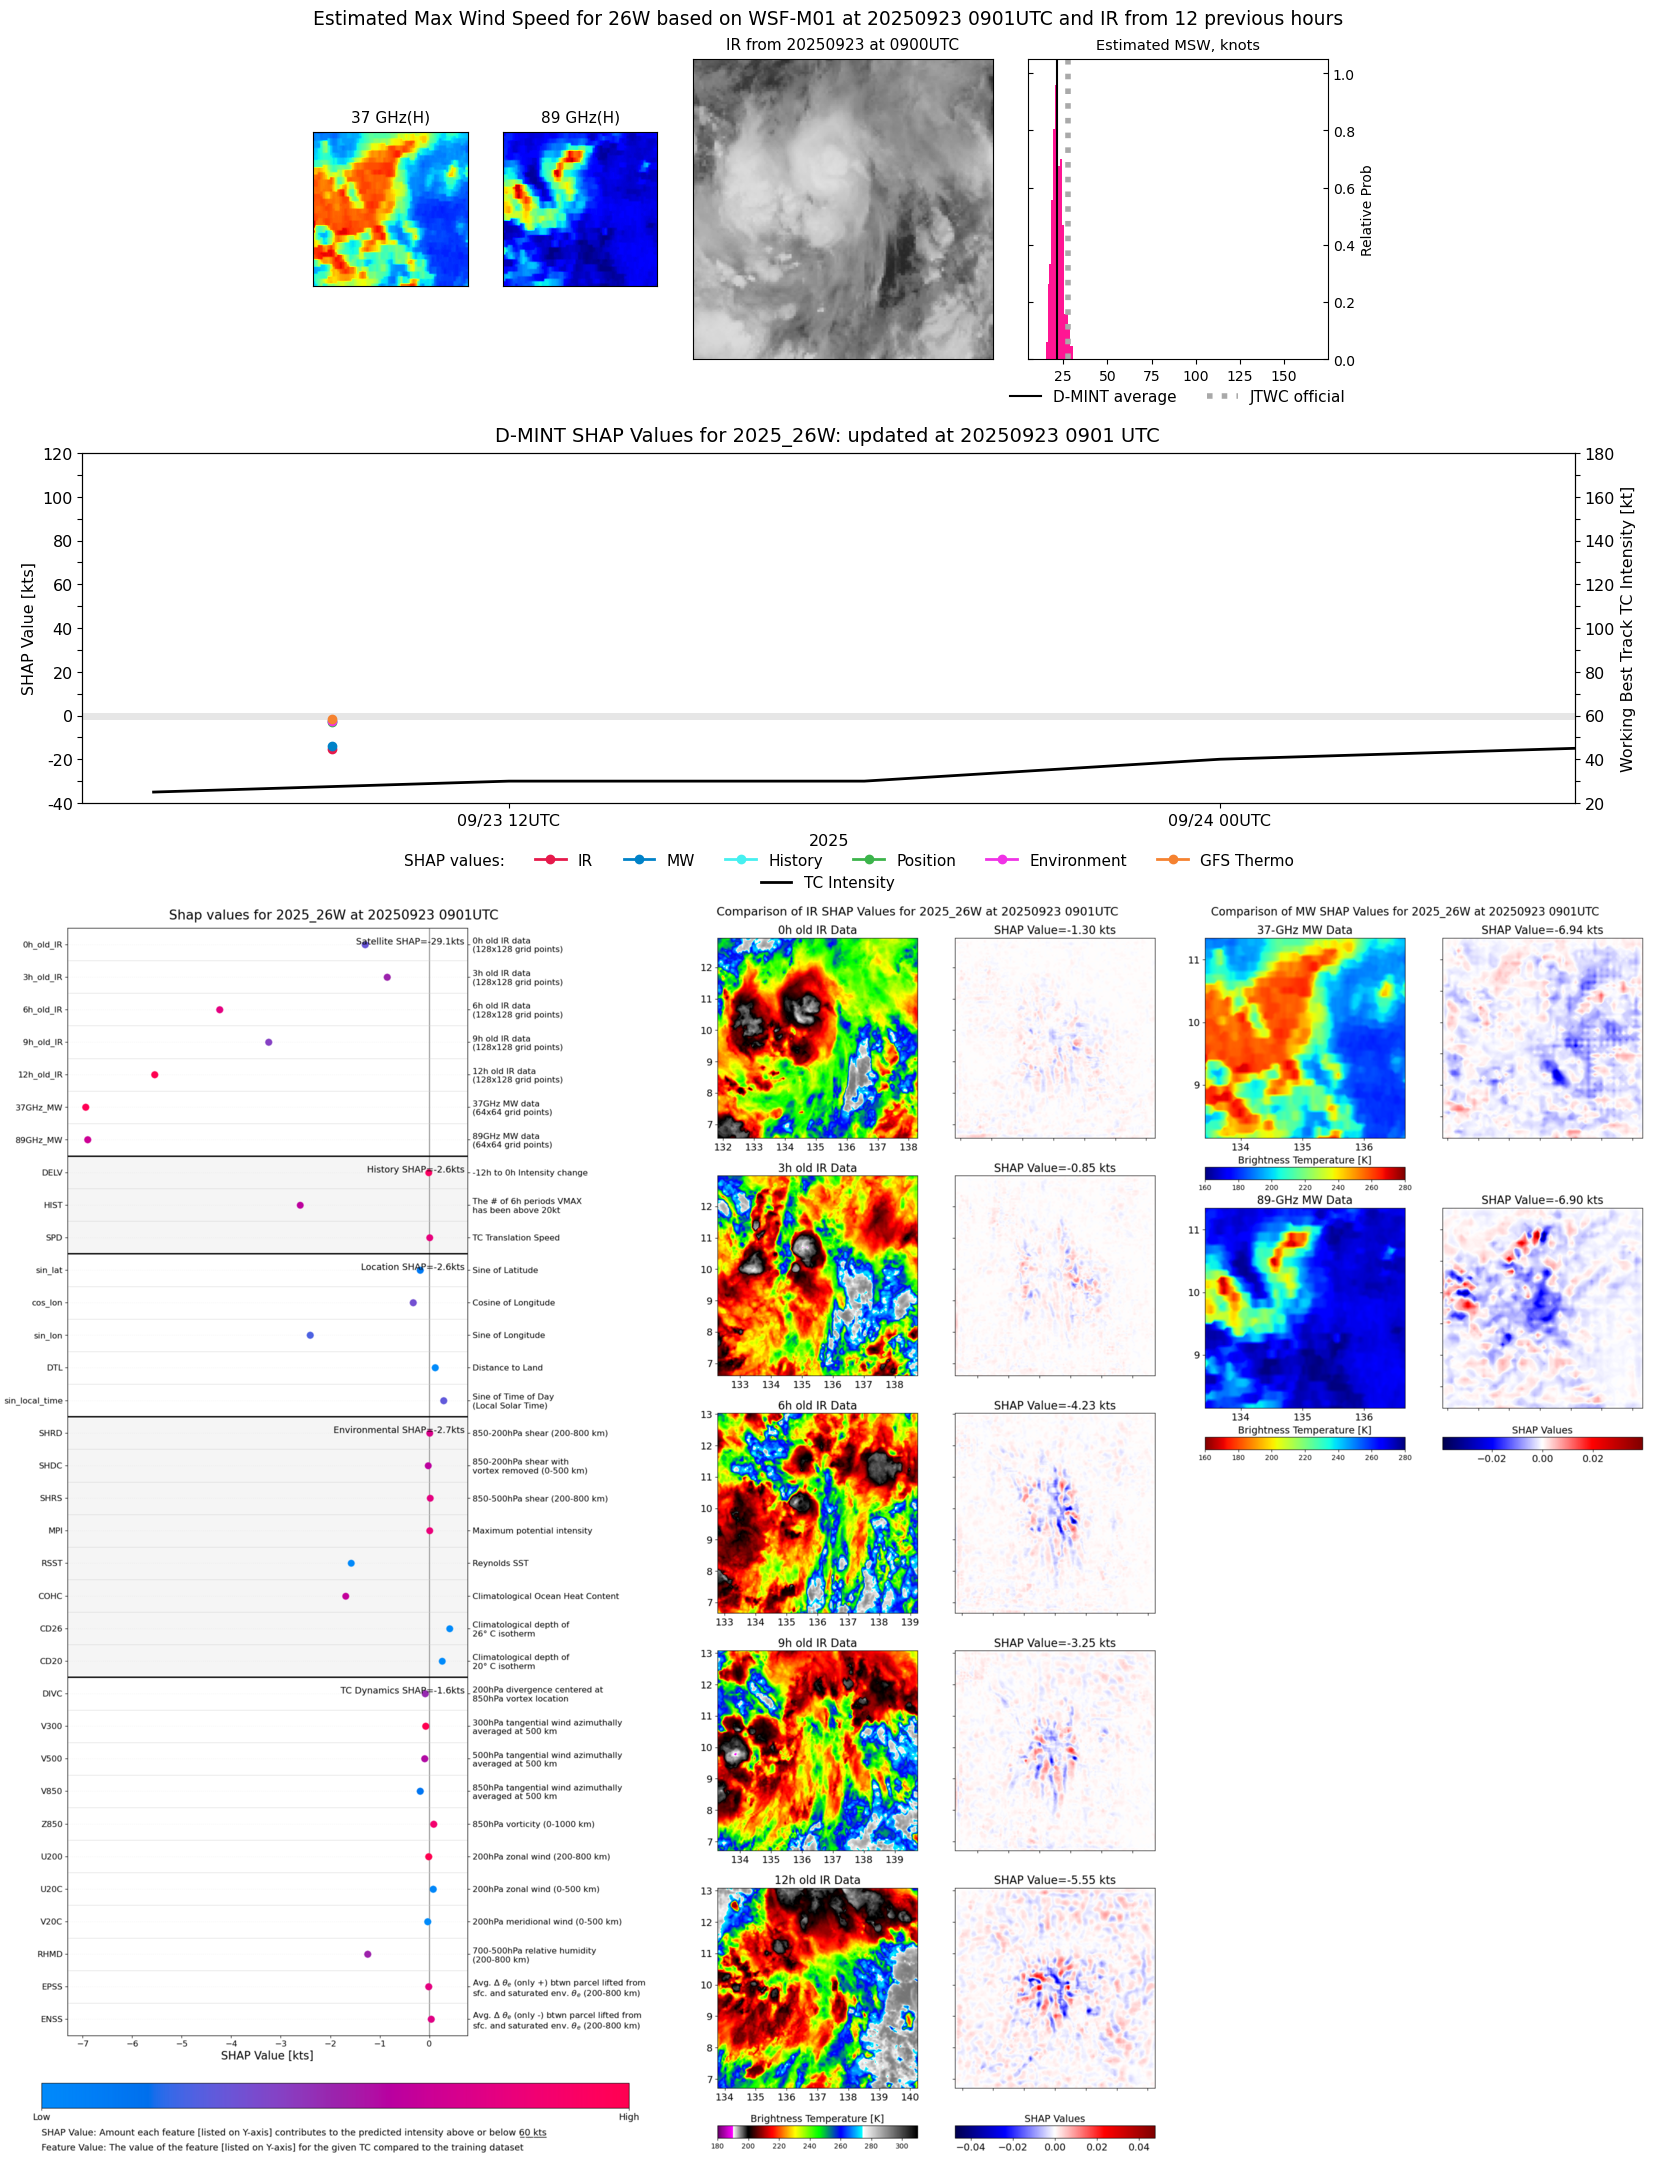 |