|
||

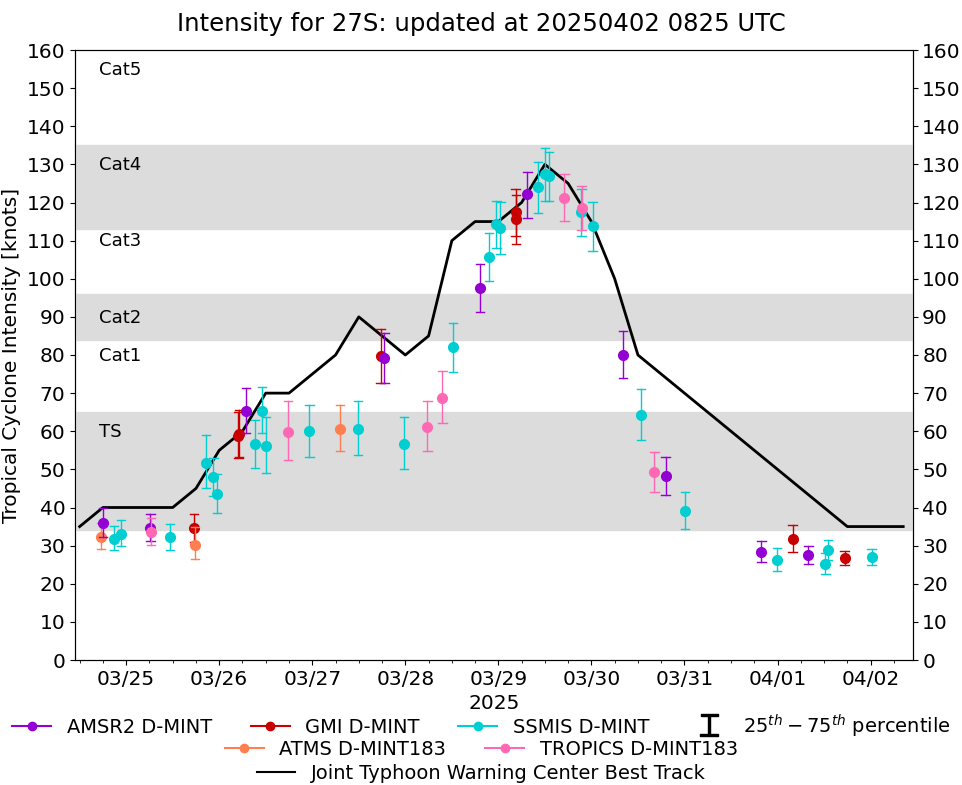 |
D-MINT HISTORY FILE for 2025_27S
| Date | Time | MW Sensor | MSLP | Vmax (30th-70th percentile average) | Vmax 25th percentile | Vmax 75th percentile | Image |
| 20250403 | 1734 UTC | GMI | 1004 hPa | 26 kts | 24 kts | 28 kts |  |
| 20250403 | 1334 UTC | SSMISF16 | 1004 hPa | 24 kts | 22 kts | 27 kts |  |
| 20250403 | 1041 UTC | SSMISF18 | NaN hPa | 25 kts | 23 kts | 28 kts |  |
| 20250403 | 0106 UTC | SSMISF16 | 1003 hPa | 21 kts | 20 kts | 23 kts |  |
| 20250403 | 0002 UTC | SSMISF17 | 1000 hPa | 27 kts | 25 kts | 29 kts |  |
| 20250402 | 2210 UTC | SSMISF18 | 1001 hPa | 26 kts | 24 kts | 28 kts |  |
| 20250402 | 1245 UTC | SSMISF17 | 1002 hPa | 30 kts | 28 kts | 33 kts |  |
| 20250402 | 1054 UTC | SSMISF18 | 1002 hPa | 31 kts | 28 kts | 34 kts |  |
| 20250402 | 0016 UTC | SSMISF17 | 1001 hPa | 27 kts | 25 kts | 29 kts | 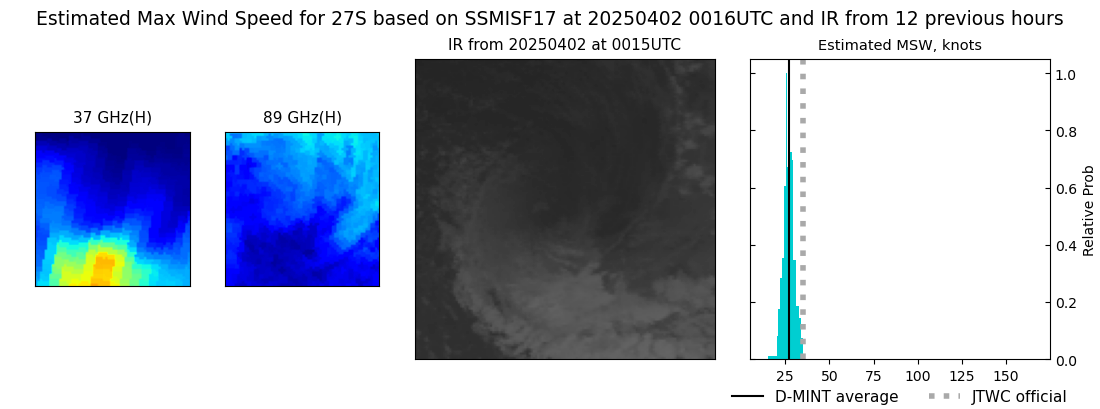 |
| 20250401 | 1718 UTC | GMI | 1001 hPa | 27 kts | 25 kts | 29 kts |  |
| 20250401 | 1300 UTC | SSMISF17 | 1001 hPa | 29 kts | 26 kts | 31 kts | 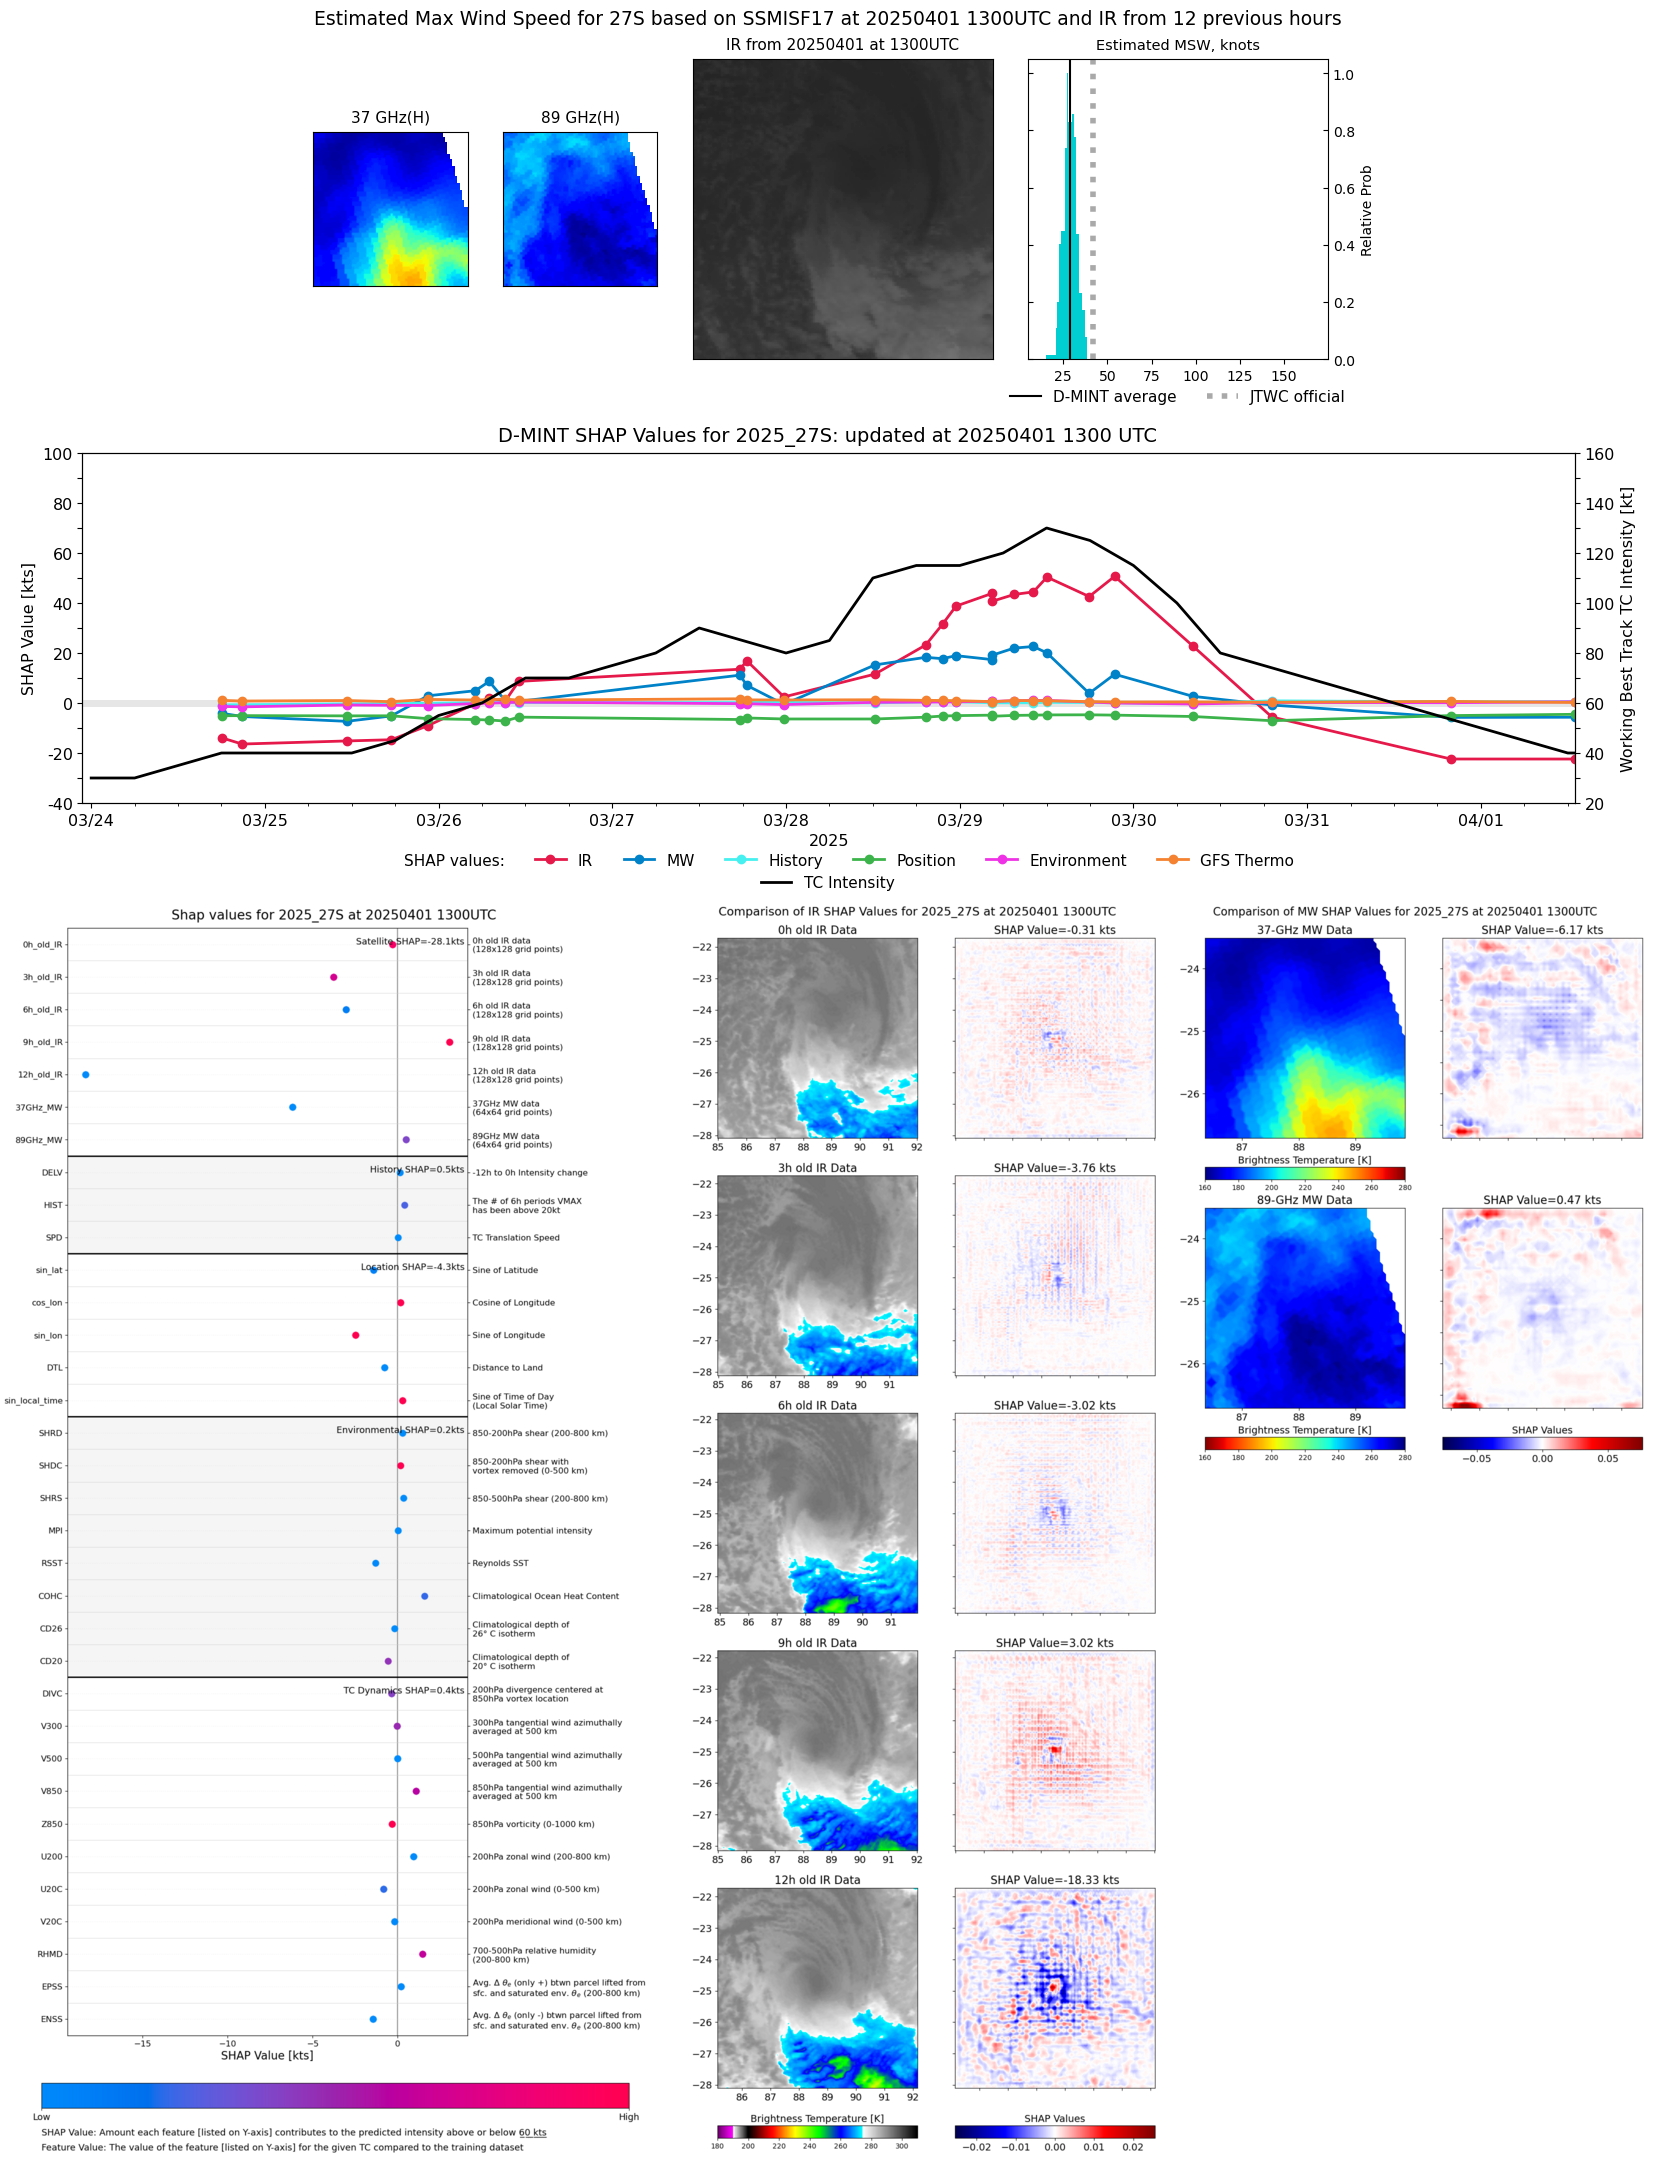 |
| 20250401 | 1222 UTC | SSMISF16 | 1000 hPa | 25 kts | 23 kts | 28 kts | 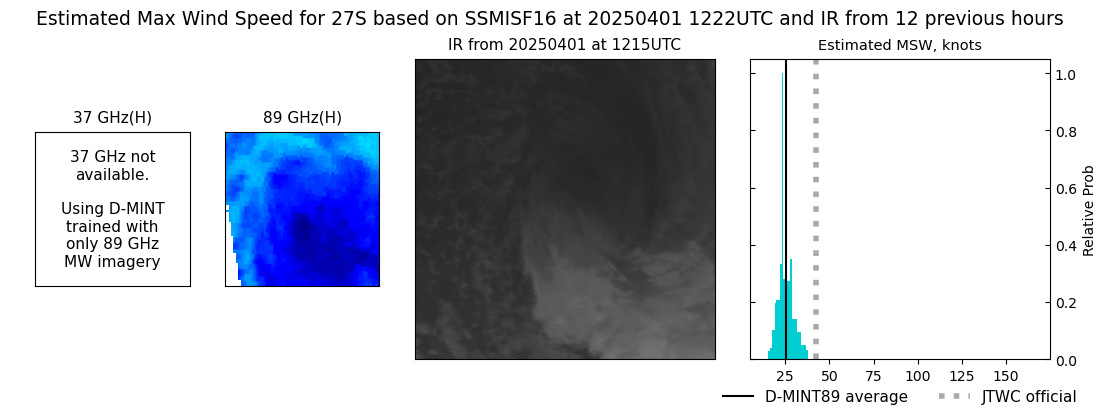 |
| 20250401 | 0758 UTC | AMSR2 | 1000 hPa | 28 kts | 25 kts | 30 kts | 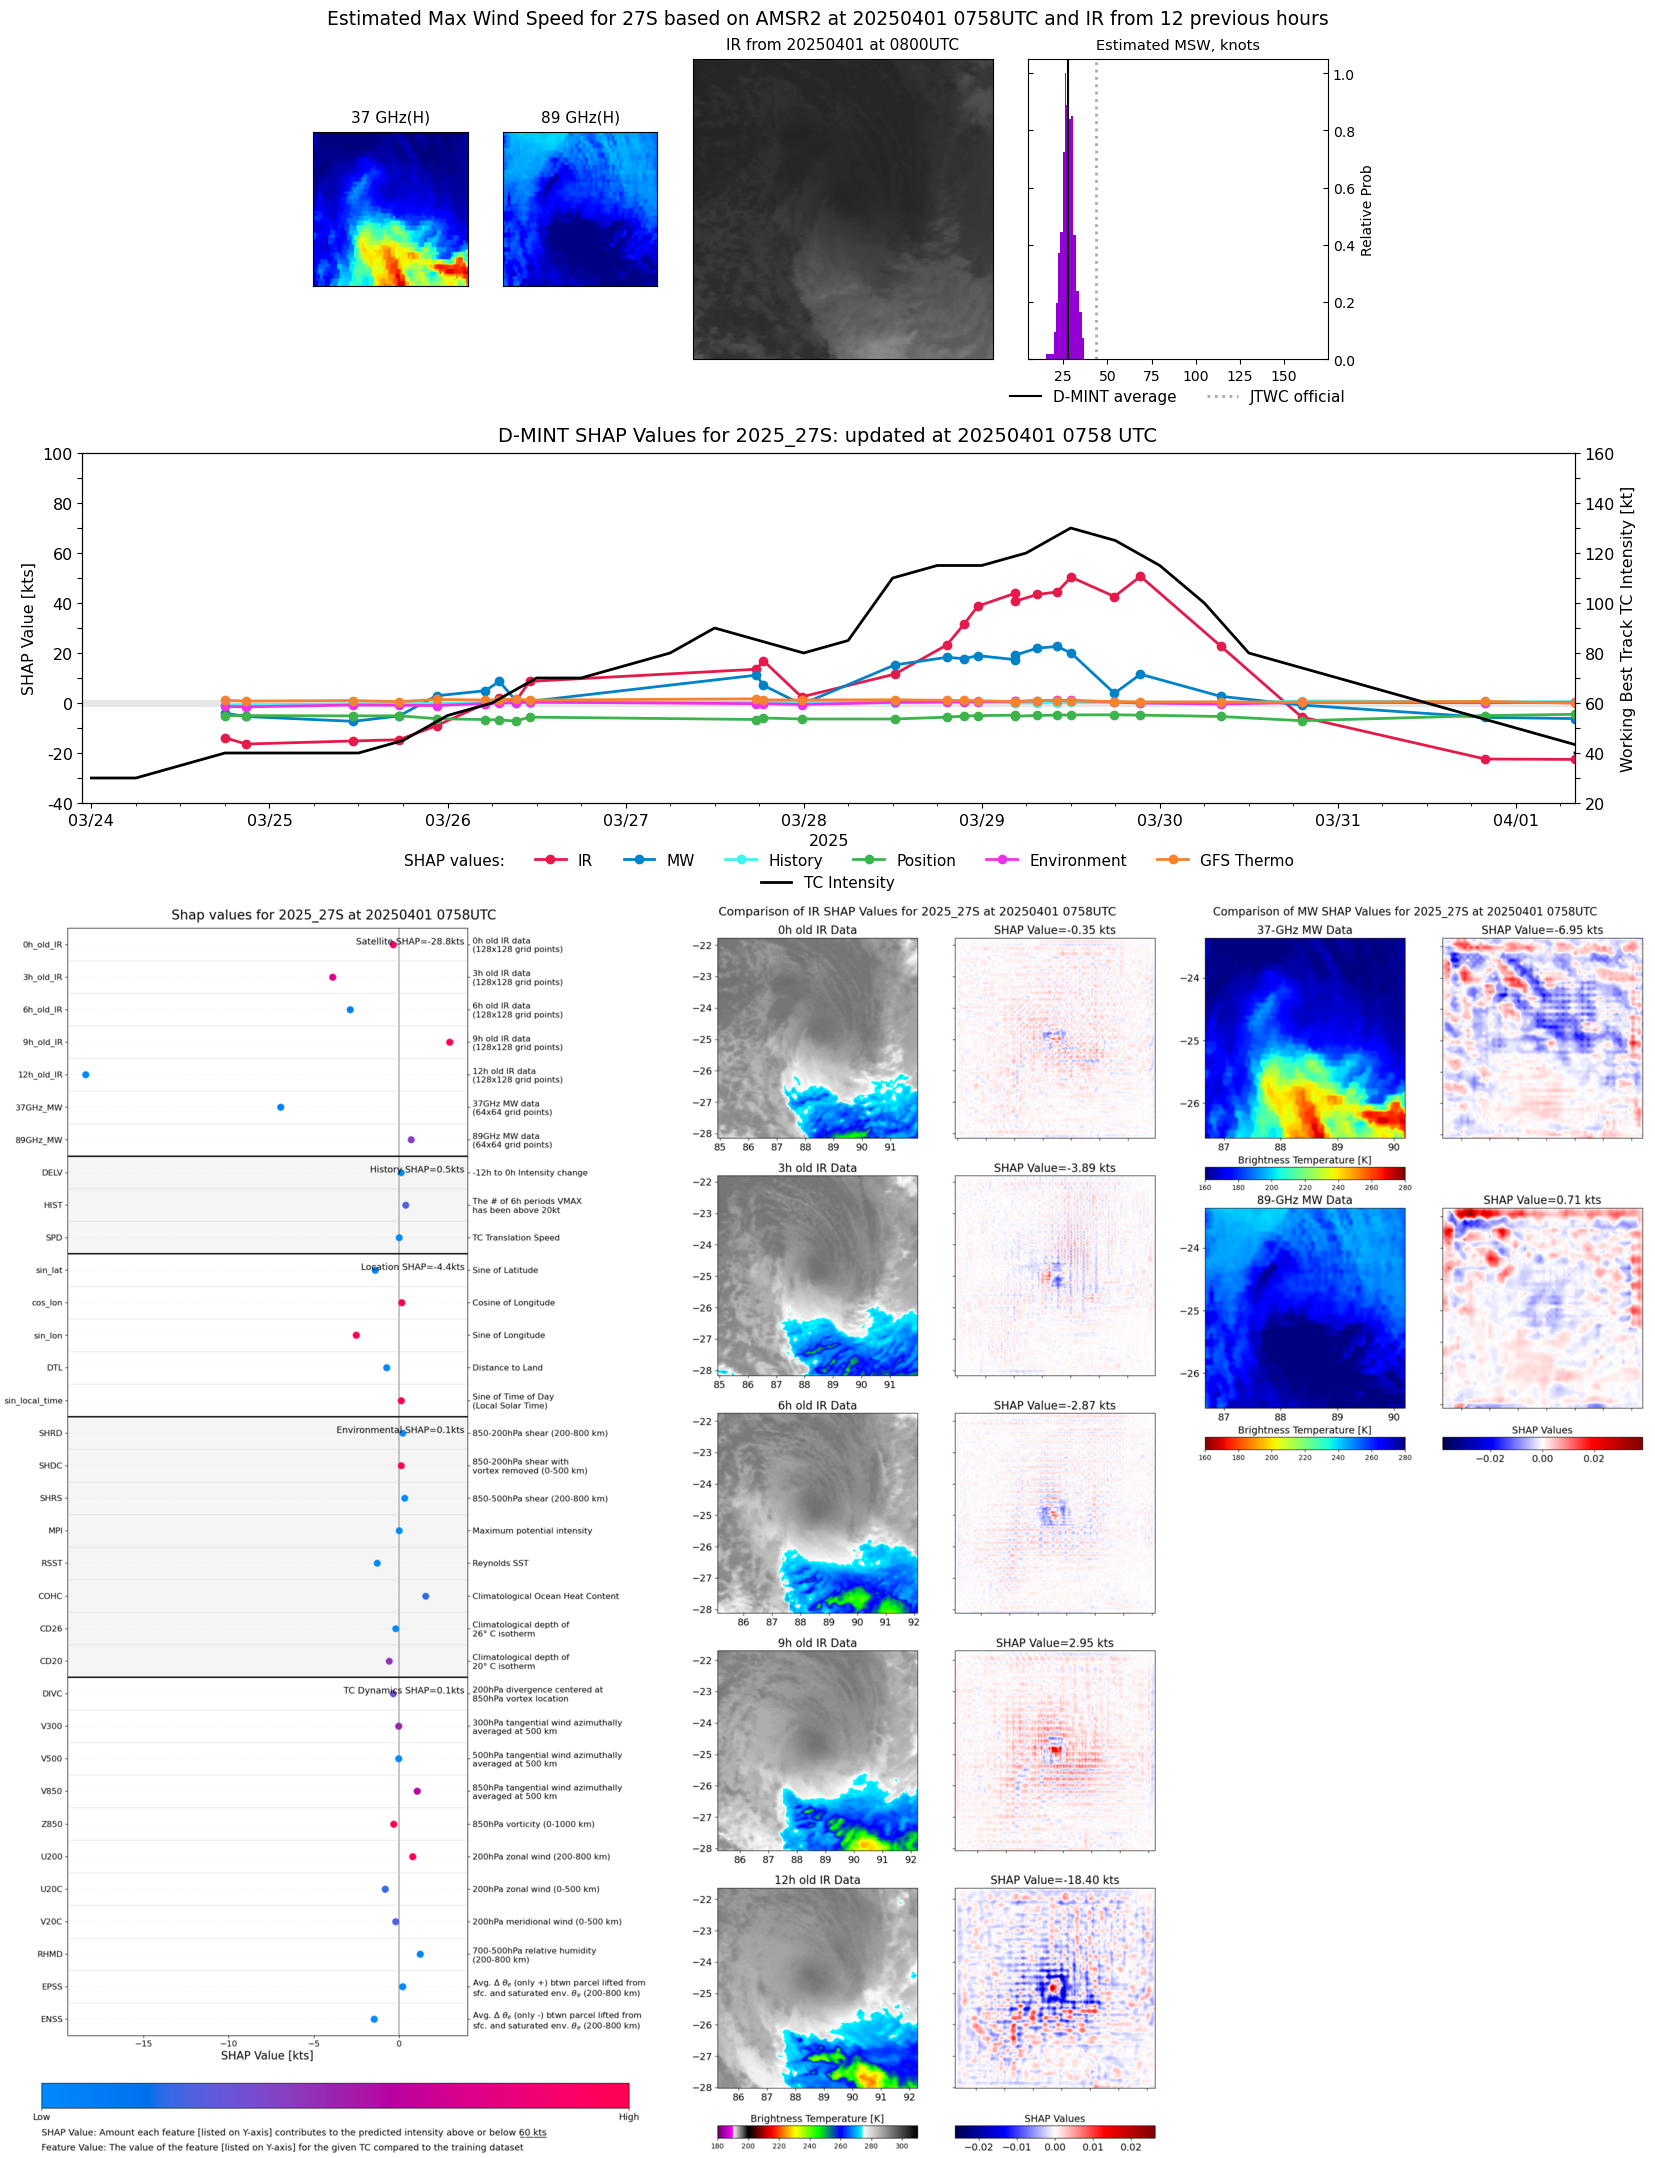 |
| 20250401 | 0353 UTC | GMI | 995 hPa | 32 kts | 28 kts | 35 kts | 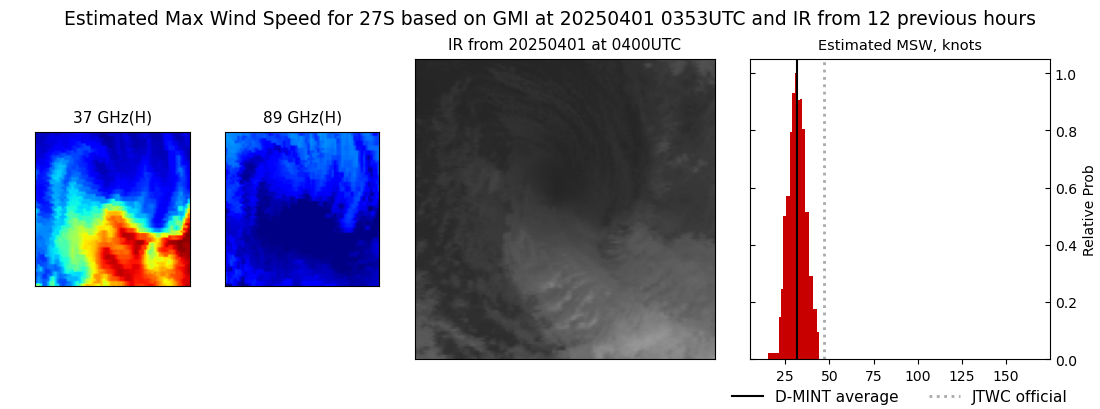 |
| 20250331 | 2351 UTC | SSMISF16 | 996 hPa | 26 kts | 23 kts | 29 kts | 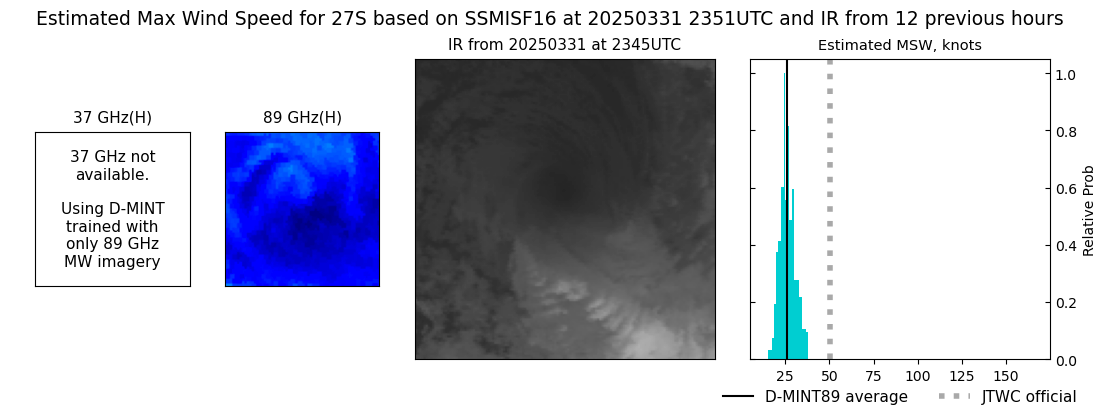 |
| 20250331 | 1951 UTC | AMSR2 | 995 hPa | 28 kts | 26 kts | 31 kts | 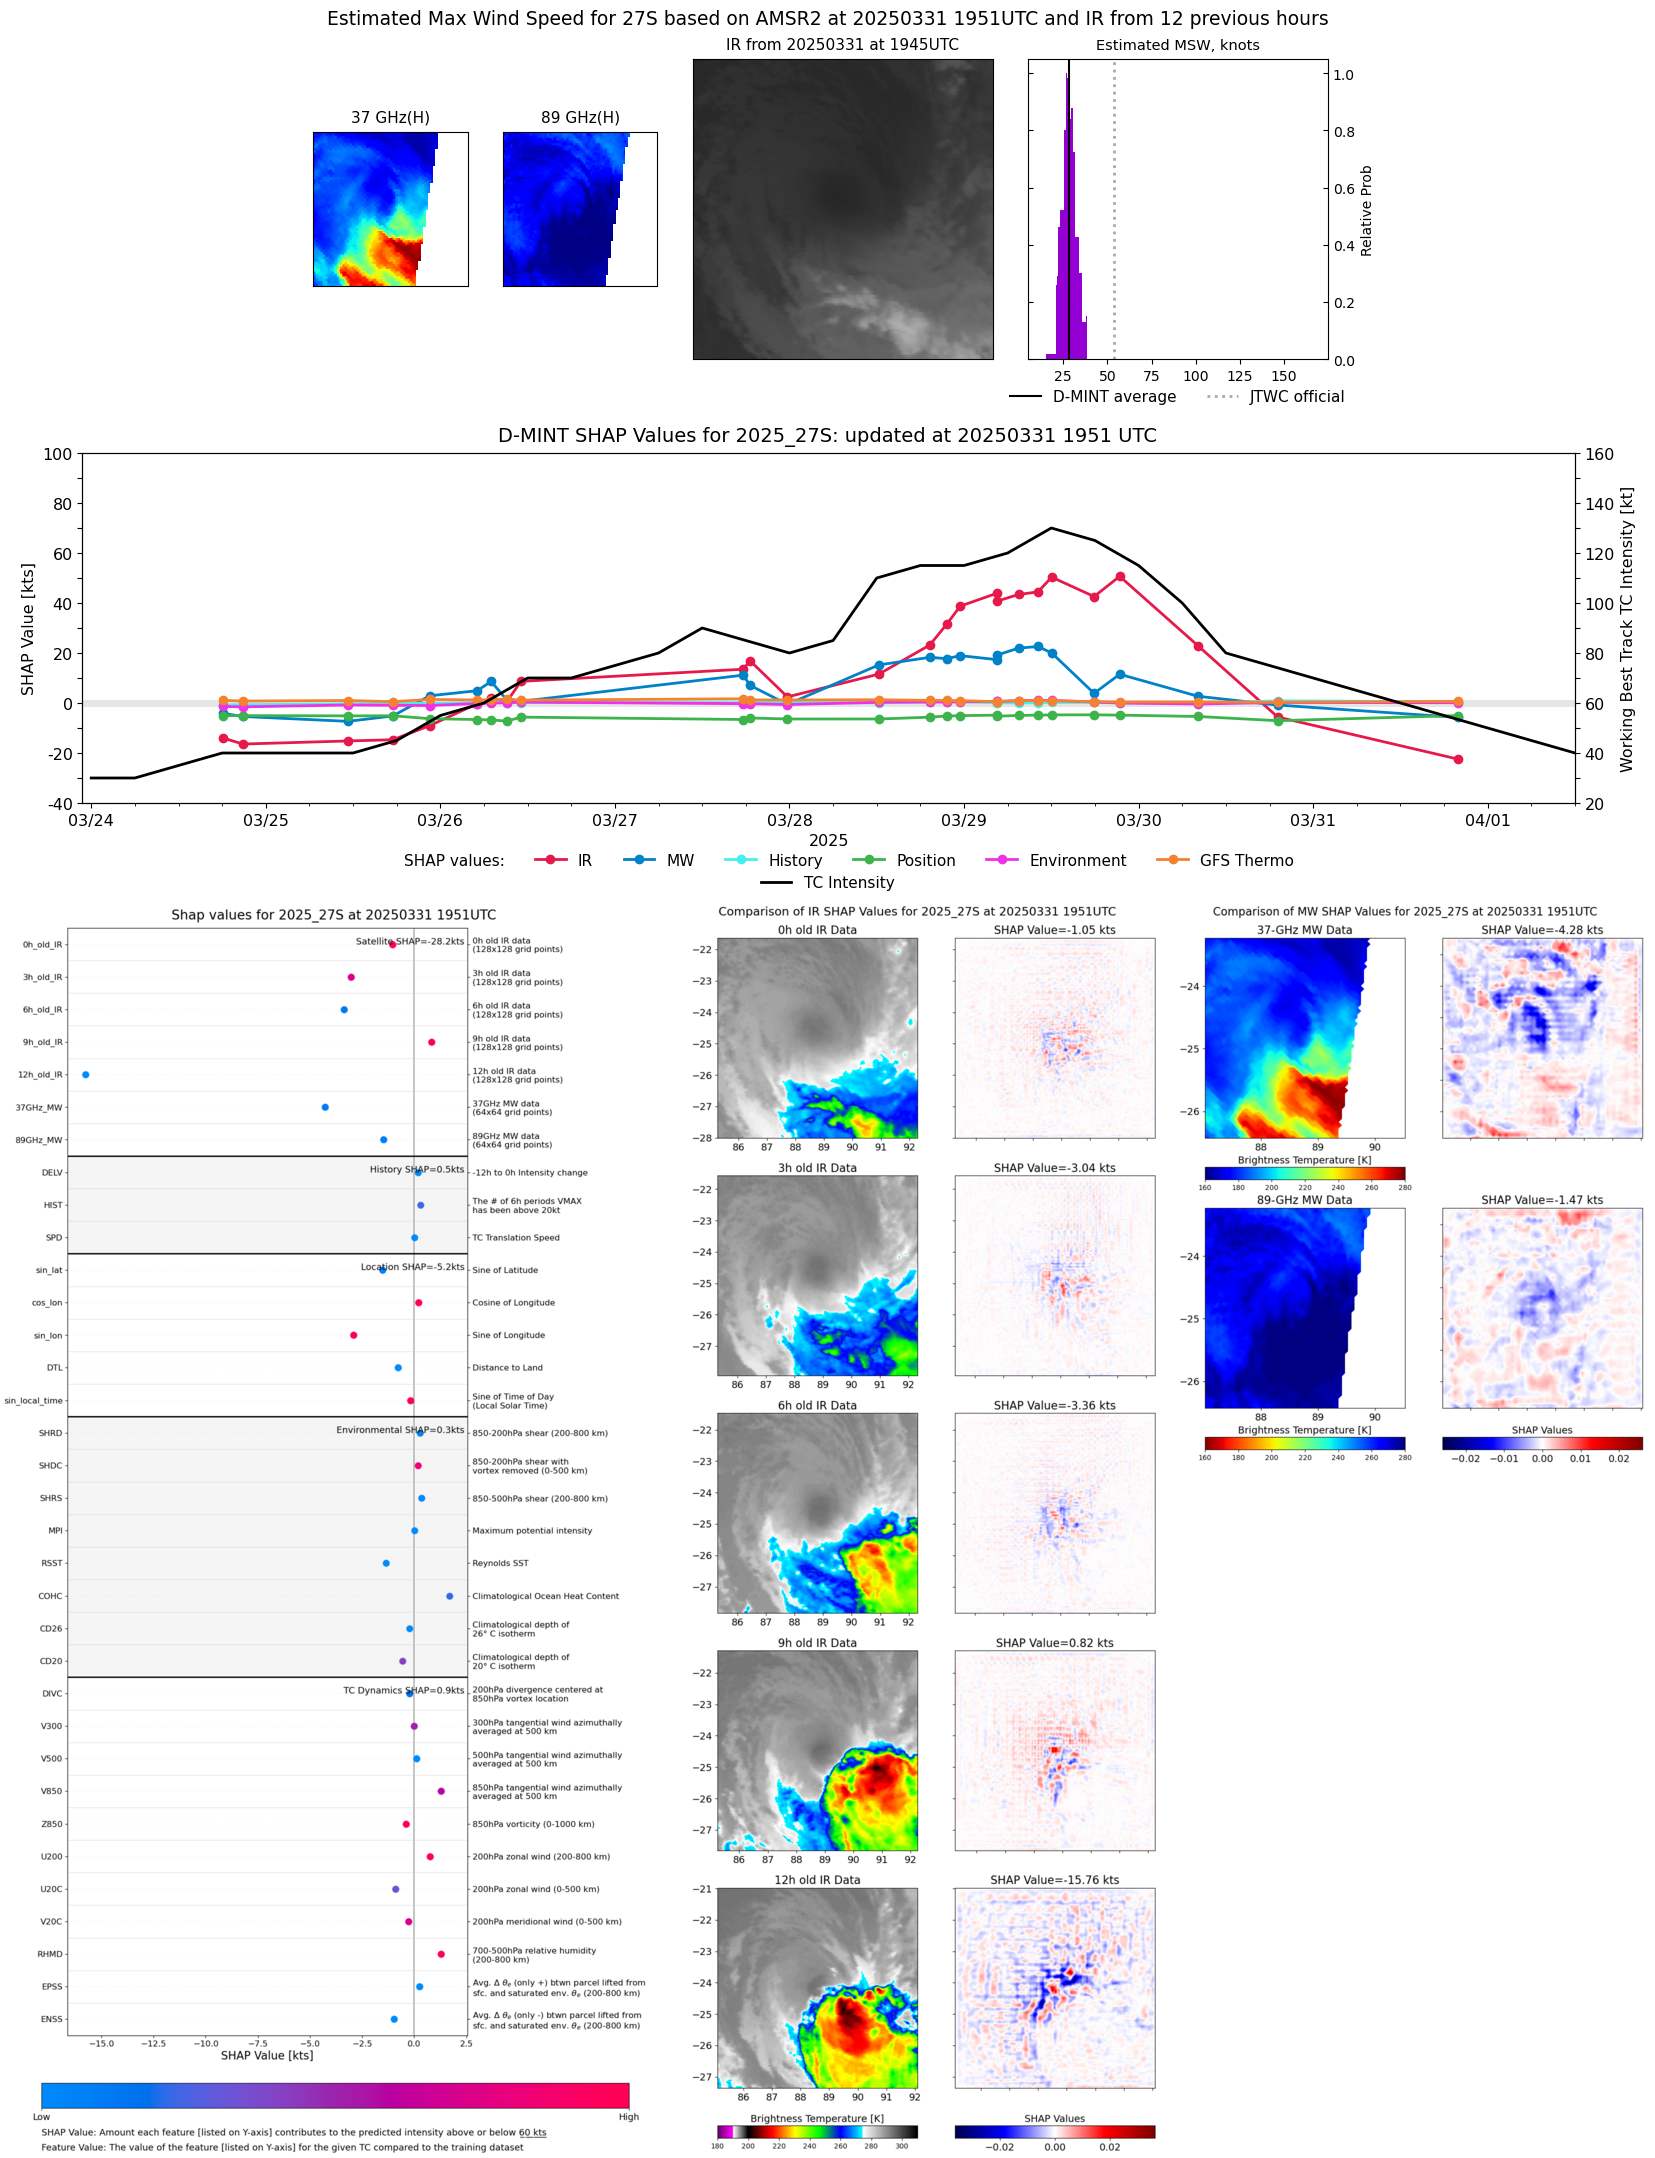 |
| 20250331 | 0004 UTC | SSMISF16 | 990 hPa | 39 kts | 34 kts | 44 kts | 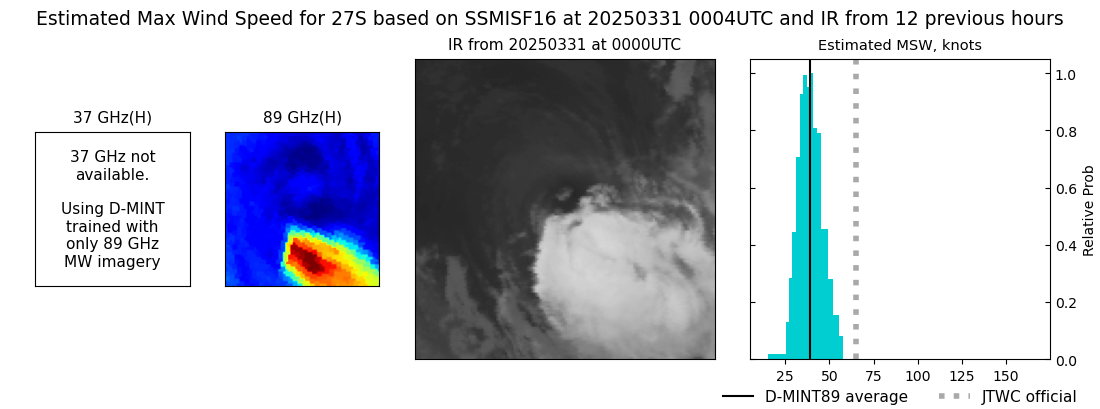 |
| 20250330 | 1907 UTC | AMSR2 | 984 hPa | 48 kts | 43 kts | 53 kts | 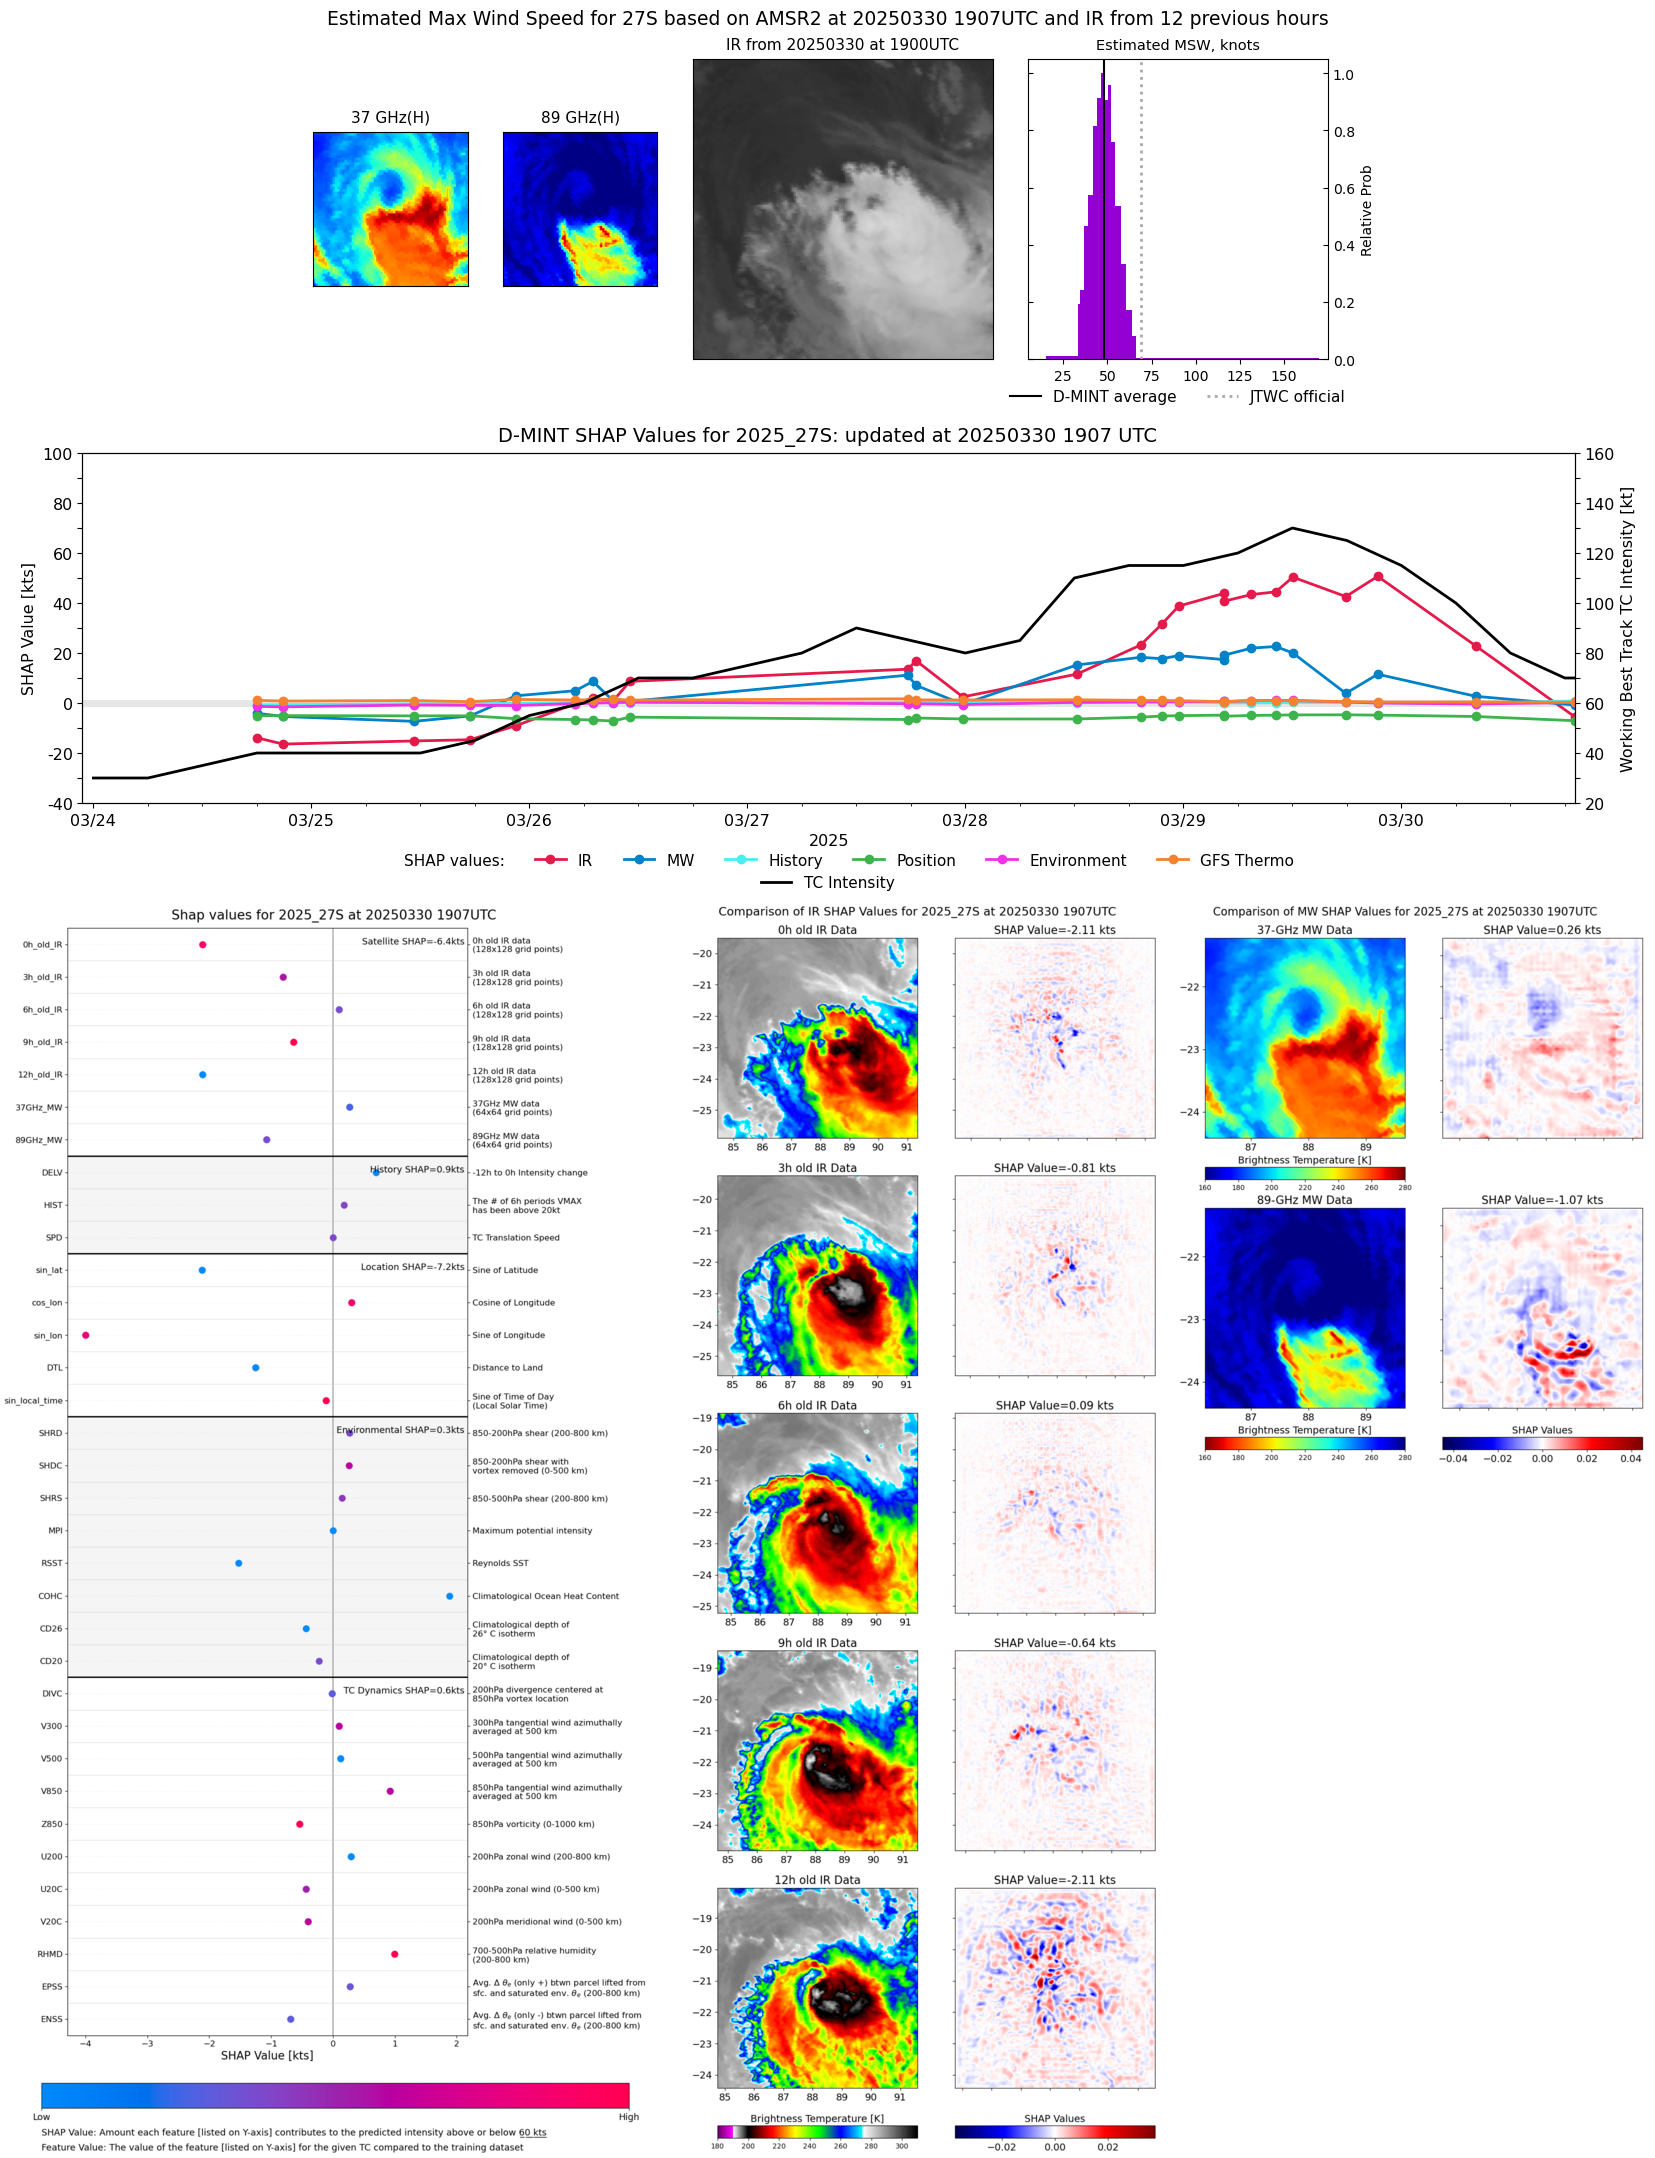 |
| 20250330 | 1616 UTC | TROPICS03 | 987 hPa | 49 kts | 44 kts | 54 kts | 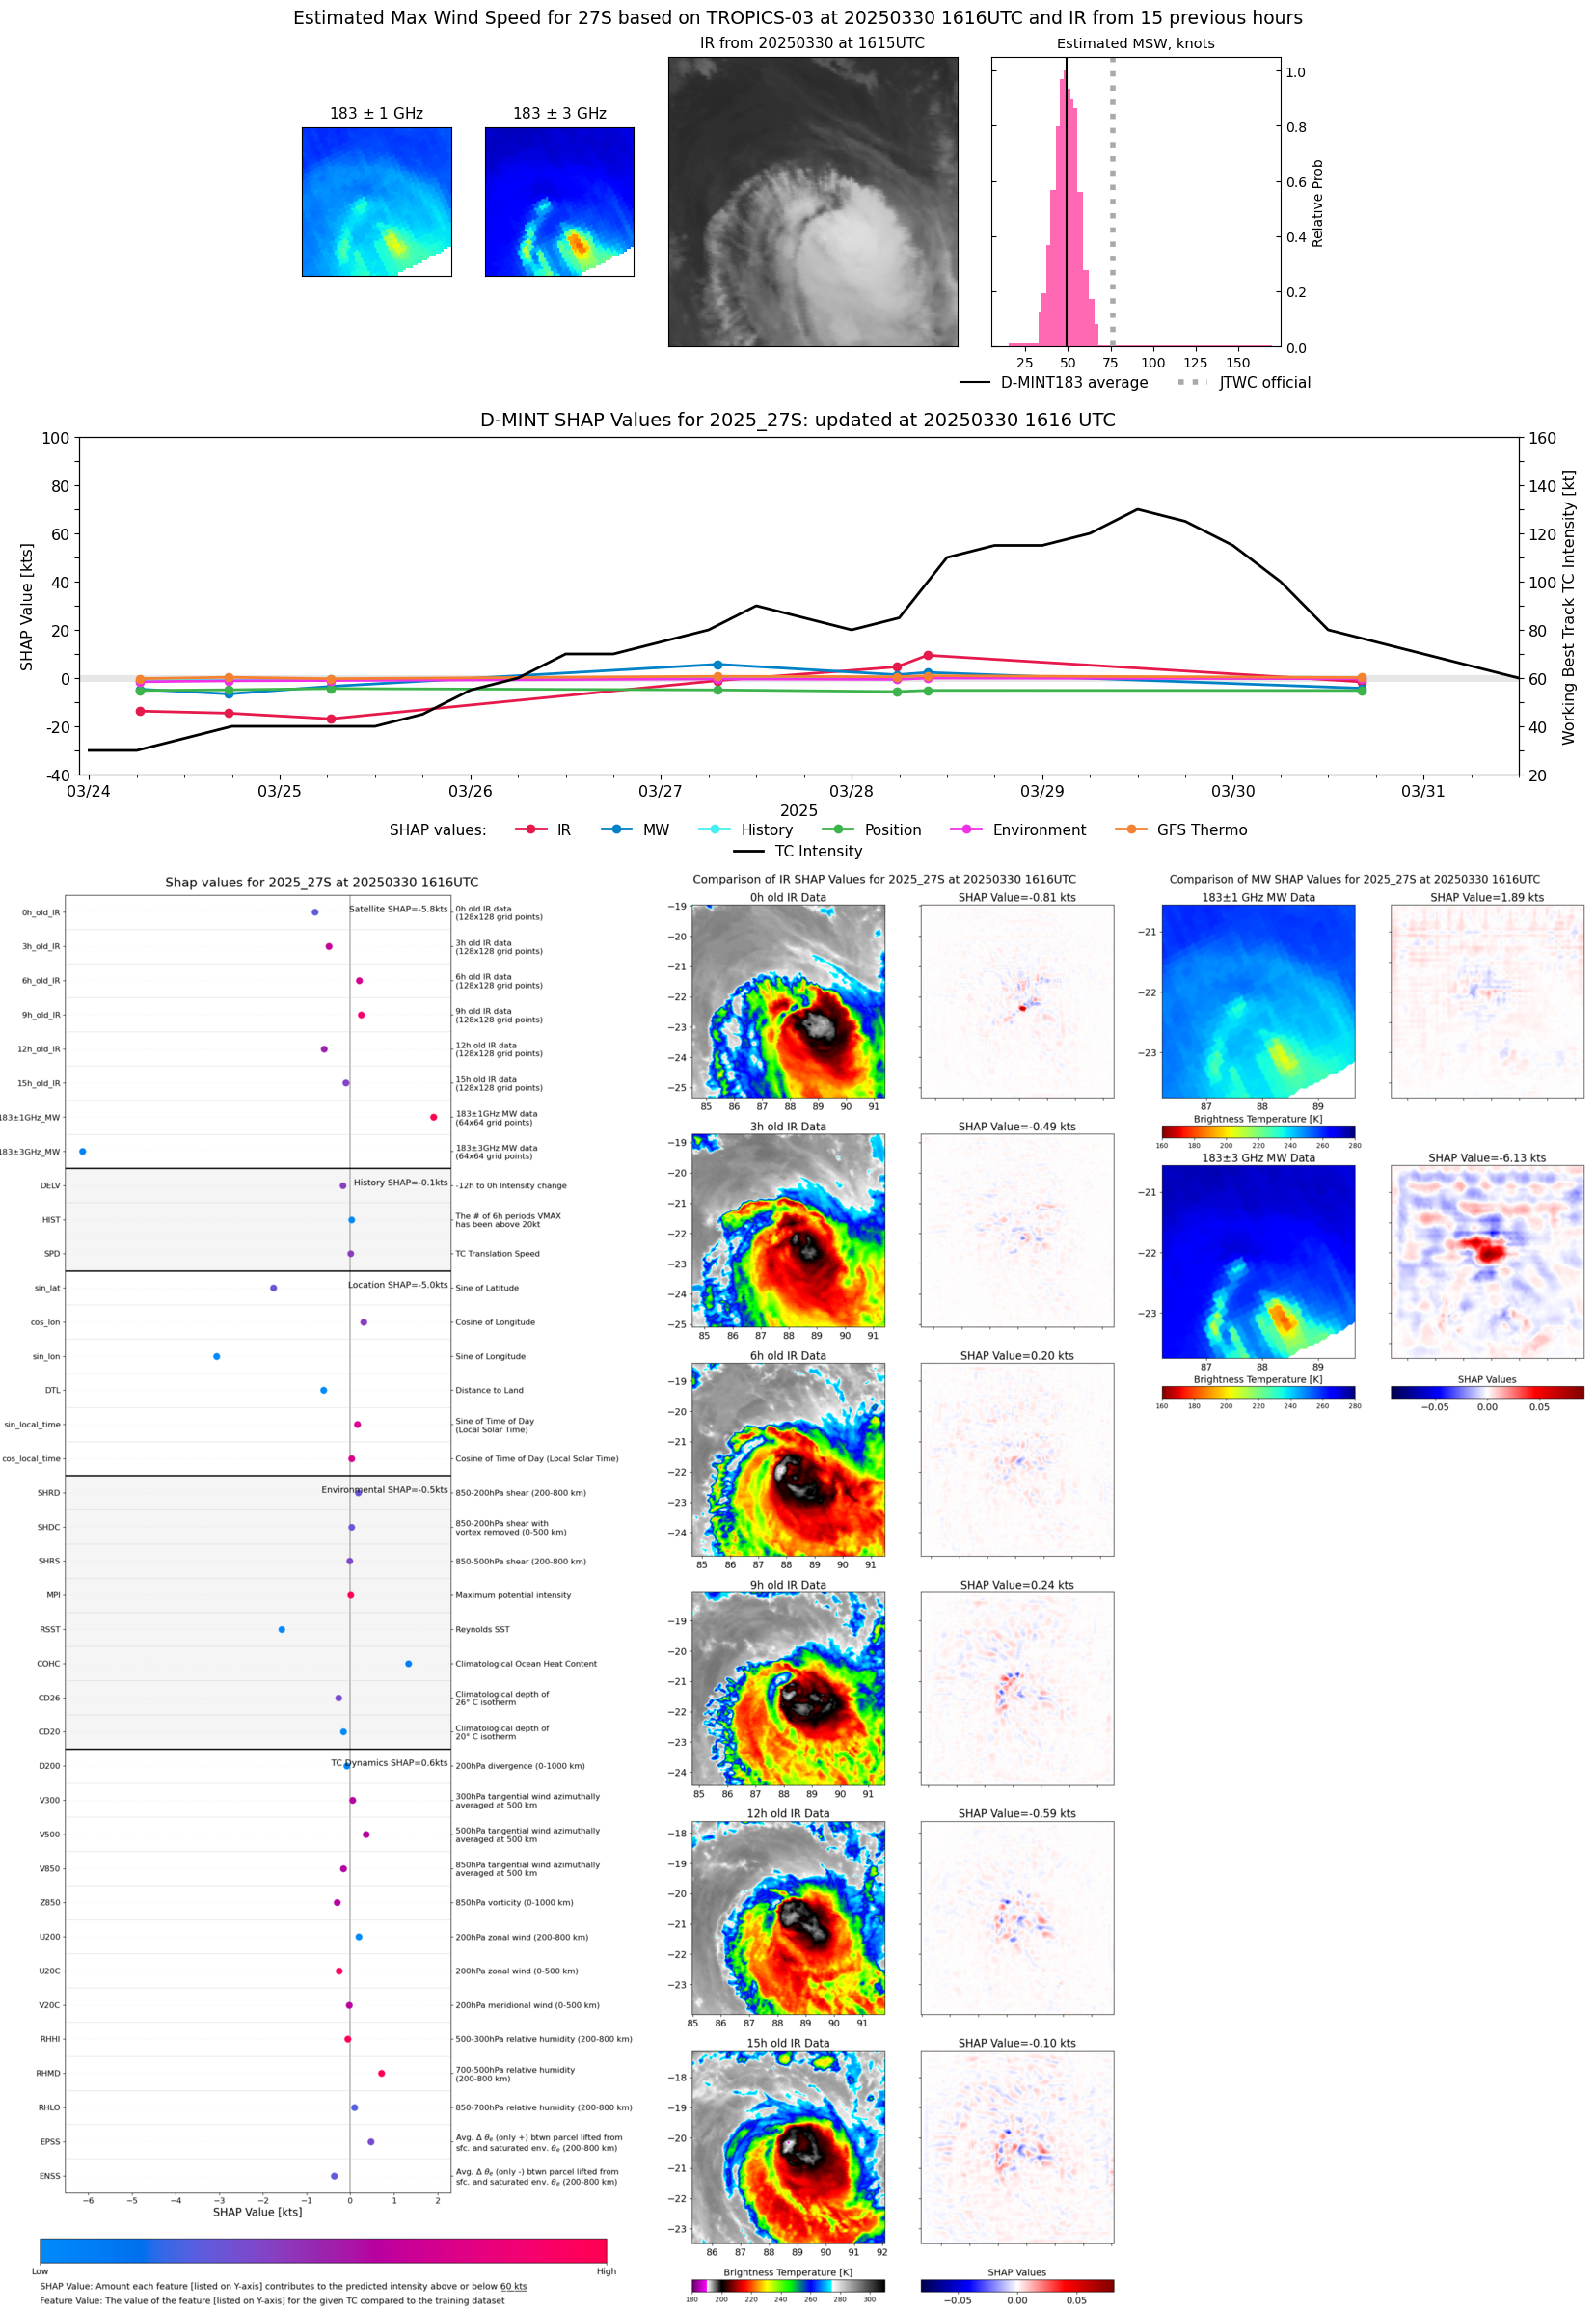 |
| 20250330 | 1249 UTC | SSMISF16 | 976 hPa | 64 kts | 58 kts | 71 kts | 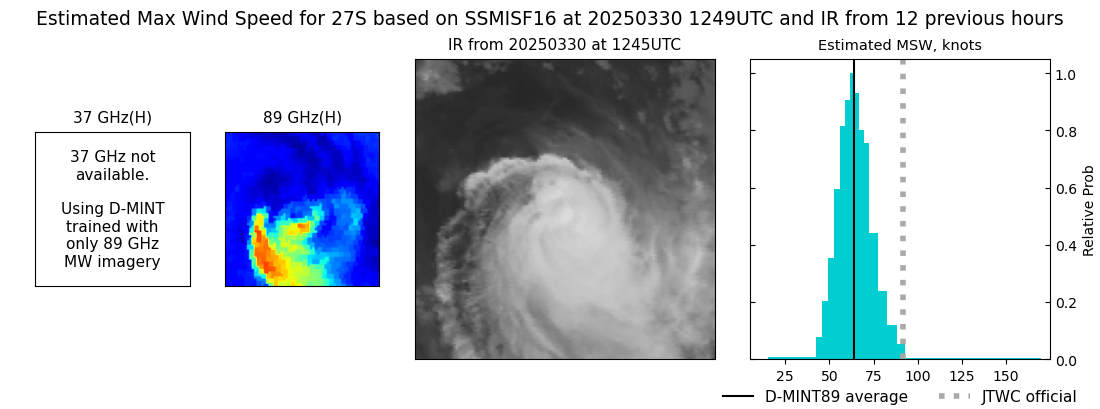 |
| 20250330 | 0812 UTC | AMSR2 | 969 hPa | 80 kts | 74 kts | 86 kts | 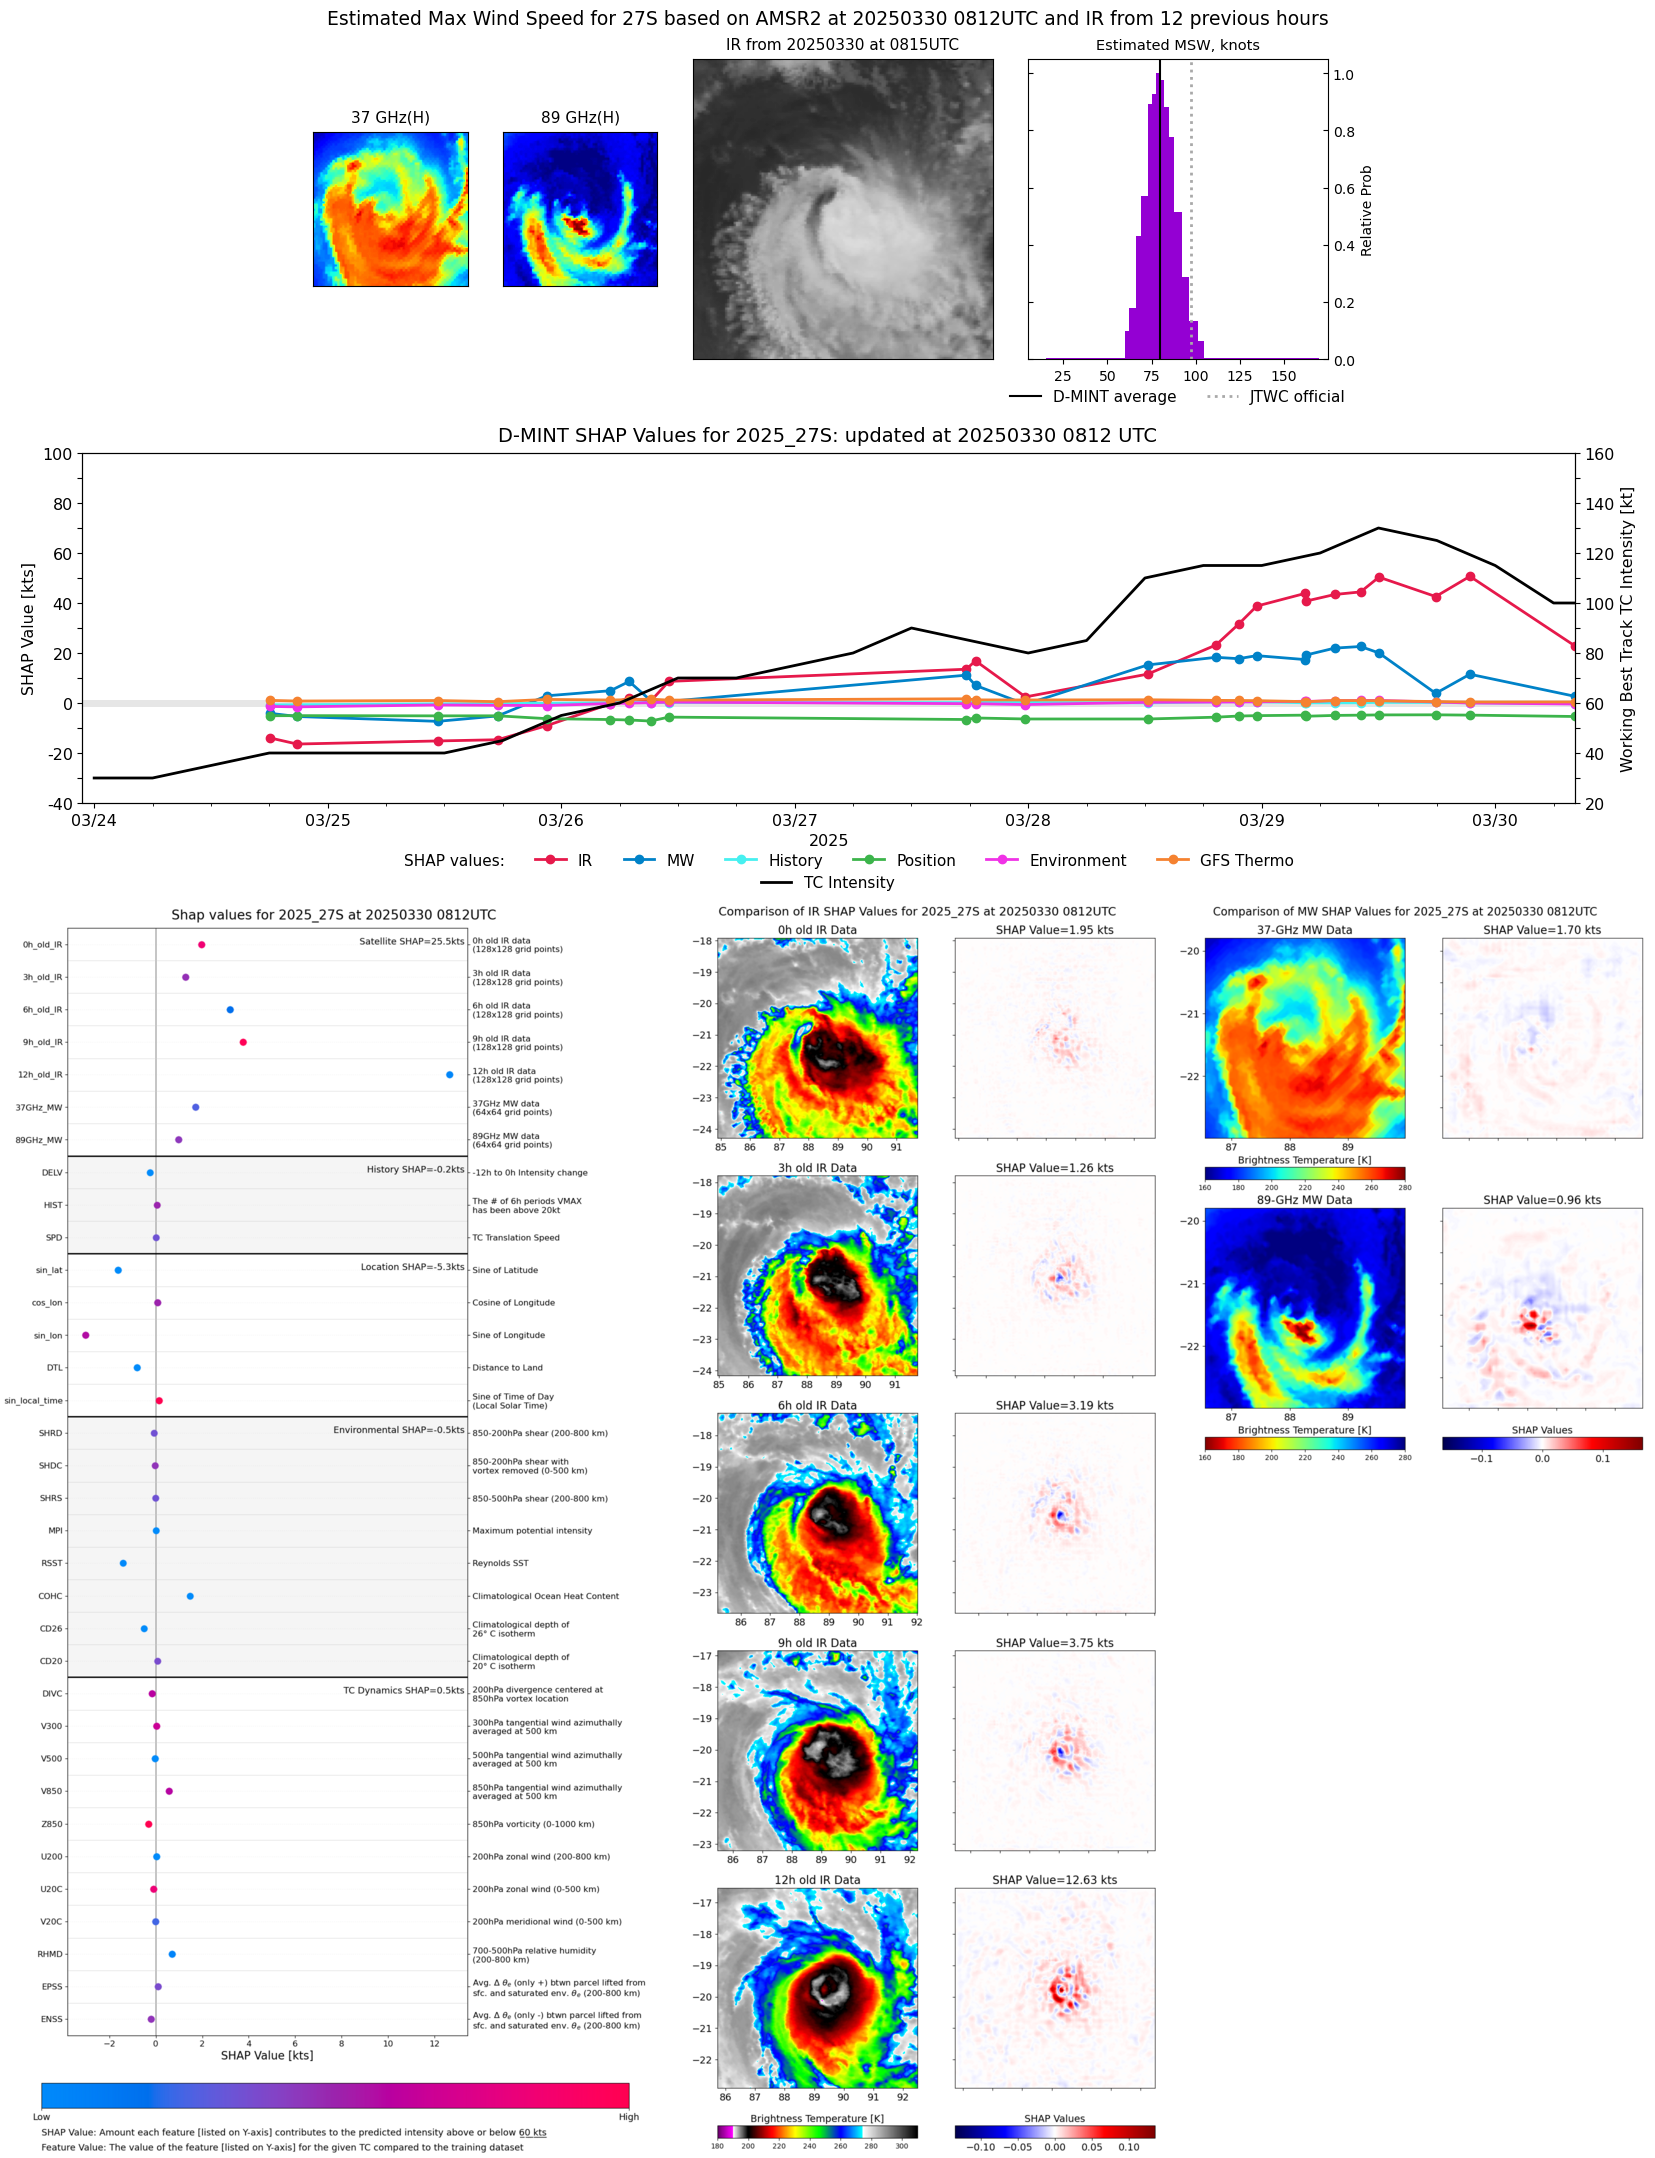 |
| 20250330 | 0017 UTC | SSMISF16 | 942 hPa | 114 kts | 107 kts | 120 kts | 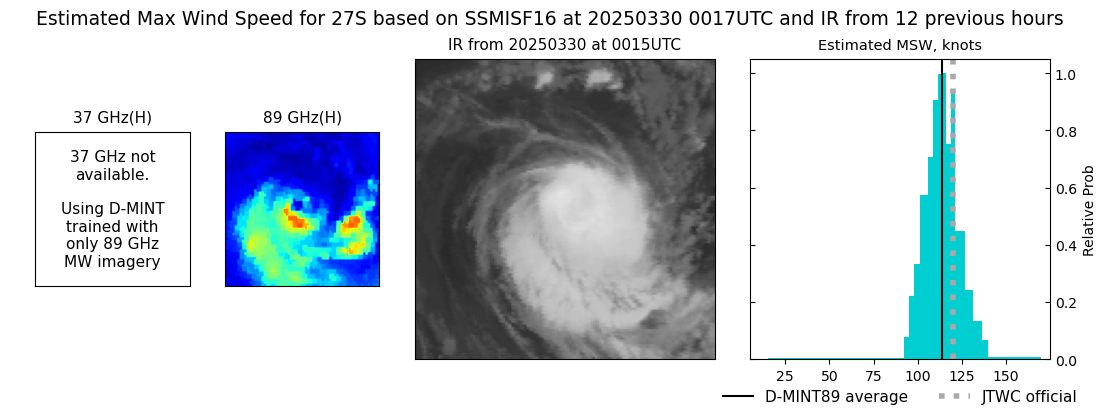 |
| 20250329 | 2129 UTC | TROPICS05 | 945 hPa | 118 kts | 113 kts | 124 kts | 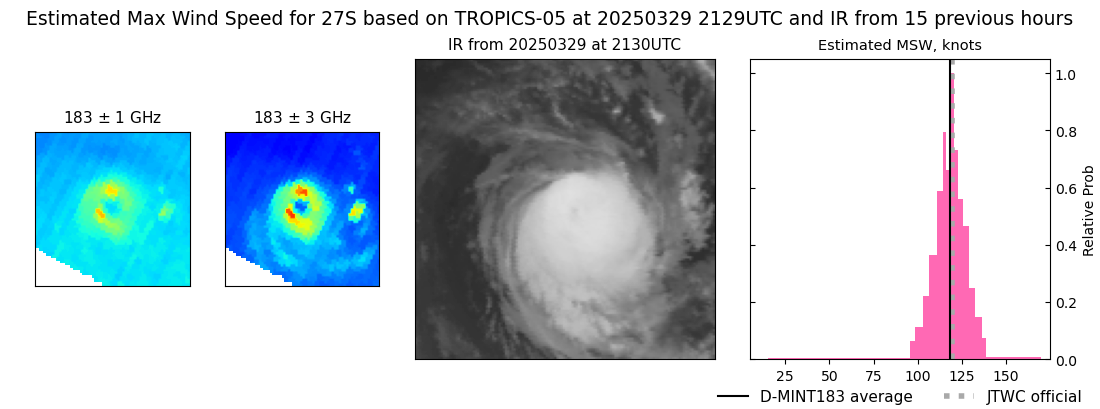 |
| 20250329 | 2124 UTC | SSMISF18 | 931 hPa | 118 kts | 111 kts | 123 kts | 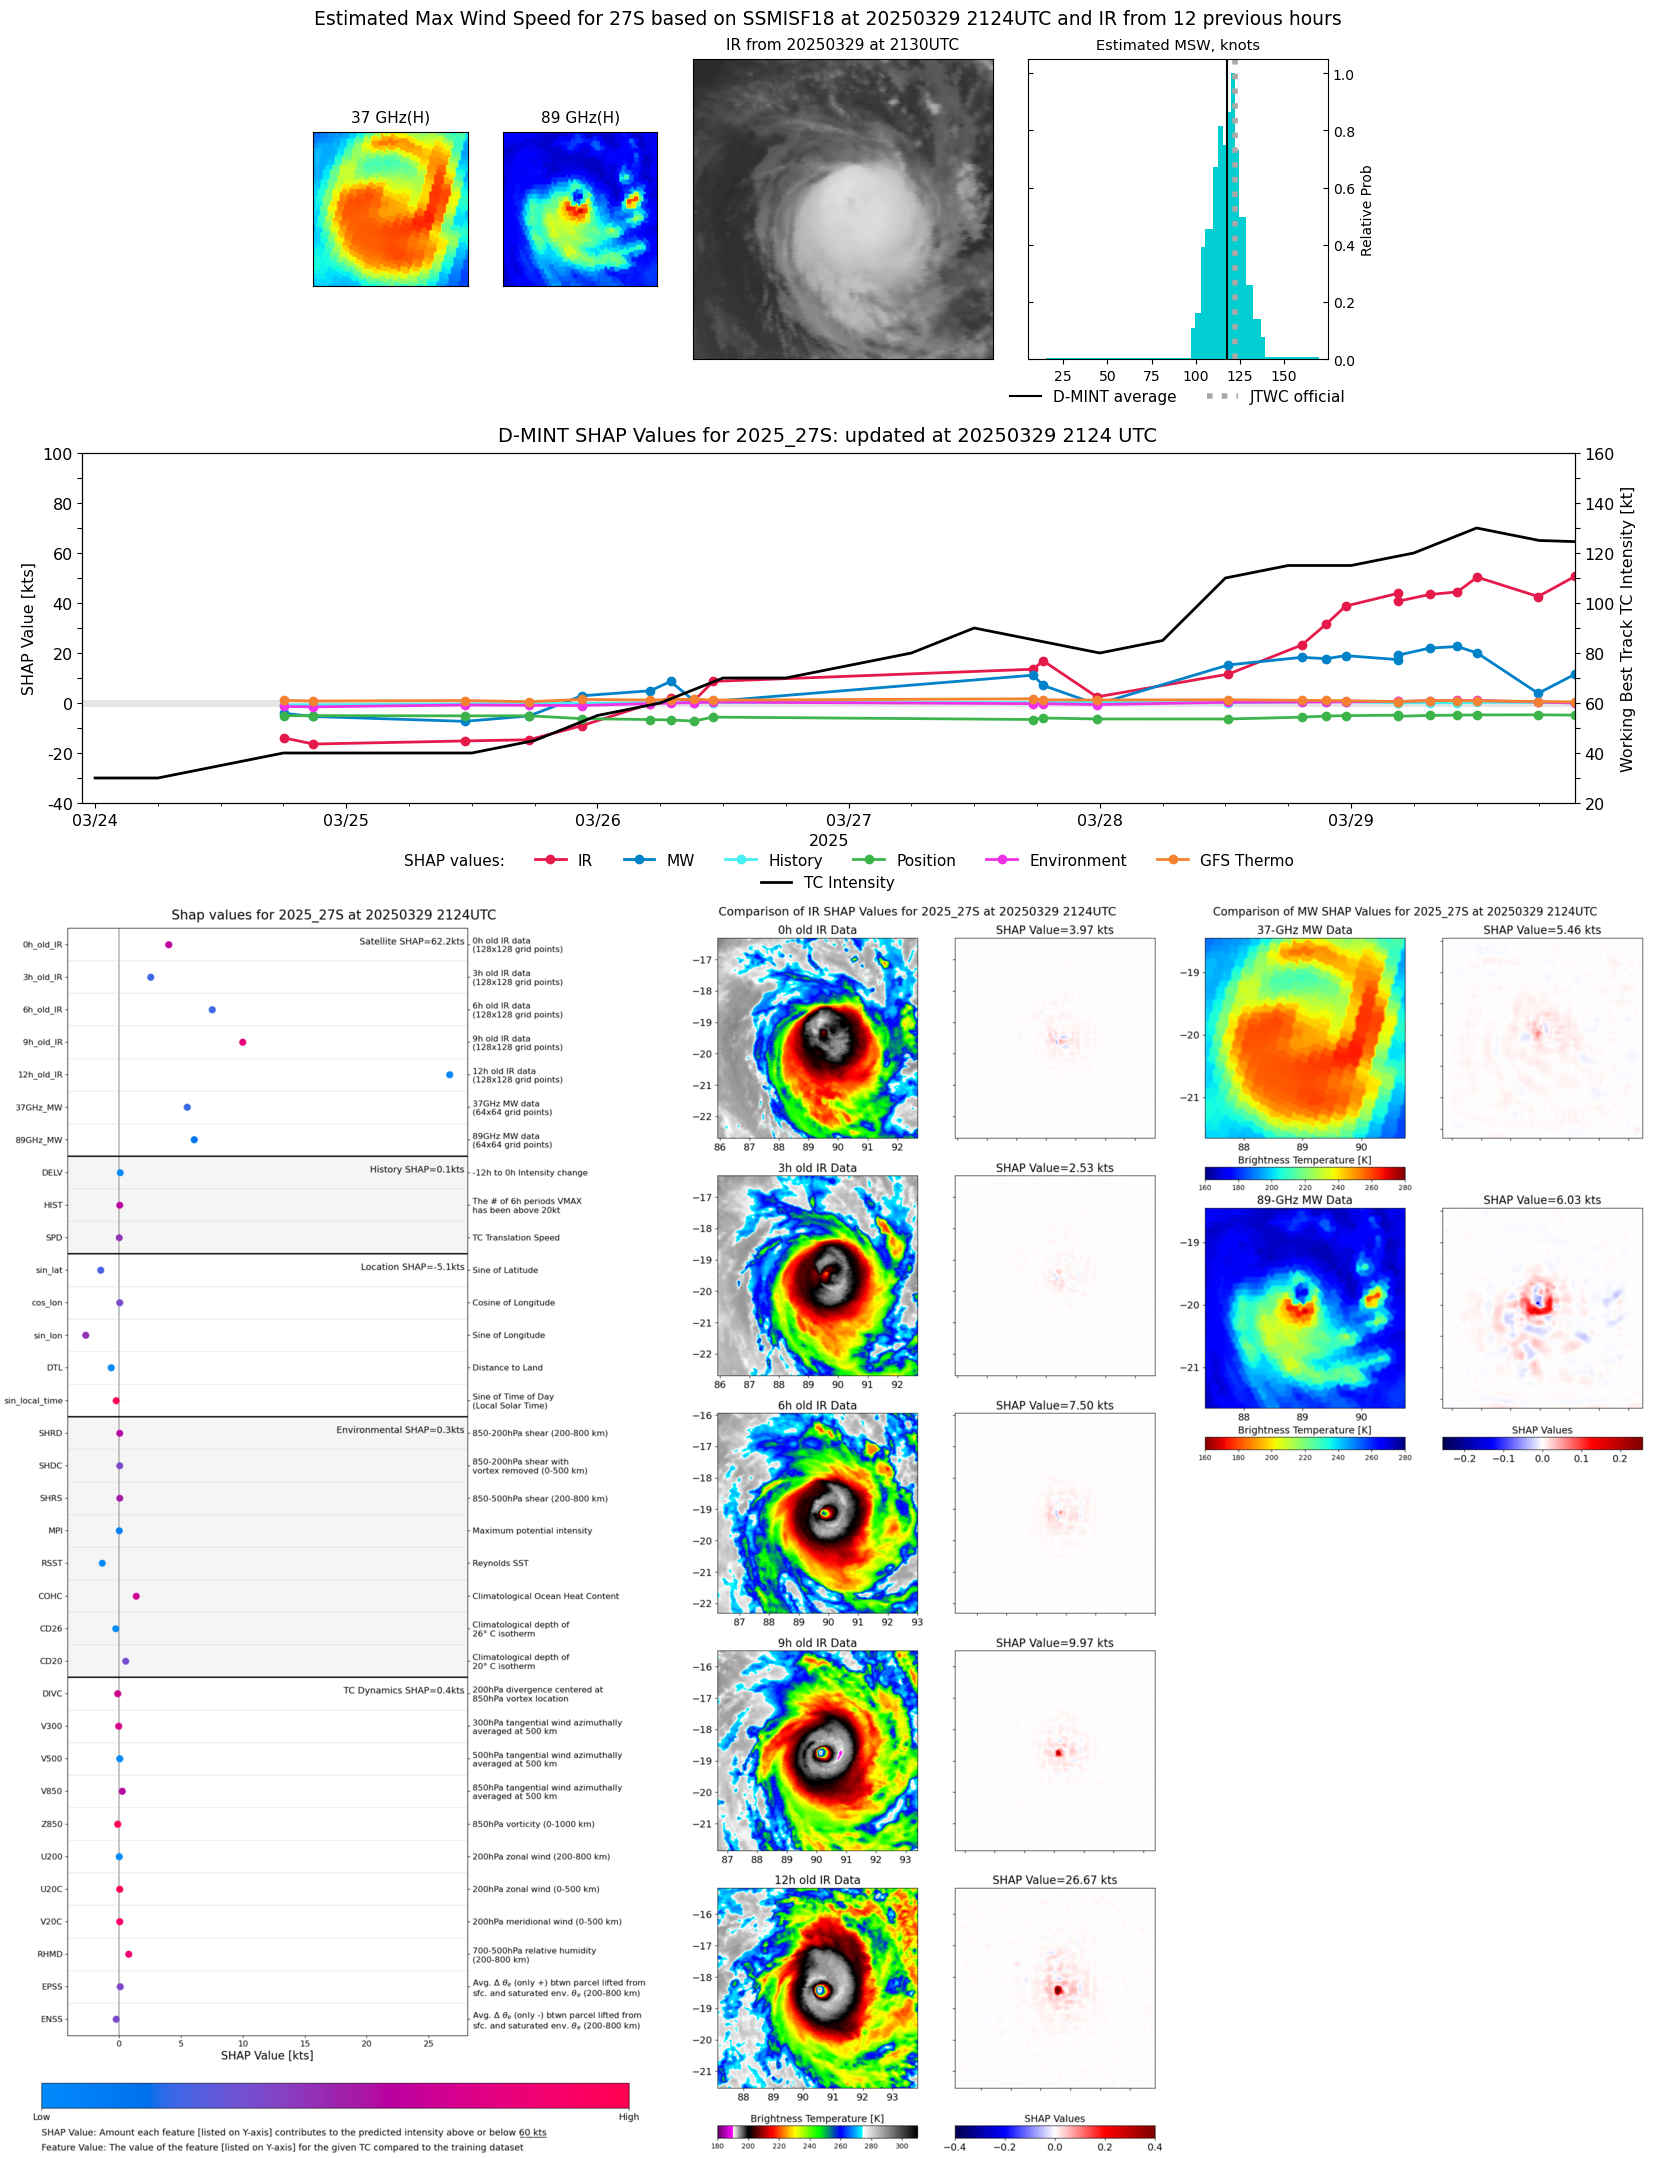 |
| 20250329 | 1702 UTC | TROPICS03 | 939 hPa | 121 kts | 115 kts | 127 kts | 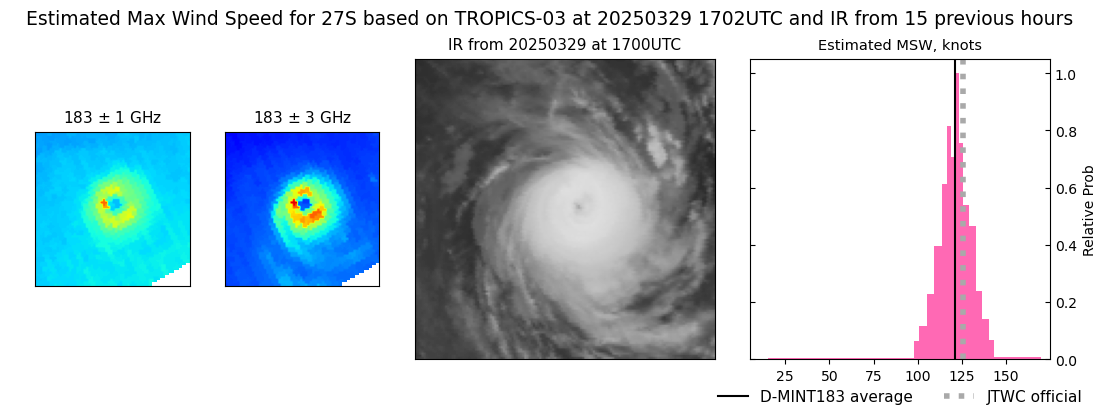 |
| 20250329 | 1304 UTC | SSMISF16 | 932 hPa | 127 kts | 120 kts | 133 kts | 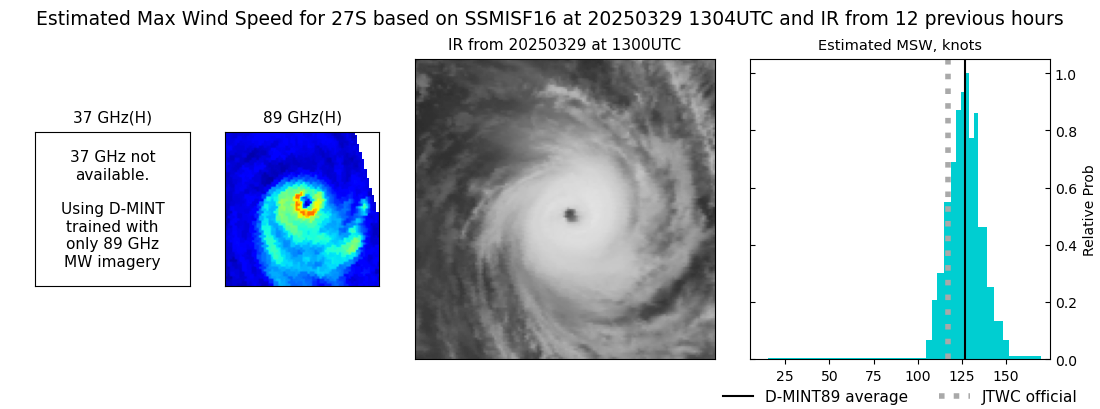 |
| 20250329 | 1203 UTC | SSMISF17 | 925 hPa | 128 kts | 120 kts | 134 kts | 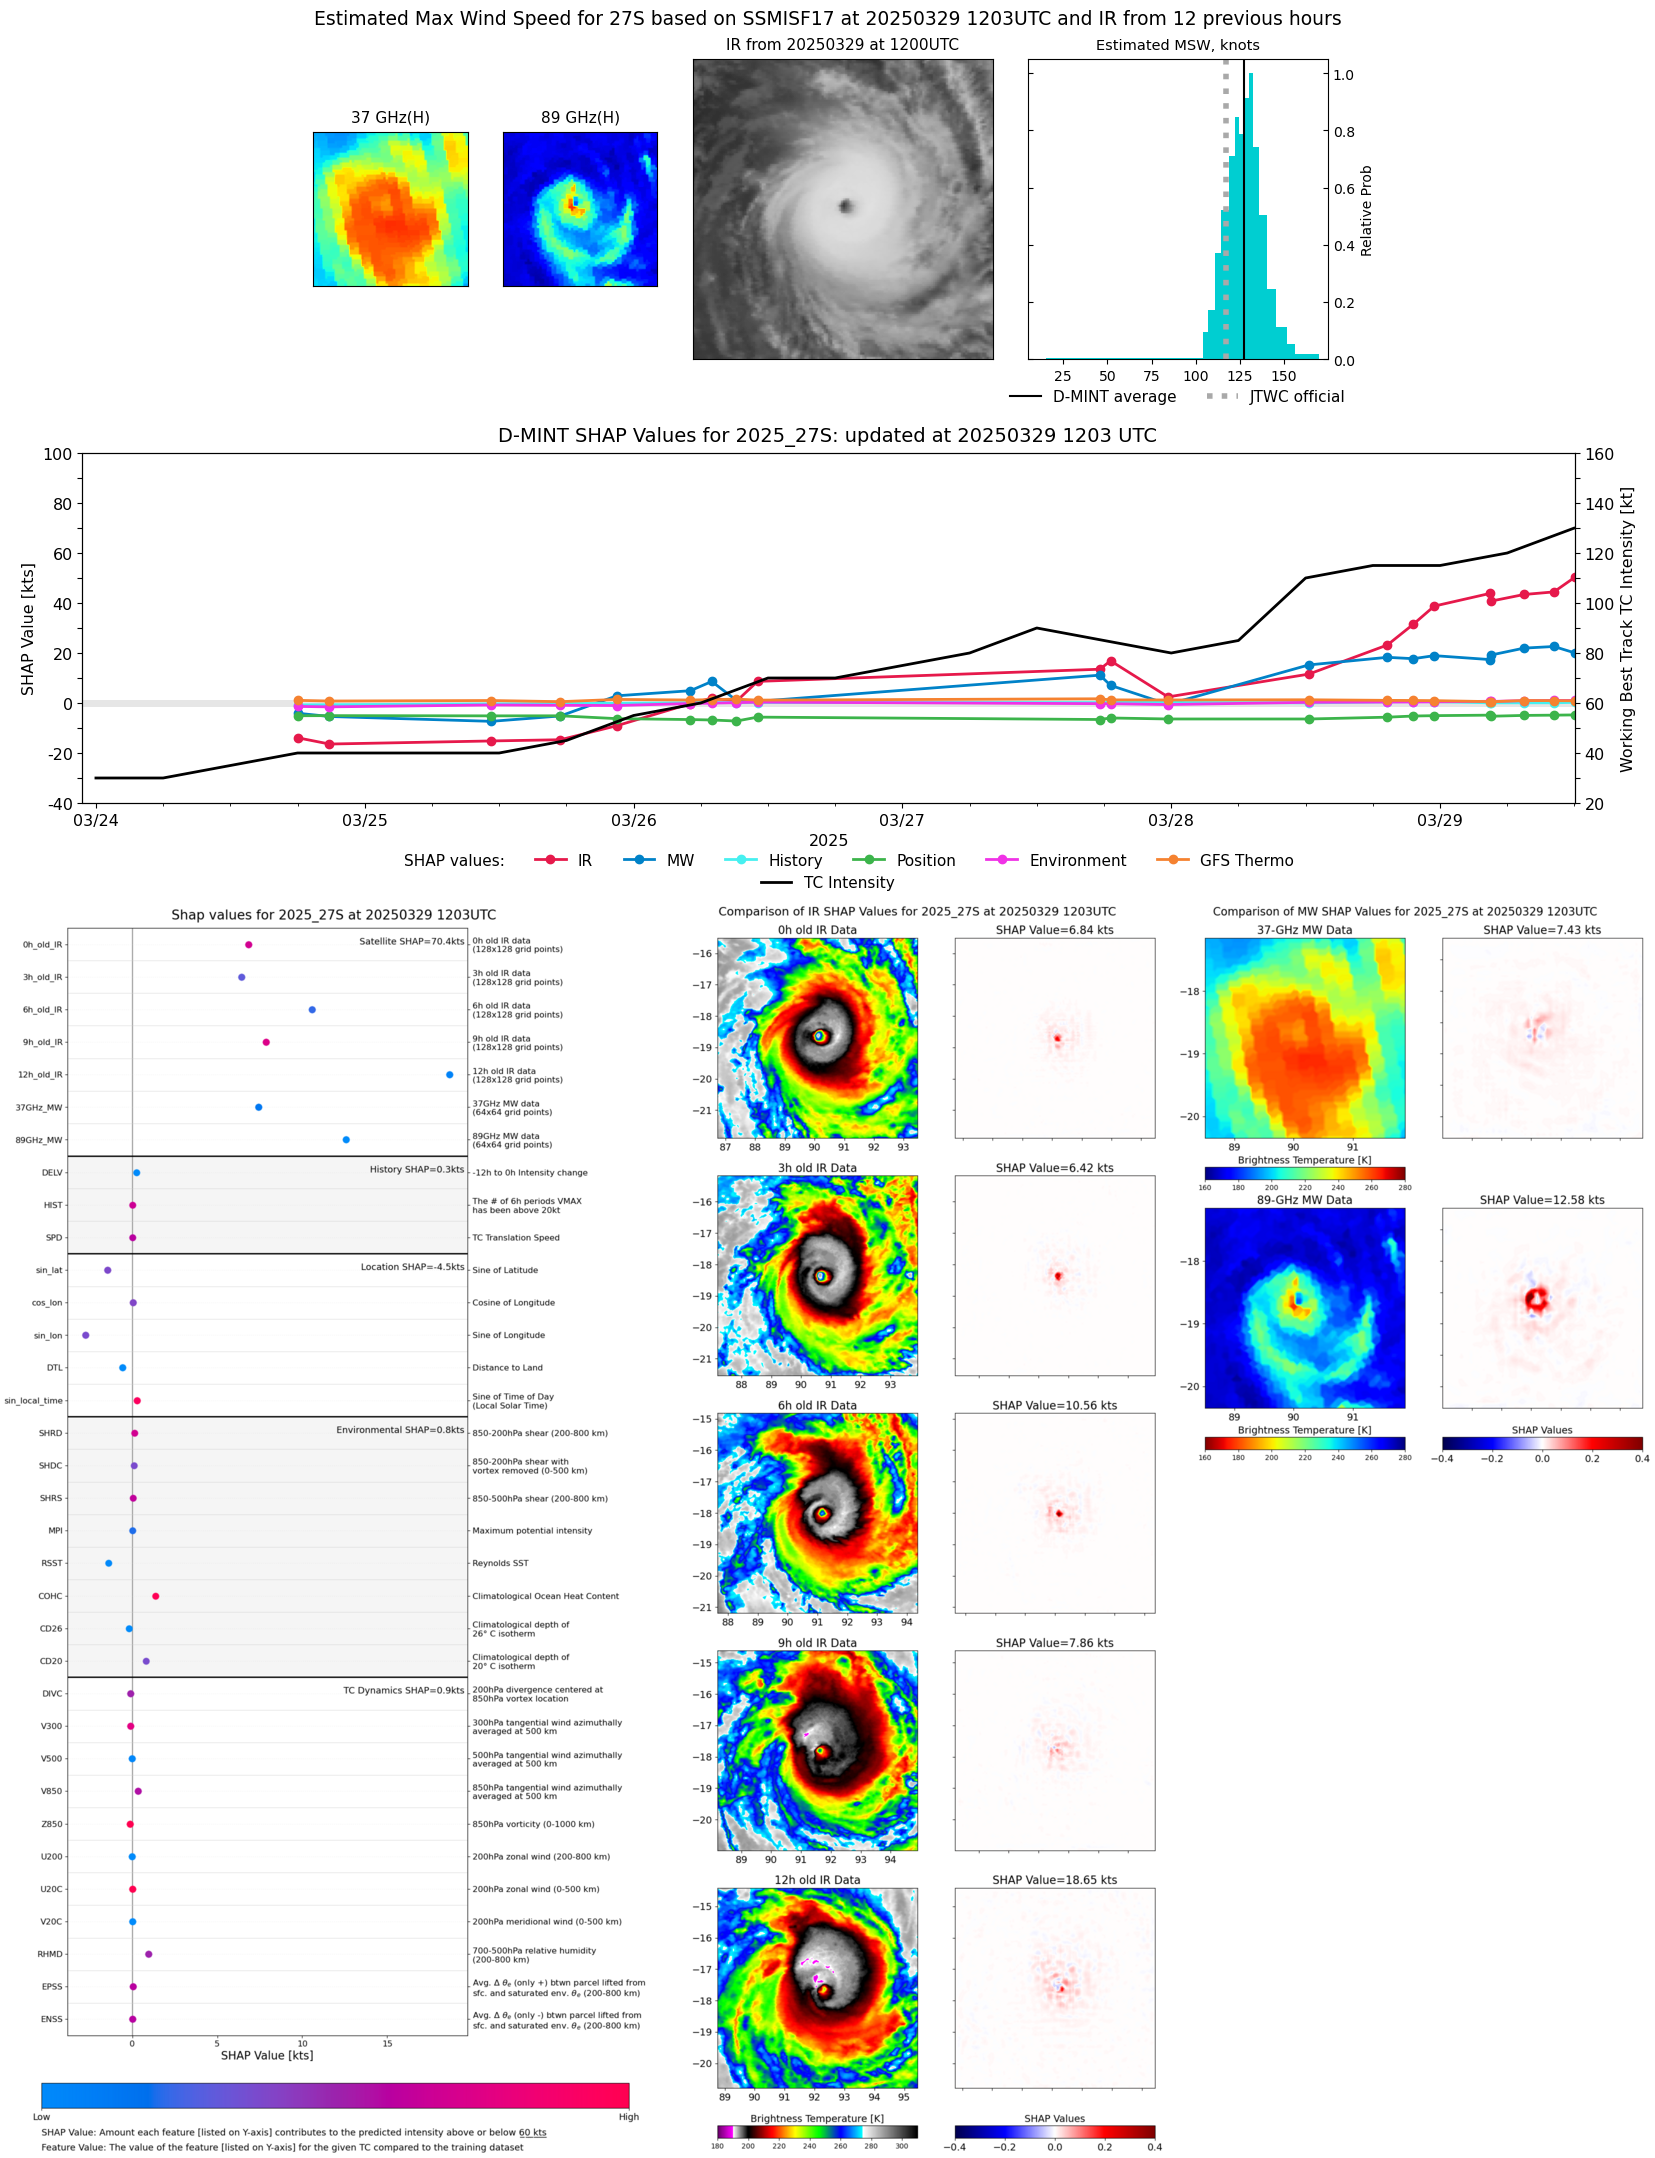 |
| 20250329 | 1010 UTC | SSMISF18 | 933 hPa | 124 kts | 117 kts | 131 kts | 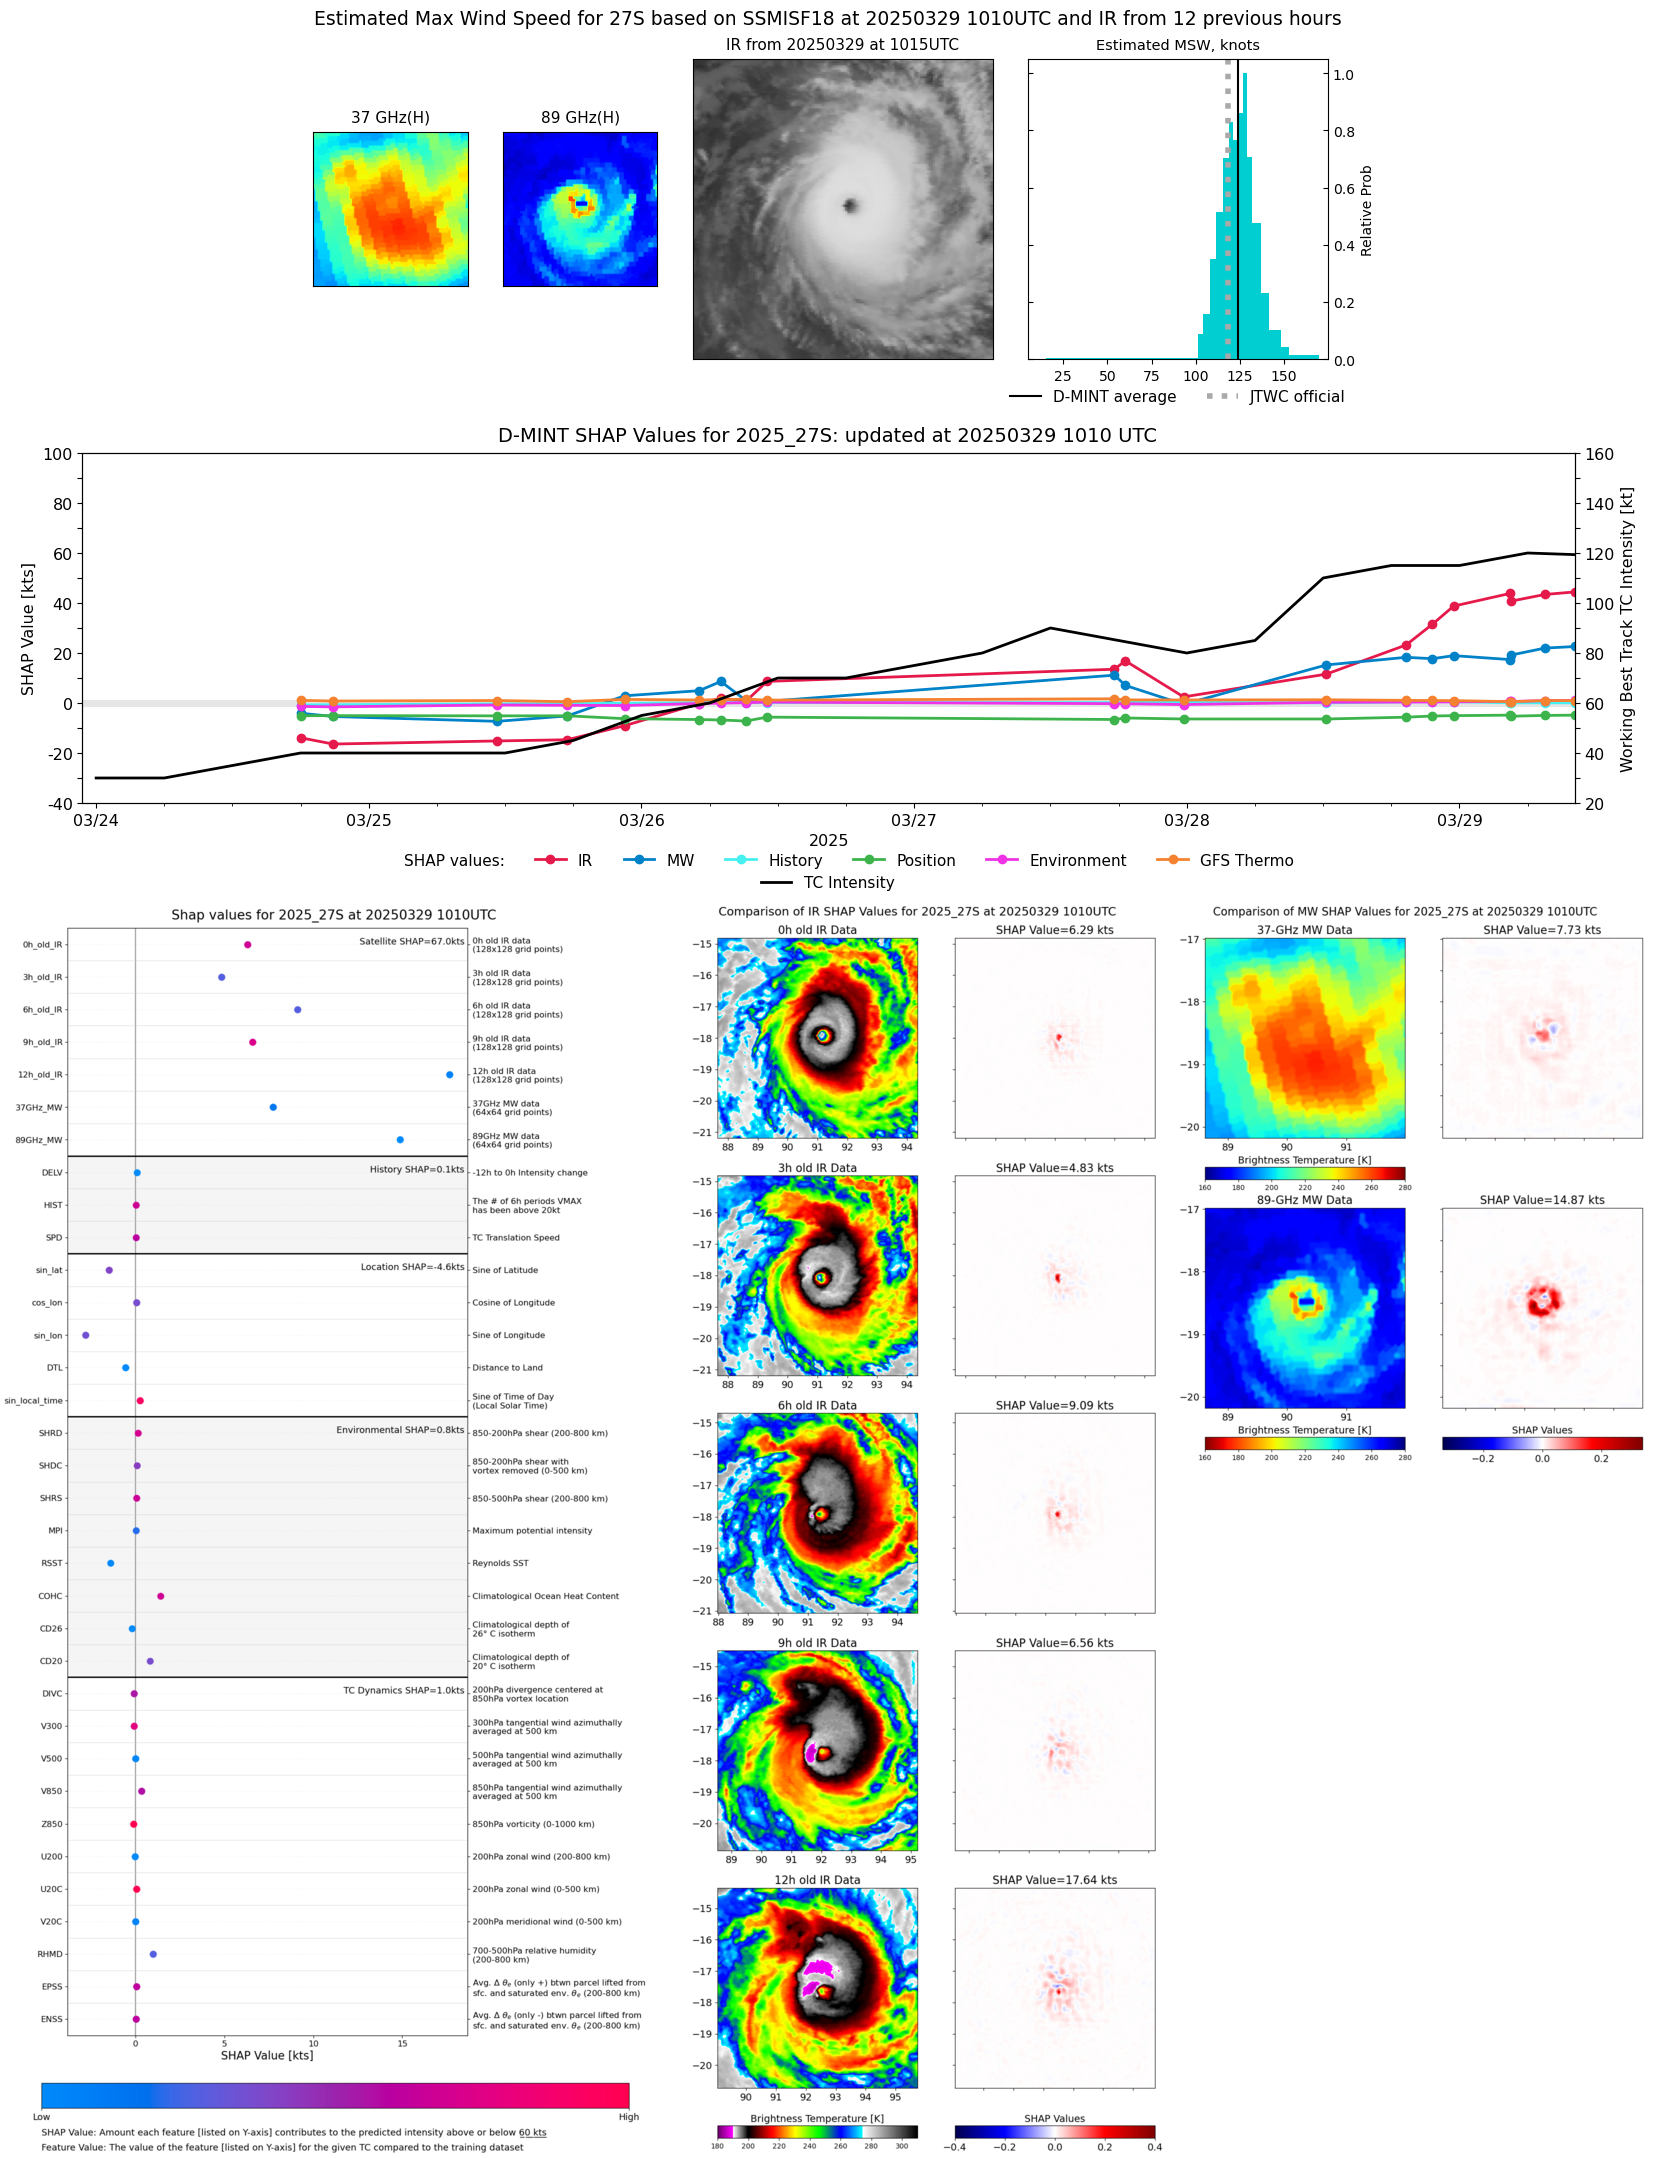 |
| 20250329 | 0730 UTC | AMSR2 | 930 hPa | 122 kts | 116 kts | 128 kts | 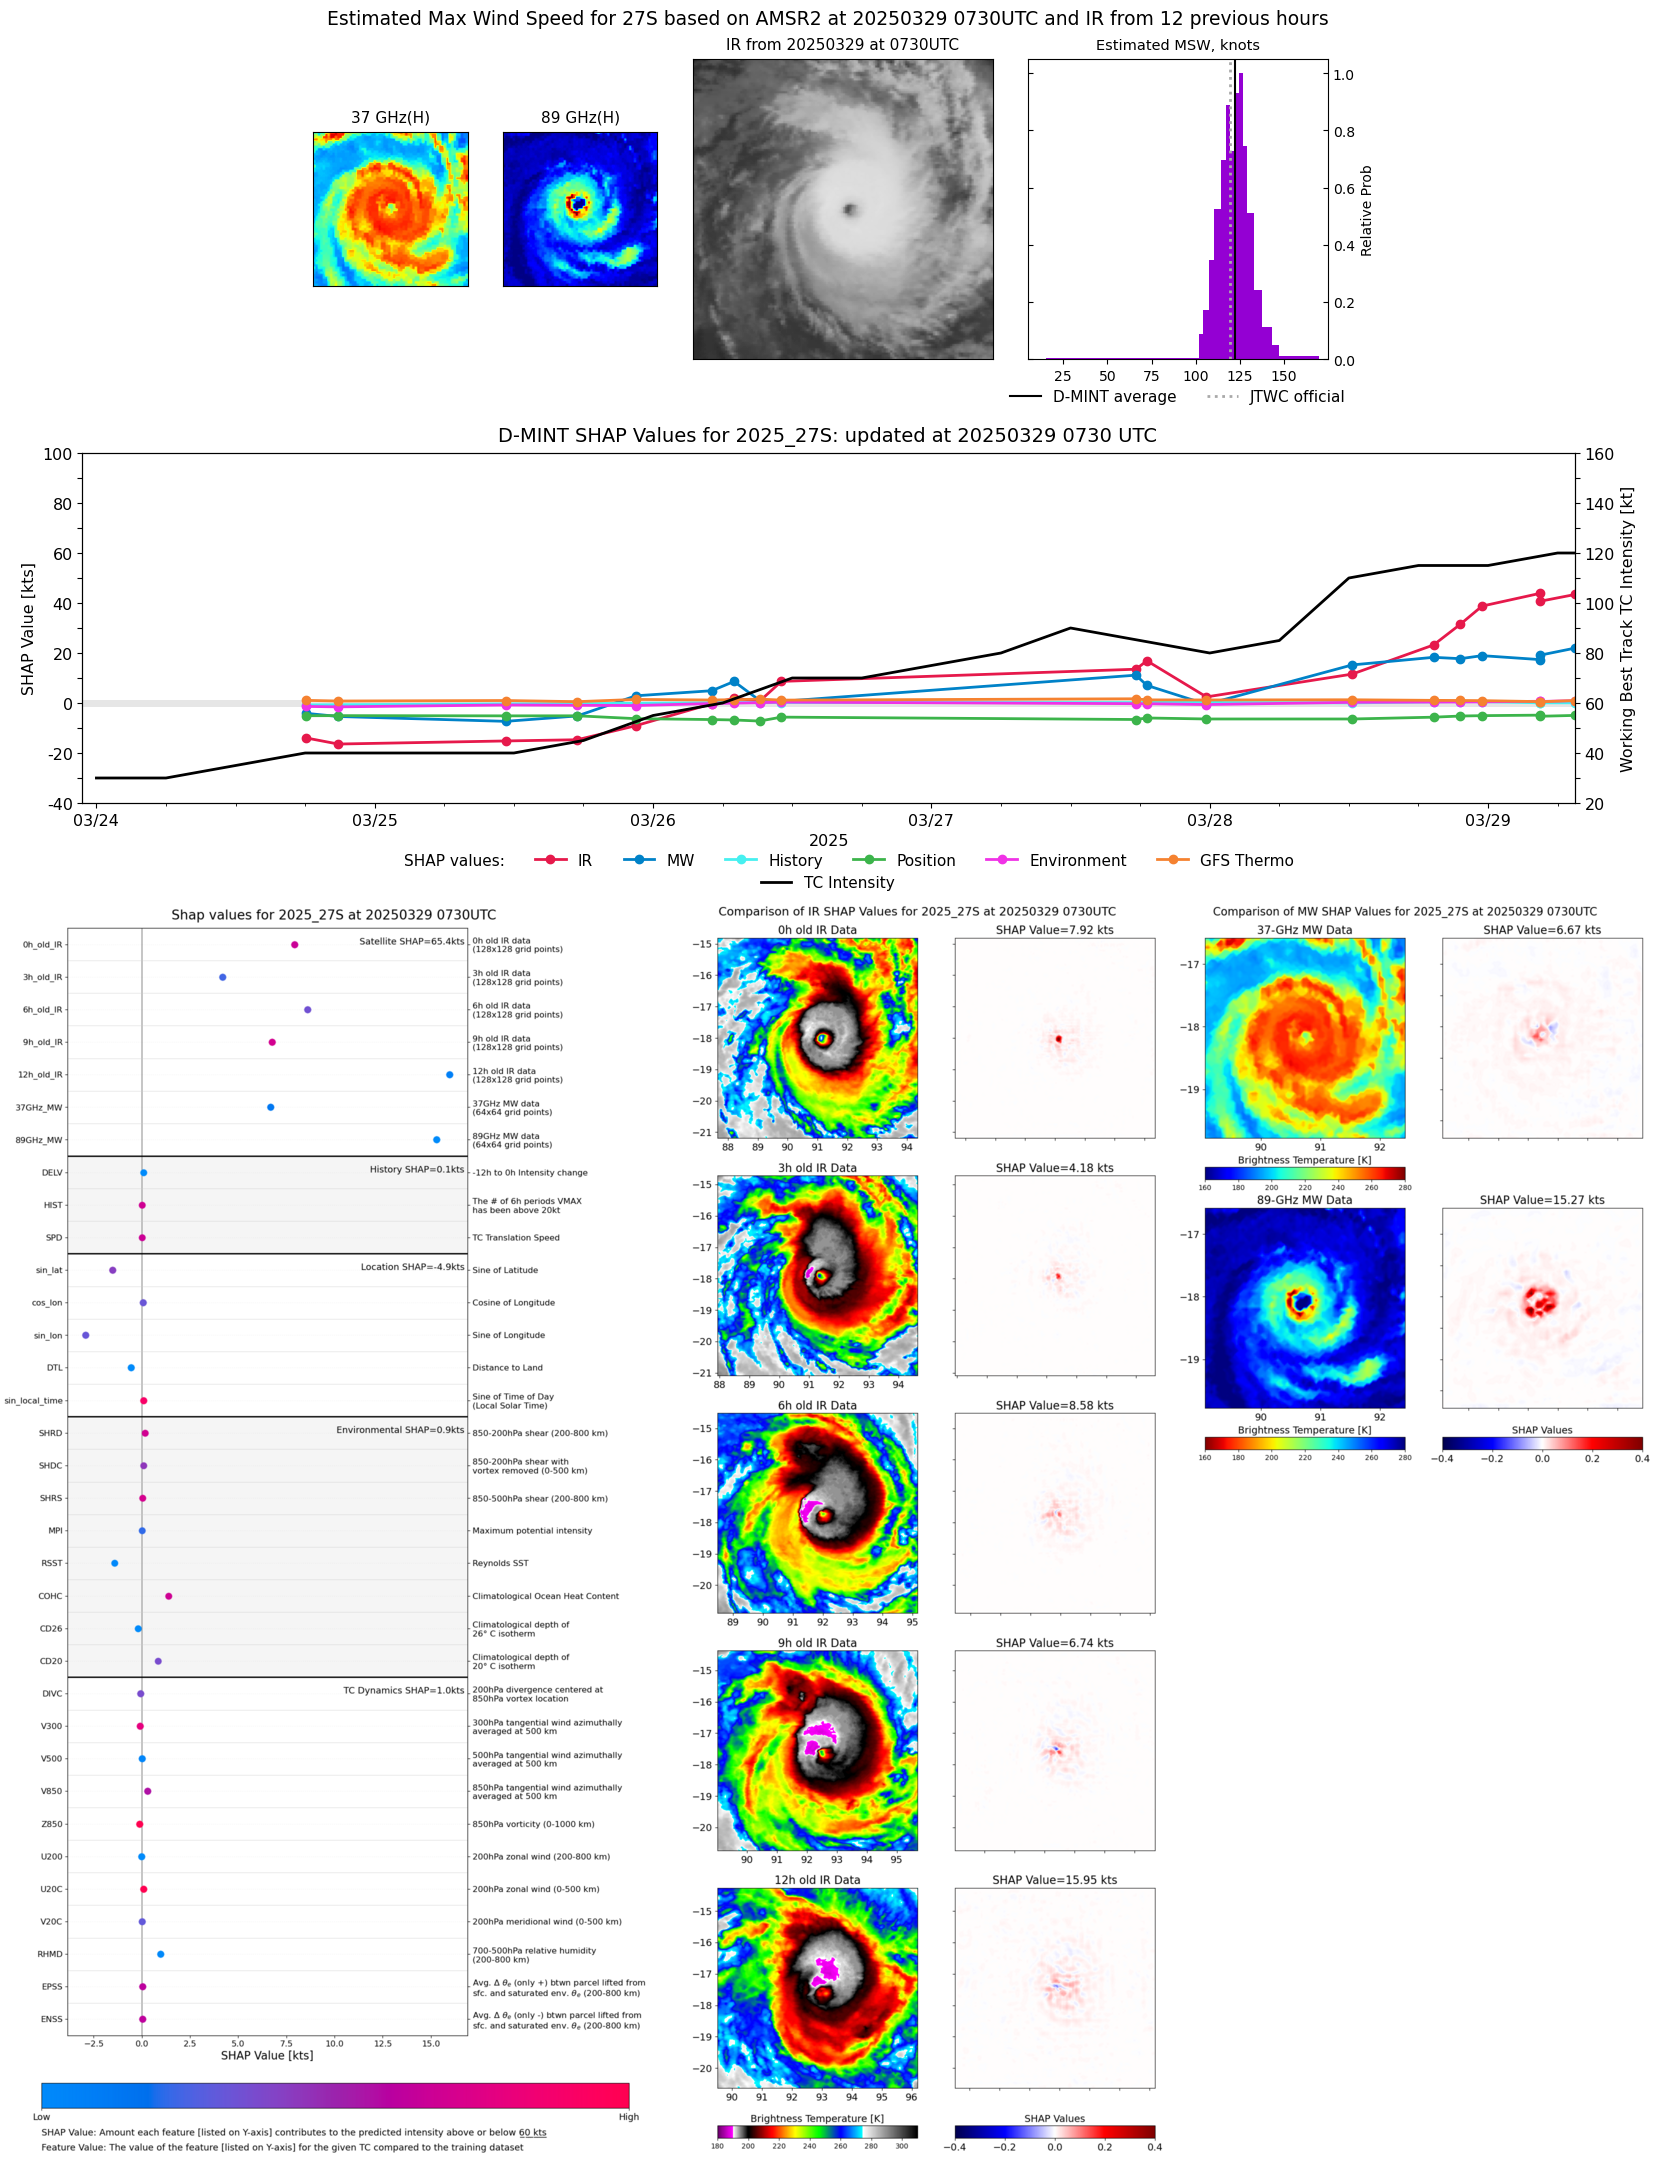 |
| 20250329 | 0431 UTC | GMI | 942 hPa | 116 kts | 109 kts | 122 kts |  |
| 20250329 | 0428 UTC | GMI | 938 hPa | 117 kts | 111 kts | 124 kts |  |
| 20250329 | 0031 UTC | SSMISF16 | 938 hPa | 113 kts | 107 kts | 120 kts | 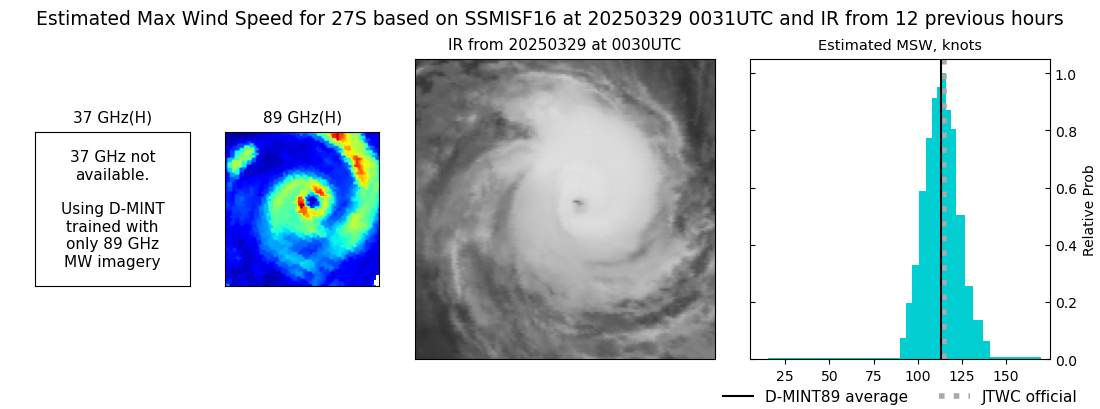 |
| 20250328 | 2329 UTC | SSMISF17 | 931 hPa | 114 kts | 108 kts | 120 kts | 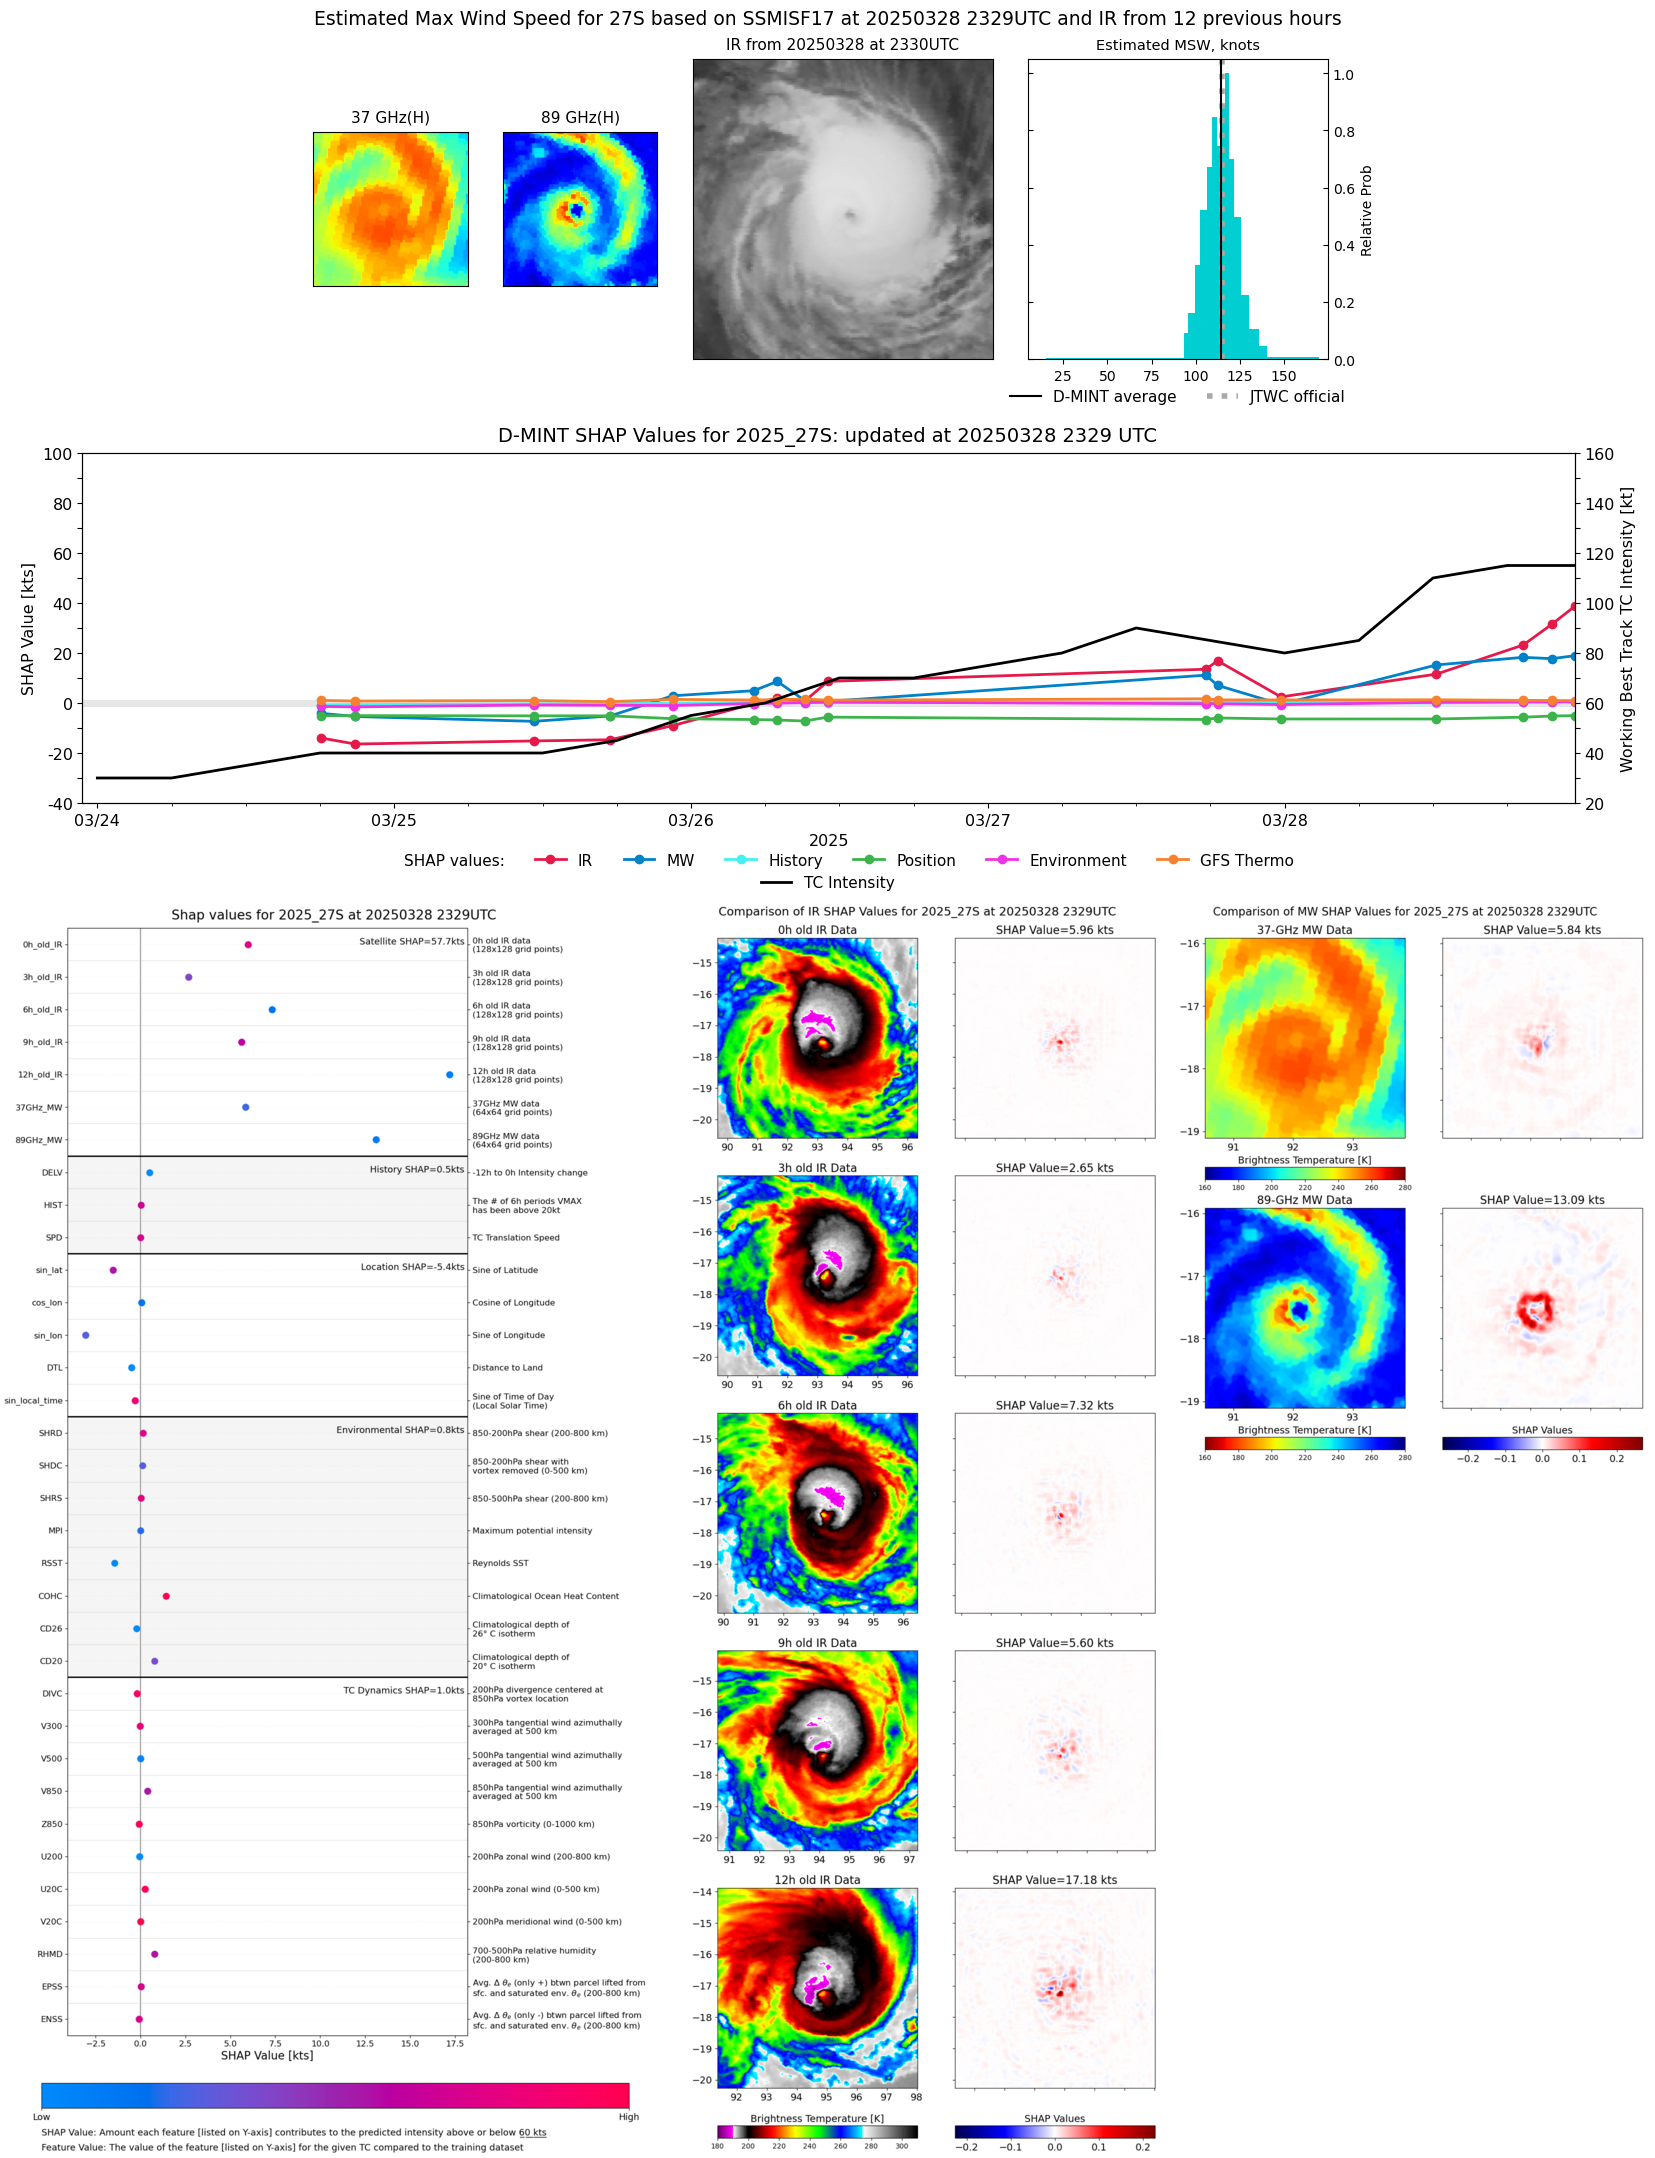 |
| 20250328 | 2137 UTC | SSMISF18 | 934 hPa | 106 kts | 99 kts | 112 kts | 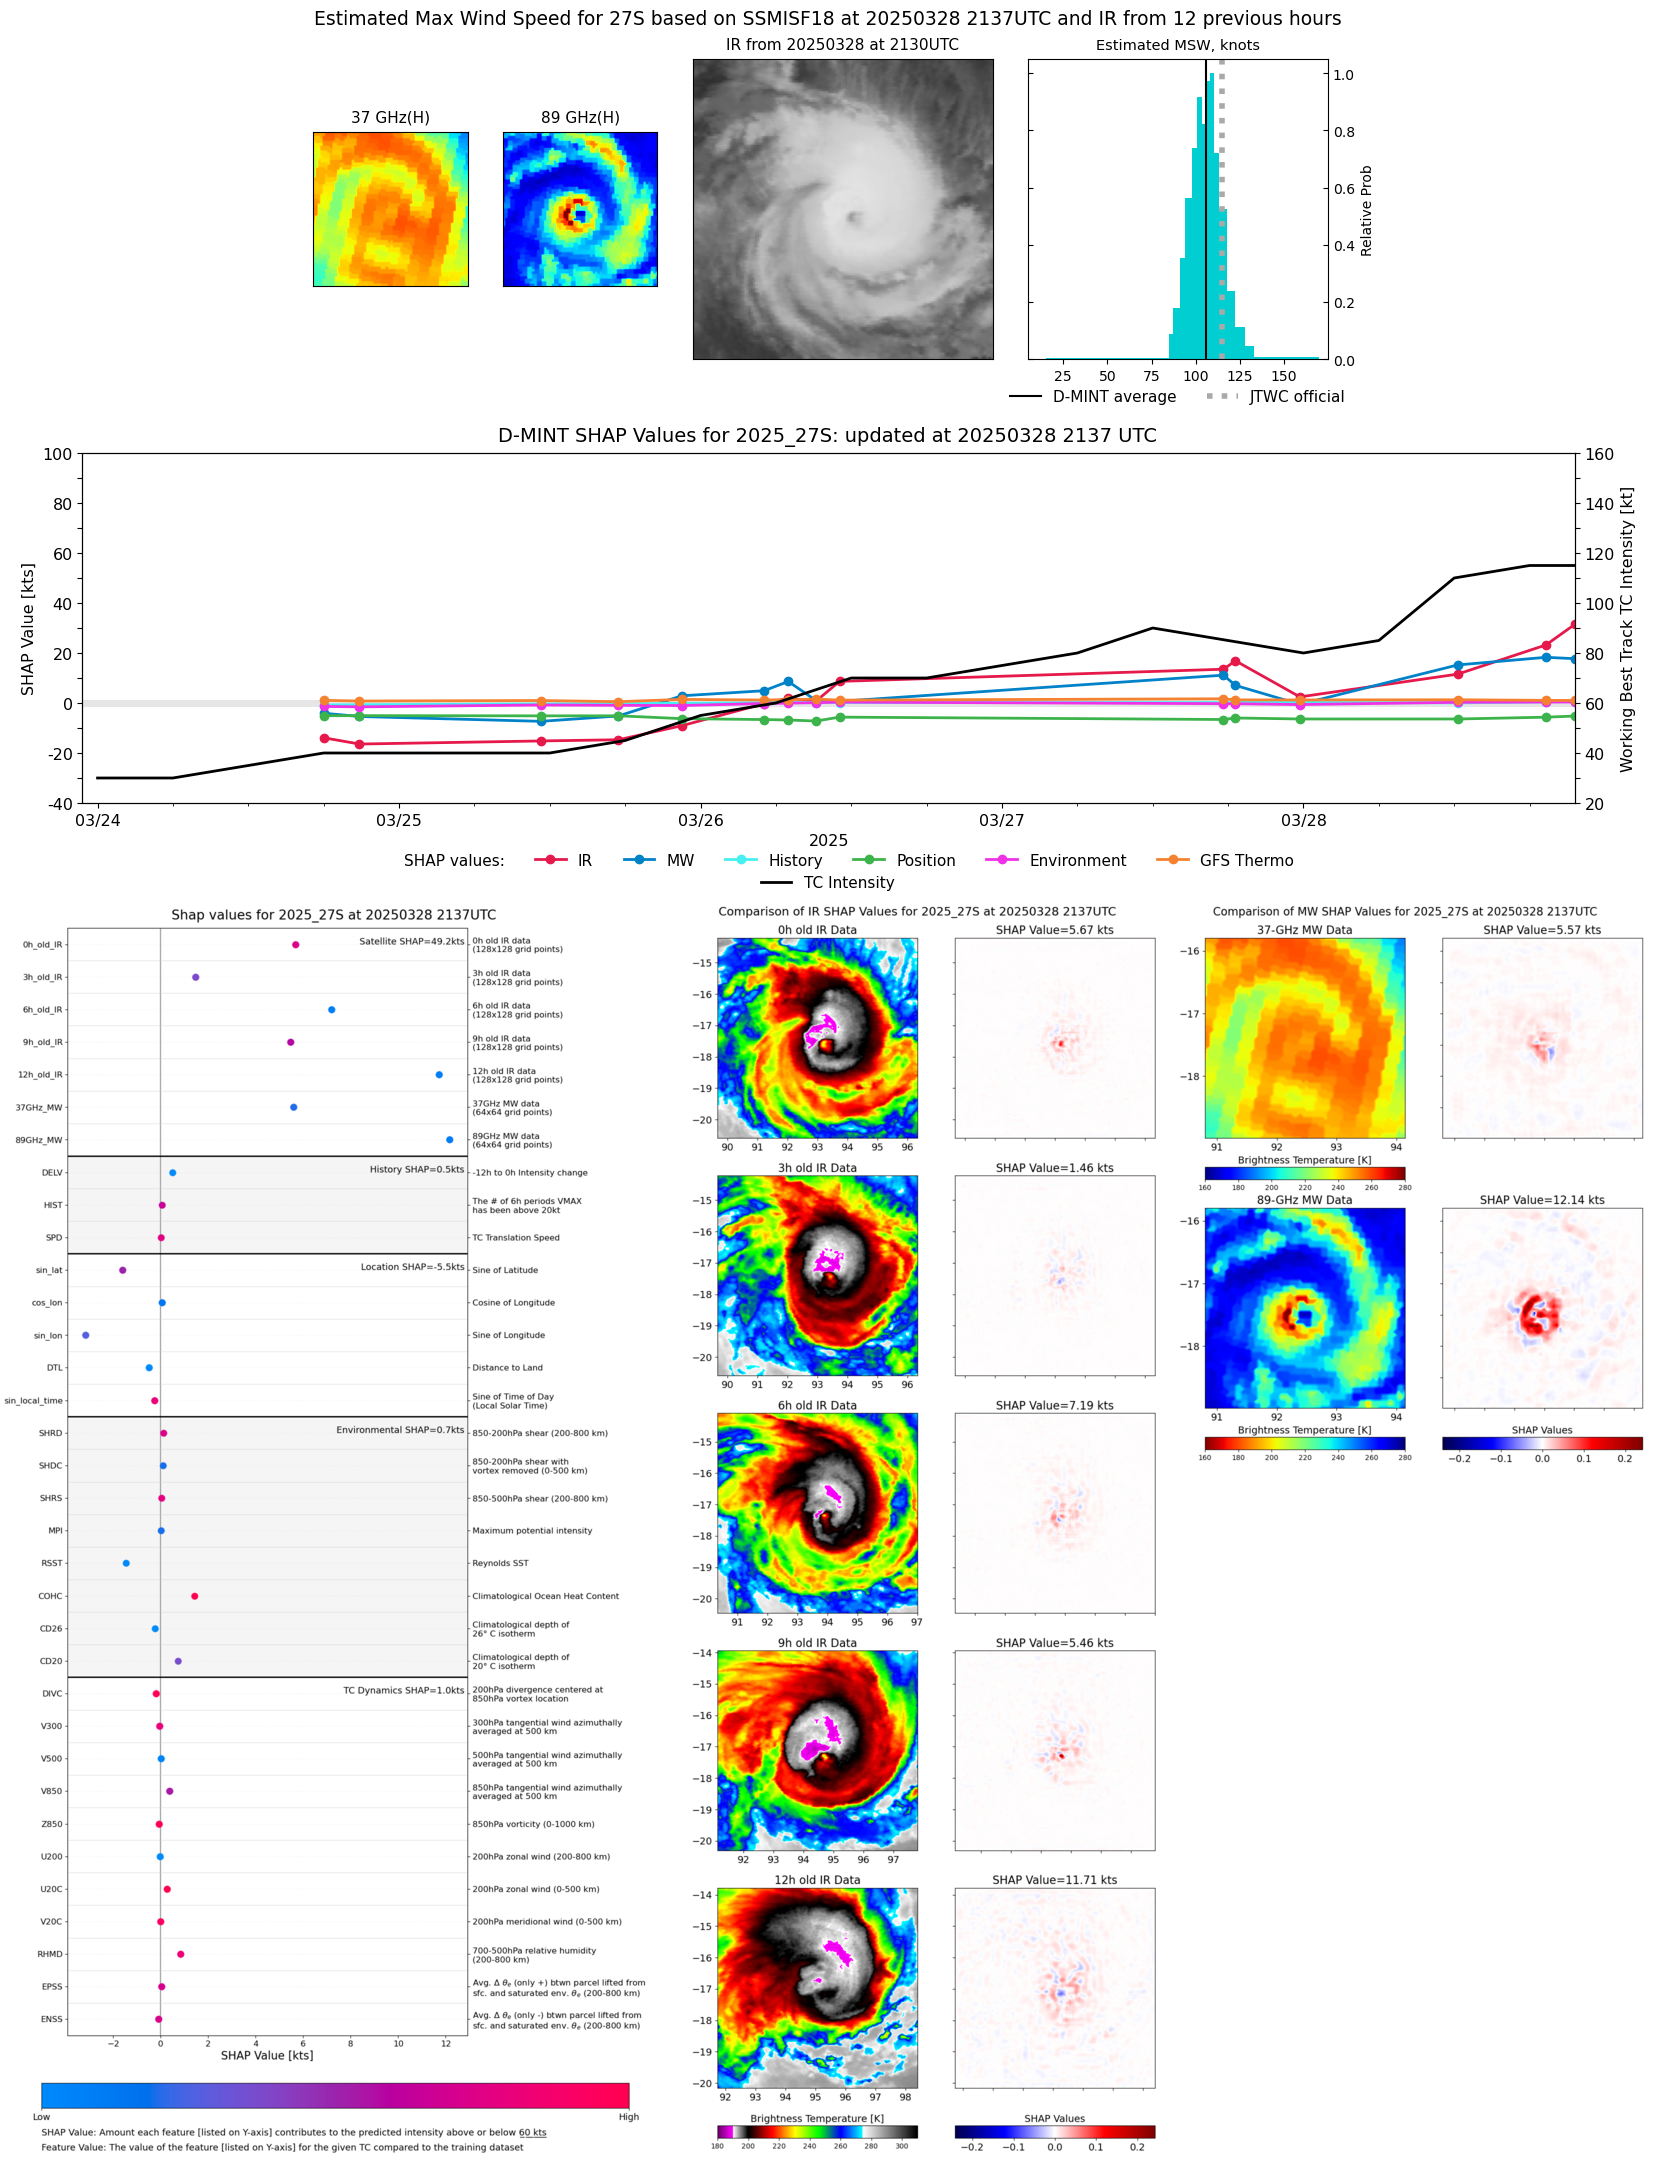 |
| 20250328 | 1918 UTC | AMSR2 | 943 hPa | 98 kts | 91 kts | 104 kts | 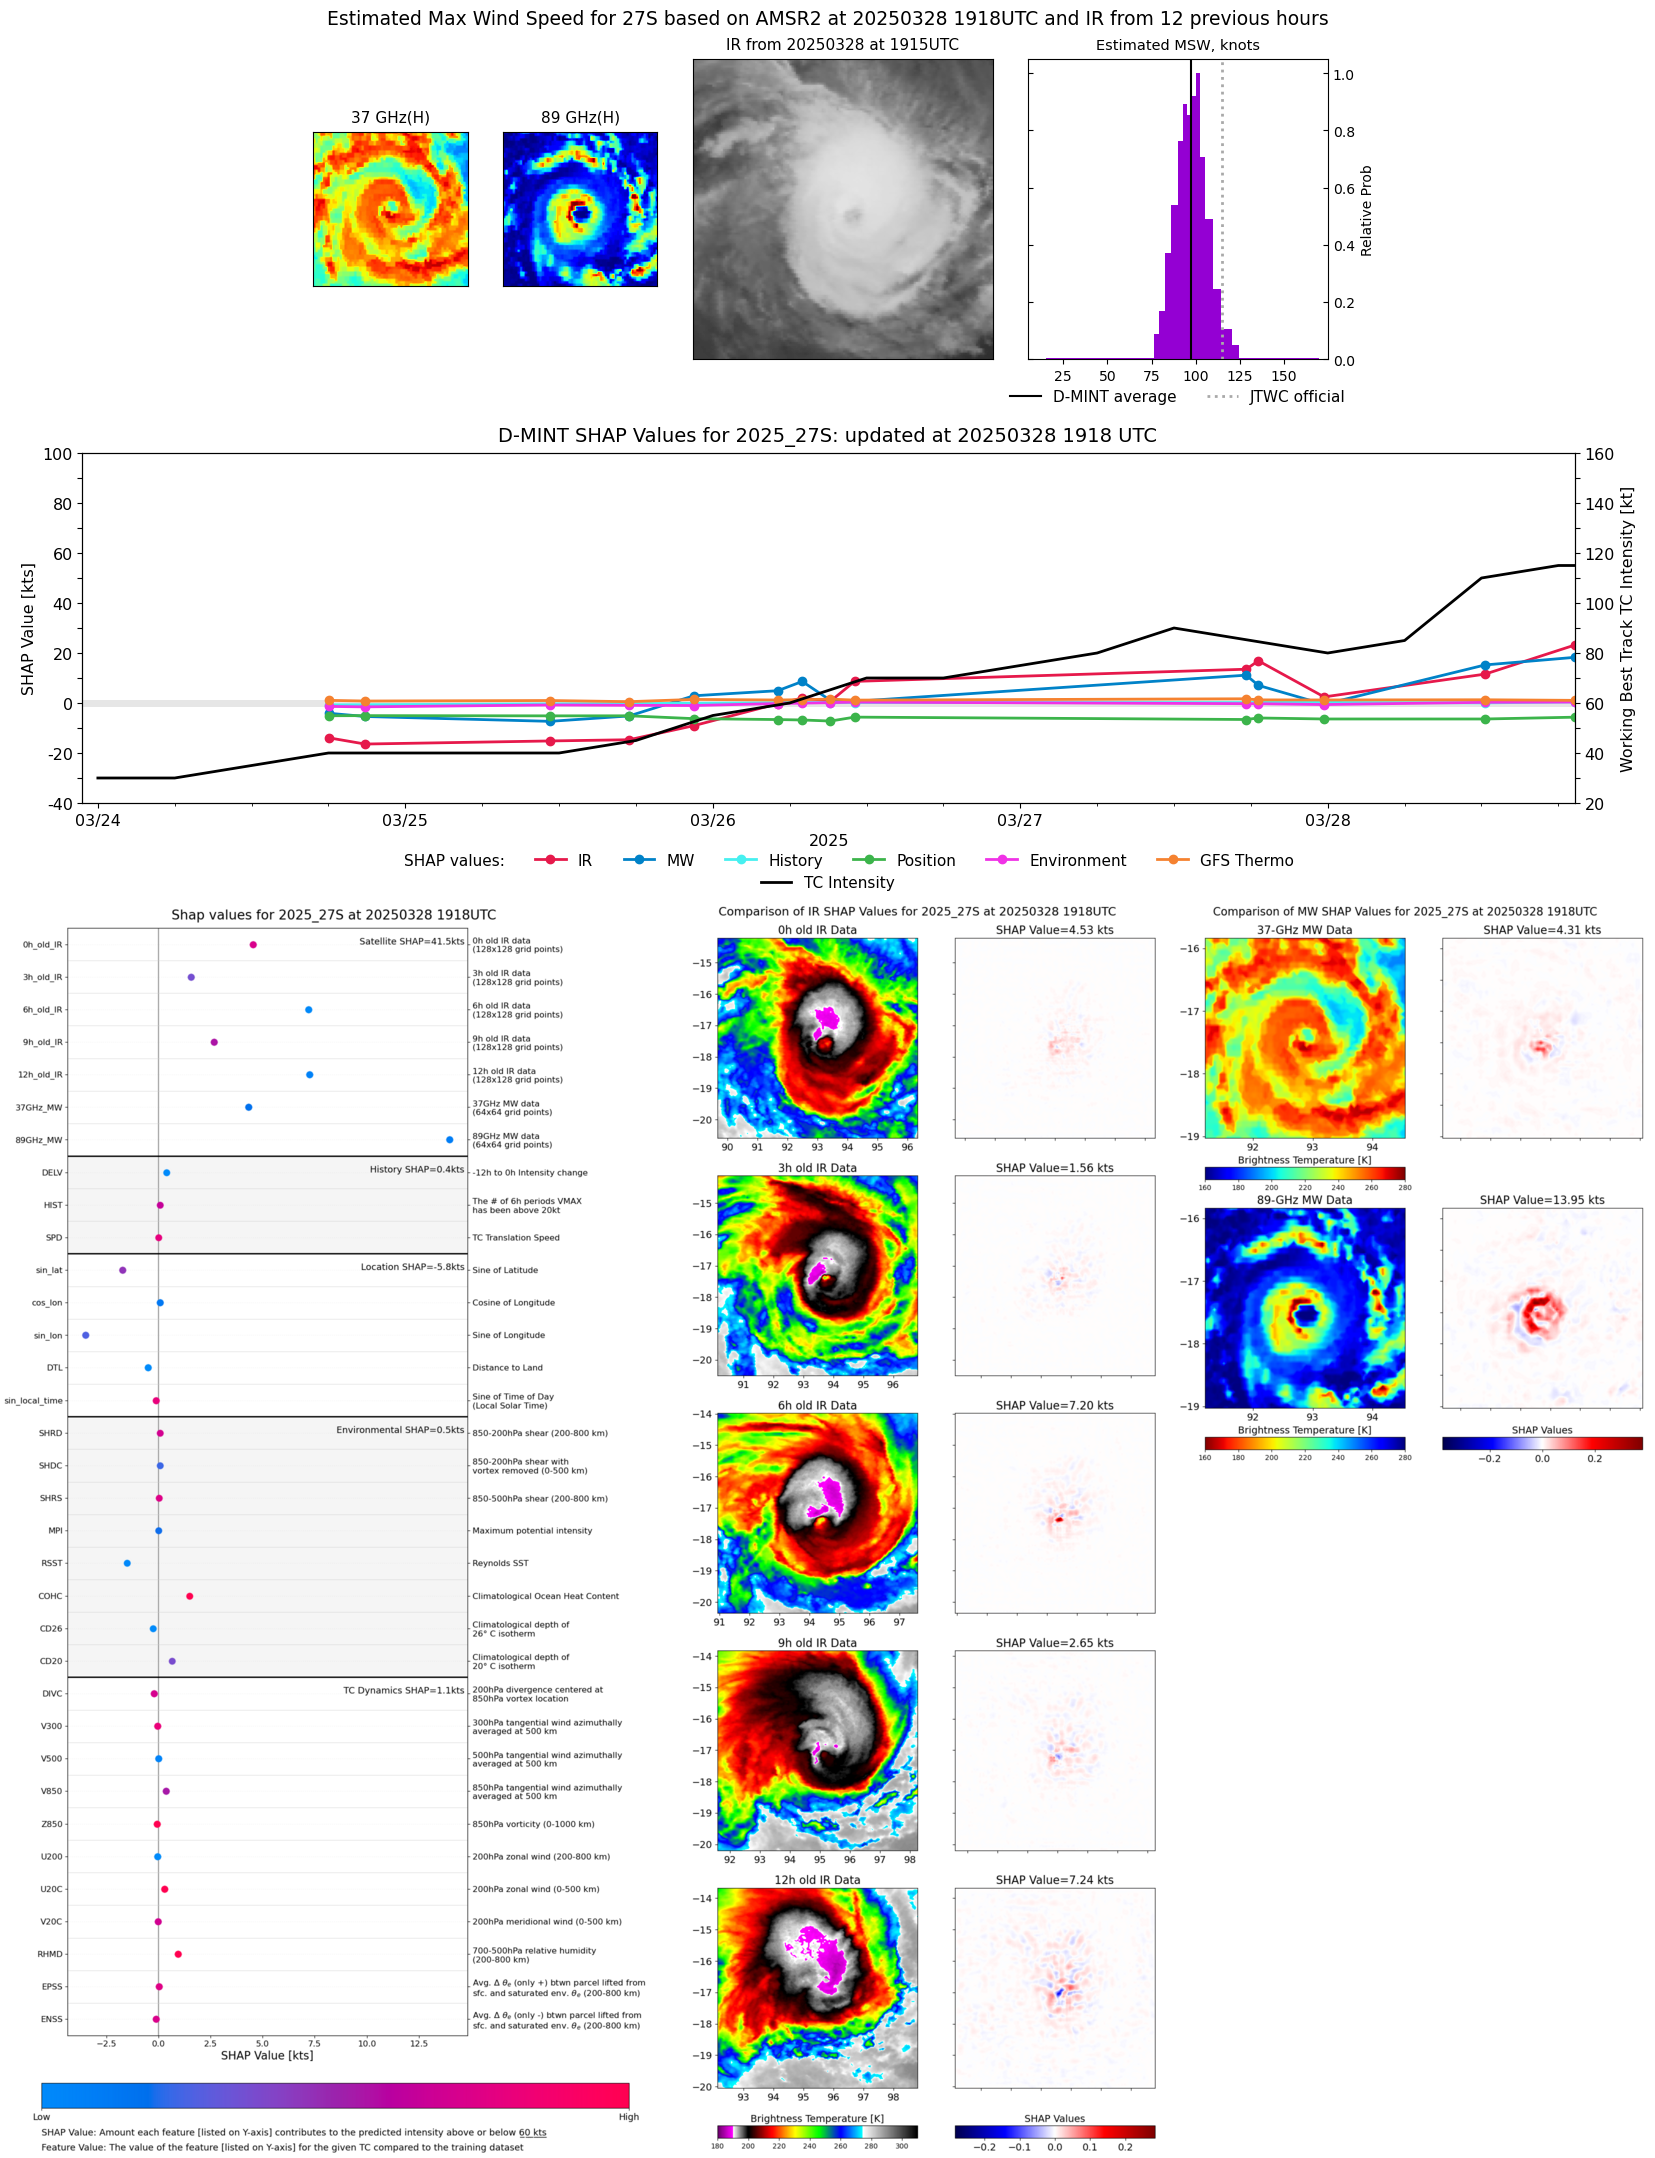 |
| 20250328 | 1217 UTC | SSMISF17 | 961 hPa | 82 kts | 76 kts | 89 kts | 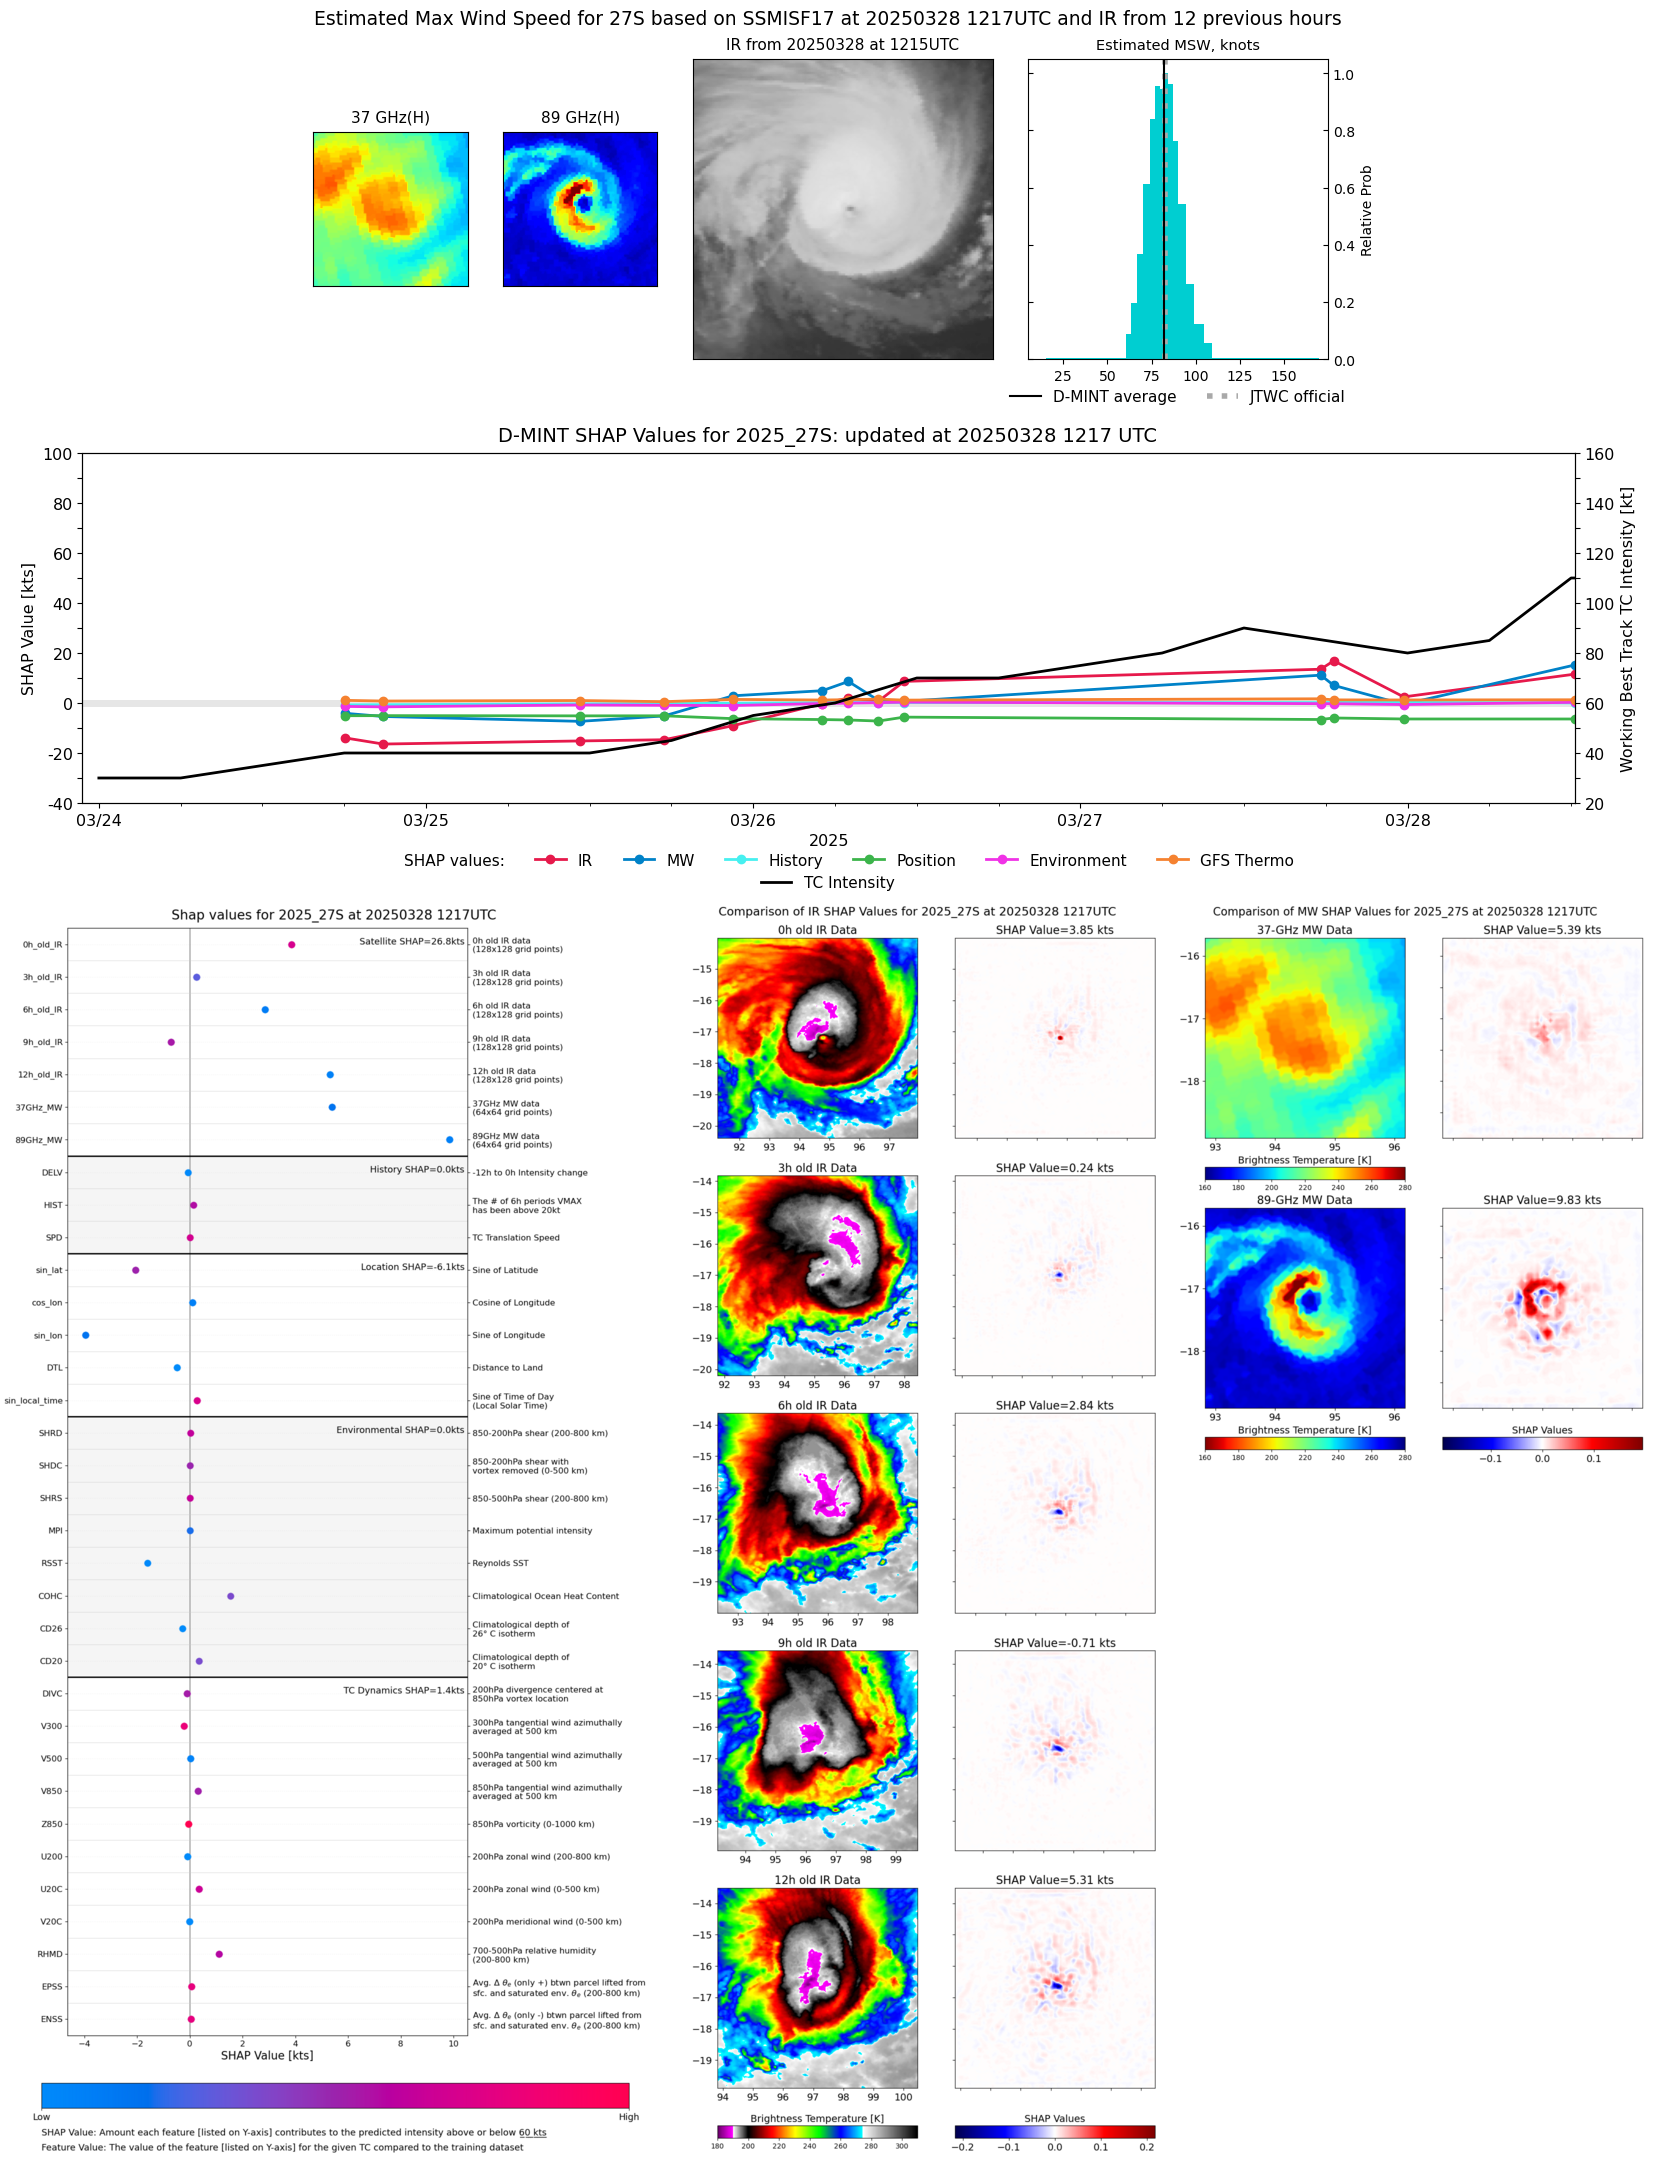 |
| 20250328 | 0933 UTC | TROPICS03 | 973 hPa | 69 kts | 62 kts | 76 kts | 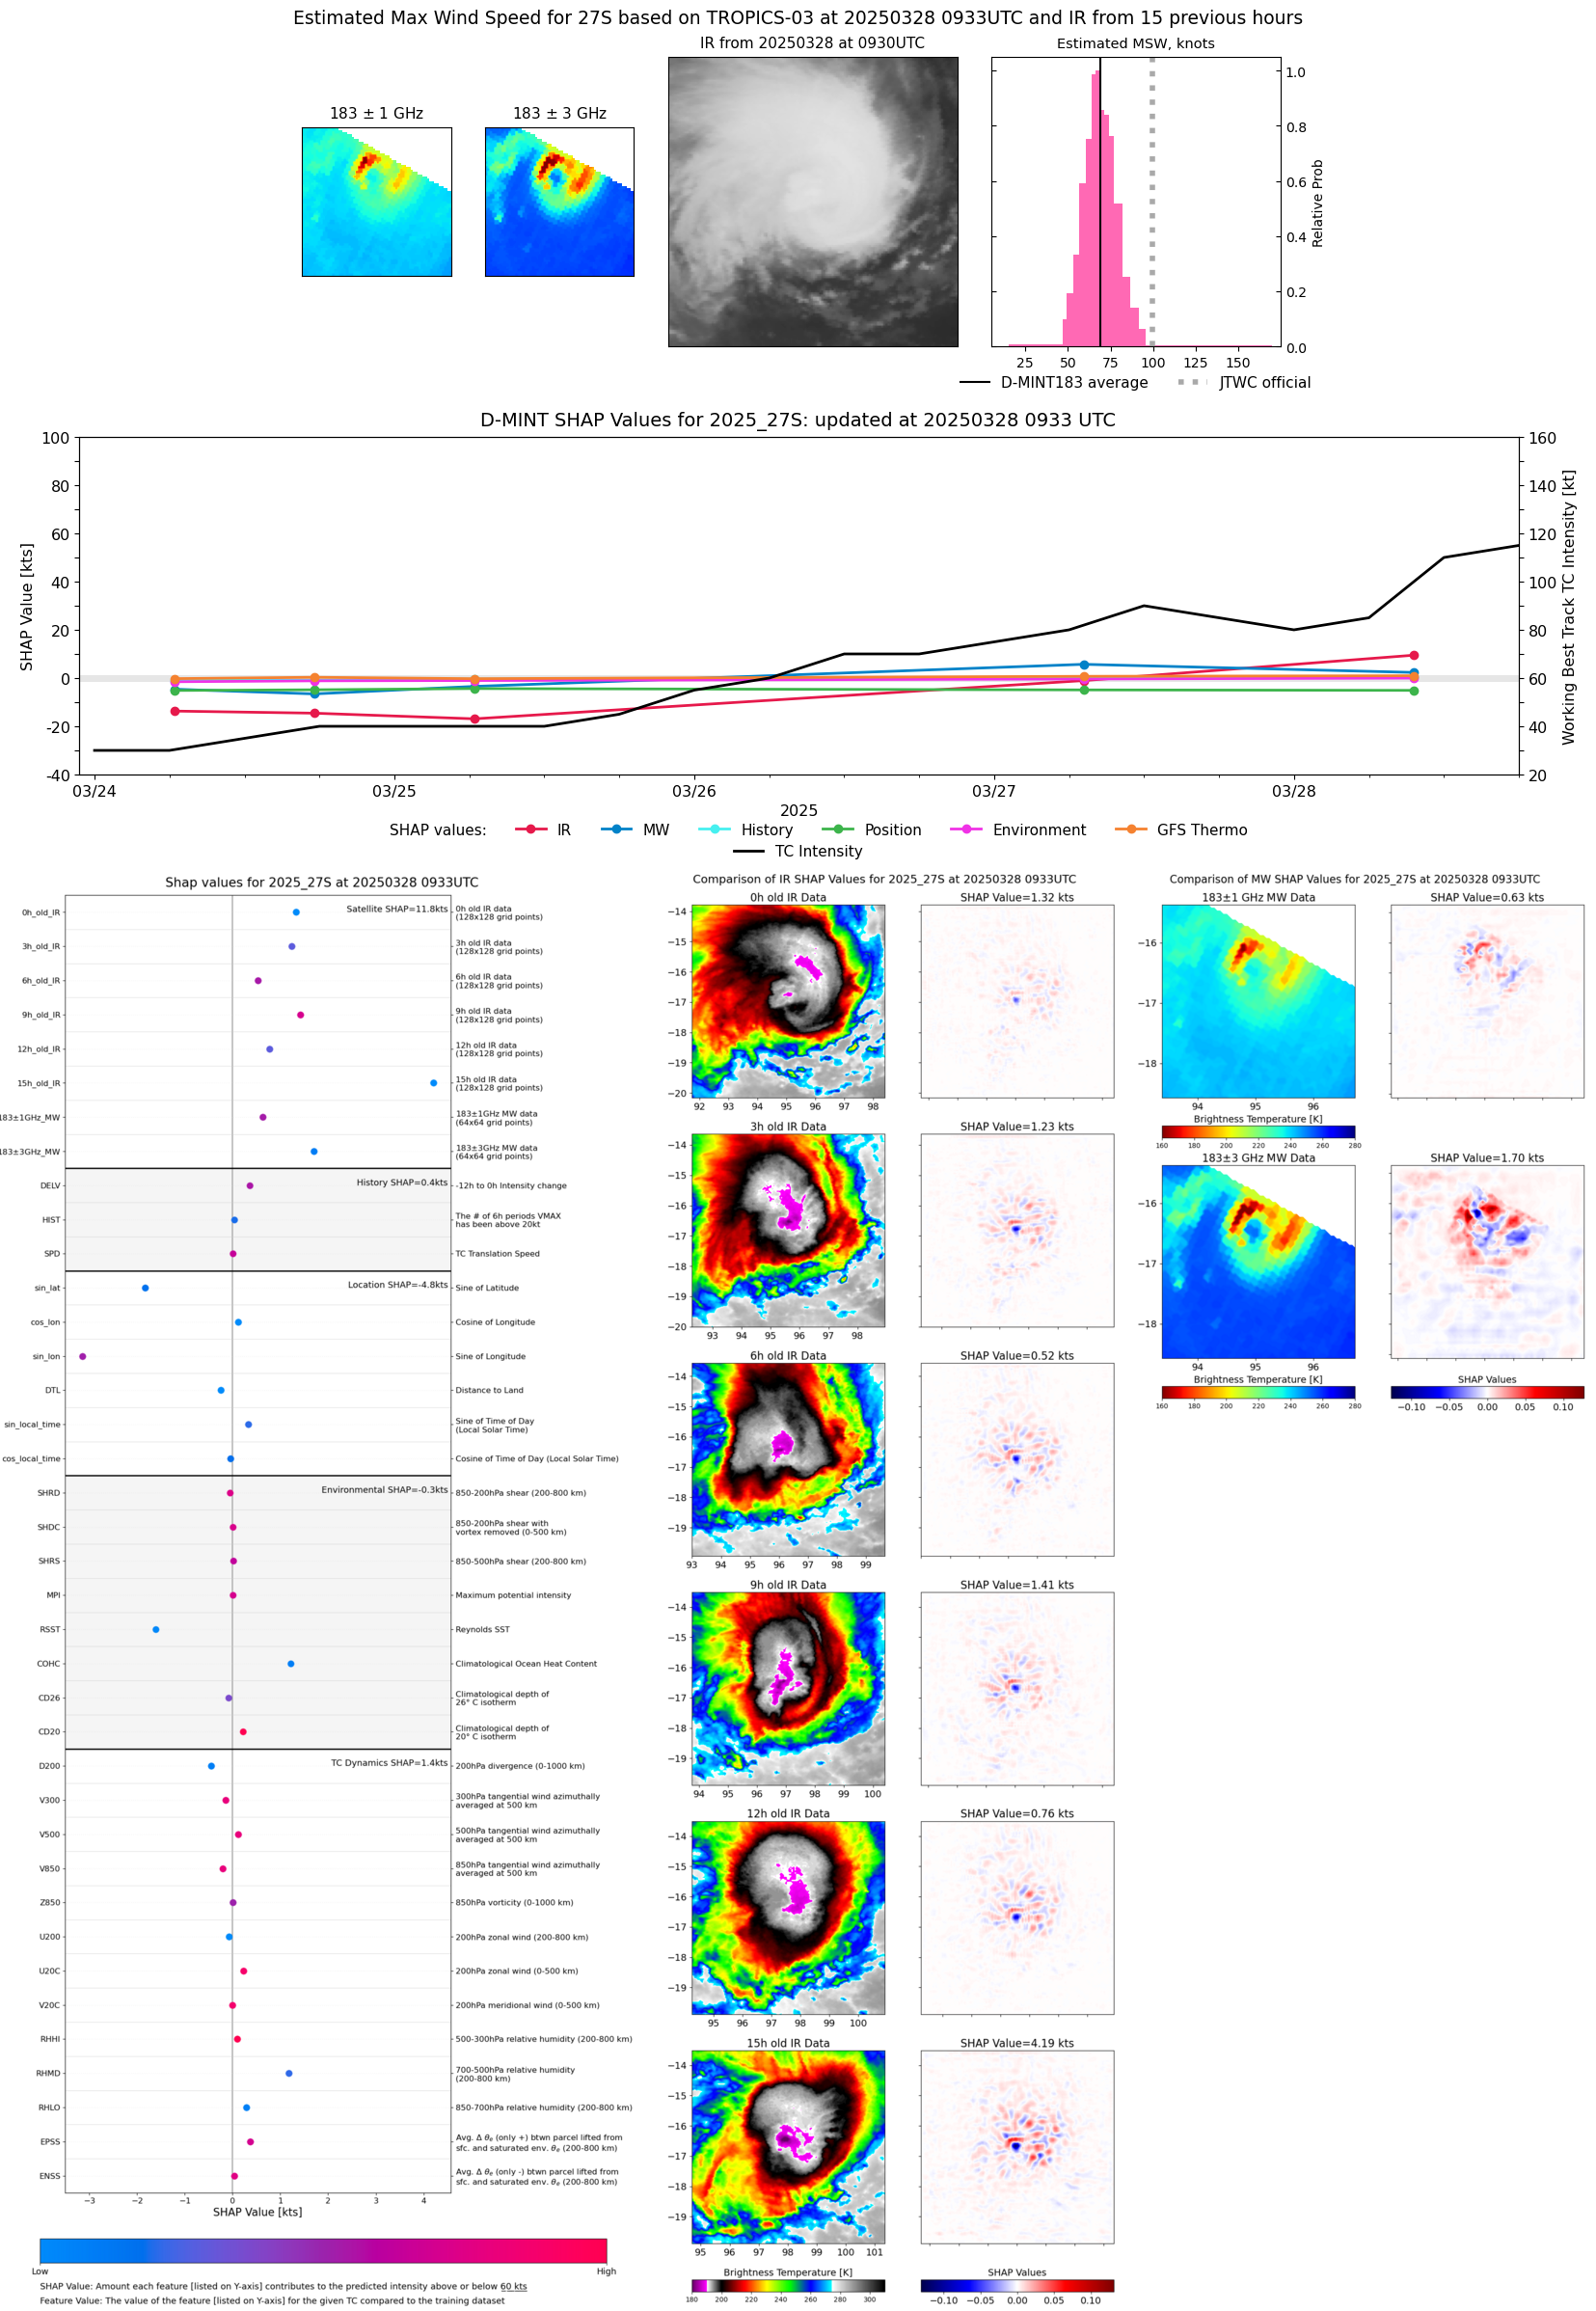 |
| 20250328 | 0541 UTC | TROPICS05 | 979 hPa | 61 kts | 55 kts | 68 kts | 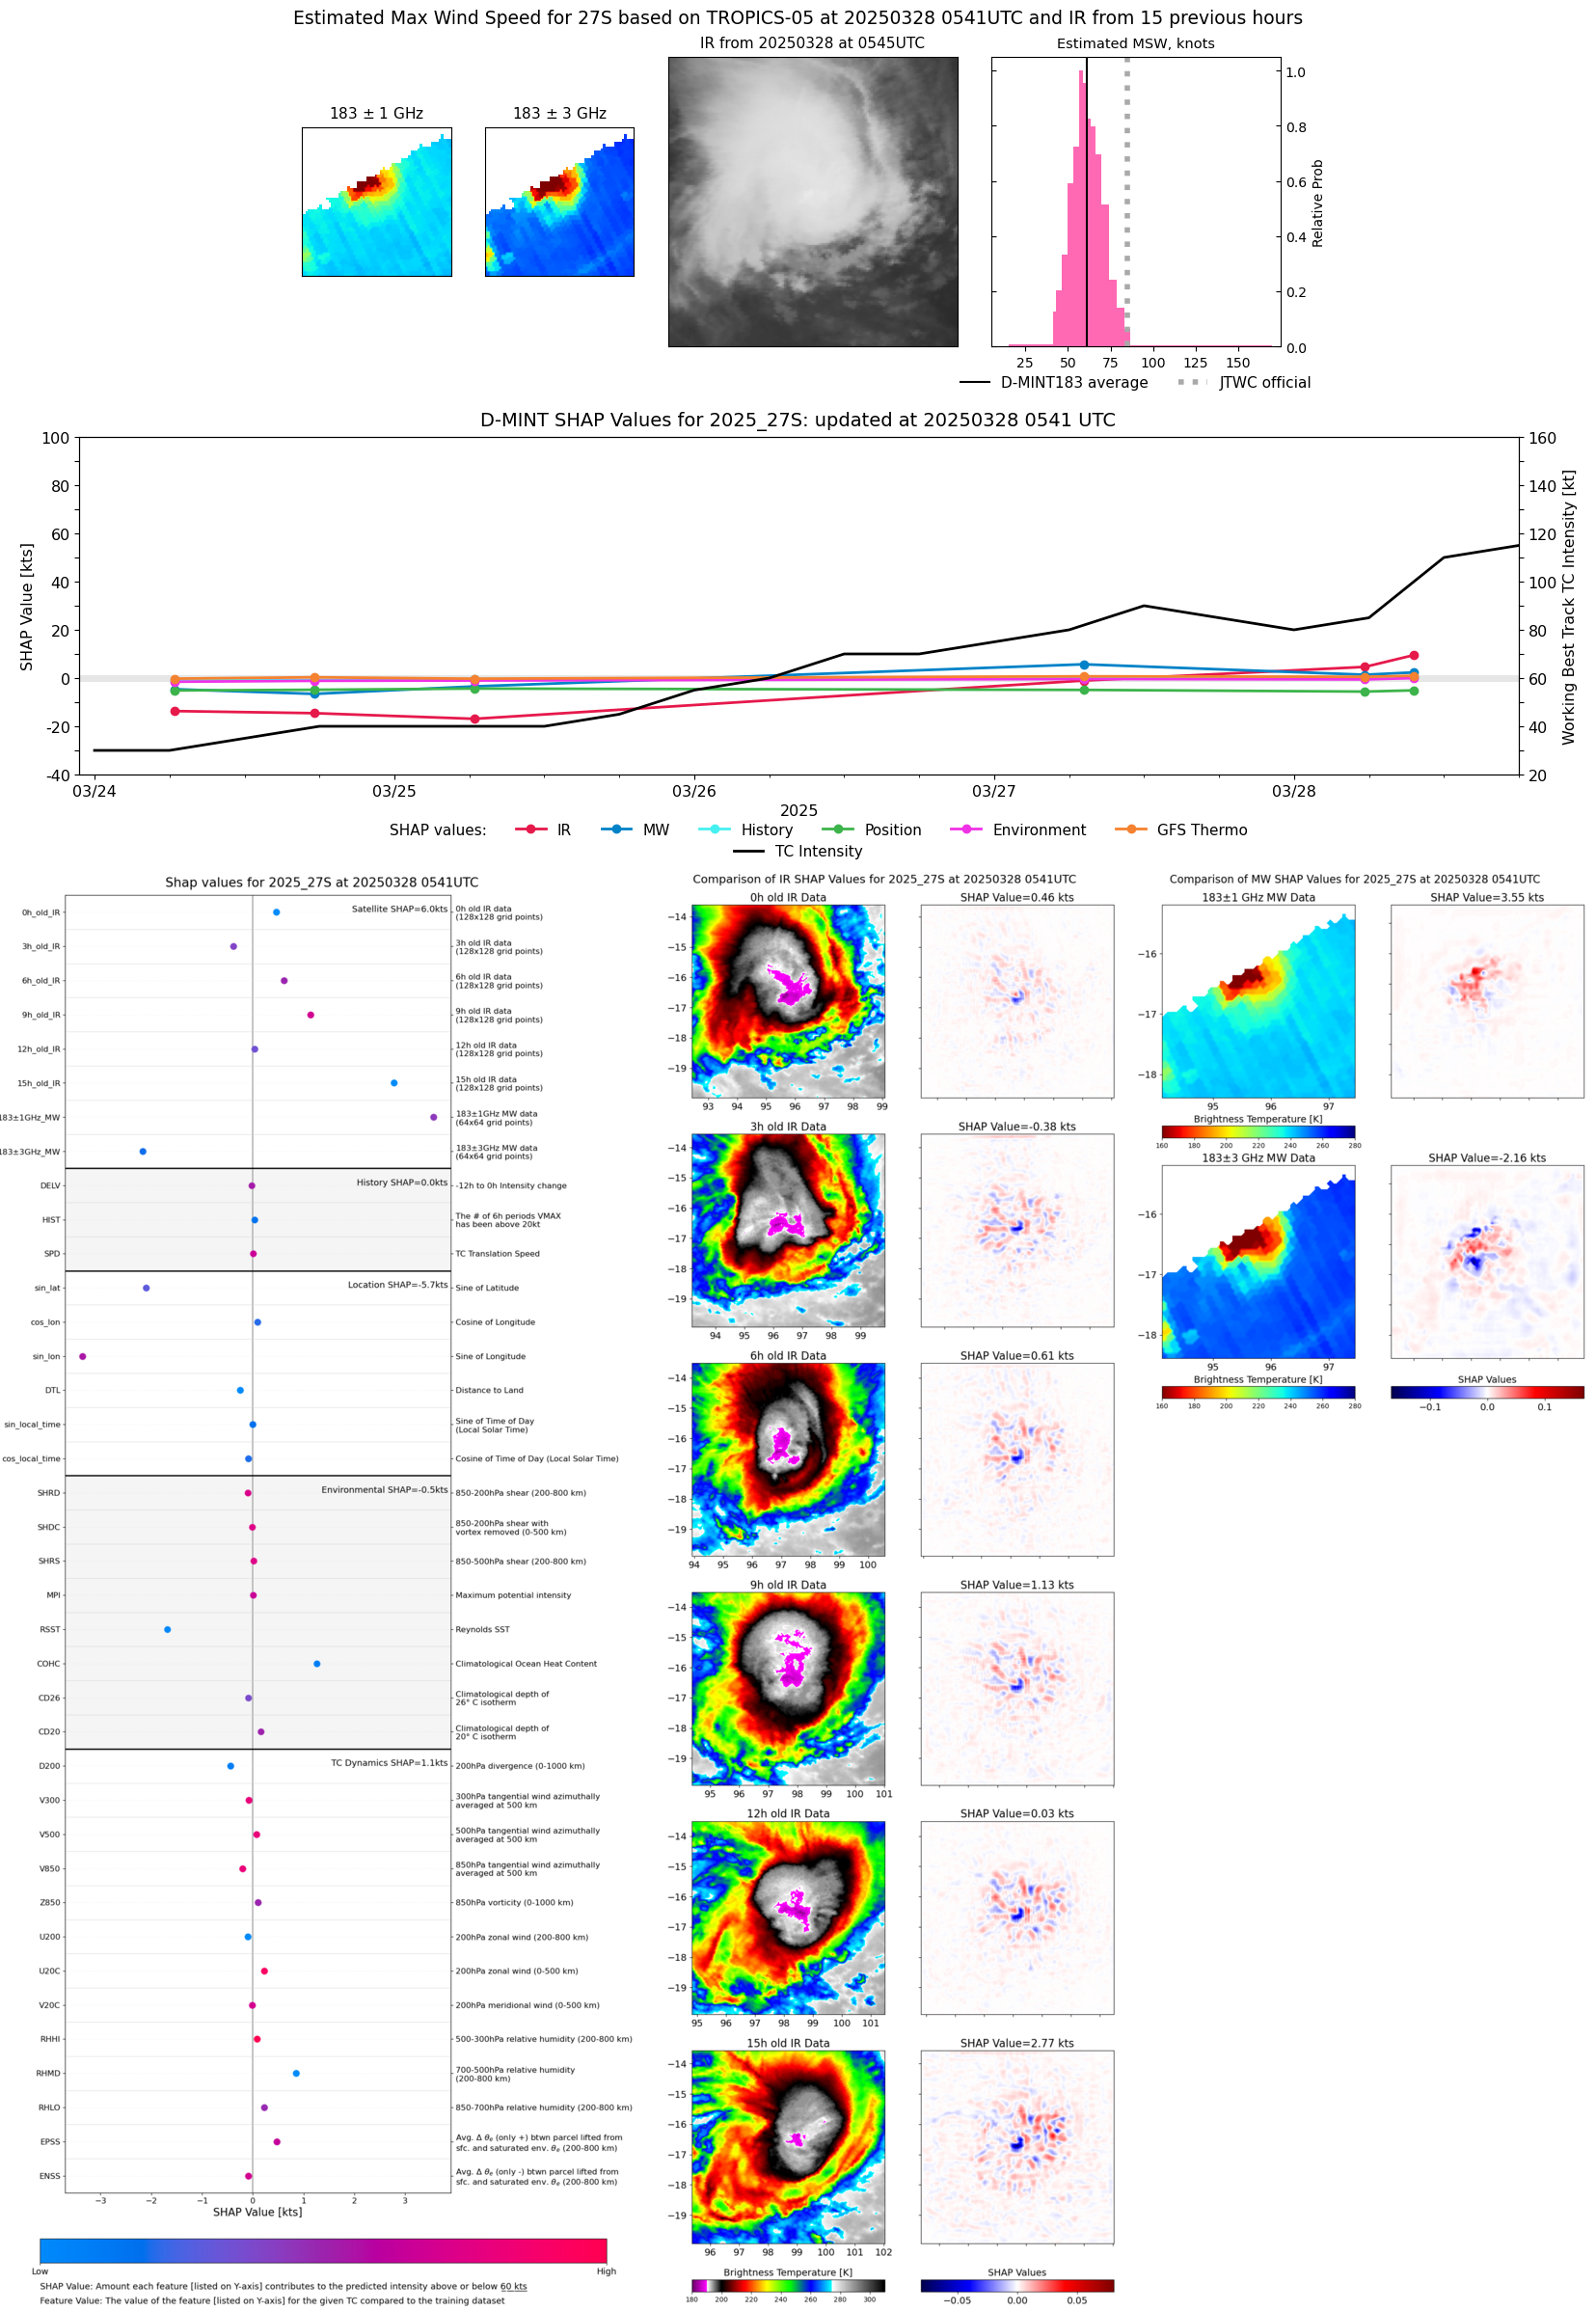 |
| 20250327 | 2343 UTC | SSMISF17 | 983 hPa | 57 kts | 50 kts | 64 kts | 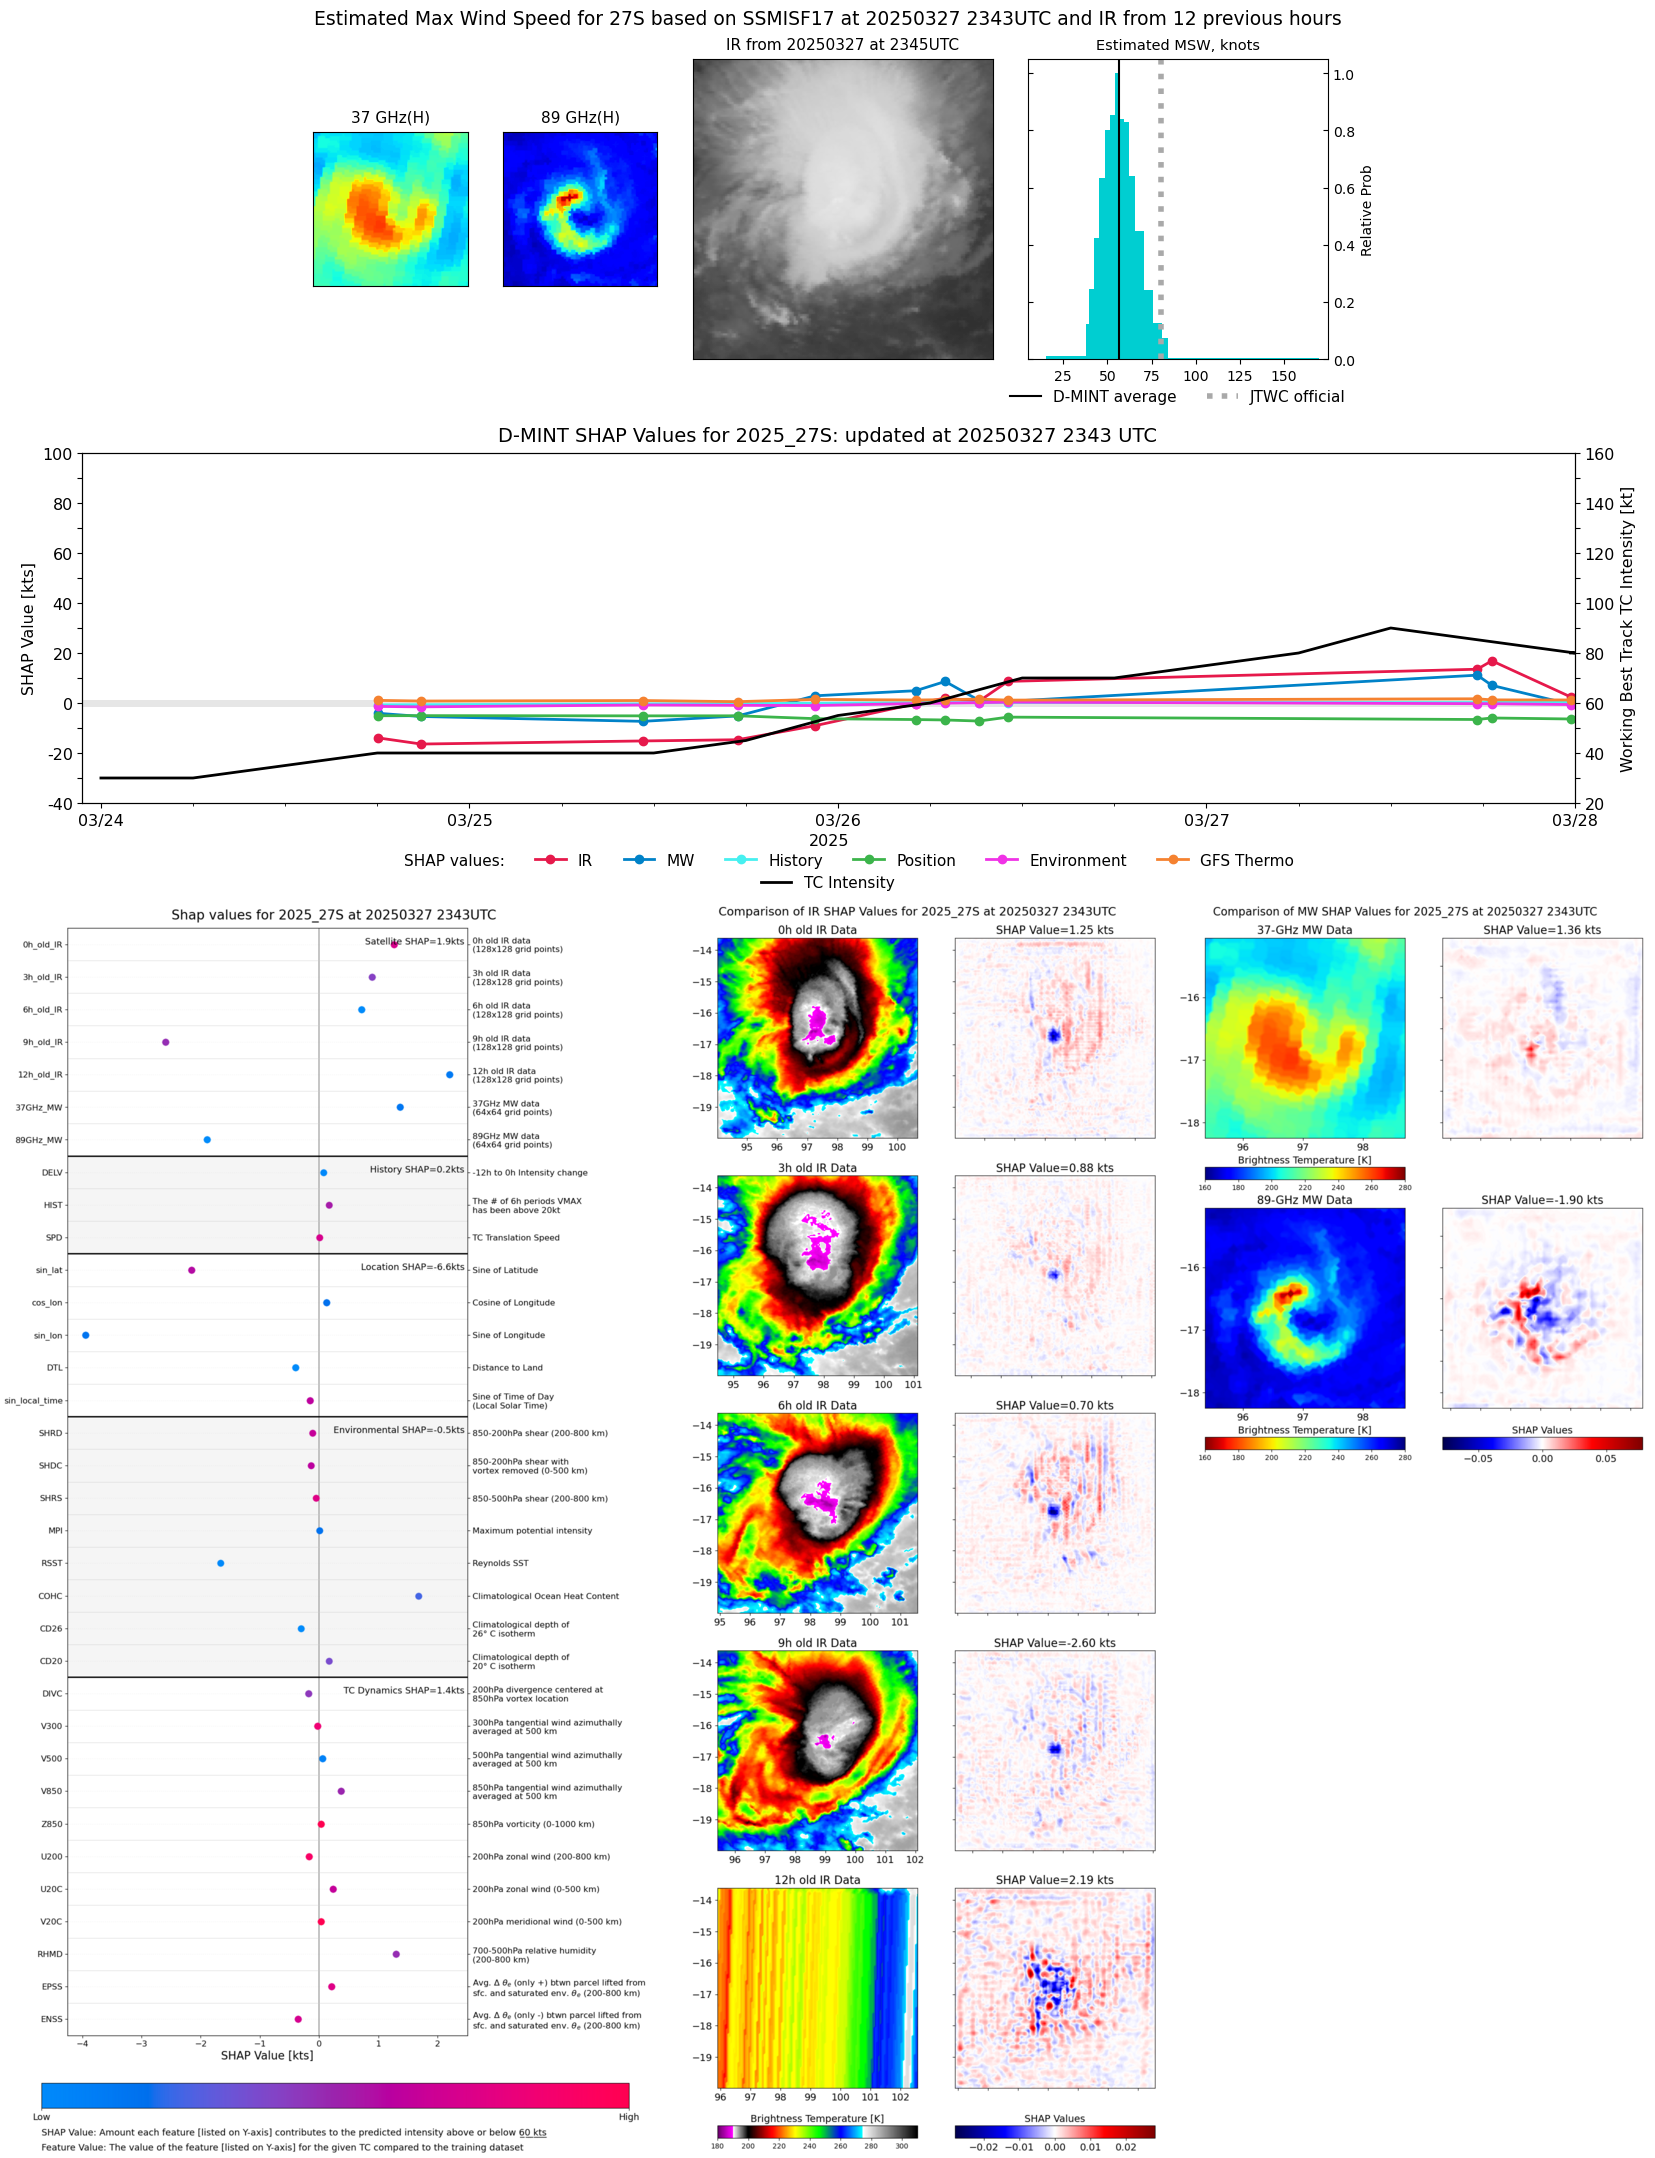 |
| 20250327 | 1835 UTC | AMSR2 | 965 hPa | 79 kts | 73 kts | 86 kts | 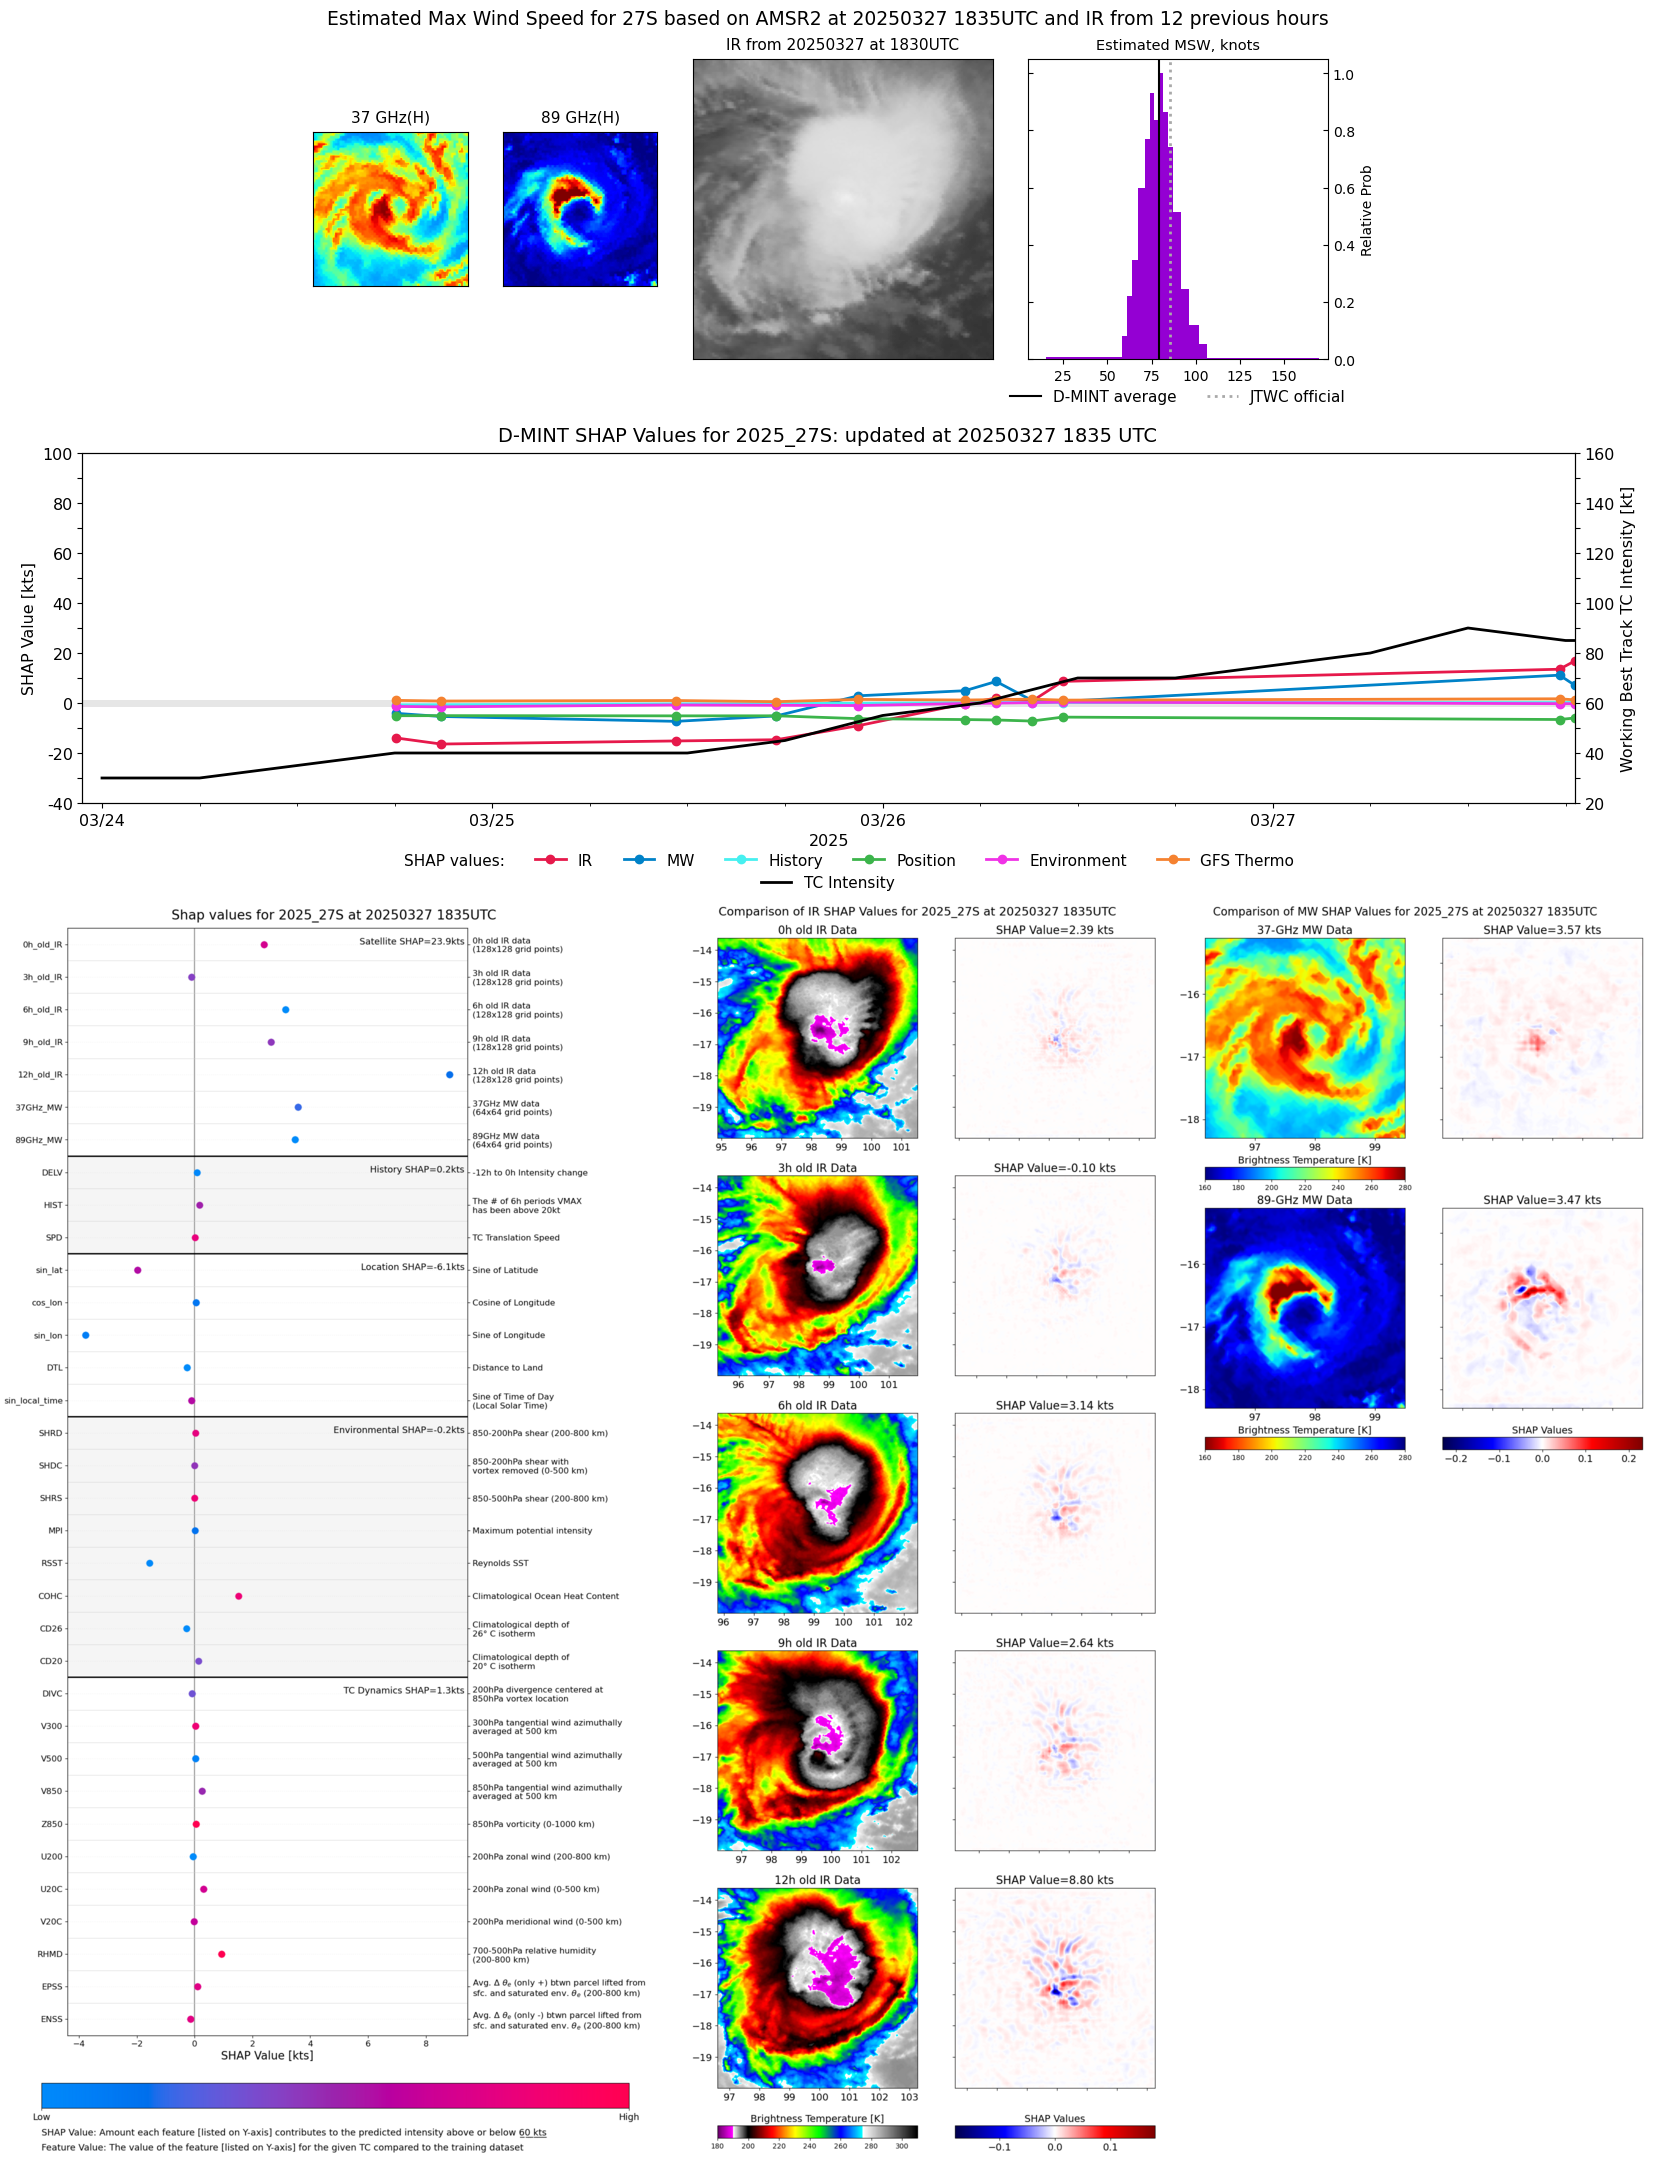 |
| 20250327 | 1738 UTC | GMI | 969 hPa | 80 kts | 73 kts | 87 kts |  |
| 20250327 | 1150 UTC | SSMISF16 | 976 hPa | 61 kts | 54 kts | 68 kts | 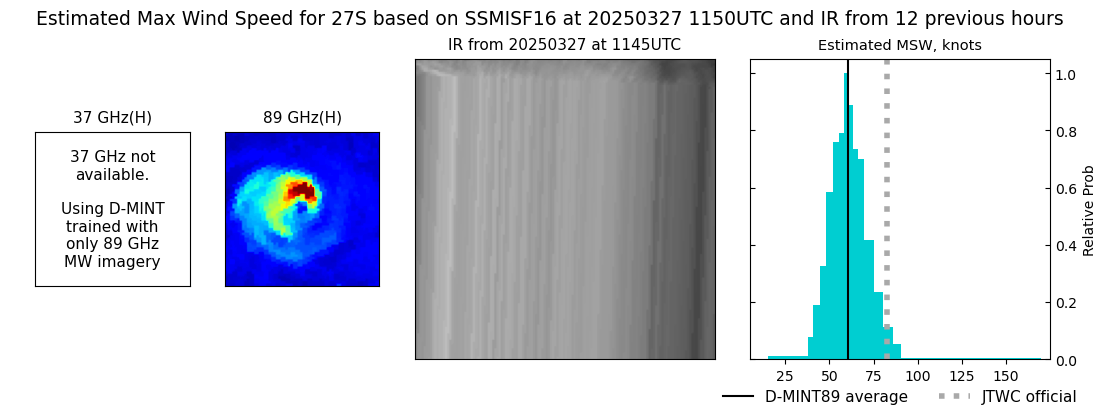 |
| 20250327 | 0710 UTC | ATMS-N20 | 975 hPa | 61 kts | 55 kts | 67 kts | 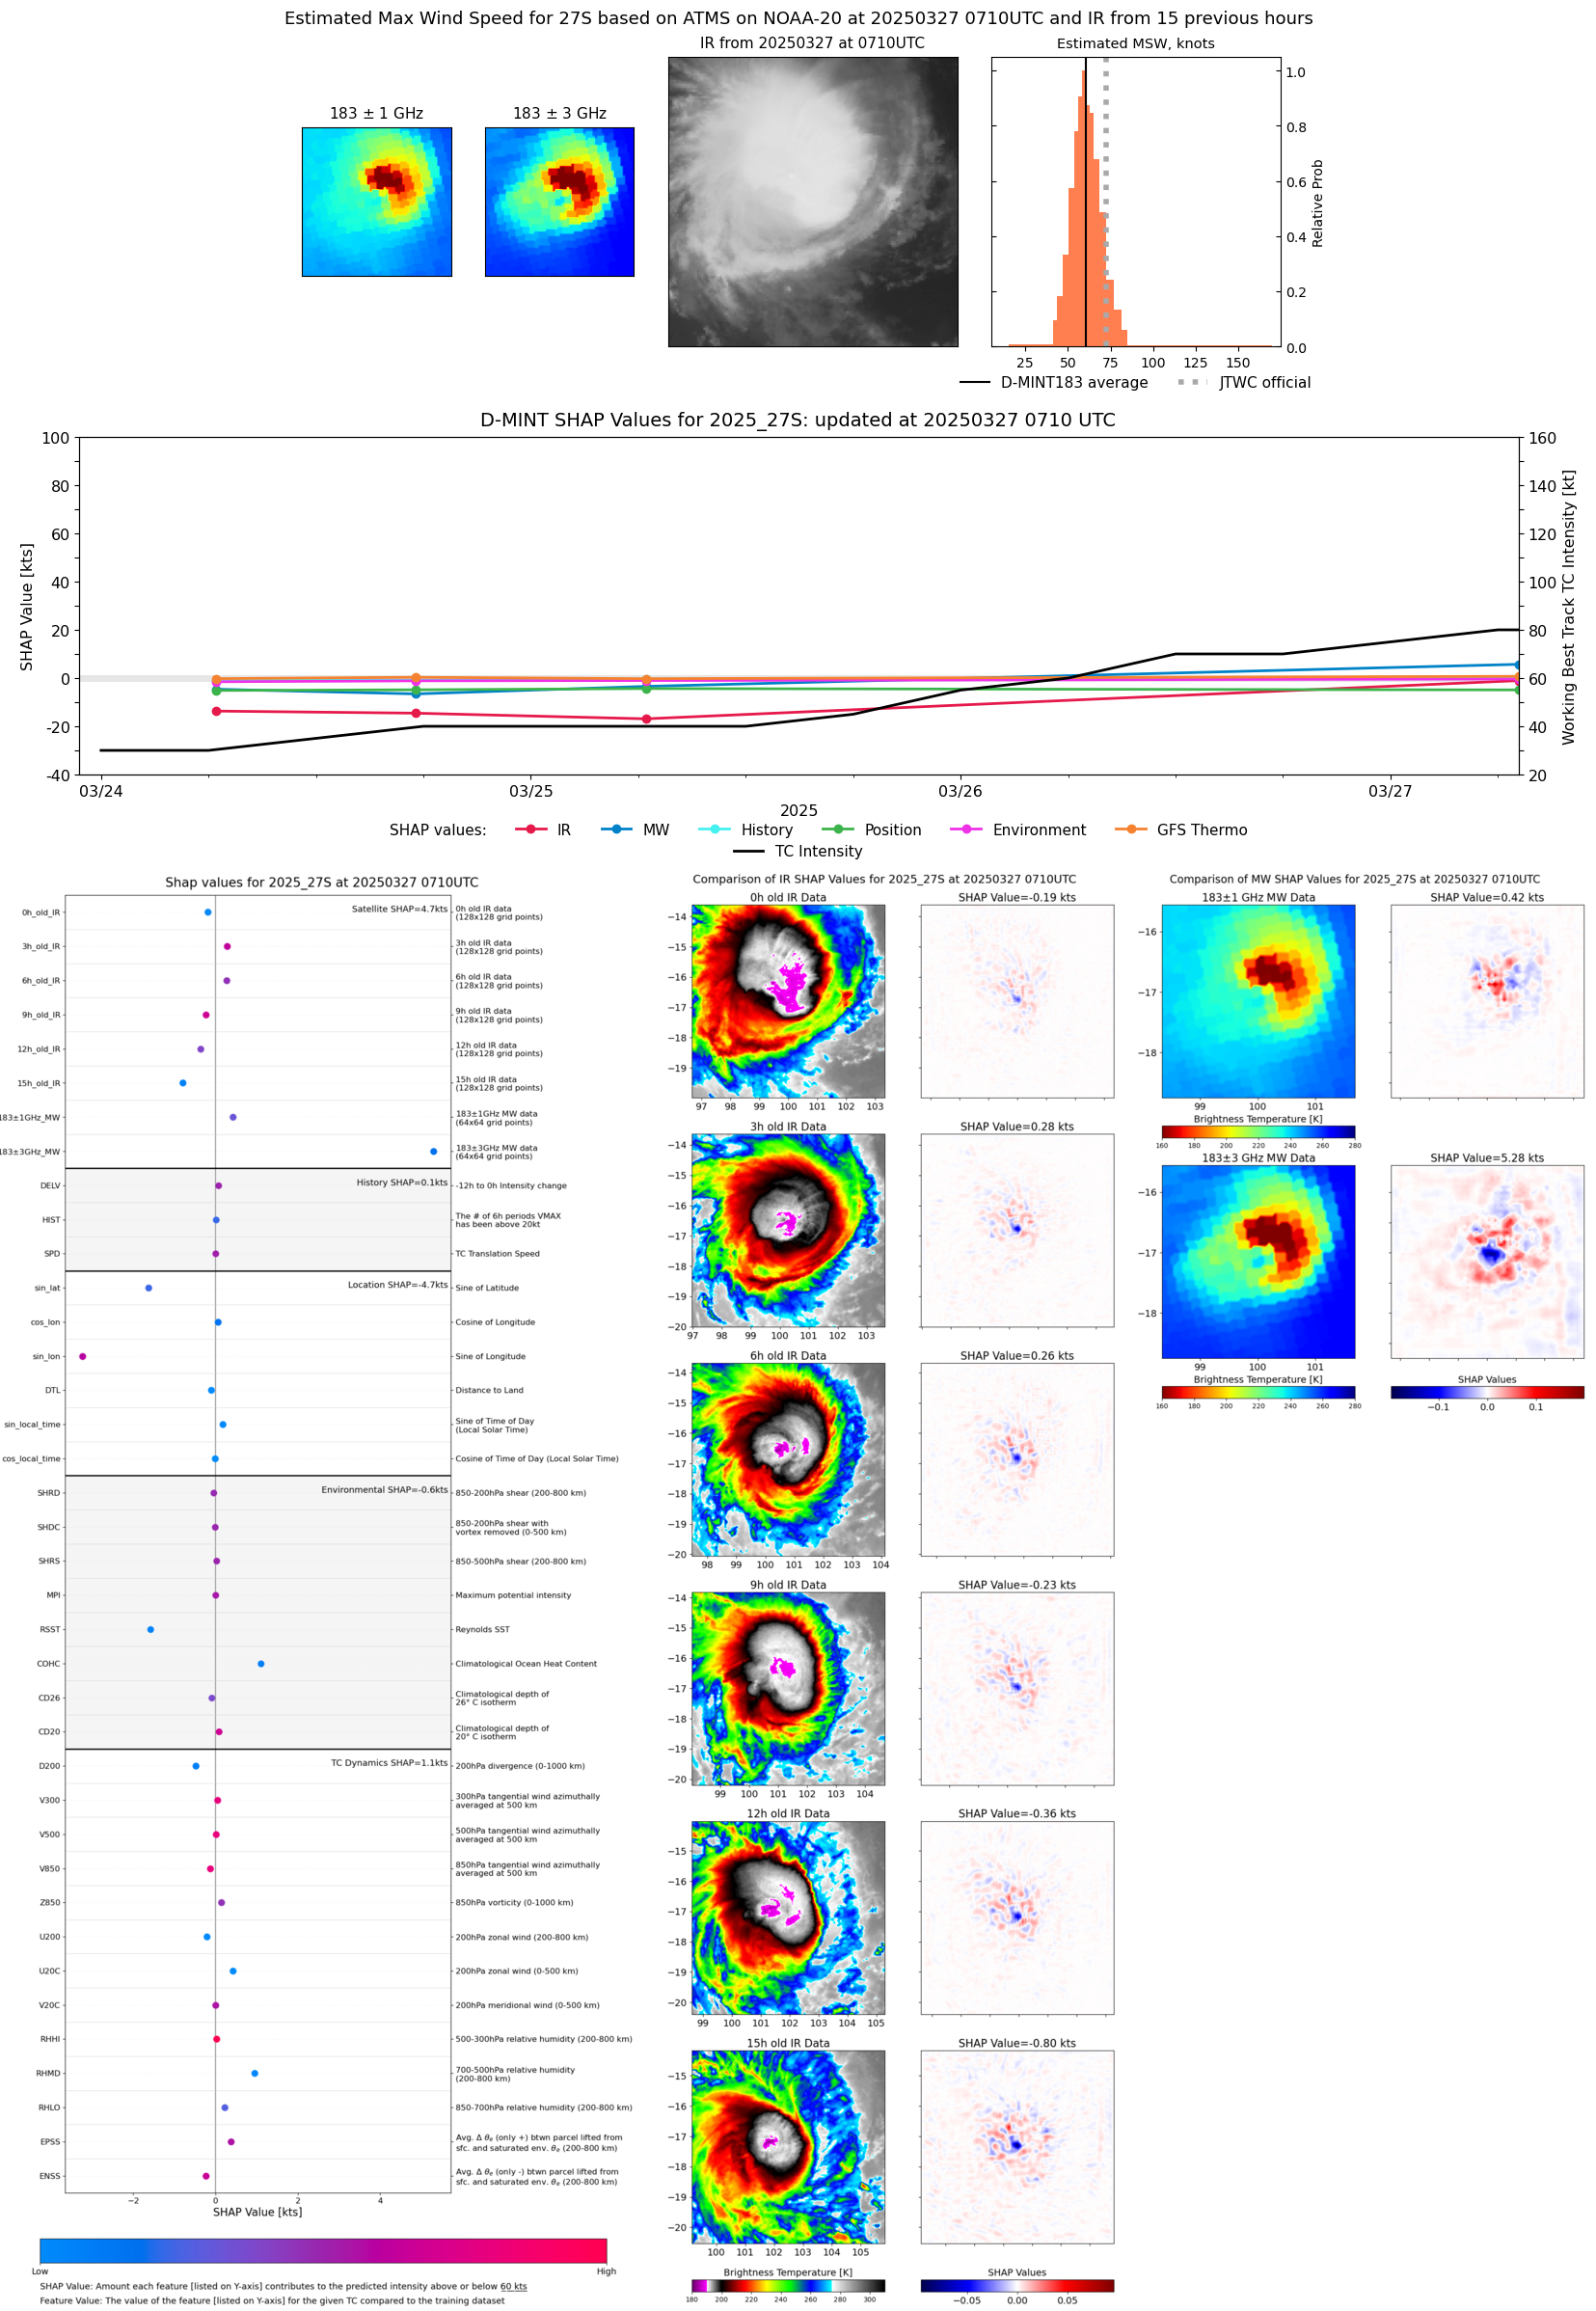 |
| 20250326 | 2316 UTC | SSMISF16 | 975 hPa | 60 kts | 53 kts | 67 kts | 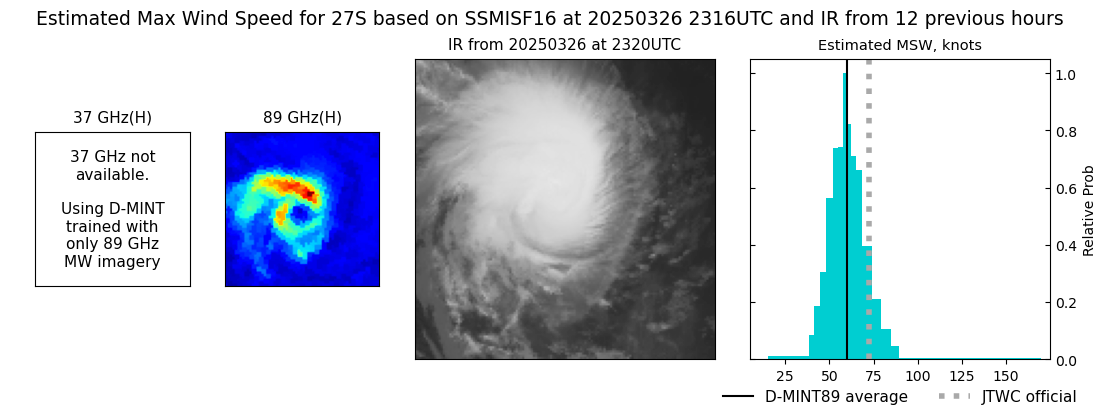 |
| 20250326 | 1742 UTC | TROPICS03 | 981 hPa | 60 kts | 52 kts | 68 kts | 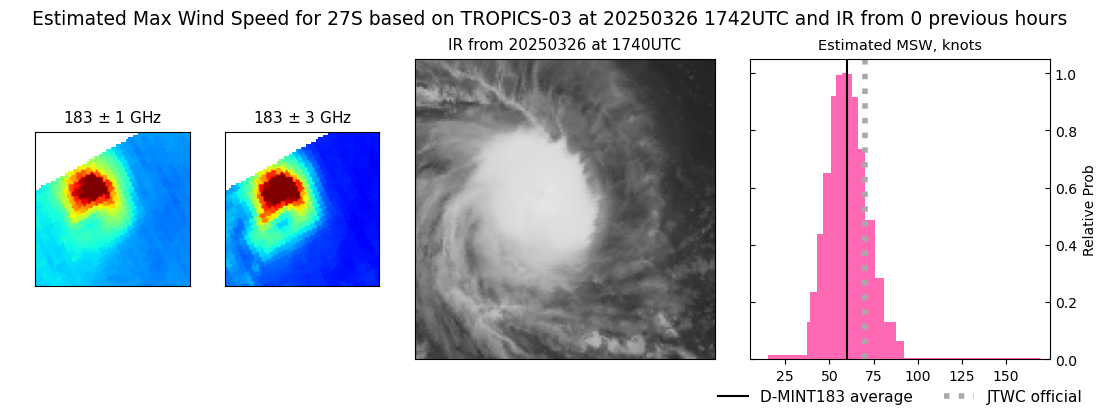 |
| 20250326 | 1204 UTC | SSMISF16 | 976 hPa | 56 kts | 49 kts | 64 kts | 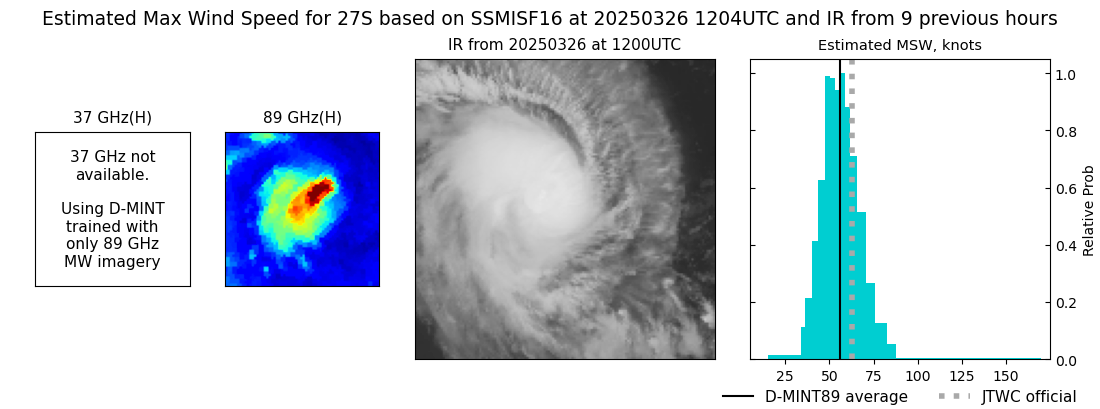 |
| 20250326 | 1104 UTC | SSMISF17 | 977 hPa | 65 kts | 59 kts | 72 kts | 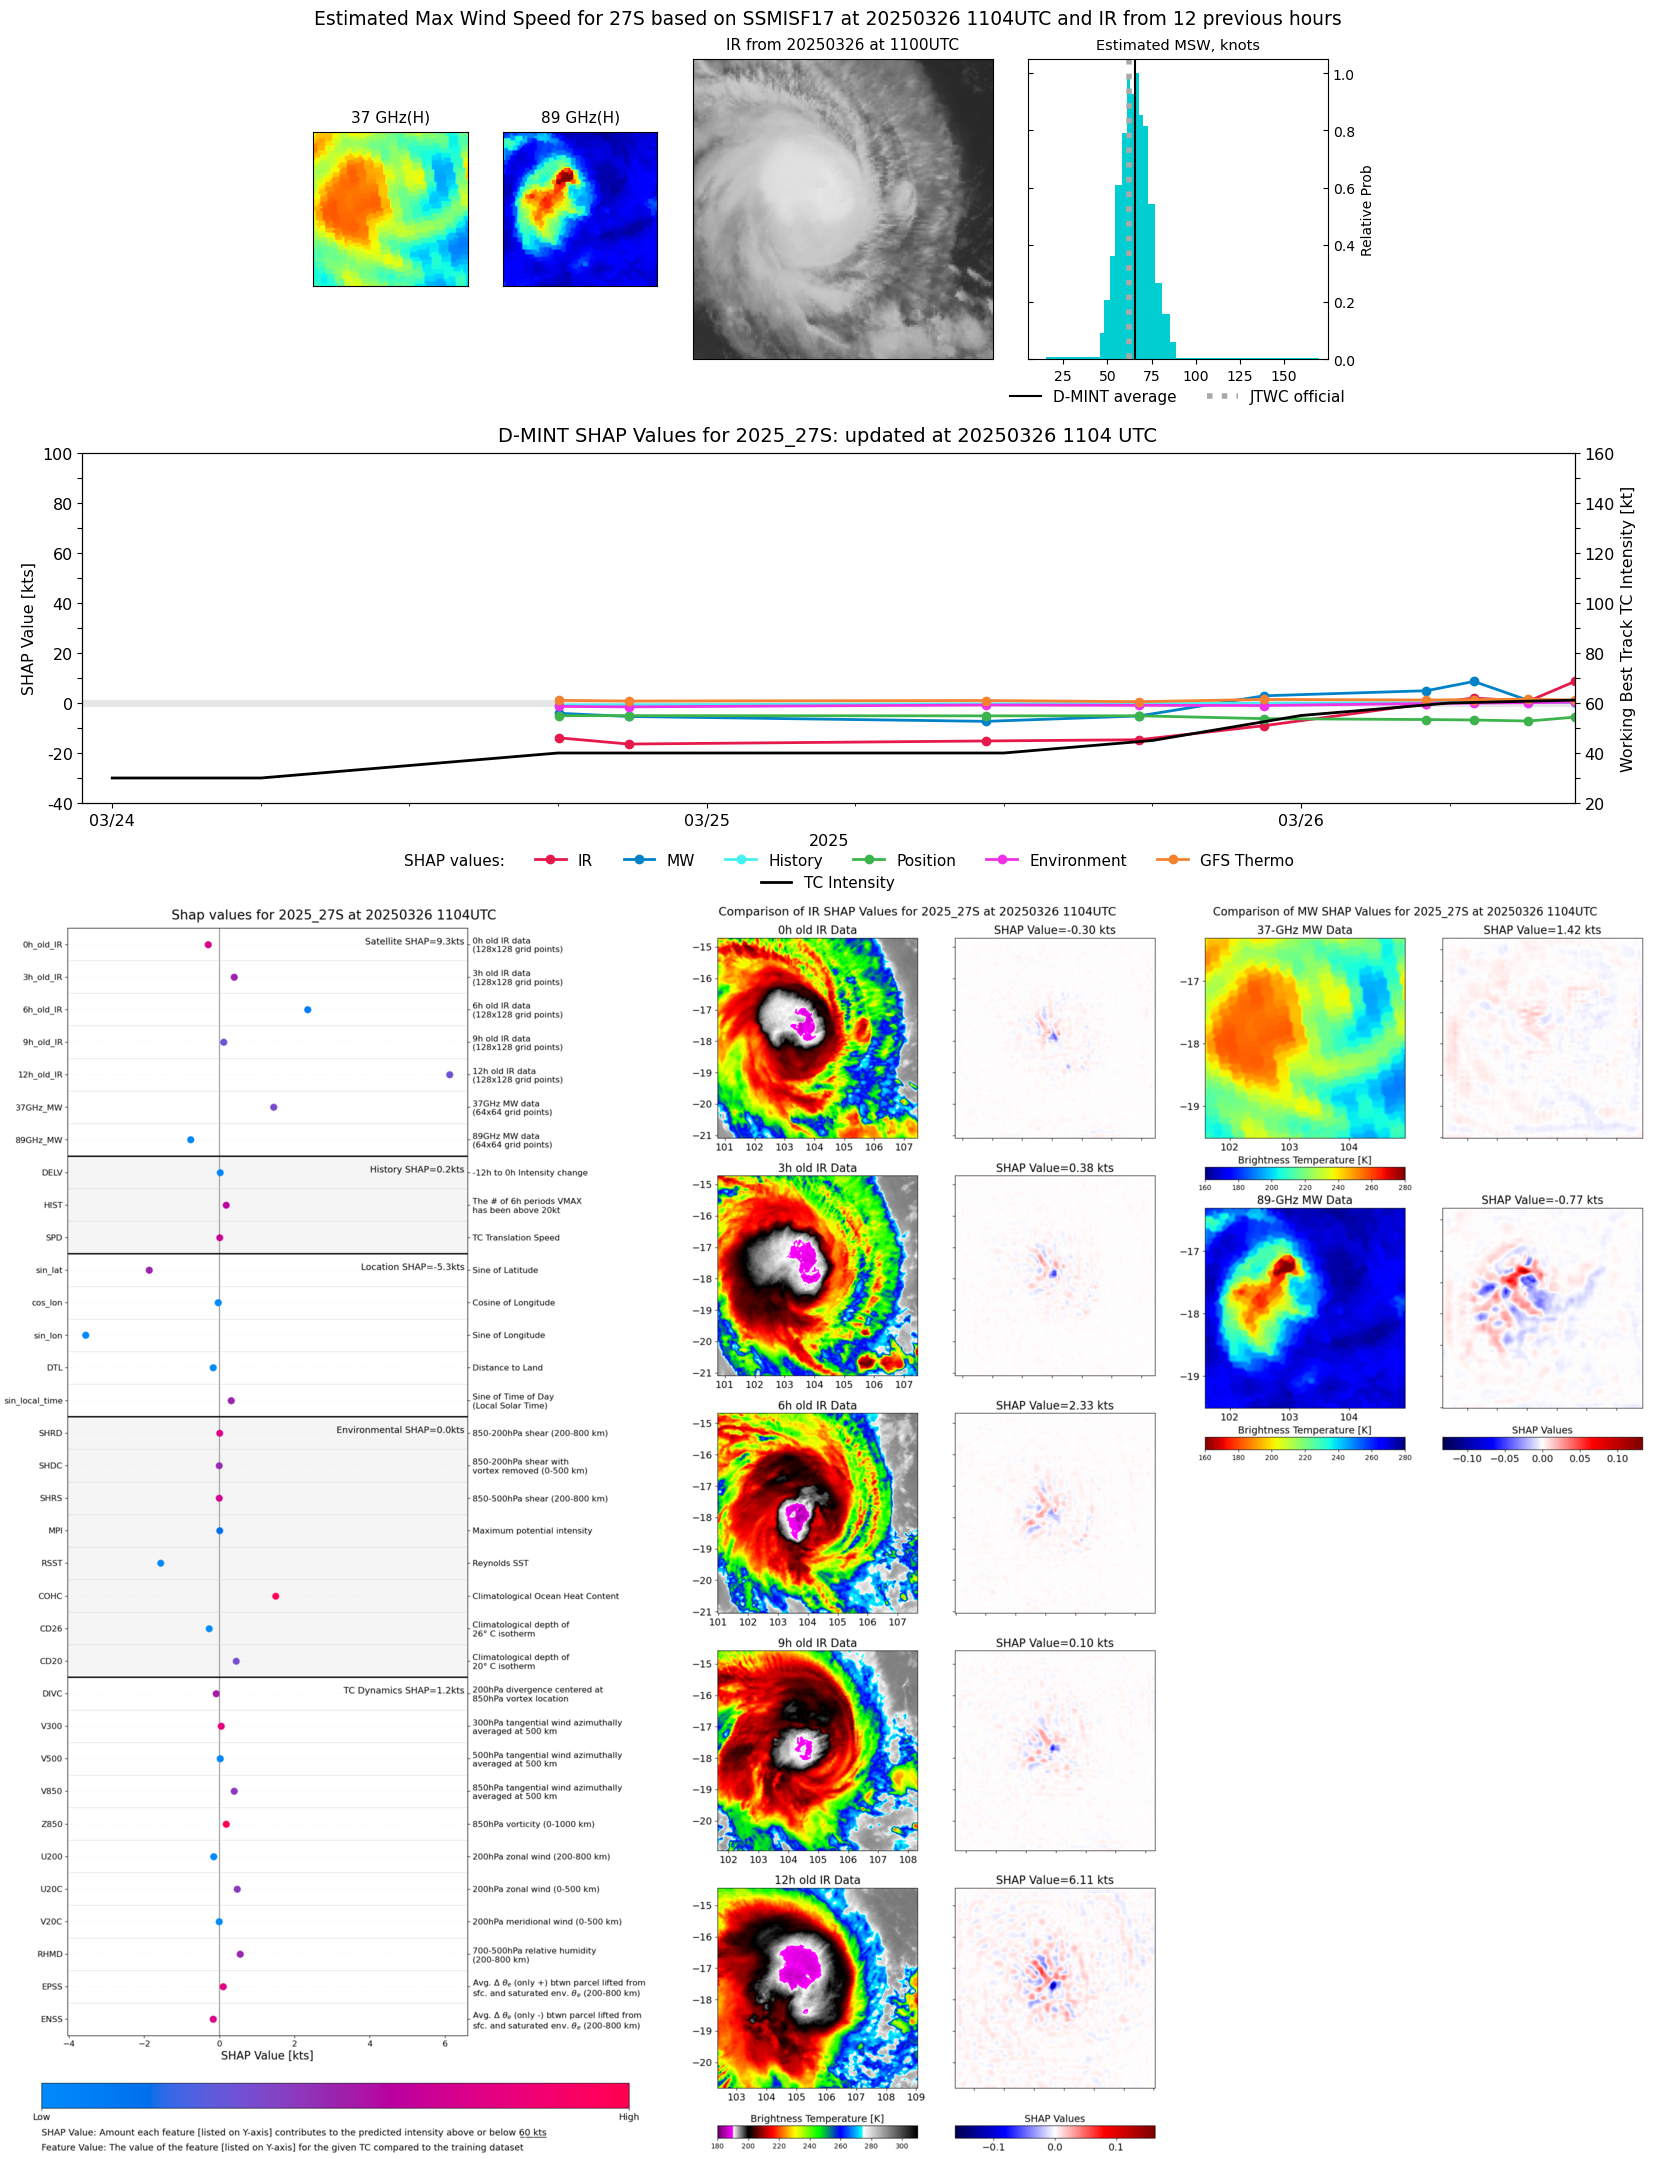 |
| 20250326 | 0911 UTC | SSMISF18 | 979 hPa | 57 kts | 50 kts | 63 kts | 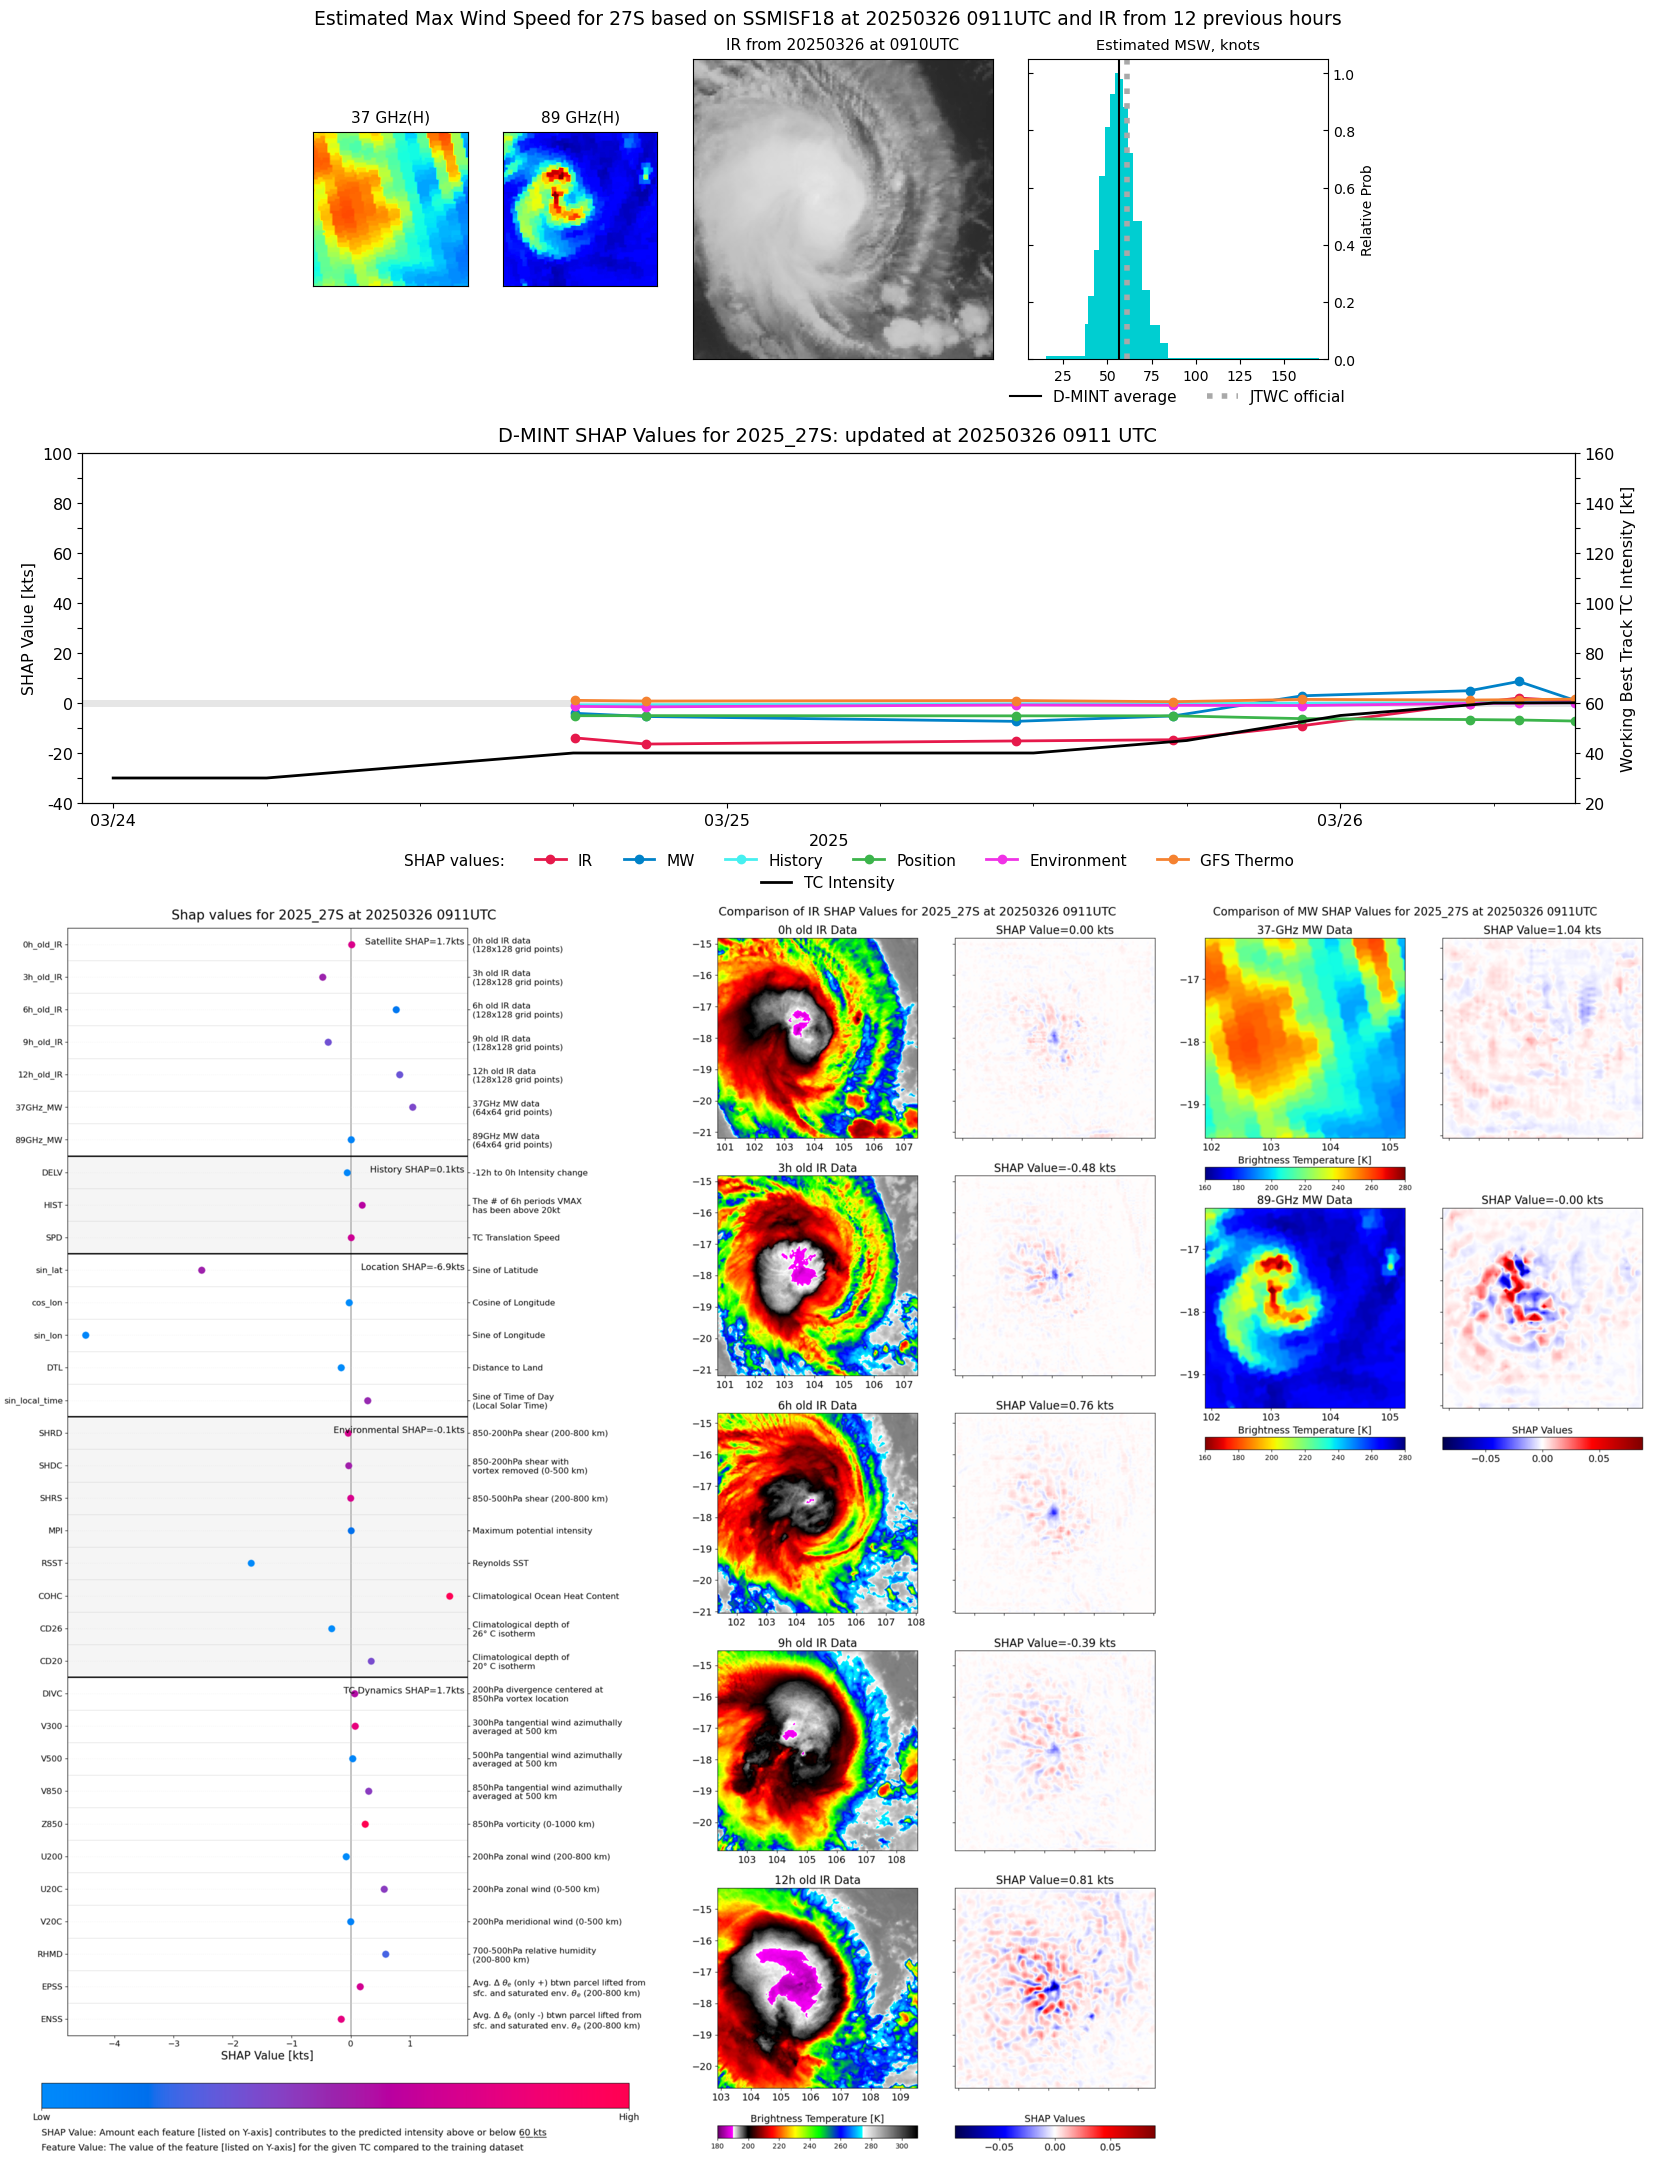 |
| 20250326 | 0659 UTC | AMSR2 | 978 hPa | 65 kts | 59 kts | 71 kts | 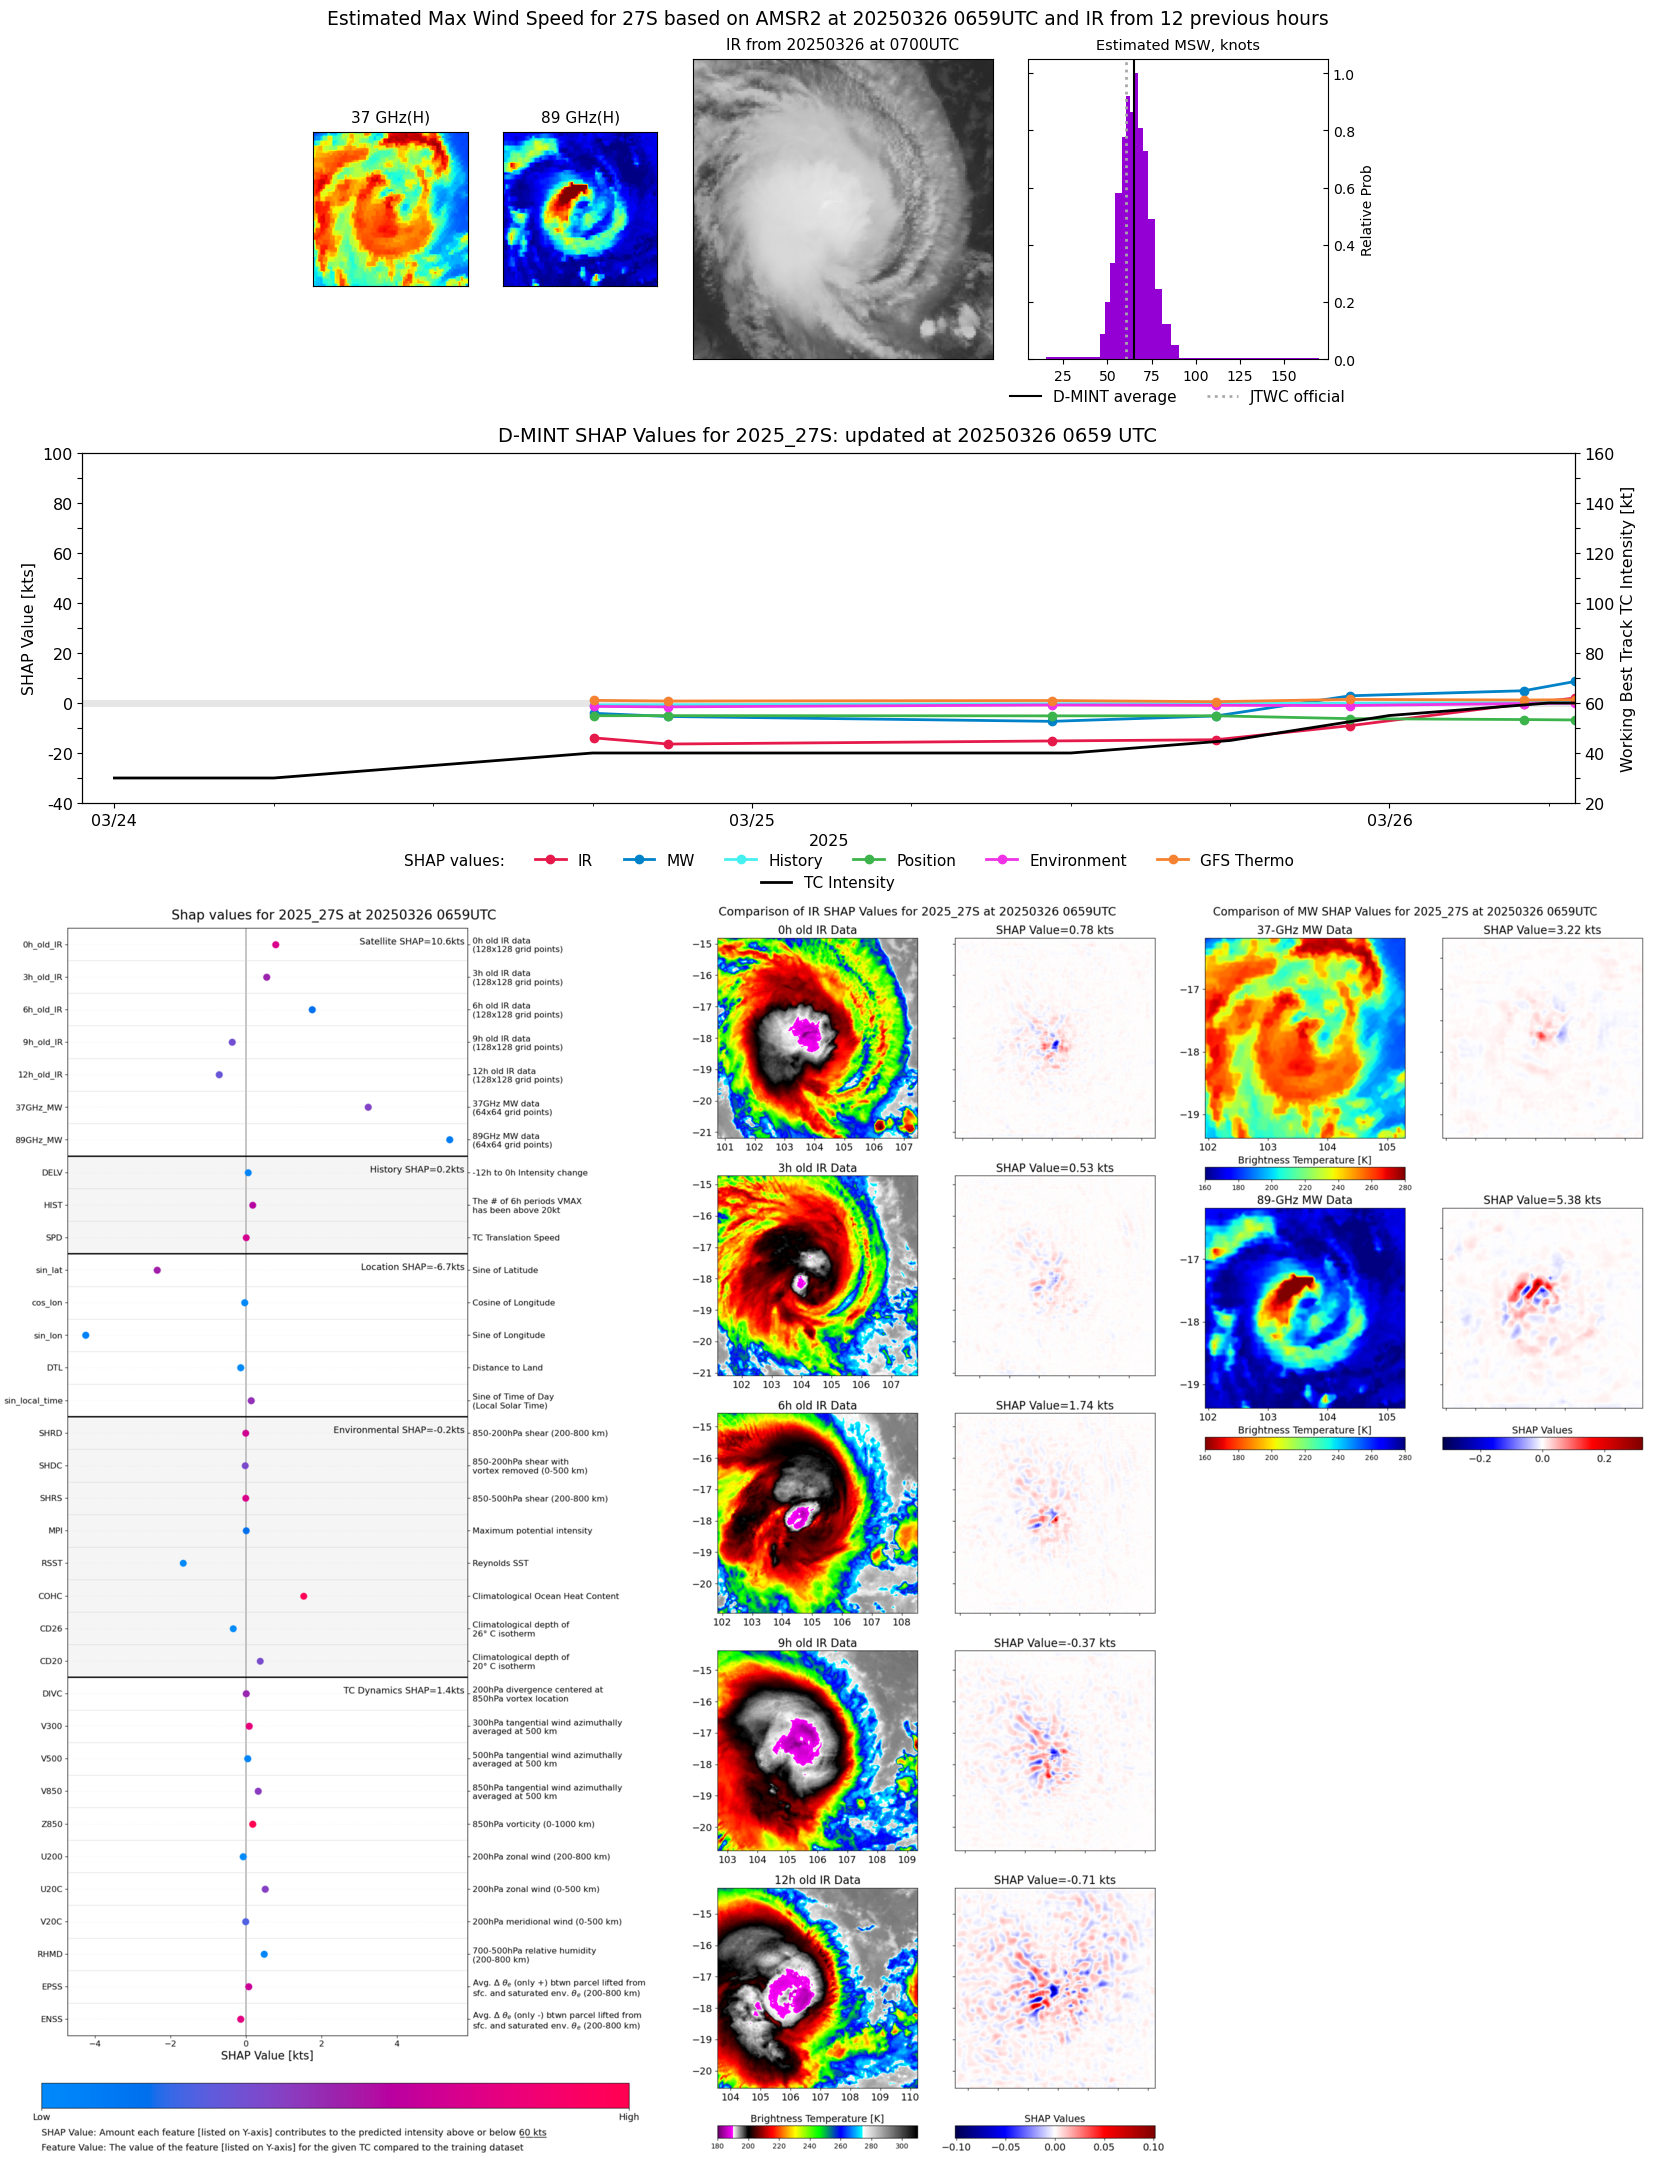 |
| 20250326 | 0504 UTC | GMI | 983 hPa | 59 kts | 53 kts | 65 kts |  |
| 20250326 | 0458 UTC | GMI | 983 hPa | 59 kts | 53 kts | 65 kts |  |
| 20250325 | 2330 UTC | SSMISF16 | 984 hPa | 44 kts | 39 kts | 49 kts | 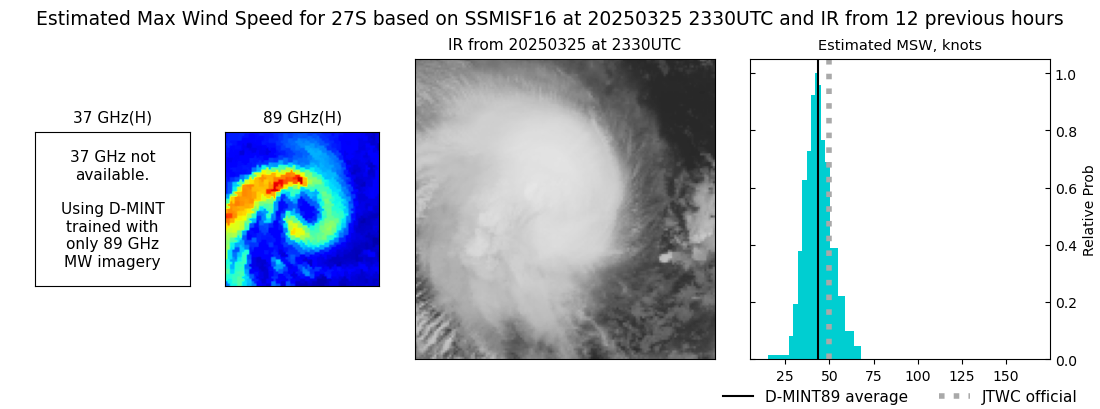 |
| 20250325 | 2231 UTC | SSMISF17 | 987 hPa | 48 kts | 43 kts | 53 kts | 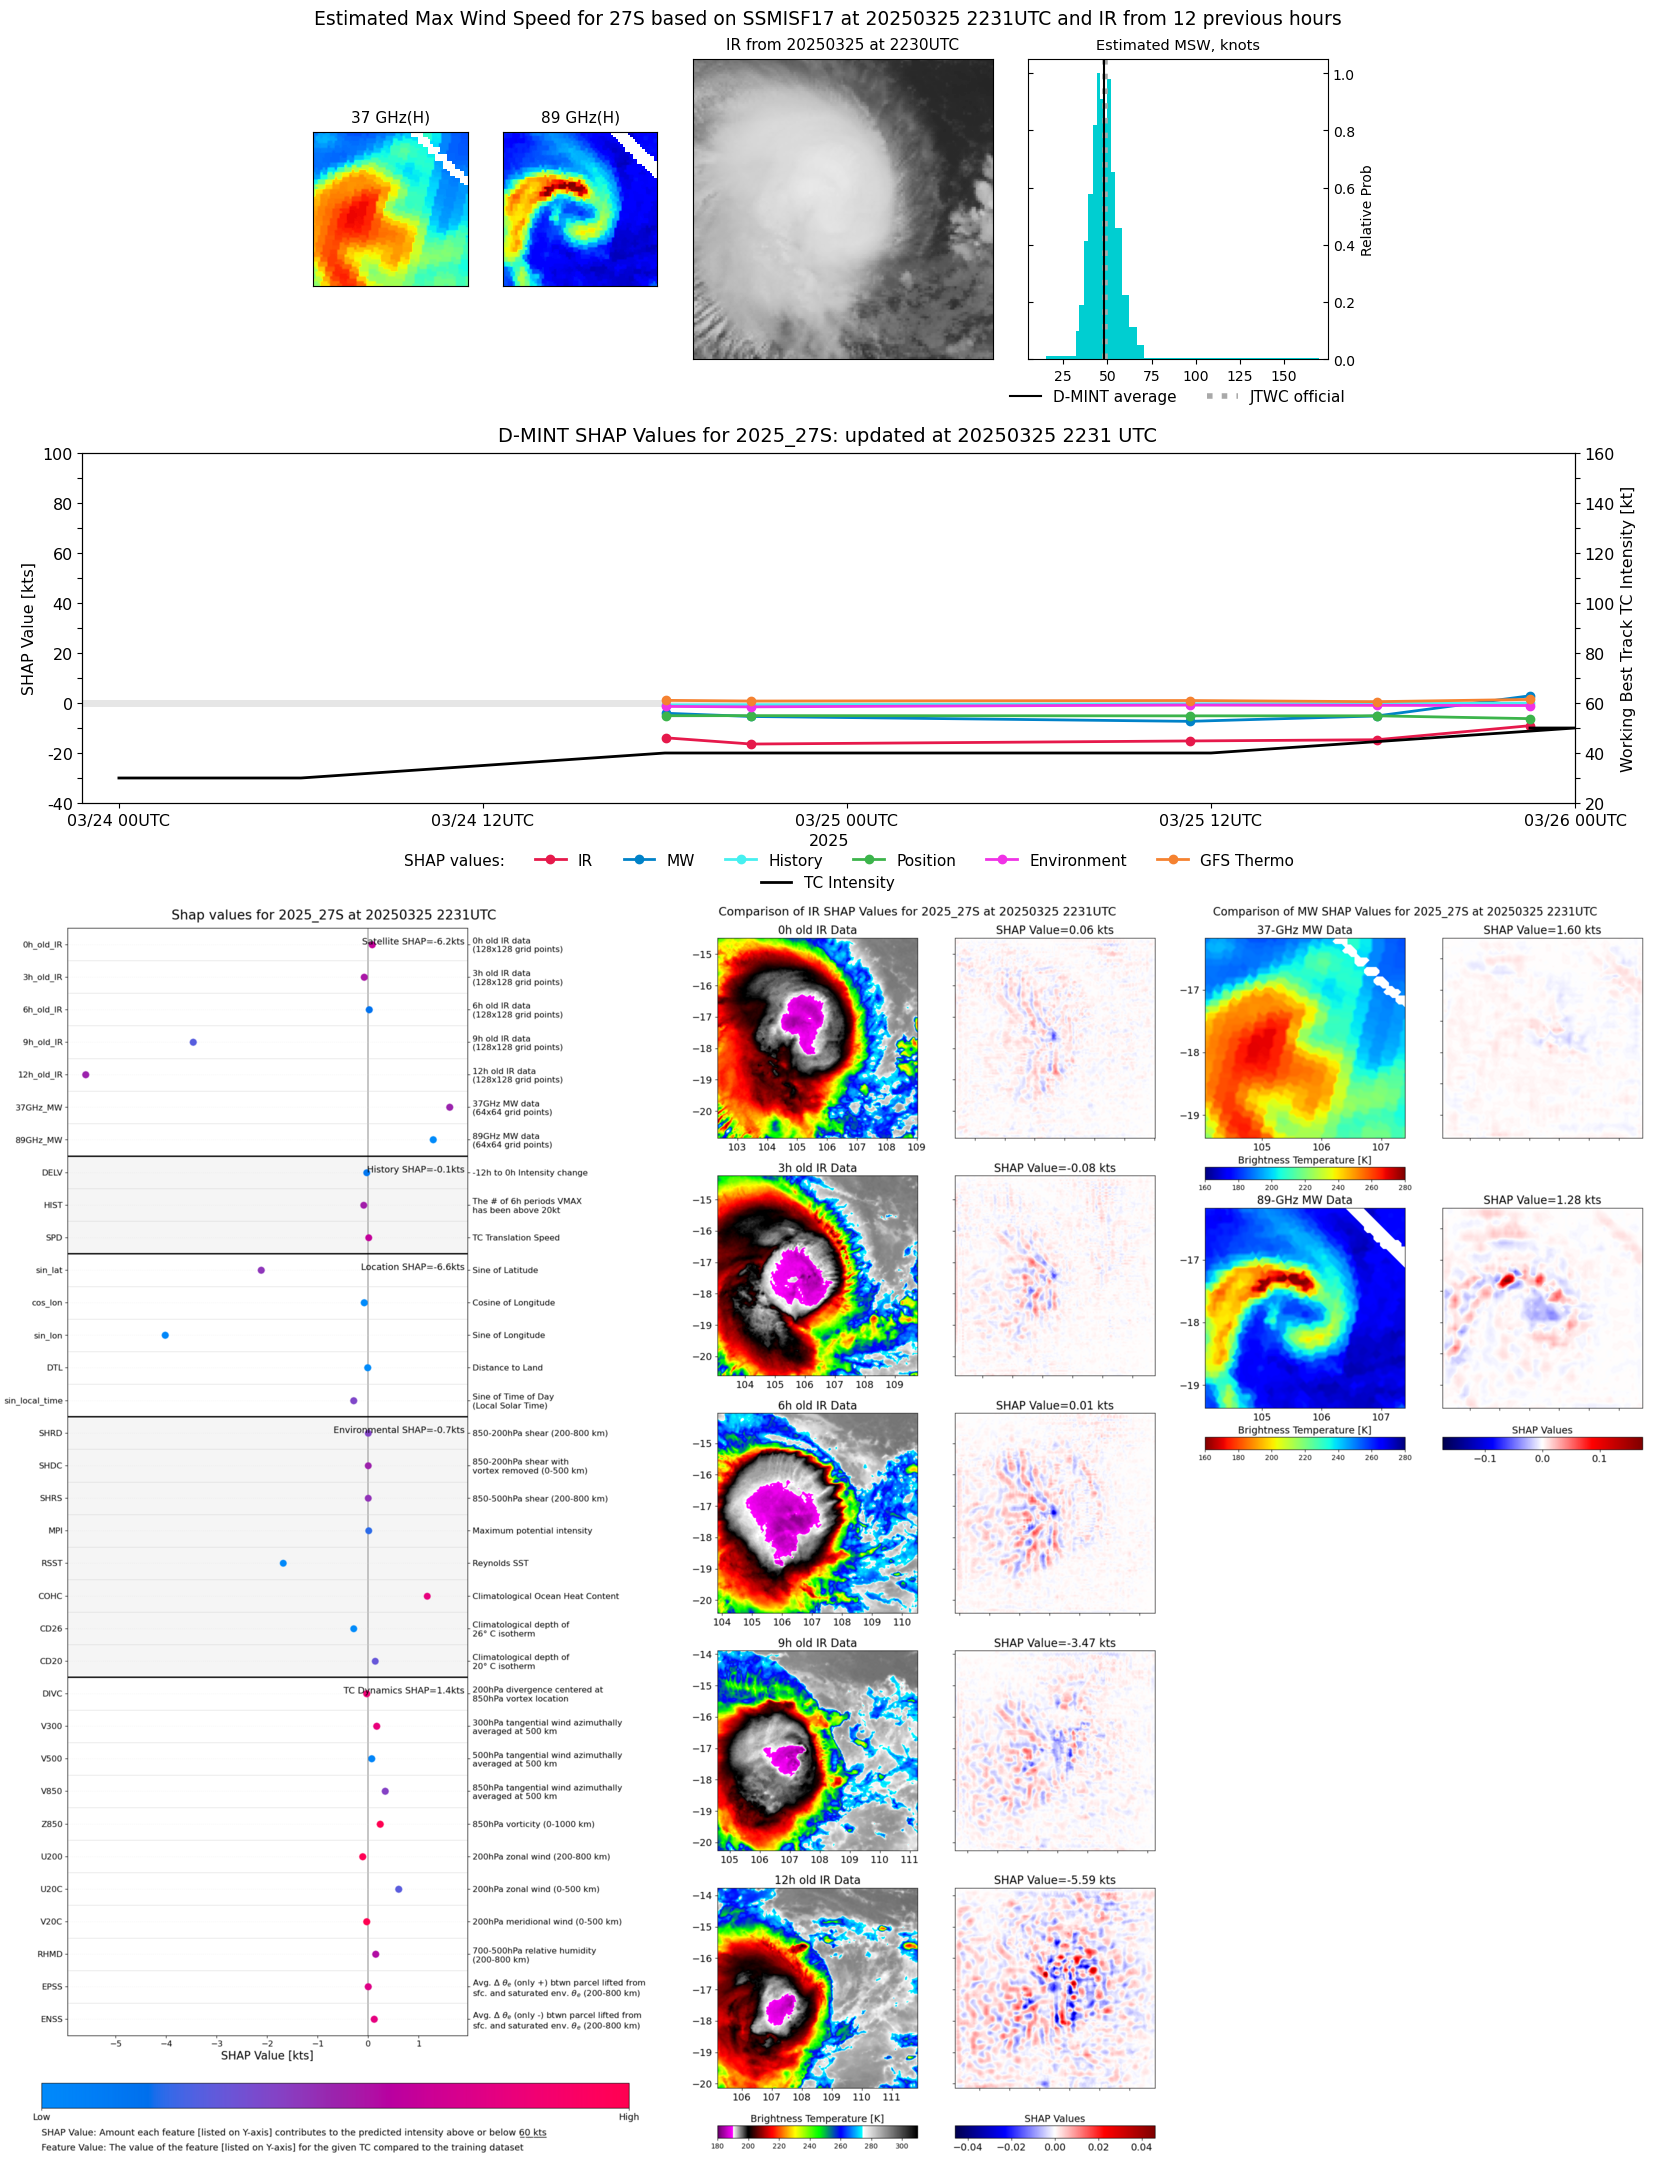 |
| 20250325 | 2037 UTC | SSMISF18 | 989 hPa | 52 kts | 45 kts | 59 kts | 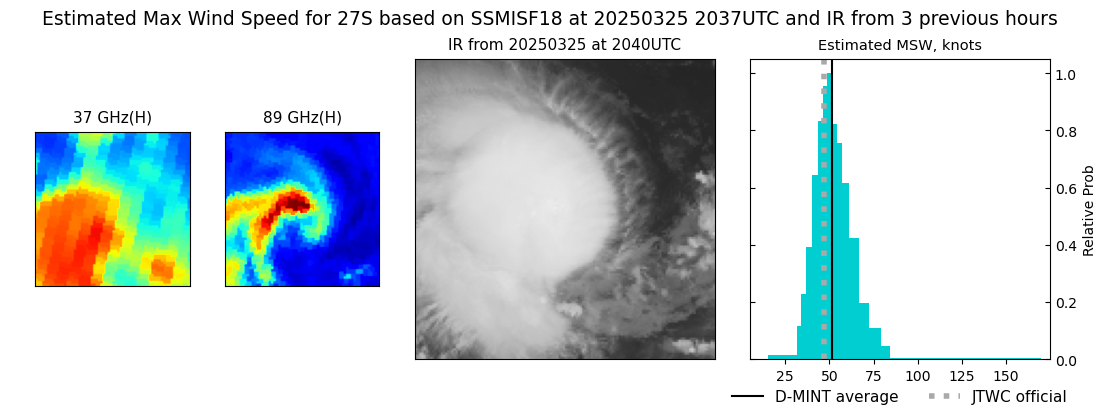 |
| 20250325 | 1742 UTC | ATMS-N20 | 998 hPa | 30 kts | 27 kts | 35 kts | 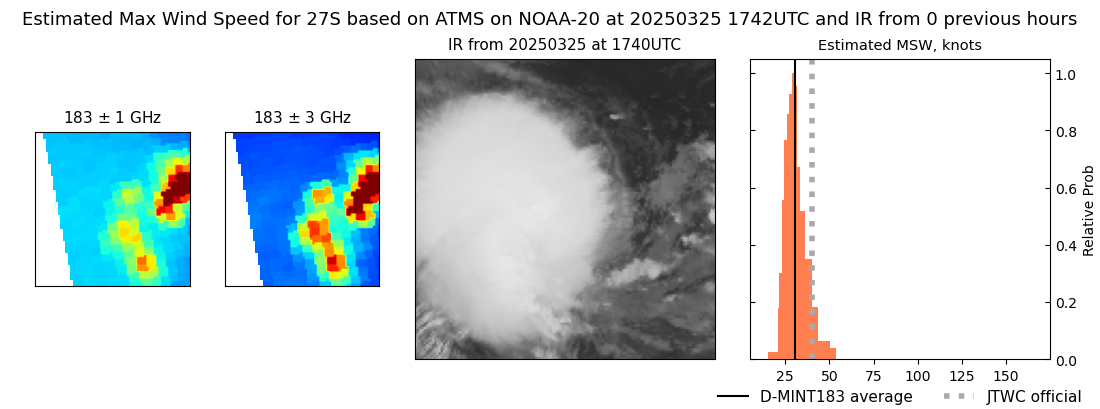 |
| 20250325 | 1728 UTC | GMI | 997 hPa | 35 kts | 31 kts | 38 kts |  |
| 20250325 | 1118 UTC | SSMISF17 | 994 hPa | 32 kts | 29 kts | 36 kts | 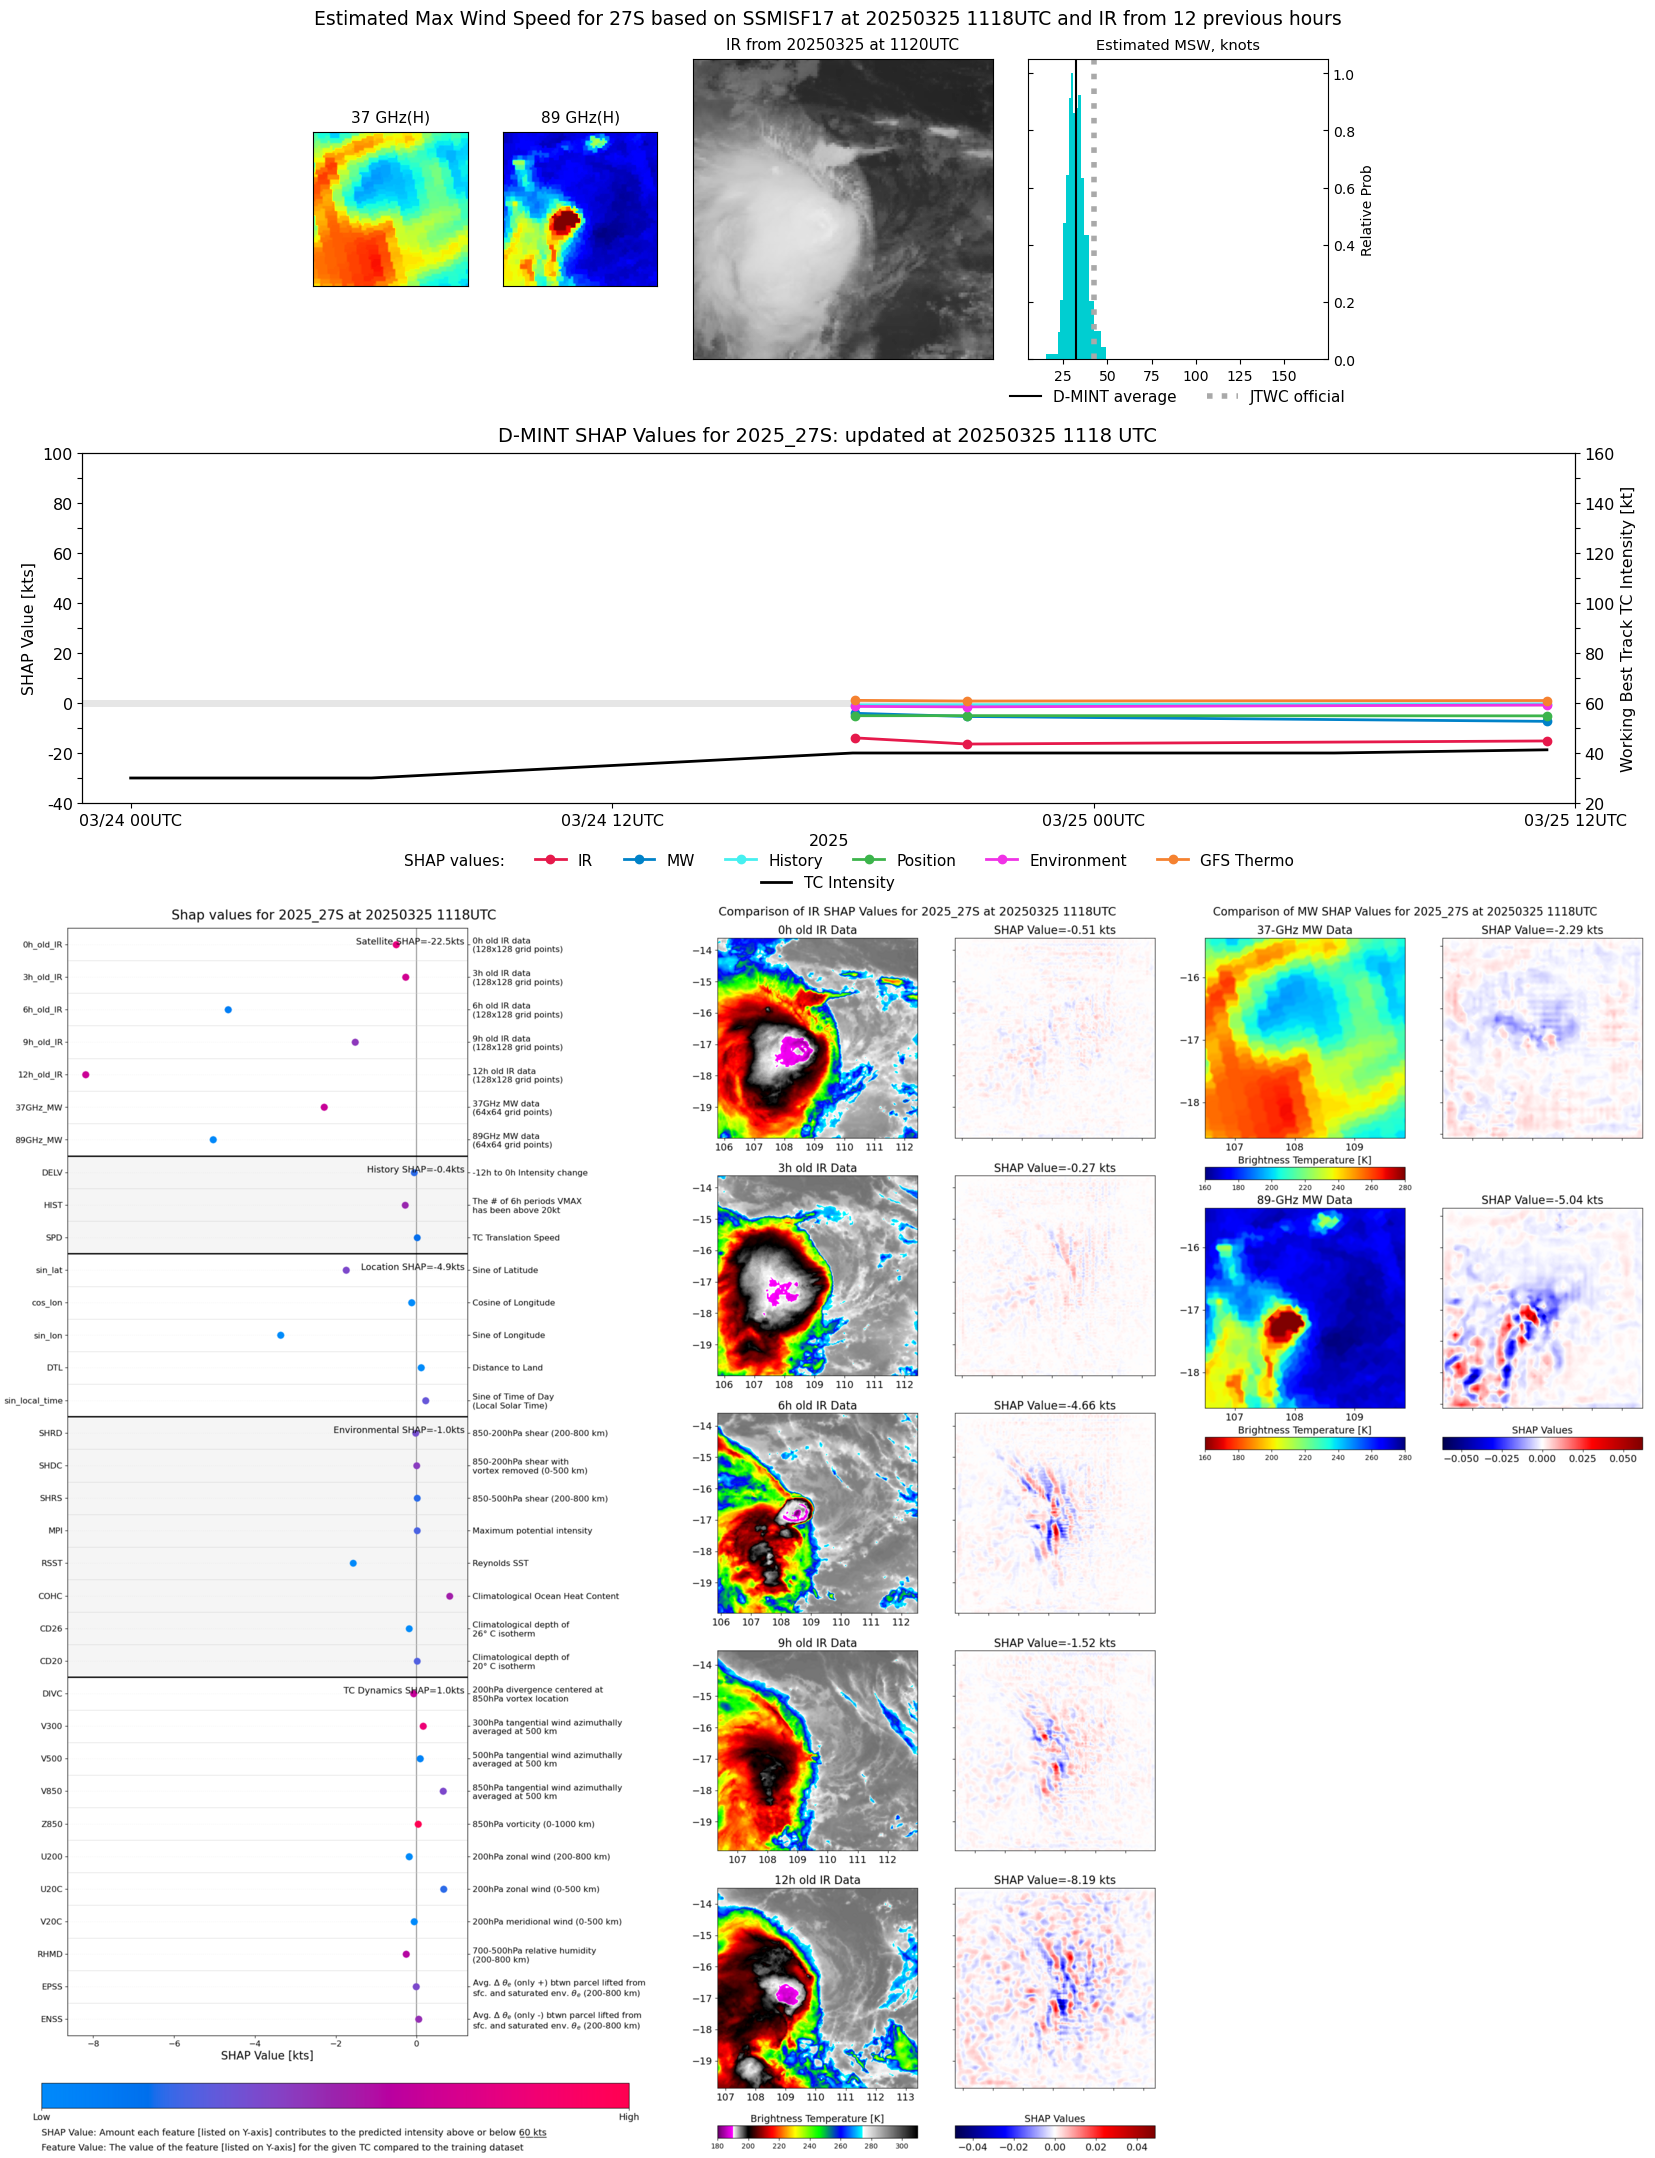 |
| 20250325 | 0625 UTC | TROPICS05 | 995 hPa | 34 kts | 30 kts | 37 kts | 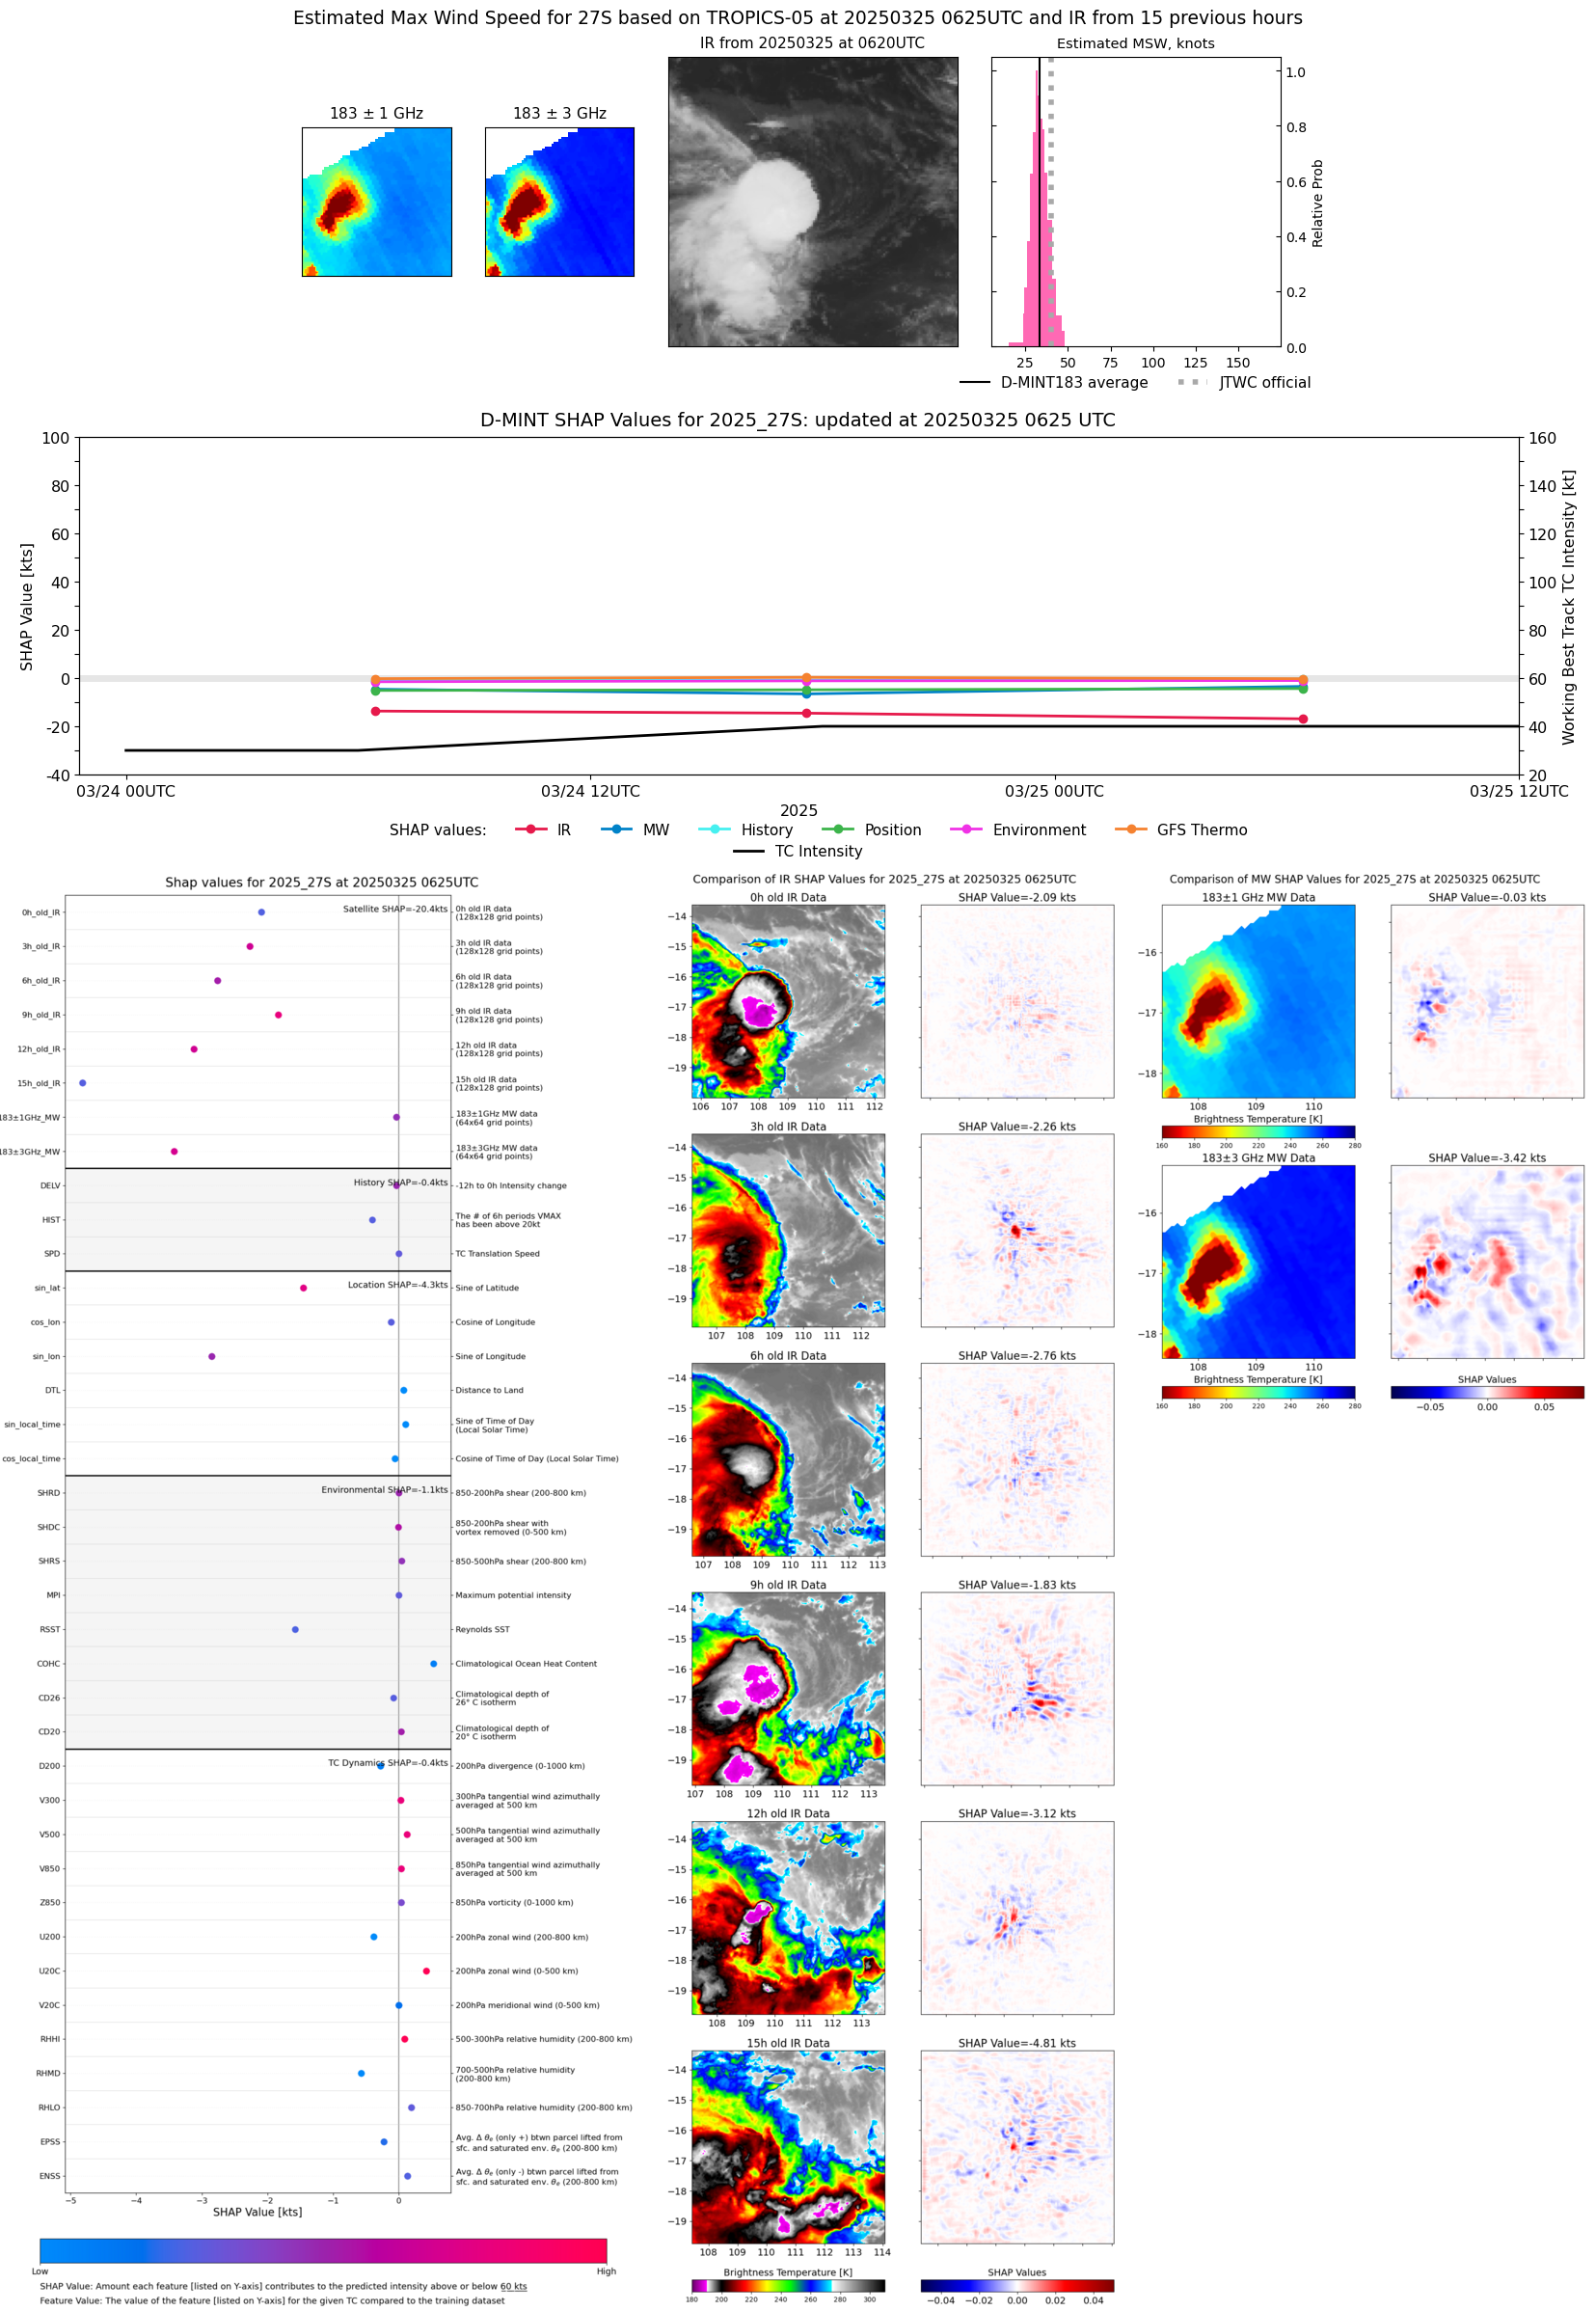 |
| 20250325 | 0616 UTC | AMSR2 | 995 hPa | 35 kts | 31 kts | 38 kts | 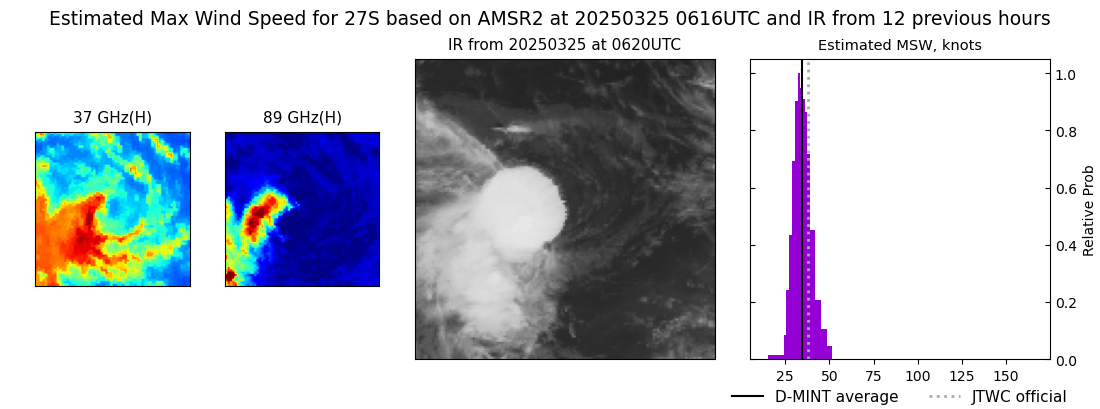 |
| 20250324 | 2243 UTC | SSMISF17 | 997 hPa | 33 kts | 30 kts | 37 kts | 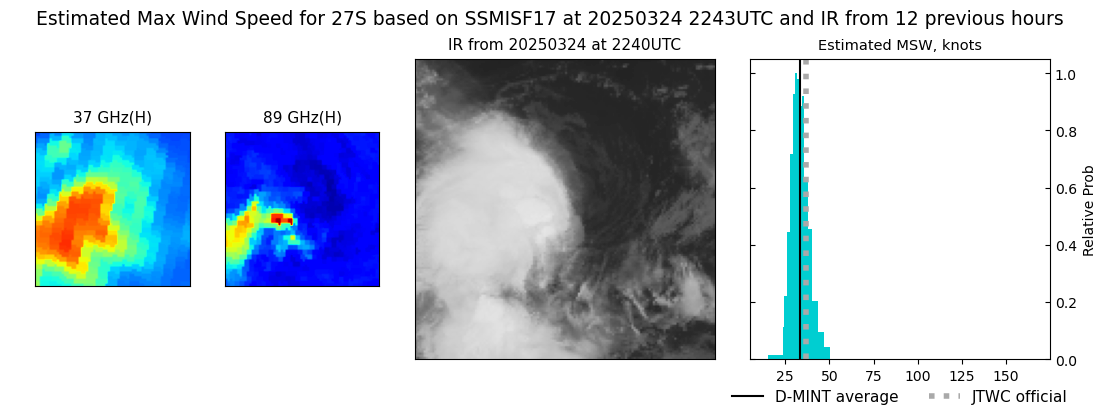 |
| 20250324 | 2051 UTC | SSMISF18 | 997 hPa | 32 kts | 29 kts | 35 kts | 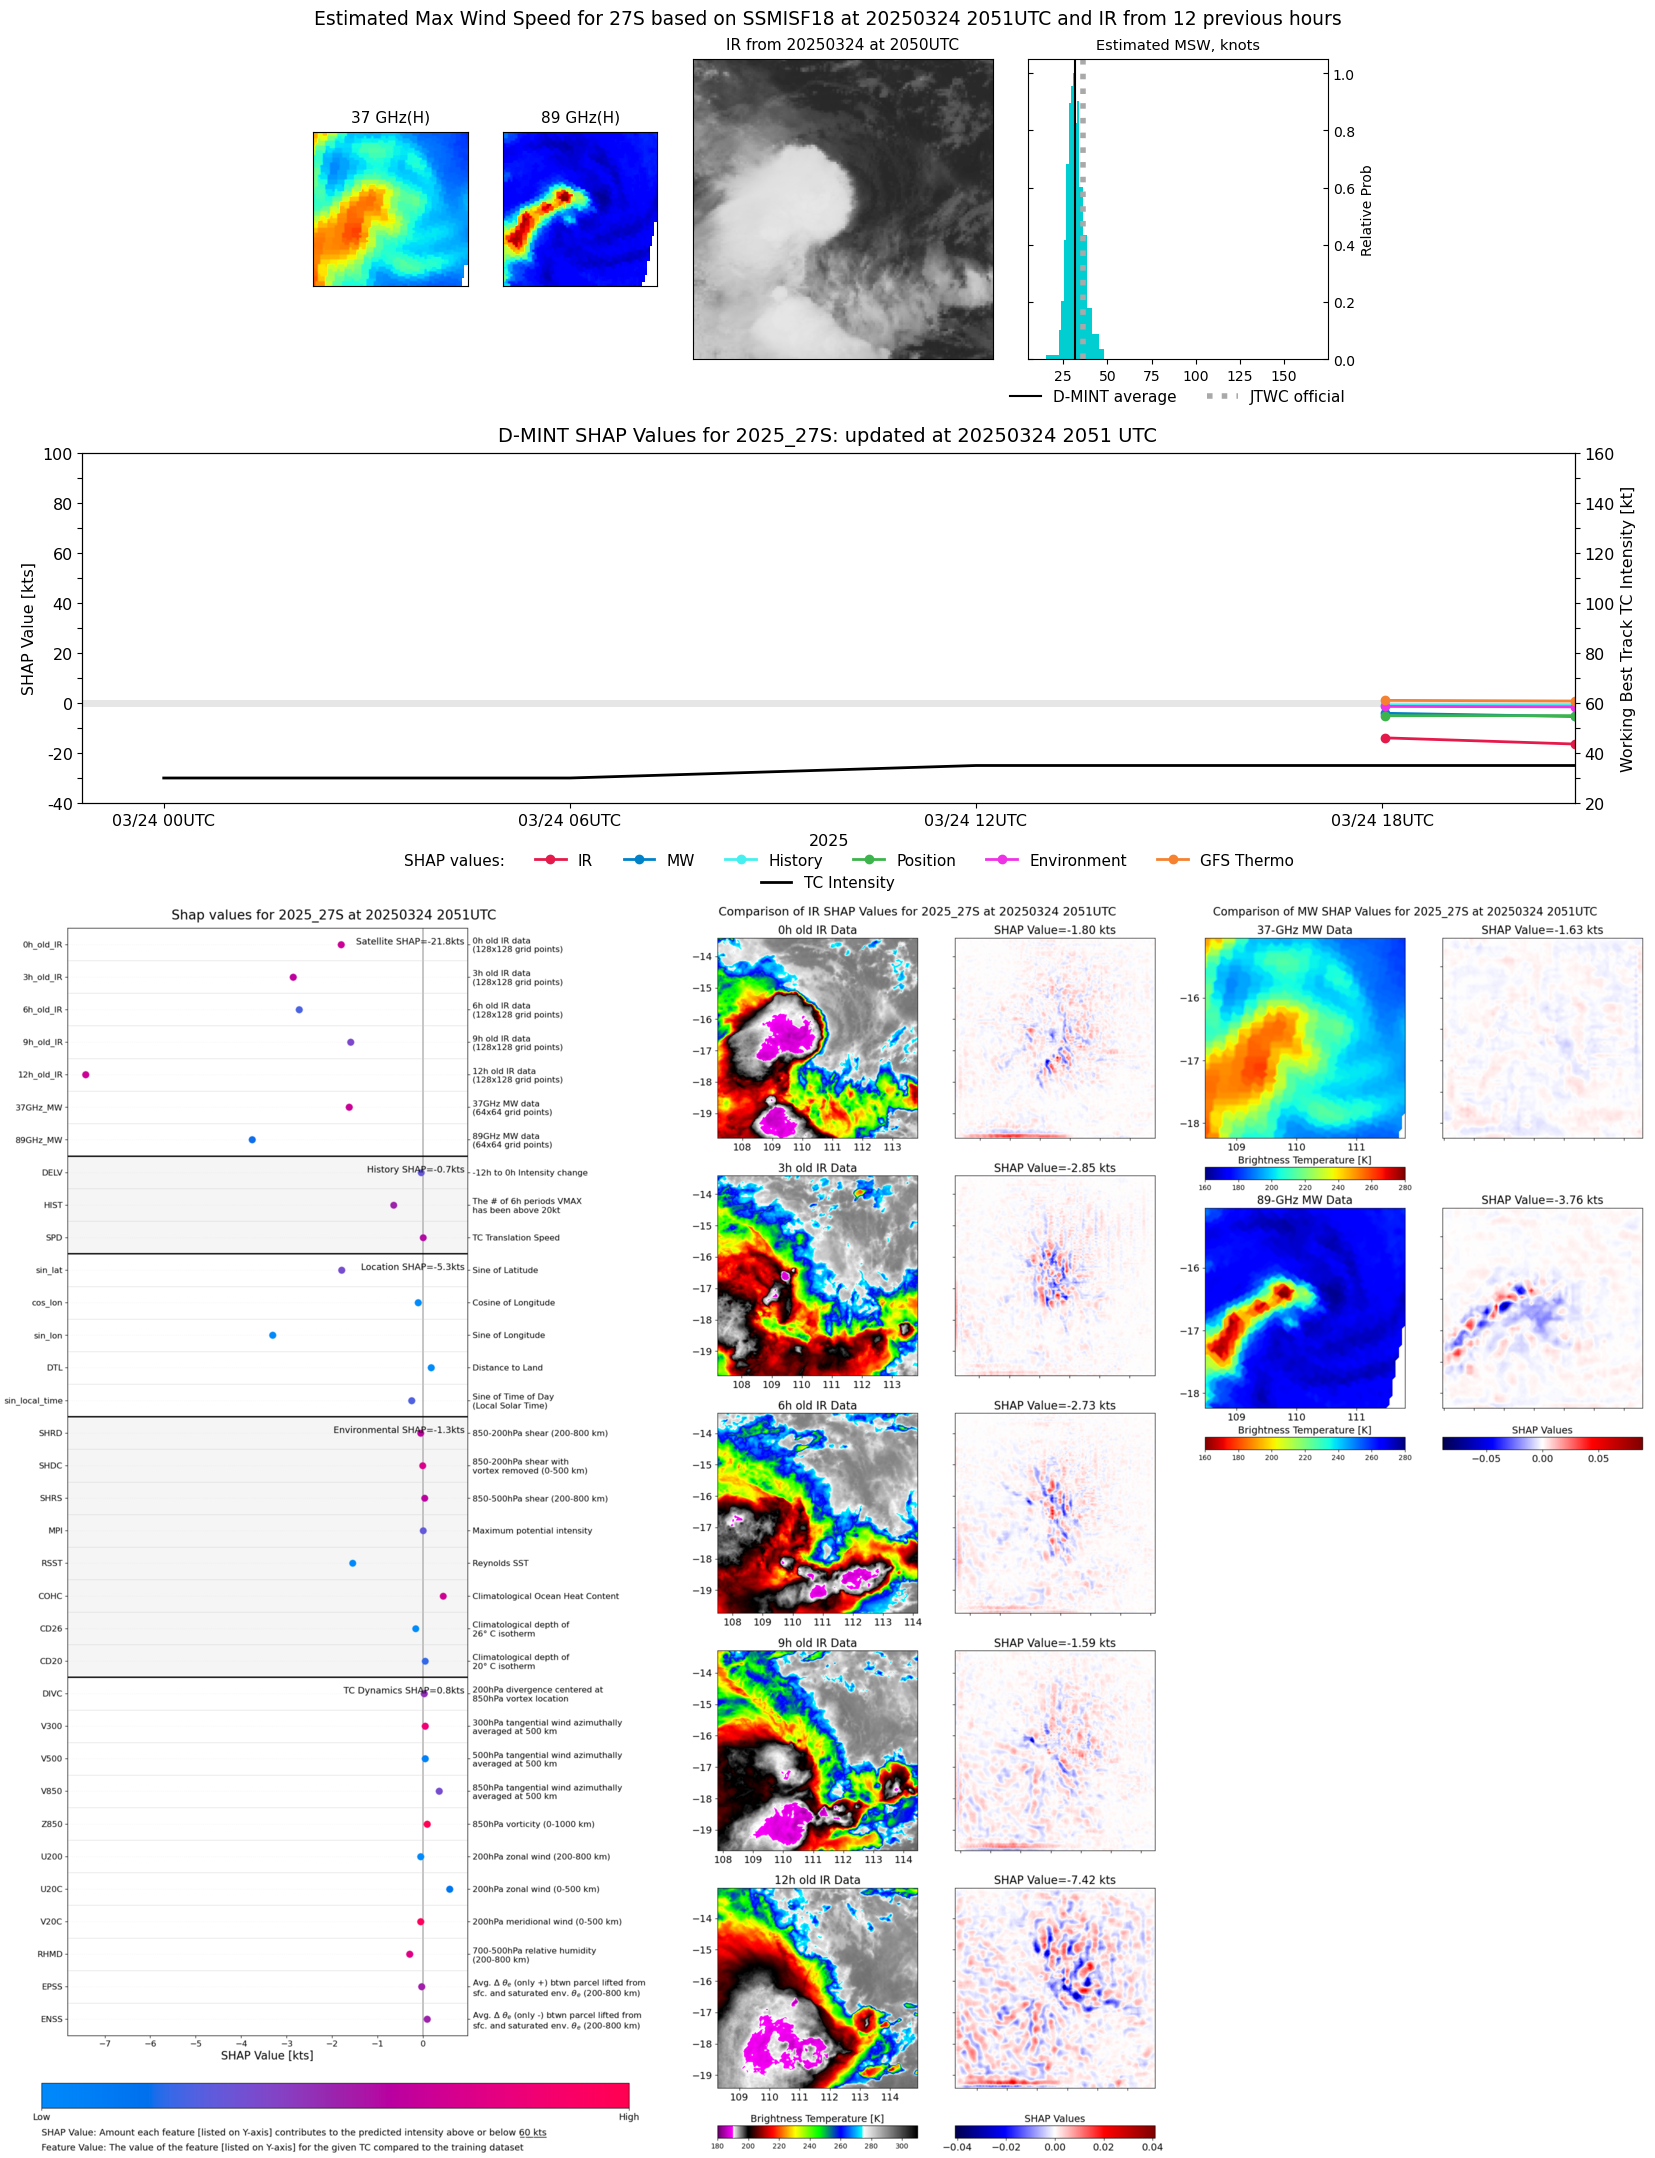 |
| 20250324 | 1803 UTC | AMSR2 | 995 hPa | 36 kts | 32 kts | 40 kts | 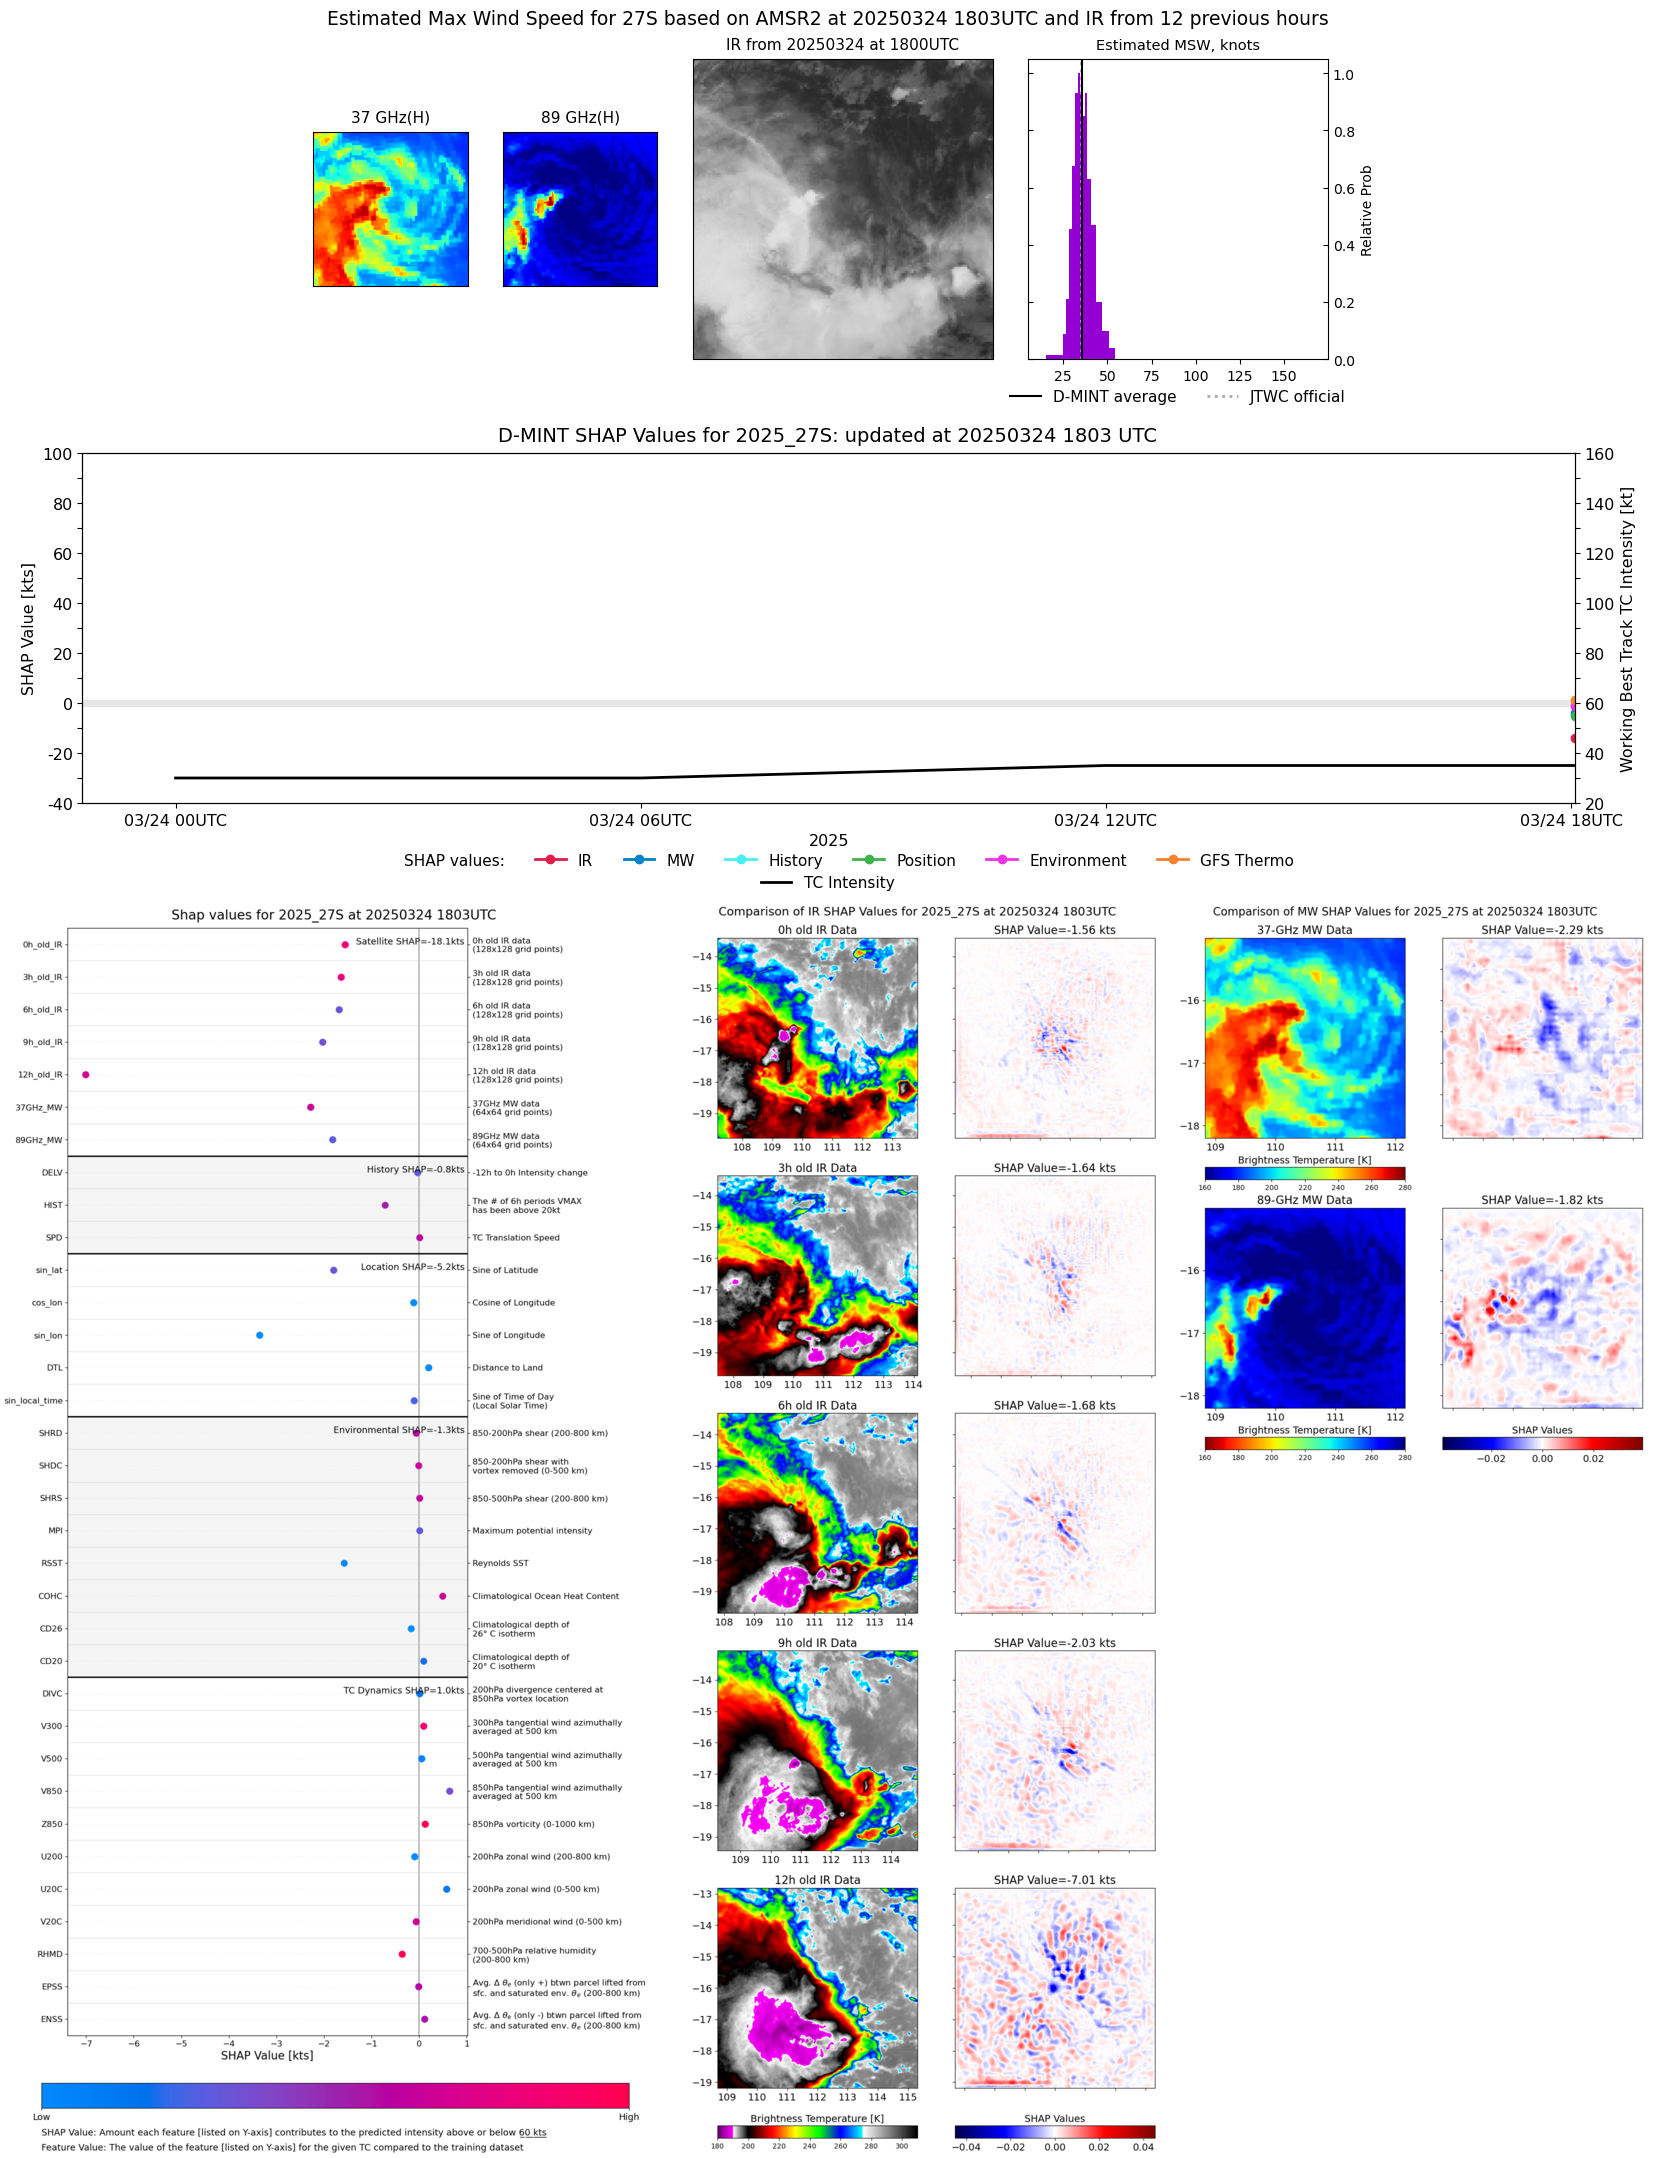 |
| 20250324 | 1735 UTC | ATMS-N20 | 996 hPa | 32 kts | 29 kts | 36 kts | 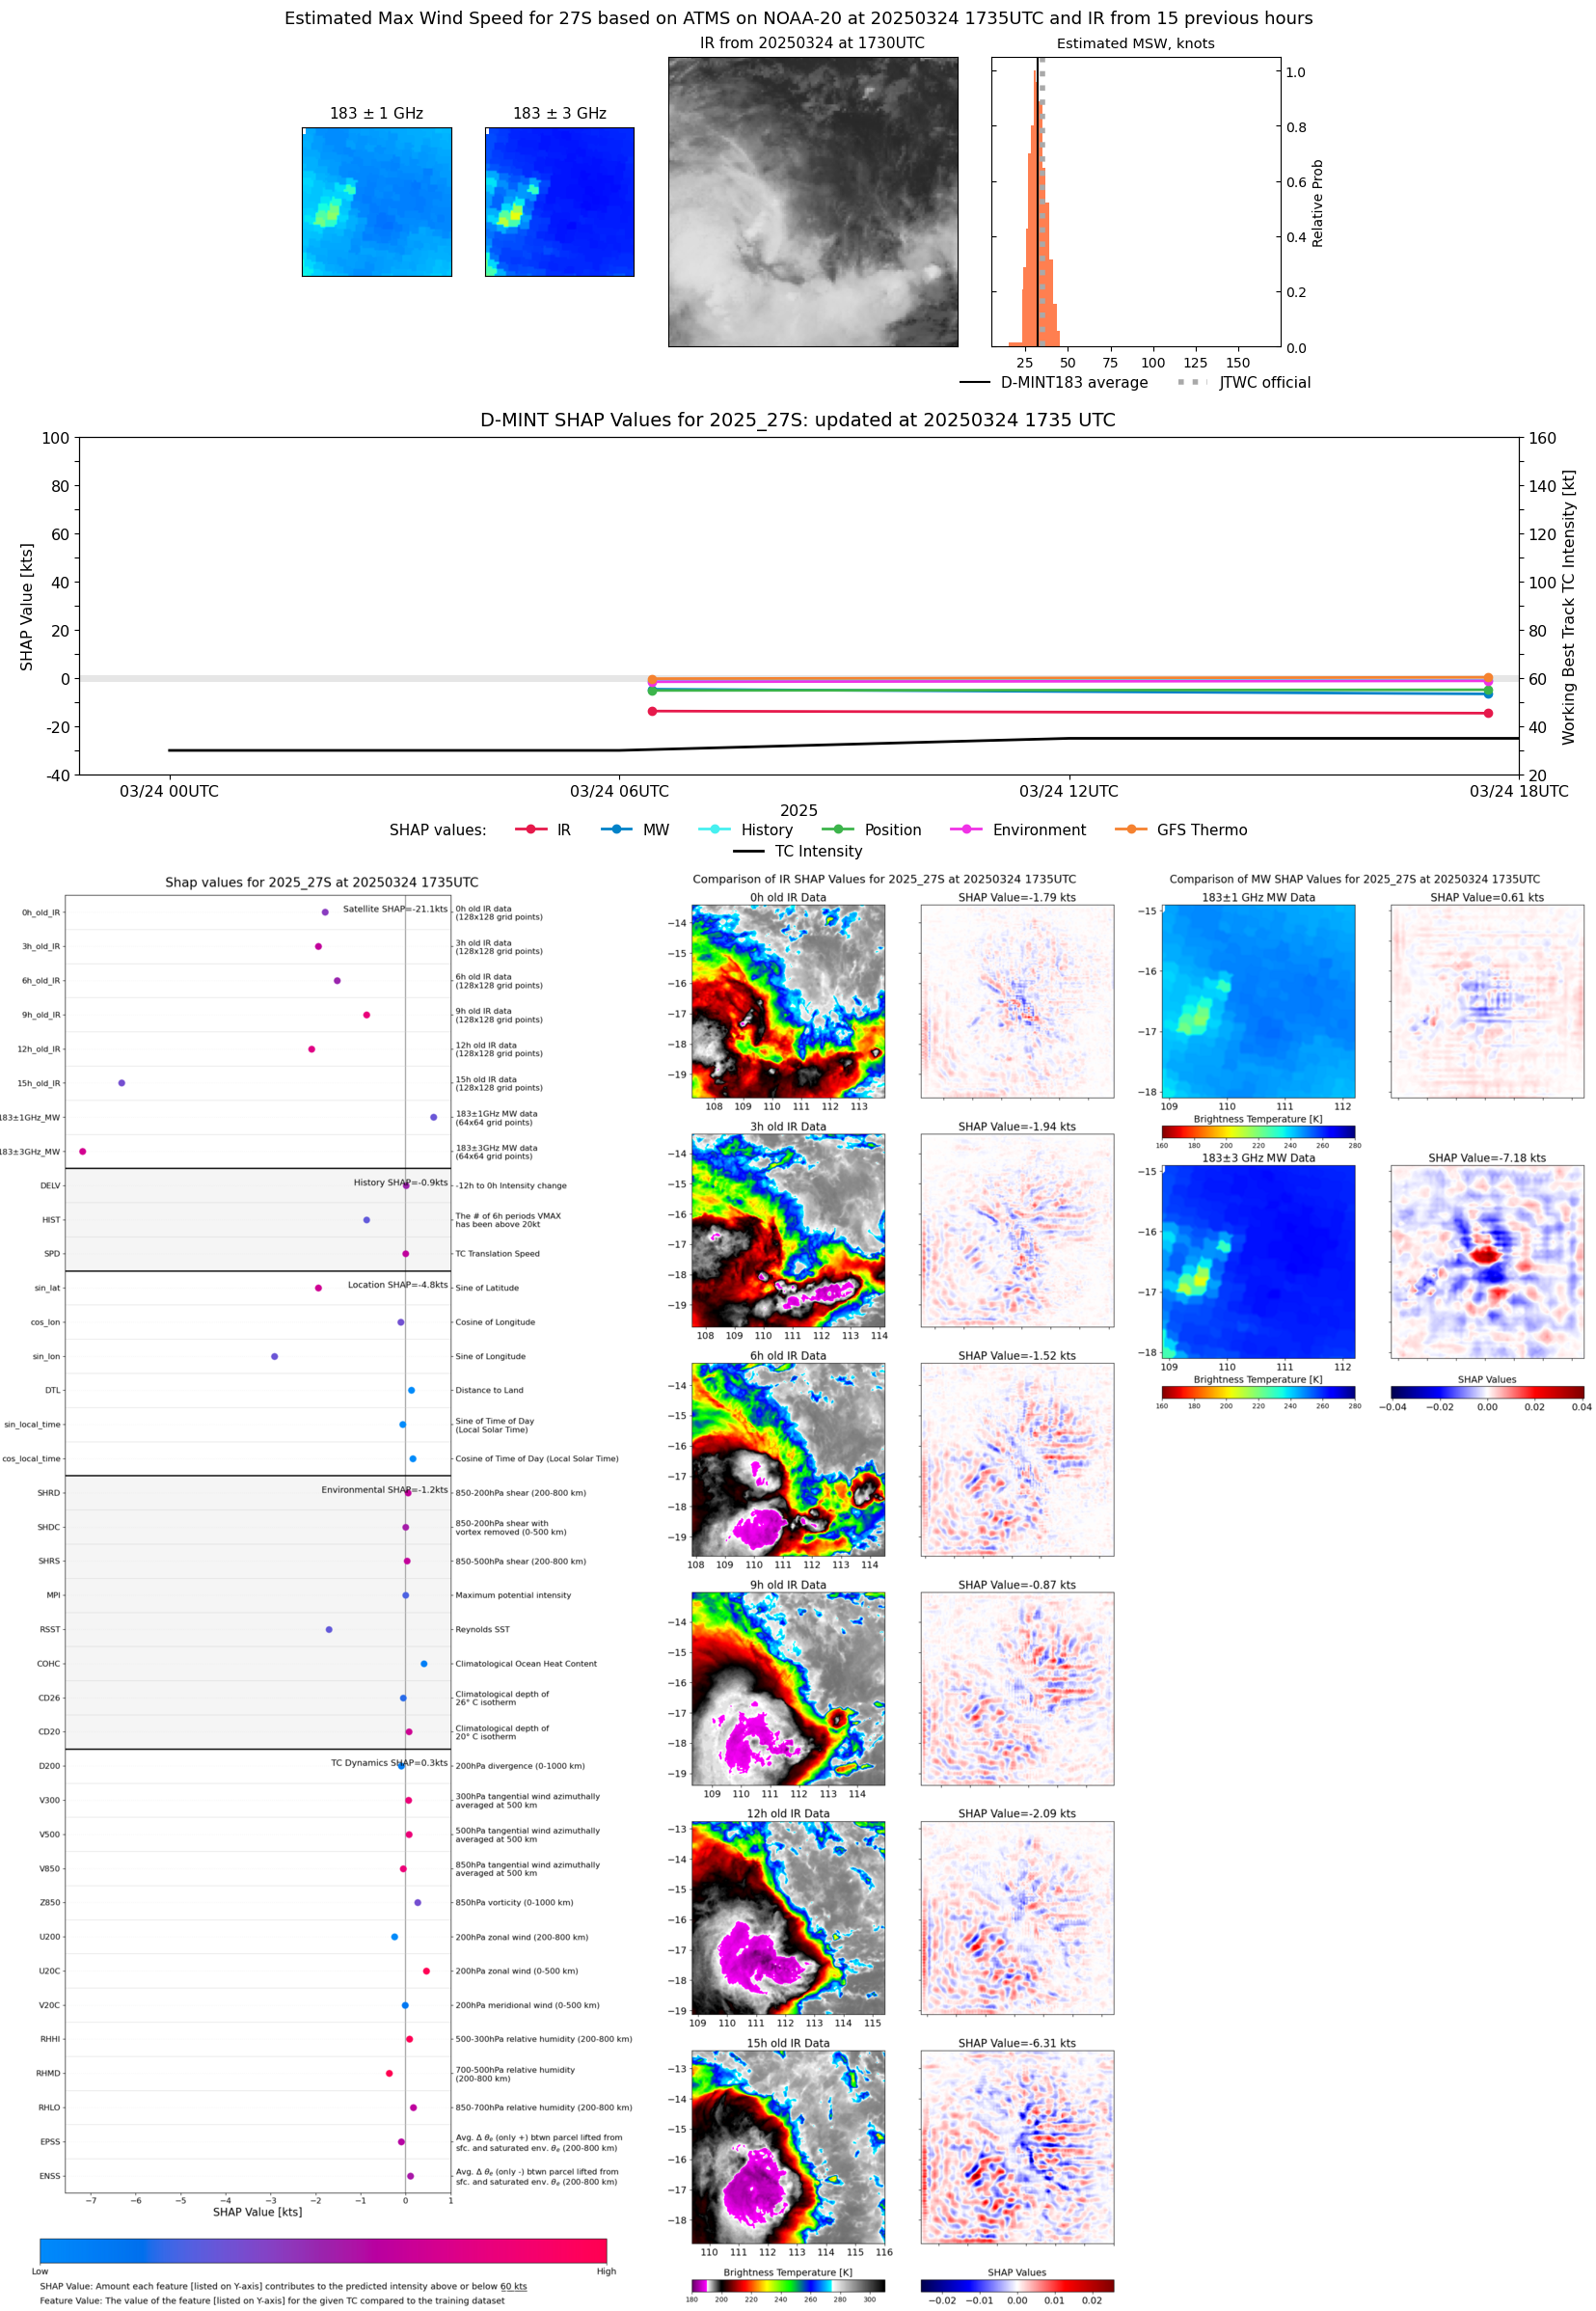 |
| 20250324 | 0626 UTC | ATMS-N20 | 994 hPa | 34 kts | 30 kts | 38 kts | 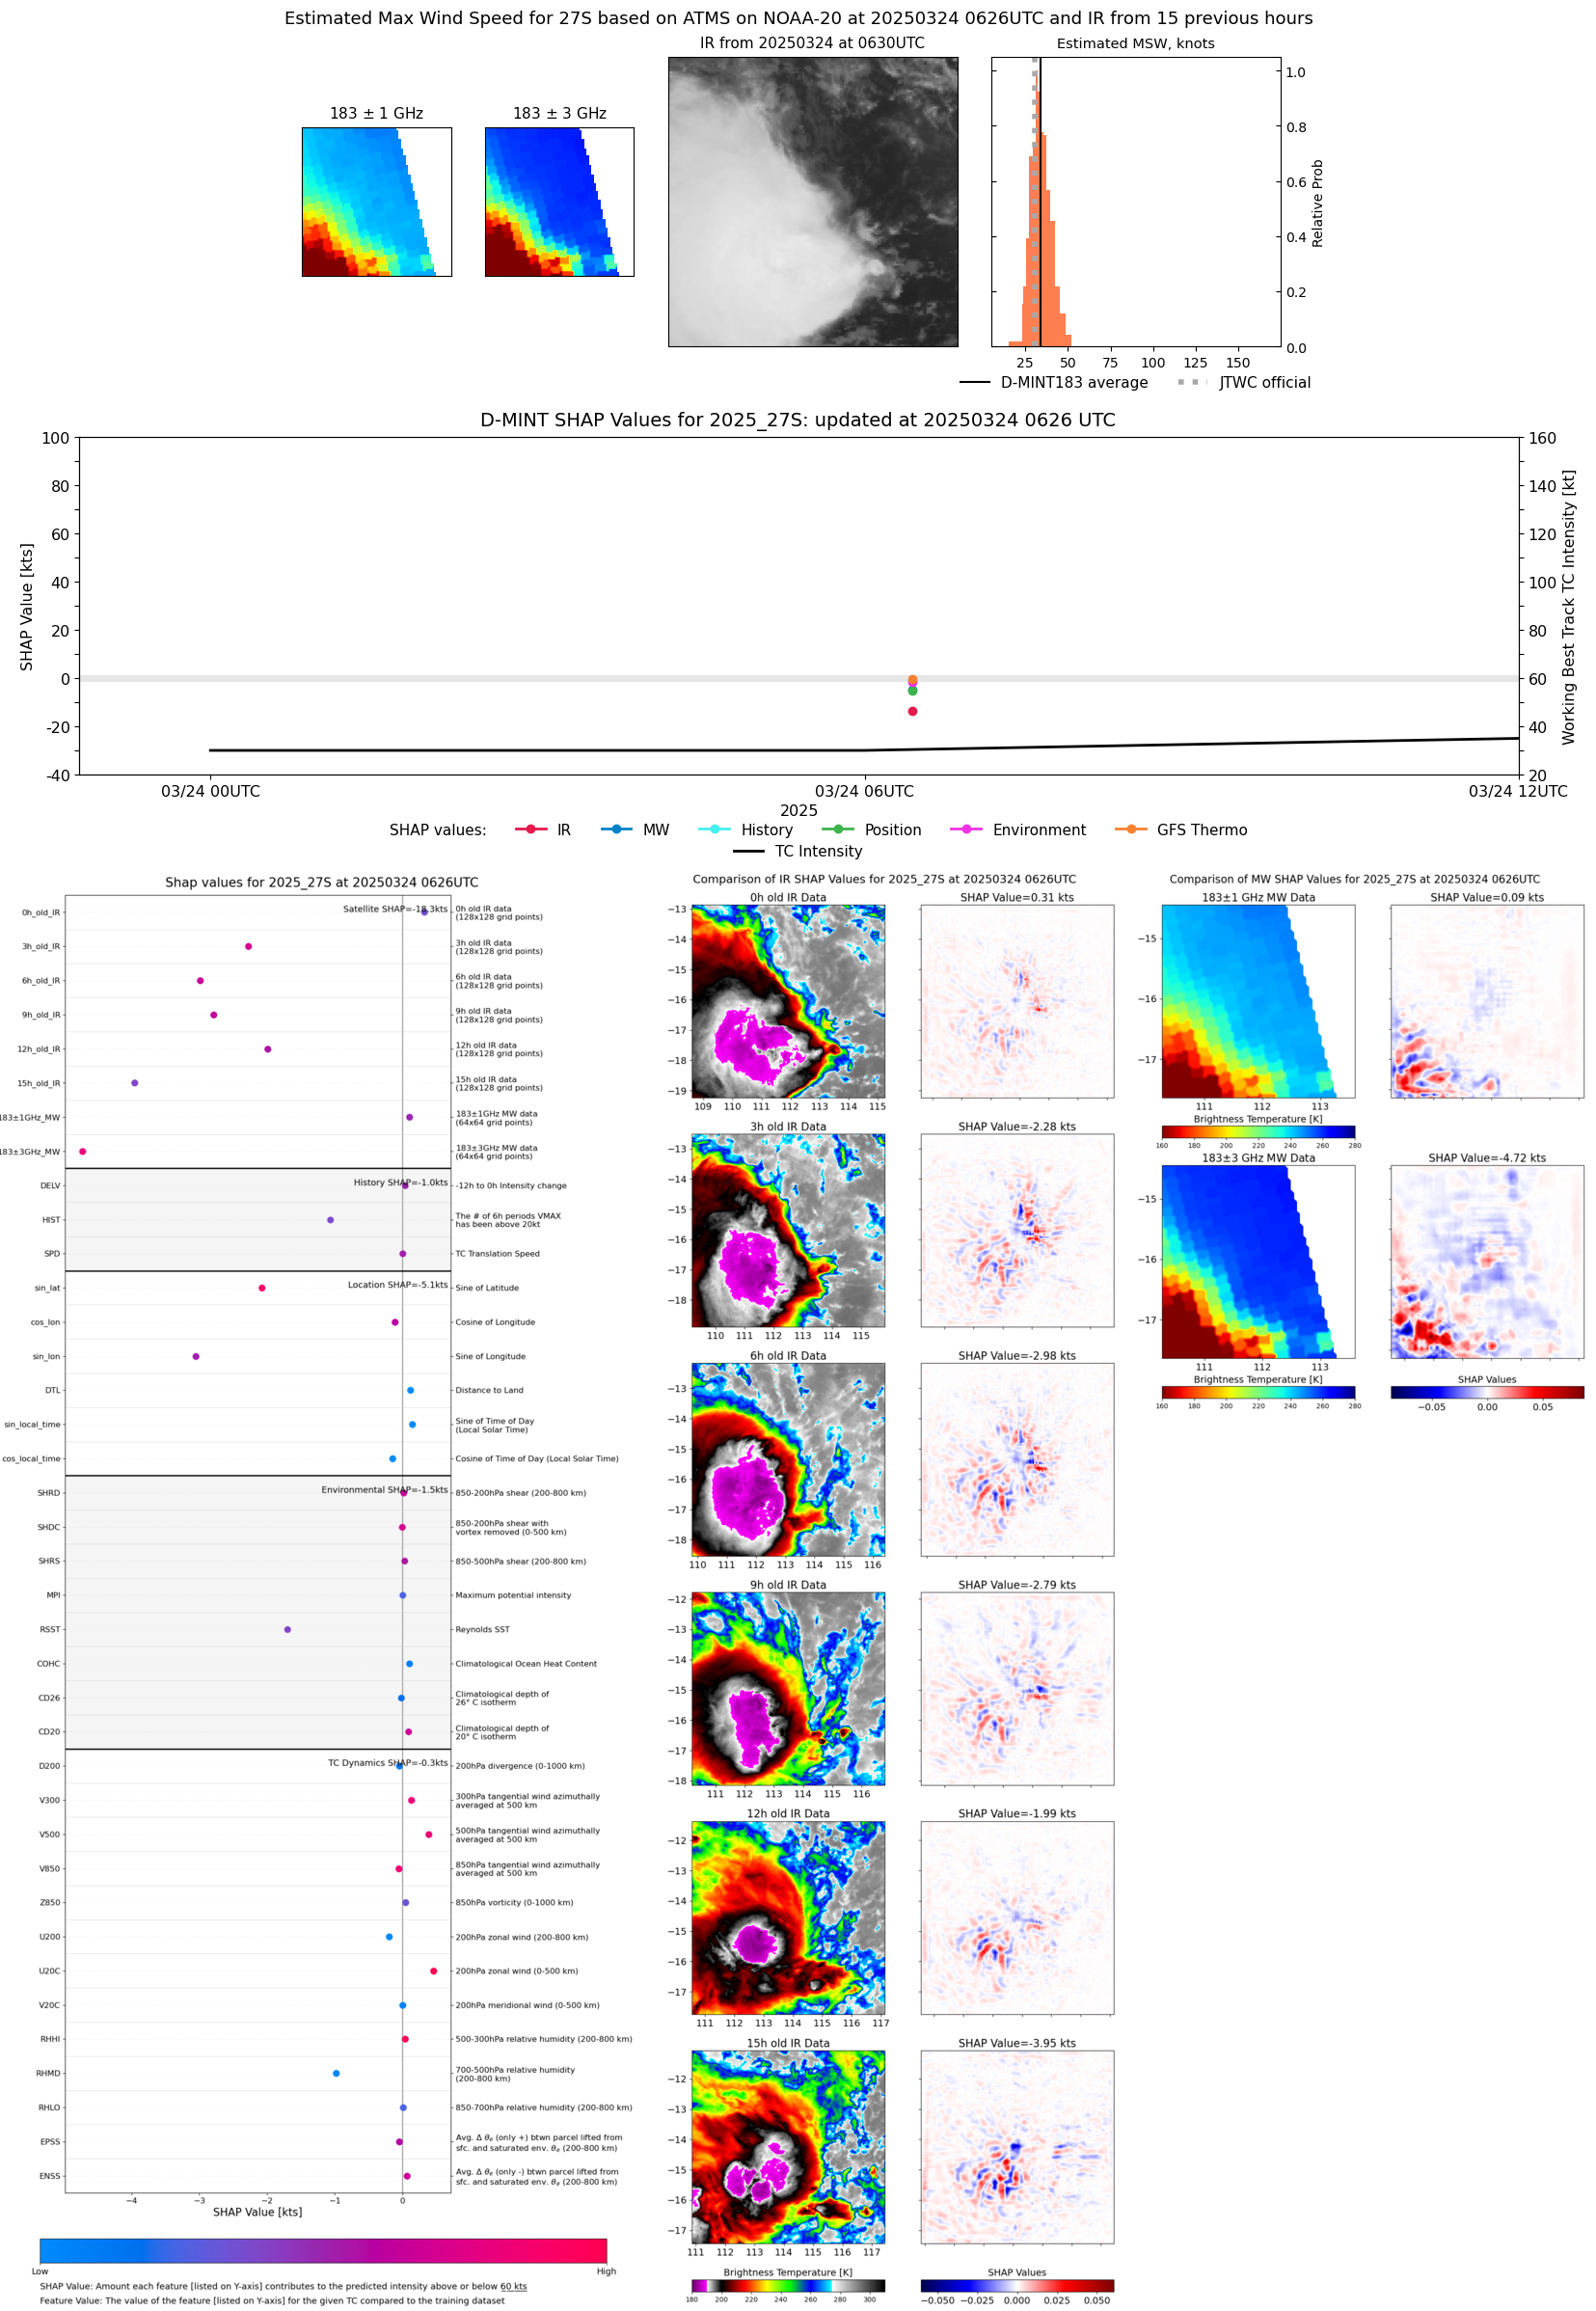 |