|
||

 |
D-MINT HISTORY FILE for 2025_29S
| Date | Time | MW Sensor | MSLP | Vmax (30th-70th percentile average) | Vmax 25th percentile | Vmax 75th percentile | Image |
| 20250418 | 1011 UTC | SSMISF16 | 997 hPa | 30 kts | 27 kts | 34 kts |  |
| 20250418 | 0526 UTC | AMSR2 | 997 hPa | 26 kts | 22 kts | 29 kts |  |
| 20250417 | 2207 UTC | SSMISF17 | 1001 hPa | 31 kts | 27 kts | 36 kts |  |
| 20250417 | 2137 UTC | SSMISF16 | 992 hPa | 29 kts | 25 kts | 33 kts |  |
| 20250417 | 2048 UTC | GMI | 1000 hPa | 28 kts | 25 kts | 32 kts |  |
| 20250417 | 1714 UTC | AMSR2 | 995 hPa | 33 kts | 29 kts | 38 kts |  |
| 20250417 | 1025 UTC | SSMISF16 | 978 hPa | 52 kts | 45 kts | 59 kts |  |
| 20250416 | 2220 UTC | SSMISF17 | 939 hPa | 117 kts | 110 kts | 124 kts |  |
| 20250416 | 2151 UTC | SSMISF16 | 935 hPa | 123 kts | 114 kts | 132 kts |  |
| 20250416 | 2128 UTC | GMI | 934 hPa | 123 kts | 116 kts | 129 kts |  |
| 20250416 | 2124 UTC | TROPICS03 | 936 hPa | 119 kts | 113 kts | 125 kts |  |
| 20250416 | 1039 UTC | SSMISF16 | 943 hPa | 108 kts | 98 kts | 117 kts |  |
| 20250416 | 0742 UTC | SSMISF18 | 951 hPa | 92 kts | 85 kts | 99 kts |  |
| 20250416 | 0627 UTC | TROPICS03 | 968 hPa | 72 kts | 65 kts | 79 kts |  |
| 20250416 | 0539 UTC | AMSR2 | 946 hPa | 99 kts | 91 kts | 108 kts |  |
| 20250415 | 2203 UTC | SSMISF16 | 983 hPa | 55 kts | 49 kts | 62 kts |  |
| 20250415 | 1725 UTC | AMSR2 | 988 hPa | 53 kts | 47 kts | 60 kts |  |
| 20250415 | 1053 UTC | SSMISF16 | 994 hPa | 39 kts | 34 kts | 44 kts |  |
| 20250415 | 1043 UTC | GMI | 994 hPa | 34 kts | 29 kts | 38 kts |  |
| 20250415 | 0944 UTC | SSMISF17 | 995 hPa | 34 kts | 30 kts | 39 kts |  |
| 20250415 | 0944 UTC | SSMISF17 | 995 hPa | 34 kts | 30 kts | 39 kts |  |
| 20250415 | 0755 UTC | SSMISF18 | 994 hPa | 38 kts | 33 kts | 42 kts |  |
| 20250415 | 0716 UTC | TROPICS03 | 998 hPa | 34 kts | 30 kts | 38 kts |  |
| 20250414 | 2216 UTC | SSMISF16 | 994 hPa | 37 kts | 32 kts | 43 kts |  |
| 20250414 | 1919 UTC | SSMISF18 | 1001 hPa | 29 kts | 26 kts | 33 kts |  |
| 20250414 | 0957 UTC | SSMISF17 | 1001 hPa | 27 kts | 24 kts | 30 kts |  |
| 20250414 | 0809 UTC | SSMISF18 | 1002 hPa | 28 kts | 25 kts | 31 kts |  |
| 20250414 | 0552 UTC | AMSR2 | 1000 hPa | 29 kts | 26 kts | 33 kts |  |
| 20250413 | 2230 UTC | SSMISF16 | 1005 hPa | 26 kts | 23 kts | 29 kts |  |
| 20250413 | 2203 UTC | GMI | 1005 hPa | 25 kts | 23 kts | 27 kts |  |
| 20250413 | 2122 UTC | SSMISF17 | 1004 hPa | 27 kts | 25 kts | 30 kts |  |
| 20250413 | 1933 UTC | SSMISF18 | 1004 hPa | 26 kts | 24 kts | 29 kts |  |
| 20250413 | 1738 UTC | AMSR2 | 1005 hPa | 24 kts | 22 kts | 27 kts |  |
| 20250413 | 1012 UTC | SSMISF17 | 1003 hPa | 24 kts | 22 kts | 27 kts |  |
| 20250413 | 0509 UTC | AMSR2 | 1003 hPa | 26 kts | 24 kts | 28 kts |  |
| 20250412 | 2258 UTC | TROPICS03 | 1001 hPa | 27 kts | 25 kts | 29 kts | 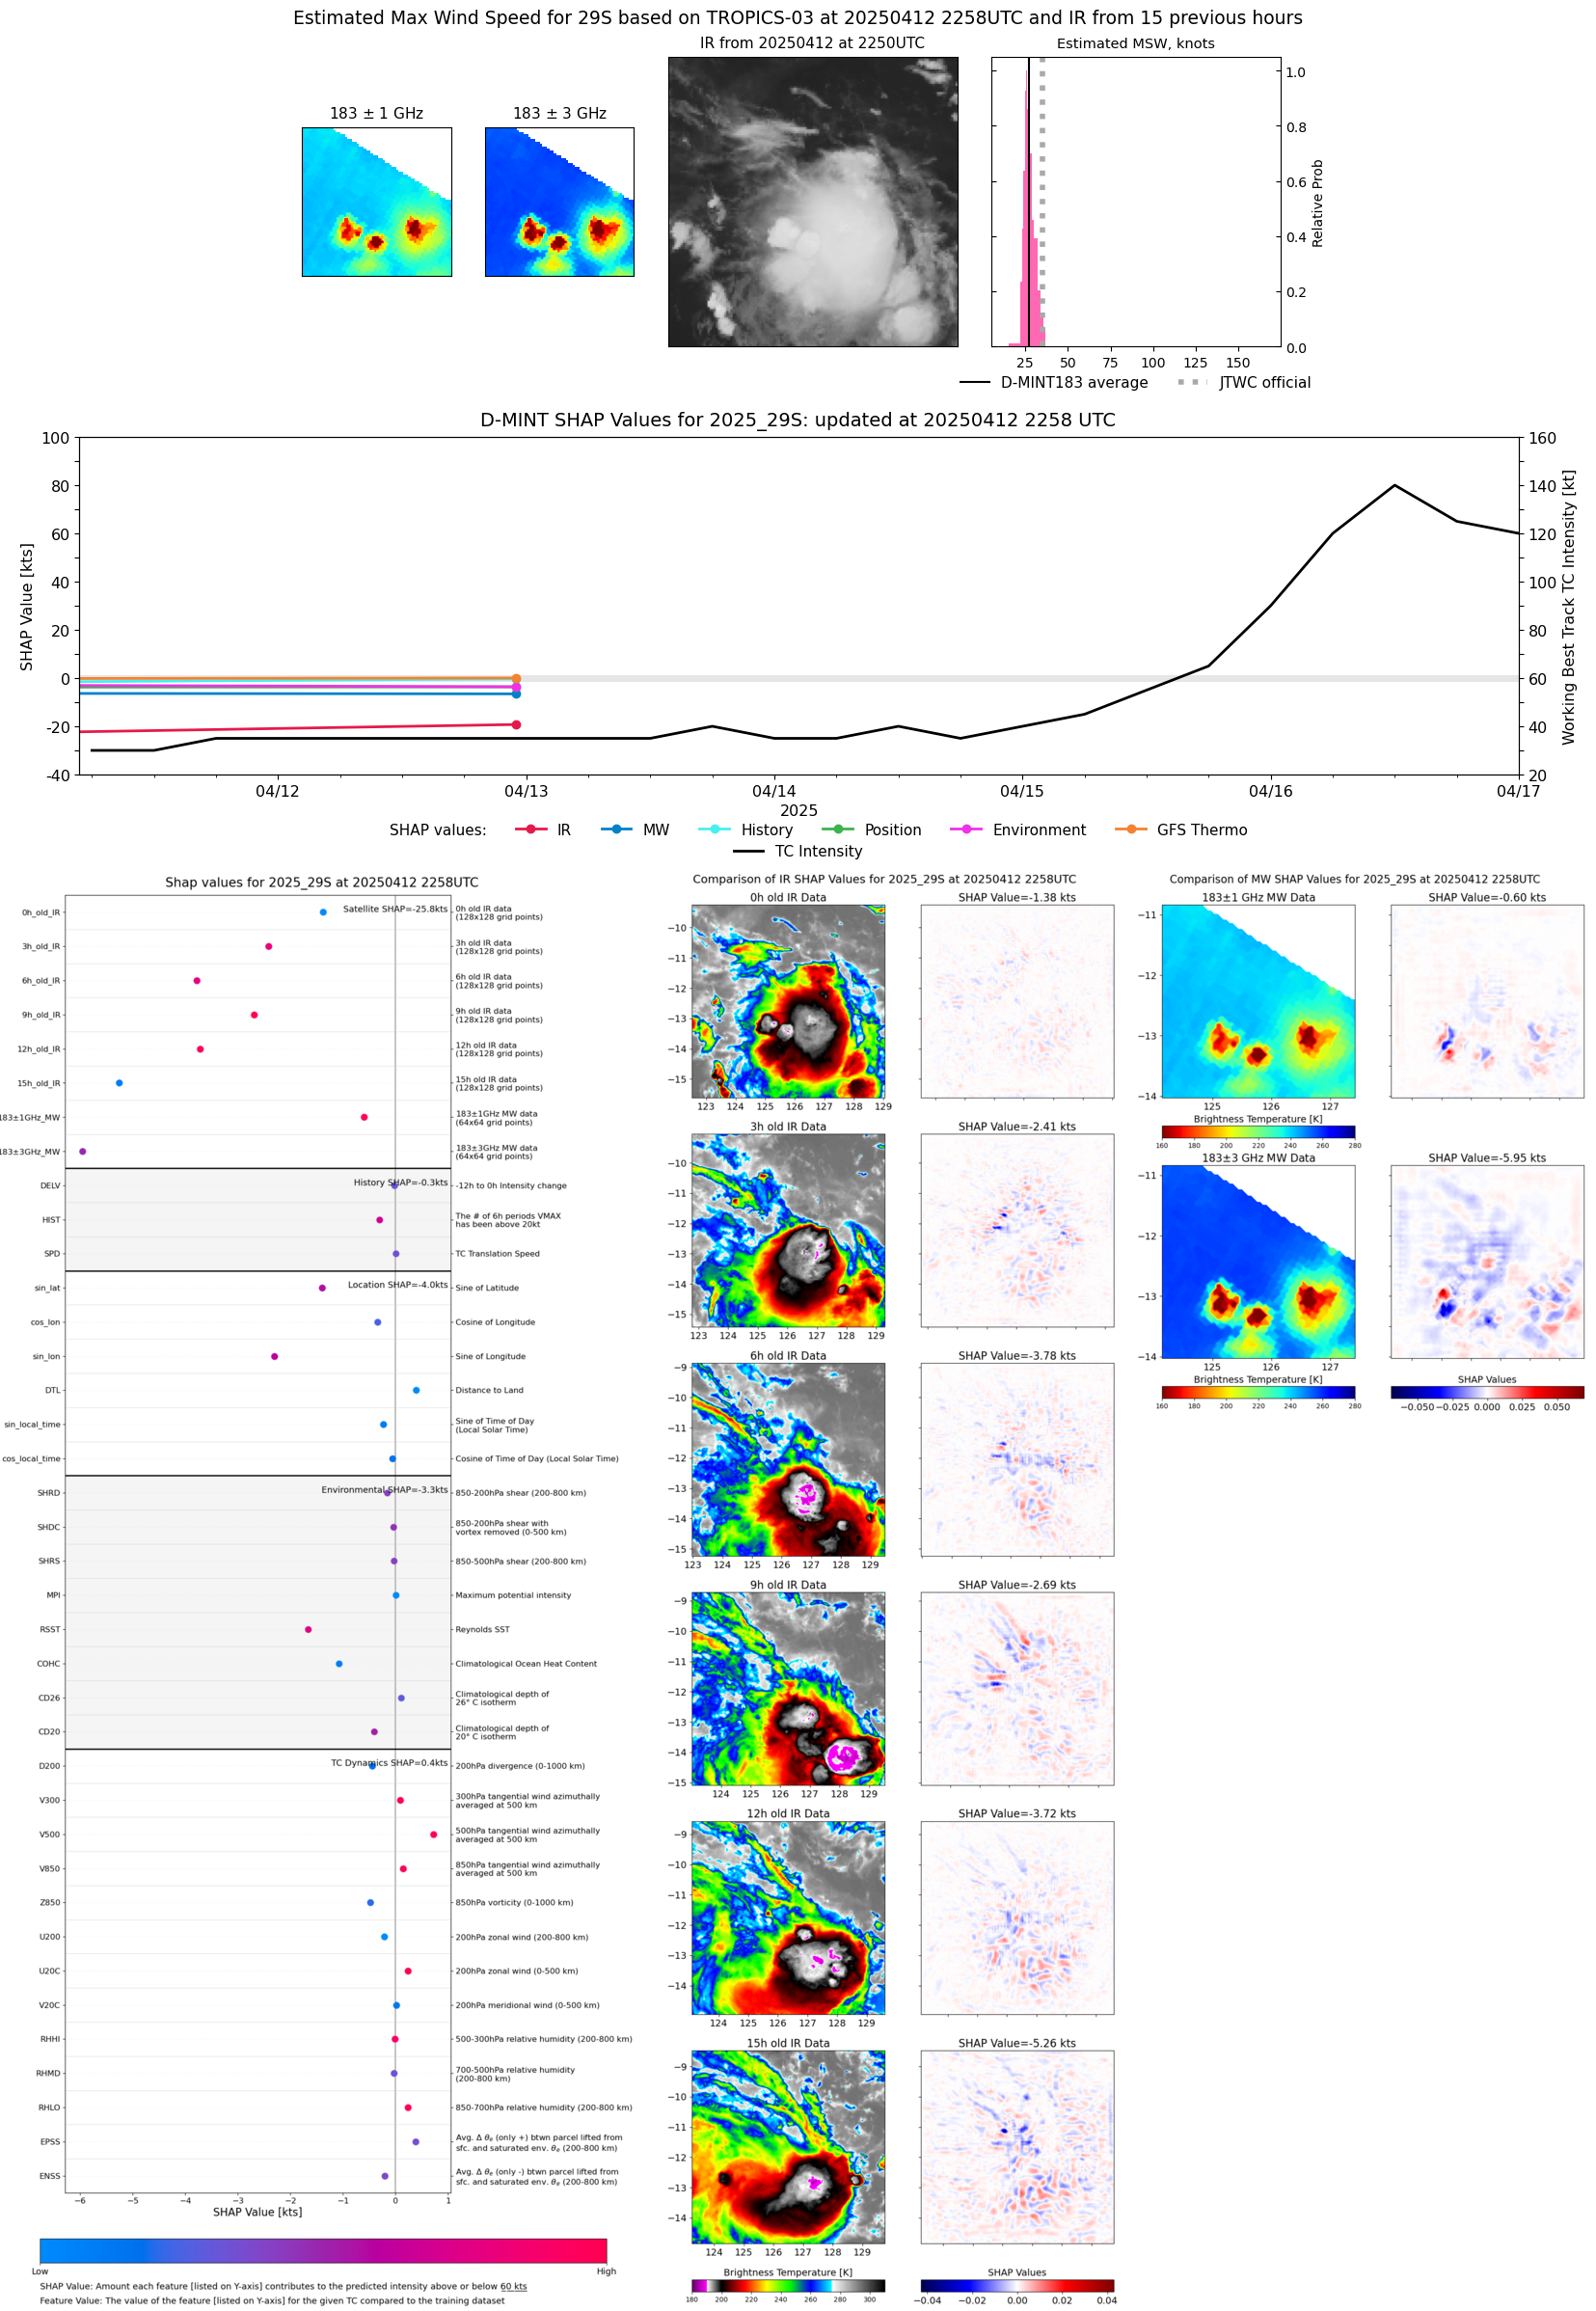 |
| 20250412 | 2135 UTC | SSMISF17 | 1004 hPa | 29 kts | 27 kts | 31 kts |  |
| 20250412 | 1946 UTC | SSMISF18 | 1004 hPa | 29 kts | 27 kts | 31 kts |  |
| 20250412 | 1654 UTC | AMSR2 | 1005 hPa | 27 kts | 25 kts | 30 kts |  |
| 20250412 | 1113 UTC | GMI | 1002 hPa | 26 kts | 24 kts | 28 kts |  |
| 20250412 | 0953 UTC | SSMISF16 | 1000 hPa | 27 kts | 23 kts | 31 kts |  |
| 20250411 | 2149 UTC | SSMISF17 | 998 hPa | 28 kts | 25 kts | 31 kts |  |
| 20250411 | 0849 UTC | TROPICS03 | NaN hPa | 26 kts | 23 kts | 29 kts |  |
| 20250410 | 2254 UTC | TROPICS03 | 1002 hPa | 23 kts | 21 kts | 26 kts |  |