|
||

 |
D-MINT HISTORY FILE for 2025_33W
| Date | Time | MW Sensor | MSLP | Vmax (30th-70th percentile average) | Vmax 25th percentile | Vmax 75th percentile | Image |
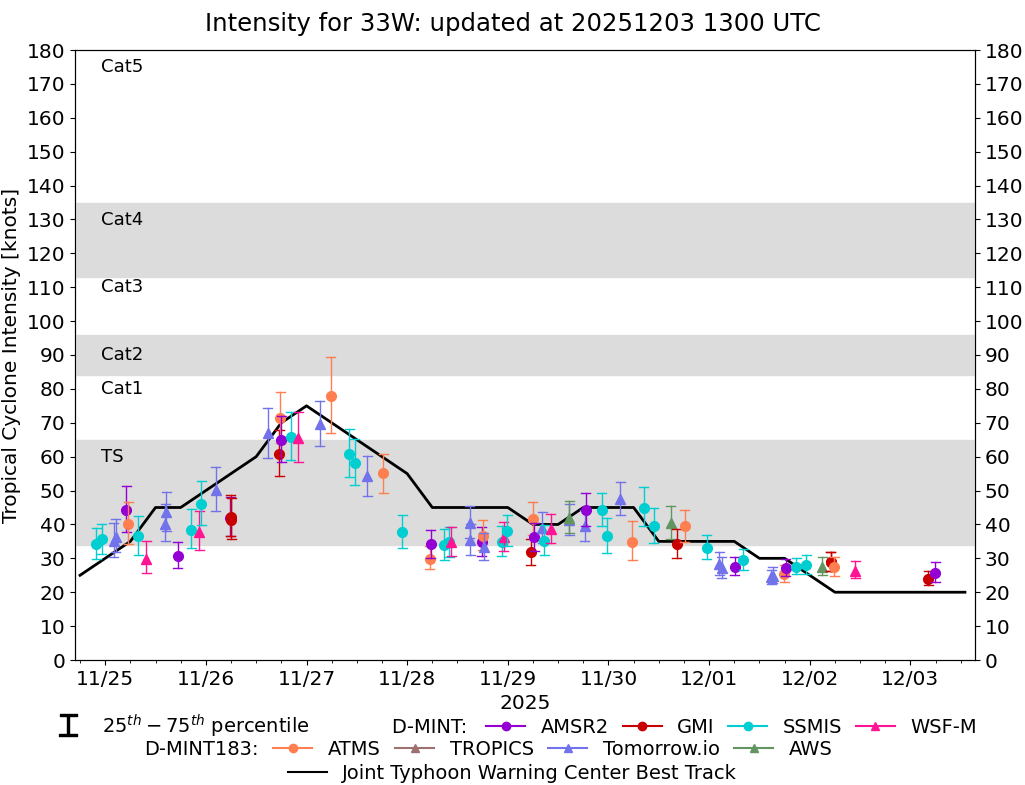
| 20251203 | 0553 UTC | AMSR2 | 1004 hPa | 26 kts | 23 kts | 29 kts | 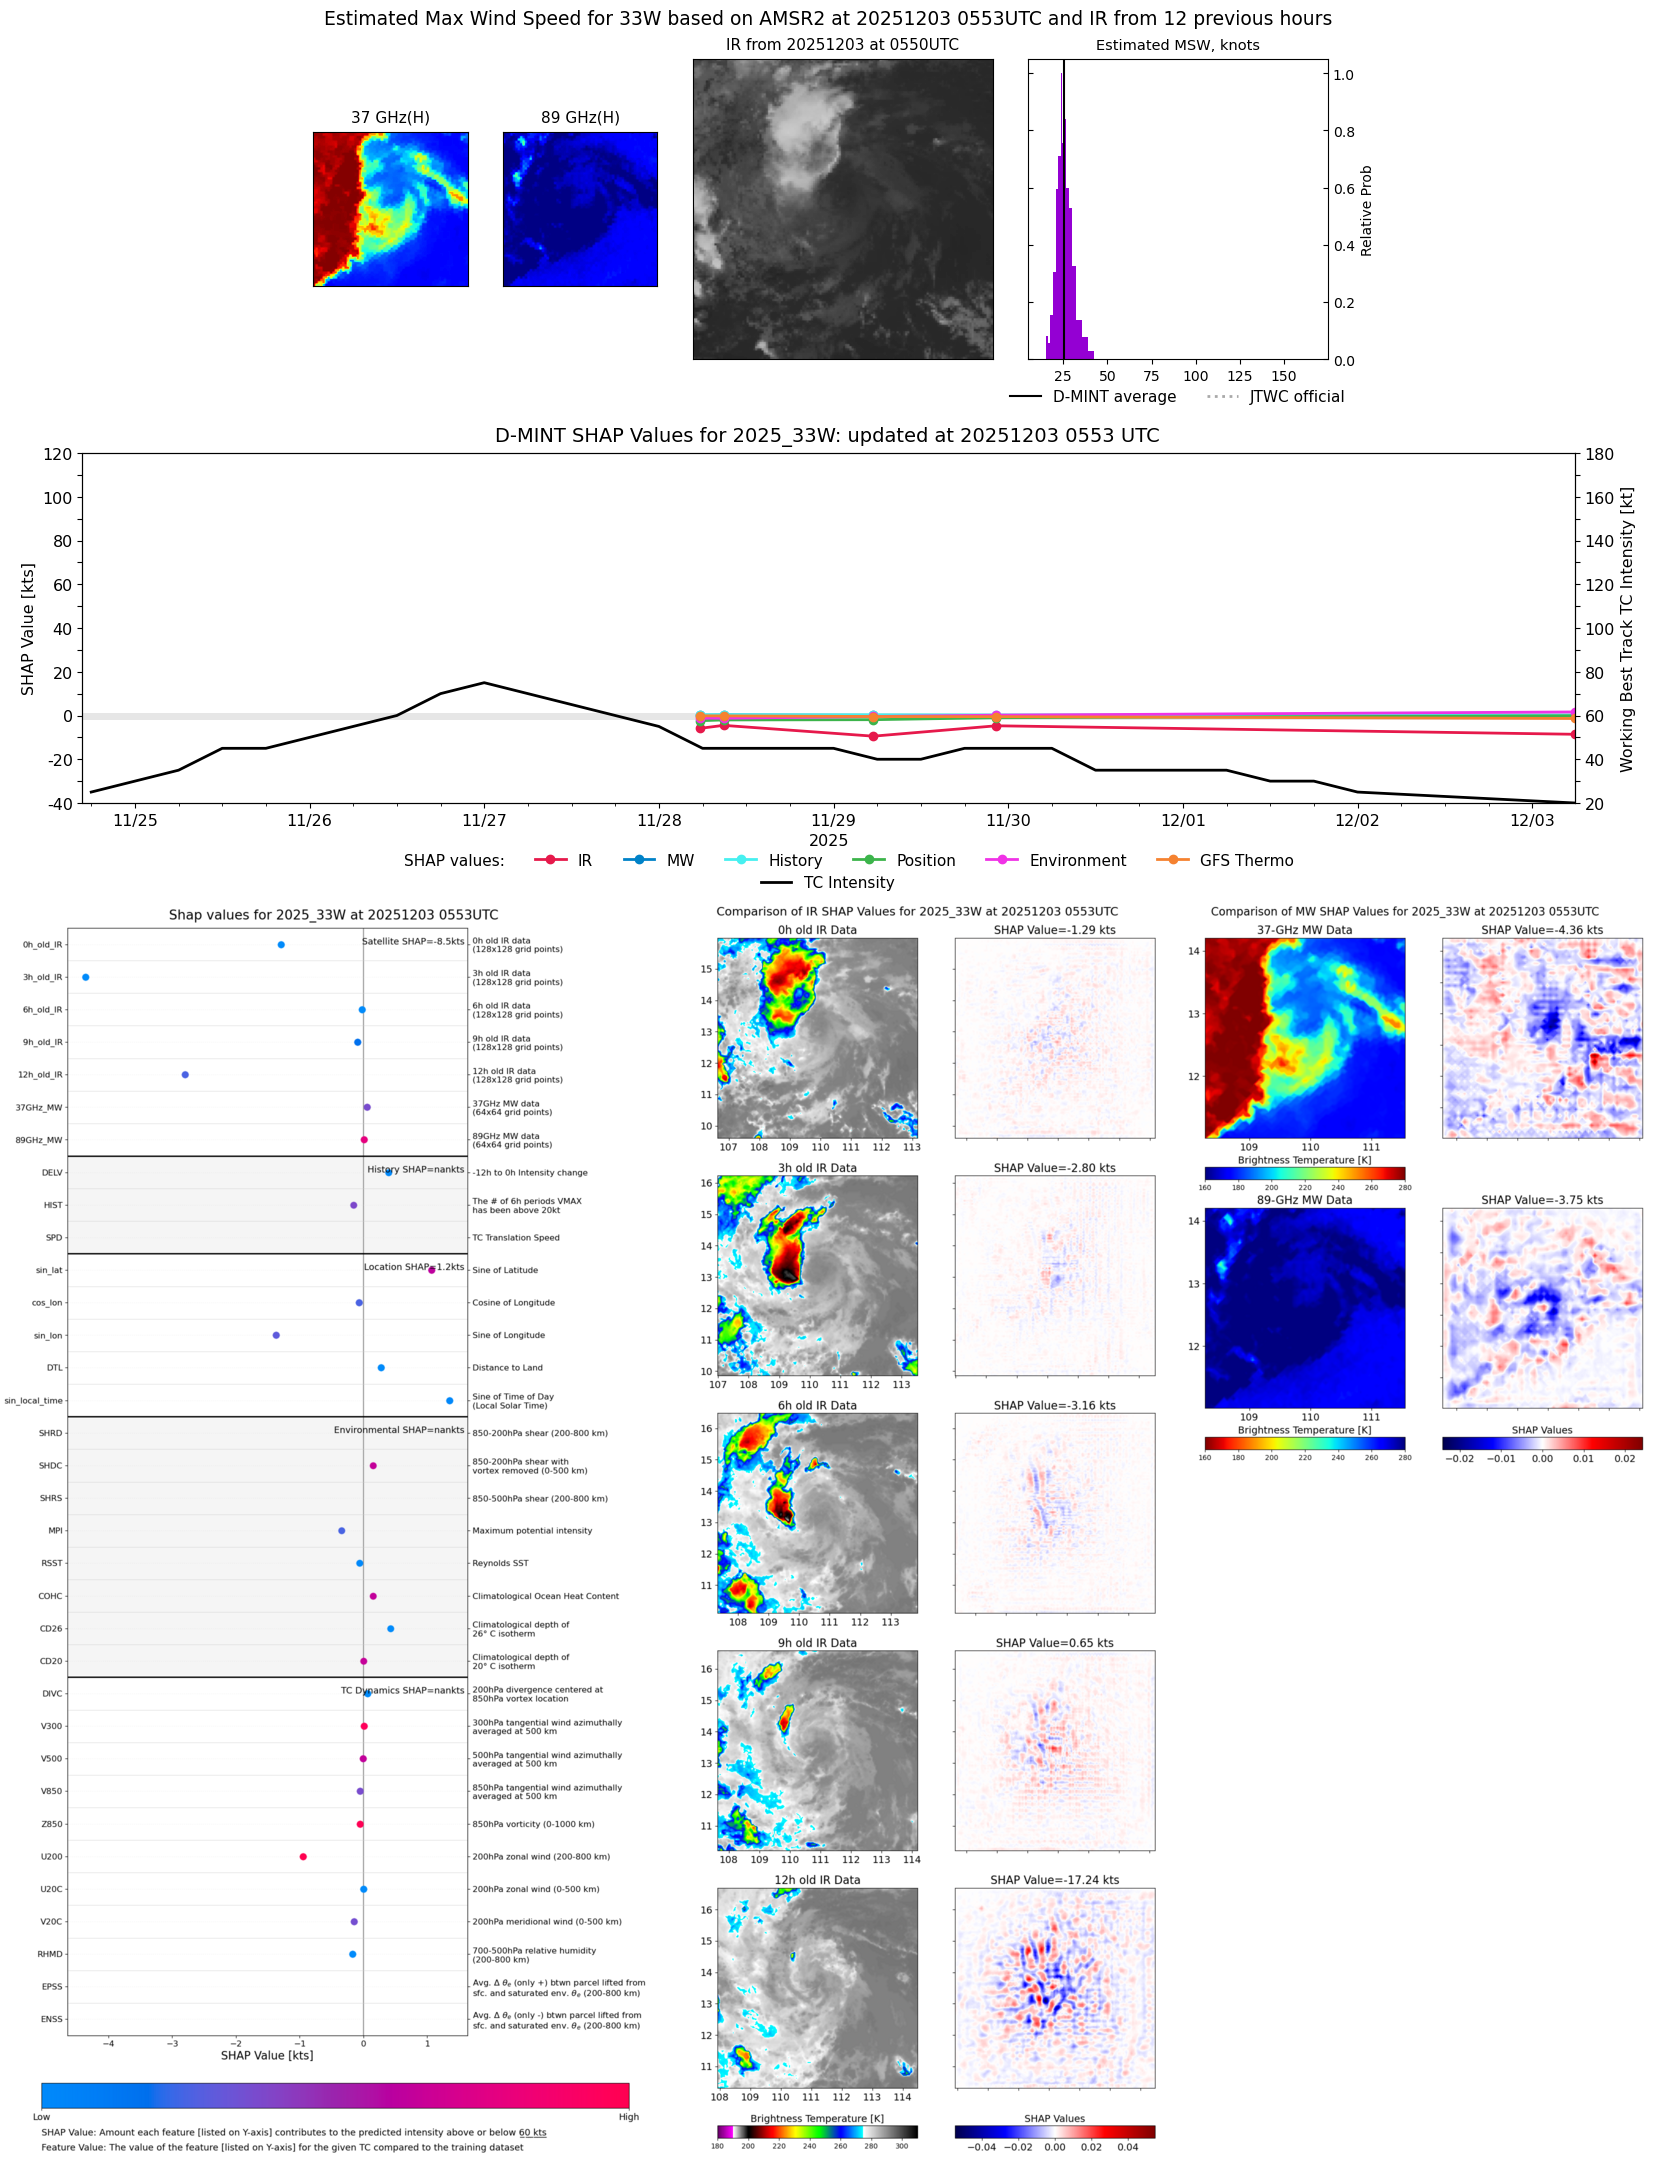 |
| 20251203 | 0413 UTC | GMI | 1005 hPa | 24 kts | 22 kts | 26 kts | 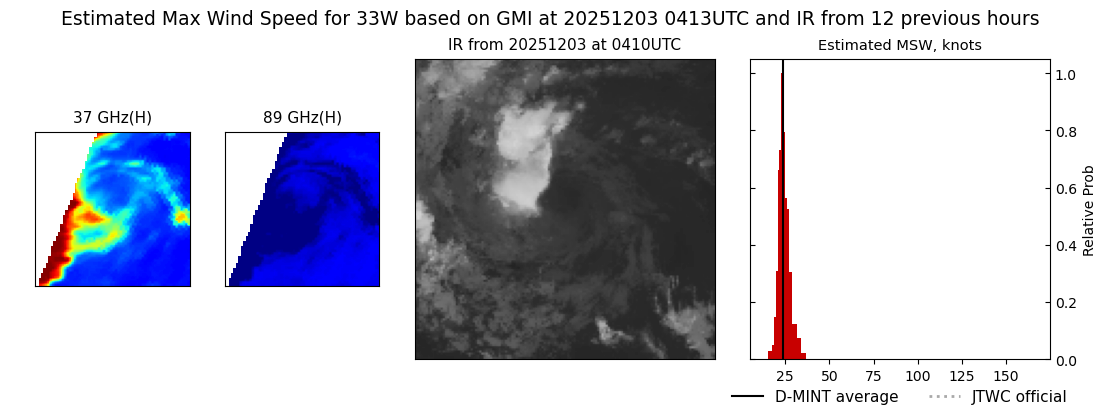 |
| 20251202 | 1052 UTC | WSFM01 | 1006 hPa | 26 kts | 24 kts | 29 kts | 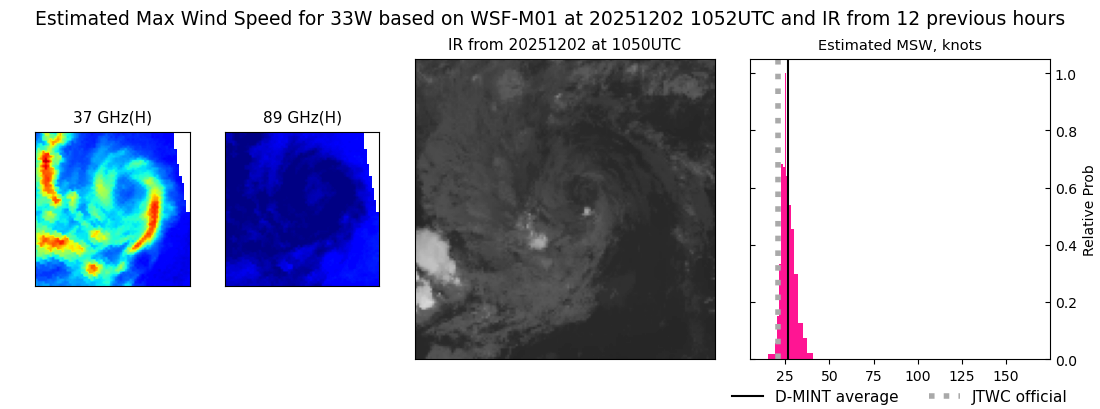 |
| 20251202 | 0550 UTC | ATMS-N21 | 1005 hPa | 27 kts | 25 kts | 30 kts | 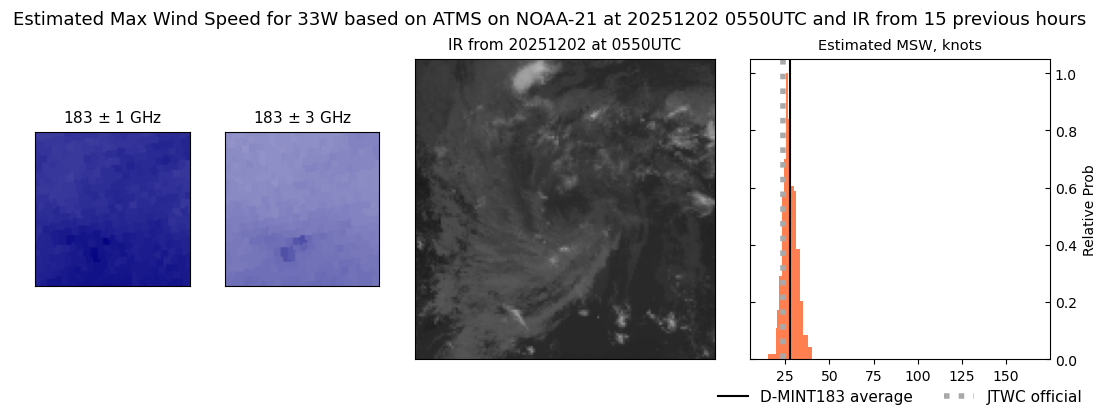 |
| 20251202 | 0501 UTC | GMI | 1004 hPa | 29 kts | 26 kts | 32 kts | 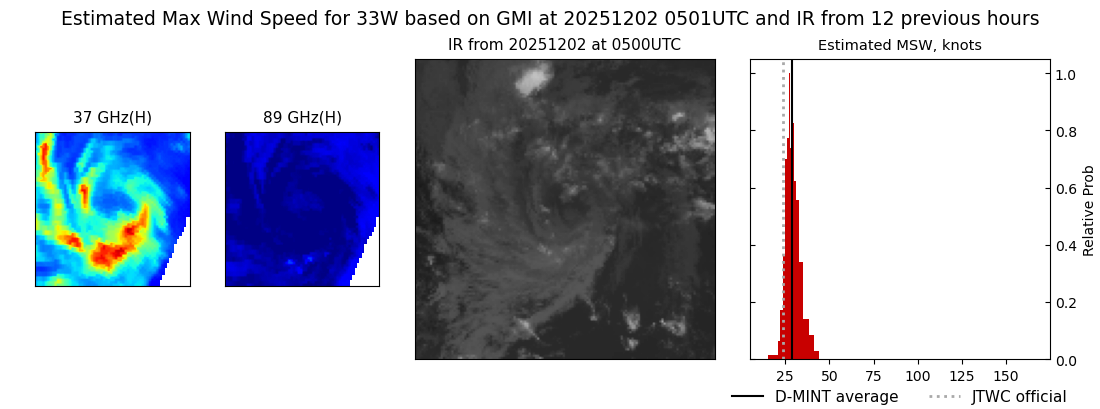 |
| 20251202 | 0458 UTC | GMI | 1004 hPa | 29 kts | 26 kts | 32 kts |  |
| 20251202 | 0258 UTC | AWS | 1004 hPa | 27 kts | 25 kts | 31 kts | 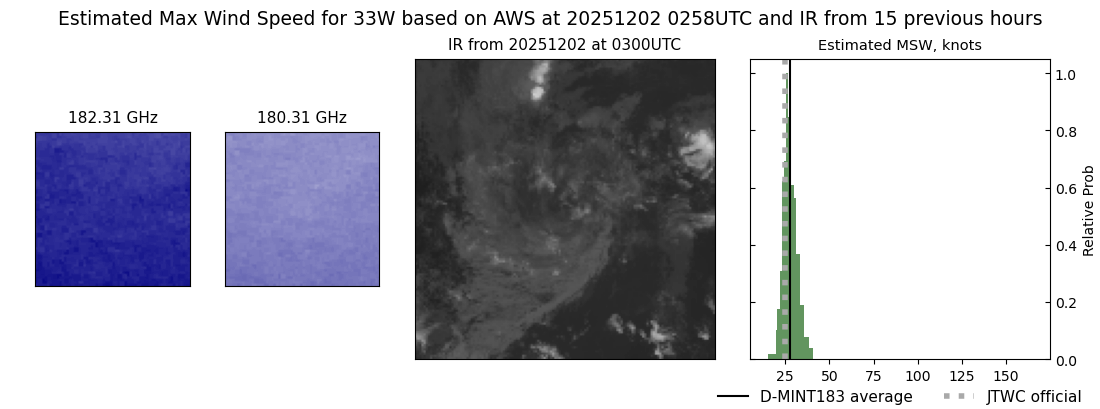 |
| 20251201 | 2312 UTC | SSMISF16 | 1004 hPa | 28 kts | 25 kts | 31 kts |  |
| 20251201 | 2046 UTC | SSMISF18 | 1005 hPa | 27 kts | 25 kts | 30 kts |  |
| 20251201 | 1819 UTC | AMSR2 | 1004 hPa | 27 kts | 25 kts | 30 kts | 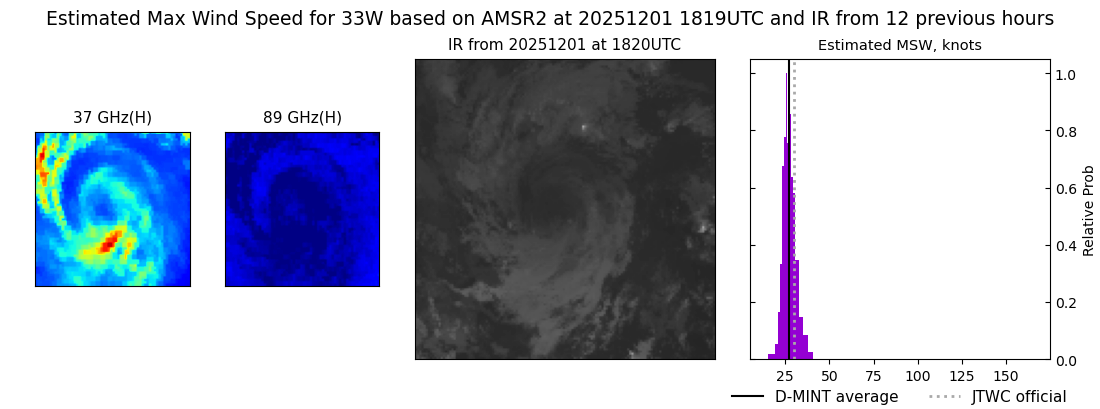 |
| 20251201 | 1752 UTC | ATMS-N20 | 1003 hPa | 25 kts | 23 kts | 28 kts | 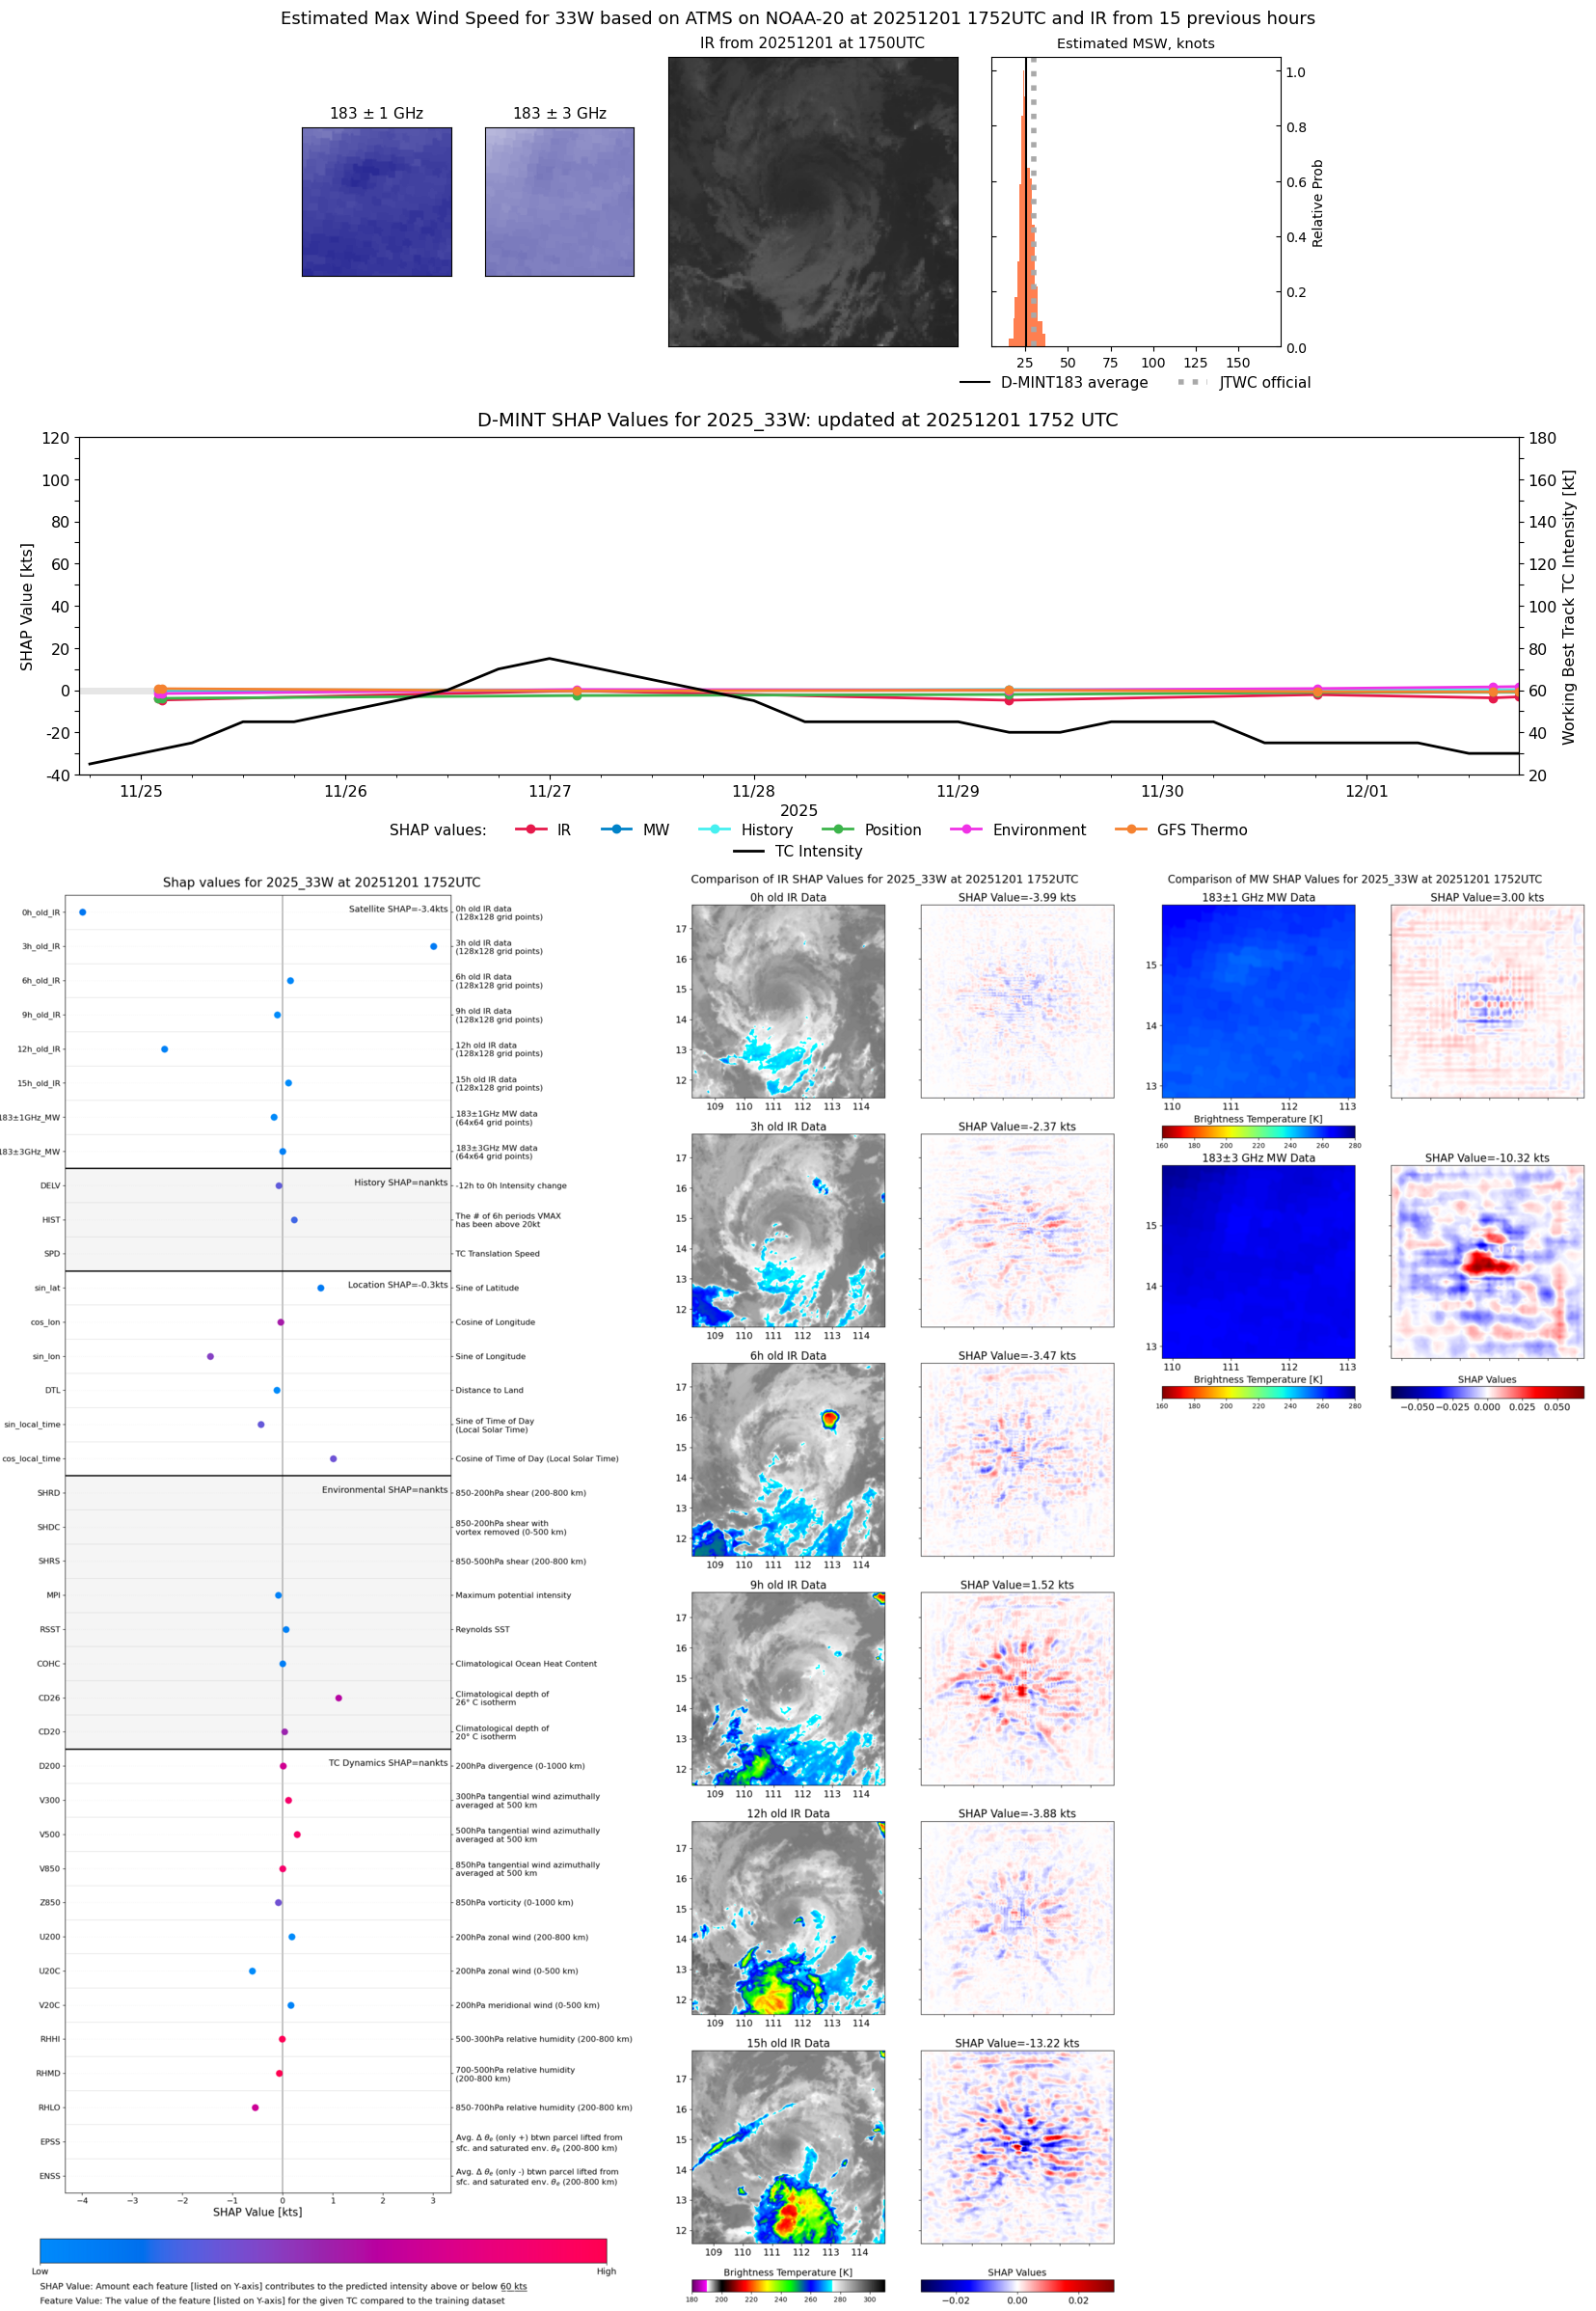 |
| 20251201 | 1508 UTC | TMS02 | 1003 hPa | 25 kts | 23 kts | 27 kts |  |
| 20251201 | 1449 UTC | TMS06 | 1003 hPa | 24 kts | 23 kts | 27 kts | 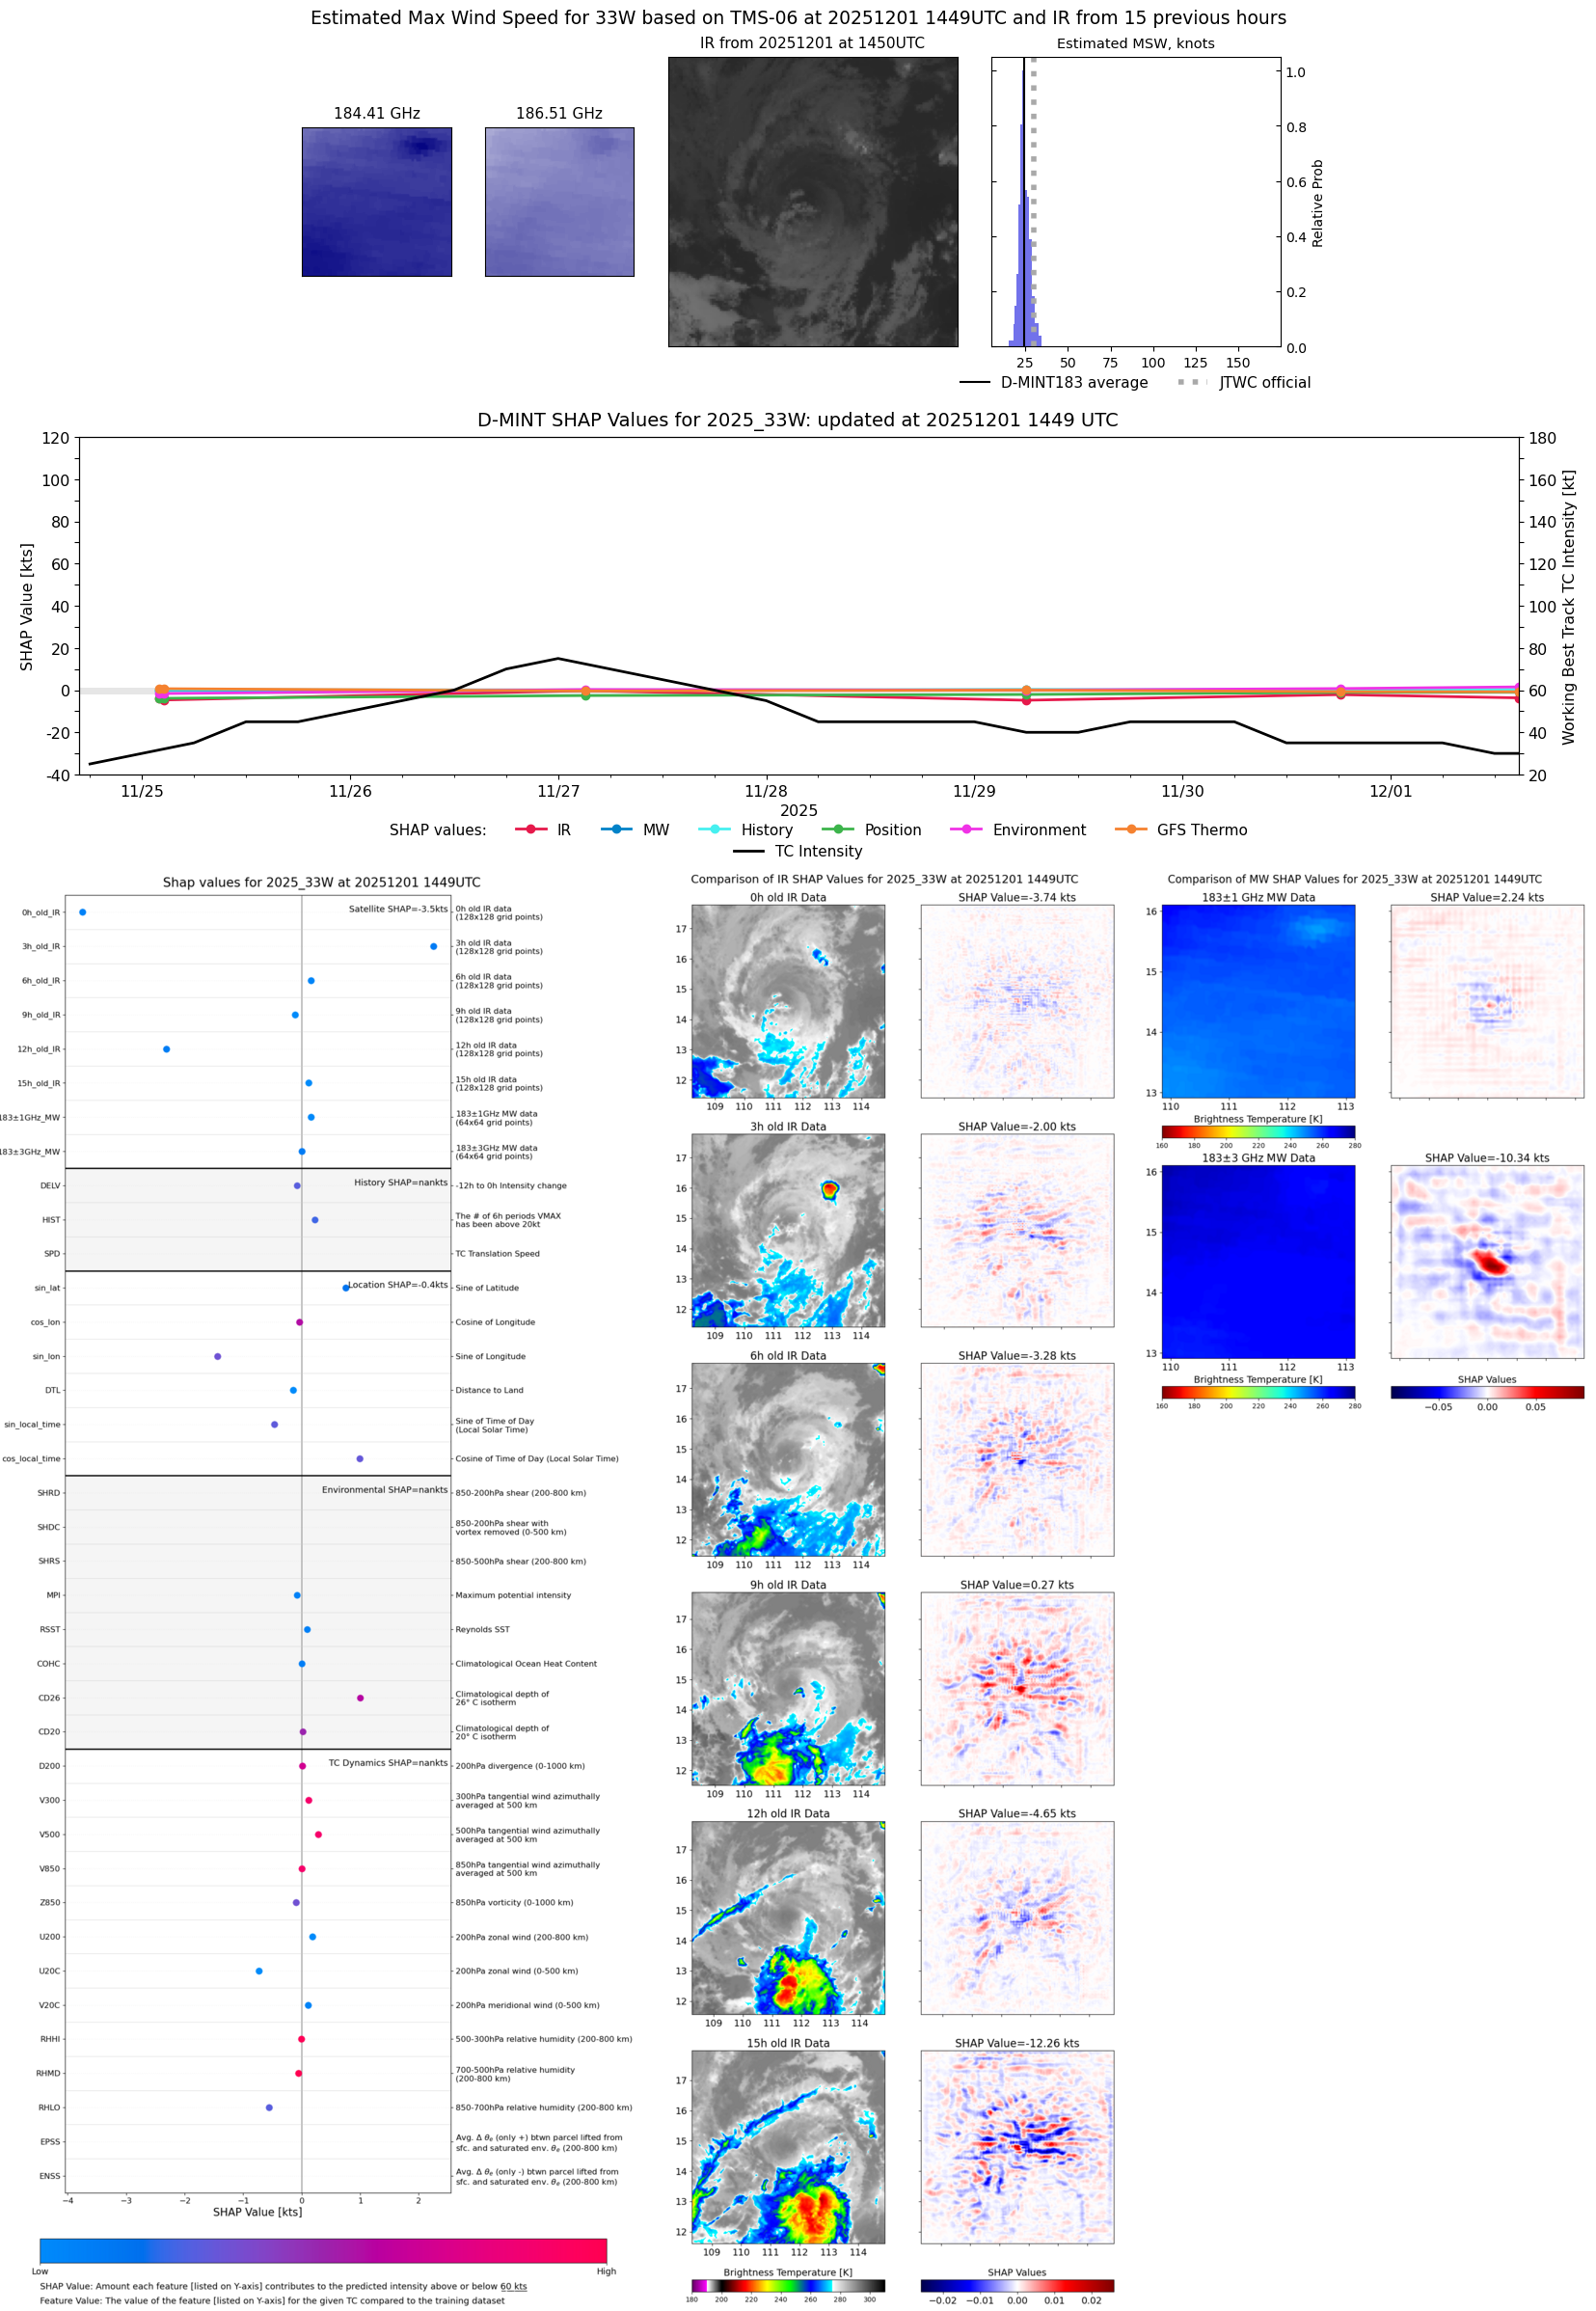 |
| 20251201 | 0811 UTC | SSMISF18 | 999 hPa | 30 kts | 27 kts | 33 kts |  |
| 20251201 | 0605 UTC | AMSR2 | 1002 hPa | 27 kts | 25 kts | 30 kts | 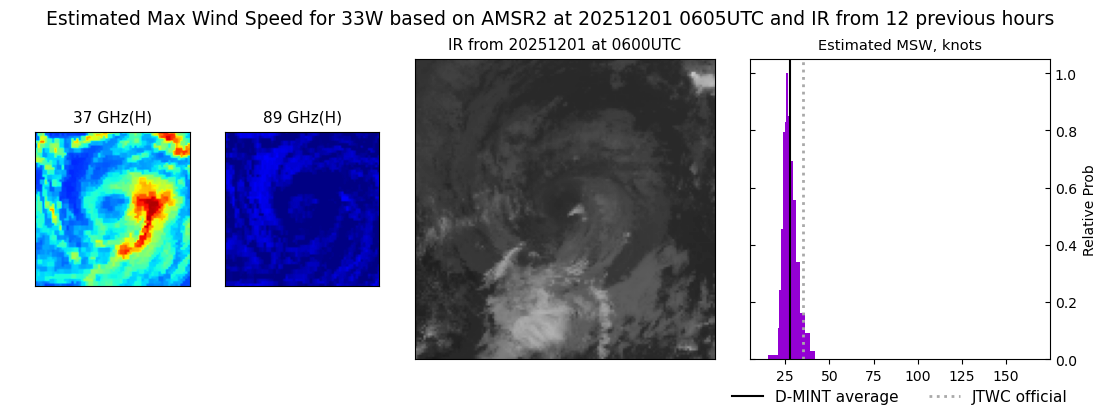 |
| 20251201 | 0300 UTC | TMS02 | 1004 hPa | 27 kts | 24 kts | 30 kts |  |
| 20251201 | 0228 UTC | TMS05 | 1003 hPa | 28 kts | 25 kts | 32 kts |  |
| 20251130 | 2325 UTC | SSMISF16 | 1000 hPa | 33 kts | 30 kts | 37 kts |  |
| 20251130 | 1811 UTC | ATMS-N20 | 1000 hPa | 39 kts | 35 kts | 44 kts | 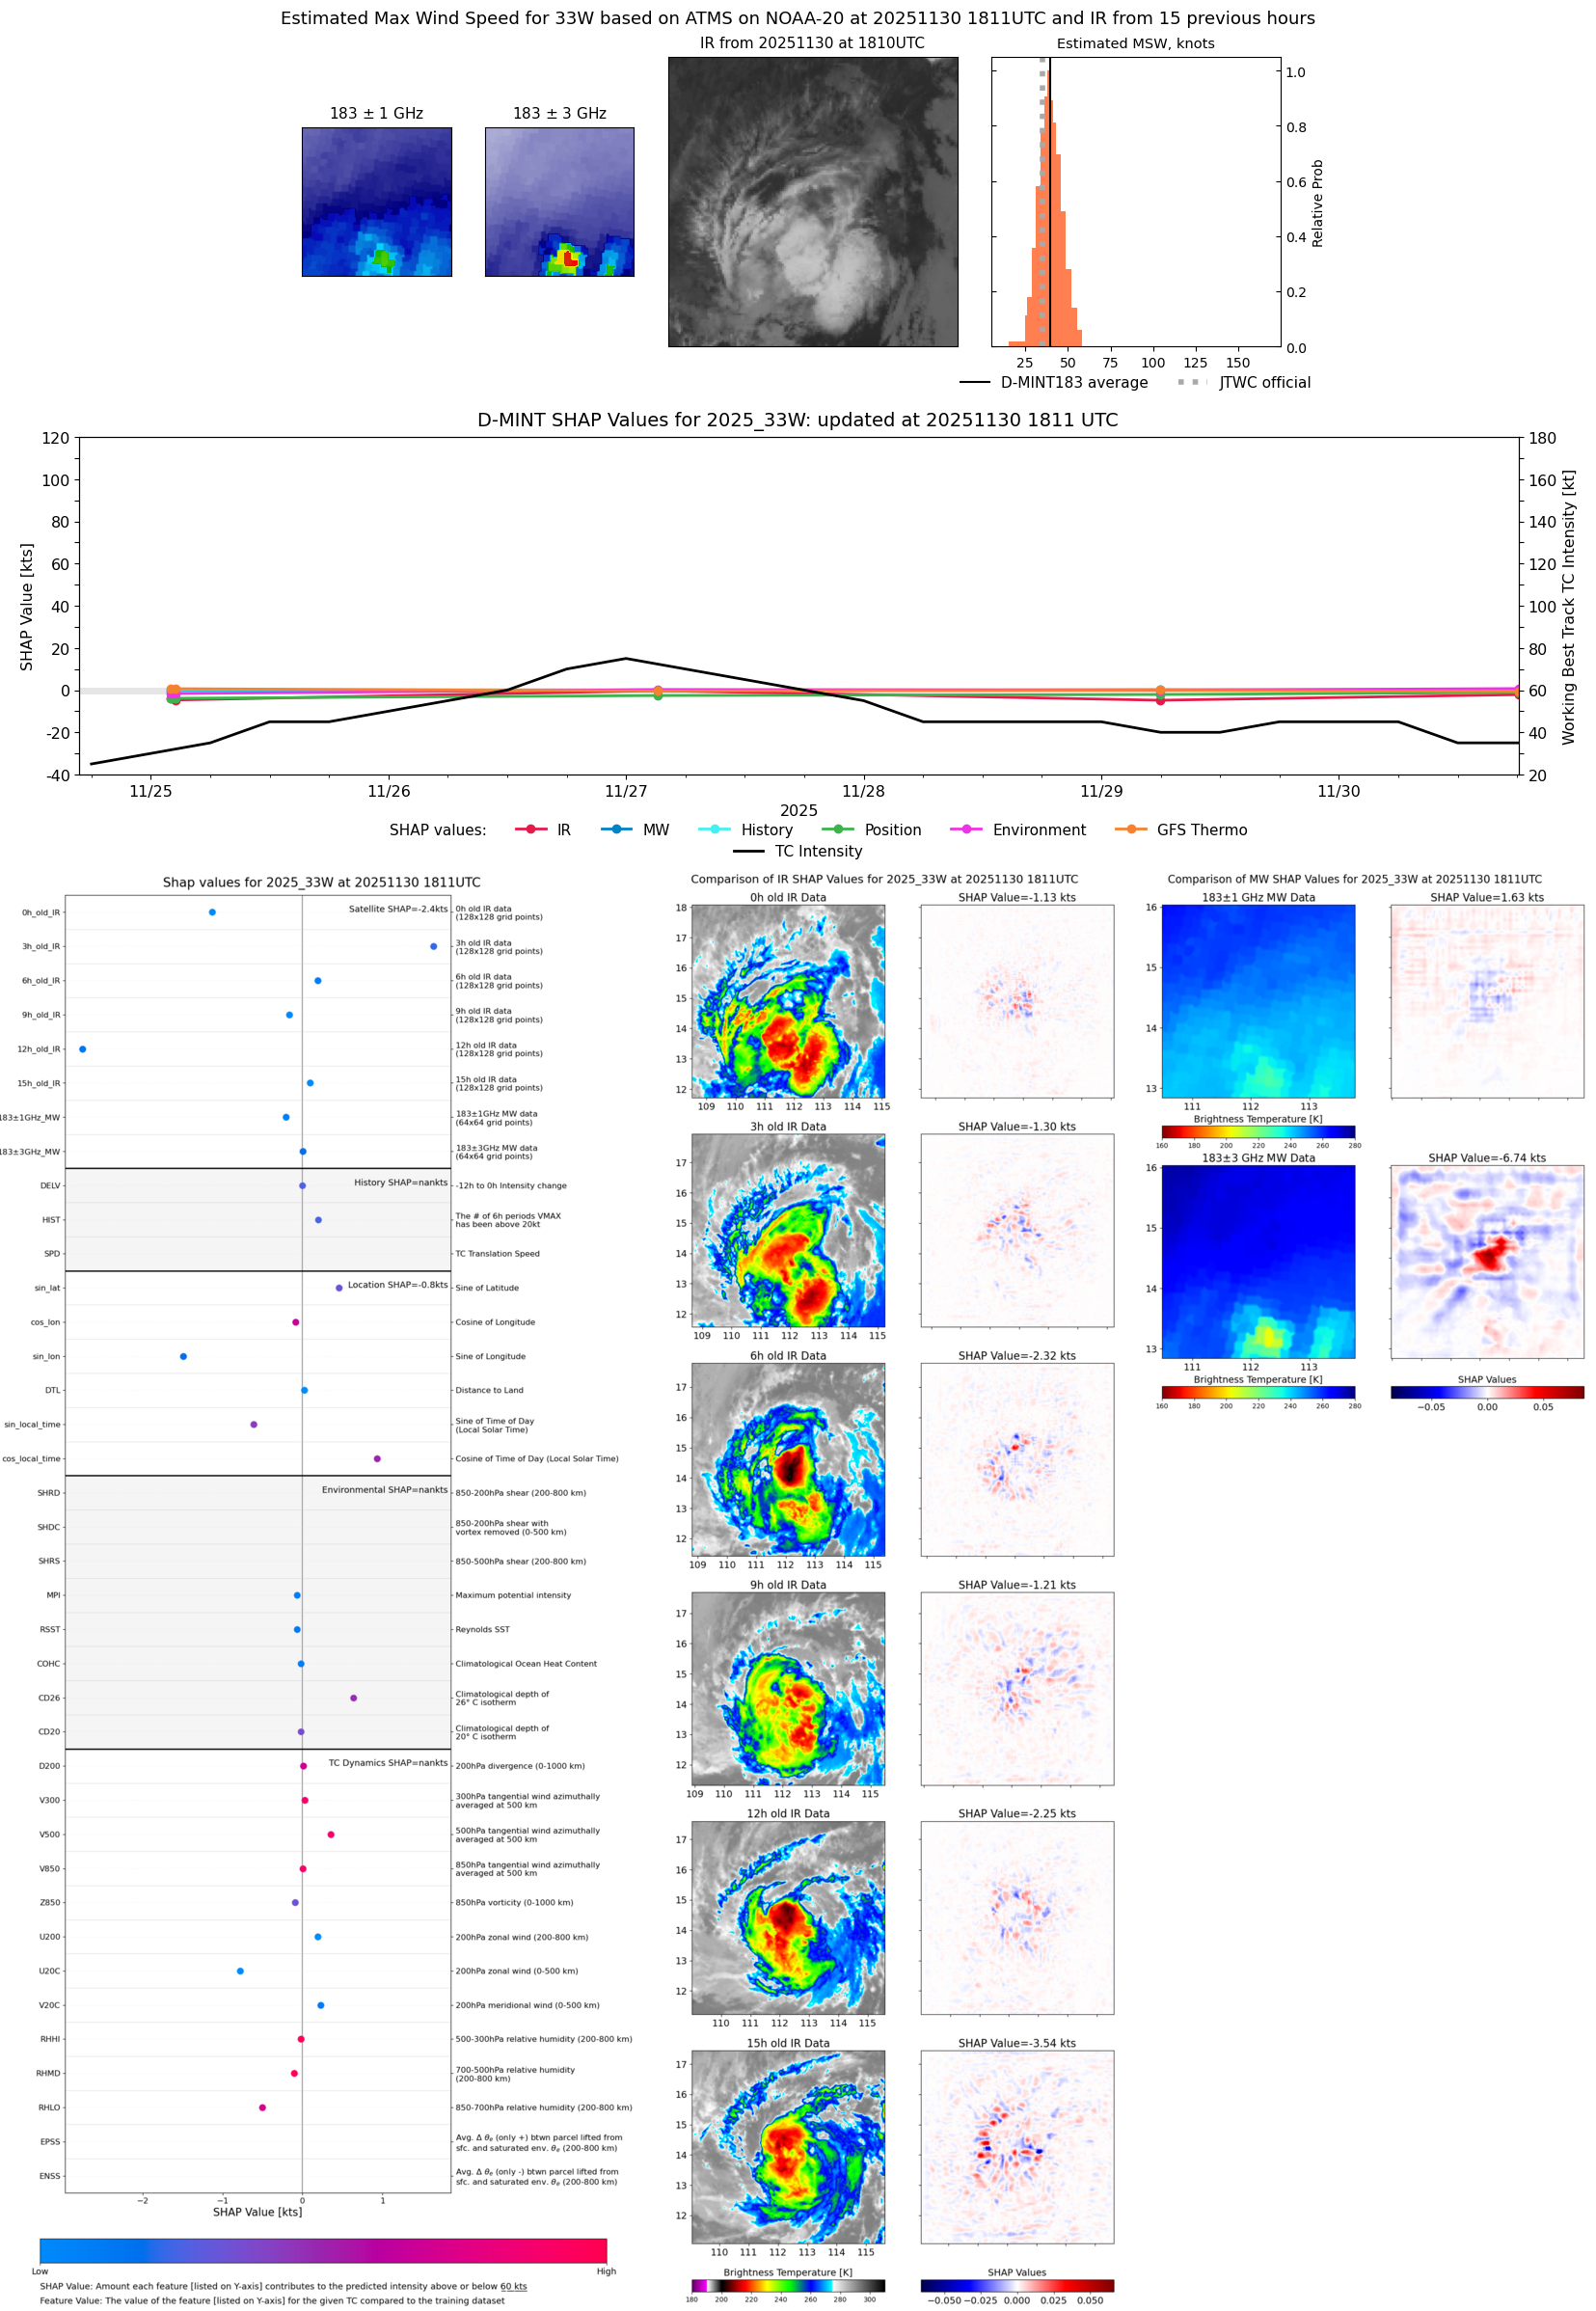 |
| 20251130 | 1618 UTC | GMI | 999 hPa | 34 kts | 30 kts | 39 kts |  |
| 20251130 | 1450 UTC | AWS | 1000 hPa | 40 kts | 36 kts | 46 kts | 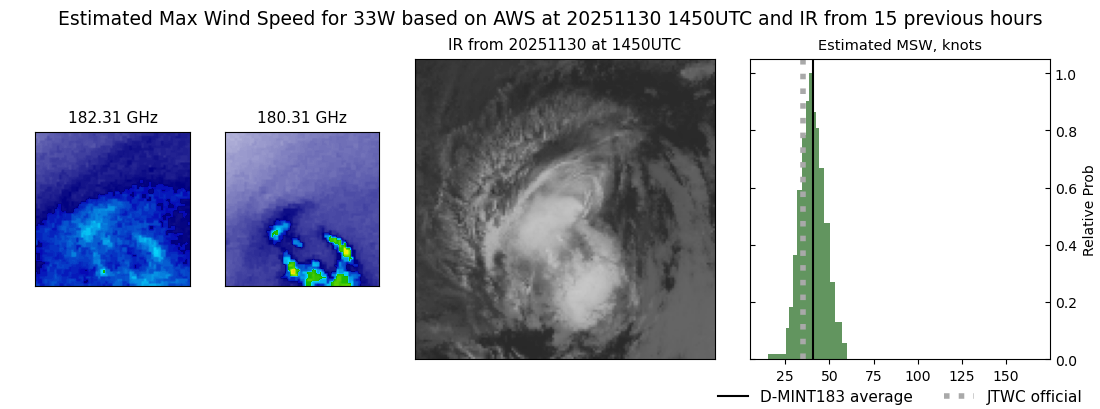 |
| 20251130 | 1050 UTC | SSMISF16 | 994 hPa | 39 kts | 35 kts | 45 kts |  |
| 20251130 | 0824 UTC | SSMISF18 | 993 hPa | 45 kts | 39 kts | 51 kts |  |
| 20251130 | 0538 UTC | ATMS-N20 | 998 hPa | 35 kts | 29 kts | 41 kts | 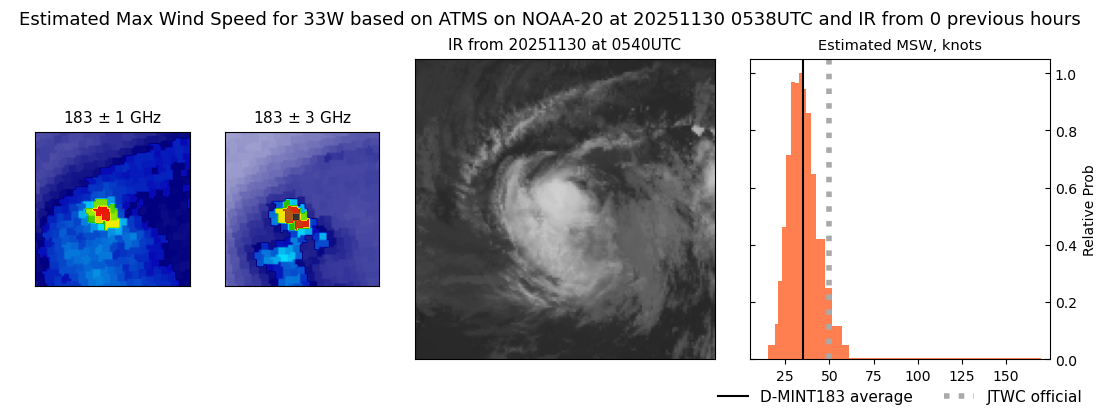 |
| 20251130 | 0247 UTC | TMS05 | 993 hPa | 47 kts | 43 kts | 53 kts | 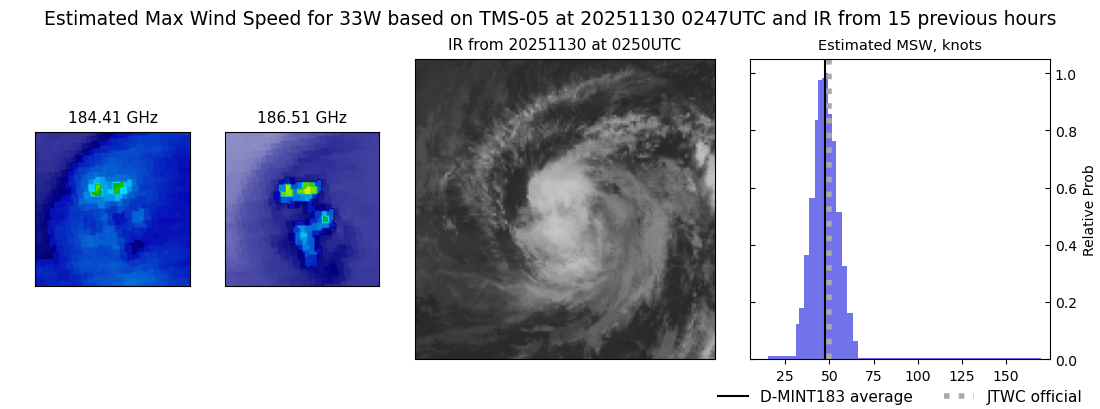 |
| 20251129 | 2339 UTC | SSMISF16 | 992 hPa | 36 kts | 32 kts | 42 kts |  |
| 20251129 | 2221 UTC | SSMISF17 | 994 hPa | 44 kts | 40 kts | 49 kts | 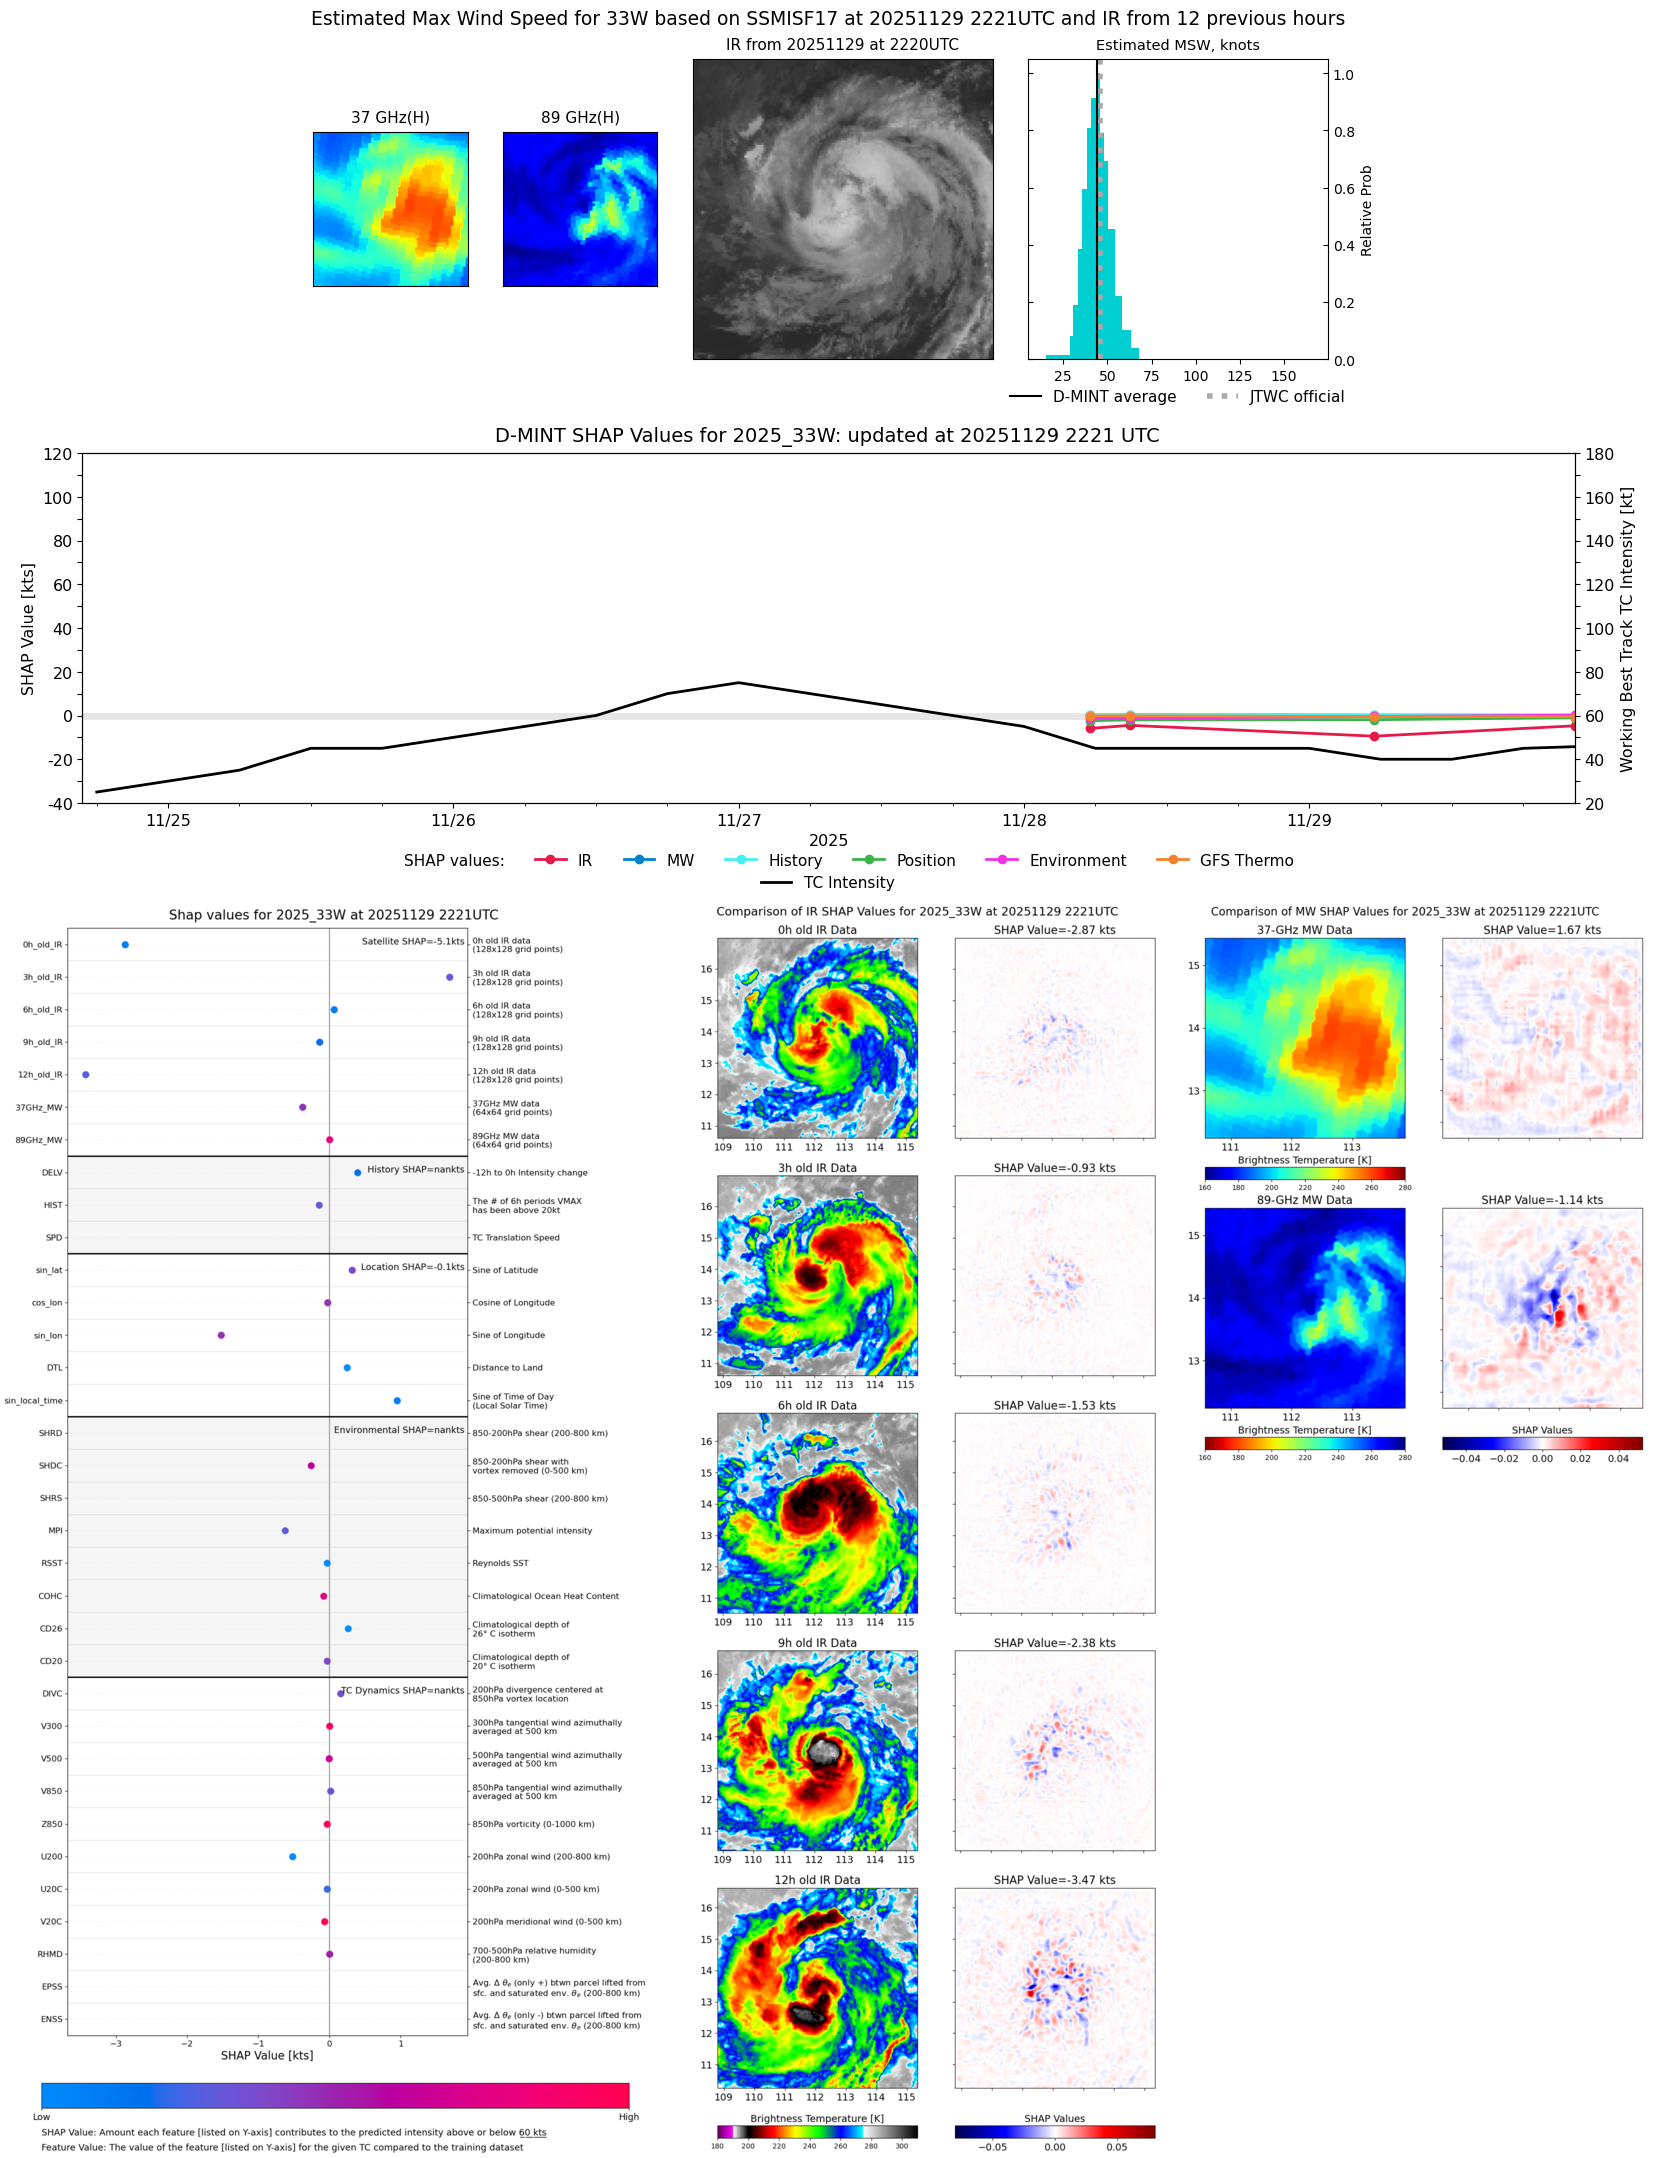 |
| 20251129 | 1832 UTC | AMSR2 | 996 hPa | 44 kts | 40 kts | 49 kts | 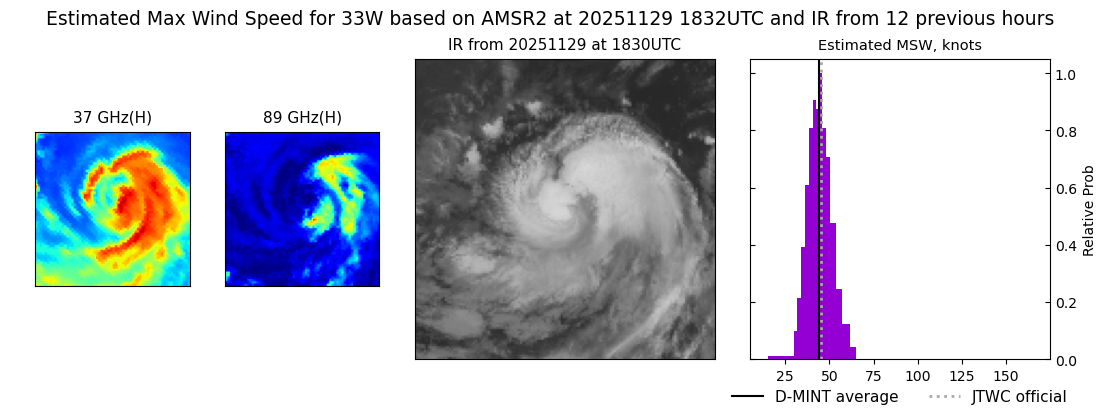 |
| 20251129 | 1823 UTC | TMS07 | 999 hPa | 39 kts | 35 kts | 44 kts | 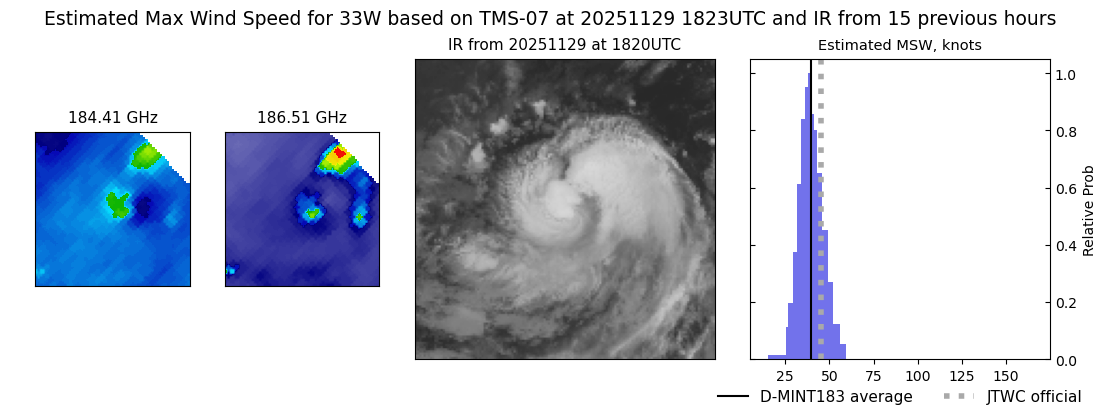 |
| 20251129 | 1439 UTC | AWS | 996 hPa | 42 kts | 38 kts | 47 kts | 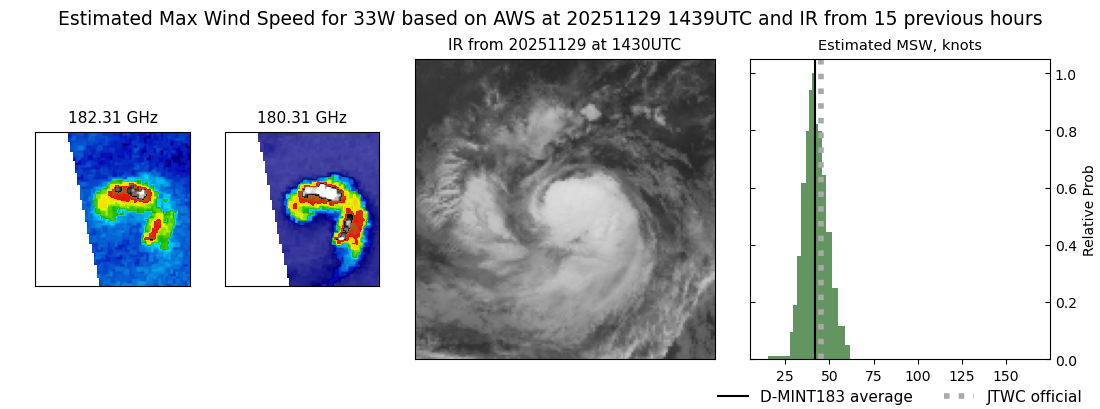 |
| 20251129 | 1439 UTC | TMS05 | 997 hPa | 41 kts | 37 kts | 46 kts | 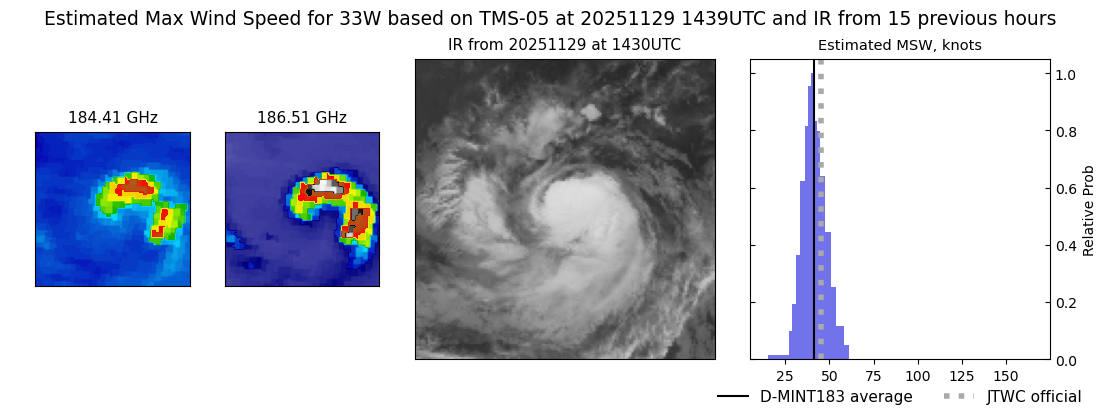 |
| 20251129 | 1011 UTC | WSFM01 | 996 hPa | 39 kts | 35 kts | 43 kts | 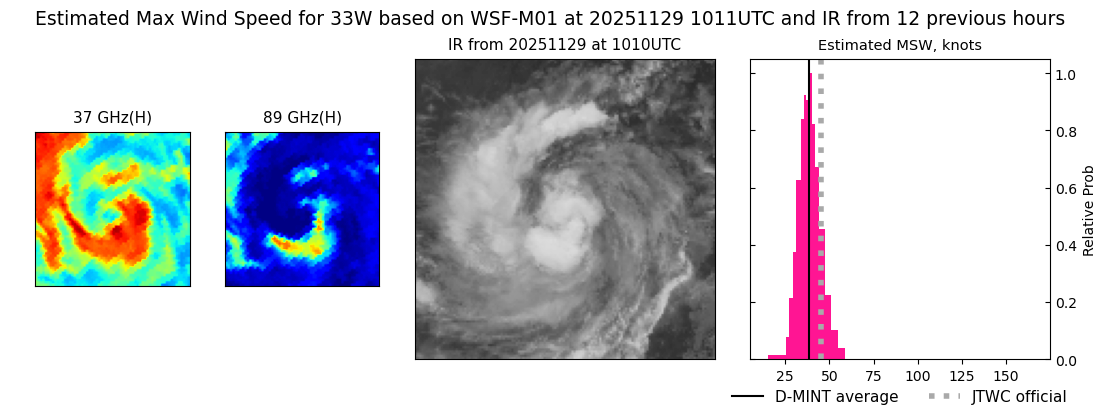 |
| 20251129 | 0838 UTC | SSMISF18 | 999 hPa | 35 kts | 31 kts | 40 kts |  |
| 20251129 | 0814 UTC | TMS07 | 997 hPa | 39 kts | 35 kts | 44 kts |  |
| 20251129 | 0618 UTC | AMSR2 | 996 hPa | 36 kts | 32 kts | 41 kts | 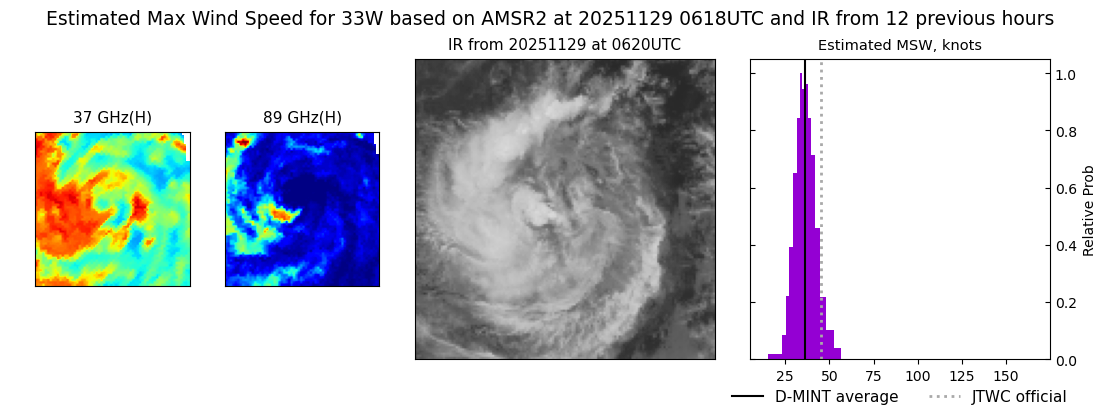 |
| 20251129 | 0556 UTC | ATMS-N20 | 996 hPa | 41 kts | 37 kts | 46 kts | 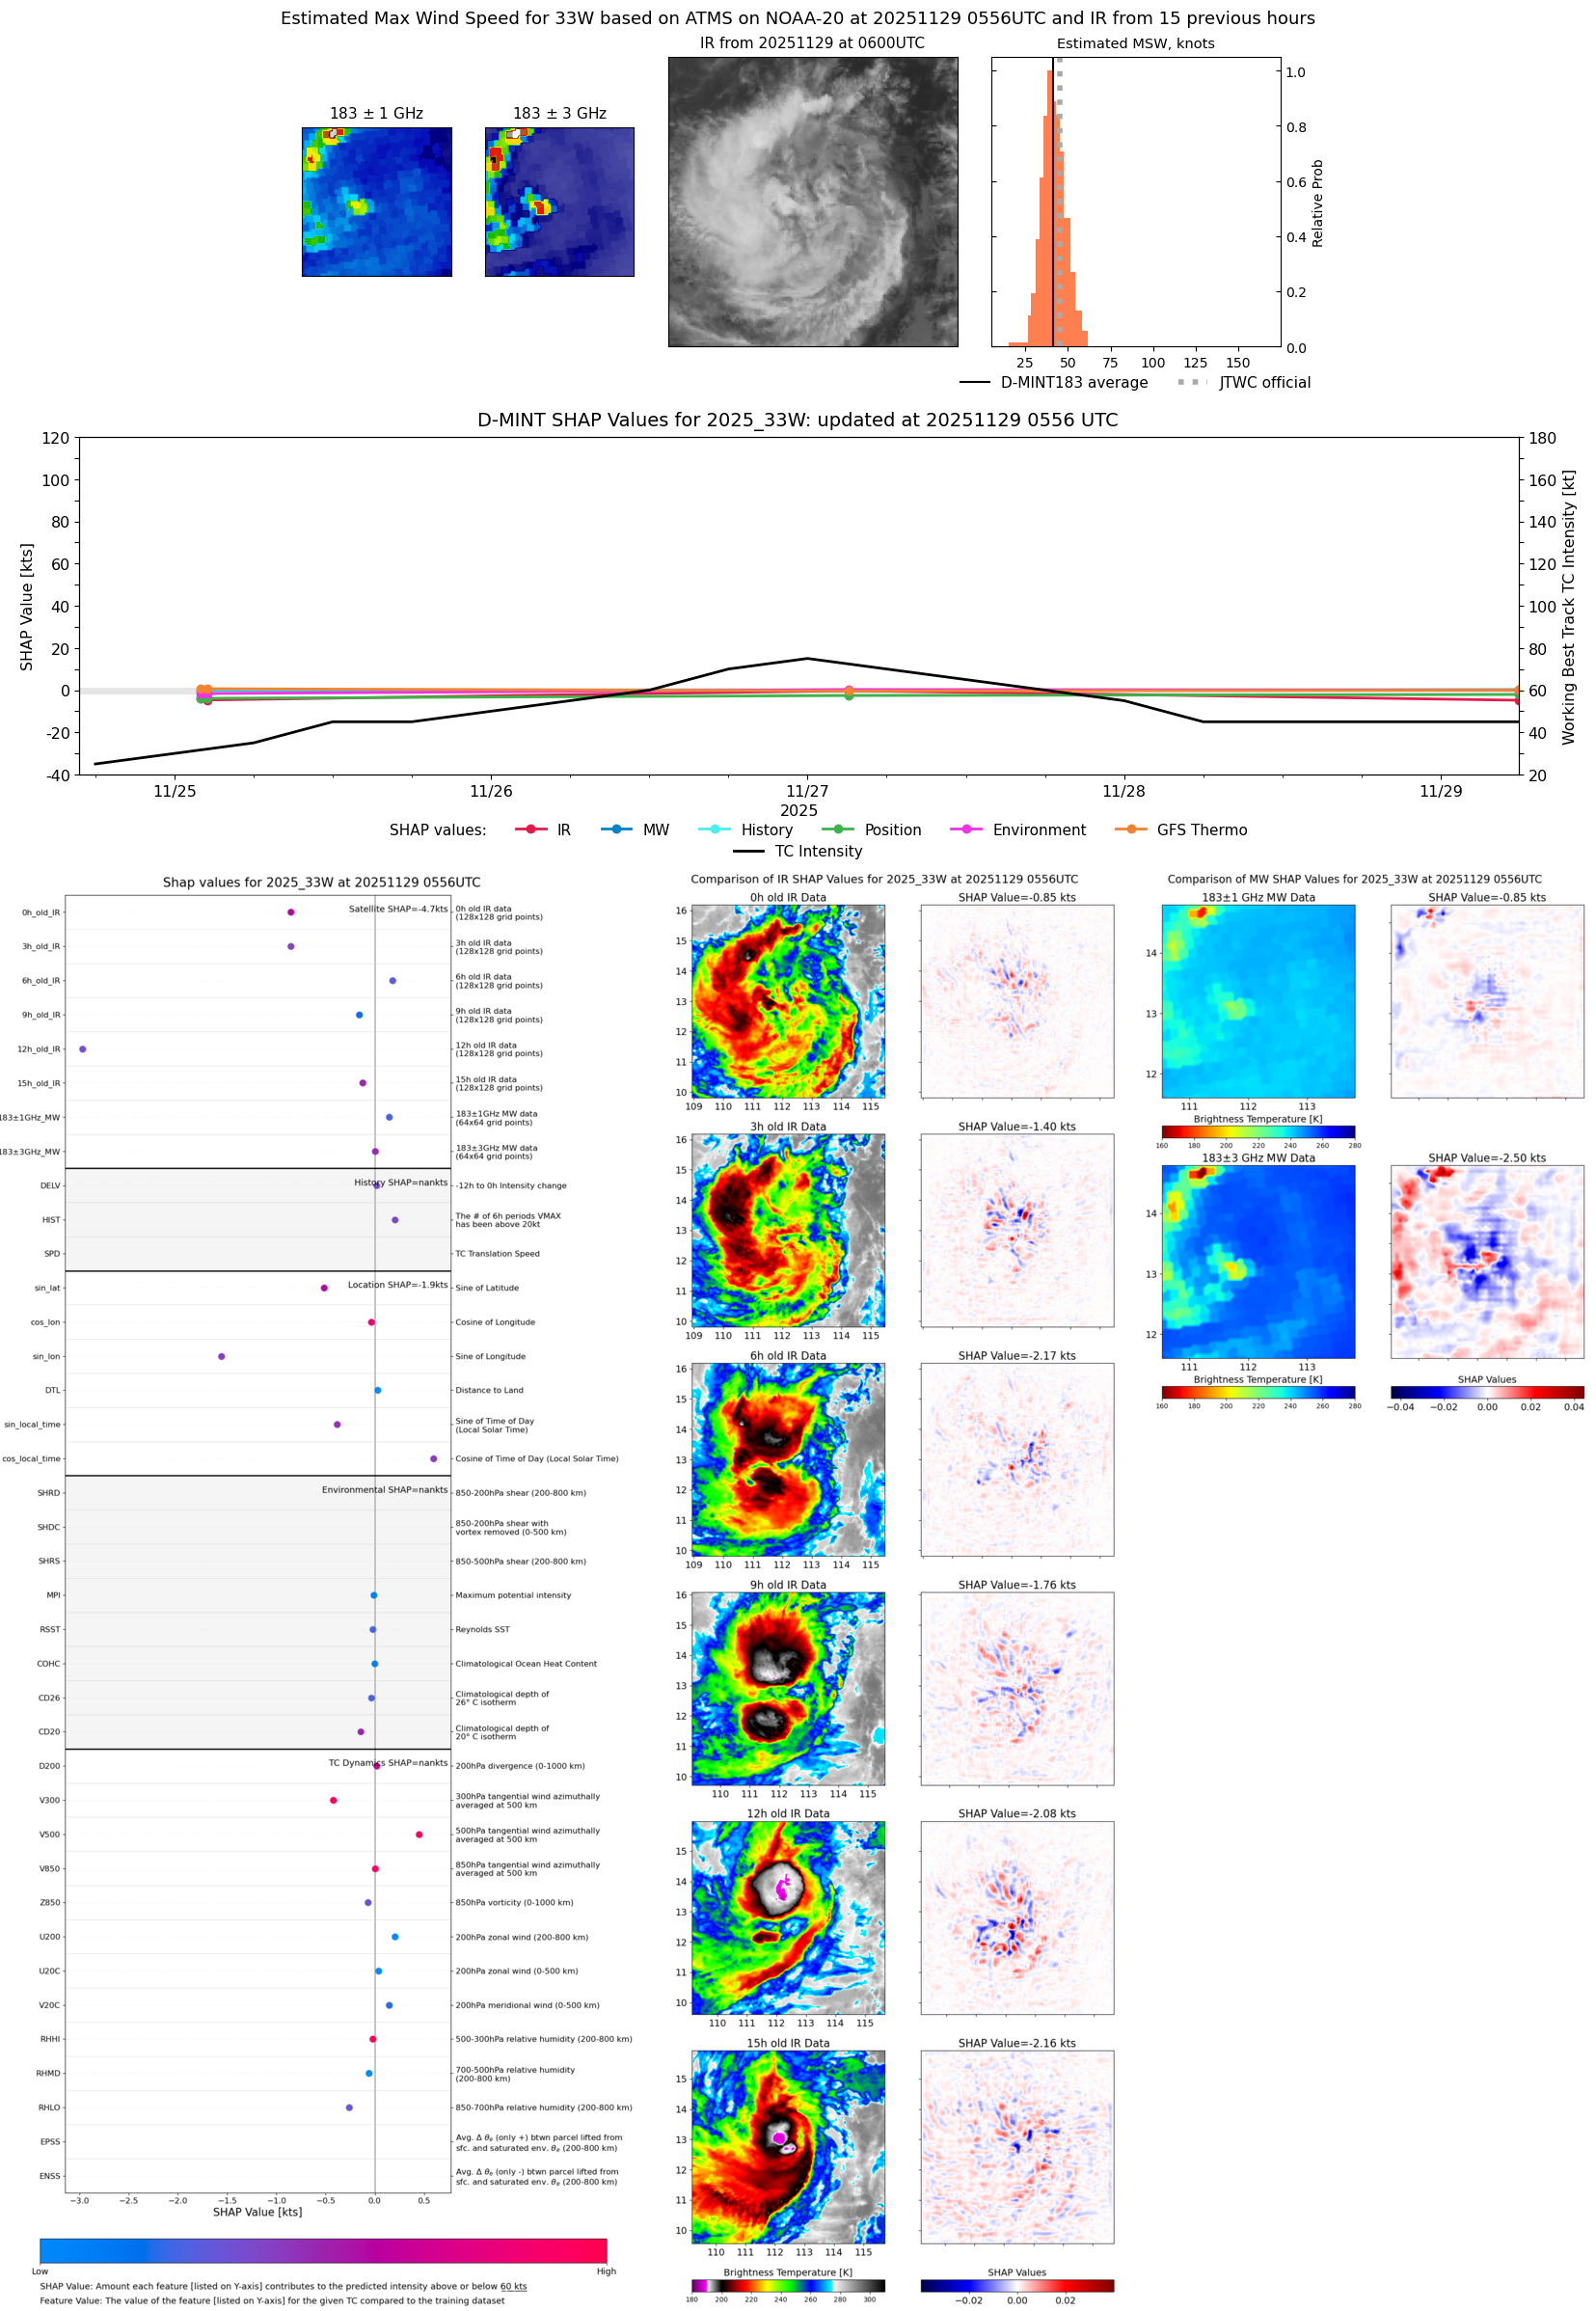 |
| 20251129 | 0528 UTC | GMI | 1000 hPa | 32 kts | 28 kts | 36 kts | 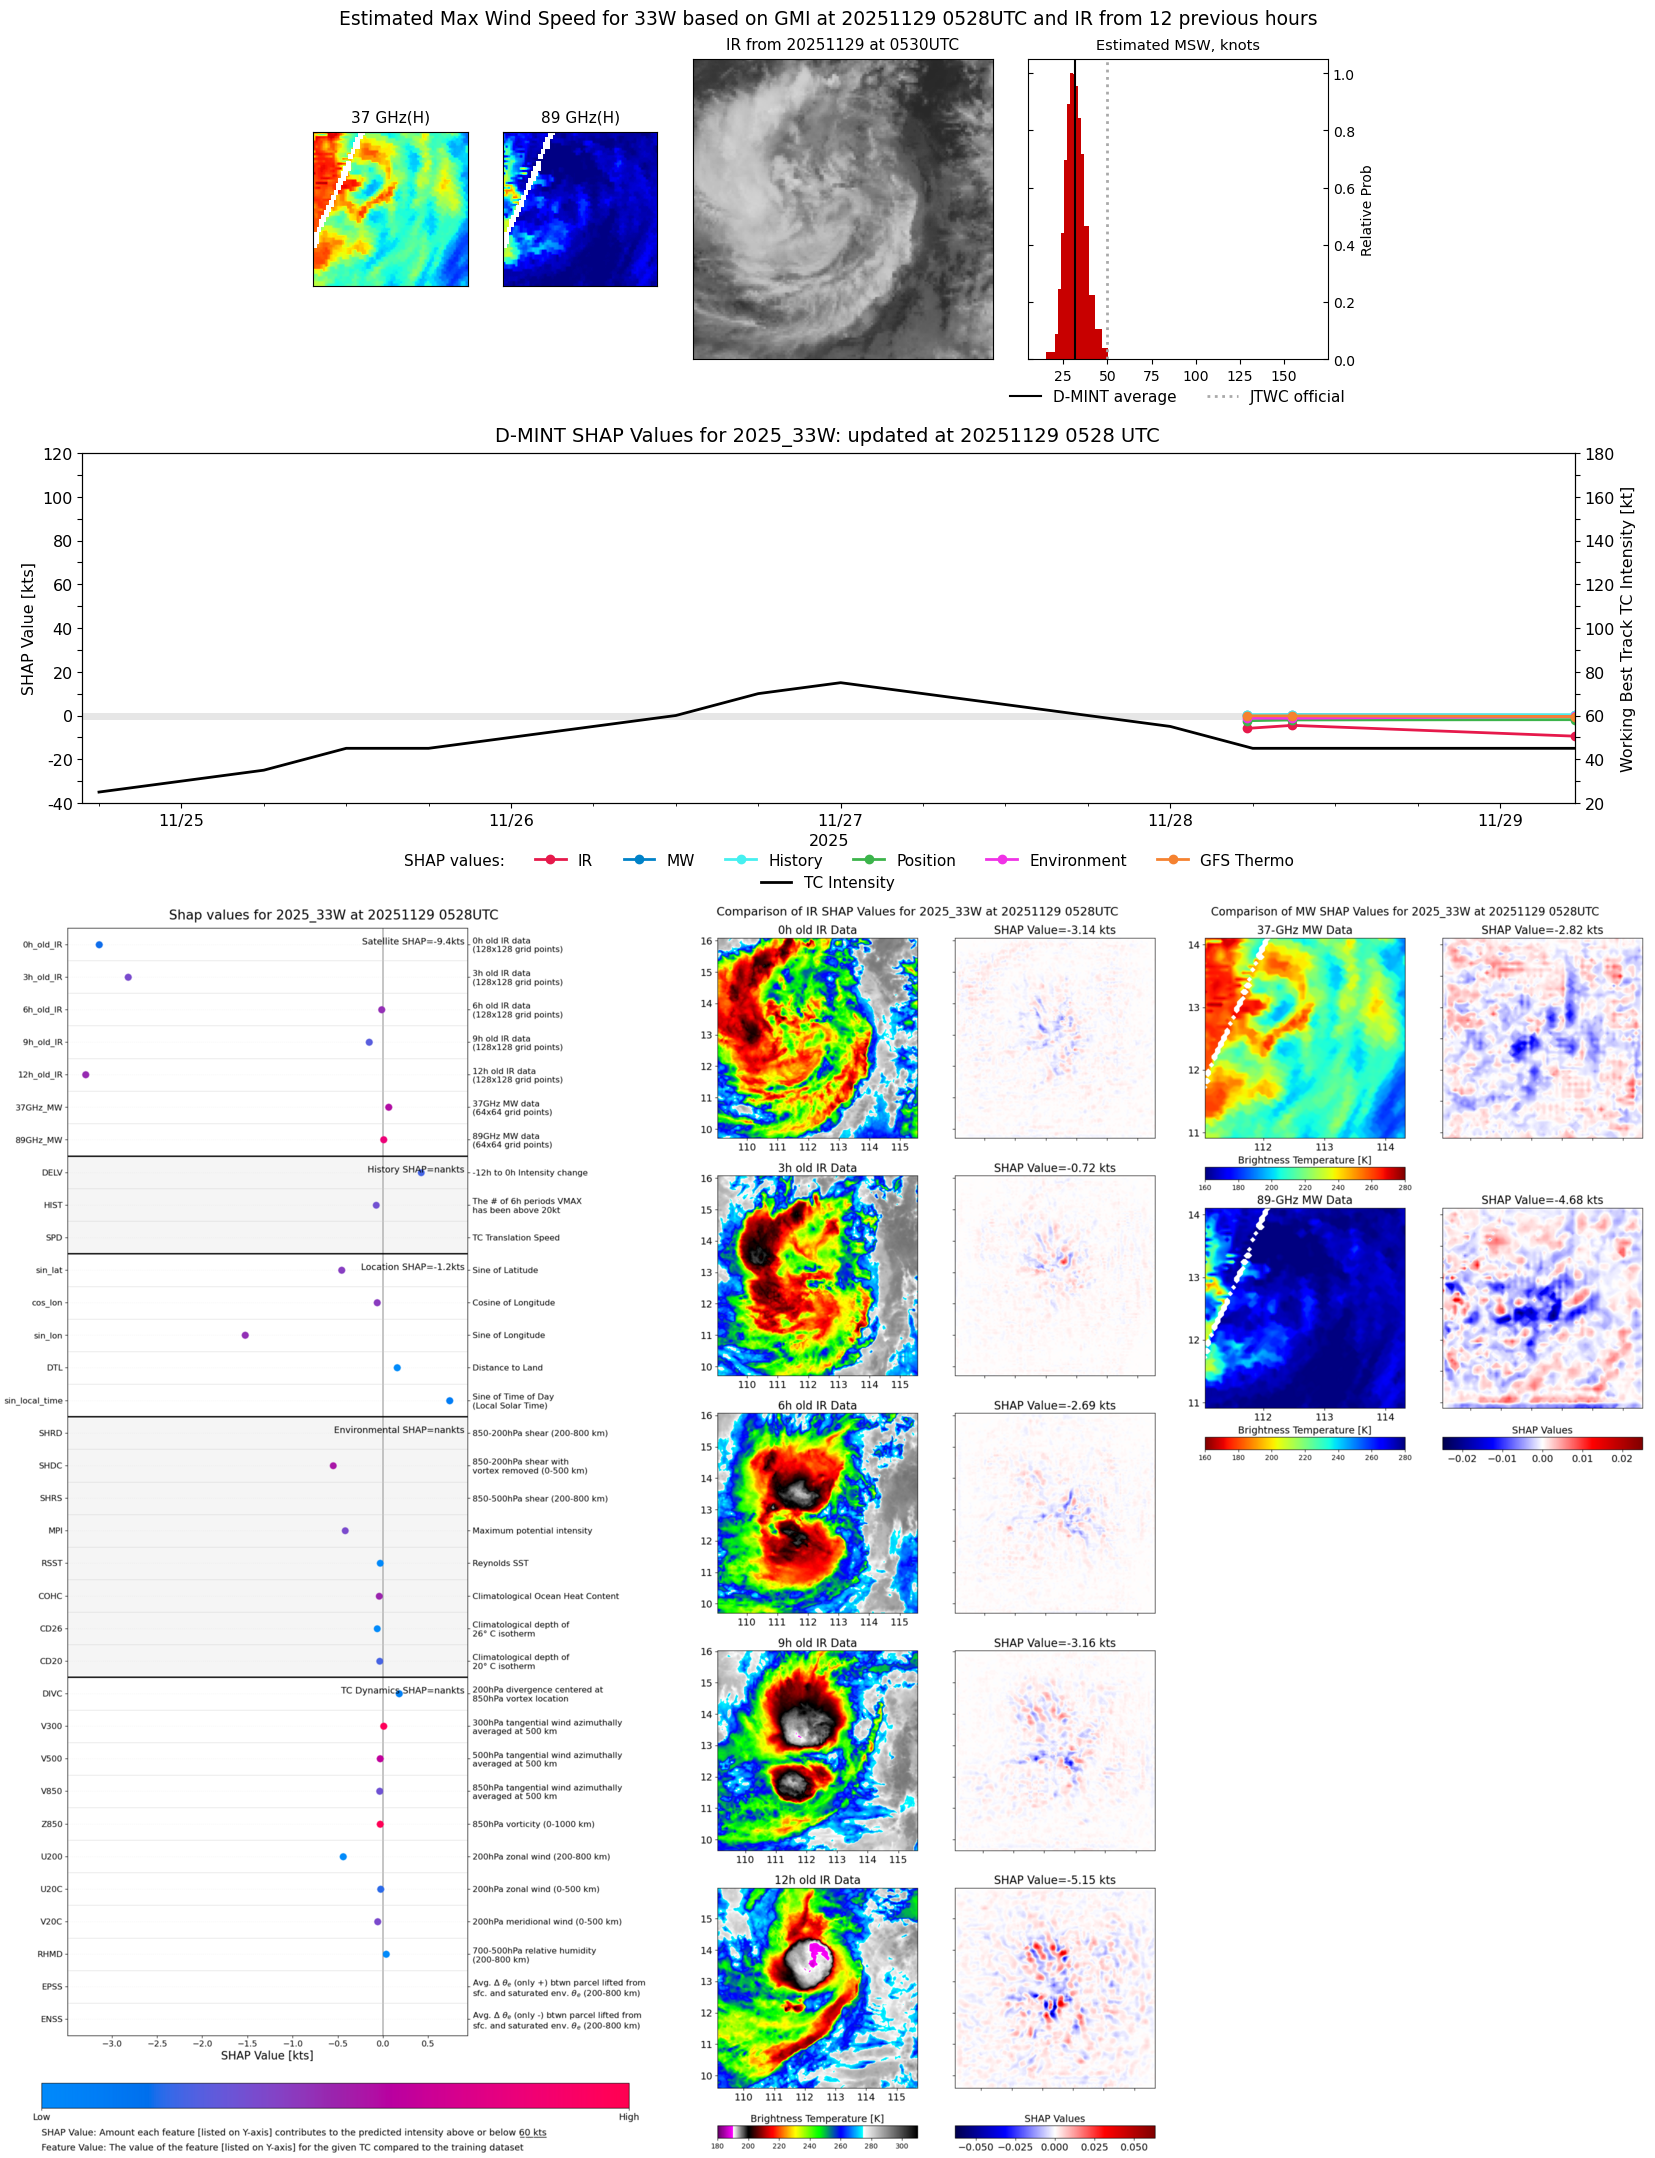 |
| 20251128 | 2354 UTC | SSMISF16 | 996 hPa | 38 kts | 34 kts | 43 kts | 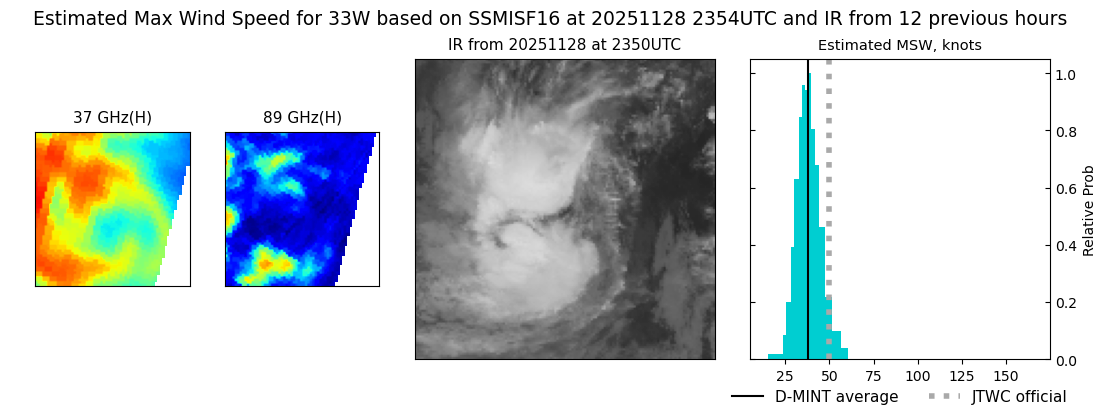 |
| 20251128 | 2305 UTC | WSFM01 | 997 hPa | 36 kts | 32 kts | 41 kts | 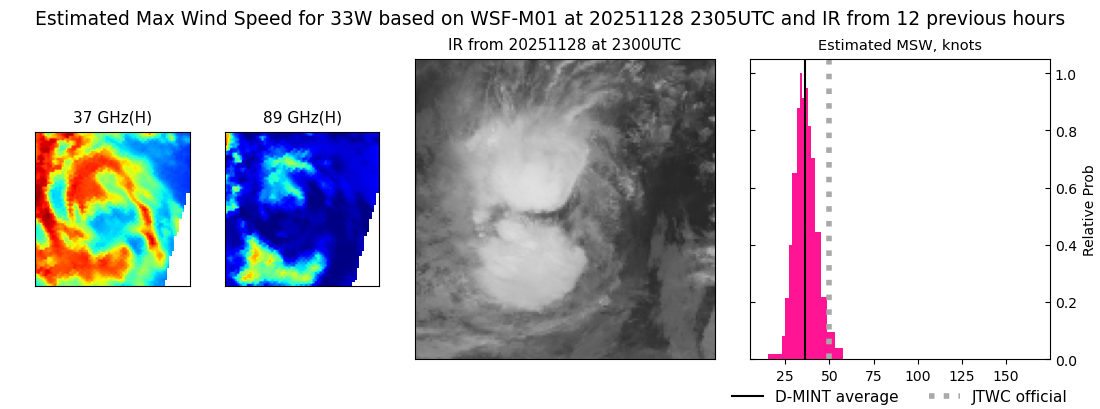 |
| 20251128 | 2235 UTC | SSMISF17 | 996 hPa | 35 kts | 31 kts | 40 kts |  |
| 20251128 | 1815 UTC | TMS07 | 1001 hPa | 33 kts | 29 kts | 38 kts | 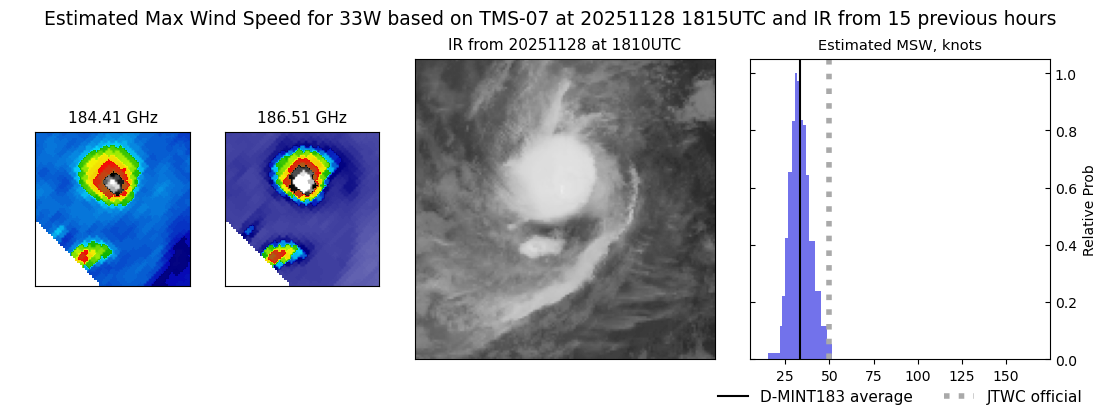 |
| 20251128 | 1758 UTC | ATMS-N21 | 1000 hPa | 37 kts | 32 kts | 41 kts | 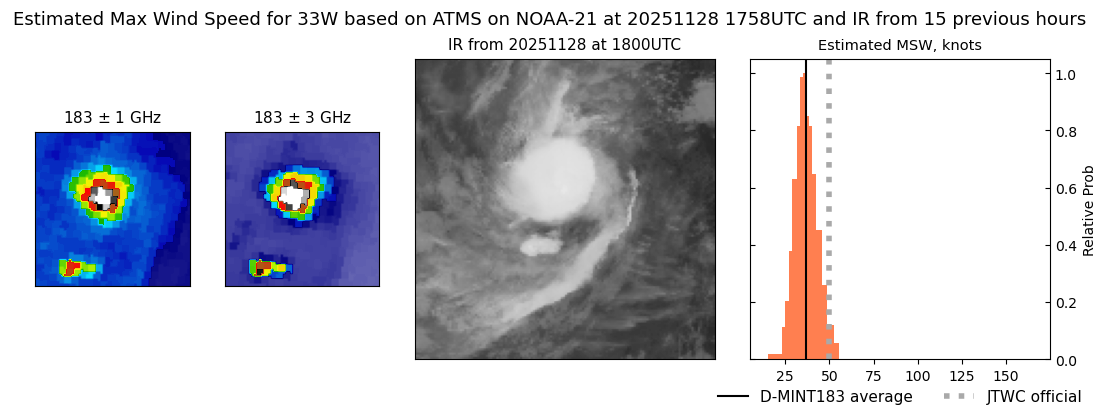 |
| 20251128 | 1749 UTC | AMSR2 | 999 hPa | 35 kts | 31 kts | 39 kts | 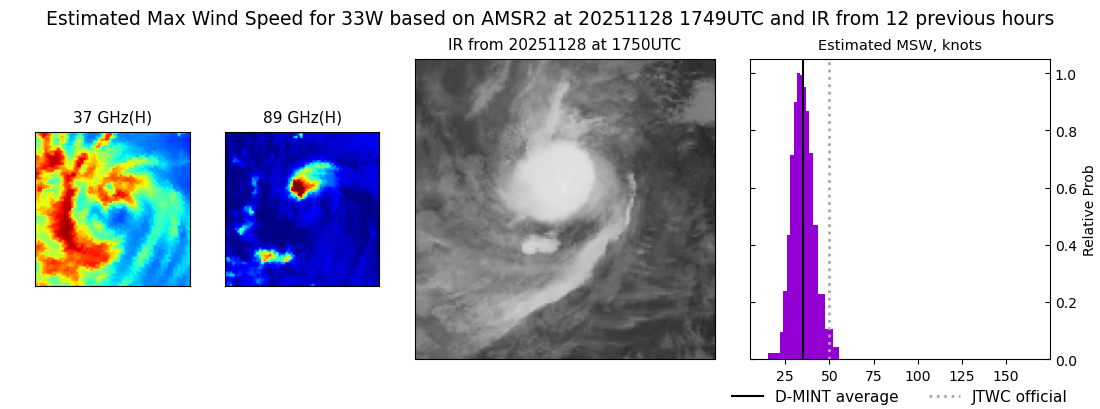 |
| 20251128 | 1504 UTC | TMS05 | 1002 hPa | 35 kts | 31 kts | 40 kts |  |
| 20251128 | 1452 UTC | TMS02 | 999 hPa | 40 kts | 36 kts | 45 kts |  |
| 20251128 | 1031 UTC | WSFM01 | 999 hPa | 35 kts | 31 kts | 39 kts | 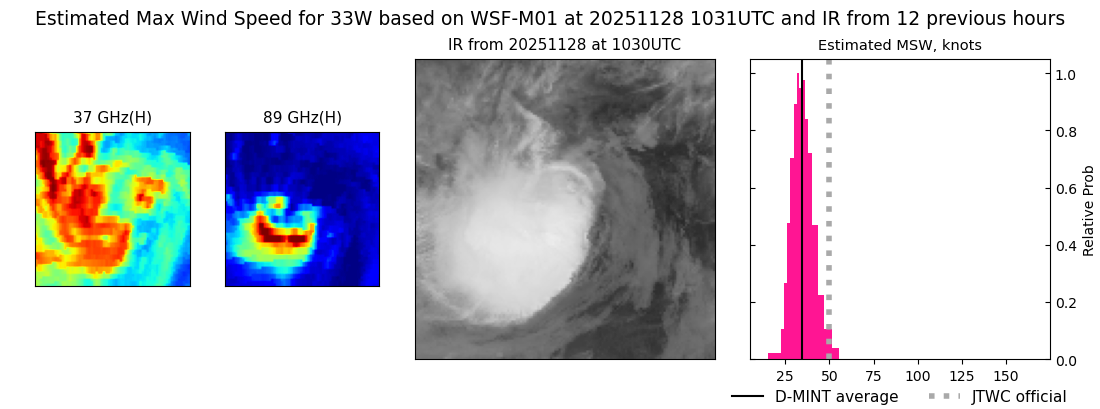 |
| 20251128 | 0959 UTC | SSMISF17 | 1000 hPa | 35 kts | 30 kts | 39 kts | 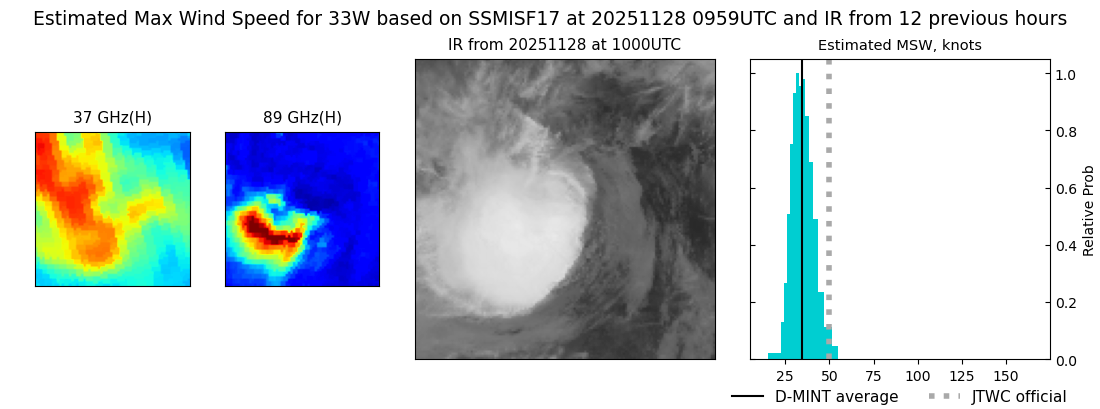 |
| 20251128 | 0853 UTC | SSMISF18 | 1000 hPa | 34 kts | 30 kts | 39 kts | 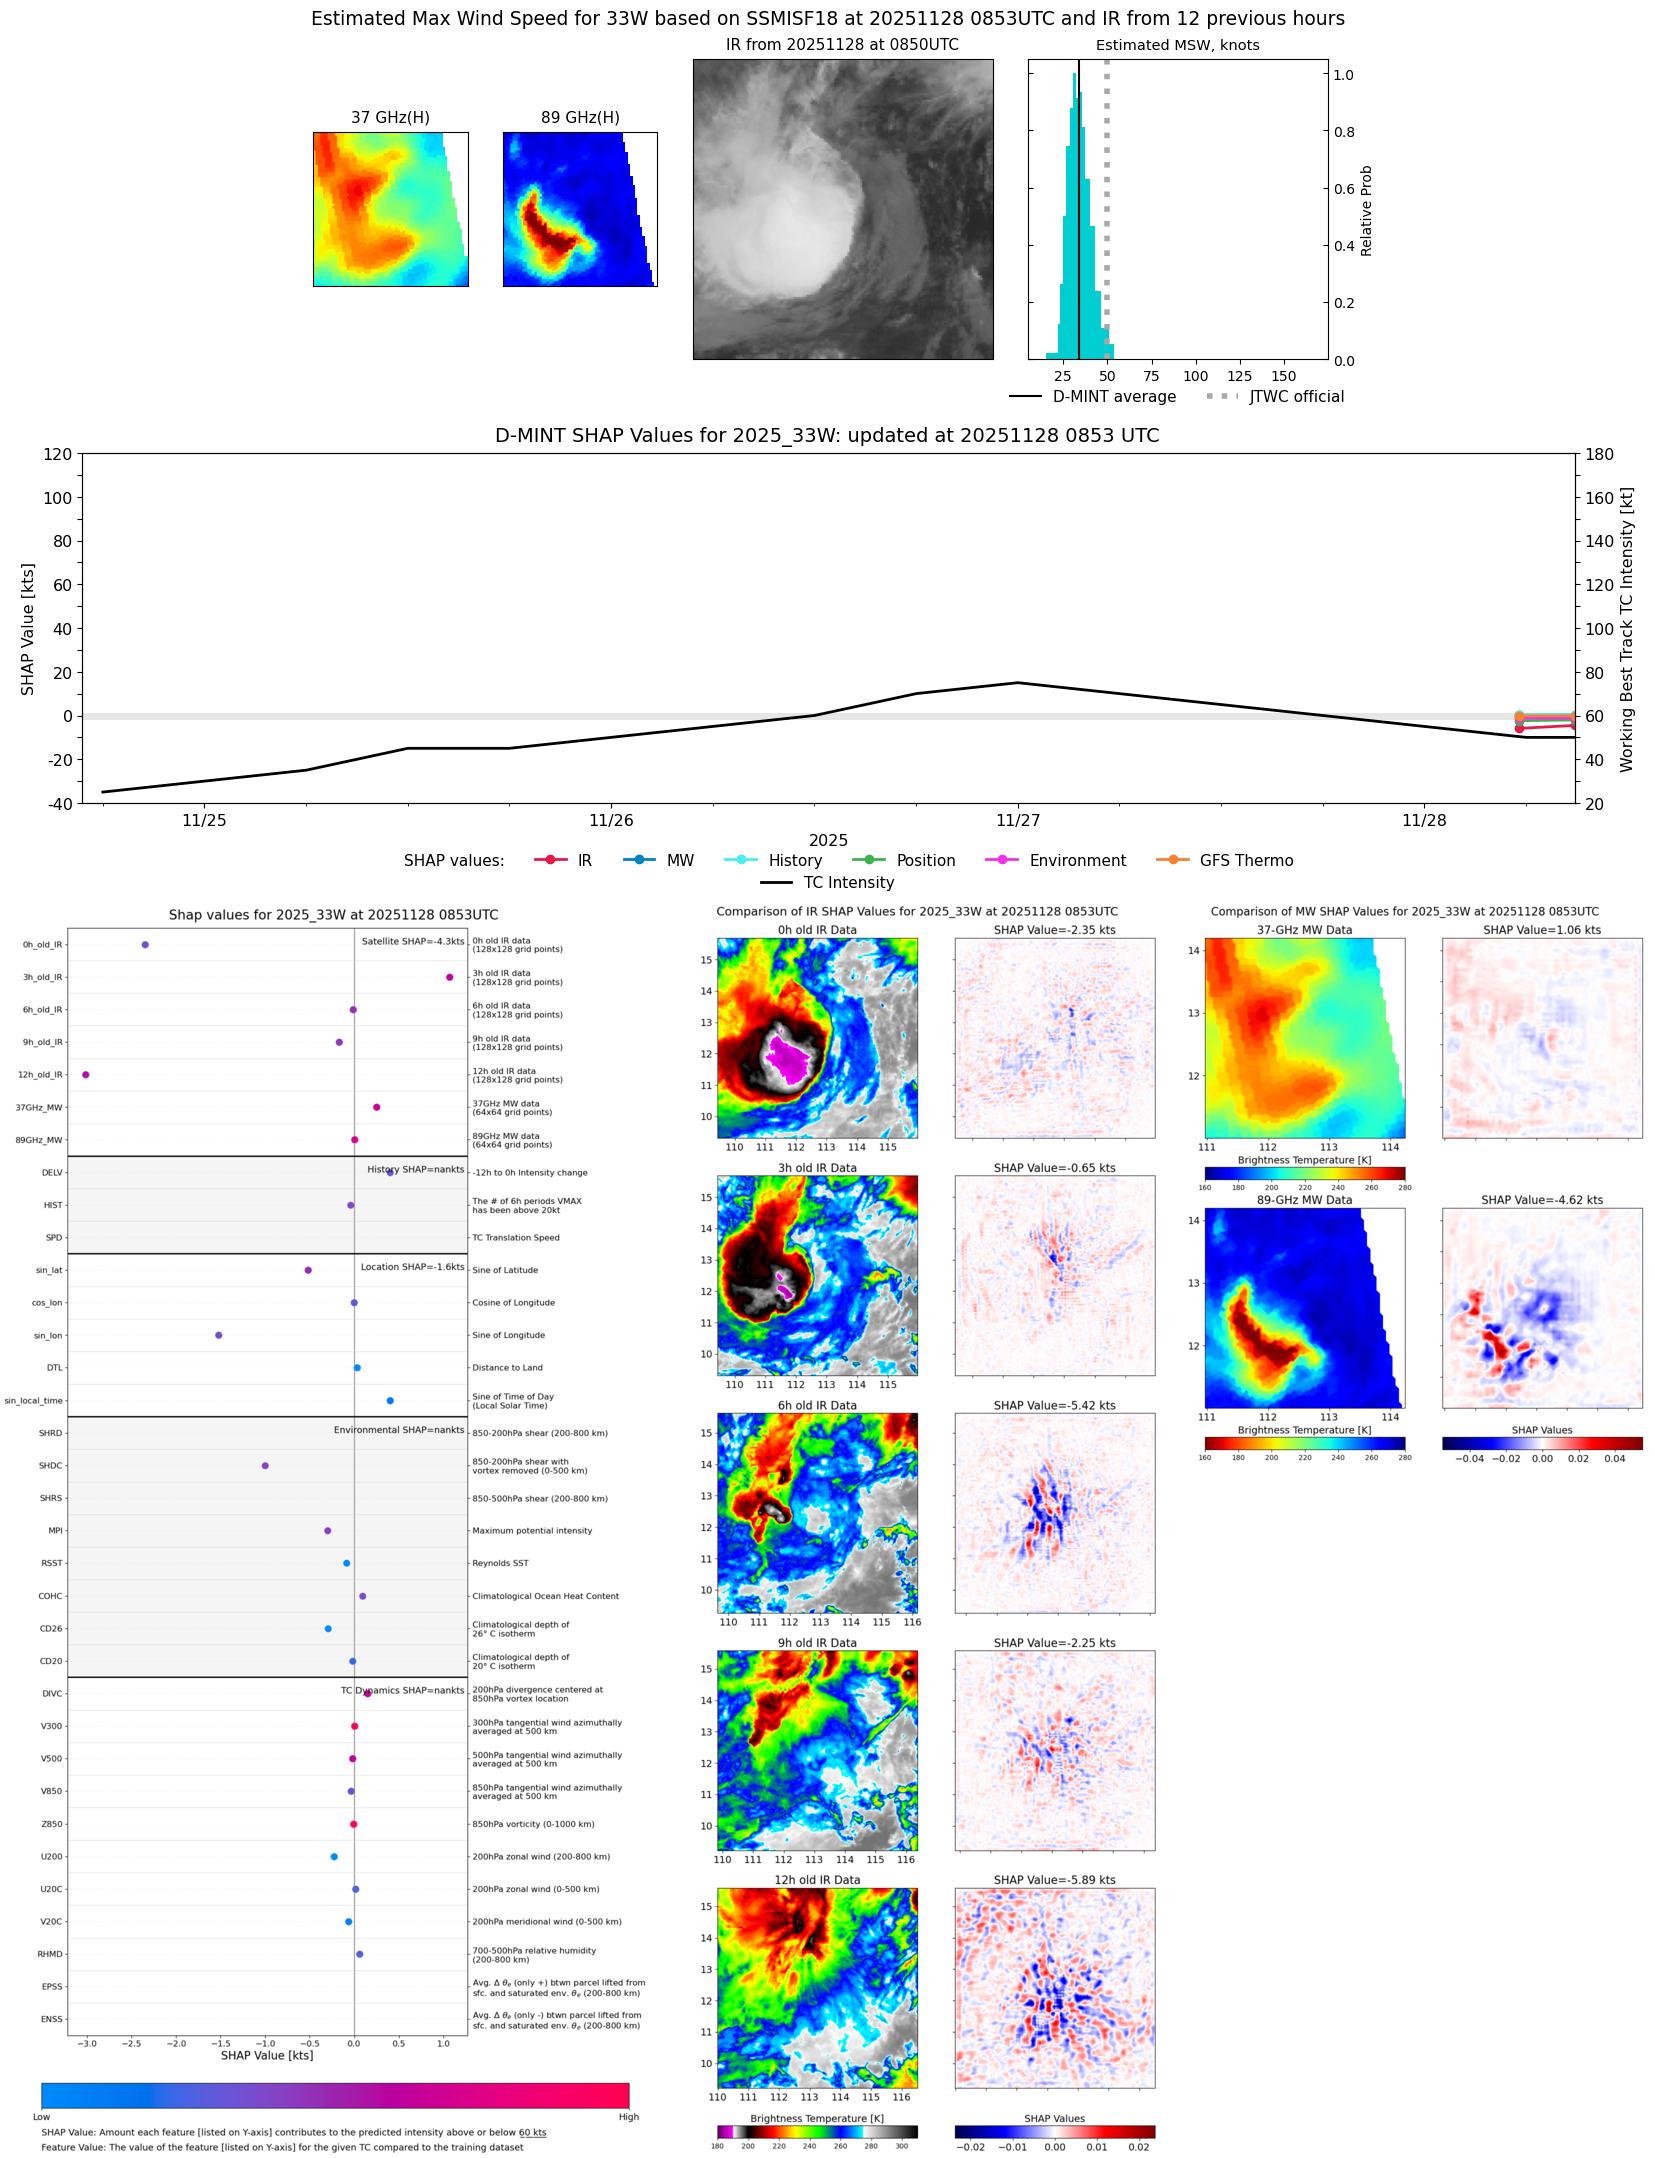 |
| 20251128 | 0535 UTC | AMSR2 | 1000 hPa | 34 kts | 30 kts | 38 kts | 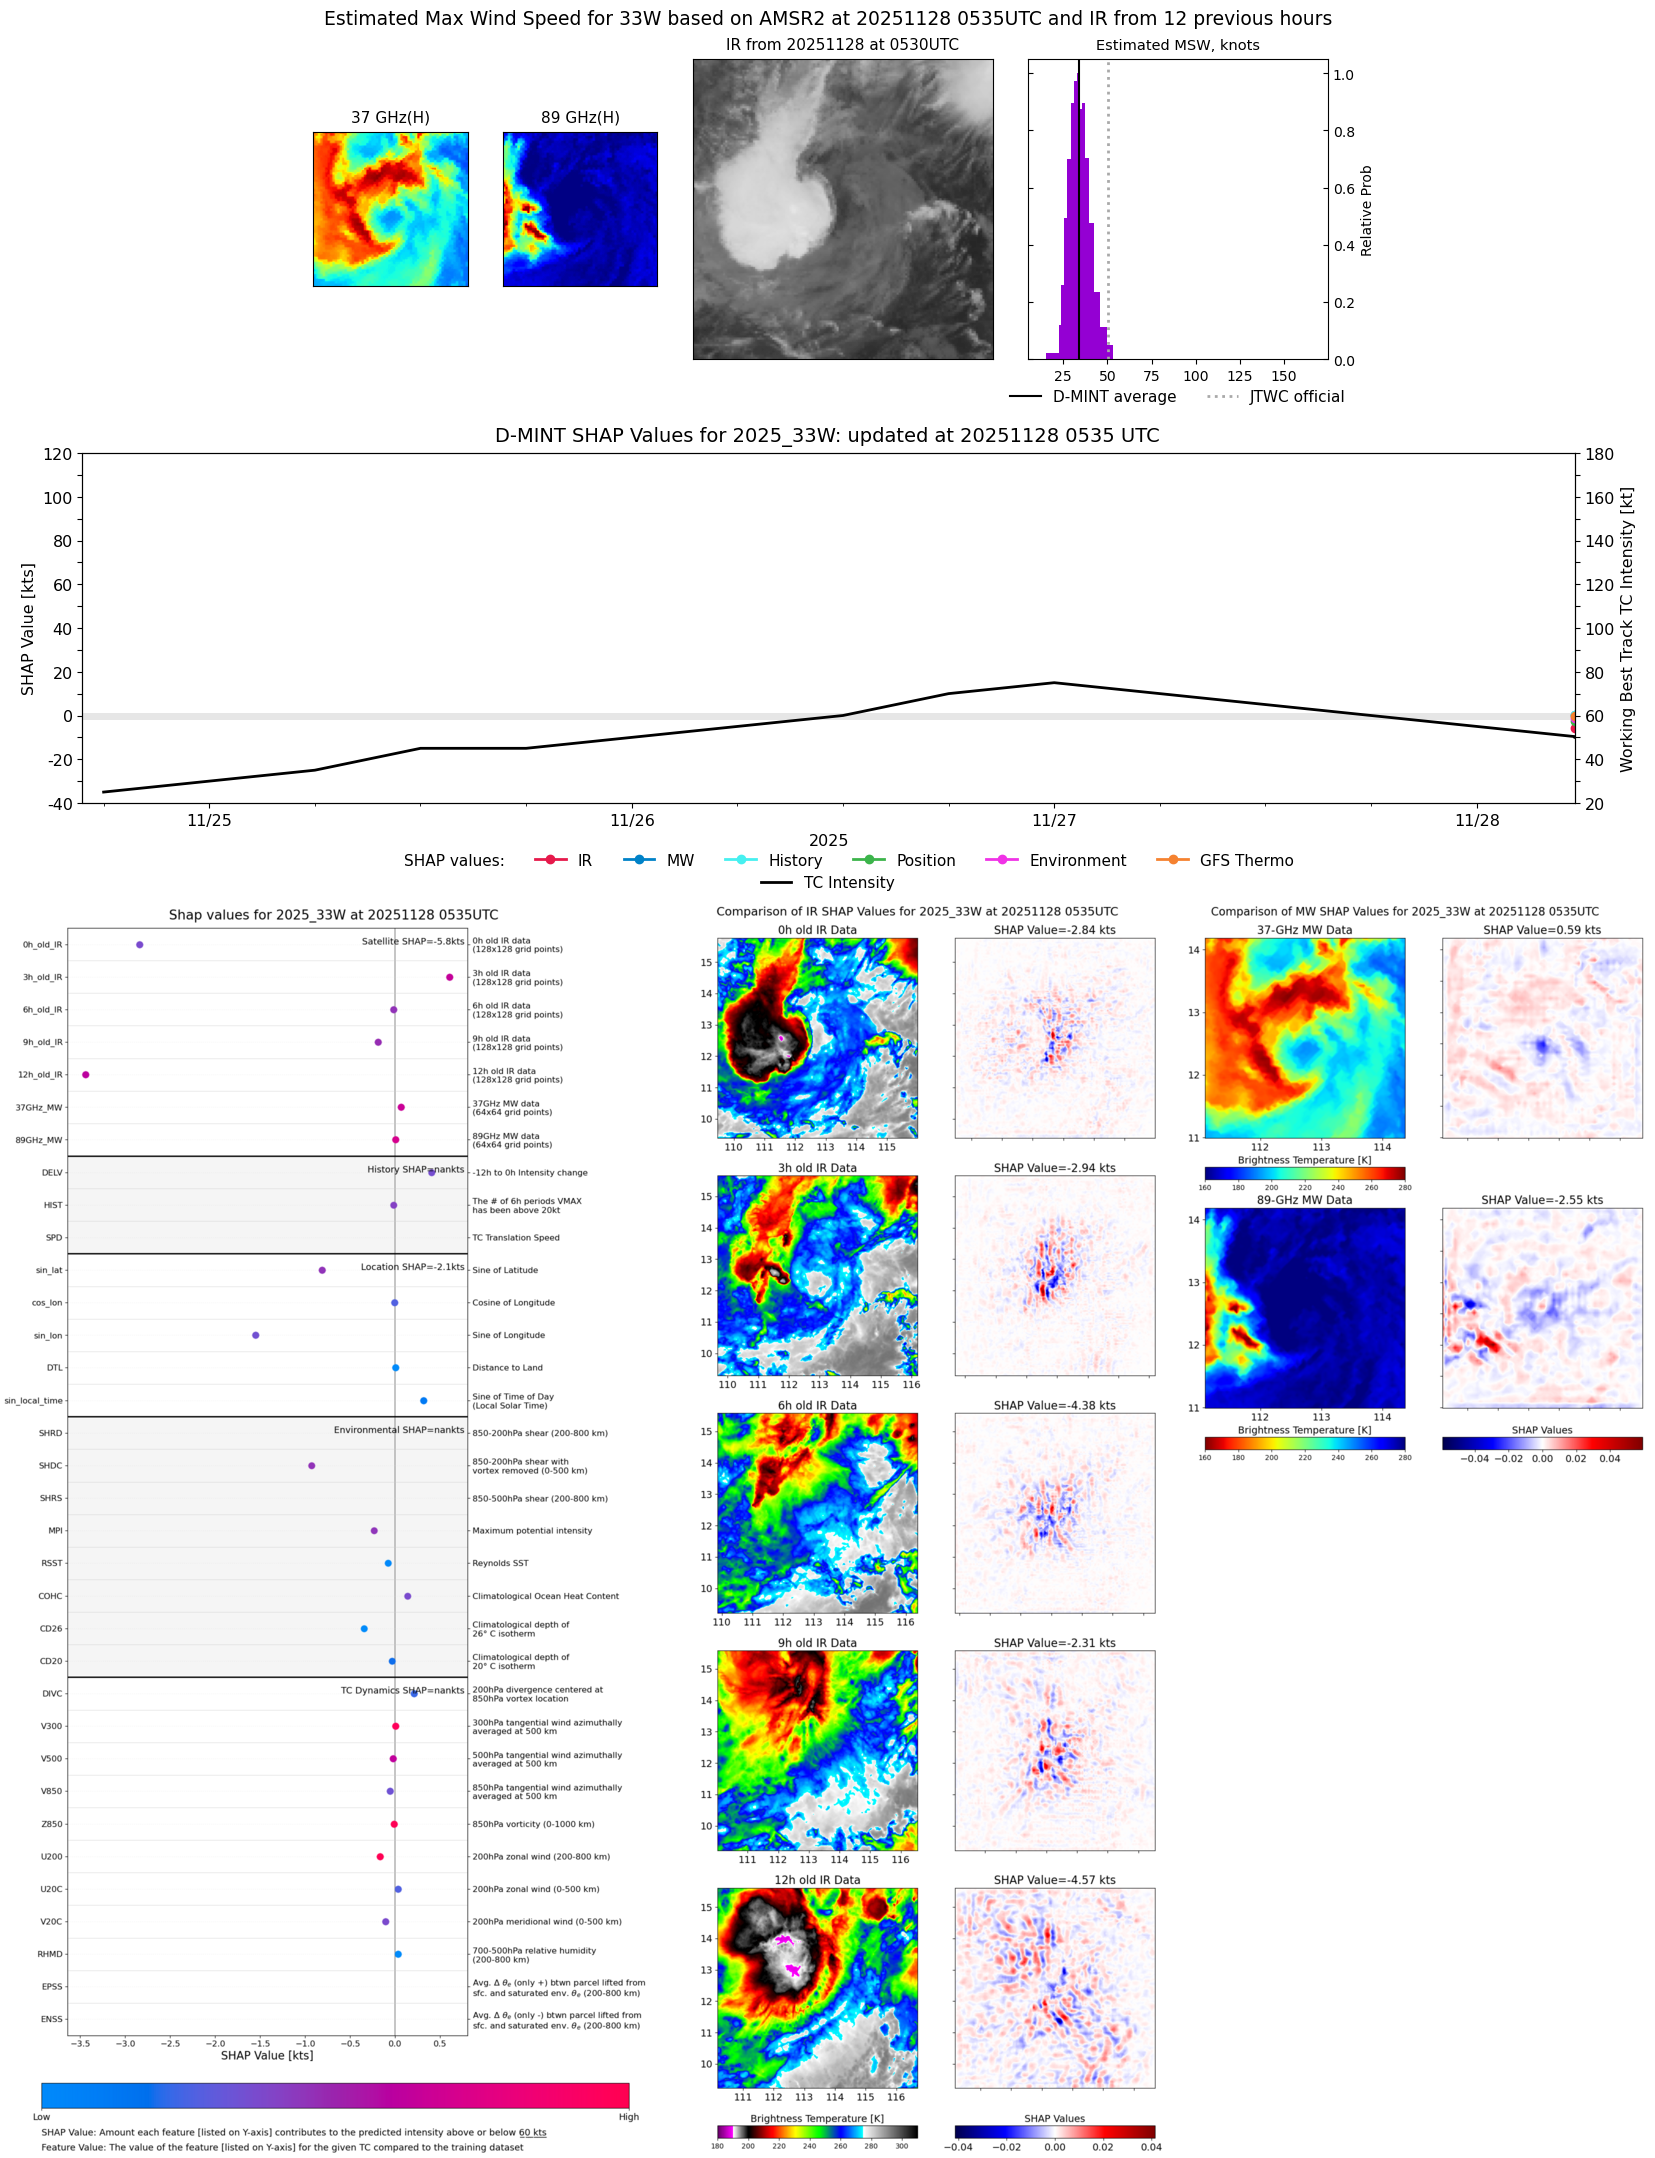 |
| 20251128 | 0524 UTC | ATMS-N21 | 1000 hPa | 30 kts | 27 kts | 34 kts | 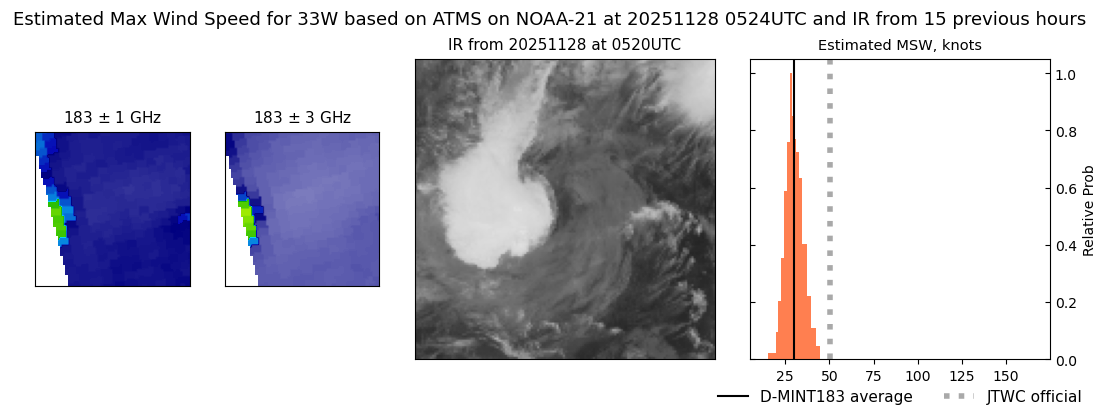 |
| 20251127 | 2249 UTC | SSMISF17 | 994 hPa | 38 kts | 33 kts | 43 kts |  |
| 20251127 | 1817 UTC | ATMS-N21 | 989 hPa | 55 kts | 49 kts | 61 kts | 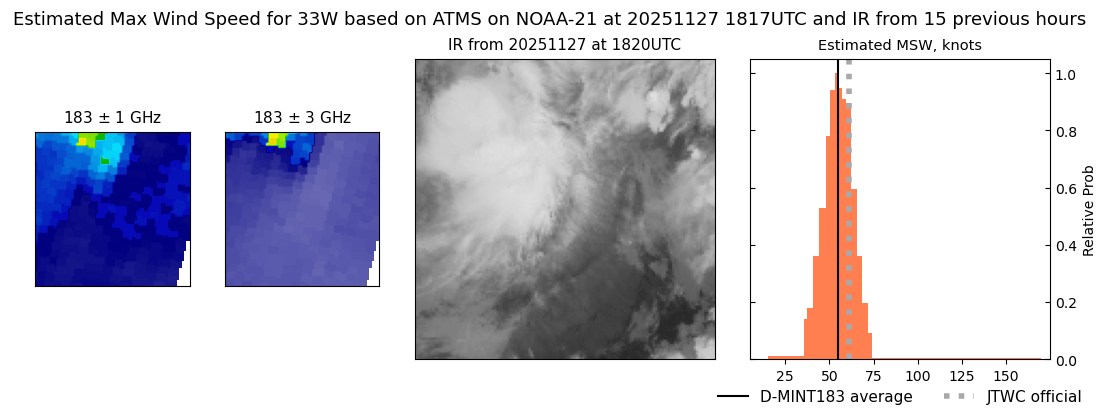 |
| 20251127 | 1429 UTC | TMS06 | 988 hPa | 54 kts | 48 kts | 60 kts | 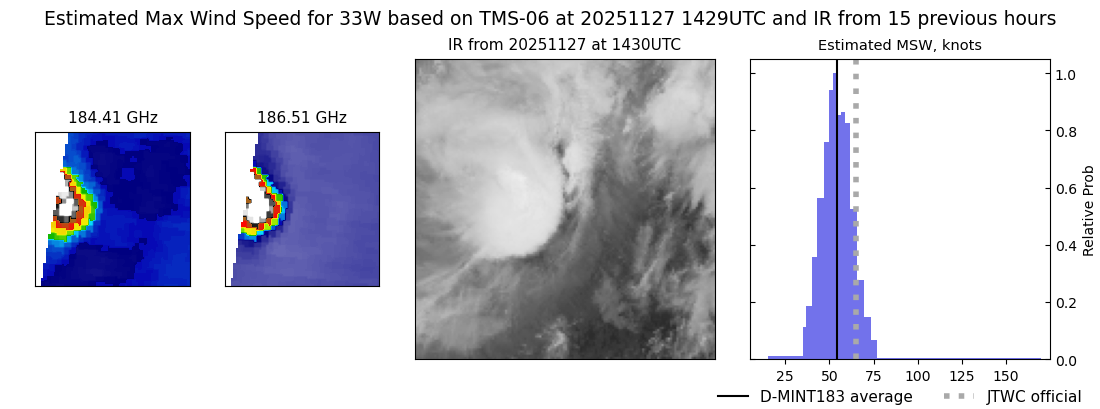 |
| 20251127 | 1132 UTC | SSMISF16 | 986 hPa | 58 kts | 52 kts | 65 kts | 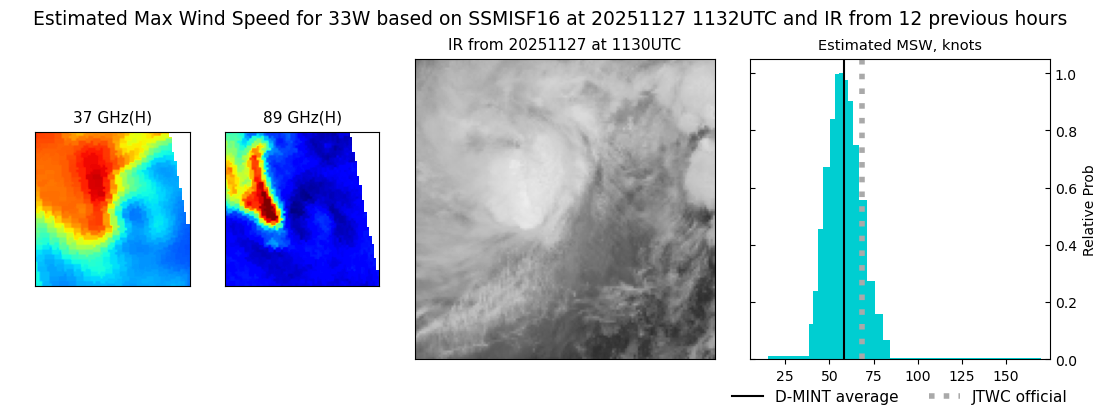 |
| 20251127 | 1013 UTC | SSMISF17 | 984 hPa | 61 kts | 54 kts | 68 kts | 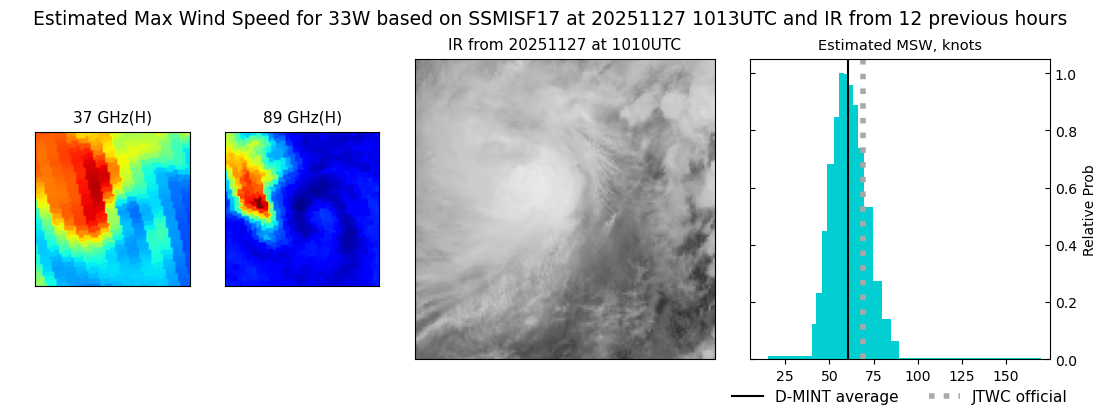 |
| 20251127 | 0544 UTC | ATMS-N21 | 978 hPa | 78 kts | 67 kts | 89 kts | 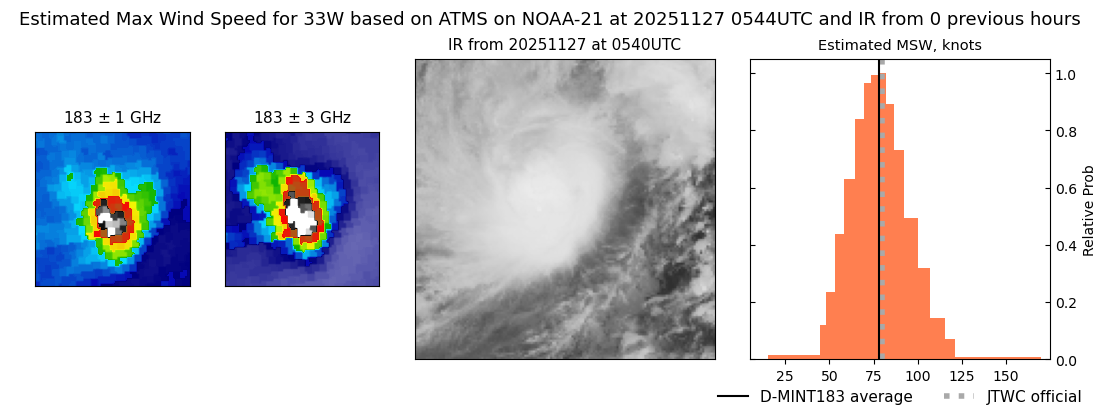 |
| 20251127 | 0309 UTC | TMS02 | 979 hPa | 70 kts | 63 kts | 76 kts | 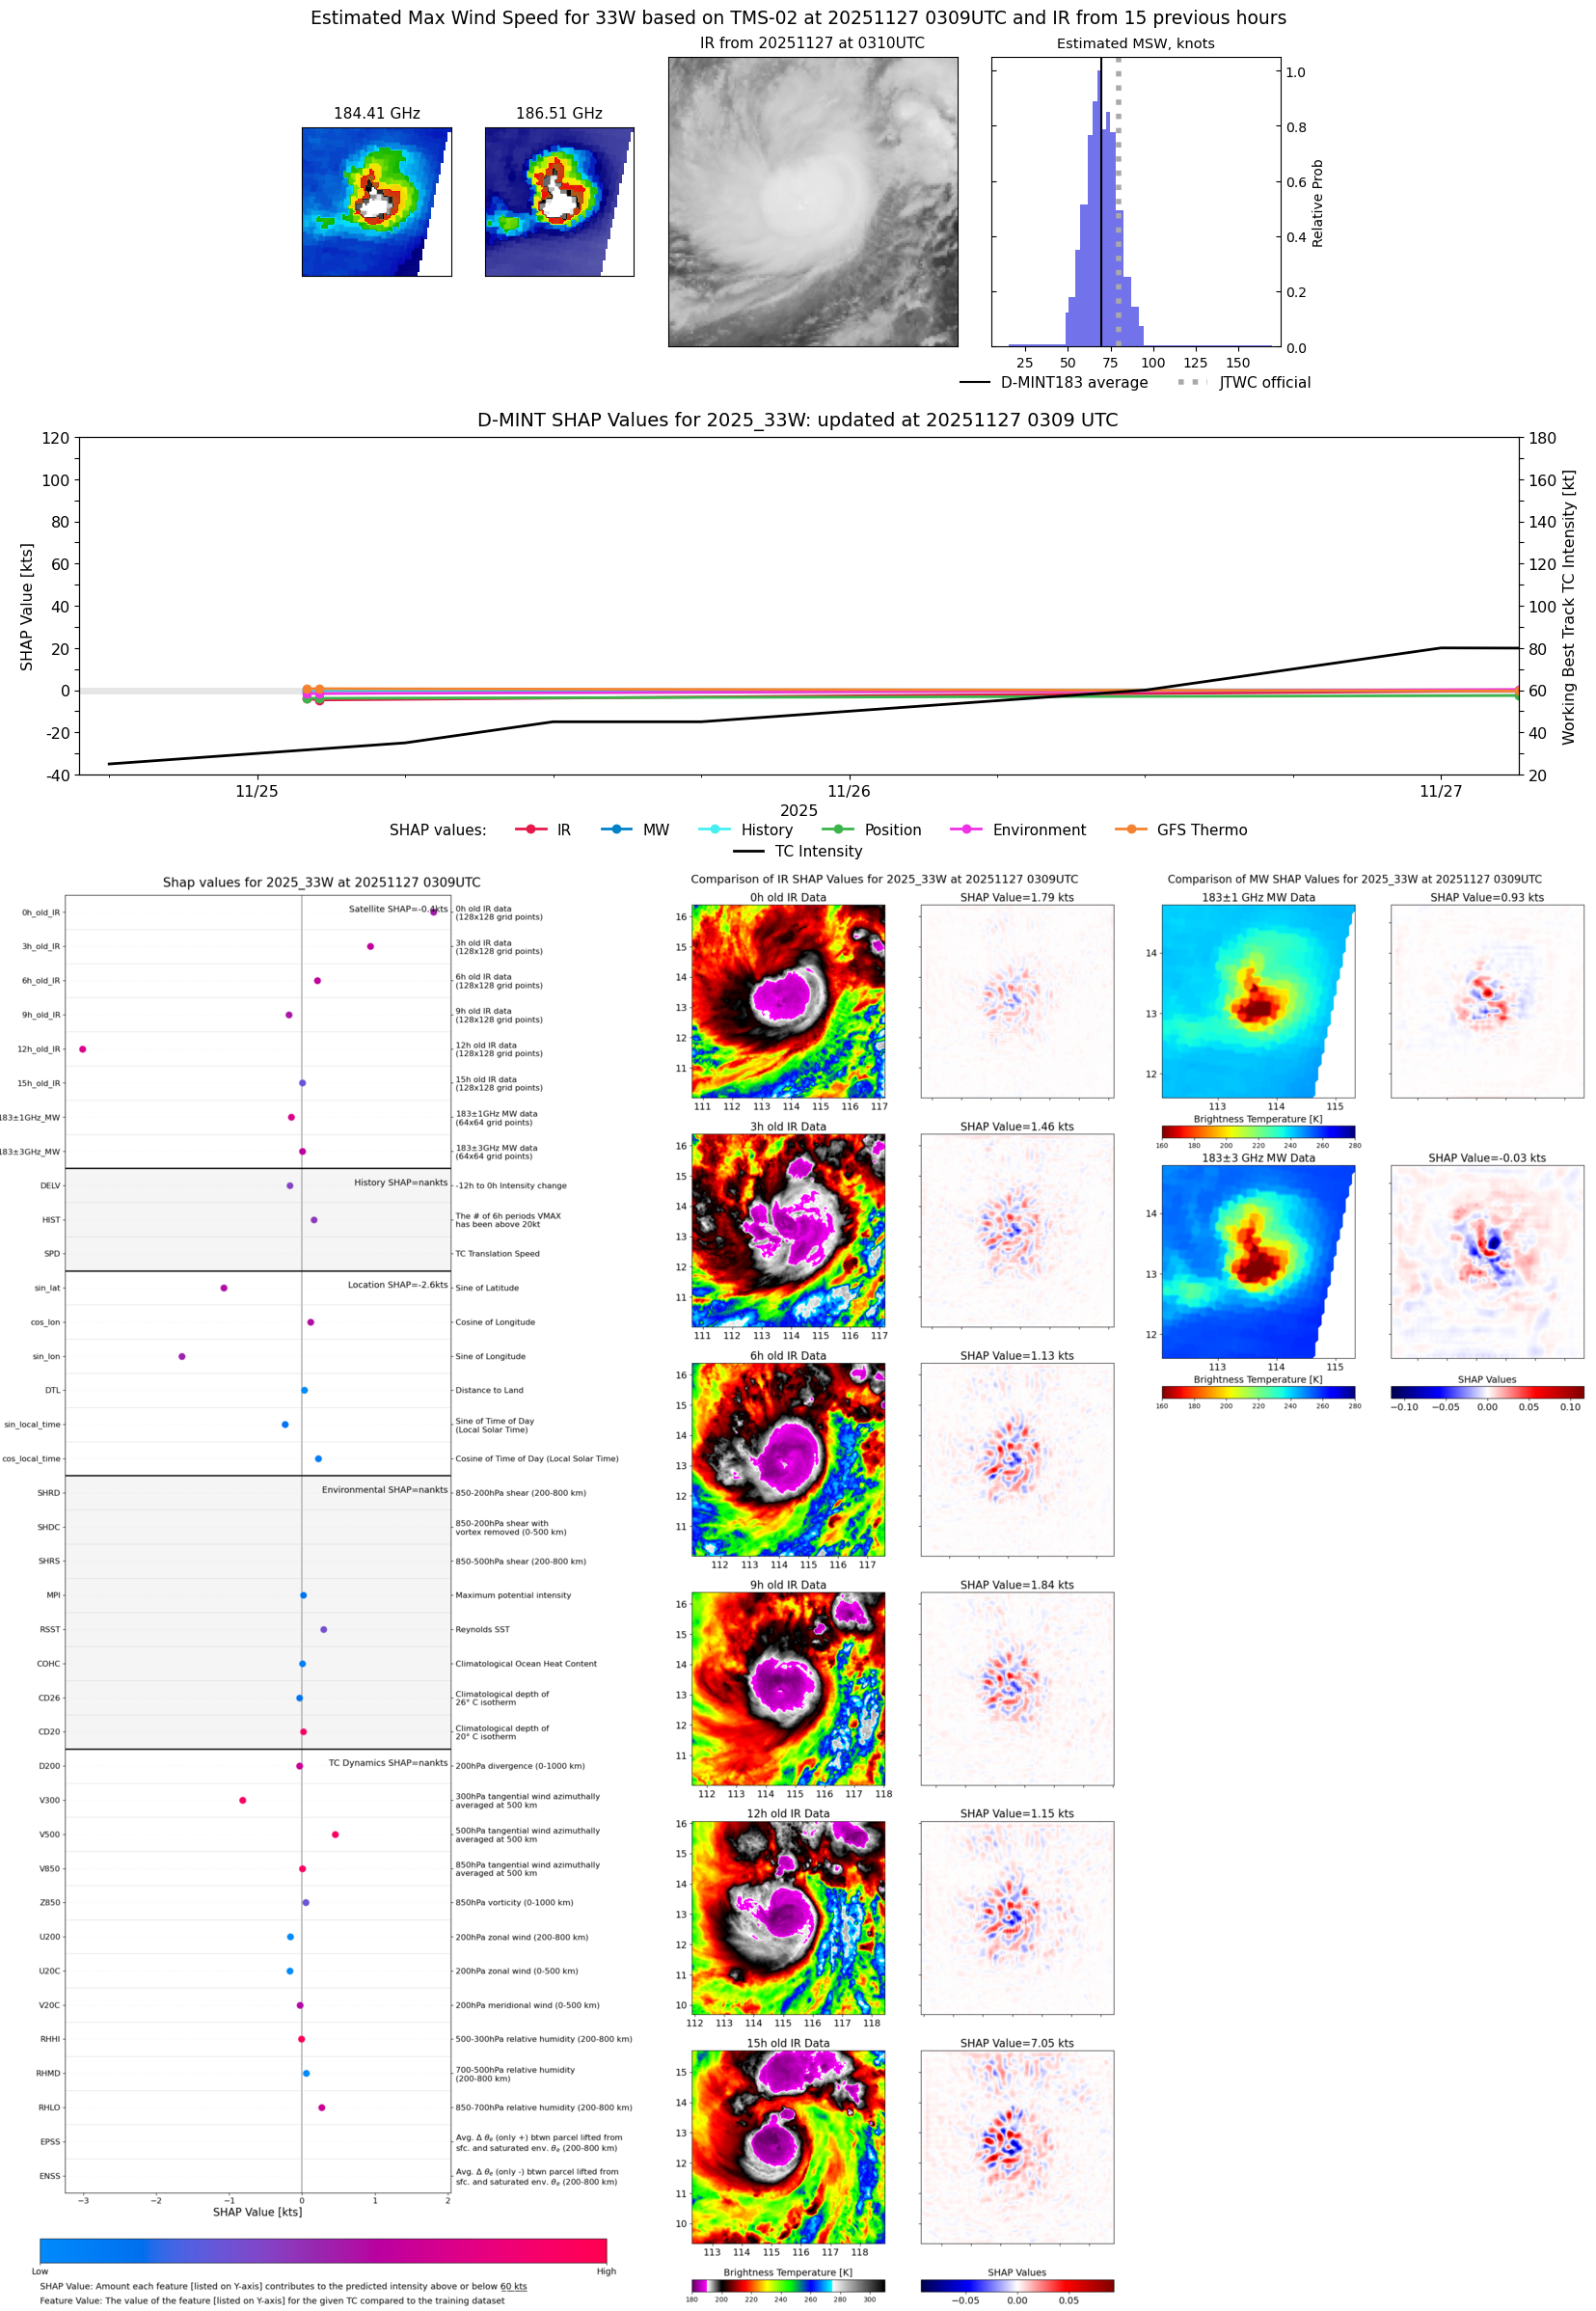 |
| 20251126 | 2204 UTC | WSFM01 | 978 hPa | 65 kts | 58 kts | 73 kts | 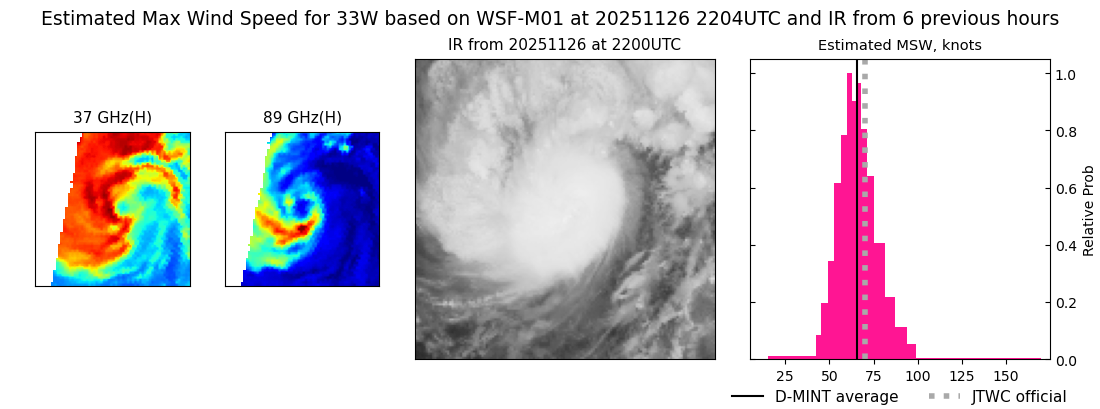 |
| 20251126 | 2016 UTC | SSMISF18 | 980 hPa | 66 kts | 59 kts | 73 kts |  |
| 20251126 | 1801 UTC | AMSR2 | 980 hPa | 65 kts | 58 kts | 72 kts | 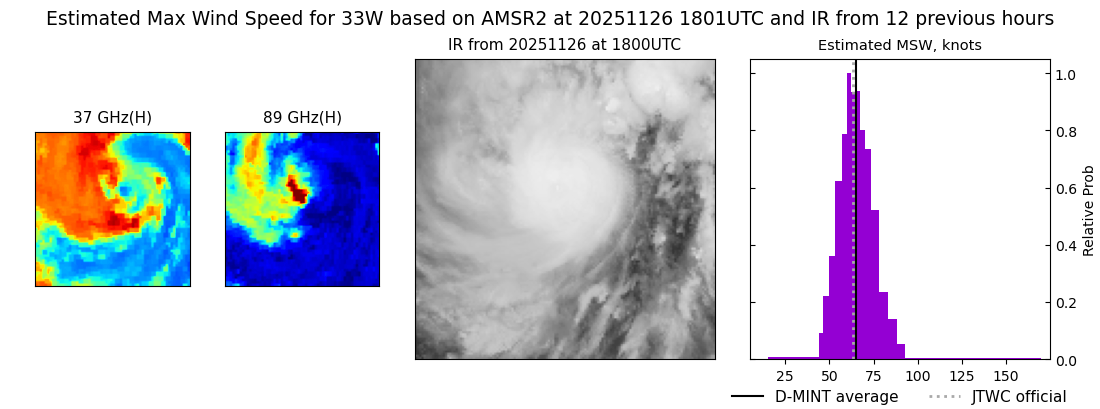 |
| 20251126 | 1746 UTC | ATMS-N20 | 970 hPa | 71 kts | 64 kts | 79 kts | 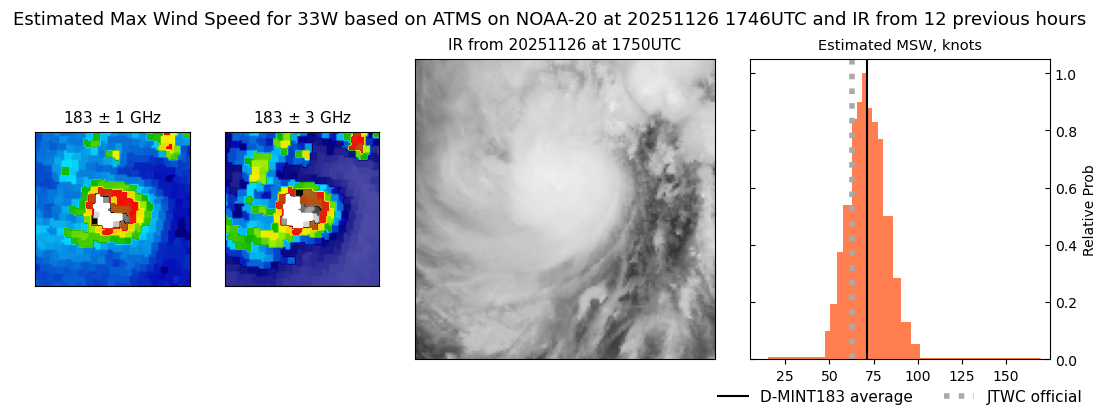 |
| 20251126 | 1733 UTC | GMI | 982 hPa | 61 kts | 54 kts | 68 kts |  |
| 20251126 | 1445 UTC | TMS06 | 980 hPa | 67 kts | 60 kts | 75 kts | 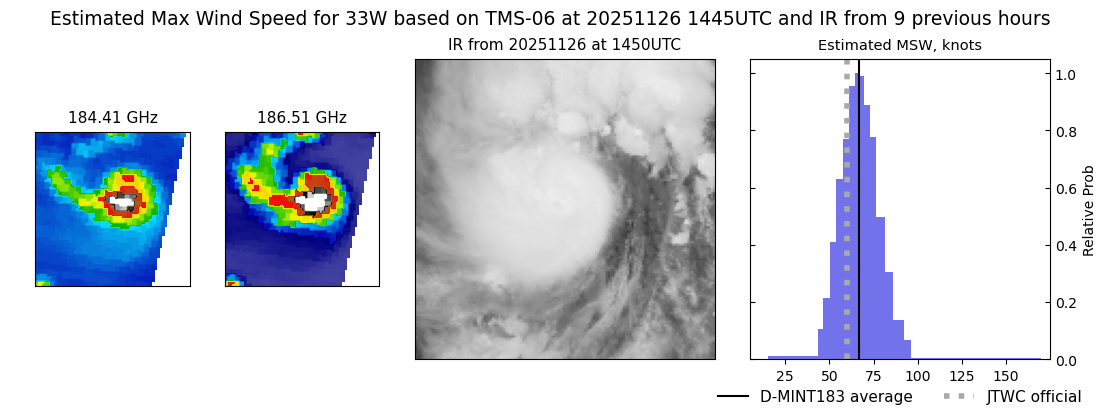 |
| 20251126 | 0600 UTC | GMI | 992 hPa | 41 kts | 36 kts | 48 kts | 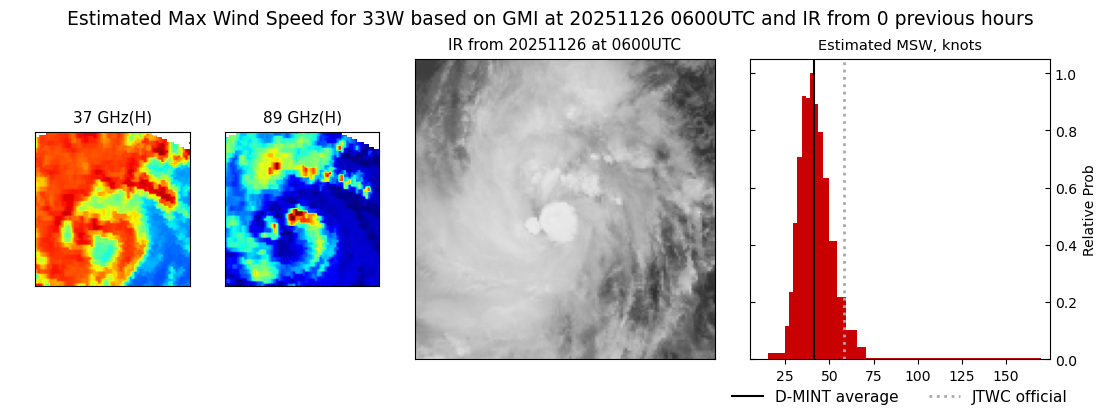 |
| 20251126 | 0558 UTC | GMI | 992 hPa | 42 kts | 36 kts | 49 kts | 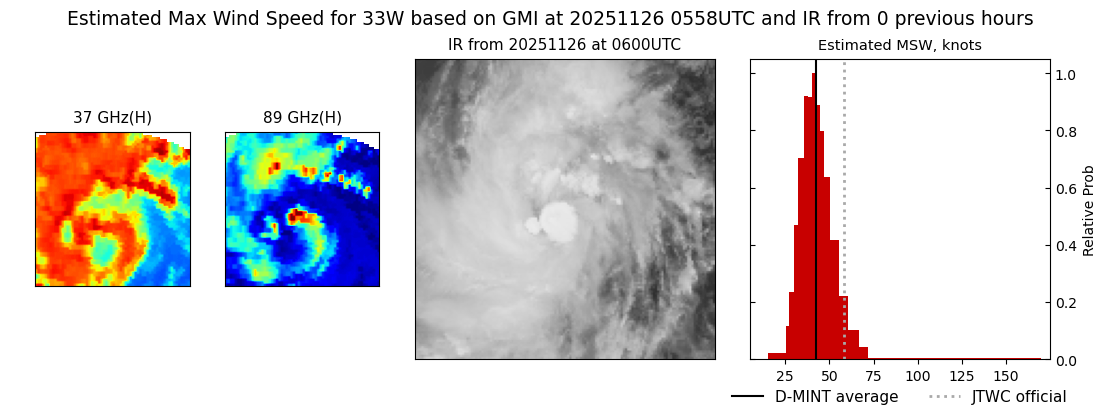 |
| 20251126 | 0546 UTC | AMSR2 | 988 hPa | 42 kts | 37 kts | 48 kts | 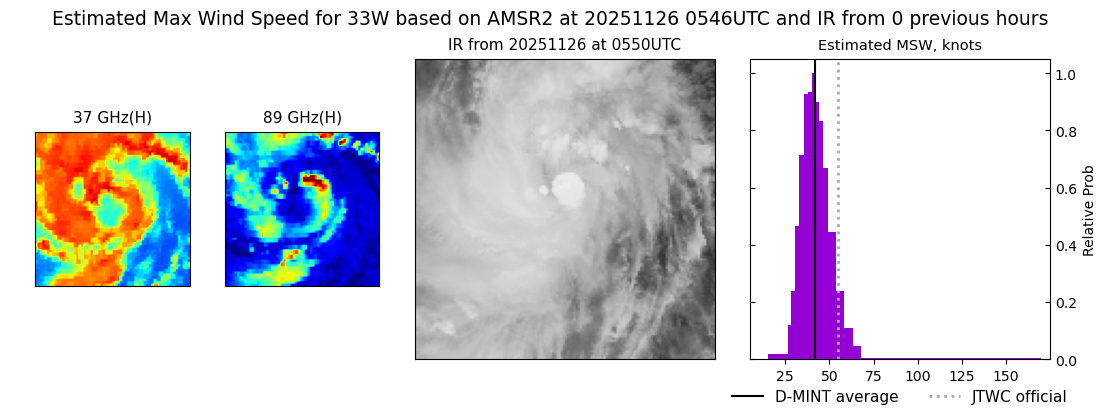 |
| 20251126 | 0225 UTC | TMS05 | 986 hPa | 50 kts | 44 kts | 57 kts |  |
| 20251125 | 2253 UTC | SSMISF16 | 991 hPa | 46 kts | 40 kts | 53 kts | 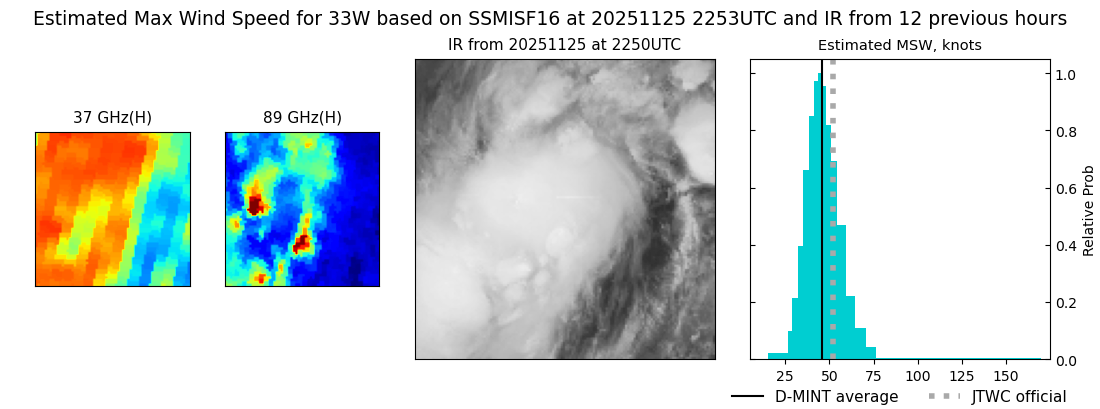 |
| 20251125 | 2223 UTC | WSFM01 | 994 hPa | 38 kts | 32 kts | 44 kts | 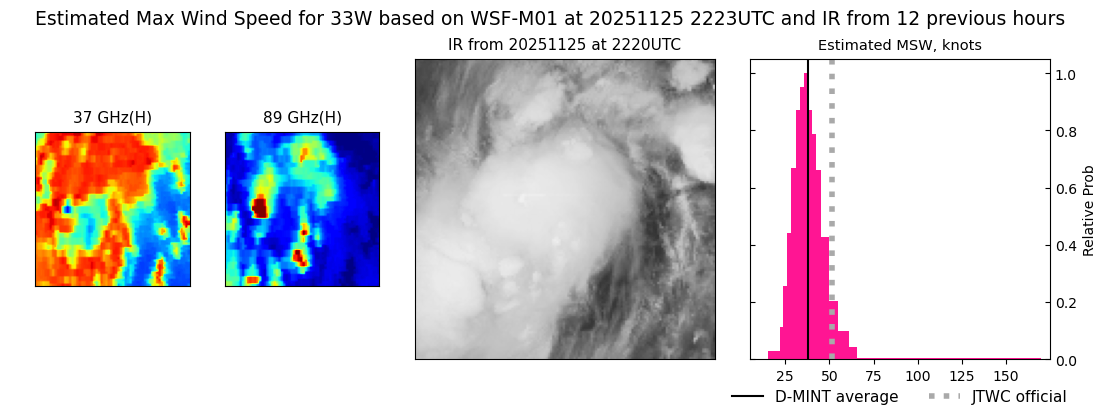 |
| 20251125 | 2030 UTC | SSMISF18 | 997 hPa | 38 kts | 33 kts | 44 kts |  |
| 20251125 | 1719 UTC | AMSR2 | 996 hPa | 31 kts | 27 kts | 35 kts | 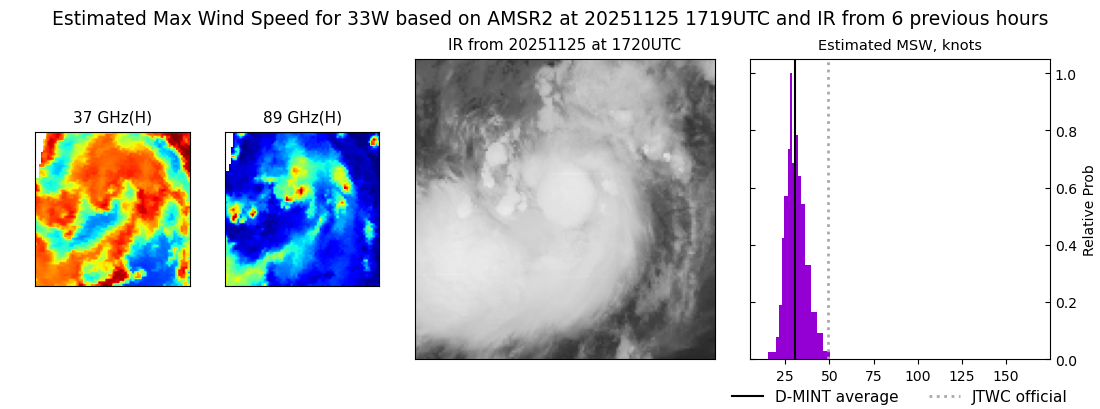 |
| 20251125 | 1434 UTC | TMS02 | 993 hPa | 44 kts | 38 kts | 50 kts |  |
| 20251125 | 1417 UTC | TMS05 | 995 hPa | 40 kts | 35 kts | 46 kts |  |
| 20251125 | 0950 UTC | WSFM01 | 996 hPa | 30 kts | 26 kts | 35 kts | 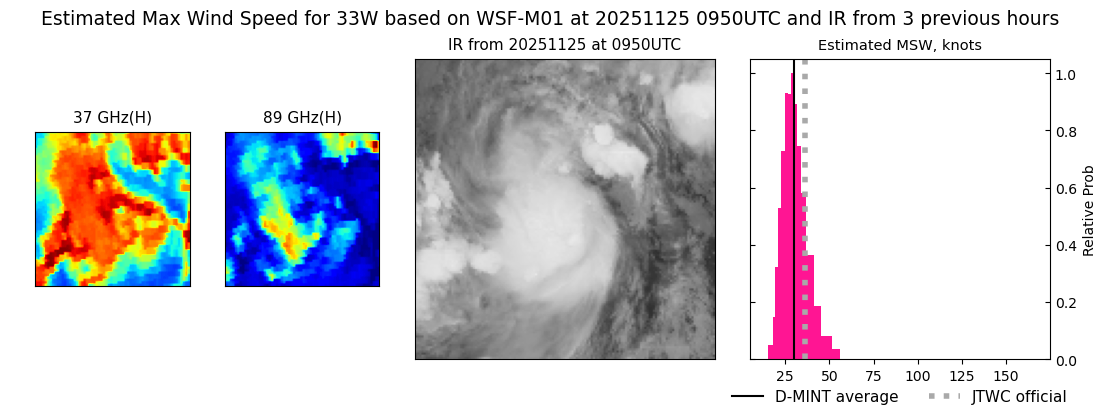 |
| 20251125 | 0753 UTC | SSMISF18 | 992 hPa | 36 kts | 31 kts | 42 kts |  |
| 20251125 | 0530 UTC | ATMS-N20 | 993 hPa | 40 kts | 34 kts | 47 kts | 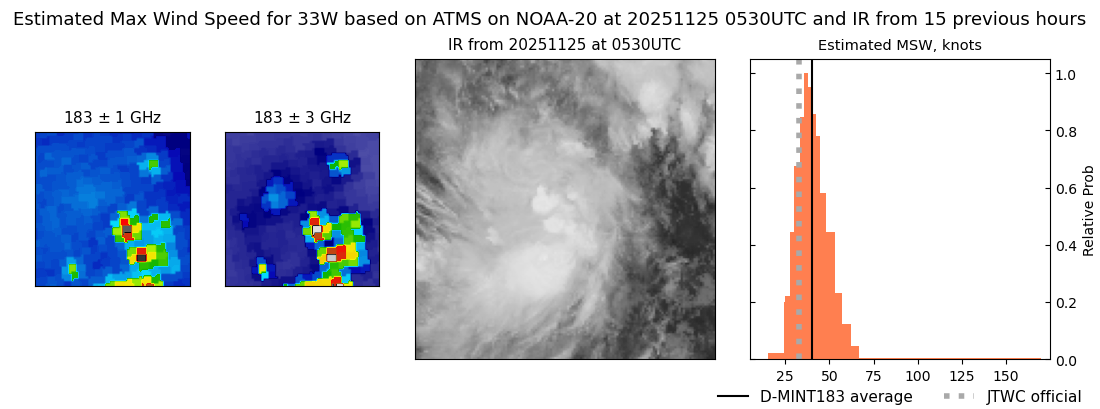 |
| 20251125 | 0503 UTC | AMSR2 | 994 hPa | 44 kts | 38 kts | 51 kts | 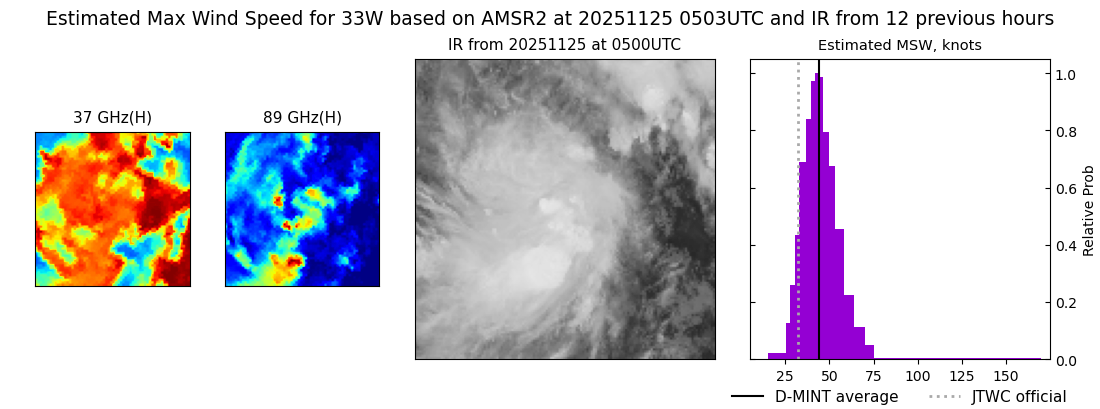 |
| 20251125 | 0231 UTC | TMS02 | 995 hPa | 36 kts | 32 kts | 42 kts | 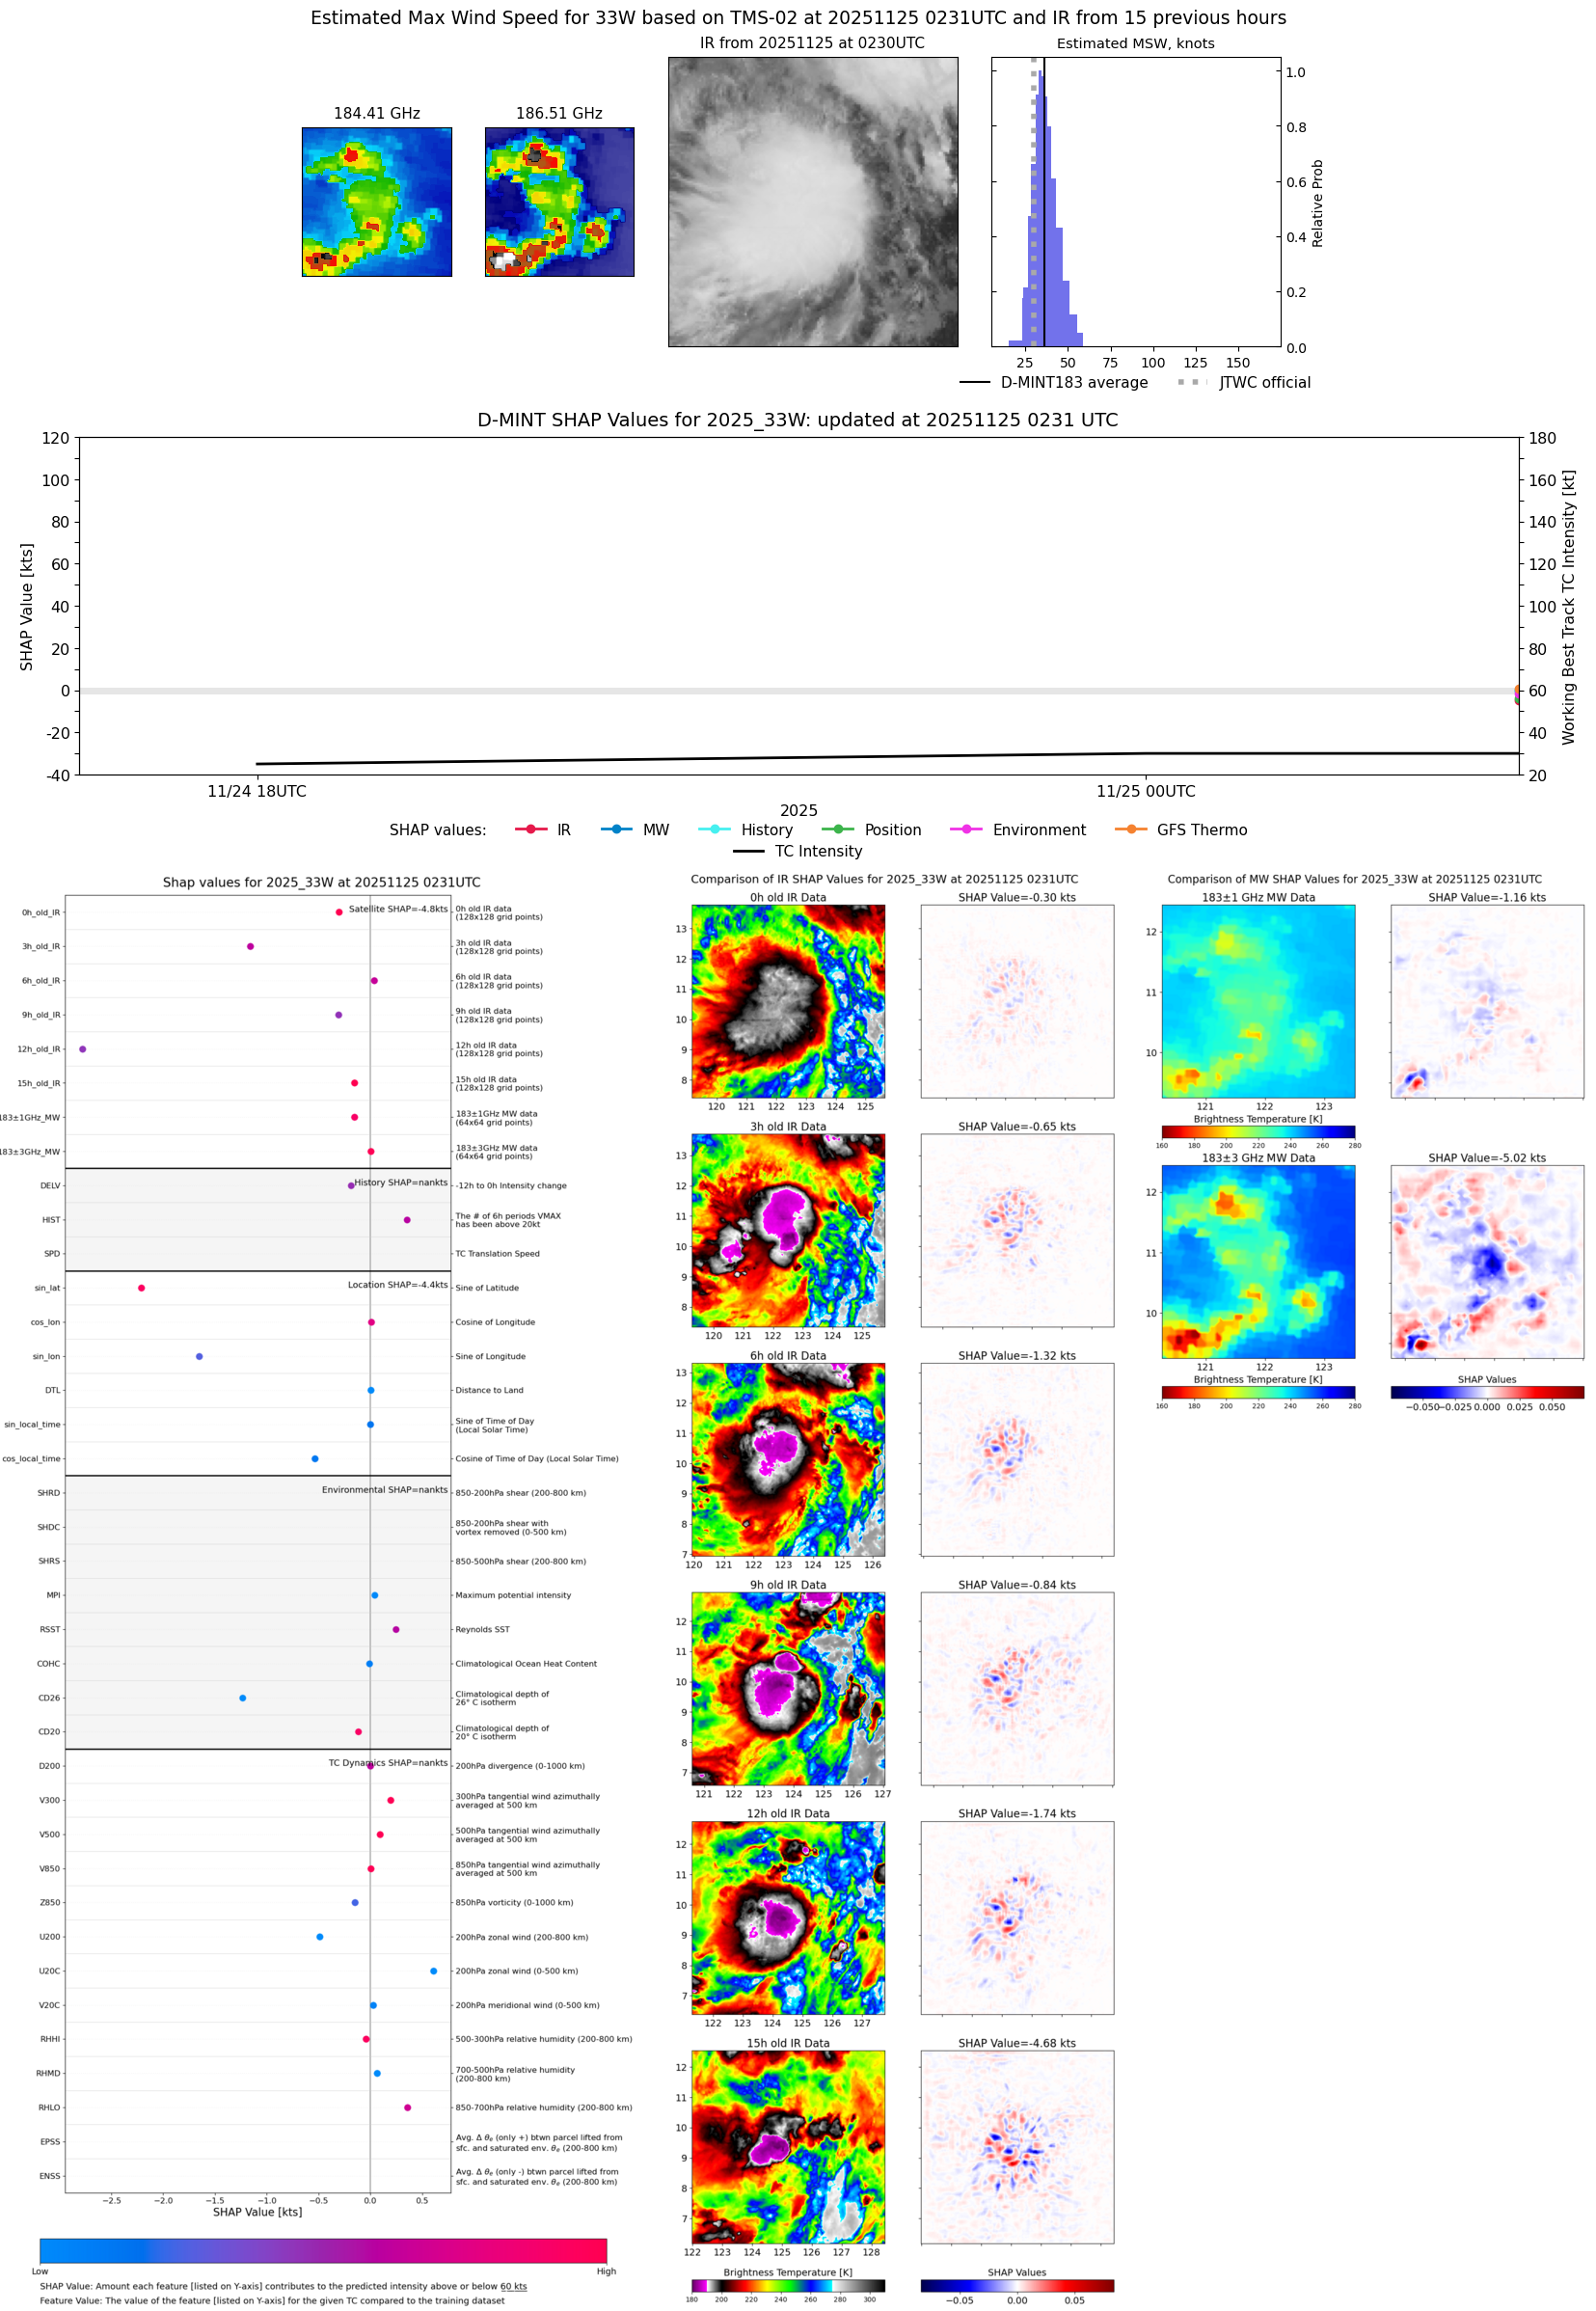 |
| 20251125 | 0200 UTC | TMS06 | 997 hPa | 35 kts | 30 kts | 41 kts | 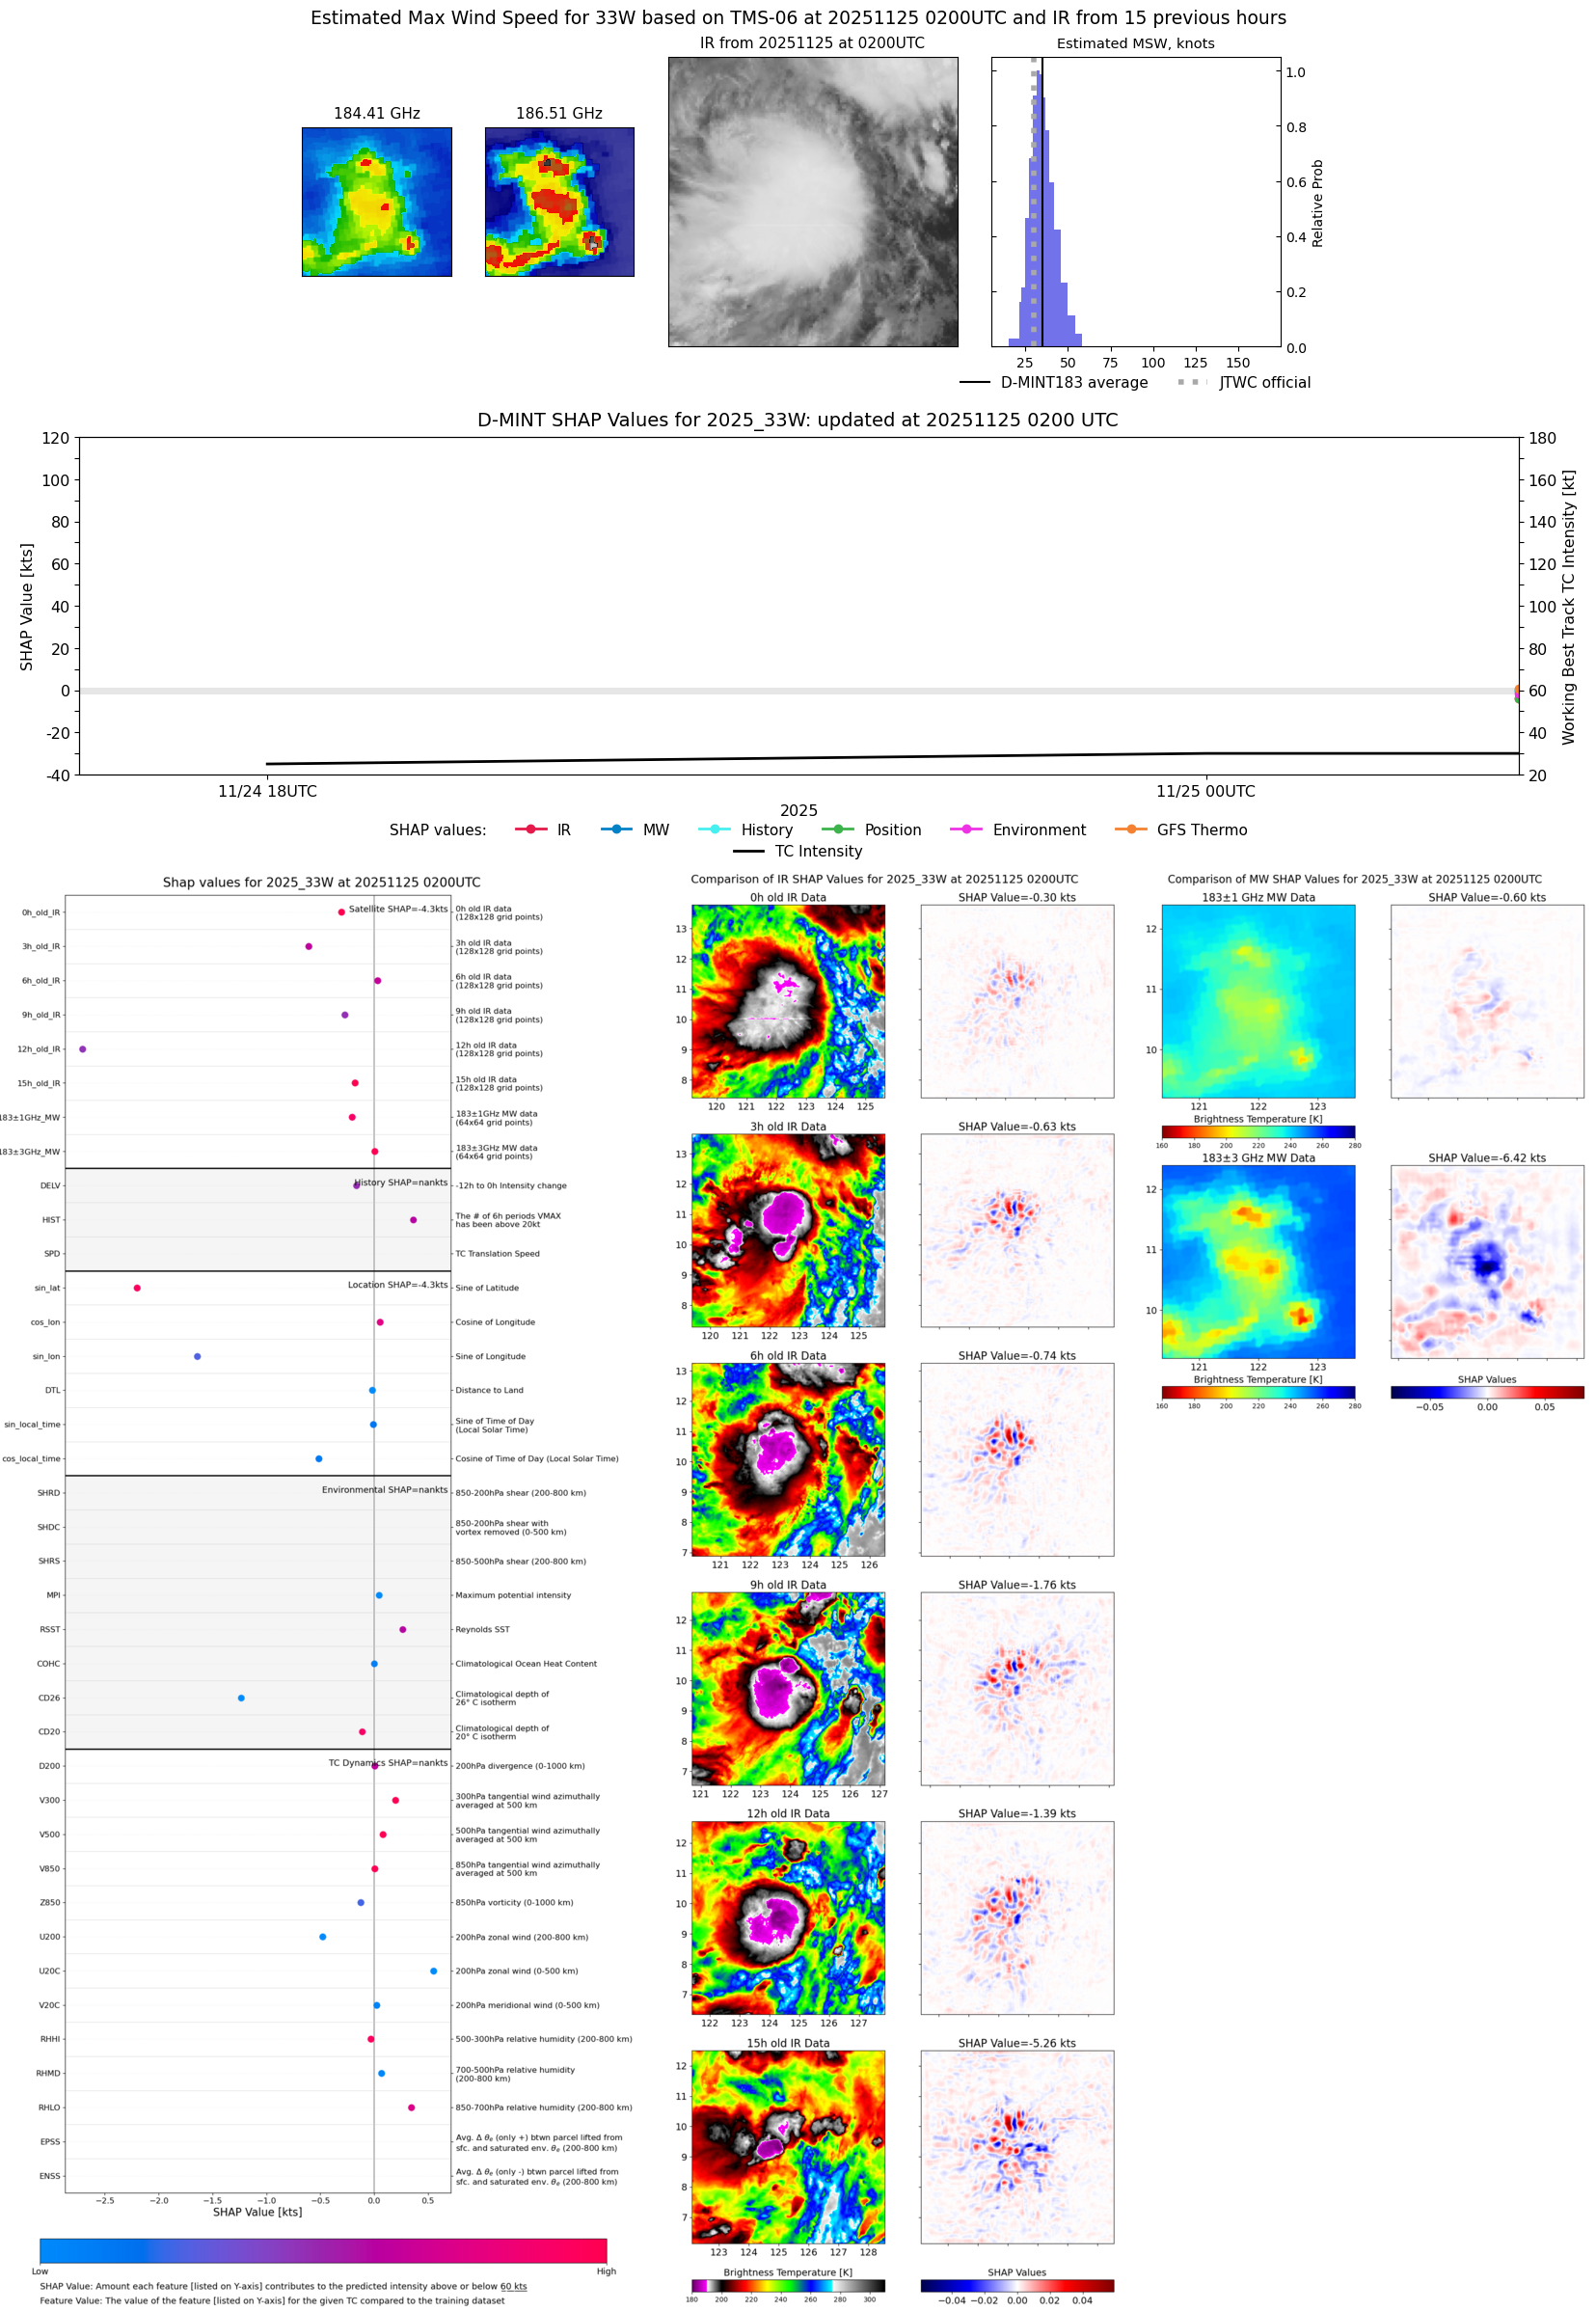 |
| 20251124 | 2308 UTC | SSMISF16 | 994 hPa | 36 kts | 31 kts | 40 kts |  |
| 20251124 | 2152 UTC | SSMISF17 | 994 hPa | 34 kts | 30 kts | 39 kts | 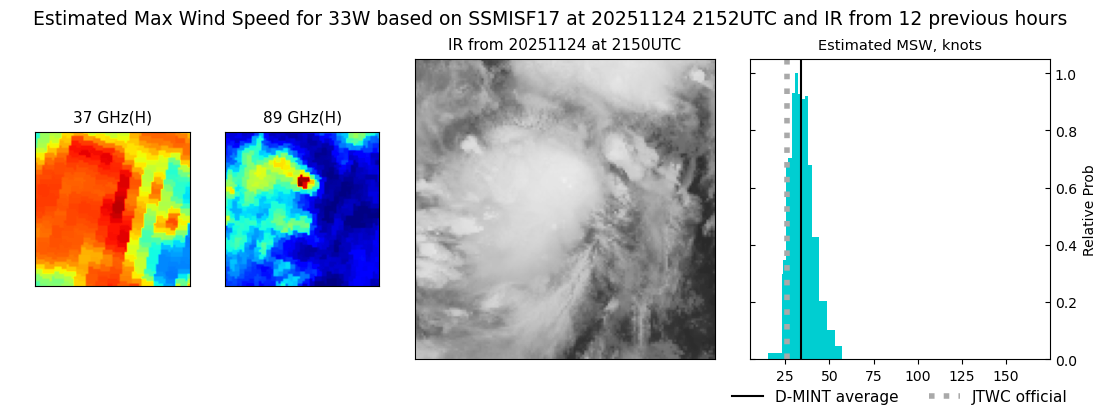 |
| 20251124 | 1029 UTC | SSMISF16 | NaN hPa | 29 kts | 24 kts | 34 kts |  |
| 20251124 | 0913 UTC | SSMISF17 | NaN hPa | 31 kts | 26 kts | 37 kts | 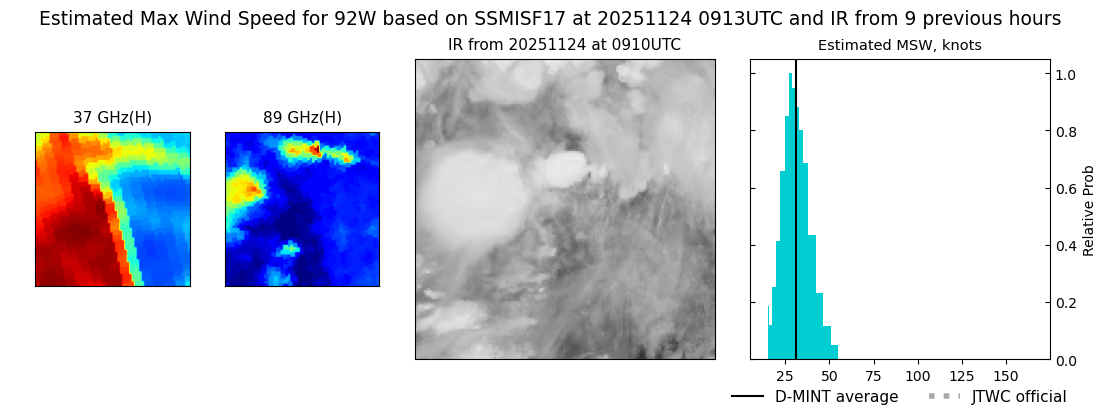 |
| 20251124 | 0552 UTC | GMI | NaN hPa | 21 kts | 17 kts | 24 kts | 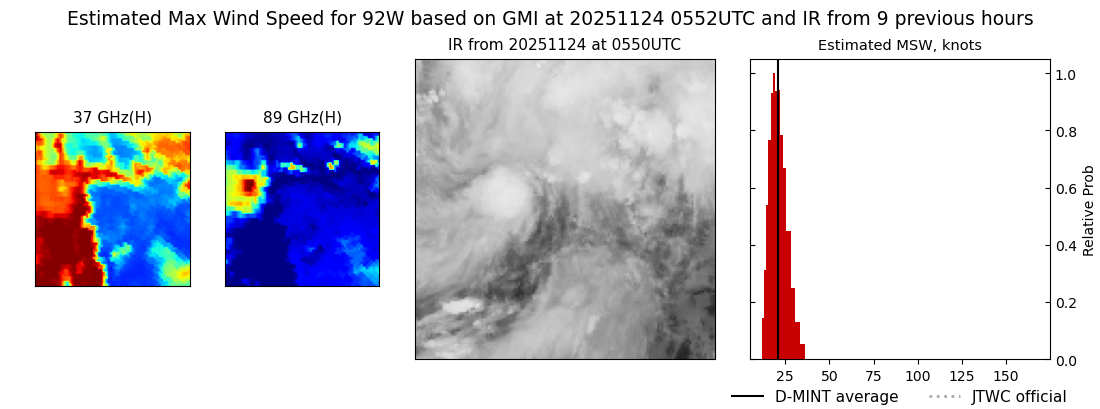 |
| 20251123 | 0928 UTC | SSMISF17 | NaN hPa | 23 kts | 19 kts | 27 kts | 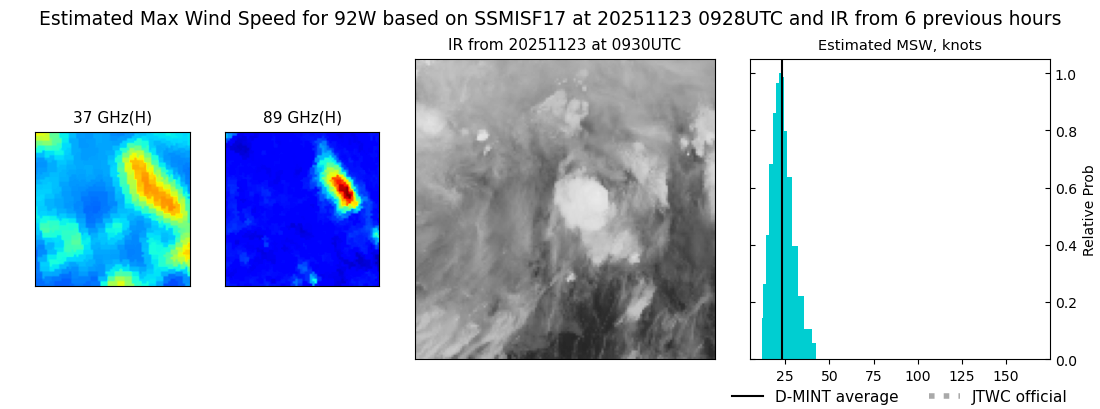 |
| 20251122 | 2041 UTC | SSMISF17 | NaN hPa | 19 kts | 16 kts | 23 kts | 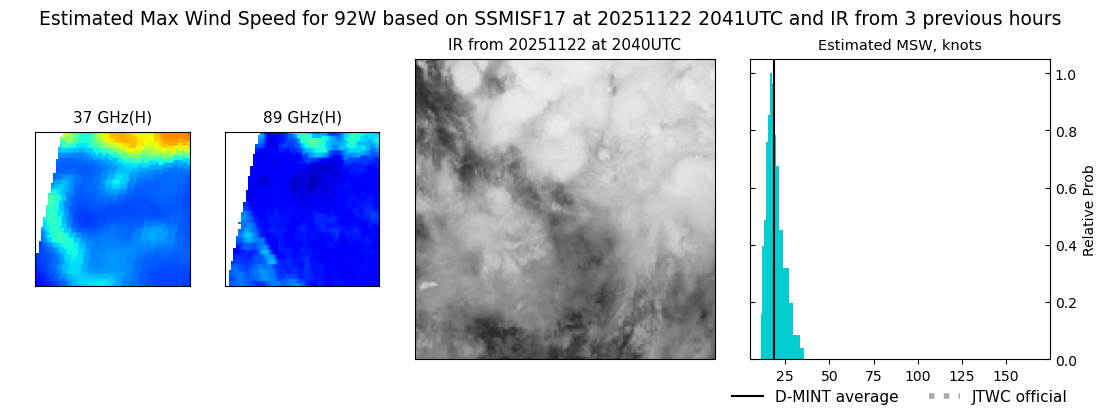 |
| 20251122 | 1932 UTC | SSMISF18 | NaN hPa | 15 kts | 13 kts | 17 kts |  |