|
||
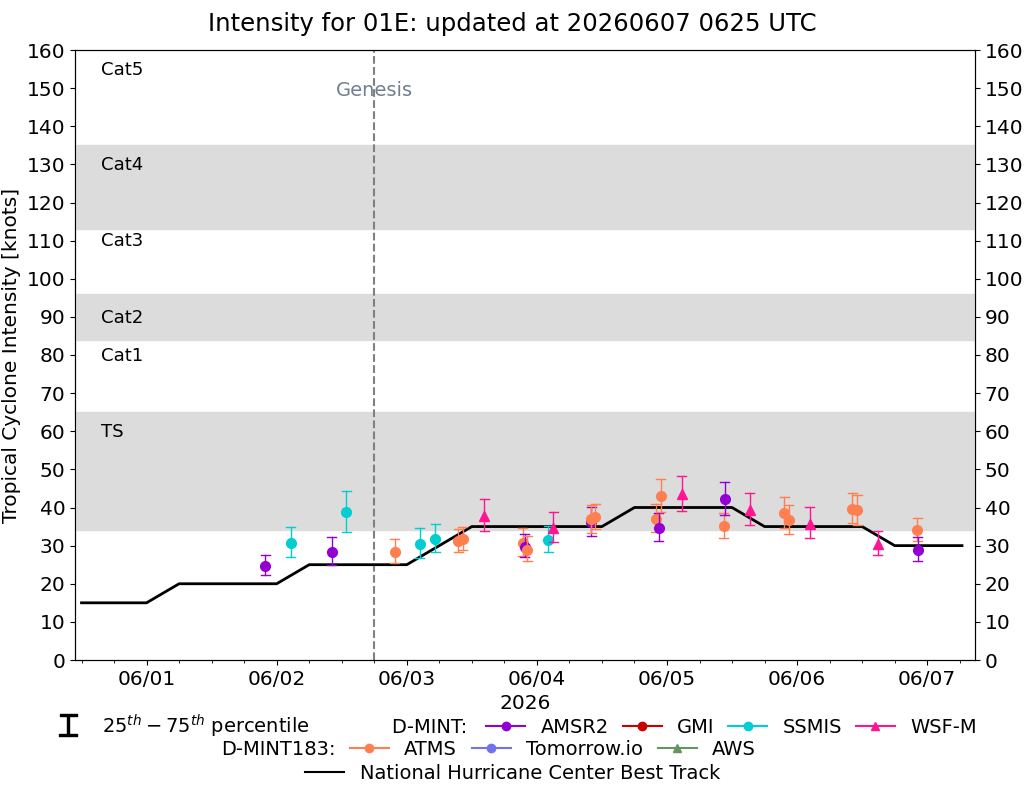 |
D-MINT HISTORY FILE for 2026_01E
| Date | Time | MW Sensor | MSLP | Vmax (30th-70th percentile average) | Vmax 25th percentile | Vmax 75th percentile | Image |
| 20260606 | 2216 UTC | AMSR2 | 1010 hPa | 29 kts | 26 kts | 32 kts |  |
| 20260606 | 2211 UTC | ATMS-N20 | 1010 hPa | 34 kts | 31 kts | 37 kts |  |
| 20260606 | 1454 UTC | WSFM01 | 1011 hPa | 30 kts | 28 kts | 34 kts |  |
| 20260606 | 1104 UTC | ATMS-N20 | 1010 hPa | 39 kts | 35 kts | 43 kts |  |
| 20260606 | 1011 UTC | ATMS-N21 | 1009 hPa | 40 kts | 36 kts | 44 kts |  |
| 20260606 | 0222 UTC | WSFM01 | 1009 hPa | 36 kts | 32 kts | 40 kts |  |
| 20260605 | 2230 UTC | ATMS-N20 | 1010 hPa | 37 kts | 33 kts | 41 kts |  |
| 20260605 | 2137 UTC | ATMS-N21 | 1010 hPa | 39 kts | 35 kts | 43 kts |  |
| 20260605 | 1514 UTC | WSFM01 | 1007 hPa | 39 kts | 35 kts | 44 kts |  |
| 20260605 | 1042 UTC | AMSR2 | 1006 hPa | 42 kts | 38 kts | 47 kts |  |
| 20260605 | 1029 UTC | ATMS-N21 | 1008 hPa | 35 kts | 32 kts | 39 kts |  |
| 20260605 | 0241 UTC | WSFM01 | 1007 hPa | 44 kts | 39 kts | 48 kts |  |
| 20260604 | 2249 UTC | ATMS-N20 | 1005 hPa | 43 kts | 39 kts | 47 kts |  |
| 20260604 | 2228 UTC | AMSR2 | 1009 hPa | 35 kts | 31 kts | 39 kts |  |
| 20260604 | 2156 UTC | ATMS-N21 | 1008 hPa | 37 kts | 34 kts | 41 kts |  |
| 20260604 | 1048 UTC | ATMS-N21 | 1005 hPa | 37 kts | 34 kts | 41 kts |  |
| 20260604 | 1001 UTC | ATMS-N20 | 1006 hPa | 37 kts | 33 kts | 41 kts |  |
| 20260604 | 1000 UTC | AMSR2 | 1007 hPa | 36 kts | 33 kts | 40 kts |  |
| 20260604 | 0301 UTC | WSFM01 | 1006 hPa | 35 kts | 31 kts | 39 kts |  |
| 20260604 | 0207 UTC | SSMISF17 | 1007 hPa | 32 kts | 28 kts | 35 kts |  |
| 20260603 | 2214 UTC | ATMS-N21 | 1007 hPa | 29 kts | 26 kts | 33 kts |  |
| 20260603 | 2145 UTC | AMSR2 | 1007 hPa | 30 kts | 27 kts | 33 kts |  |
| 20260603 | 2126 UTC | ATMS-N20 | 1007 hPa | 31 kts | 27 kts | 35 kts |  |
| 20260603 | 1415 UTC | WSFM01 | 1005 hPa | 38 kts | 34 kts | 42 kts |  |
| 20260603 | 1020 UTC | ATMS-N20 | 1007 hPa | 32 kts | 29 kts | 35 kts |  |
| 20260603 | 0927 UTC | ATMS-N21 | 1008 hPa | 31 kts | 28 kts | 34 kts |  |
| 20260603 | 0513 UTC | SSMISF16 | 1006 hPa | 32 kts | 28 kts | 36 kts |  |
| 20260603 | 0221 UTC | SSMISF17 | 1007 hPa | 30 kts | 27 kts | 35 kts |  |
| 20260602 | 2145 UTC | ATMS-N20 | 1009 hPa | 28 kts | 26 kts | 32 kts |  |
| 20260602 | 1249 UTC | SSMISF18 | NaN hPa | 39 kts | 34 kts | 44 kts |  |
| 20260602 | 1012 UTC | AMSR2 | NaN hPa | 28 kts | 25 kts | 32 kts |  |
| 20260602 | 0236 UTC | SSMISF17 | NaN hPa | 31 kts | 27 kts | 35 kts |  |
| 20260601 | 2156 UTC | AMSR2 | NaN hPa | 25 kts | 22 kts | 28 kts |  |