|
||

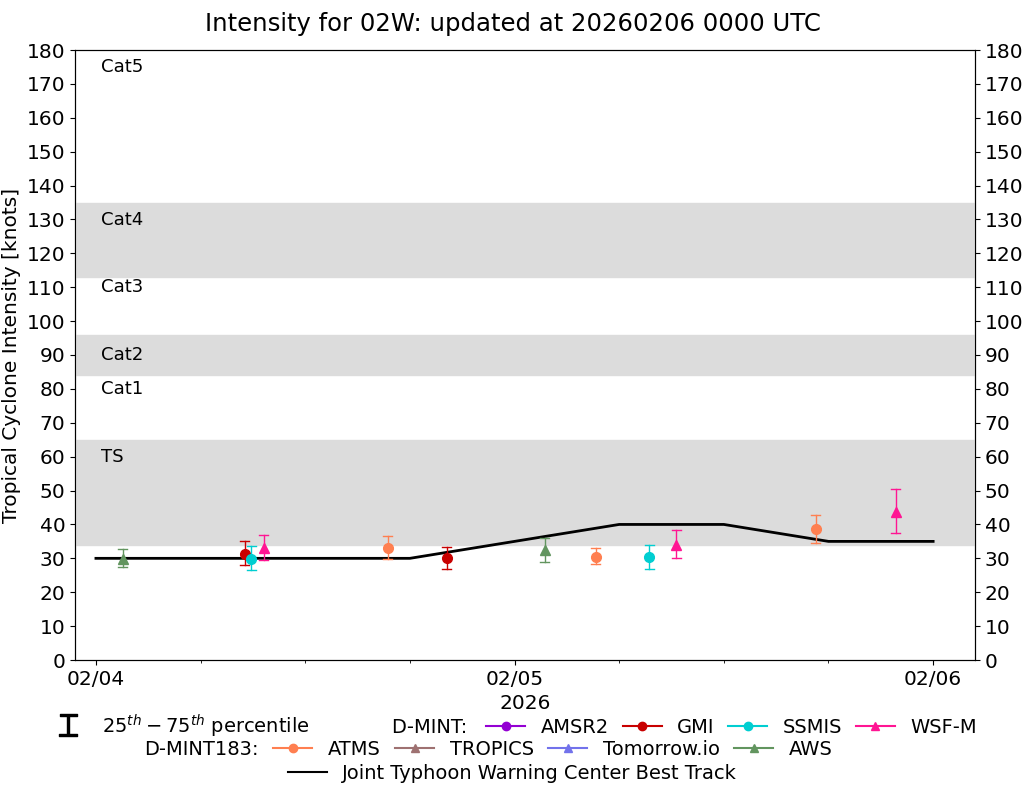 |
D-MINT HISTORY FILE for 2026_02W
| Date | Time | MW Sensor | MSLP | Vmax (30th-70th percentile average) | Vmax 25th percentile | Vmax 75th percentile | Image |
| 20260207 | 0540 UTC | AMSR2 | 1004 hPa | 25 kts | 22 kts | 28 kts |  |
| 20260206 | 2132 UTC | WSFM01 | 1002 hPa | 27 kts | 24 kts | 30 kts |  |
| 20260206 | 2022 UTC | GMI | 1001 hPa | 34 kts | 30 kts | 39 kts |  |
| 20260206 | 2008 UTC | SSMISF18 | 1000 hPa | 36 kts | 32 kts | 40 kts |  |
| 20260206 | 1713 UTC | AMSR2 | 1000 hPa | 33 kts | 29 kts | 37 kts |  |
| 20260206 | 1405 UTC | AWS | 996 hPa | 37 kts | 33 kts | 42 kts |  |
| 20260206 | 0847 UTC | GMI | 985 hPa | 50 kts | 44 kts | 57 kts |  |
| 20260206 | 0731 UTC | SSMISF18 | 992 hPa | 48 kts | 42 kts | 55 kts |  |
| 20260206 | 0512 UTC | ATMS-N21 | 995 hPa | 44 kts | 38 kts | 50 kts |  |
| 20260206 | 0457 UTC | AMSR2 | 993 hPa | 45 kts | 39 kts | 51 kts |  |
| 20260205 | 2151 UTC | WSFM01 | 995 hPa | 44 kts | 37 kts | 50 kts |  |
| 20260205 | 2151 UTC | WSFM01 | 996 hPa | 45 kts | 39 kts | 52 kts |  |
| 20260205 | 1717 UTC | ATMS-N20 | 999 hPa | 39 kts | 35 kts | 43 kts |  |
| 20260205 | 0916 UTC | WSFM01 | 999 hPa | 34 kts | 30 kts | 38 kts |  |
| 20260205 | 0744 UTC | SSMISF18 | 1001 hPa | 30 kts | 27 kts | 34 kts |  |
| 20260205 | 0440 UTC | ATMS-N20 | 1003 hPa | 30 kts | 28 kts | 33 kts |  |
| 20260205 | 0144 UTC | AWS | 1001 hPa | 32 kts | 29 kts | 36 kts |  |
| 20260204 | 2007 UTC | GMI | 1001 hPa | 30 kts | 27 kts | 33 kts |  |
| 20260204 | 1644 UTC | ATMS-N21 | 1001 hPa | 33 kts | 30 kts | 37 kts |  |
| 20260204 | 0937 UTC | WSFM01 | 998 hPa | 33 kts | 30 kts | 37 kts |  |
| 20260204 | 0855 UTC | SSMISF17 | 999 hPa | 30 kts | 27 kts | 34 kts |  |
| 20260204 | 0832 UTC | GMI | 998 hPa | 31 kts | 28 kts | 35 kts |  |
| 20260204 | 0133 UTC | AWS | 1000 hPa | 30 kts | 27 kts | 33 kts |  |
| 20260203 | 1910 UTC | SSMISF18 | 1001 hPa | 24 kts | 22 kts | 27 kts |  |
| 20260203 | 1642 UTC | AMSR2 | NaN hPa | 26 kts | 22 kts | 30 kts |  |
| 20260203 | 0633 UTC | SSMISF18 | 1002 hPa | 24 kts | 22 kts | 26 kts |  |
| 20260202 | 2213 UTC | SSMISF16 | NaN hPa | 16 kts | 14 kts | 19 kts |  |
| 20260202 | 2002 UTC | GMI | NaN hPa | 16 kts | 15 kts | 18 kts |  |
| 20260202 | 1600 UTC | AMSR2 | NaN hPa | 16 kts | 15 kts | 17 kts |  |