|
||
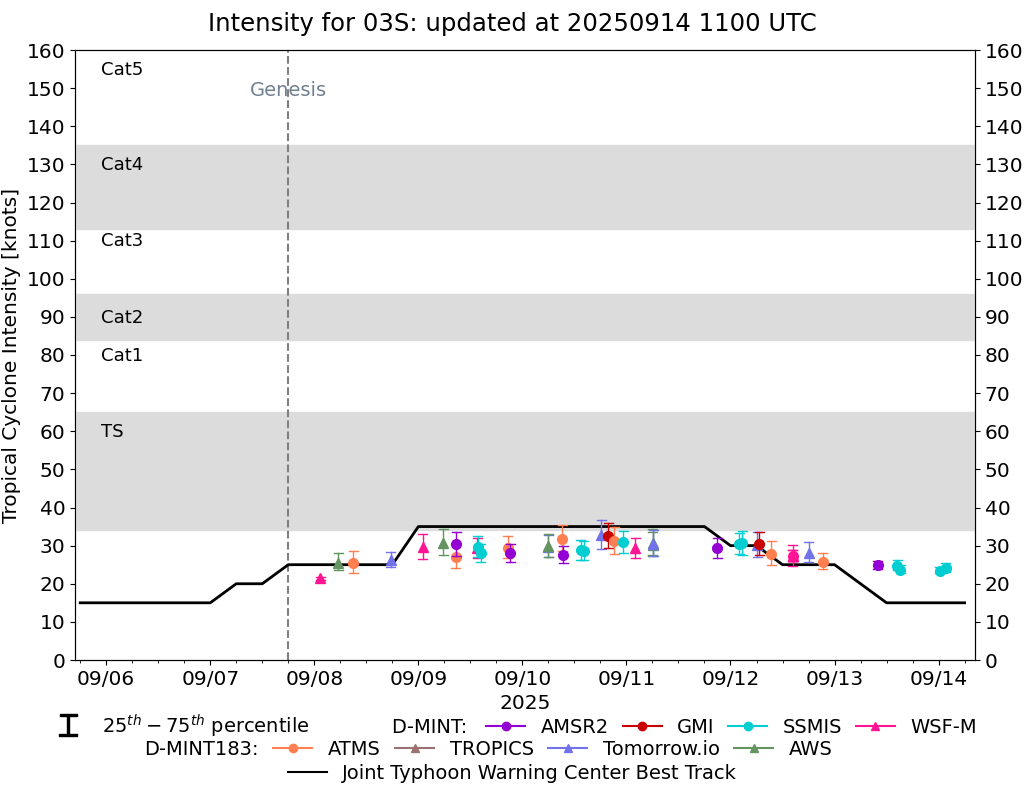 |
D-MINT HISTORY FILE for 2026_03S
| Date | Time | MW Sensor | MSLP | Vmax (30th-70th percentile average) | Vmax 25th percentile | Vmax 75th percentile | Image |
| 20250914 | 0136 UTC | SSMISF17 | 1007 hPa | 24 kts | 23 kts | 25 kts | 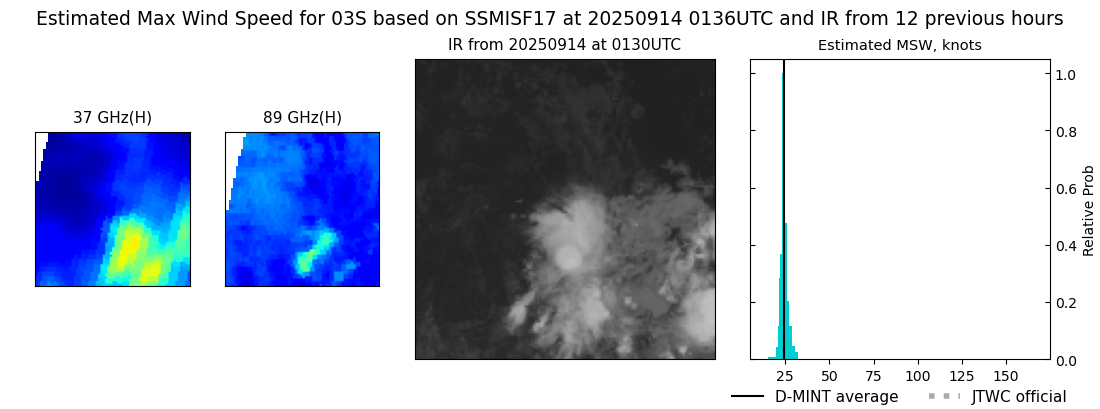 |
| 20250914 | 0016 UTC | SSMISF18 | 1008 hPa | 23 kts | 23 kts | 24 kts |  |
| 20250913 | 1510 UTC | SSMISF16 | 1007 hPa | 24 kts | 23 kts | 25 kts |  |
| 20250913 | 1429 UTC | SSMISF17 | 1007 hPa | 25 kts | 24 kts | 26 kts |  |
| 20250913 | 1001 UTC | AMSR2 | 1007 hPa | 25 kts | 24 kts | 26 kts | 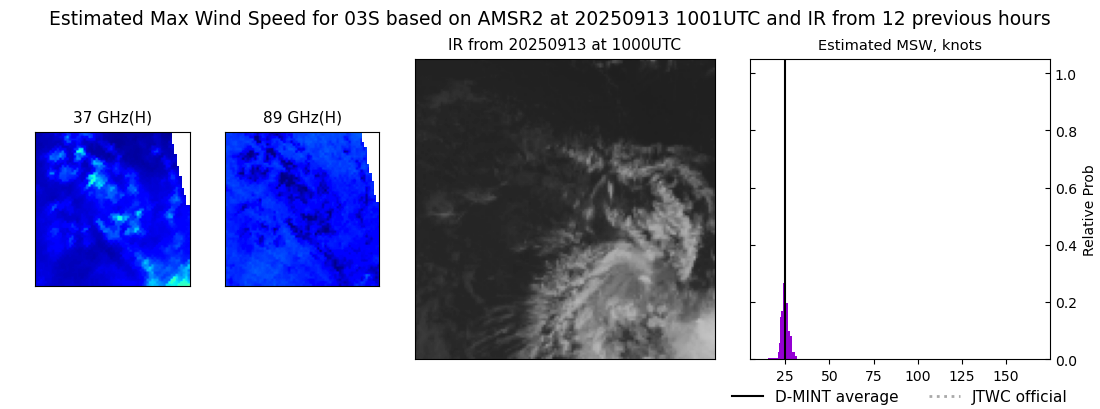 |
| 20250912 | 2120 UTC | ATMS-N20 | 1005 hPa | 26 kts | 24 kts | 28 kts | 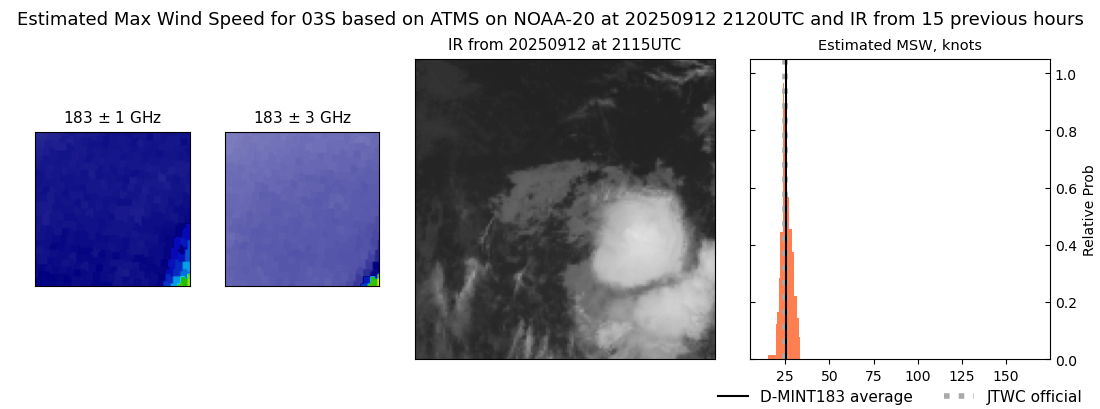 |
| 20250912 | 1802 UTC | TMS06 | 1004 hPa | 28 kts | 26 kts | 31 kts |  |
| 20250912 | 1419 UTC | WSFM01 | 1005 hPa | 27 kts | 26 kts | 29 kts | 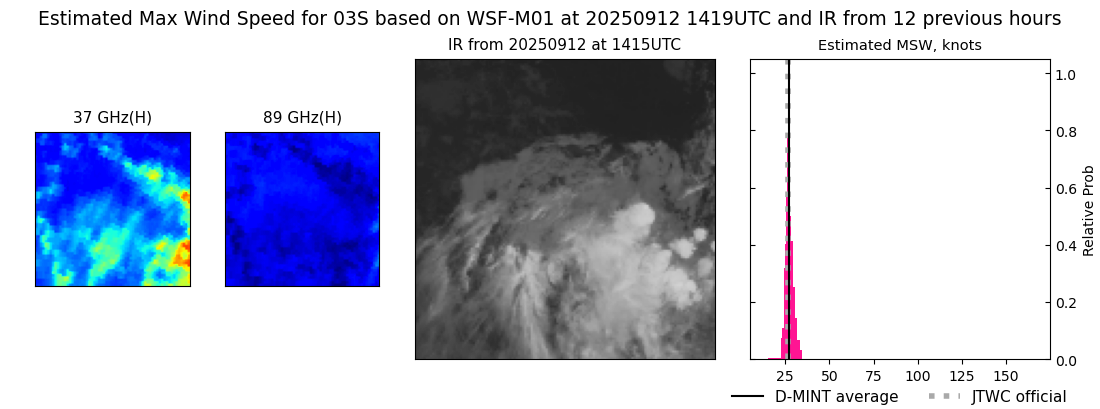 |
| 20250912 | 1419 UTC | WSFM01 | 1005 hPa | 27 kts | 26 kts | 29 kts |  |
| 20250912 | 0925 UTC | ATMS-N21 | 1004 hPa | 28 kts | 25 kts | 31 kts | 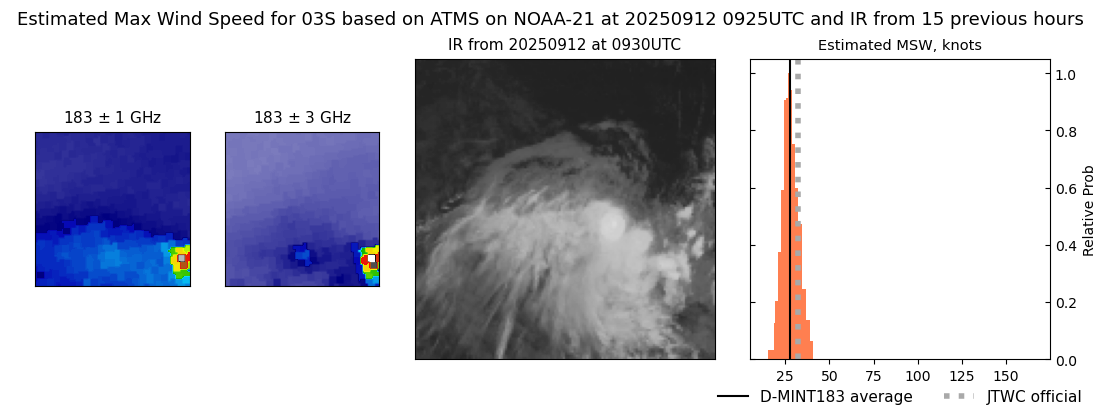 |
| 20250912 | 0638 UTC | GMI | 1001 hPa | 31 kts | 28 kts | 34 kts | 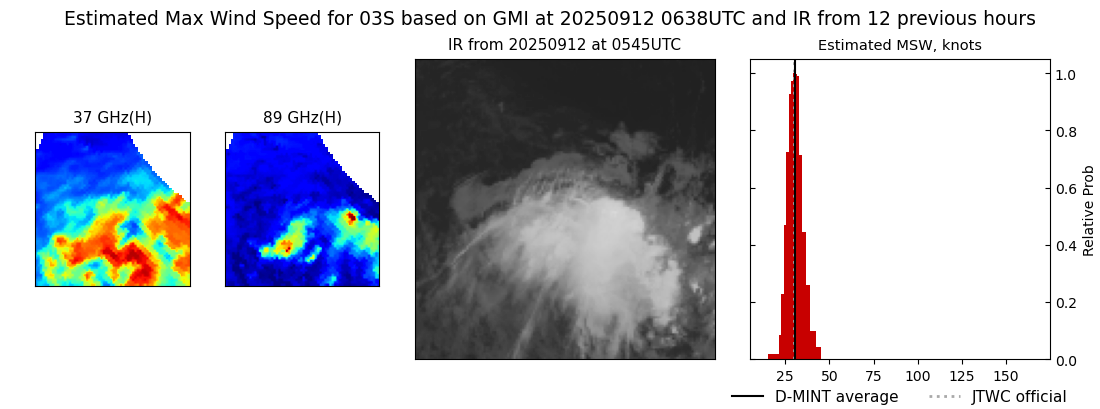 |
| 20250912 | 0613 UTC | TMS06 | 1003 hPa | 30 kts | 27 kts | 34 kts | 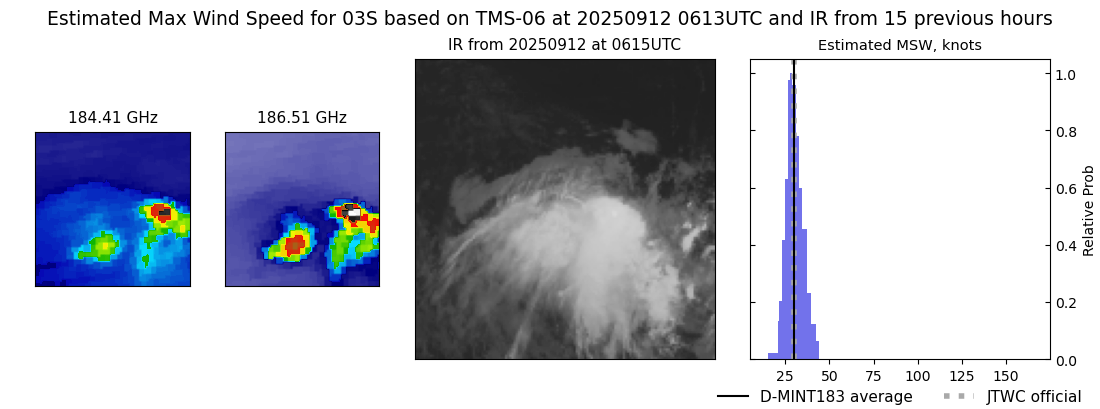 |
| 20250912 | 0244 UTC | SSMISF16 | 1000 hPa | 31 kts | 28 kts | 34 kts |  |
| 20250912 | 0204 UTC | SSMISF17 | 999 hPa | 30 kts | 28 kts | 33 kts |  |
| 20250911 | 2100 UTC | AMSR2 | 1003 hPa | 29 kts | 27 kts | 32 kts | 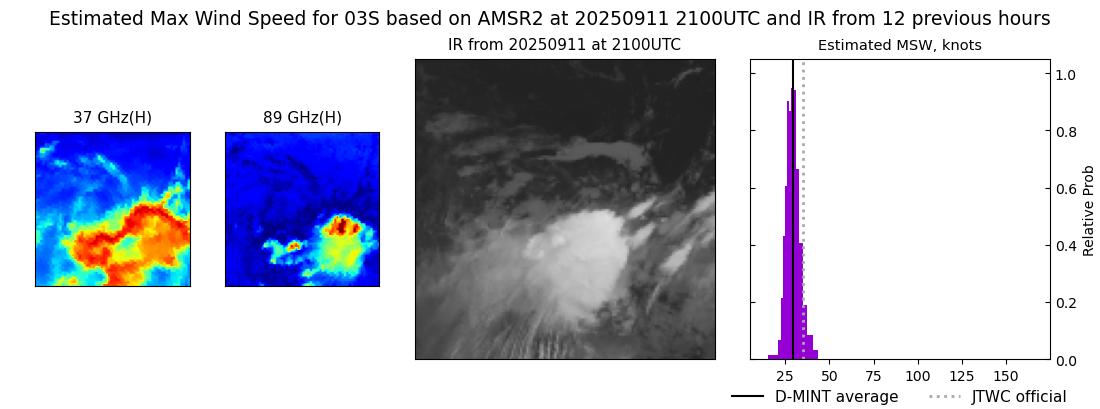 |
| 20250911 | 0608 UTC | TMS02 | 1003 hPa | 30 kts | 27 kts | 34 kts |  |
| 20250911 | 0606 UTC | AWS | 1004 hPa | 30 kts | 27 kts | 34 kts |  |
| 20250911 | 0606 UTC | AWS | 1004 hPa | 31 kts | 28 kts | 34 kts | 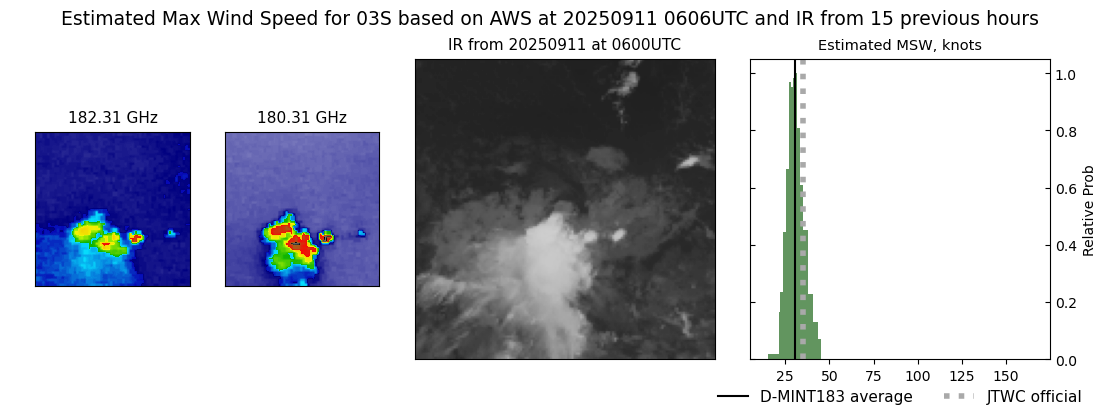 |
| 20250911 | 0204 UTC | WSFM01 | 1002 hPa | 29 kts | 27 kts | 32 kts | 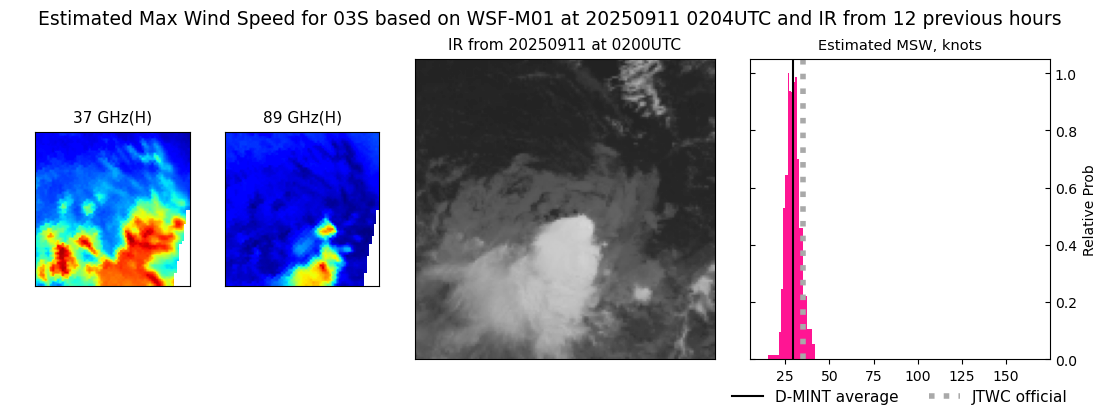 |
| 20250910 | 2319 UTC | SSMISF18 | 1002 hPa | 31 kts | 28 kts | 34 kts |  |
| 20250910 | 2109 UTC | ATMS-N21 | 1004 hPa | 31 kts | 28 kts | 35 kts | 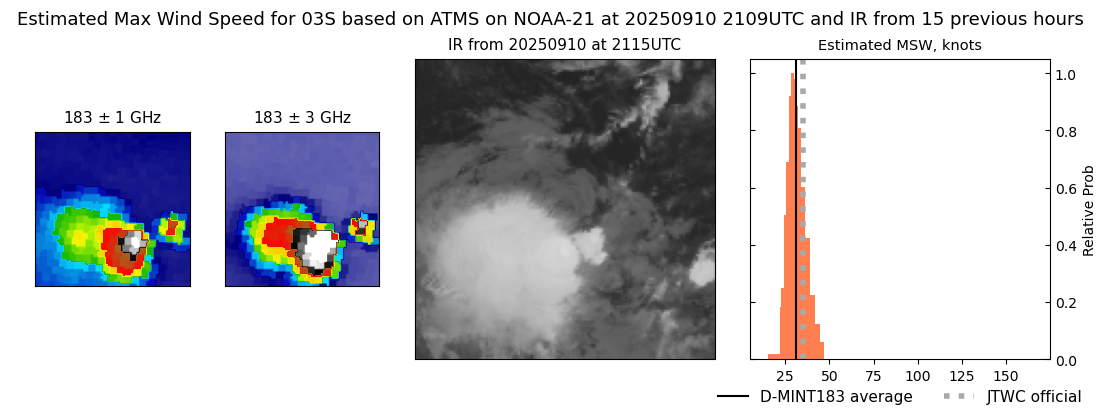 |
| 20250910 | 1946 UTC | GMI | 1001 hPa | 33 kts | 29 kts | 36 kts | 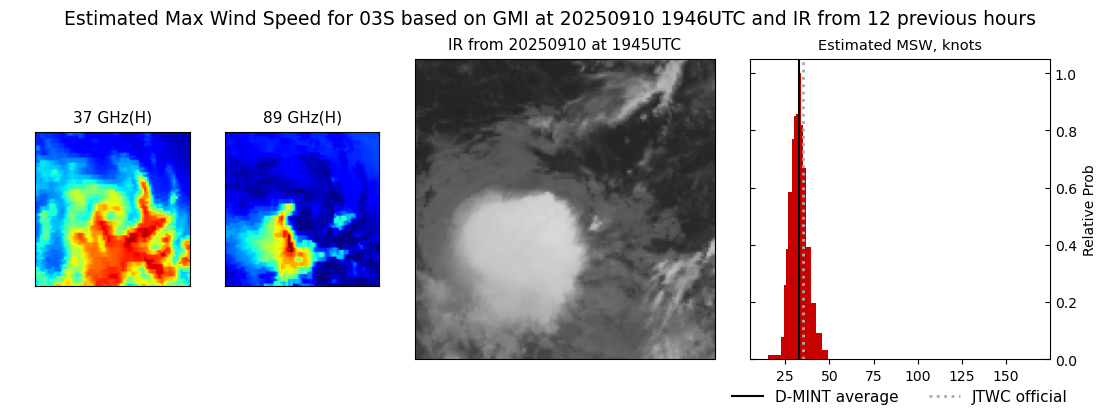 |
| 20250910 | 1811 UTC | TMS02 | 1004 hPa | 33 kts | 29 kts | 37 kts |  |
| 20250910 | 1409 UTC | SSMISF16 | 1003 hPa | 29 kts | 26 kts | 31 kts |  |
| 20250910 | 1330 UTC | SSMISF17 | 1002 hPa | 29 kts | 26 kts | 32 kts | 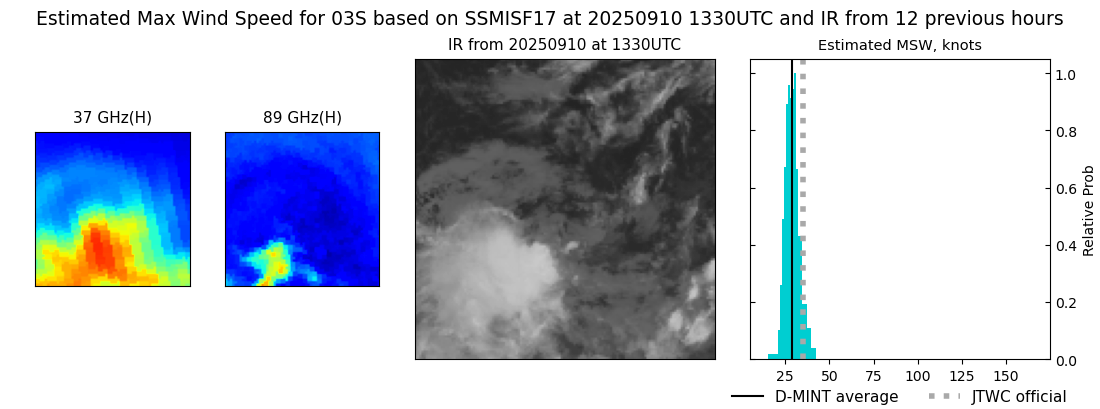 |
| 20250910 | 0928 UTC | AMSR2 | 1004 hPa | 28 kts | 26 kts | 30 kts | 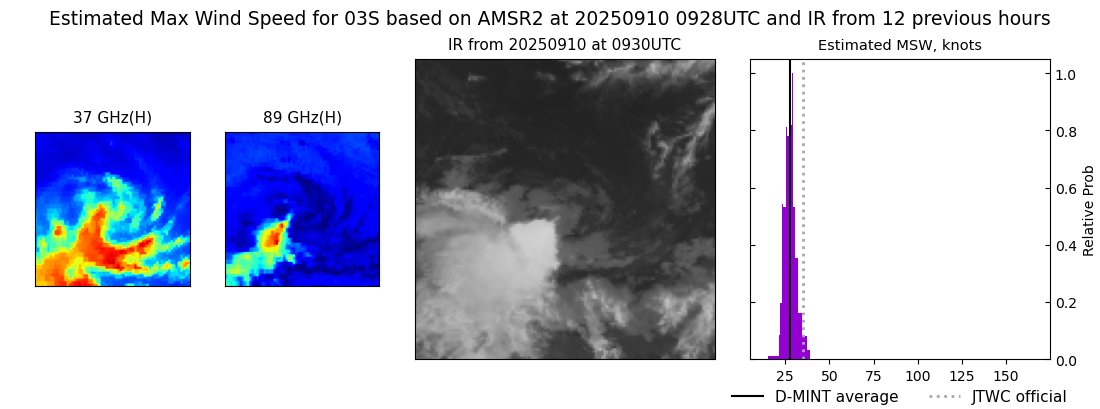 |
| 20250910 | 0912 UTC | ATMS-N20 | 1004 hPa | 32 kts | 29 kts | 35 kts | 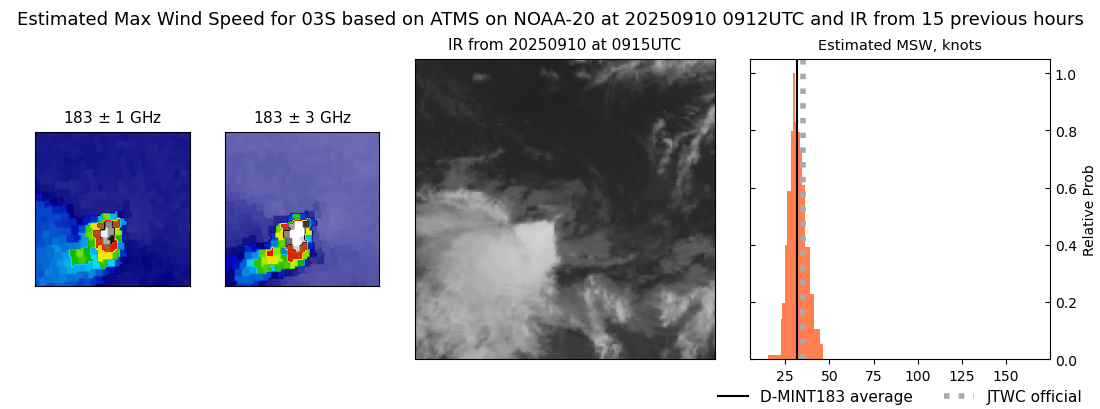 |
| 20250910 | 0556 UTC | AWS | 1005 hPa | 30 kts | 27 kts | 33 kts | 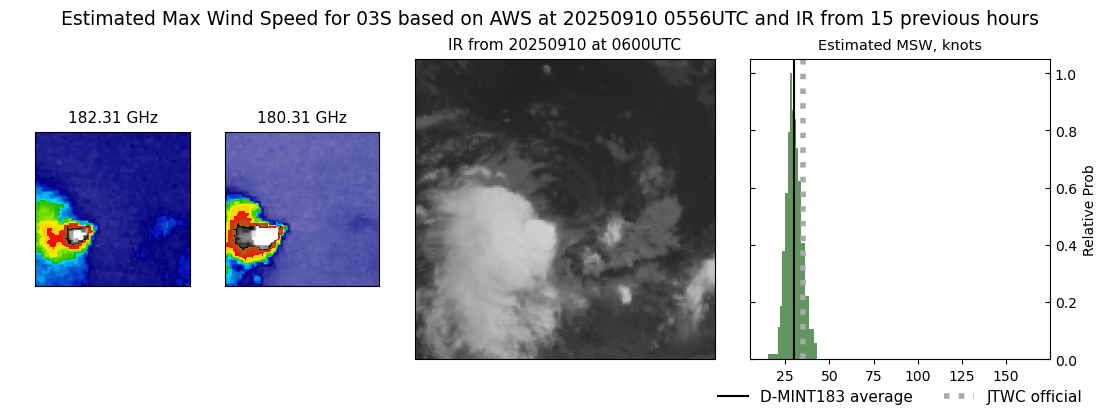 |
| 20250910 | 0556 UTC | TMS05 | 1006 hPa | 30 kts | 27 kts | 33 kts | 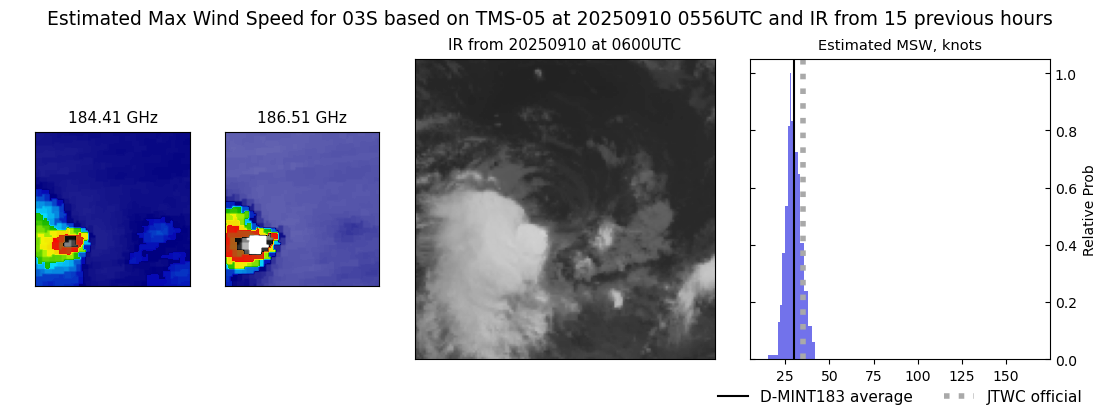 |
| 20250909 | 2113 UTC | AMSR2 | 1006 hPa | 28 kts | 26 kts | 30 kts | 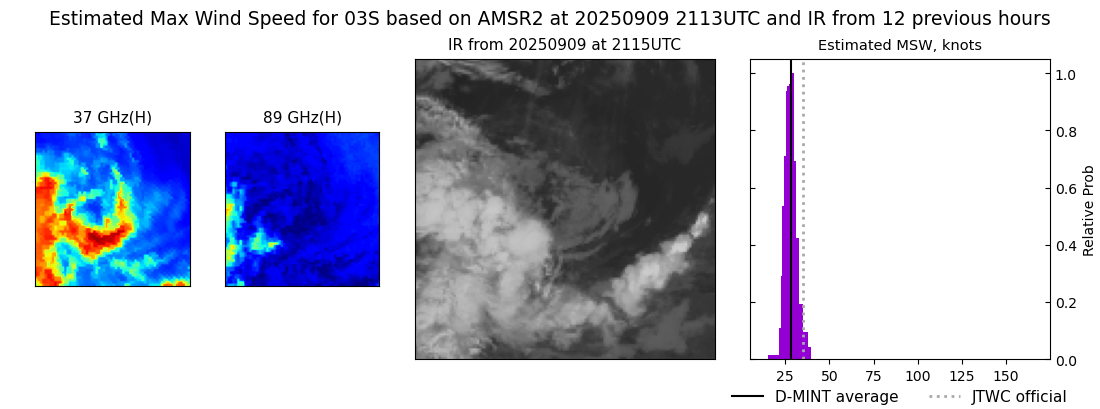 |
| 20250909 | 2036 UTC | ATMS-N20 | 1006 hPa | 29 kts | 27 kts | 32 kts | 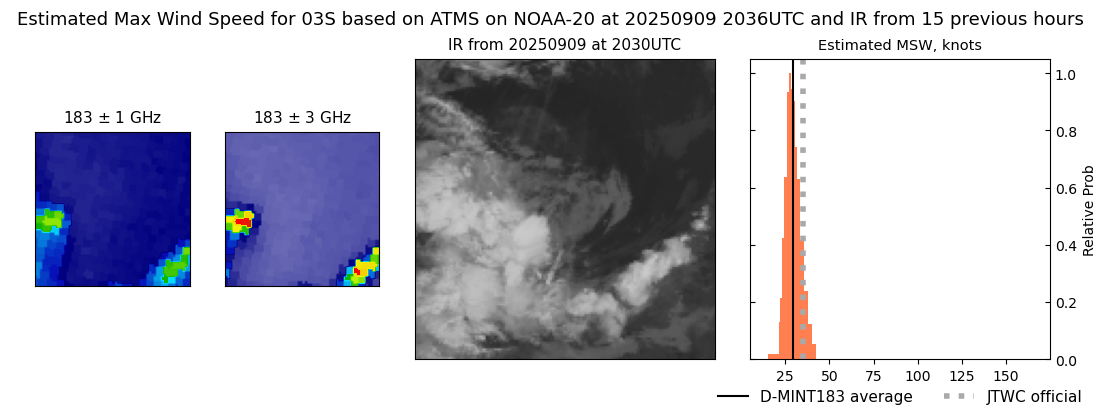 |
| 20250909 | 1422 UTC | SSMISF16 | 1004 hPa | 28 kts | 26 kts | 30 kts |  |
| 20250909 | 1344 UTC | SSMISF17 | 1004 hPa | 30 kts | 27 kts | 32 kts |  |
| 20250909 | 1337 UTC | WSFM01 | 1002 hPa | 29 kts | 27 kts | 32 kts | 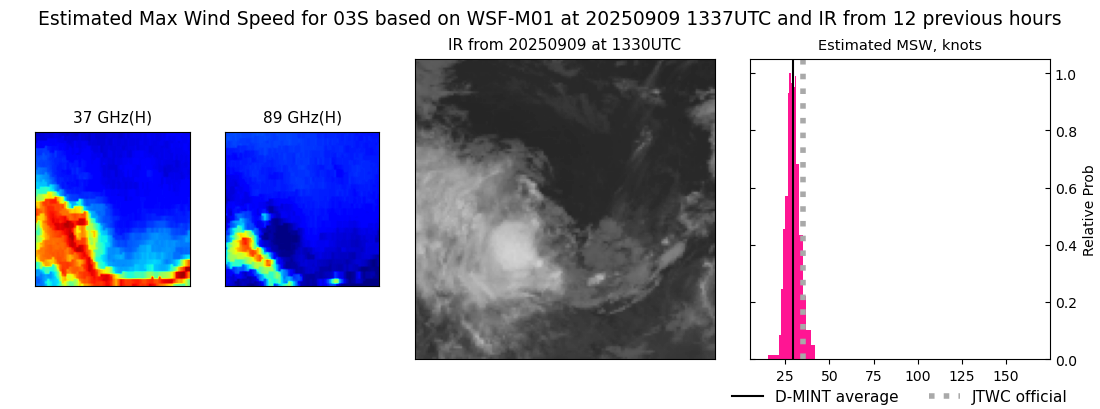 |
| 20250909 | 0846 UTC | AMSR2 | 1005 hPa | 30 kts | 27 kts | 34 kts | 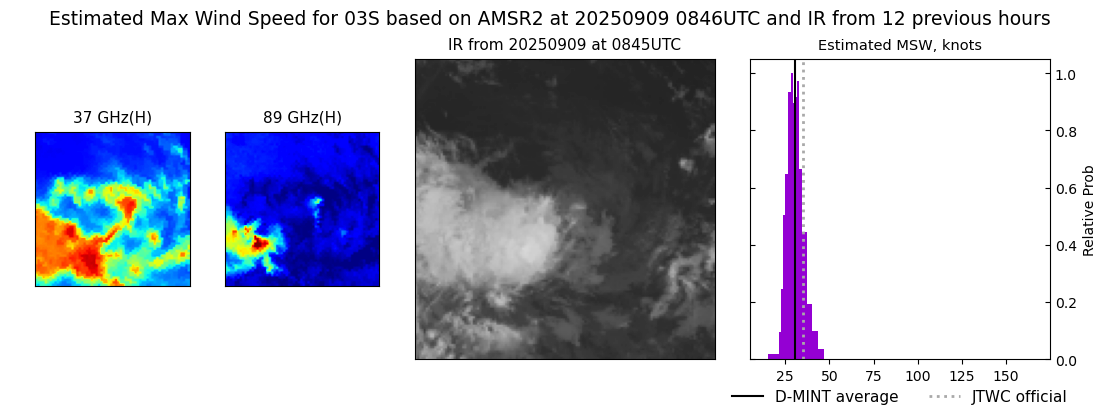 |
| 20250909 | 0841 UTC | ATMS-N21 | 1005 hPa | 27 kts | 24 kts | 30 kts | 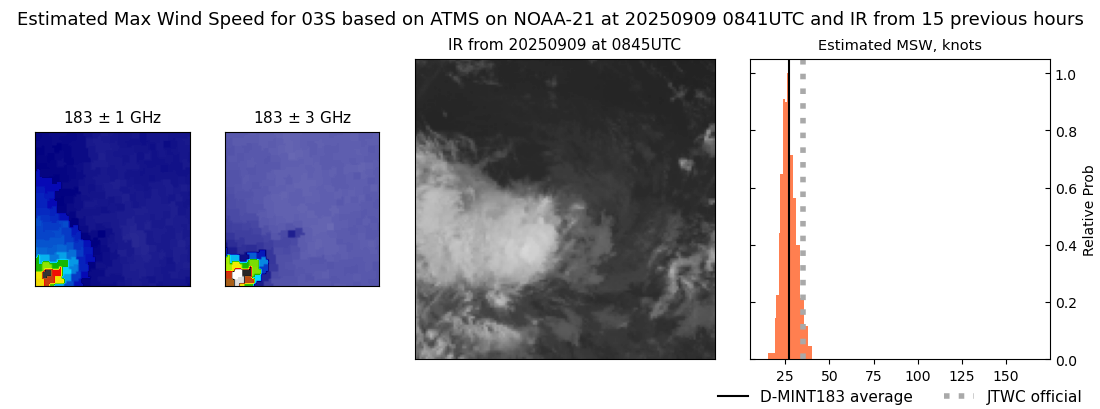 |
| 20250909 | 0545 UTC | AWS | 1004 hPa | 31 kts | 28 kts | 34 kts | 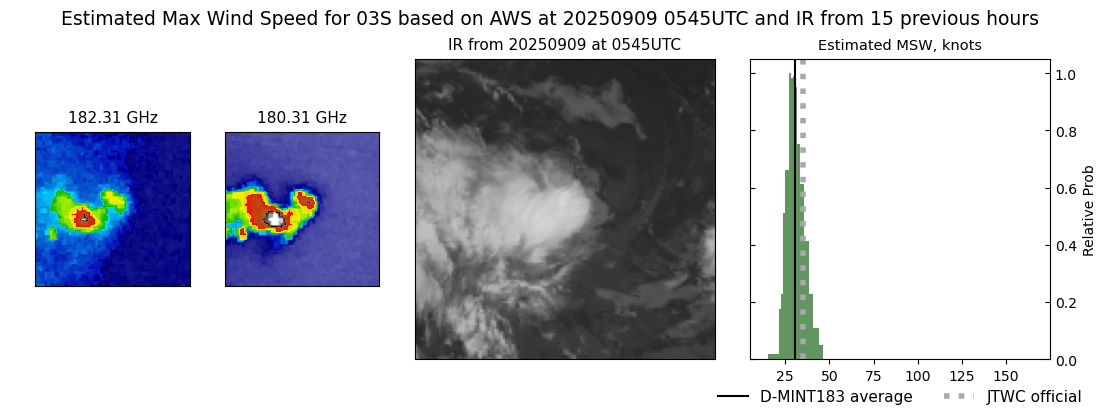 |
| 20250909 | 0102 UTC | WSFM01 | 1002 hPa | 30 kts | 27 kts | 33 kts | 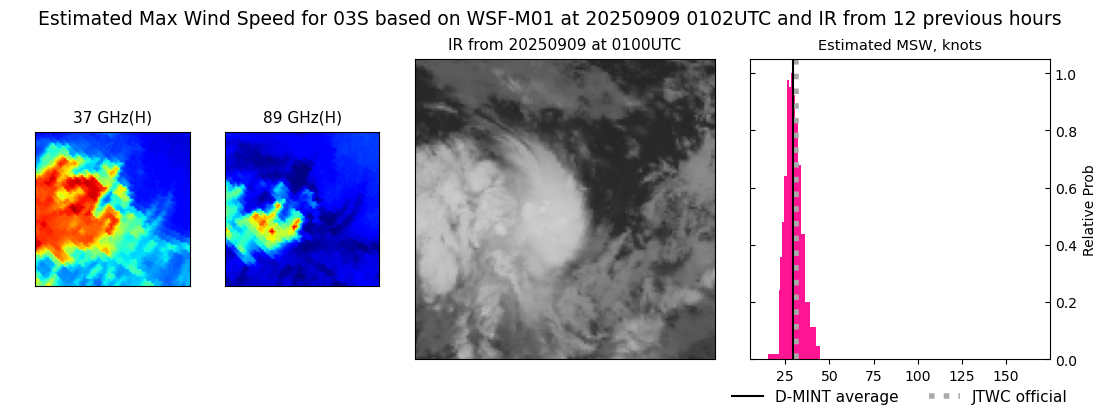 |
| 20250908 | 1735 UTC | TMS06 | 1005 hPa | 26 kts | 25 kts | 28 kts | 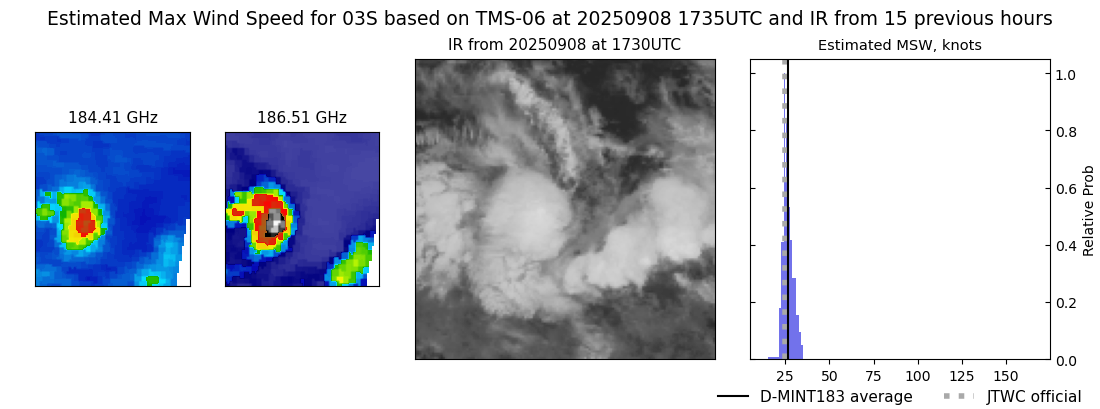 |
| 20250908 | 0900 UTC | ATMS-N21 | 1005 hPa | 25 kts | 23 kts | 28 kts |  |
| 20250908 | 0533 UTC | AWS | 1005 hPa | 26 kts | 24 kts | 28 kts |  |
| 20250908 | 0122 UTC | WSFM01 | 1006 hPa | 21 kts | 21 kts | 22 kts | 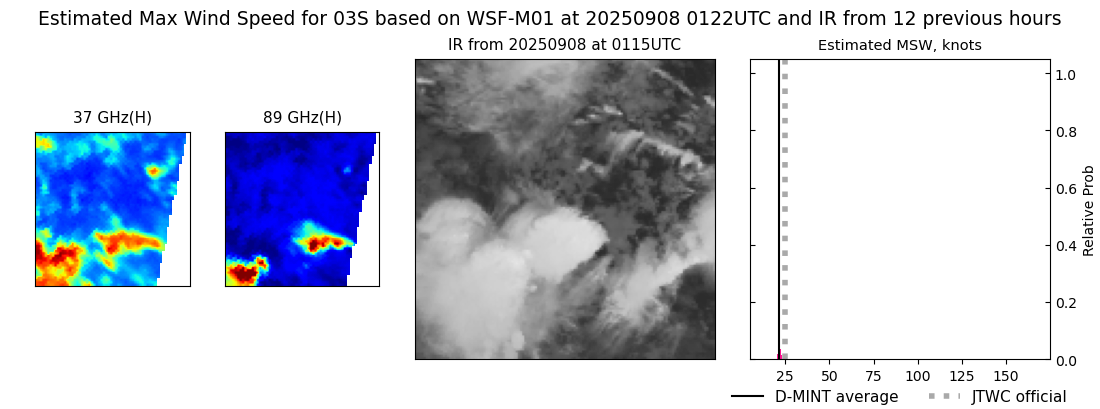 |