|
||

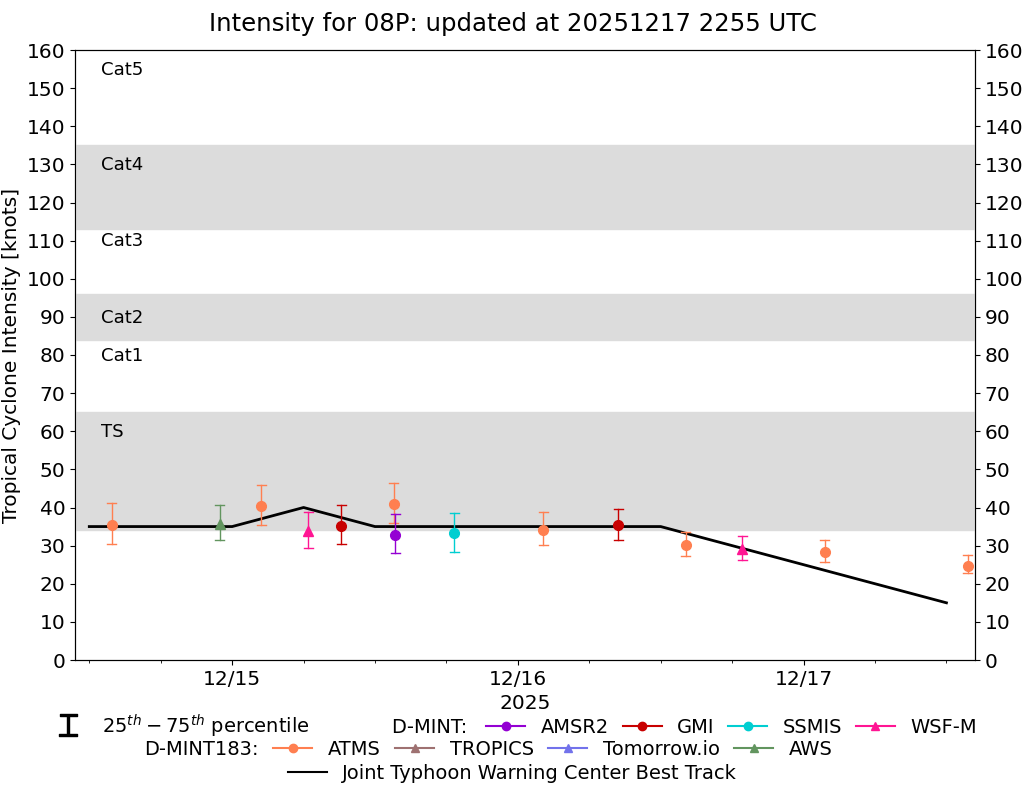 |
D-MINT HISTORY FILE for 2026_08P
| Date | Time | MW Sensor | MSLP | Vmax (30th-70th percentile average) | Vmax 25th percentile | Vmax 75th percentile | Image |
| 20251217 | 1347 UTC | ATMS-N21 | 1006 hPa | 25 kts | 23 kts | 28 kts |  |
| 20251217 | 0148 UTC | ATMS-N20 | 1004 hPa | 28 kts | 26 kts | 32 kts |  |
| 20251216 | 1851 UTC | WSFM01 | 1002 hPa | 29 kts | 26 kts | 33 kts |  |
| 20251216 | 1406 UTC | ATMS-N21 | 1003 hPa | 30 kts | 27 kts | 34 kts |  |
| 20251216 | 0827 UTC | GMI | 1002 hPa | 35 kts | 31 kts | 40 kts |  |
| 20251216 | 0207 UTC | ATMS-N20 | 999 hPa | 34 kts | 30 kts | 39 kts |  |
| 20251215 | 1839 UTC | SSMISF17 | 997 hPa | 33 kts | 28 kts | 39 kts |  |
| 20251215 | 1343 UTC | AMSR2 | 997 hPa | 33 kts | 28 kts | 38 kts |  |
| 20251215 | 1334 UTC | ATMS-N20 | 996 hPa | 41 kts | 36 kts | 46 kts |  |
| 20251215 | 0909 UTC | GMI | 998 hPa | 35 kts | 30 kts | 41 kts |  |
| 20251215 | 0623 UTC | WSFM01 | 996 hPa | 34 kts | 29 kts | 39 kts |  |
| 20251215 | 0226 UTC | ATMS-N20 | 998 hPa | 40 kts | 35 kts | 46 kts |  |
| 20251214 | 2258 UTC | AWS | 992 hPa | 36 kts | 31 kts | 41 kts |  |
| 20251214 | 1352 UTC | ATMS-N20 | 996 hPa | 35 kts | 30 kts | 41 kts |  |
| 20251214 | 0643 UTC | WSFM01 | 995 hPa | 36 kts | 31 kts | 41 kts | 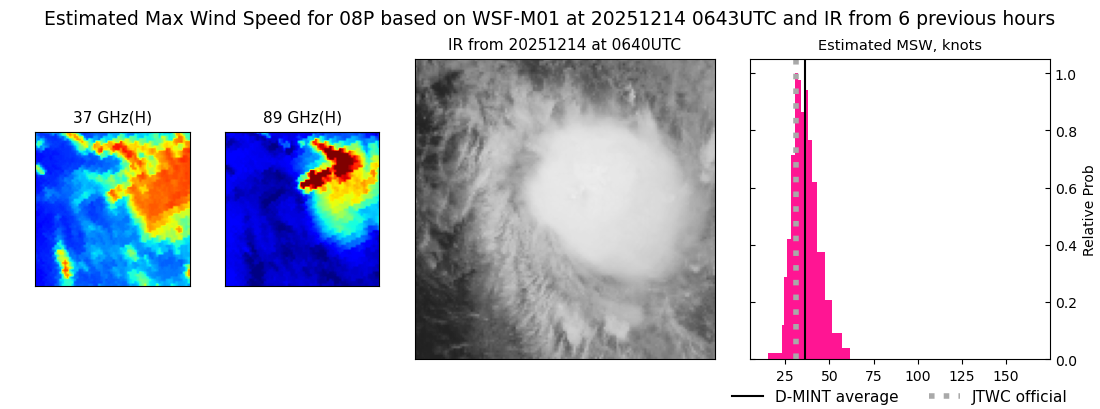 |
| 20251214 | 0155 UTC | ATMS-N21 | 996 hPa | 33 kts | 28 kts | 39 kts |  |
| 20251213 | 0703 UTC | WSFM01 | 999 hPa | 28 kts | 25 kts | 32 kts |  |
| 20251212 | 1635 UTC | SSMISF18 | NaN hPa | 21 kts | 18 kts | 25 kts |  |
| 20251212 | 1450 UTC | AMSR2 | NaN hPa | 19 kts | 16 kts | 22 kts |  |