|
||

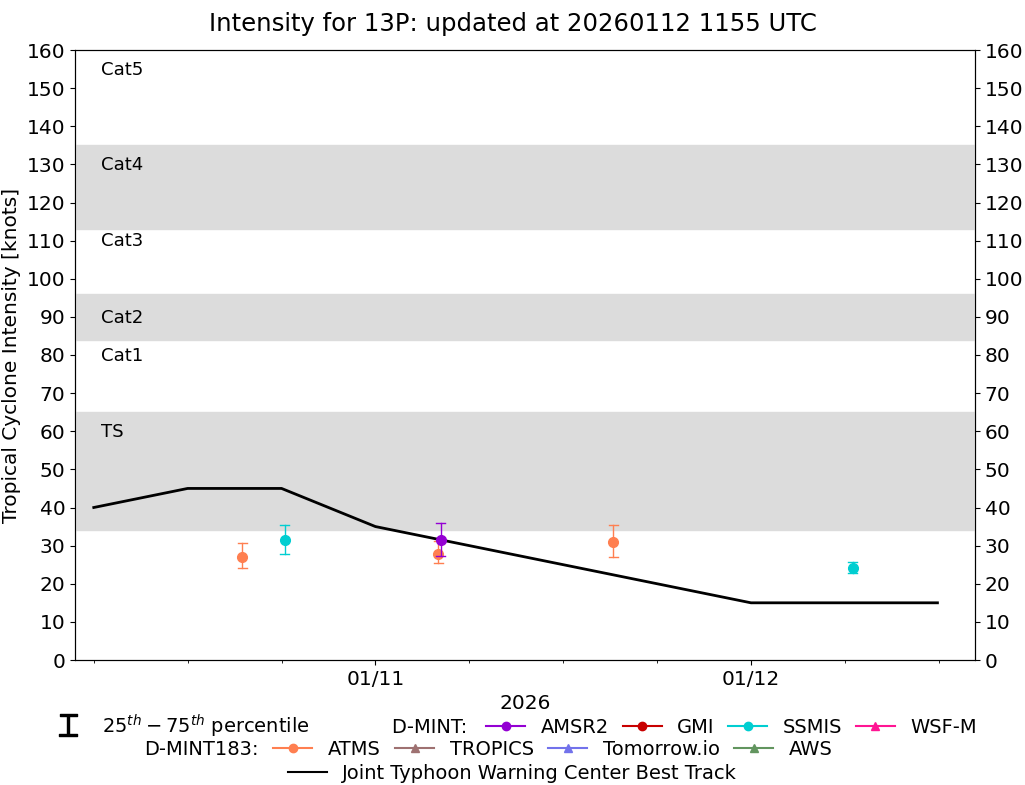 |
D-MINT HISTORY FILE for 2026_13P
| Date | Time | MW Sensor | MSLP | Vmax (30th-70th percentile average) | Vmax 25th percentile | Vmax 75th percentile | Image |
| 20260112 | 0631 UTC | SSMISF18 | 992 hPa | 24 kts | 23 kts | 26 kts |  |
| 20260111 | 1511 UTC | ATMS-N20 | 993 hPa | 31 kts | 27 kts | 35 kts |  |
| 20260111 | 0411 UTC | AMSR2 | 994 hPa | 31 kts | 27 kts | 36 kts |  |
| 20260111 | 0400 UTC | ATMS-N20 | 992 hPa | 28 kts | 25 kts | 31 kts |  |
| 20260110 | 1813 UTC | SSMISF18 | 991 hPa | 31 kts | 28 kts | 35 kts |  |
| 20260110 | 1529 UTC | ATMS-N20 | 996 hPa | 27 kts | 24 kts | 31 kts |  |
| 20260110 | 0329 UTC | ATMS-N21 | 995 hPa | 27 kts | 24 kts | 31 kts |  |
| 20260106 | 0353 UTC | AMSR2 | NaN hPa | 16 kts | 14 kts | 18 kts |  |
| 20260105 | 2024 UTC | SSMISF17 | NaN hPa | 17 kts | 14 kts | 20 kts |  |
| 20260105 | 2020 UTC | SSMISF16 | NaN hPa | 19 kts | 16 kts | 22 kts |  |
| 20260105 | 1742 UTC | SSMISF18 | NaN hPa | 20 kts | 17 kts | 23 kts |  |