|
||
 |
D-MINT HISTORY FILE for 2026_14S
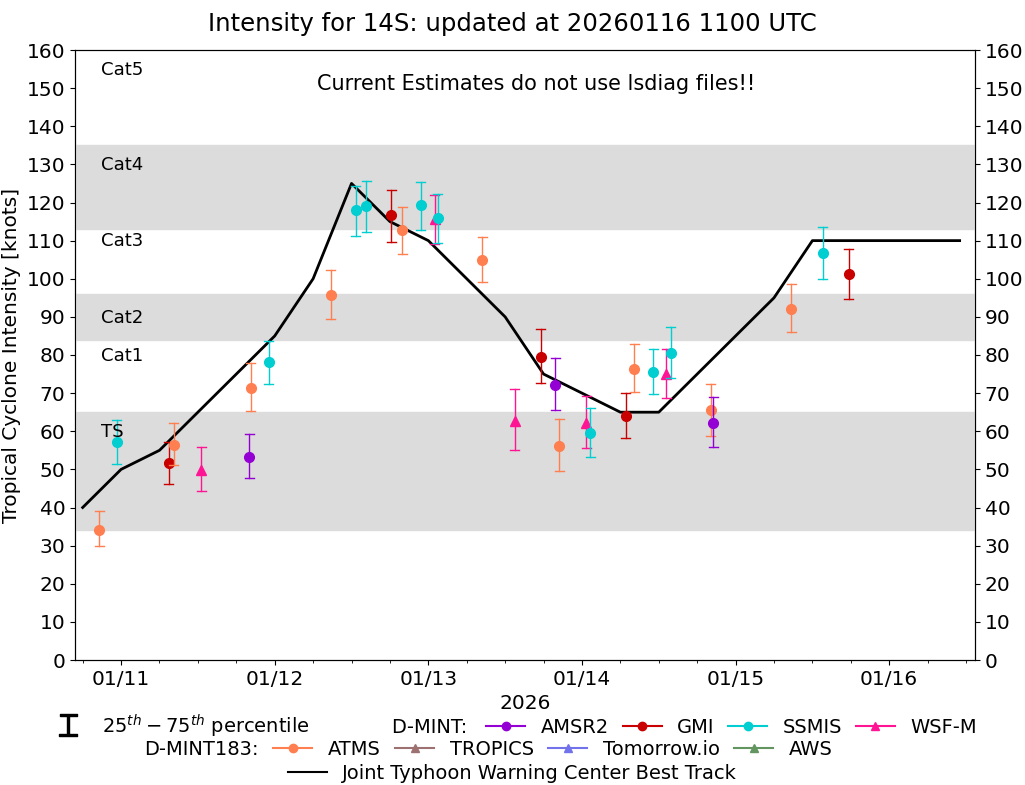
| Date | Time | MW Sensor | MSLP | Vmax (30th-70th percentile average) | Vmax 25th percentile | Vmax 75th percentile | Image |
| 20260121 | 1006 UTC | ATMS-N21 | 993 hPa | 35 kts | 30 kts | 41 kts |  |
| 20260121 | 0942 UTC | AMSR2 | 988 hPa | 37 kts | 33 kts | 41 kts |  |
| 20260121 | 0642 UTC | GMI | 992 hPa | 32 kts | 29 kts | 36 kts |  |
| 20260121 | 0144 UTC | WSFM01 | 992 hPa | 42 kts | 37 kts | 46 kts |  |
| 20260121 | 0143 UTC | WSFM01 | 989 hPa | 42 kts | 38 kts | 47 kts |  |
| 20260120 | 2139 UTC | ATMS-N21 | 992 hPa | 48 kts | 43 kts | 52 kts |  |
| 20260120 | 2136 UTC | AMSR2 | 989 hPa | 49 kts | 45 kts | 54 kts |  |
| 20260120 | 1856 UTC | AWS | 994 hPa | 50 kts | 46 kts | 55 kts |  |
| 20260120 | 1548 UTC | SSMISF16 | 985 hPa | 54 kts | 49 kts | 59 kts |  |
| 20260120 | 1429 UTC | WSFM01 | 986 hPa | 55 kts | 50 kts | 60 kts |  |
| 20260120 | 0936 UTC | ATMS-N20 | 984 hPa | 52 kts | 47 kts | 57 kts |  |
| 20260119 | 2107 UTC | ATMS-N20 | 995 hPa | 35 kts | 32 kts | 40 kts |  |
| 20260119 | 2053 UTC | AMSR2 | 993 hPa | 42 kts | 38 kts | 47 kts |  |
| 20260119 | 1847 UTC | AWS | 996 hPa | 37 kts | 33 kts | 41 kts |  |
| 20260119 | 0955 UTC | ATMS-N20 | 999 hPa | 39 kts | 35 kts | 43 kts |  |
| 20260119 | 0627 UTC | GMI | 996 hPa | 38 kts | 35 kts | 42 kts |  |
| 20260118 | 1707 UTC | GMI | 987 hPa | 54 kts | 49 kts | 60 kts |  |
| 20260118 | 0924 UTC | ATMS-N21 | 991 hPa | 39 kts | 34 kts | 44 kts |  |
| 20260118 | 0914 UTC | AMSR2 | 1004 hPa | 33 kts | 29 kts | 38 kts |  |
| 20260118 | 0101 UTC | WSFM01 | 992 hPa | 45 kts | 40 kts | 50 kts |  |
| 20260117 | 2103 UTC | AMSR2 | 992 hPa | 48 kts | 43 kts | 54 kts |  |
| 20260117 | 2053 UTC | ATMS-N21 | 994 hPa | 47 kts | 42 kts | 52 kts |  |
| 20260117 | 1350 UTC | WSFM01 | 994 hPa | 40 kts | 36 kts | 46 kts |  |
| 20260117 | 0853 UTC | ATMS-N20 | 995 hPa | 46 kts | 41 kts | 51 kts |  |
| 20260117 | 0617 UTC | GMI | 992 hPa | 46 kts | 41 kts | 52 kts |  |
| 20260117 | 0120 UTC | WSFM01 | 982 hPa | 56 kts | 50 kts | 63 kts |  |
| 20260117 | 0120 UTC | WSFM01 | 981 hPa | 55 kts | 49 kts | 62 kts |  |
| 20260117 | 0119 UTC | WSFM01 | 980 hPa | 59 kts | 53 kts | 65 kts |  |
| 20260116 | 2021 UTC | ATMS-N20 | 975 hPa | 72 kts | 64 kts | 79 kts |  |
| 20260116 | 2020 UTC | AMSR2 | 976 hPa | 69 kts | 62 kts | 76 kts |  |
| 20260115 | 1742 UTC | GMI | 944 hPa | 101 kts | 95 kts | 108 kts |  |
| 20260115 | 1336 UTC | SSMISF17 | 947 hPa | 107 kts | 100 kts | 114 kts |  |
| 20260115 | 0840 UTC | ATMS-N21 | 961 hPa | 92 kts | 86 kts | 99 kts |  |
| 20260114 | 2031 UTC | AMSR2 | 982 hPa | 62 kts | 56 kts | 69 kts |  |
| 20260114 | 2009 UTC | ATMS-N21 | 980 hPa | 65 kts | 59 kts | 72 kts |  |
| 20260114 | 1350 UTC | SSMISF16 | 965 hPa | 81 kts | 74 kts | 87 kts |  |
| 20260114 | 1310 UTC | WSFM01 | 971 hPa | 75 kts | 69 kts | 82 kts |  |
| 20260114 | 1109 UTC | SSMISF18 | 975 hPa | 76 kts | 70 kts | 82 kts |  |
| 20260114 | 0809 UTC | ATMS-N20 | 974 hPa | 76 kts | 70 kts | 83 kts |  |
| 20260114 | 0652 UTC | GMI | 981 hPa | 64 kts | 58 kts | 70 kts |  |
| 20260114 | 0116 UTC | SSMISF16 | 976 hPa | 60 kts | 53 kts | 66 kts |  |
| 20260114 | 0039 UTC | WSFM01 | 979 hPa | 62 kts | 56 kts | 69 kts |  |
| 20260113 | 2027 UTC | ATMS-N21 | 980 hPa | 56 kts | 50 kts | 63 kts |  |
| 20260113 | 1949 UTC | AMSR2 | 972 hPa | 72 kts | 65 kts | 79 kts |  |
| 20260113 | 1732 UTC | GMI | 975 hPa | 80 kts | 73 kts | 87 kts |  |
| 20260113 | 1331 UTC | WSFM01 | 984 hPa | 63 kts | 55 kts | 71 kts |  |
| 20260113 | 0827 UTC | ATMS-N20 | 956 hPa | 105 kts | 99 kts | 111 kts |  |
| 20260113 | 0129 UTC | SSMISF16 | 938 hPa | 116 kts | 109 kts | 122 kts |  |
| 20260113 | 0059 UTC | WSFM01 | 940 hPa | 116 kts | 109 kts | 122 kts |  |
| 20260112 | 2249 UTC | SSMISF18 | 938 hPa | 119 kts | 113 kts | 125 kts |  |
| 20260112 | 1956 UTC | ATMS-N20 | 953 hPa | 113 kts | 107 kts | 119 kts |  |
| 20260112 | 1812 UTC | GMI | 943 hPa | 117 kts | 110 kts | 123 kts |  |
| 20260112 | 1418 UTC | SSMISF16 | 941 hPa | 119 kts | 112 kts | 126 kts |  |
| 20260112 | 1238 UTC | SSMISF17 | 940 hPa | 118 kts | 111 kts | 124 kts |  |
| 20260112 | 0846 UTC | ATMS-N20 | 959 hPa | 96 kts | 89 kts | 102 kts |  |
| 20260111 | 2303 UTC | SSMISF18 | 971 hPa | 78 kts | 72 kts | 84 kts |  |
| 20260111 | 2014 UTC | ATMS-N20 | 984 hPa | 71 kts | 65 kts | 78 kts |  |
| 20260111 | 2000 UTC | AMSR2 | 982 hPa | 53 kts | 48 kts | 59 kts |  |
| 20260111 | 1231 UTC | WSFM01 | 989 hPa | 50 kts | 44 kts | 56 kts |  |
| 20260111 | 0815 UTC | ATMS-N21 | 980 hPa | 56 kts | 51 kts | 62 kts |  |
| 20260111 | 0727 UTC | GMI | 987 hPa | 52 kts | 46 kts | 57 kts |  |
| 20260110 | 2318 UTC | SSMISF18 | 990 hPa | 57 kts | 51 kts | 63 kts |  |
| 20260110 | 2033 UTC | ATMS-N20 | 997 hPa | 34 kts | 30 kts | 39 kts |  |
| 20260110 | 0835 UTC | ATMS-N21 | 1001 hPa | 29 kts | 26 kts | 32 kts |  |
| 20260109 | 1311 UTC | WSFM01 | NaN hPa | 22 kts | 21 kts | 24 kts |  |
| 20260107 | 2023 UTC | AMSR2 | NaN hPa | 17 kts | 15 kts | 18 kts |  |
| 20260107 | 0844 UTC | GMI | NaN hPa | 16 kts | 14 kts | 18 kts |  |