|
||

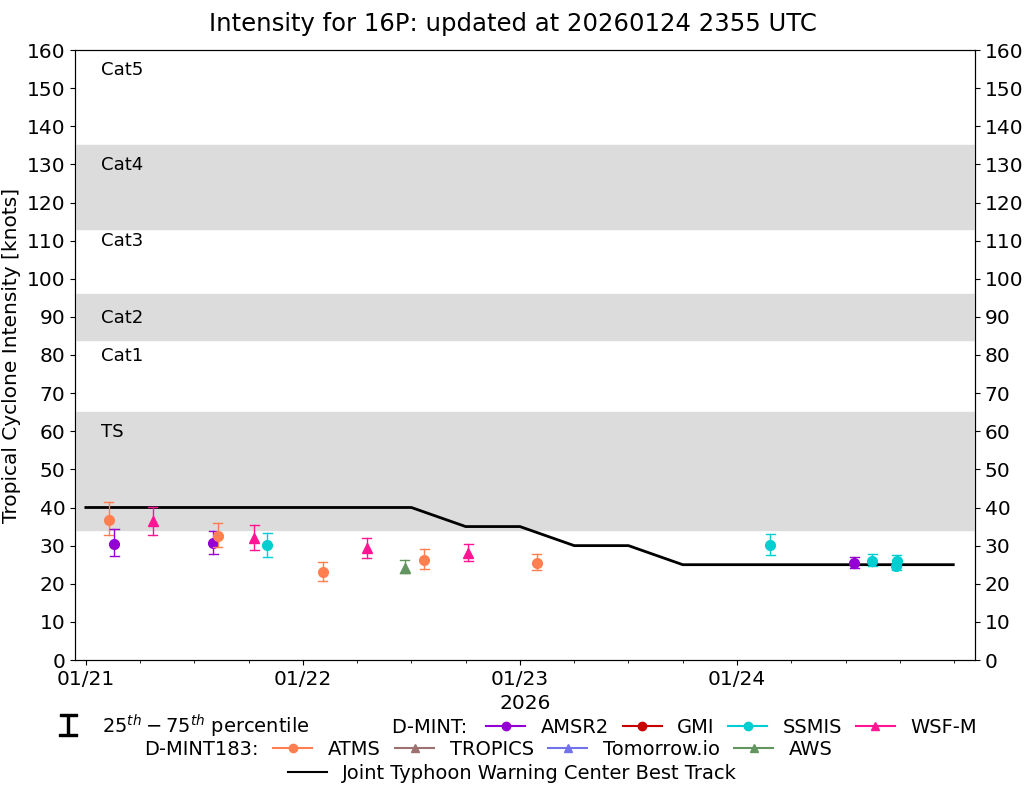 |
D-MINT HISTORY FILE for 2026_16P
| Date | Time | MW Sensor | MSLP | Vmax (30th-70th percentile average) | Vmax 25th percentile | Vmax 75th percentile | Image |
| 20260124 | 1741 UTC | SSMISF16 | 996 hPa | 26 kts | 25 kts | 27 kts |  |
| 20260124 | 1736 UTC | SSMISF17 | 995 hPa | 25 kts | 24 kts | 26 kts |  |
| 20260124 | 1456 UTC | SSMISF18 | 995 hPa | 26 kts | 25 kts | 28 kts |  |
| 20260124 | 1257 UTC | AMSR2 | 994 hPa | 25 kts | 24 kts | 27 kts |  |
| 20260124 | 0339 UTC | SSMISF18 | 994 hPa | 30 kts | 28 kts | 33 kts |  |
| 20260123 | 0151 UTC | ATMS-N20 | 1000 hPa | 25 kts | 24 kts | 28 kts |  |
| 20260122 | 1817 UTC | WSFM01 | 994 hPa | 28 kts | 26 kts | 31 kts |  |
| 20260122 | 1325 UTC | ATMS-N20 | 997 hPa | 26 kts | 24 kts | 29 kts |  |
| 20260122 | 1115 UTC | AWS | 999 hPa | 24 kts | 23 kts | 26 kts |  |
| 20260122 | 0703 UTC | WSFM01 | 996 hPa | 29 kts | 27 kts | 32 kts |  |
| 20260122 | 0212 UTC | ATMS-N20 | 1002 hPa | 23 kts | 21 kts | 26 kts |  |
| 20260121 | 2003 UTC | SSMISF16 | 1000 hPa | 30 kts | 27 kts | 33 kts |  |
| 20260121 | 1836 UTC | WSFM01 | 999 hPa | 32 kts | 29 kts | 35 kts |  |
| 20260121 | 1434 UTC | ATMS-N21 | 997 hPa | 32 kts | 30 kts | 36 kts |  |
| 20260121 | 1404 UTC | AMSR2 | 996 hPa | 31 kts | 28 kts | 34 kts |  |
| 20260121 | 0725 UTC | WSFM01 | 992 hPa | 36 kts | 33 kts | 40 kts |  |
| 20260121 | 0310 UTC | AMSR2 | 993 hPa | 31 kts | 27 kts | 34 kts |  |
| 20260121 | 0233 UTC | ATMS-N20 | 992 hPa | 37 kts | 33 kts | 41 kts |  |
| 20260120 | 1457 UTC | AMSR2 | 988 hPa | 39 kts | 33 kts | 45 kts |  |
| 20260120 | 1451 UTC | ATMS-N21 | 992 hPa | 28 kts | 25 kts | 33 kts |  |