|
||
 |
D-MINT HISTORY FILE for 2026_19S
| Date | Time | MW Sensor | MSLP | Vmax (30th-70th percentile average) | Vmax 25th percentile | Vmax 75th percentile | Image |
| 20260206 | 1145 UTC | GMI | 1001 hPa | 28 kts | 26 kts | 30 kts |  |
| 20260206 | 0155 UTC | GMI | 1002 hPa | 23 kts | 21 kts | 25 kts |  |
| 20260205 | 2135 UTC | AMSR2 | NaN hPa | 24 kts | 22 kts | 27 kts |  |
| 20260205 | 1529 UTC | SSMISF16 | NaN hPa | 24 kts | 22 kts | 27 kts |  |
| 20260205 | 0144 UTC | WSFM01 | 1002 hPa | 22 kts | 21 kts | 24 kts |  |
| 20260205 | 0010 UTC | SSMISF18 | 999 hPa | 24 kts | 22 kts | 27 kts |  |
| 20260204 | 1431 UTC | WSFM01 | 997 hPa | 22 kts | 20 kts | 24 kts |  |
| 20260204 | 1431 UTC | WSFM01 | 997 hPa | 27 kts | 24 kts | 29 kts |  |
| 20260204 | 0955 UTC | ATMS-N20 | 1002 hPa | 28 kts | 25 kts | 31 kts |  |
| 20260204 | 0632 UTC | AWS | 1003 hPa | 31 kts | 28 kts | 35 kts |  |
| 20260204 | 0313 UTC | SSMISF16 | 998 hPa | 34 kts | 30 kts | 38 kts |  |
| 20260204 | 0204 UTC | WSFM01 | 996 hPa | 37 kts | 33 kts | 41 kts |  |
| 20260204 | 0024 UTC | SSMISF18 | 1000 hPa | 31 kts | 28 kts | 35 kts |  |
| 20260203 | 2148 UTC | AMSR2 | 995 hPa | 35 kts | 31 kts | 39 kts |  |
| 20260203 | 2127 UTC | ATMS-N20 | 996 hPa | 35 kts | 30 kts | 40 kts |  |
| 20260203 | 1451 UTC | WSFM01 | 992 hPa | 37 kts | 33 kts | 43 kts |  |
| 20260203 | 1013 UTC | ATMS-N20 | 994 hPa | 44 kts | 39 kts | 50 kts |  |
| 20260203 | 0622 UTC | AWS | 990 hPa | 52 kts | 46 kts | 58 kts |  |
| 20260203 | 0224 UTC | WSFM01 | 987 hPa | 47 kts | 41 kts | 53 kts |  |
| 20260202 | 2146 UTC | ATMS-N20 | 1001 hPa | 33 kts | 29 kts | 37 kts |  |
| 20260202 | 1513 UTC | WSFM01 | 997 hPa | 34 kts | 30 kts | 37 kts |  |
| 20260202 | 0943 UTC | ATMS-N21 | 1001 hPa | 32 kts | 28 kts | 37 kts |  |
| 20260202 | 0302 UTC | GMI | 995 hPa | 40 kts | 36 kts | 44 kts |  |
| 20260202 | 0244 UTC | WSFM01 | 993 hPa | 43 kts | 38 kts | 47 kts |  |
| 20260201 | 2204 UTC | ATMS-N20 | 994 hPa | 39 kts | 34 kts | 46 kts |  |
| 20260201 | 2159 UTC | AMSR2 | 989 hPa | 47 kts | 41 kts | 52 kts |  |
| 20260201 | 1003 UTC | ATMS-N21 | 1001 hPa | 38 kts | 33 kts | 43 kts |  |
| 20260201 | 0354 UTC | SSMISF16 | 995 hPa | 30 kts | 25 kts | 35 kts |  |
| 20260201 | 0342 UTC | GMI | 995 hPa | 27 kts | 23 kts | 32 kts |  |
| 20260131 | 2222 UTC | ATMS-N20 | 994 hPa | 31 kts | 26 kts | 36 kts |  |
| 20260131 | 1920 UTC | AWS | 973 hPa | 70 kts | 64 kts | 76 kts |  |
| 20260131 | 1417 UTC | GMI | 987 hPa | 49 kts | 40 kts | 60 kts |  |
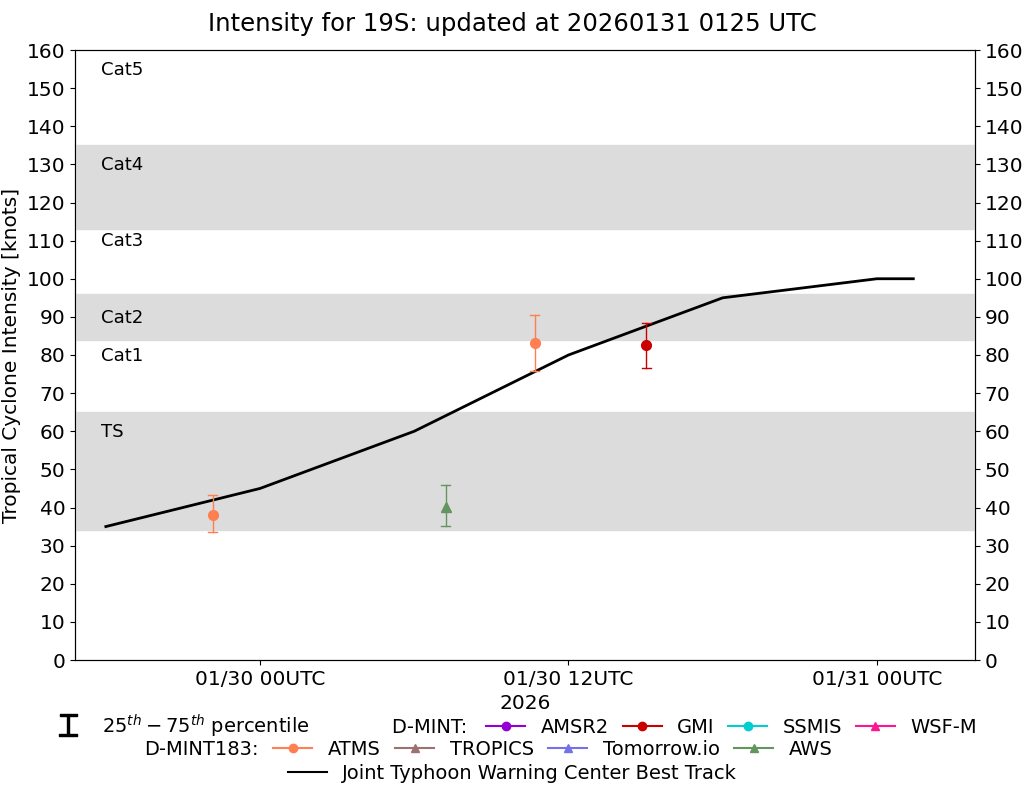
| 20260131 | 1023 UTC | AMSR2 | 963 hPa | 83 kts | 75 kts | 92 kts |  |
| 20260131 | 1022 UTC | ATMS-N21 | 959 hPa | 92 kts | 84 kts | 100 kts |  |
| 20260131 | 0120 UTC | SSMISF18 | 948 hPa | 109 kts | 101 kts | 117 kts |  |
| 20260130 | 2210 UTC | AMSR2 | 963 hPa | 87 kts | 81 kts | 93 kts |  |
| 20260130 | 1502 UTC | GMI | 967 hPa | 83 kts | 77 kts | 88 kts |  |
| 20260130 | 1041 UTC | ATMS-N21 | 971 hPa | 83 kts | 76 kts | 91 kts |  |
| 20260130 | 0713 UTC | AWS | 995 hPa | 40 kts | 35 kts | 46 kts |  |
| 20260129 | 2209 UTC | ATMS-N21 | 999 hPa | 38 kts | 33 kts | 43 kts |  |
| 20260129 | 1454 UTC | WSFM01 | 1003 hPa | 27 kts | 24 kts | 30 kts |  |
| 20260129 | 1059 UTC | ATMS-N21 | 1006 hPa | 25 kts | 22 kts | 28 kts |  |
| 20260128 | 2223 UTC | AMSR2 | NaN hPa | 19 kts | 16 kts | 22 kts |  |
| 20260128 | 1535 UTC | SSMISF17 | NaN hPa | 21 kts | 18 kts | 25 kts |  |
| 20260128 | 1256 UTC | SSMISF18 | NaN hPa | 16 kts | 14 kts | 19 kts |  |