|
||

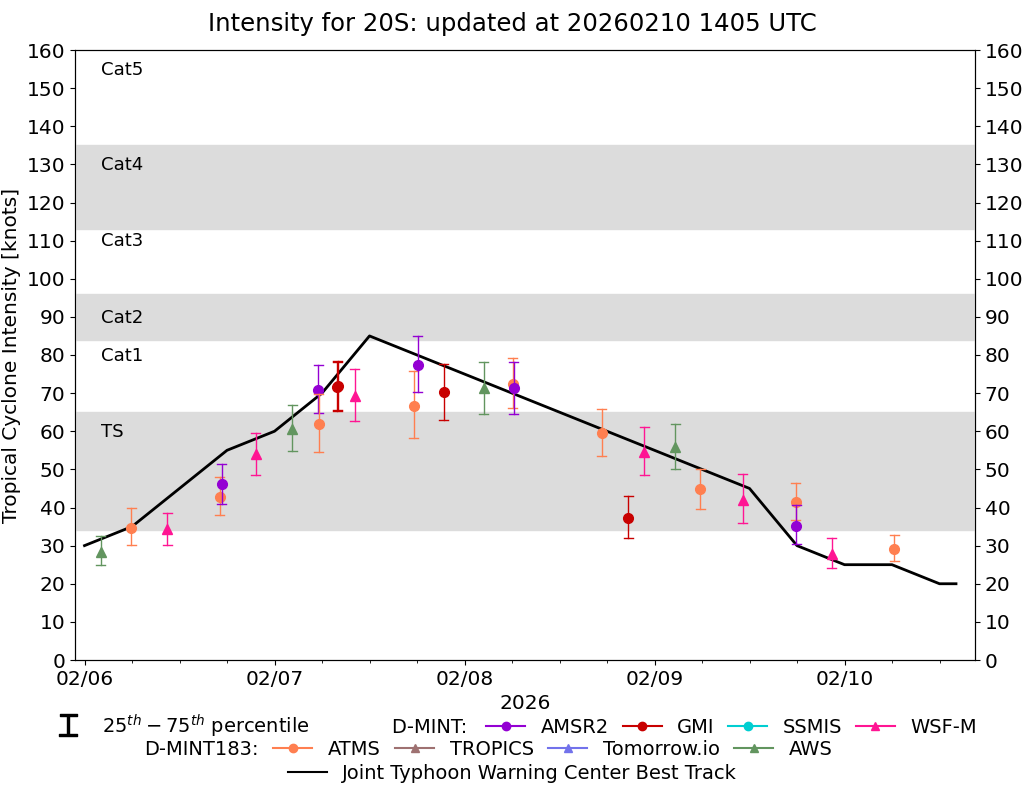 |
D-MINT HISTORY FILE for 2026_20S
| Date | Time | MW Sensor | MSLP | Vmax (30th-70th percentile average) | Vmax 25th percentile | Vmax 75th percentile | Image |
| 20260210 | 1047 UTC | WSFM01 | 1000 hPa | 17 kts | 15 kts | 19 kts |  |
| 20260210 | 0618 UTC | ATMS-N20 | 999 hPa | 29 kts | 26 kts | 33 kts |  |
| 20260209 | 2222 UTC | WSFM01 | 994 hPa | 28 kts | 24 kts | 32 kts |  |
| 20260209 | 1753 UTC | AMSR2 | 991 hPa | 35 kts | 31 kts | 41 kts |  |
| 20260209 | 1751 UTC | ATMS-N20 | 989 hPa | 41 kts | 37 kts | 46 kts |  |
| 20260209 | 1108 UTC | WSFM01 | 986 hPa | 42 kts | 36 kts | 49 kts |  |
| 20260209 | 0548 UTC | ATMS-N21 | 988 hPa | 45 kts | 40 kts | 50 kts |  |
| 20260209 | 0236 UTC | AWS | 982 hPa | 56 kts | 50 kts | 62 kts |  |
| 20260208 | 2242 UTC | WSFM01 | 977 hPa | 55 kts | 48 kts | 61 kts |  |
| 20260208 | 2042 UTC | GMI | 991 hPa | 37 kts | 32 kts | 43 kts |  |
| 20260208 | 1719 UTC | ATMS-N21 | 976 hPa | 60 kts | 53 kts | 66 kts |  |
| 20260208 | 0614 UTC | AMSR2 | 971 hPa | 71 kts | 65 kts | 78 kts |  |
| 20260208 | 0607 UTC | ATMS-N21 | 968 hPa | 72 kts | 66 kts | 79 kts |  |
| 20260208 | 0224 UTC | AWS | 968 hPa | 71 kts | 65 kts | 78 kts |  |
| 20260207 | 2122 UTC | GMI | 970 hPa | 70 kts | 63 kts | 78 kts |  |
| 20260207 | 1805 UTC | AMSR2 | 962 hPa | 77 kts | 70 kts | 85 kts |  |
| 20260207 | 1737 UTC | ATMS-N21 | 972 hPa | 67 kts | 58 kts | 76 kts |  |
| 20260207 | 1009 UTC | WSFM01 | 965 hPa | 69 kts | 63 kts | 76 kts |  |
| 20260207 | 0800 UTC | GMI | 964 hPa | 72 kts | 66 kts | 78 kts |  |
| 20260207 | 0757 UTC | GMI | 964 hPa | 72 kts | 65 kts | 78 kts |  |
| 20260207 | 0536 UTC | ATMS-N20 | 970 hPa | 62 kts | 55 kts | 70 kts |  |
| 20260207 | 0532 UTC | AMSR2 | 970 hPa | 71 kts | 65 kts | 77 kts |  |
| 20260207 | 0213 UTC | AWS | 975 hPa | 61 kts | 55 kts | 67 kts |  |
| 20260206 | 2139 UTC | WSFM01 | 982 hPa | 54 kts | 49 kts | 60 kts |  |
| 20260206 | 1720 UTC | AMSR2 | 983 hPa | 46 kts | 41 kts | 51 kts |  |
| 20260206 | 1705 UTC | ATMS-N20 | 987 hPa | 43 kts | 38 kts | 48 kts |  |
| 20260206 | 1029 UTC | WSFM01 | 992 hPa | 34 kts | 30 kts | 39 kts |  |
| 20260206 | 0555 UTC | ATMS-N20 | 991 hPa | 35 kts | 30 kts | 40 kts |  |
| 20260206 | 0202 UTC | AWS | 1001 hPa | 28 kts | 25 kts | 33 kts |  |