|
||
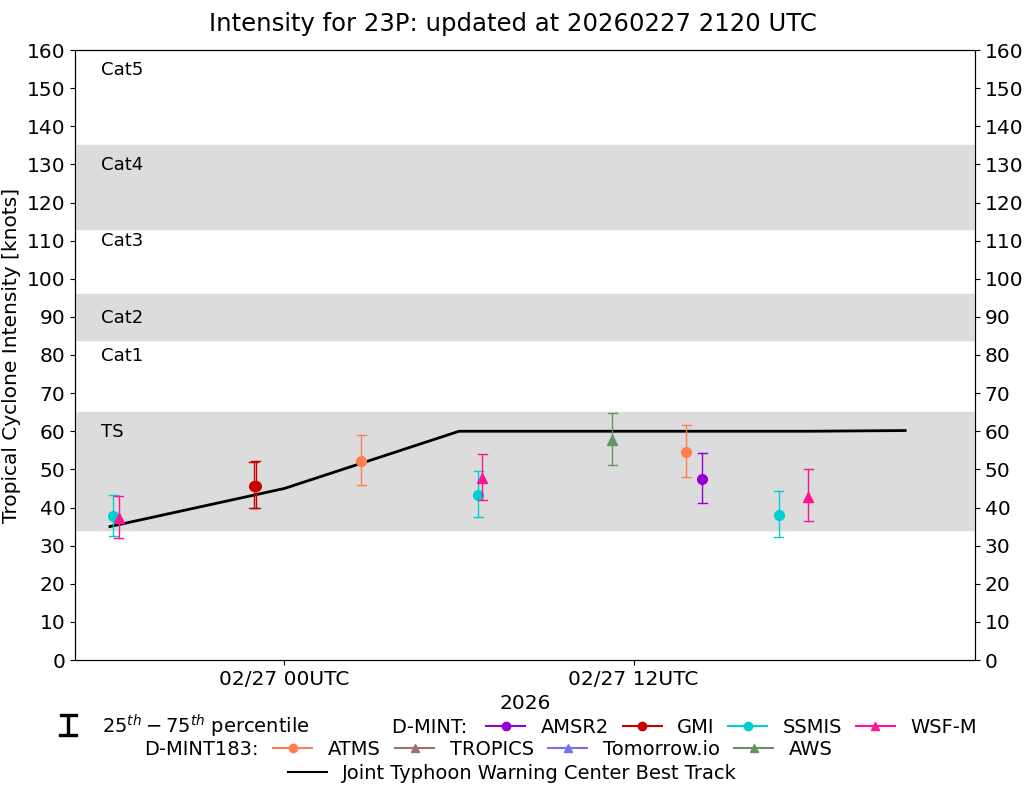 |
D-MINT HISTORY FILE for 2026_23P
| Date | Time | MW Sensor | MSLP | Vmax (30th-70th percentile average) | Vmax 25th percentile | Vmax 75th percentile | Image |
| 20260301 | 1102 UTC | GMI | 993 hPa | 38 kts | 34 kts | 43 kts |  |
| 20260301 | 0609 UTC | SSMISF17 | 981 hPa | 58 kts | 52 kts | 63 kts |  |
| 20260301 | 0159 UTC | ATMS-N20 | 984 hPa | 62 kts | 56 kts | 67 kts |  |
| 20260228 | 2232 UTC | TMS09 | 985 hPa | 50 kts | 45 kts | 56 kts |  |
| 20260228 | 2207 UTC | AWS | 985 hPa | 52 kts | 47 kts | 57 kts |  |
| 20260228 | 1740 UTC | WSFM01 | 985 hPa | 54 kts | 47 kts | 62 kts |  |
| 20260228 | 1739 UTC | SSMISF17 | 990 hPa | 48 kts | 42 kts | 55 kts |  |
| 20260228 | 1646 UTC | SSMISF18 | 990 hPa | 45 kts | 39 kts | 52 kts |  |
| 20260228 | 1407 UTC | TMS09 | 983 hPa | 52 kts | 46 kts | 58 kts |  |
| 20260228 | 1331 UTC | ATMS-N20 | 991 hPa | 49 kts | 43 kts | 55 kts |  |
| 20260228 | 1327 UTC | AMSR2 | 987 hPa | 49 kts | 43 kts | 56 kts |  |
| 20260228 | 1142 UTC | GMI | 997 hPa | 34 kts | 29 kts | 39 kts |  |
| 20260228 | 0628 UTC | WSFM01 | 990 hPa | 47 kts | 42 kts | 54 kts | 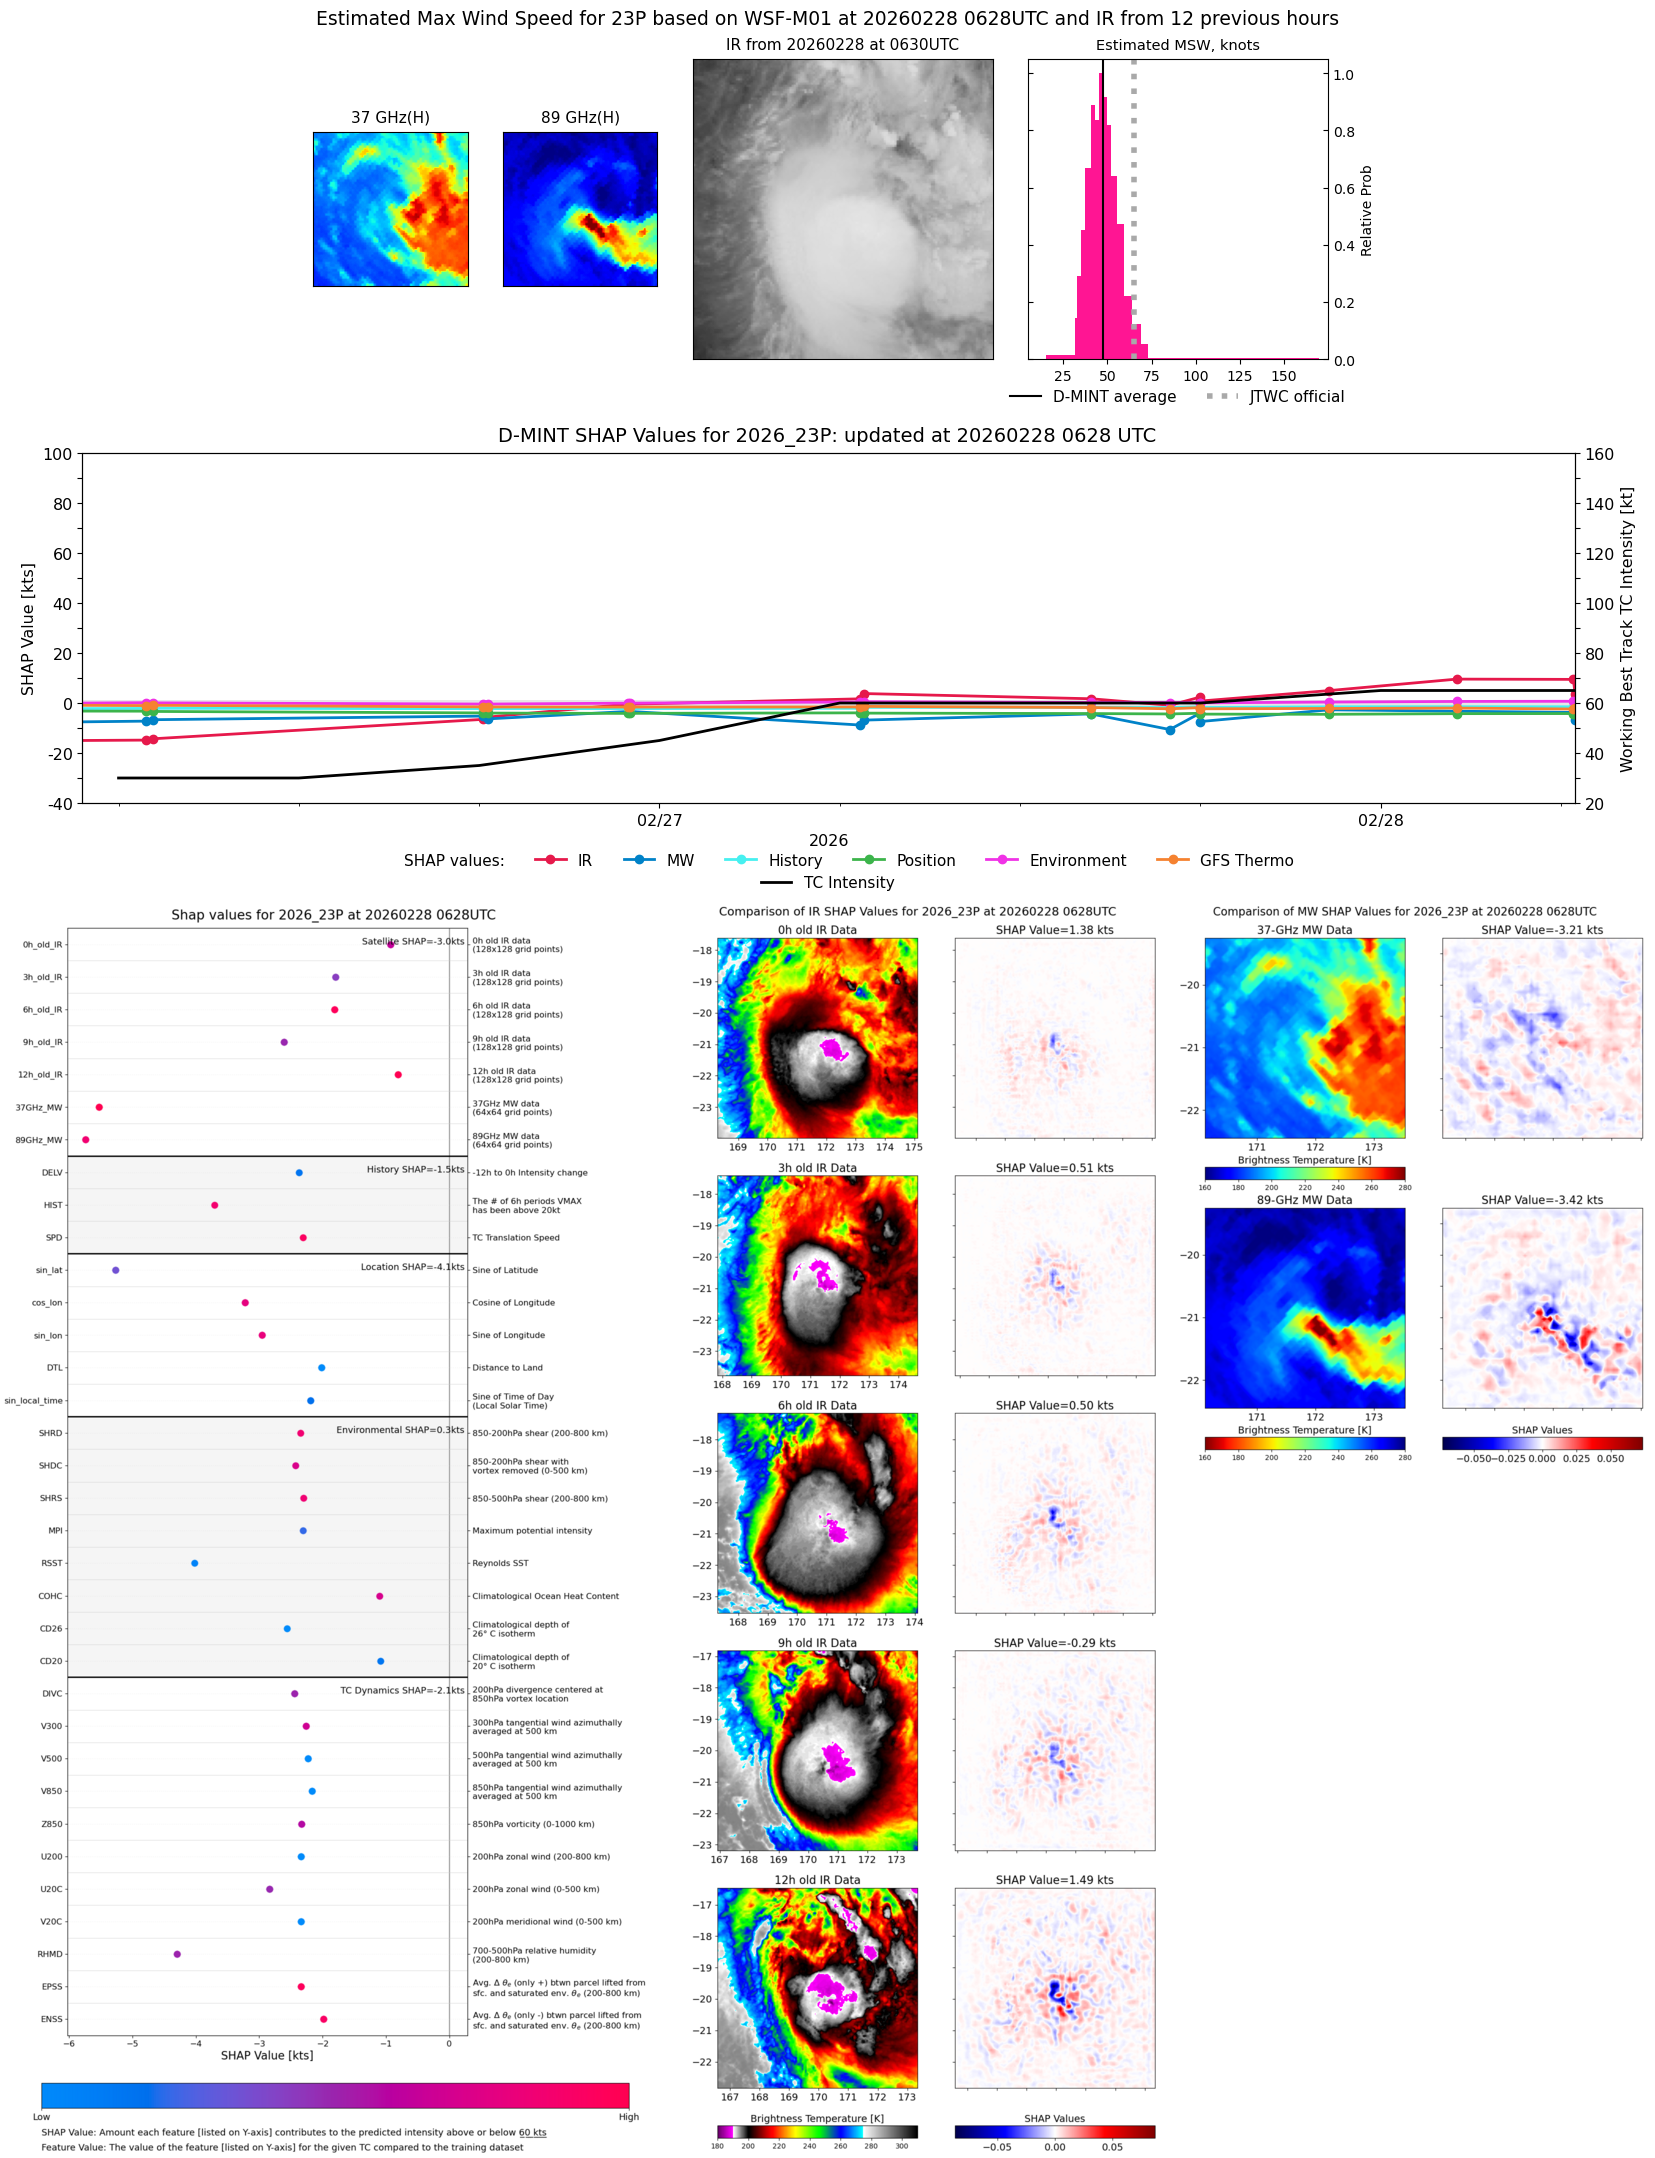 |
| 20260228 | 0625 UTC | SSMISF17 | 988 hPa | 56 kts | 50 kts | 64 kts |  |
| 20260228 | 0232 UTC | AMSR2 | 987 hPa | 57 kts | 50 kts | 64 kts |  |
| 20260228 | 0219 UTC | ATMS-N20 | 980 hPa | 54 kts | 48 kts | 61 kts |  |
| 20260227 | 2217 UTC | GMI | 983 hPa | 52 kts | 46 kts | 59 kts |  |
| 20260227 | 1800 UTC | WSFM01 | 986 hPa | 43 kts | 36 kts | 50 kts |  |
| 20260227 | 1759 UTC | WSFM01 | 987 hPa | 49 kts | 43 kts | 55 kts |  |
| 20260227 | 1659 UTC | SSMISF18 | 989 hPa | 38 kts | 32 kts | 44 kts |  |
| 20260227 | 1425 UTC | TMS09 | 986 hPa | 52 kts | 46 kts | 59 kts |  |
| 20260227 | 1422 UTC | AMSR2 | 989 hPa | 48 kts | 41 kts | 54 kts |  |
| 20260227 | 1349 UTC | ATMS-N20 | 985 hPa | 55 kts | 48 kts | 62 kts |  |
| 20260227 | 1132 UTC | TMS02 | 985 hPa | 57 kts | 51 kts | 65 kts |  |
| 20260227 | 1116 UTC | AWS | 983 hPa | 58 kts | 51 kts | 65 kts |  |
| 20260227 | 0648 UTC | WSFM01 | 988 hPa | 48 kts | 42 kts | 54 kts |  |
| 20260227 | 0640 UTC | SSMISF17 | 989 hPa | 43 kts | 38 kts | 50 kts |  |
| 20260227 | 0238 UTC | ATMS-N20 | 986 hPa | 52 kts | 46 kts | 59 kts |  |
| 20260226 | 2301 UTC | GMI | 988 hPa | 46 kts | 40 kts | 52 kts |  |
| 20260226 | 2257 UTC | GMI | 989 hPa | 46 kts | 40 kts | 52 kts |  |
| 20260226 | 1818 UTC | WSFM01 | 993 hPa | 37 kts | 32 kts | 43 kts |  |
| 20260226 | 1807 UTC | SSMISF17 | 988 hPa | 38 kts | 33 kts | 43 kts |  |
| 20260226 | 1408 UTC | ATMS-N20 | 991 hPa | 43 kts | 37 kts | 49 kts |  |
| 20260226 | 1159 UTC | TMS02 | 997 hPa | 42 kts | 36 kts | 48 kts |  |
| 20260226 | 0708 UTC | WSFM01 | 998 hPa | 30 kts | 27 kts | 34 kts |  |
| 20260226 | 0654 UTC | SSMISF17 | 997 hPa | 29 kts | 26 kts | 33 kts |  |
| 20260226 | 0207 UTC | ATMS-N21 | 999 hPa | 32 kts | 28 kts | 37 kts |  |
| 20260225 | 1837 UTC | WSFM01 | 1001 hPa | 26 kts | 24 kts | 29 kts |  |
| 20260225 | 0731 UTC | SSMISF16 | NaN hPa | 22 kts | 18 kts | 26 kts |  |
| 20260225 | 0435 UTC | SSMISF18 | NaN hPa | 19 kts | 15 kts | 22 kts |  |
| 20260224 | 1855 UTC | SSMISF16 | NaN hPa | 16 kts | 14 kts | 18 kts |  |
| 20260224 | 1833 UTC | SSMISF17 | NaN hPa | 17 kts | 15 kts | 19 kts |  |