|
||

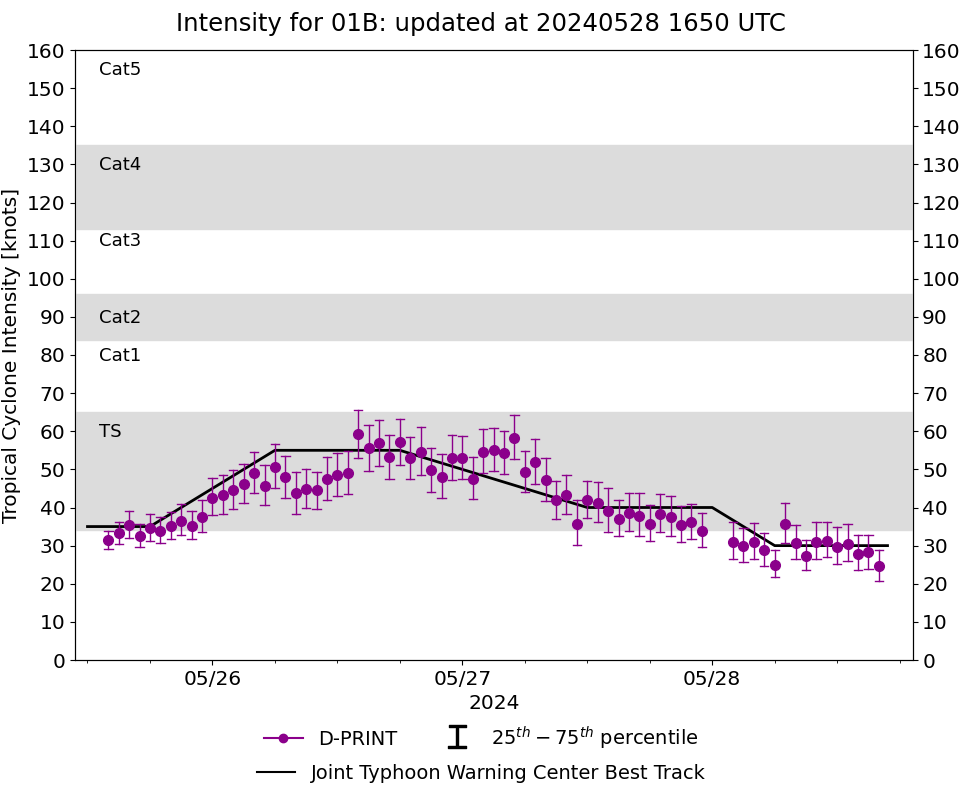 |
D-PRINT HISTORY FILE for 2024_01B
| Date | Time | MSLP | Vmax (30th-70th percentile average) | Vmax 25th percentile | Vmax 75th percentile | Image |
| 20240528 | 1600 UTC | 995 hPa | 25 kts | 21 kts | 29 kts | 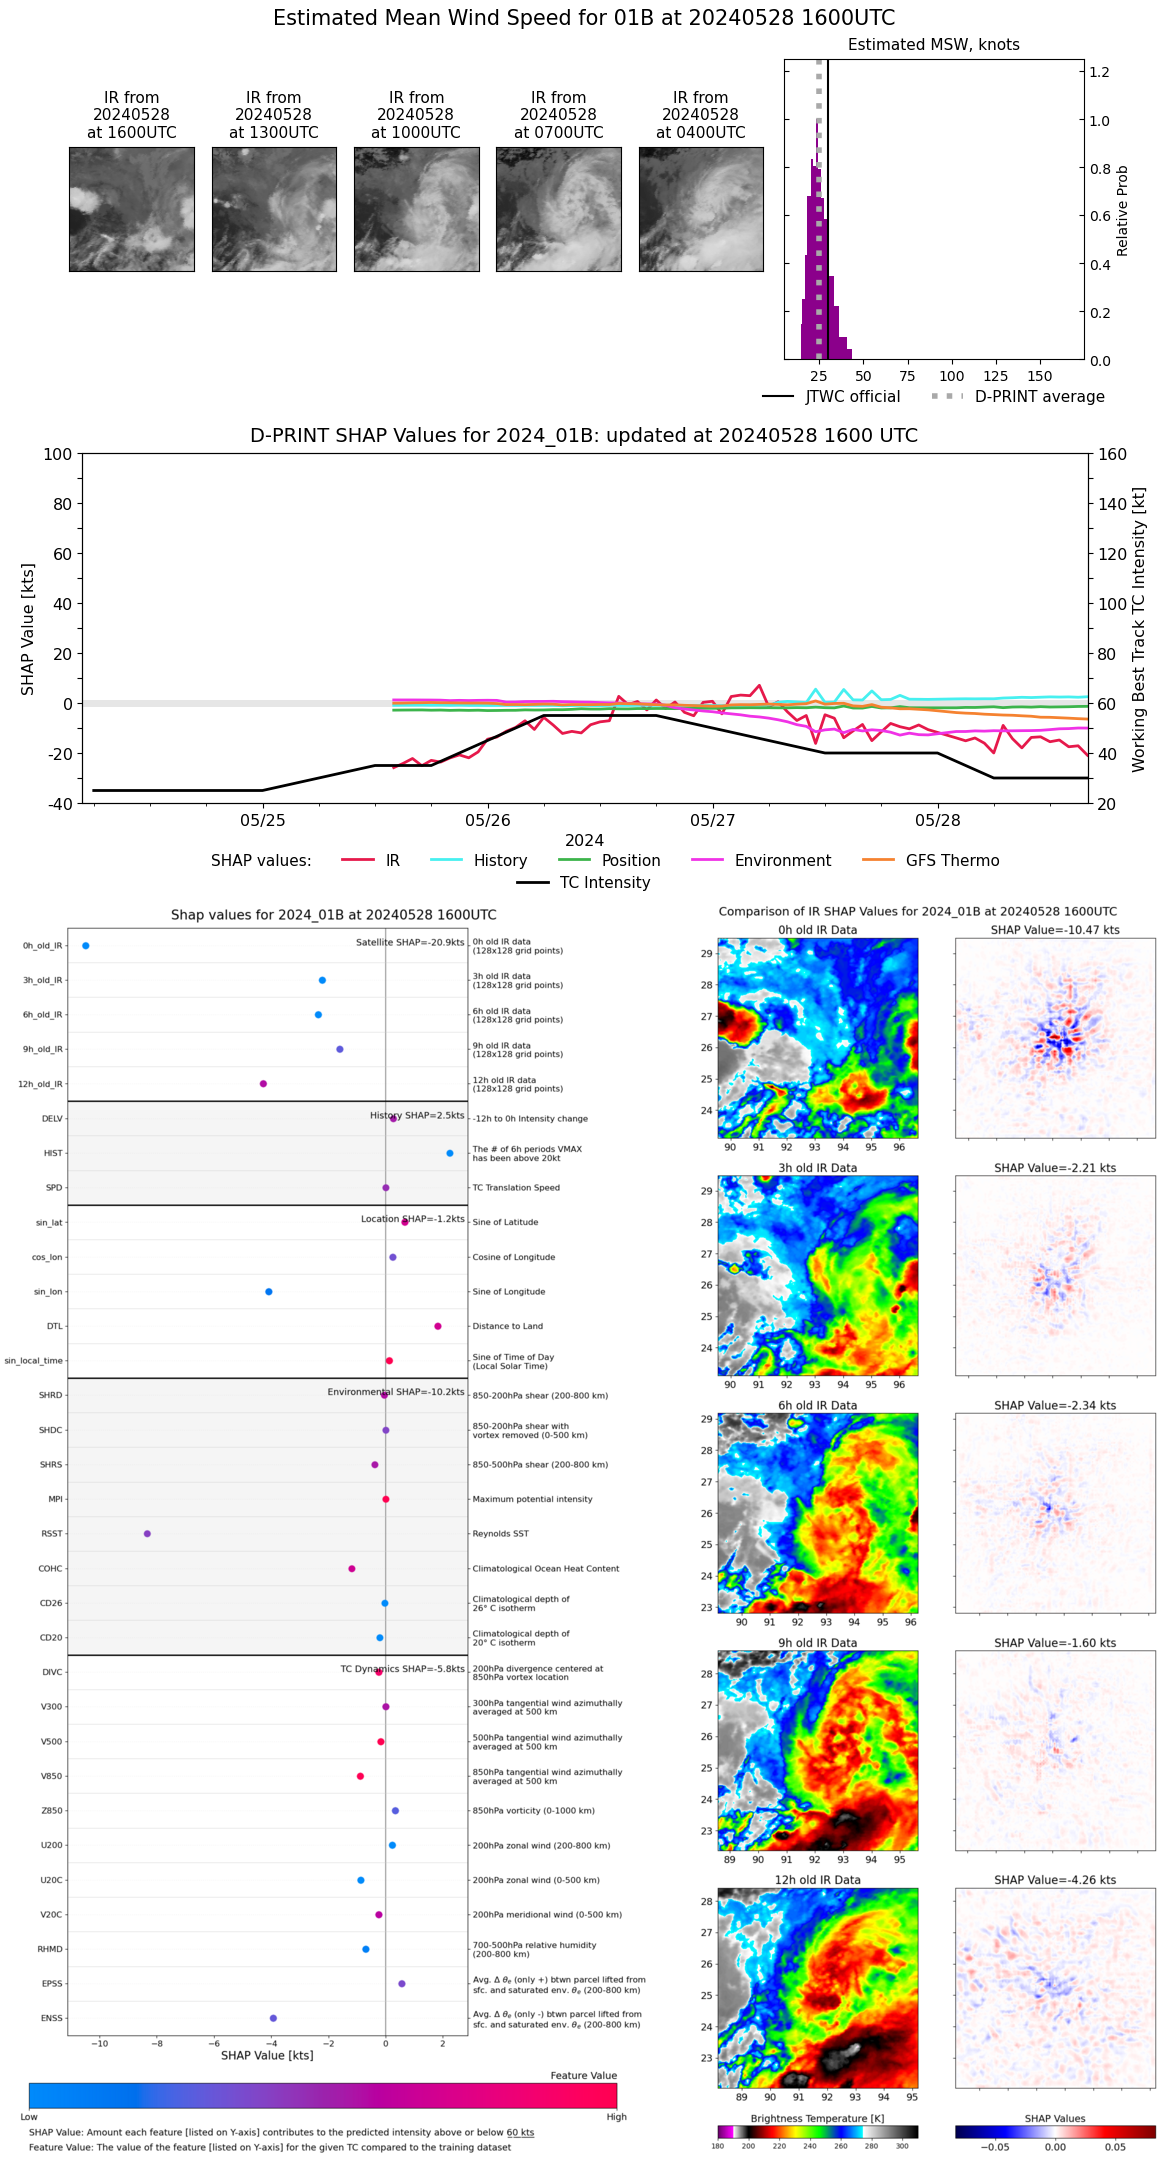 |
| 20240528 | 1500 UTC | 995 hPa | 28 kts | 24 kts | 33 kts |  |
| 20240528 | 1400 UTC | 996 hPa | 28 kts | 24 kts | 33 kts | 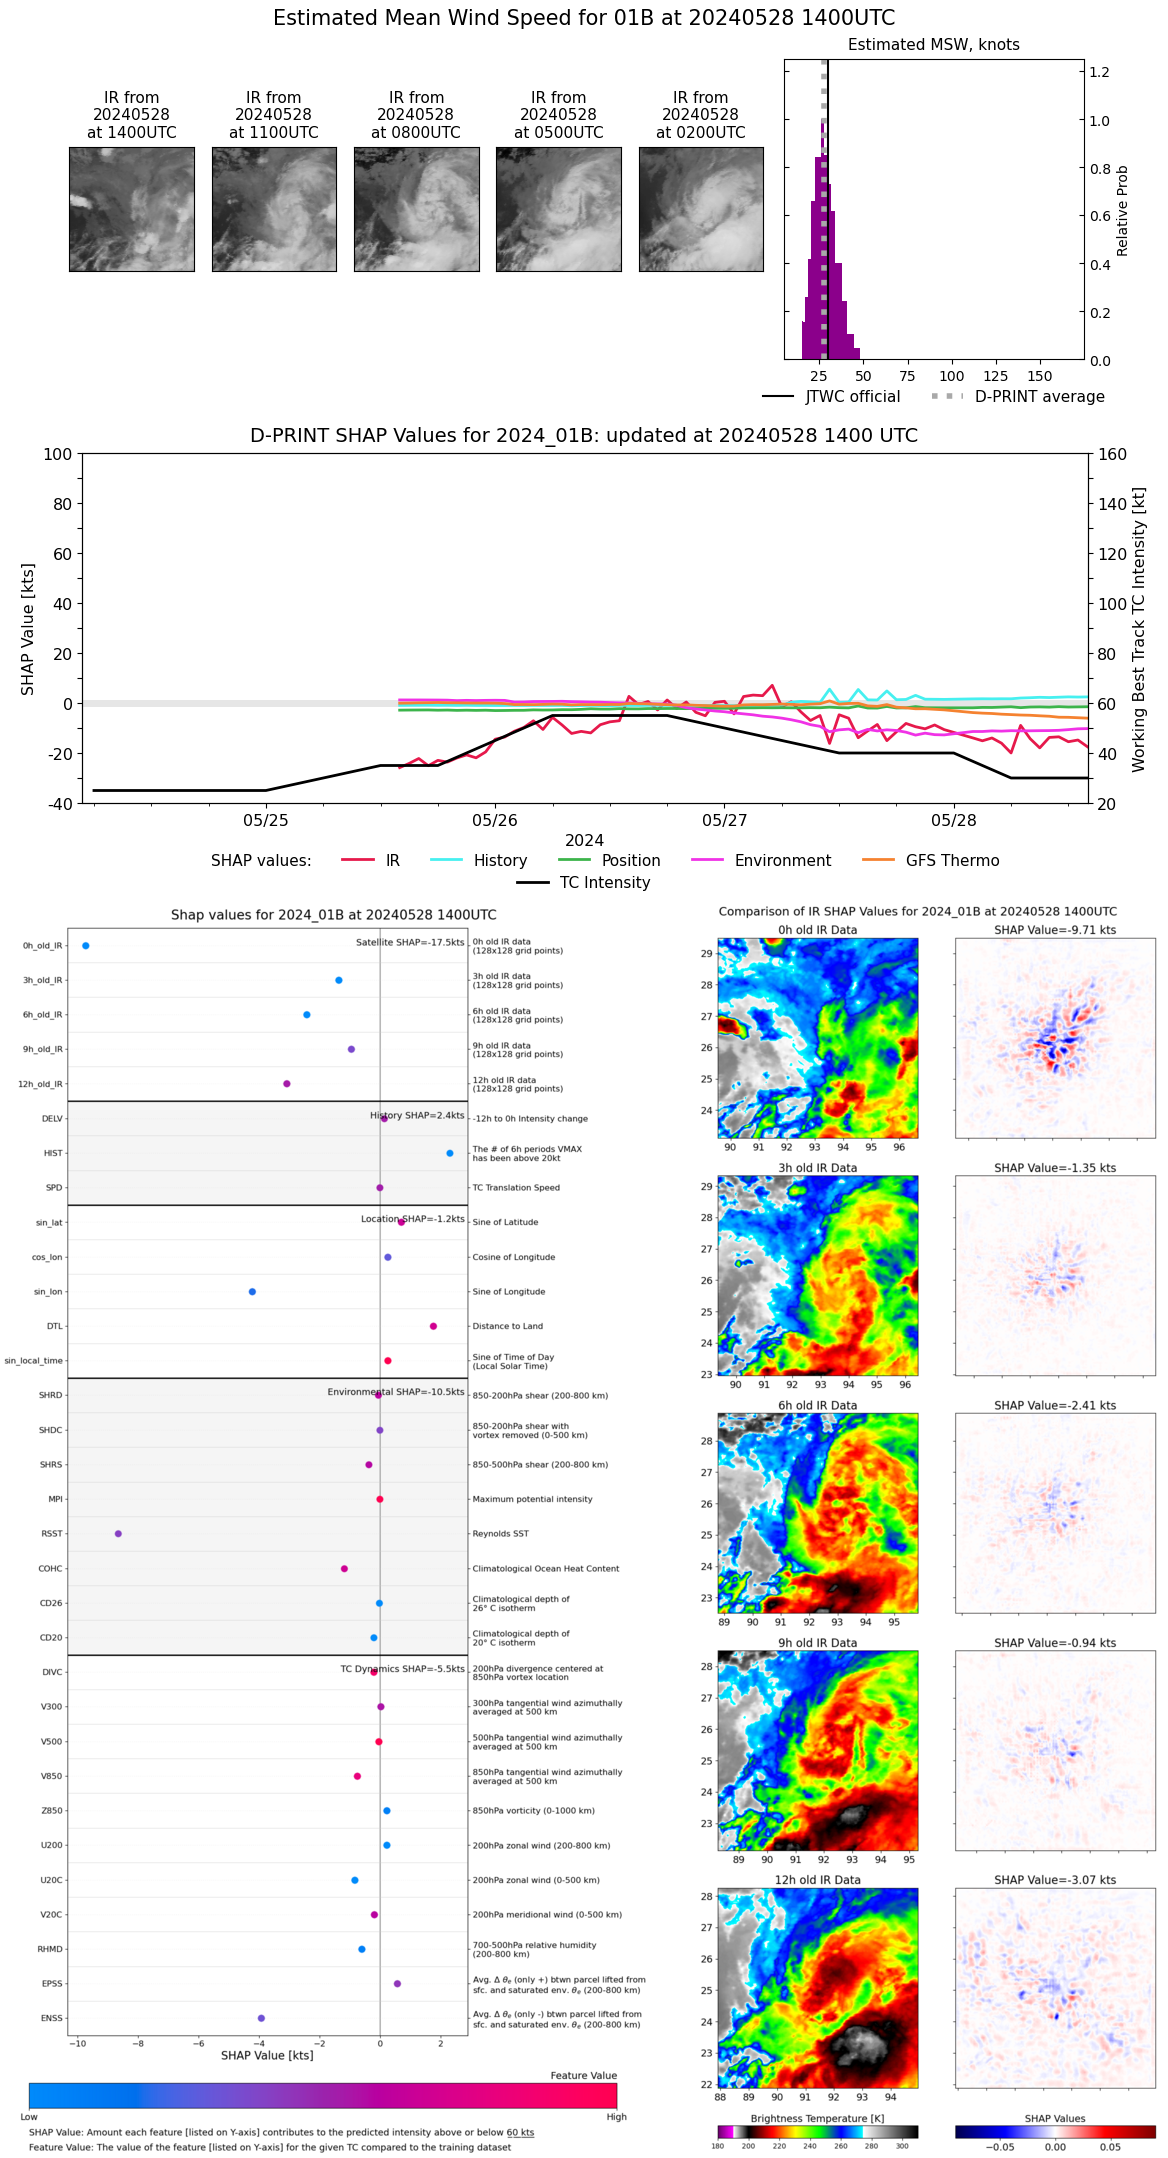 |
| 20240528 | 1300 UTC | 994 hPa | 30 kts | 26 kts | 36 kts | 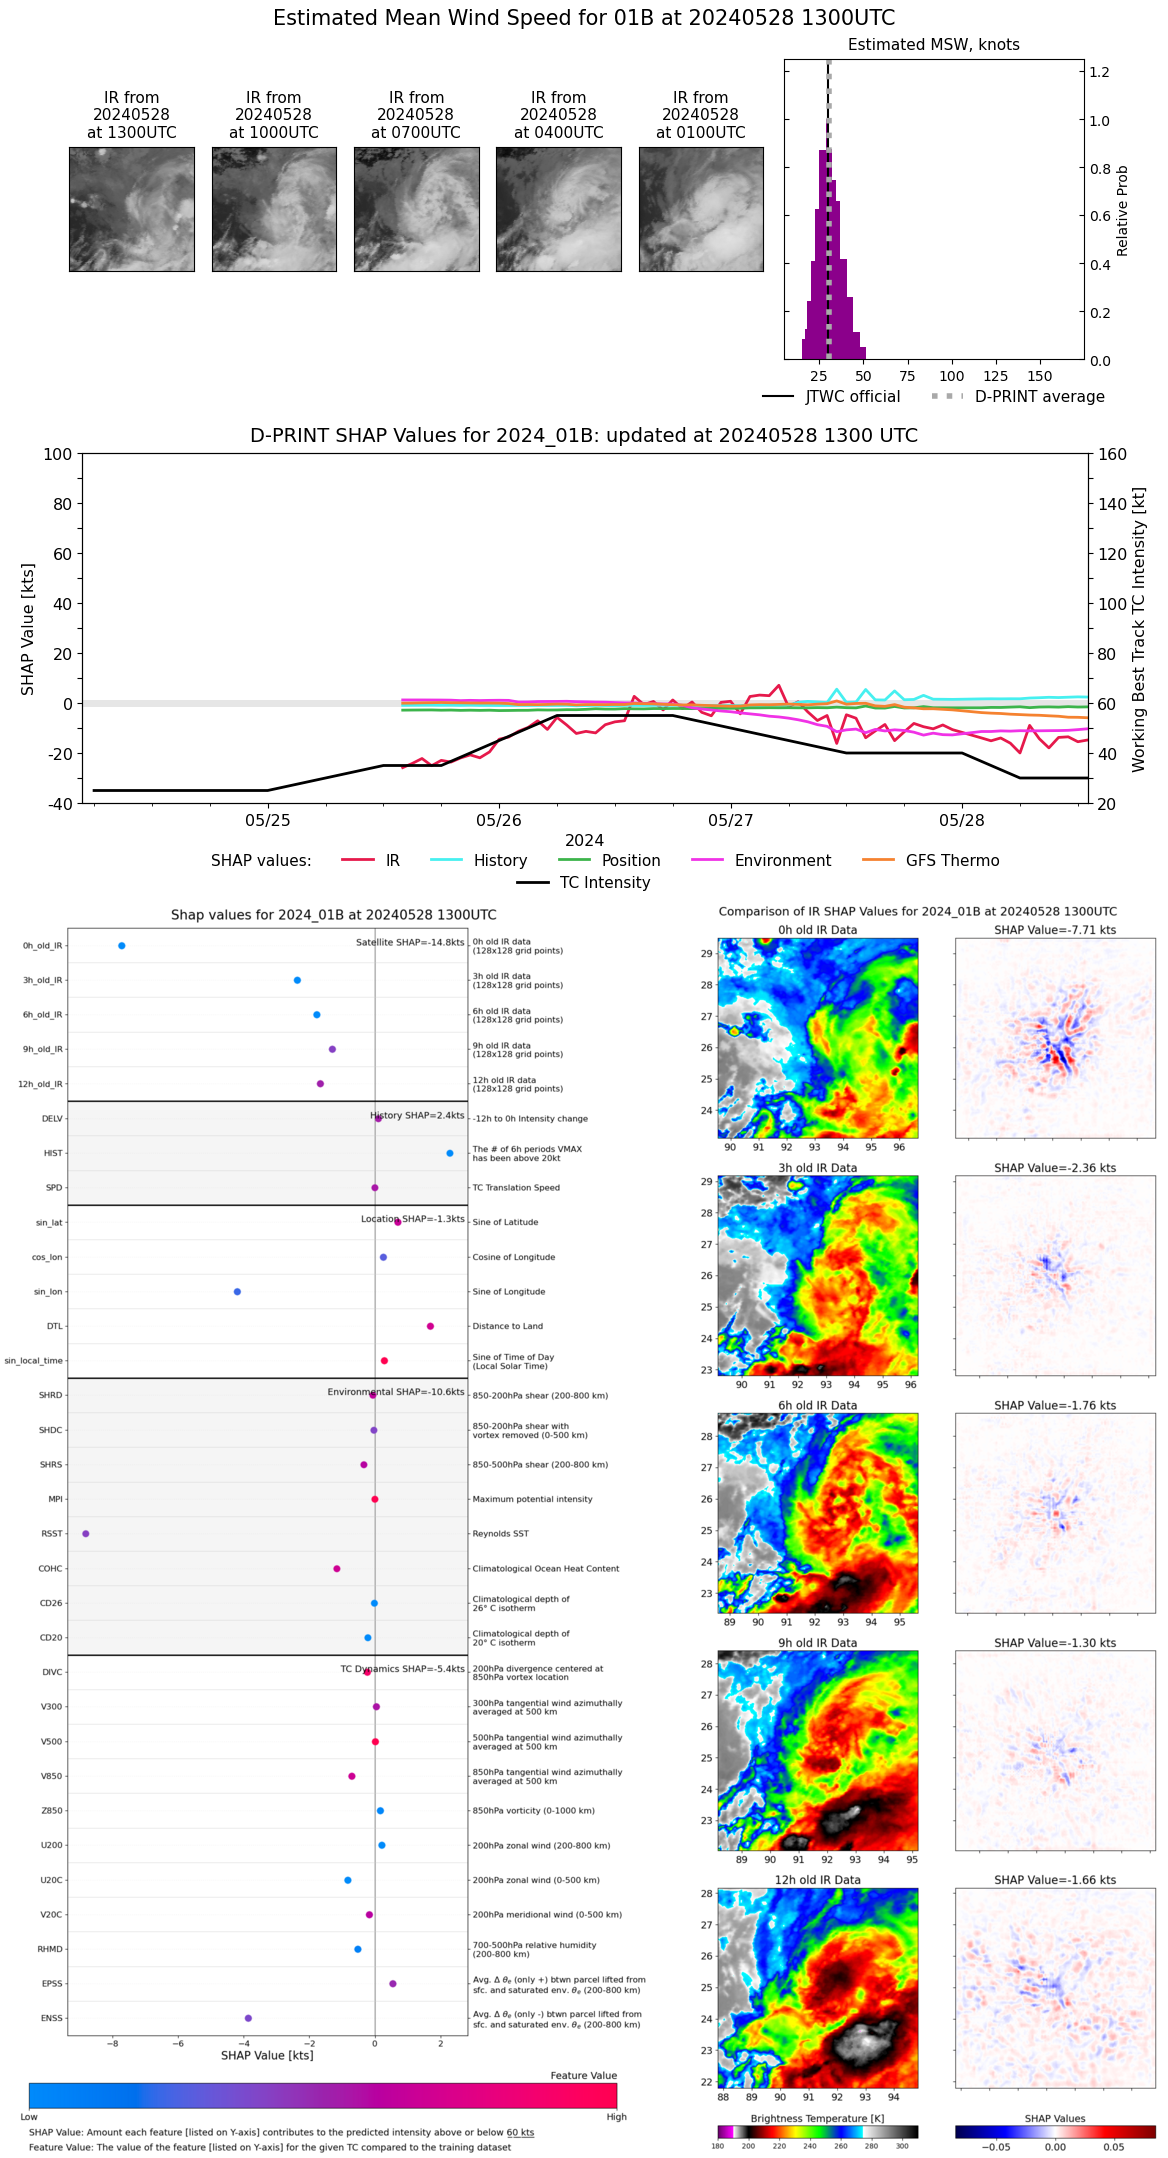 |
| 20240528 | 1200 UTC | 994 hPa | 30 kts | 25 kts | 35 kts | 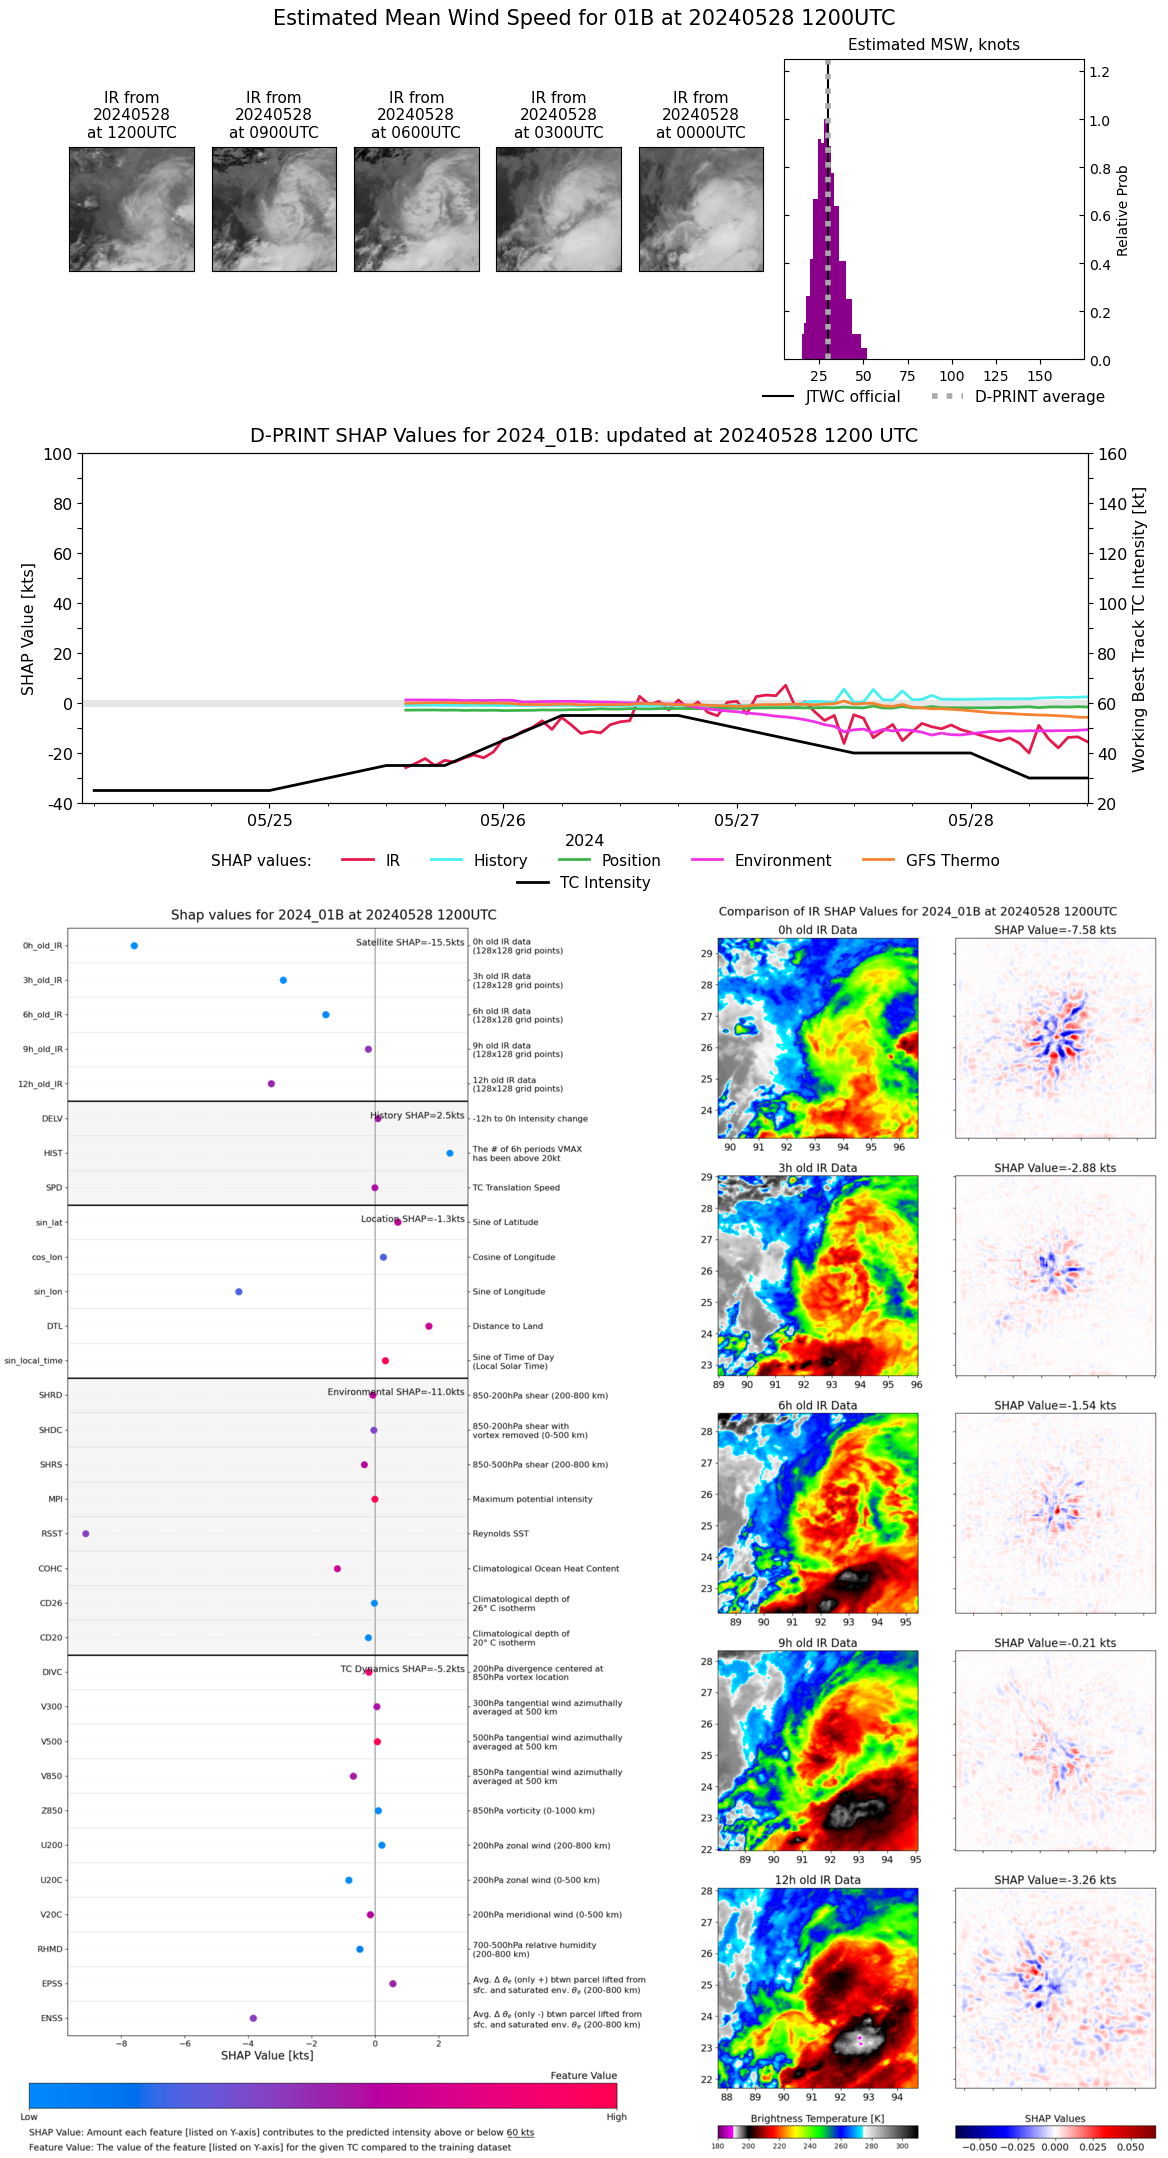 |
| 20240528 | 1100 UTC | 995 hPa | 31 kts | 27 kts | 36 kts | 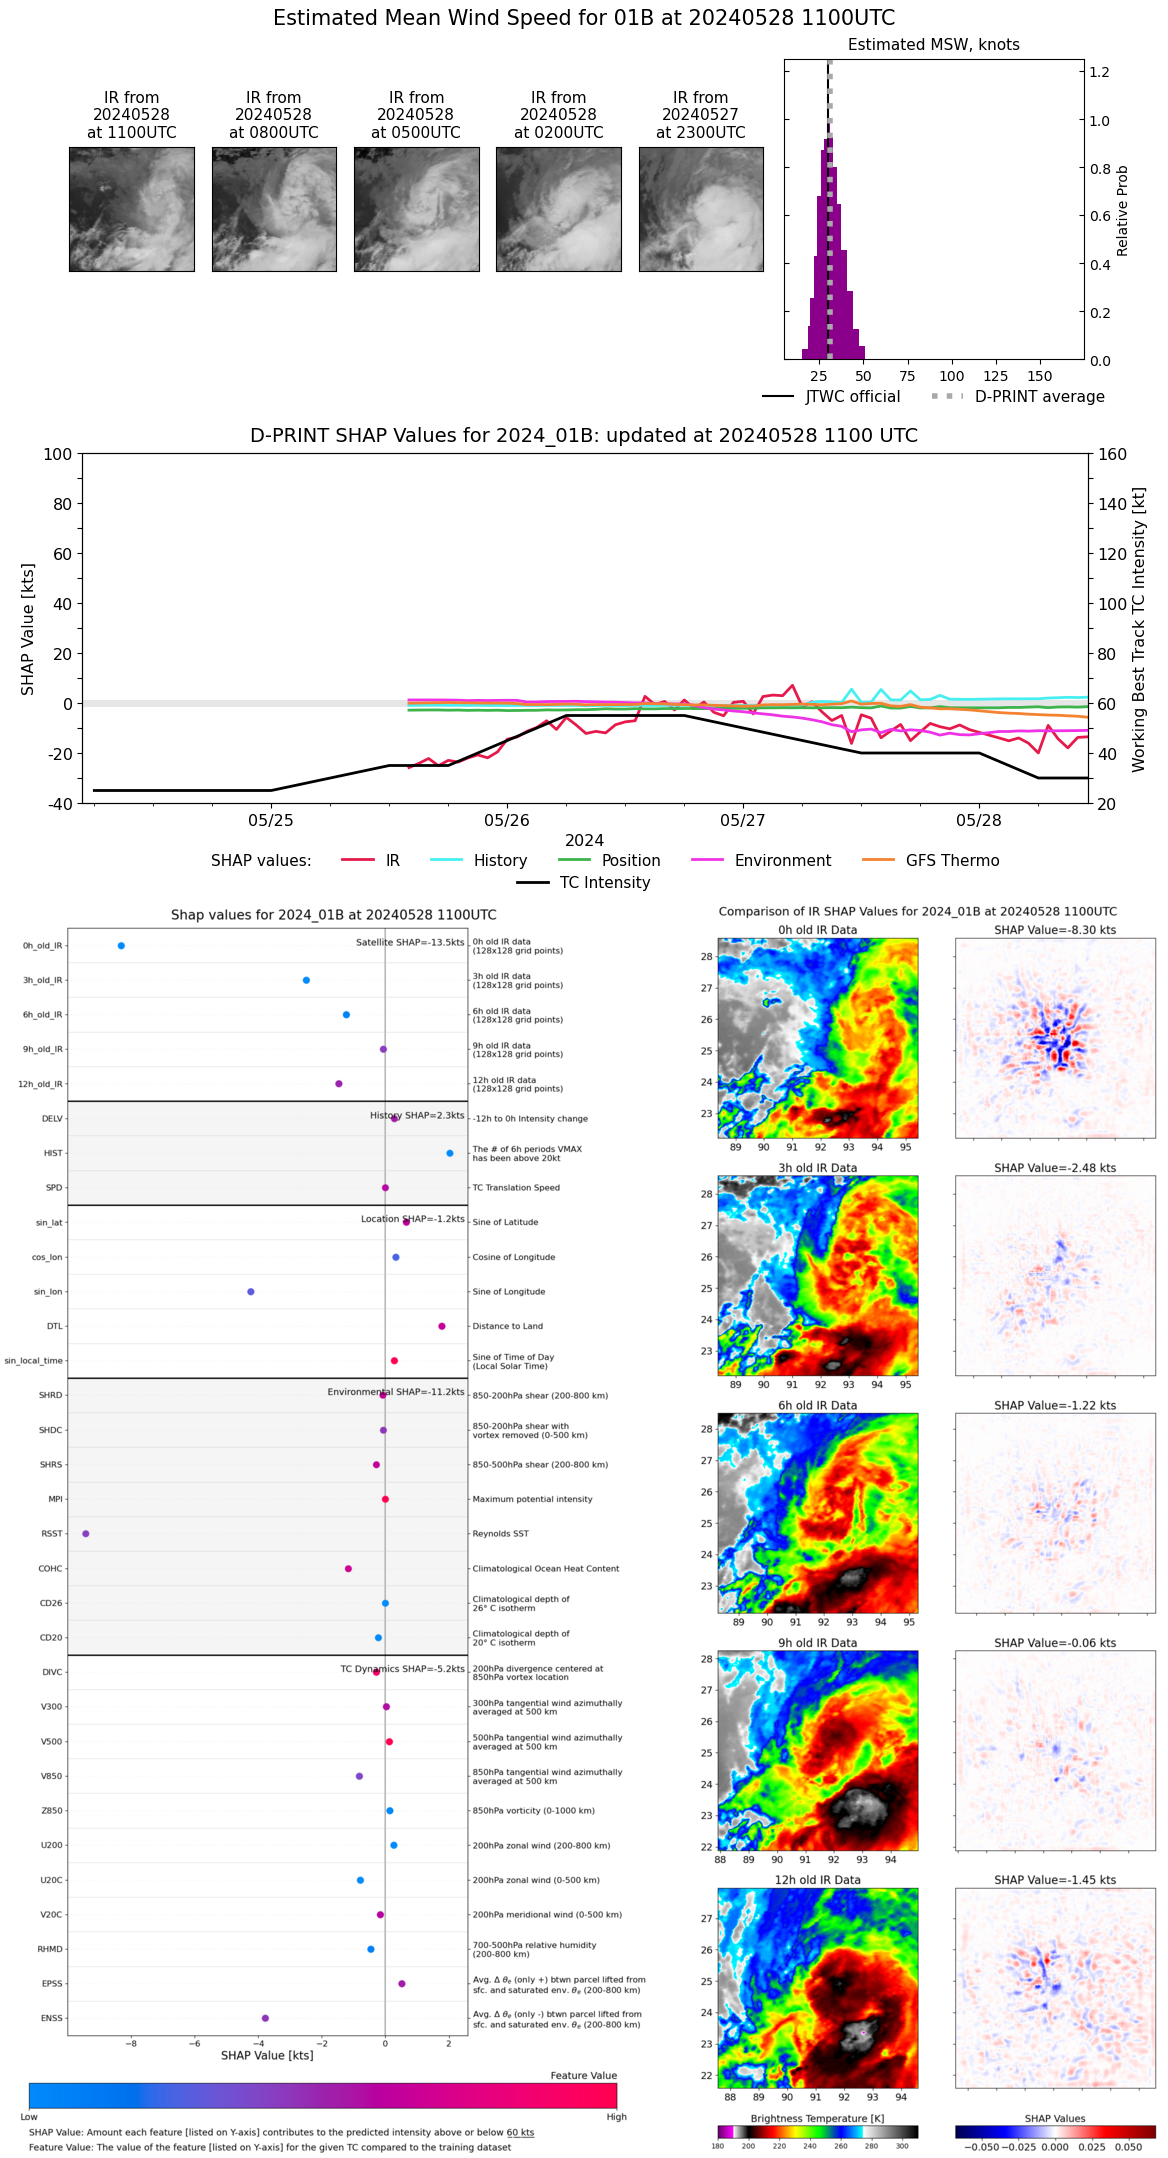 |
| 20240528 | 1000 UTC | 994 hPa | 31 kts | 26 kts | 36 kts |  |
| 20240528 | 0900 UTC | 994 hPa | 27 kts | 24 kts | 31 kts | 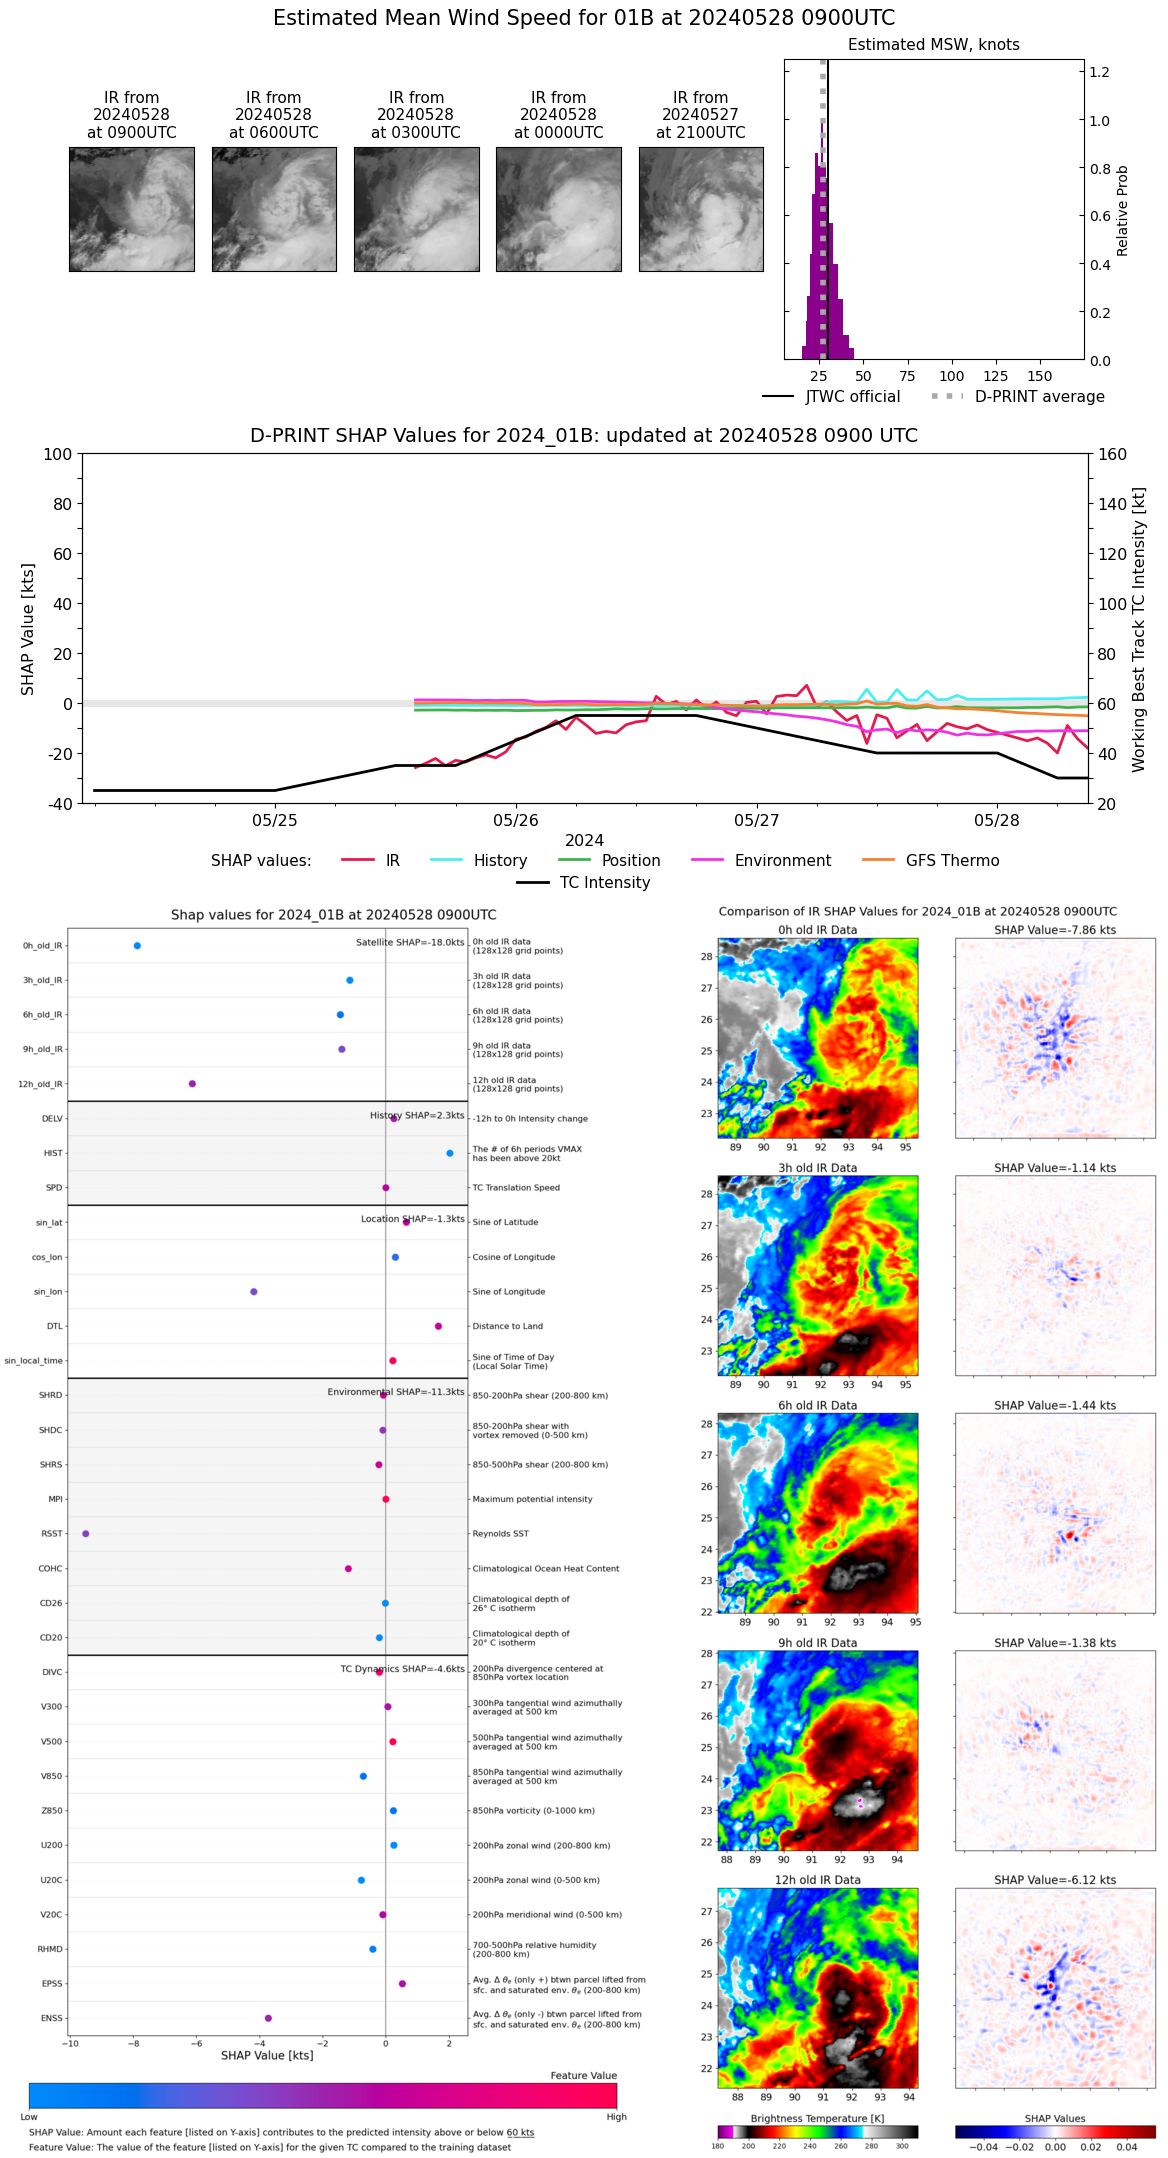 |
| 20240528 | 0800 UTC | 994 hPa | 31 kts | 26 kts | 36 kts | 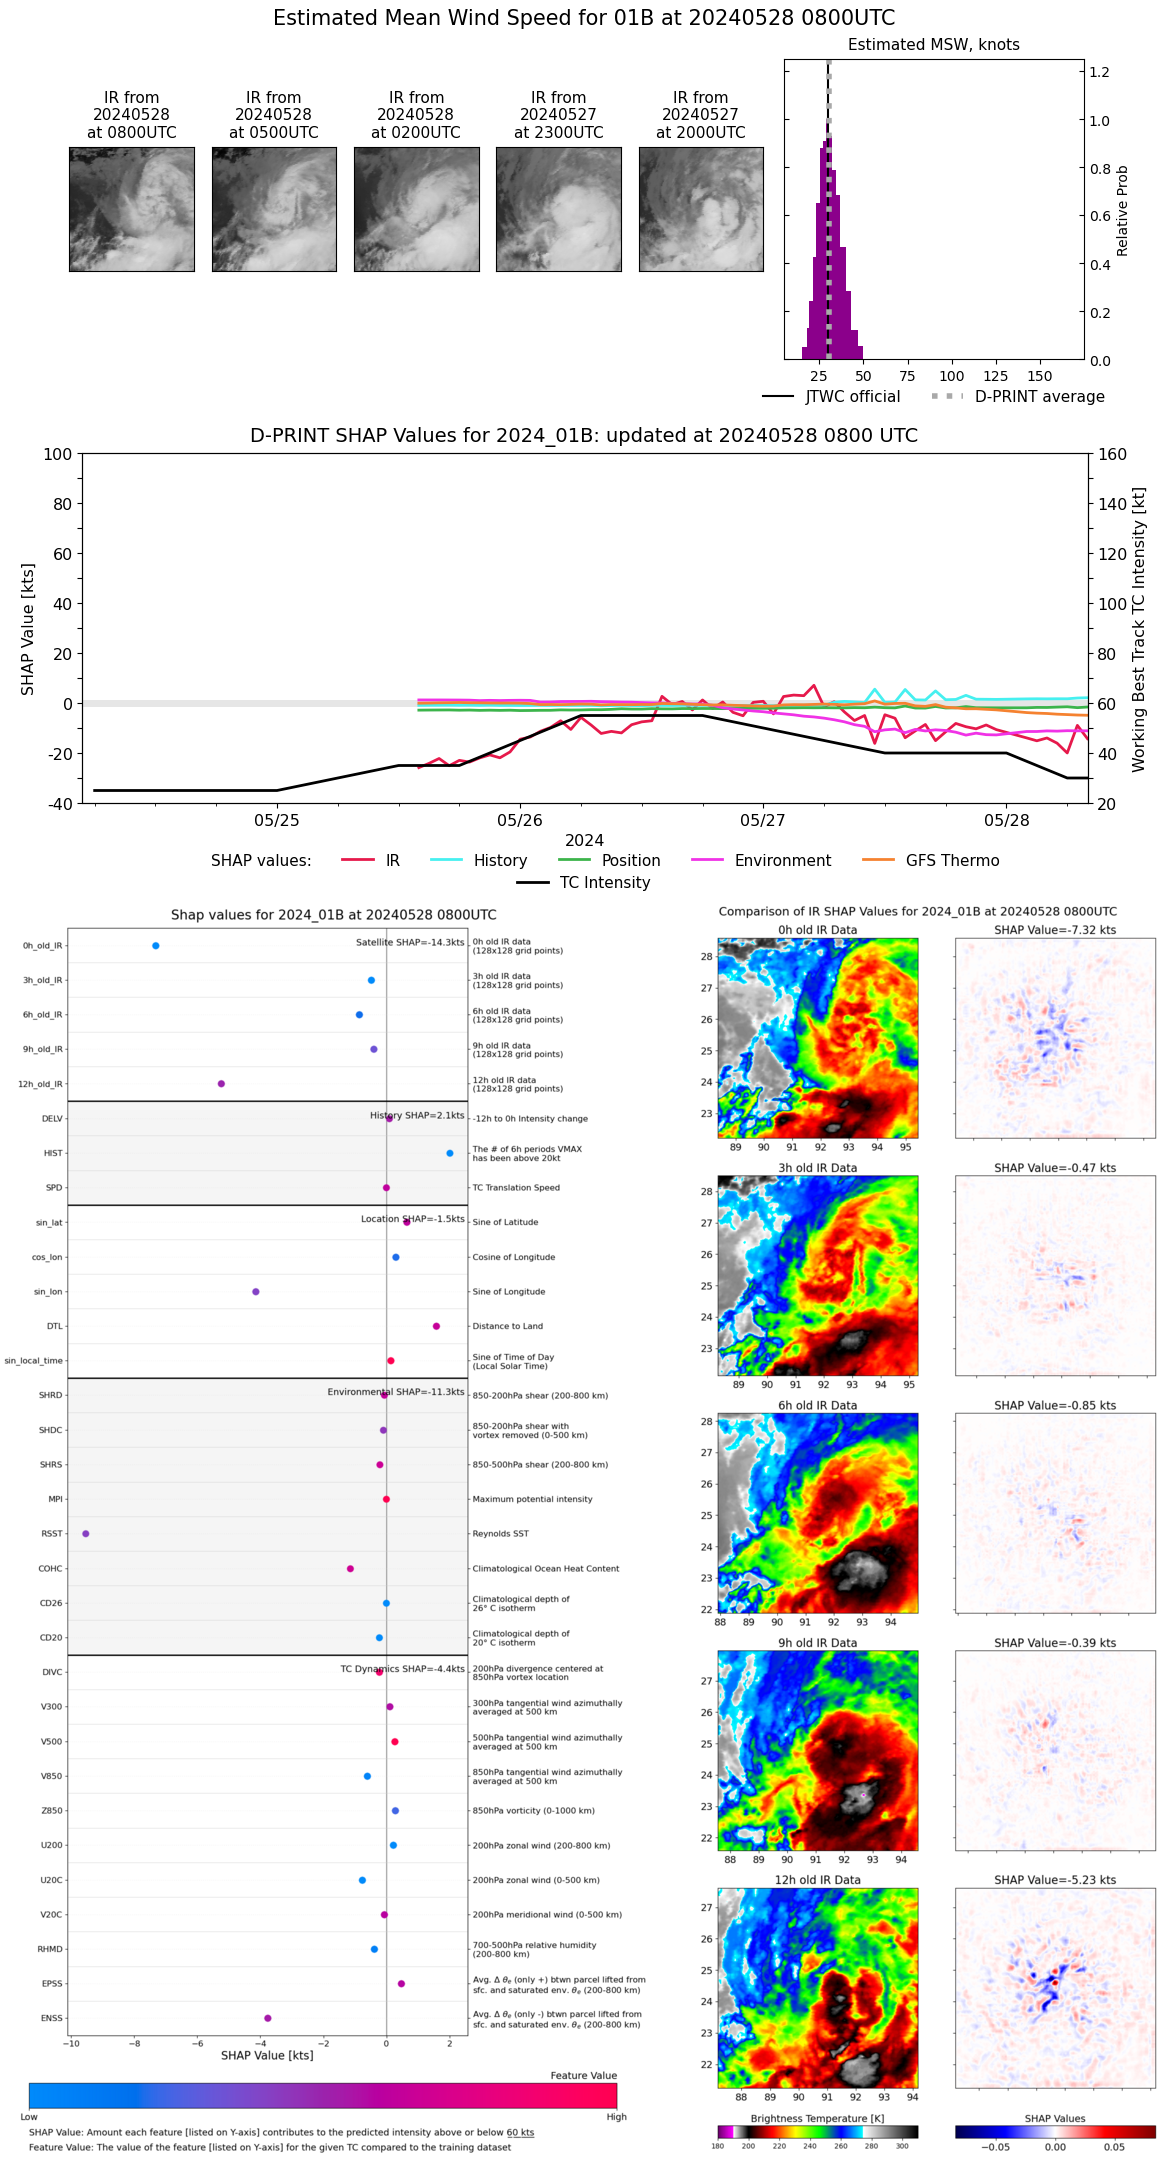 |
| 20240528 | 0700 UTC | 994 hPa | 36 kts | 31 kts | 41 kts |  |
| 20240528 | 0600 UTC | 994 hPa | 25 kts | 22 kts | 29 kts | 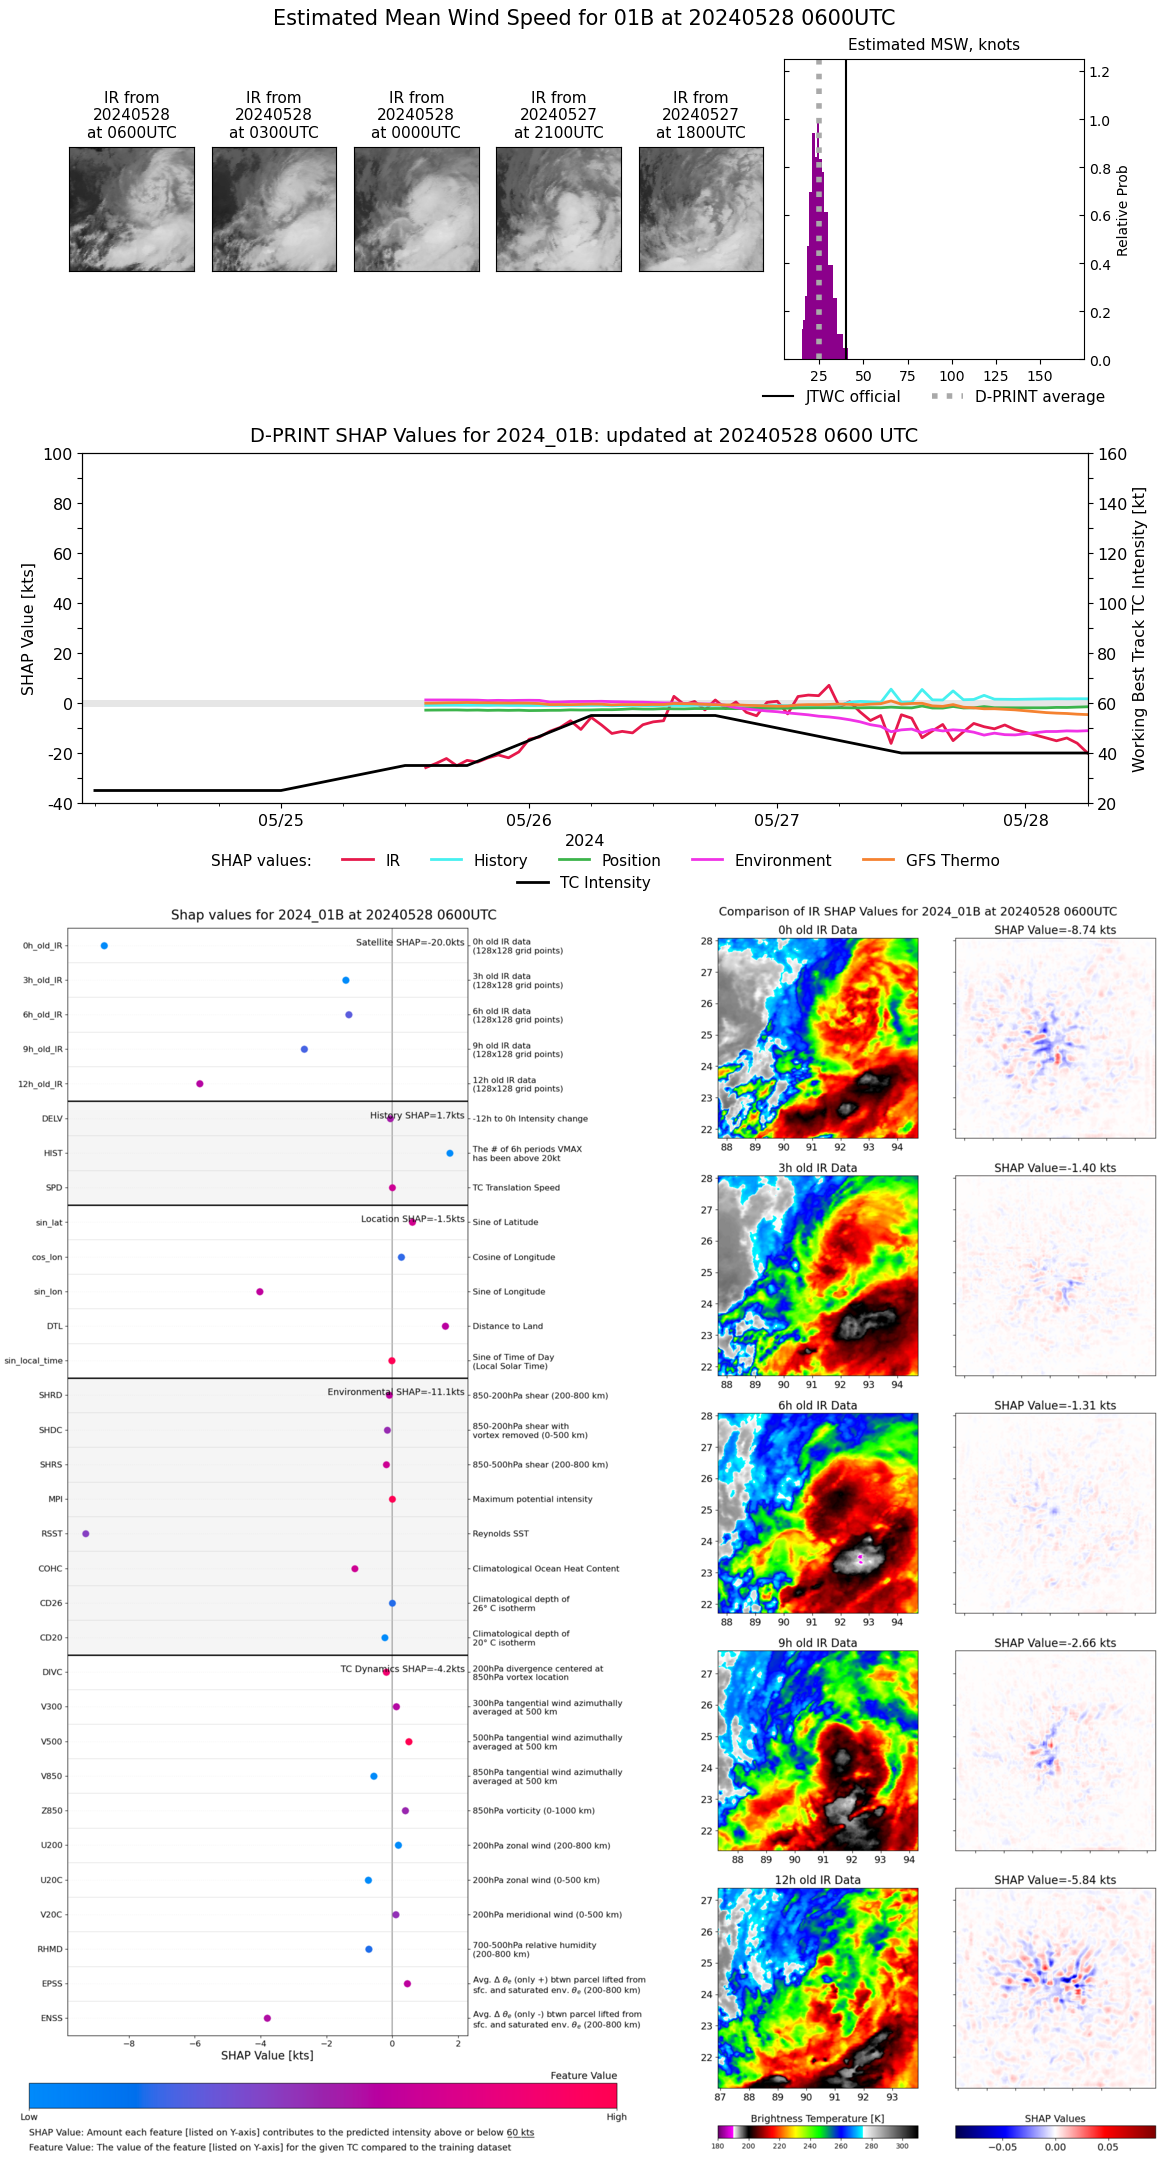 |
| 20240528 | 0500 UTC | 993 hPa | 29 kts | 25 kts | 33 kts | 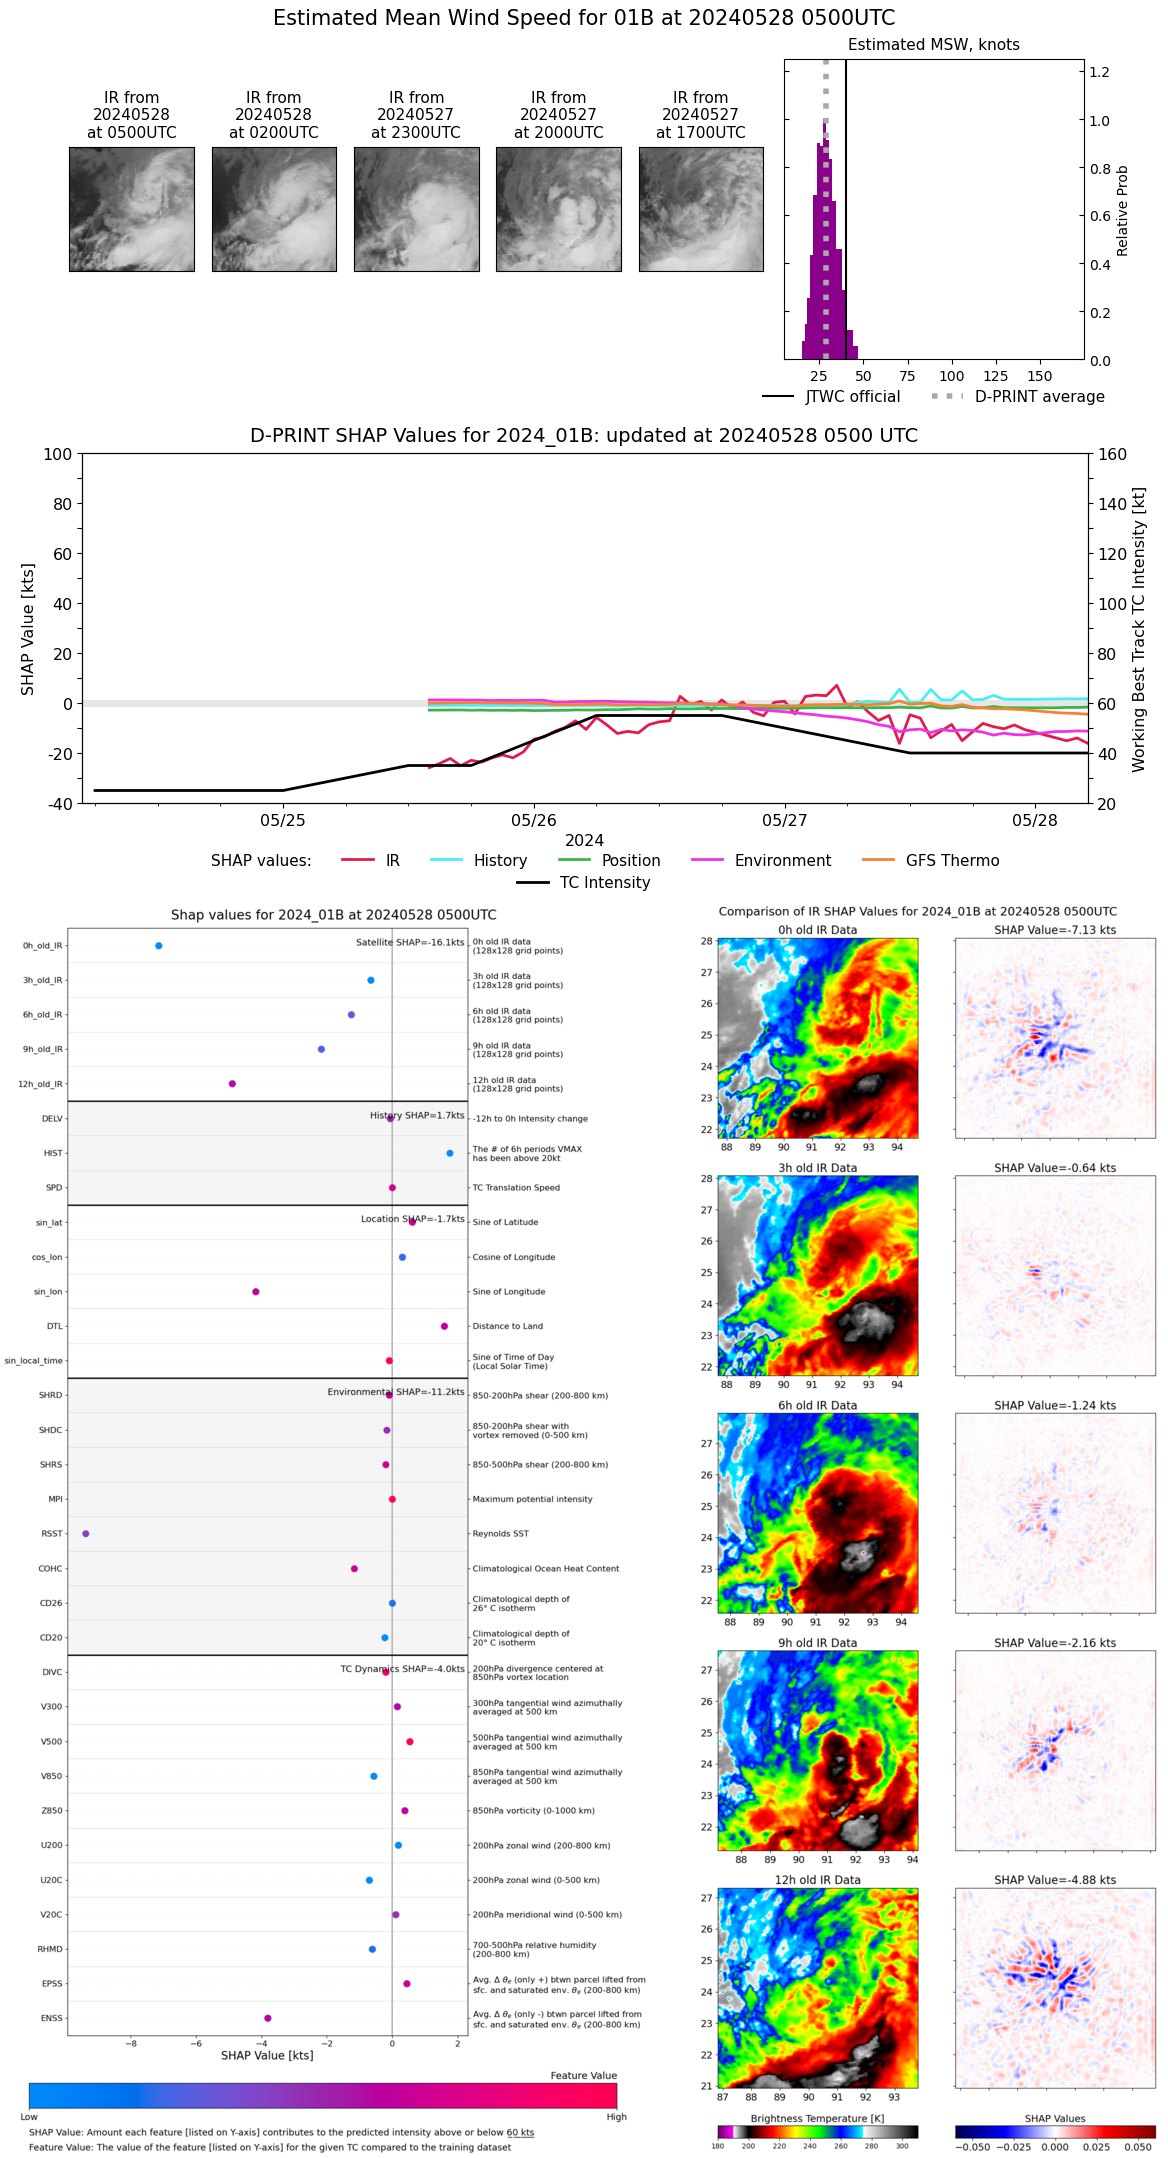 |
| 20240528 | 0400 UTC | 993 hPa | 31 kts | 27 kts | 36 kts | 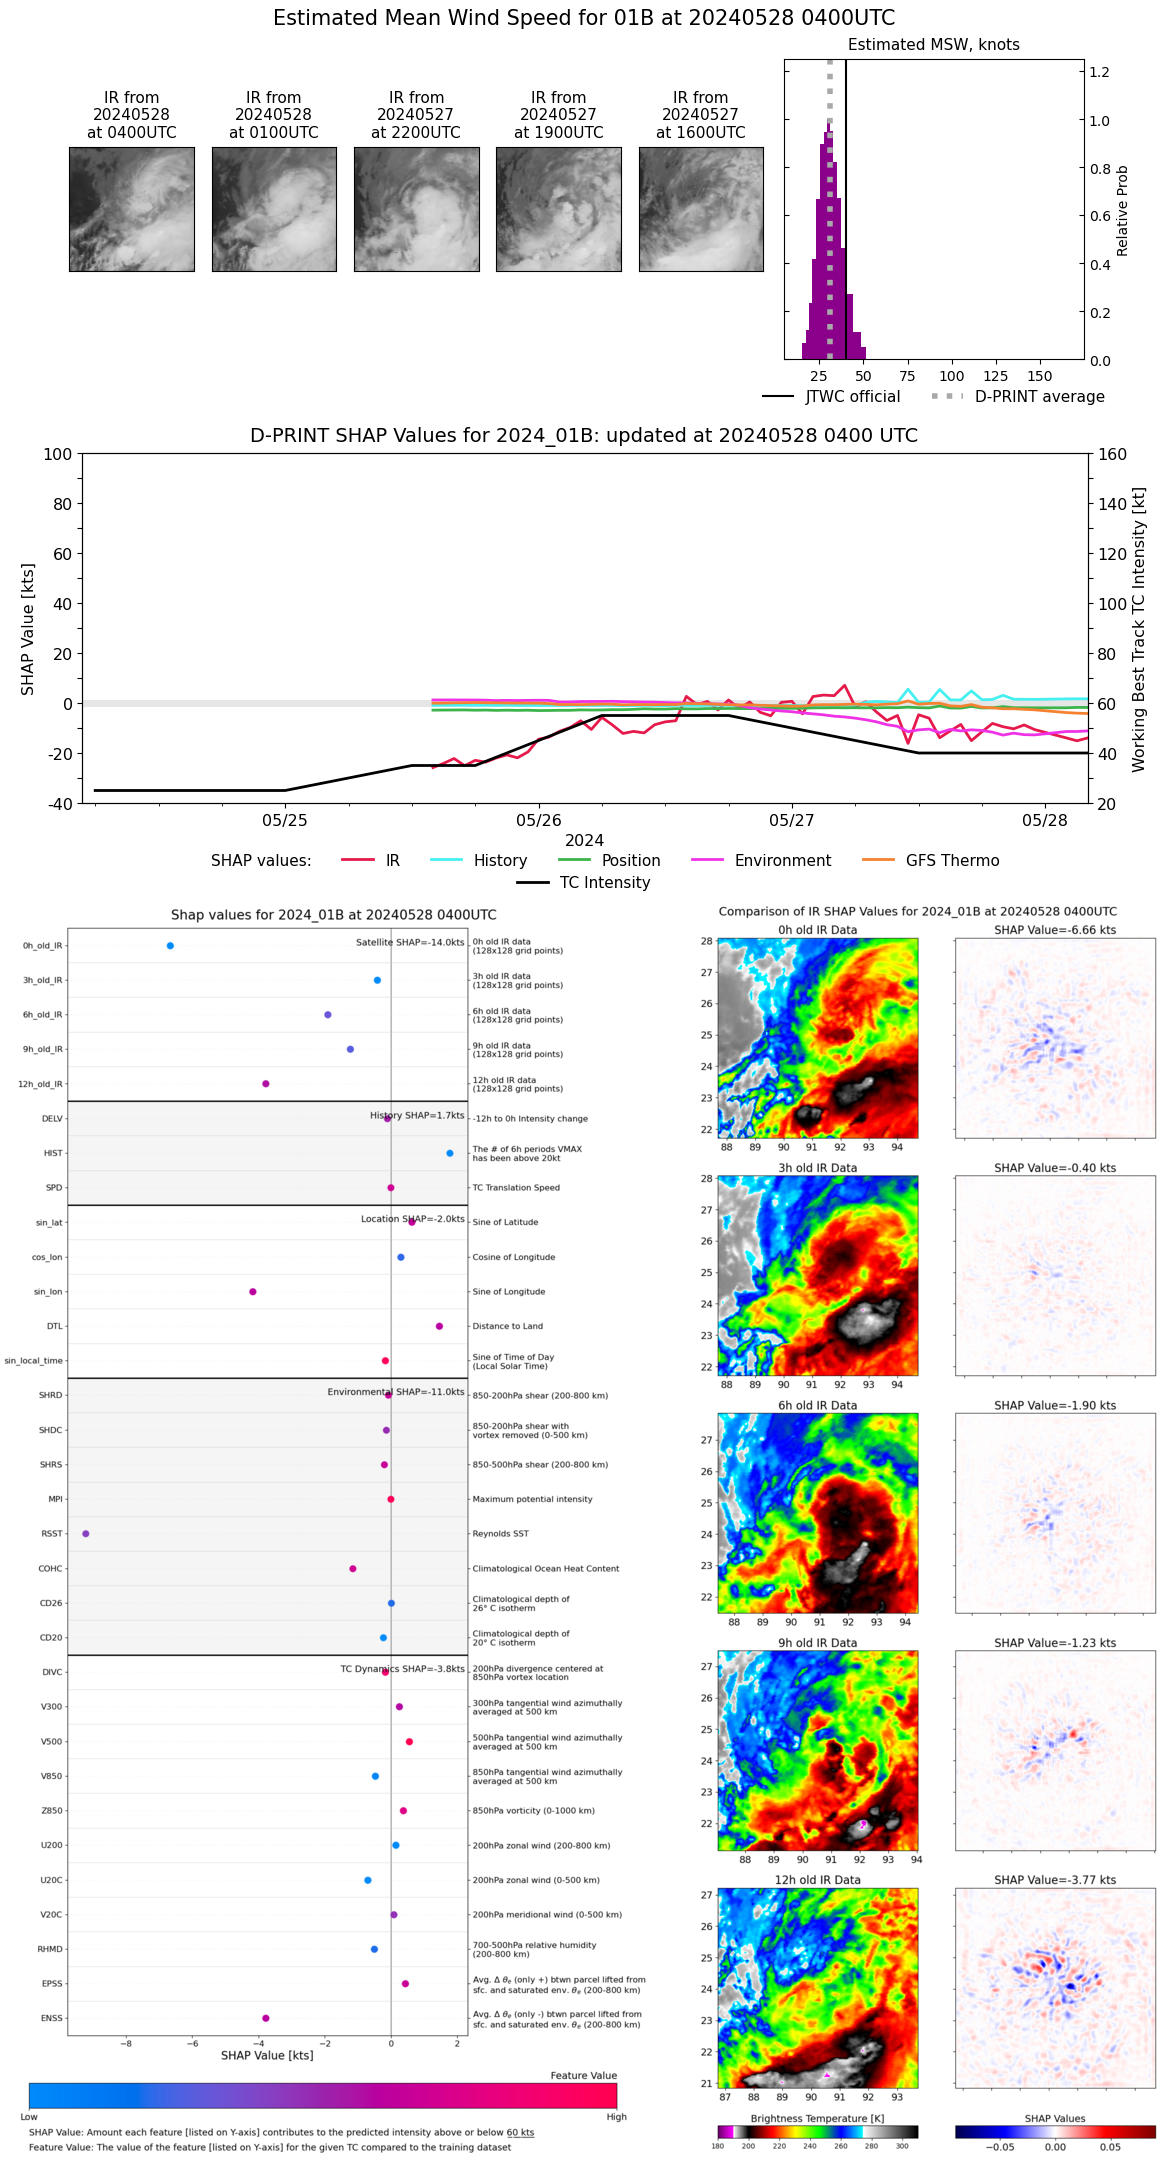 |
| 20240528 | 0300 UTC | 994 hPa | 30 kts | 26 kts | 35 kts | 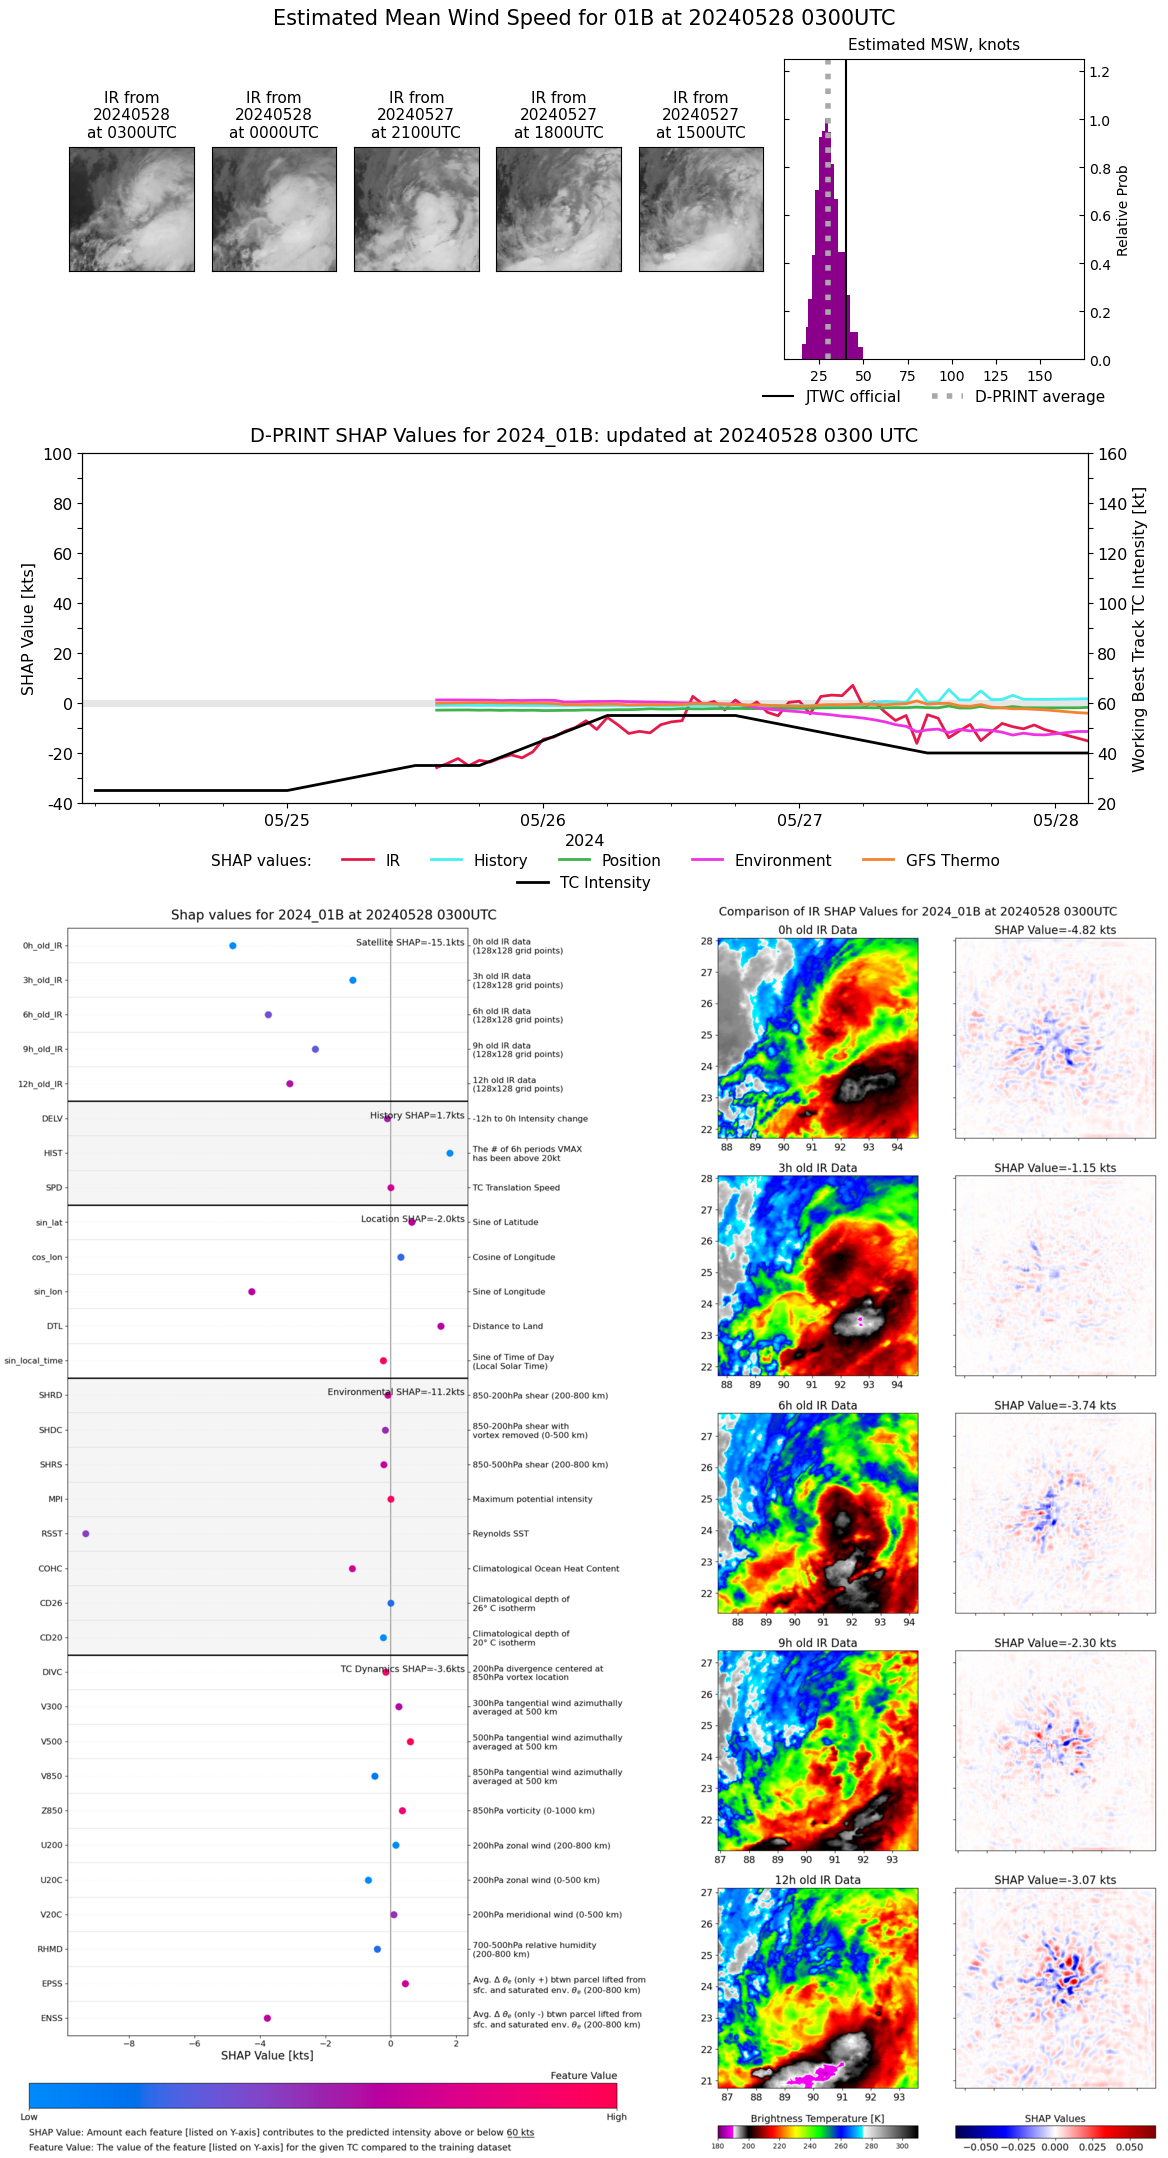 |
| 20240528 | 0200 UTC | 991 hPa | 31 kts | 26 kts | 36 kts | 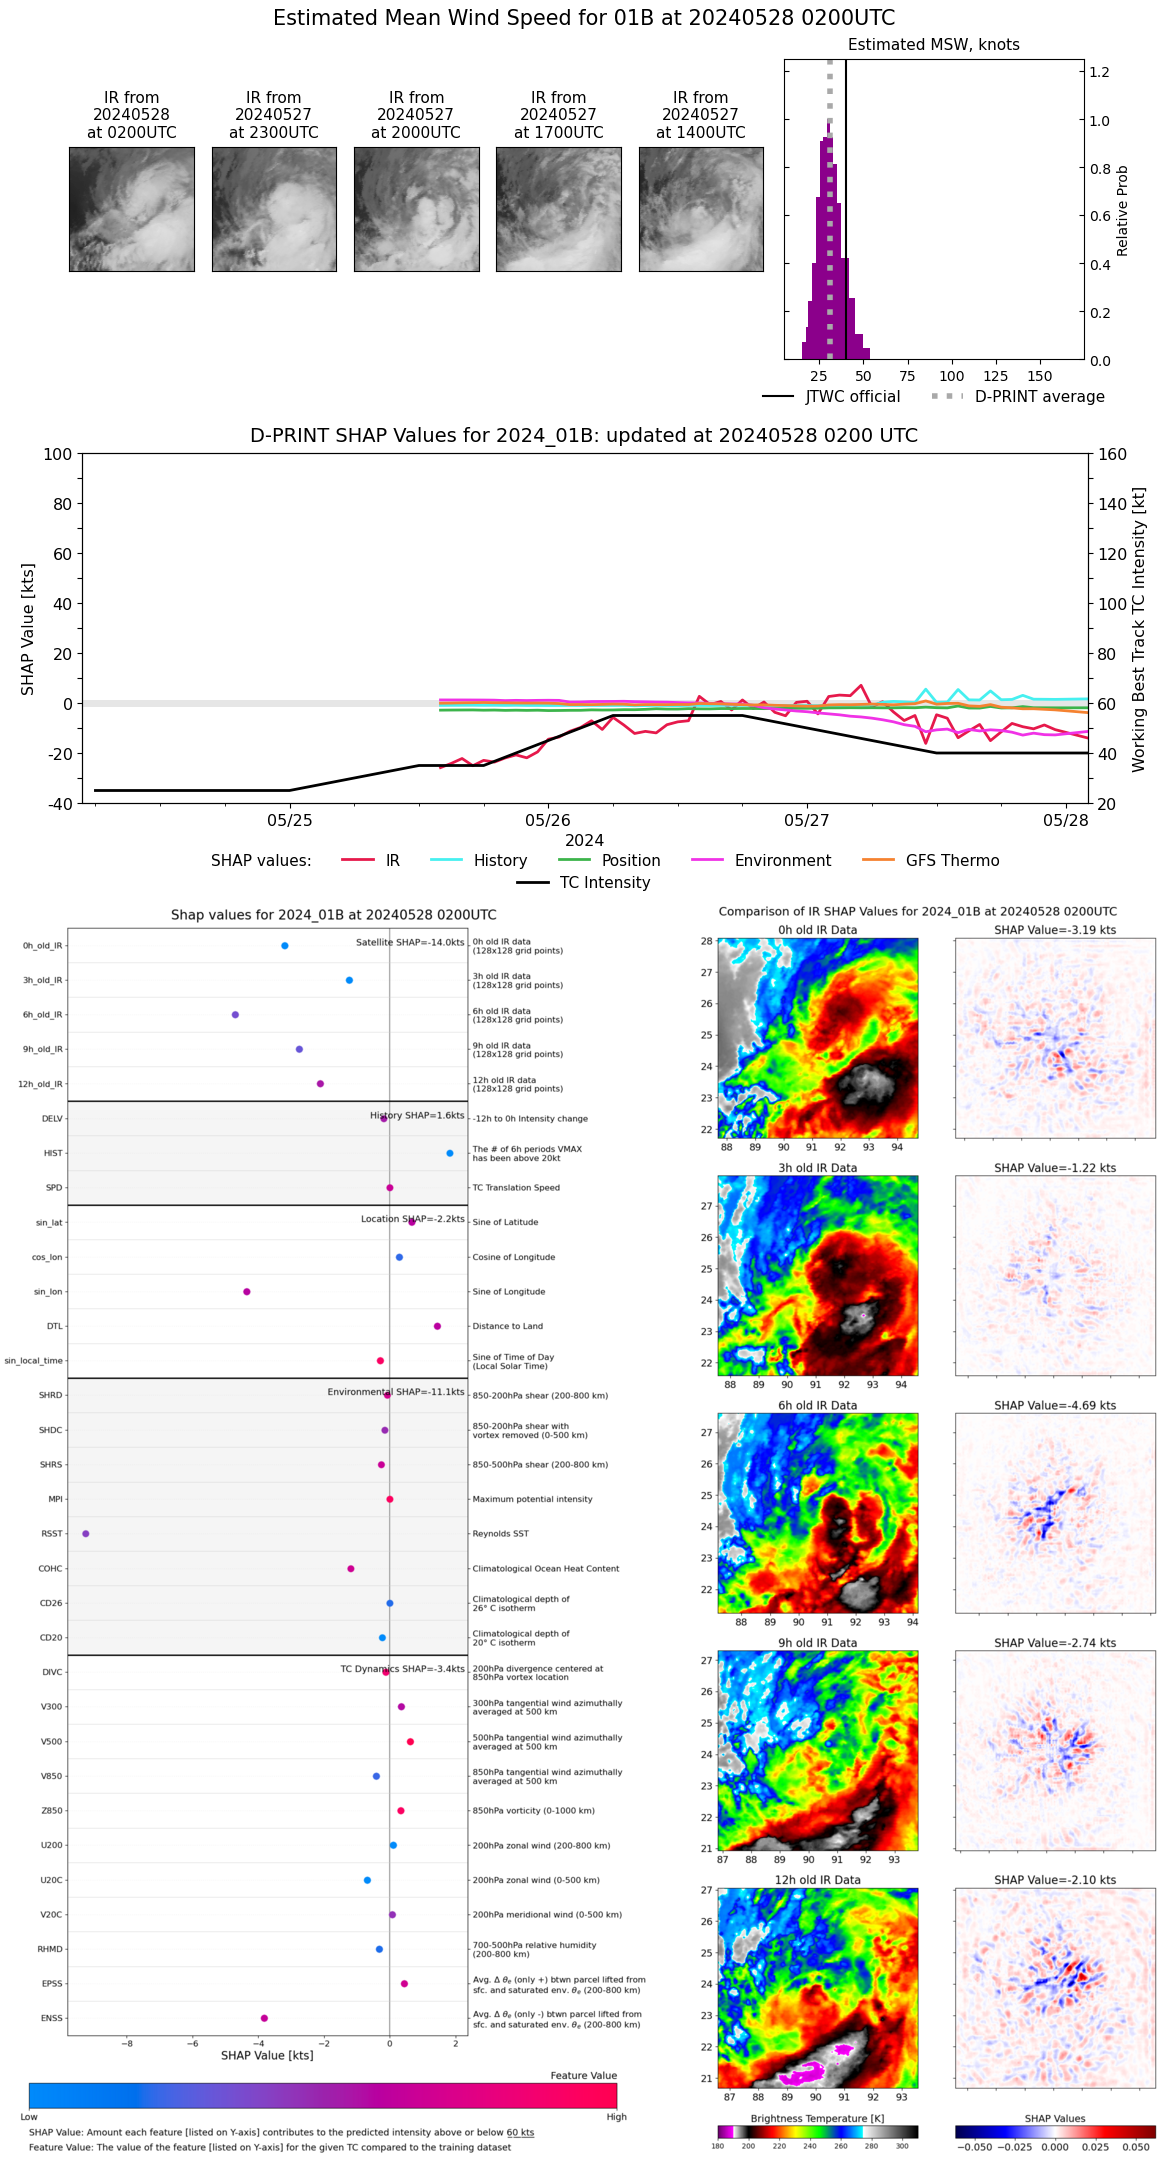 |
| 20240527 | 2300 UTC | 994 hPa | 34 kts | 30 kts | 39 kts |  |
| 20240527 | 2200 UTC | 994 hPa | 36 kts | 32 kts | 41 kts | 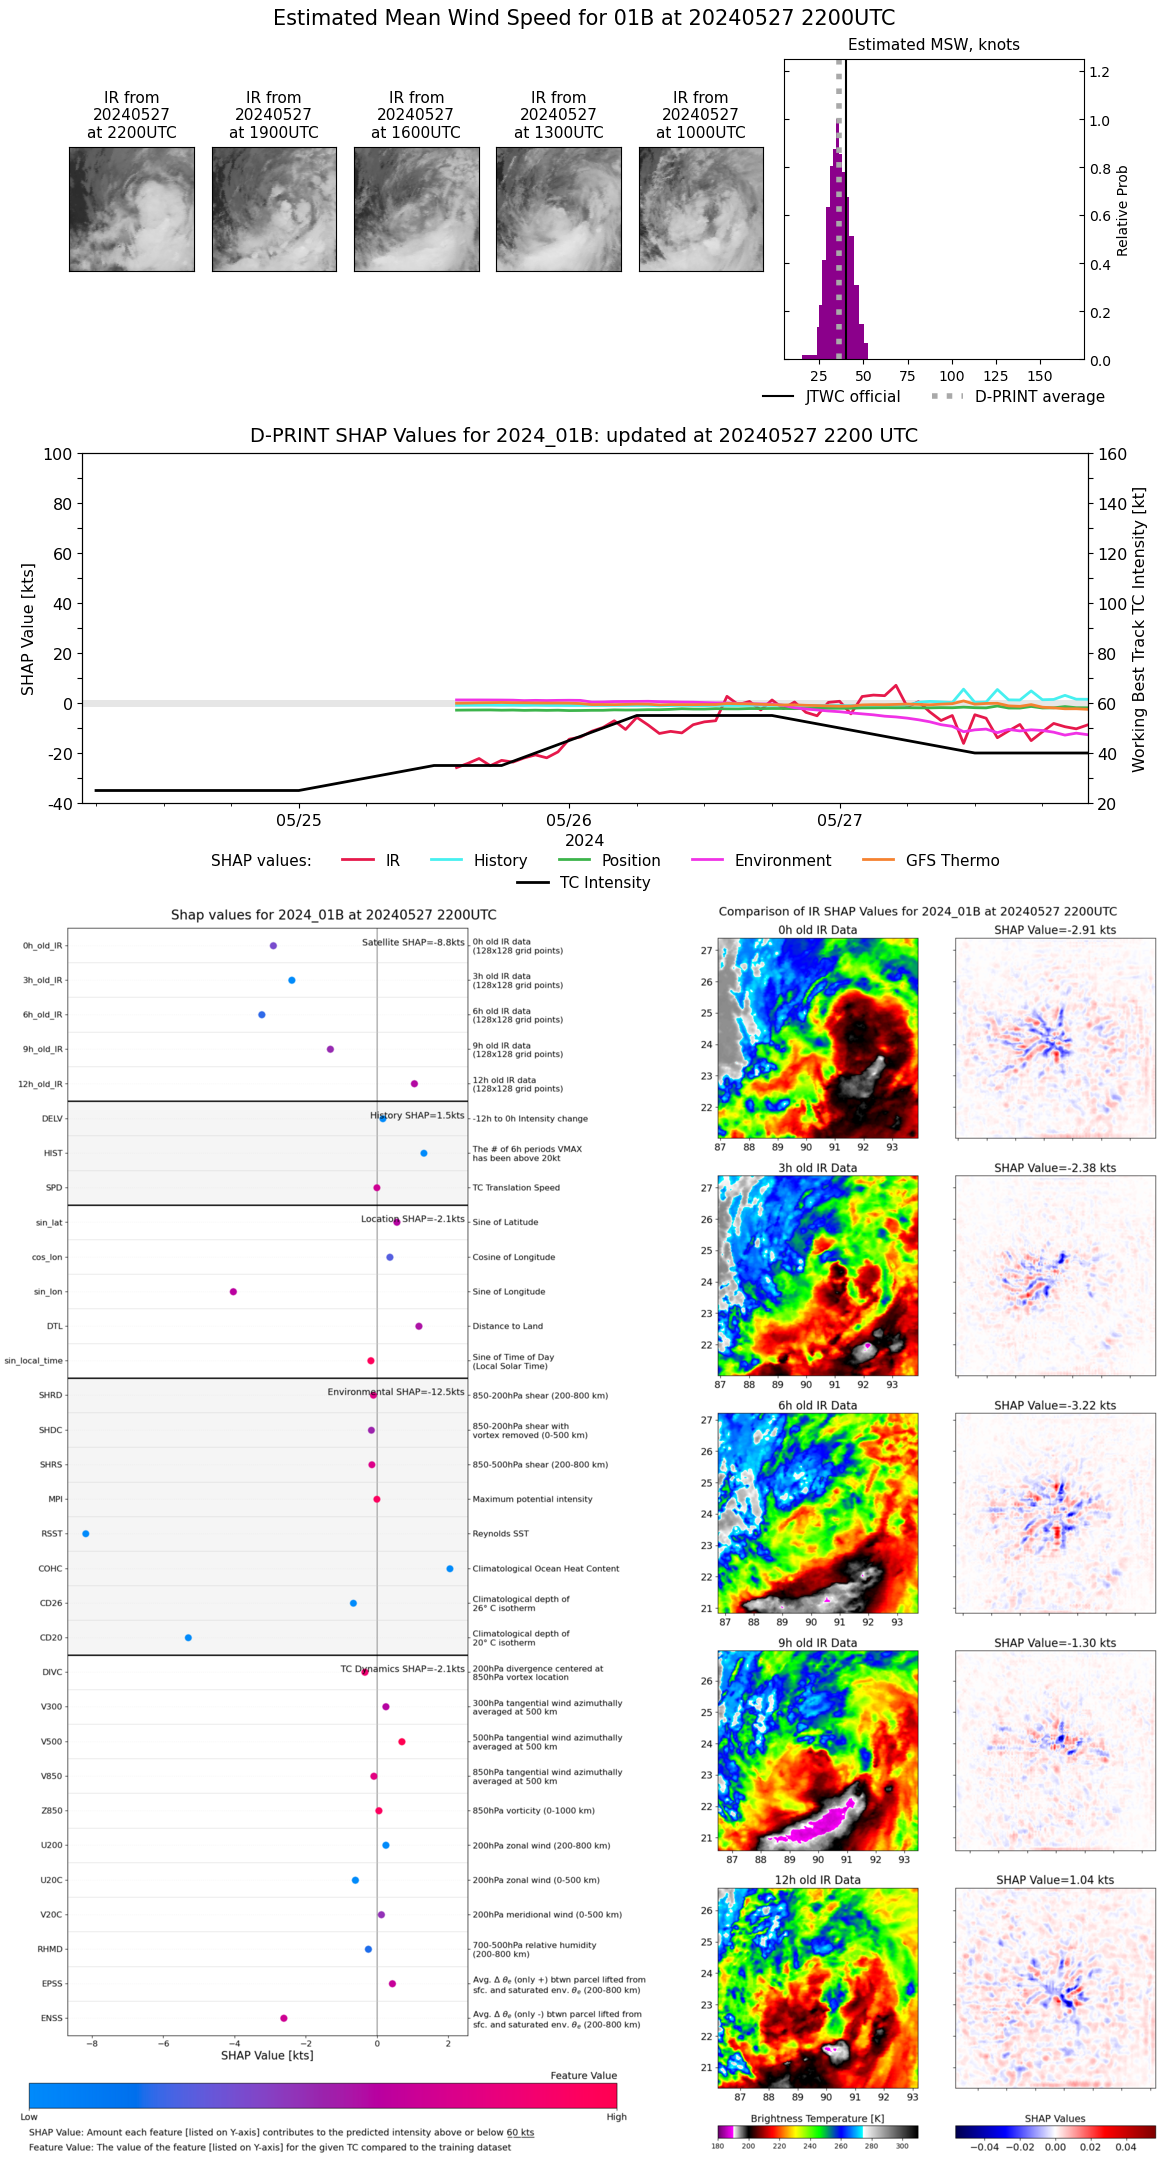 |
| 20240527 | 2100 UTC | 992 hPa | 36 kts | 31 kts | 40 kts |  |
| 20240527 | 2000 UTC | 990 hPa | 38 kts | 33 kts | 43 kts | 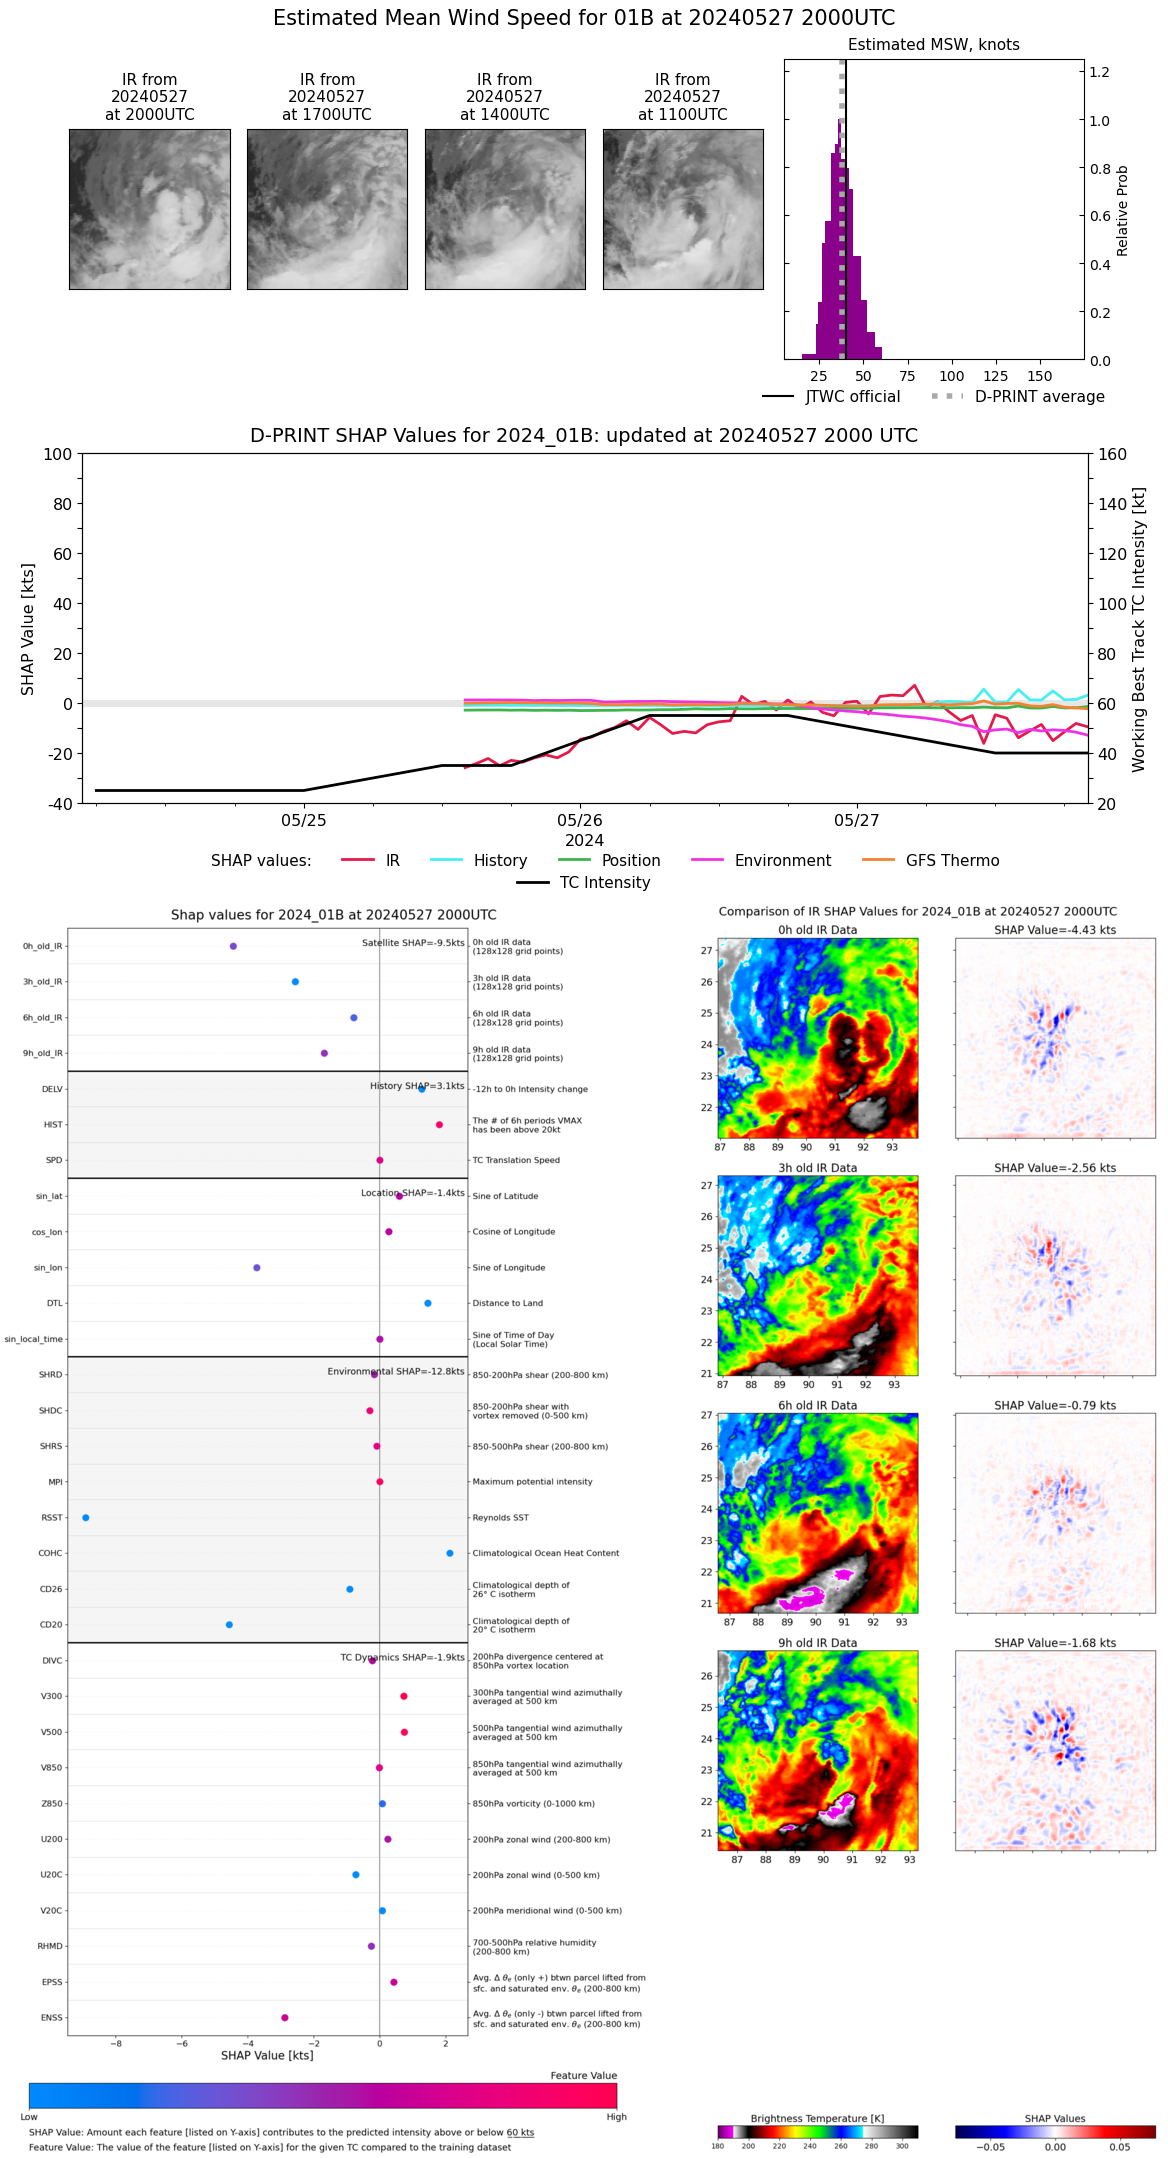 |
| 20240527 | 1900 UTC | 991 hPa | 38 kts | 33 kts | 44 kts |  |
| 20240527 | 1800 UTC | 991 hPa | 36 kts | 31 kts | 41 kts | 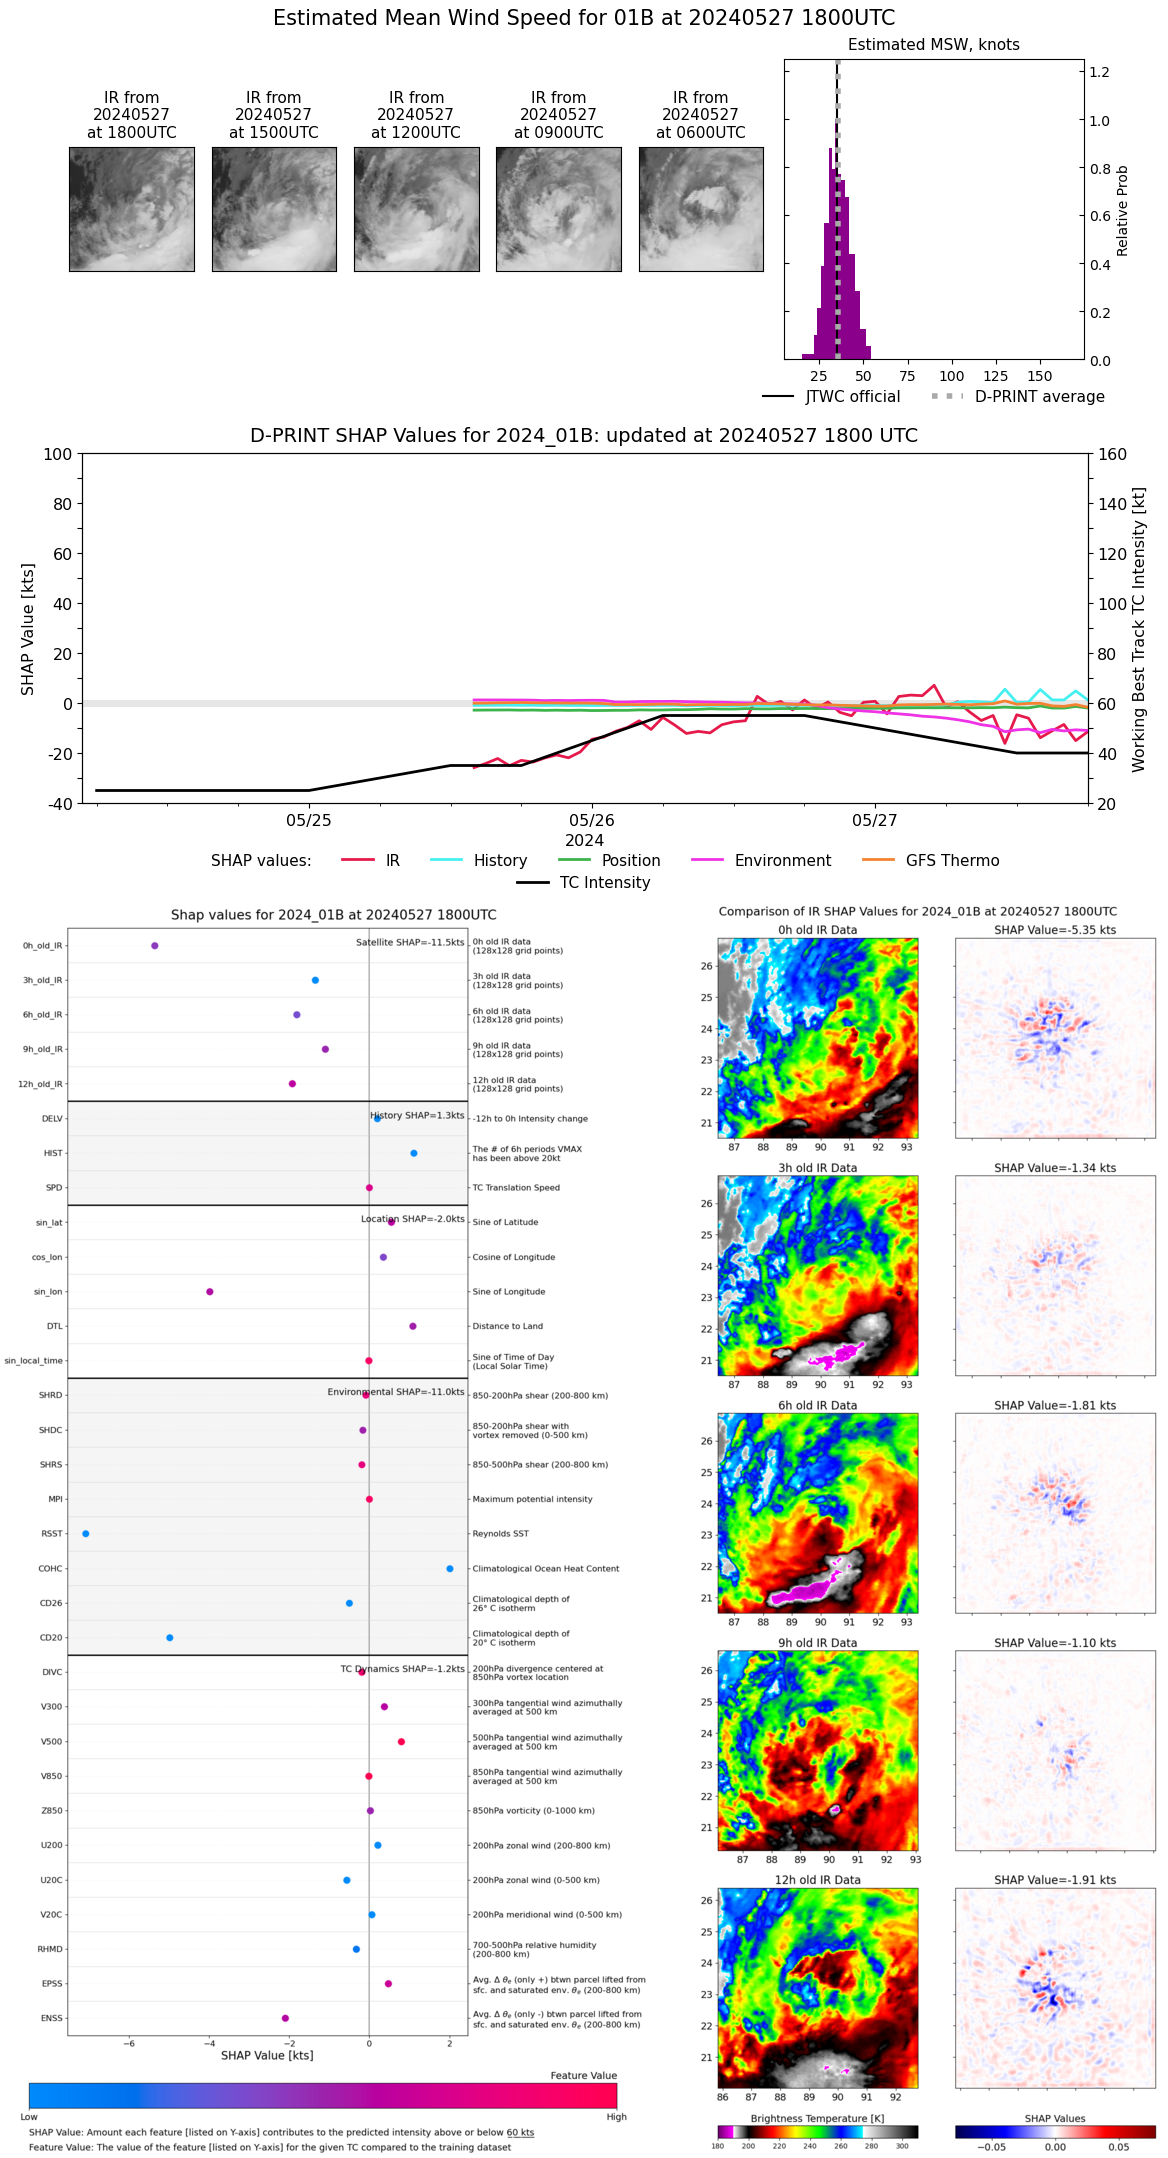 |
| 20240527 | 1700 UTC | 986 hPa | 38 kts | 33 kts | 44 kts | 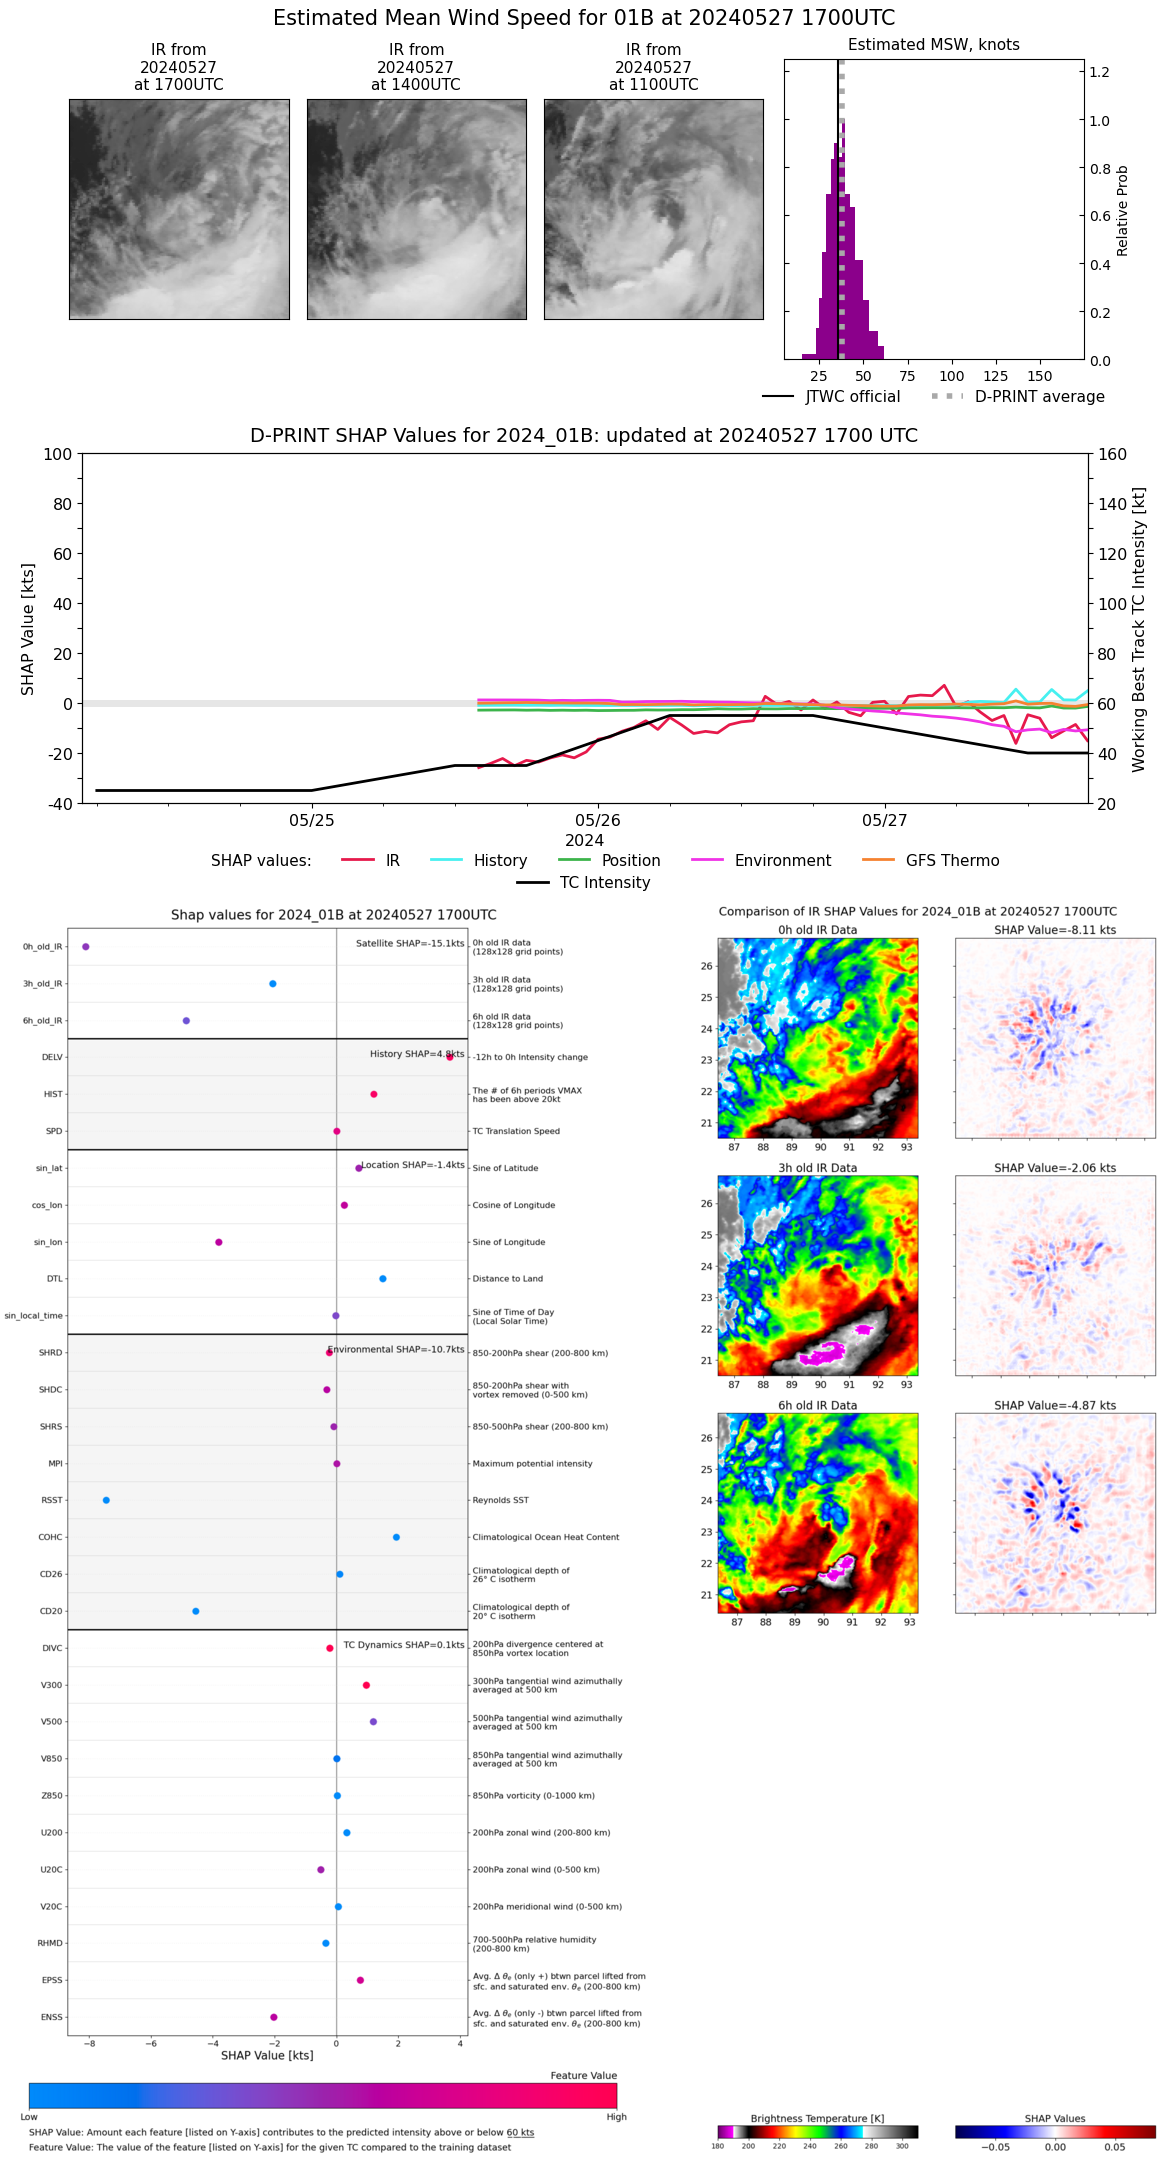 |
| 20240527 | 1600 UTC | 991 hPa | 39 kts | 34 kts | 44 kts | 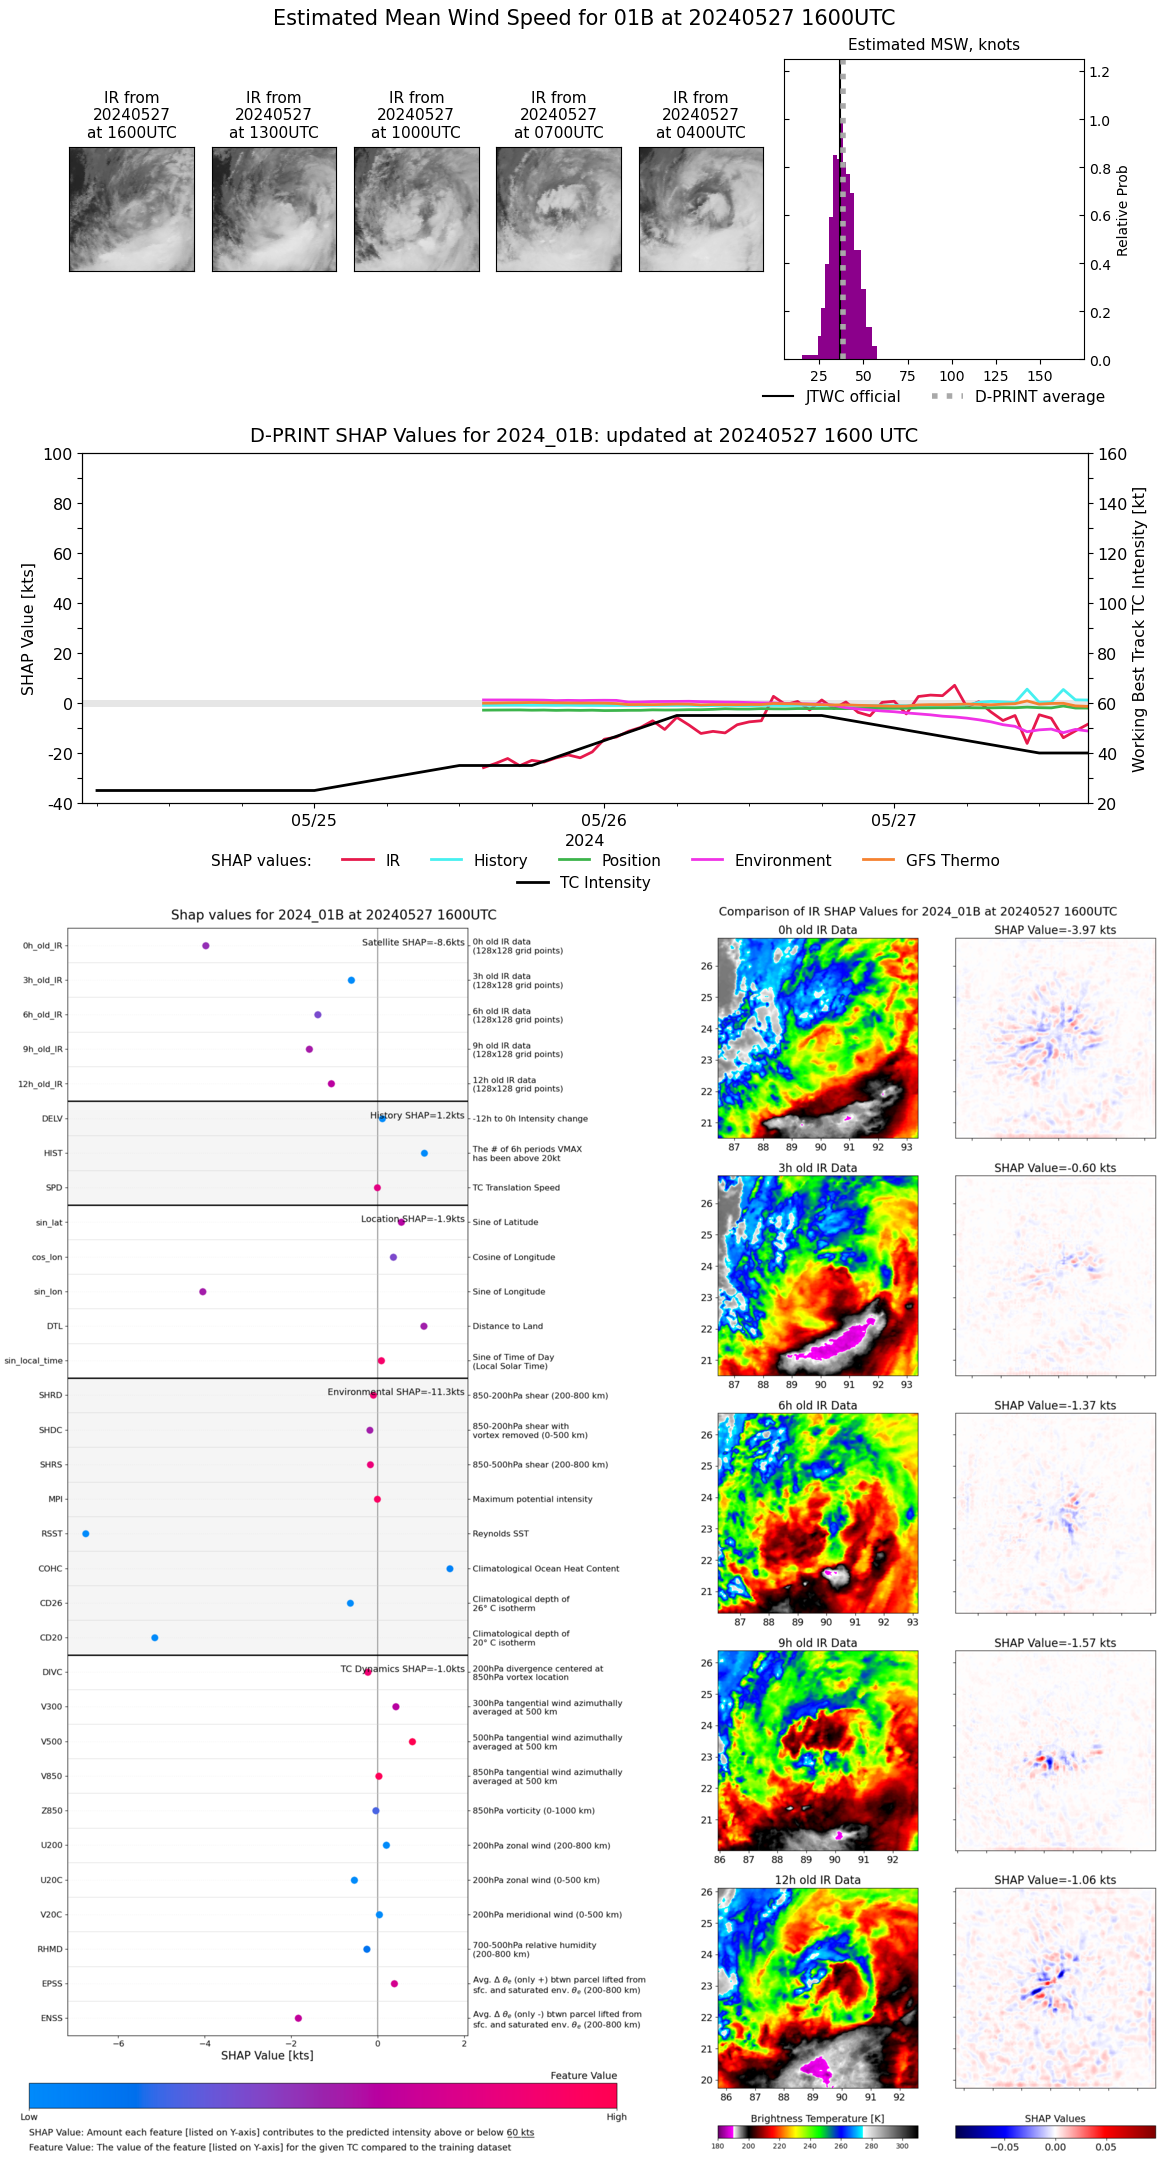 |
| 20240527 | 1500 UTC | 989 hPa | 37 kts | 32 kts | 42 kts | 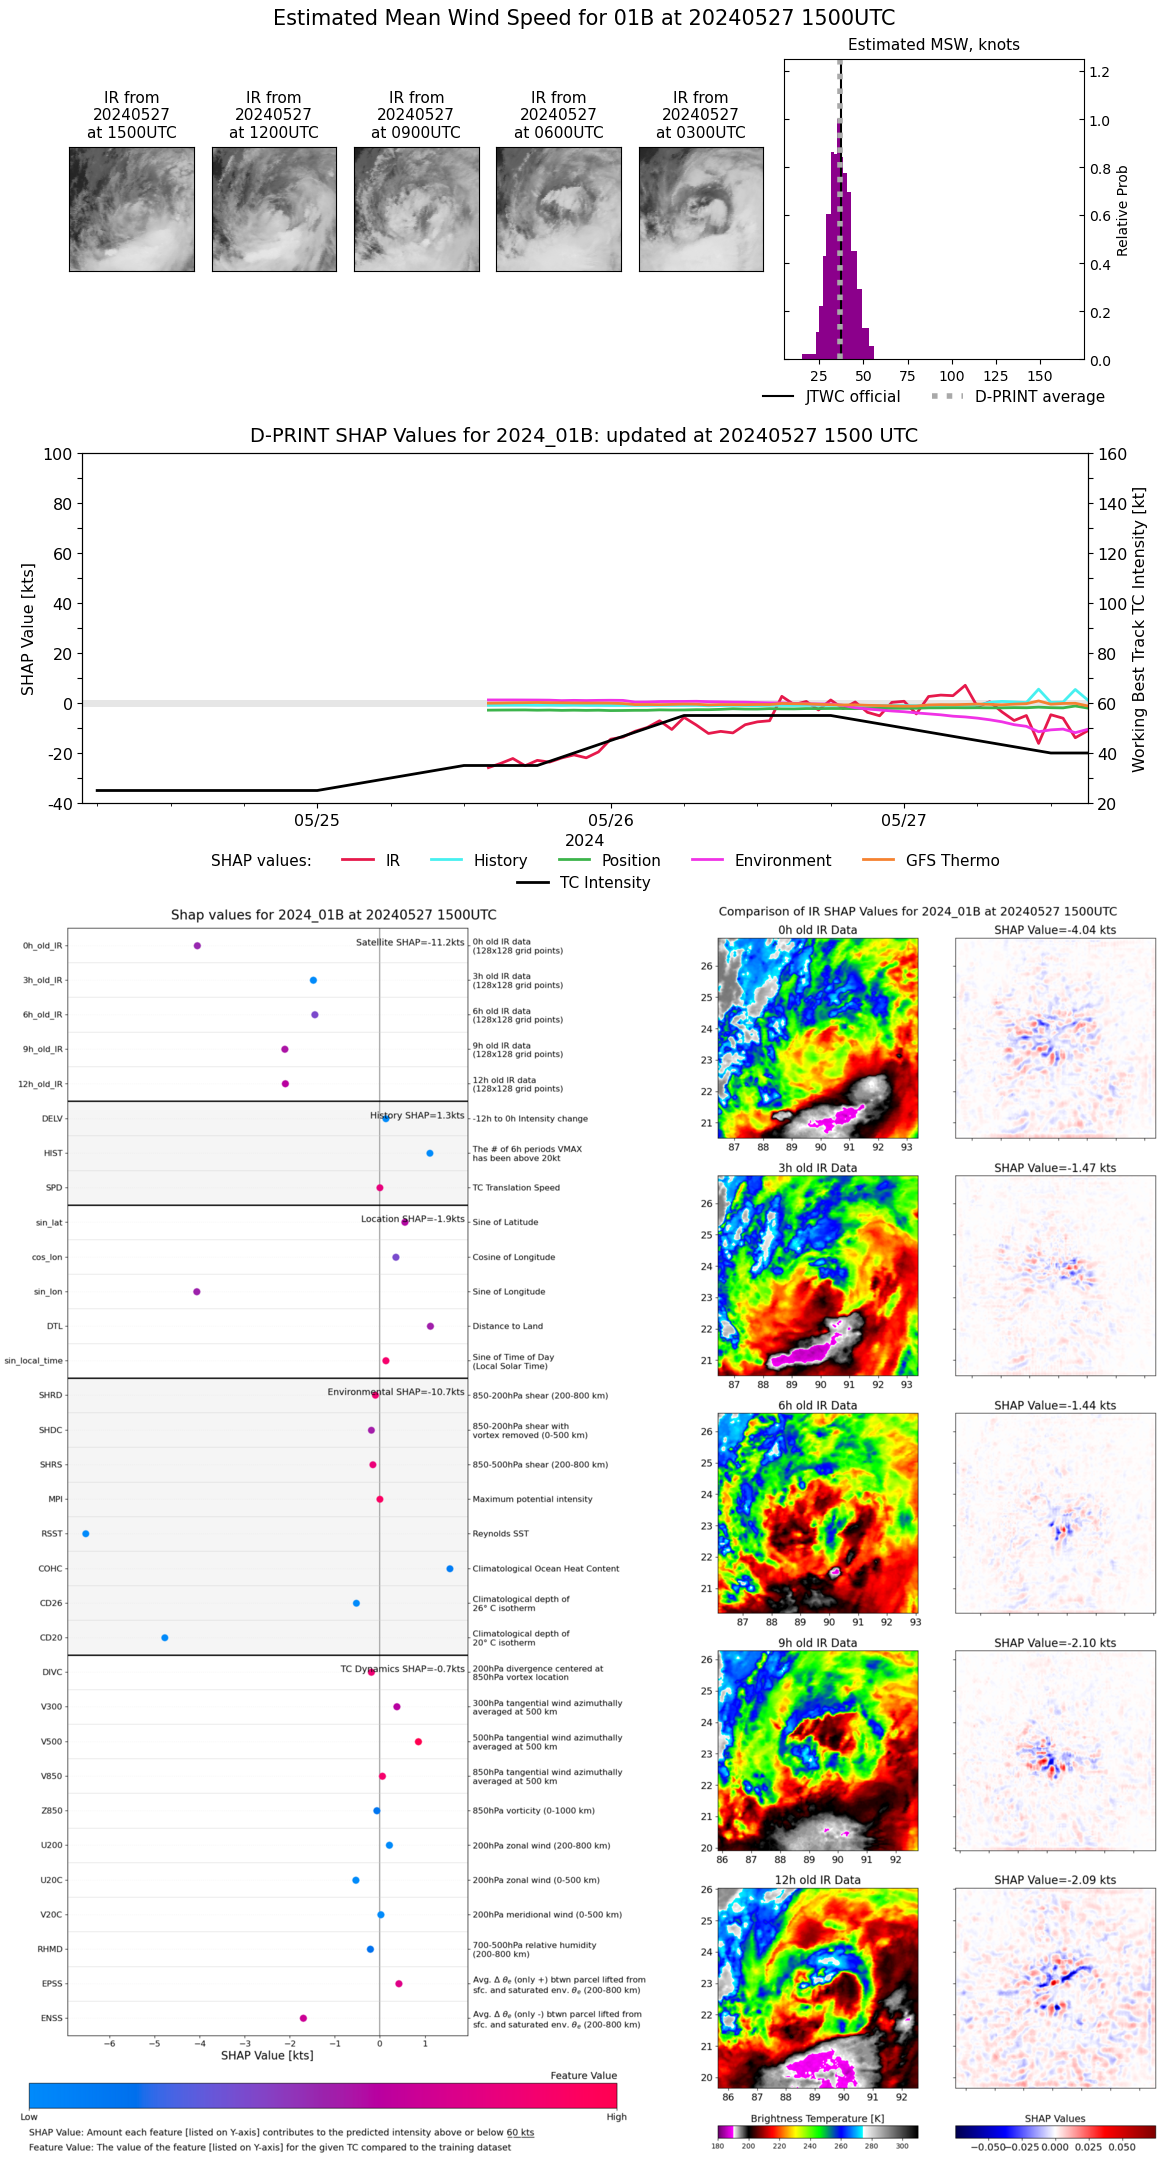 |
| 20240527 | 1400 UTC | 984 hPa | 39 kts | 34 kts | 45 kts | 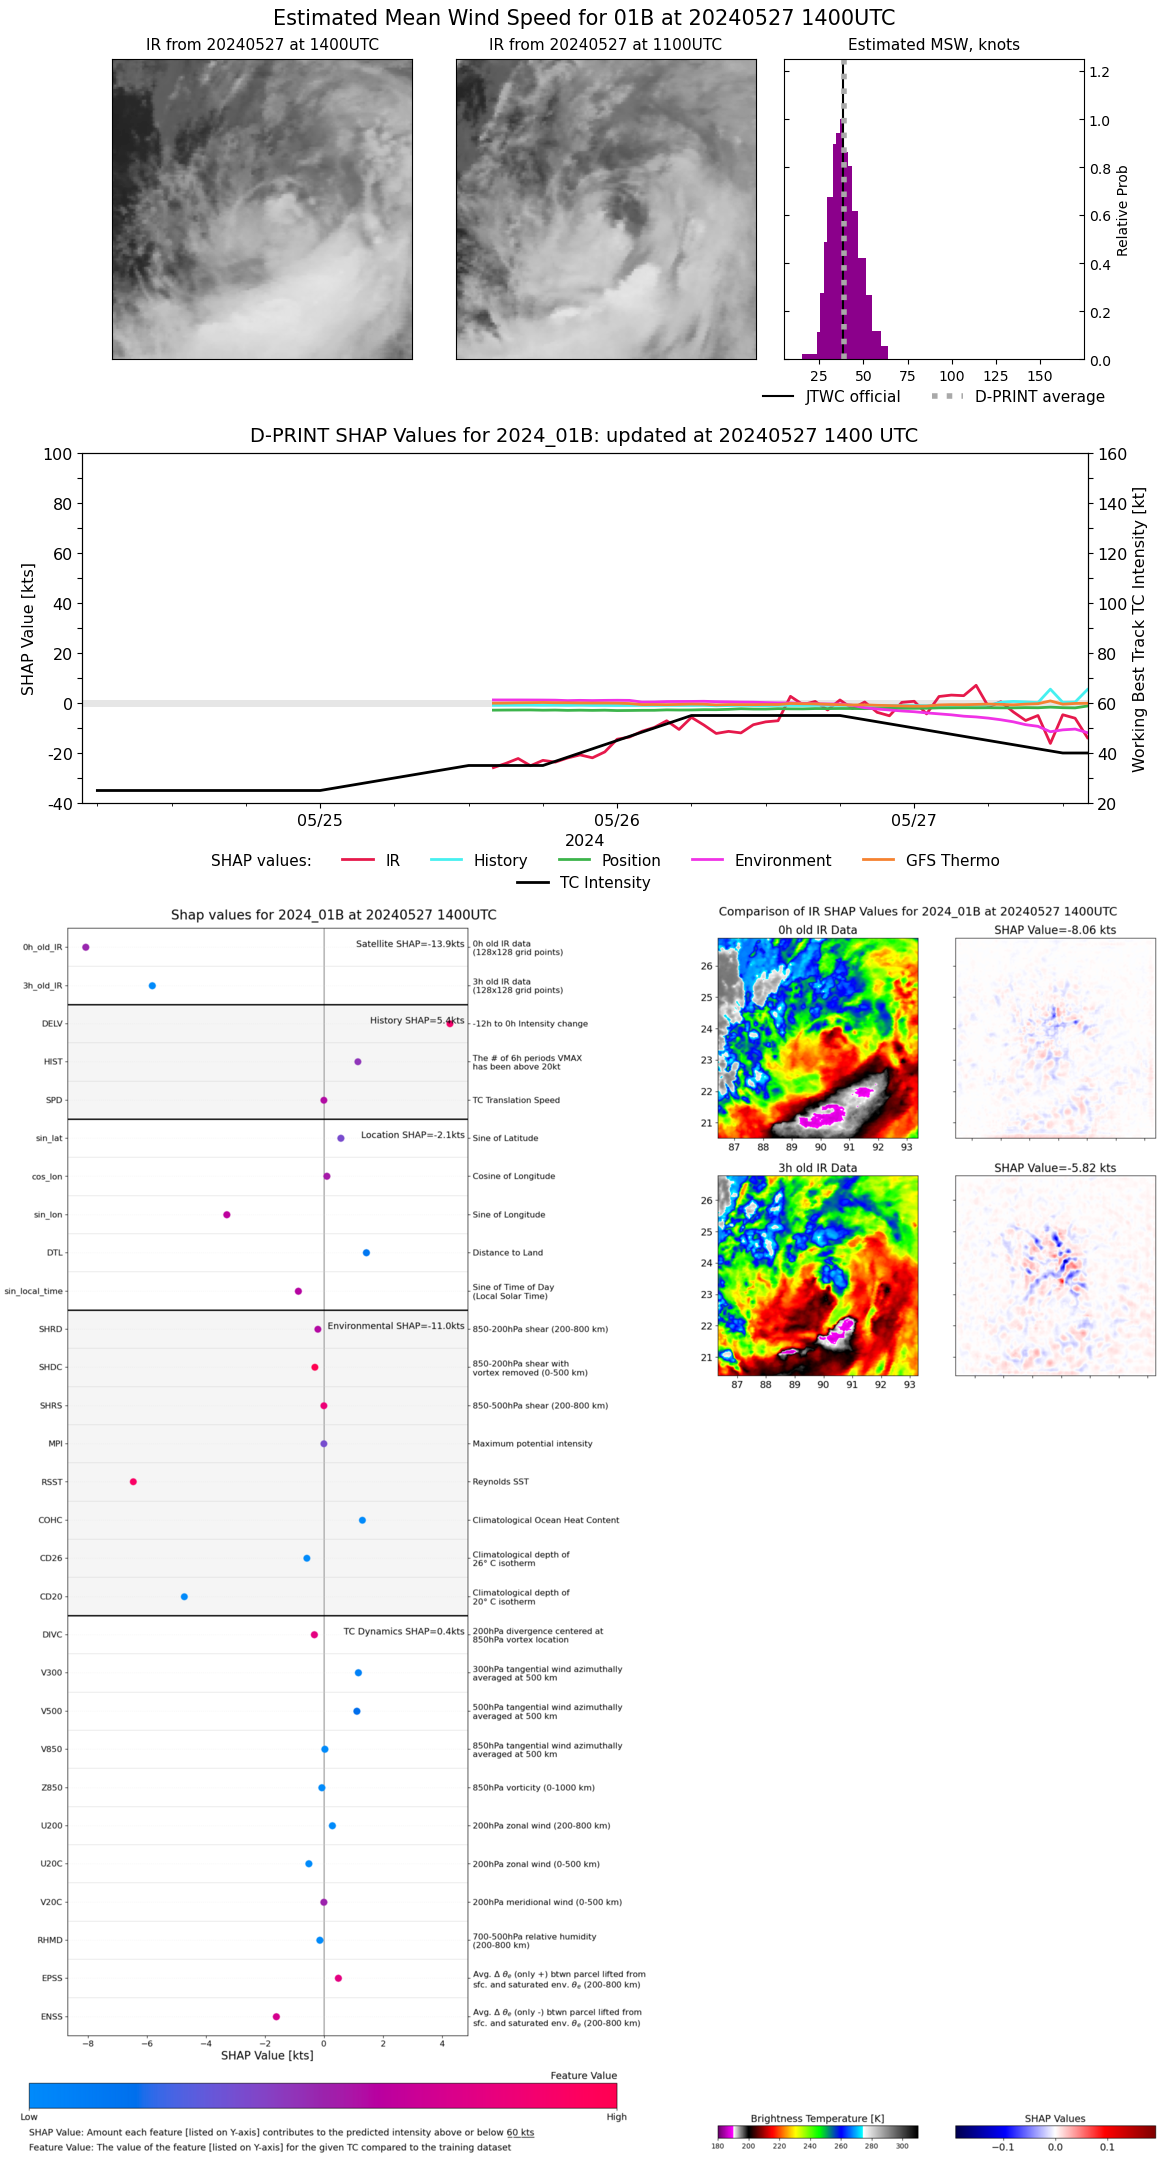 |
| 20240527 | 1300 UTC | 991 hPa | 41 kts | 36 kts | 47 kts | 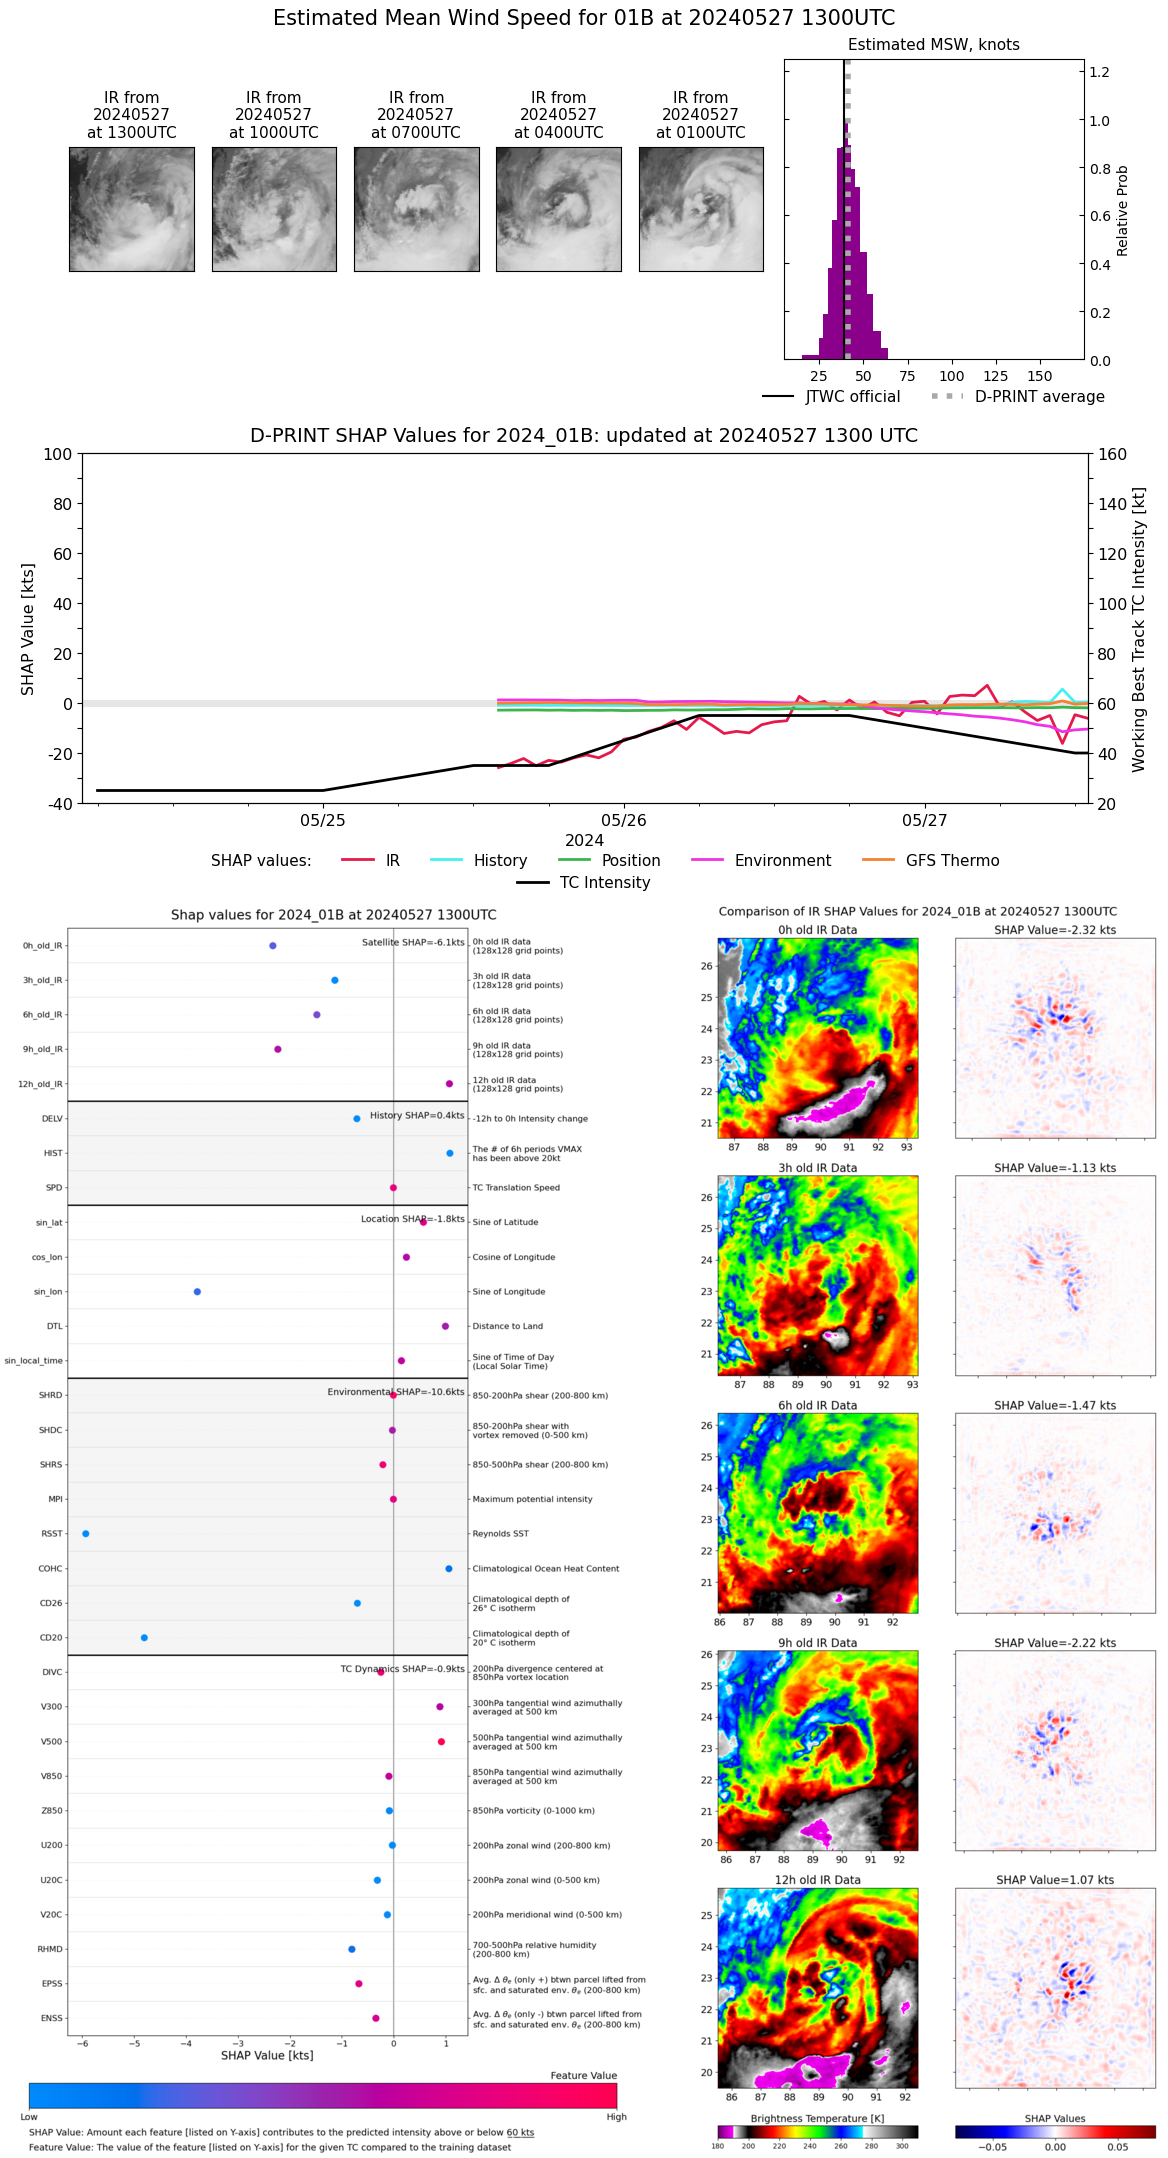 |
| 20240527 | 1200 UTC | 990 hPa | 42 kts | 37 kts | 47 kts | 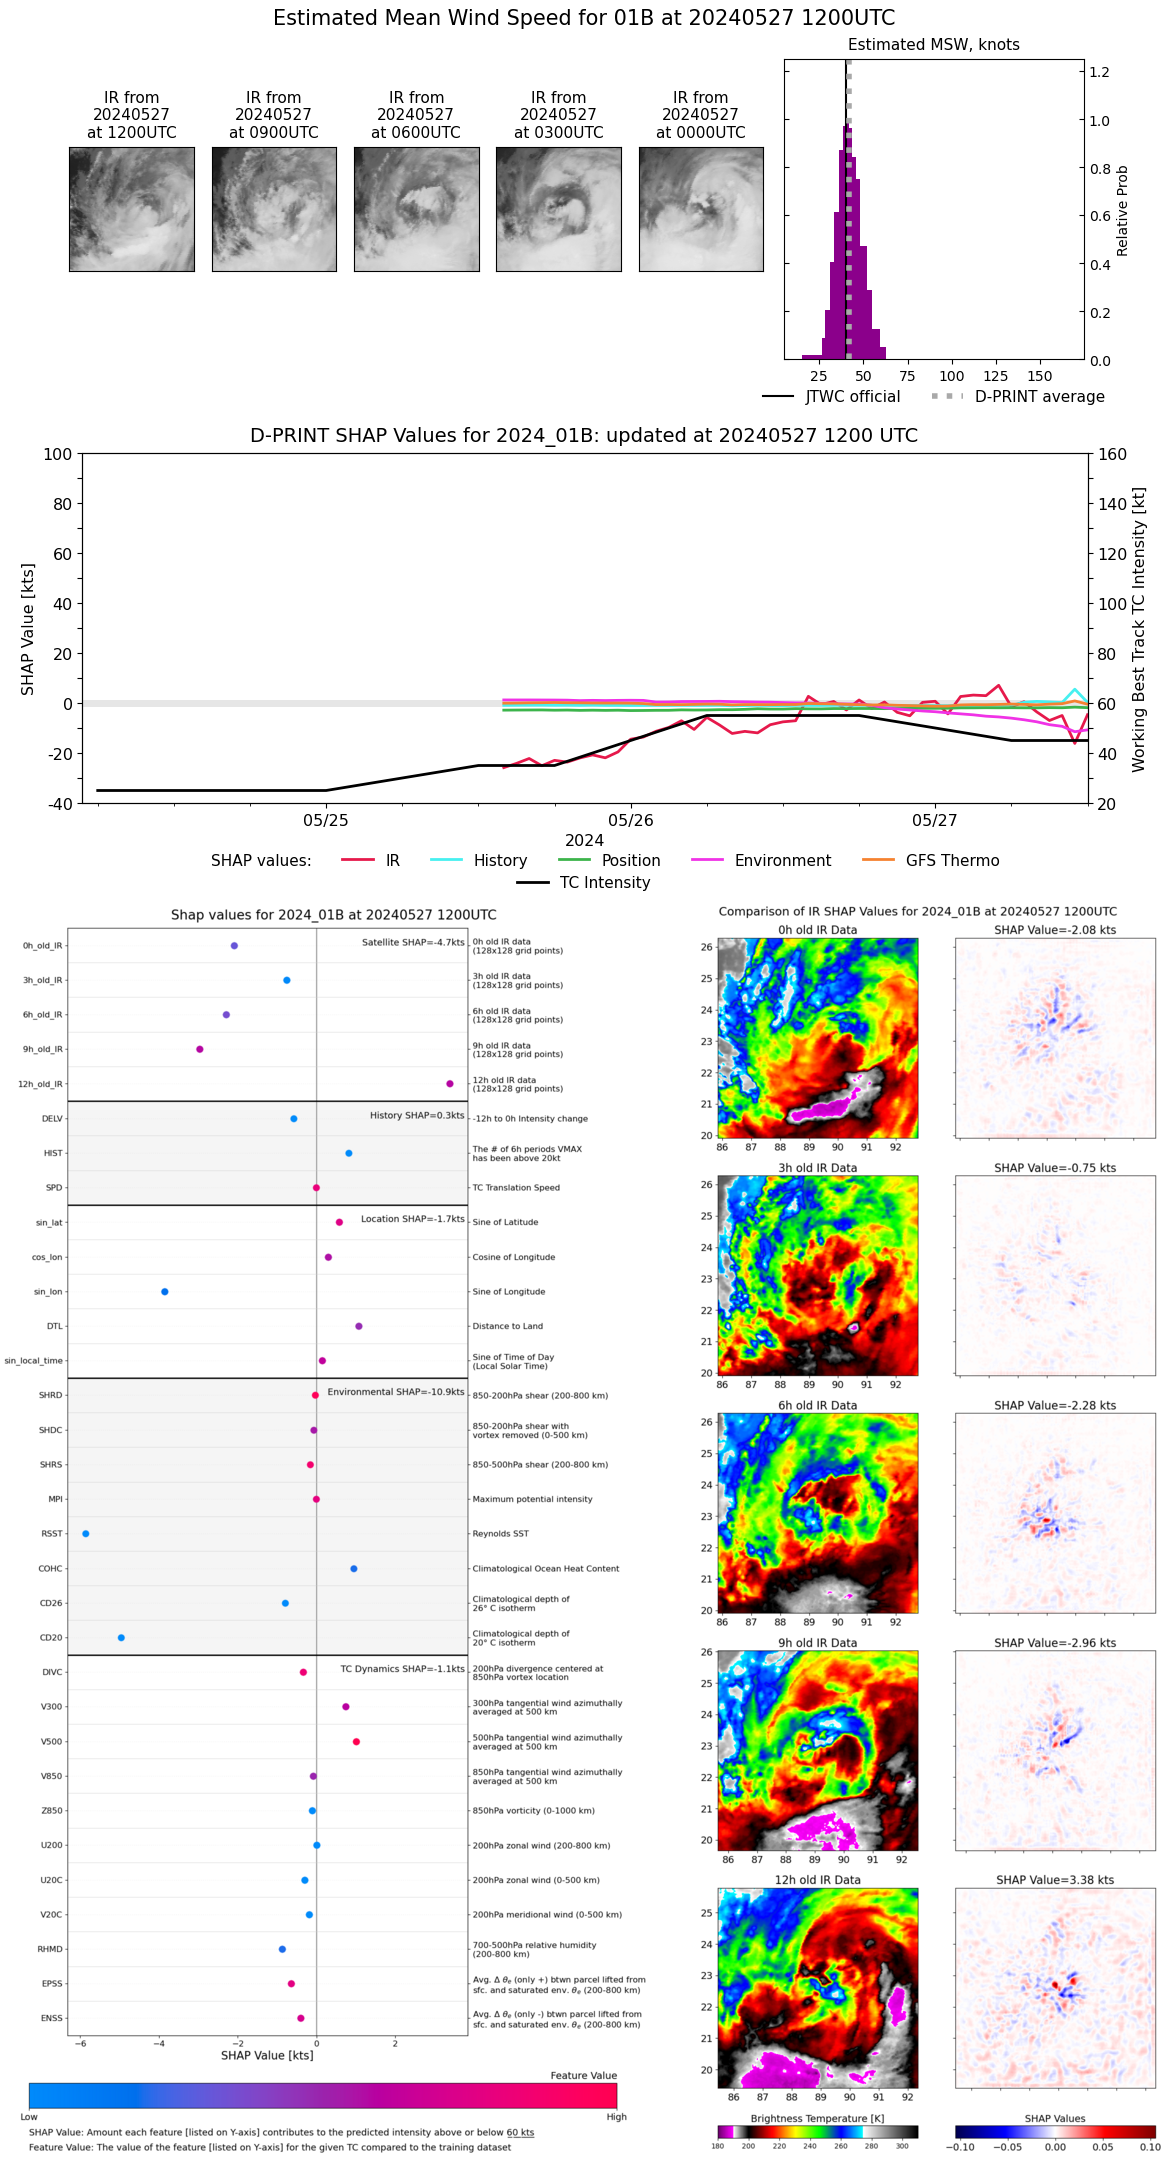 |
| 20240527 | 1100 UTC | 990 hPa | 36 kts | 30 kts | 42 kts | 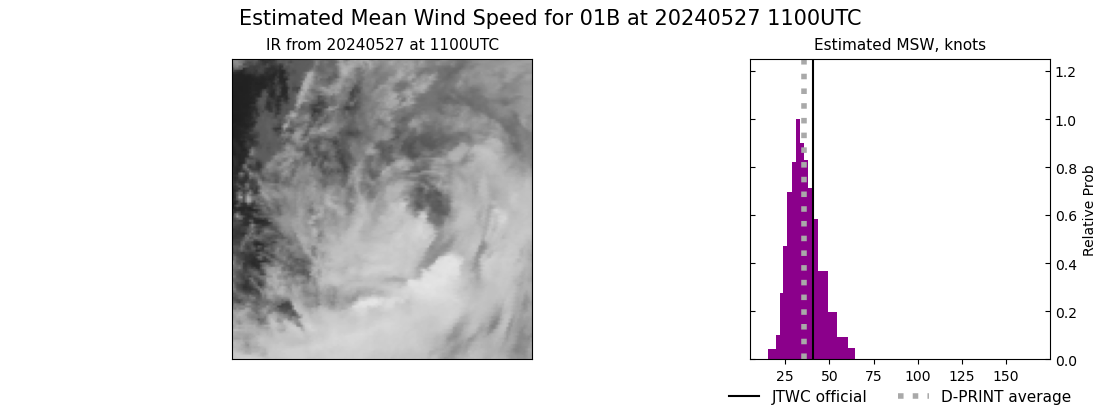 |
| 20240527 | 1000 UTC | 989 hPa | 43 kts | 38 kts | 49 kts | 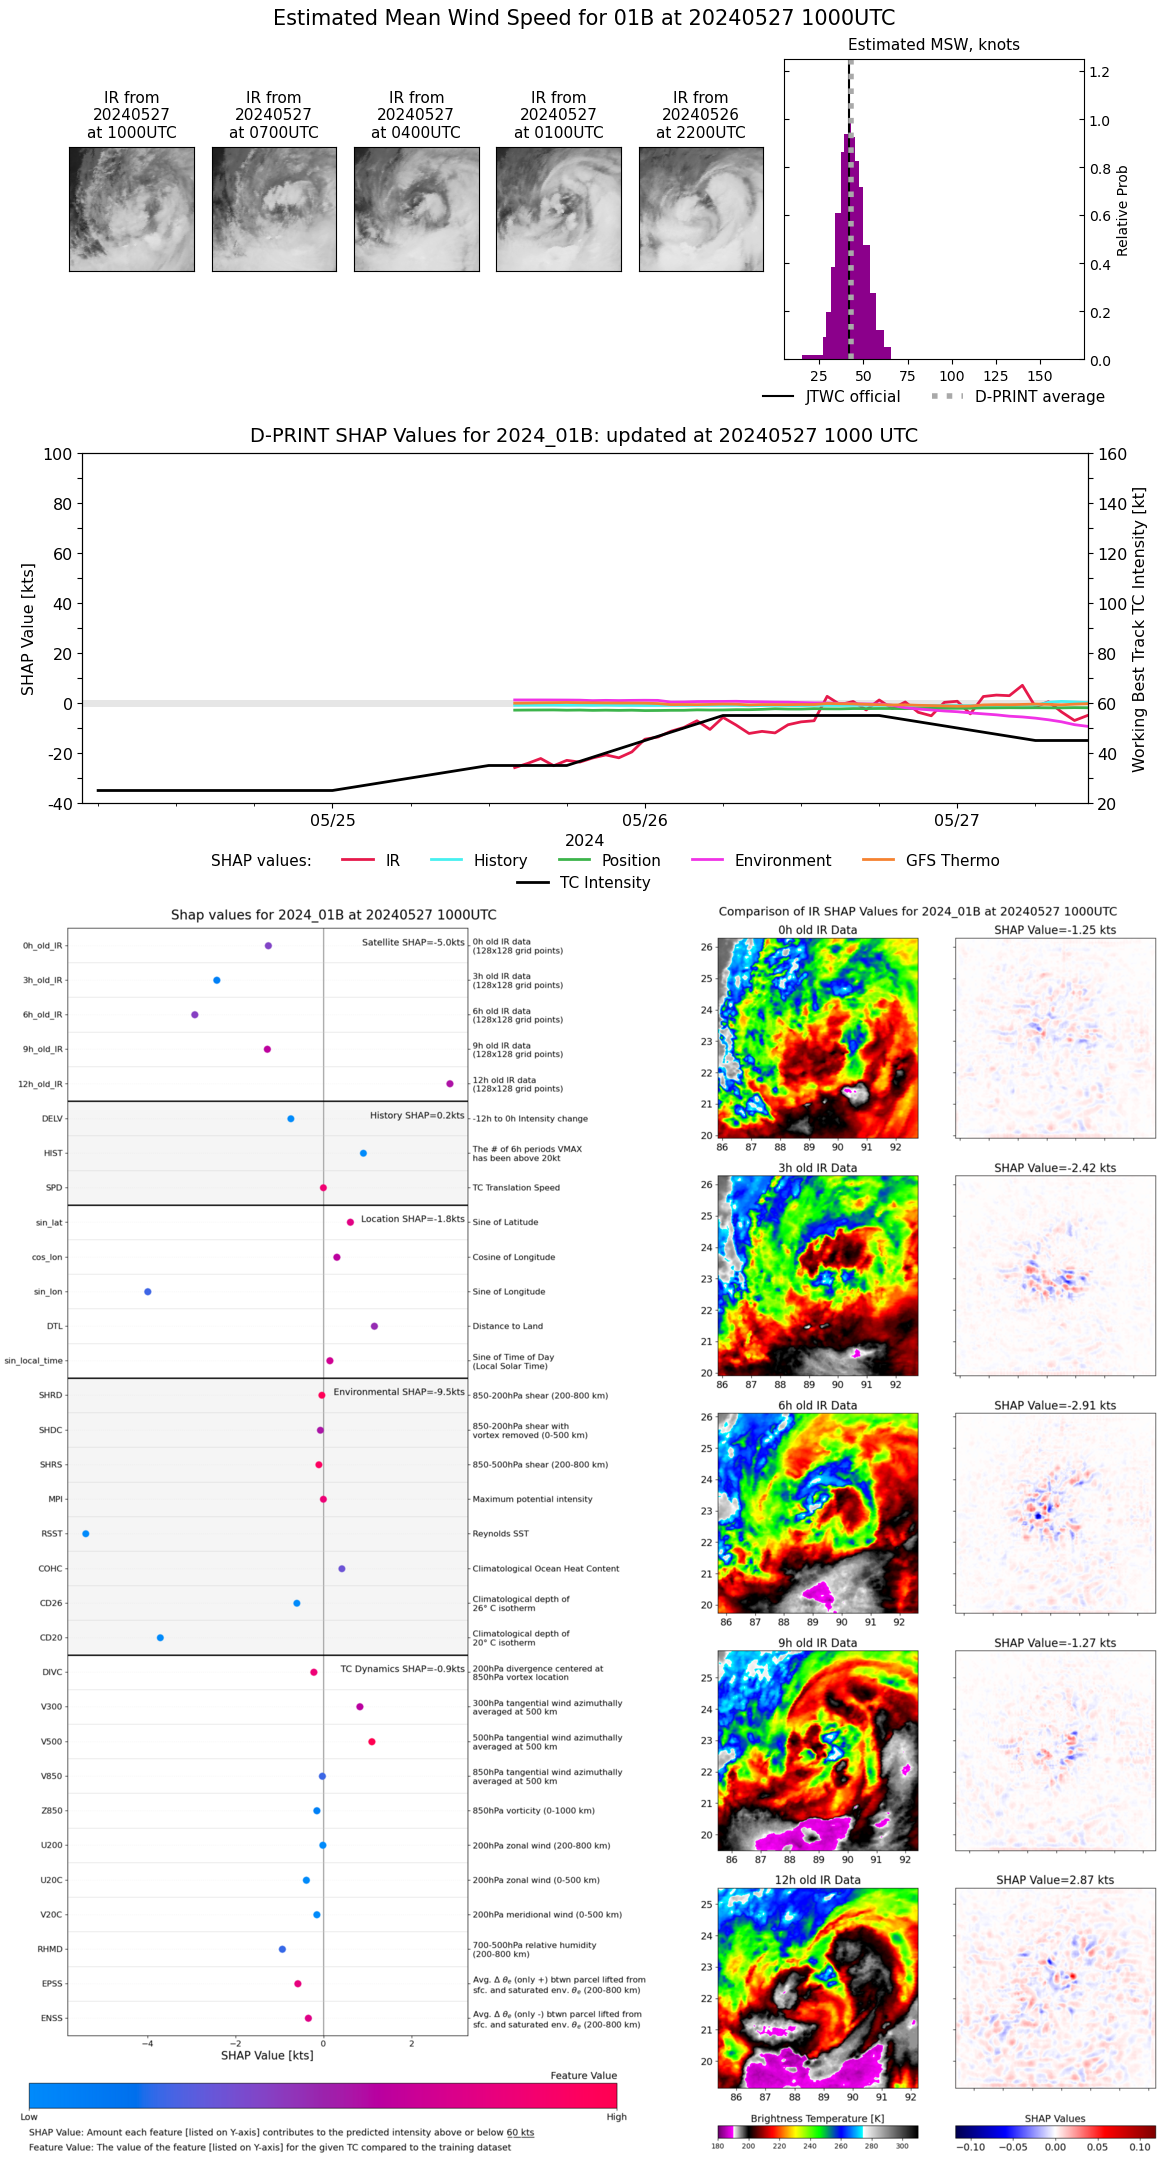 |
| 20240527 | 0900 UTC | 989 hPa | 42 kts | 37 kts | 47 kts | 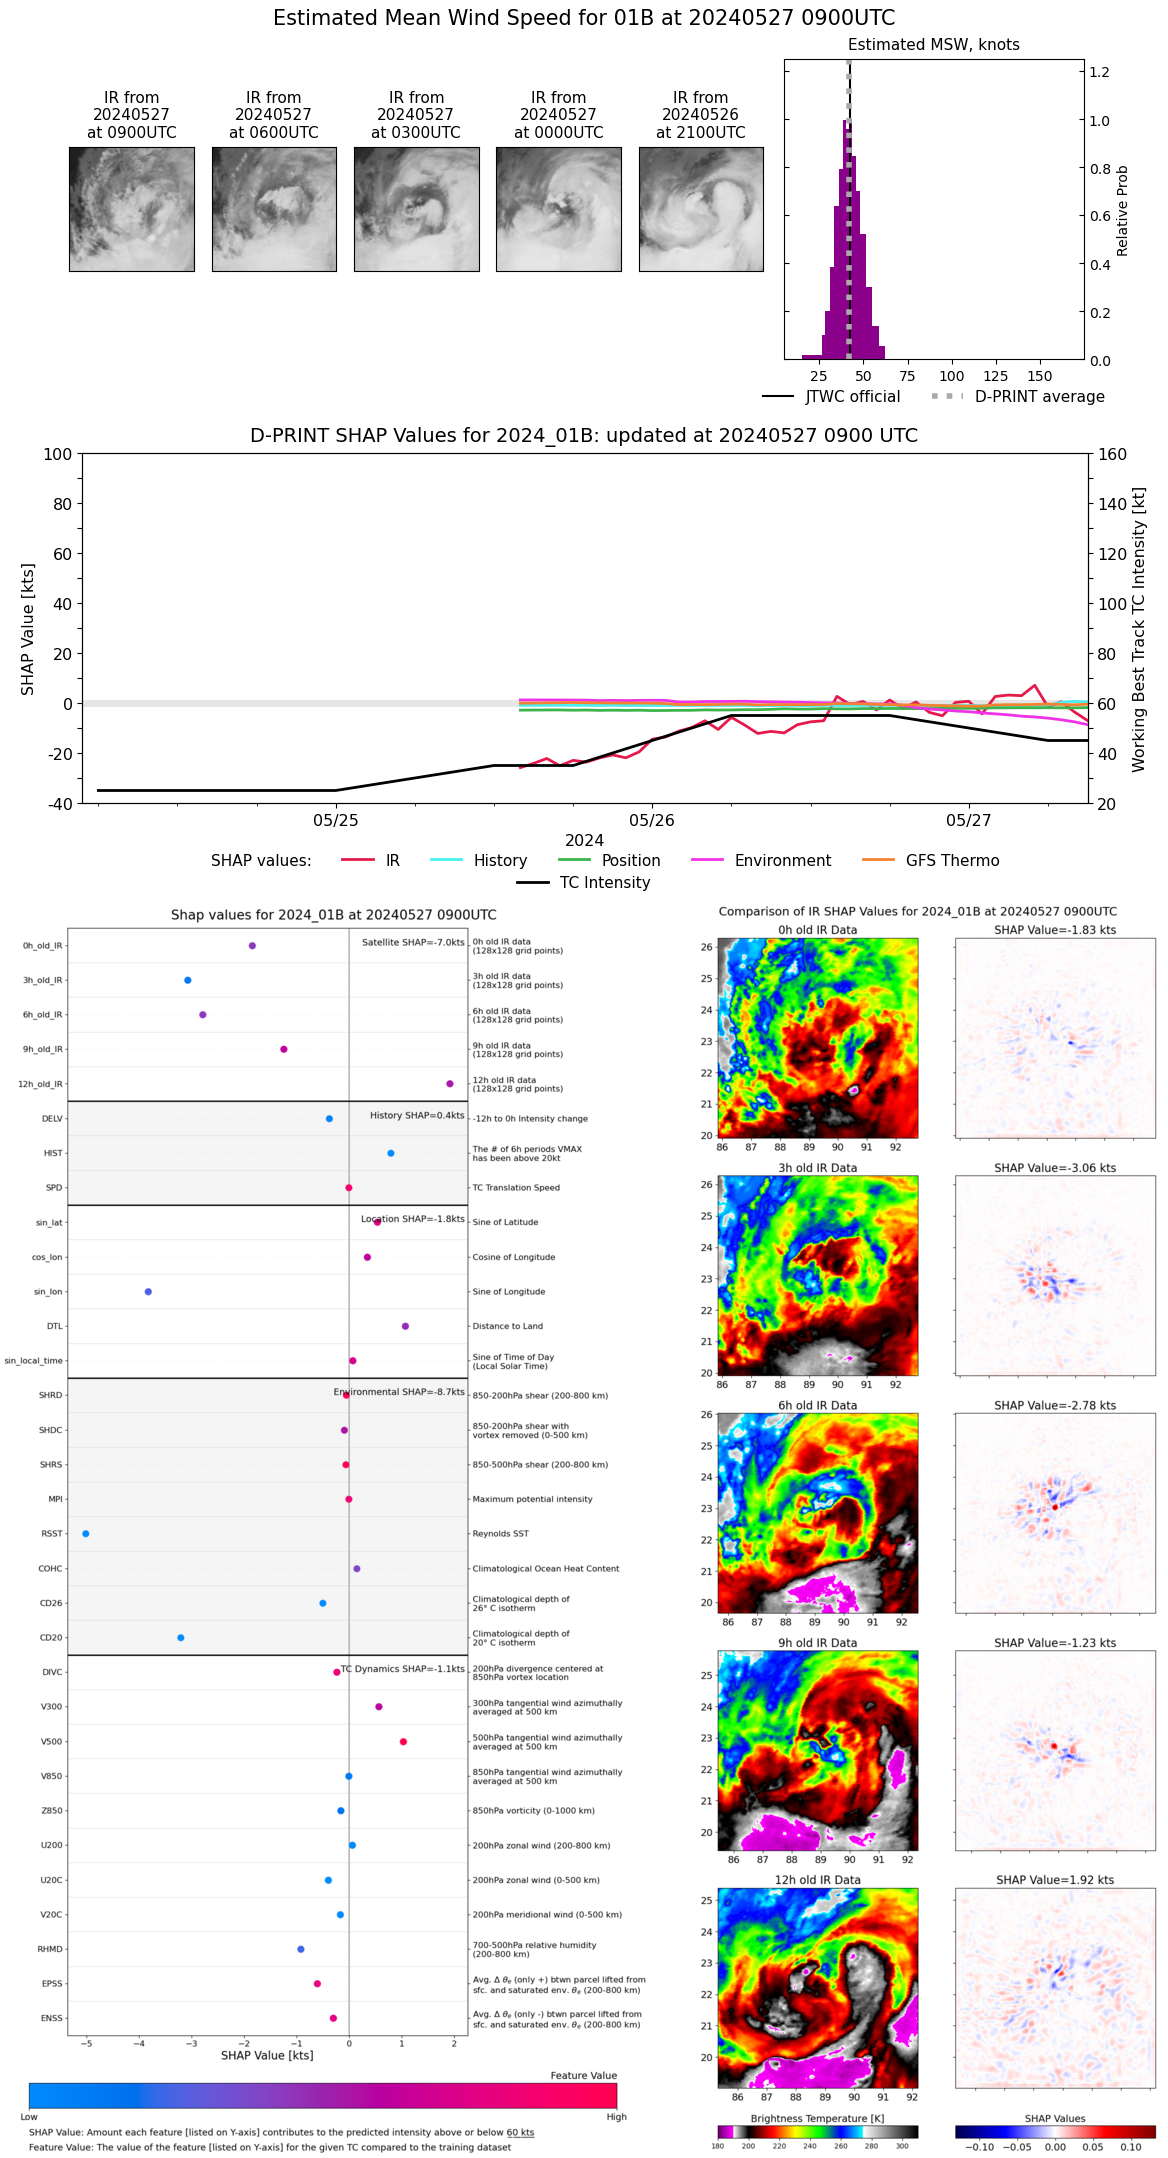 |
| 20240527 | 0800 UTC | 984 hPa | 47 kts | 42 kts | 53 kts | 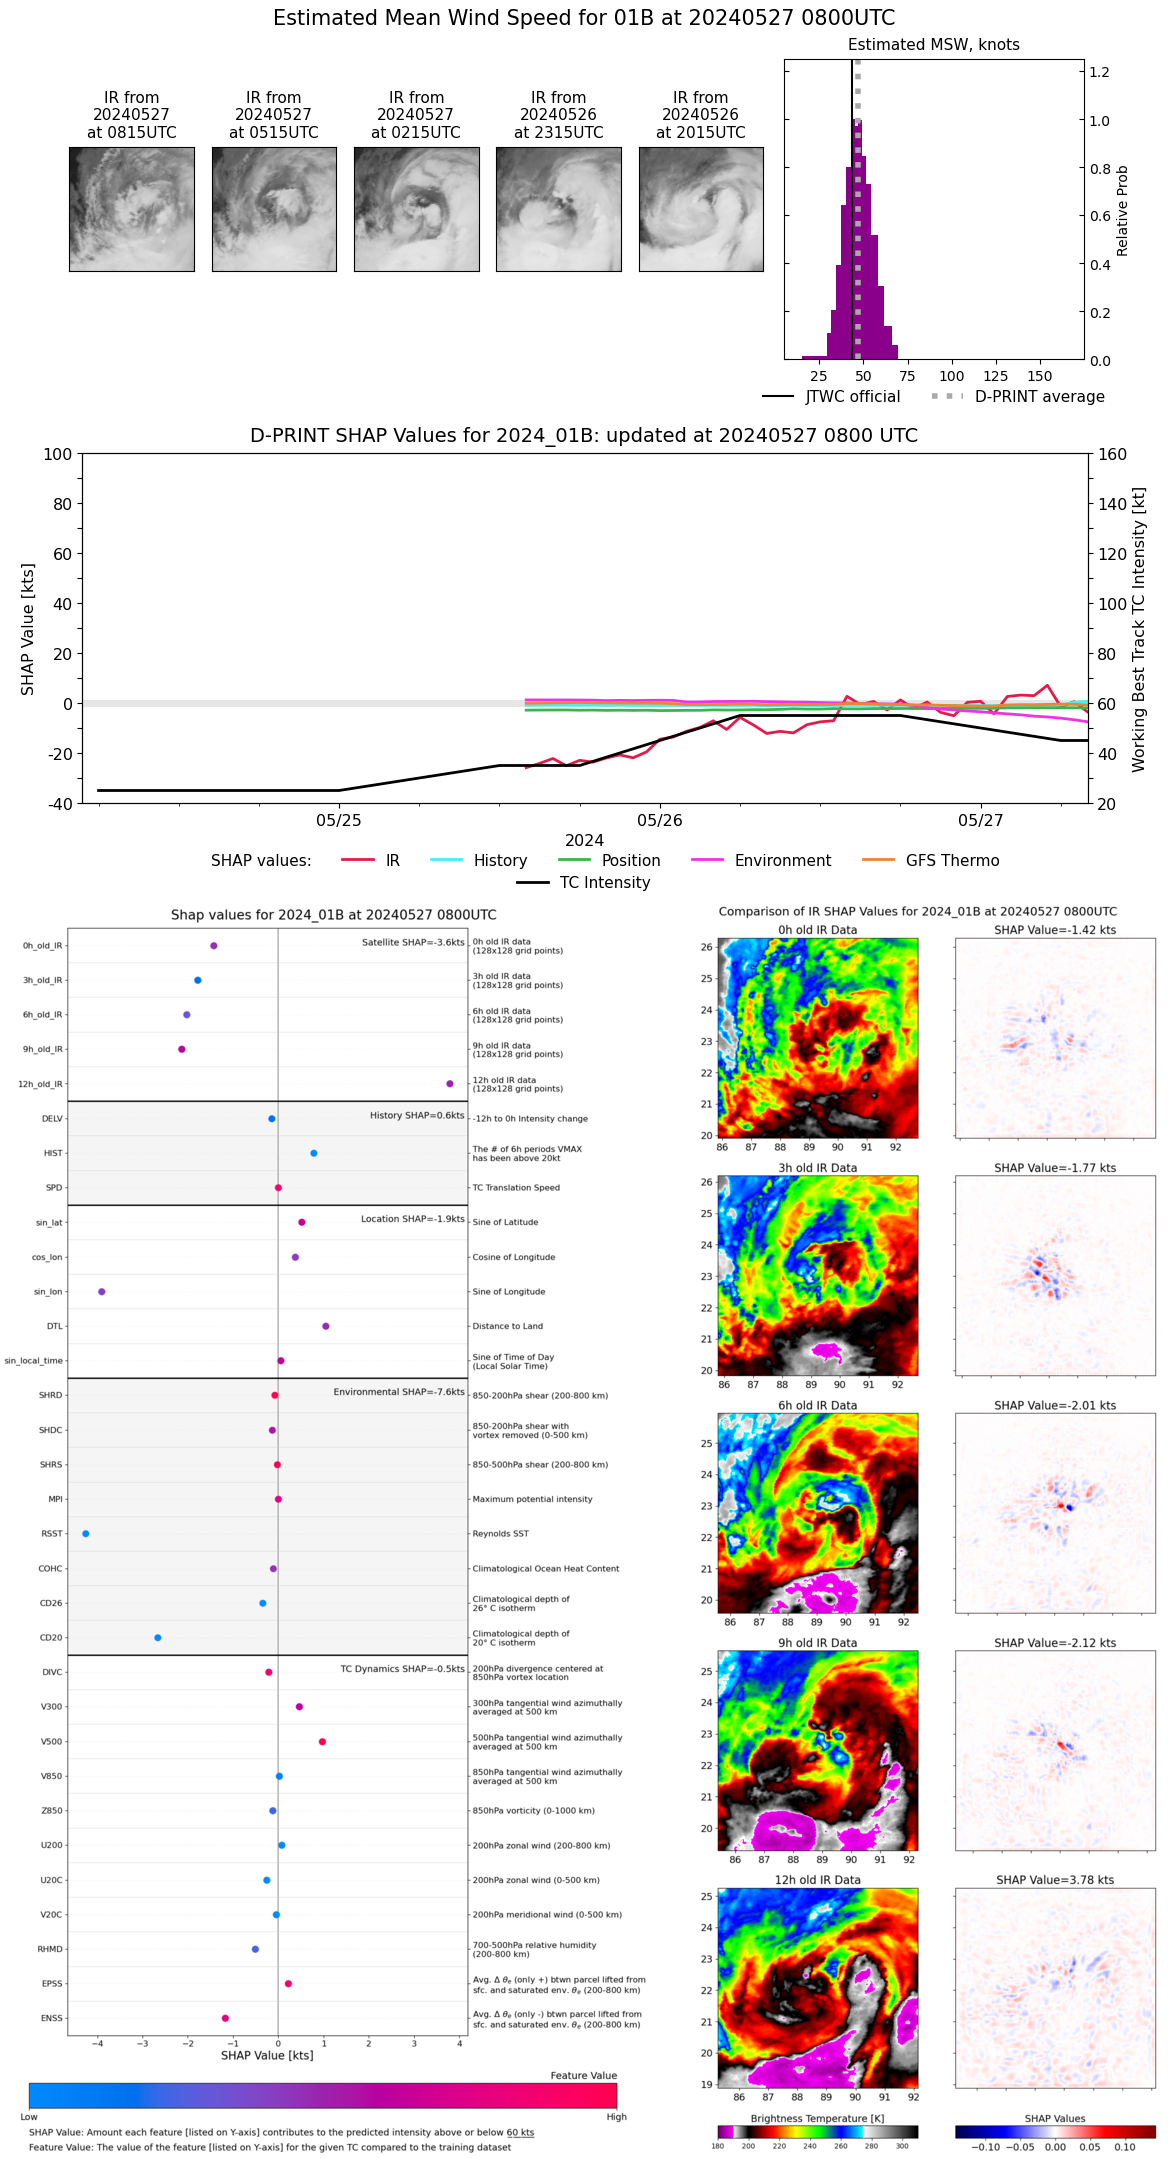 |
| 20240527 | 0700 UTC | 981 hPa | 52 kts | 46 kts | 58 kts | 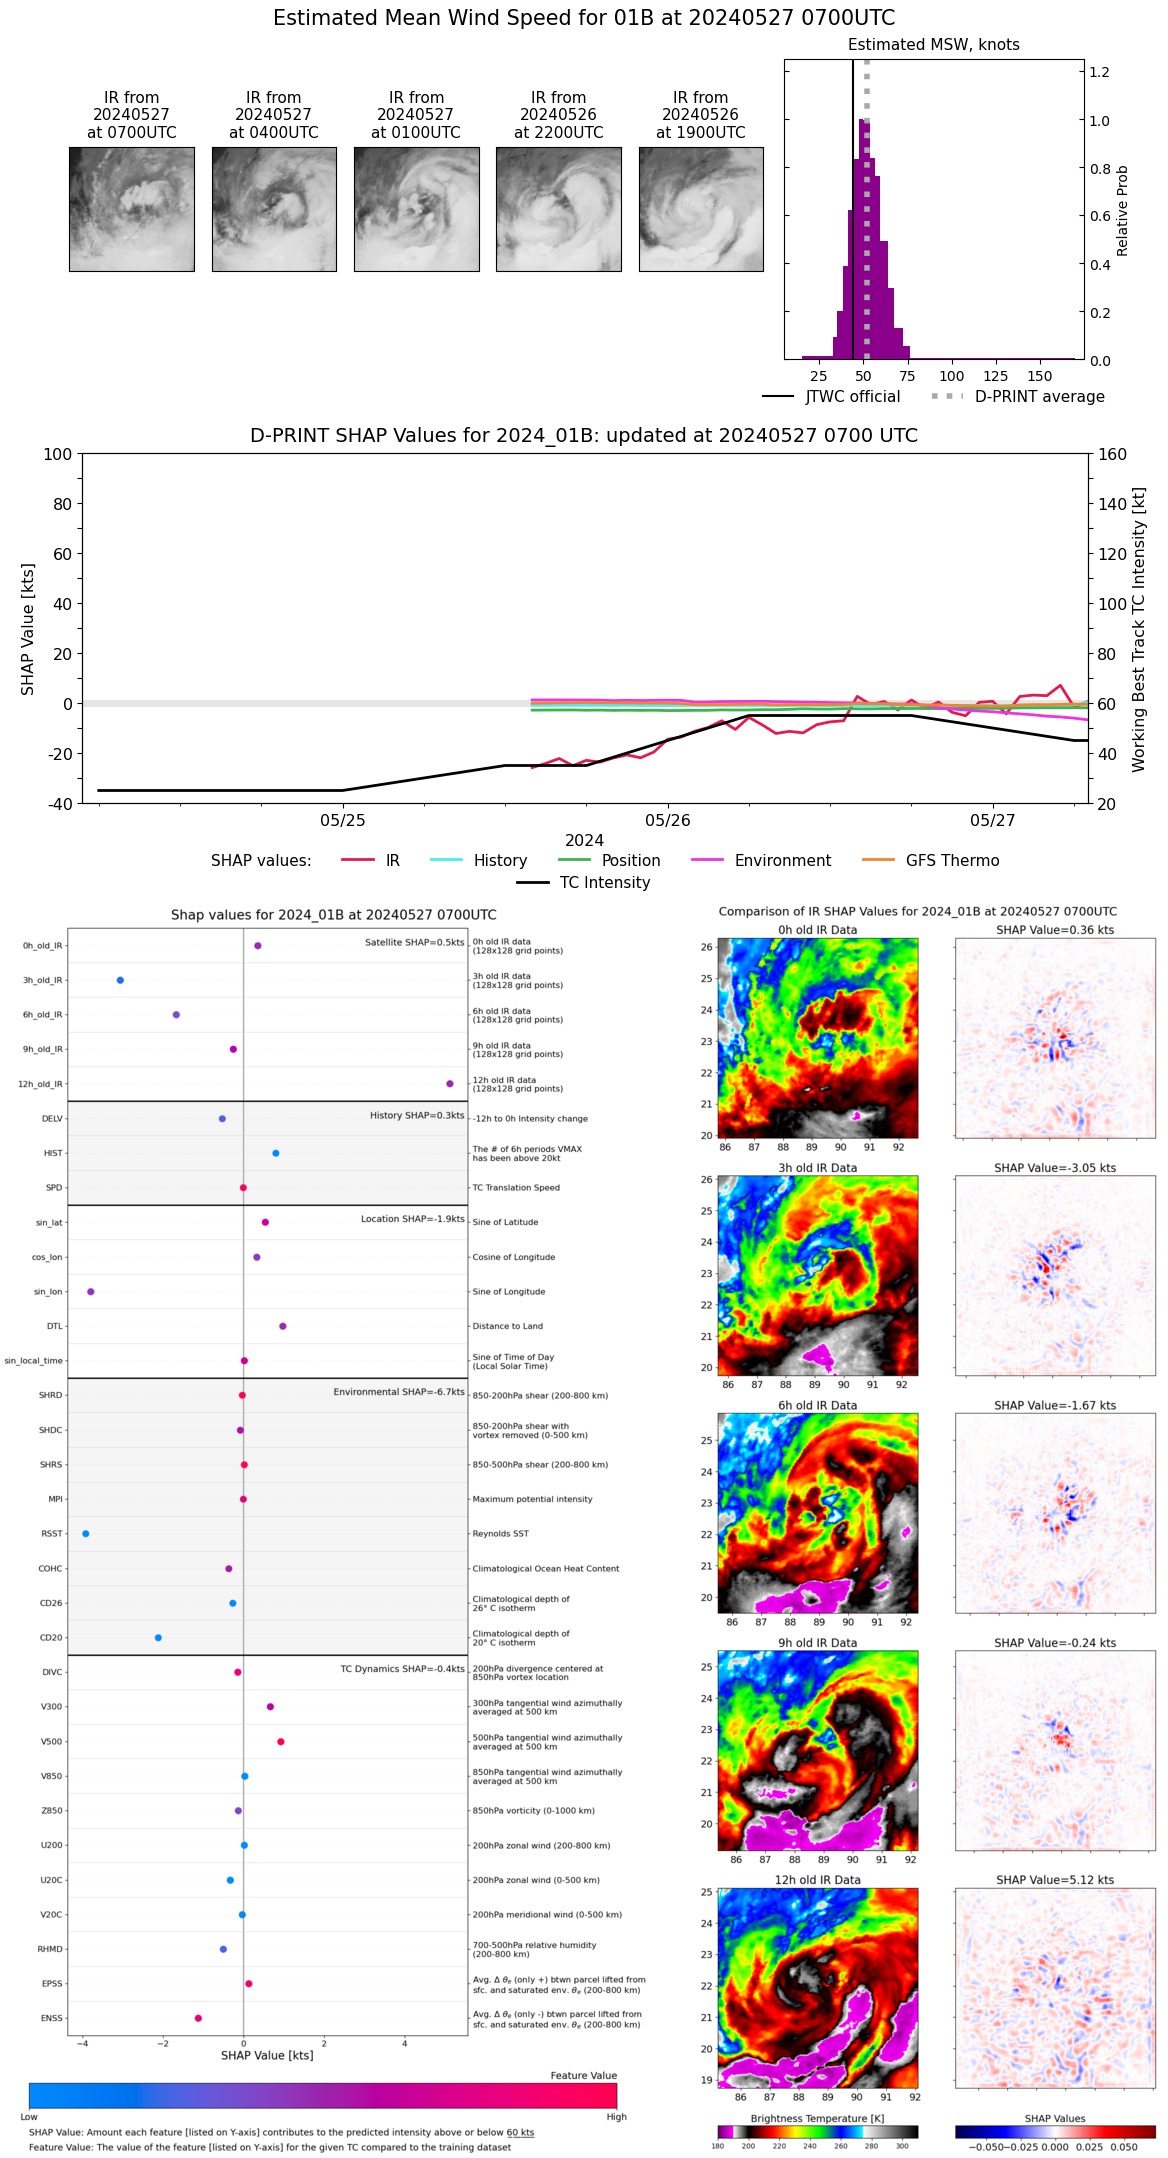 |
| 20240527 | 0600 UTC | 982 hPa | 49 kts | 44 kts | 55 kts | 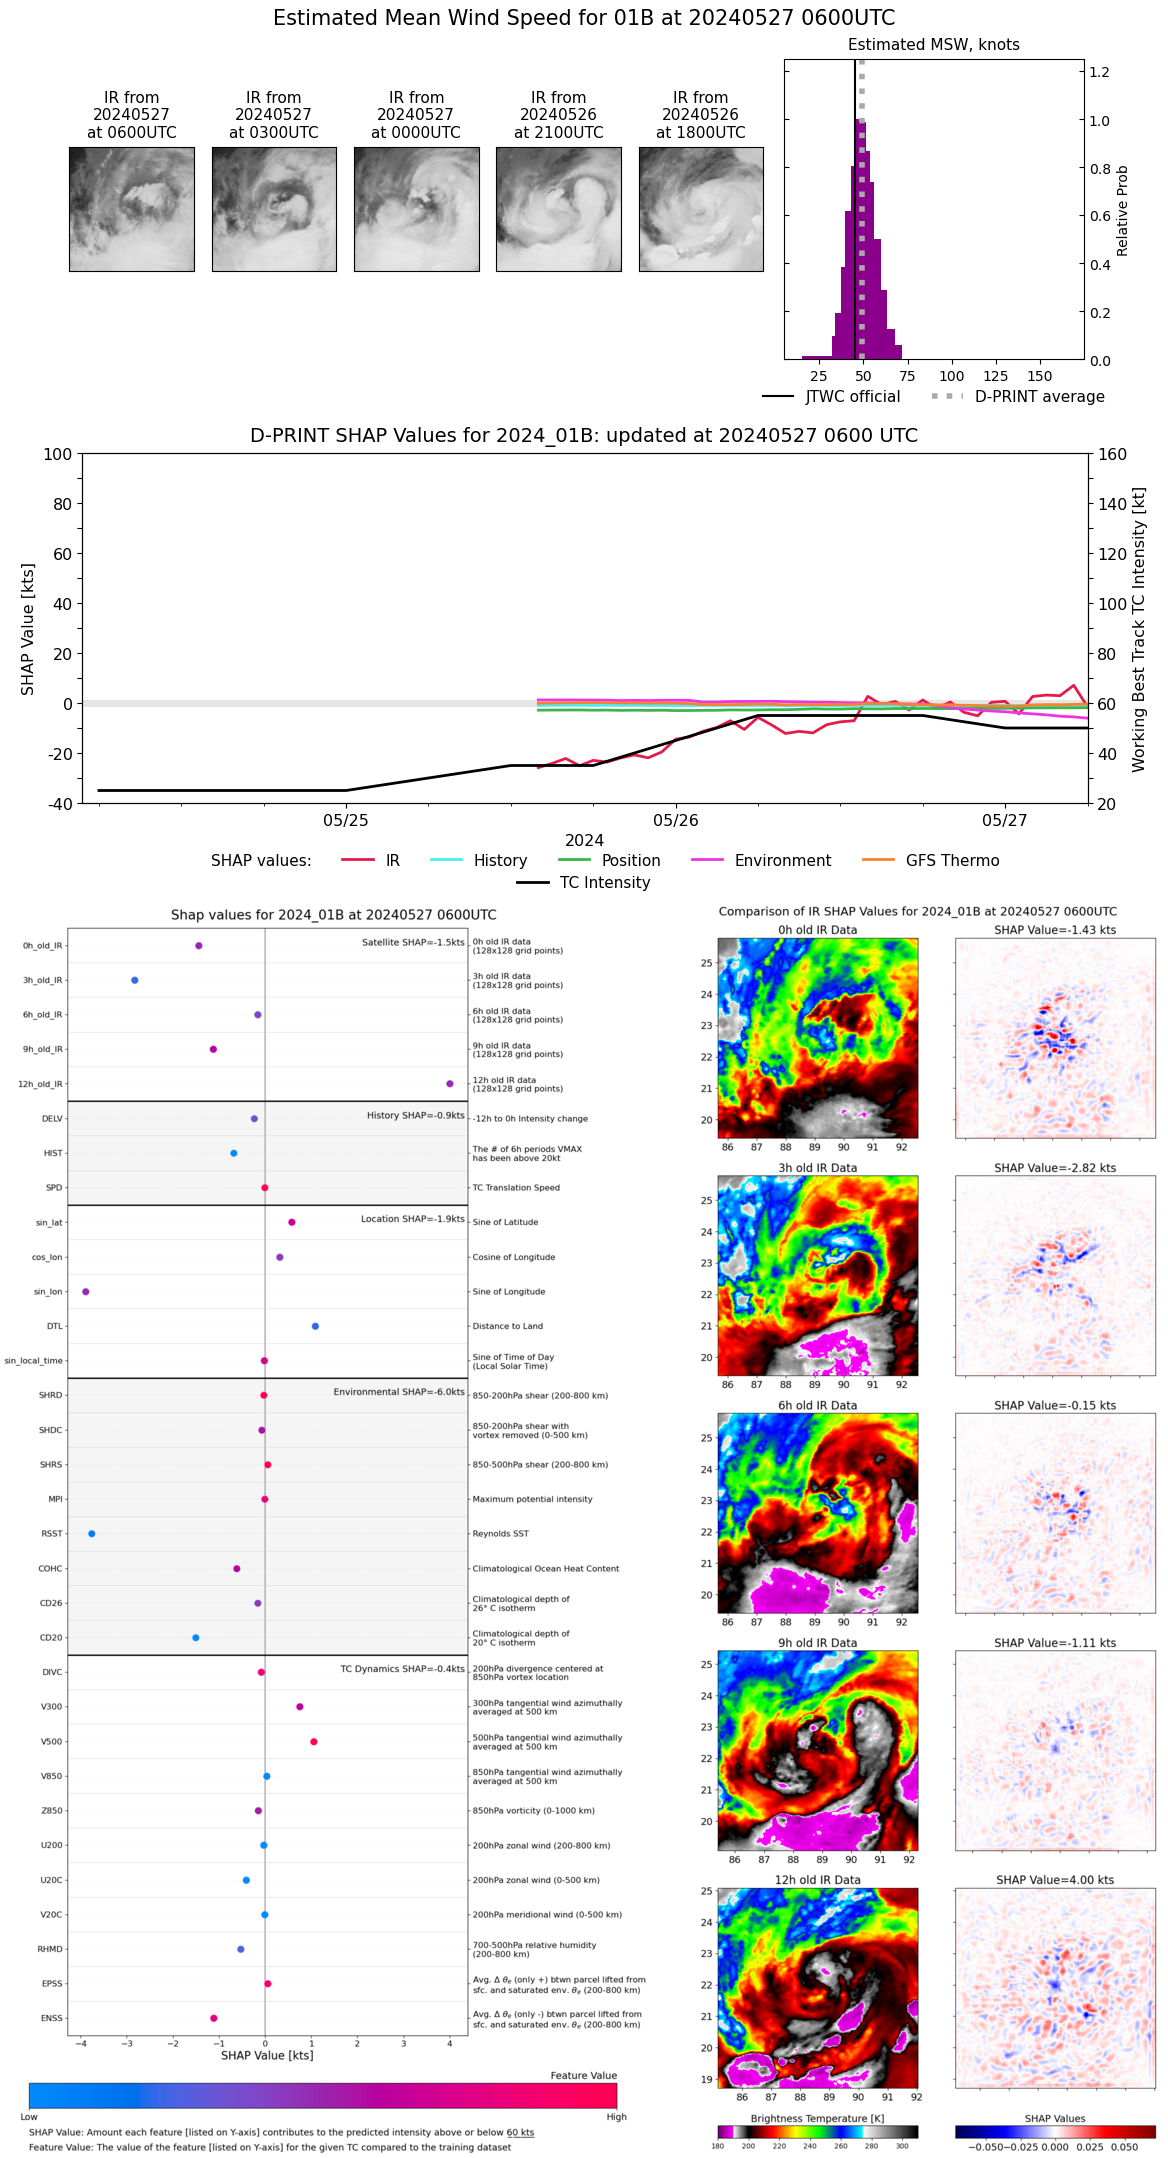 |
| 20240527 | 0500 UTC | 982 hPa | 58 kts | 53 kts | 64 kts | 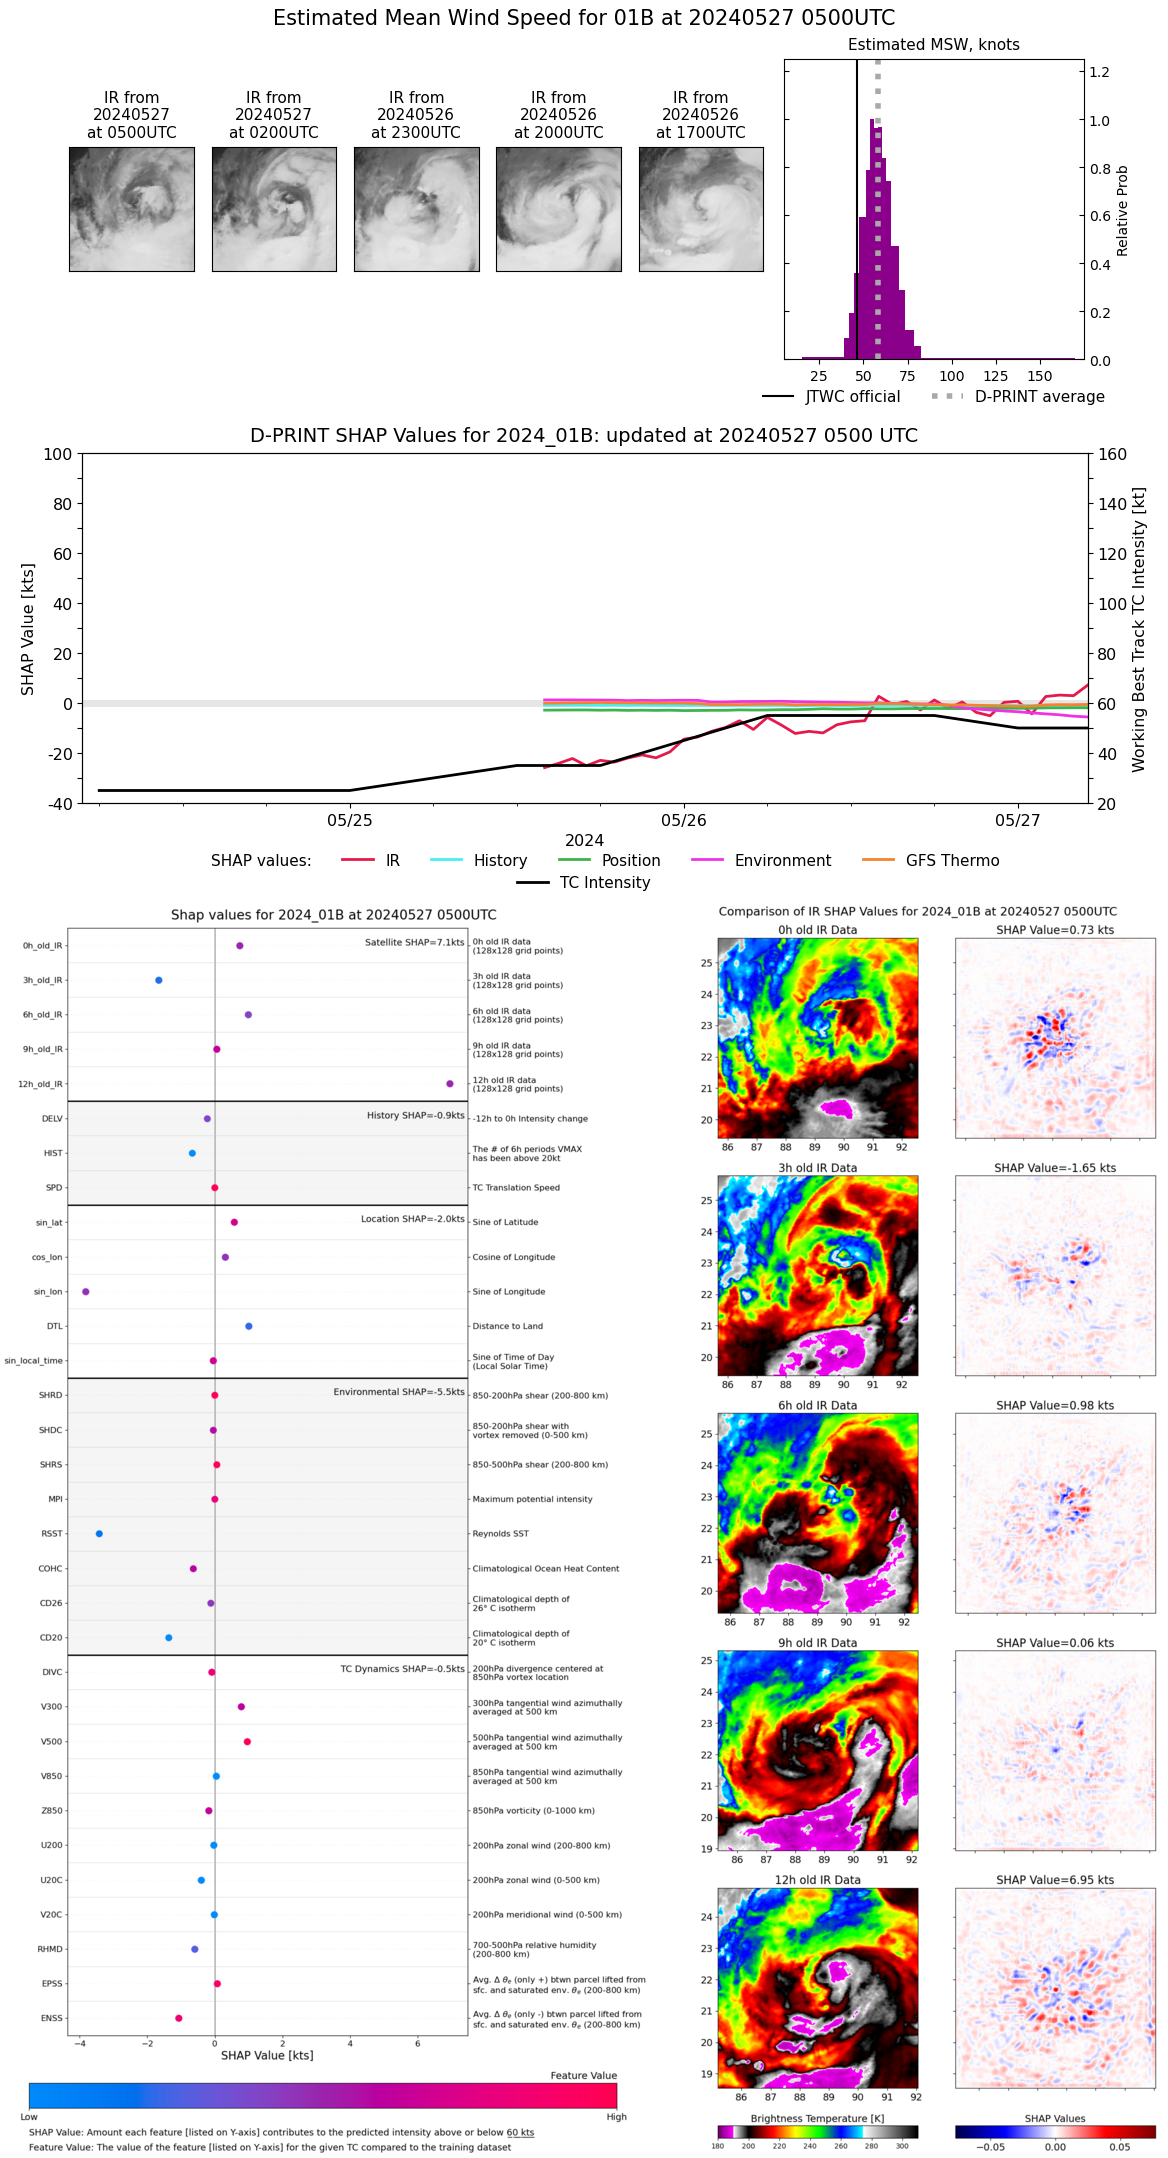 |
| 20240527 | 0400 UTC | 986 hPa | 54 kts | 49 kts | 60 kts | 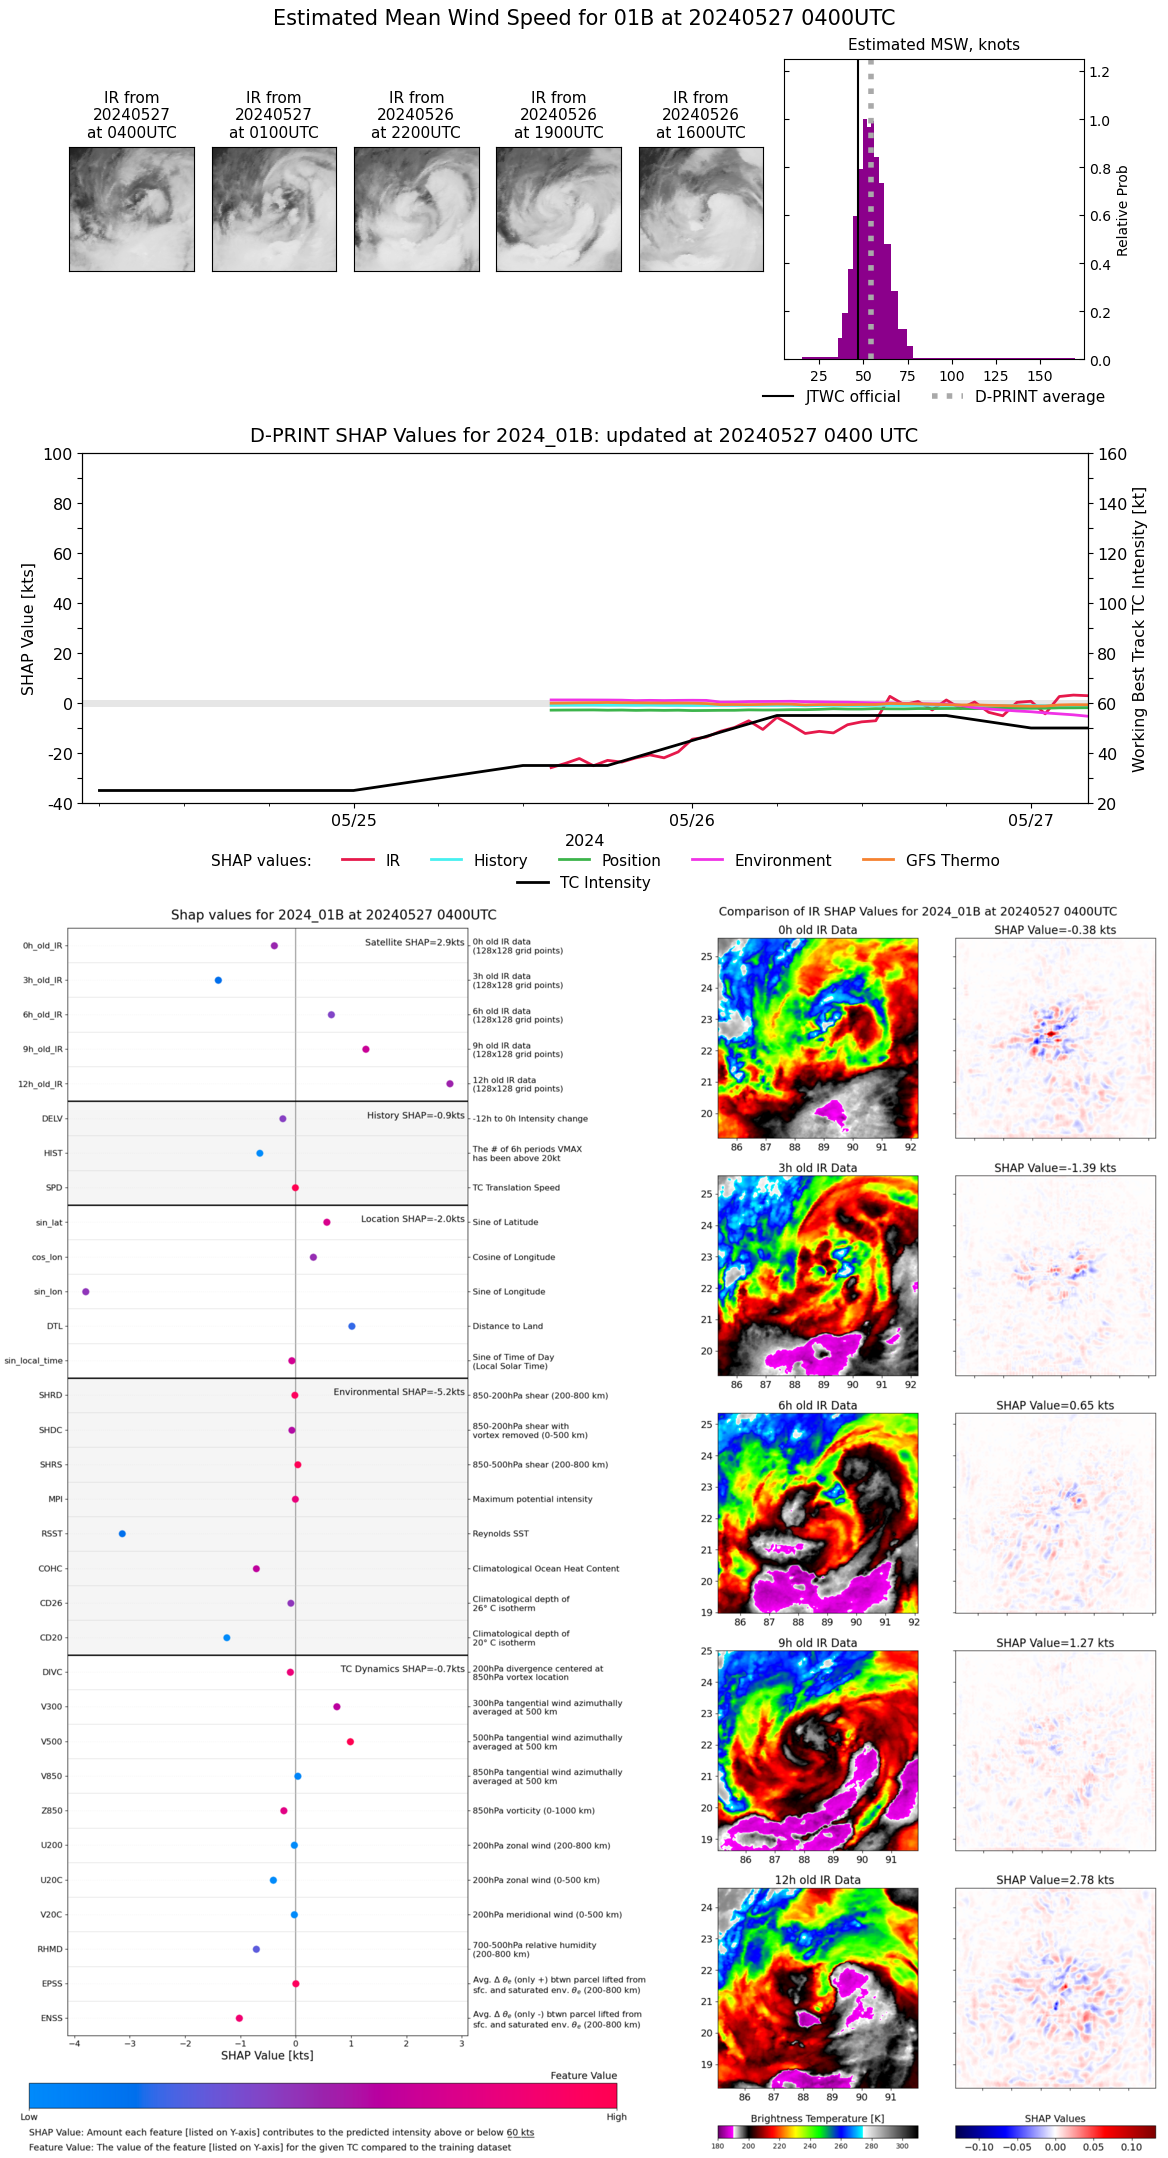 |
| 20240527 | 0300 UTC | 988 hPa | 55 kts | 50 kts | 61 kts | 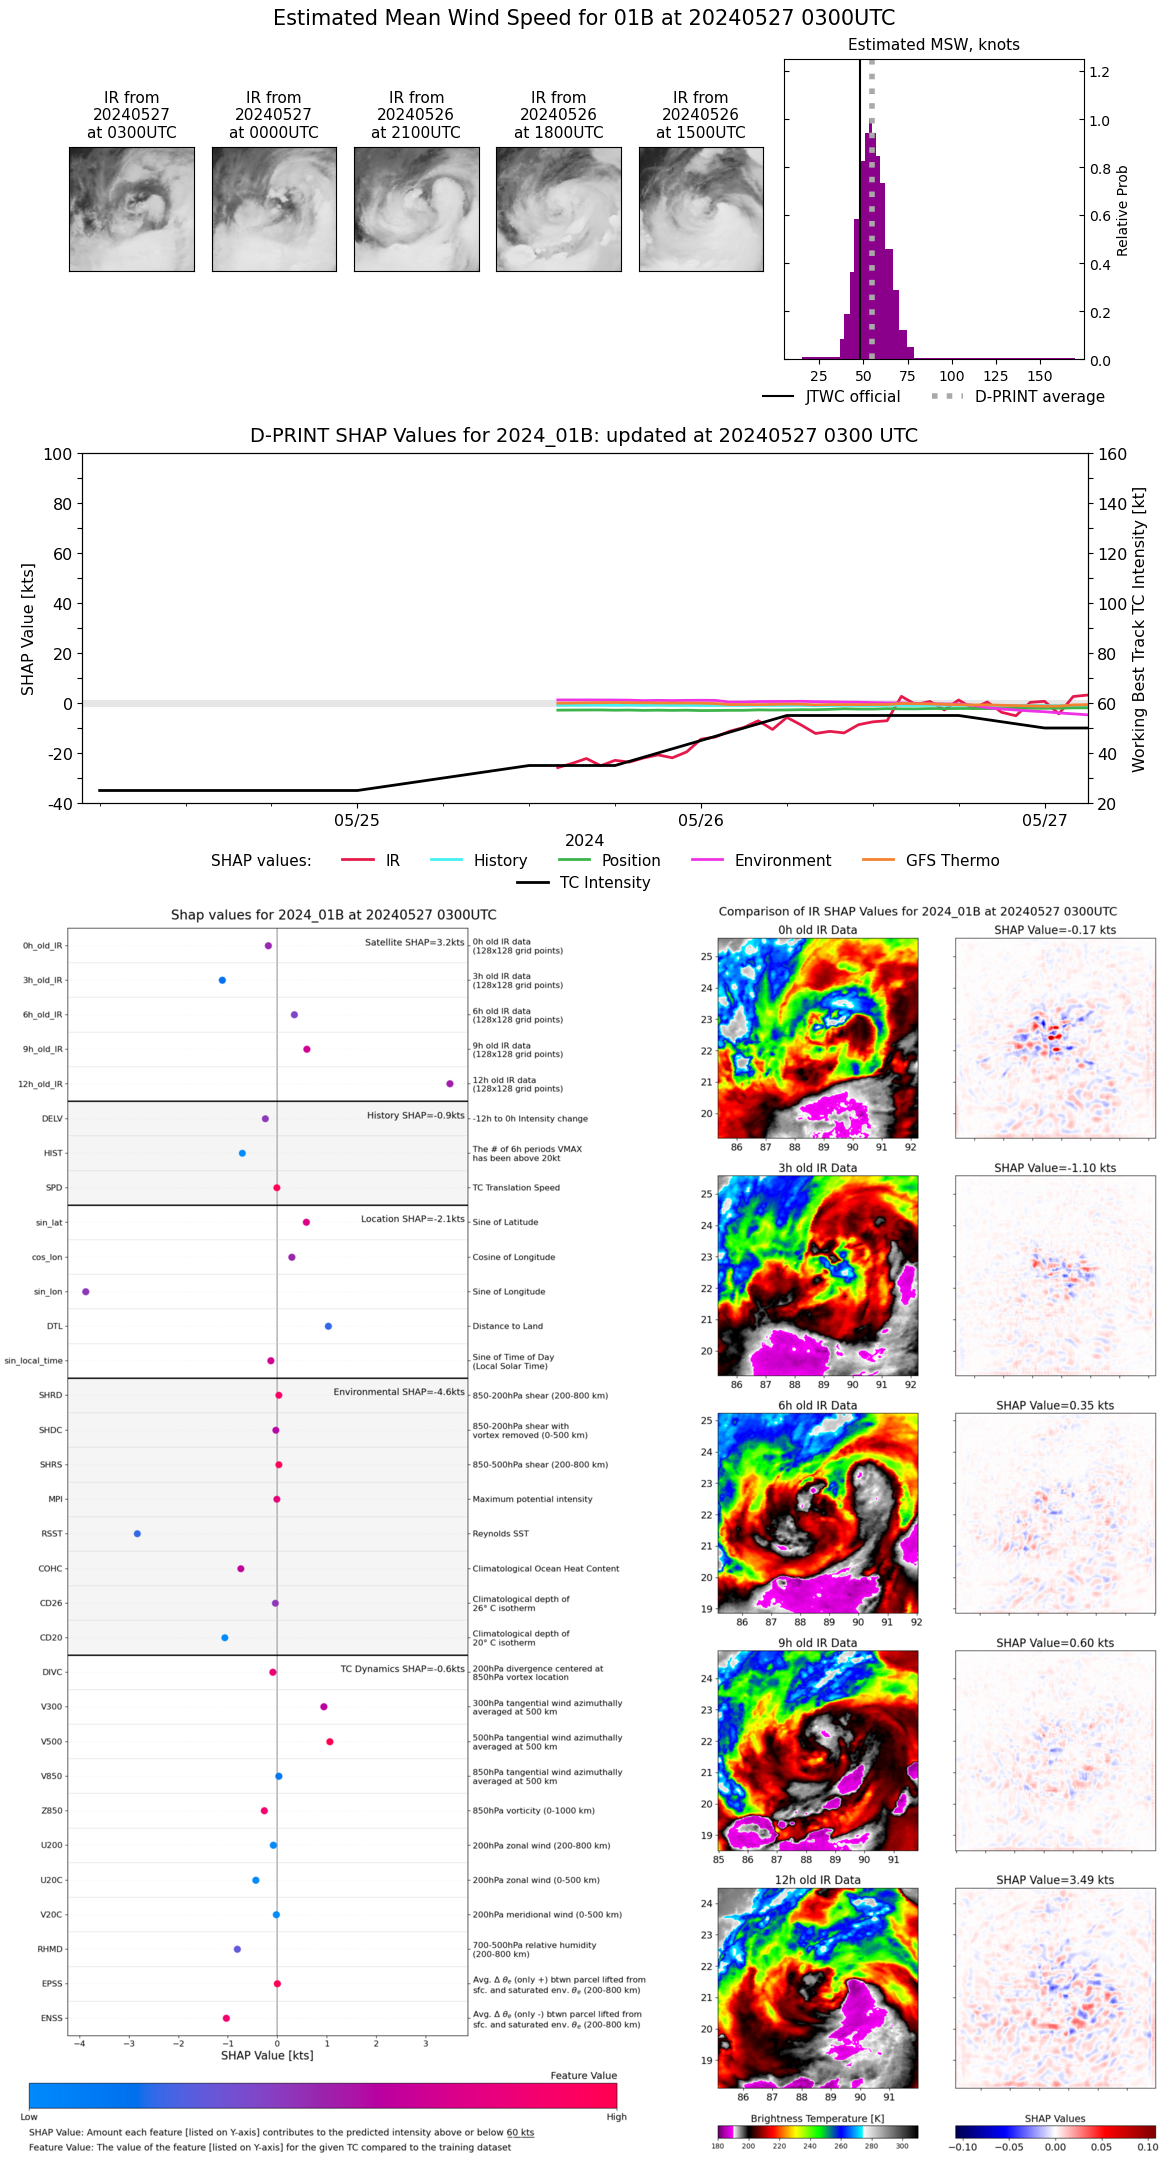 |
| 20240527 | 0200 UTC | 983 hPa | 55 kts | 49 kts | 60 kts | 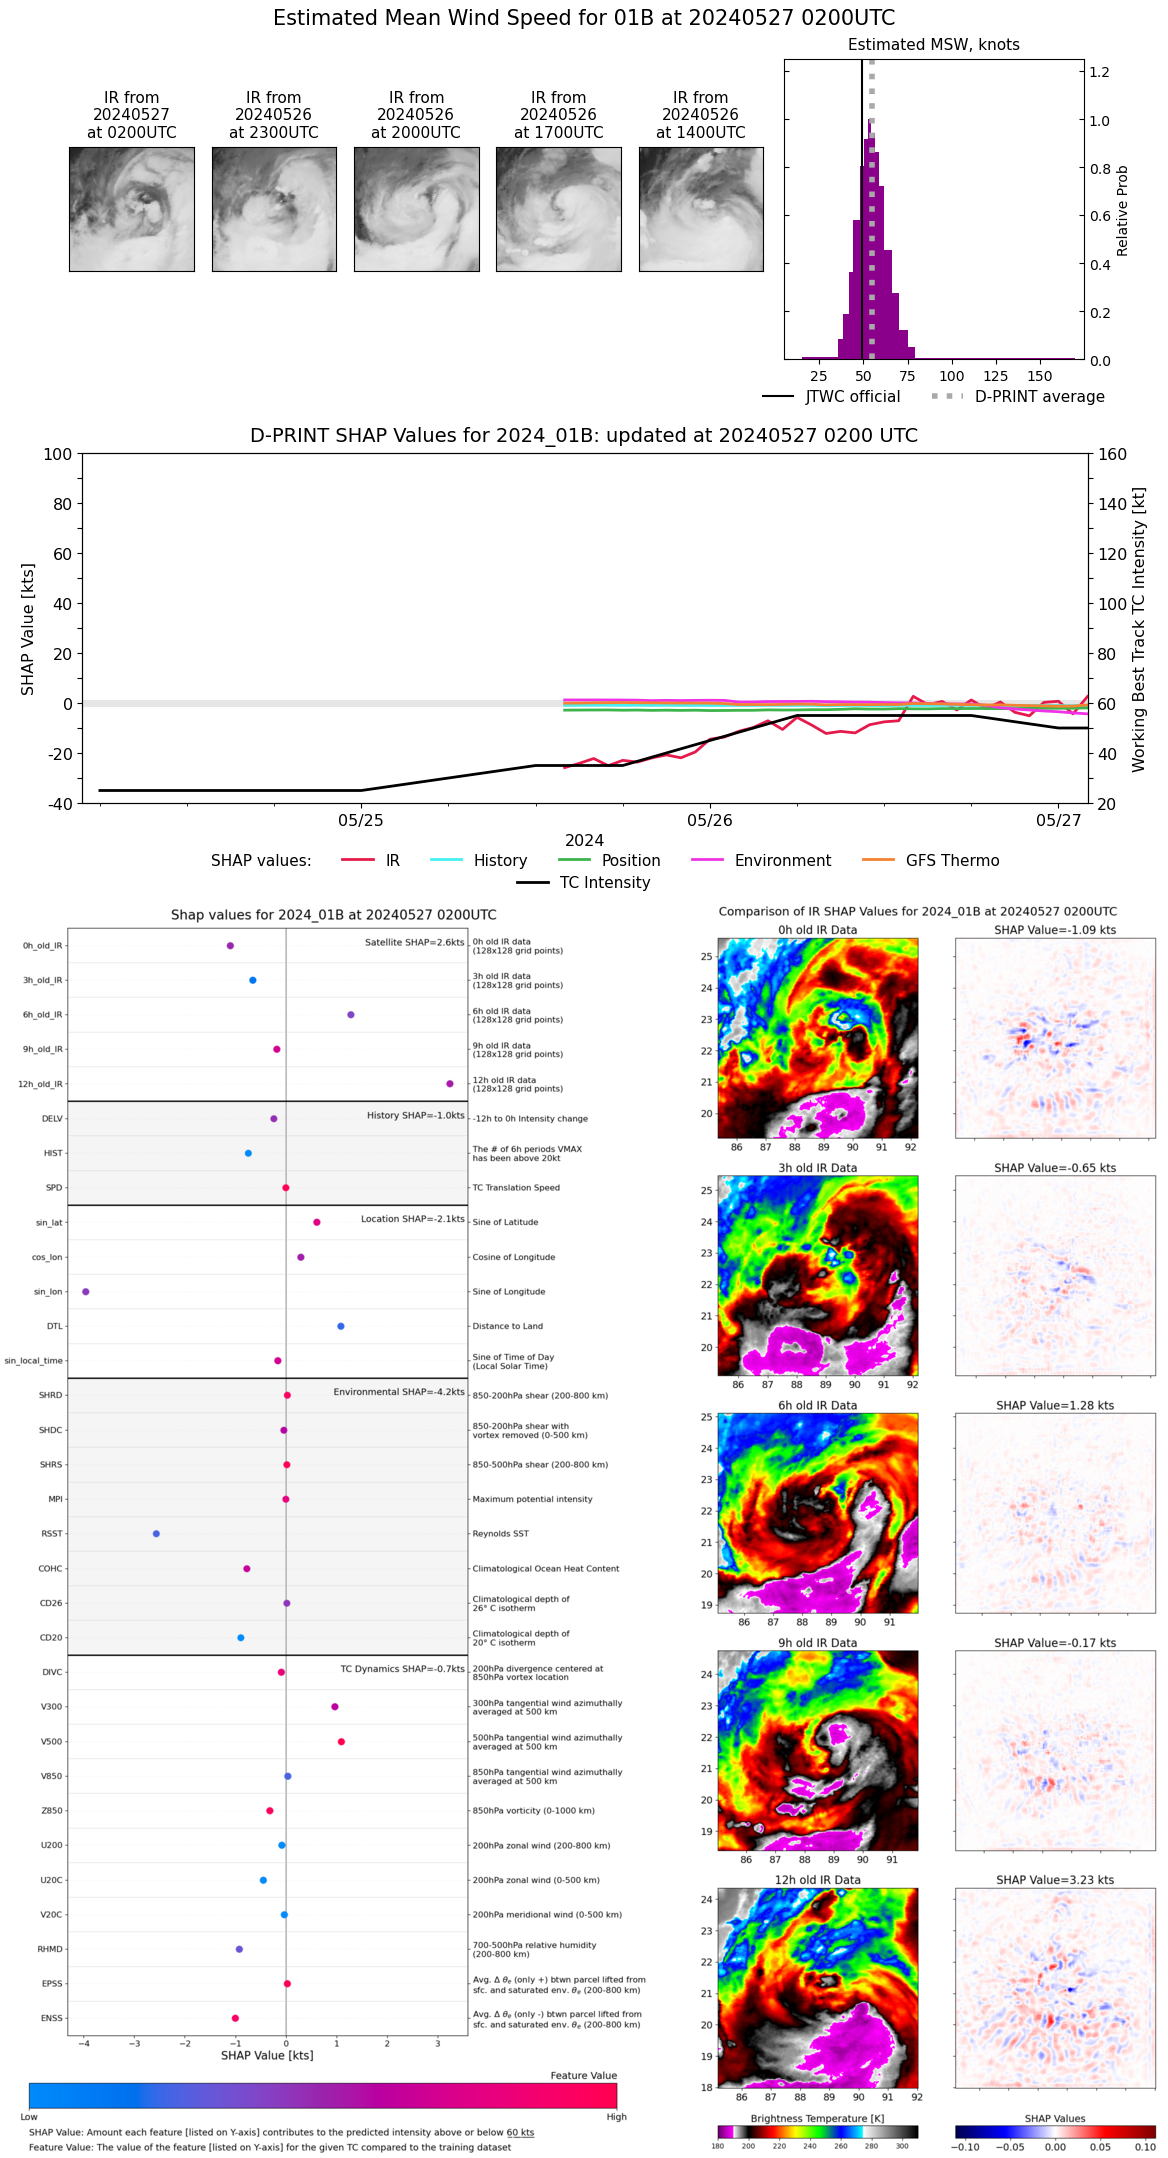 |
| 20240527 | 0100 UTC | 984 hPa | 47 kts | 42 kts | 53 kts | 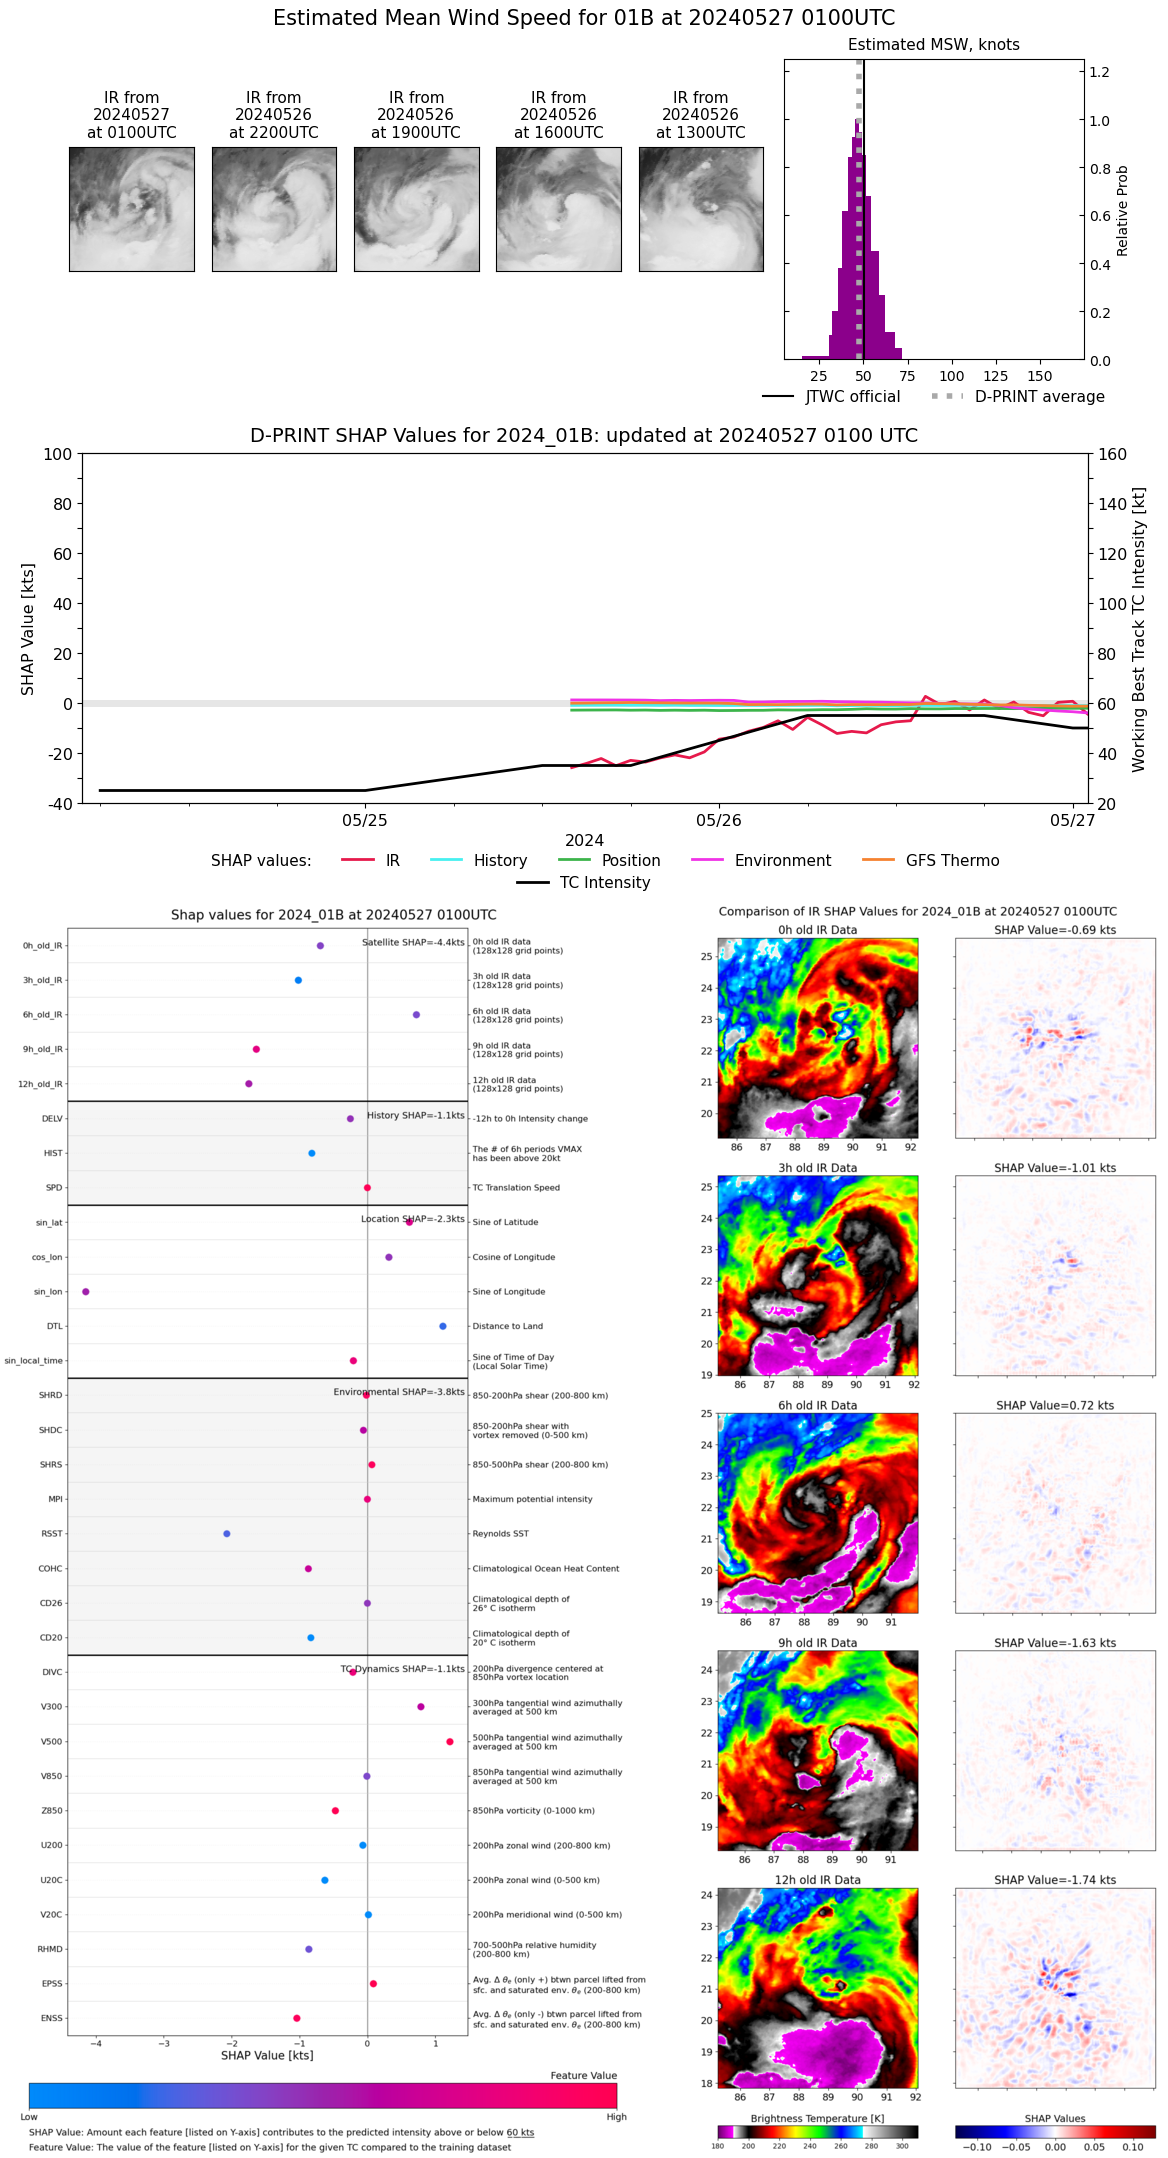 |
| 20240527 | 0000 UTC | 983 hPa | 53 kts | 47 kts | 59 kts | 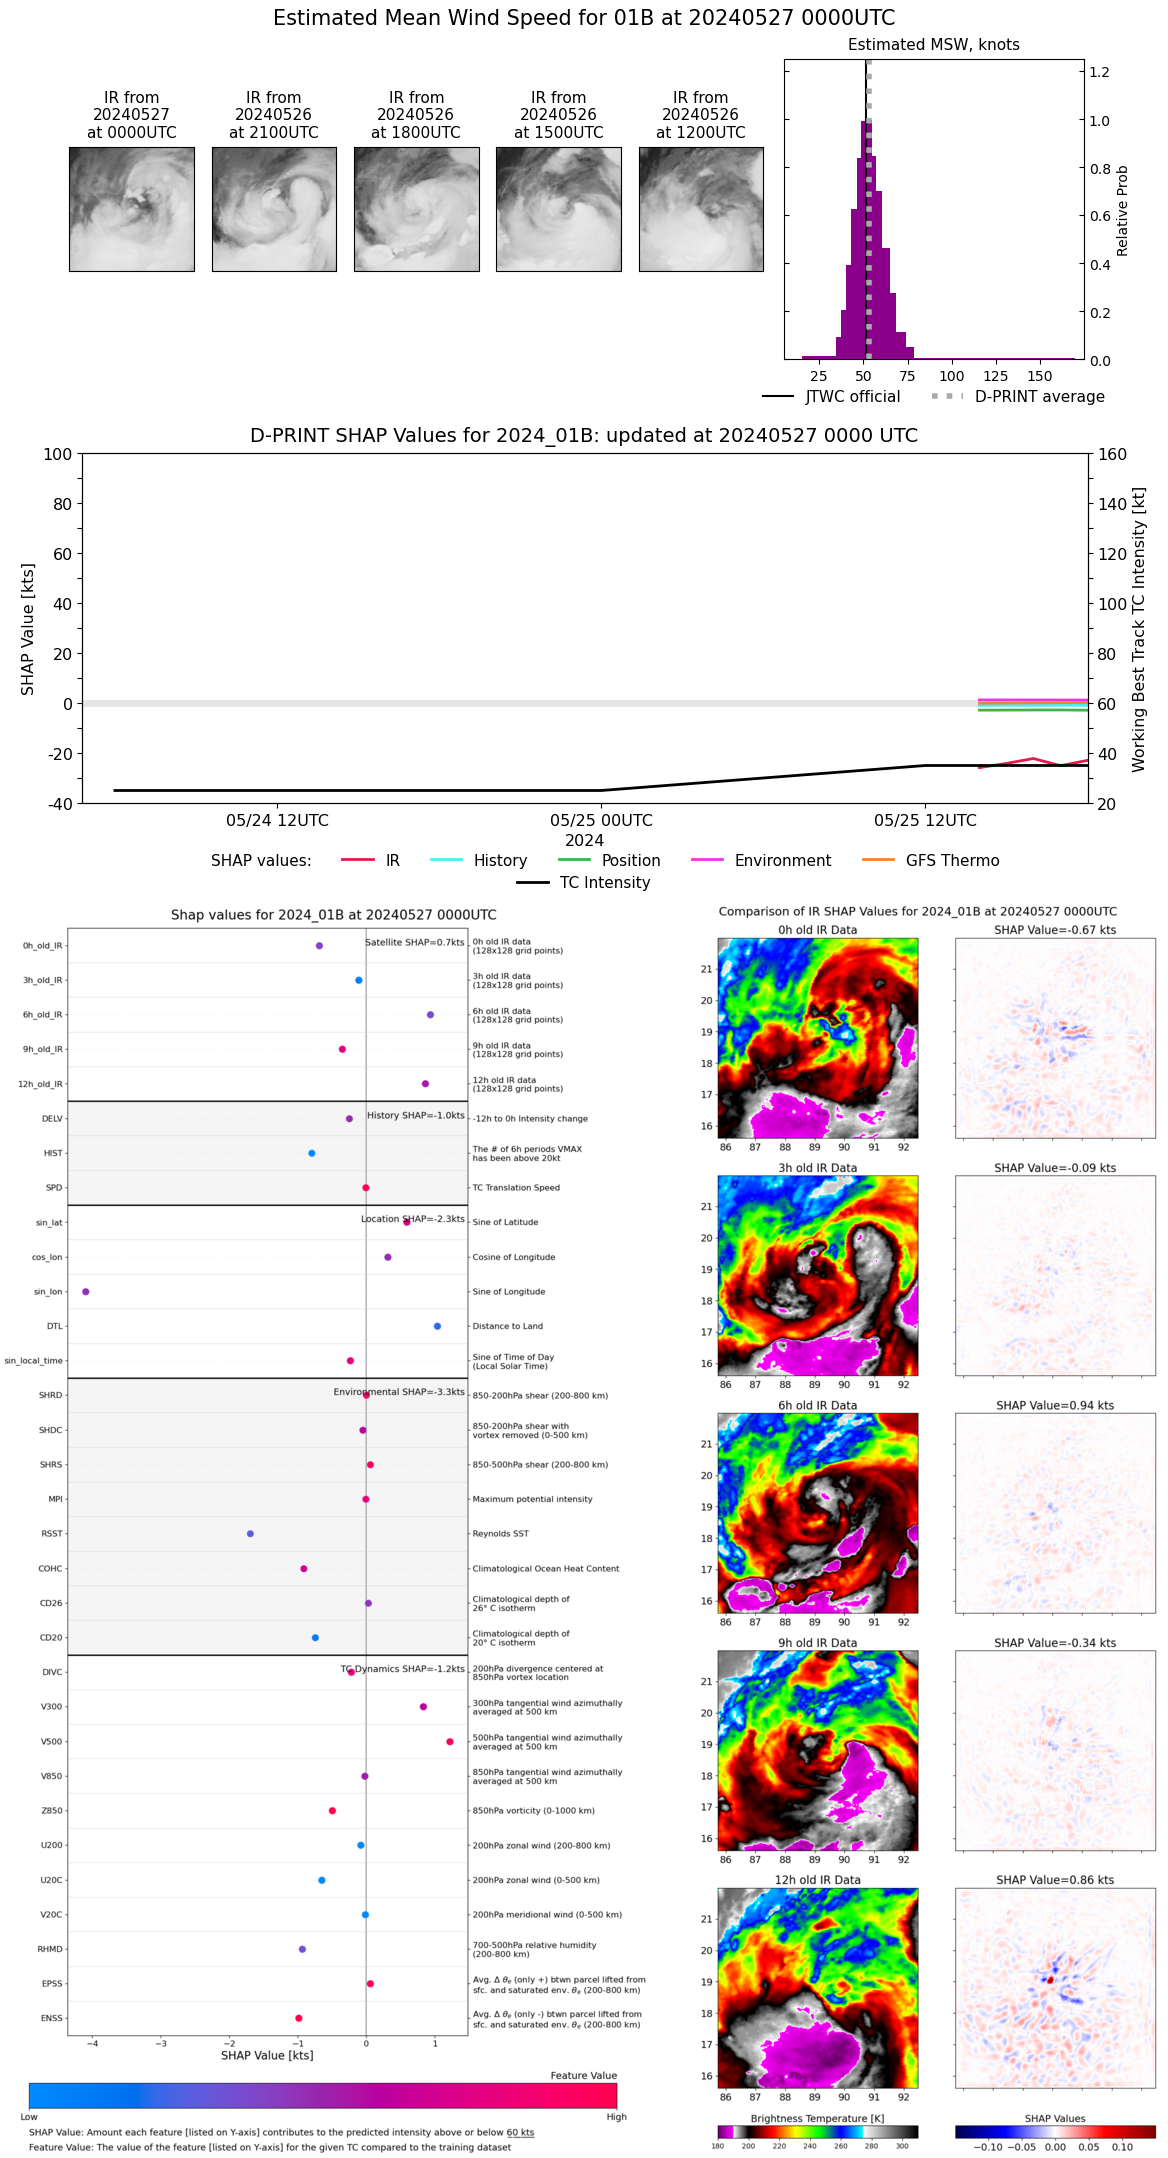 |
| 20240526 | 2300 UTC | 982 hPa | 53 kts | 47 kts | 59 kts | 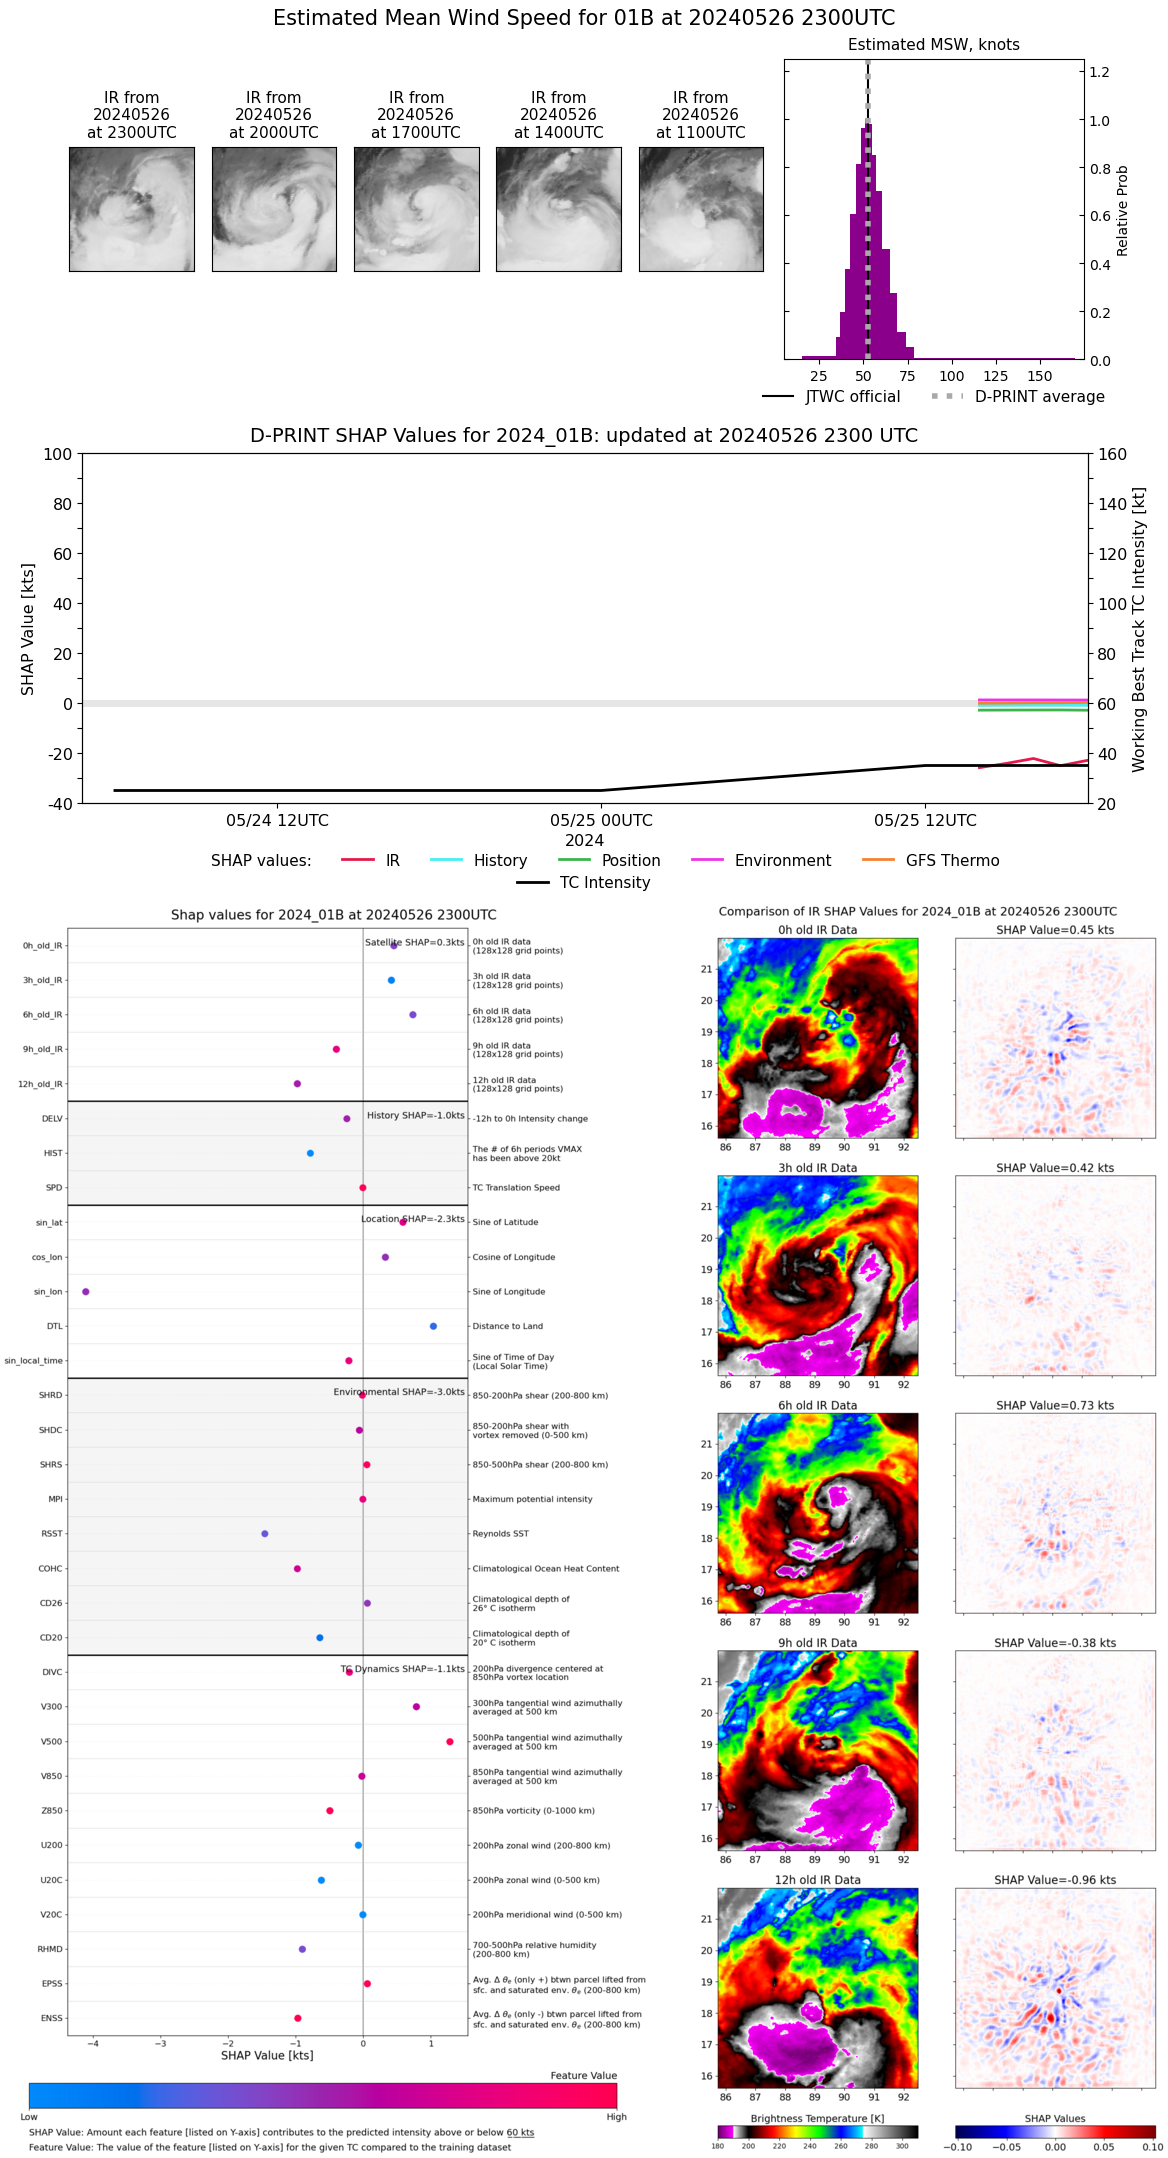 |
| 20240526 | 2200 UTC | 985 hPa | 48 kts | 42 kts | 54 kts | 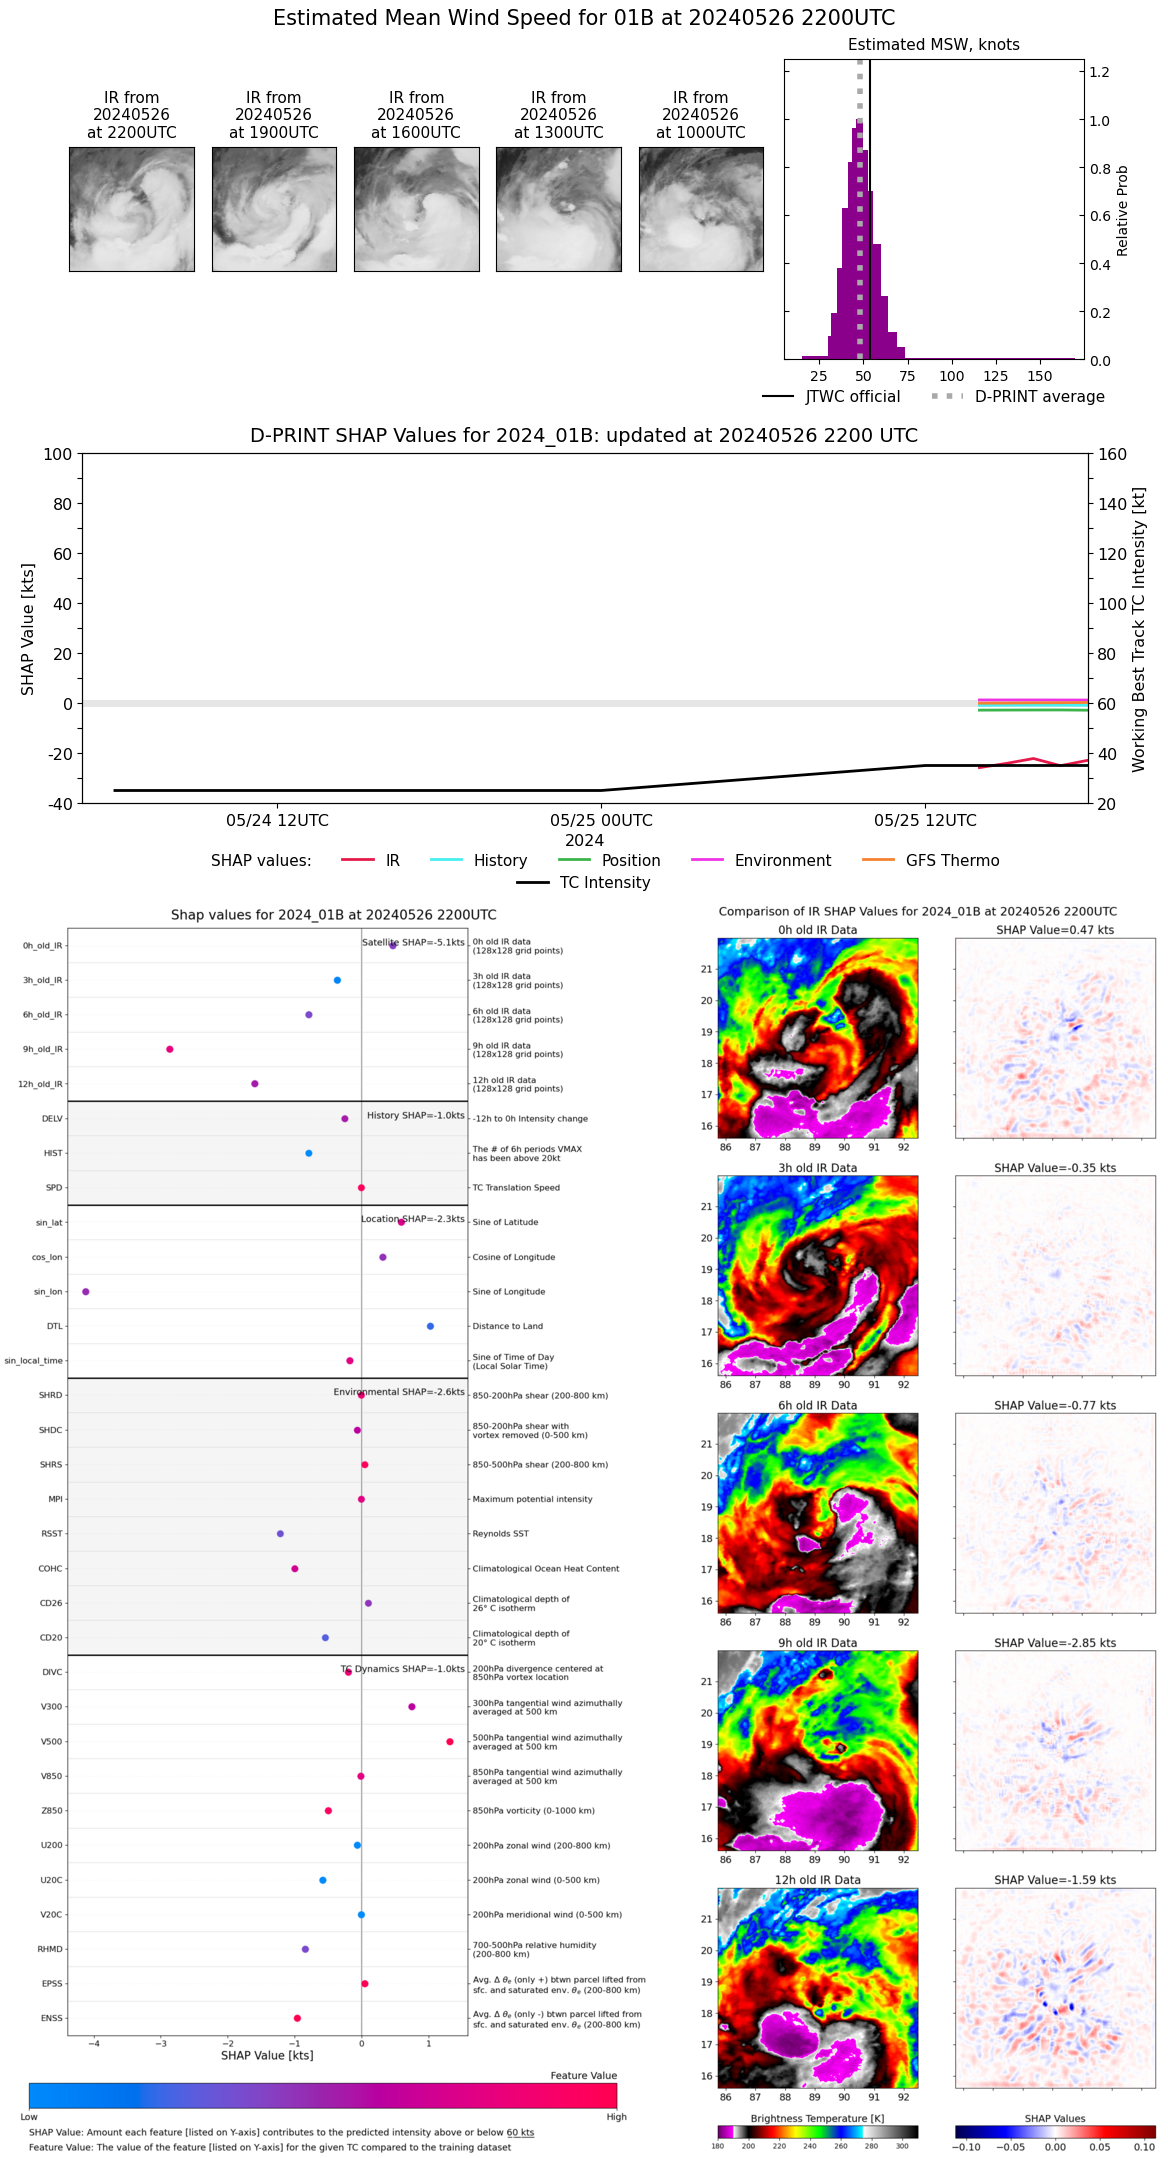 |
| 20240526 | 2100 UTC | 985 hPa | 50 kts | 44 kts | 56 kts | 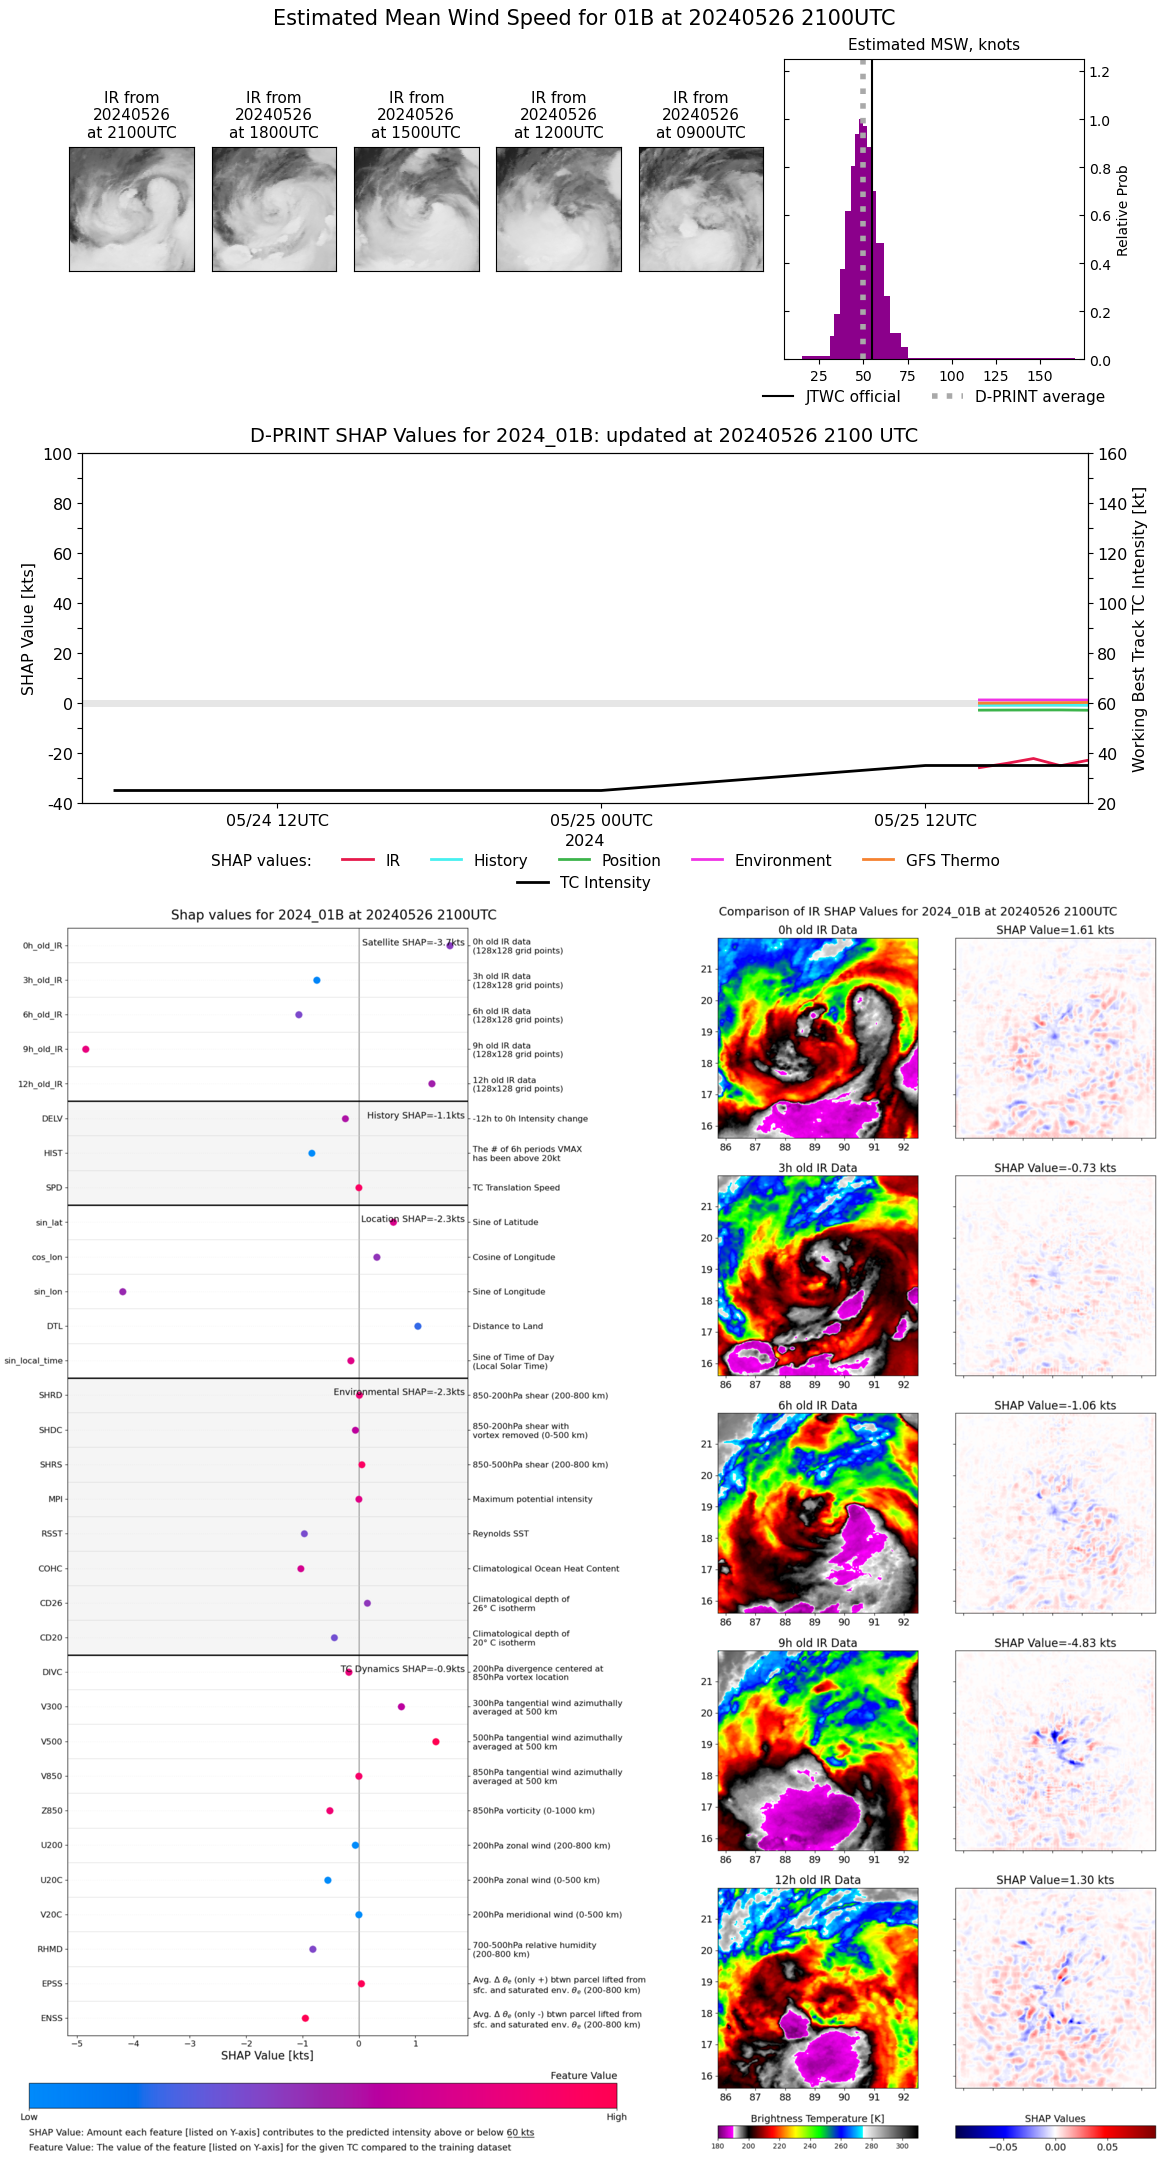 |
| 20240526 | 2000 UTC | 982 hPa | 55 kts | 49 kts | 61 kts | 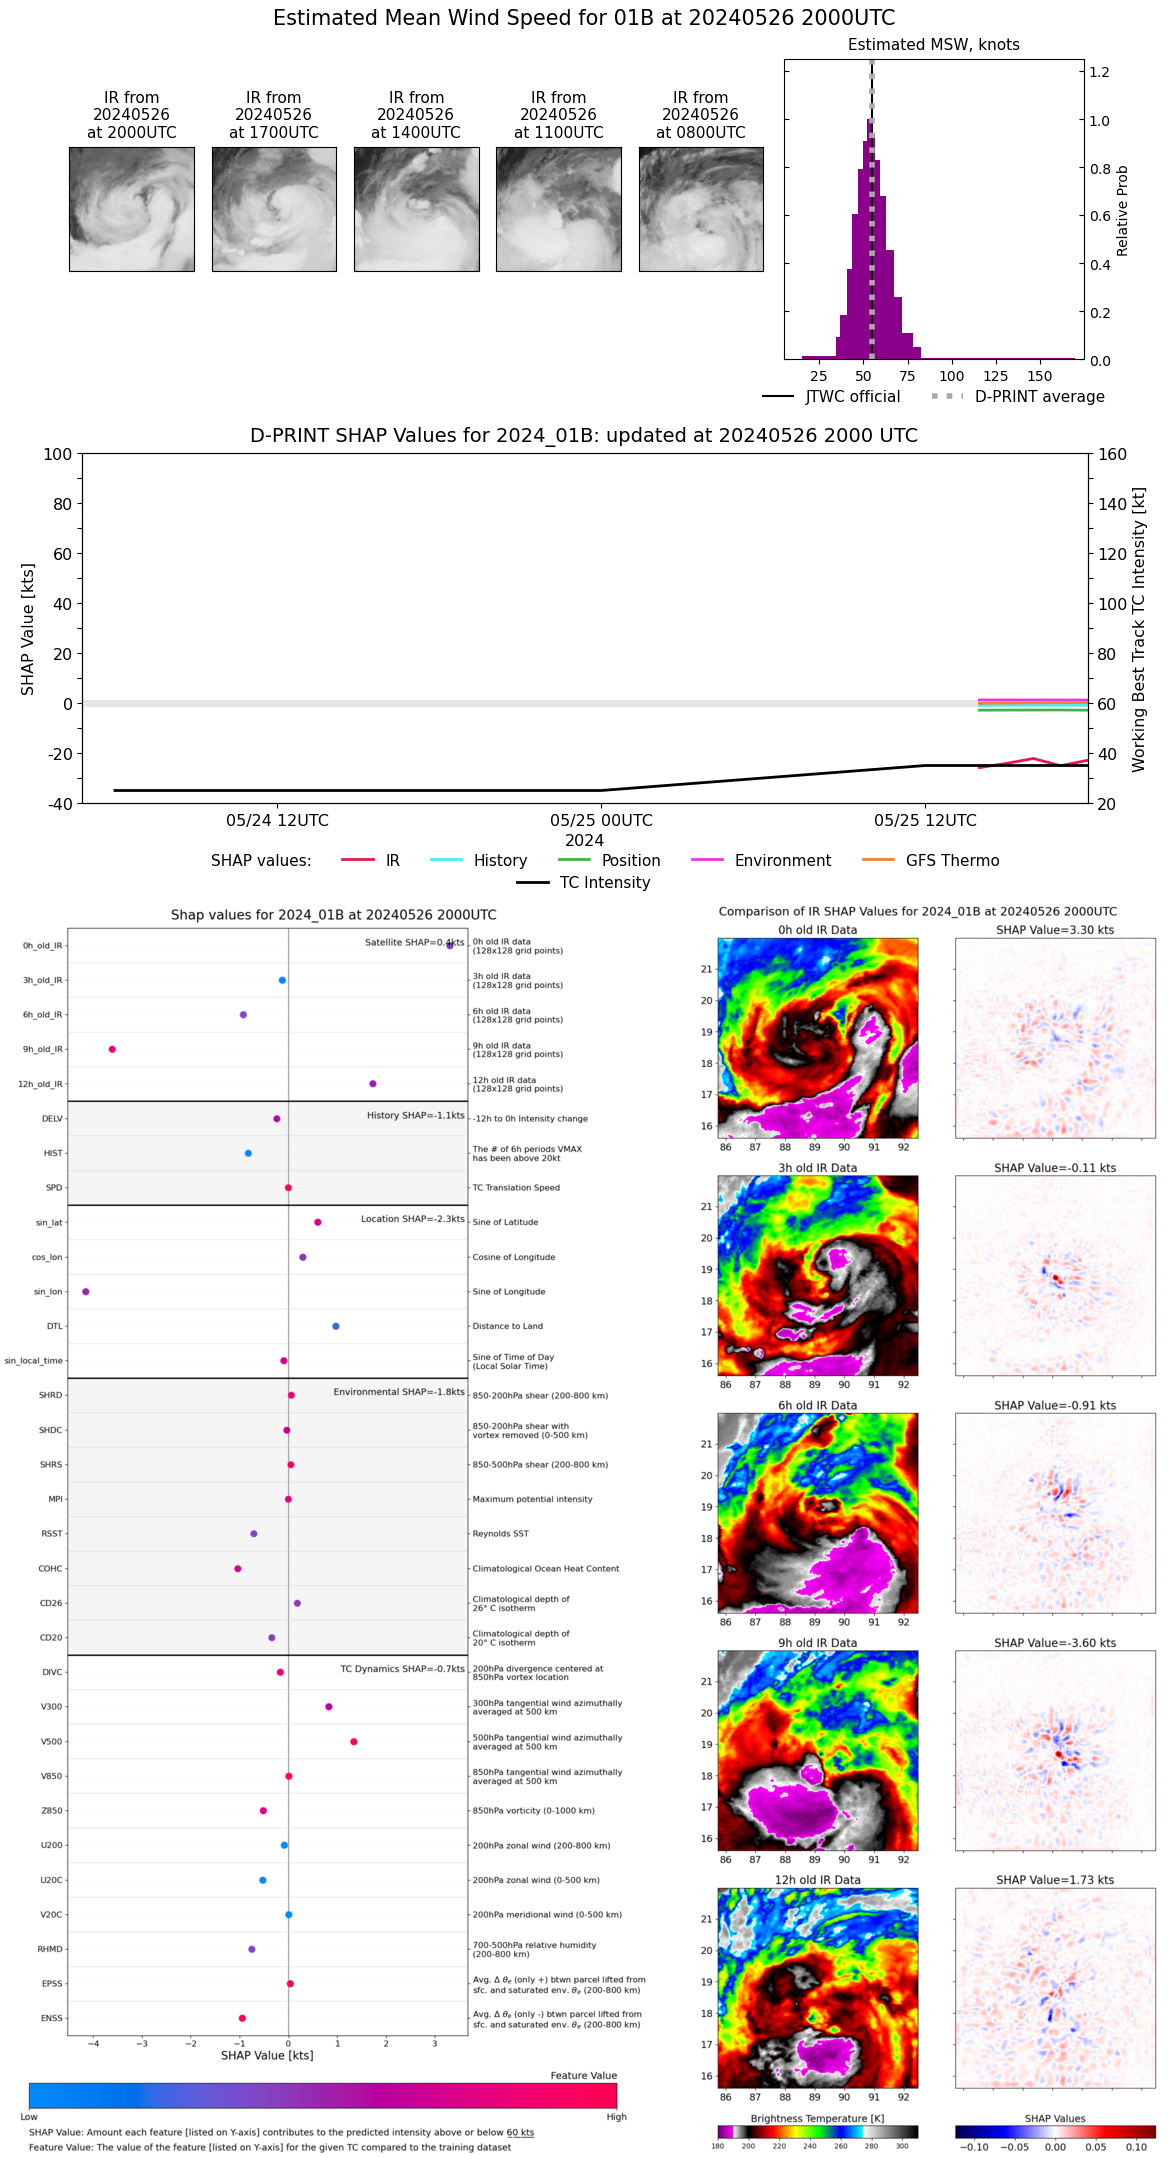 |
| 20240526 | 1900 UTC | 978 hPa | 53 kts | 48 kts | 59 kts | 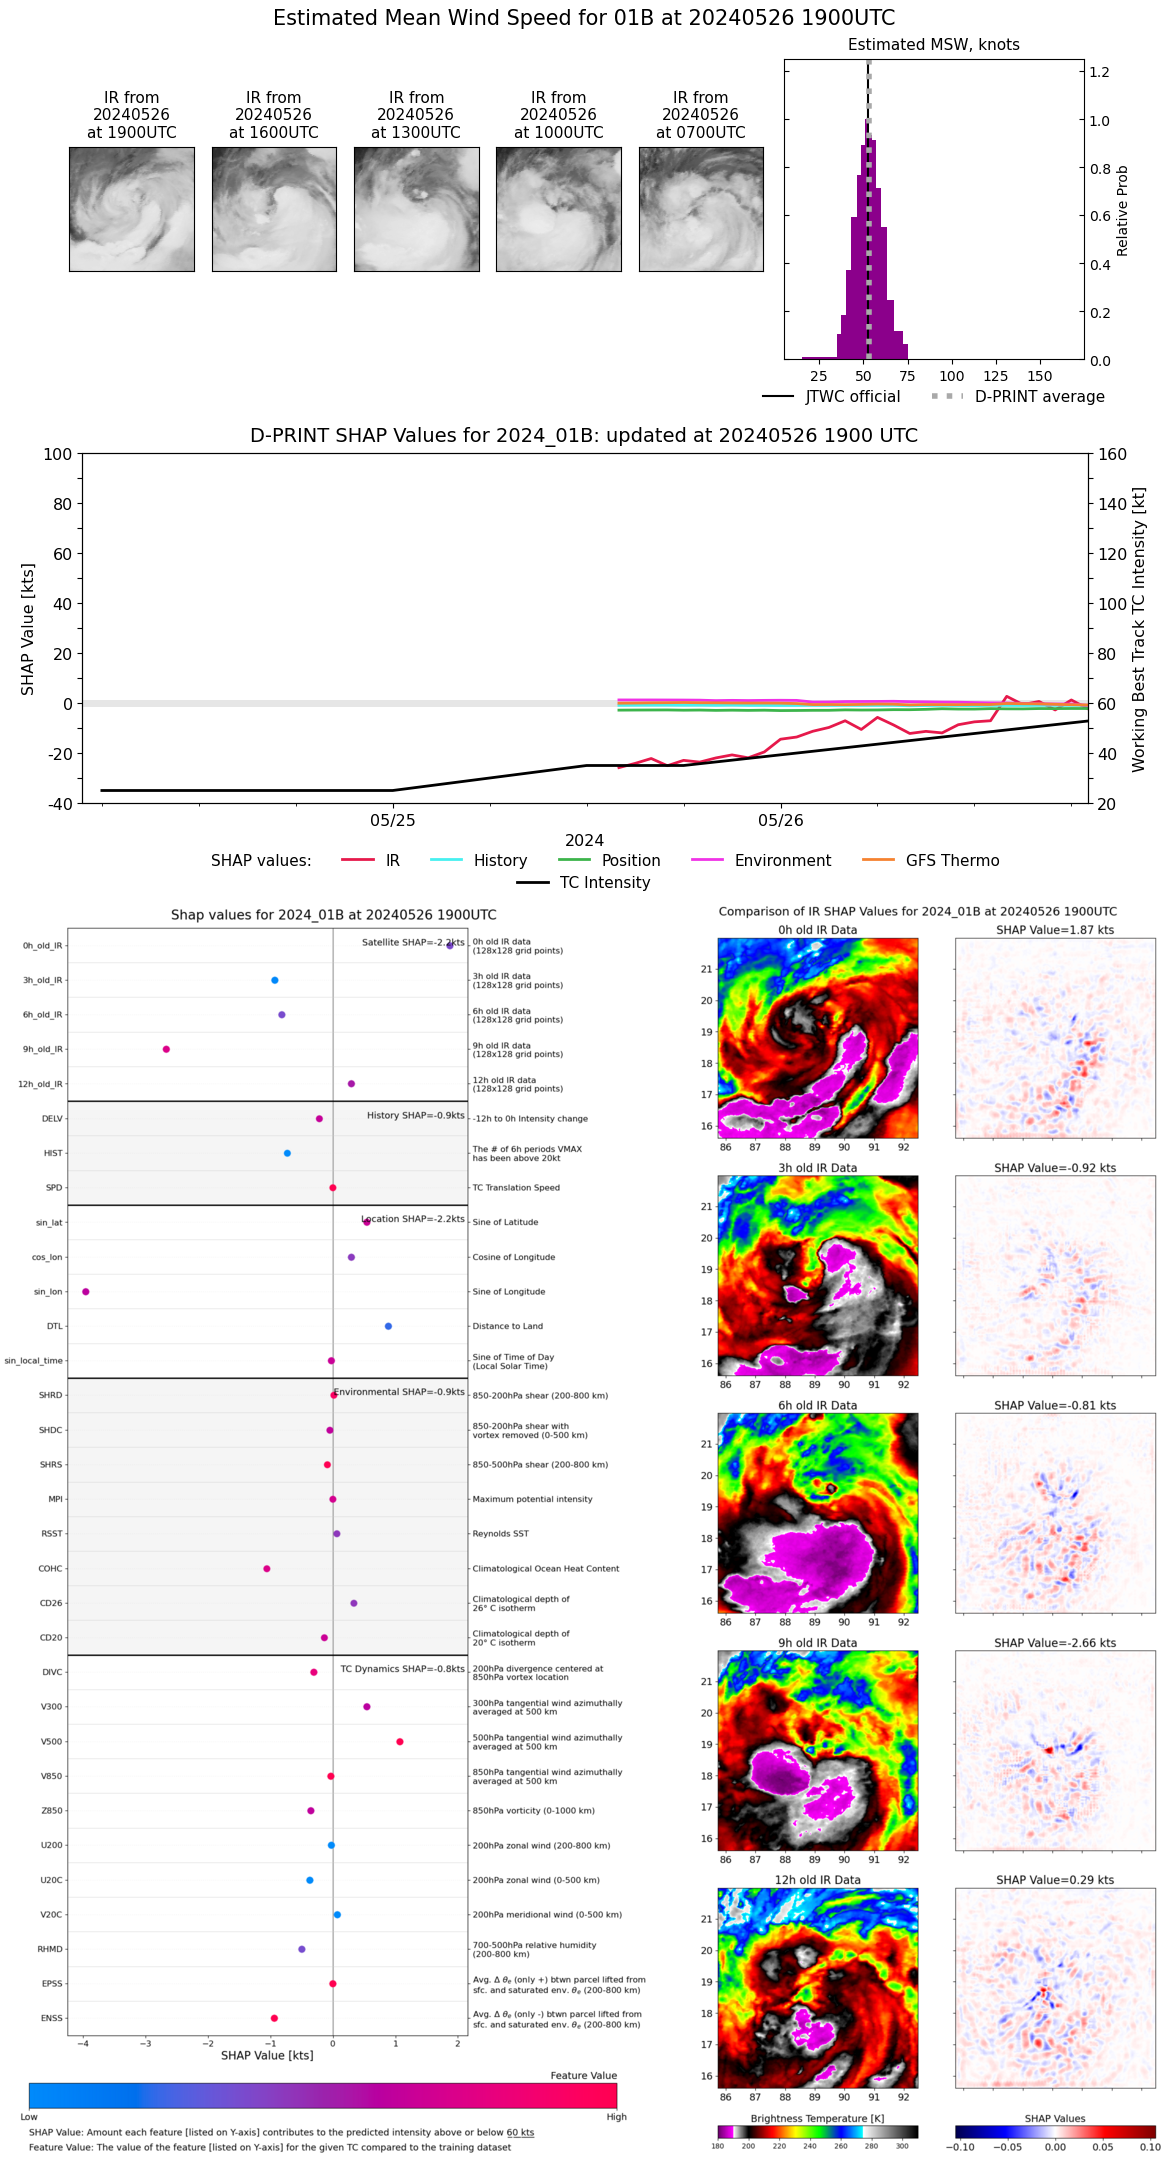 |
| 20240526 | 1800 UTC | 977 hPa | 57 kts | 51 kts | 63 kts | 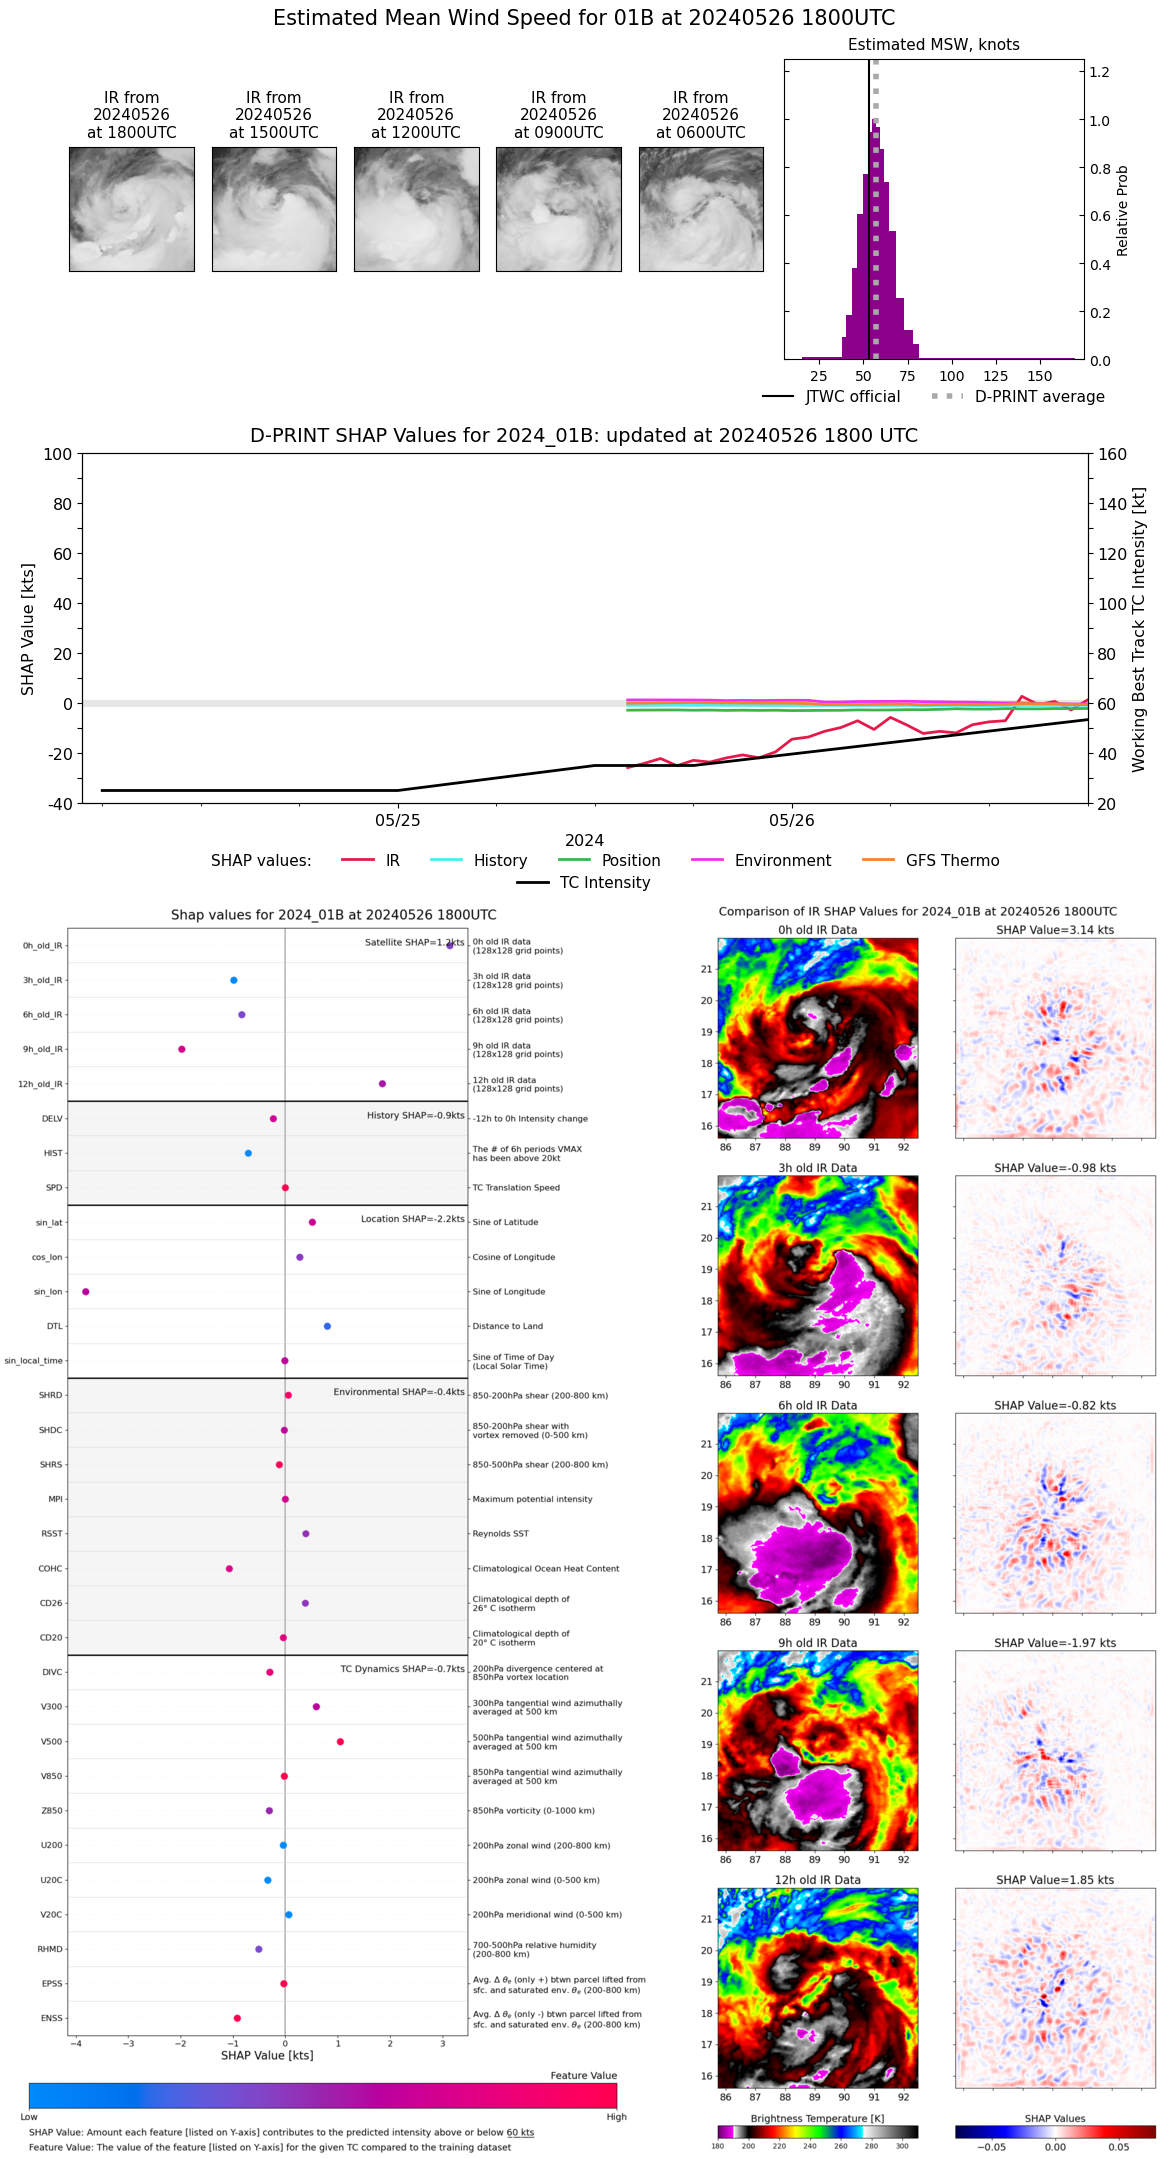 |
| 20240526 | 1700 UTC | 975 hPa | 53 kts | 48 kts | 59 kts | 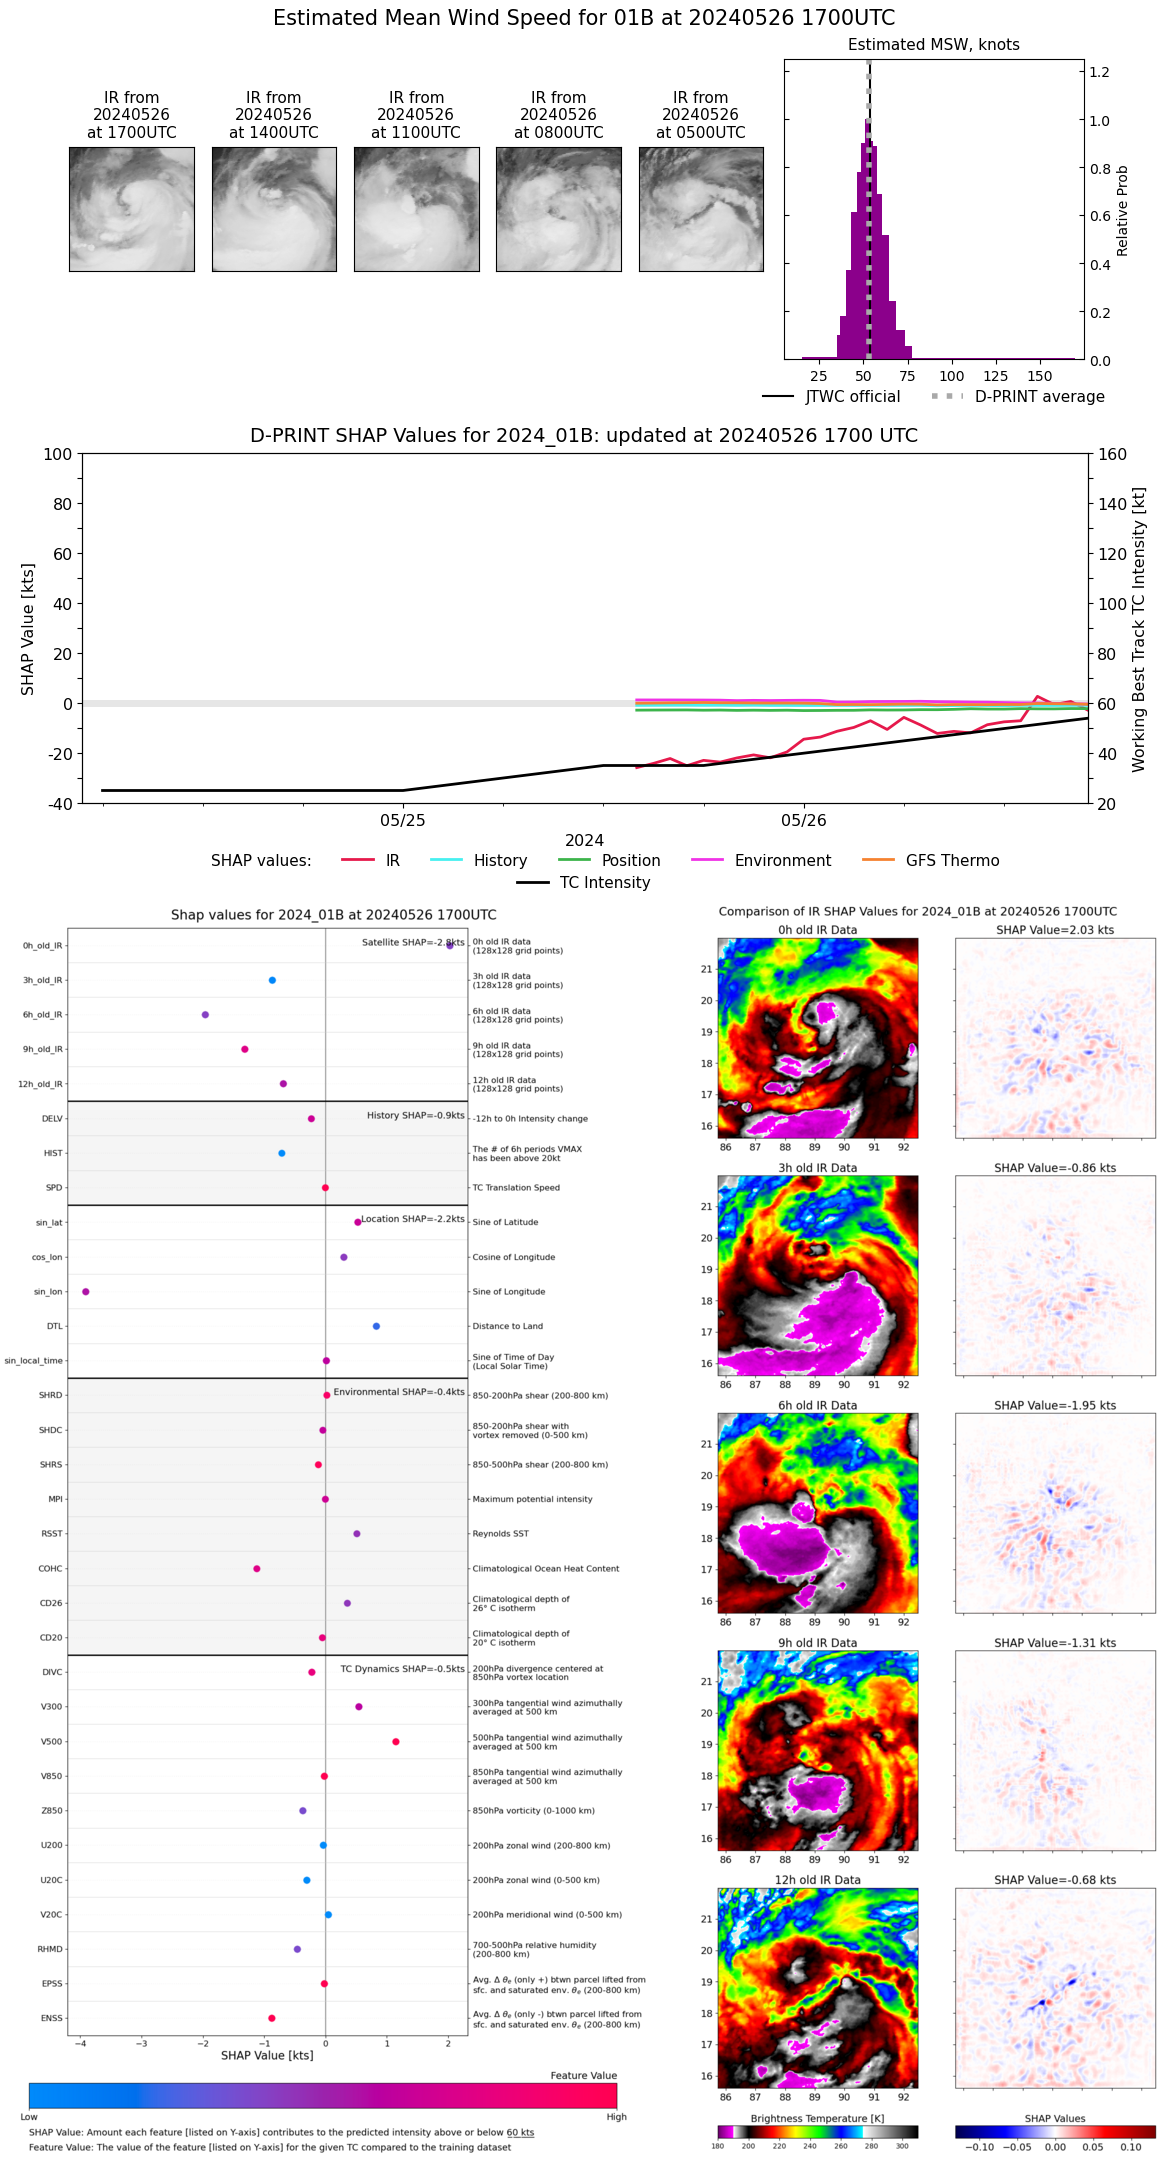 |
| 20240526 | 1600 UTC | 975 hPa | 57 kts | 51 kts | 63 kts | 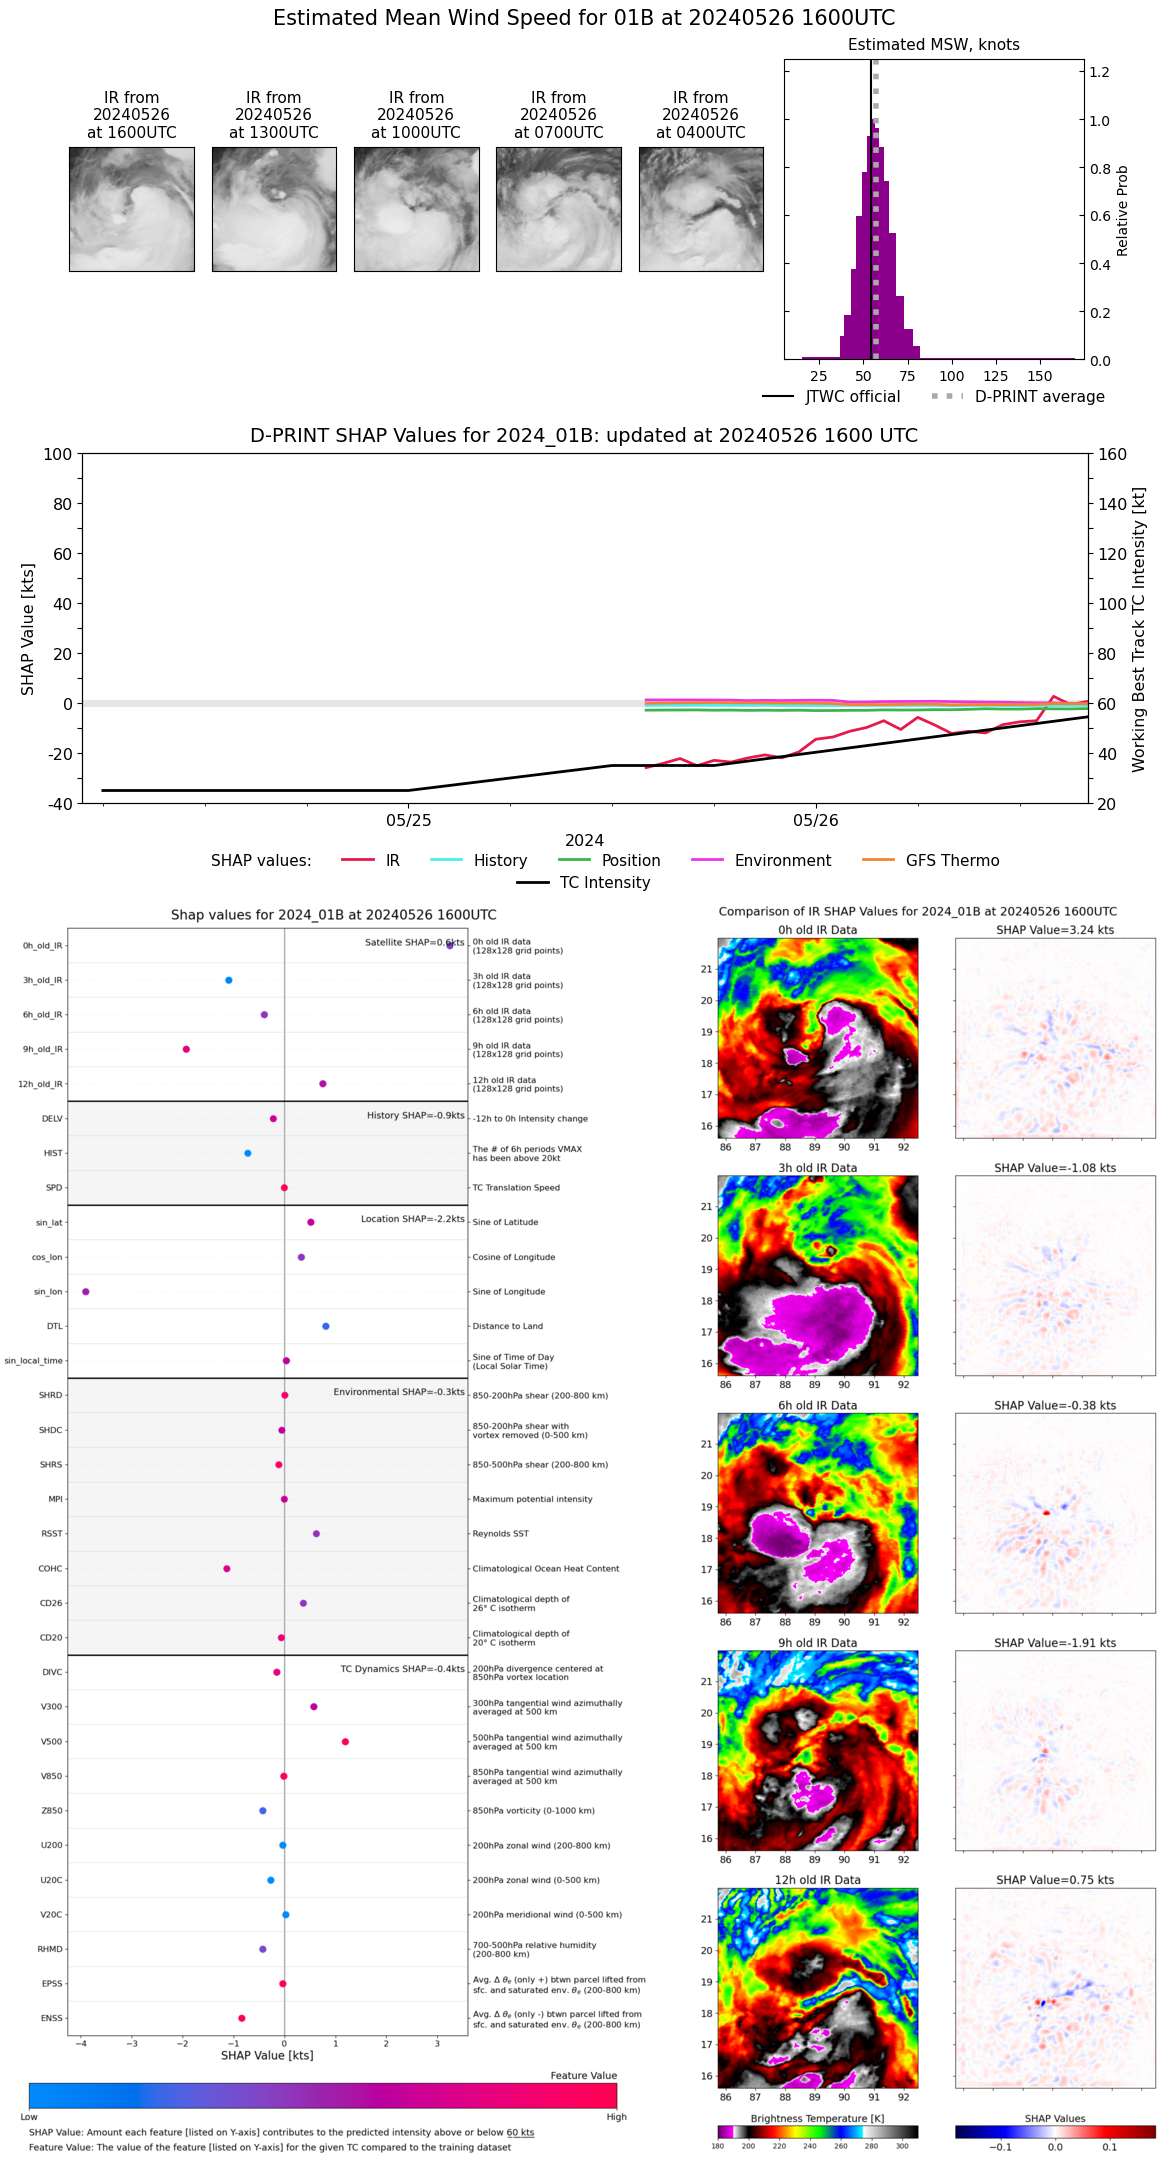 |
| 20240526 | 1500 UTC | 975 hPa | 56 kts | 50 kts | 62 kts | 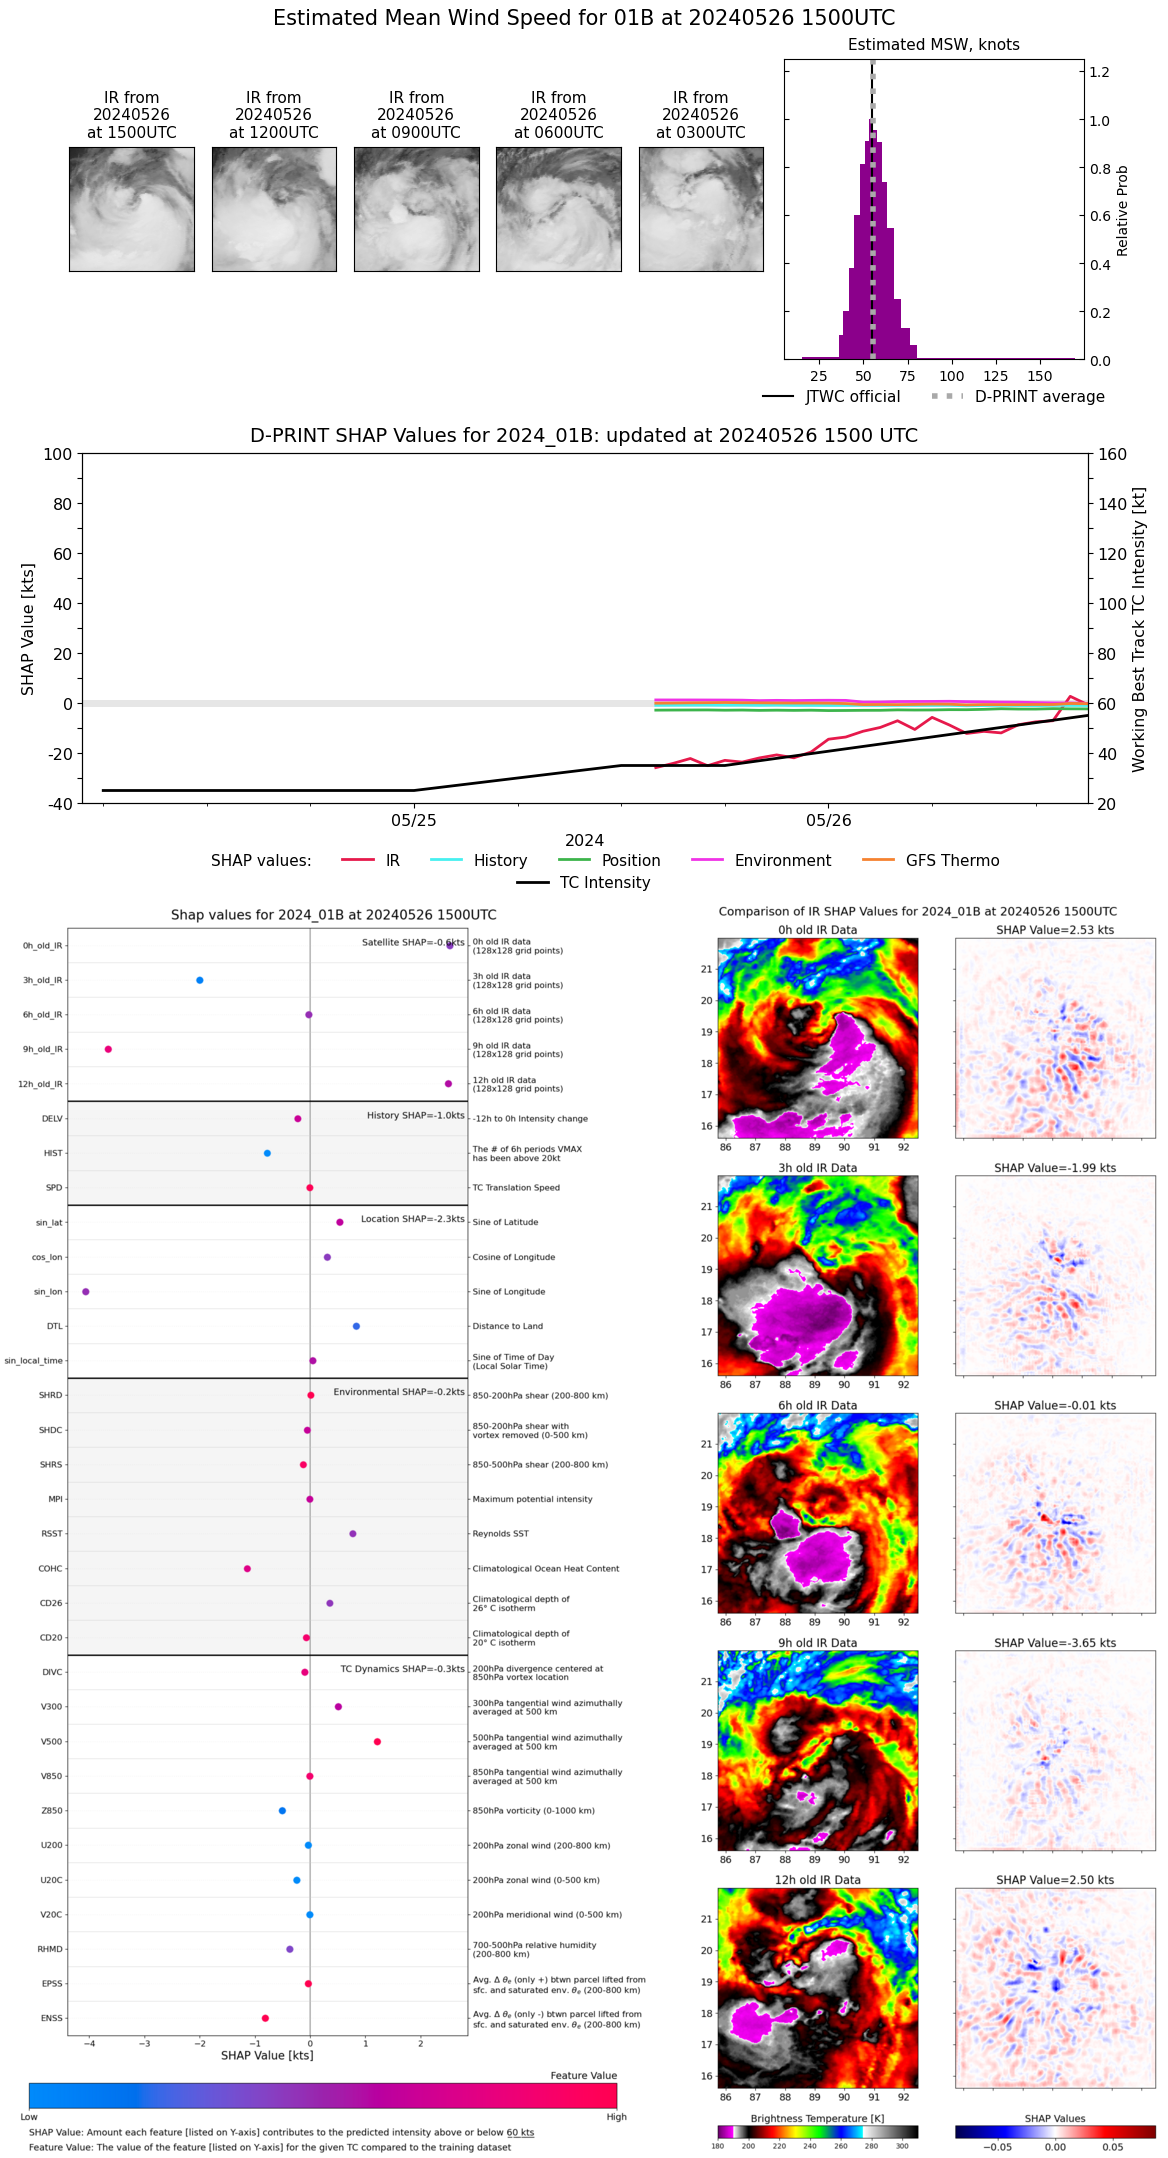 |
| 20240526 | 1400 UTC | 977 hPa | 59 kts | 53 kts | 66 kts | 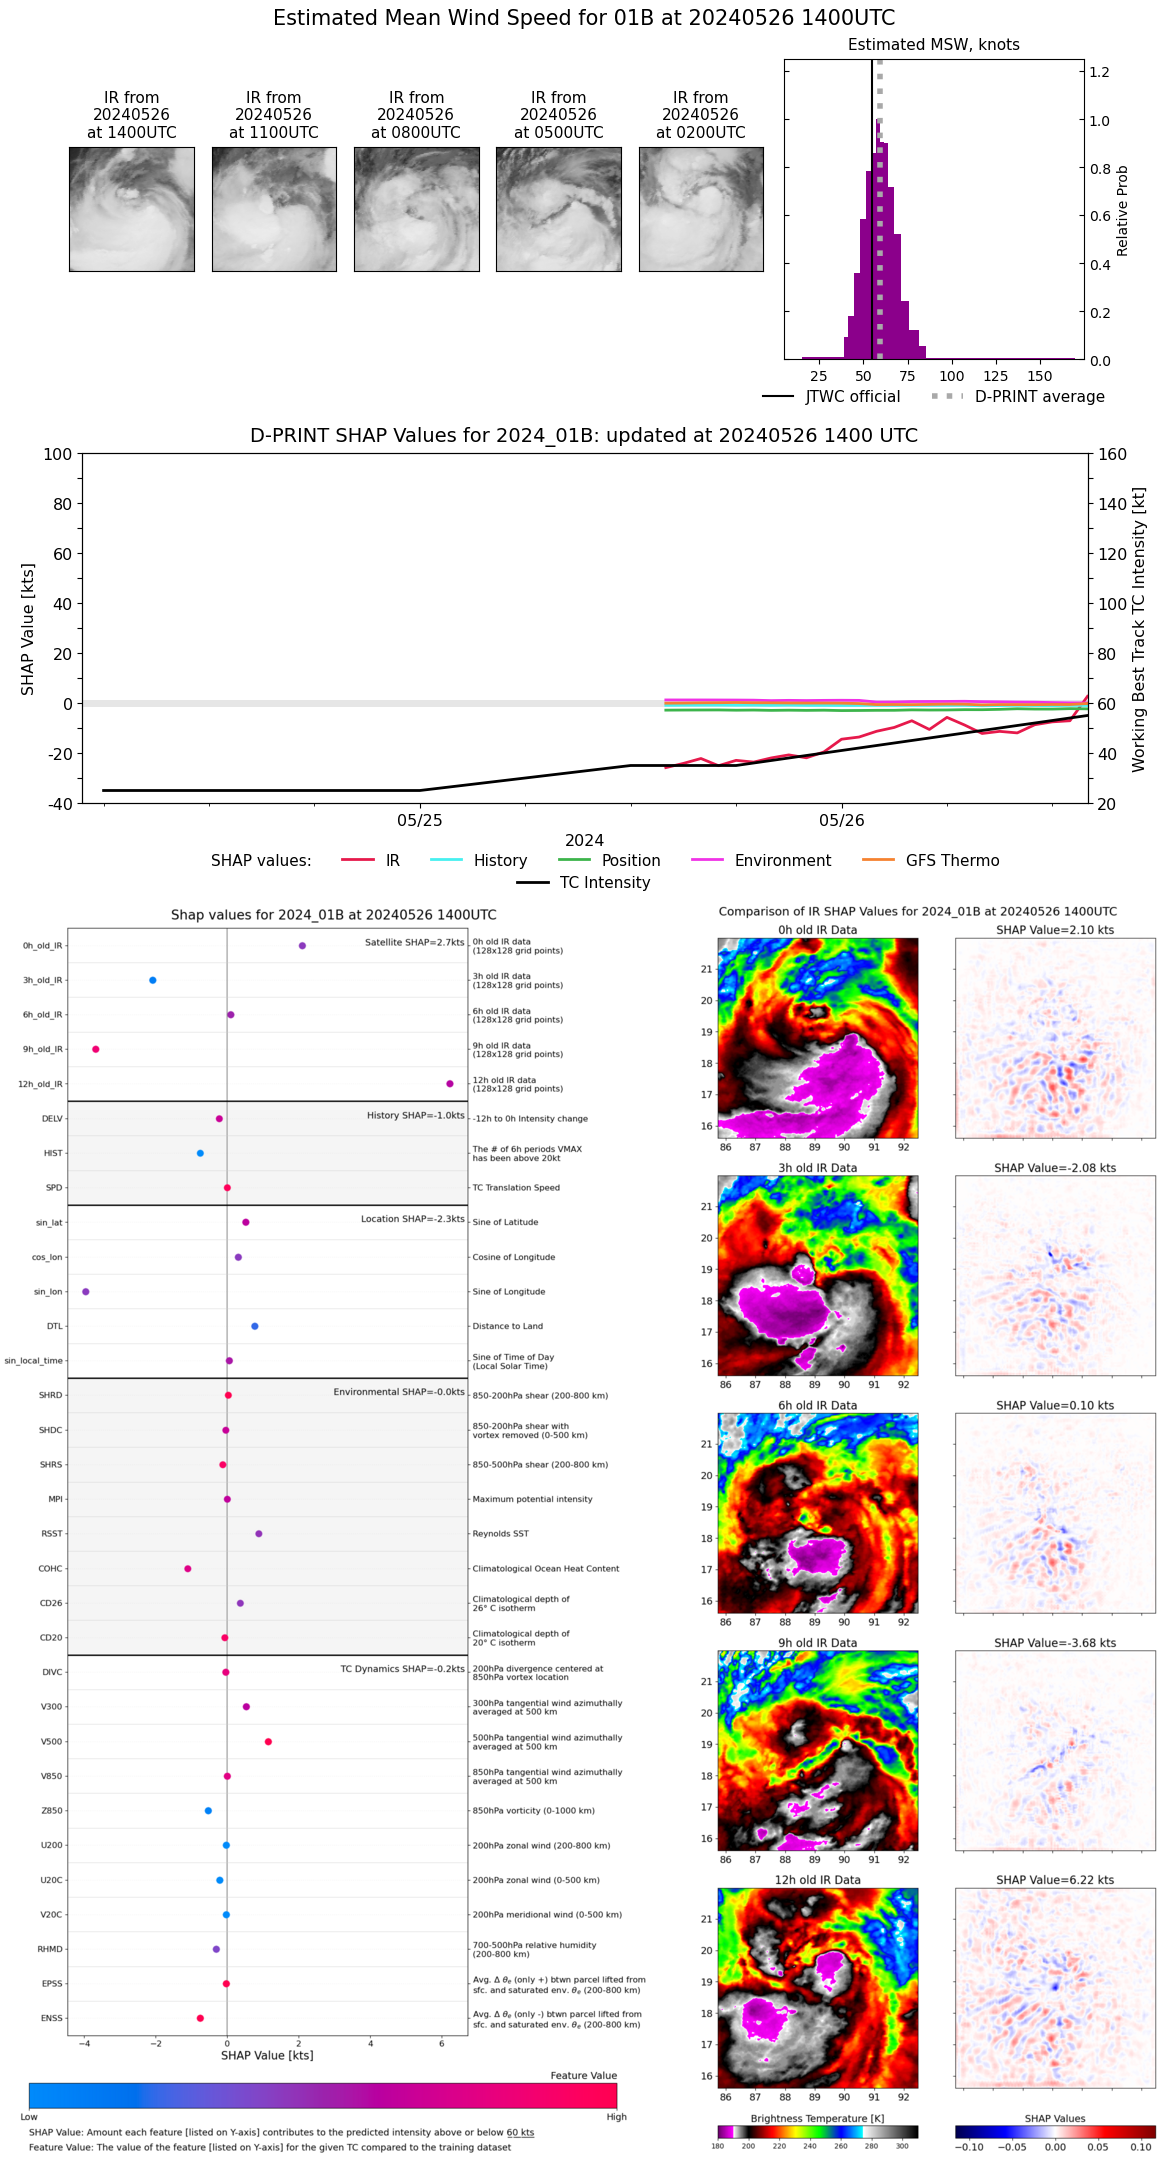 |
| 20240526 | 1300 UTC | 982 hPa | 49 kts | 44 kts | 55 kts | 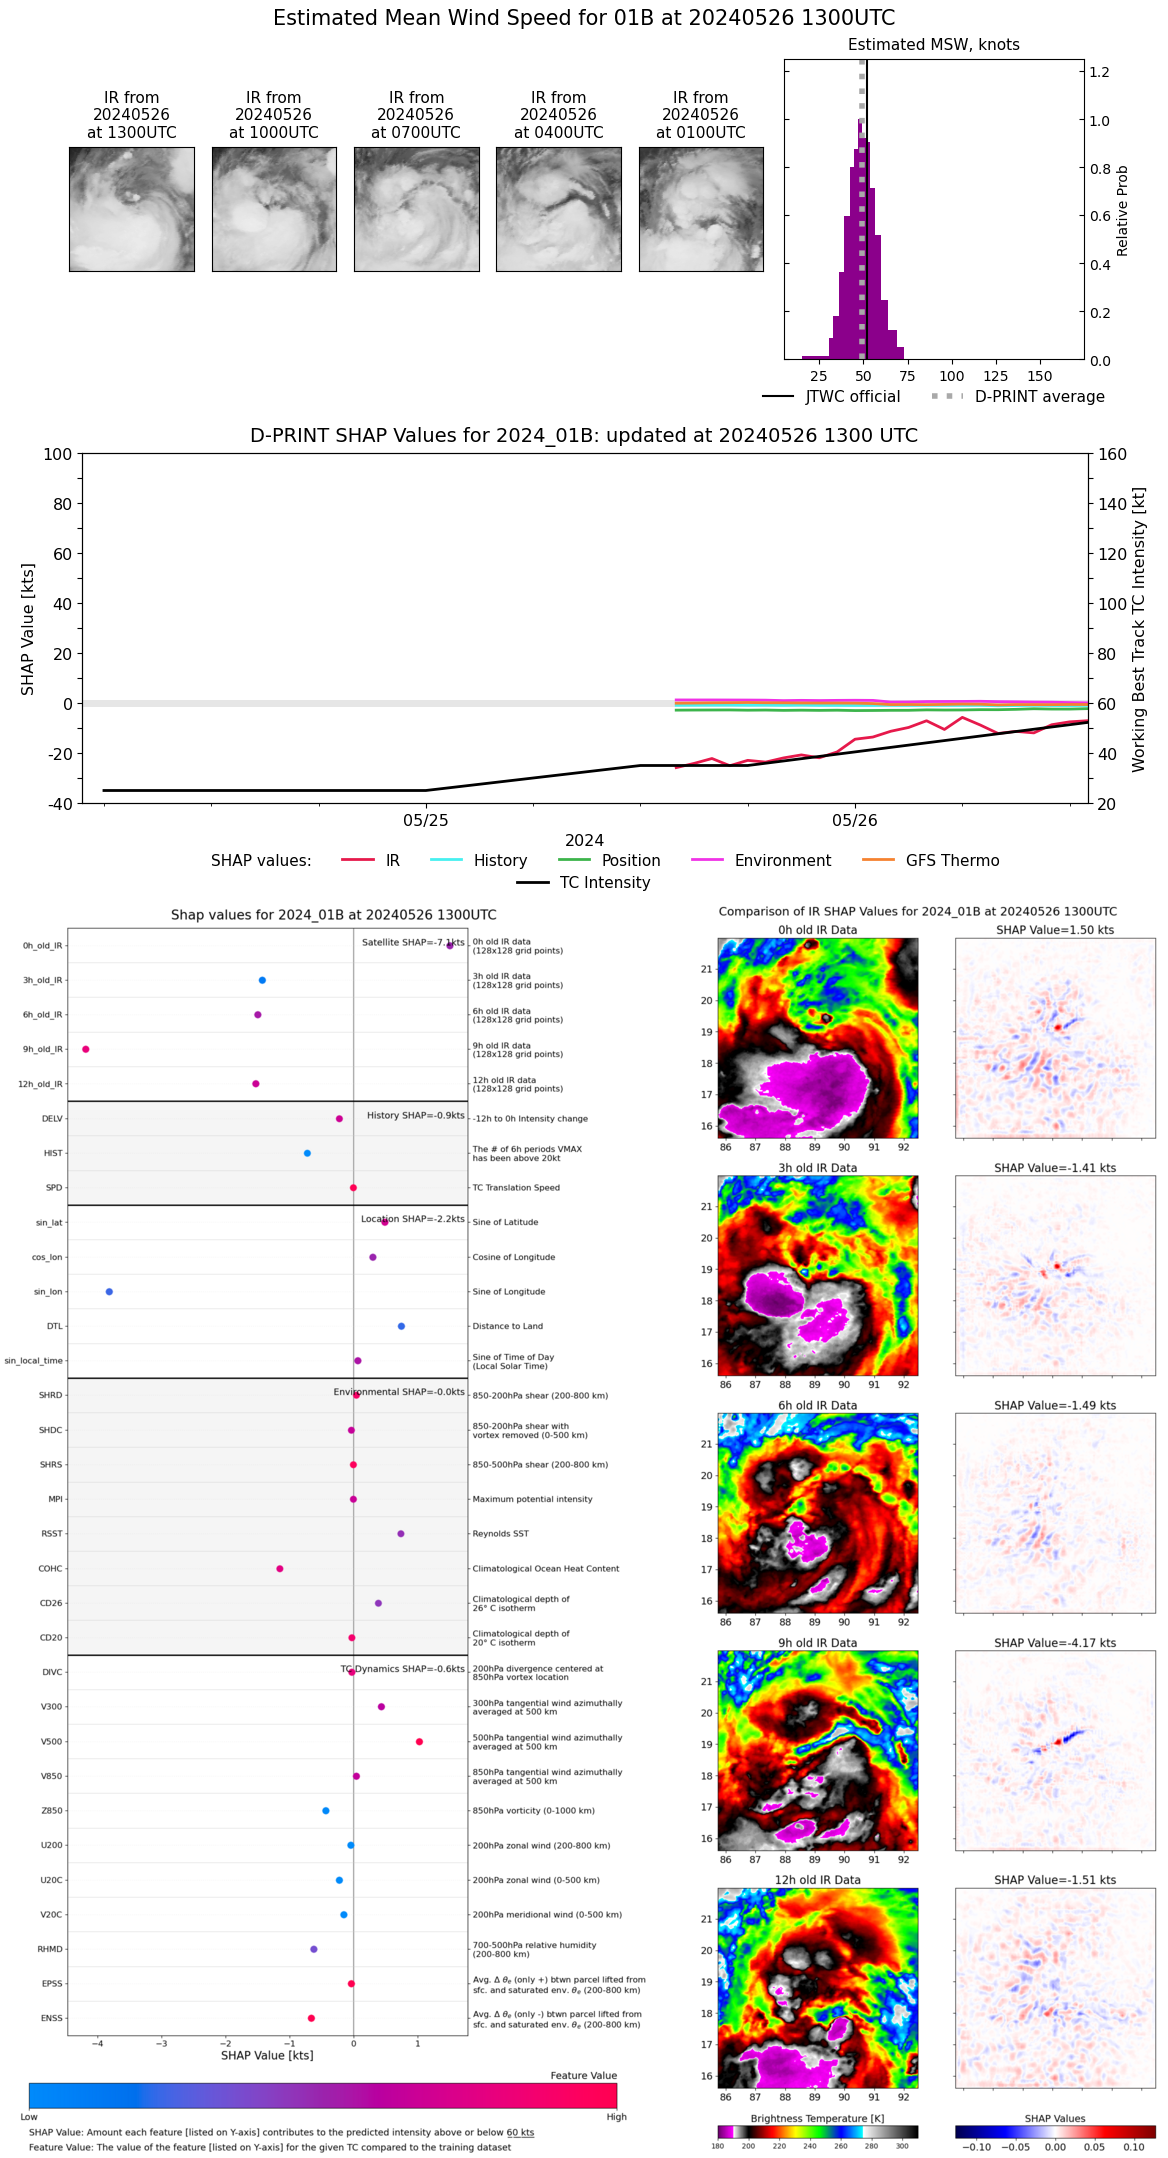 |
| 20240526 | 1200 UTC | 978 hPa | 49 kts | 43 kts | 54 kts | 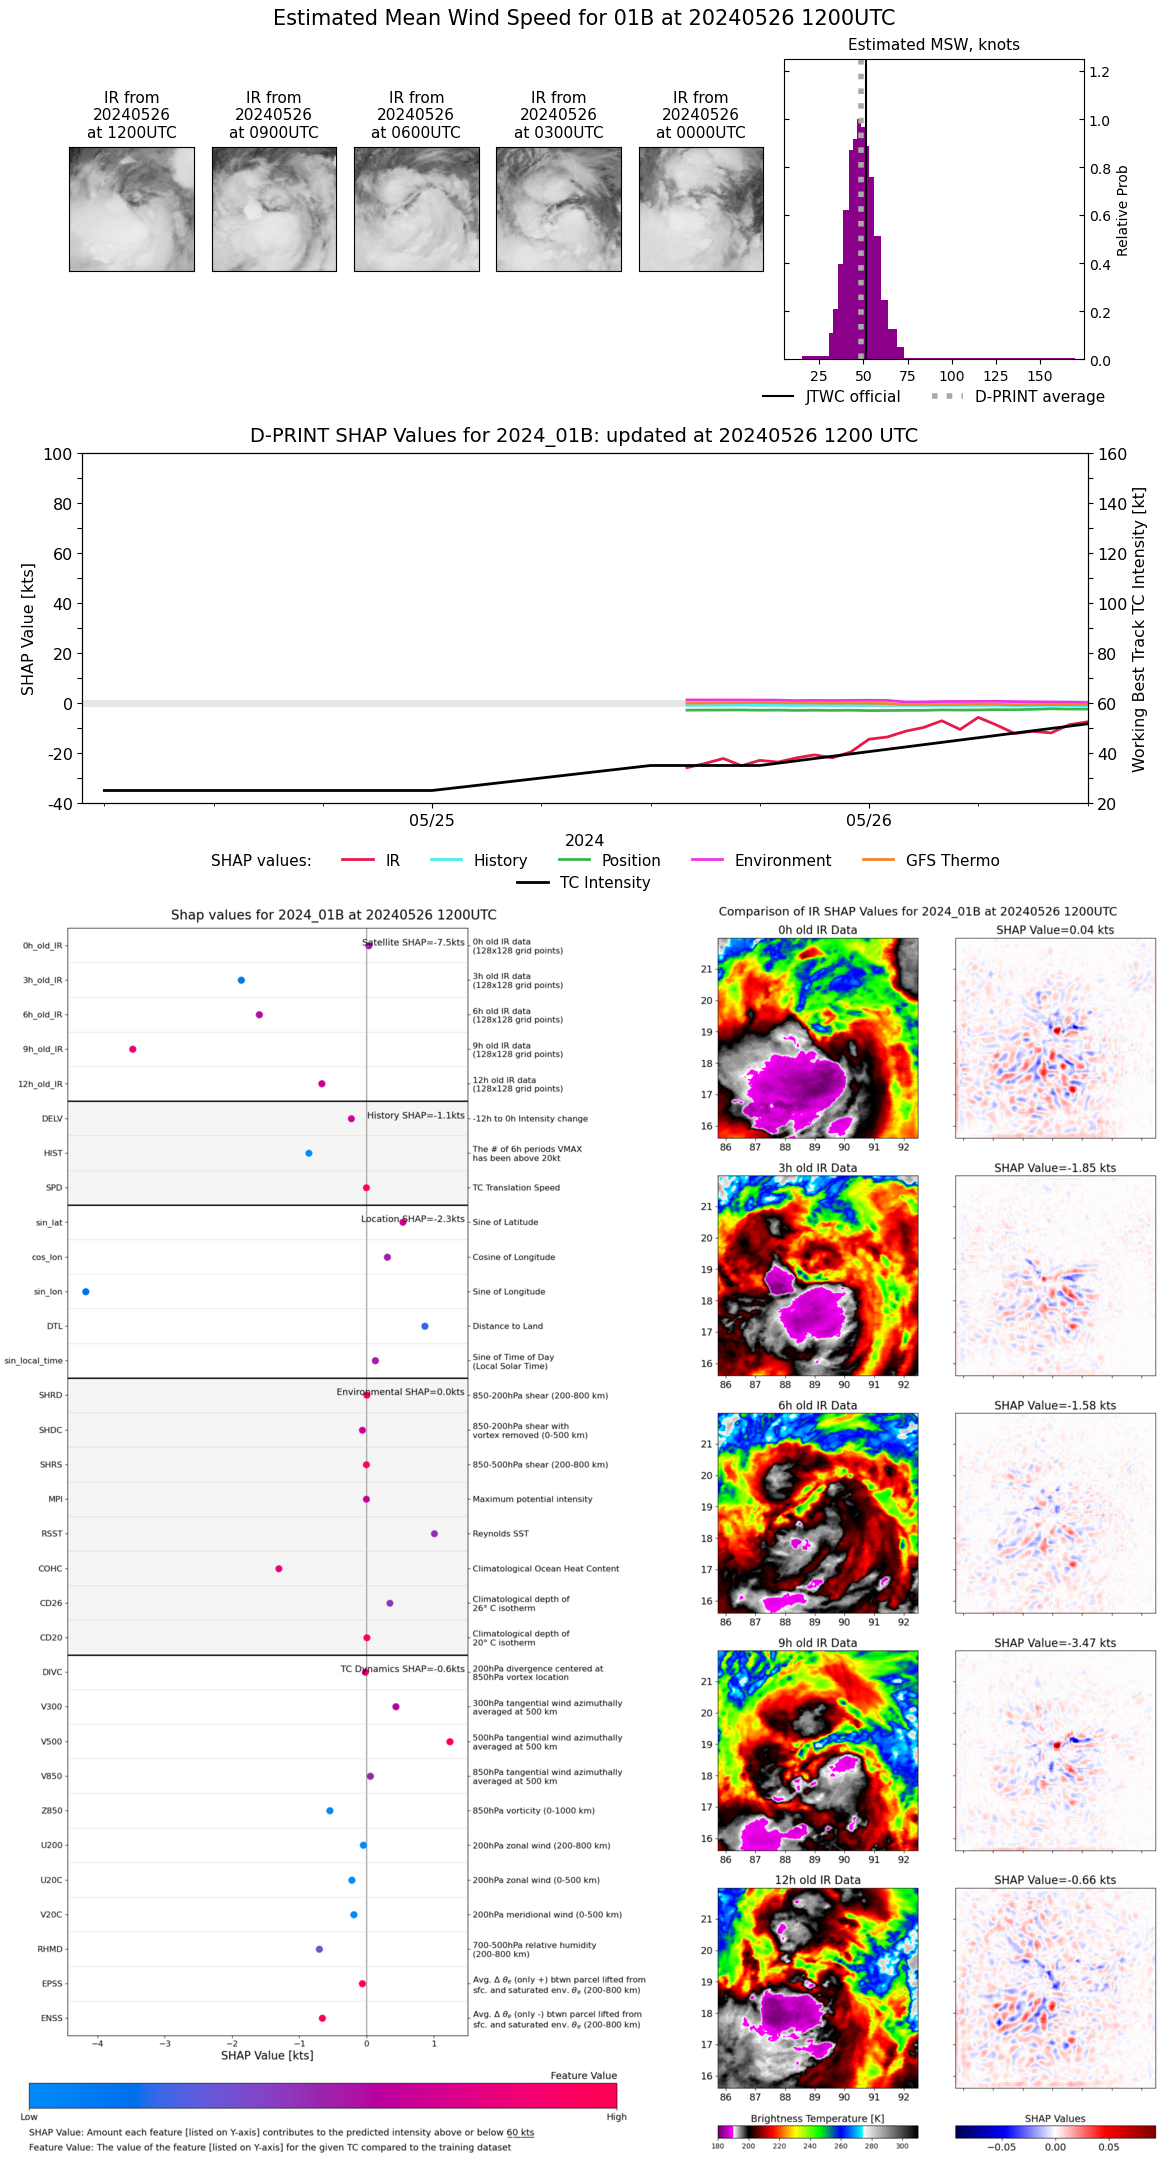 |
| 20240526 | 1100 UTC | 980 hPa | 47 kts | 42 kts | 53 kts | 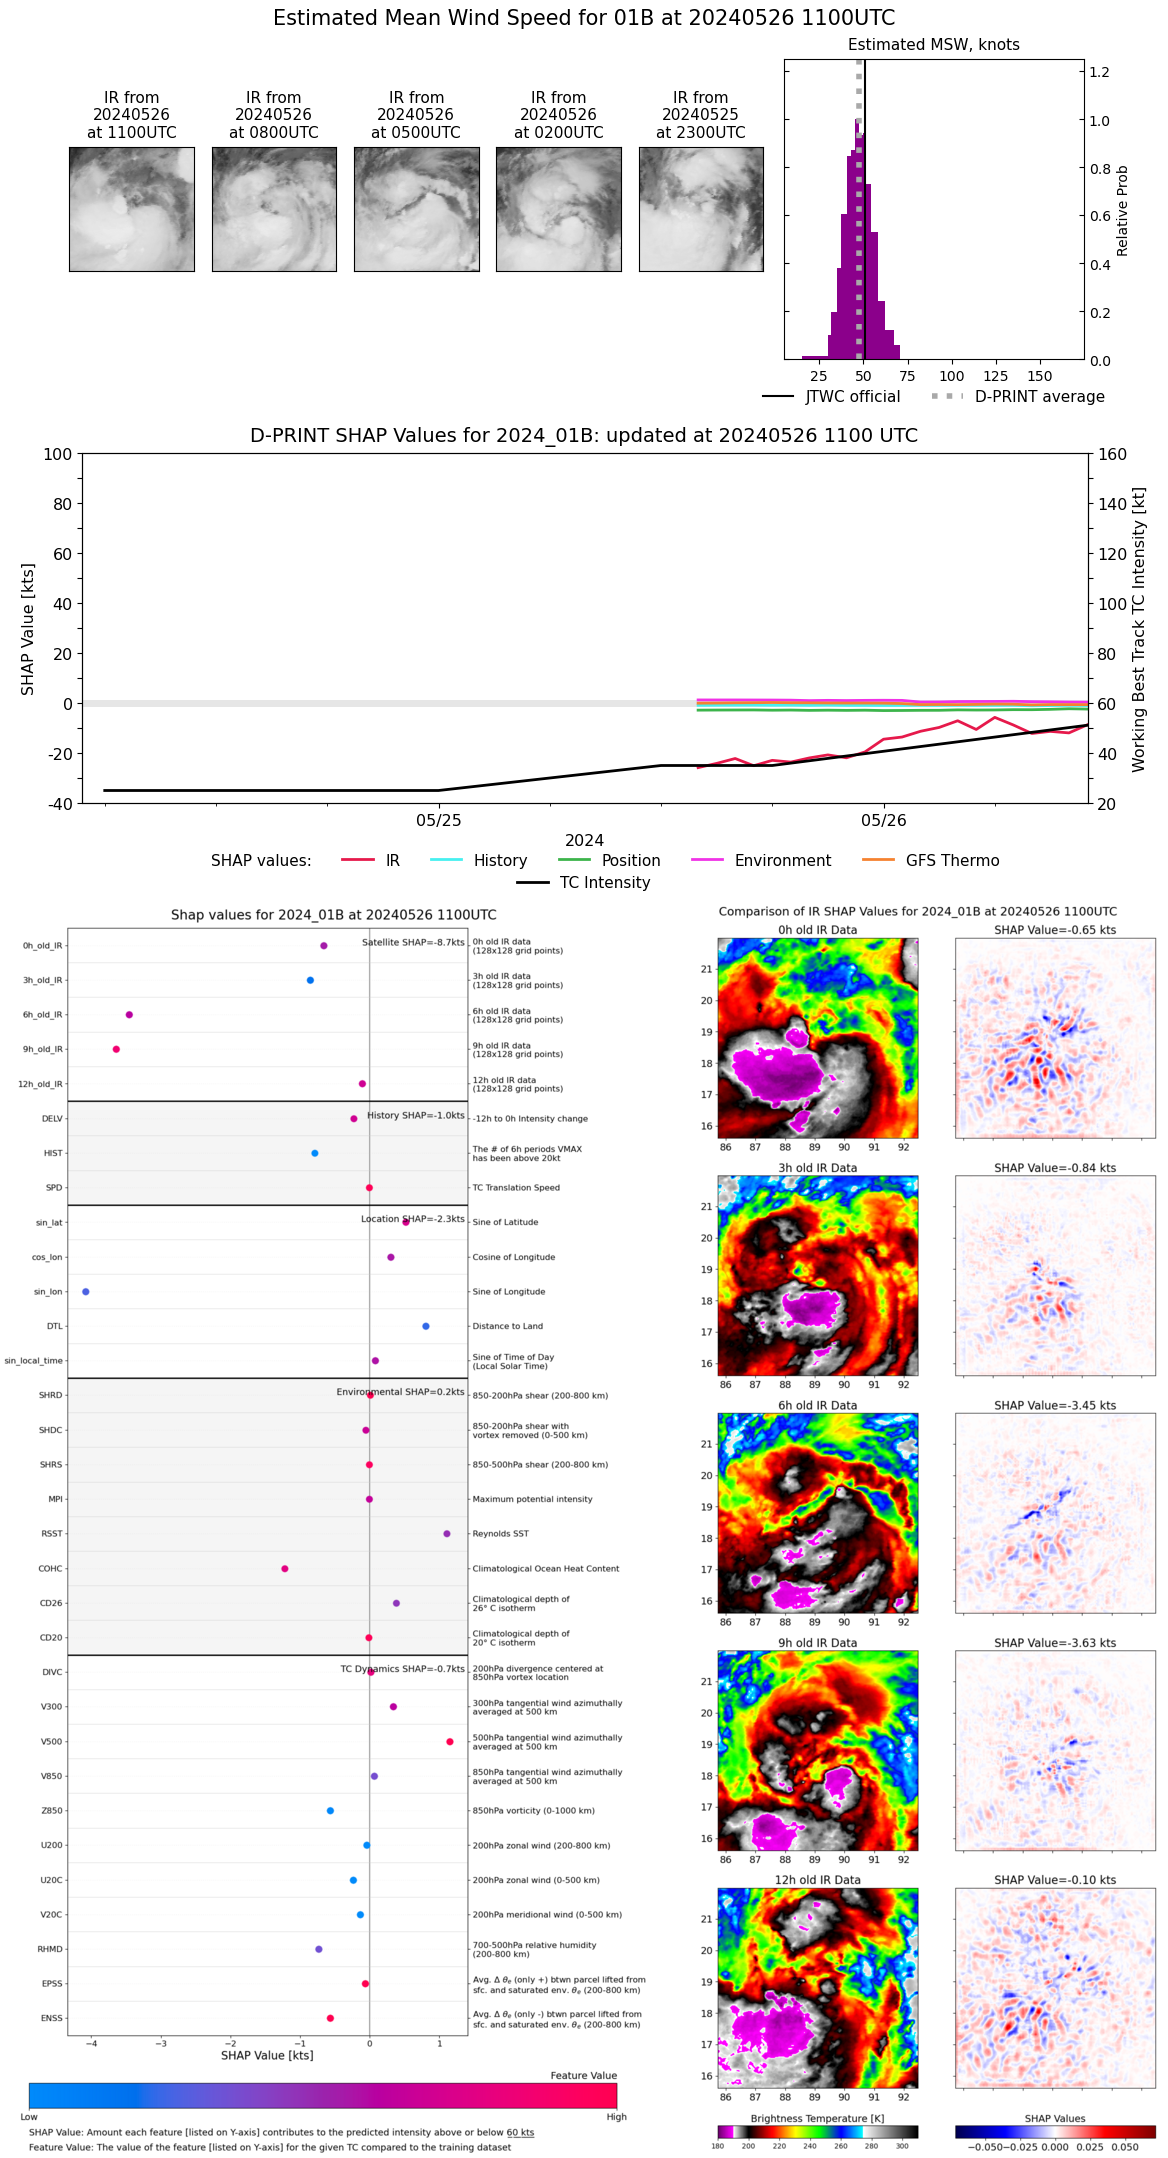 |
| 20240526 | 1000 UTC | 983 hPa | 44 kts | 40 kts | 49 kts | 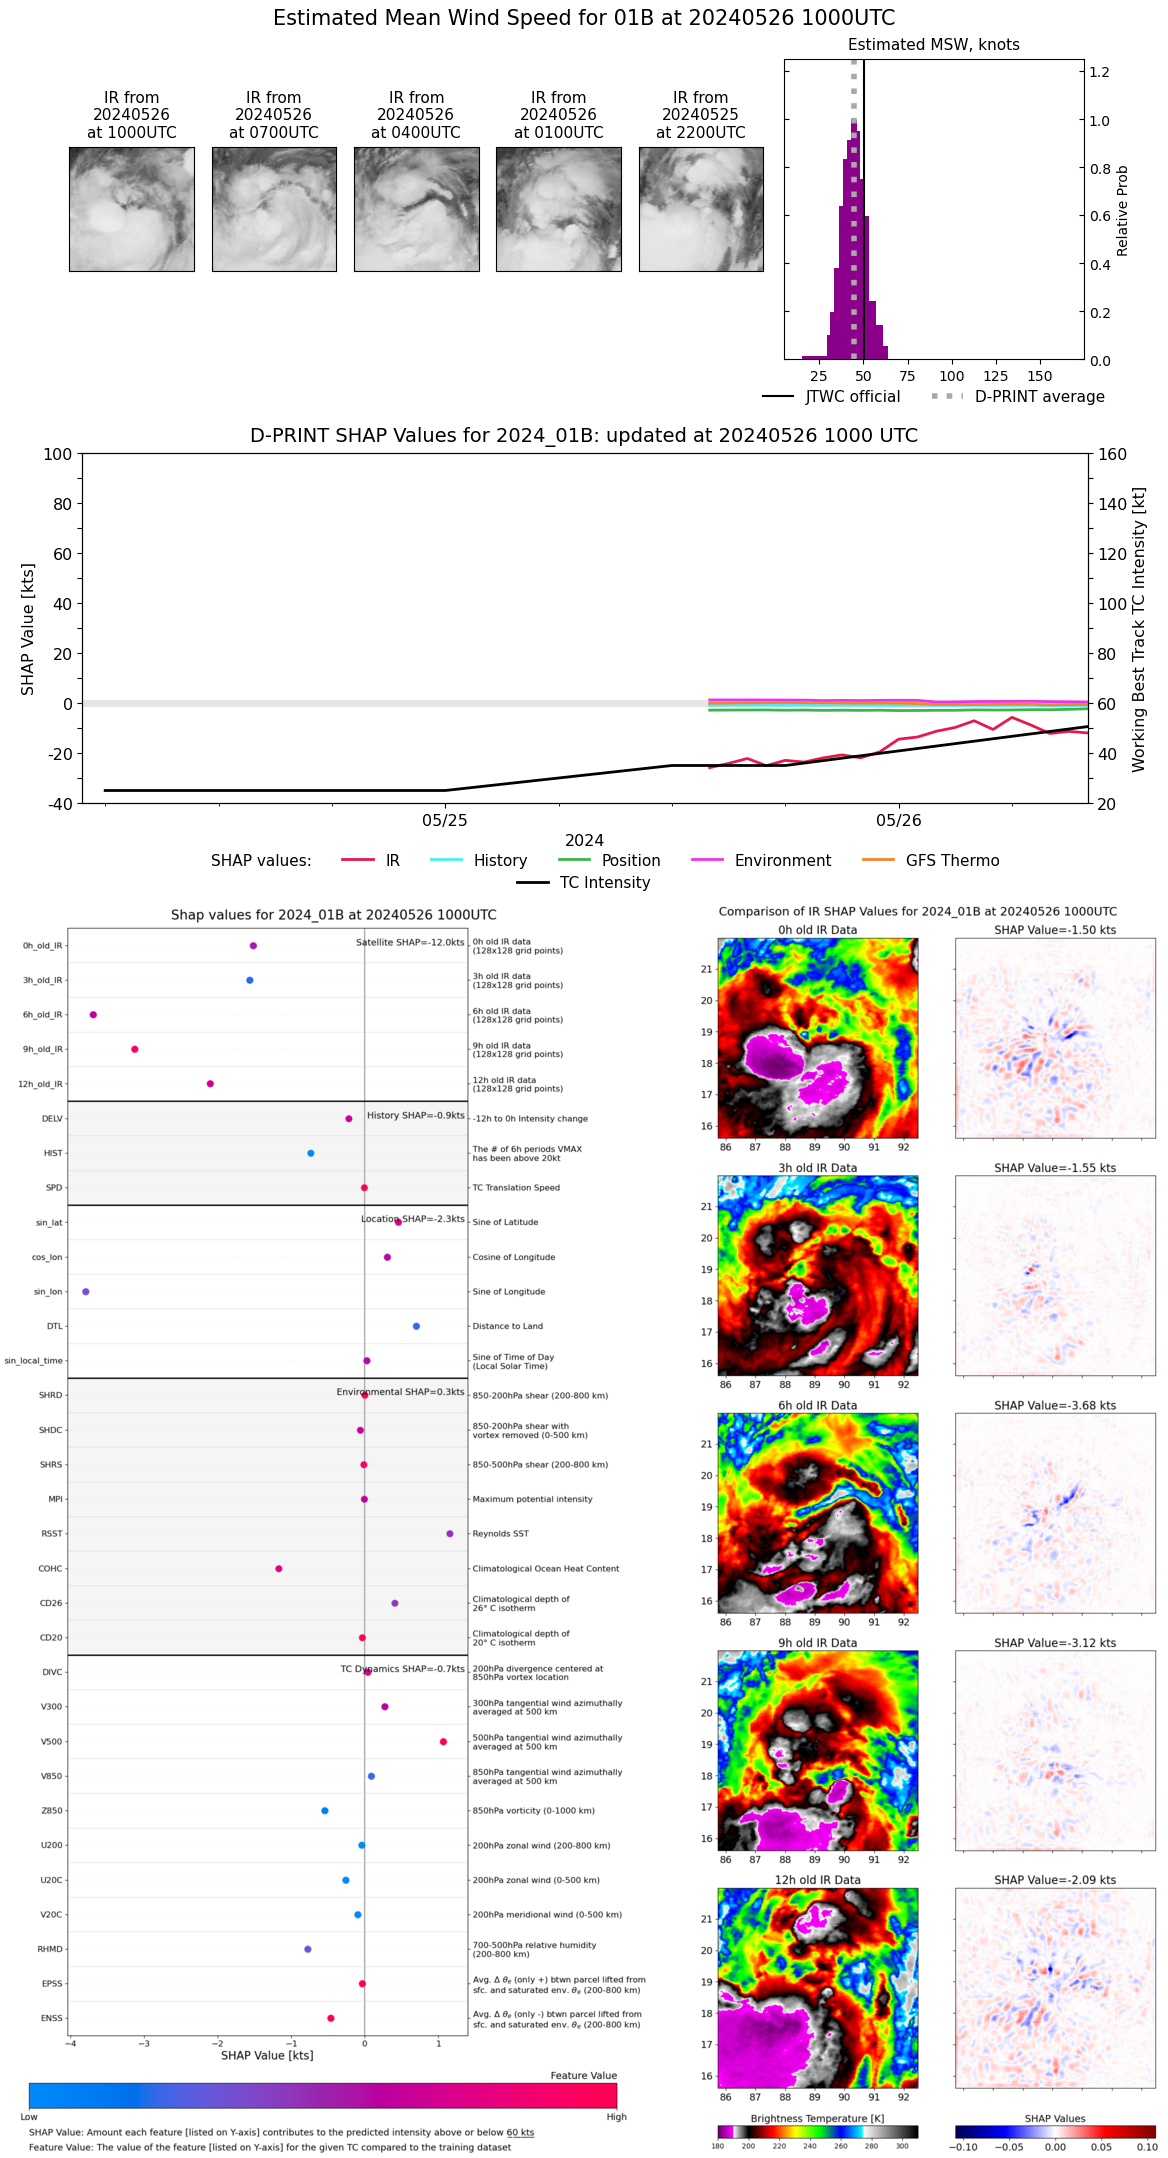 |
| 20240526 | 0900 UTC | 980 hPa | 45 kts | 40 kts | 50 kts |  |
| 20240526 | 0800 UTC | 985 hPa | 44 kts | 38 kts | 49 kts |  |
| 20240526 | 0700 UTC | 986 hPa | 48 kts | 43 kts | 53 kts | 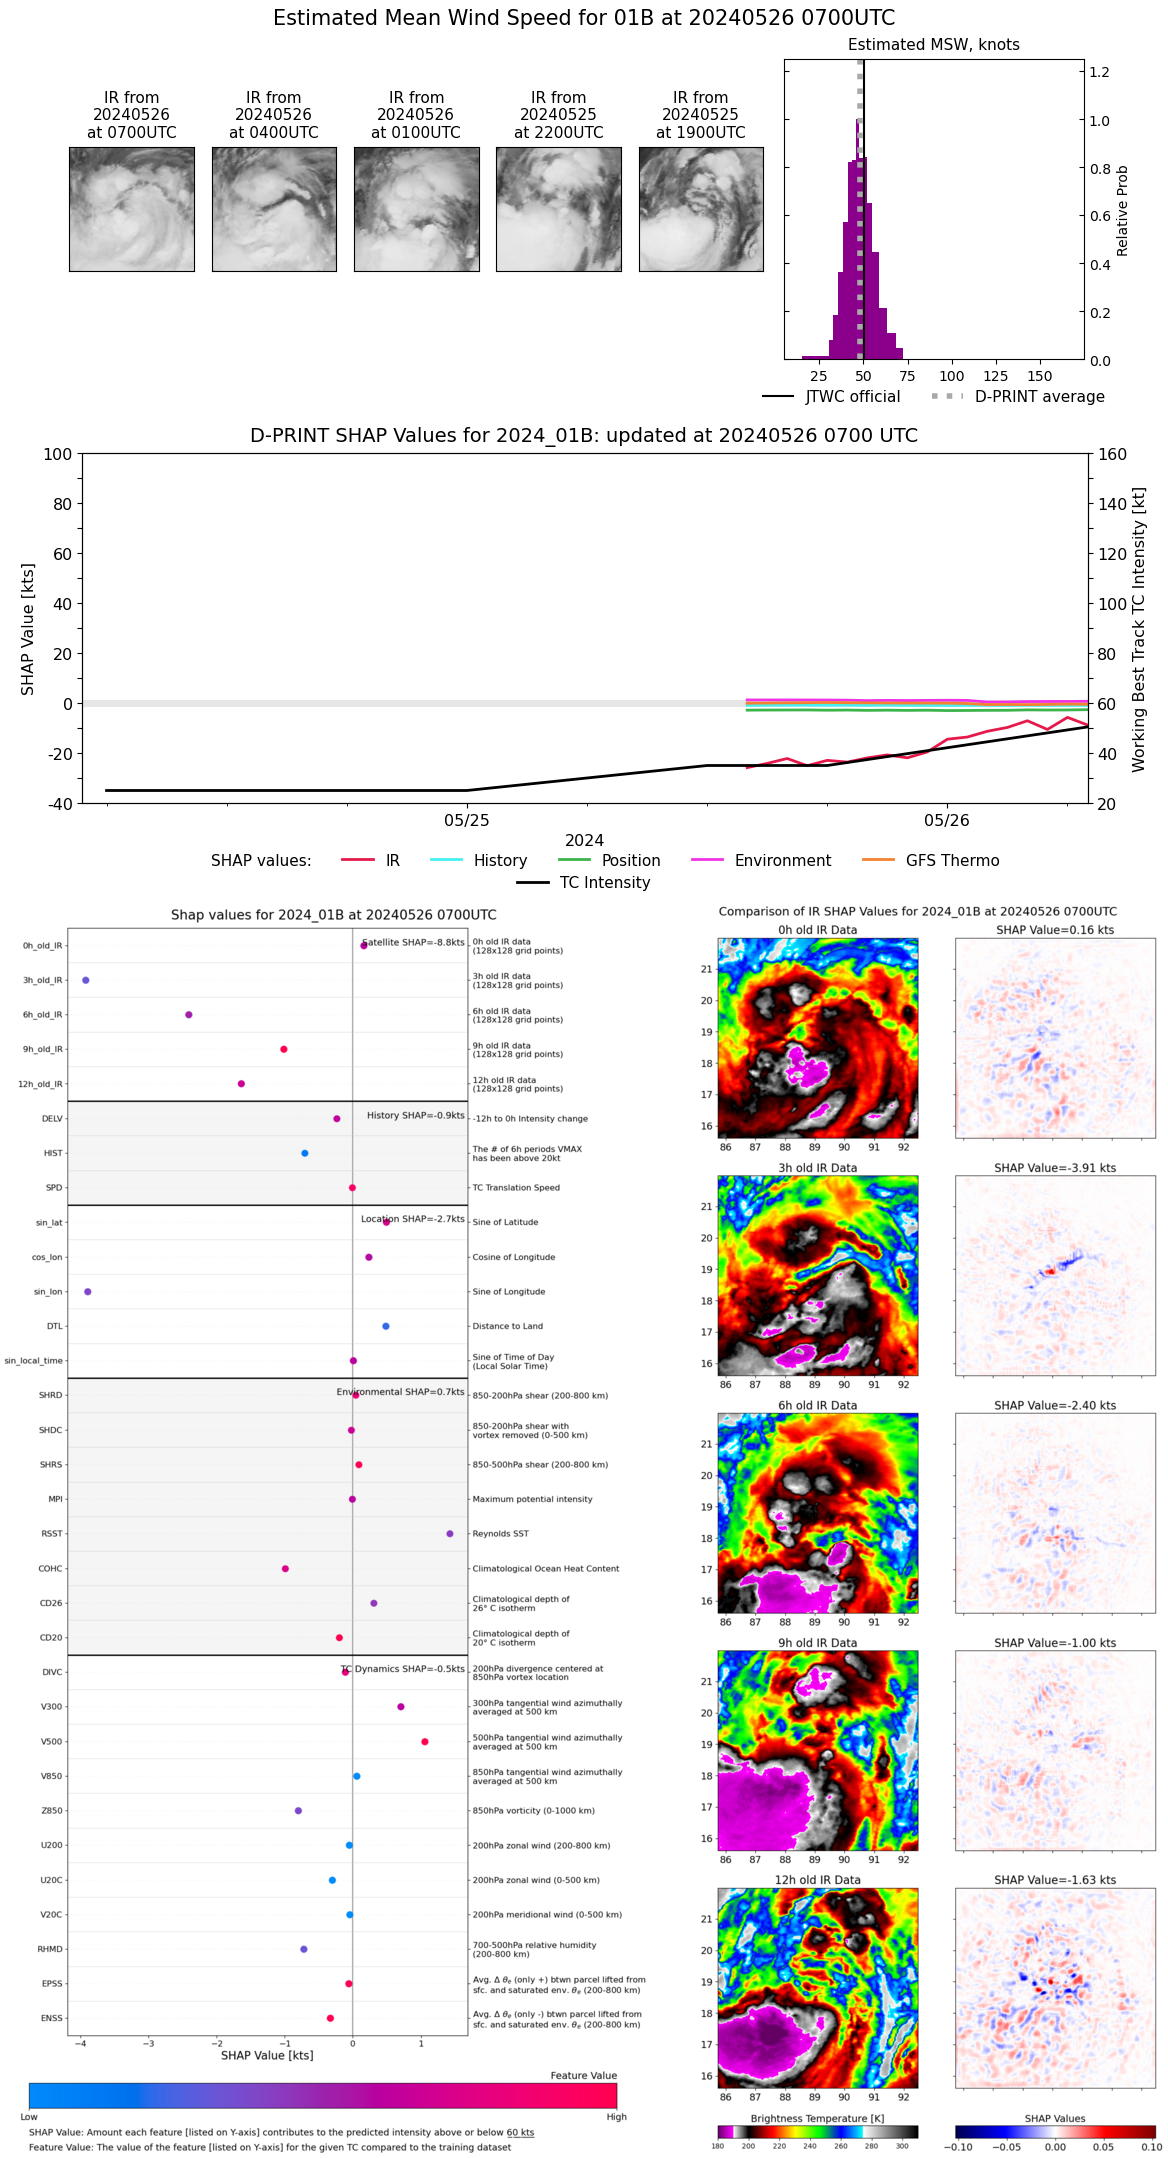 |
| 20240526 | 0600 UTC | 987 hPa | 51 kts | 45 kts | 57 kts | 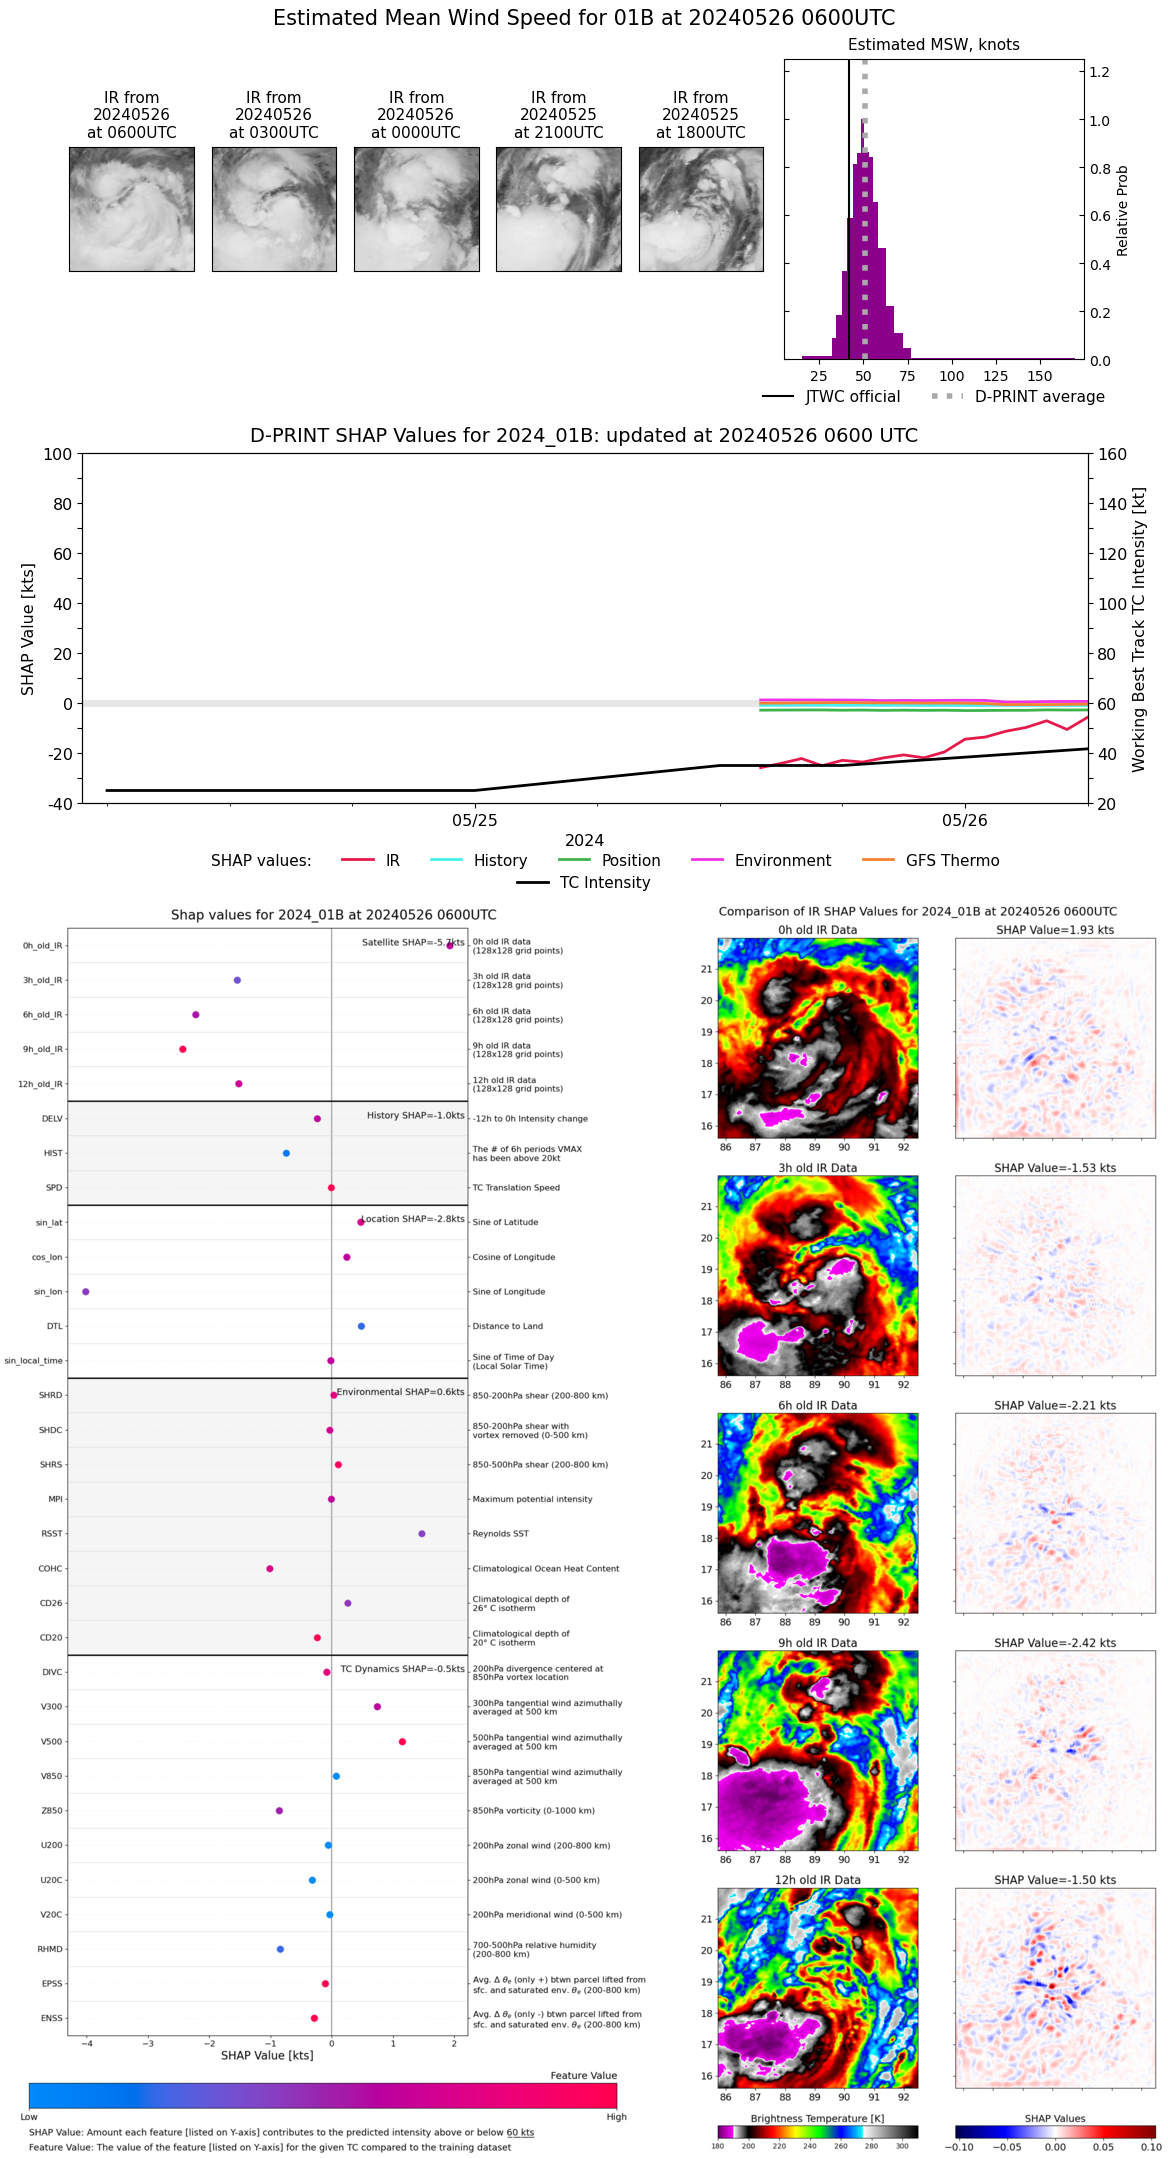 |
| 20240526 | 0500 UTC | 987 hPa | 46 kts | 41 kts | 51 kts | 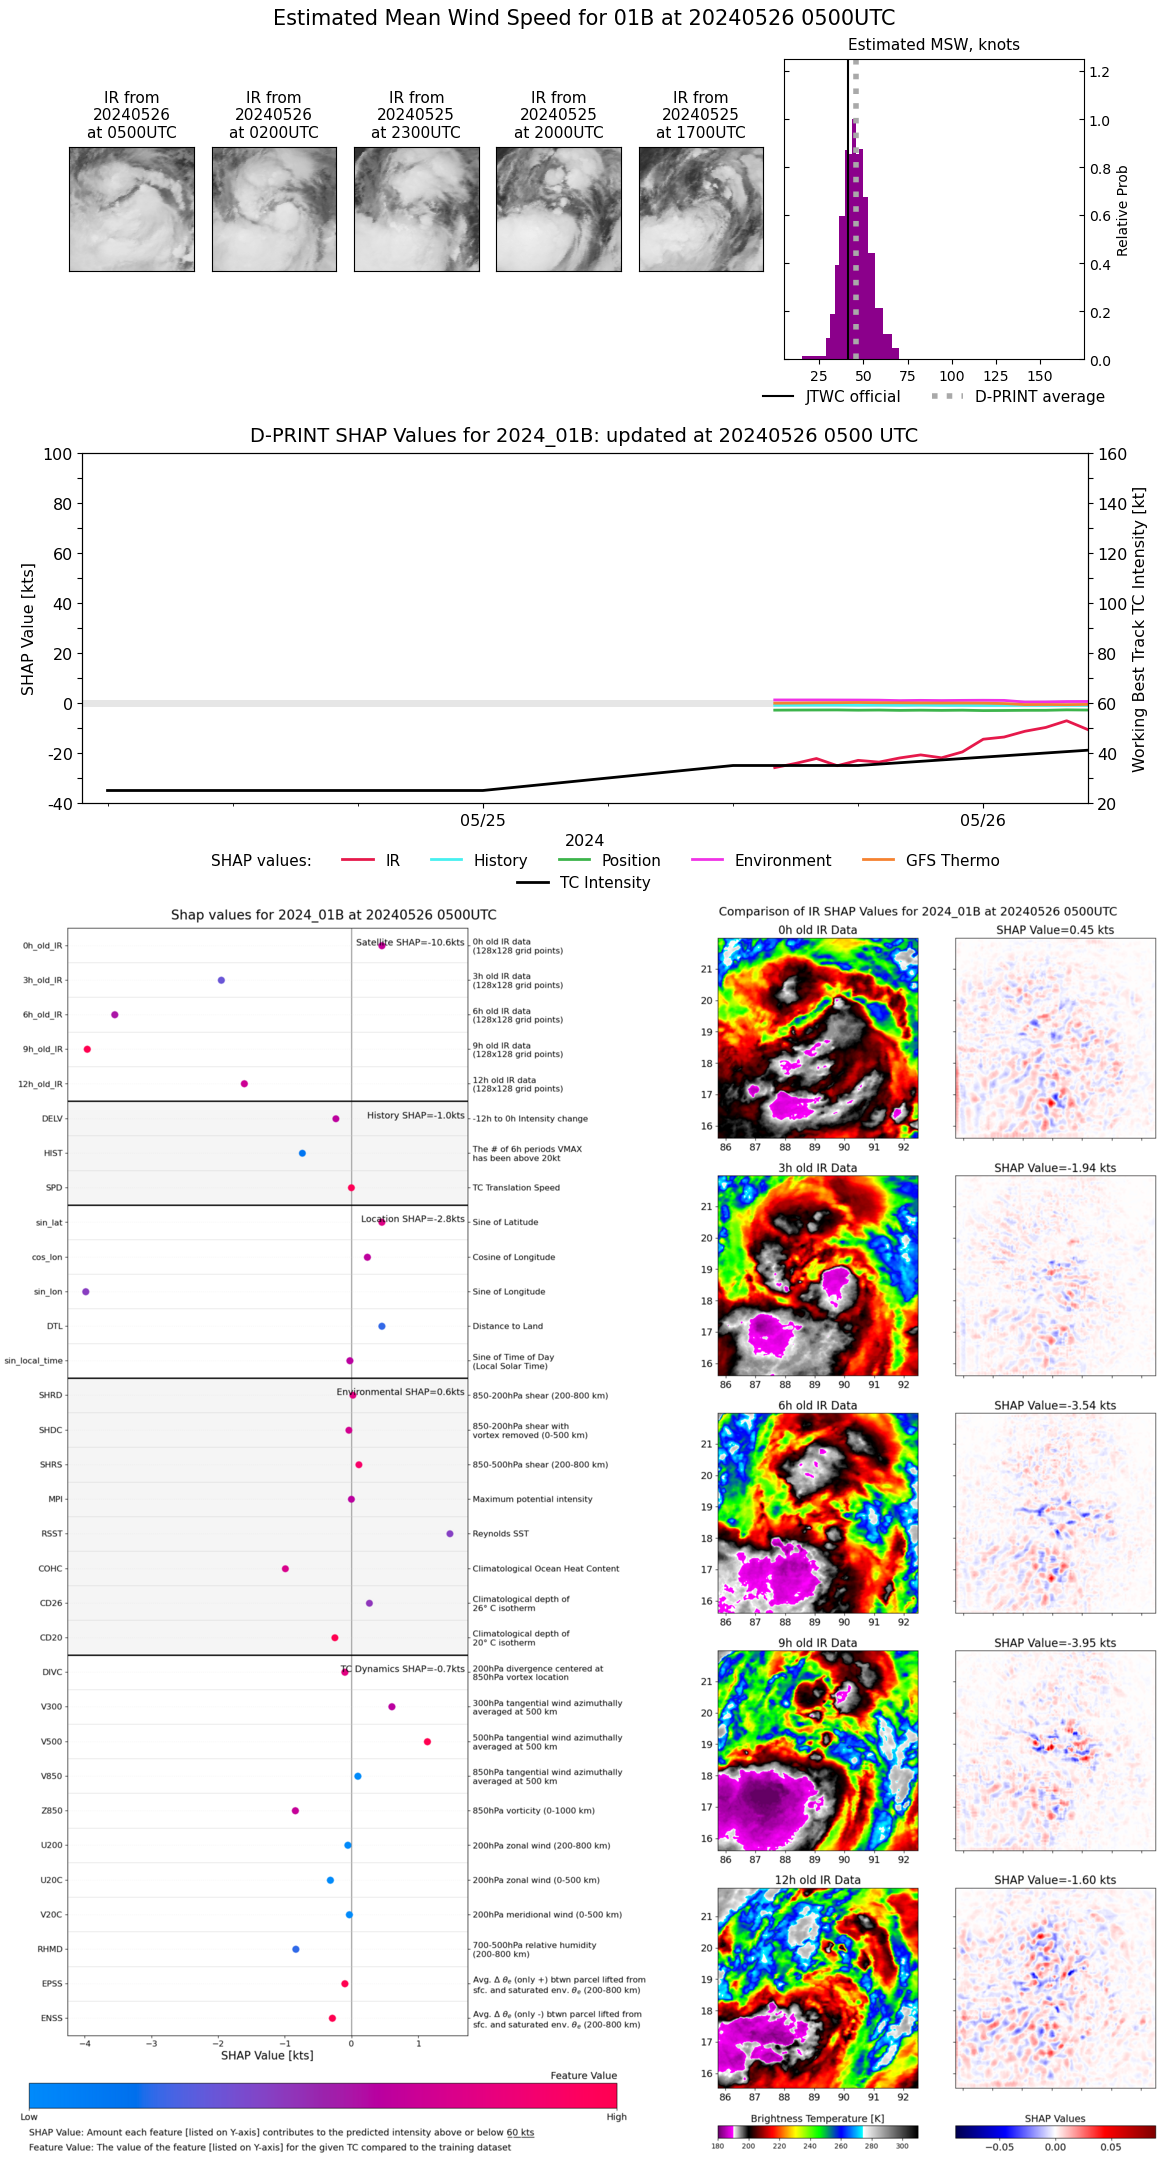 |
| 20240526 | 0400 UTC | 986 hPa | 49 kts | 44 kts | 55 kts | 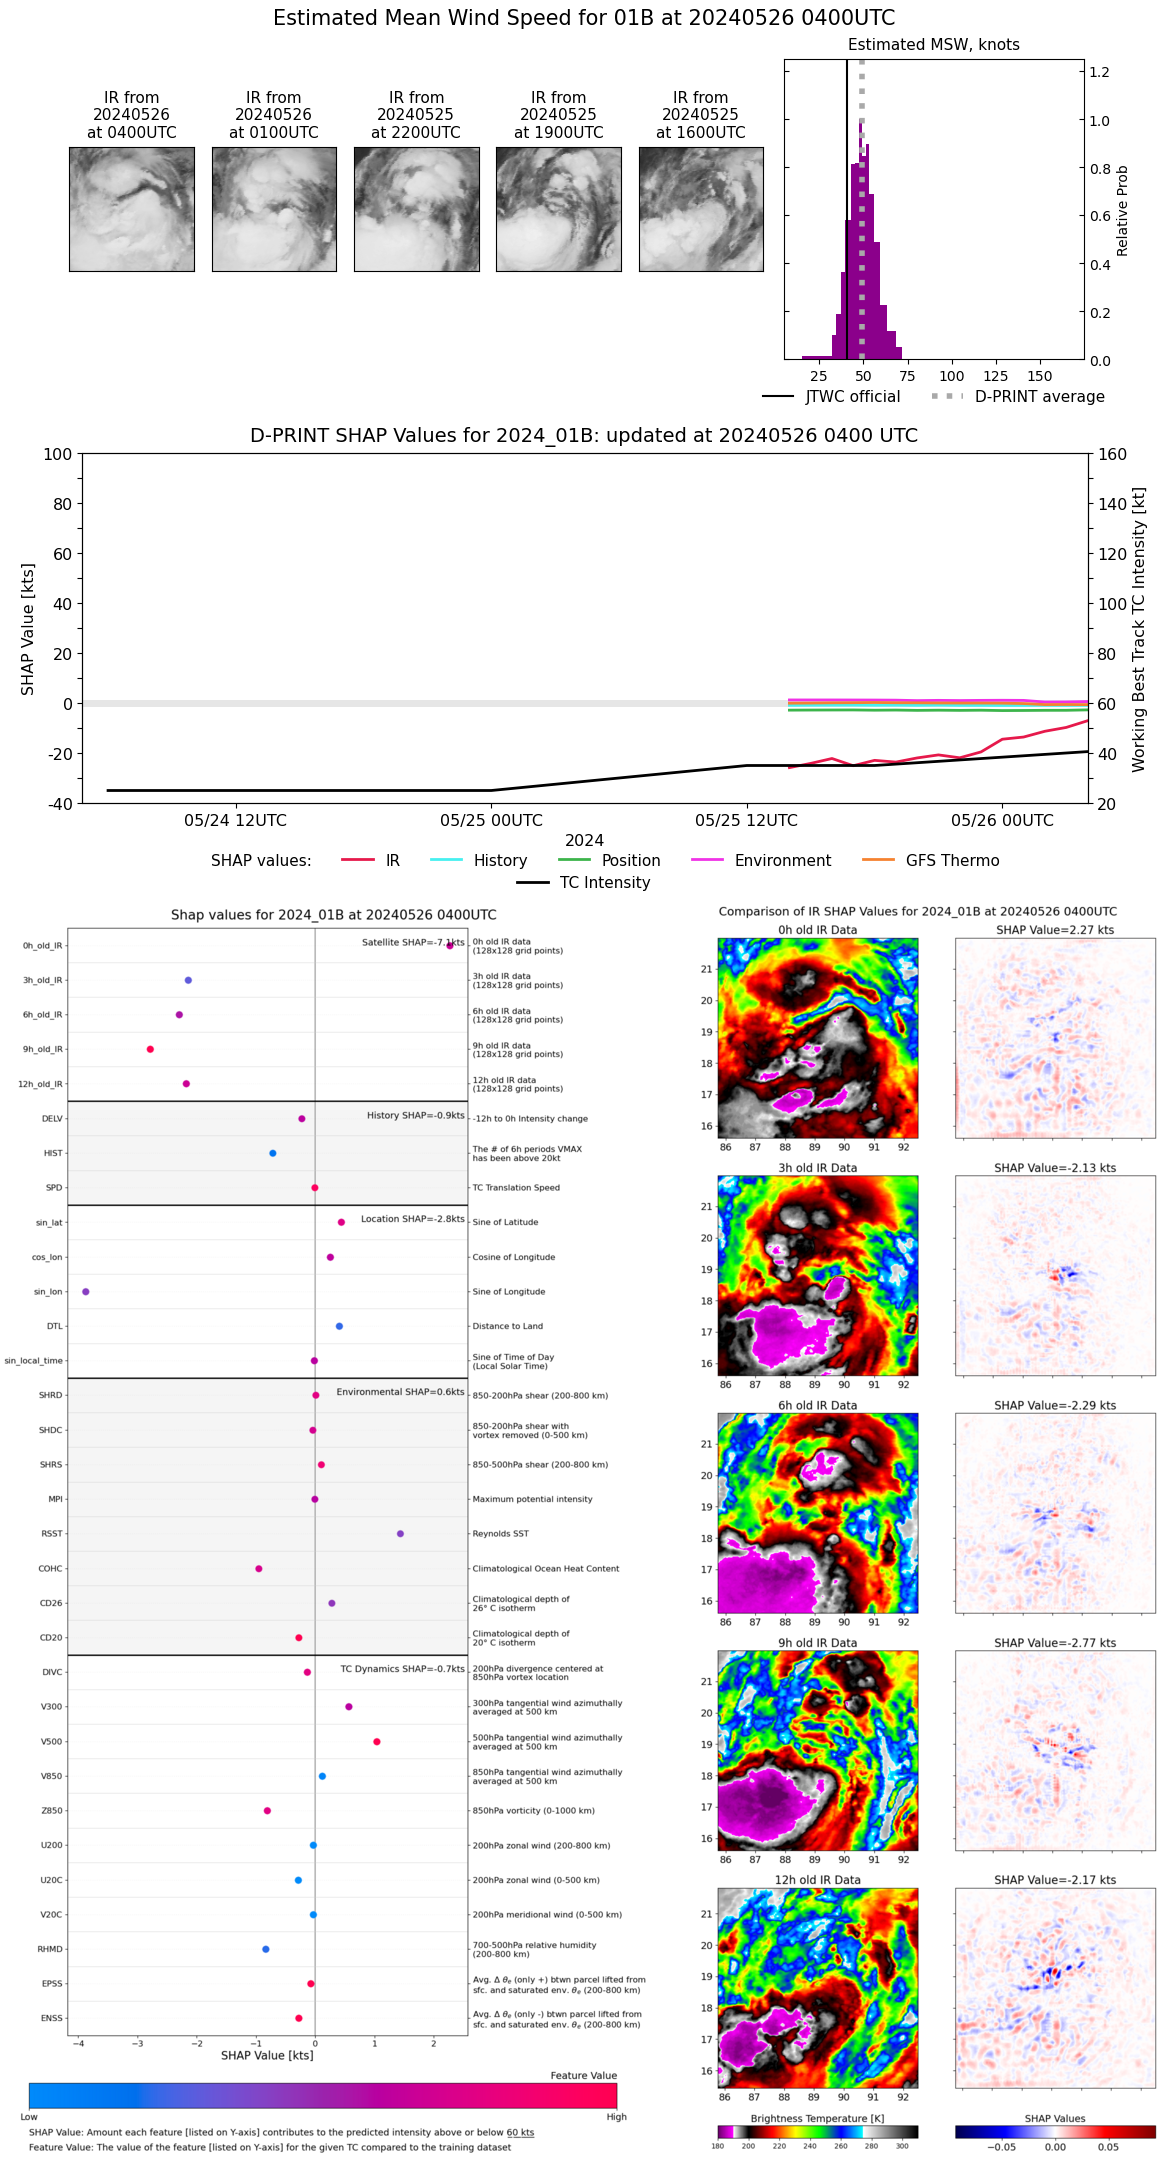 |
| 20240526 | 0300 UTC | 985 hPa | 46 kts | 41 kts | 51 kts | 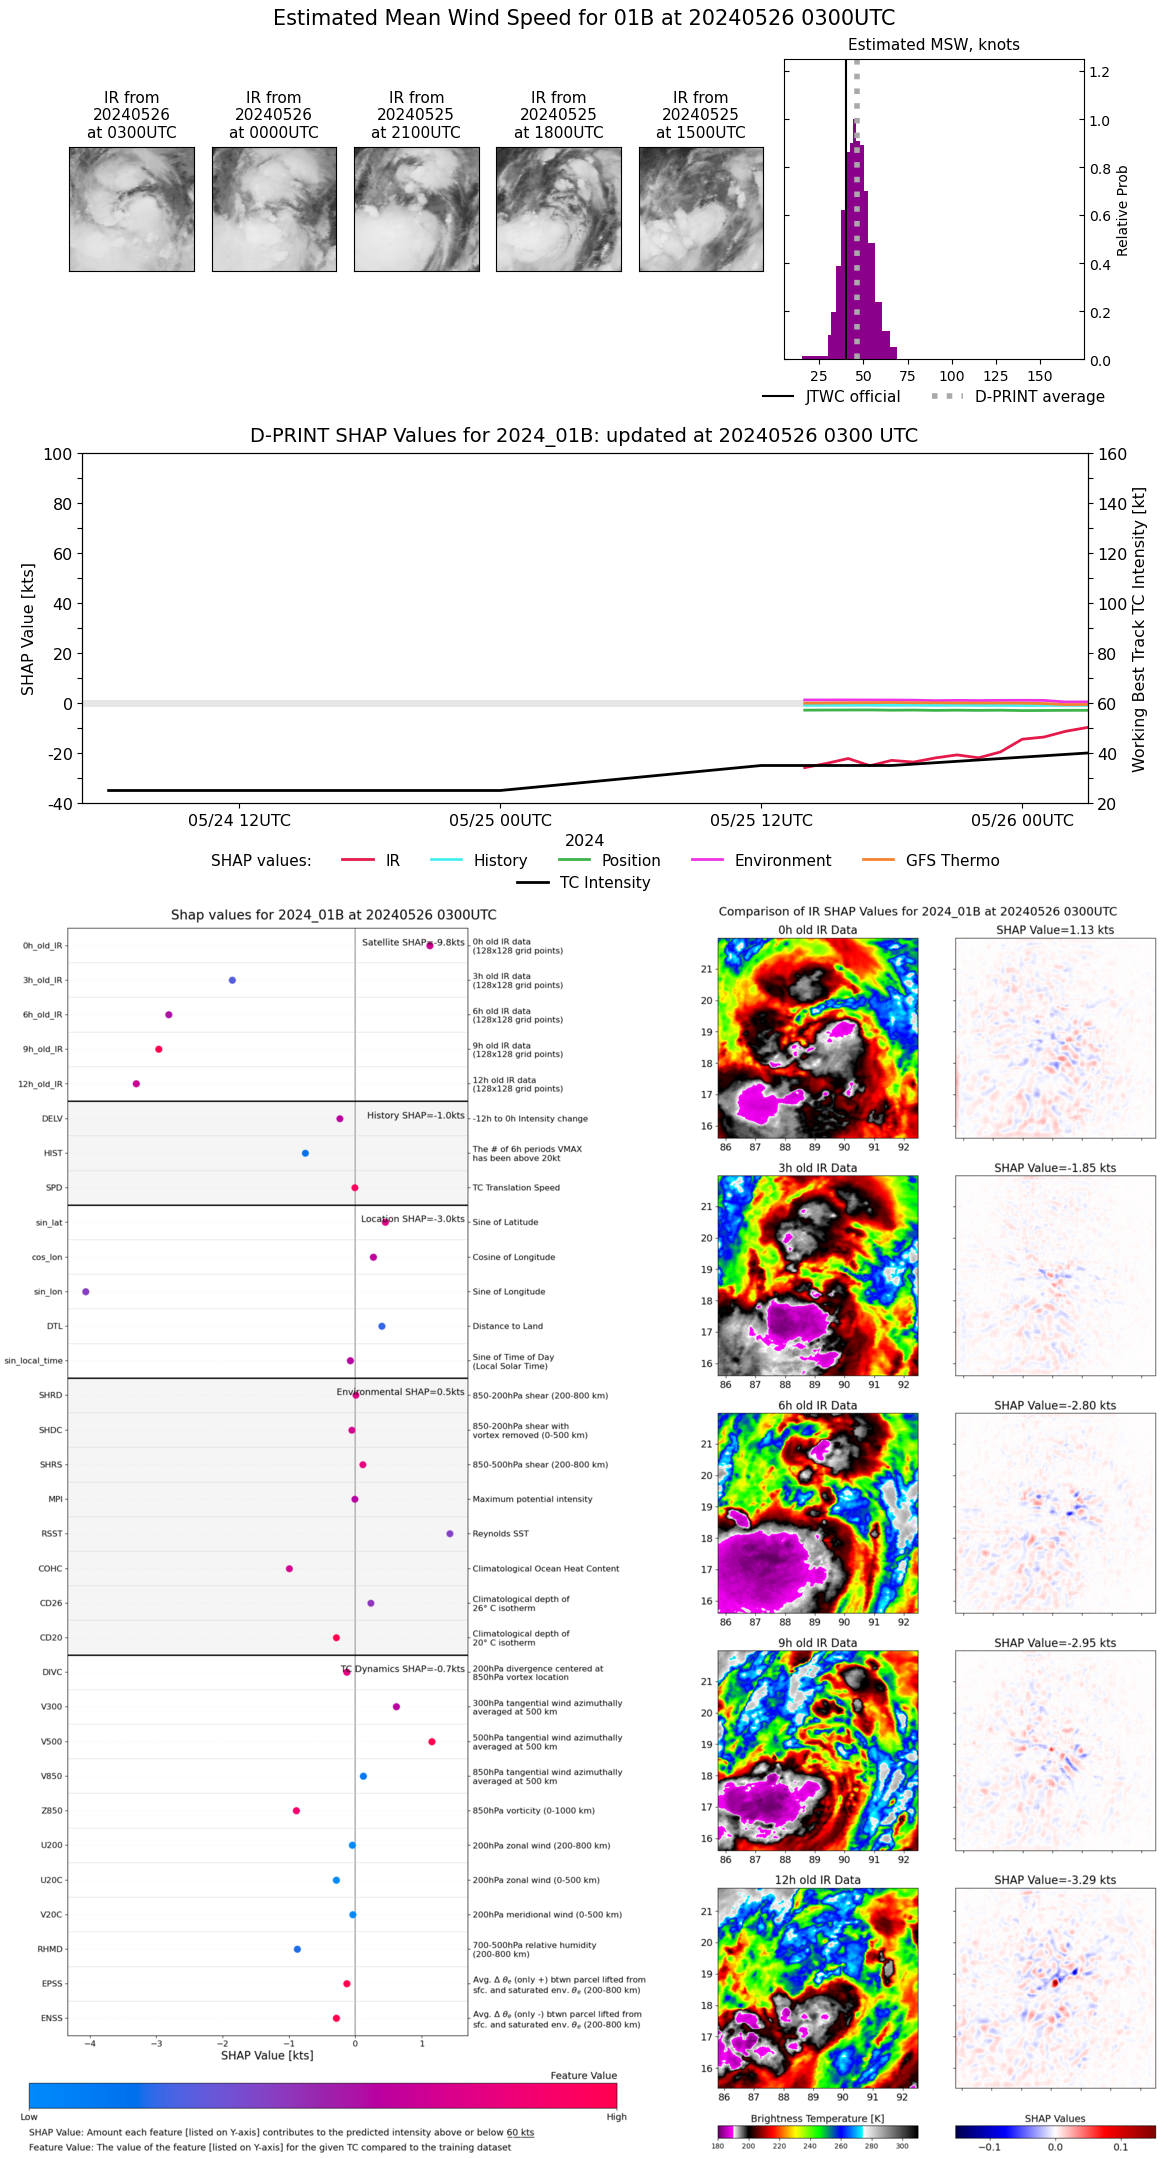 |
| 20240526 | 0200 UTC | 987 hPa | 44 kts | 40 kts | 50 kts | 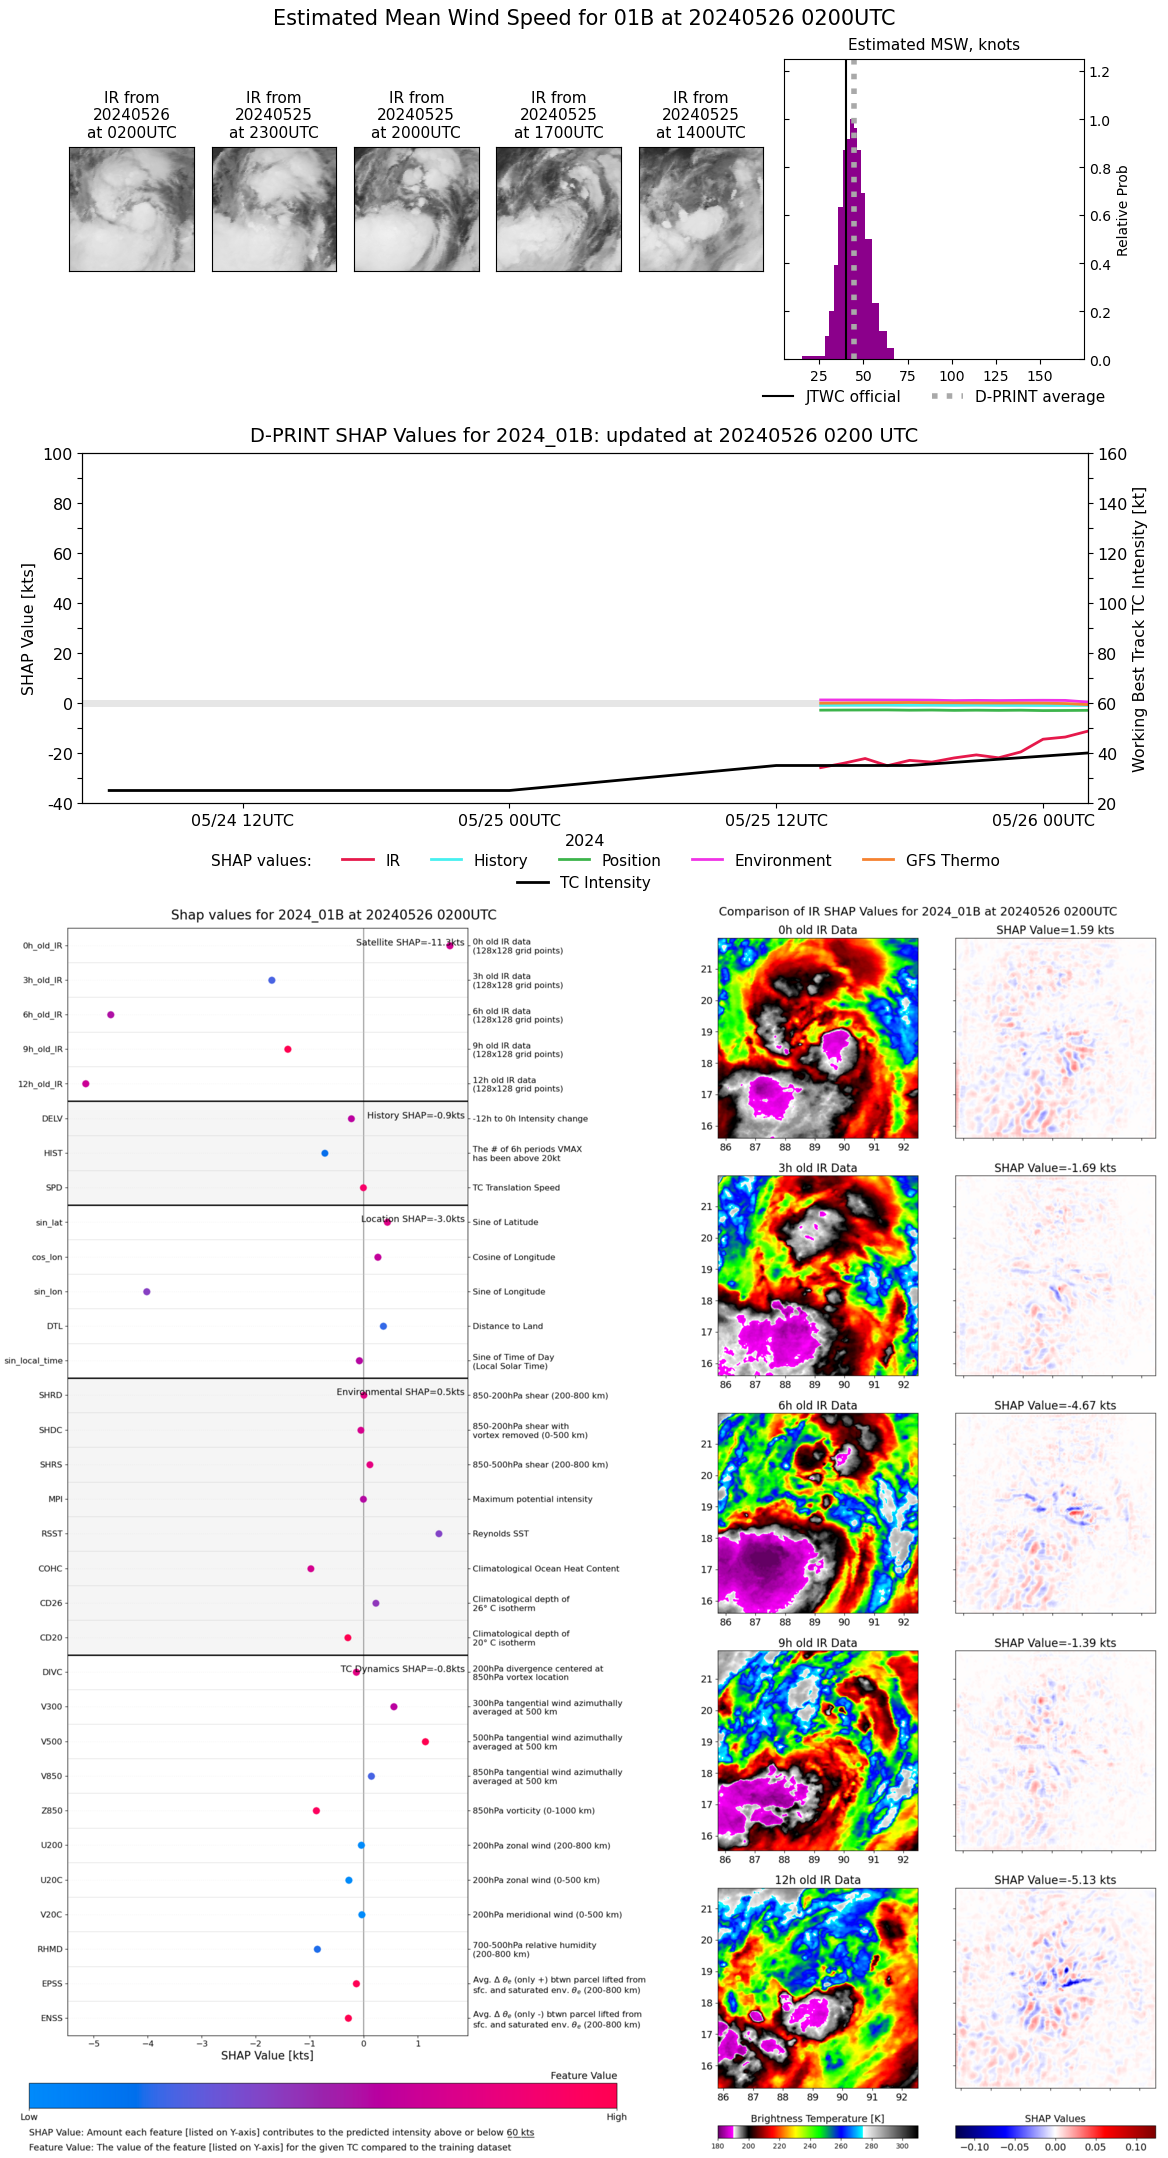 |
| 20240526 | 0100 UTC | 987 hPa | 43 kts | 38 kts | 49 kts | 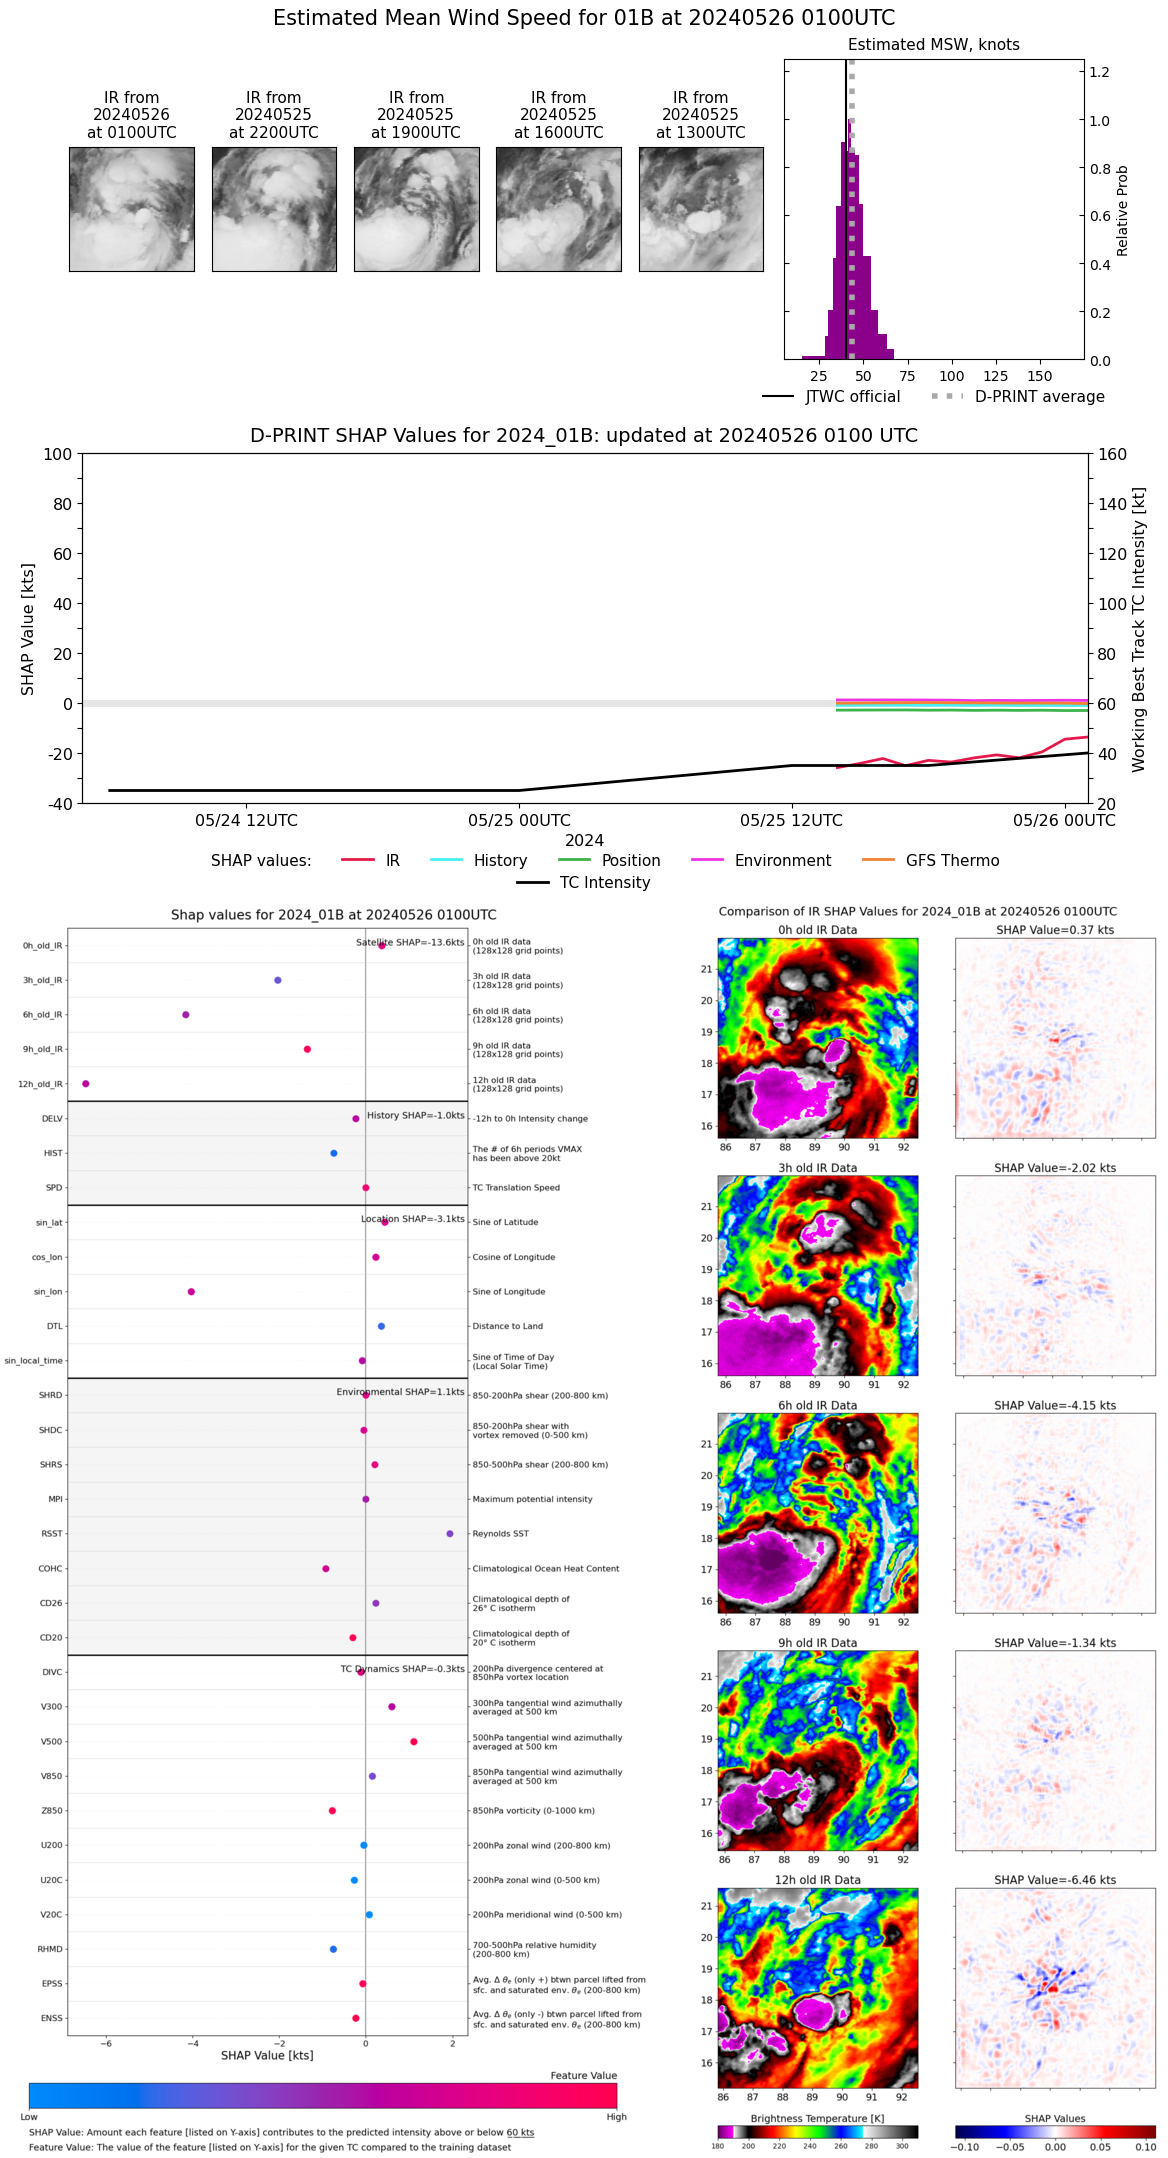 |
| 20240526 | 0000 UTC | 988 hPa | 43 kts | 38 kts | 48 kts | 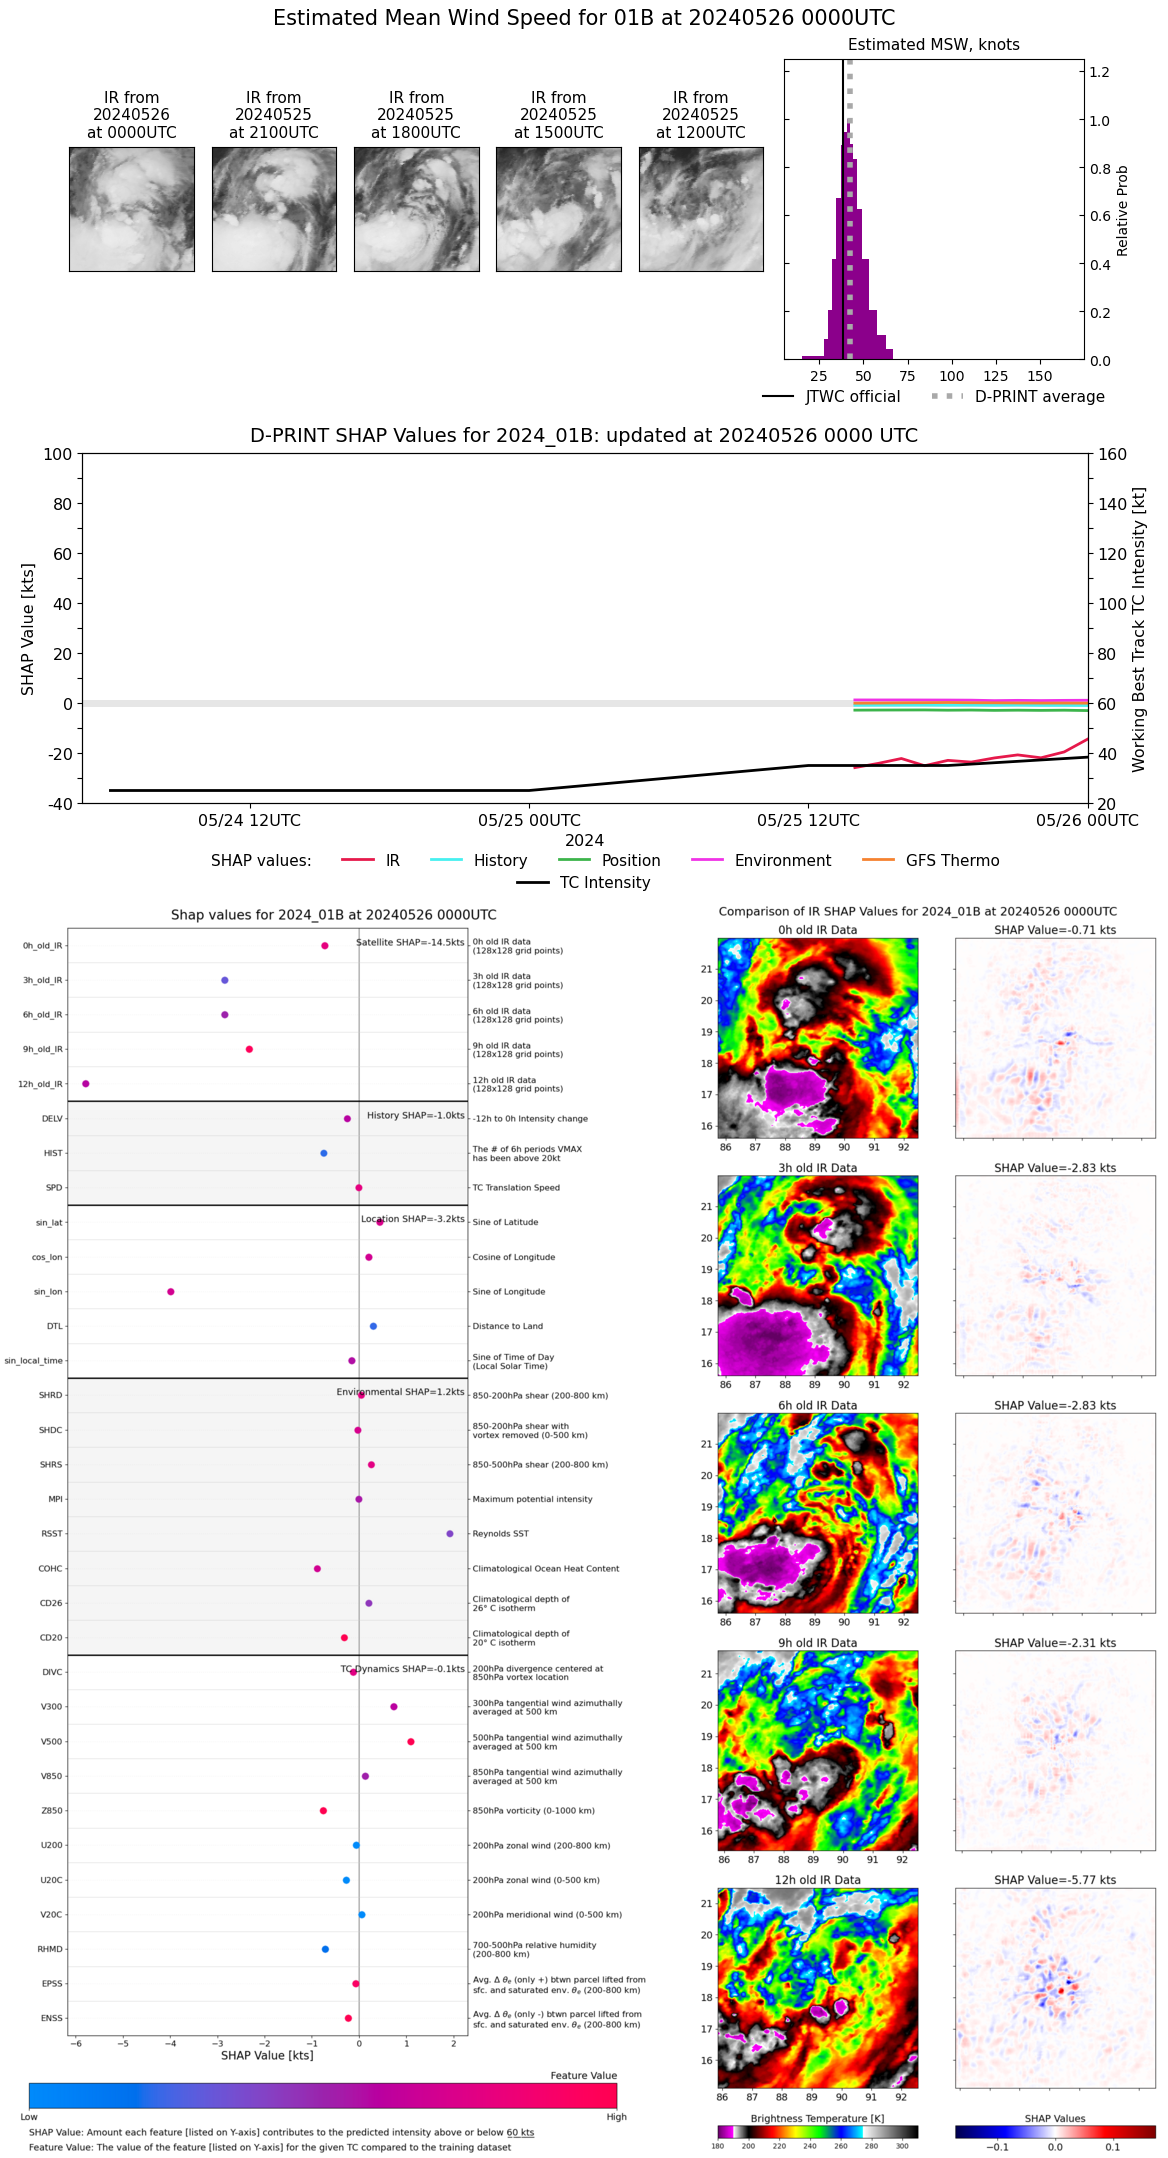 |
| 20240525 | 2300 UTC | 989 hPa | 38 kts | 34 kts | 42 kts | 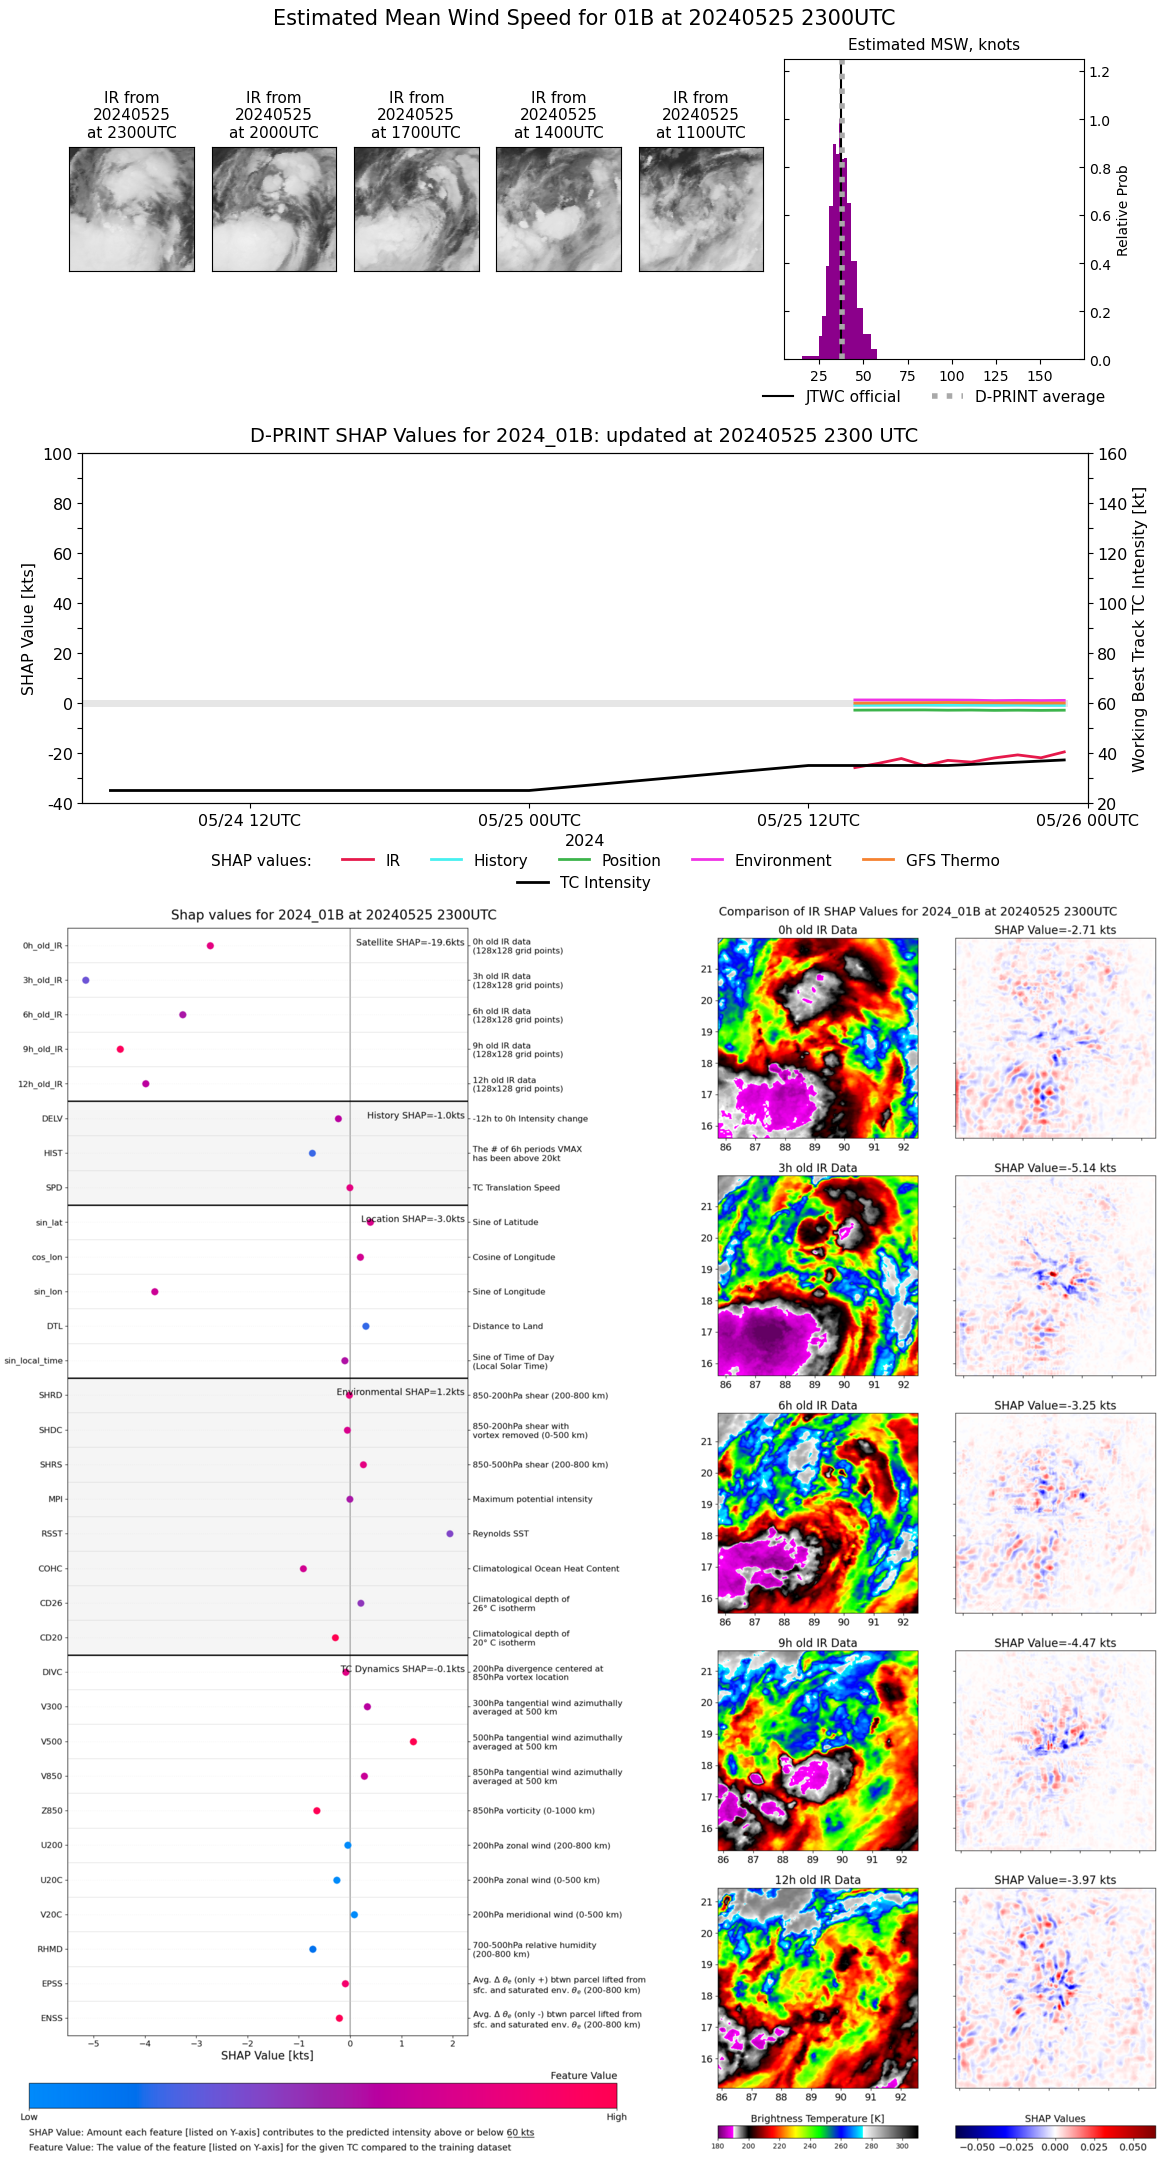 |
| 20240525 | 2200 UTC | 991 hPa | 35 kts | 32 kts | 39 kts | 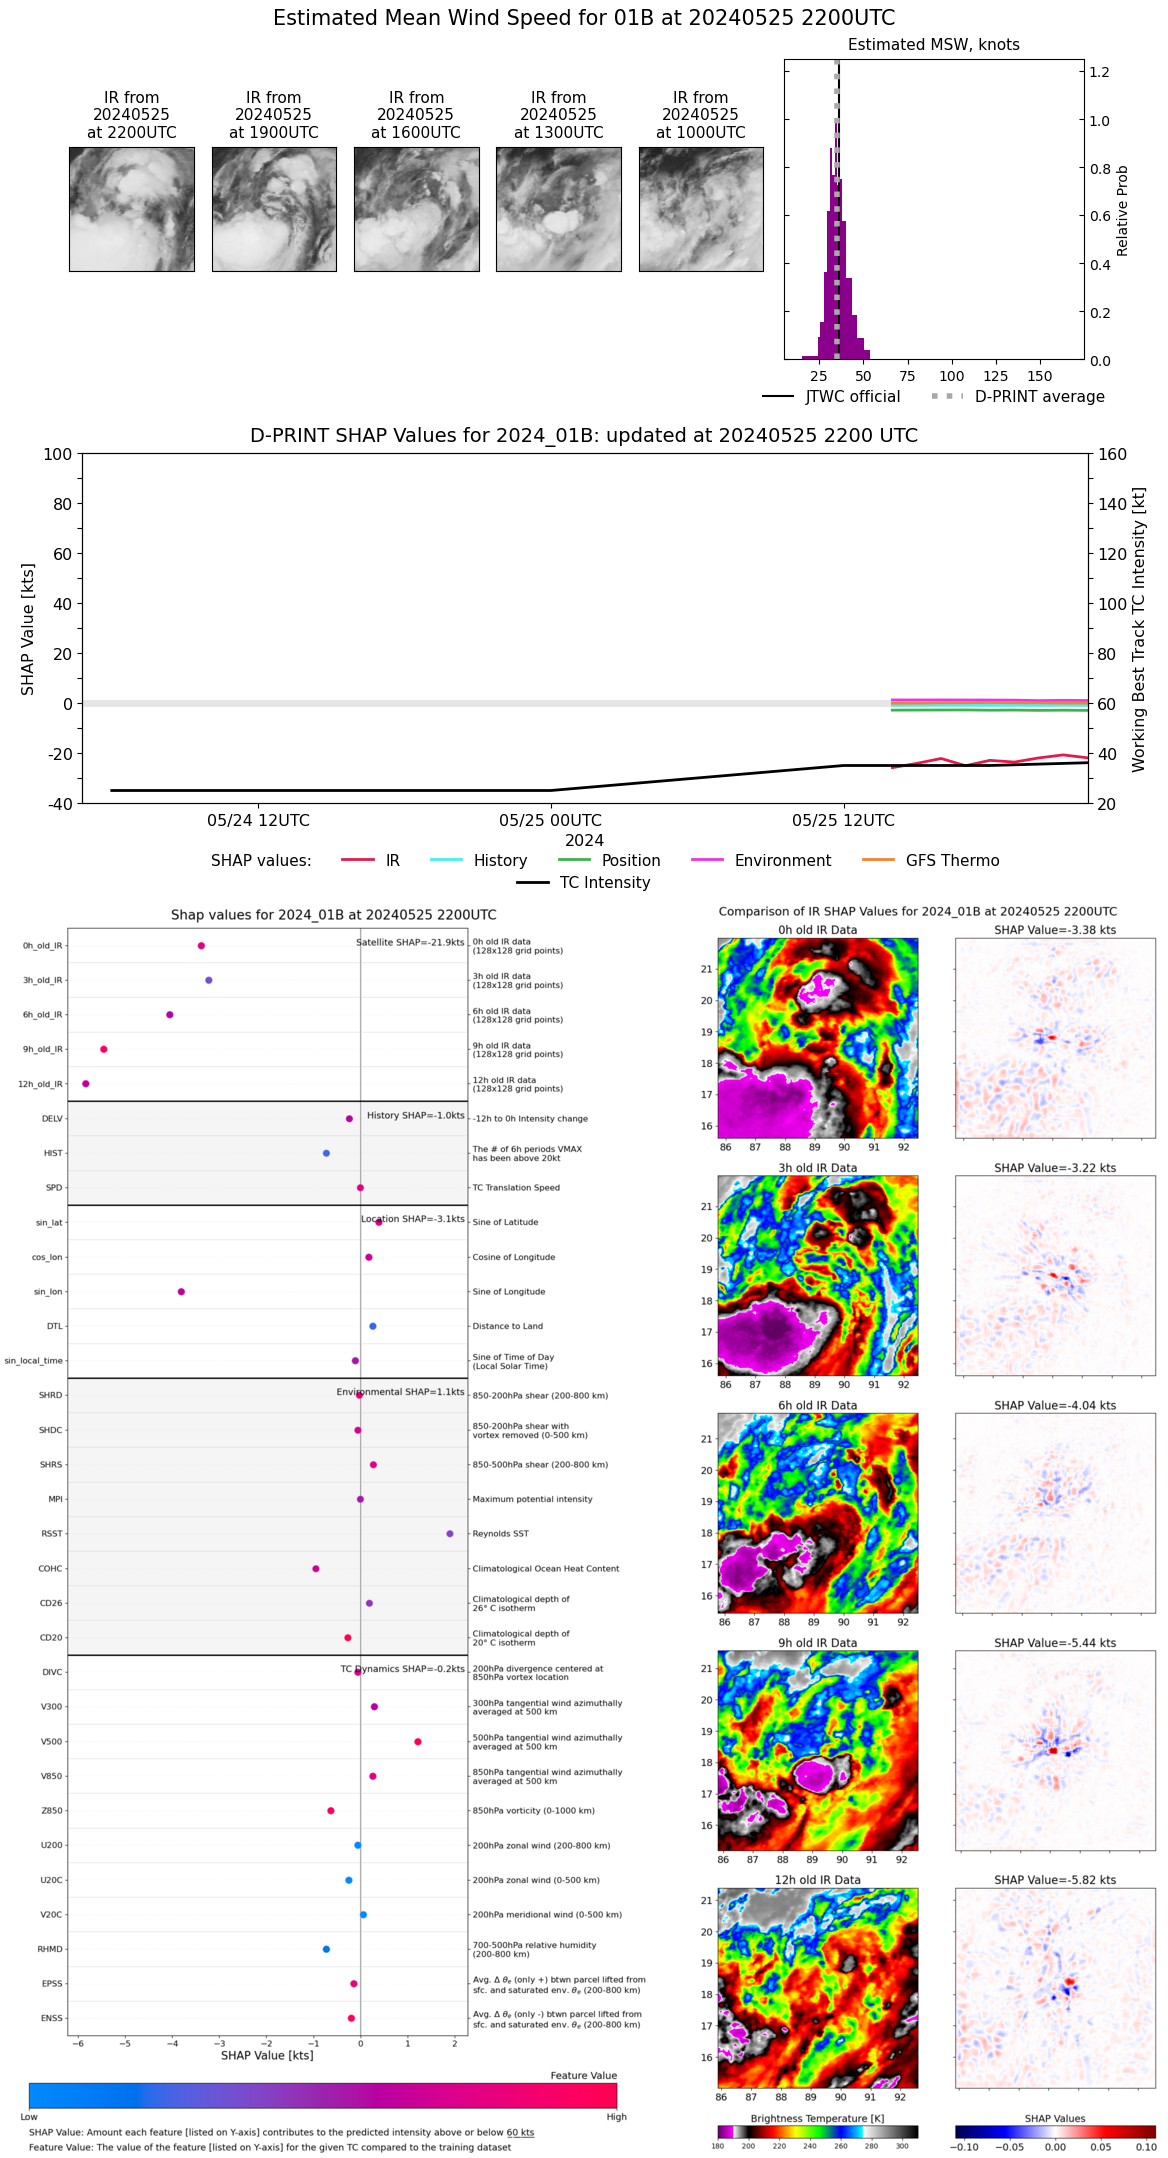 |
| 20240525 | 2100 UTC | 990 hPa | 37 kts | 33 kts | 41 kts | 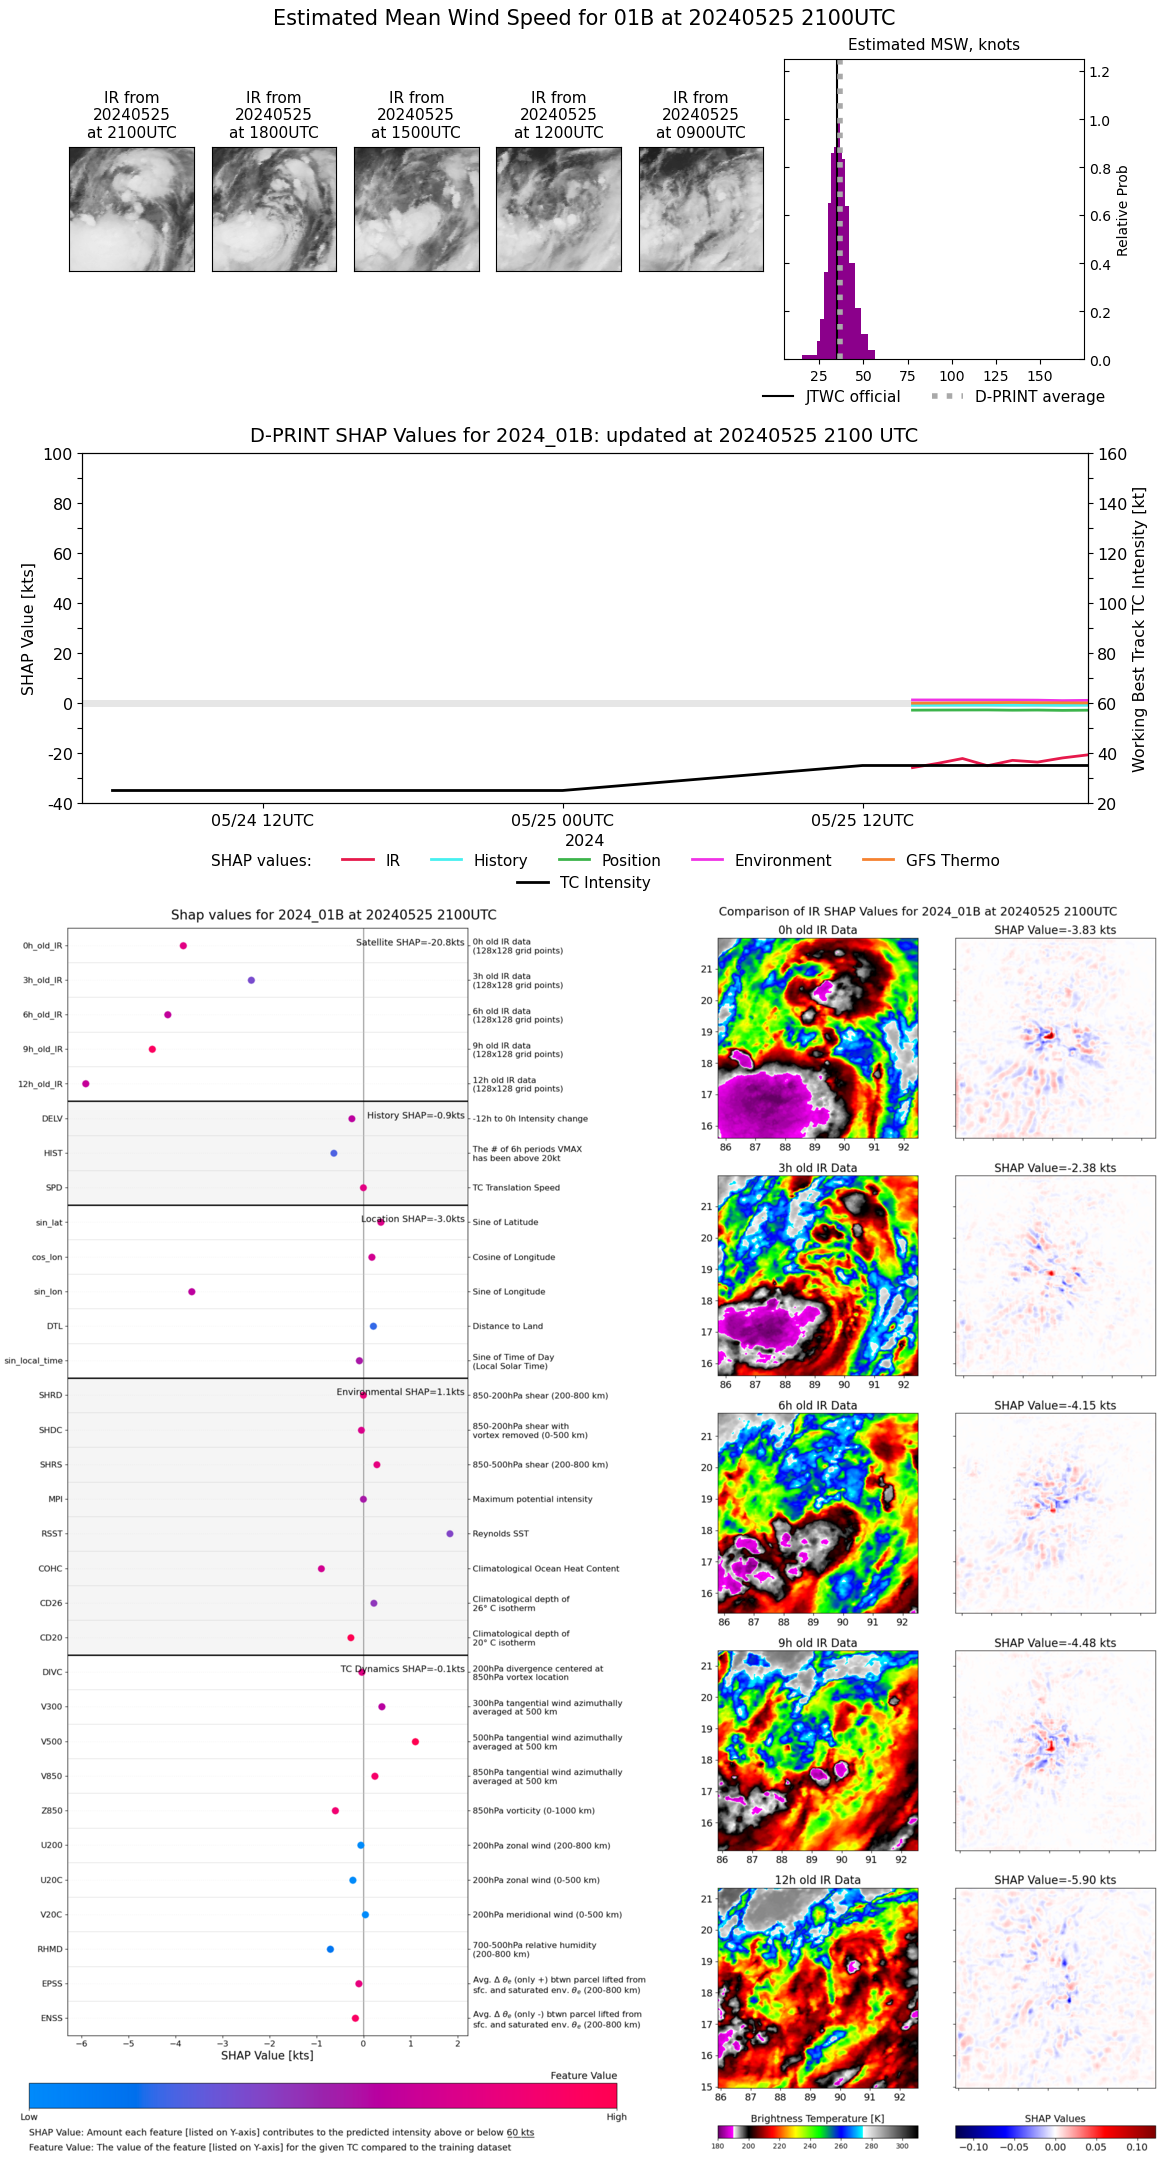 |
| 20240525 | 2000 UTC | 992 hPa | 35 kts | 32 kts | 39 kts | 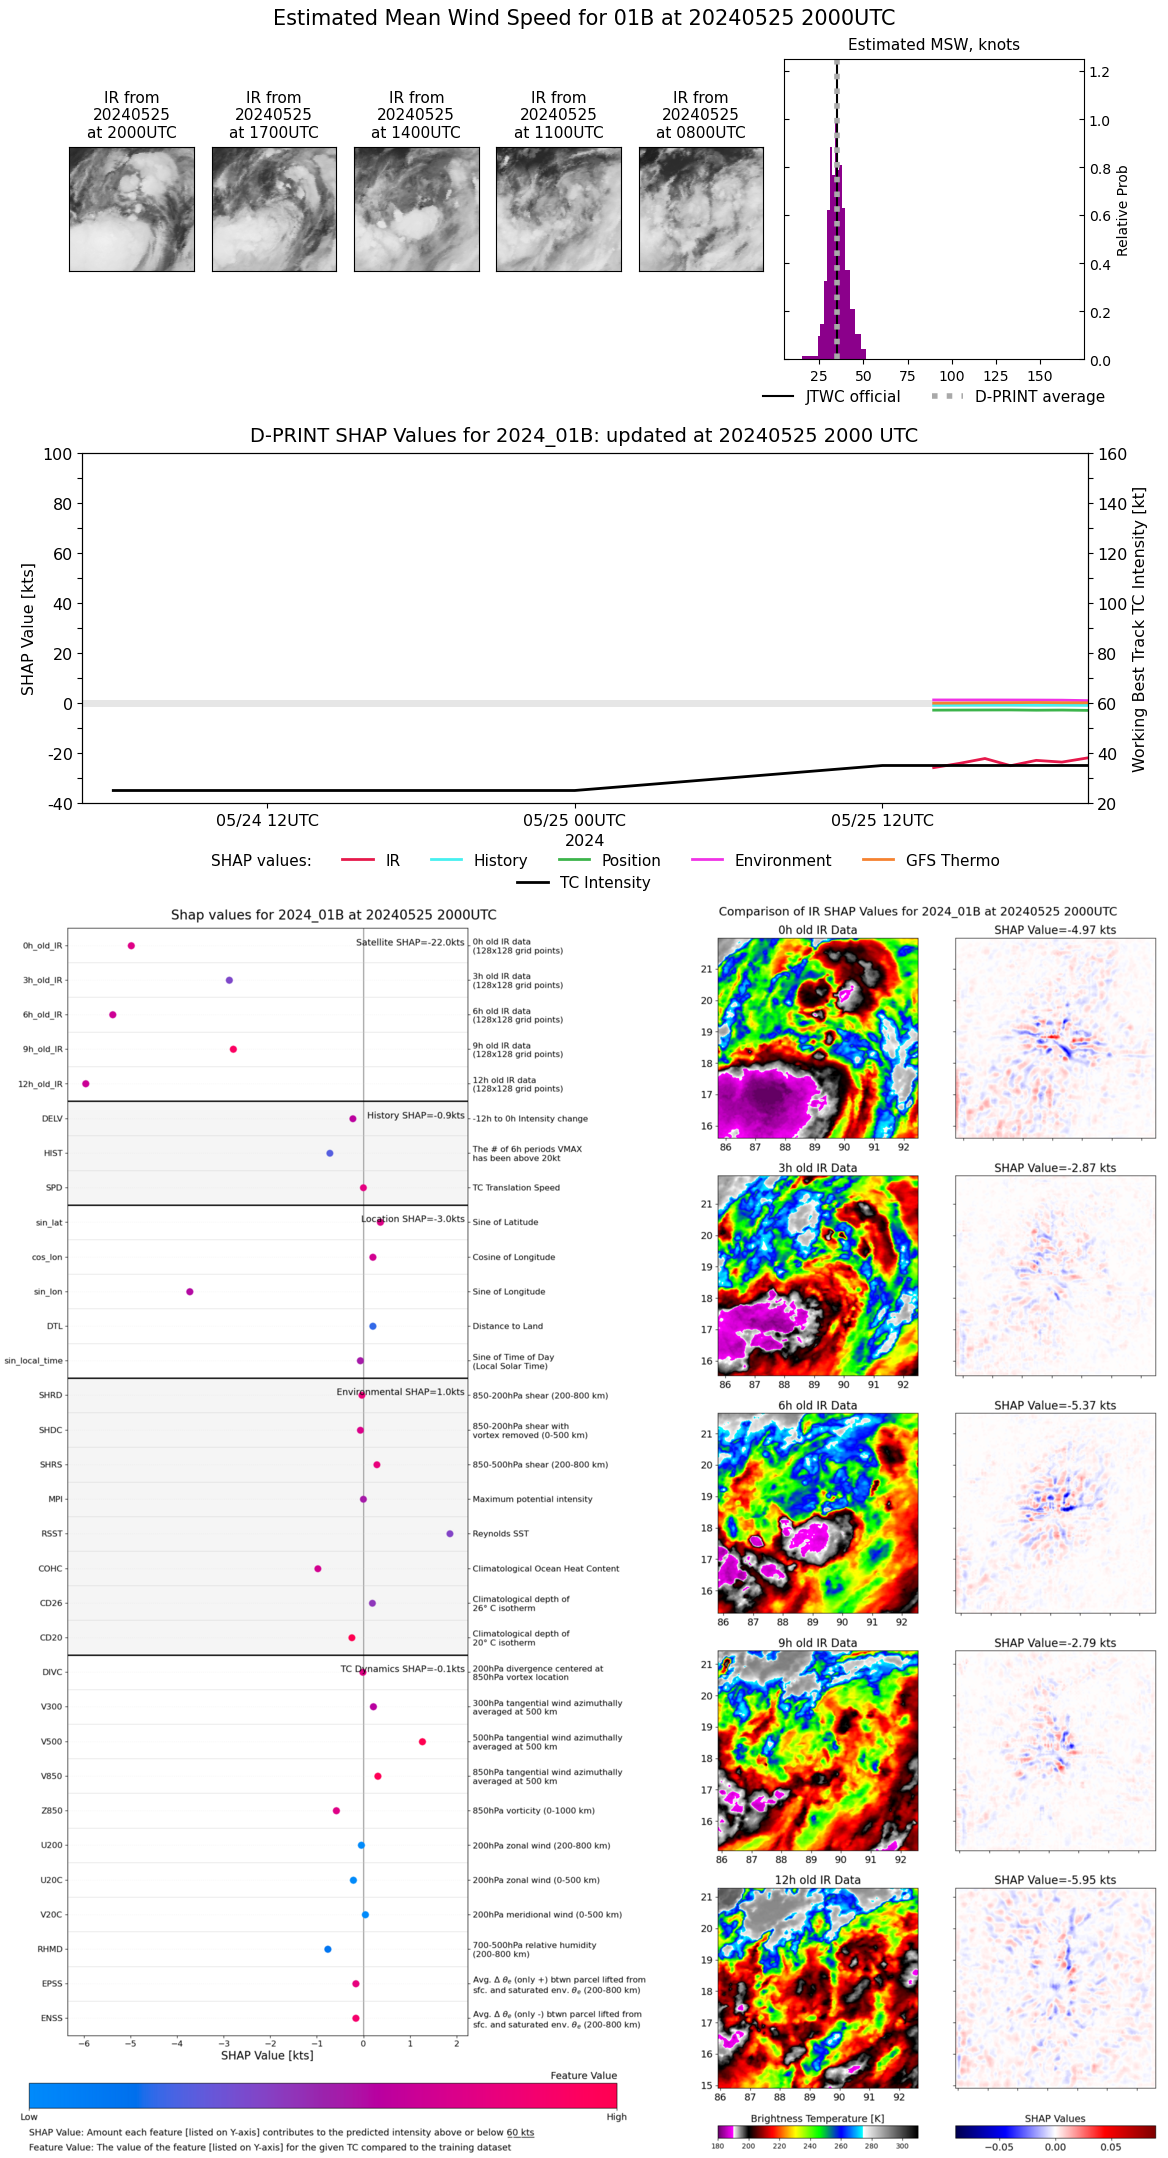 |
| 20240525 | 1900 UTC | 991 hPa | 34 kts | 31 kts | 38 kts | 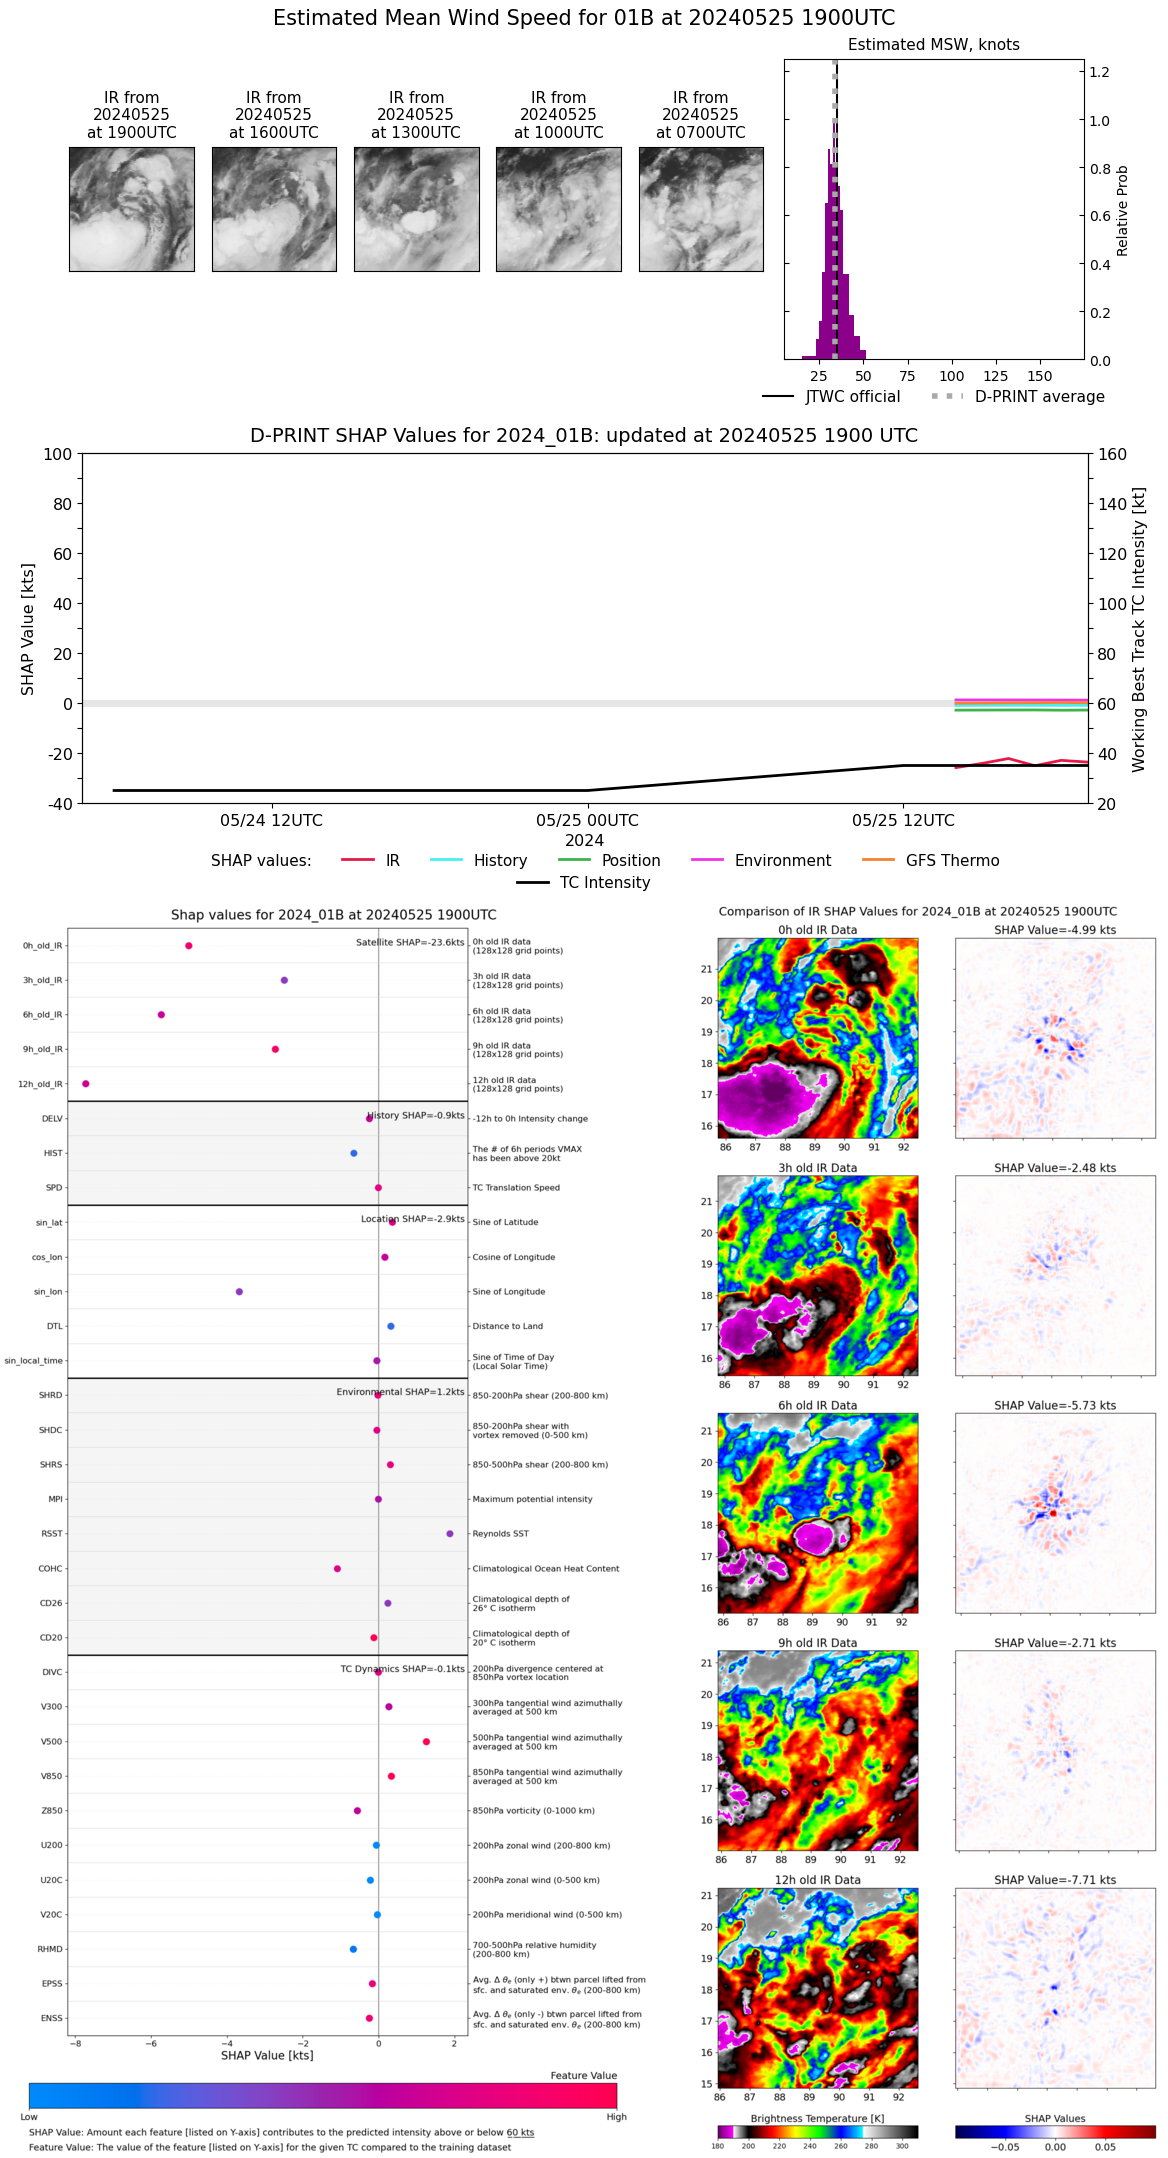 |
| 20240525 | 1800 UTC | 990 hPa | 35 kts | 31 kts | 38 kts | 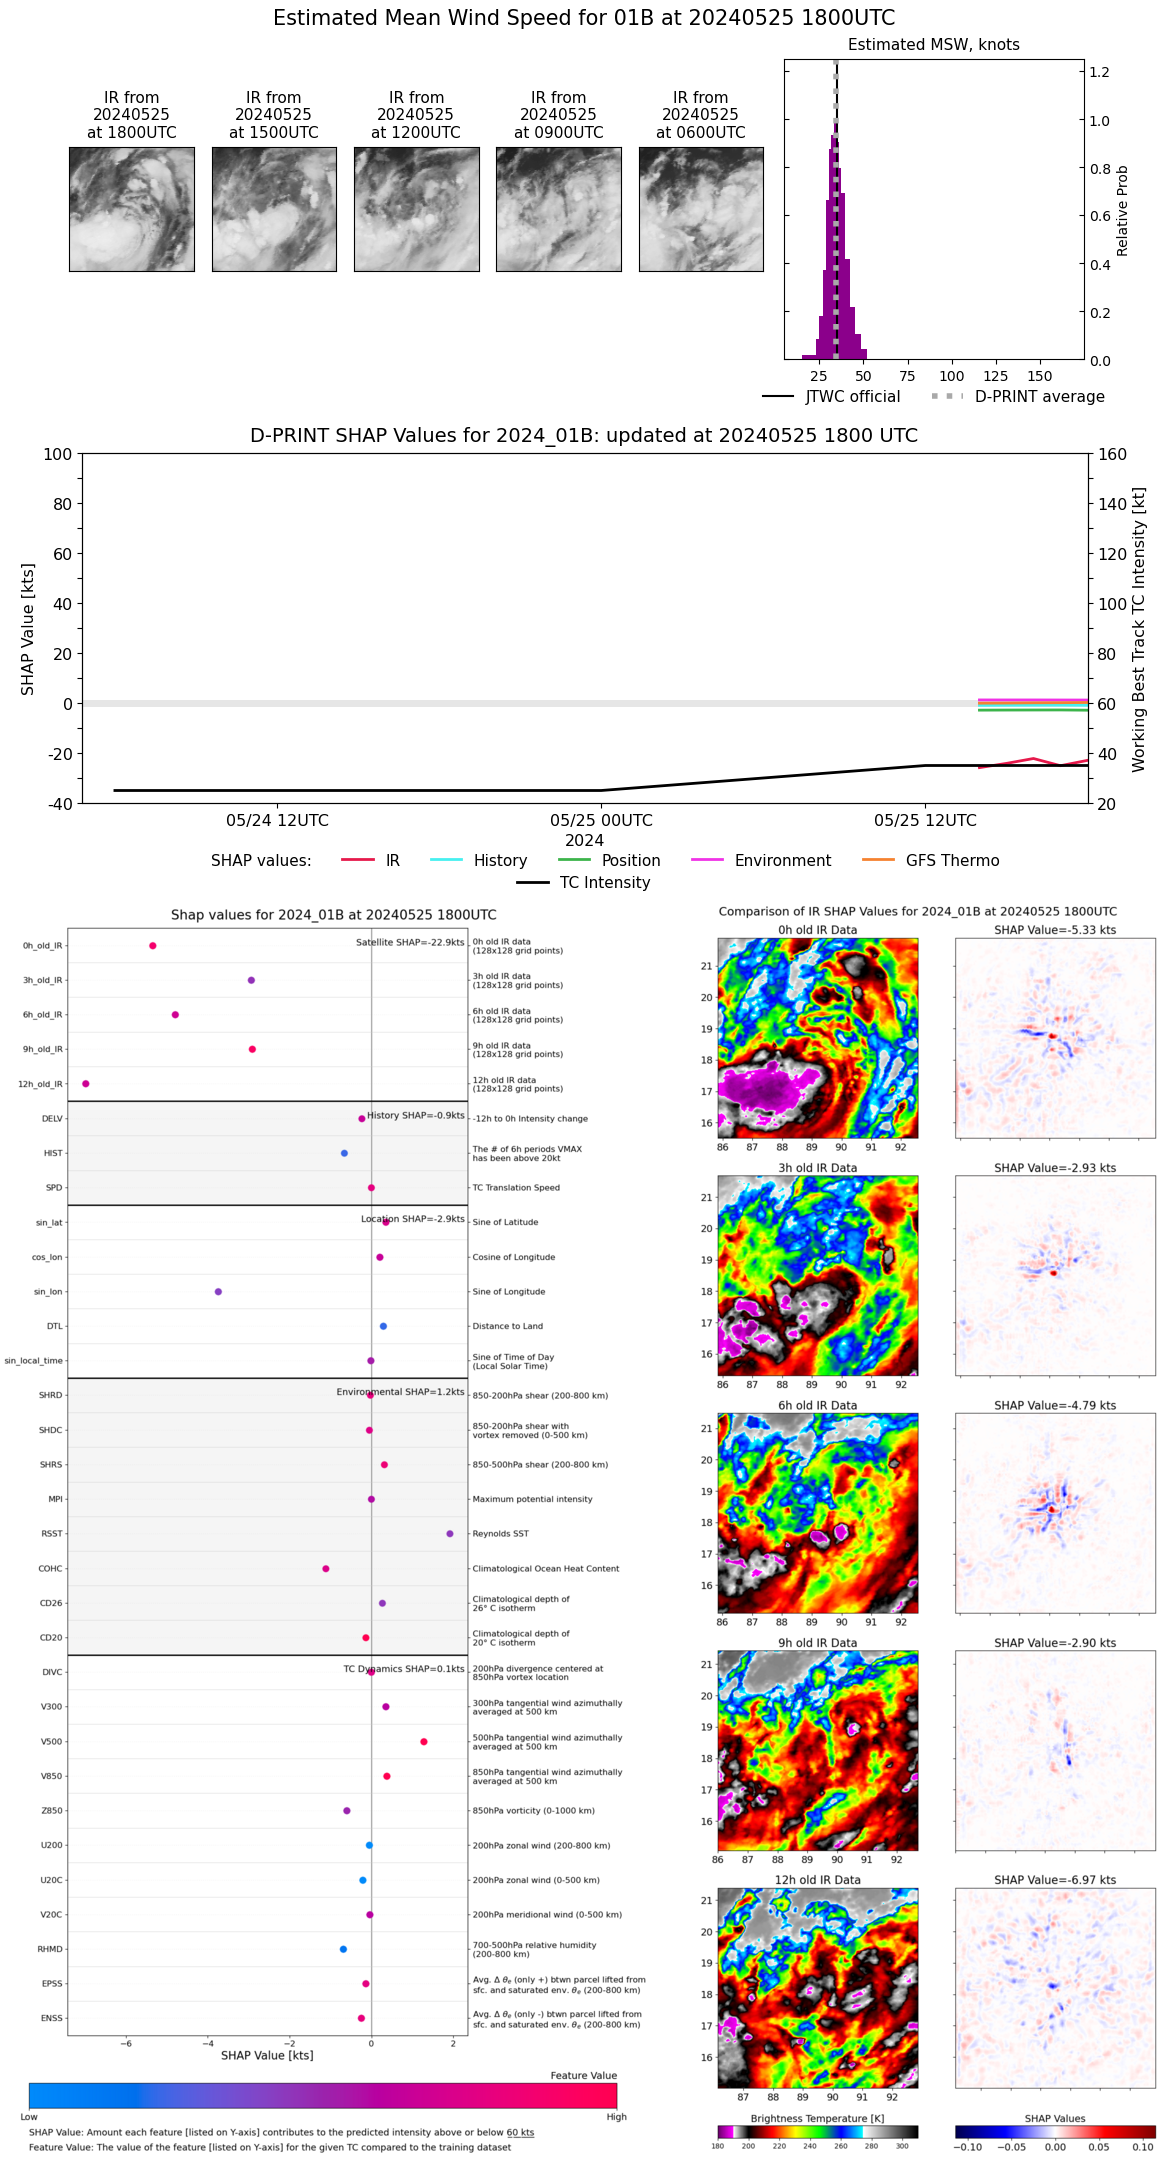 |
| 20240525 | 1700 UTC | 991 hPa | 33 kts | 30 kts | 36 kts | 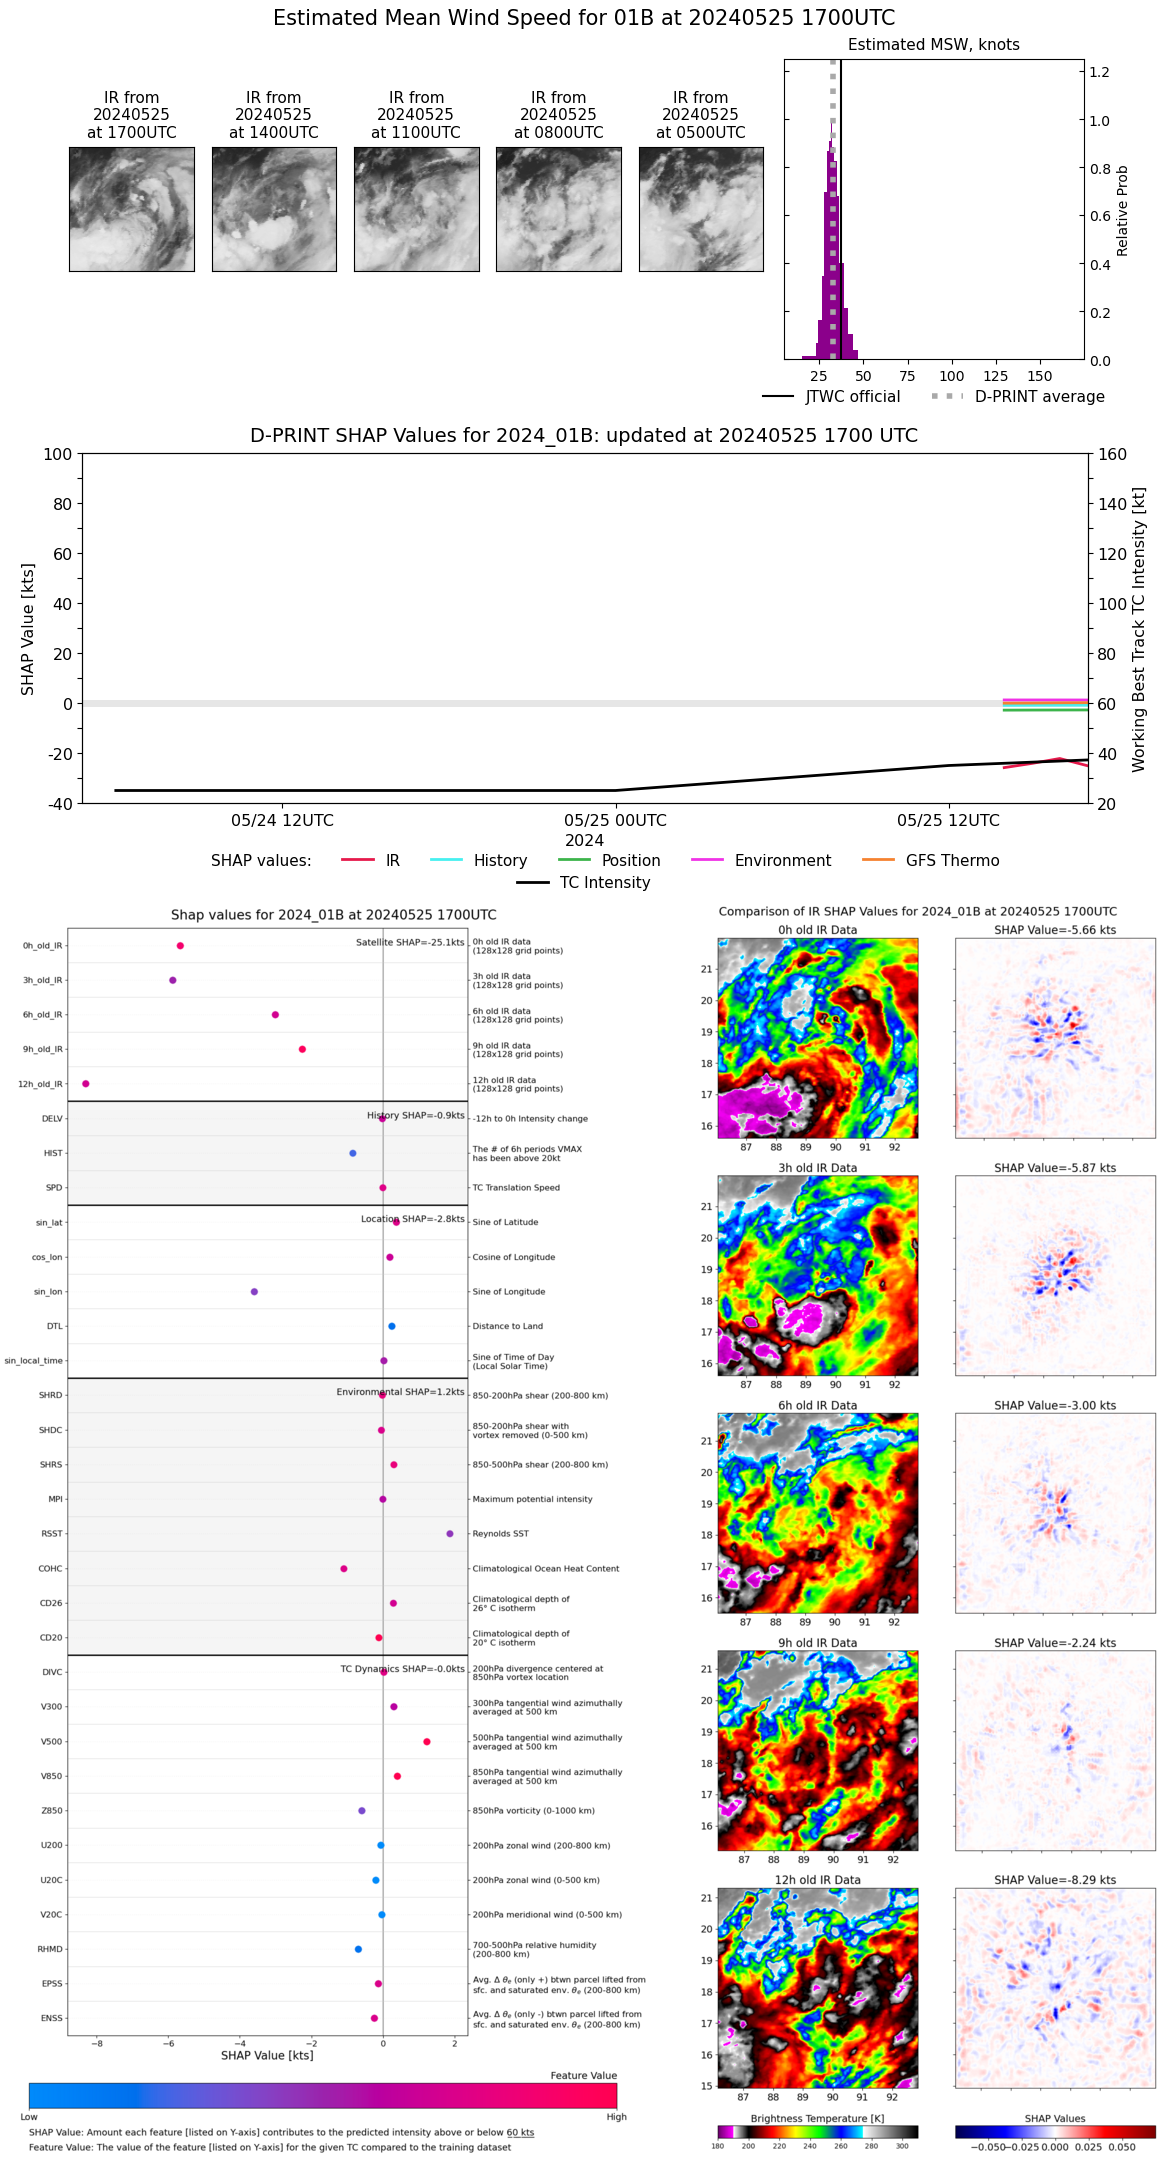 |
| 20240525 | 1600 UTC | 991 hPa | 35 kts | 32 kts | 39 kts |  |
| 20240525 | 1500 UTC | 990 hPa | 33 kts | 31 kts | 36 kts | 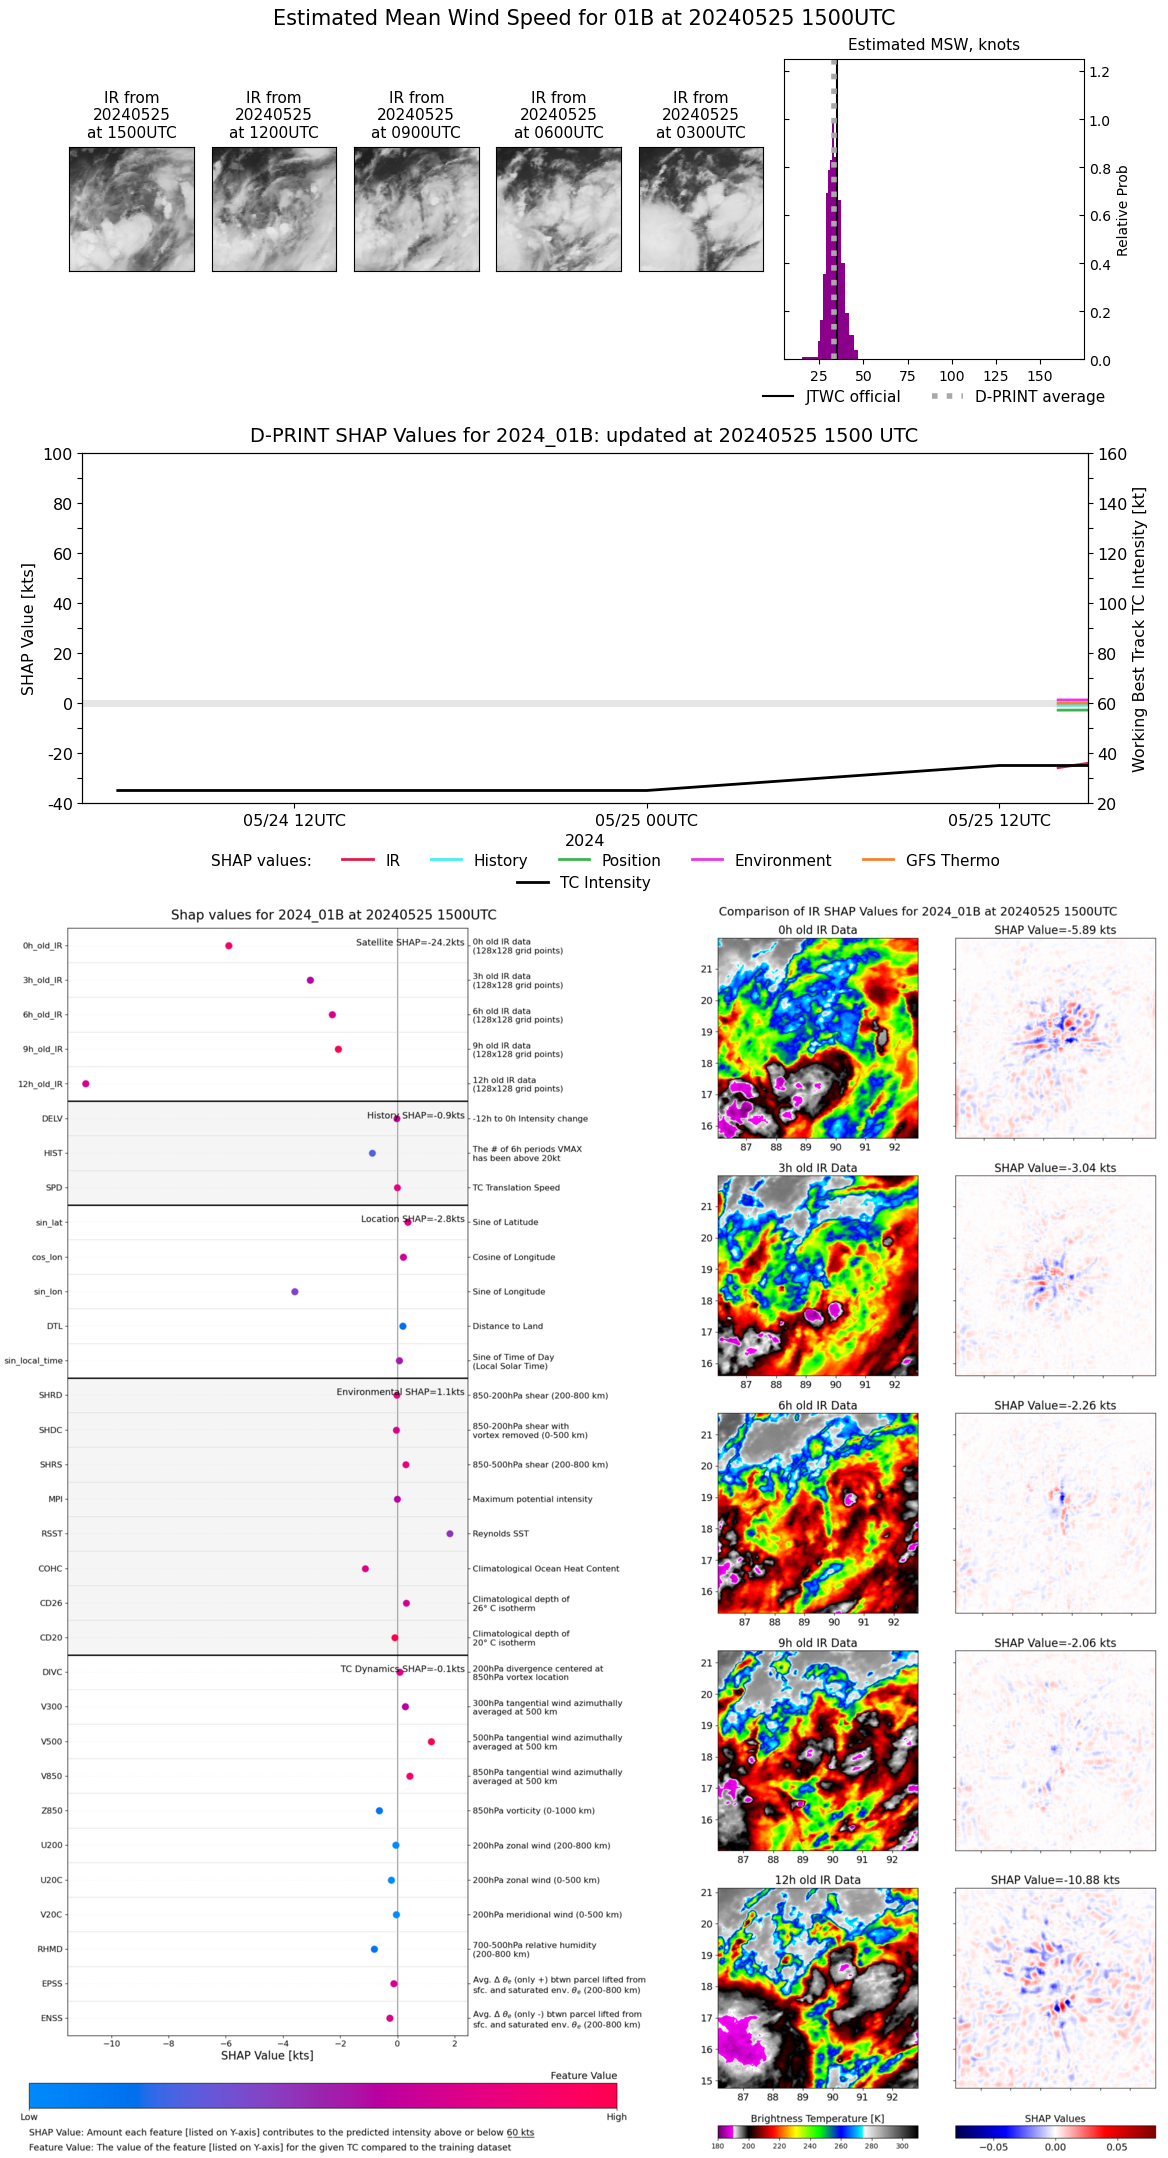 |
| 20240525 | 1400 UTC | 991 hPa | 31 kts | 29 kts | 34 kts | 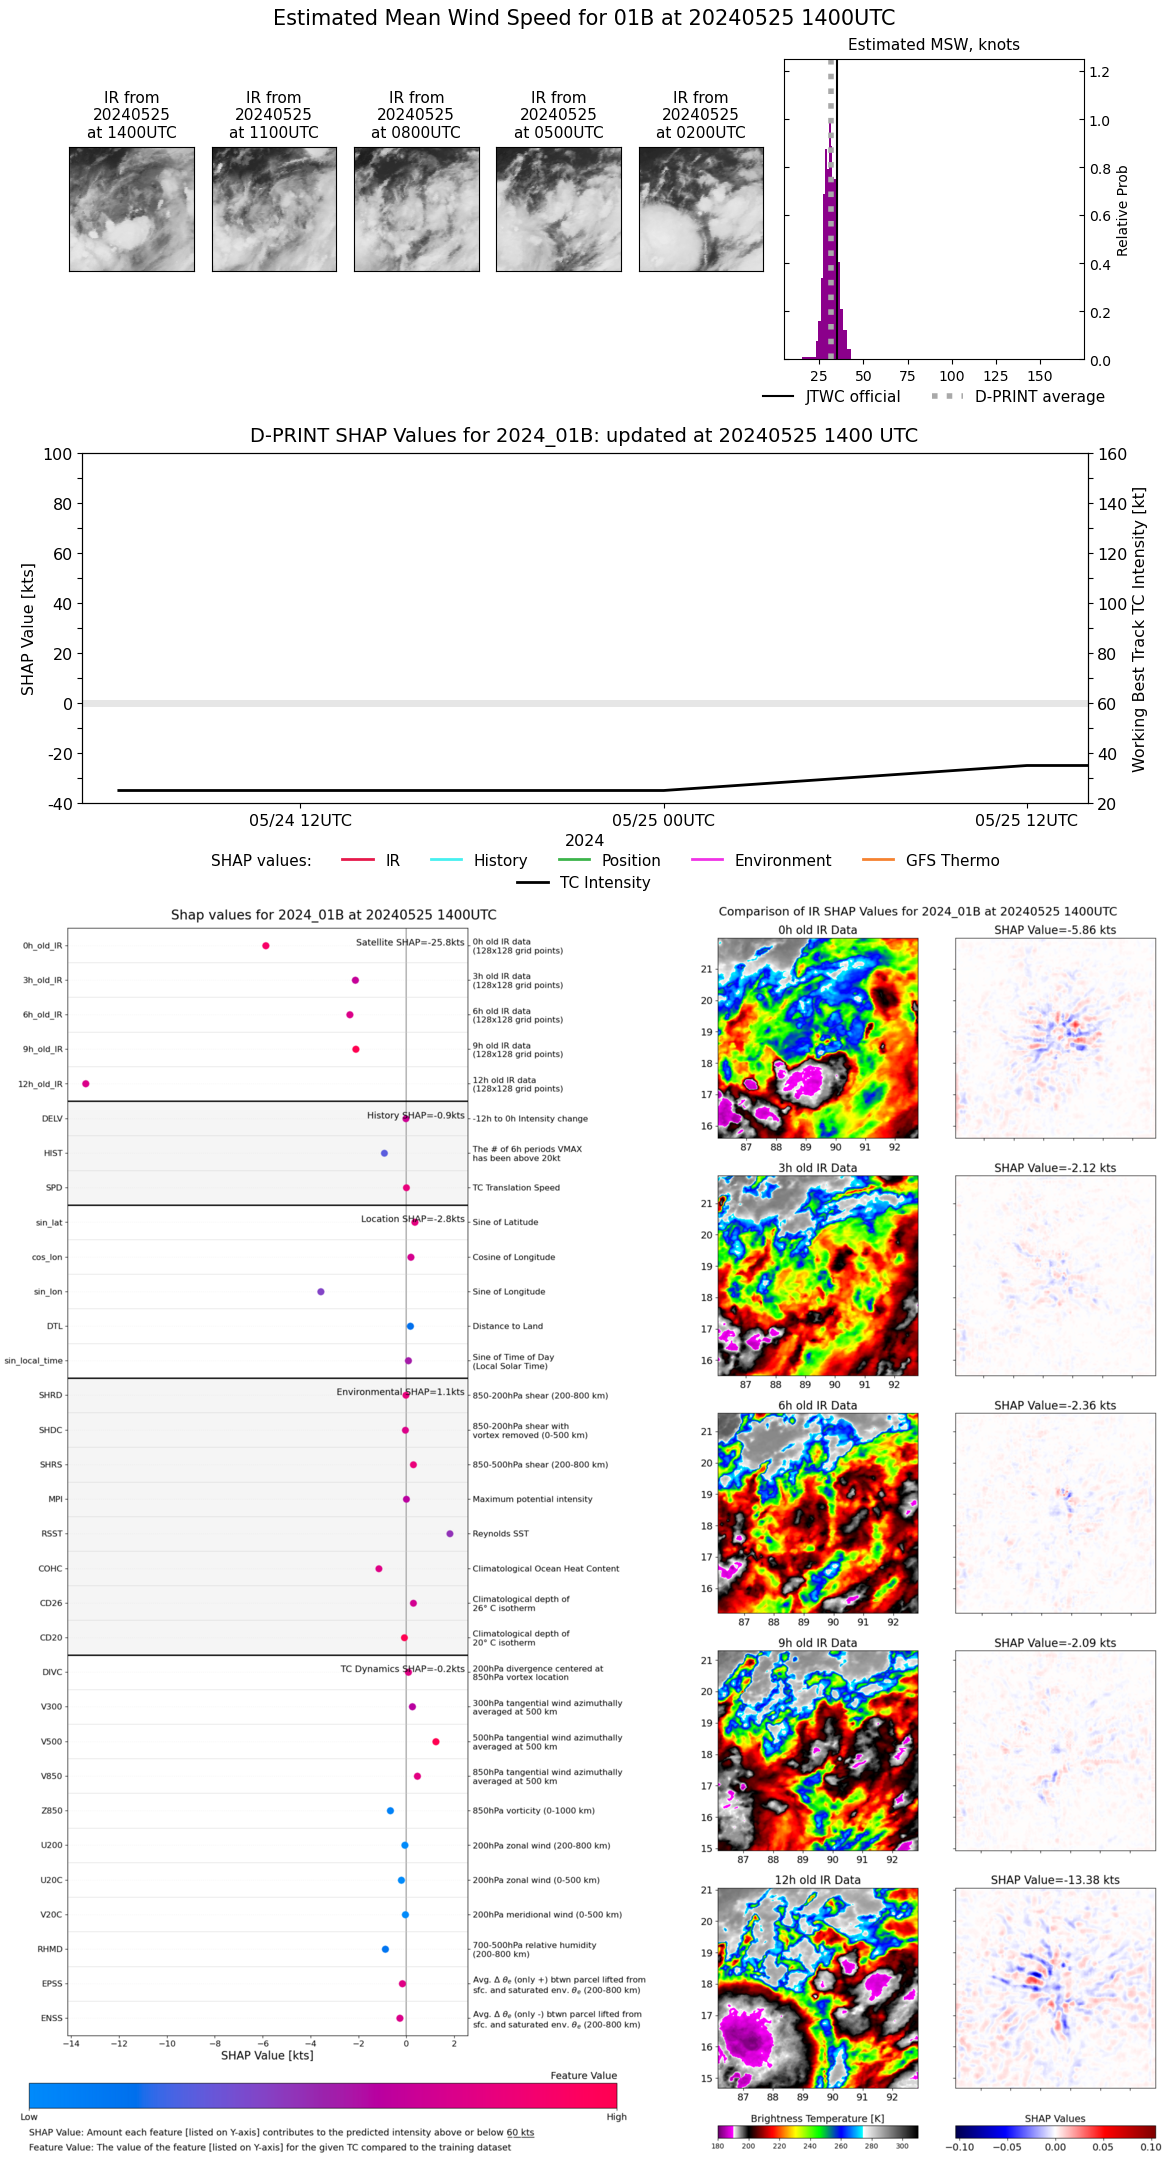 |