|
||

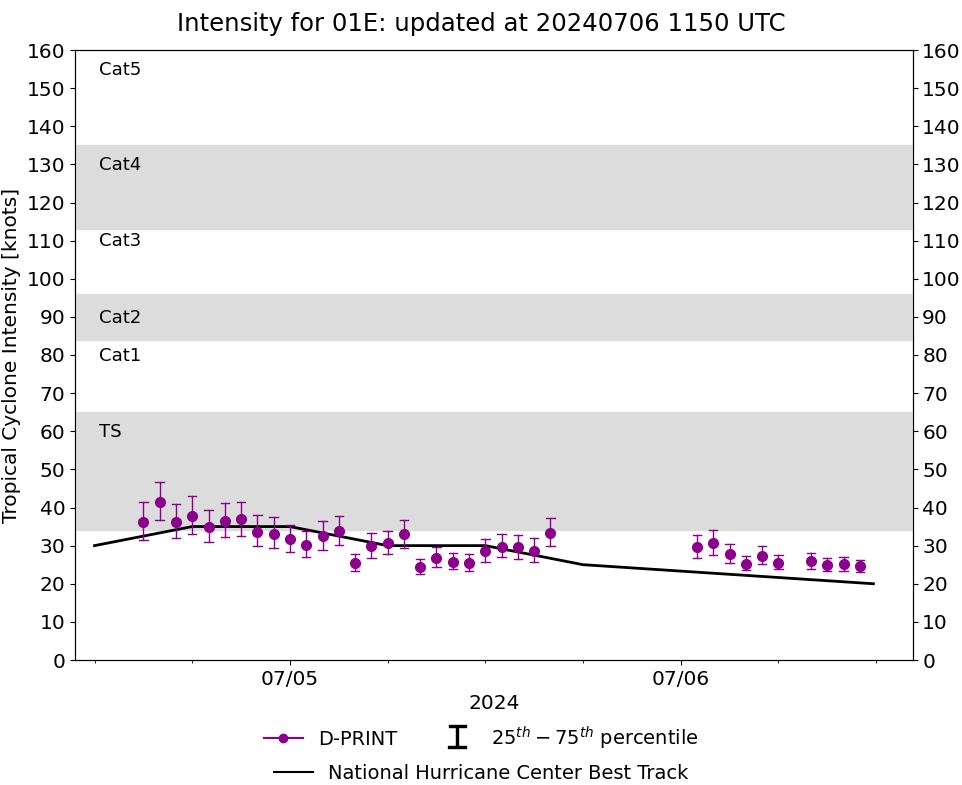 |
D-PRINT HISTORY FILE for 2024_01E
| Date | Time | MSLP | Vmax (30th-70th percentile average) | Vmax 25th percentile | Vmax 75th percentile | Image |
| 20240706 | 1100 UTC | 1007 hPa | 25 kts | 23 kts | 26 kts | 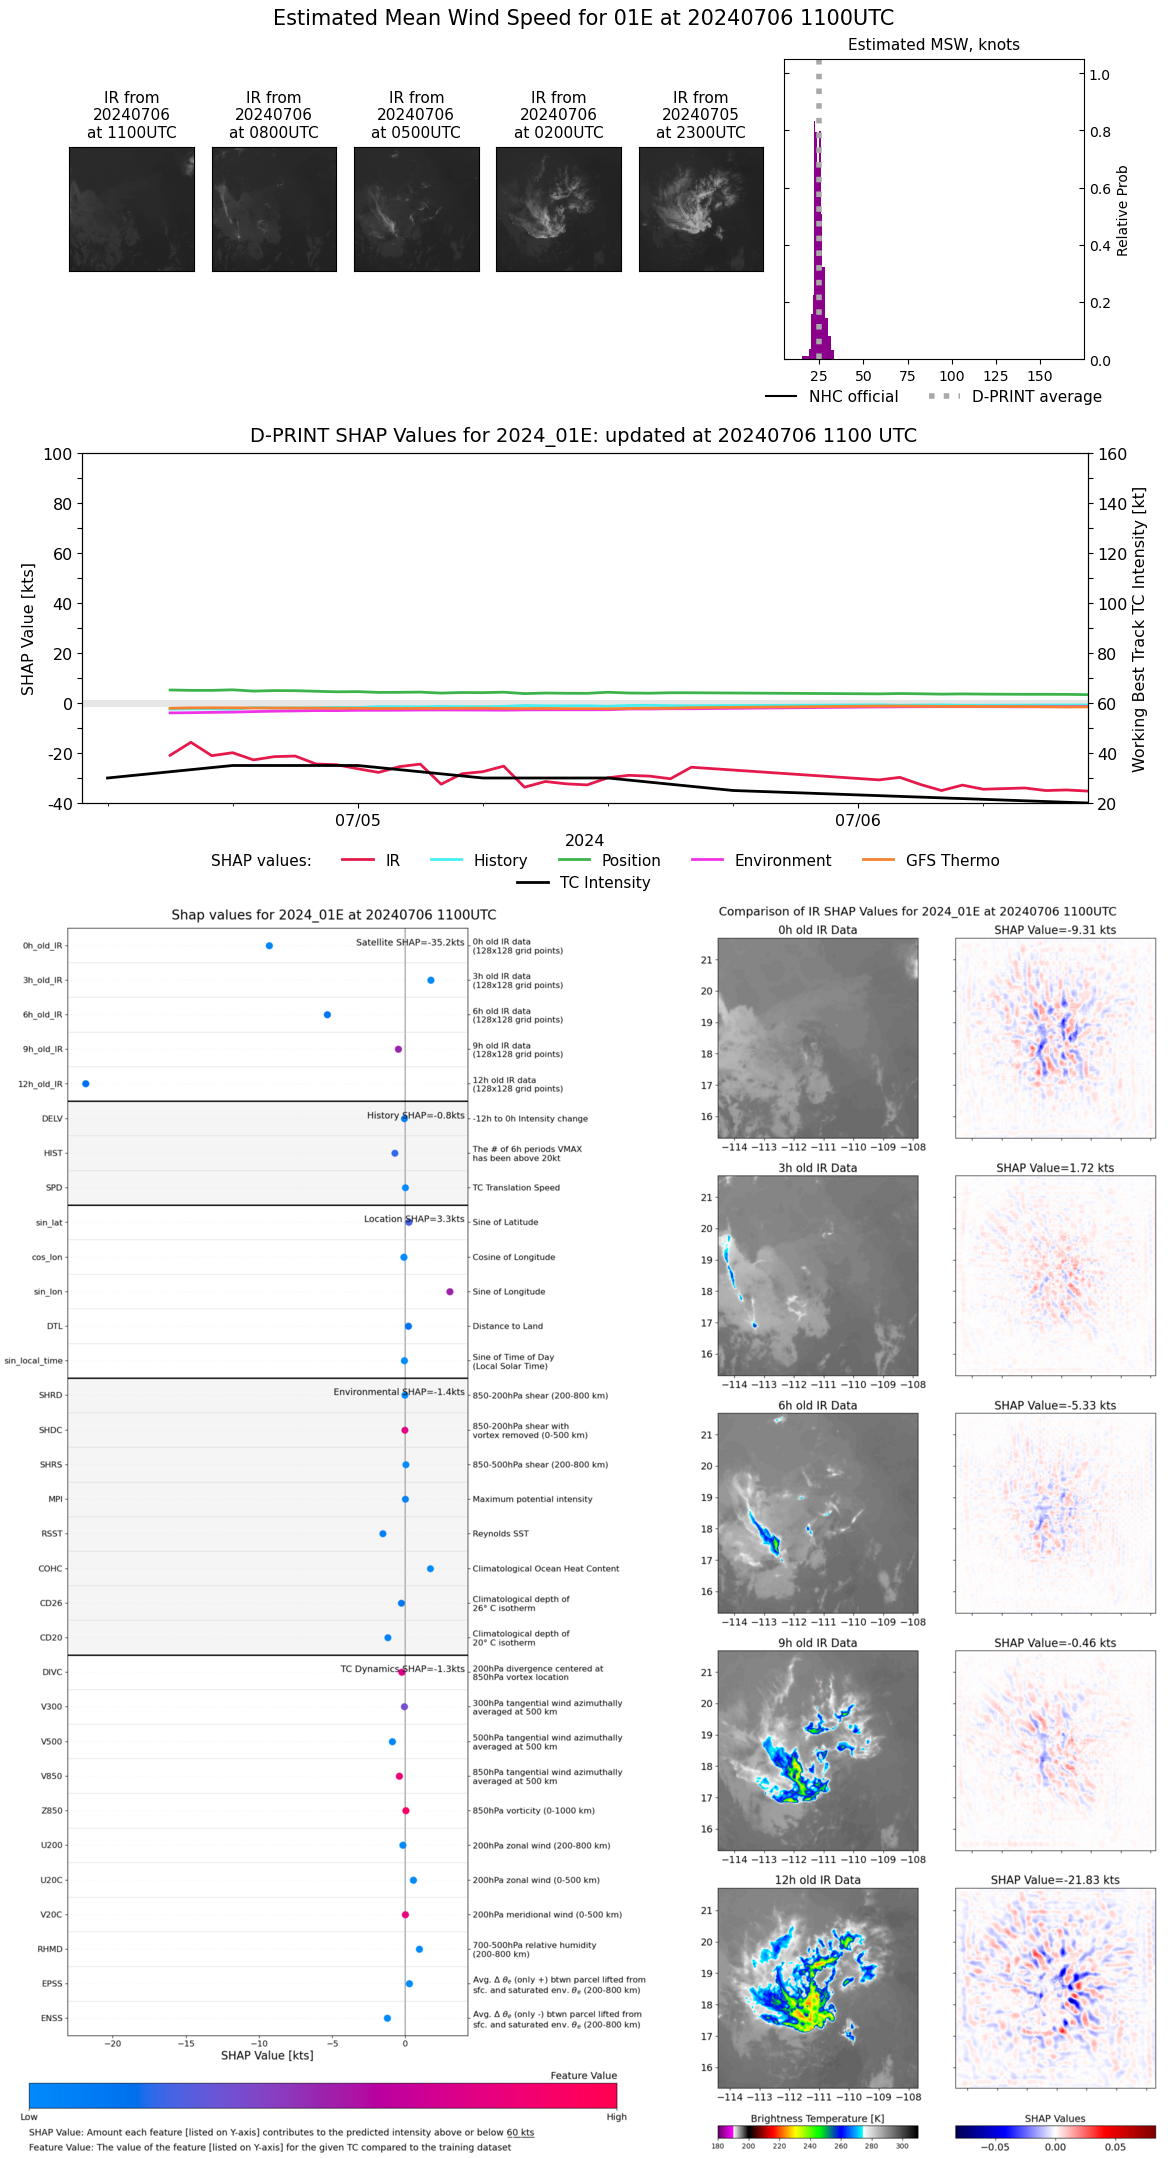 |
| 20240706 | 1000 UTC | 1007 hPa | 25 kts | 23 kts | 27 kts | 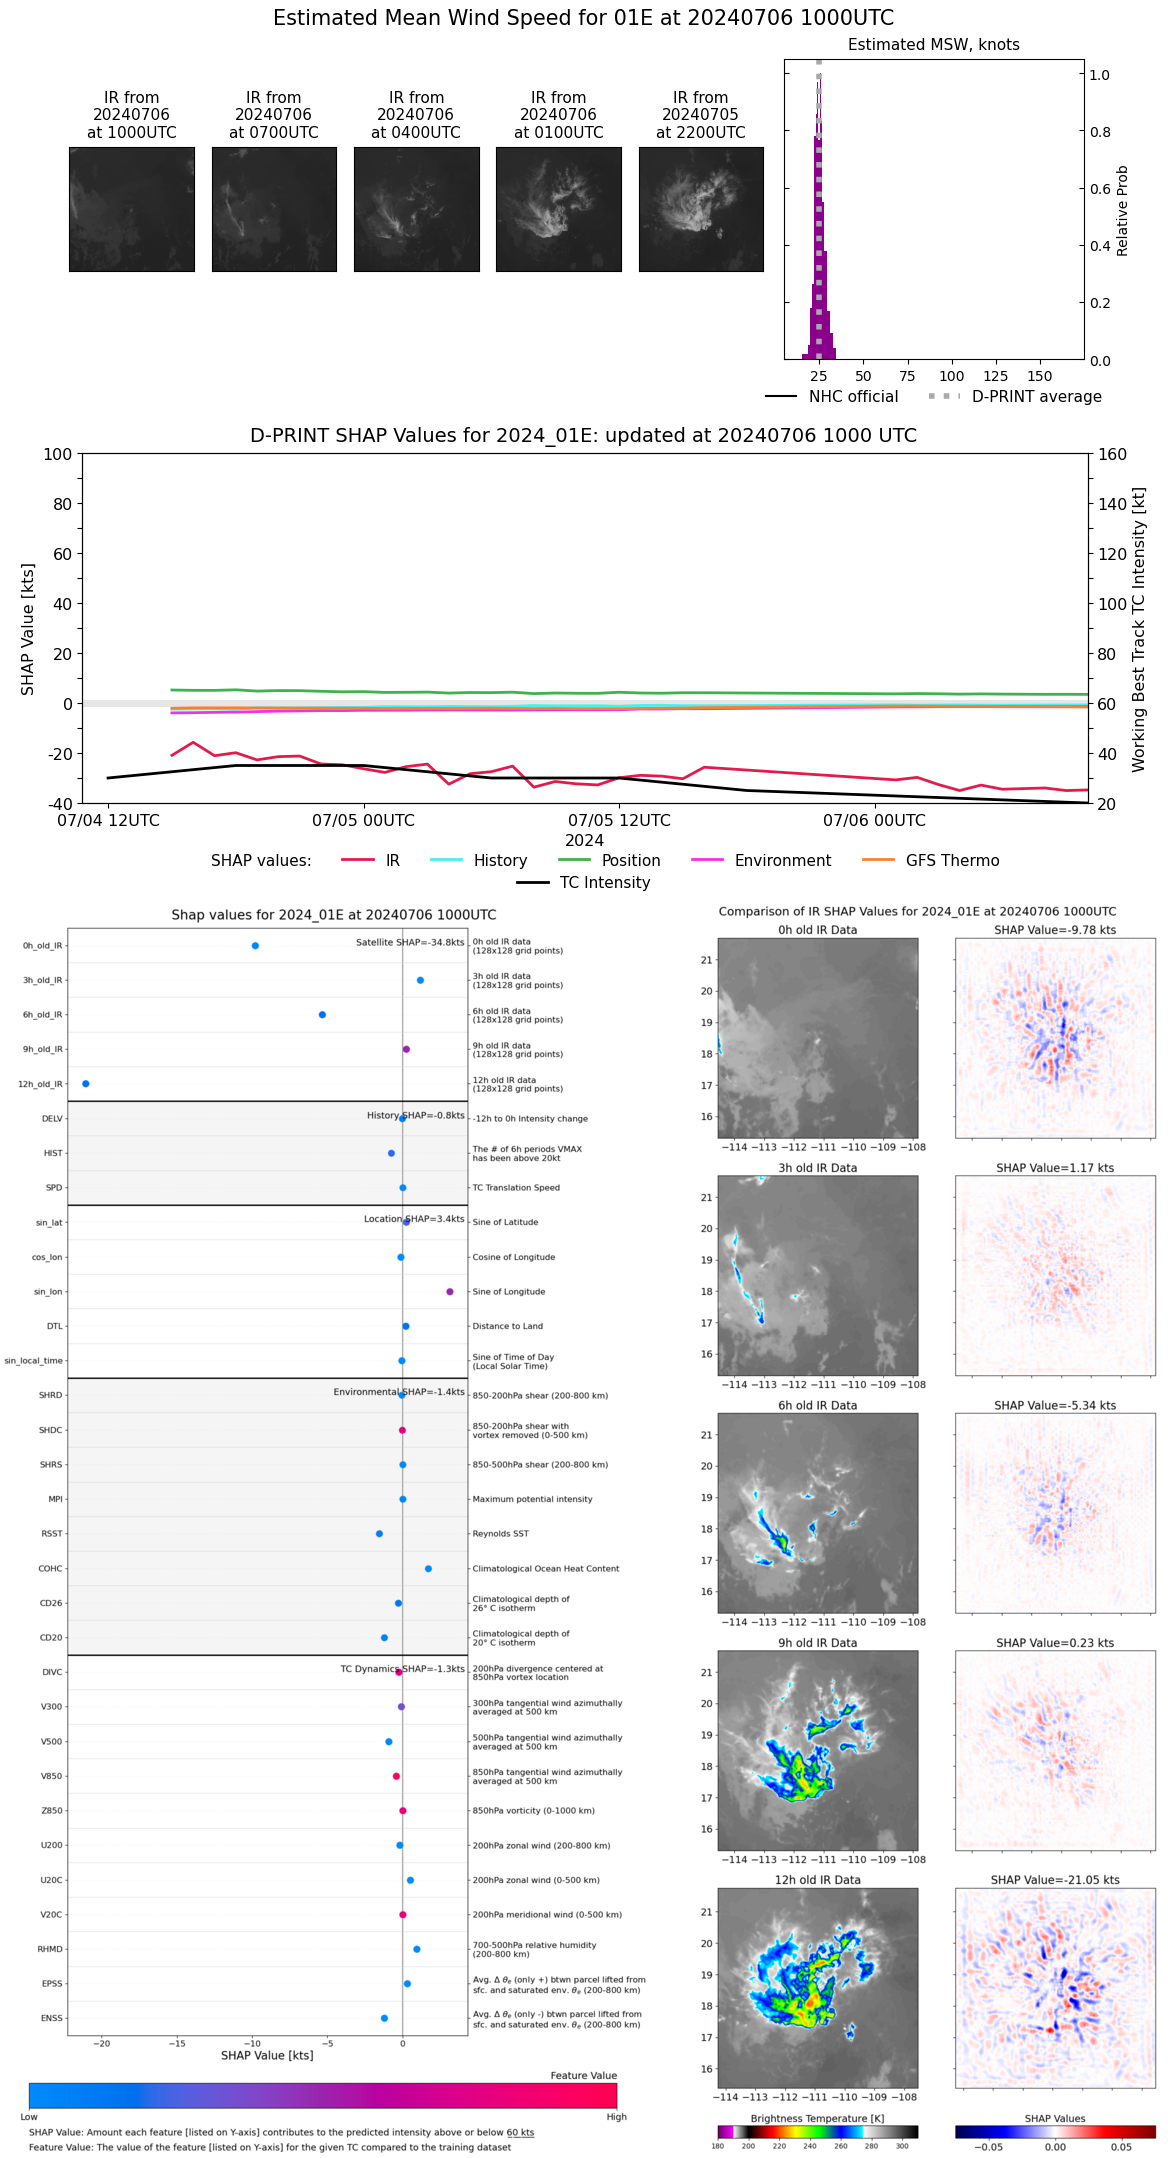 |
| 20240706 | 0900 UTC | 1007 hPa | 25 kts | 23 kts | 27 kts | 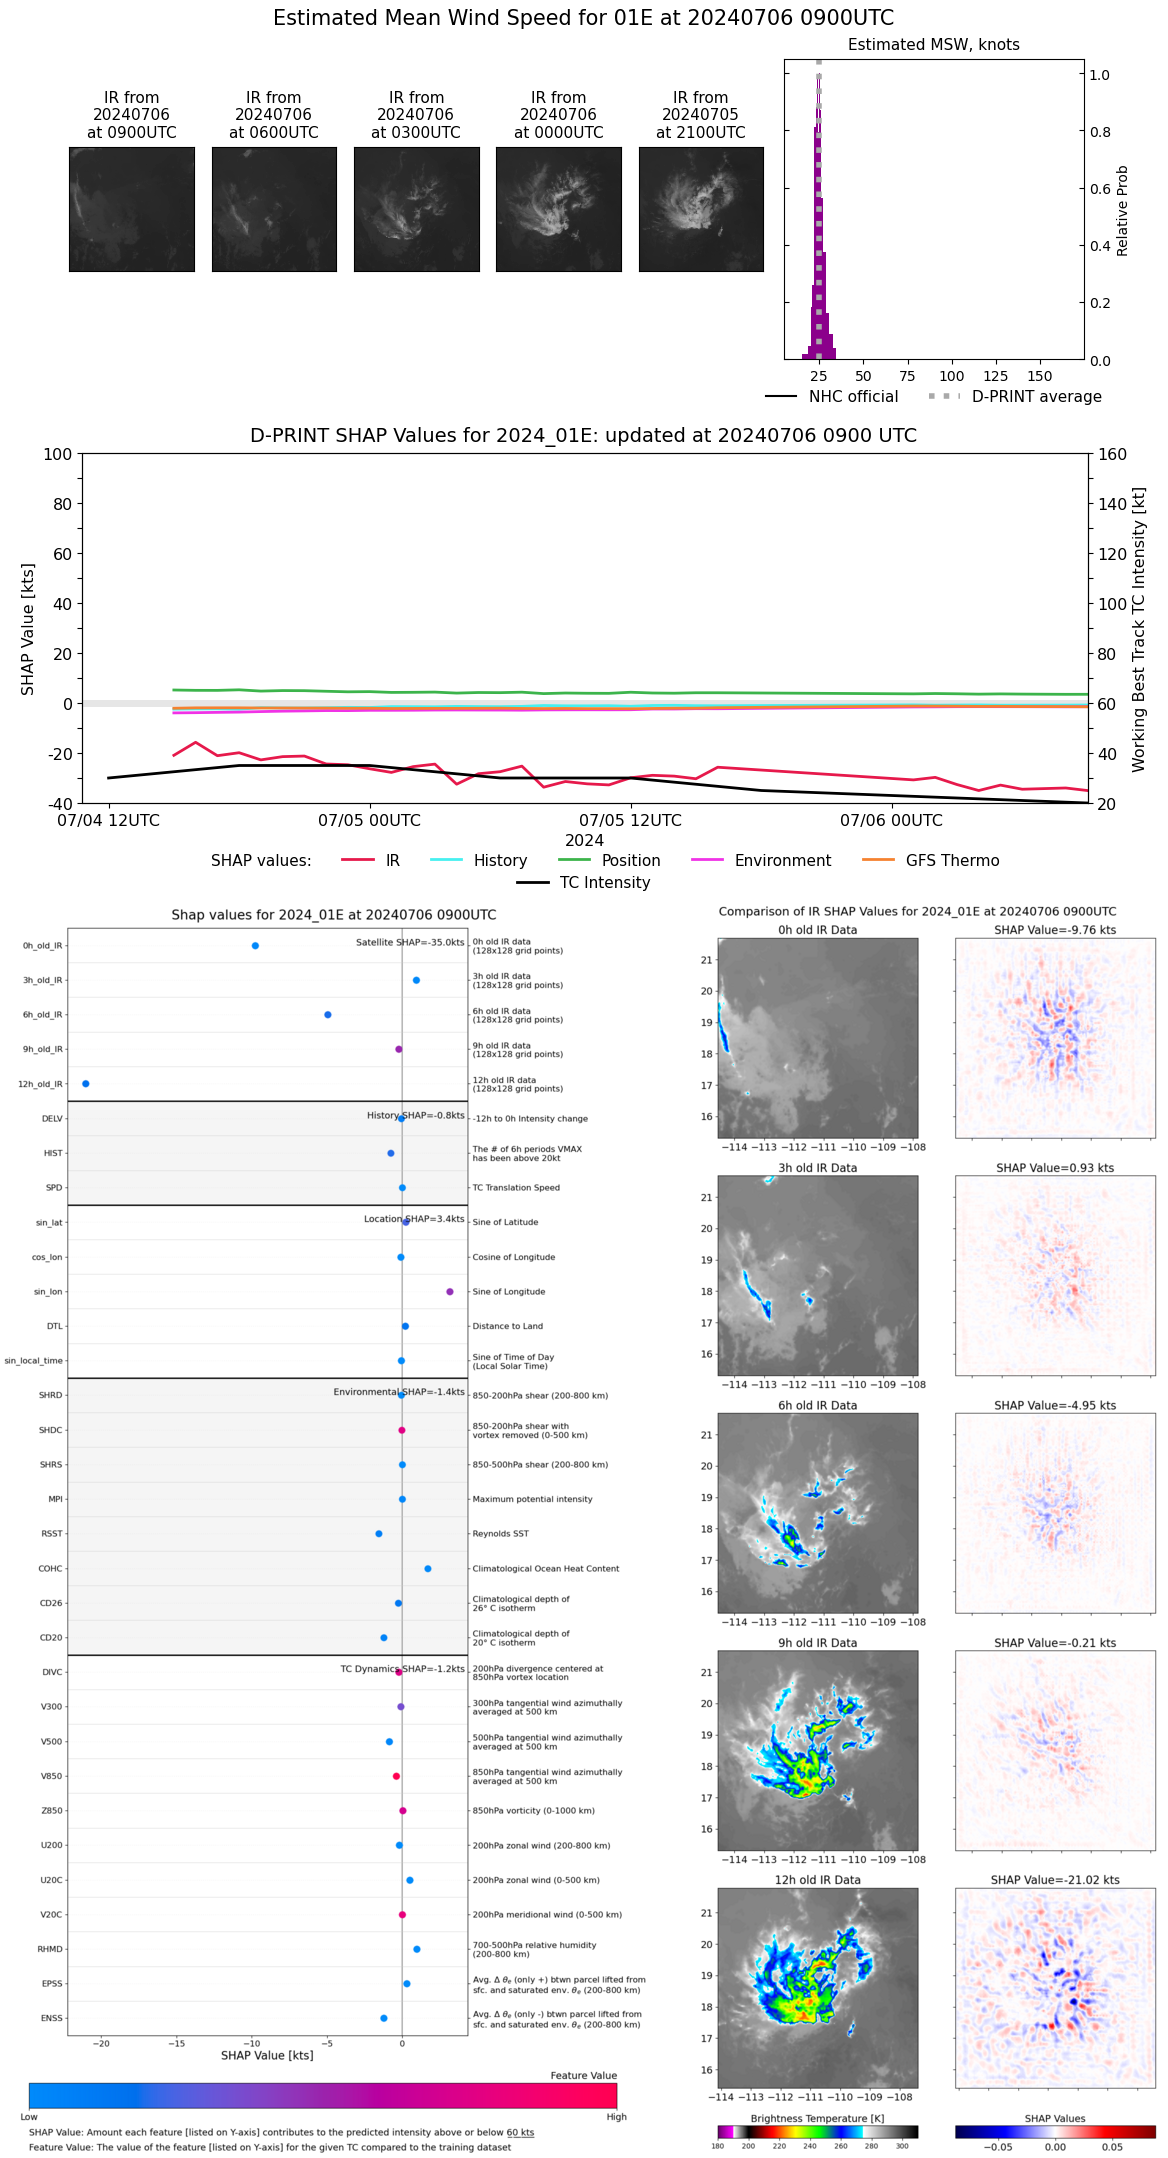 |
| 20240706 | 0800 UTC | 1007 hPa | 26 kts | 24 kts | 28 kts | 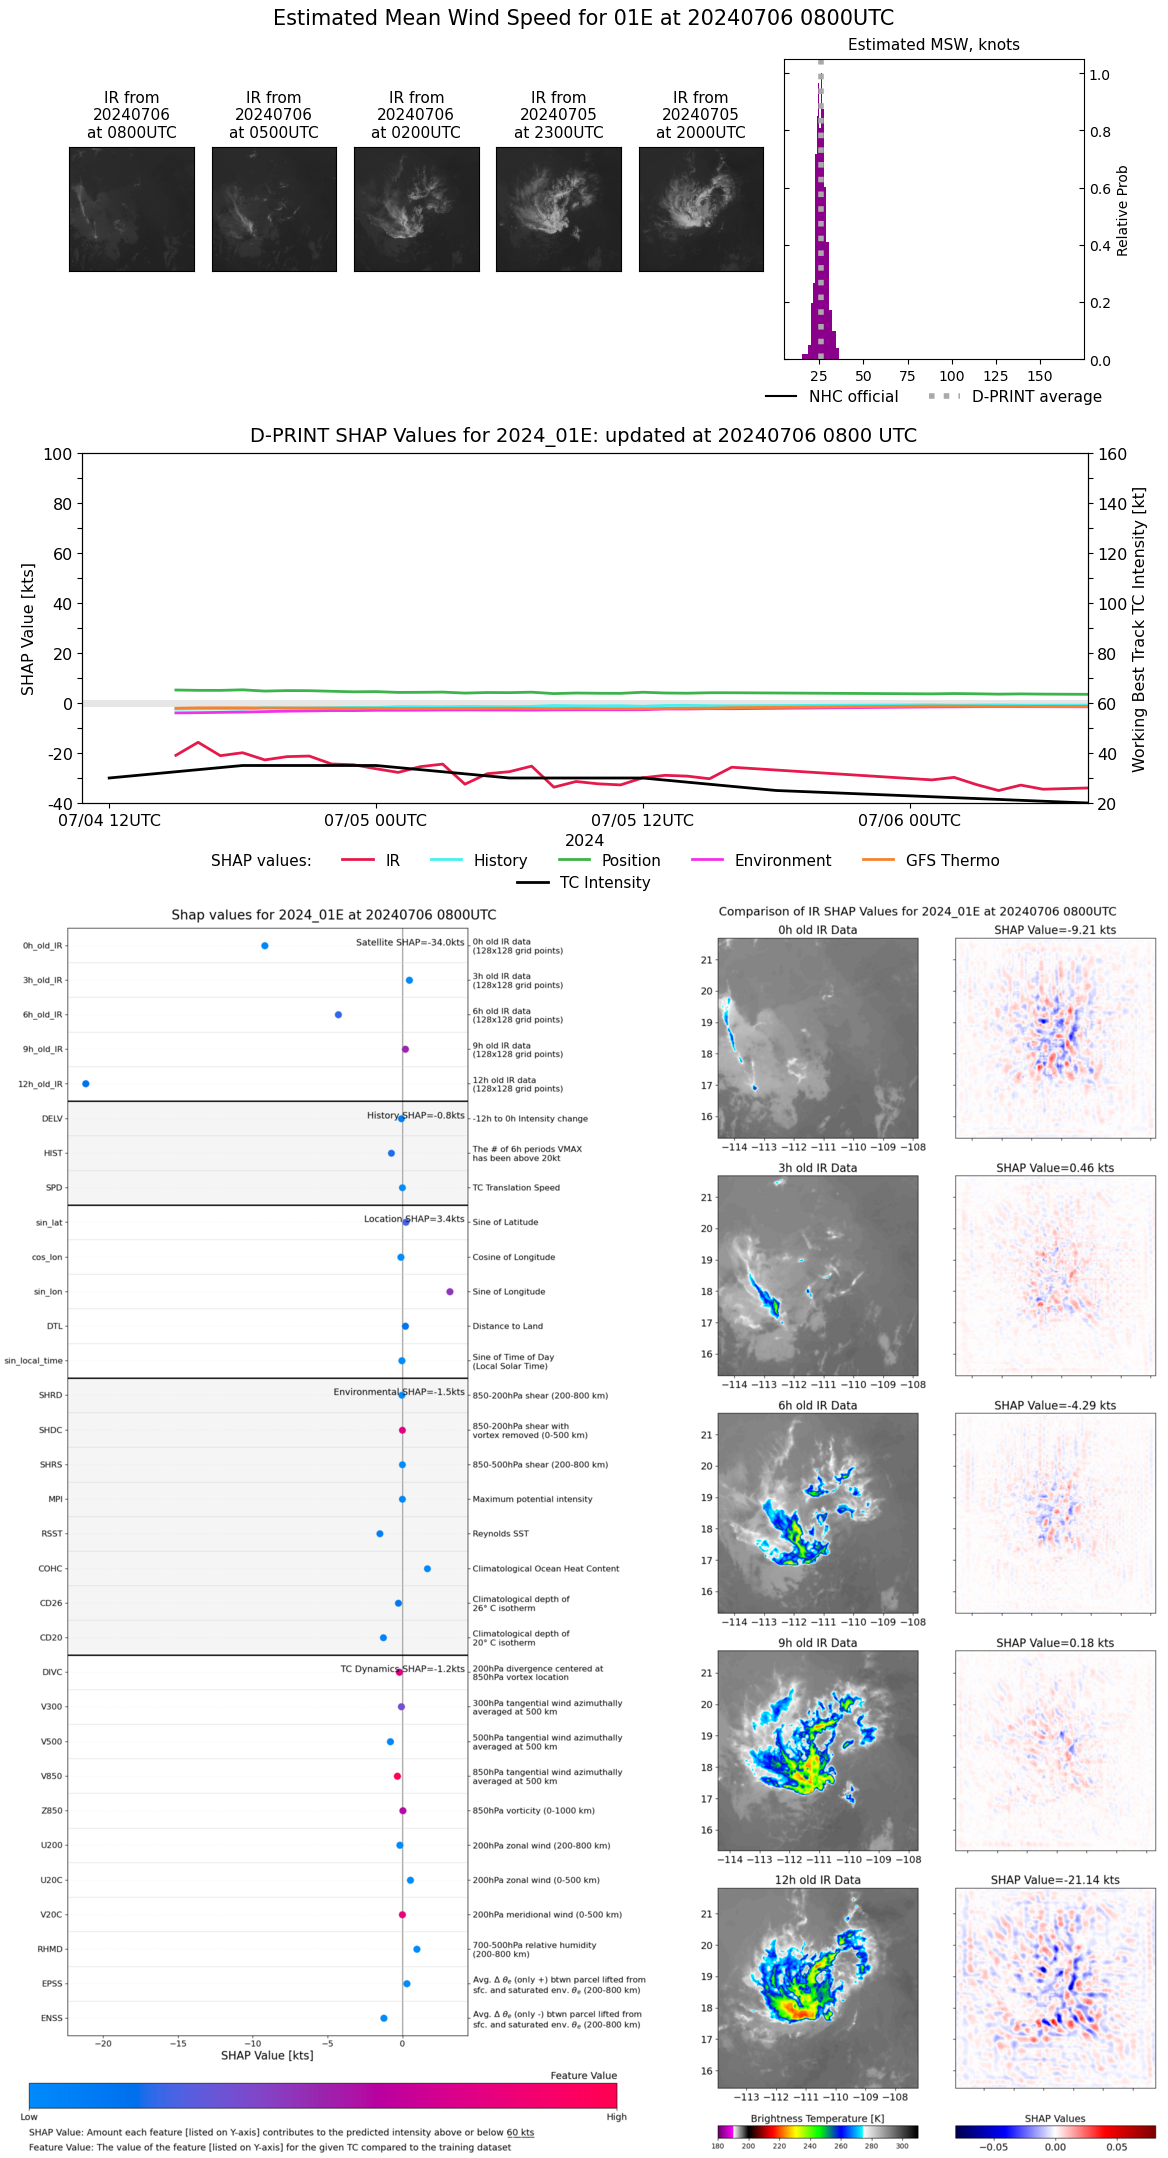 |
| 20240706 | 0600 UTC | 1007 hPa | 26 kts | 24 kts | 28 kts | 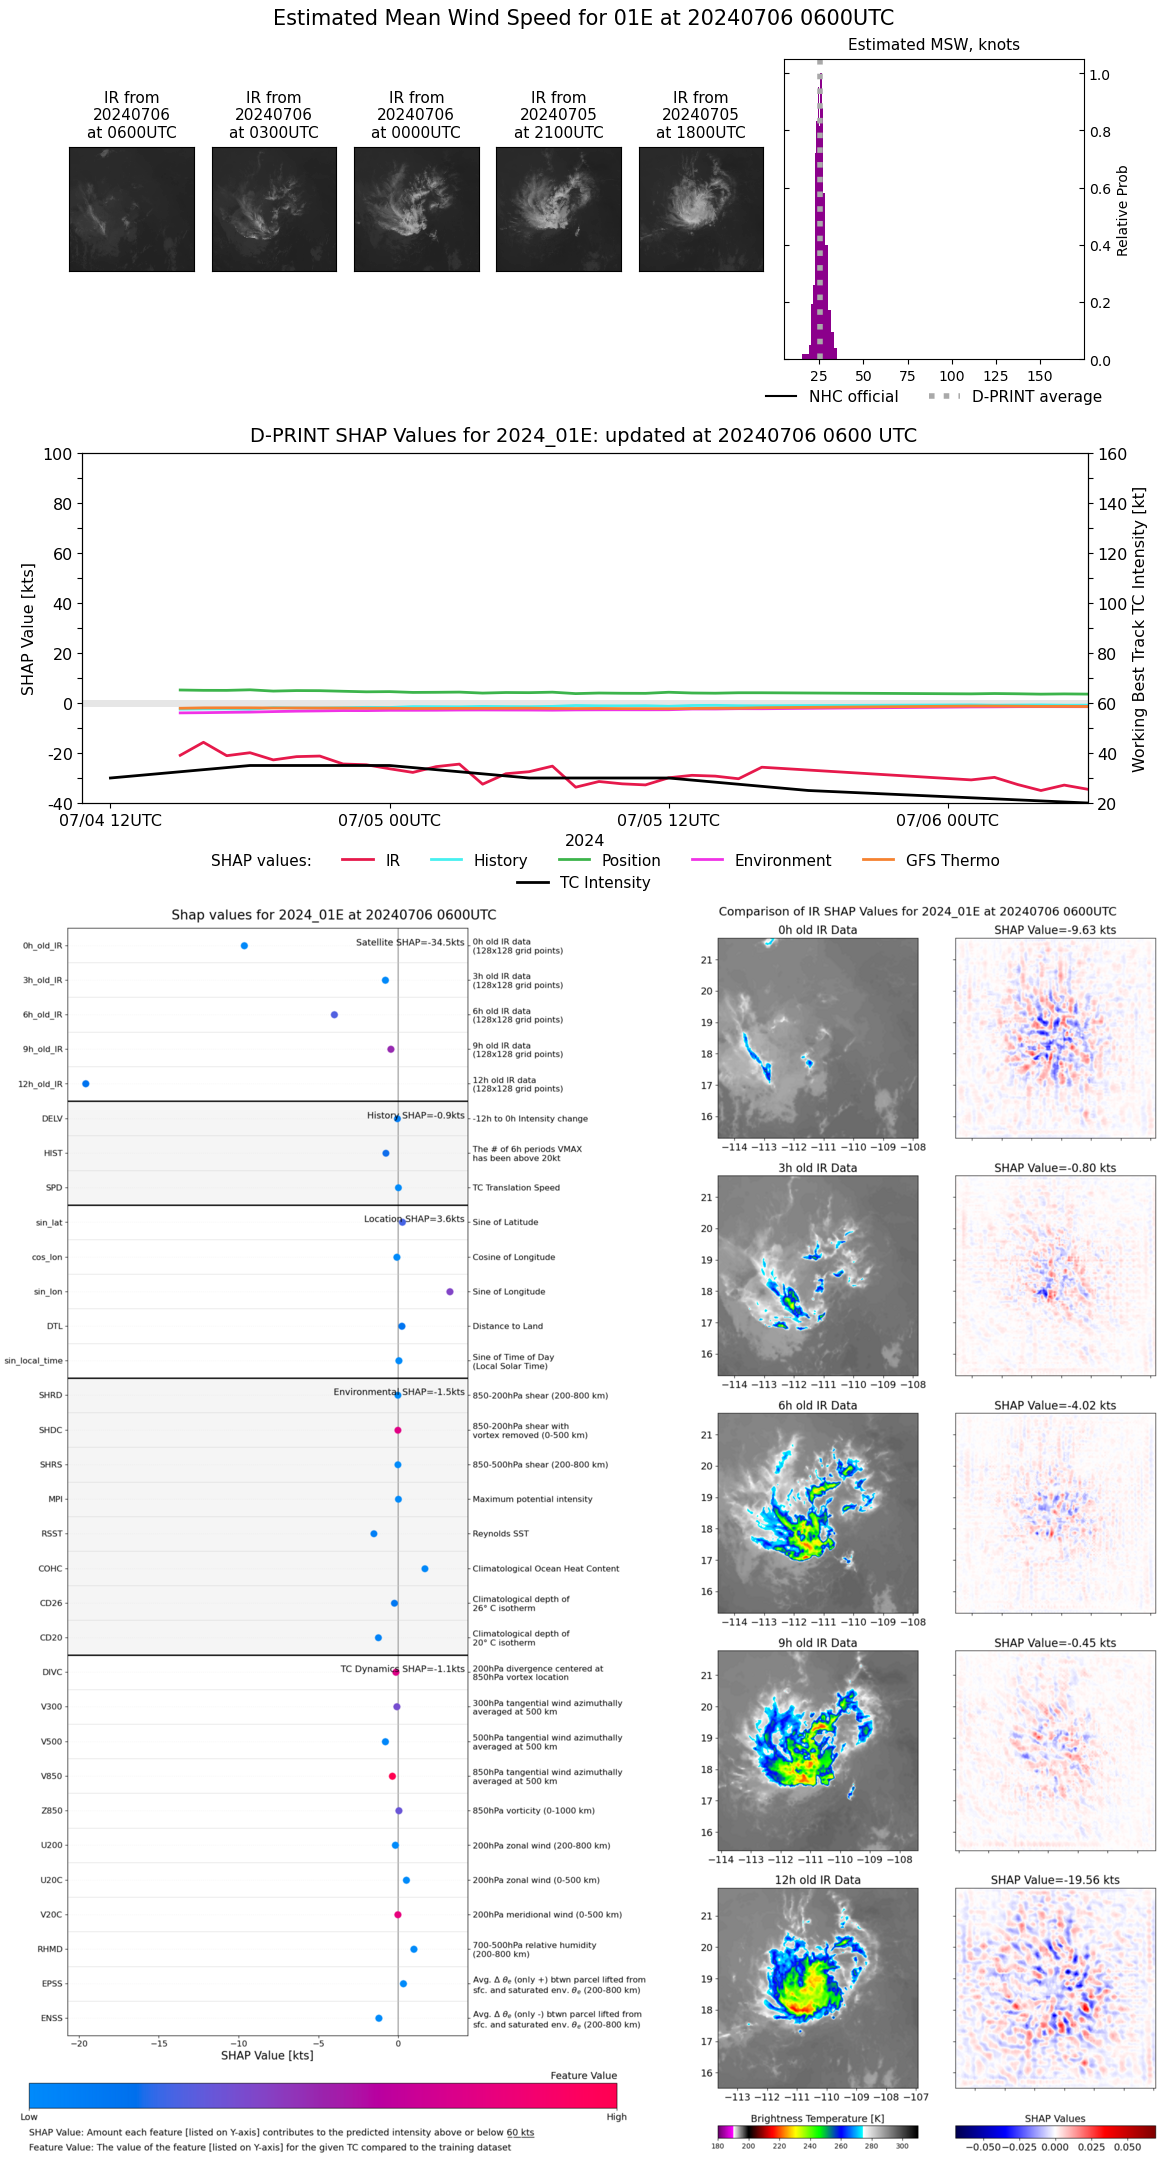 |
| 20240706 | 0500 UTC | 1007 hPa | 27 kts | 25 kts | 30 kts |  |
| 20240706 | 0400 UTC | 1006 hPa | 25 kts | 24 kts | 27 kts | 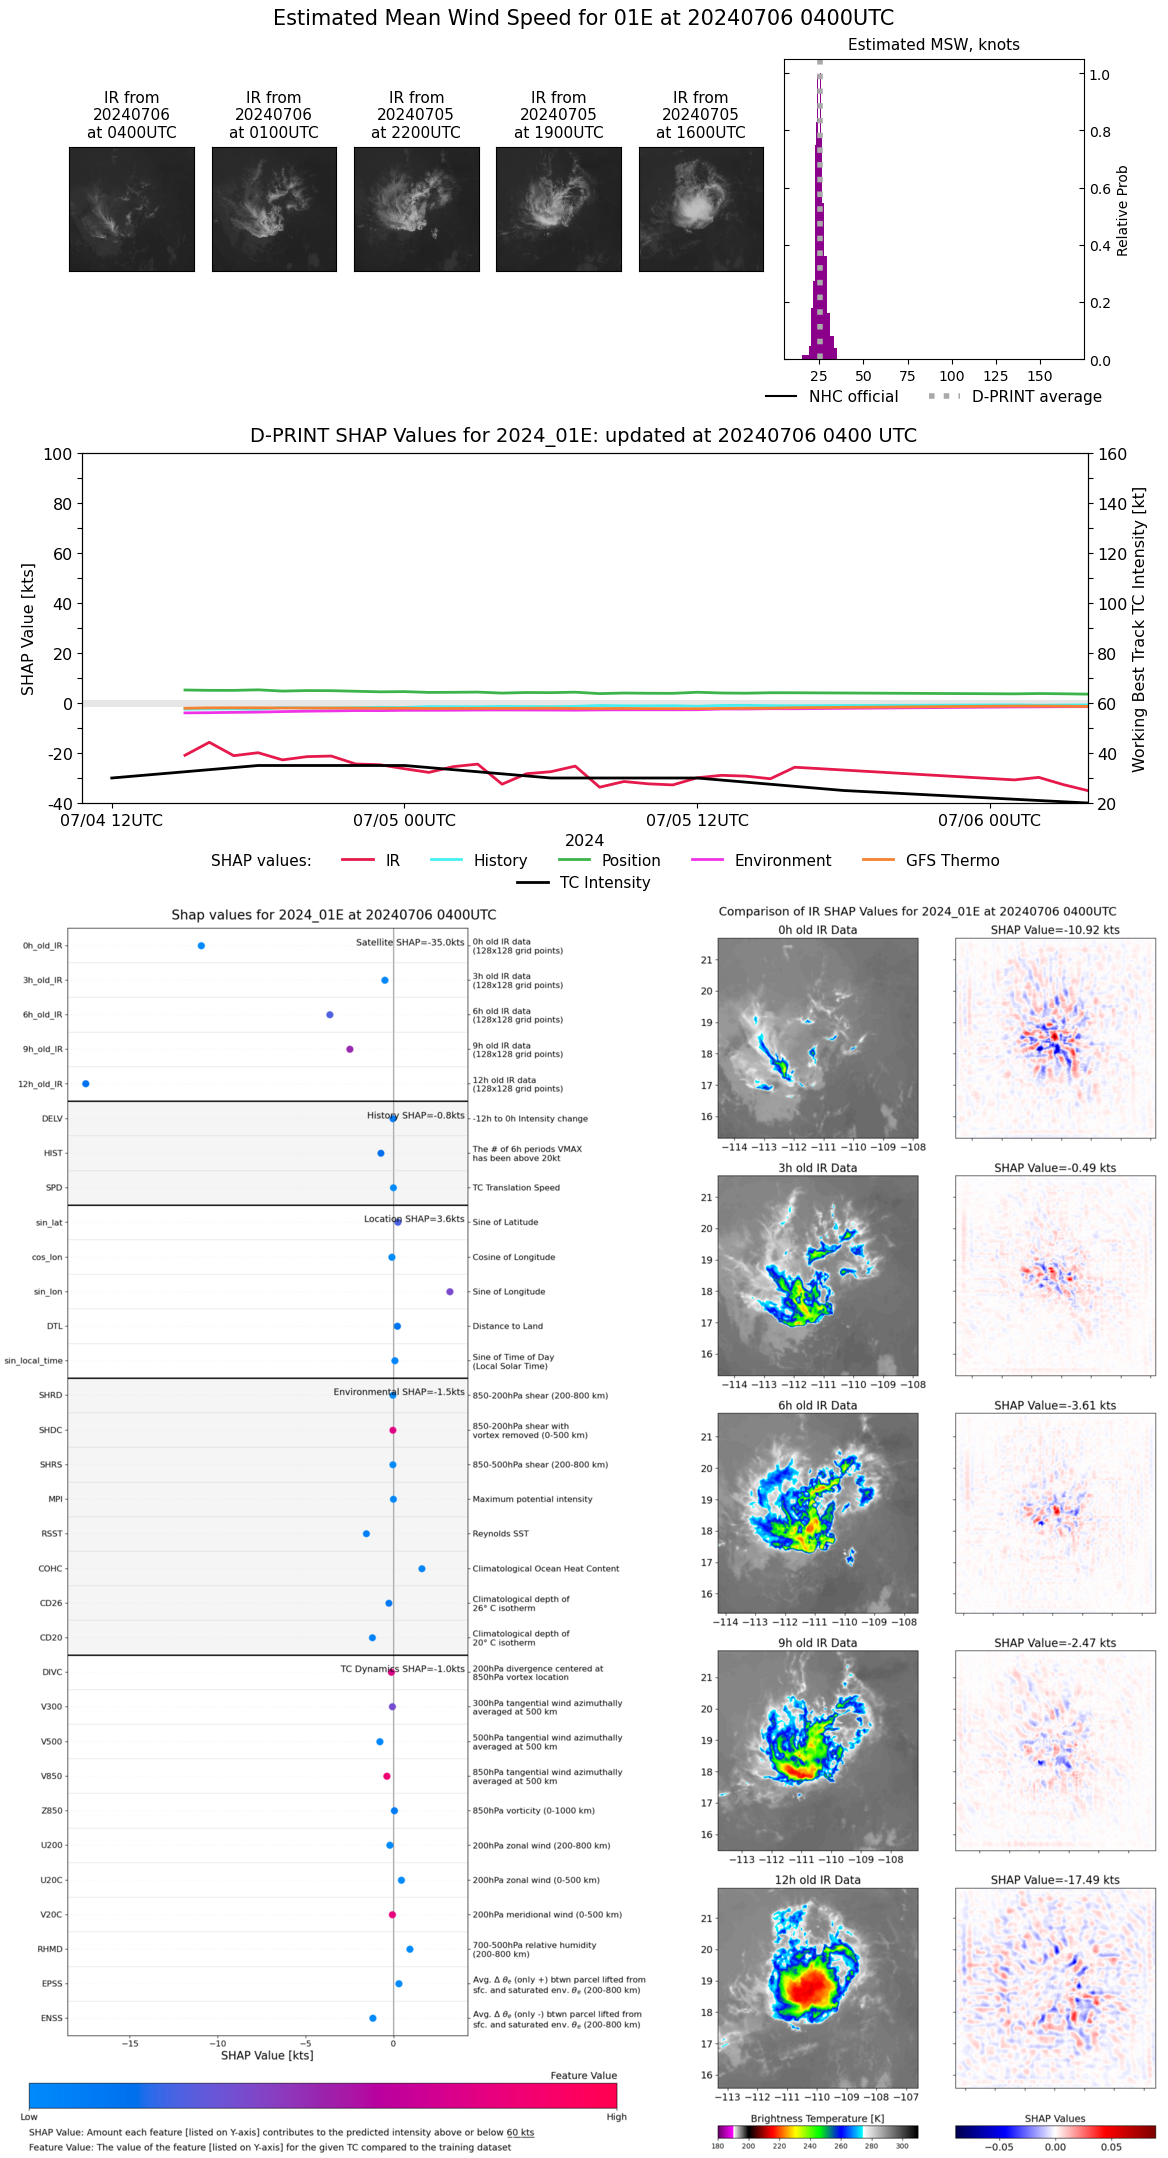 |
| 20240706 | 0300 UTC | 1006 hPa | 28 kts | 25 kts | 30 kts | 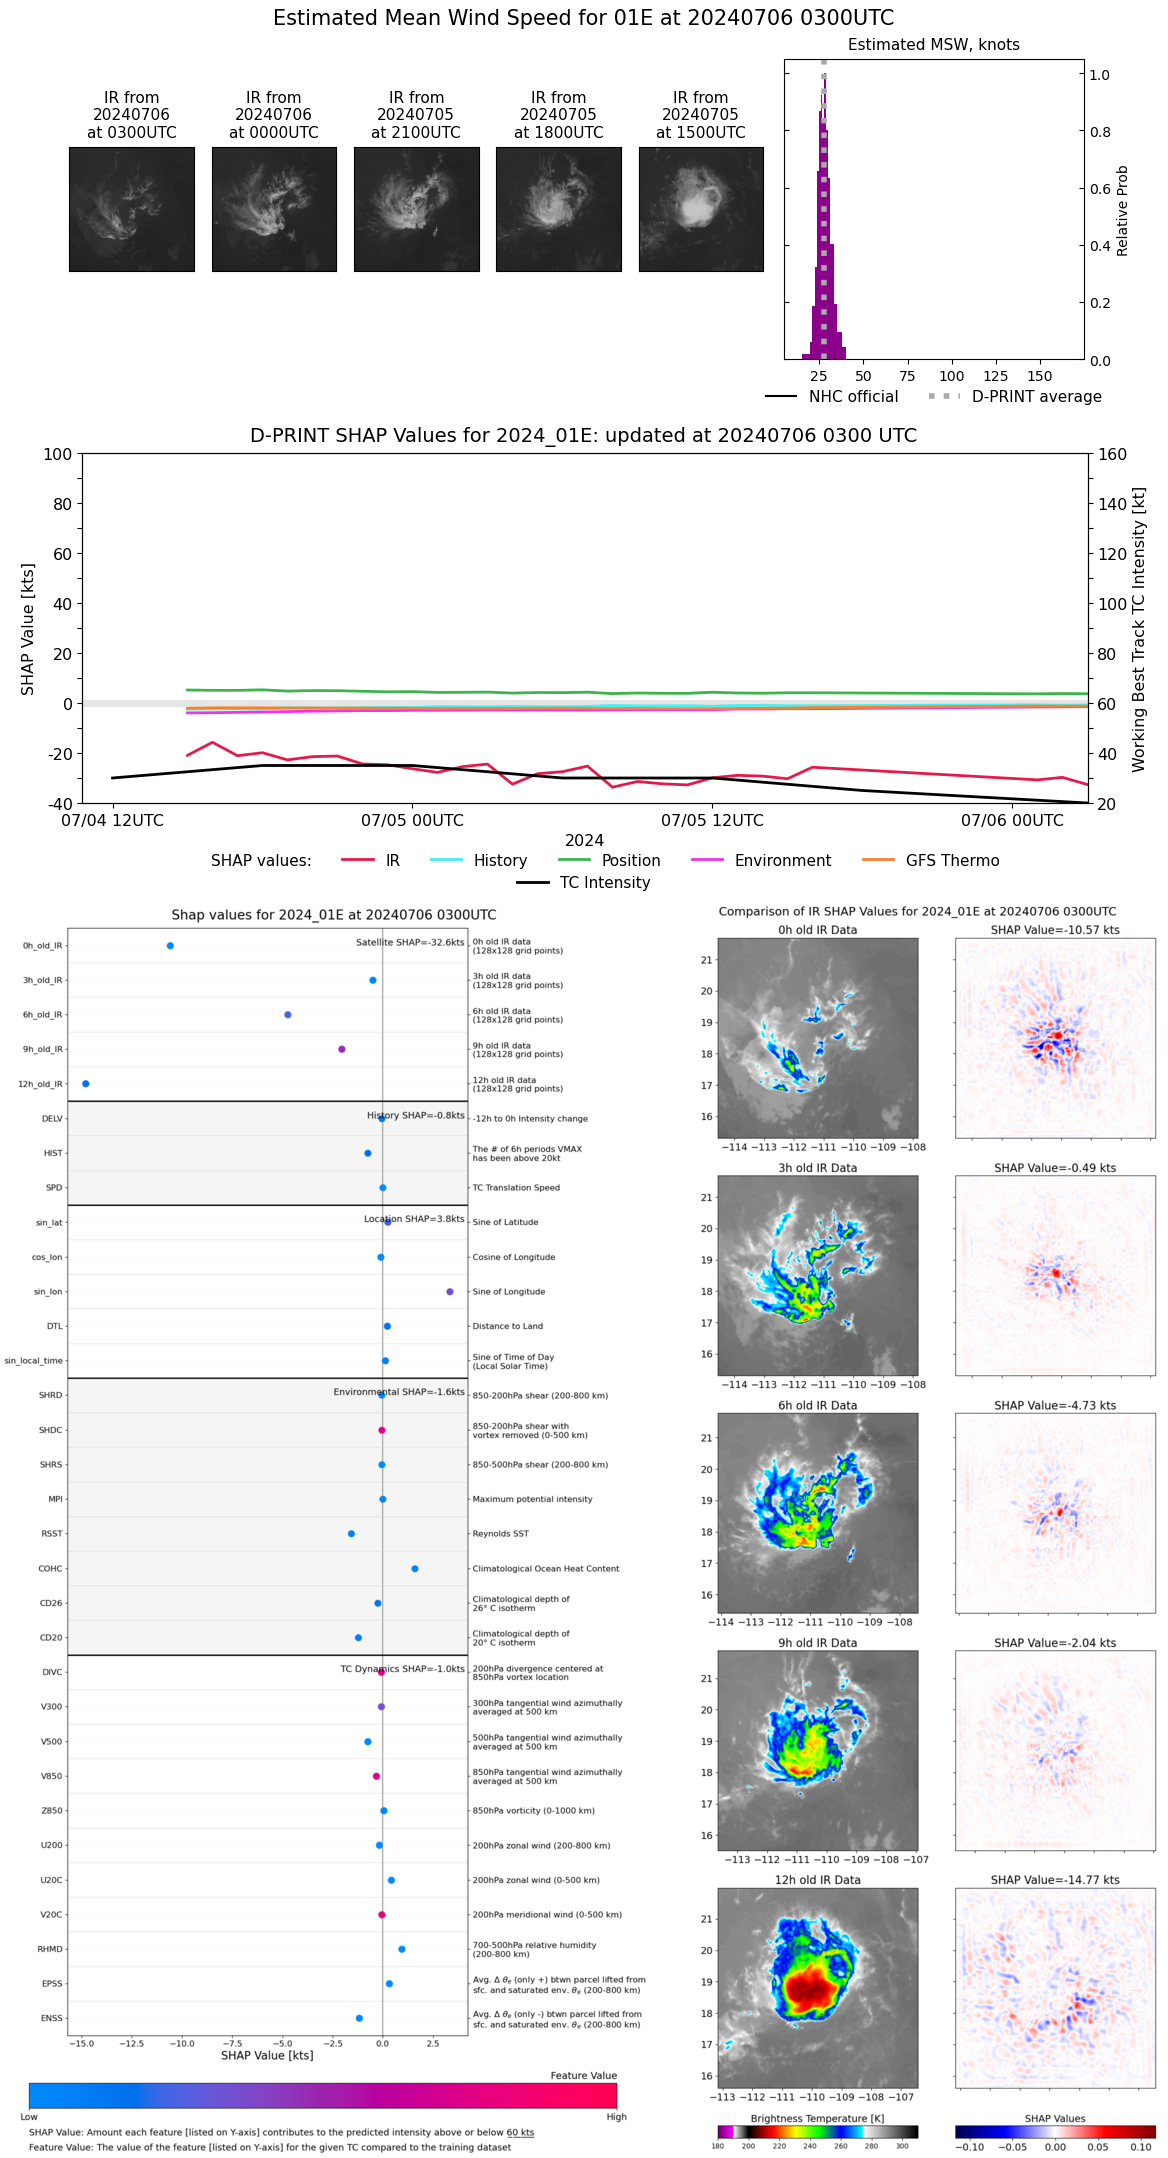 |
| 20240706 | 0200 UTC | 1006 hPa | 31 kts | 28 kts | 34 kts | 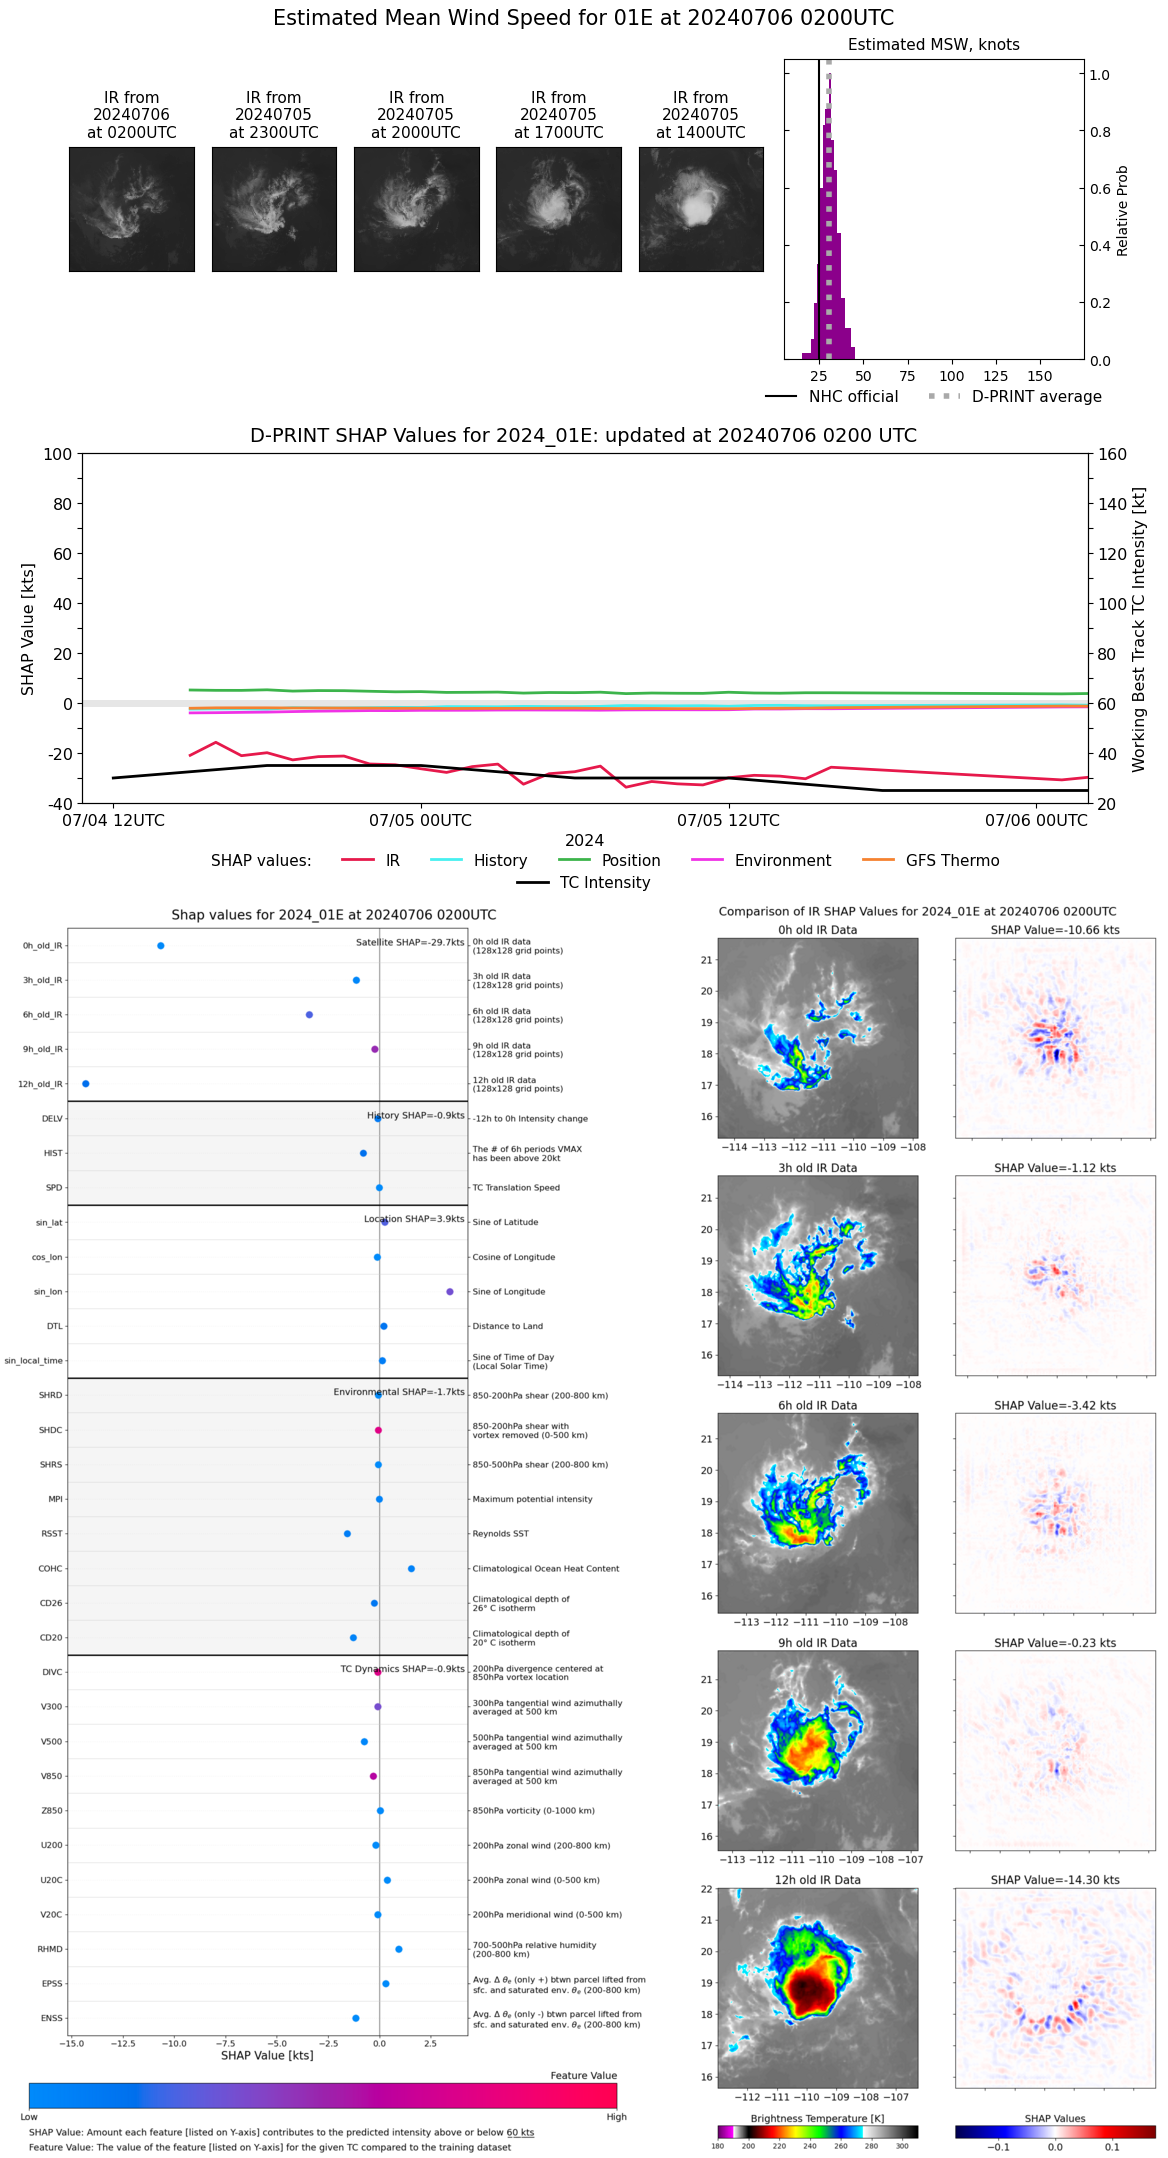 |
| 20240706 | 0100 UTC | 1006 hPa | 30 kts | 27 kts | 33 kts | 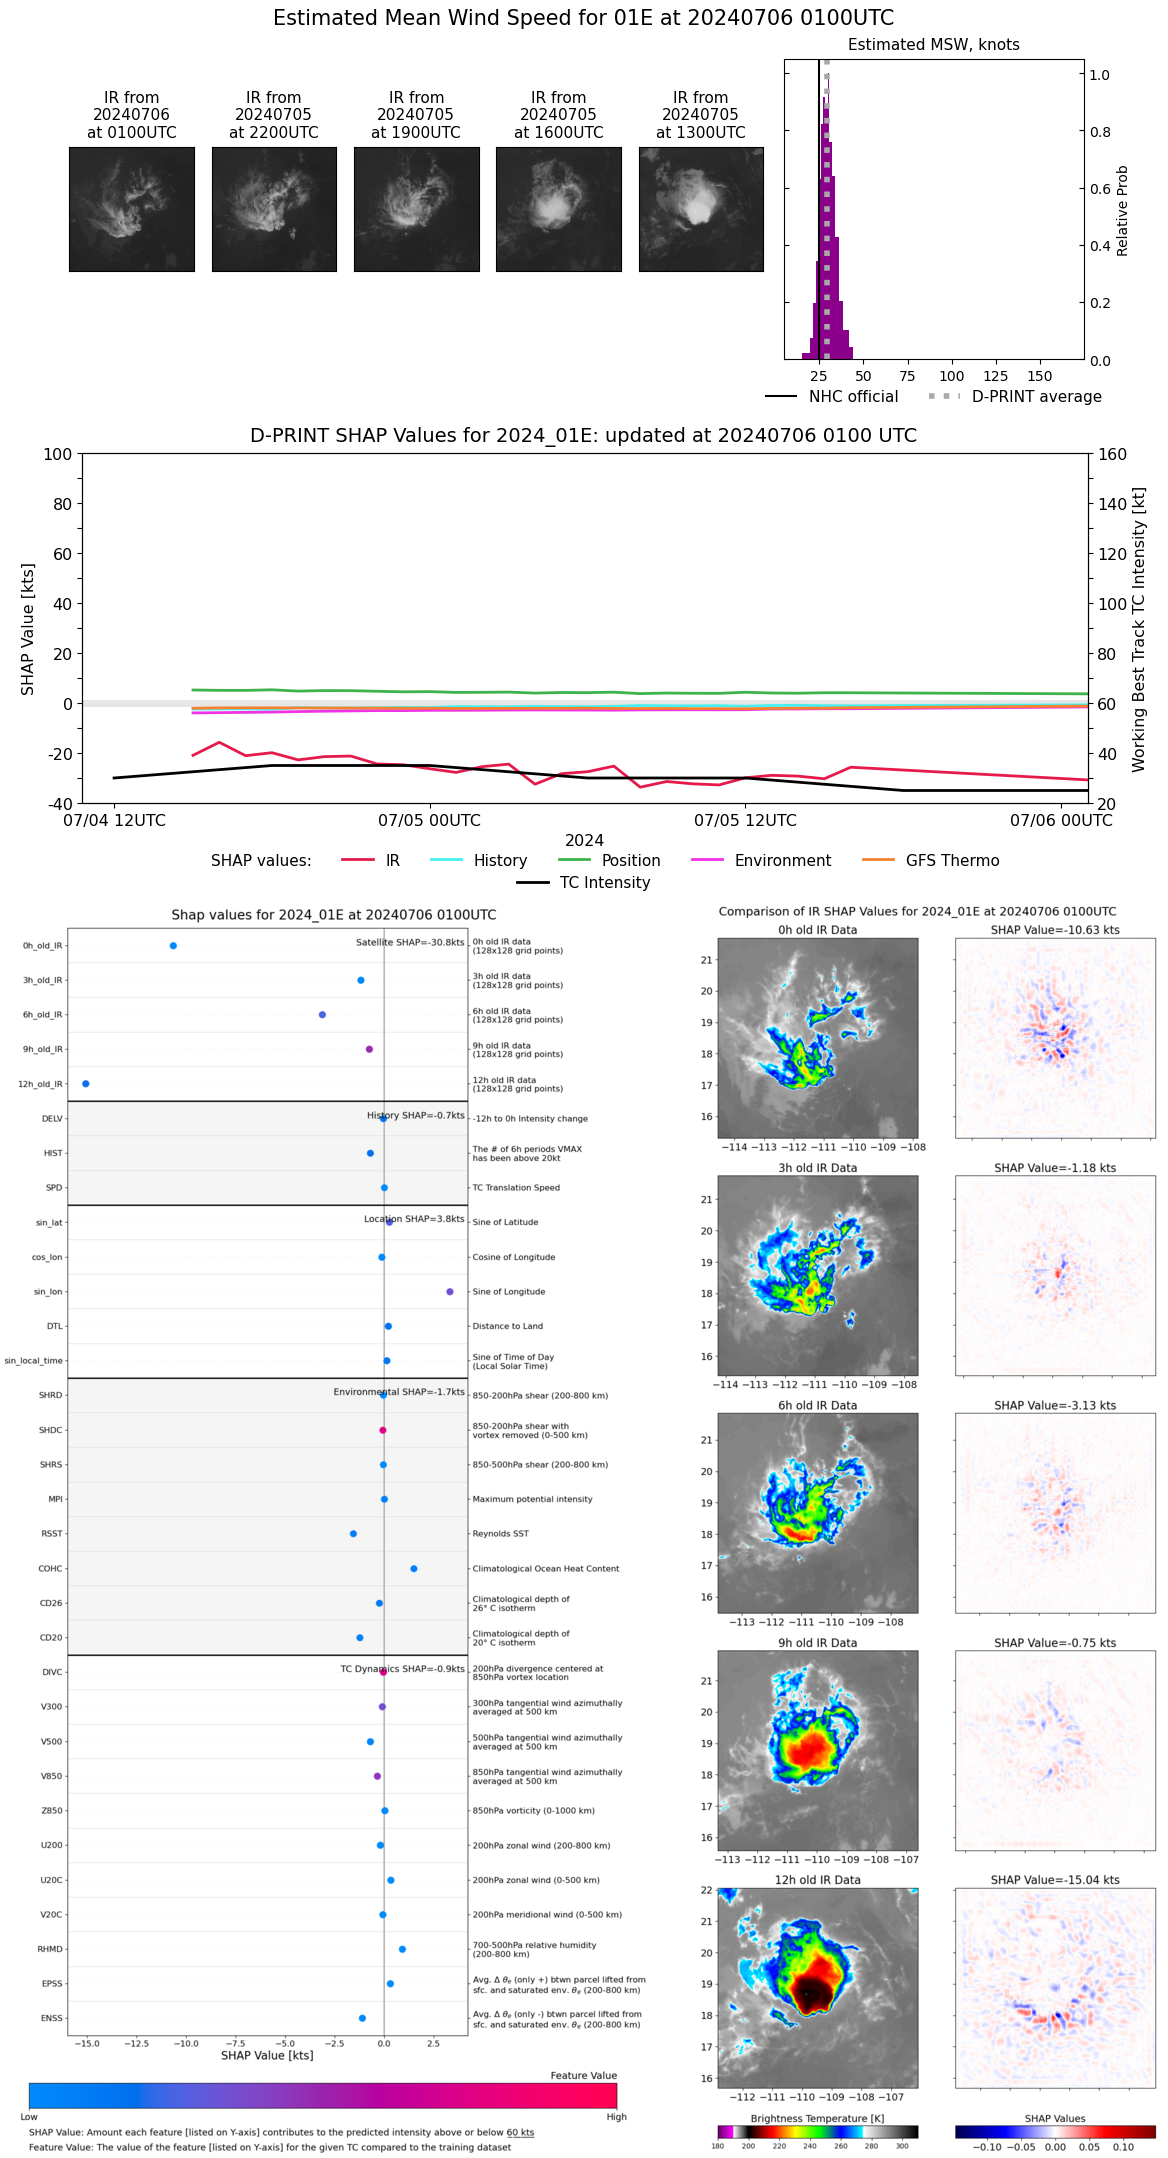 |
| 20240705 | 1600 UTC | 1006 hPa | 33 kts | 30 kts | 37 kts | 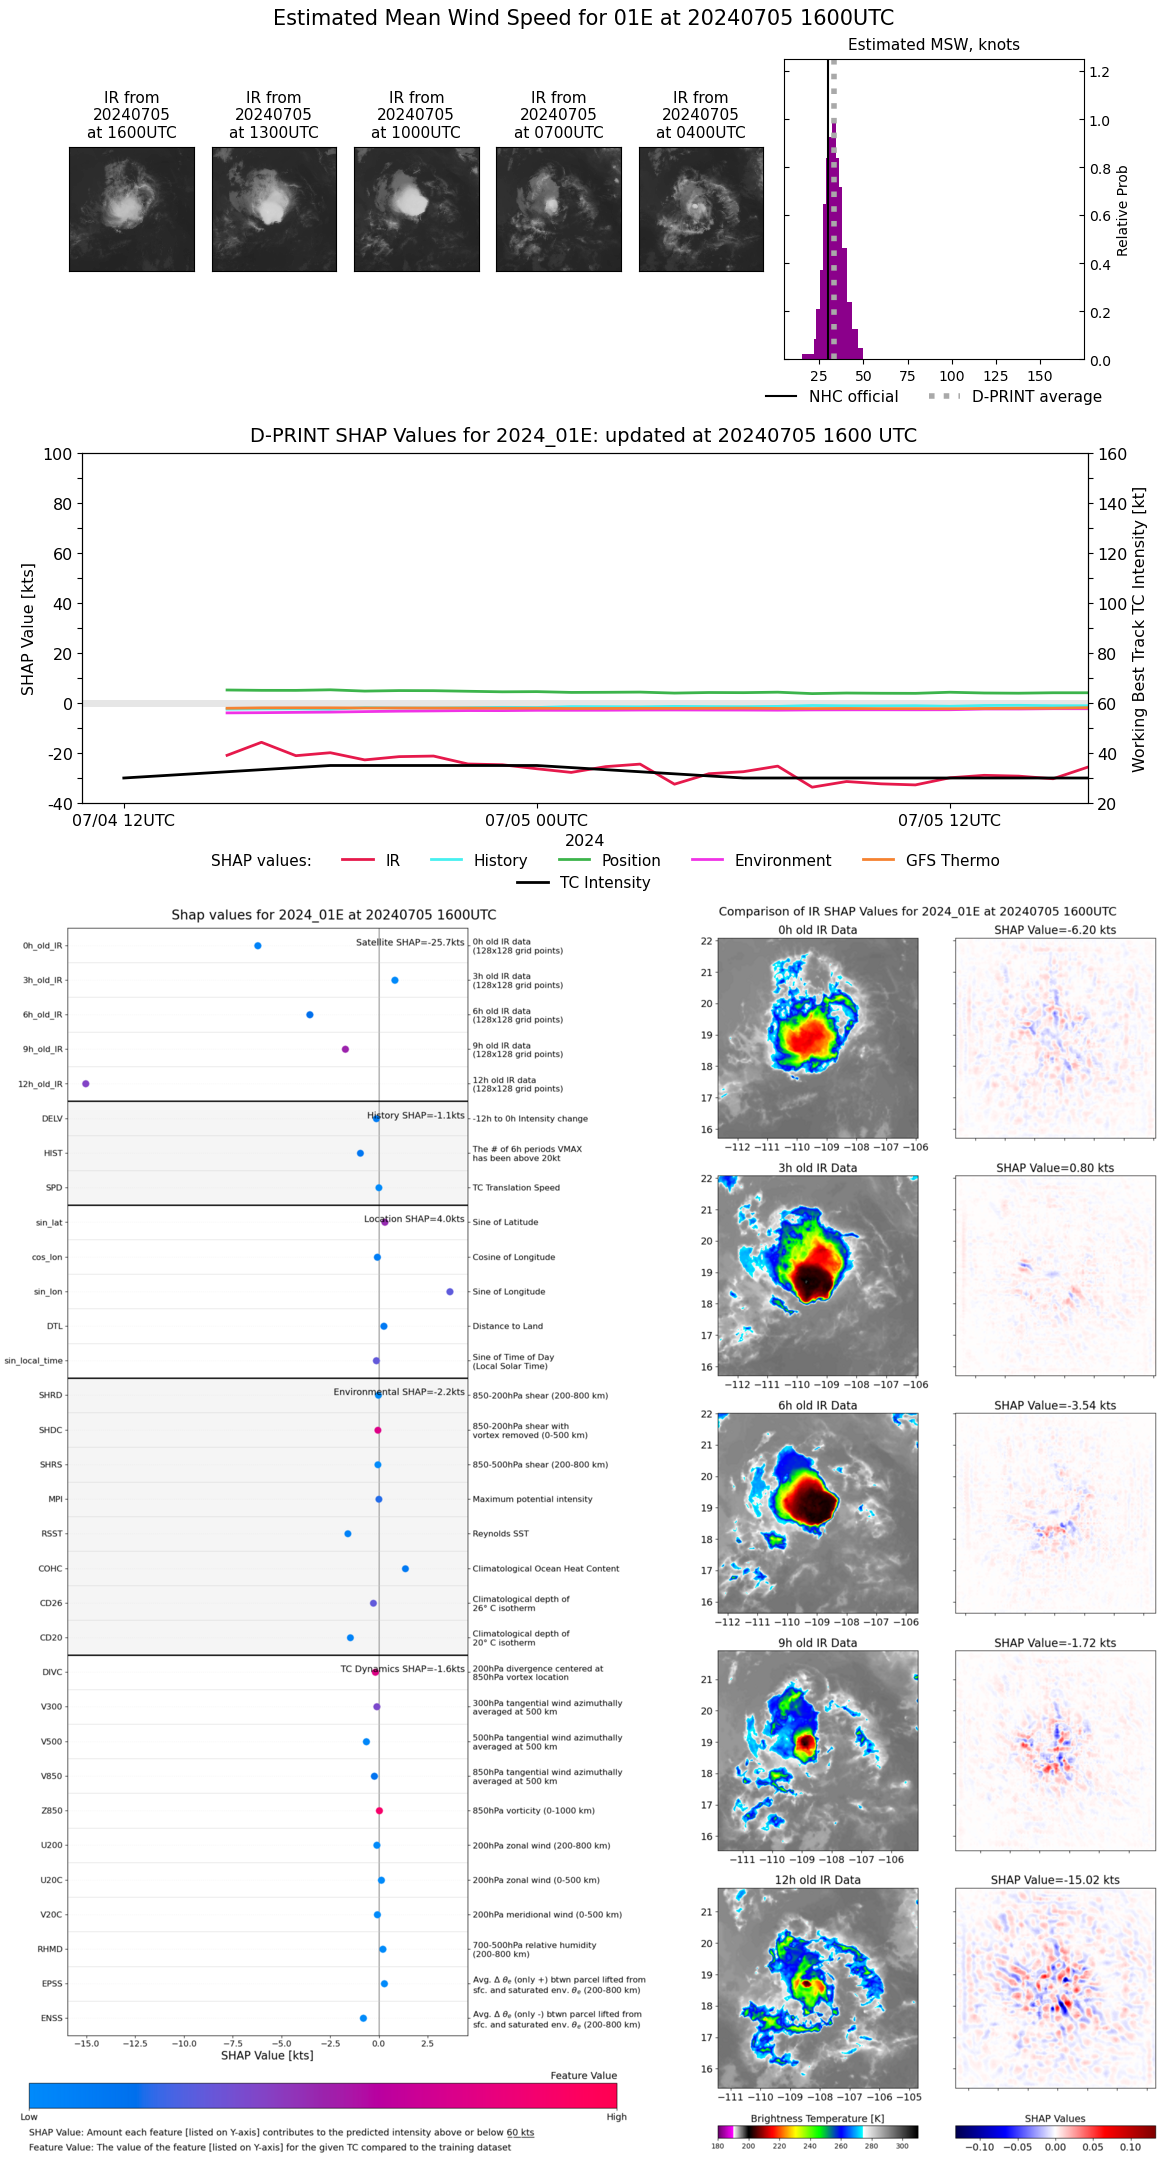 |
| 20240705 | 1500 UTC | 1006 hPa | 29 kts | 26 kts | 32 kts |  |
| 20240705 | 1400 UTC | 1006 hPa | 30 kts | 27 kts | 33 kts | 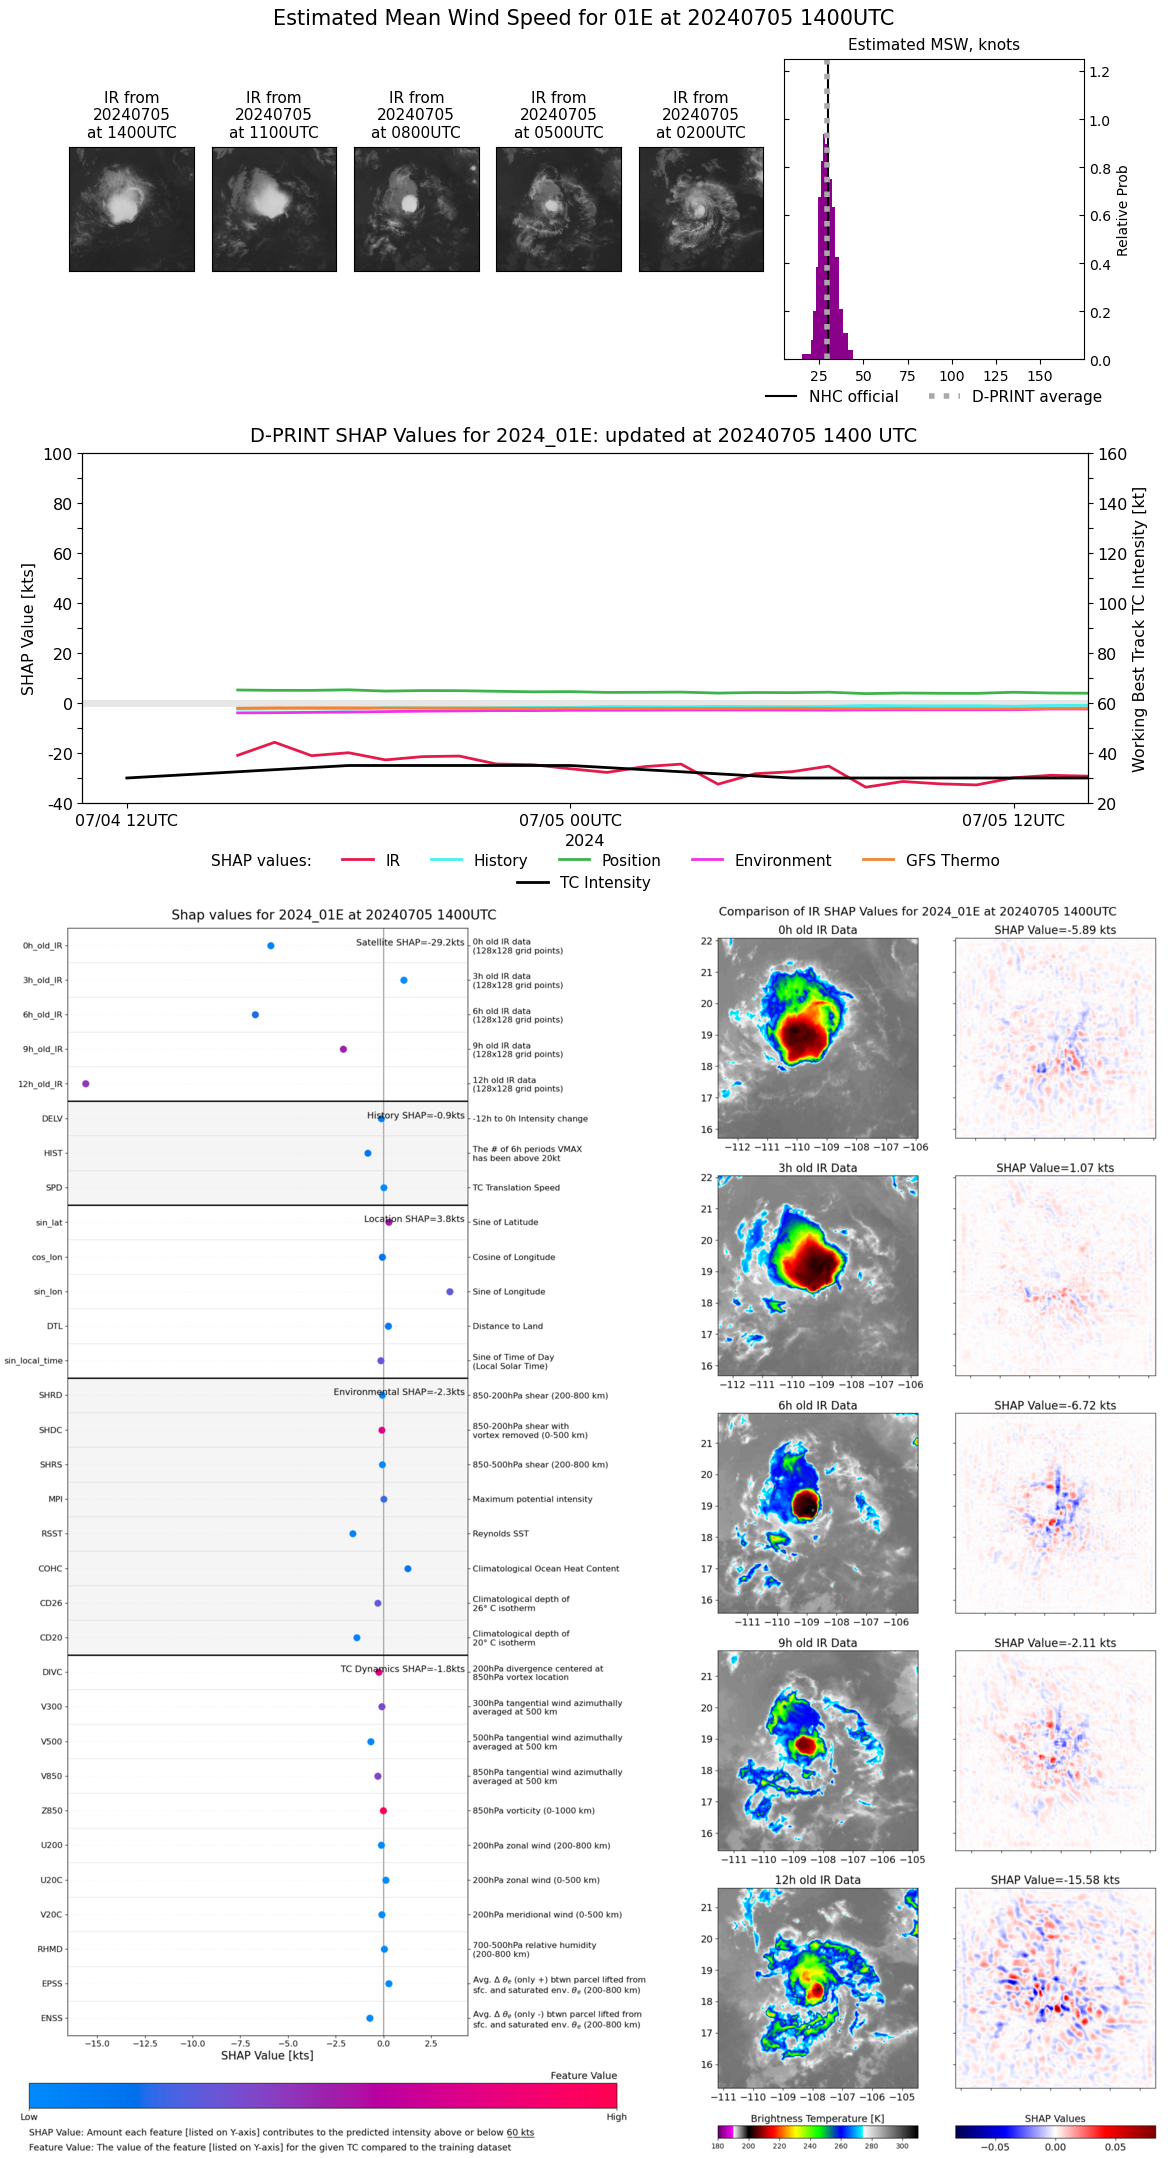 |
| 20240705 | 1300 UTC | 1006 hPa | 30 kts | 27 kts | 33 kts | 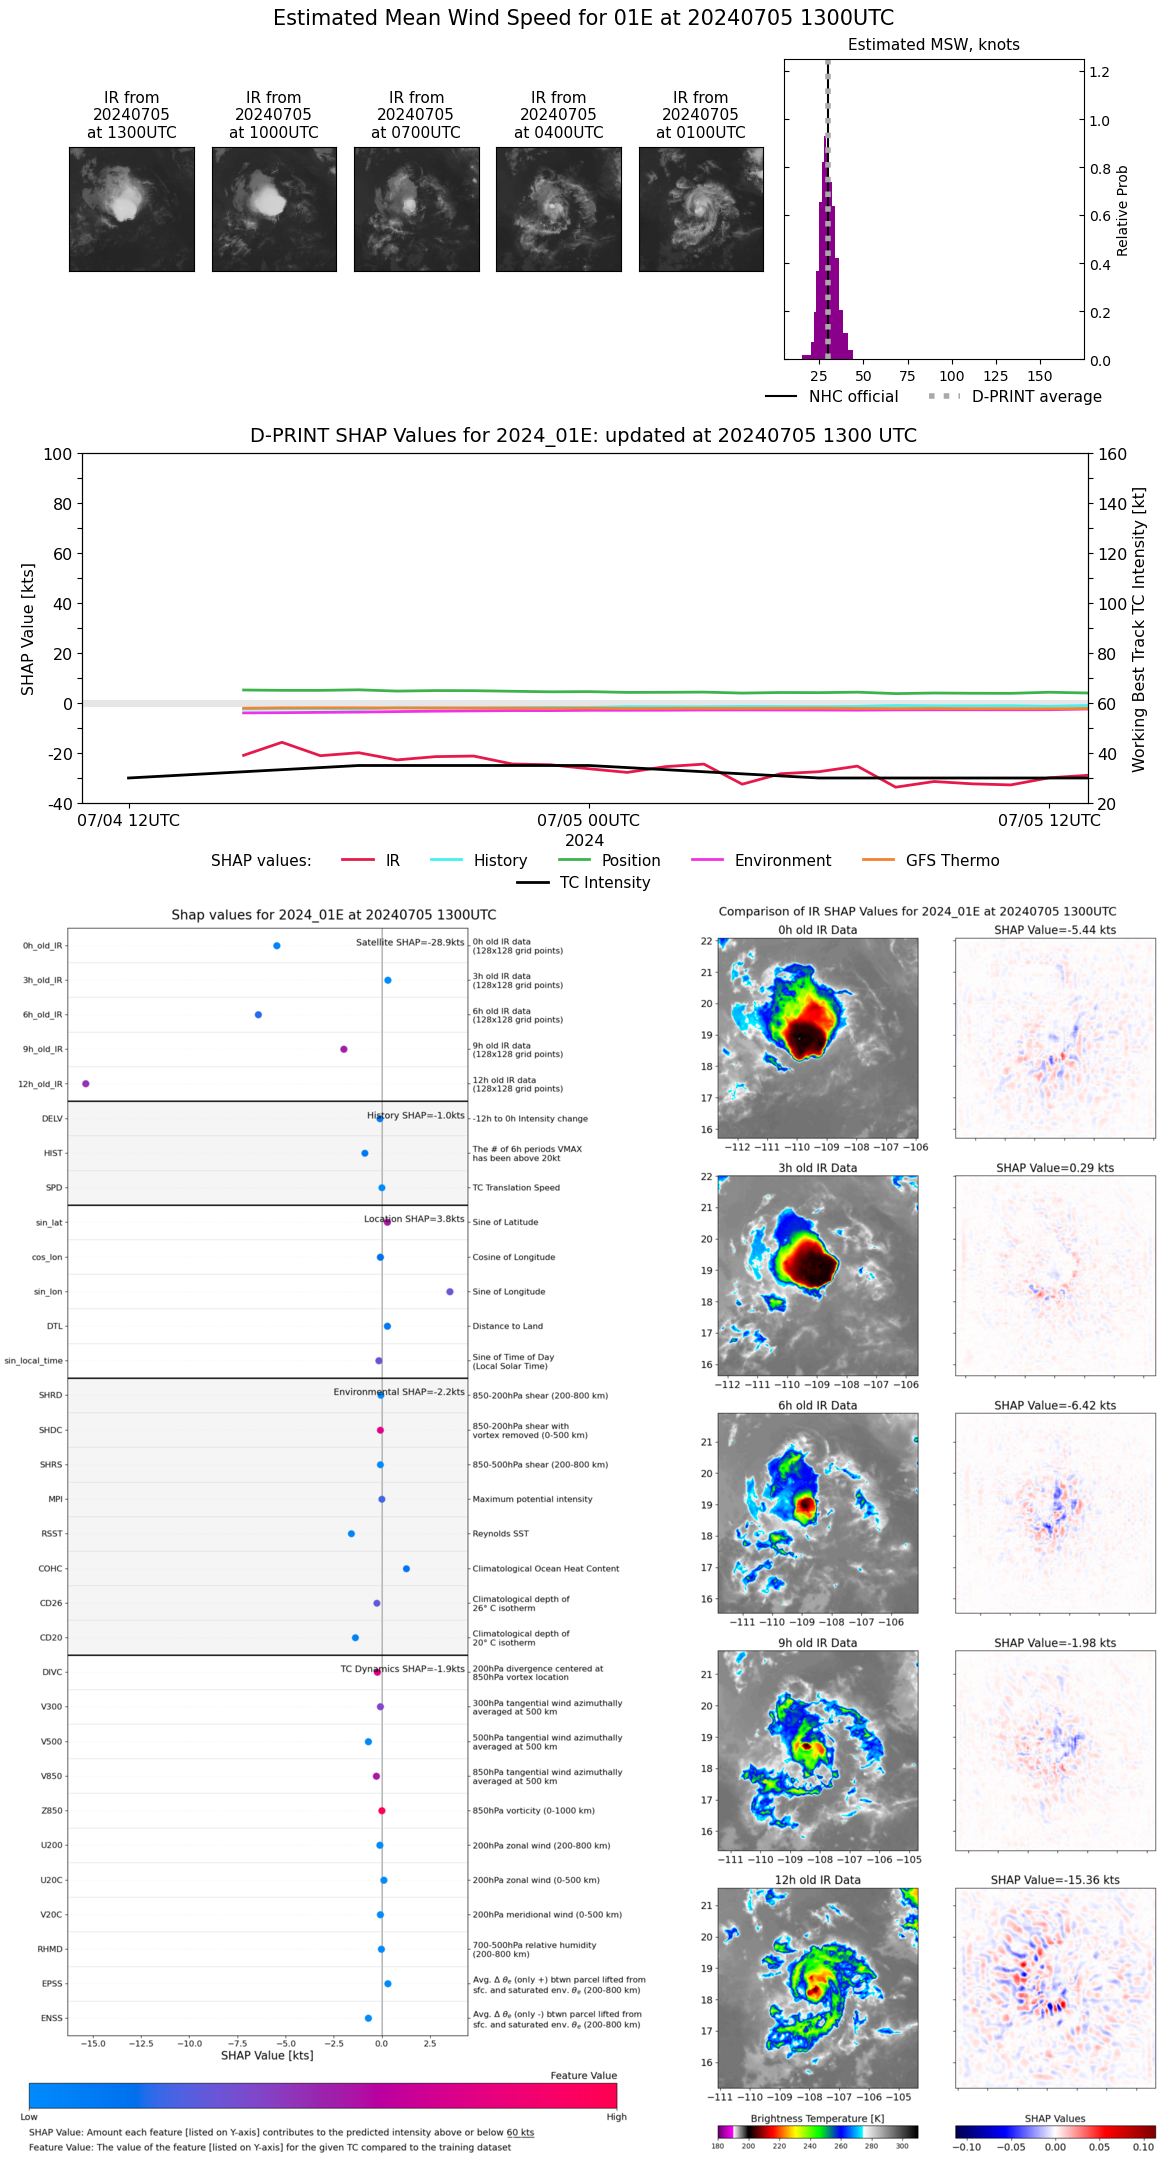 |
| 20240705 | 1200 UTC | 1006 hPa | 28 kts | 26 kts | 32 kts | 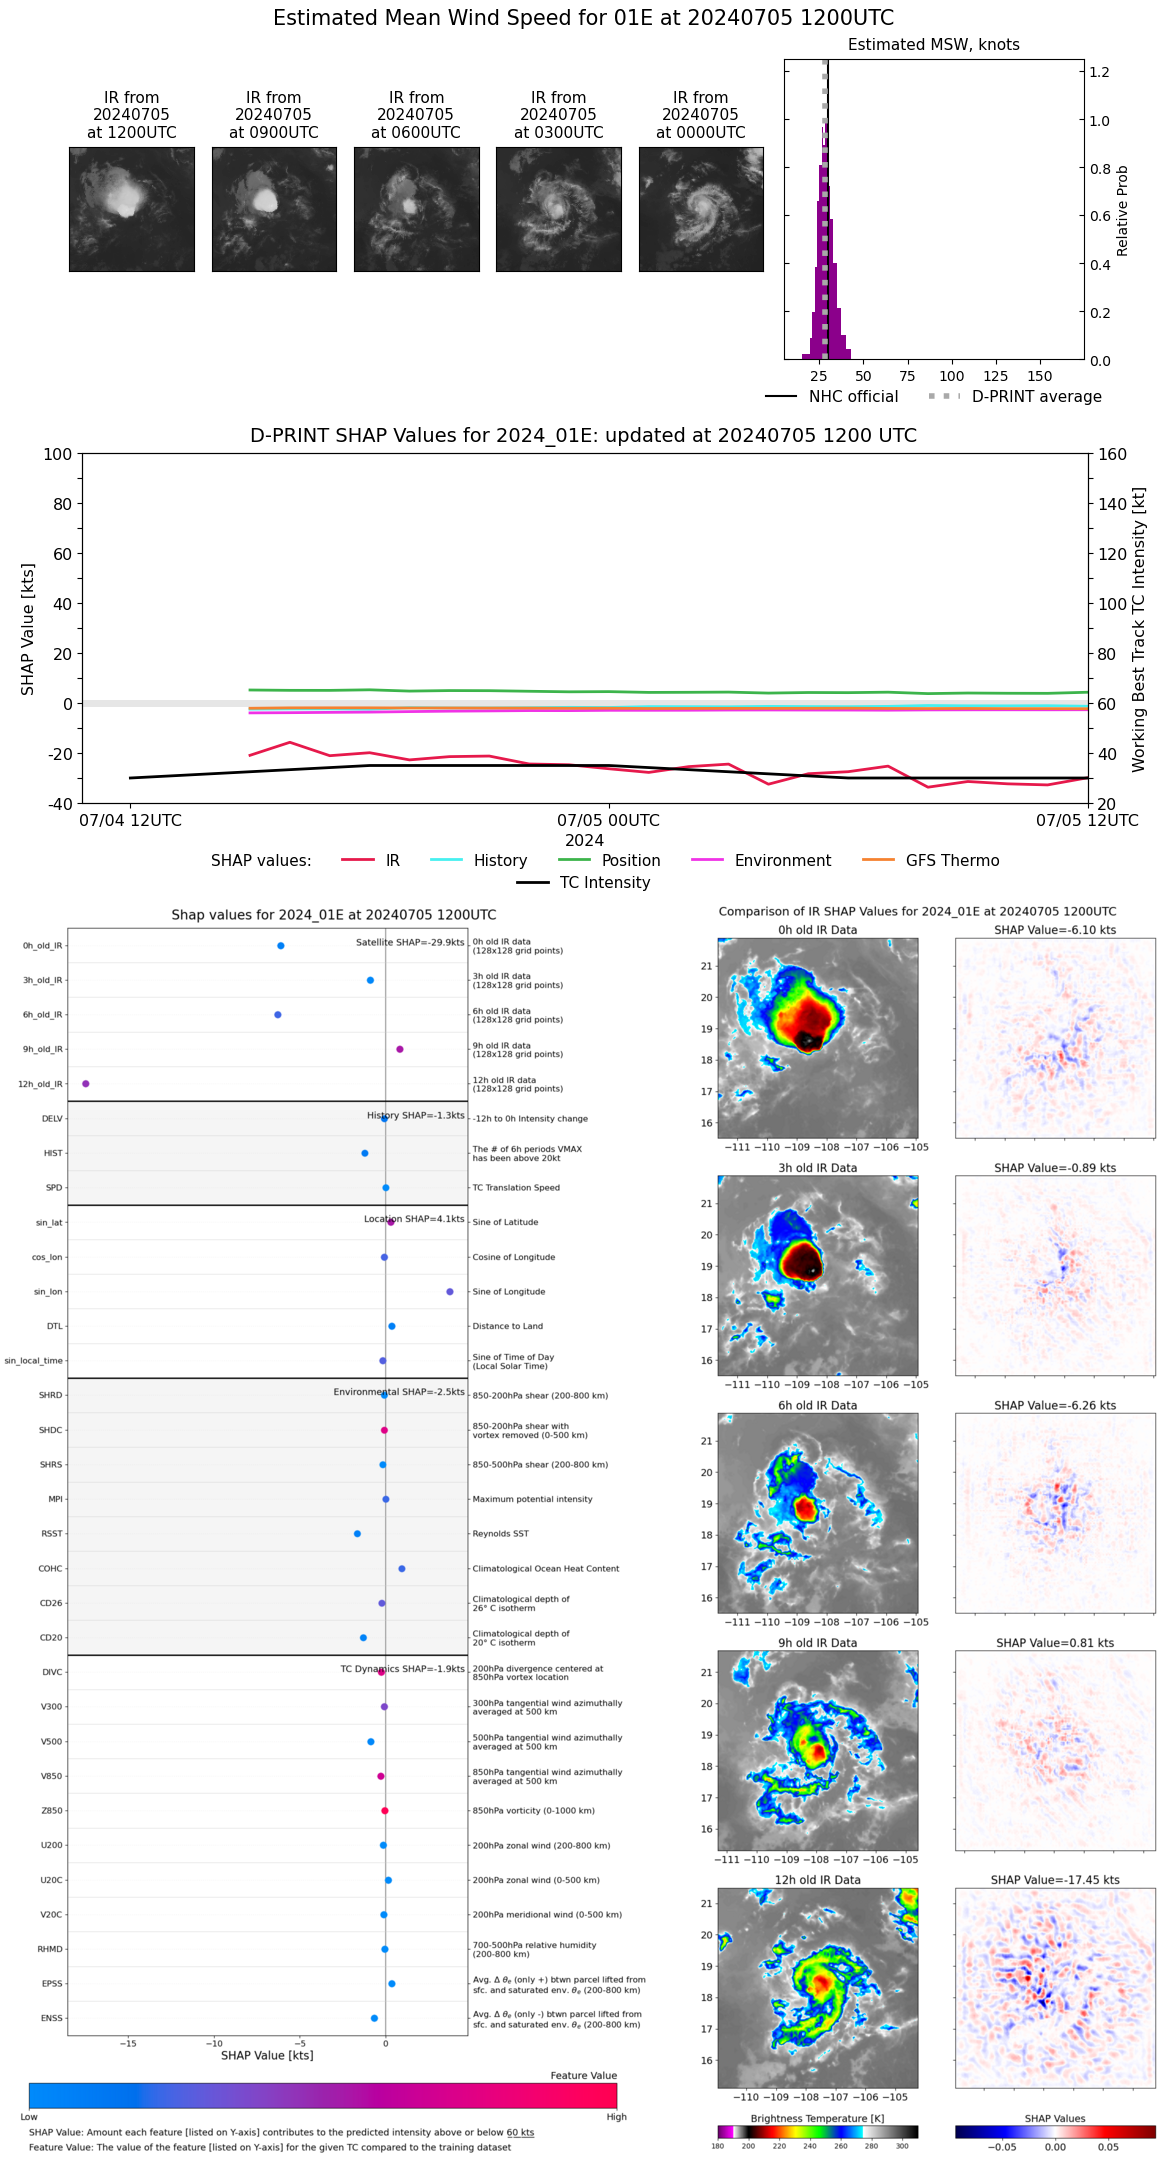 |
| 20240705 | 1100 UTC | 1007 hPa | 25 kts | 23 kts | 28 kts | 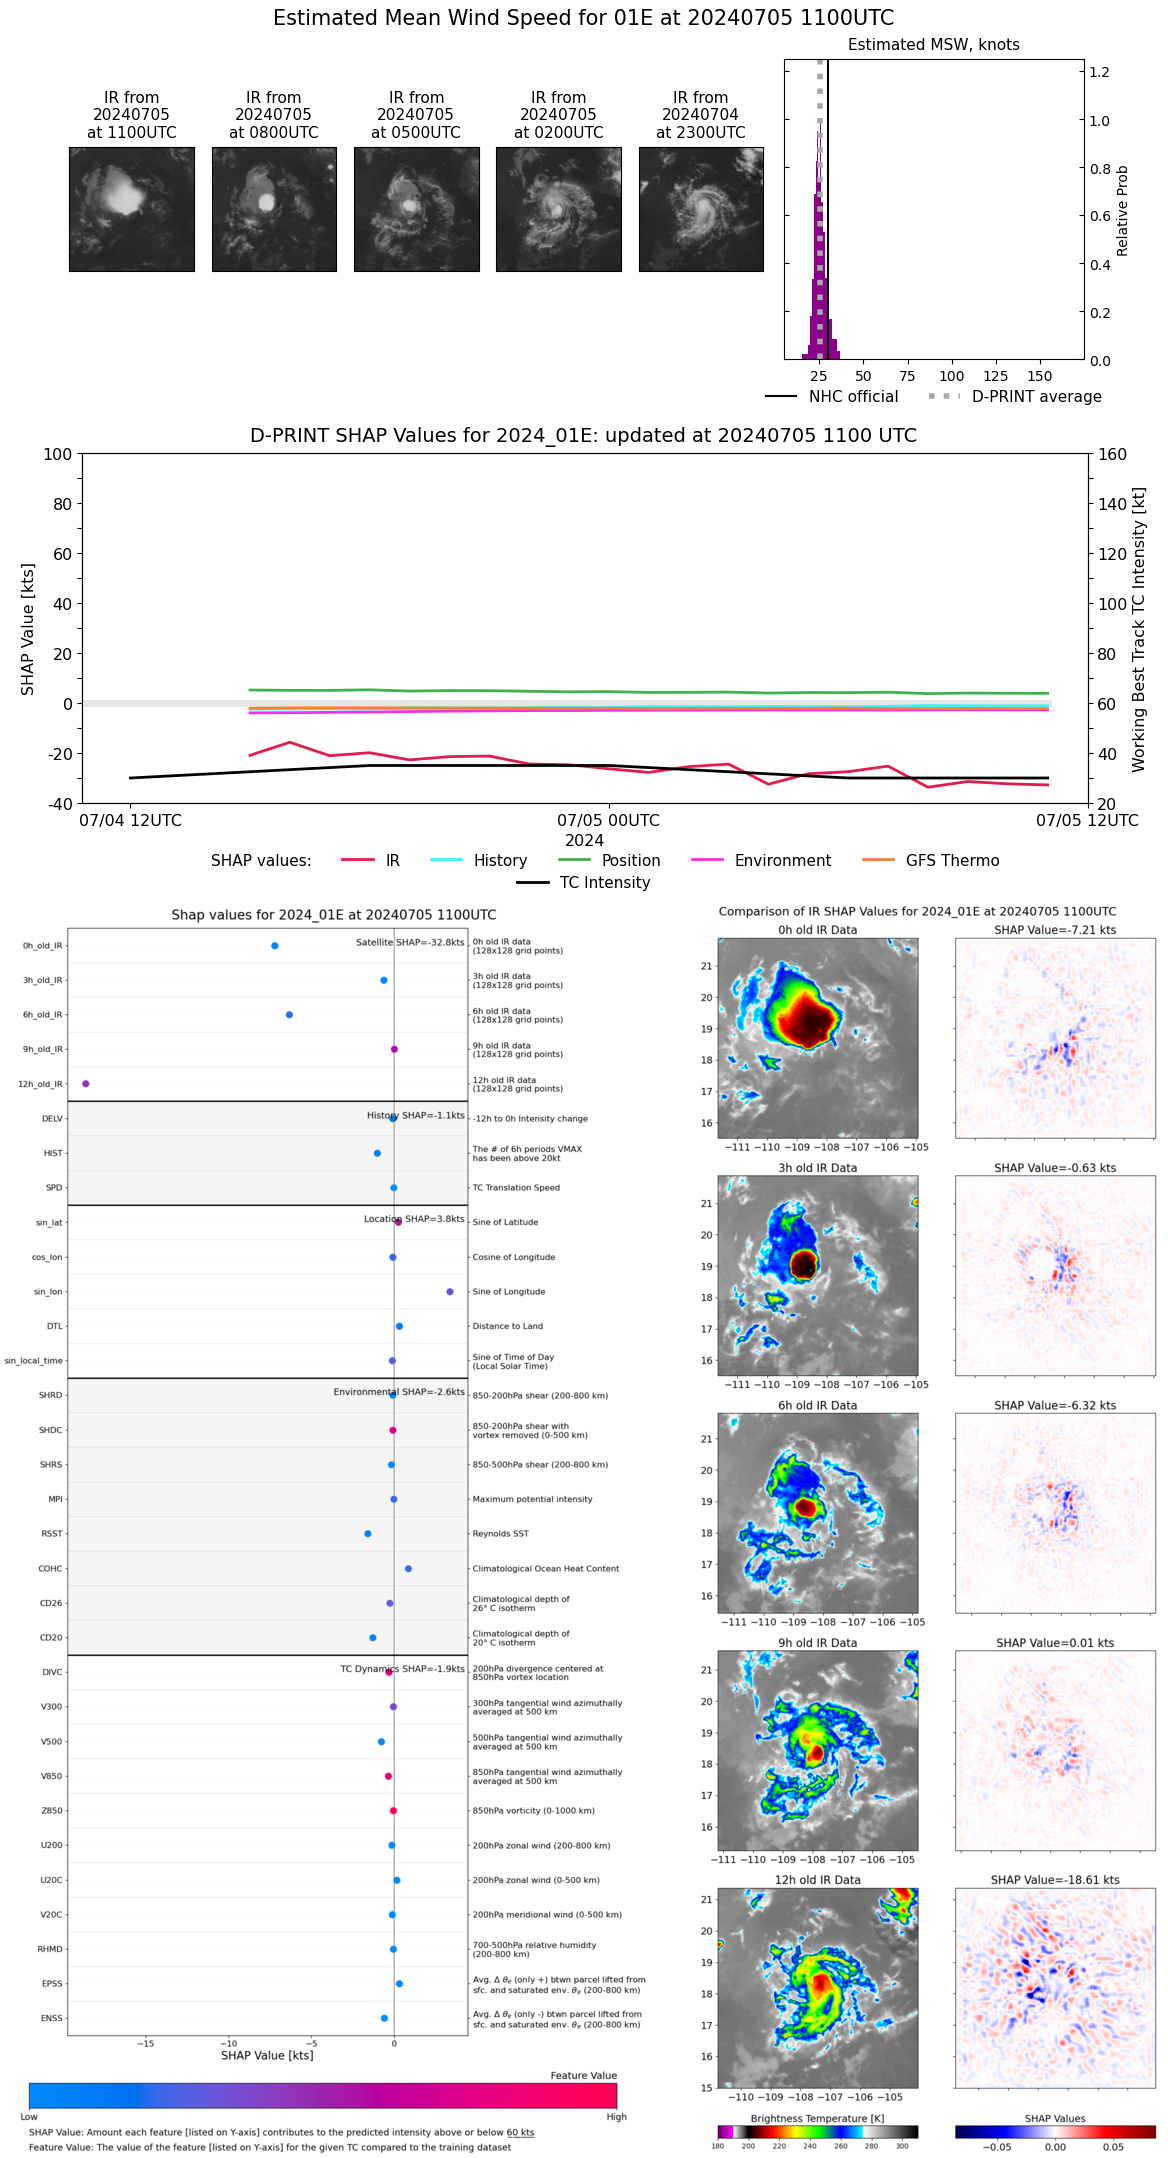 |
| 20240705 | 1000 UTC | 1007 hPa | 26 kts | 24 kts | 28 kts |  |
| 20240705 | 0900 UTC | 1008 hPa | 27 kts | 25 kts | 30 kts |  |
| 20240705 | 0800 UTC | 1008 hPa | 24 kts | 23 kts | 26 kts | 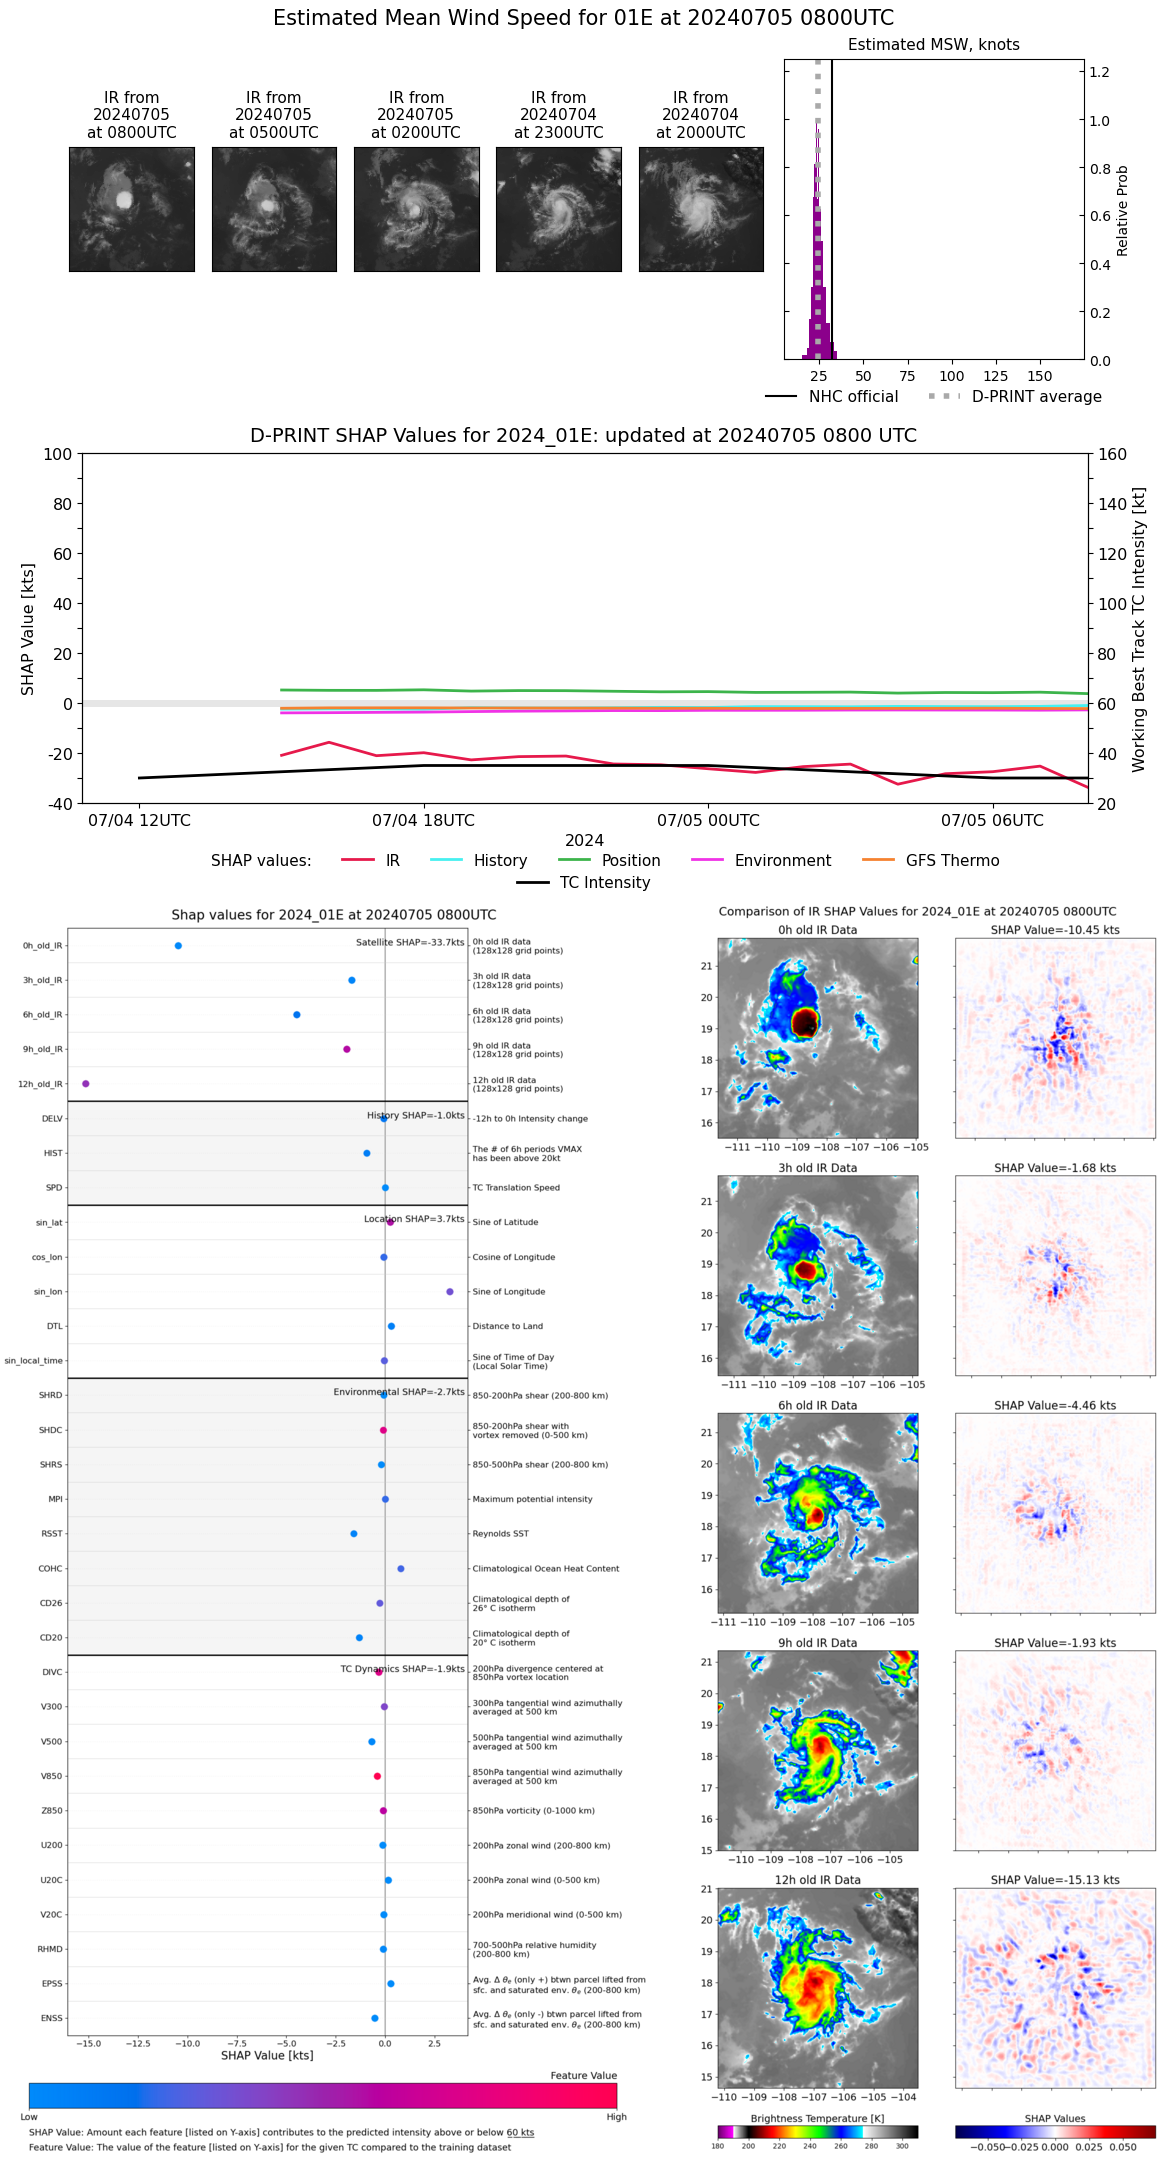 |
| 20240705 | 0700 UTC | 1009 hPa | 33 kts | 29 kts | 37 kts | 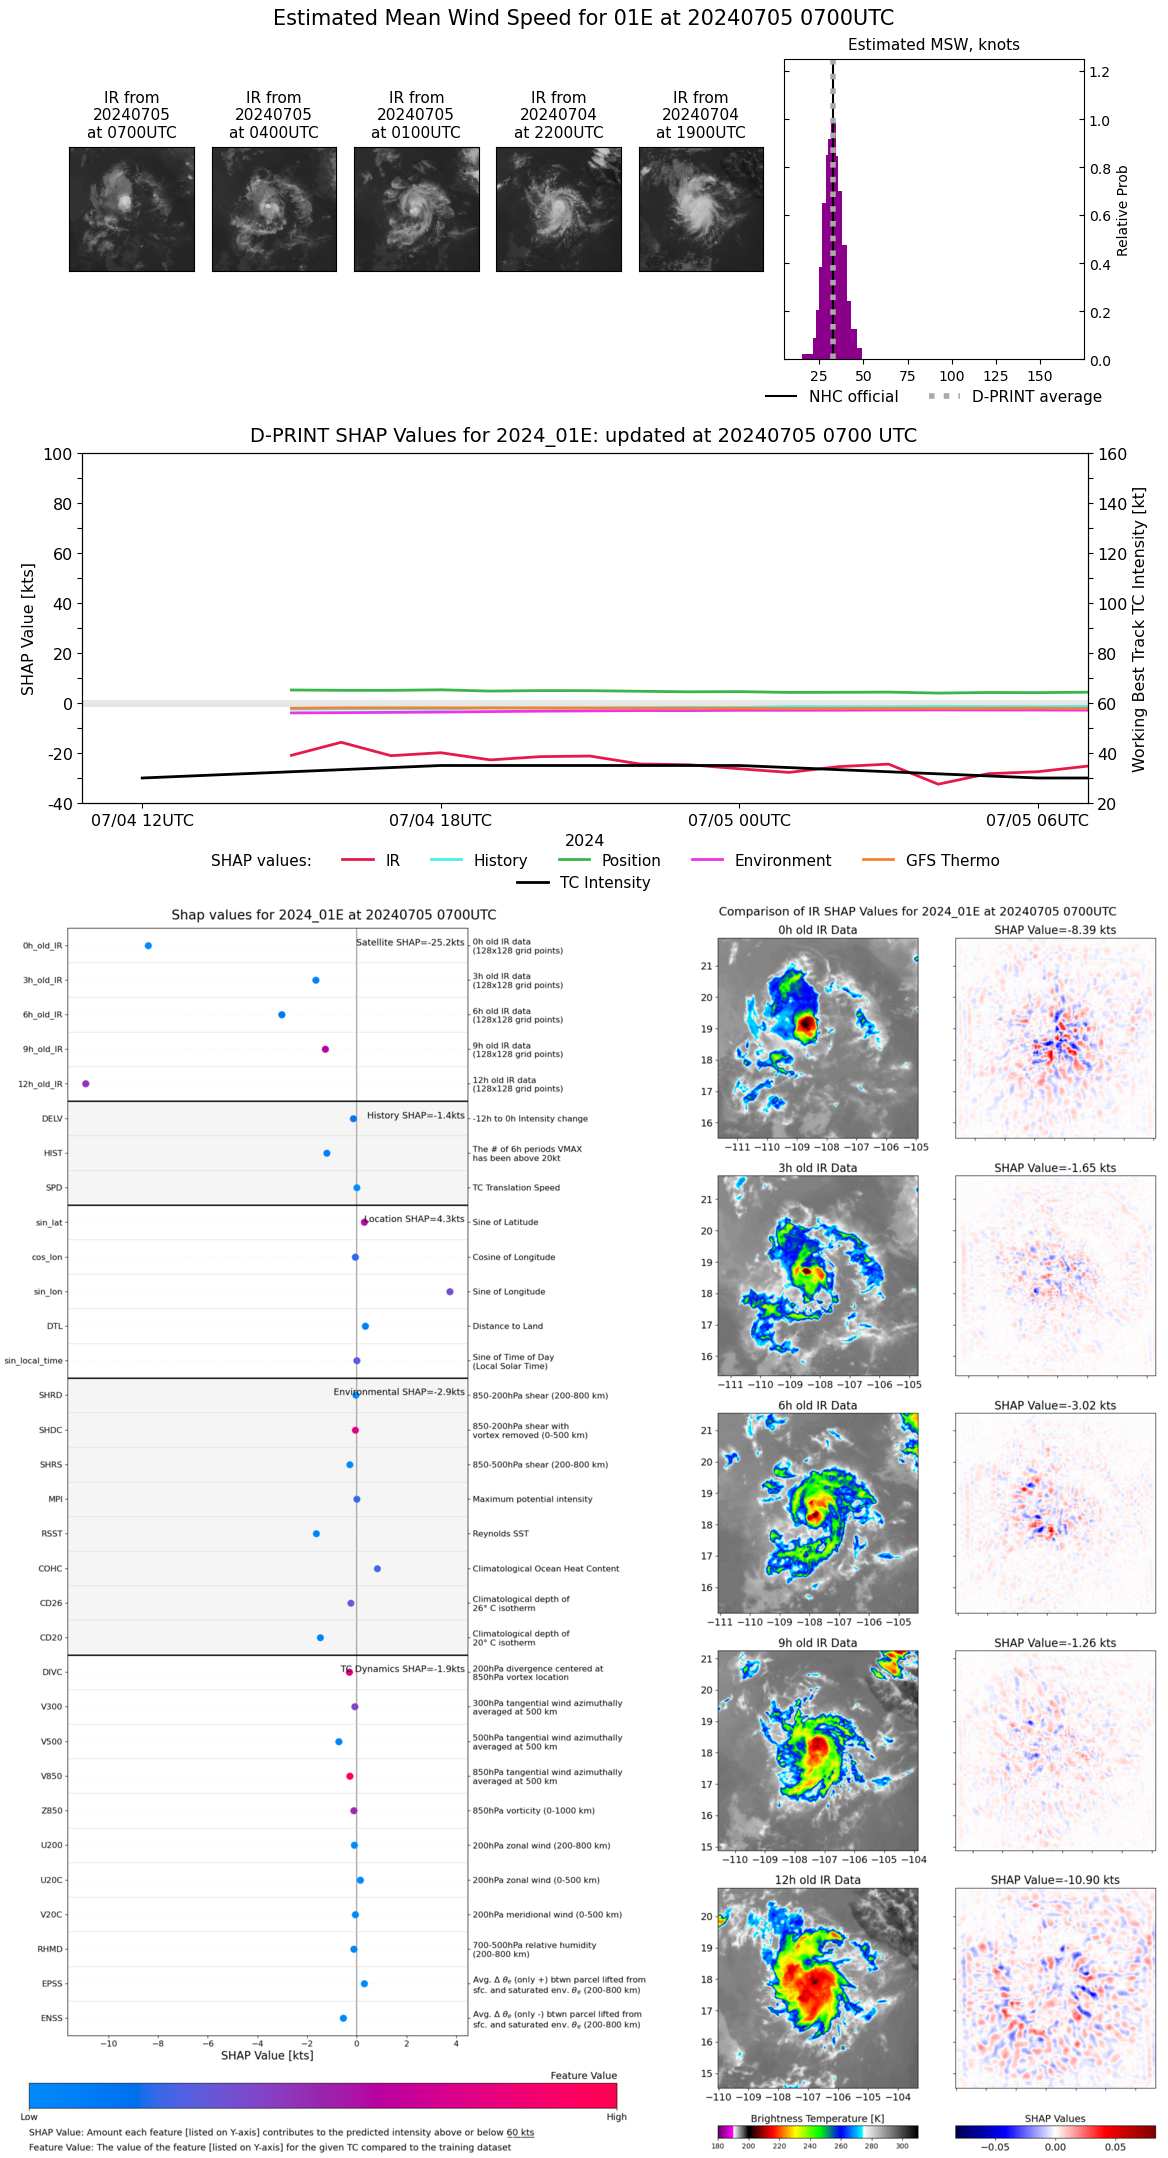 |
| 20240705 | 0600 UTC | 1007 hPa | 31 kts | 28 kts | 34 kts | 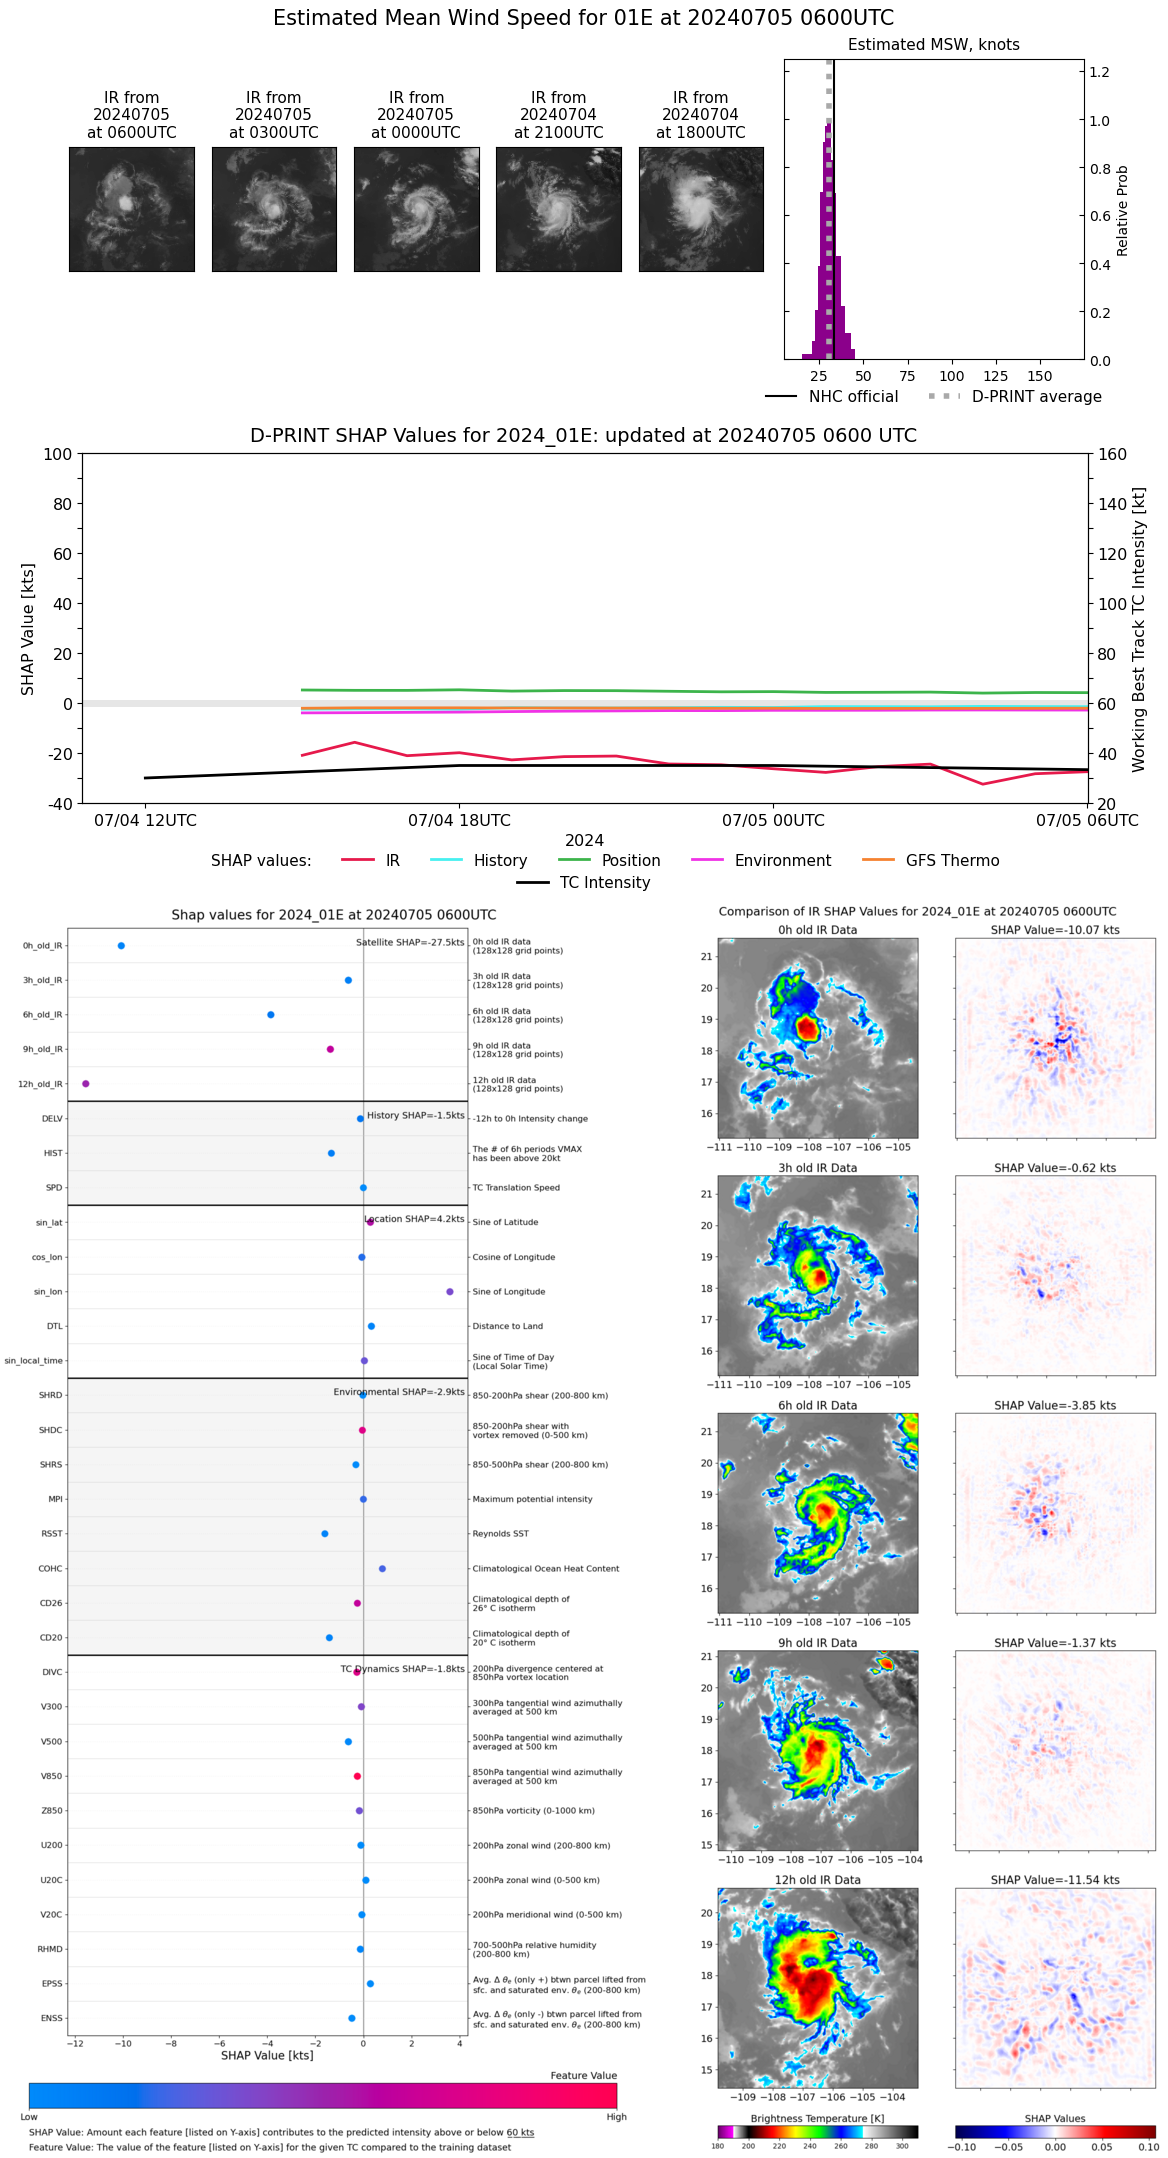 |
| 20240705 | 0500 UTC | 1007 hPa | 30 kts | 27 kts | 33 kts |  |
| 20240705 | 0400 UTC | 1007 hPa | 25 kts | 23 kts | 28 kts | 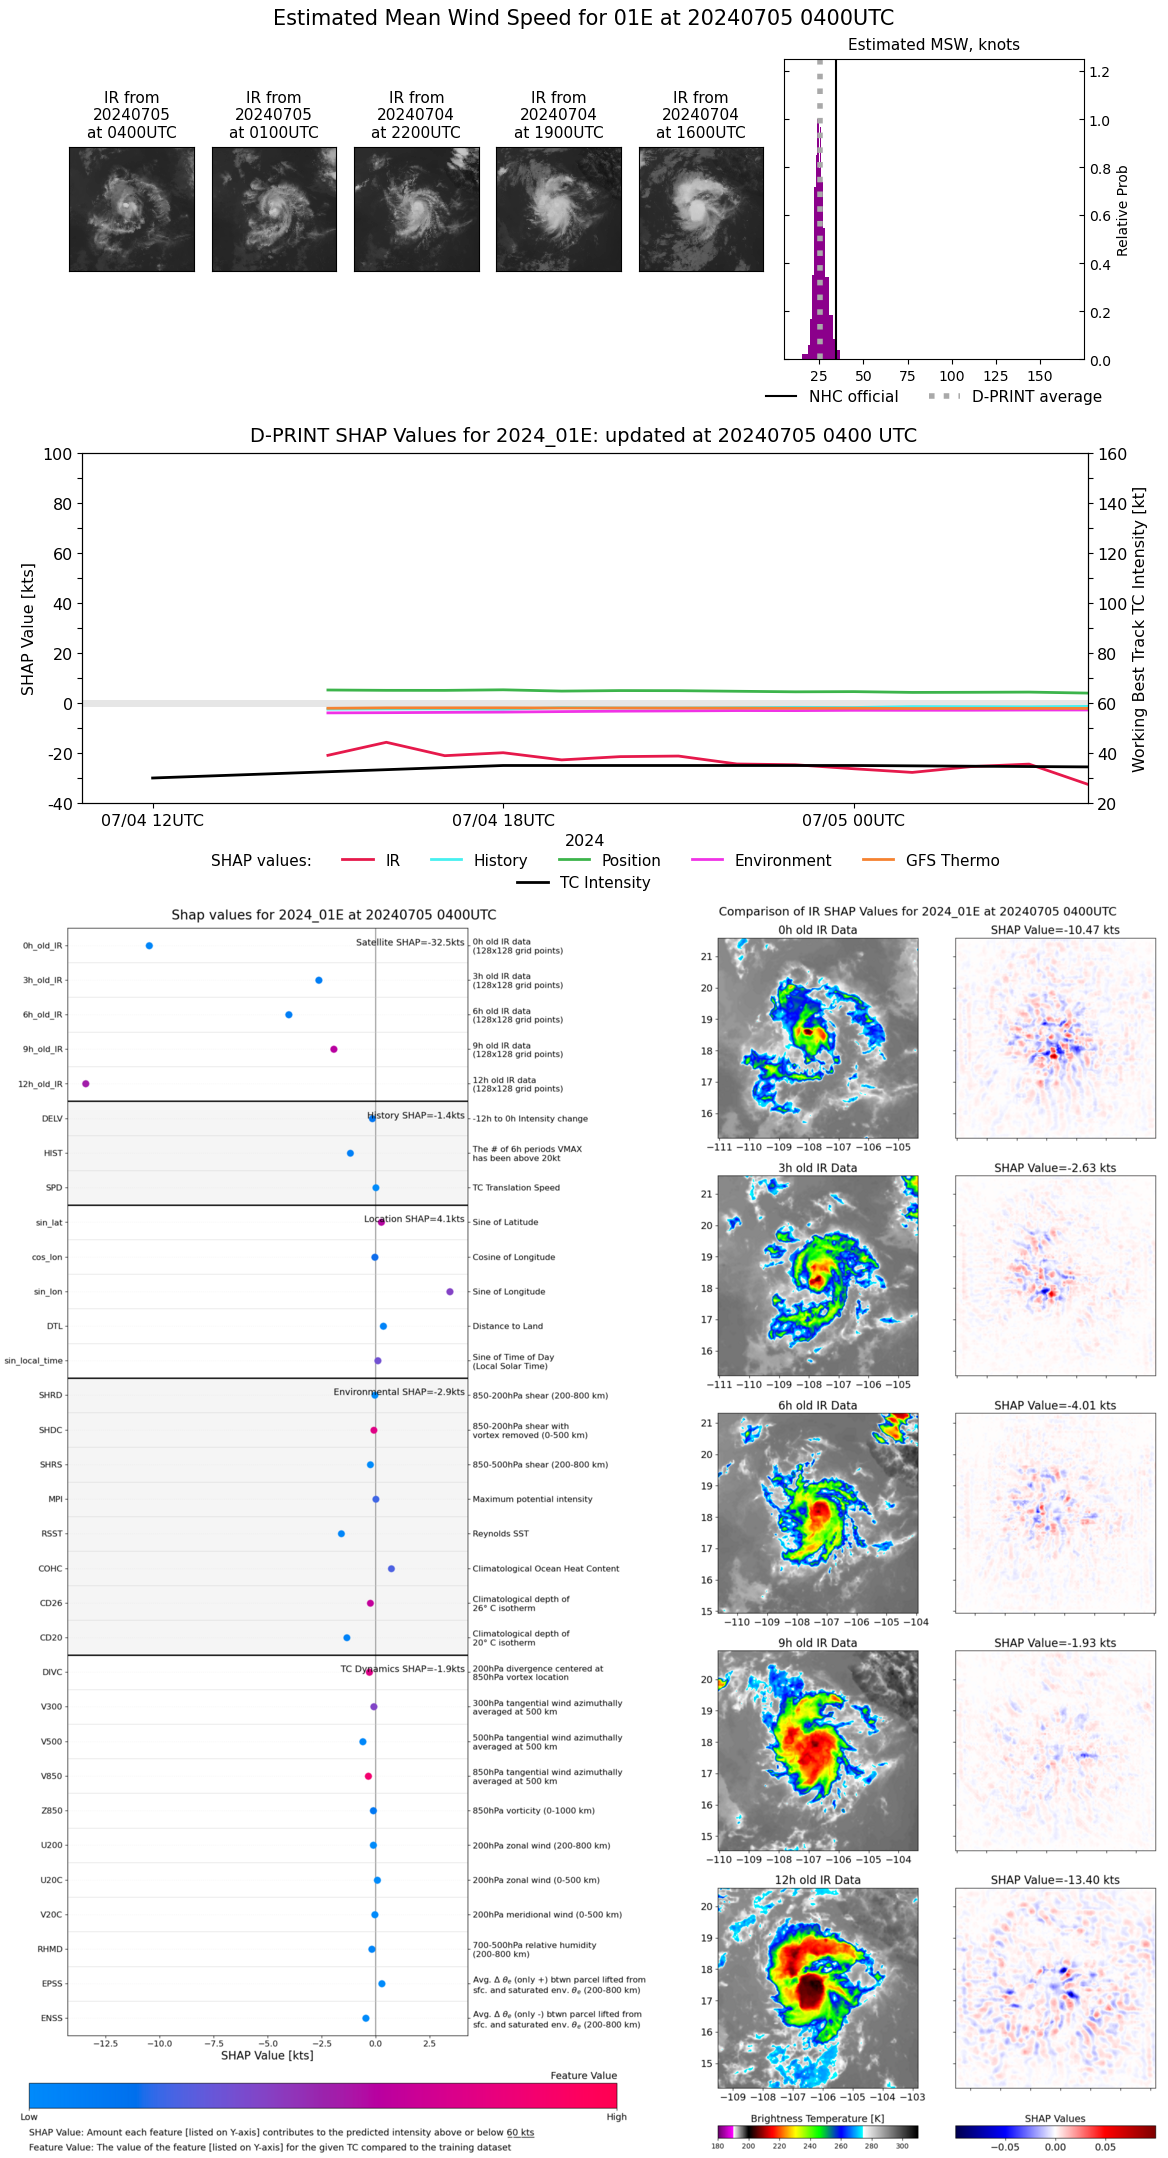 |
| 20240705 | 0300 UTC | 1006 hPa | 34 kts | 30 kts | 38 kts | 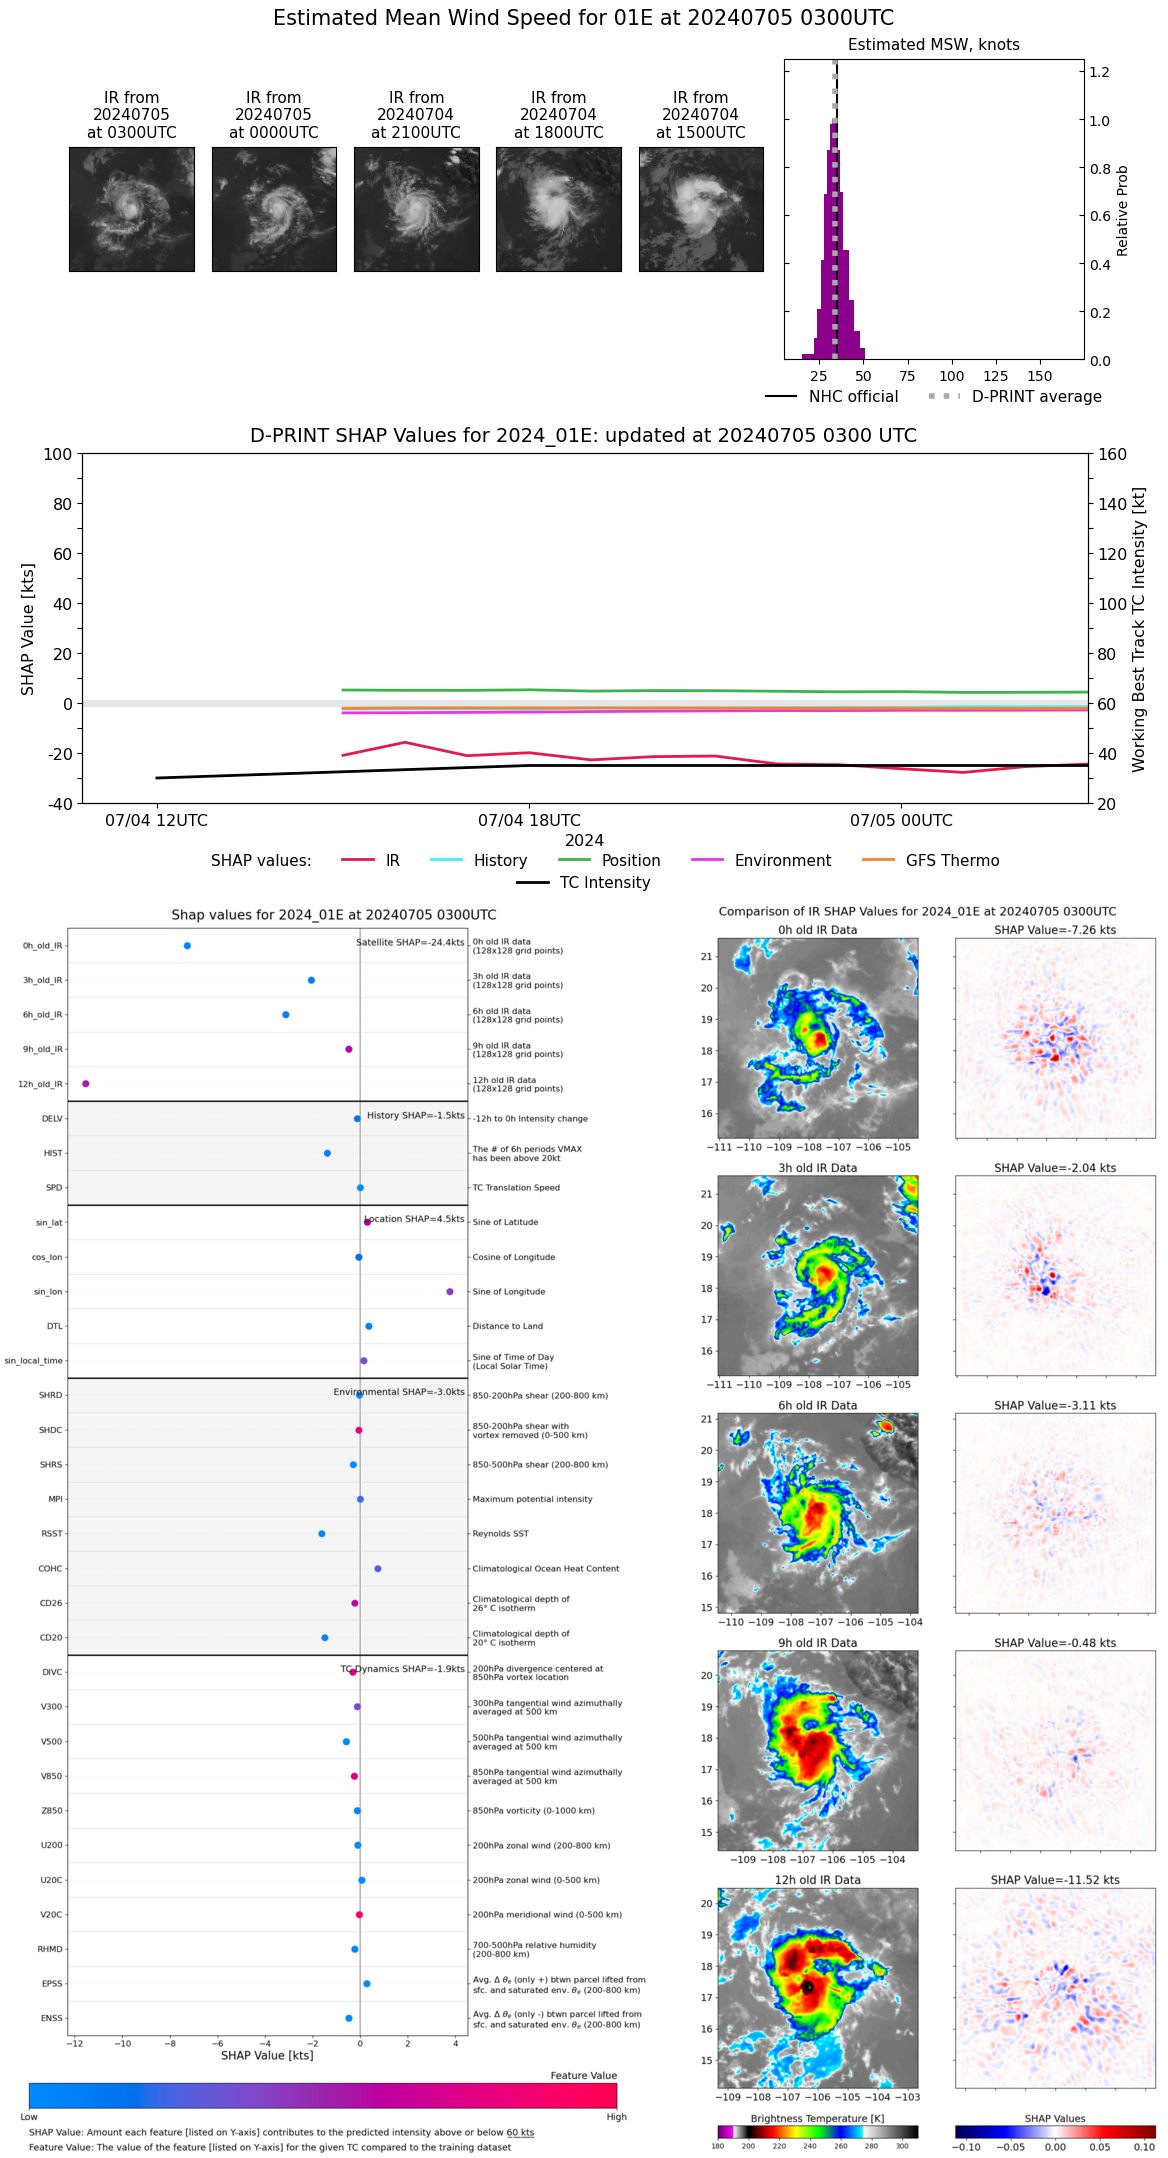 |
| 20240705 | 0200 UTC | 1006 hPa | 33 kts | 29 kts | 37 kts | 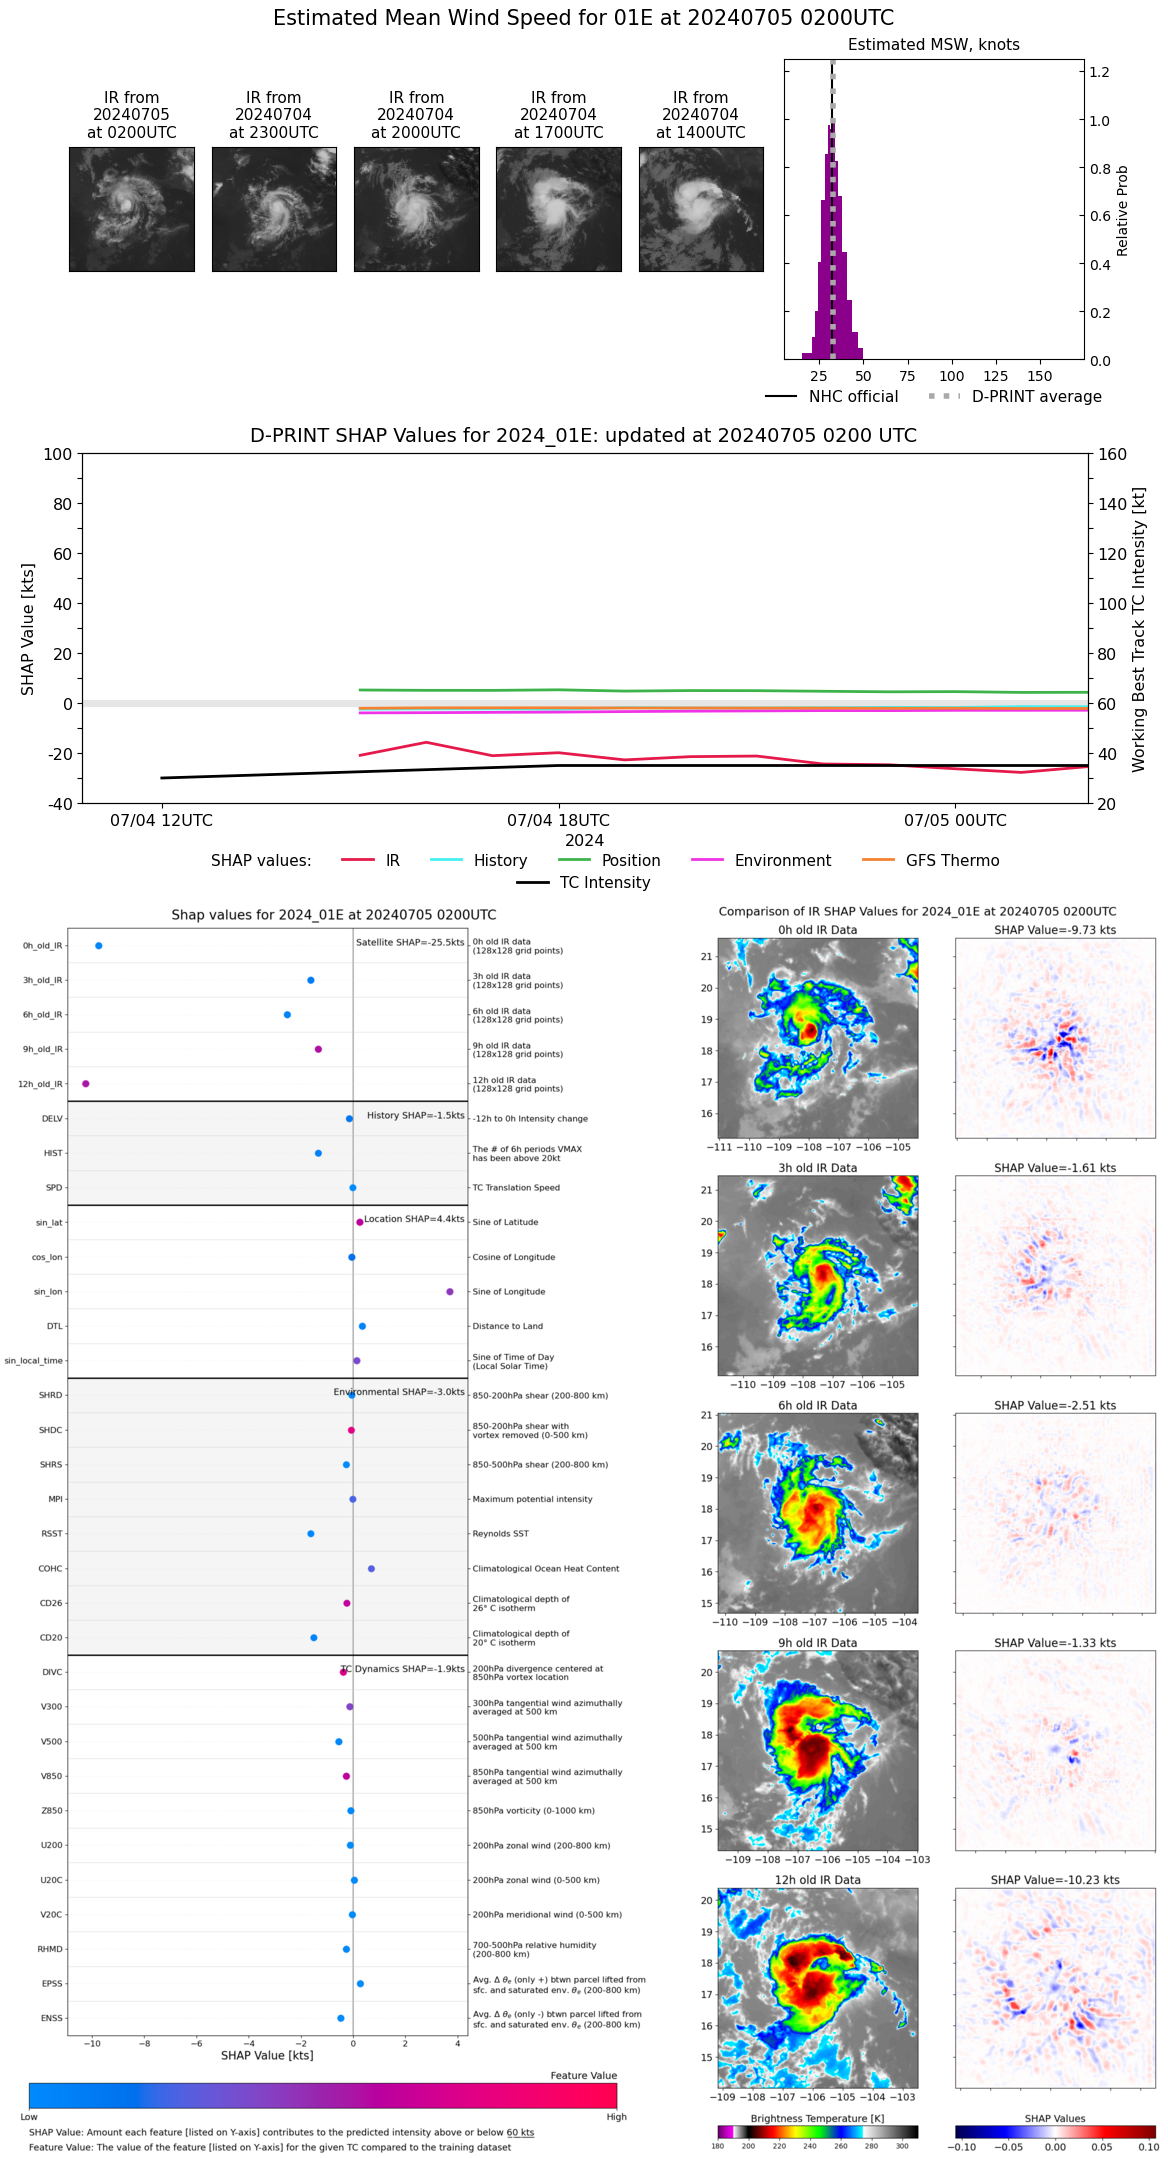 |
| 20240705 | 0100 UTC | 1007 hPa | 30 kts | 27 kts | 34 kts | 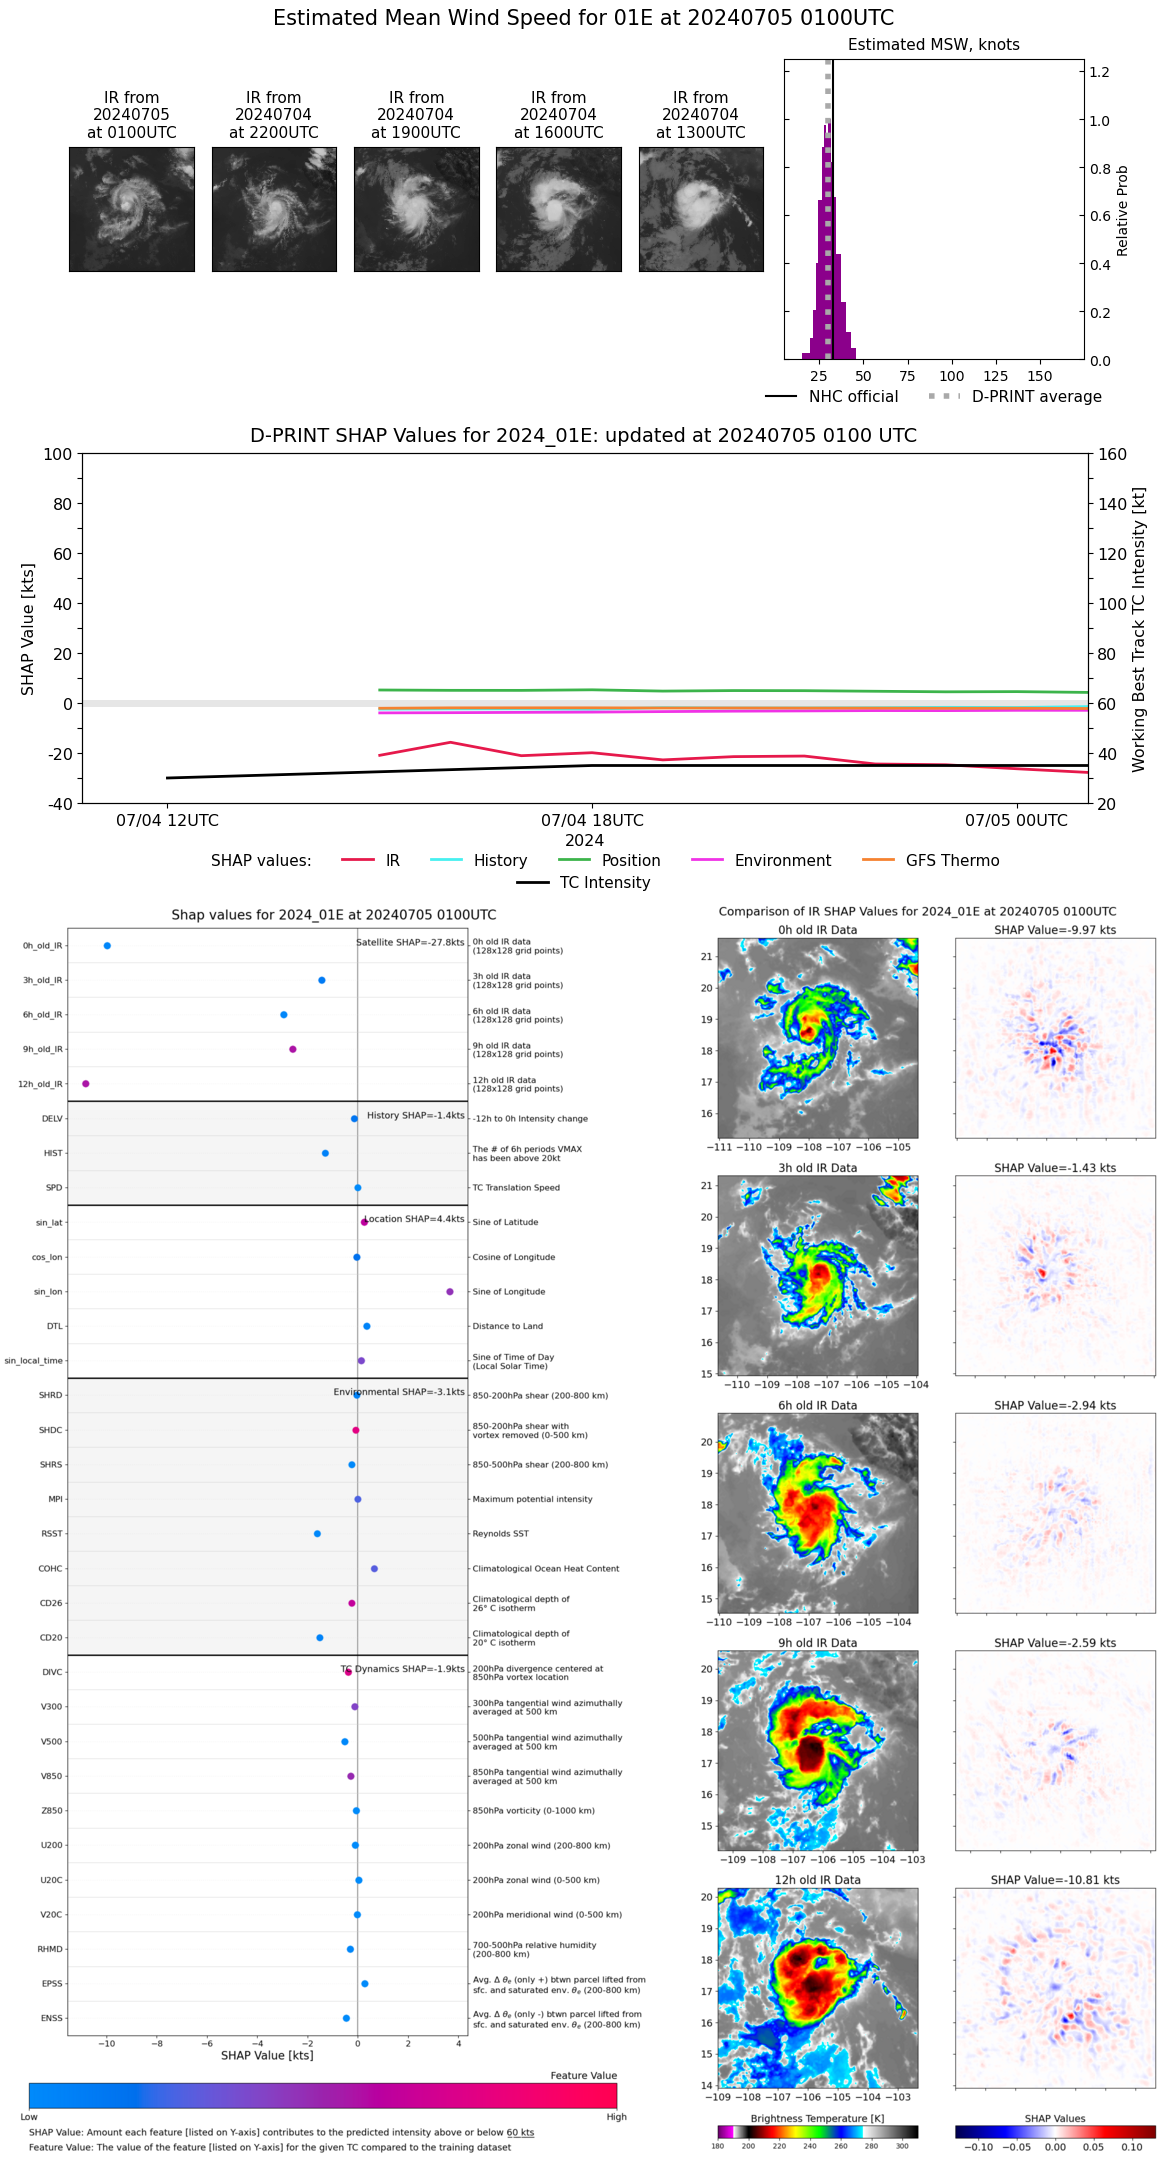 |
| 20240705 | 0000 UTC | 1006 hPa | 32 kts | 28 kts | 36 kts | 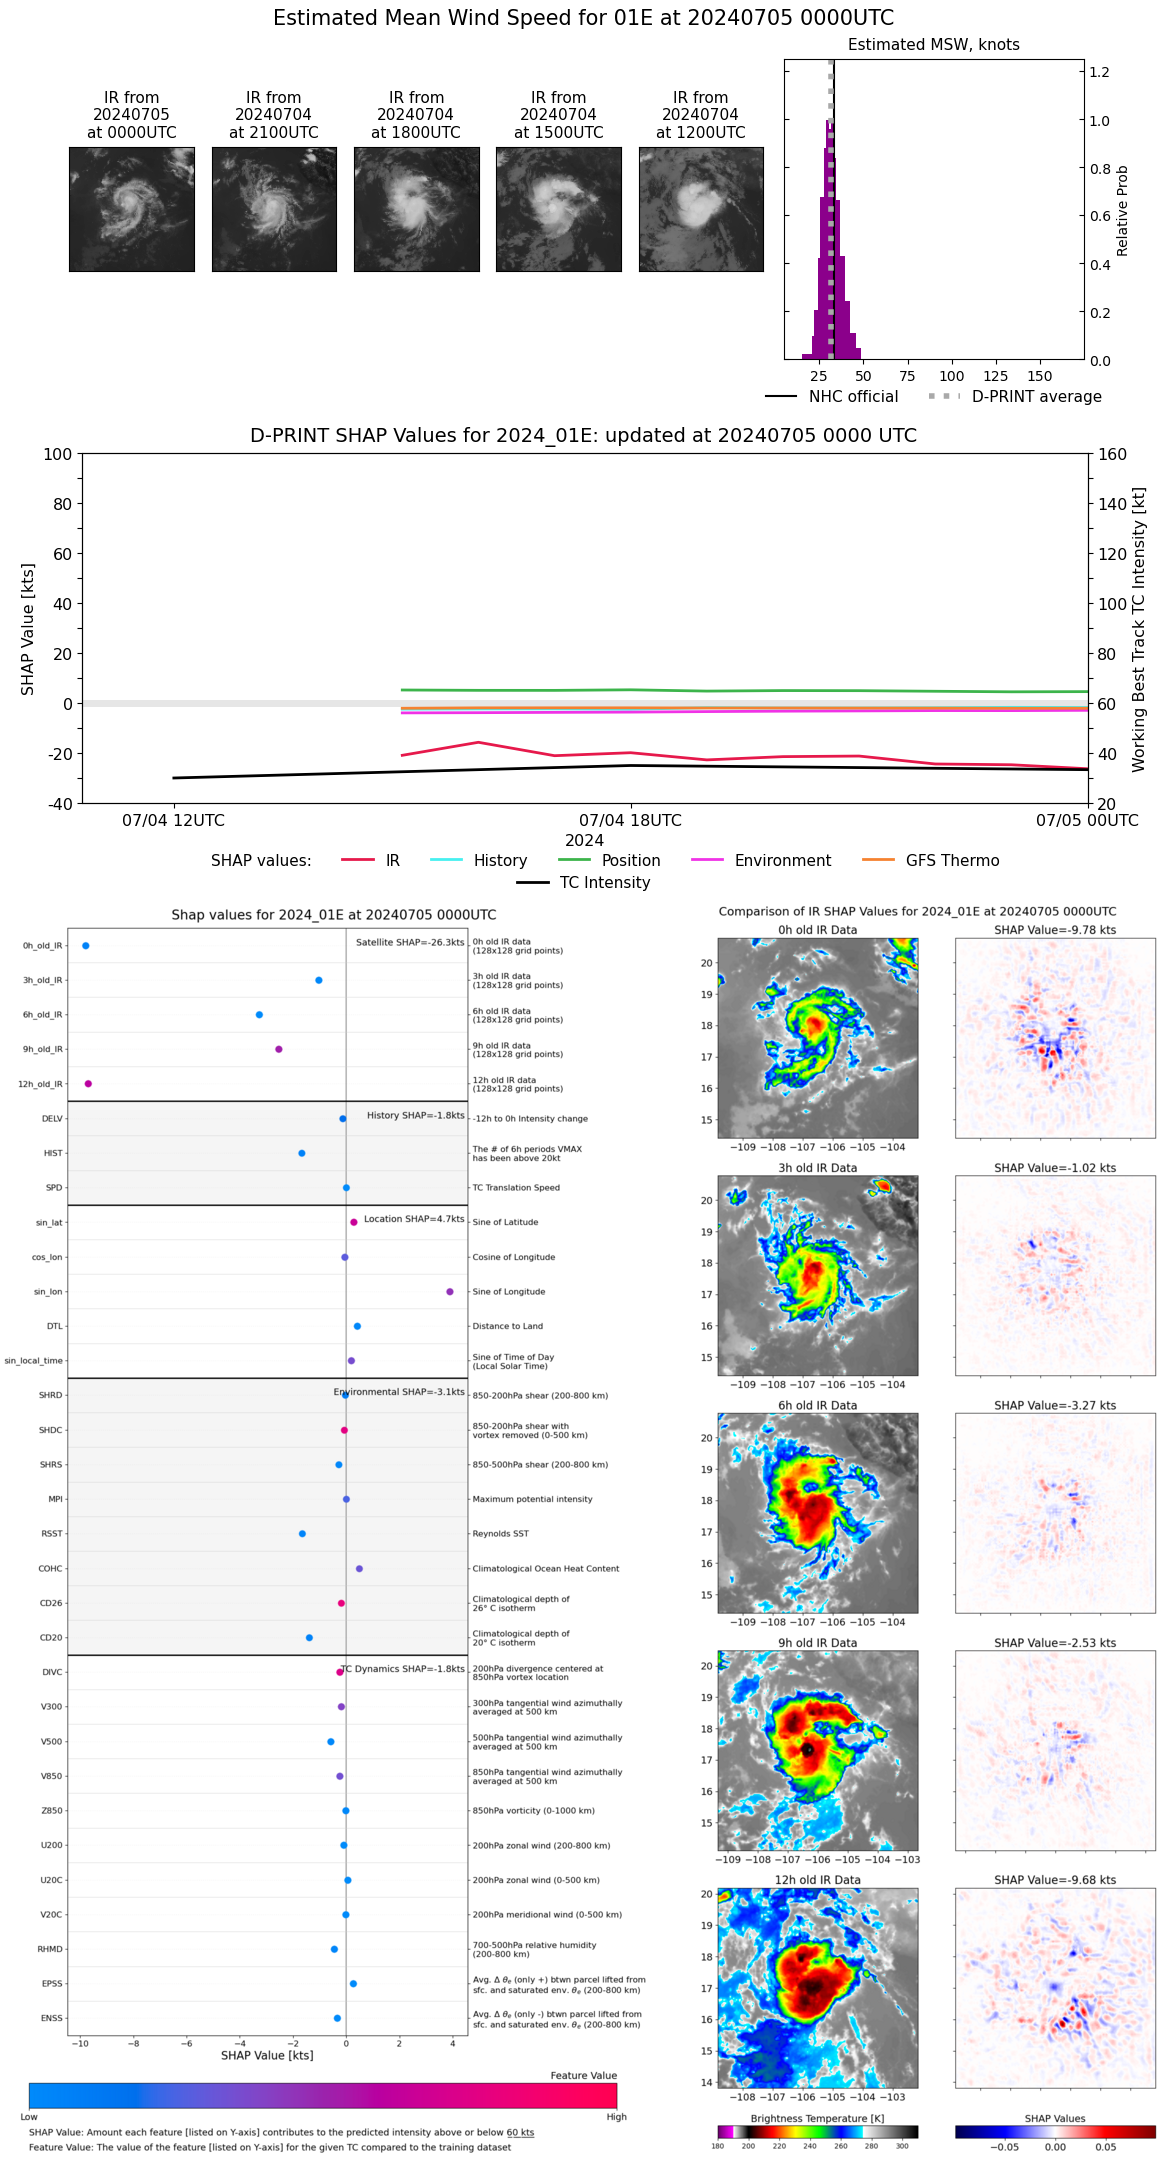 |
| 20240704 | 2300 UTC | 1007 hPa | 33 kts | 29 kts | 38 kts | 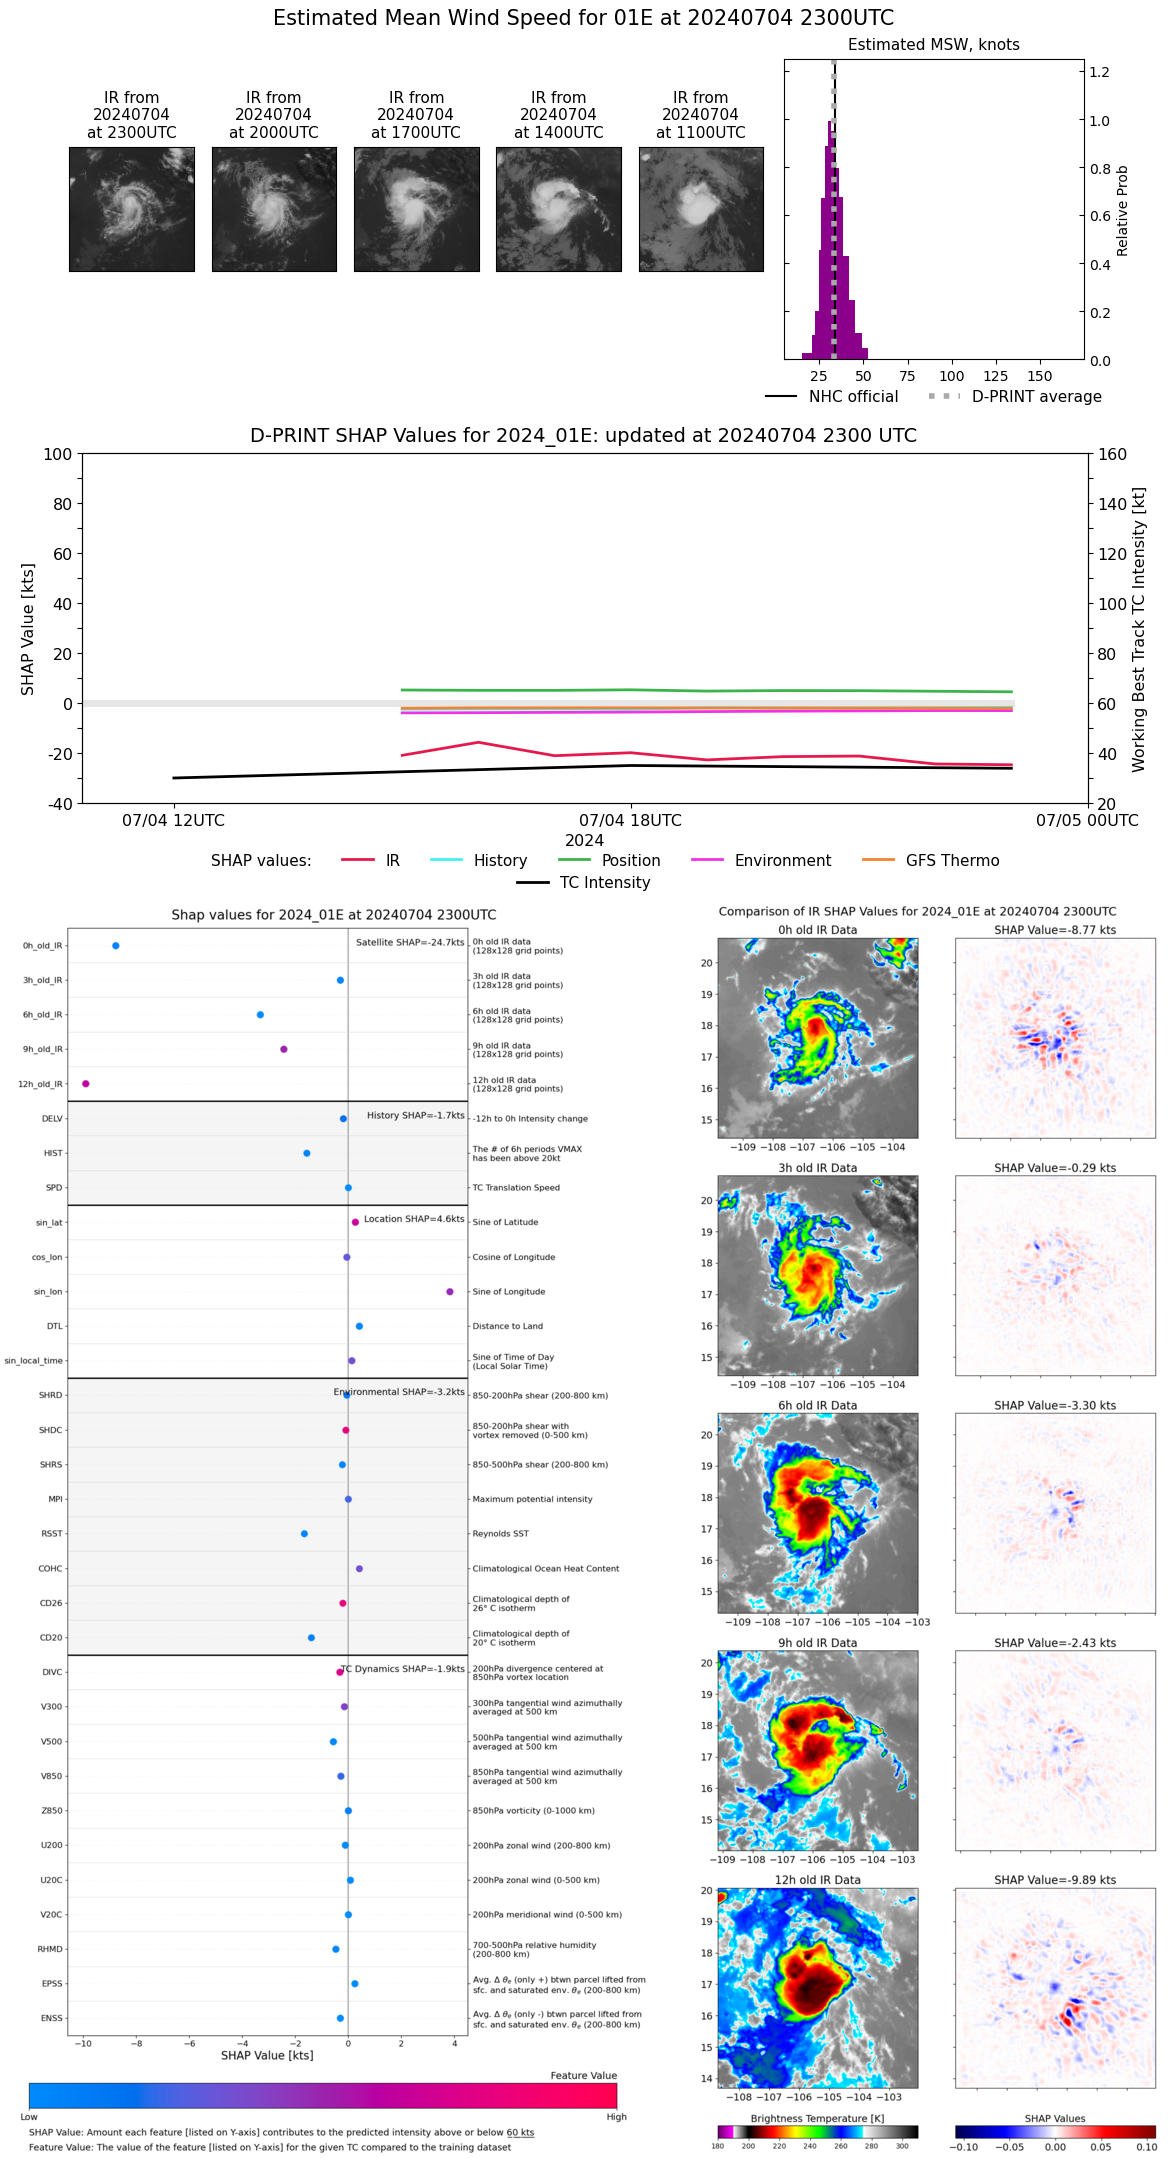 |
| 20240704 | 2200 UTC | 1006 hPa | 34 kts | 30 kts | 38 kts | 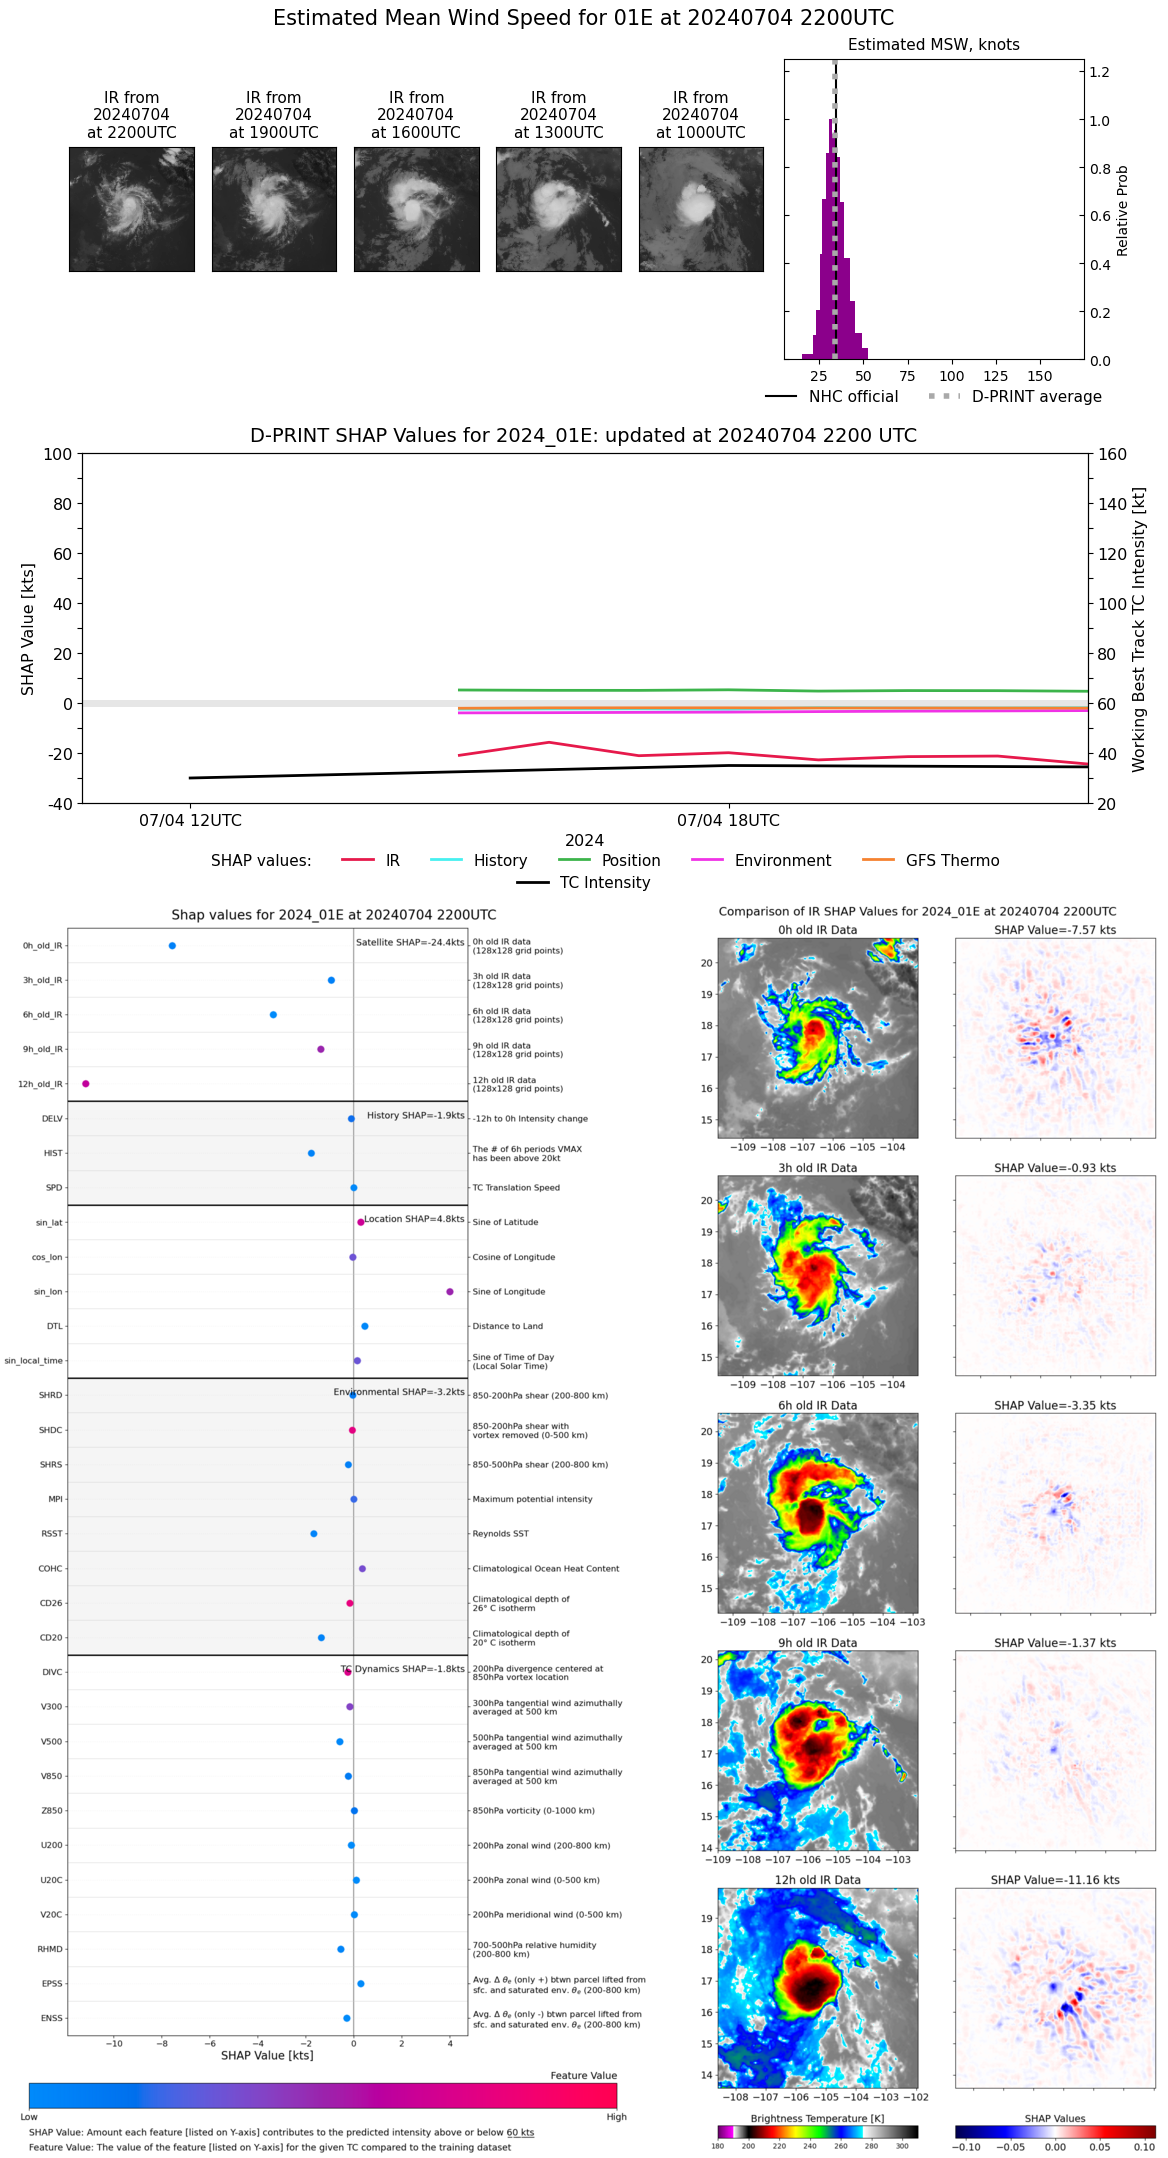 |
| 20240704 | 2100 UTC | 1005 hPa | 37 kts | 33 kts | 42 kts |  |
| 20240704 | 2000 UTC | 1006 hPa | 37 kts | 32 kts | 41 kts | 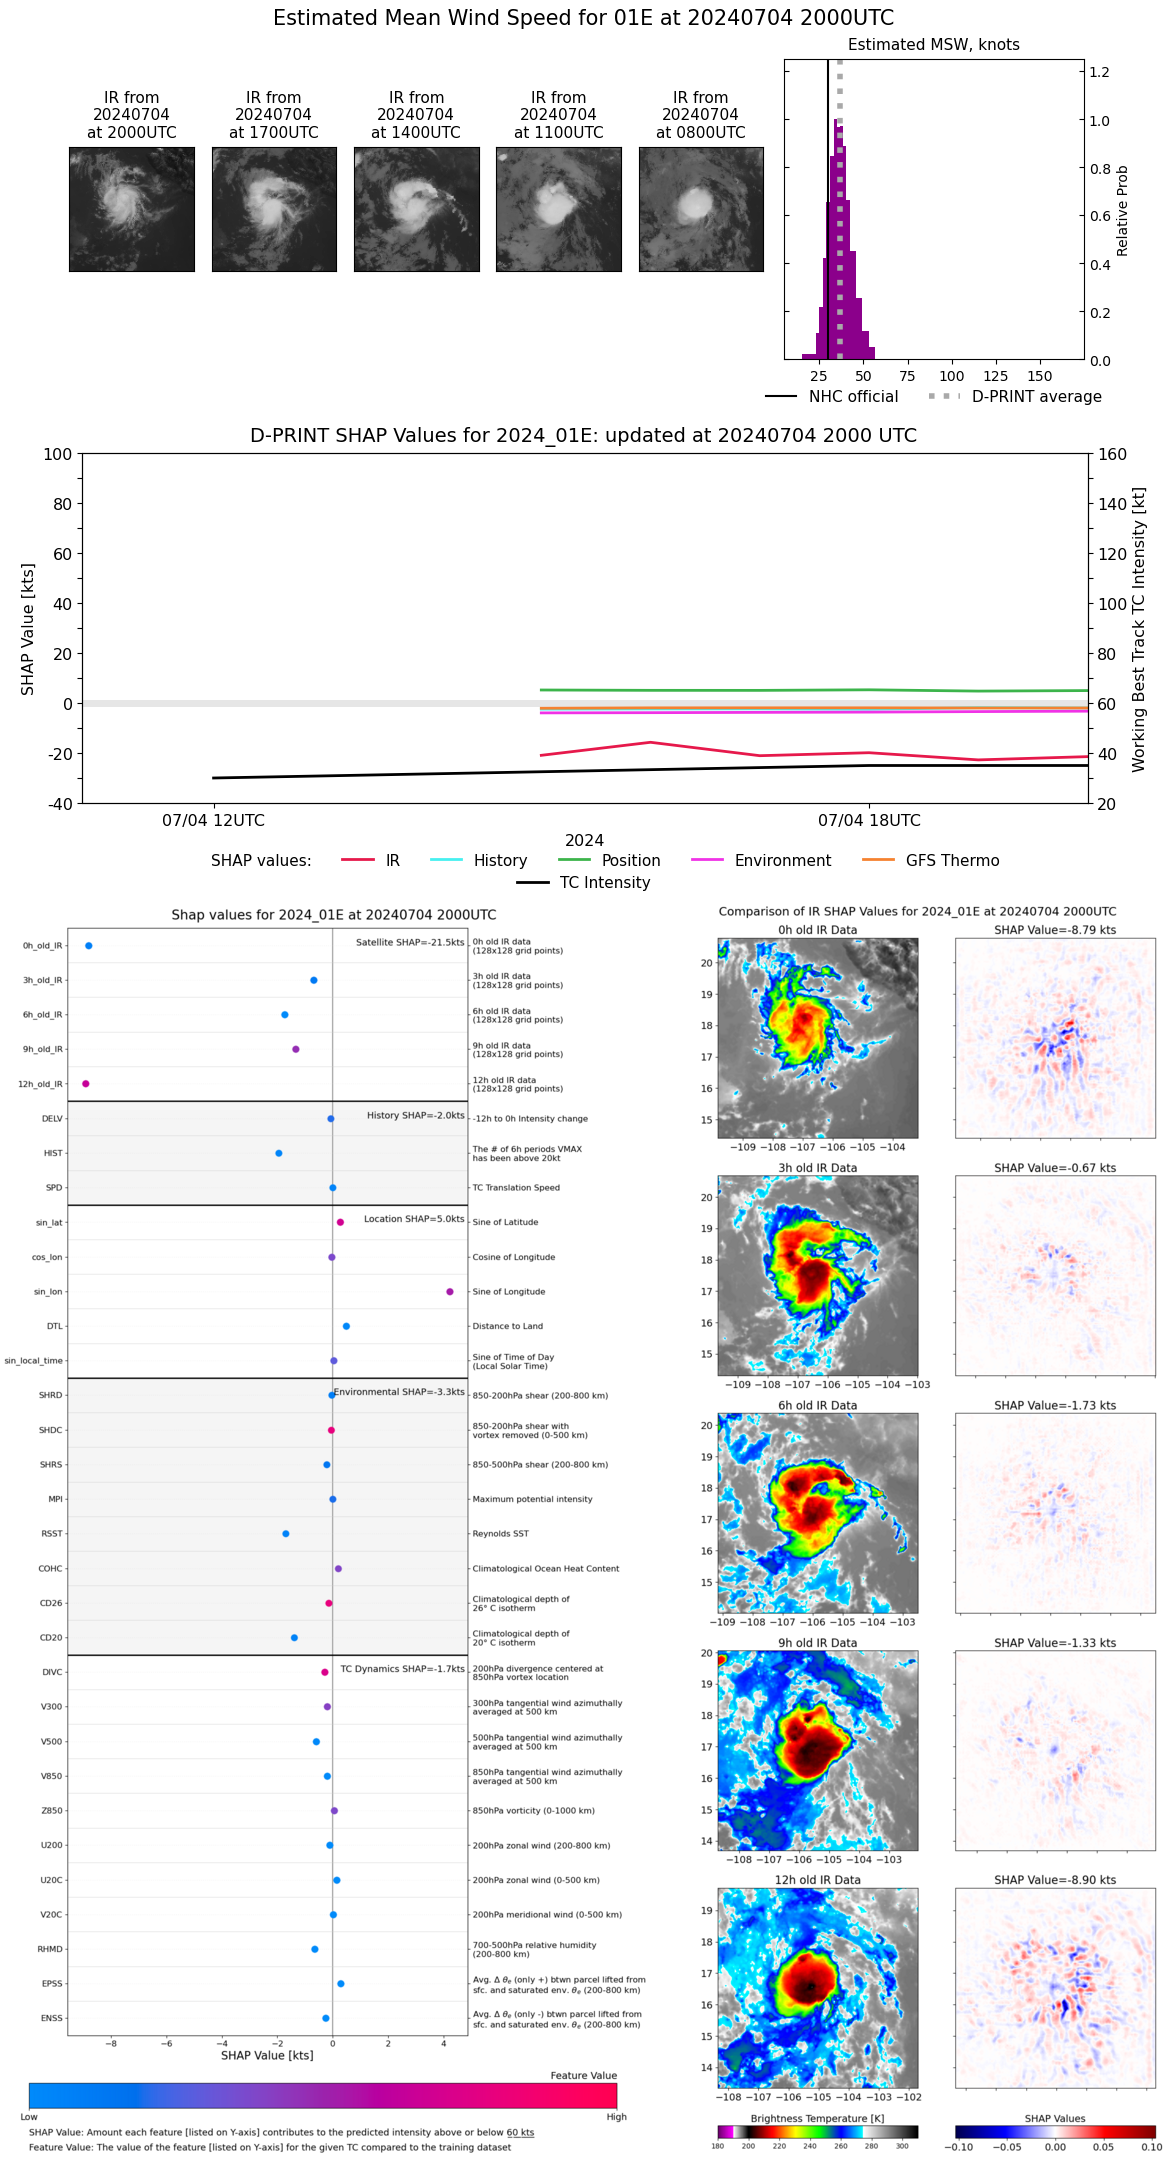 |
| 20240704 | 1900 UTC | 1005 hPa | 35 kts | 31 kts | 39 kts | 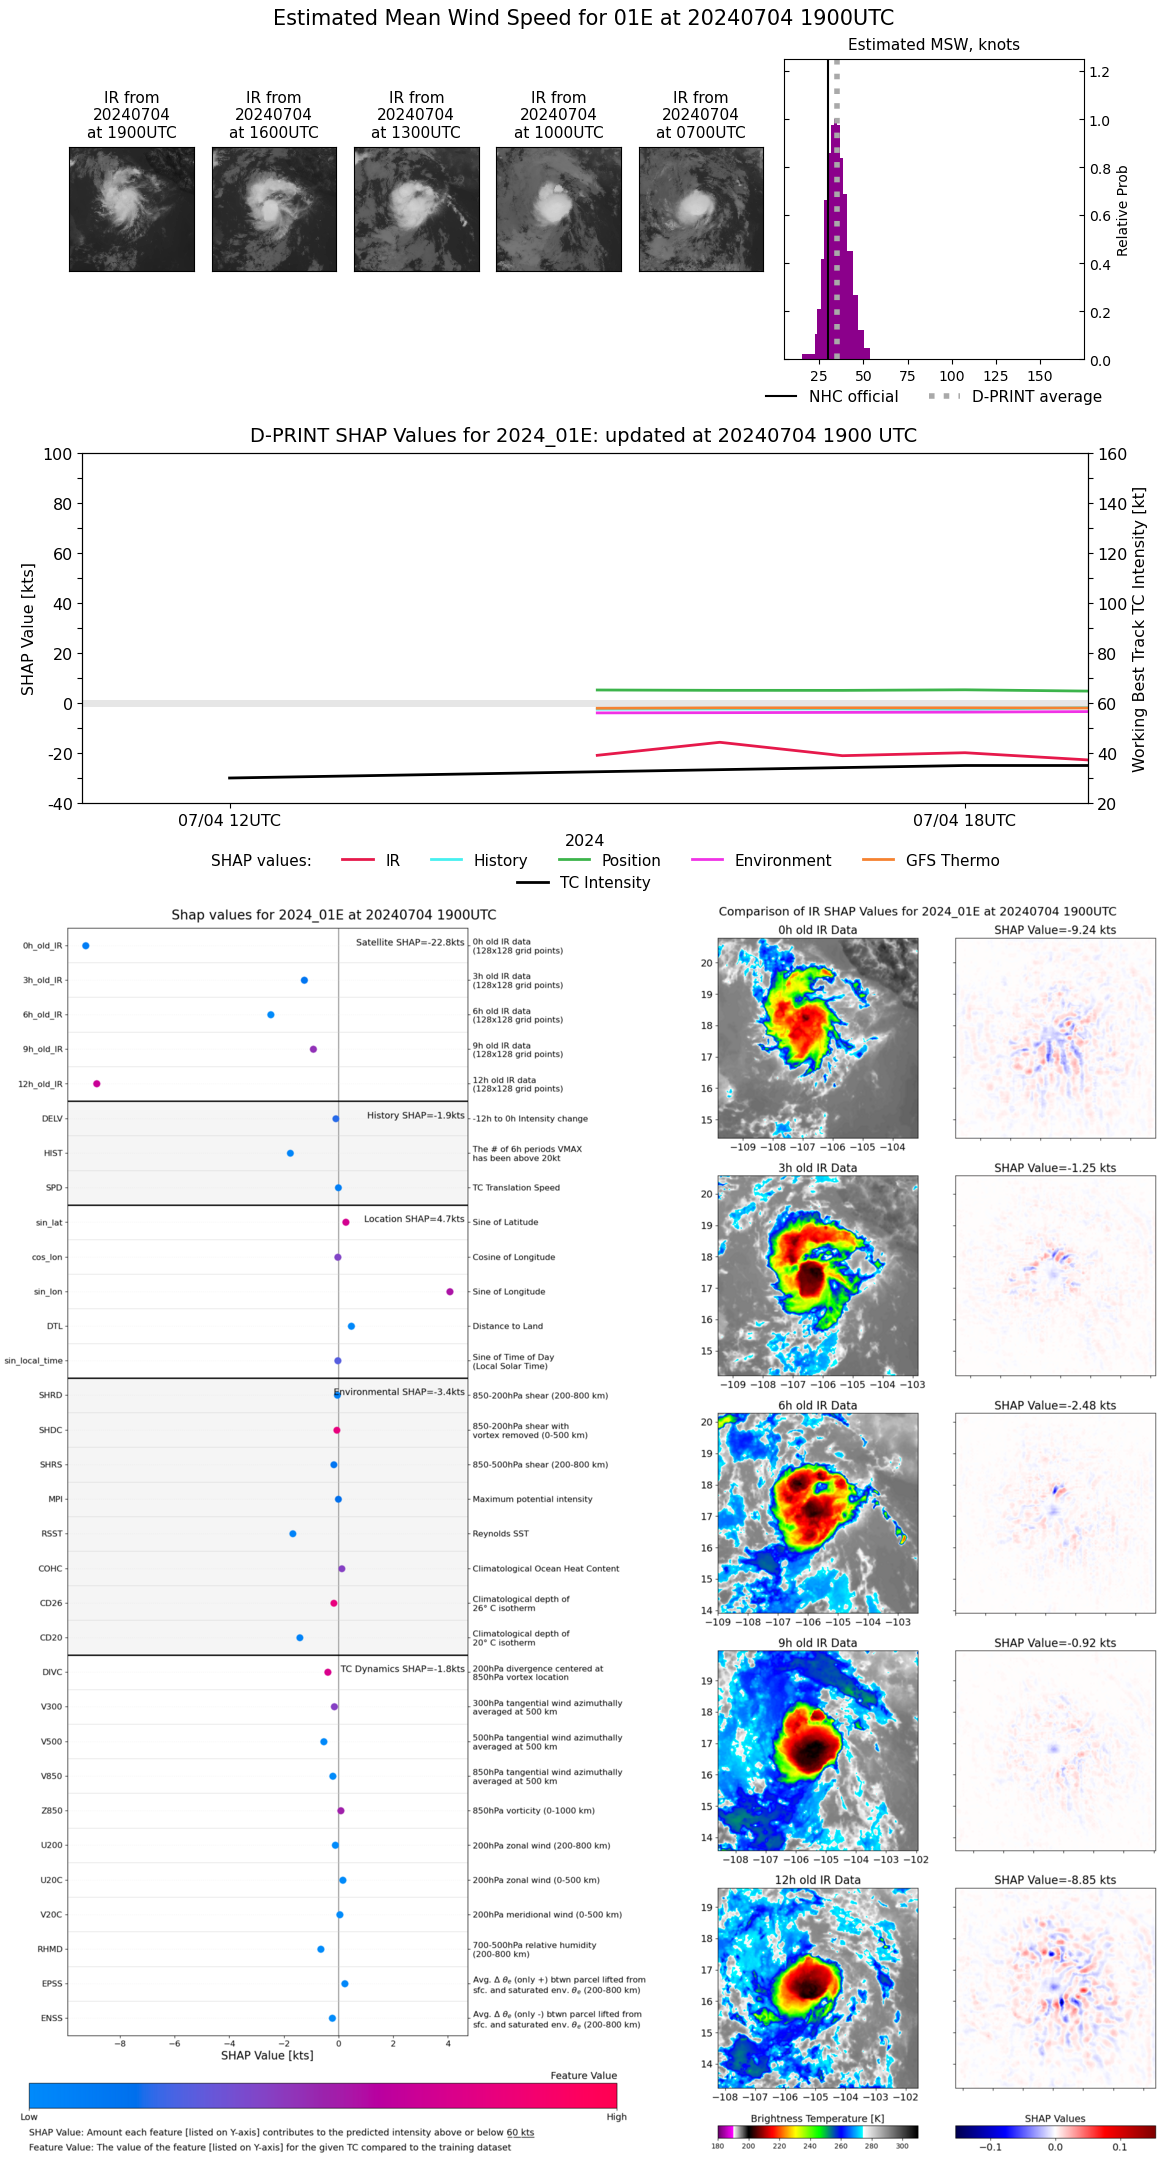 |
| 20240704 | 1800 UTC | 1004 hPa | 38 kts | 33 kts | 43 kts | 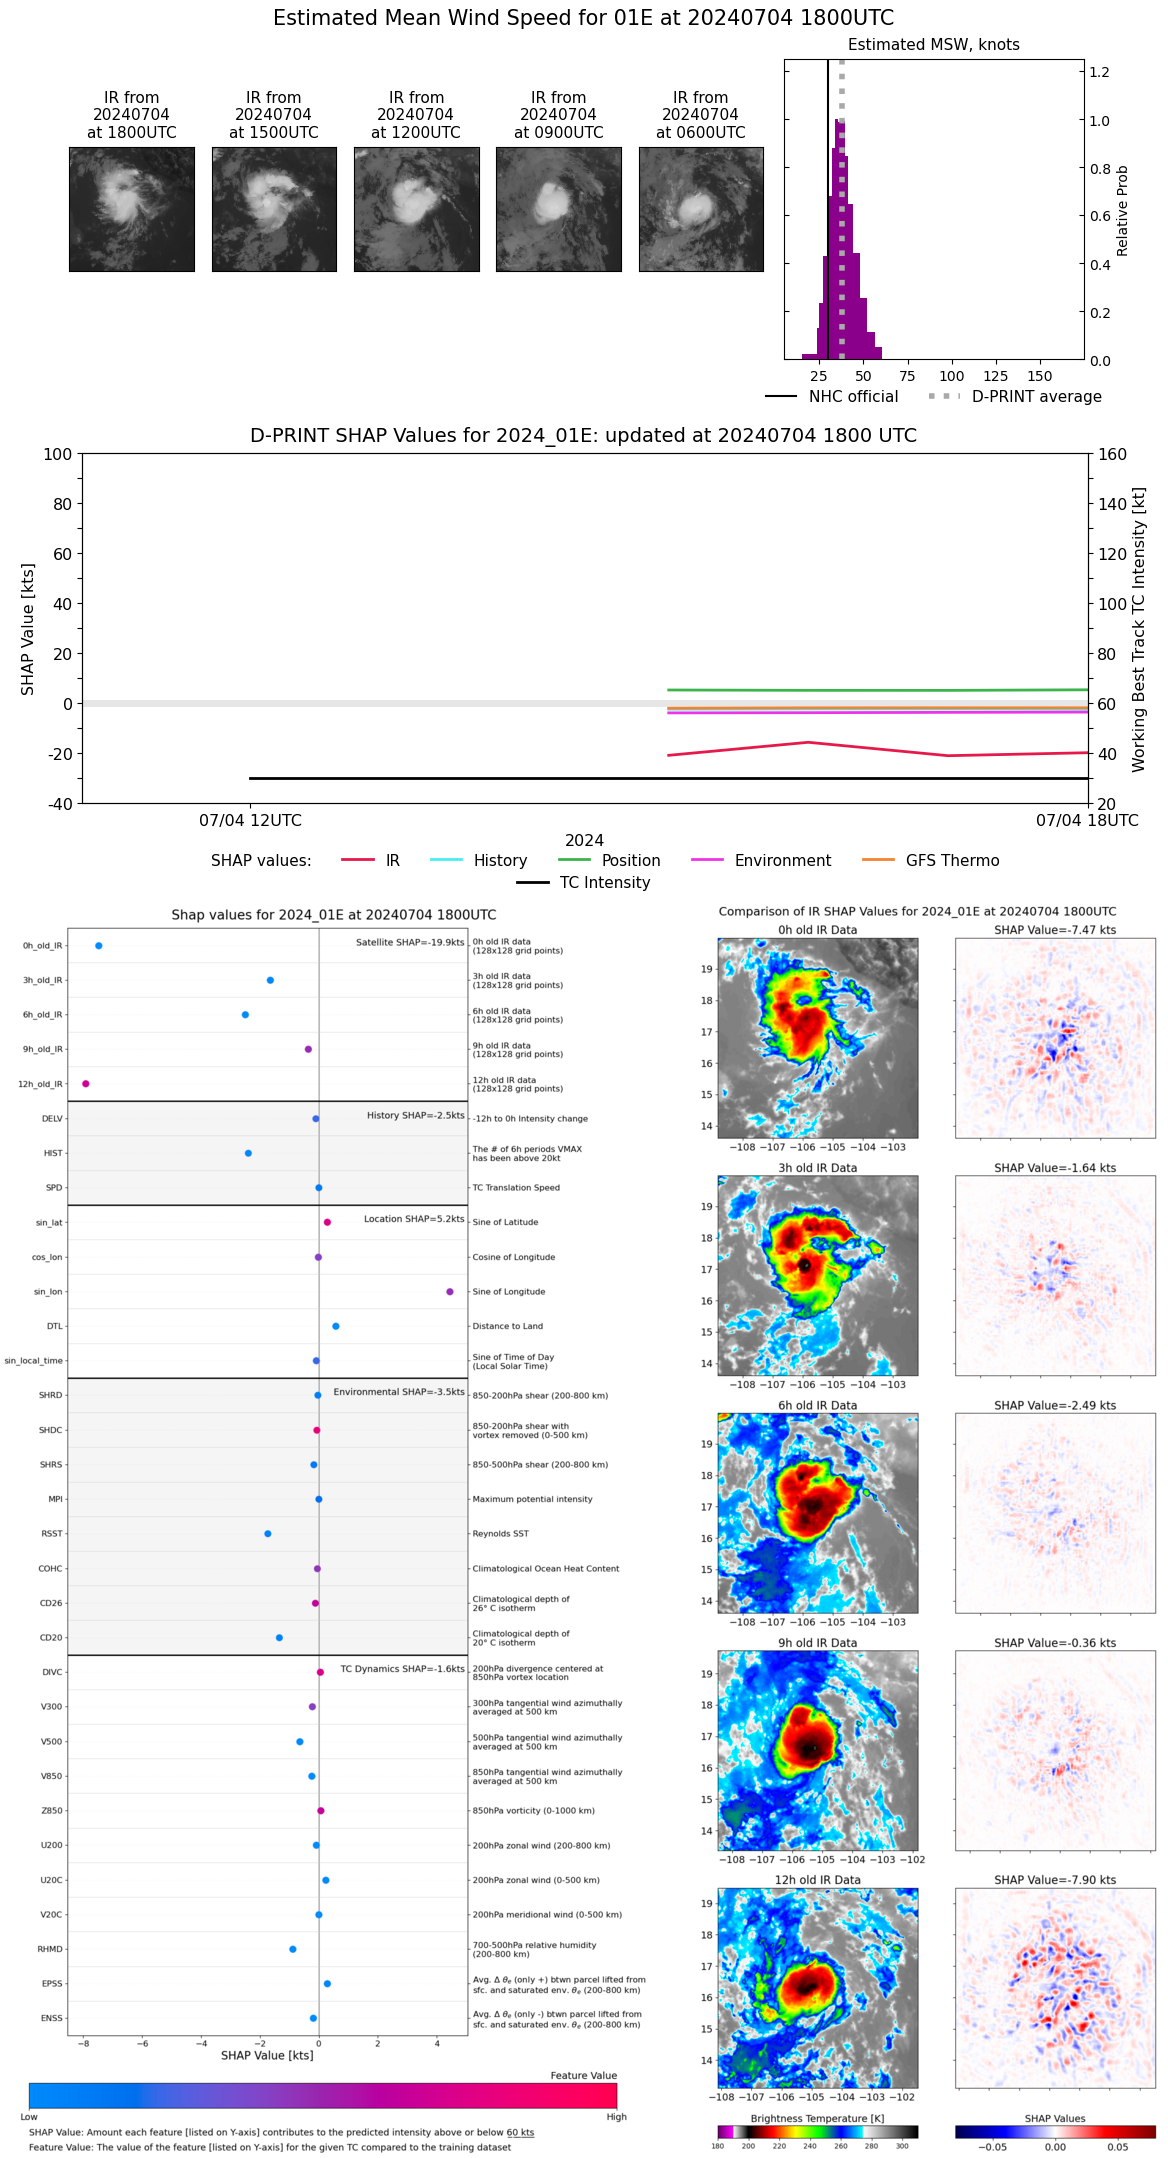 |
| 20240704 | 1700 UTC | 1006 hPa | 36 kts | 32 kts | 41 kts | 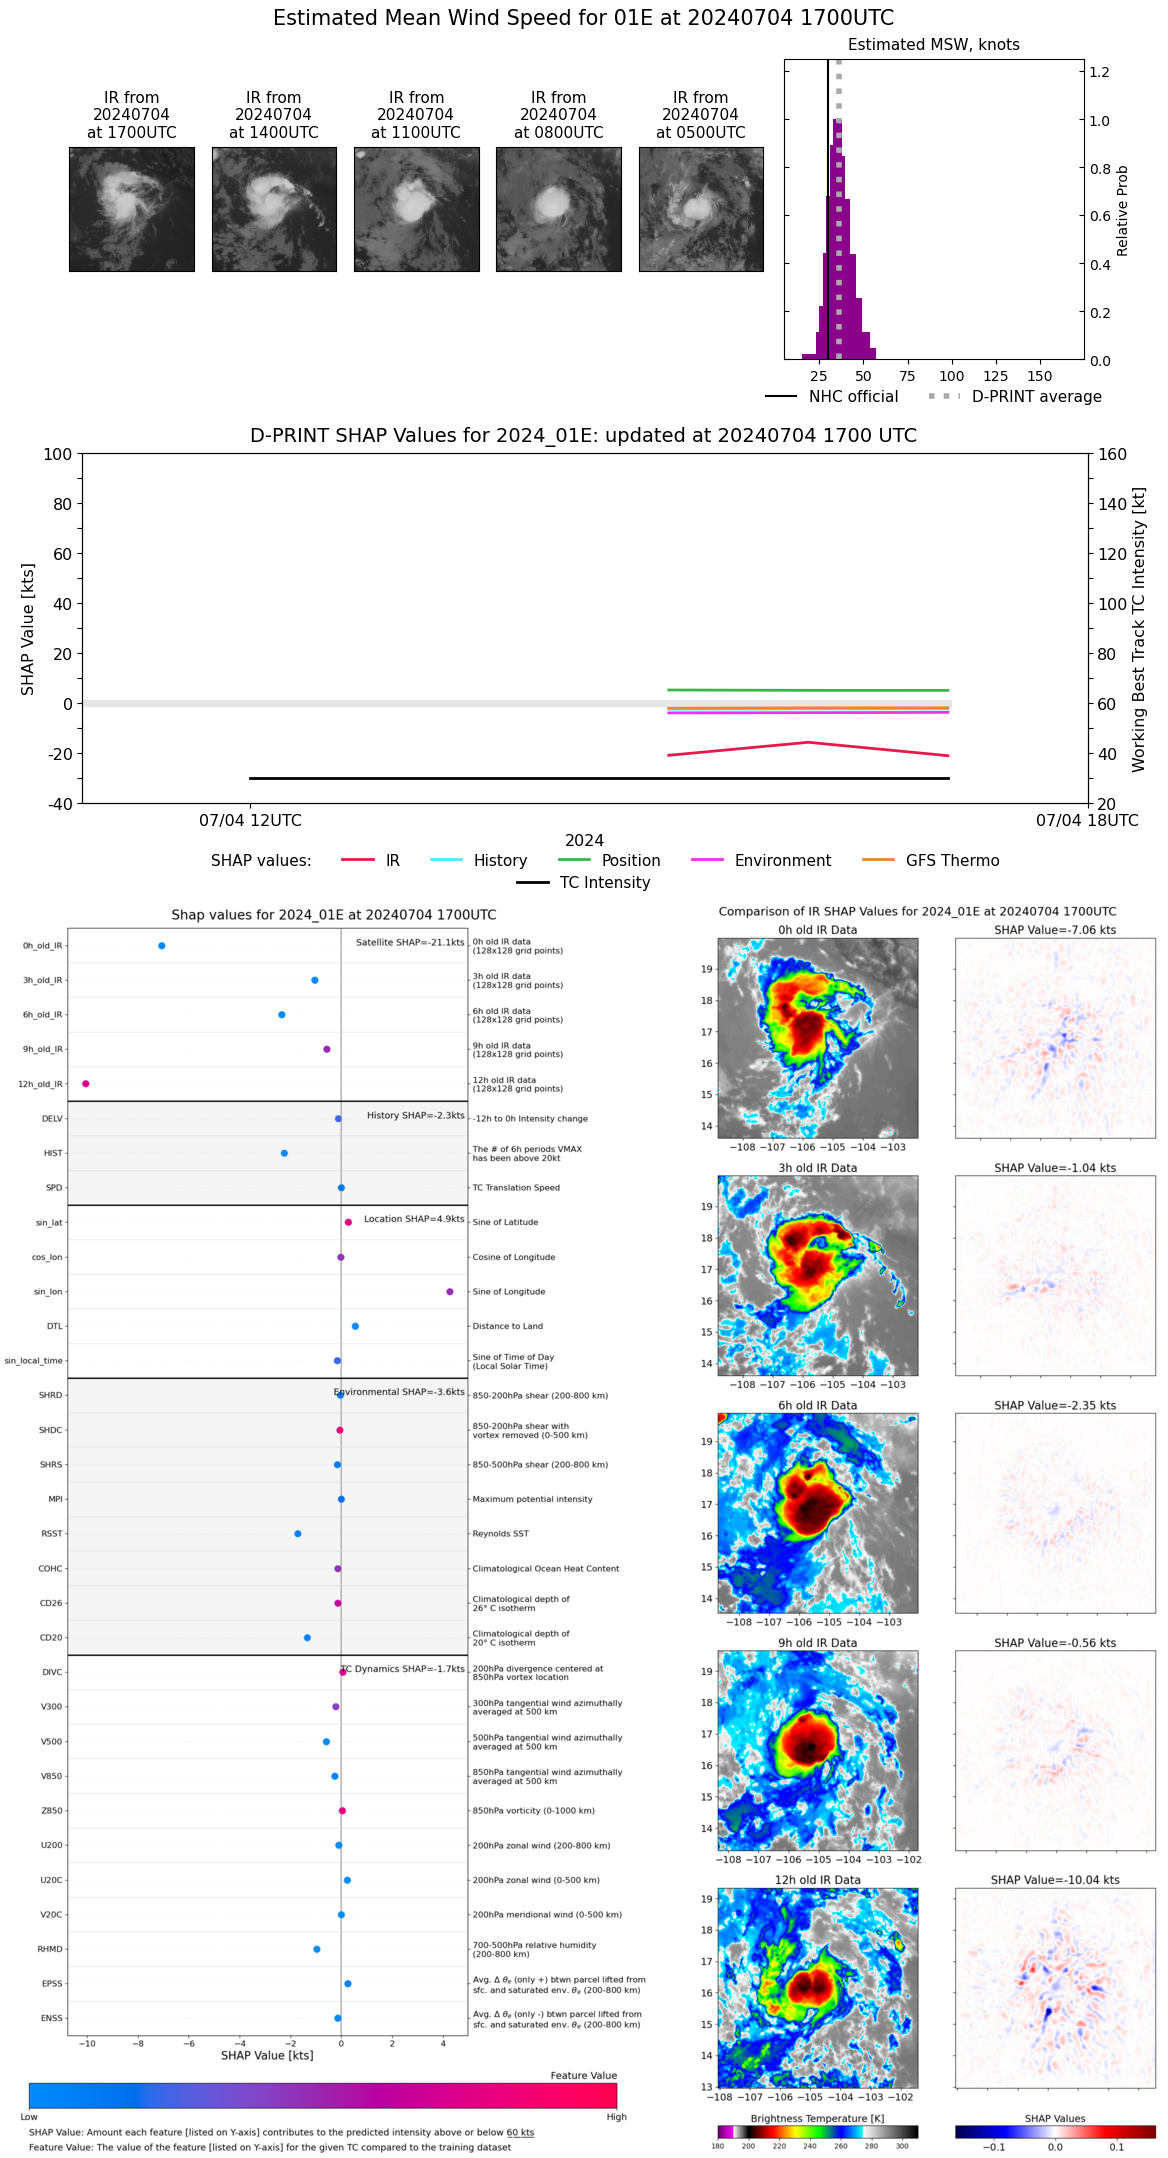 |
| 20240704 | 1600 UTC | 1006 hPa | 41 kts | 37 kts | 47 kts |  |
| 20240704 | 1500 UTC | 1005 hPa | 36 kts | 32 kts | 41 kts | 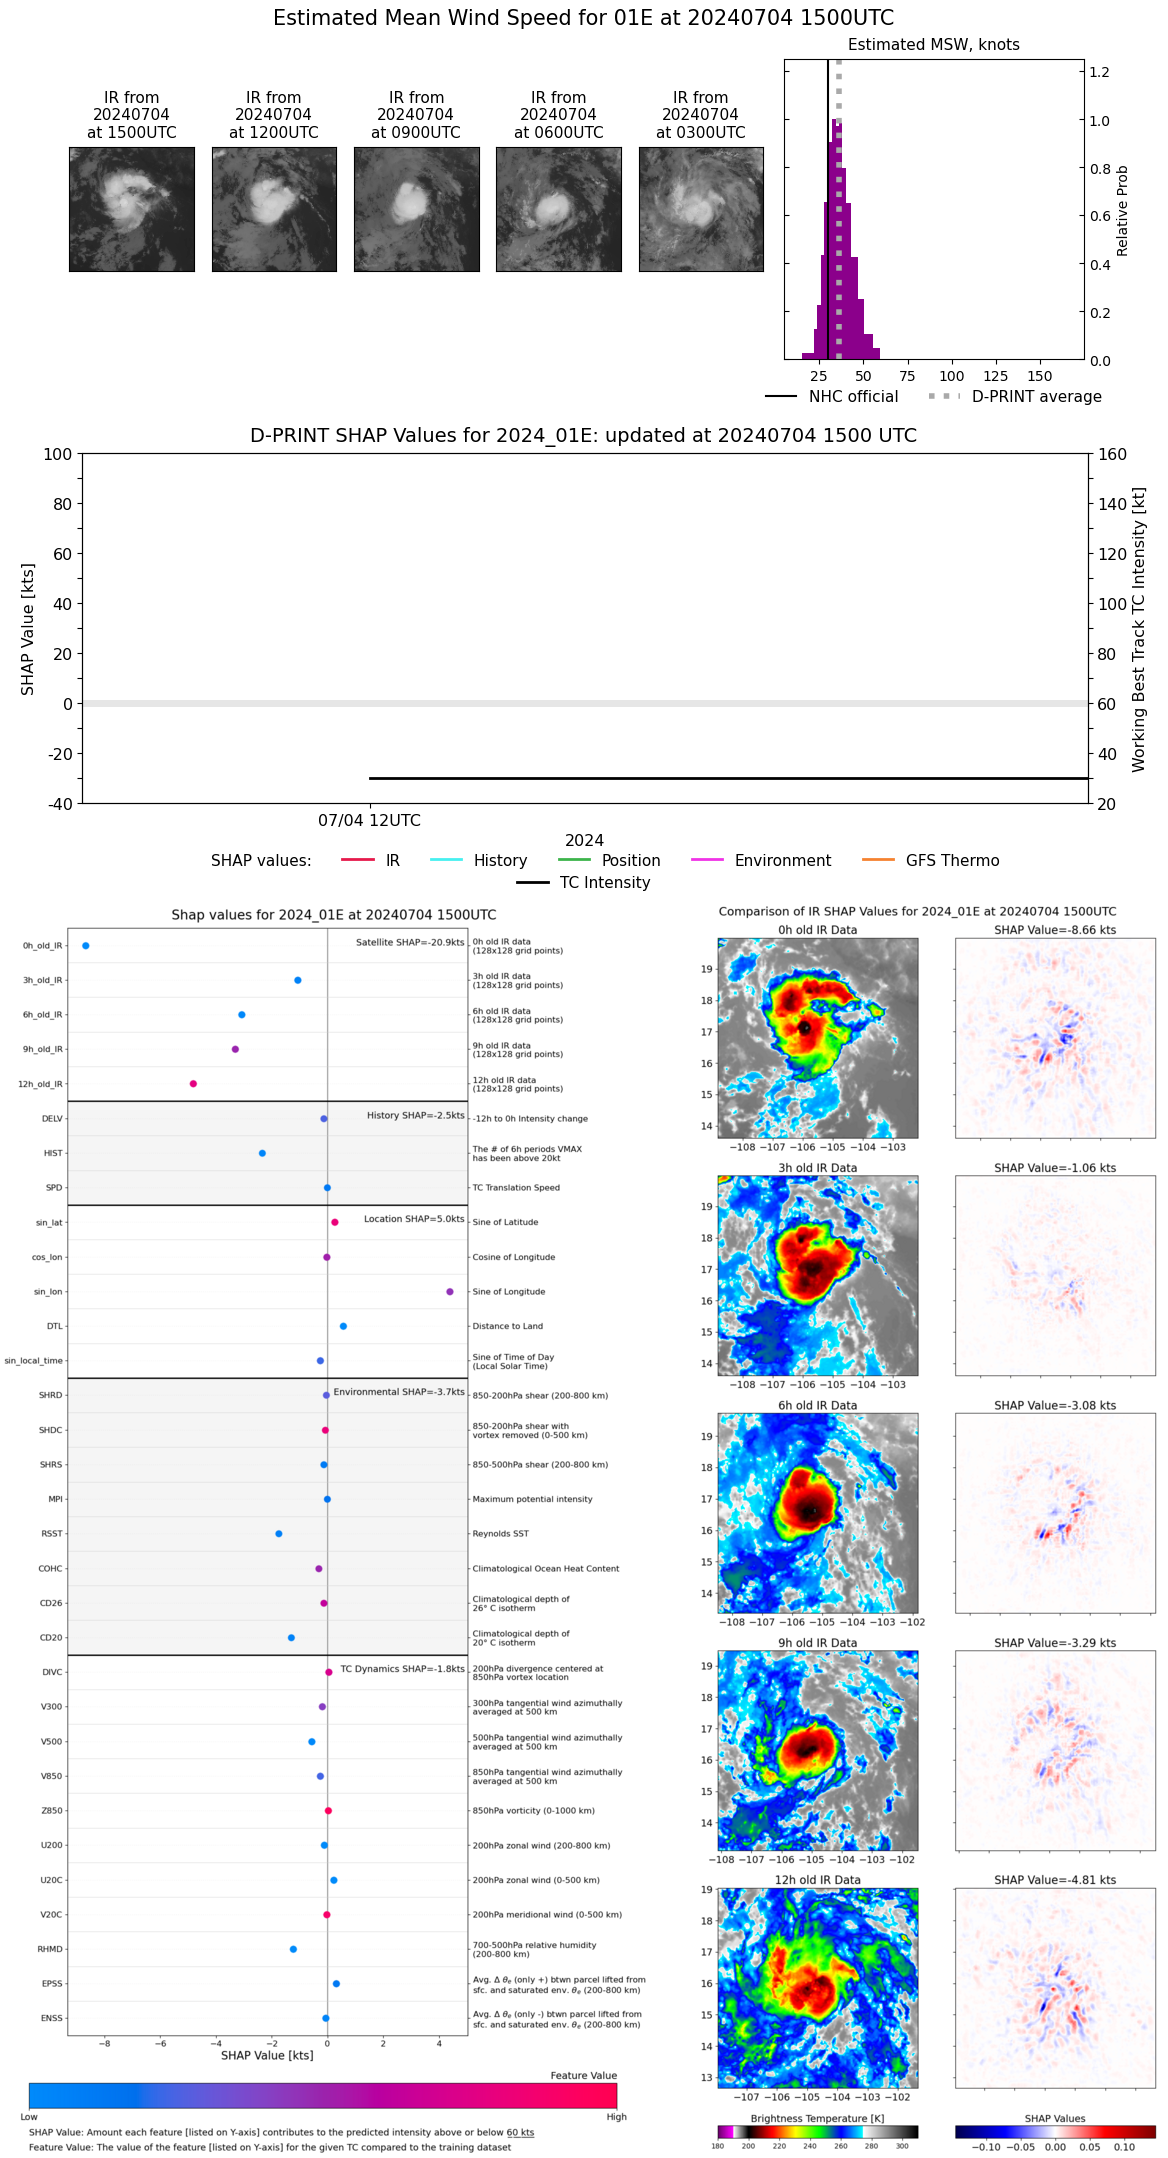 |
| 20240704 | 1200 UTC | NaN hPa | 39 kts | 34 kts | 44 kts |  |
| 20240704 | 0600 UTC | NaN hPa | 36 kts | 31 kts | 41 kts |  |
| 20240704 | 0300 UTC | NaN hPa | 31 kts | 28 kts | 36 kts |  |
| 20240704 | 0000 UTC | NaN hPa | 25 kts | 22 kts | 28 kts |  |
| 20240703 | 2100 UTC | NaN hPa | 28 kts | 25 kts | 33 kts |  |
| 20240703 | 1800 UTC | NaN hPa | 25 kts | 22 kts | 28 kts |  |
| 20240703 | 1500 UTC | NaN hPa | 21 kts | 19 kts | 23 kts |  |
| 20240703 | 1200 UTC | NaN hPa | 22 kts | 20 kts | 24 kts |  |
| 20240703 | 0900 UTC | NaN hPa | 22 kts | 19 kts | 25 kts |  |
| 20240703 | 0600 UTC | NaN hPa | 22 kts | 20 kts | 23 kts |  |
| 20240703 | 0300 UTC | NaN hPa | 23 kts | 20 kts | 25 kts |  |
| 20240703 | 0000 UTC | NaN hPa | 24 kts | 21 kts | 27 kts |  |