|
||

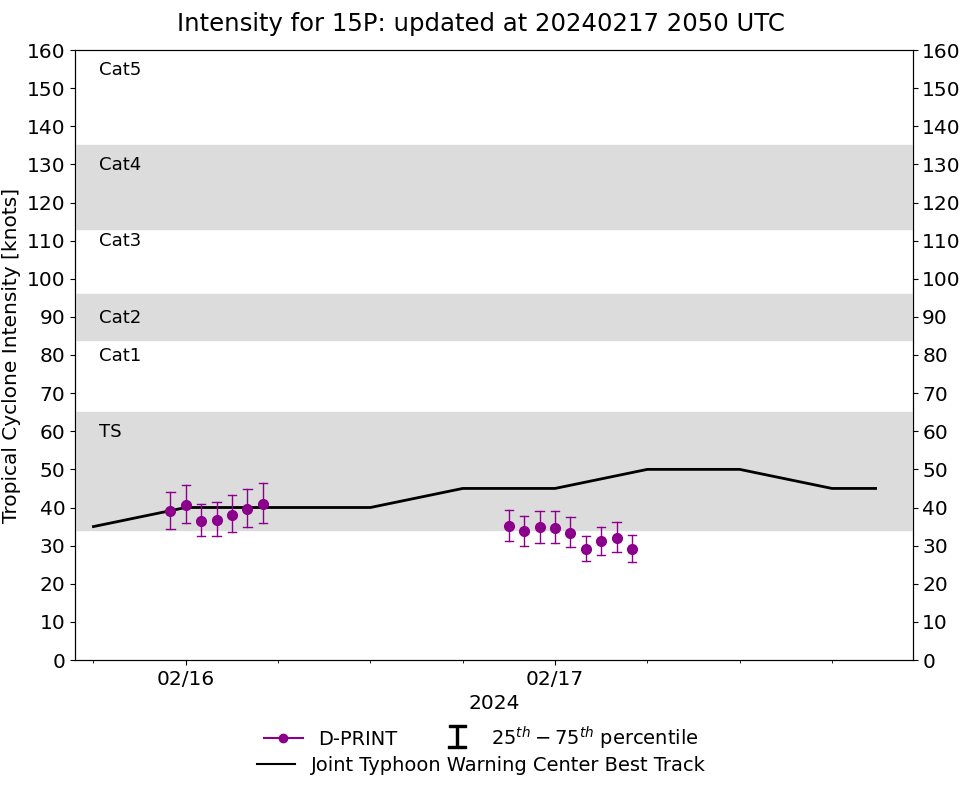 |
D-PRINT HISTORY FILE for 2024_15P
| Date | Time | MSLP | Vmax (30th-70th percentile average) | Vmax 25th percentile | Vmax 75th percentile | Image |
| 20240217 | 0500 UTC | 997 hPa | 29 kts | 26 kts | 33 kts | 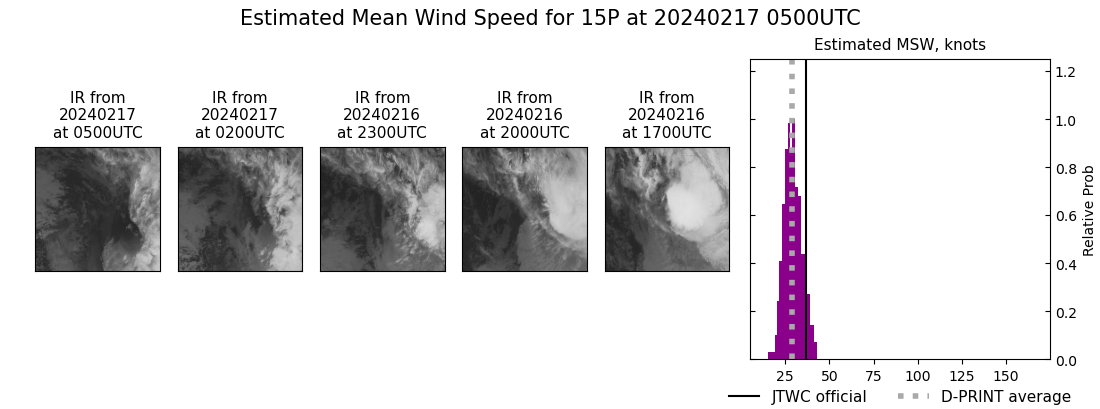 |
| 20240217 | 0400 UTC | 997 hPa | 32 kts | 28 kts | 36 kts | 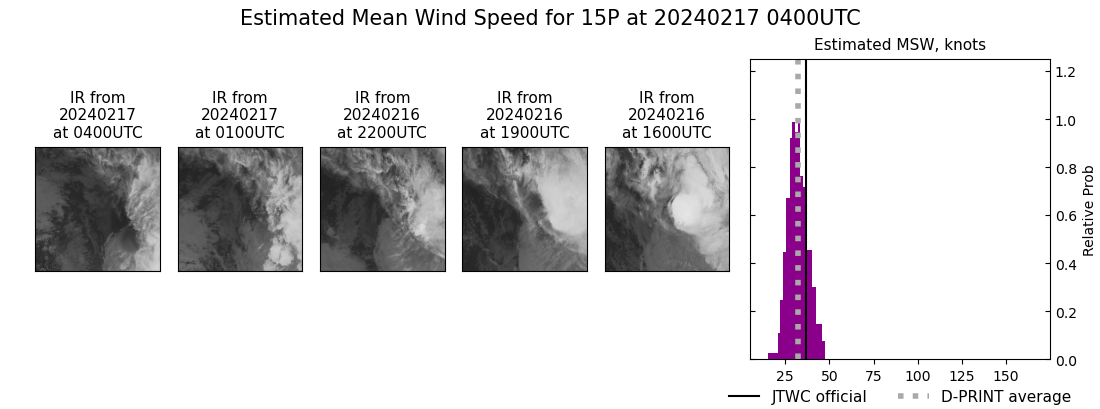 |
| 20240217 | 0300 UTC | 998 hPa | 31 kts | 28 kts | 35 kts | 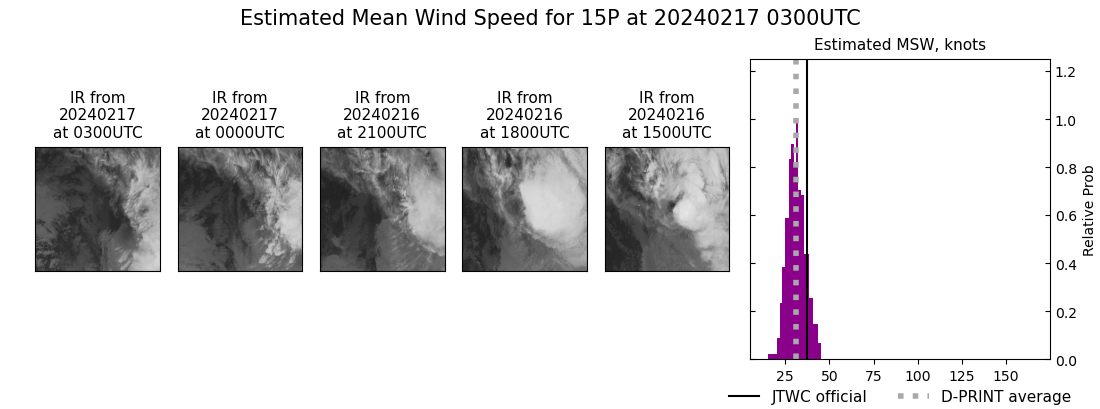 |
| 20240217 | 0200 UTC | 998 hPa | 29 kts | 26 kts | 33 kts | 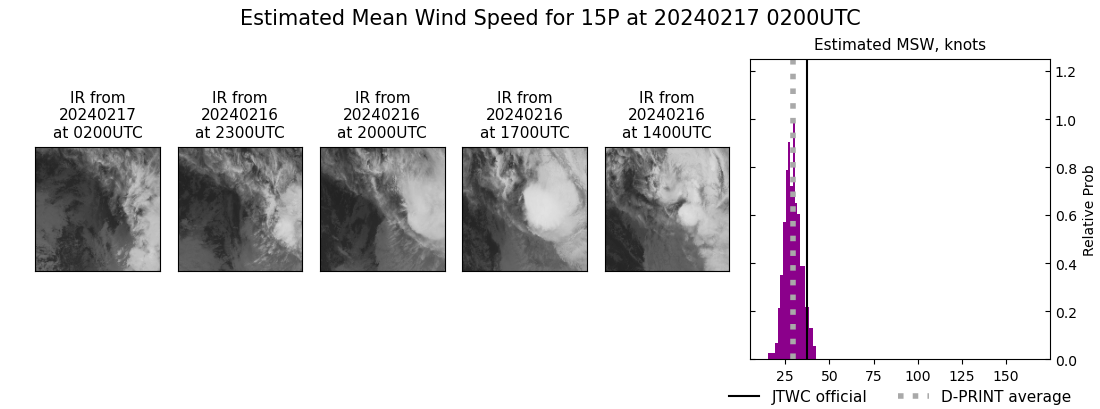 |
| 20240217 | 0100 UTC | 998 hPa | 33 kts | 30 kts | 38 kts |  |
| 20240217 | 0000 UTC | 997 hPa | 35 kts | 31 kts | 39 kts | 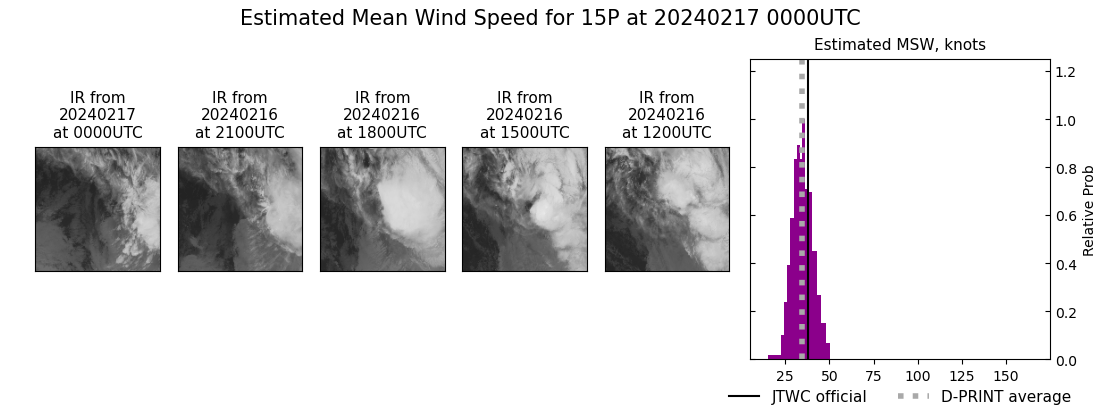 |
| 20240216 | 2300 UTC | 997 hPa | 35 kts | 31 kts | 39 kts | 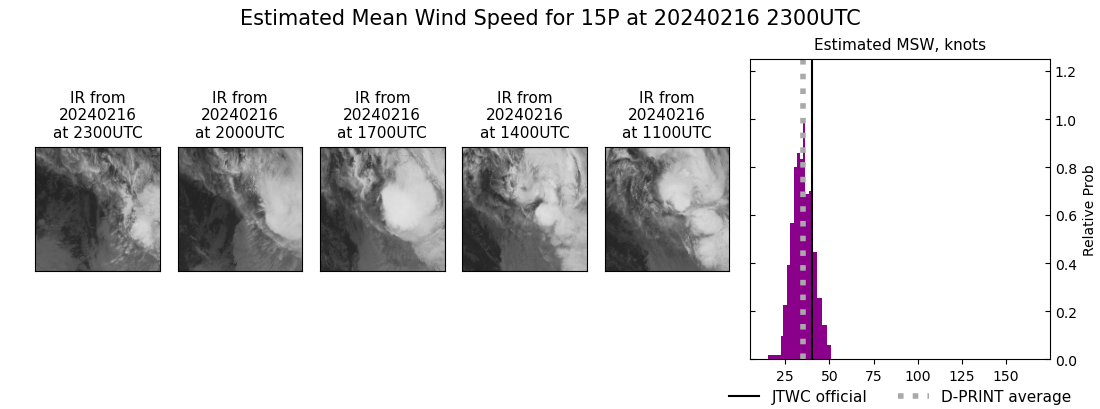 |
| 20240216 | 2200 UTC | 998 hPa | 34 kts | 30 kts | 38 kts |  |
| 20240216 | 2100 UTC | 997 hPa | 35 kts | 31 kts | 39 kts | 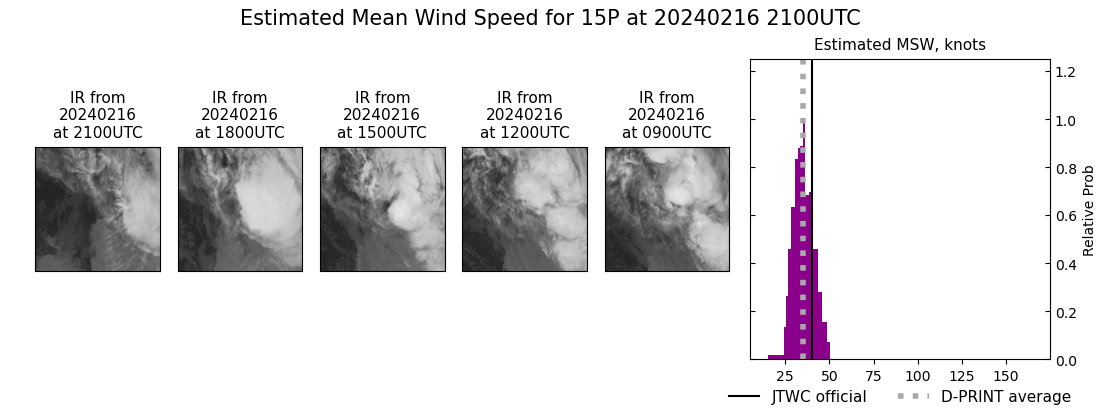 |
| 20240216 | 0500 UTC | 996 hPa | 41 kts | 36 kts | 46 kts | 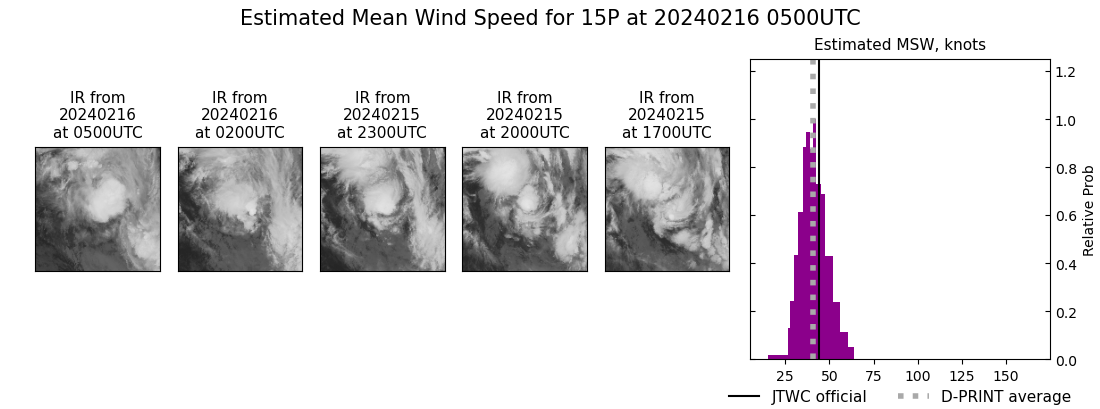 |
| 20240216 | 0400 UTC | 997 hPa | 40 kts | 35 kts | 45 kts |  |
| 20240216 | 0300 UTC | 998 hPa | 38 kts | 33 kts | 43 kts | 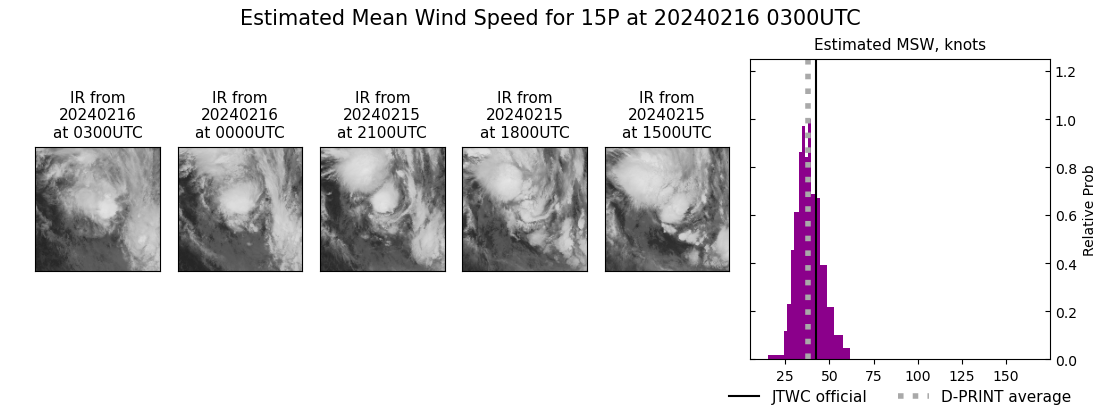 |
| 20240216 | 0200 UTC | 999 hPa | 37 kts | 33 kts | 42 kts | 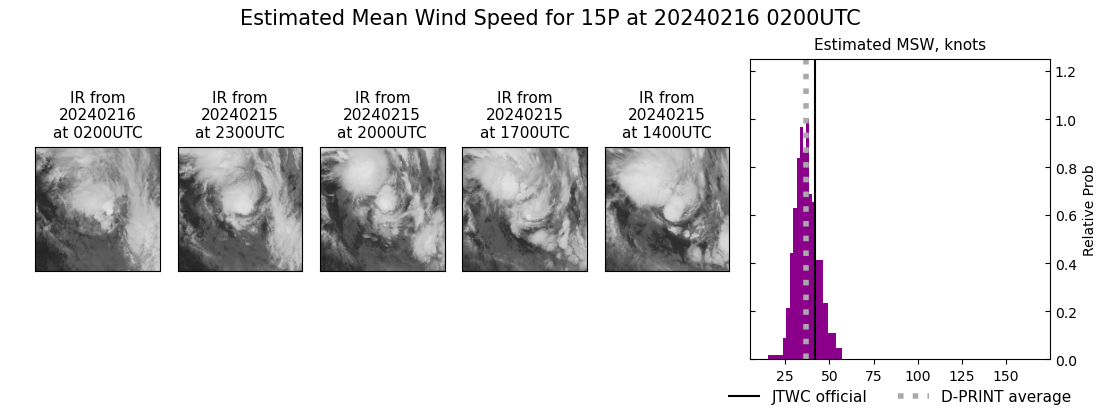 |
| 20240216 | 0100 UTC | 999 hPa | 36 kts | 33 kts | 41 kts |  |
| 20240216 | 0000 UTC | 998 hPa | 41 kts | 36 kts | 46 kts |  |
| 20240215 | 2300 UTC | 998 hPa | 39 kts | 34 kts | 44 kts | 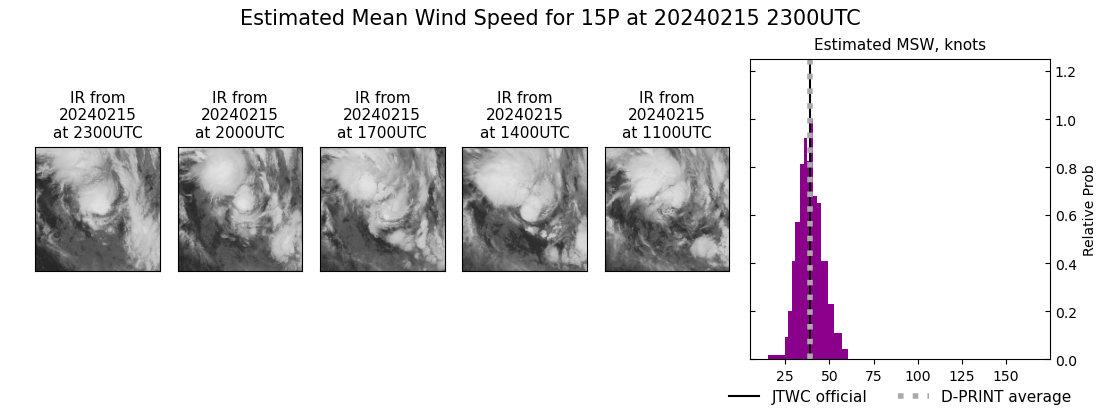 |