Tropical Depression 05E
|
Passive Microwave (PMW) Intensity Information Advanced Dvorak Technique (ADT) Version 8.1.4 |
Overpass Inten Ring Ring Wind Forecast Final Target
Date Time Score Meaning Pct Diam BTdiff Est Sat Lat Lon Lat Lon Lat Lon
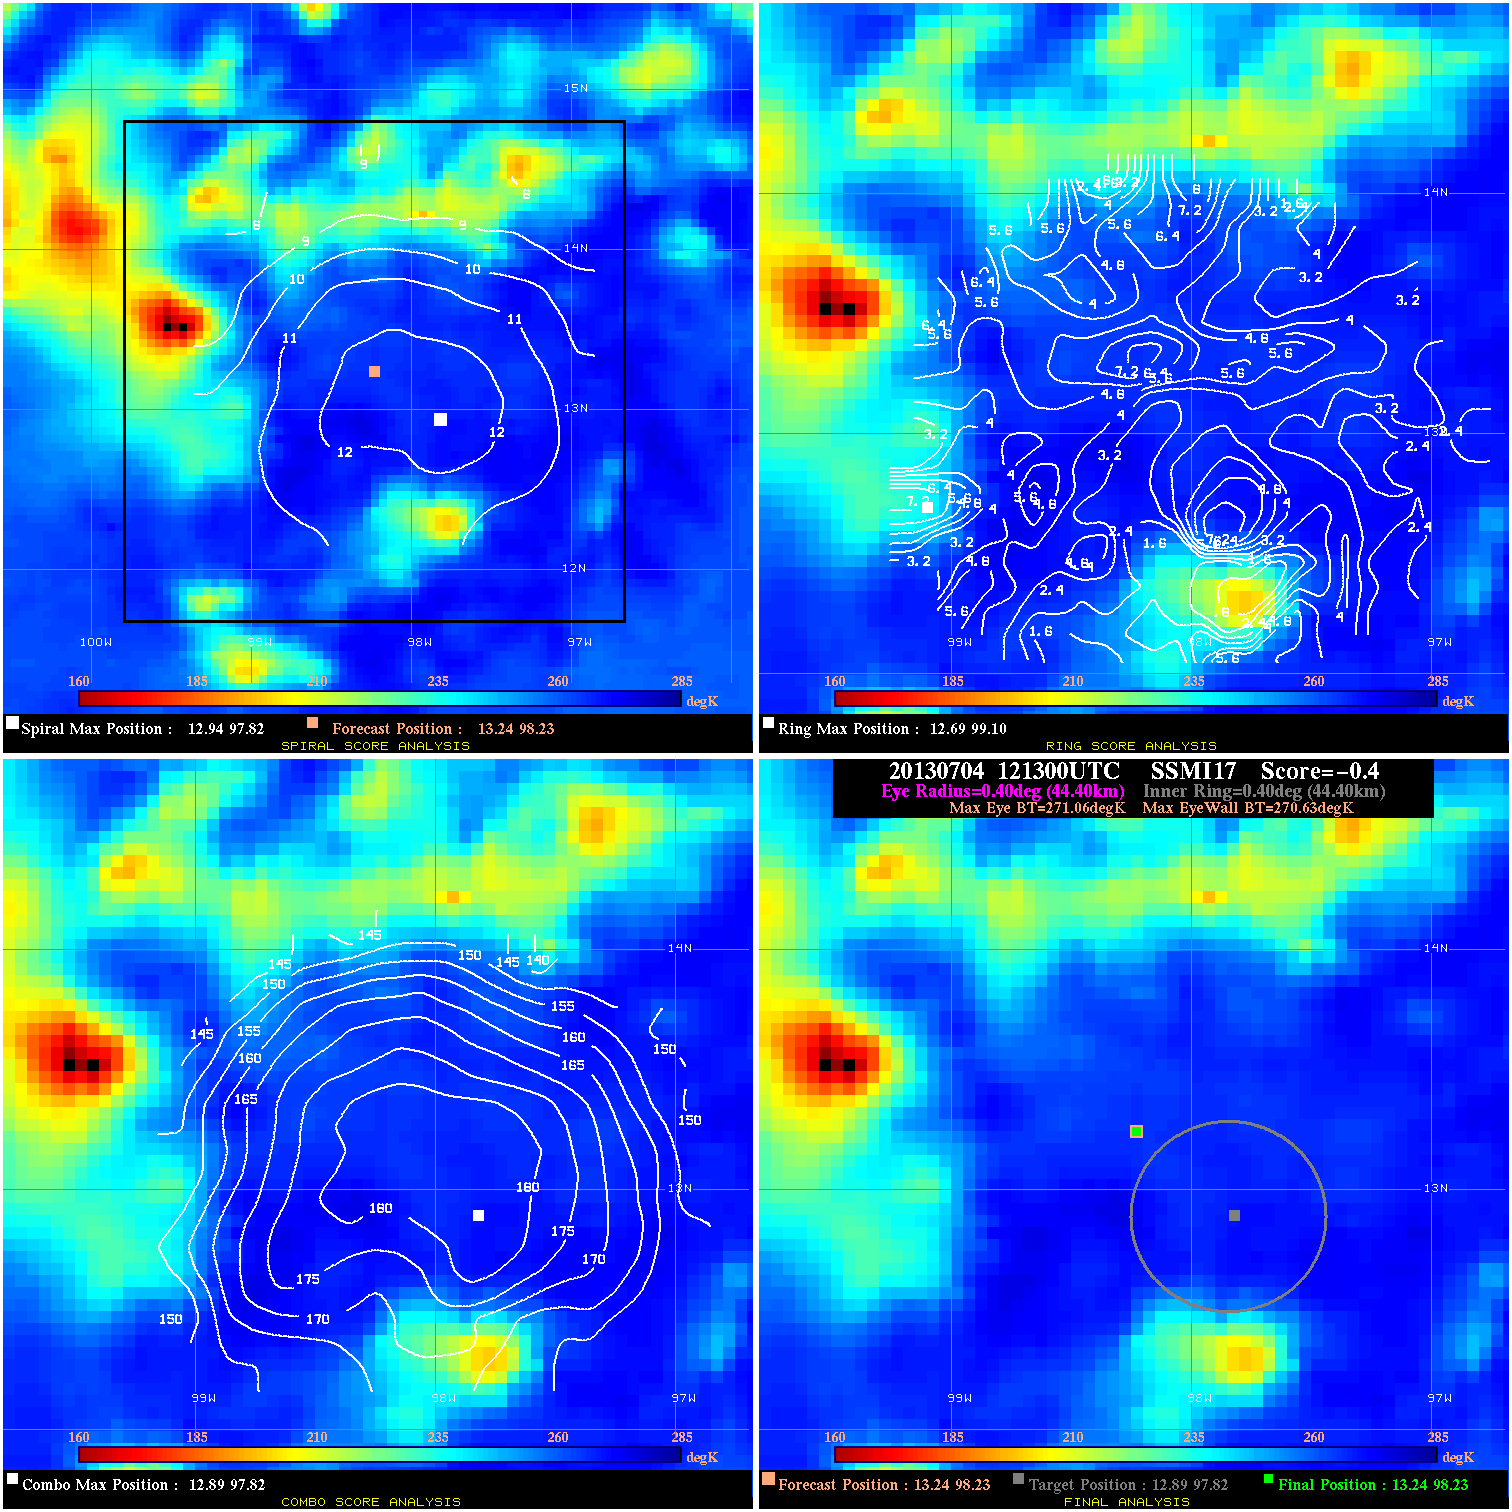
20130704 121300 -0.4 N/A N/A 88.88 .43 30.0 SSMI17 13.2 98.2 13.2 98.2 12.9 97.8 Analysis Plot
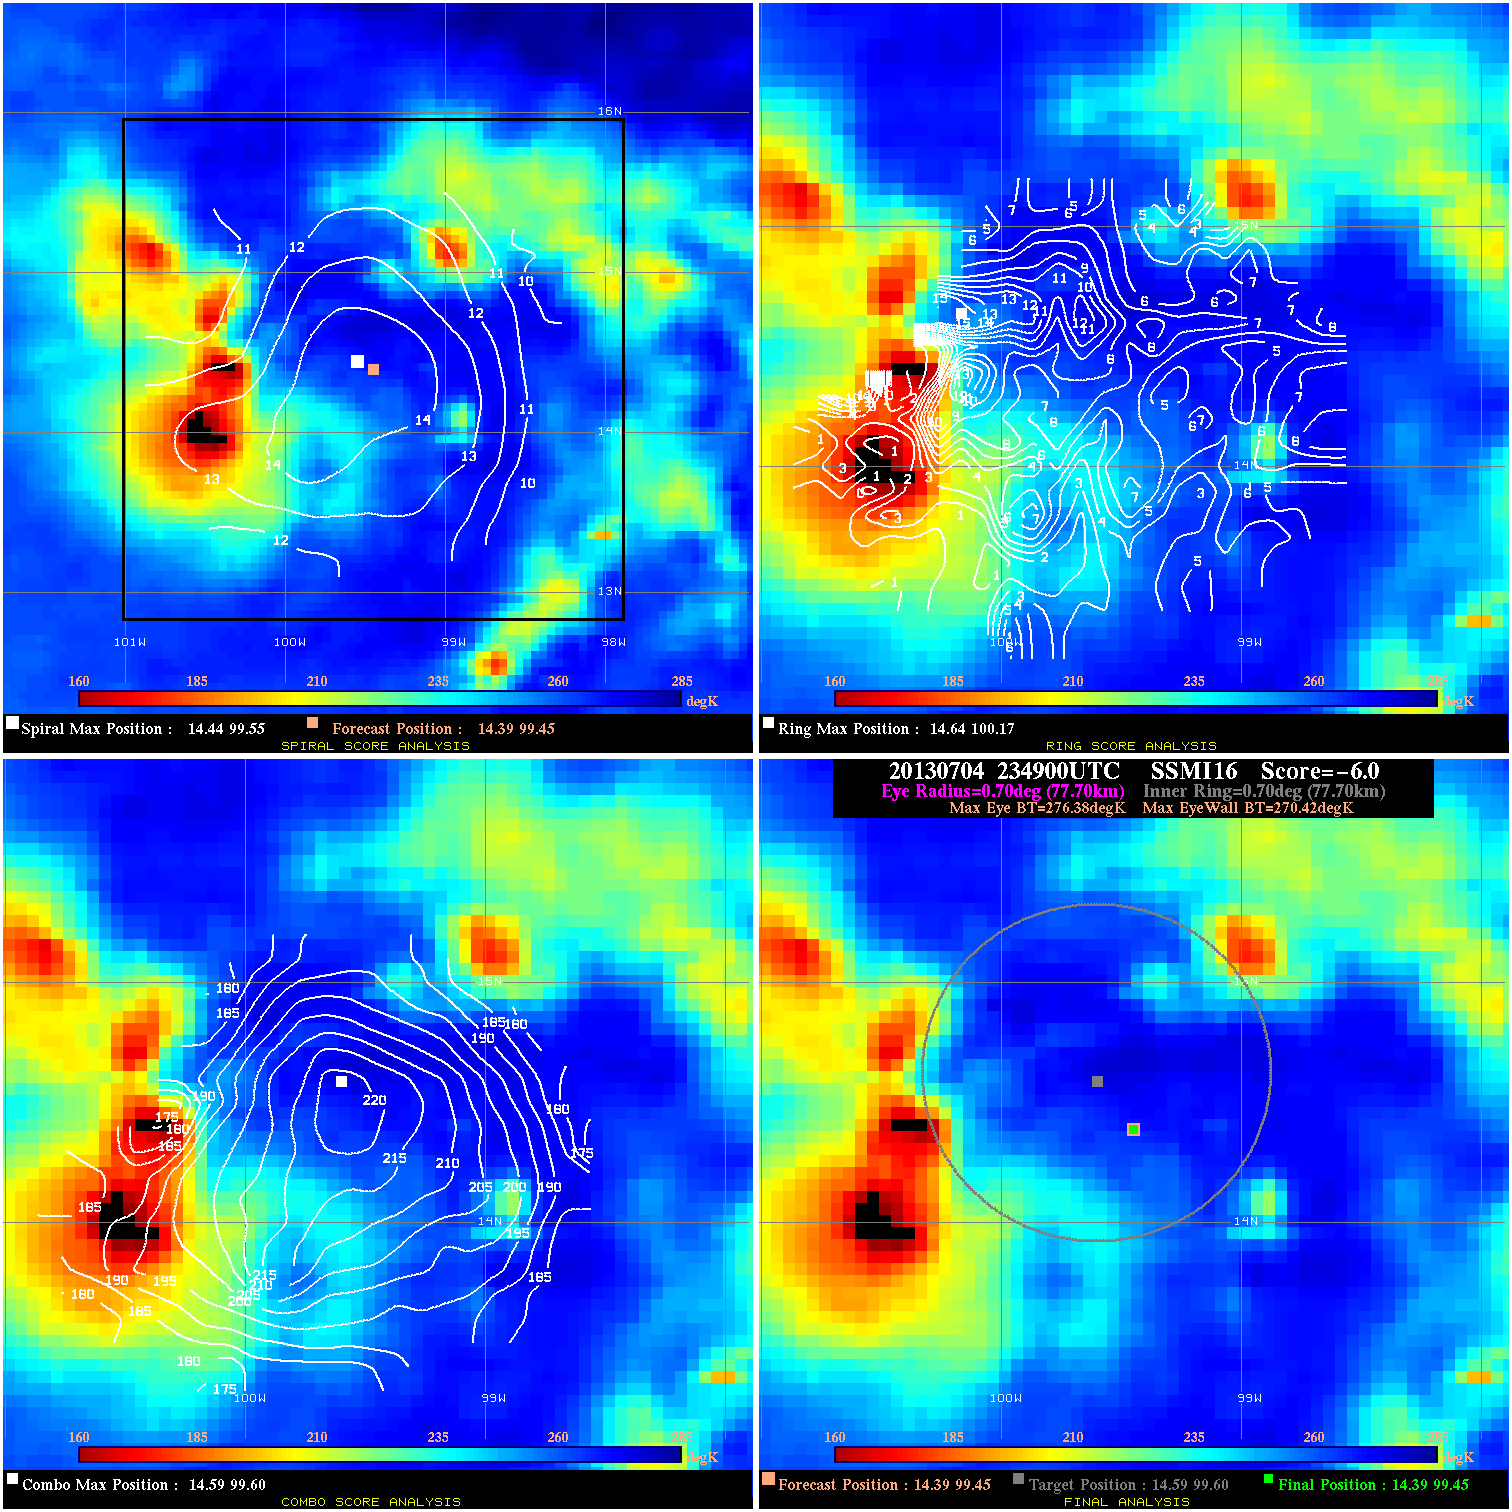
20130704 234900 -6.0 N/A 37.0% 155.54 5.96 30.0 SSMI16 14.4 99.5 14.4 99.5 14.6 99.6 Analysis Plot
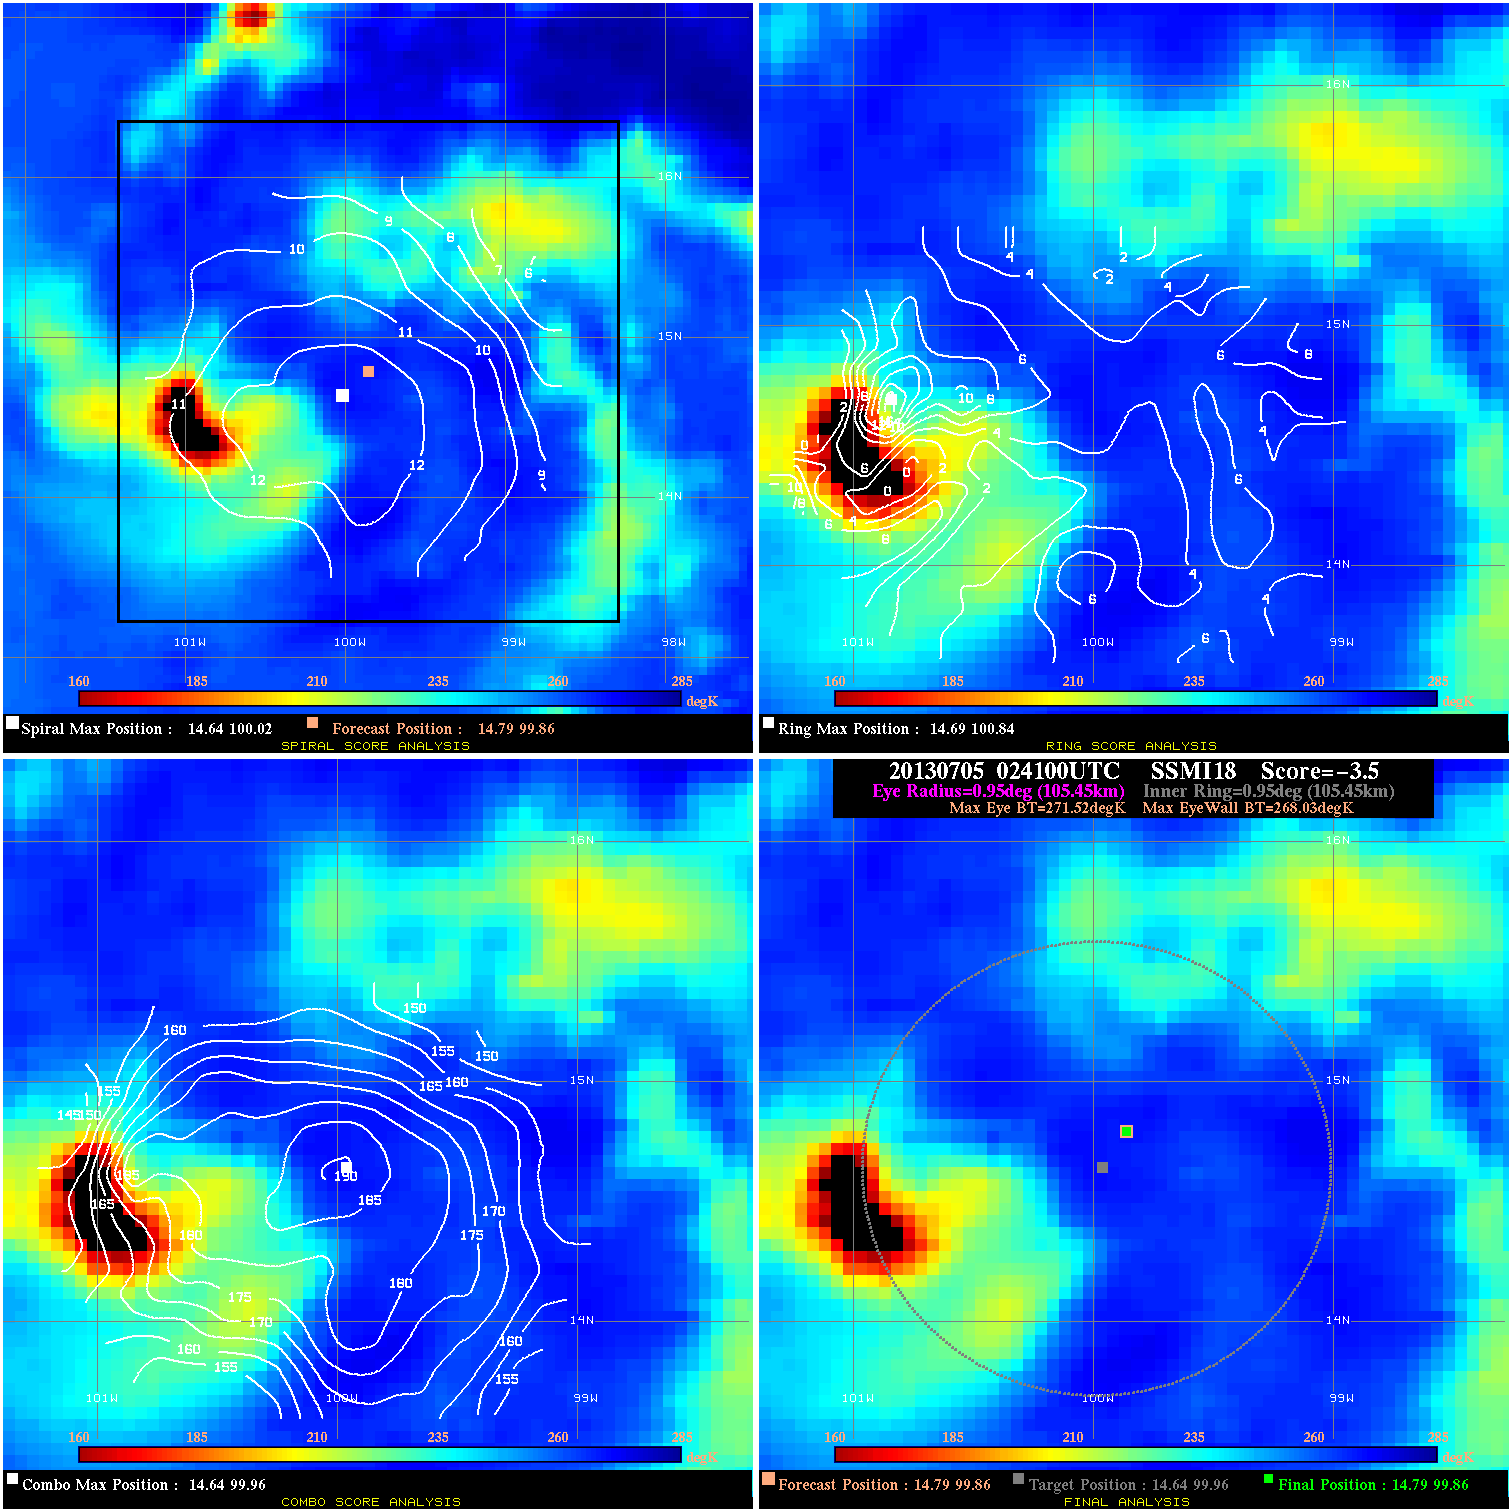
20130705 024100 -3.5 N/A 24.7% 211.09 3.49 40.0 SSMI18 14.8 99.9 14.8 99.9 14.6 100.0 Analysis Plot
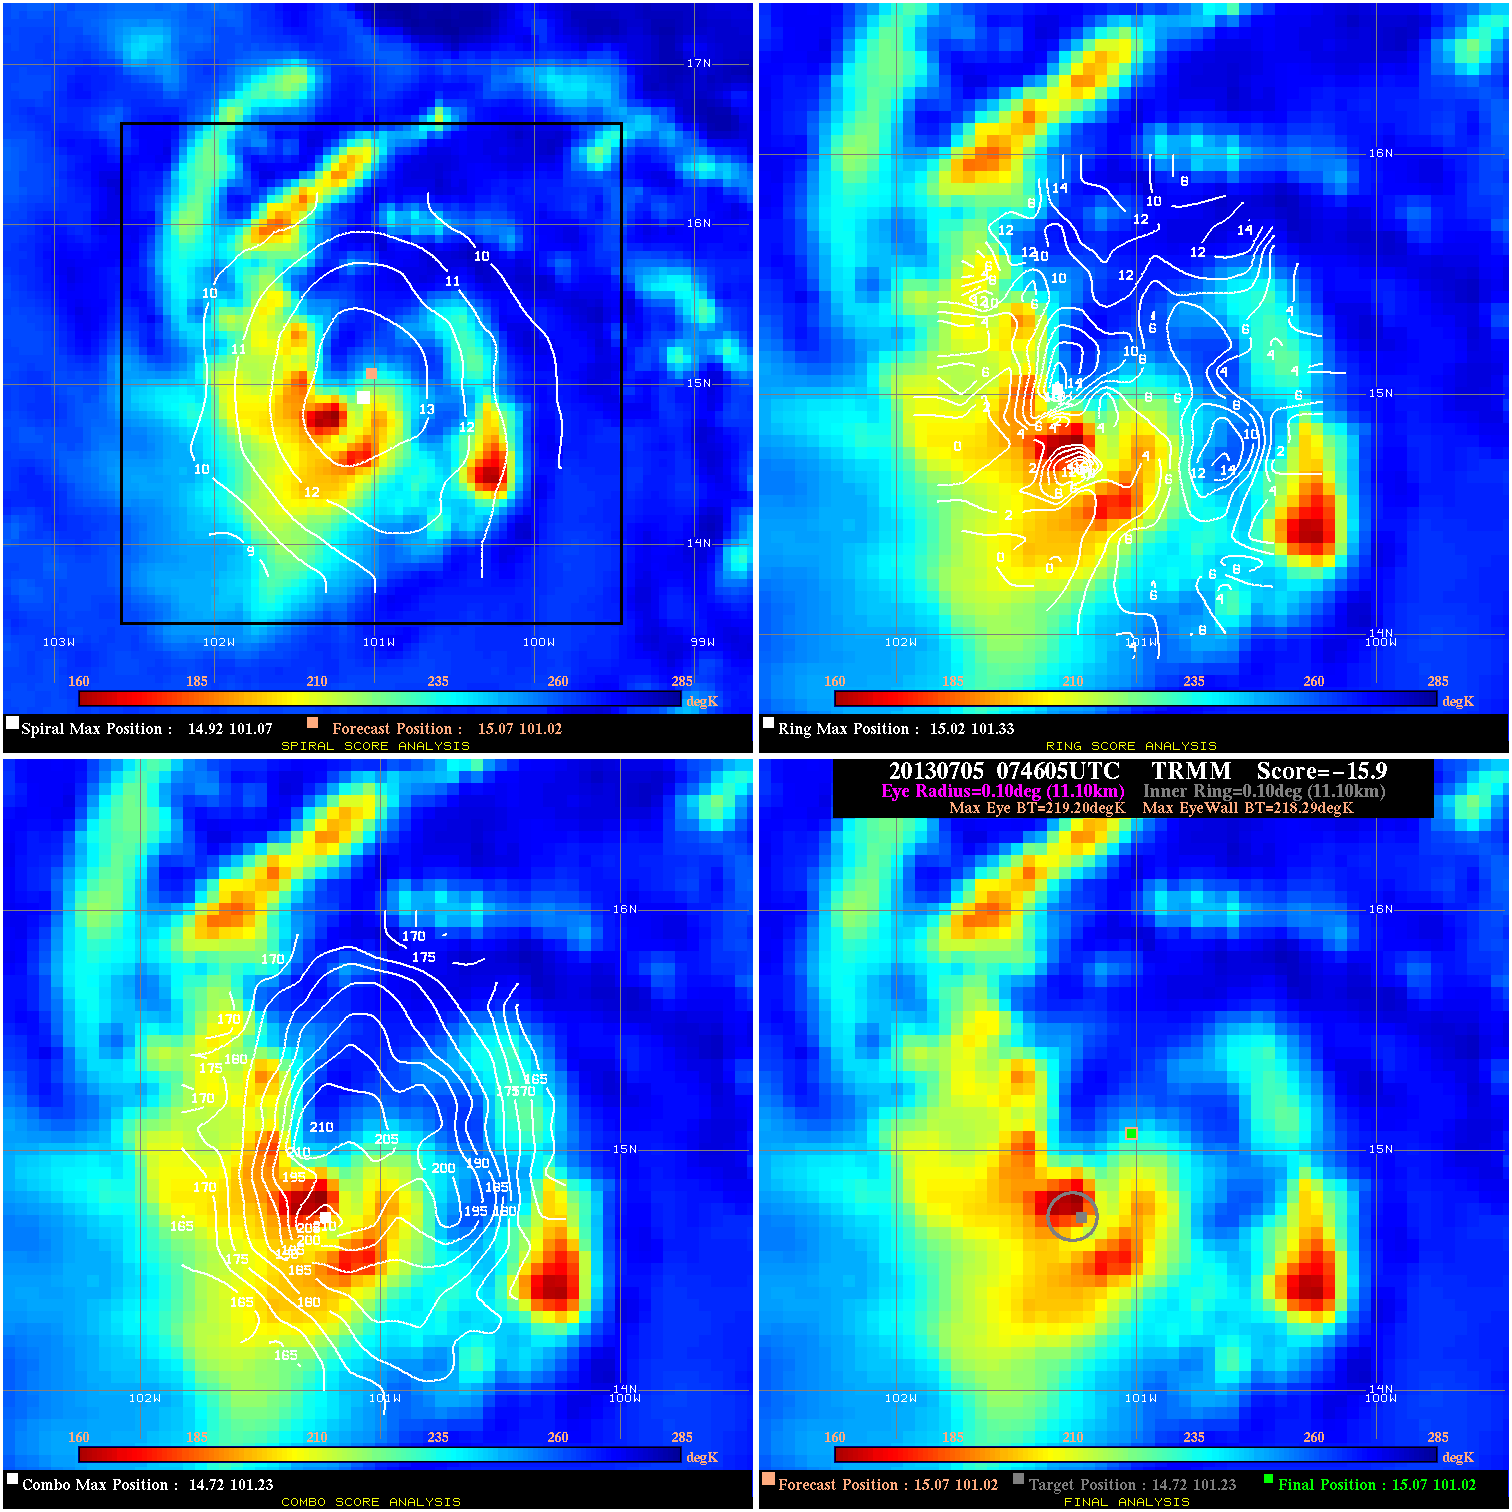
20130705 074605 -15.9 N/A 100.0% 22.22 .91 40.0 TRMM 15.1 101.0 15.1 101.0 14.7 101.2 Analysis Plot
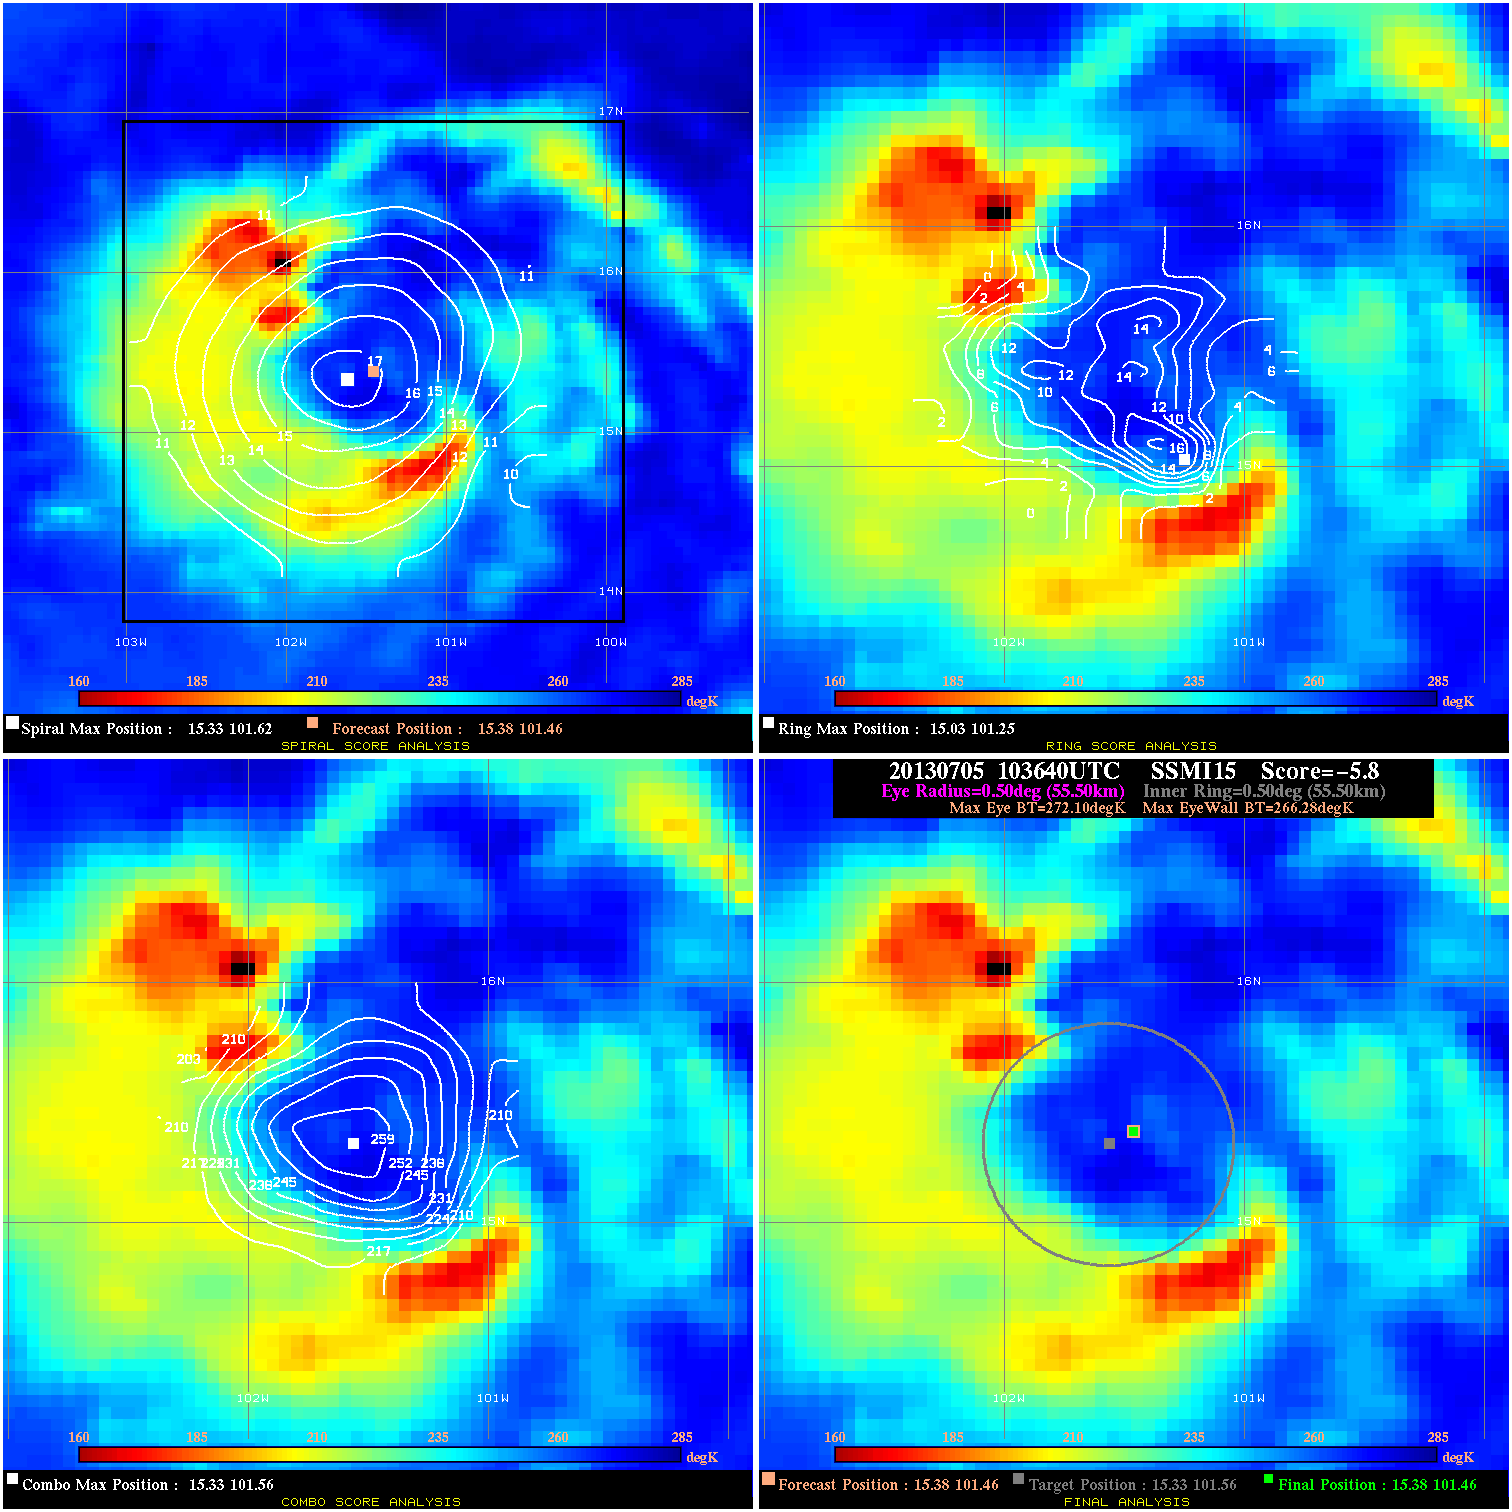
20130705 103640 -5.8 N/A 39.7% 111.10 5.82 40.0 SSMI15 15.4 101.5 15.4 101.5 15.3 101.6 Analysis Plot
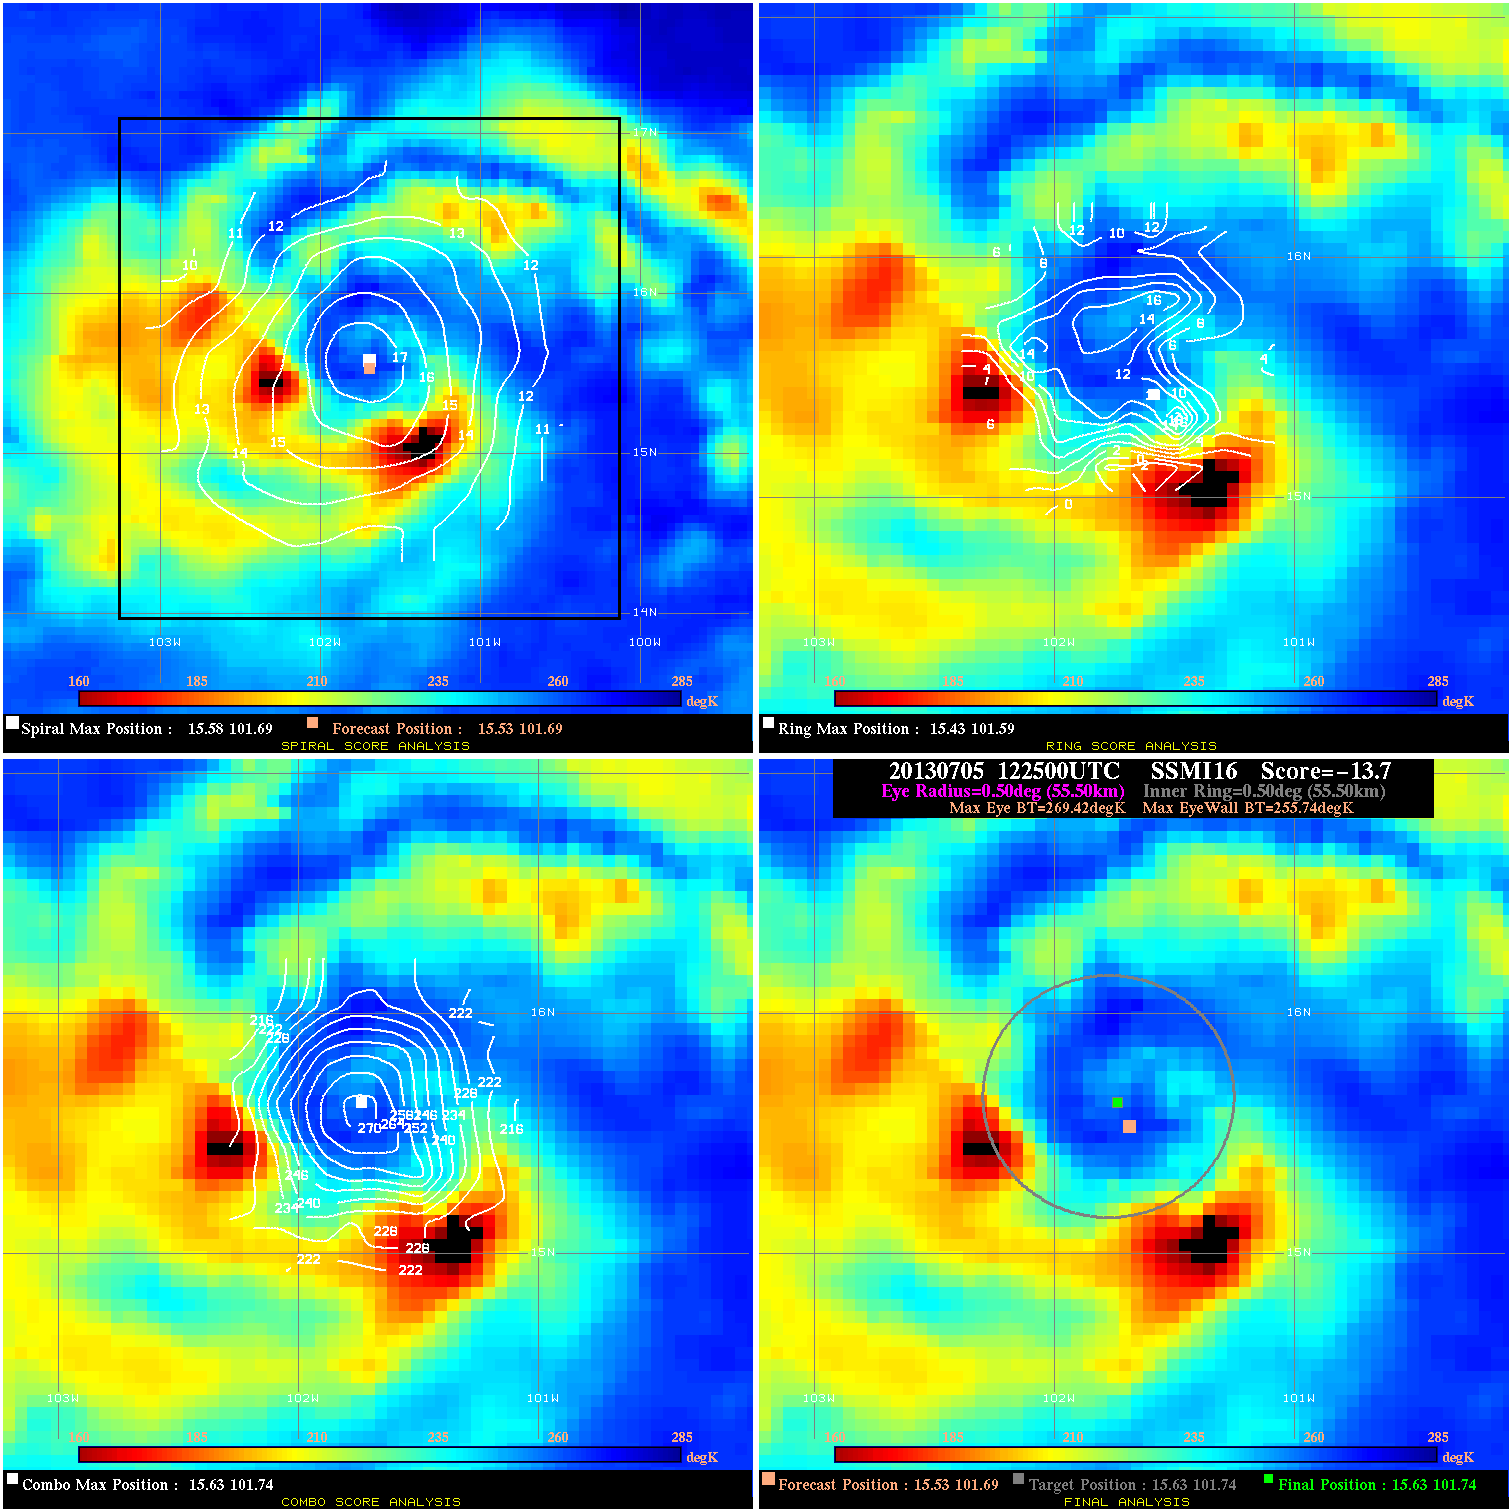
20130705 122500 -13.7 N/A 54.8% 111.10 13.68 40.0 SSMI16 15.5 101.7 15.6 101.7 15.6 101.7 Analysis Plot
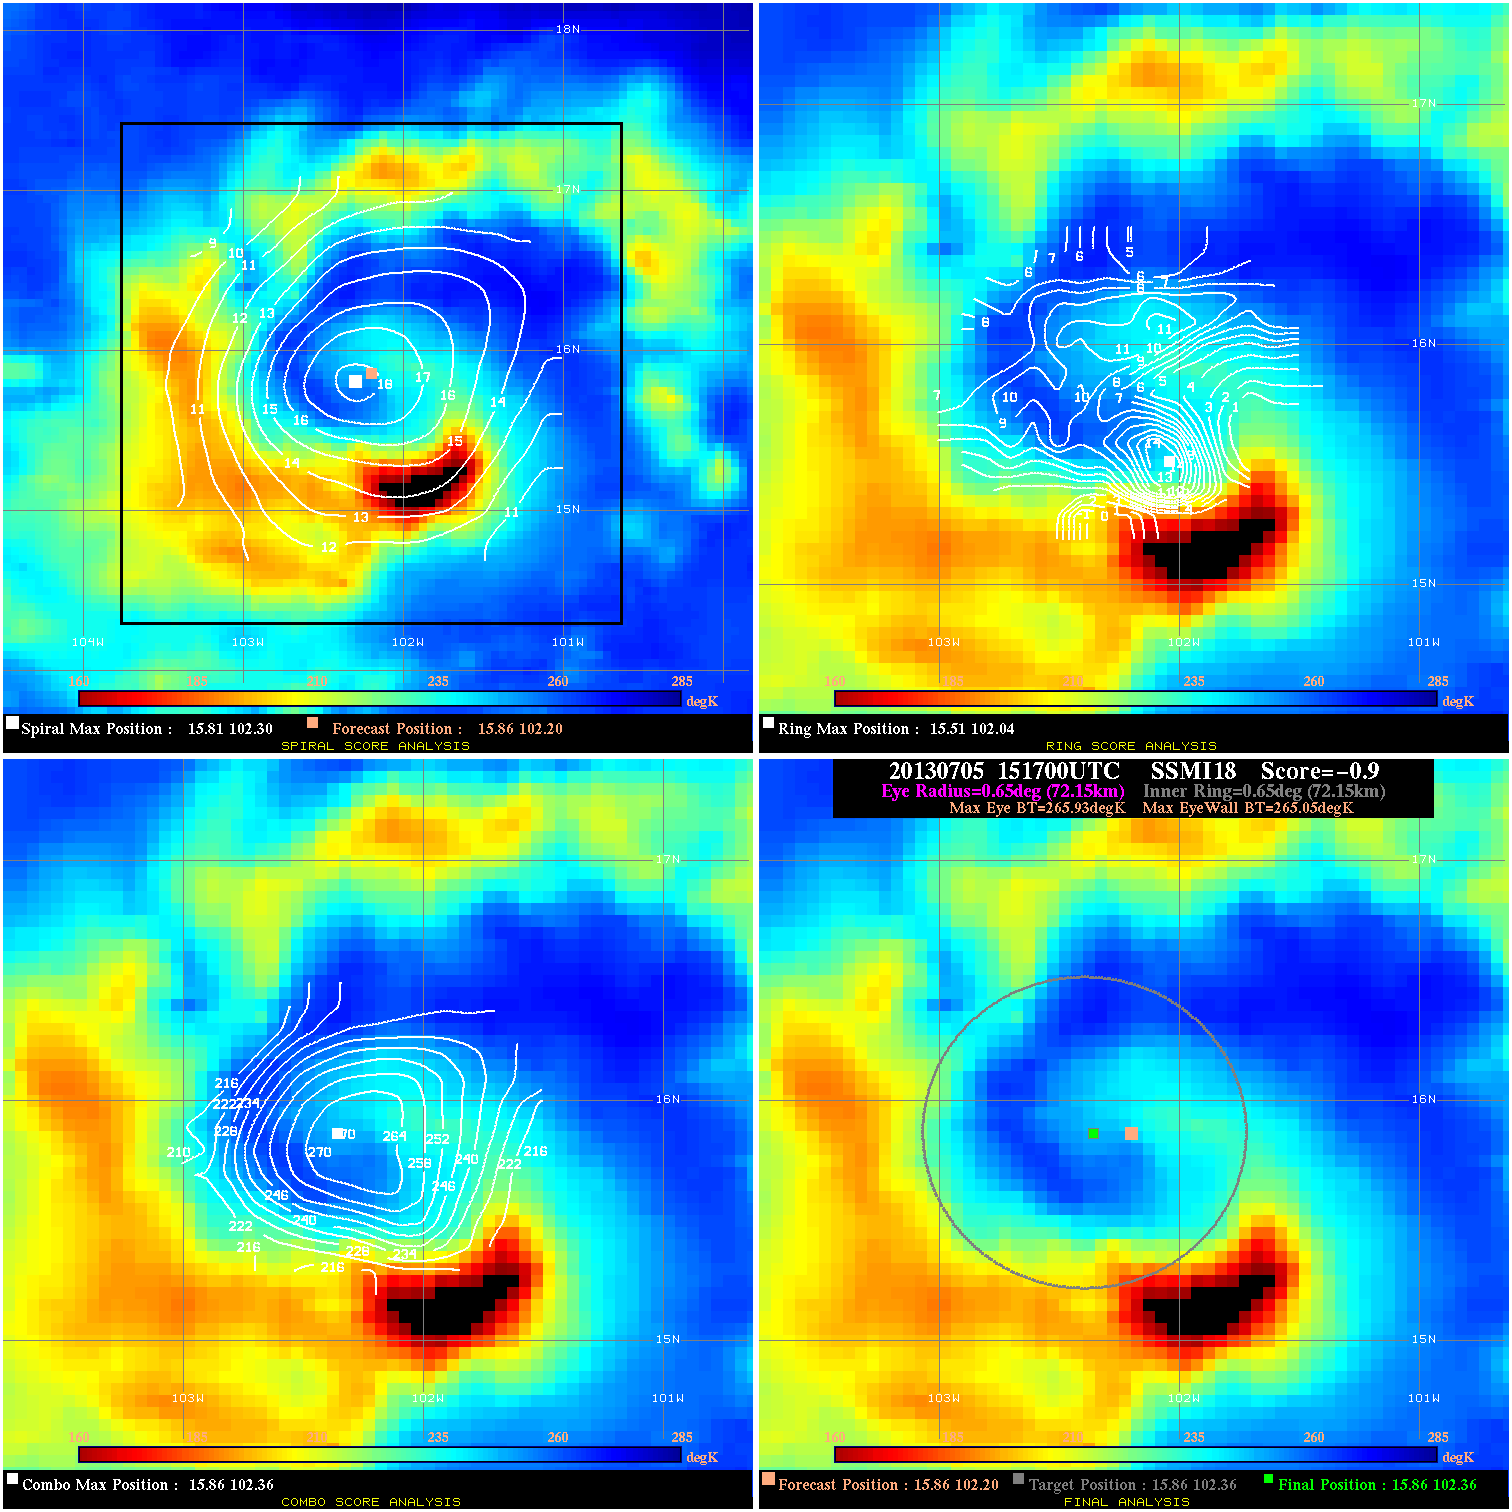
20130705 151700 -0.9 N/A 42.5% 144.43 .88 50.0 SSMI18 15.9 102.2 15.9 102.4 15.9 102.4 Analysis Plot
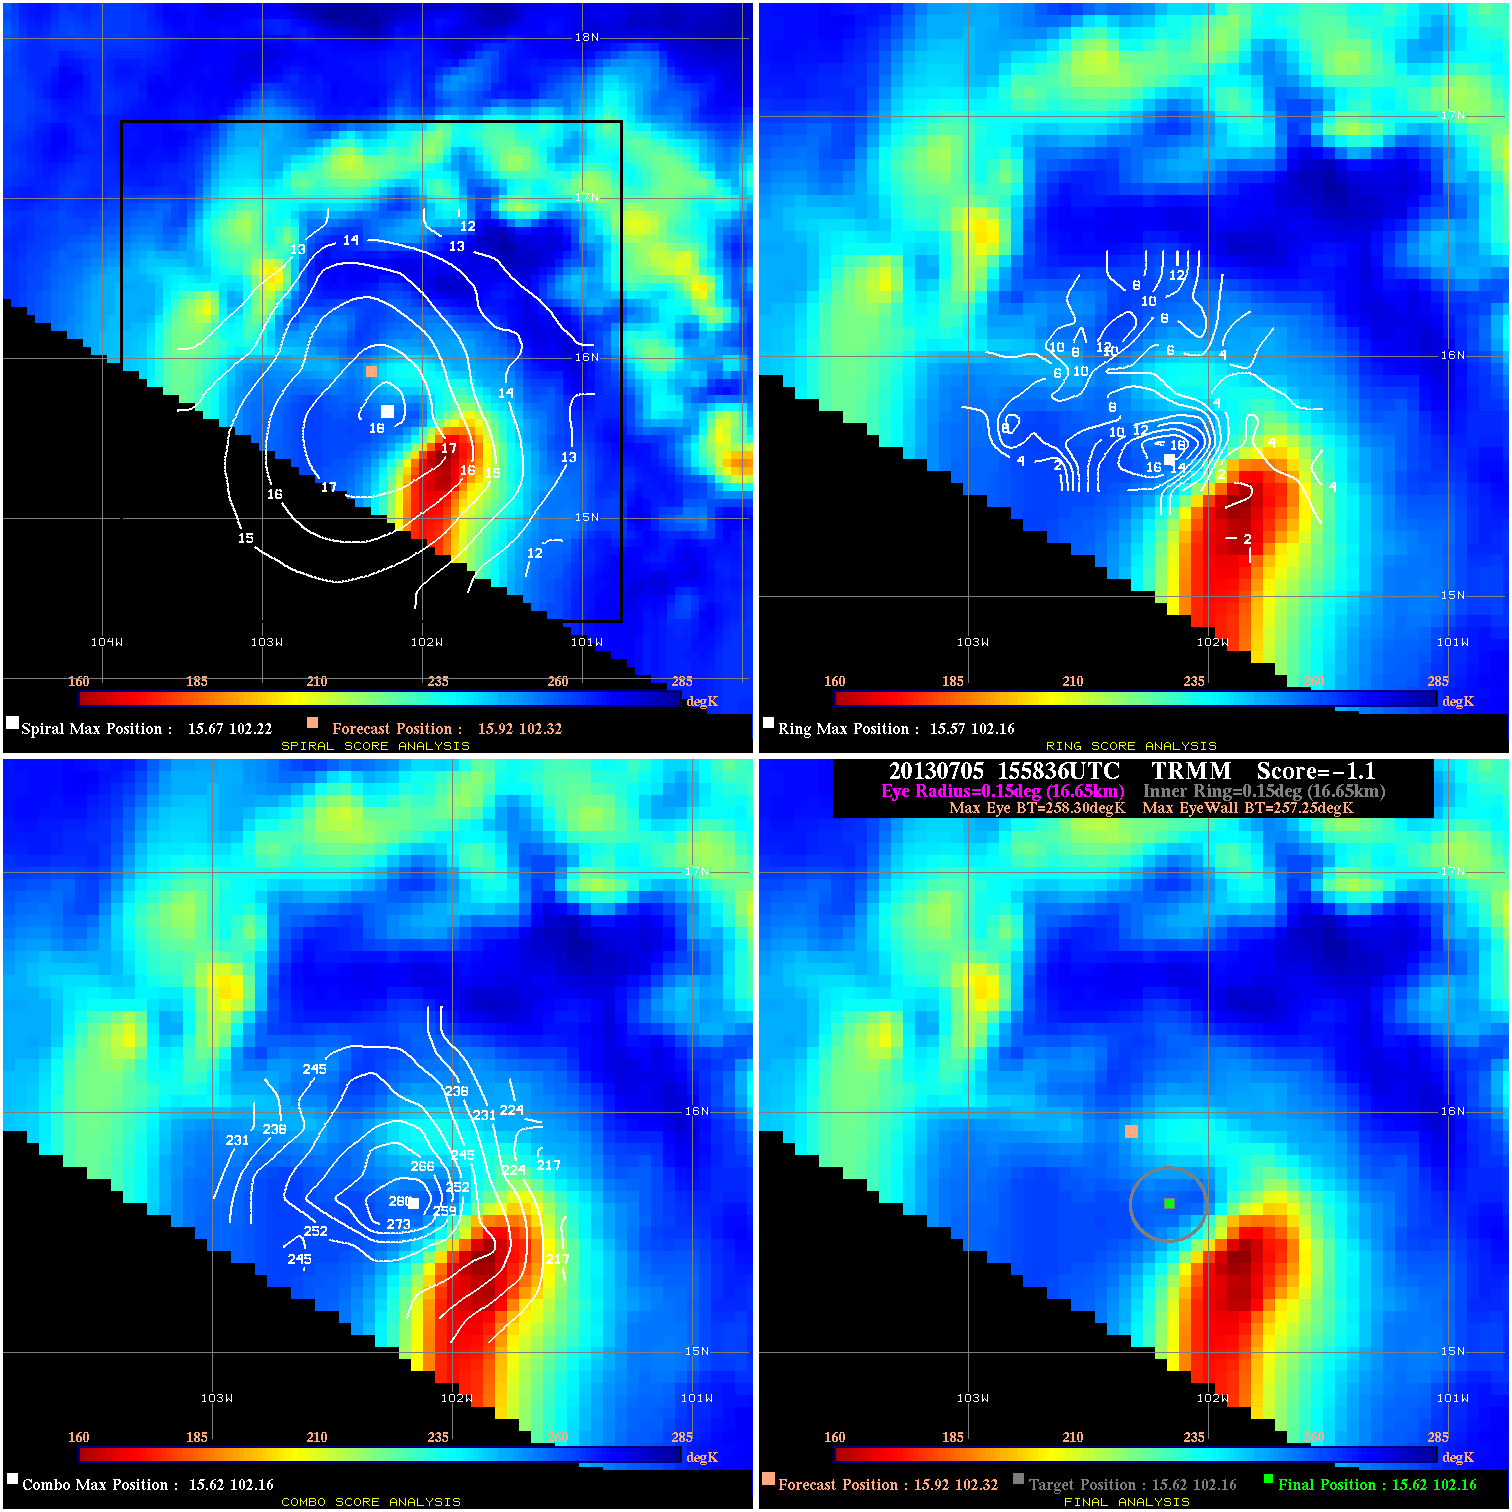
20130705 155836 -1.1 N/A 20.8% 33.33 1.05 50.0 TRMM 15.9 102.3 15.6 102.2 15.6 102.2 Analysis Plot
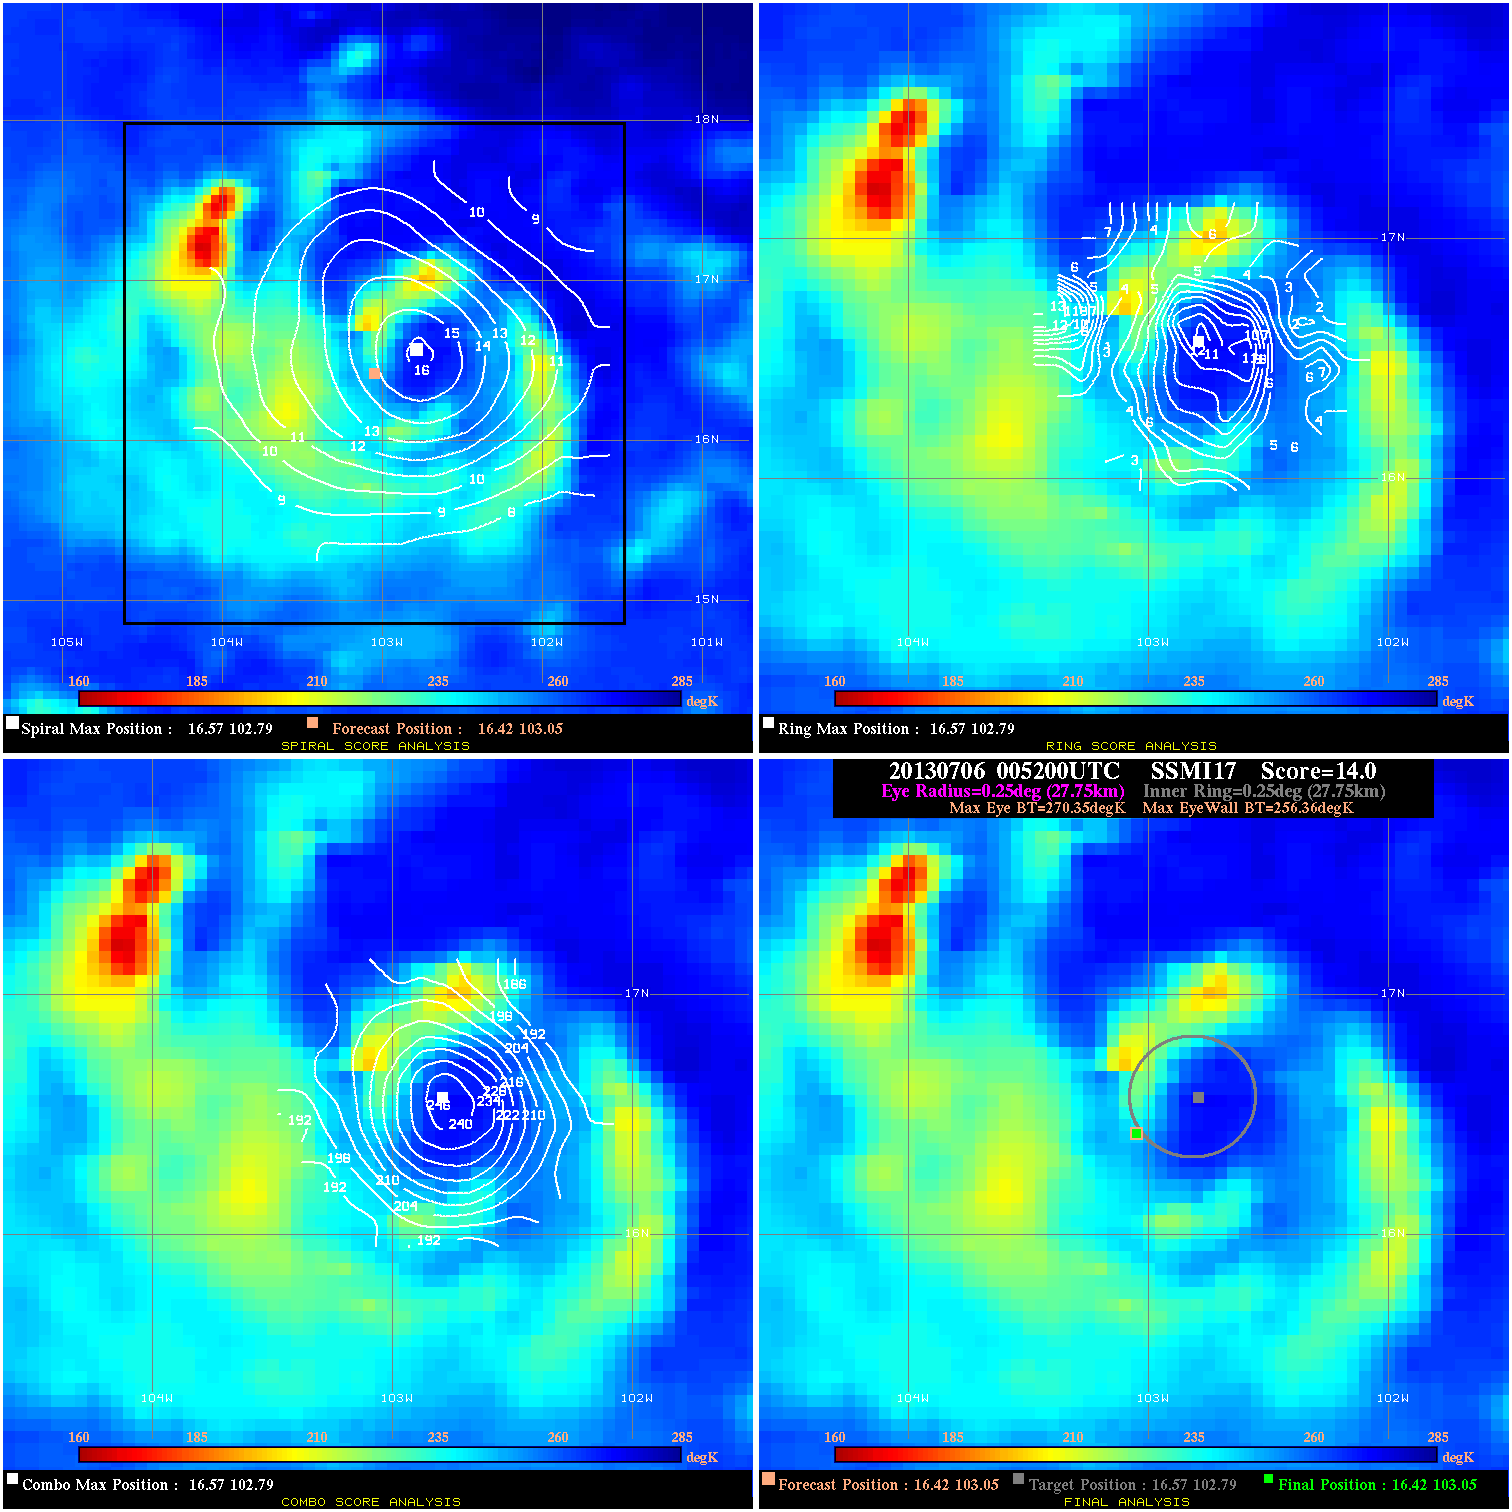
20130706 005200 14.0 N/A 21.9% 55.55 13.99 55.0 SSMI17 16.4 103.0 16.4 103.0 16.6 102.8 Analysis Plot
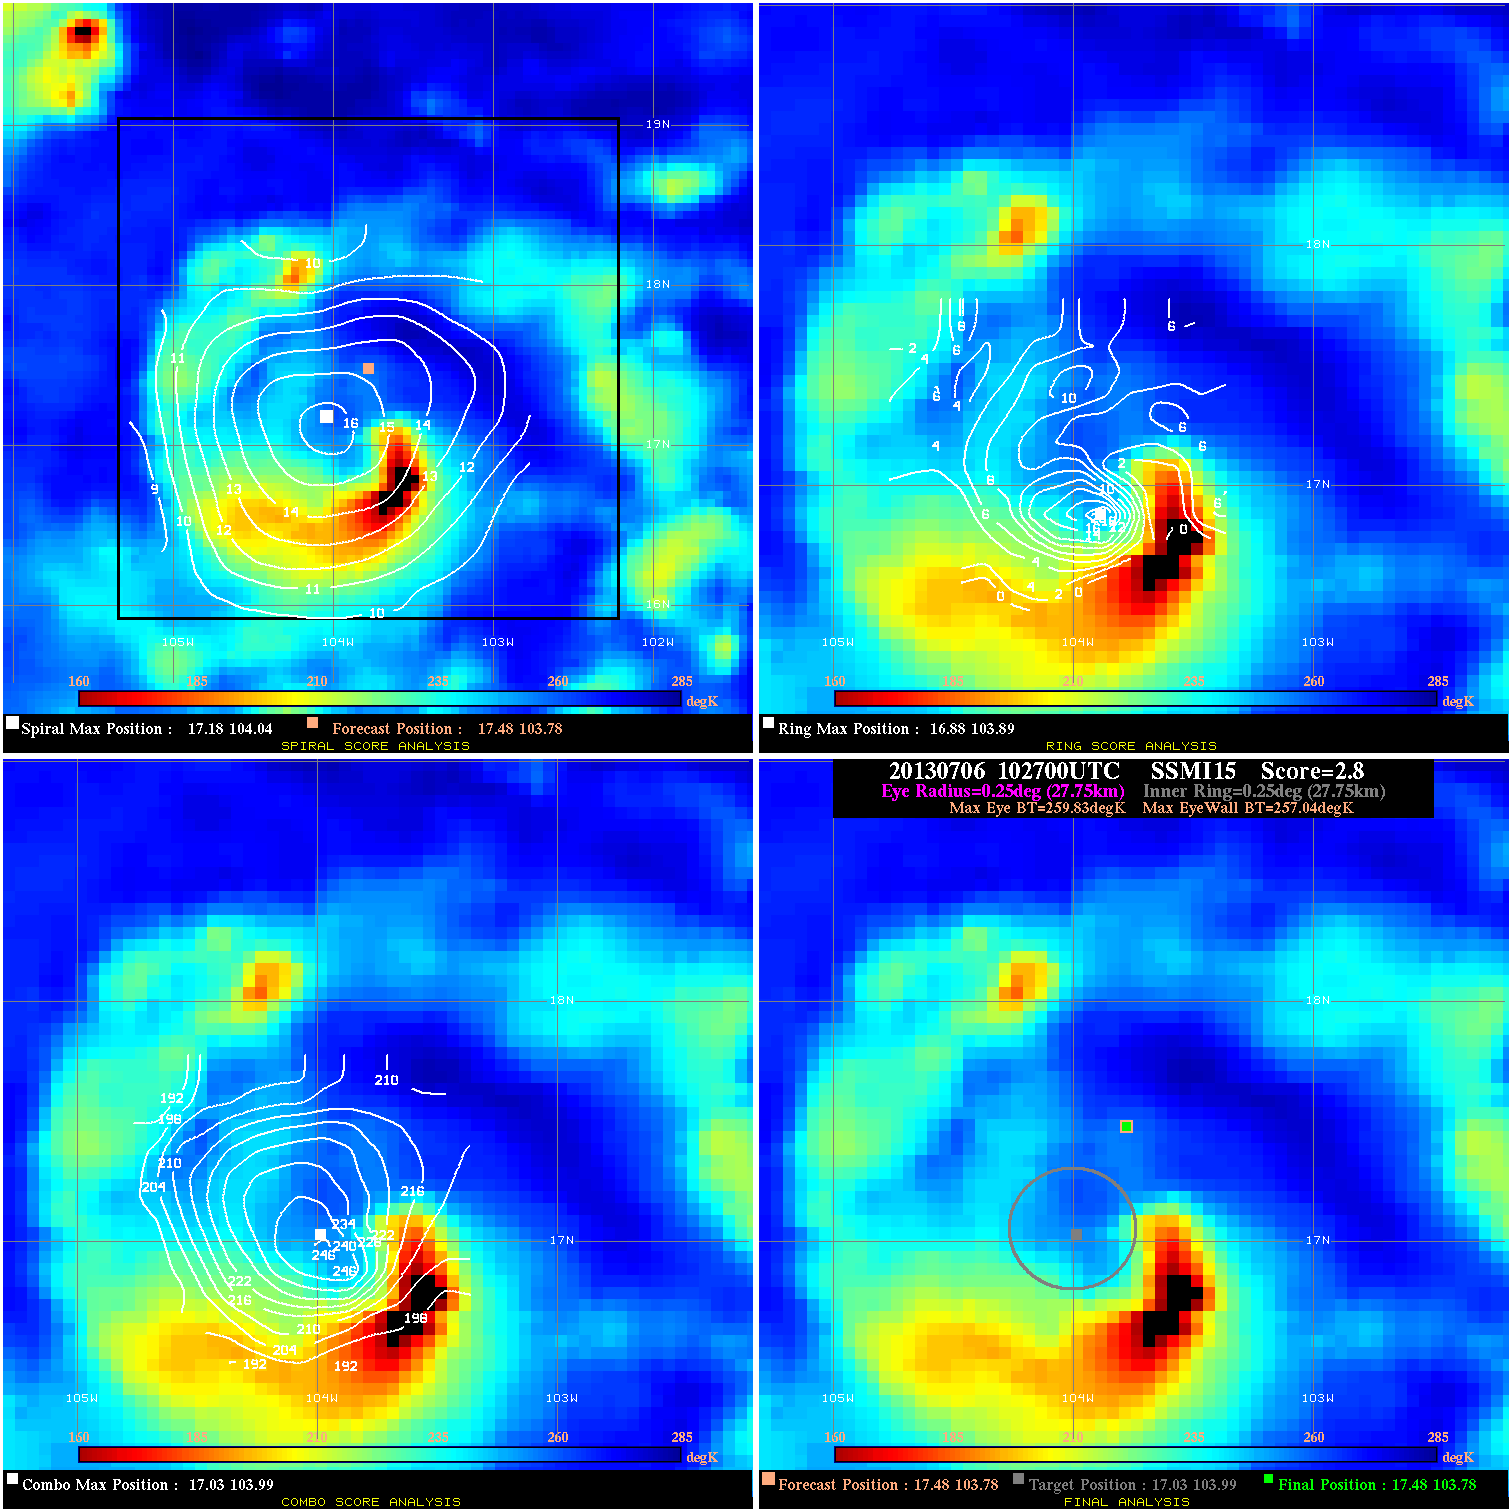
20130706 102700 2.8 N/A 56.2% 55.55 2.79 60.0 SSMI15 17.5 103.8 17.5 103.8 17.0 104.0 Analysis Plot
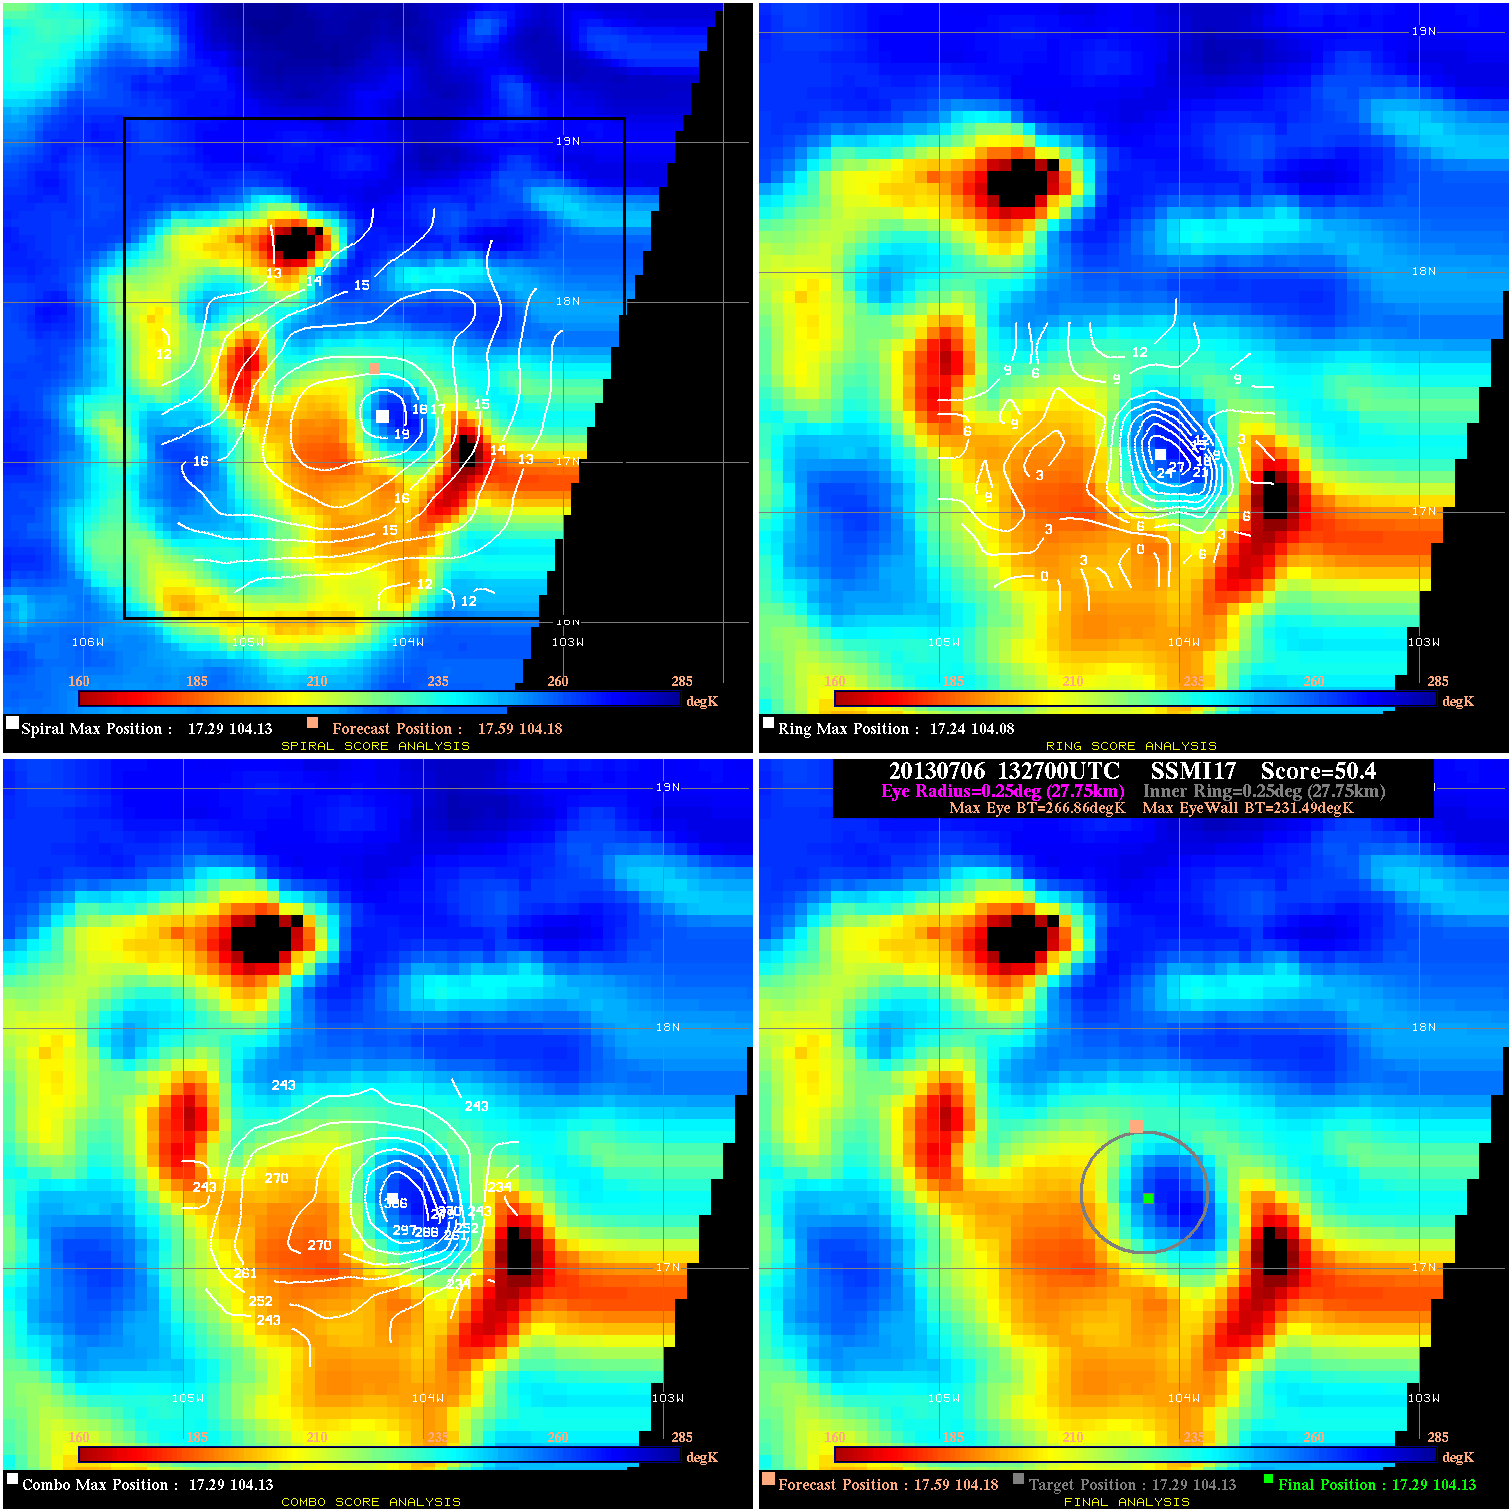
20130706 132700 50.4 >65 kts 100.0% 55.55 35.37 70.0 SSMI17 17.6 104.2 17.3 104.1 17.3 104.1 Analysis Plot
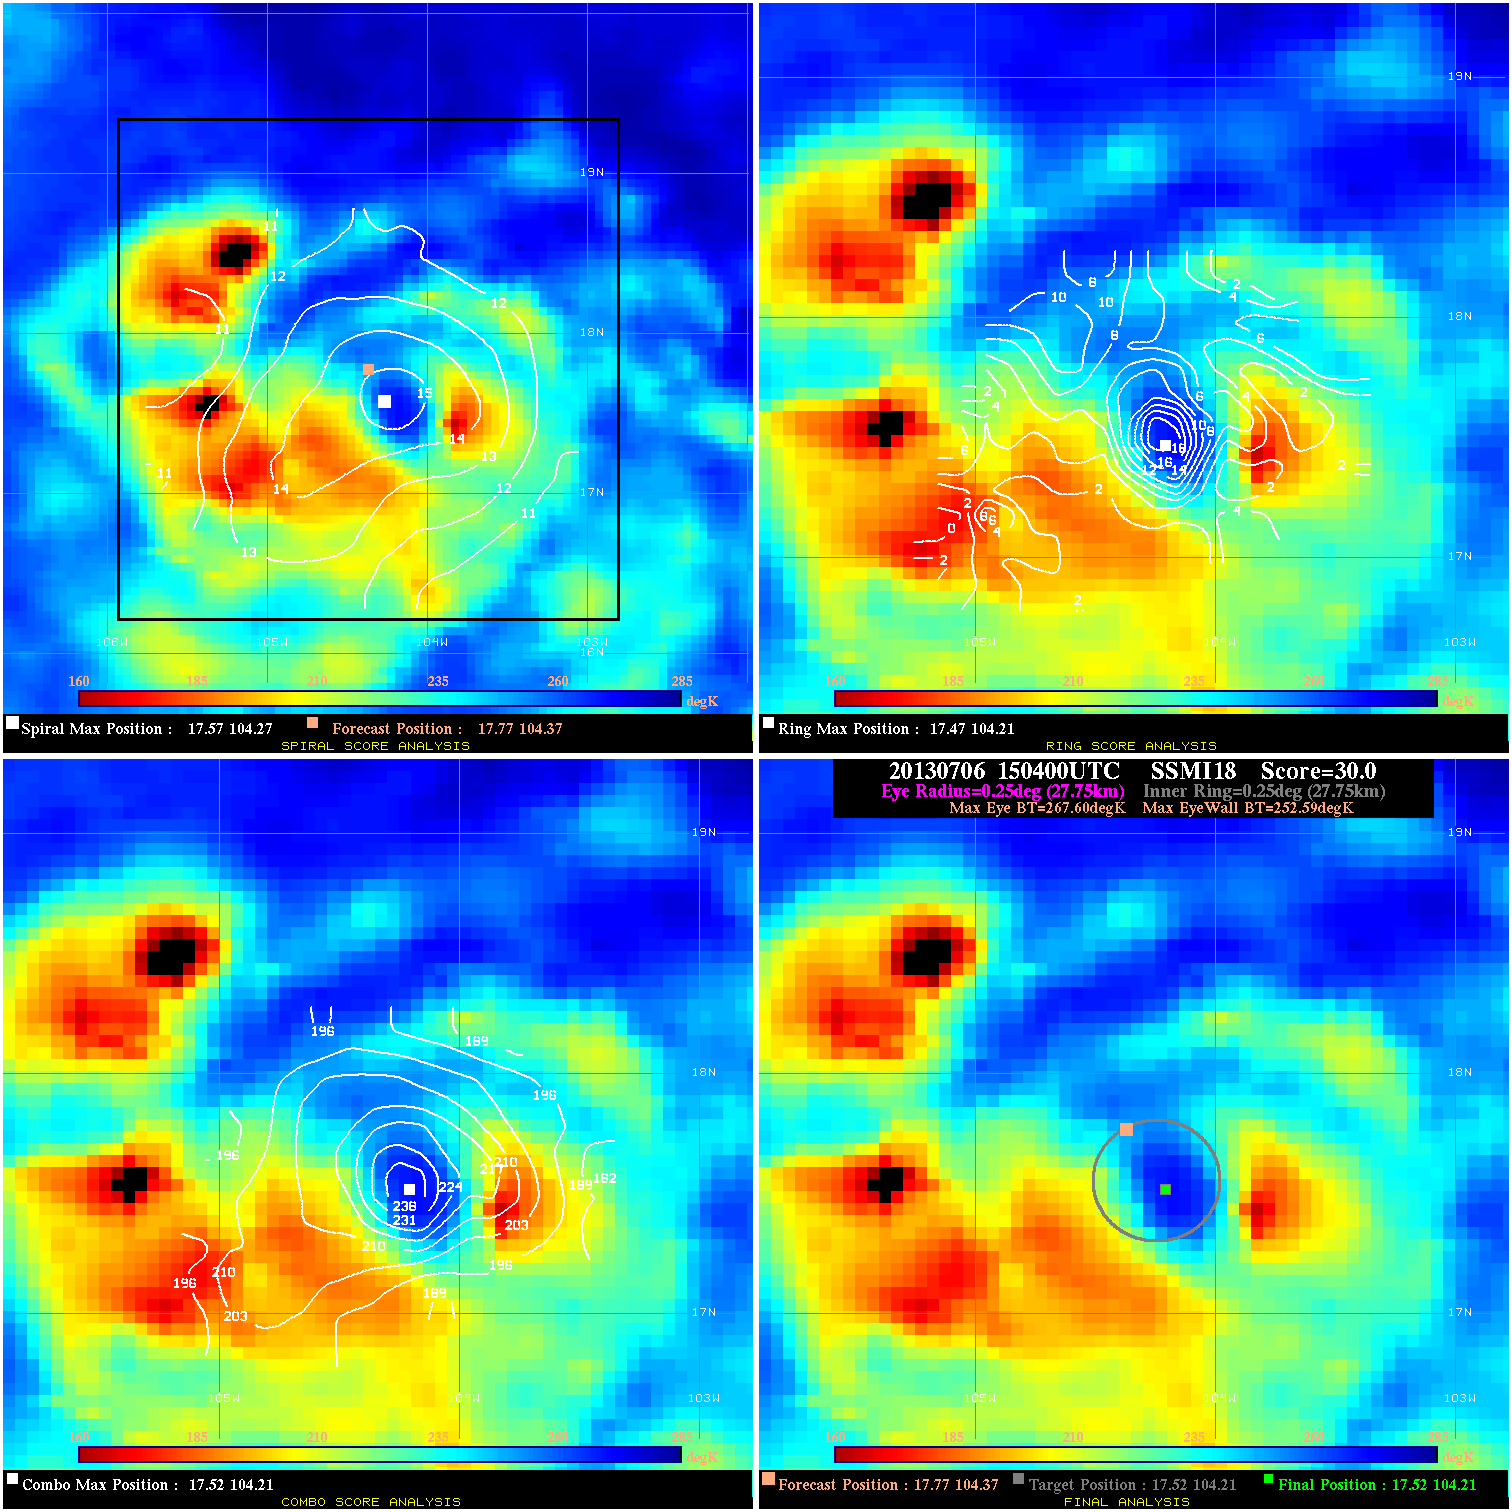
20130706 150400 30.0 >65 kts 89.0% 55.55 15.01 70.0 SSMI18 17.8 104.4 17.5 104.2 17.5 104.2 Analysis Plot
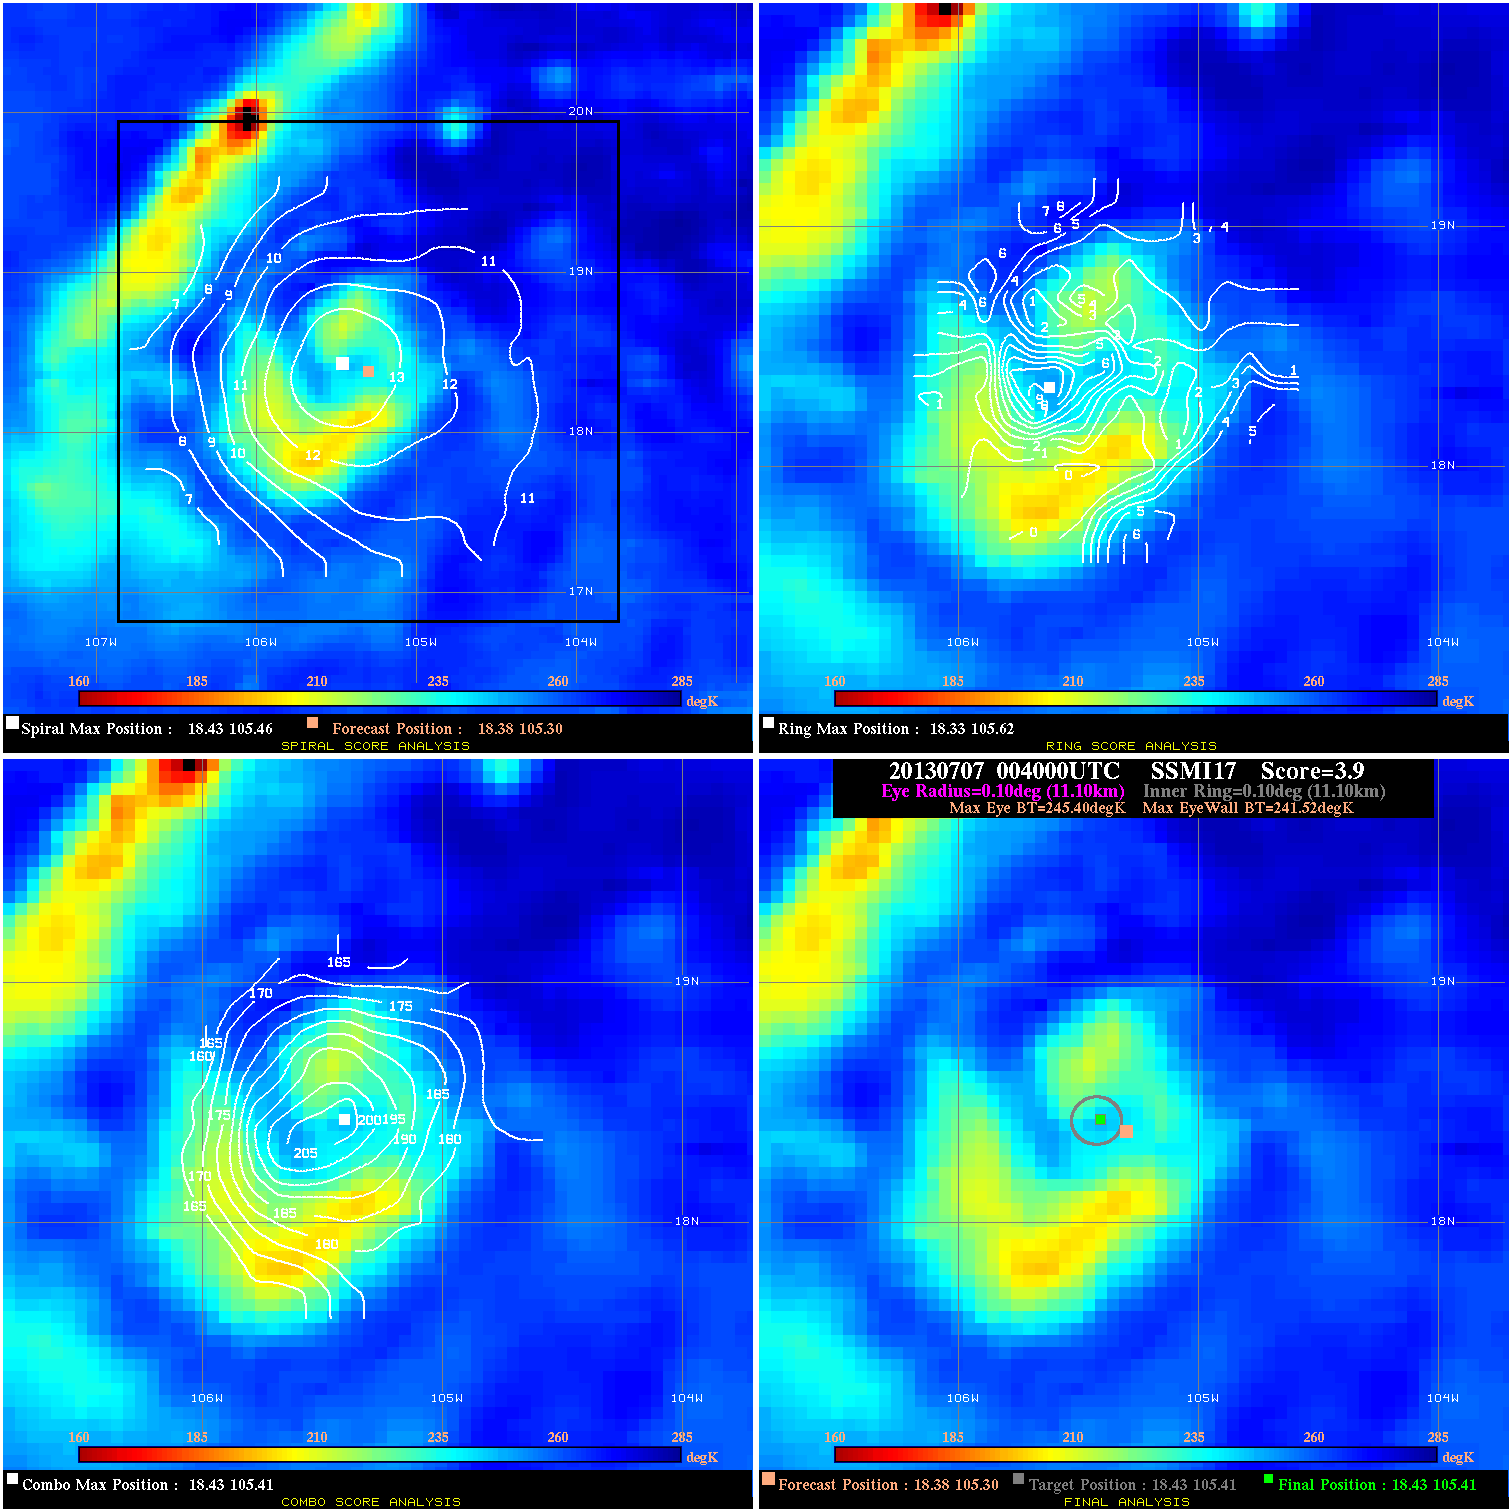
20130707 004000 3.9 N/A 43.8% 22.22 3.88 70.0 SSMI17 18.4 105.3 18.4 105.4 18.4 105.4 Analysis Plot
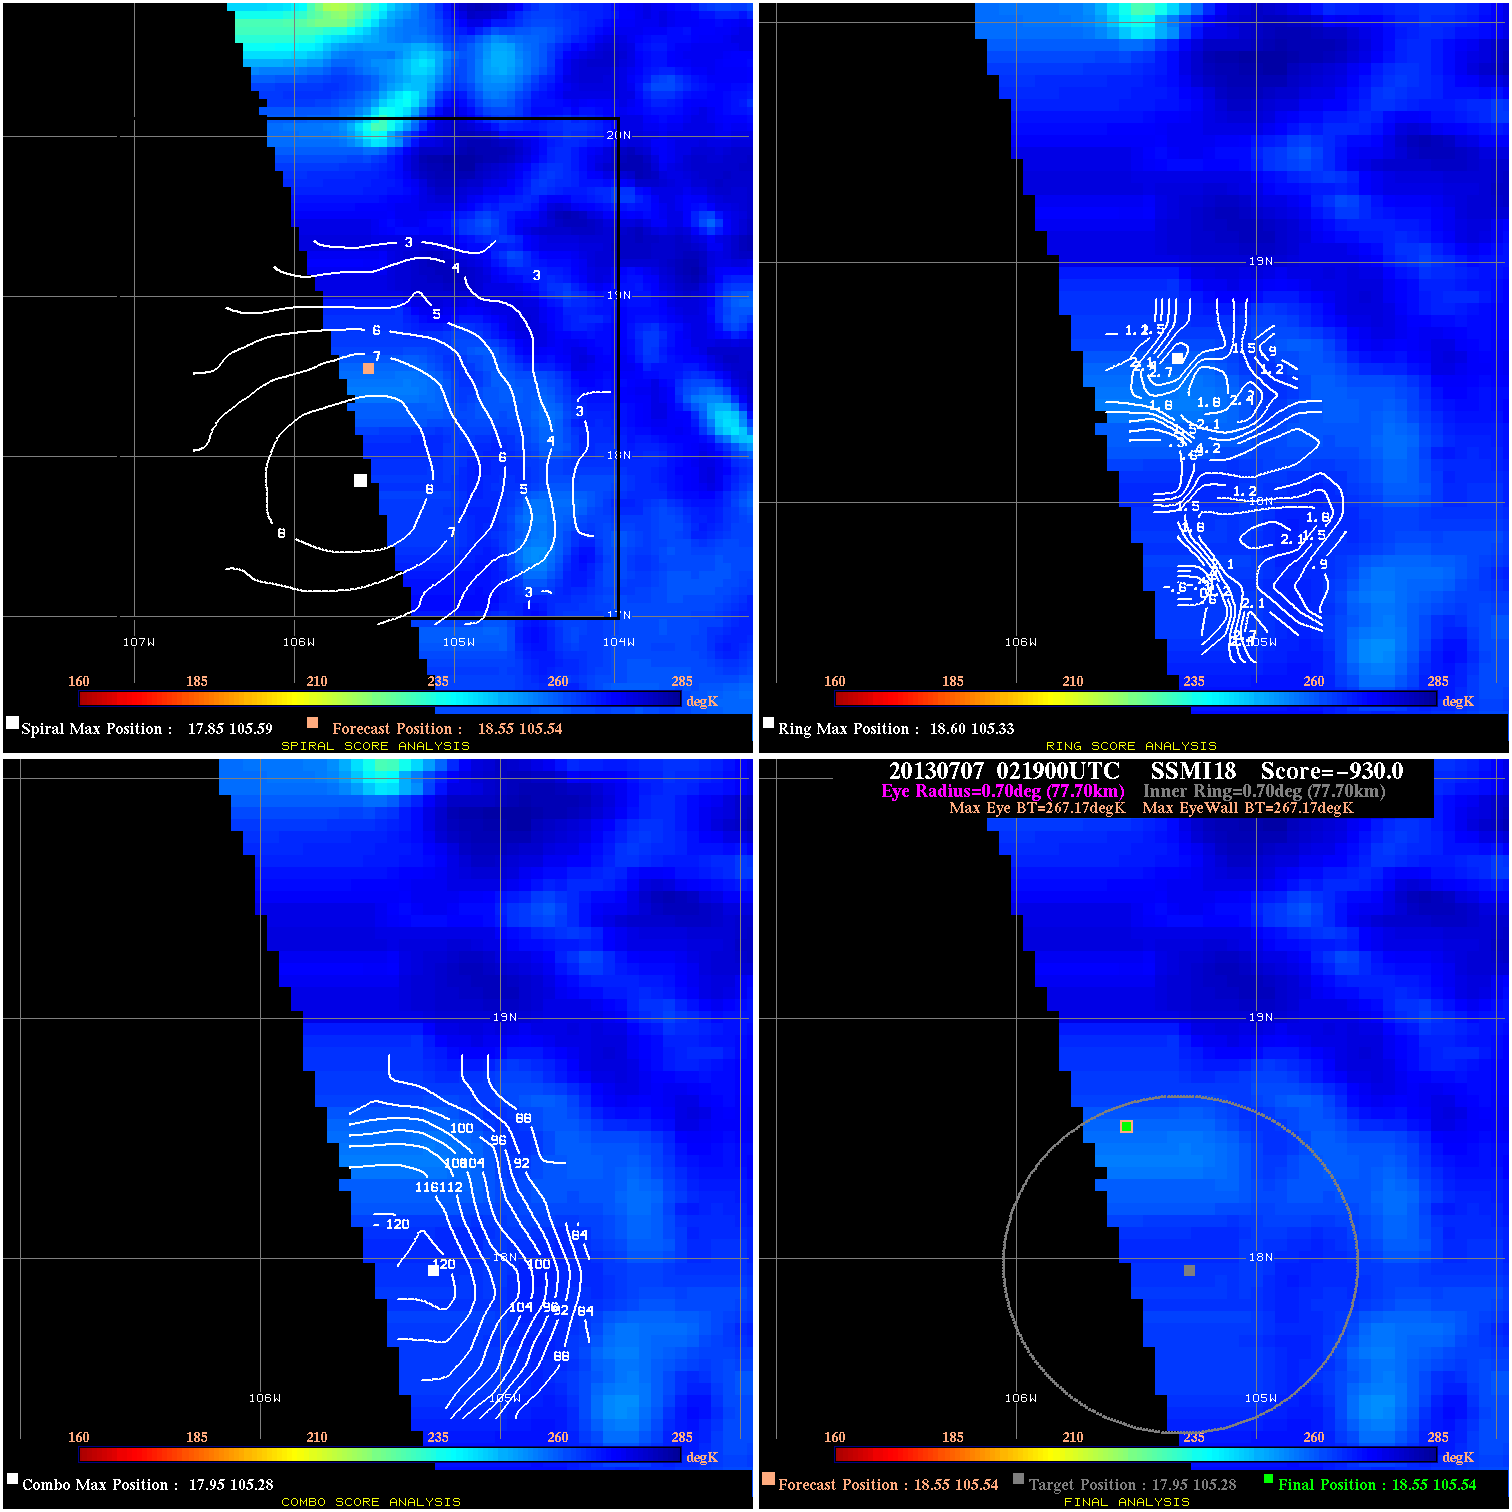
20130707 021900 N/A N/A N/A N/A N/A 70.0 SSMI18 18.6 105.5 18.6 105.5 17.9 105.3 Analysis Plot
20130707 022000 -930.0 N/A N/A 166.65 .25 70.0 SSMI18 18.7 105.7 18.7 105.7 18.0 105.3 Analysis Plot
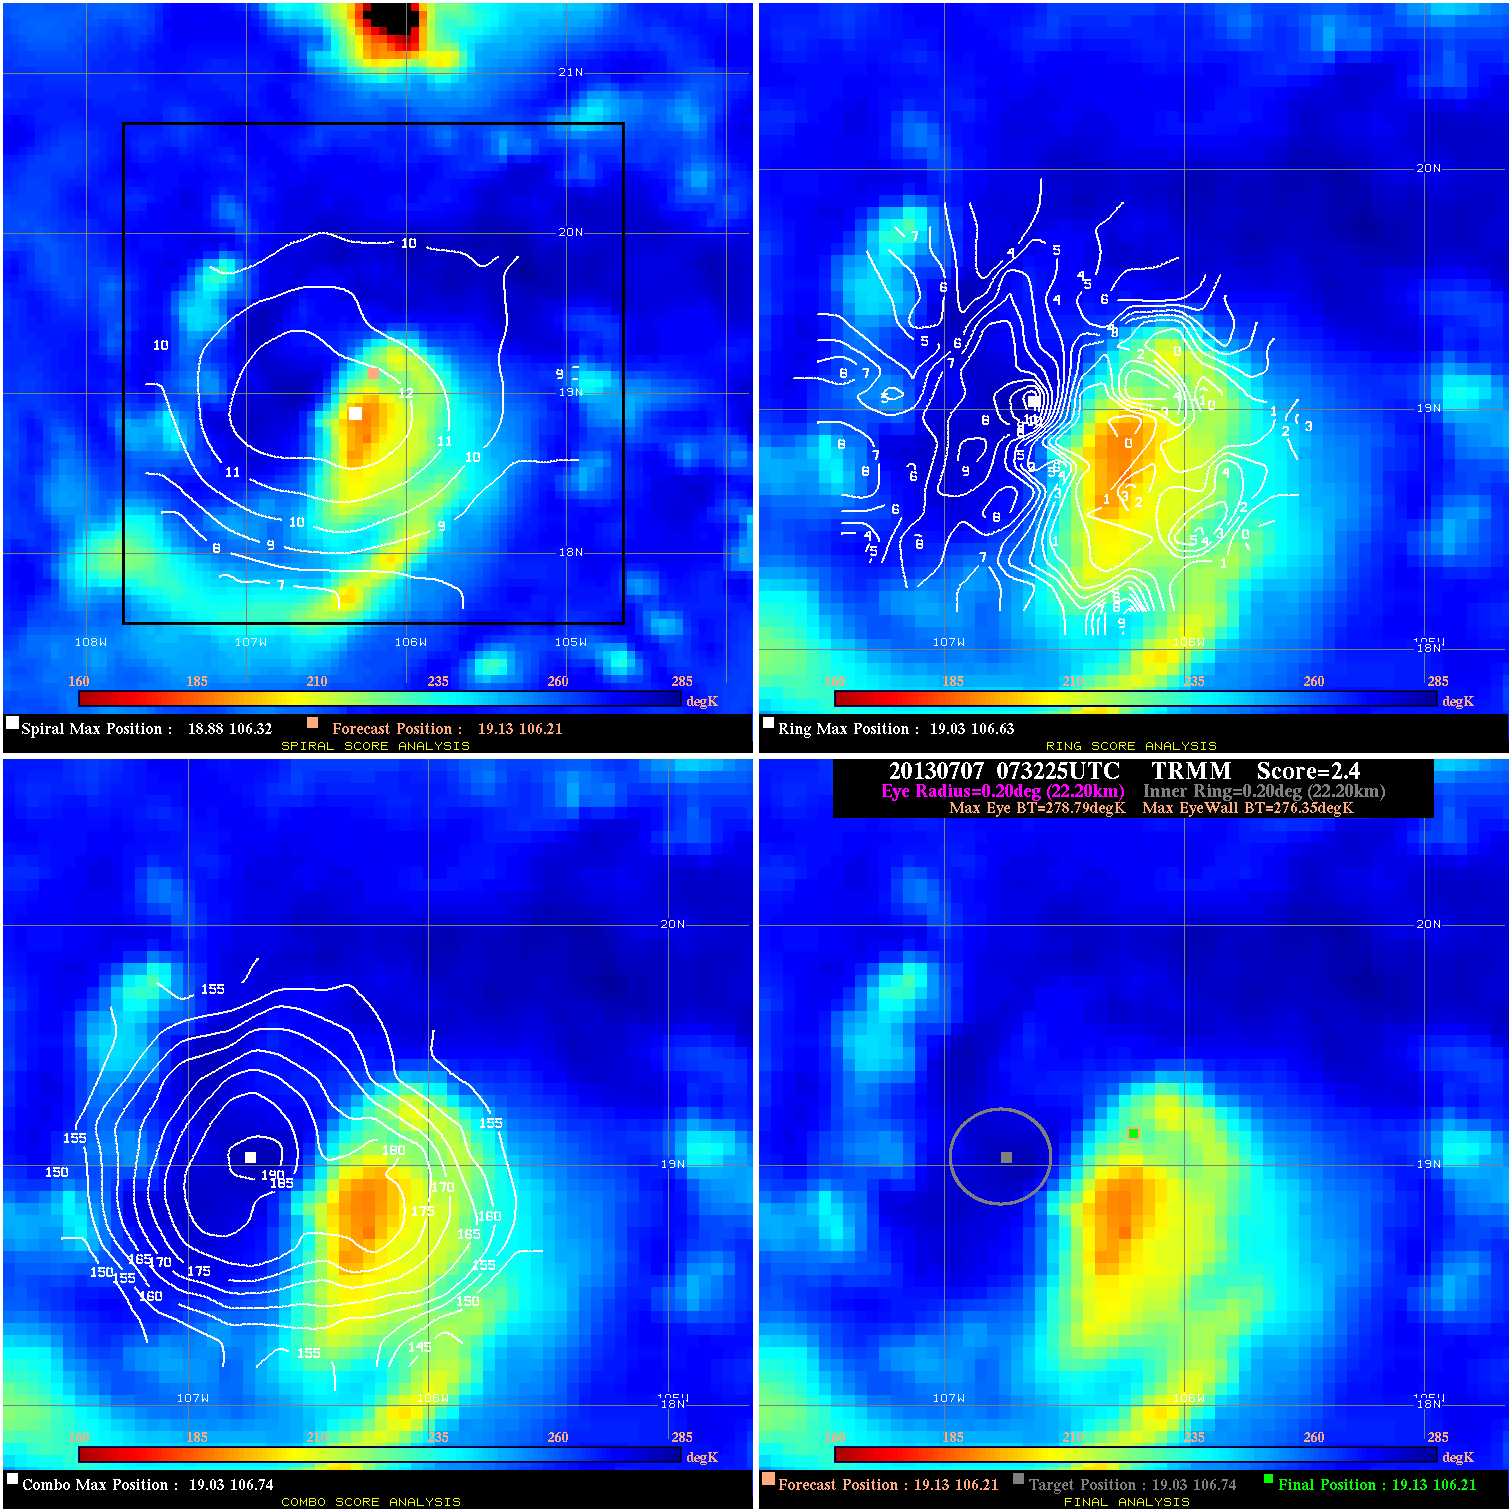
20130707 073225 2.4 N/A 23.3% 44.44 2.44 70.0 TRMM 19.1 106.2 19.1 106.2 19.0 106.7 Analysis Plot
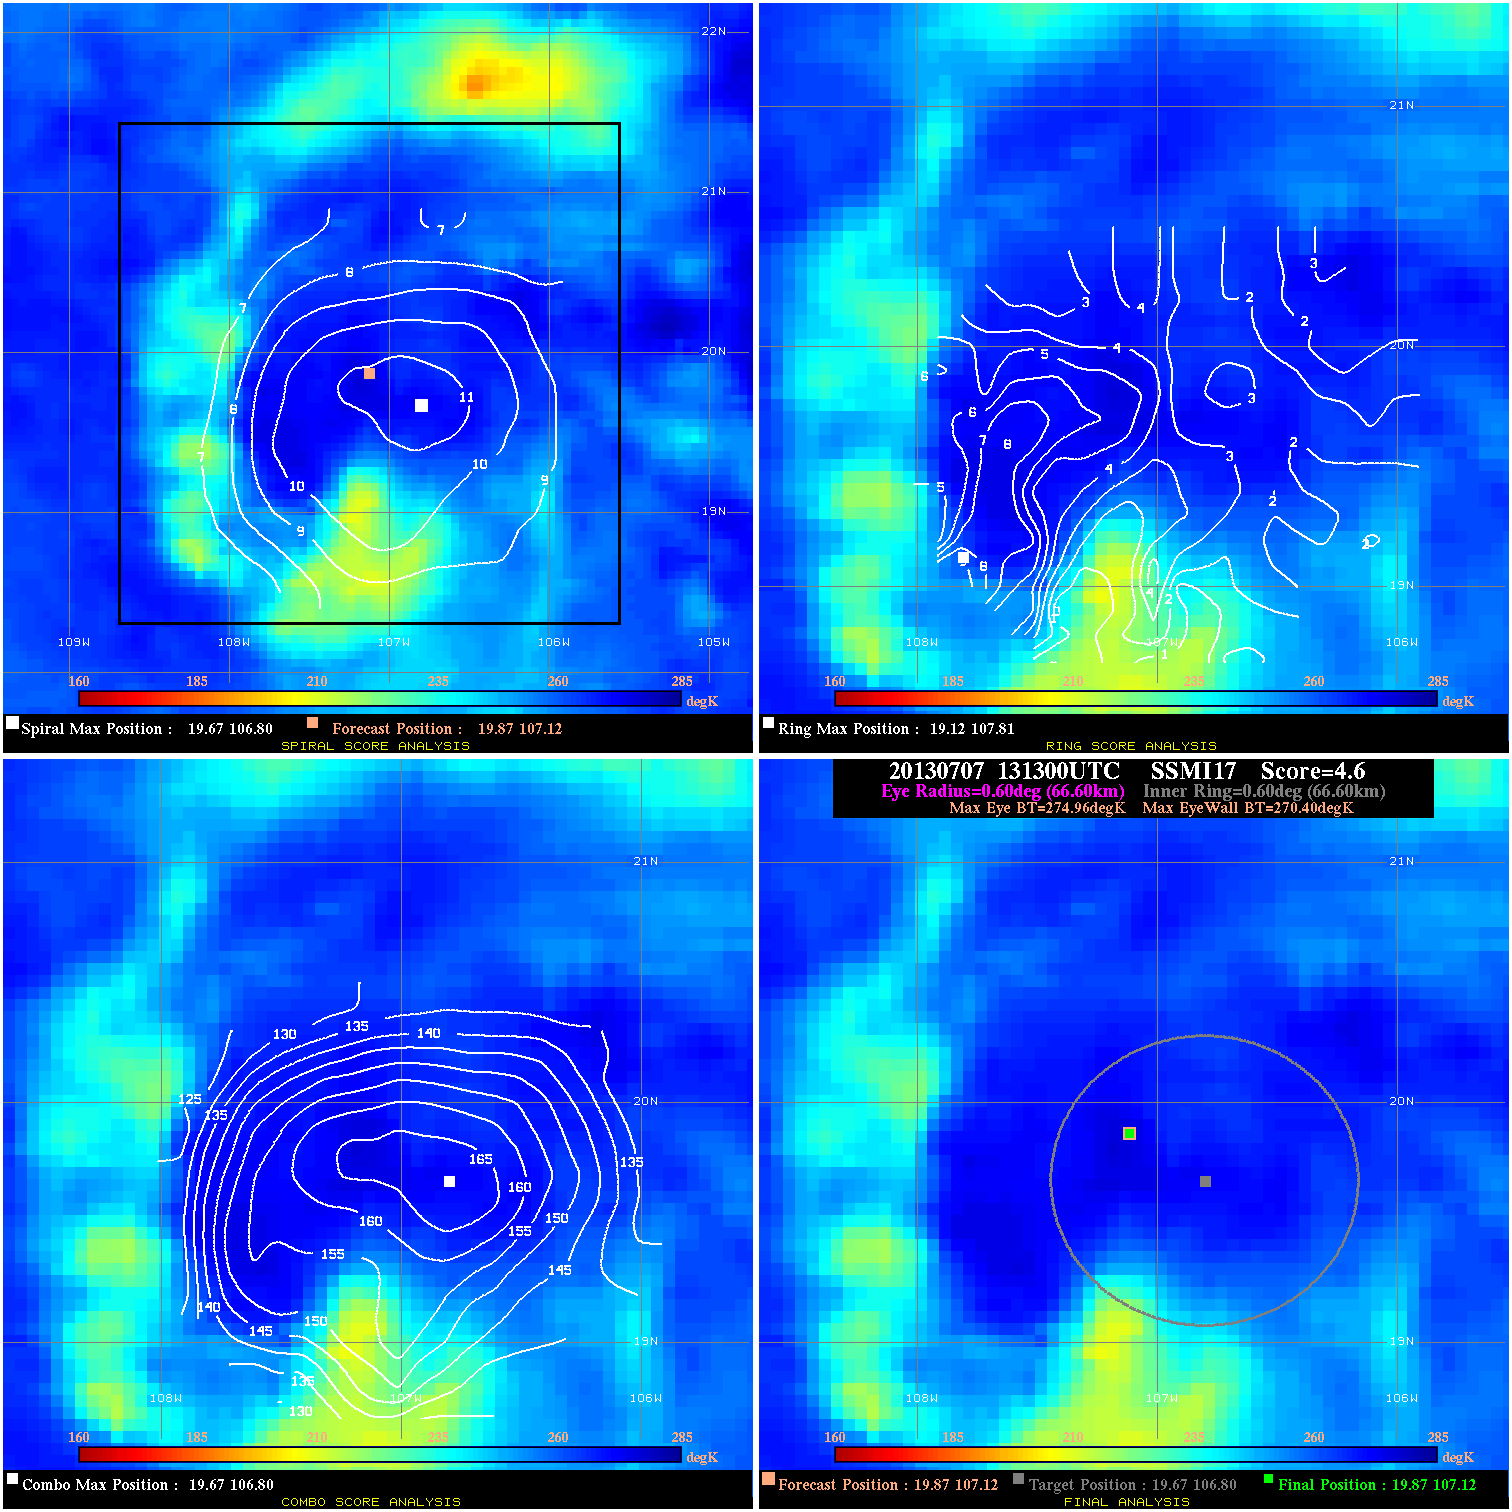
20130707 131300 4.6 N/A 9.6% 133.32 4.56 65.0 SSMI17 19.9 107.1 19.9 107.1 19.7 106.8 Analysis Plot
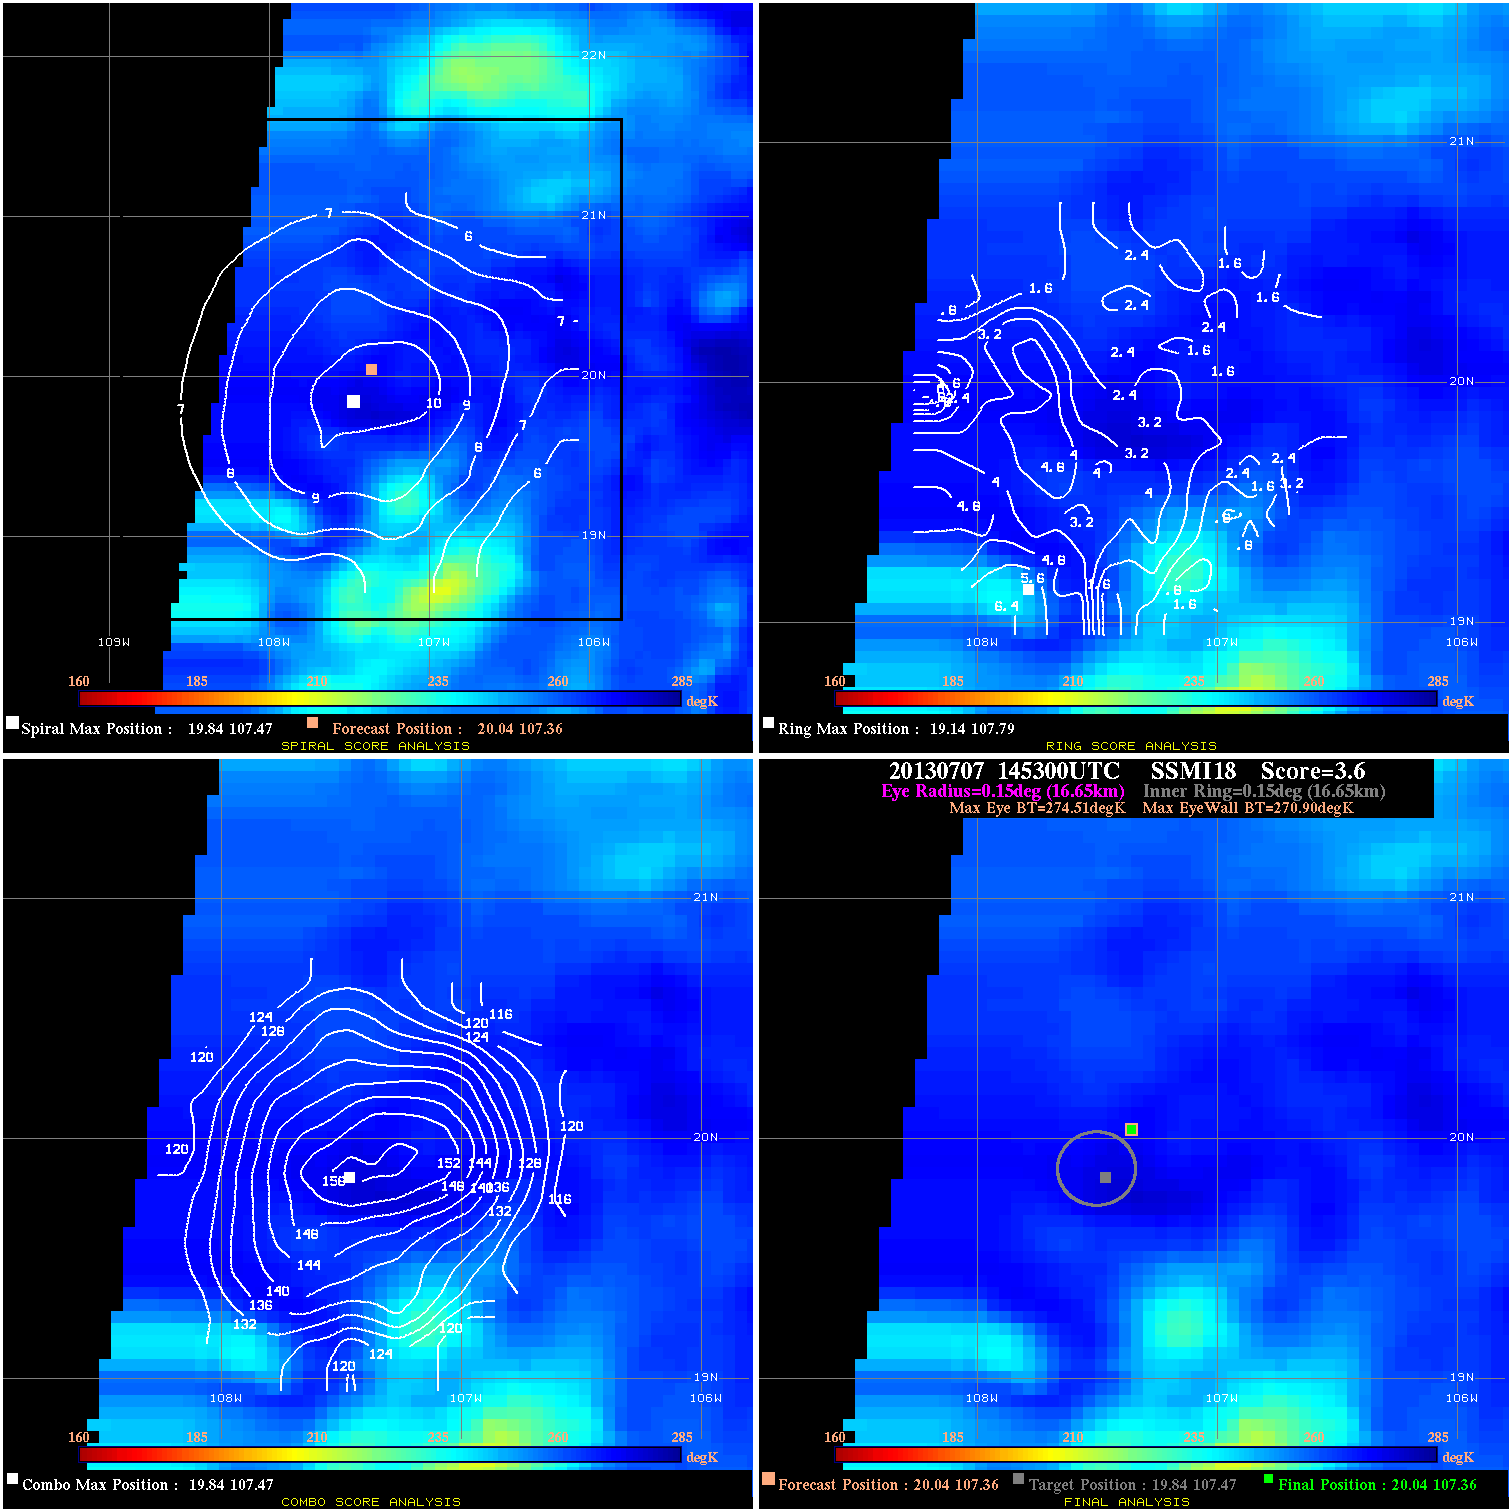
20130707 145300 3.6 N/A N/A 33.33 3.61 65.0 SSMI18 20.0 107.4 20.0 107.4 19.8 107.5 Analysis Plot
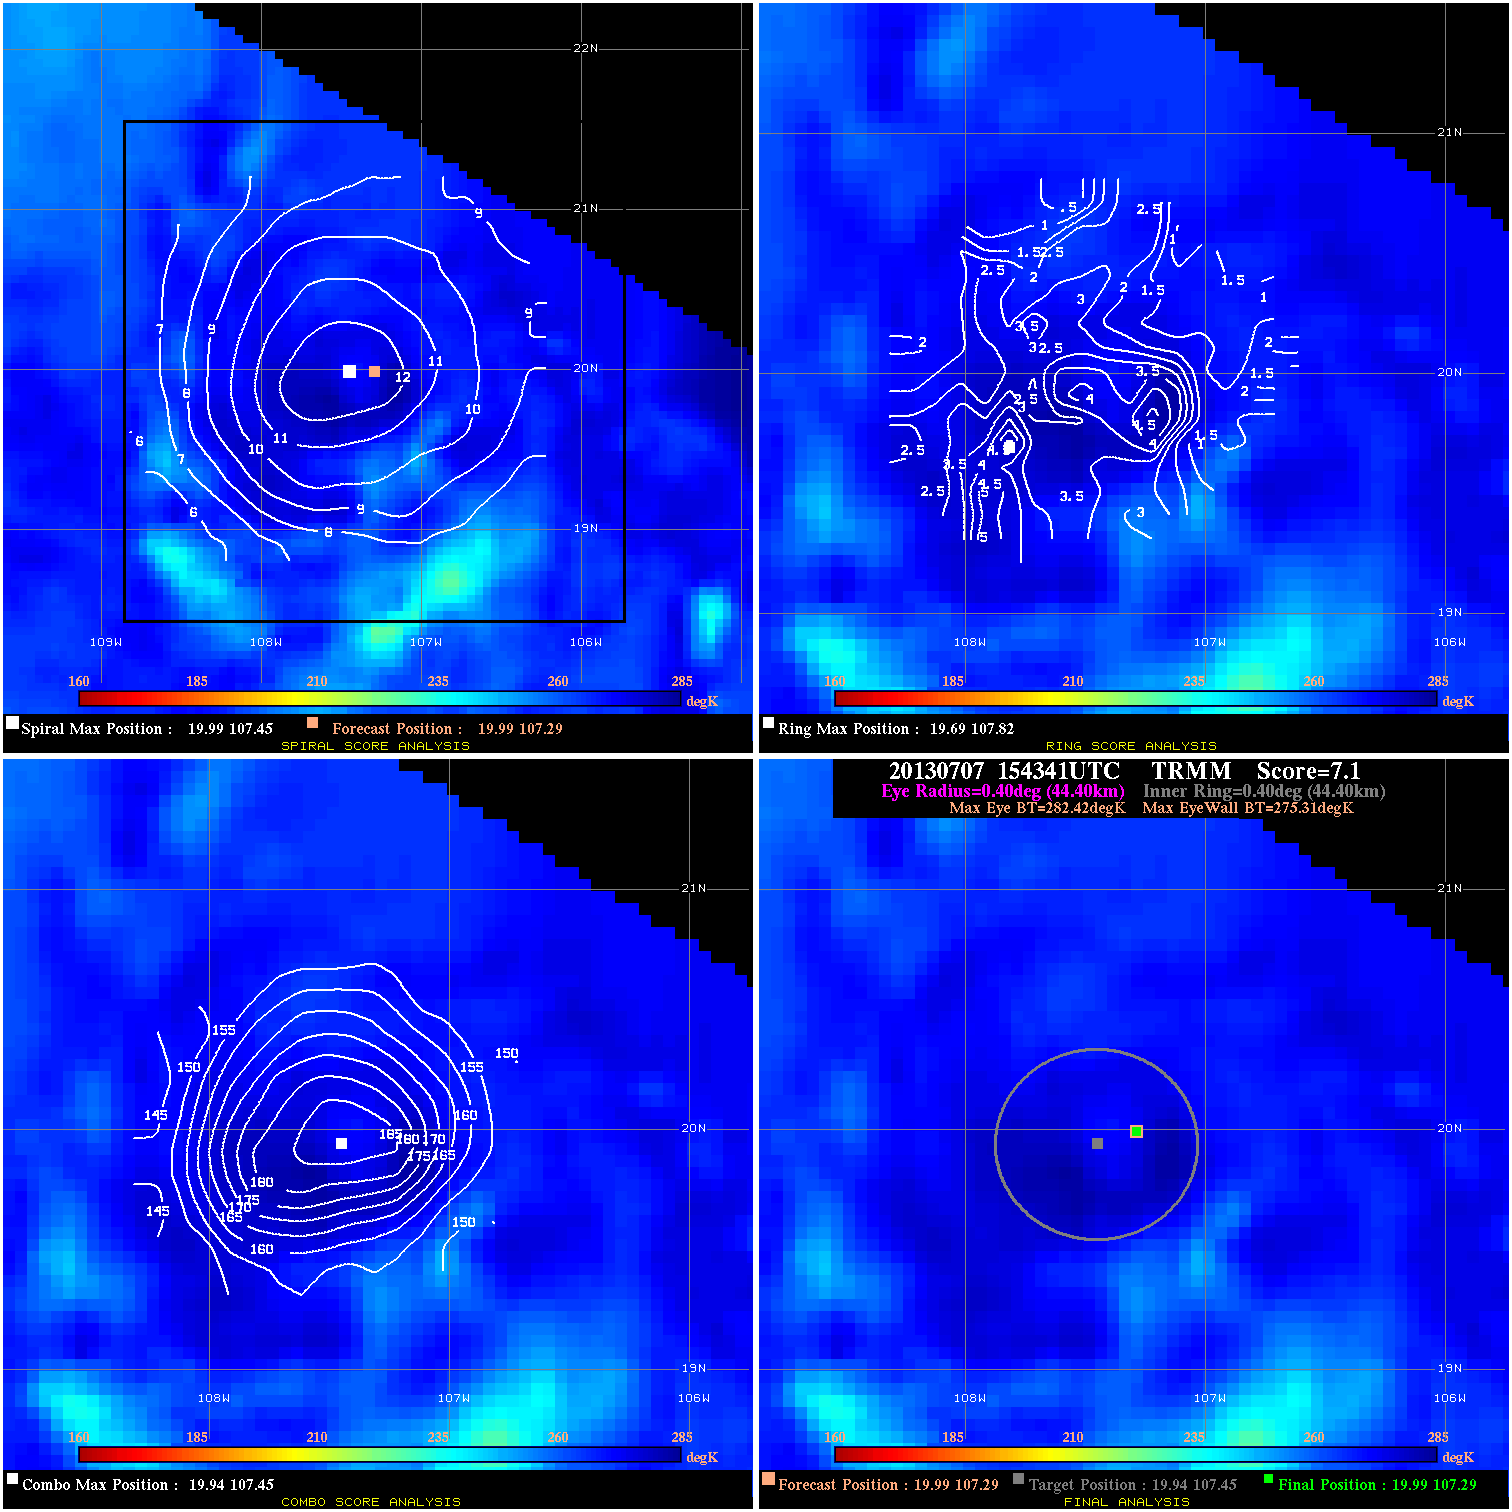
20130707 154341 7.1 N/A N/A 88.88 7.11 65.0 TRMM 20.0 107.3 20.0 107.3 19.9 107.5 Analysis Plot
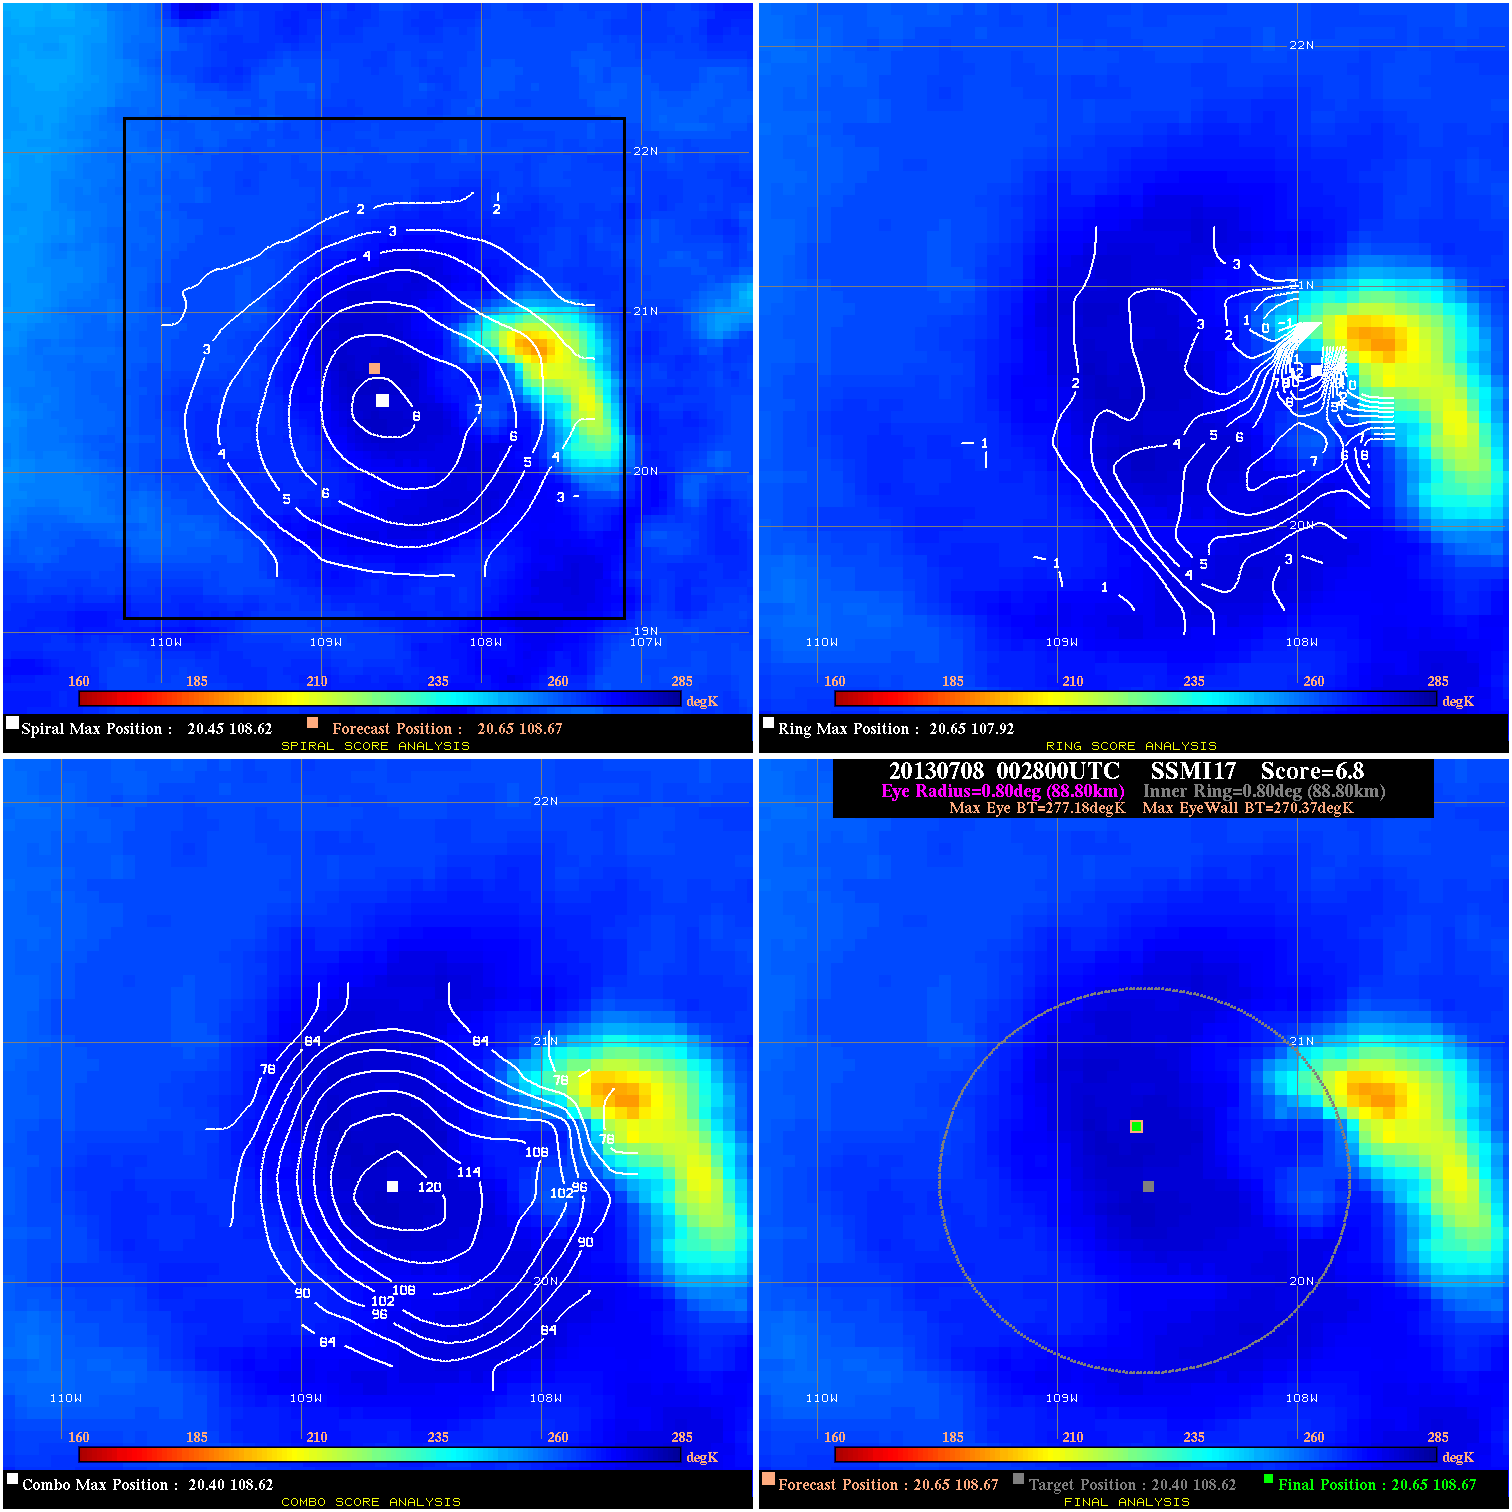
20130708 002800 6.8 N/A 12.3% 177.76 6.83 55.0 SSMI17 20.5 108.4 20.5 108.4 20.4 108.6 Analysis Plot
20130708 002800 6.8 N/A 13.7% 177.76 6.81 55.0 SSMI17 20.6 108.7 20.6 108.7 20.4 108.6 Analysis Plot
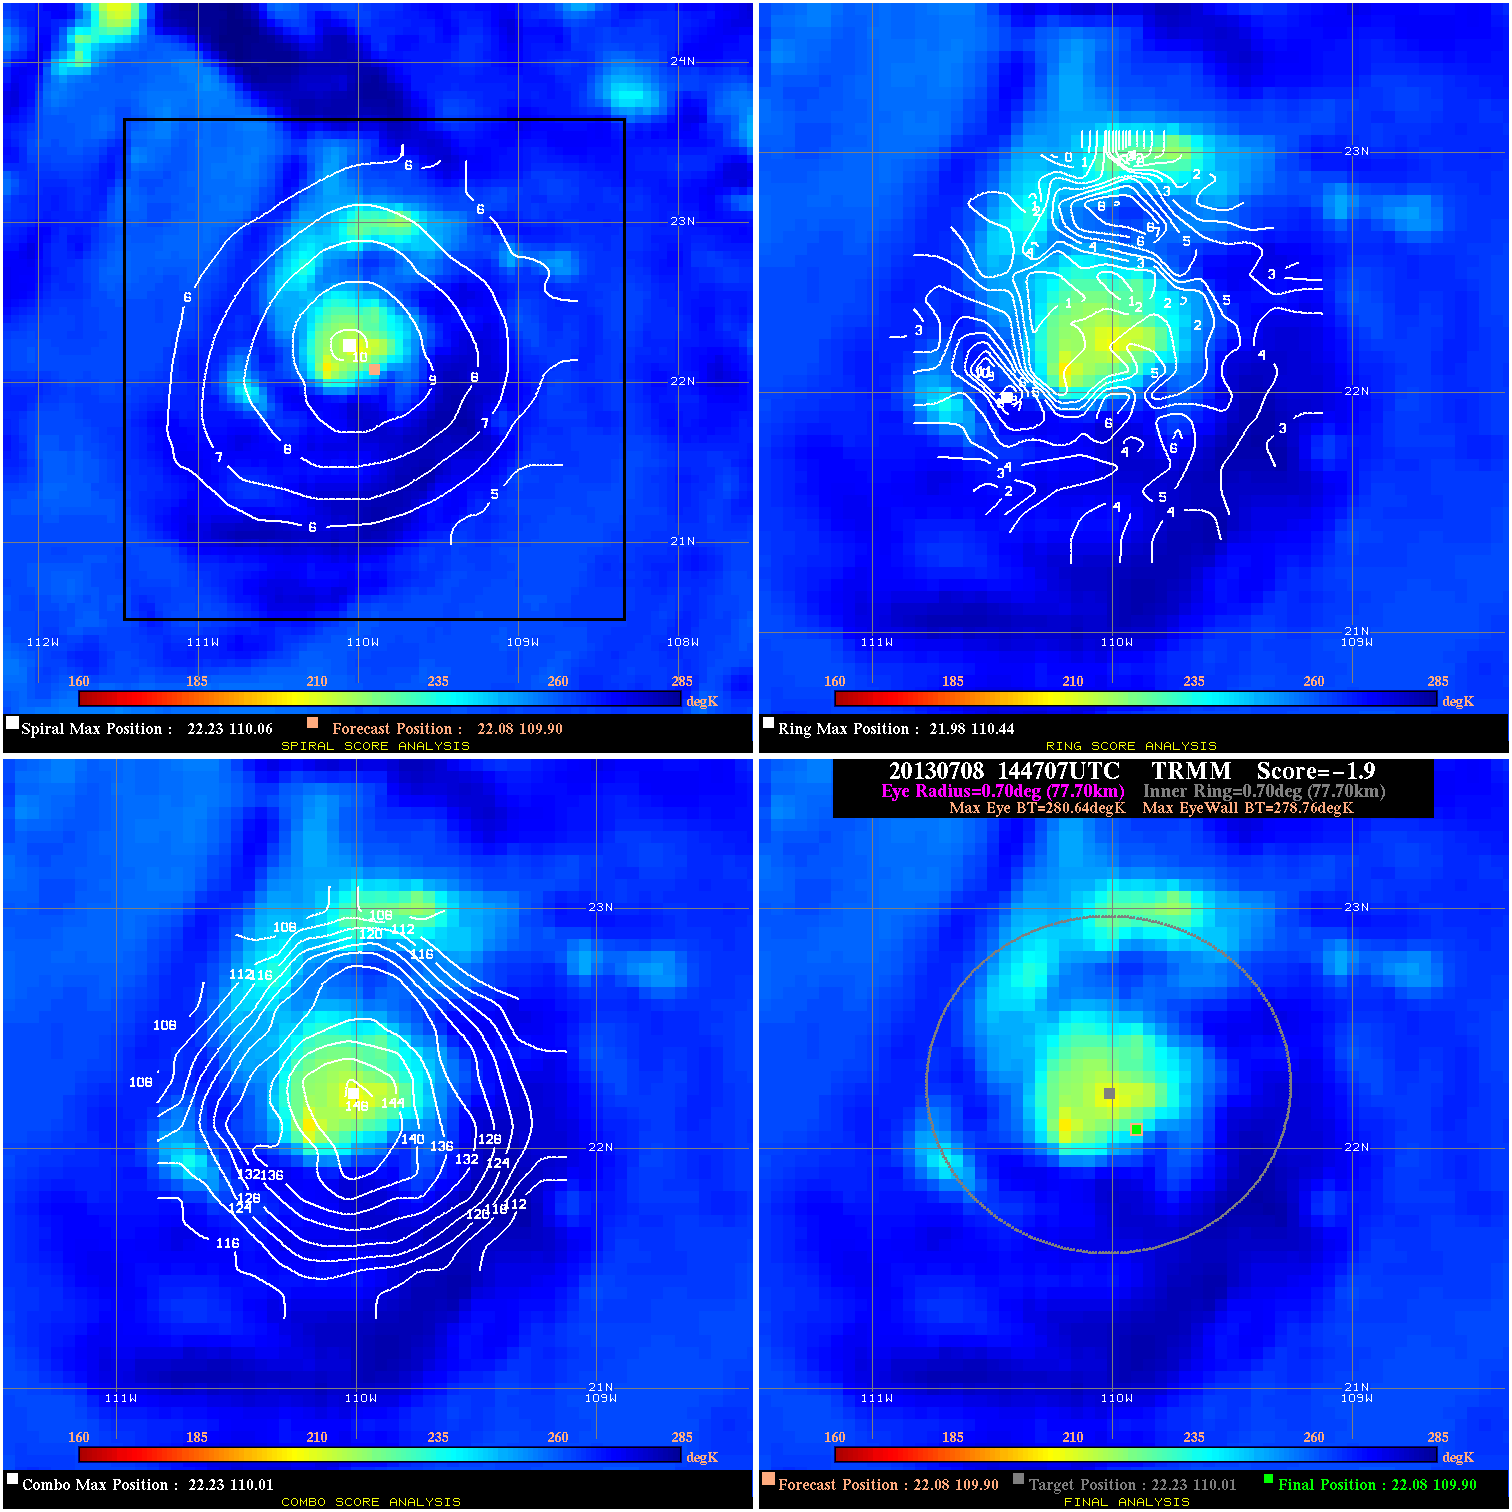
20130708 144707 -1.9 N/A N/A 155.54 1.88 40.0 TRMM 22.1 109.9 22.1 109.9 22.2 110.0 Analysis Plot
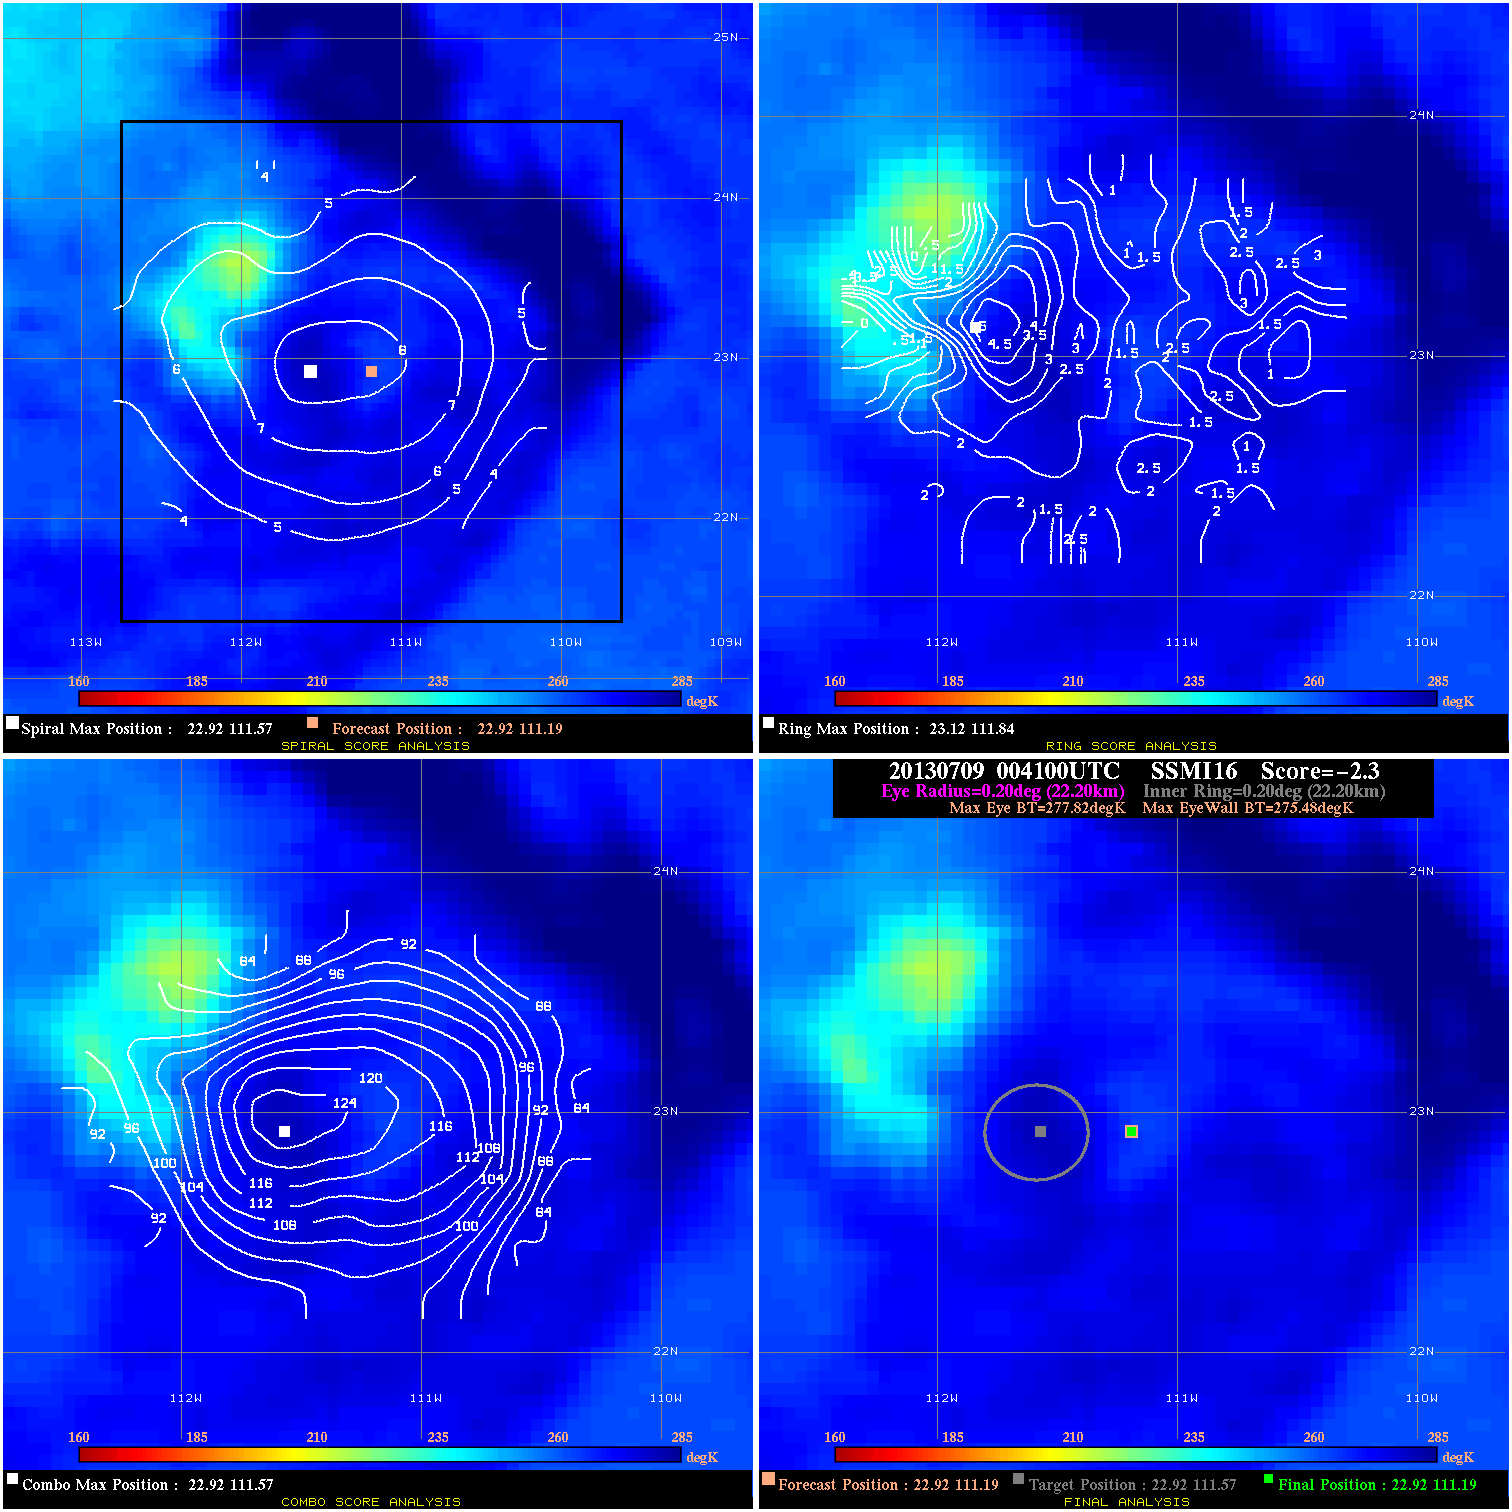
20130709 004100 -2.3 N/A N/A 44.44 2.34 40.0 SSMI16 22.9 111.2 22.9 111.2 22.9 111.6 Analysis Plot
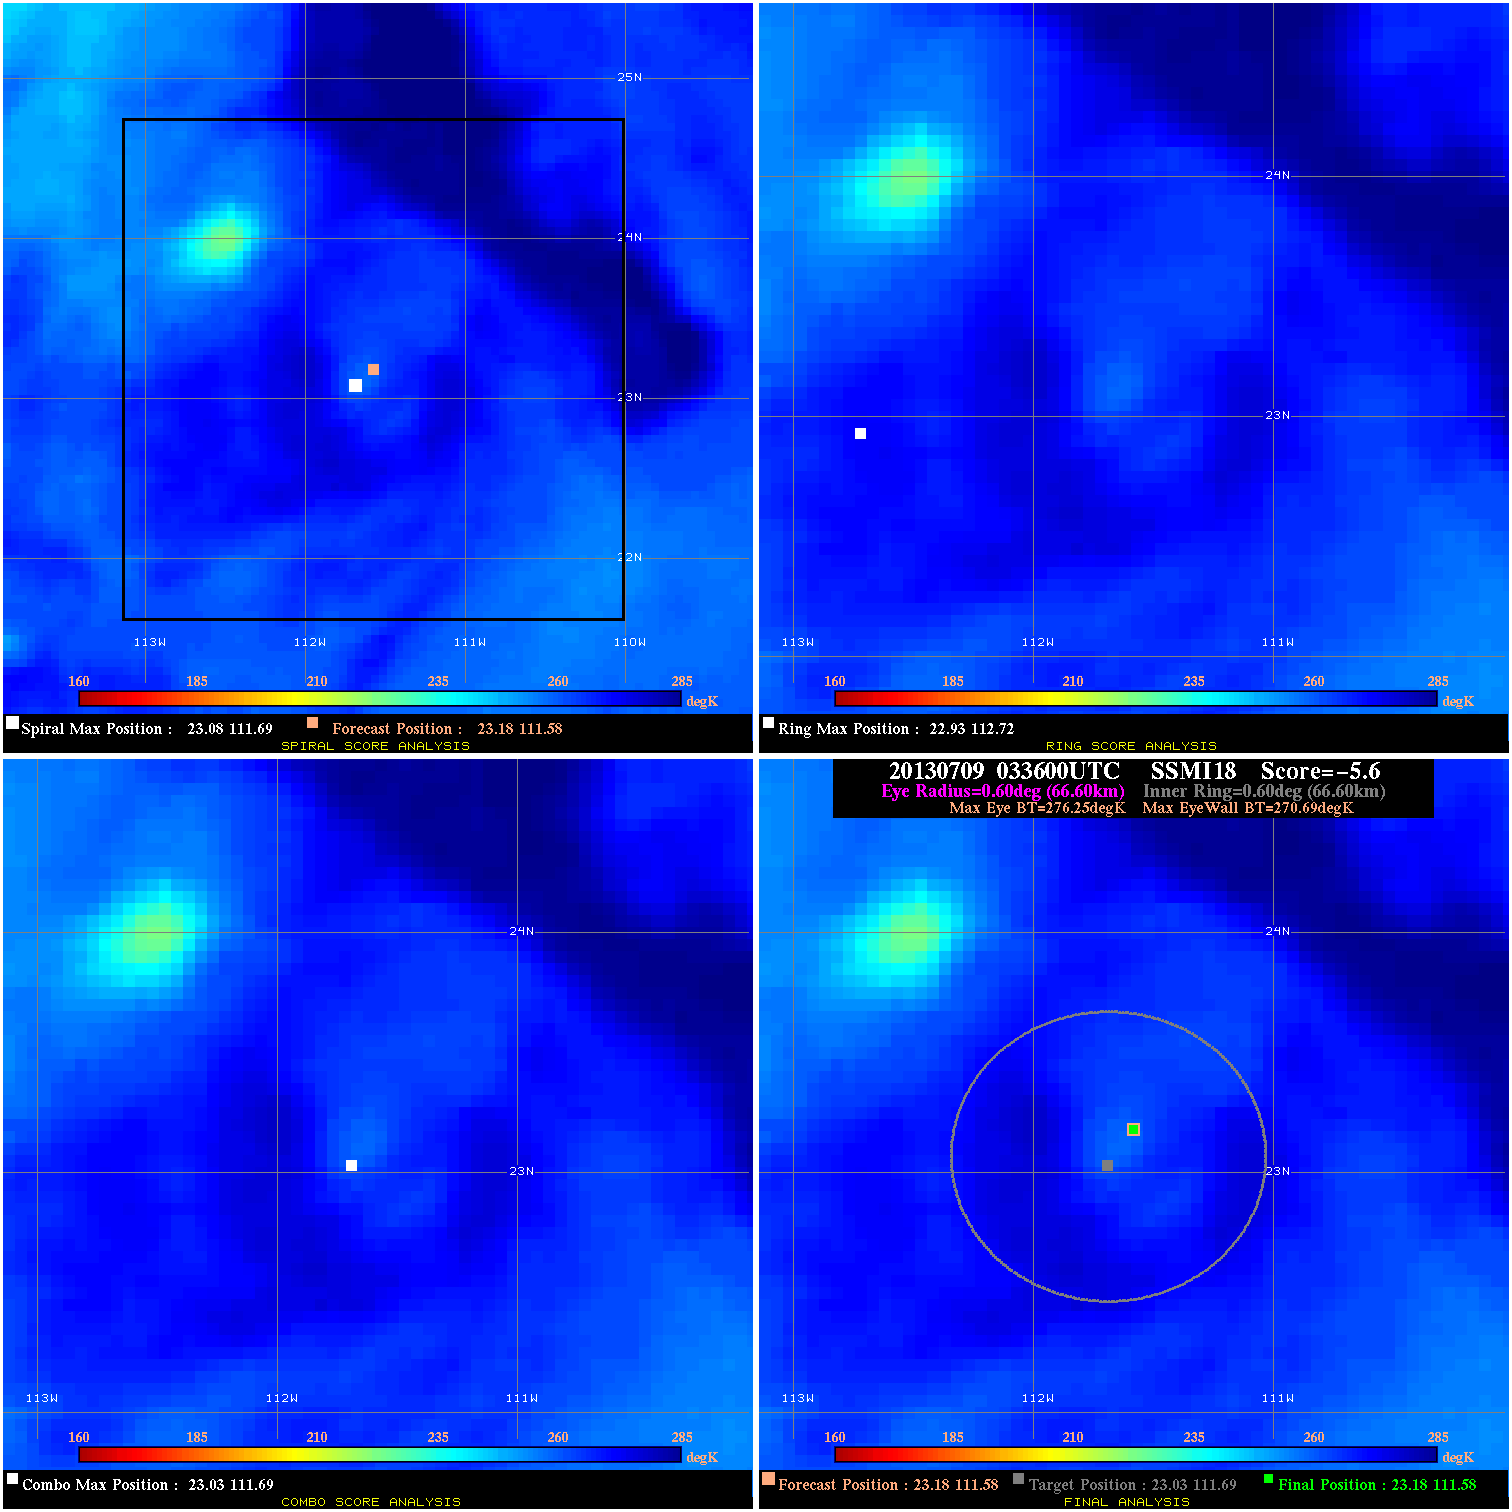
20130709 033600 -5.6 N/A N/A 133.32 5.56 35.0 SSMI18 23.2 111.6 23.2 111.6 23.0 111.7 Analysis Plot
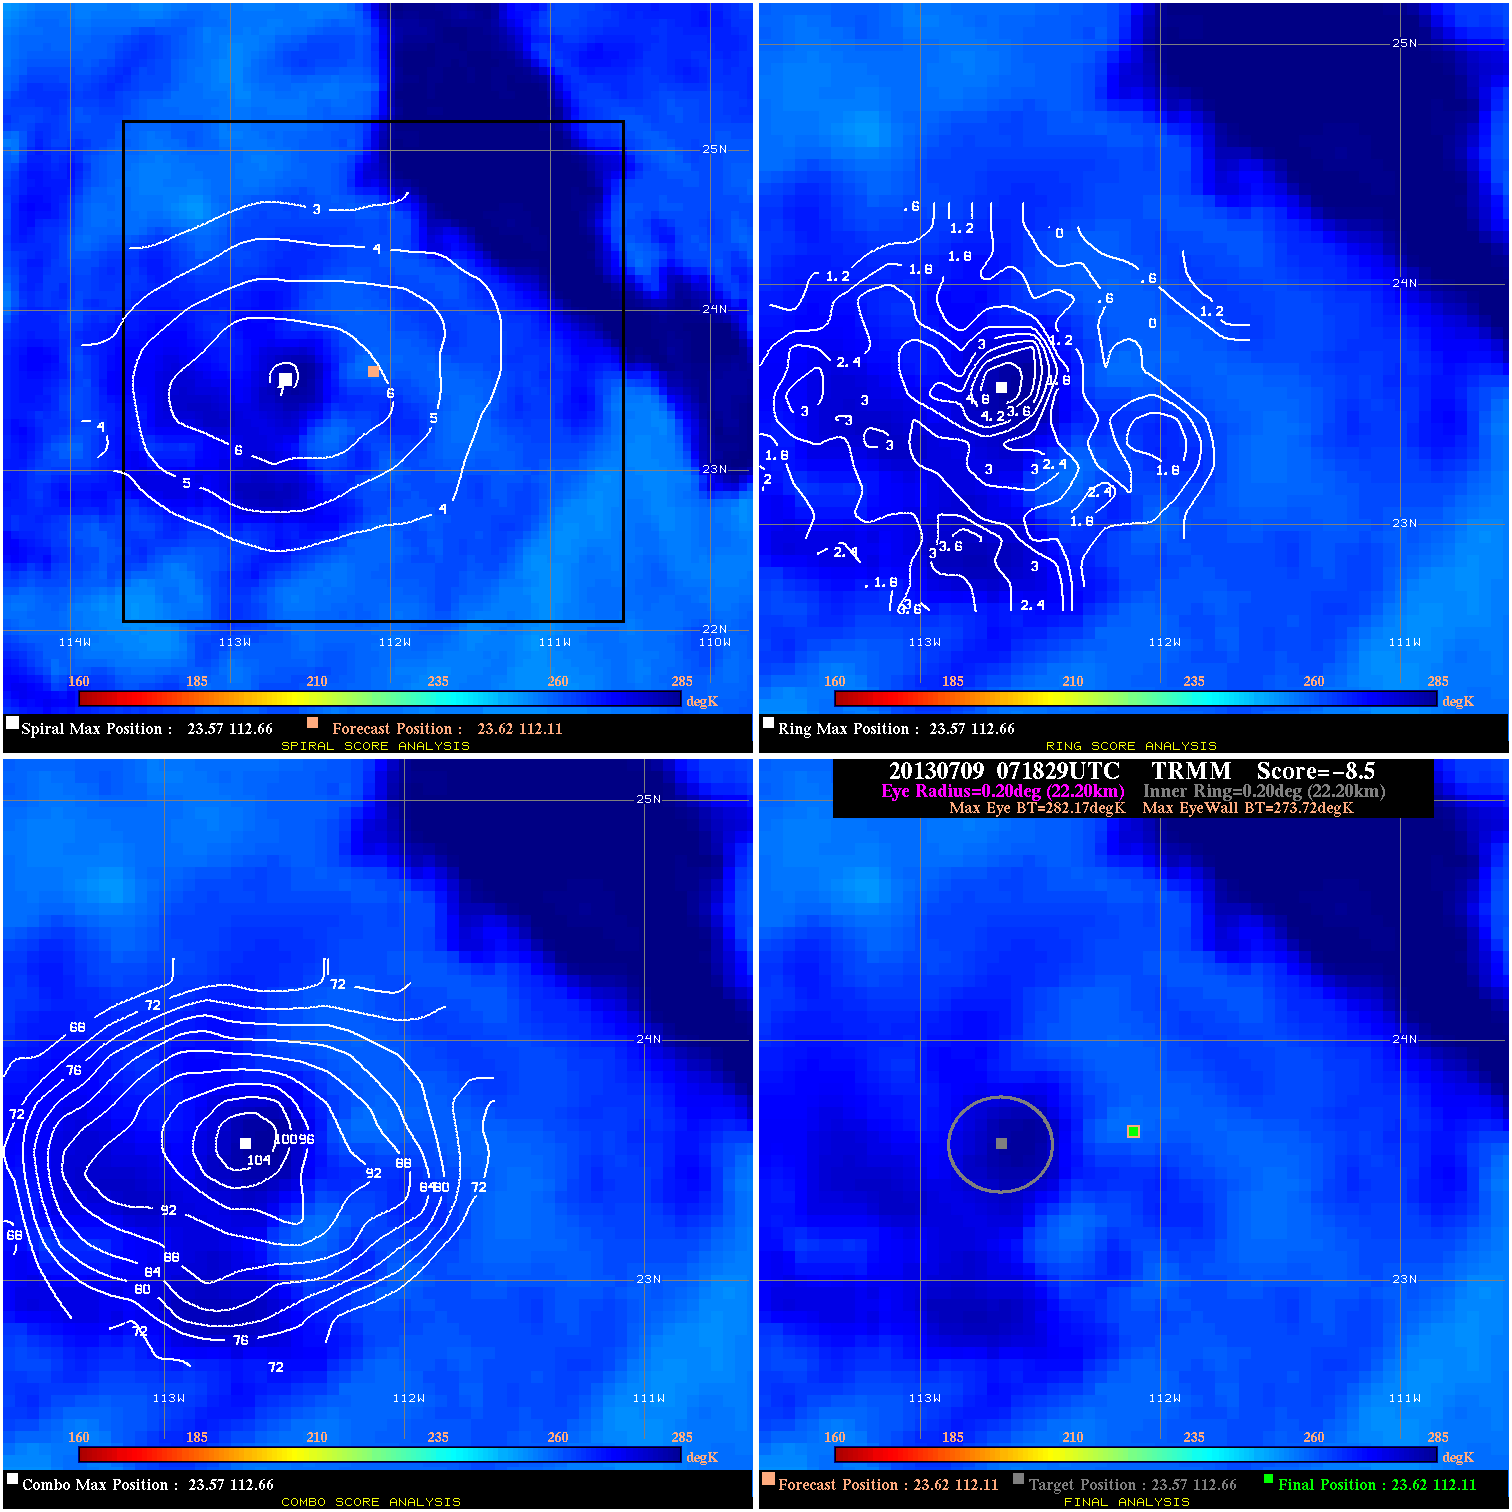
20130709 071829 -8.5 N/A N/A 44.44 8.45 35.0 TRMM 23.6 112.1 23.6 112.1 23.6 112.7 Analysis Plot
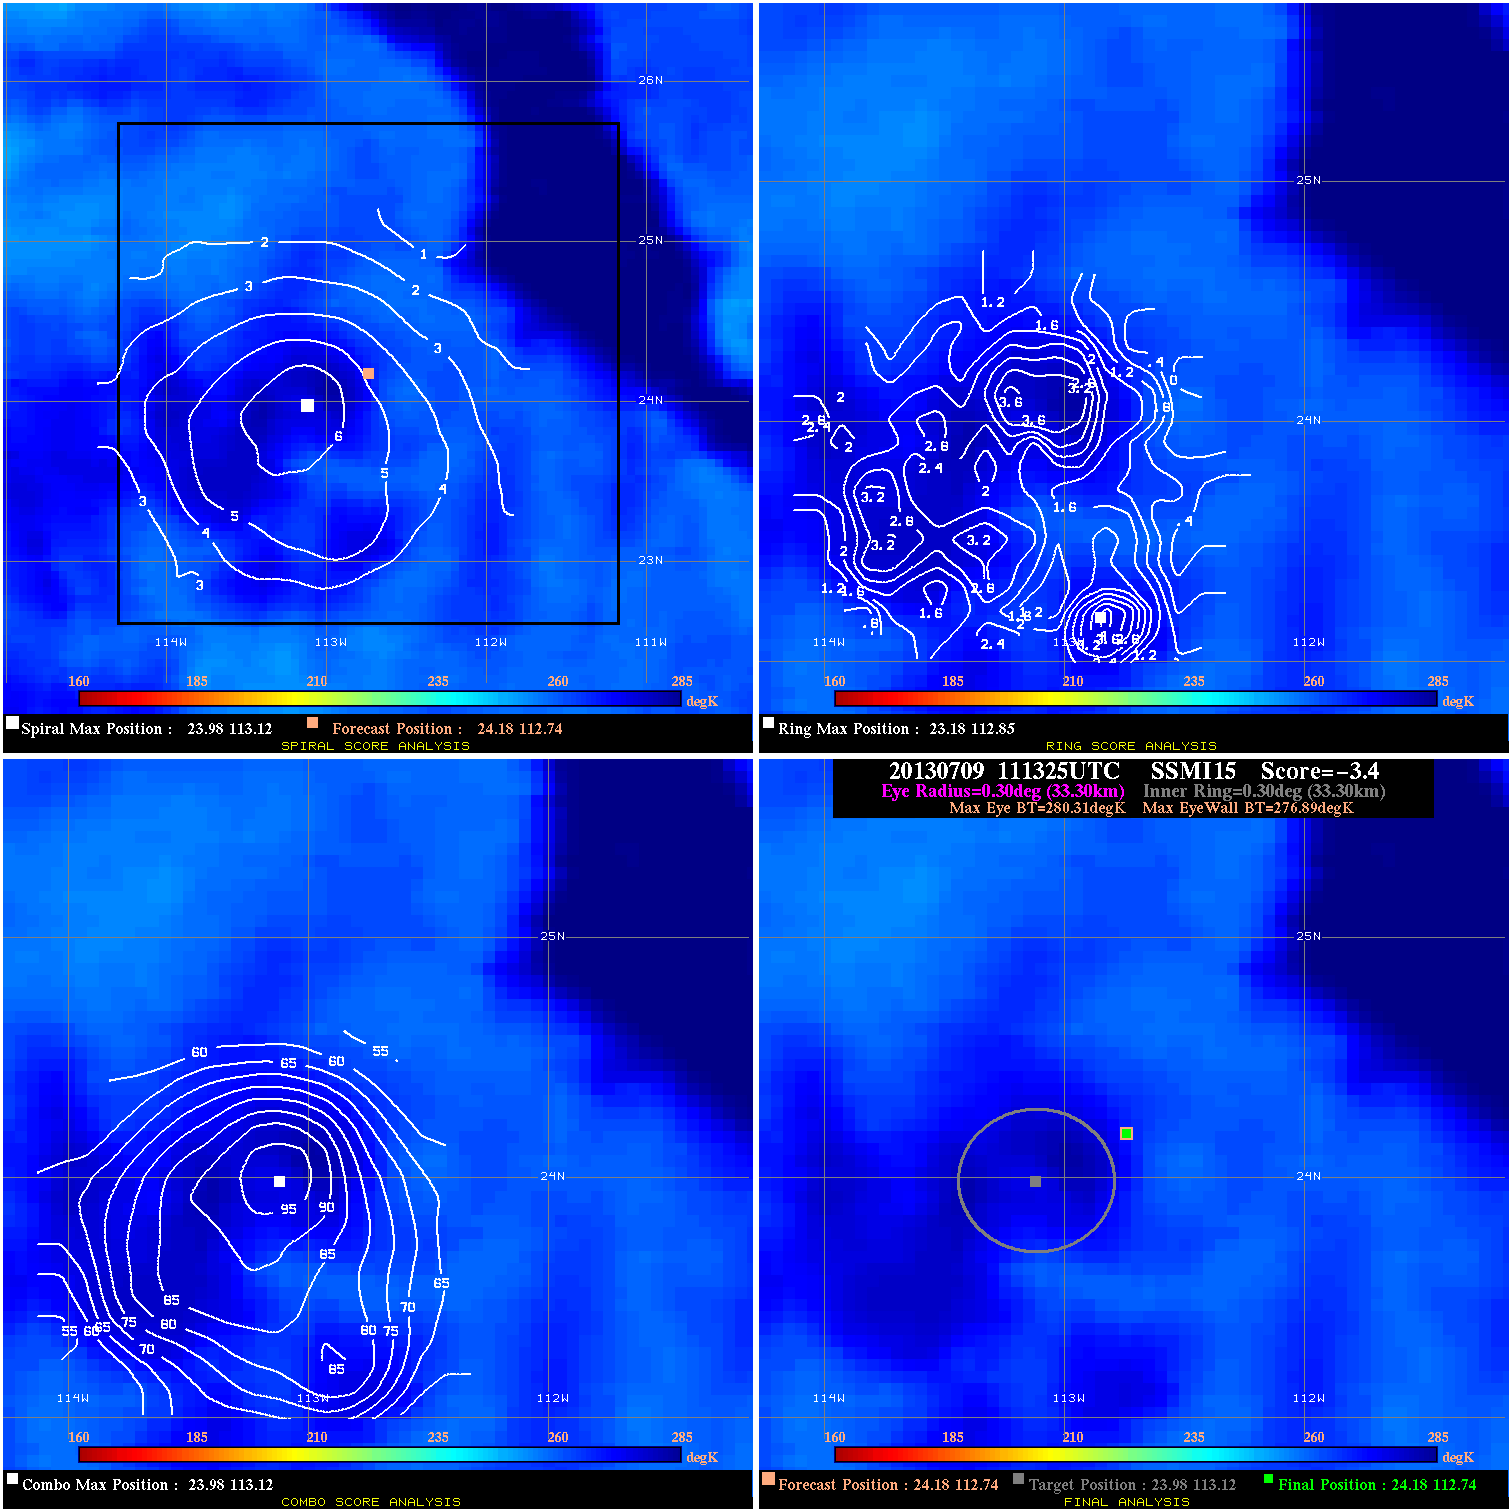
20130709 111325 -3.4 N/A N/A 66.66 3.42 30.0 SSMI15 24.2 112.7 24.2 112.7 24.0 113.1 Analysis Plot
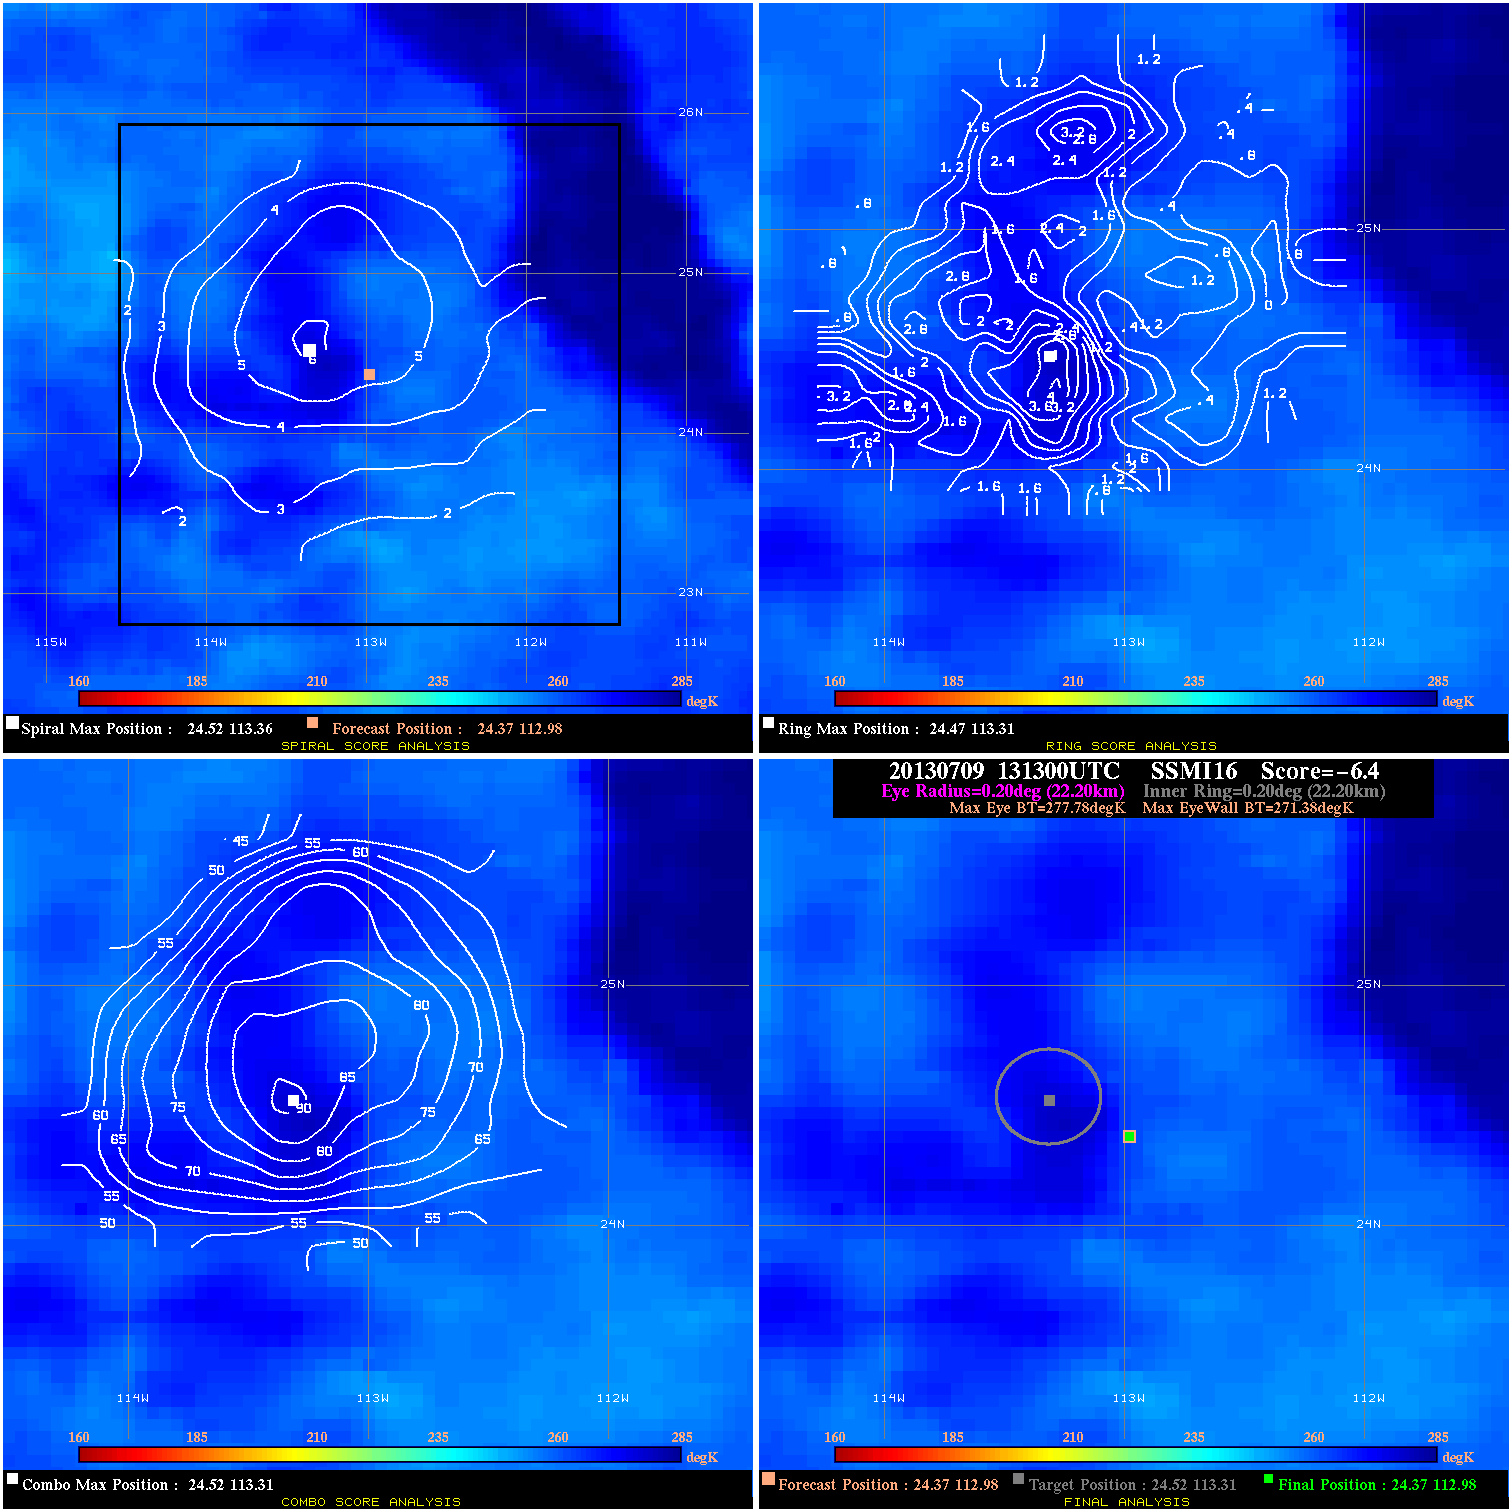
20130709 131300 -6.4 N/A N/A 44.44 6.40 30.0 SSMI16 24.4 113.0 24.4 113.0 24.5 113.3 Analysis Plot
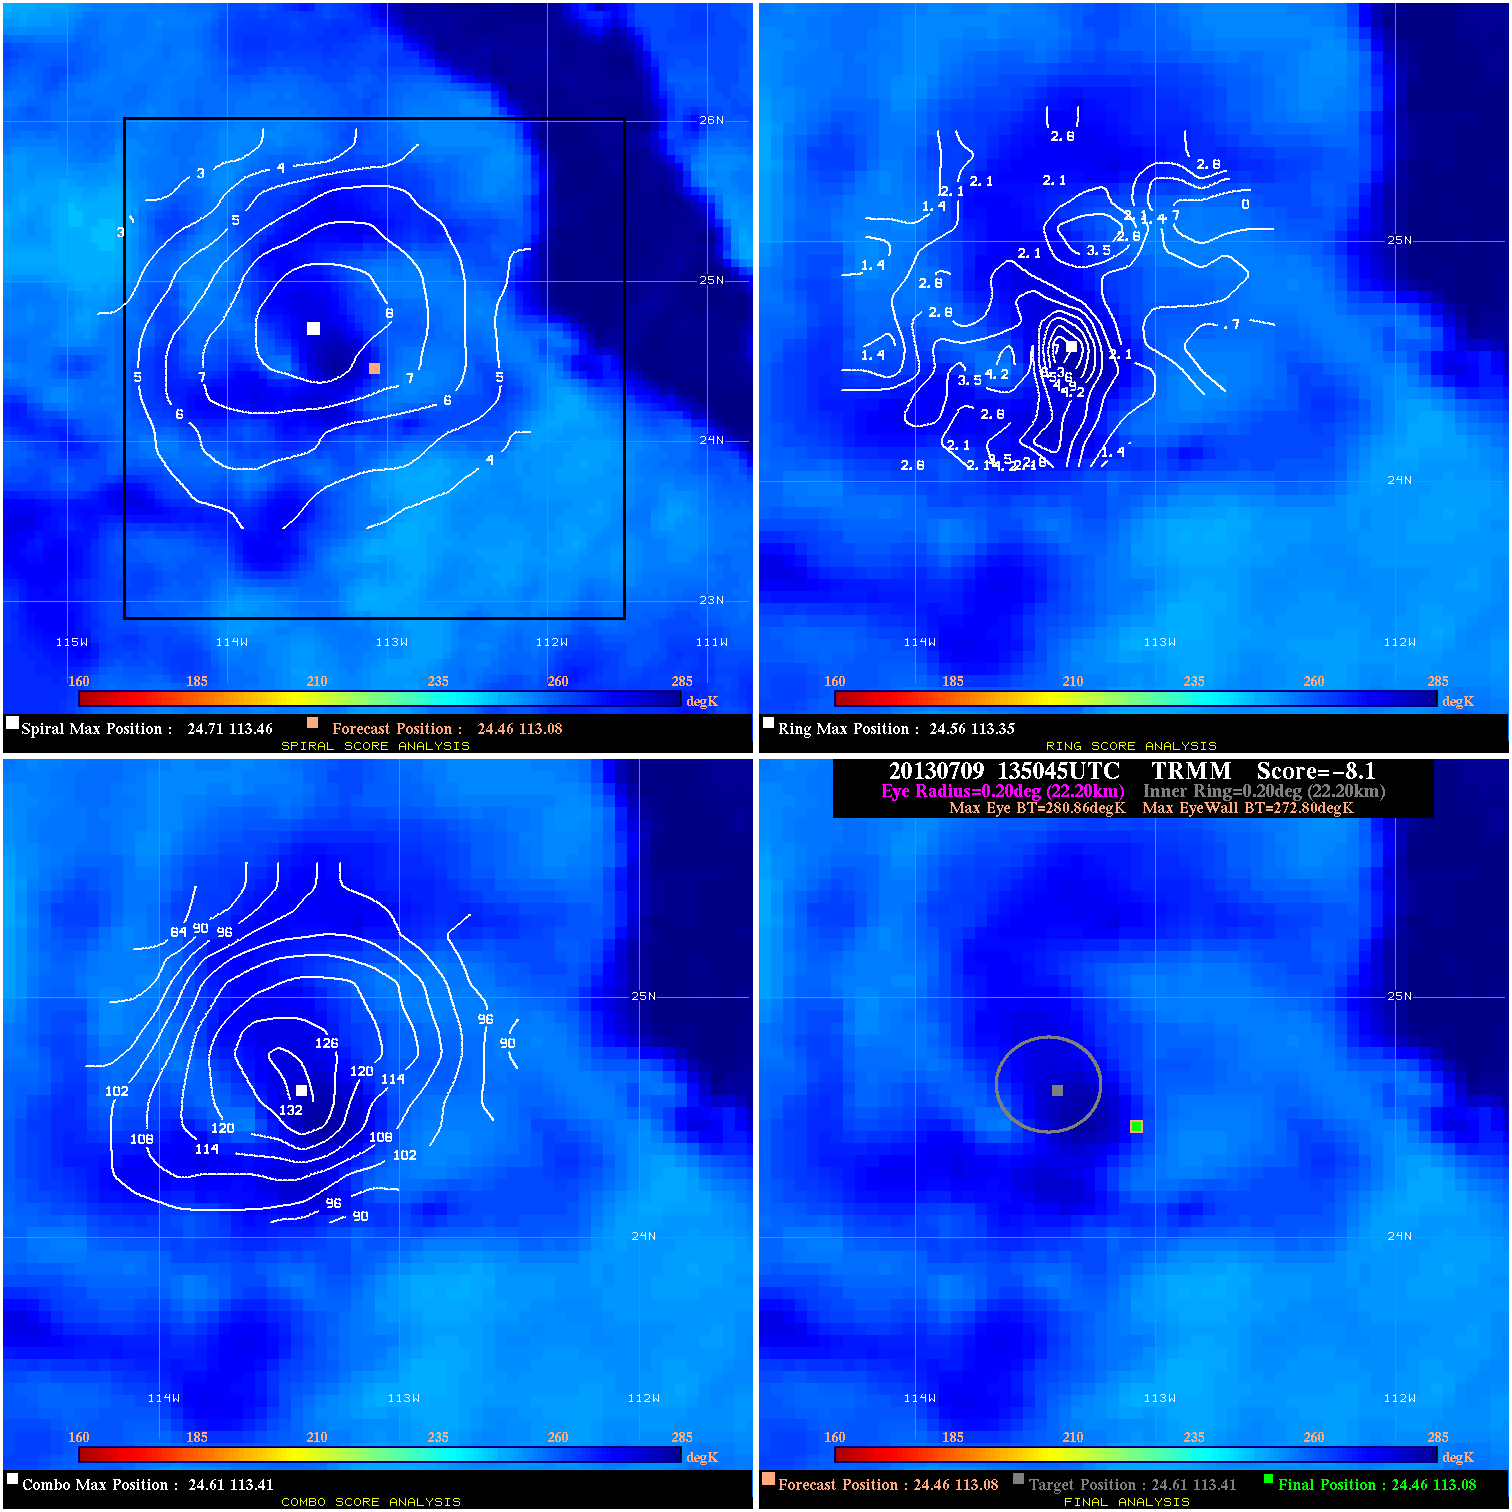
20130709 135045 -8.1 N/A N/A 44.44 8.06 30.0 TRMM 24.5 113.1 24.5 113.1 24.6 113.4 Analysis Plot
|
|
Legend: - Date/Time are determined from PMW imagery at Forecast (initial guess) Lat/Lon position. - Positive/Negative Latitude = North/South Hemisphere; Longitude = Western/Eastern Hemisphere. - "Ring Diam" value indicates the estimated surface eyewall diameter in km (the MI eyewall edge diameter minus 10 km). - "Ring Pct" is the percentage of the "ring" (eyewall inner boundary) that is 1) colder than the "hot spot" (warmest eye pixel) in the eye by 20K, or 2) the percentage that is a) colder than 232K and b) colder than the "hot spot" by 10K, whichever is greater. - Values are red if Ring % <= 65, yellow/brown if Ring % <= 85 and green if Ring % > 85. - "Tb diff" is the difference between the "hot spot" (warmest eye pixel) and the warmest pixel on the eyewall. - Intensity score are listed as negative, and not used, when the JTWC or NHC estimated Vmax is <55 kts in order to rule out weak but highly symmetric TCs. - Error messages in intensity scores: -920 is used when the hottest pixel in the eye is <200K, to prevent false positives; -930 means <85% of eyewall has observations/data. |