Tropical Depression 15W
|
Passive Microwave (PMW) Intensity Information Advanced Dvorak Technique (ADT) Version 8.1.5 |
Overpass Inten Ring Ring Wind Forecast Final Target
Date Time Score Meaning Pct Diam BTdiff Est Sat Lat Lon Lat Lon Lat Lon
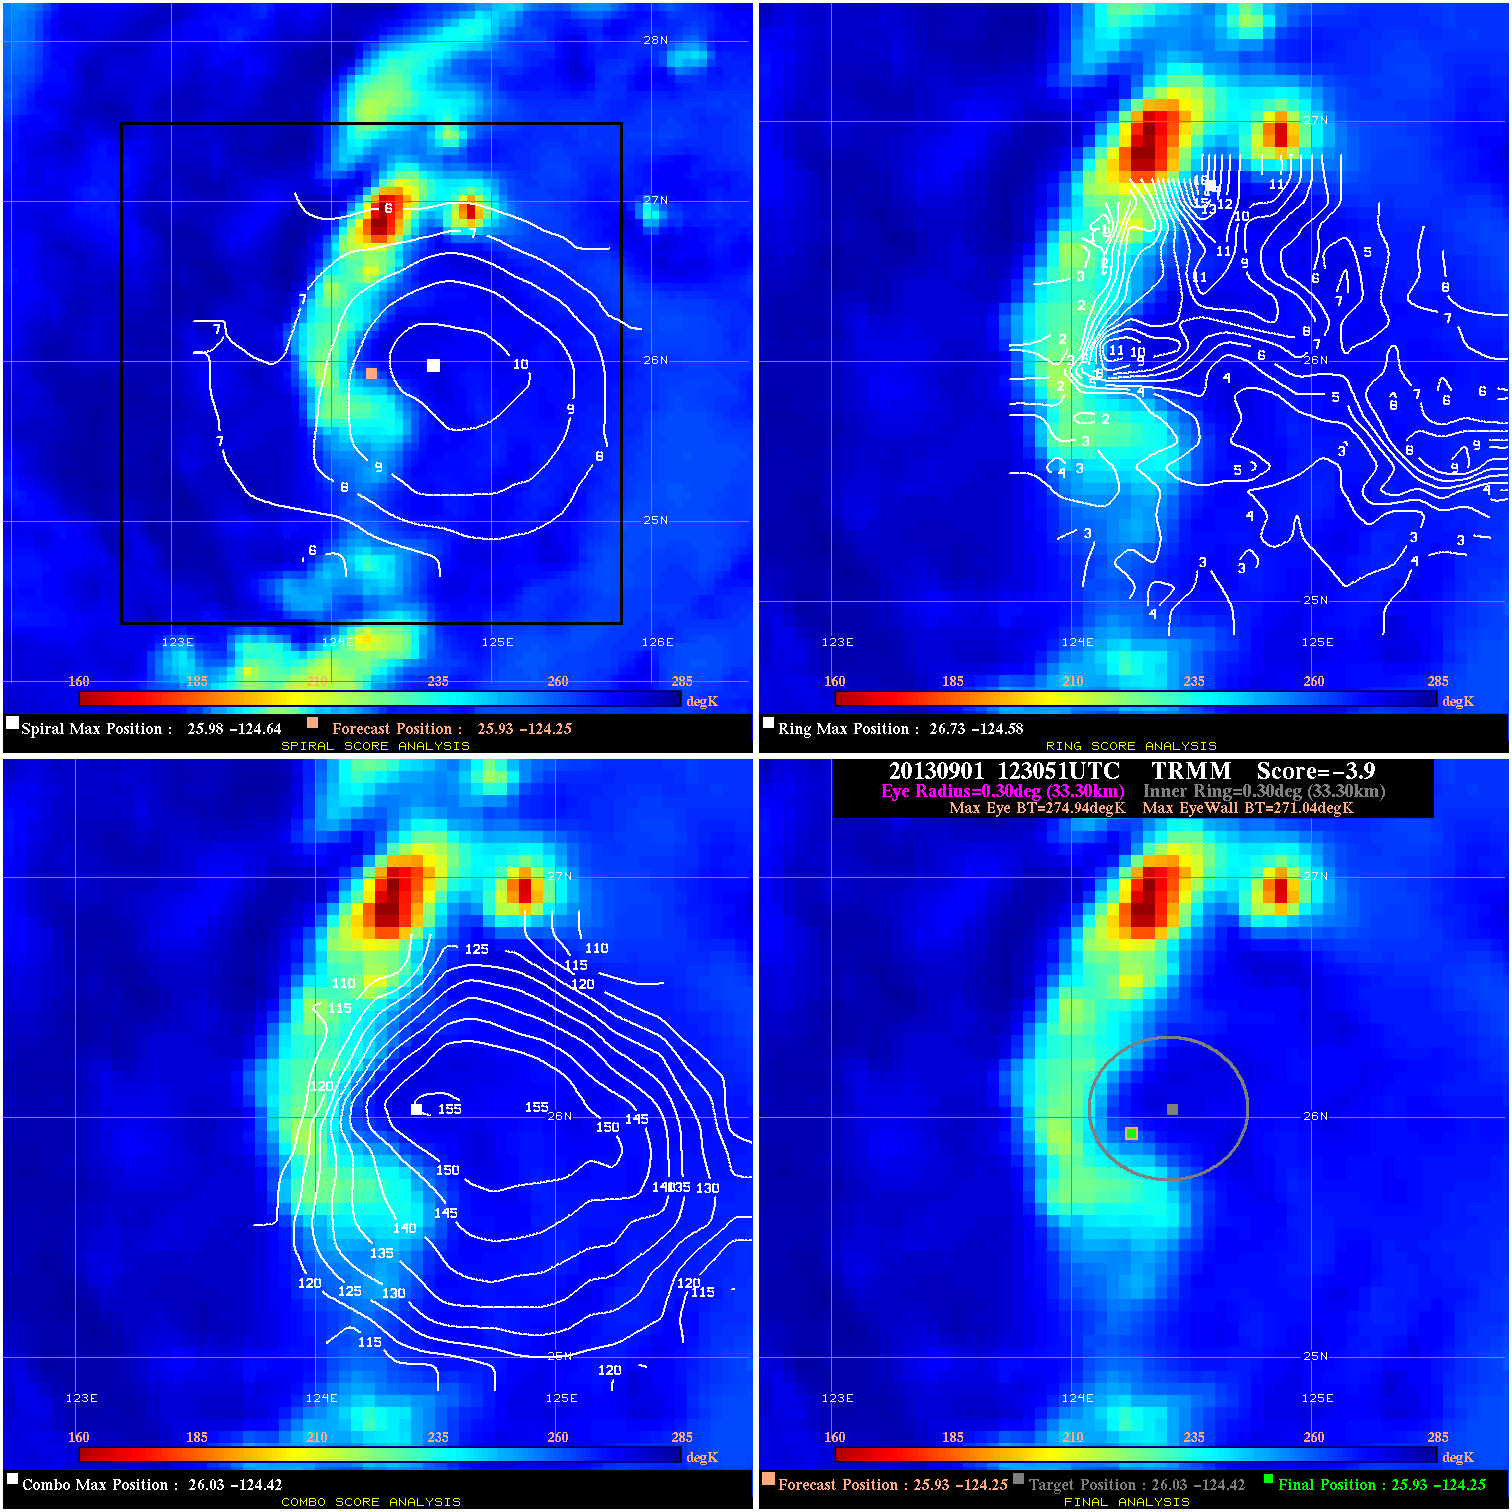
20130901 123051 -3.9 N/A 21.9% 66.66 3.90 25.0 TRMM 25.9 -124.3 25.9 -124.3 26.0 -124.4 Analysis Plot
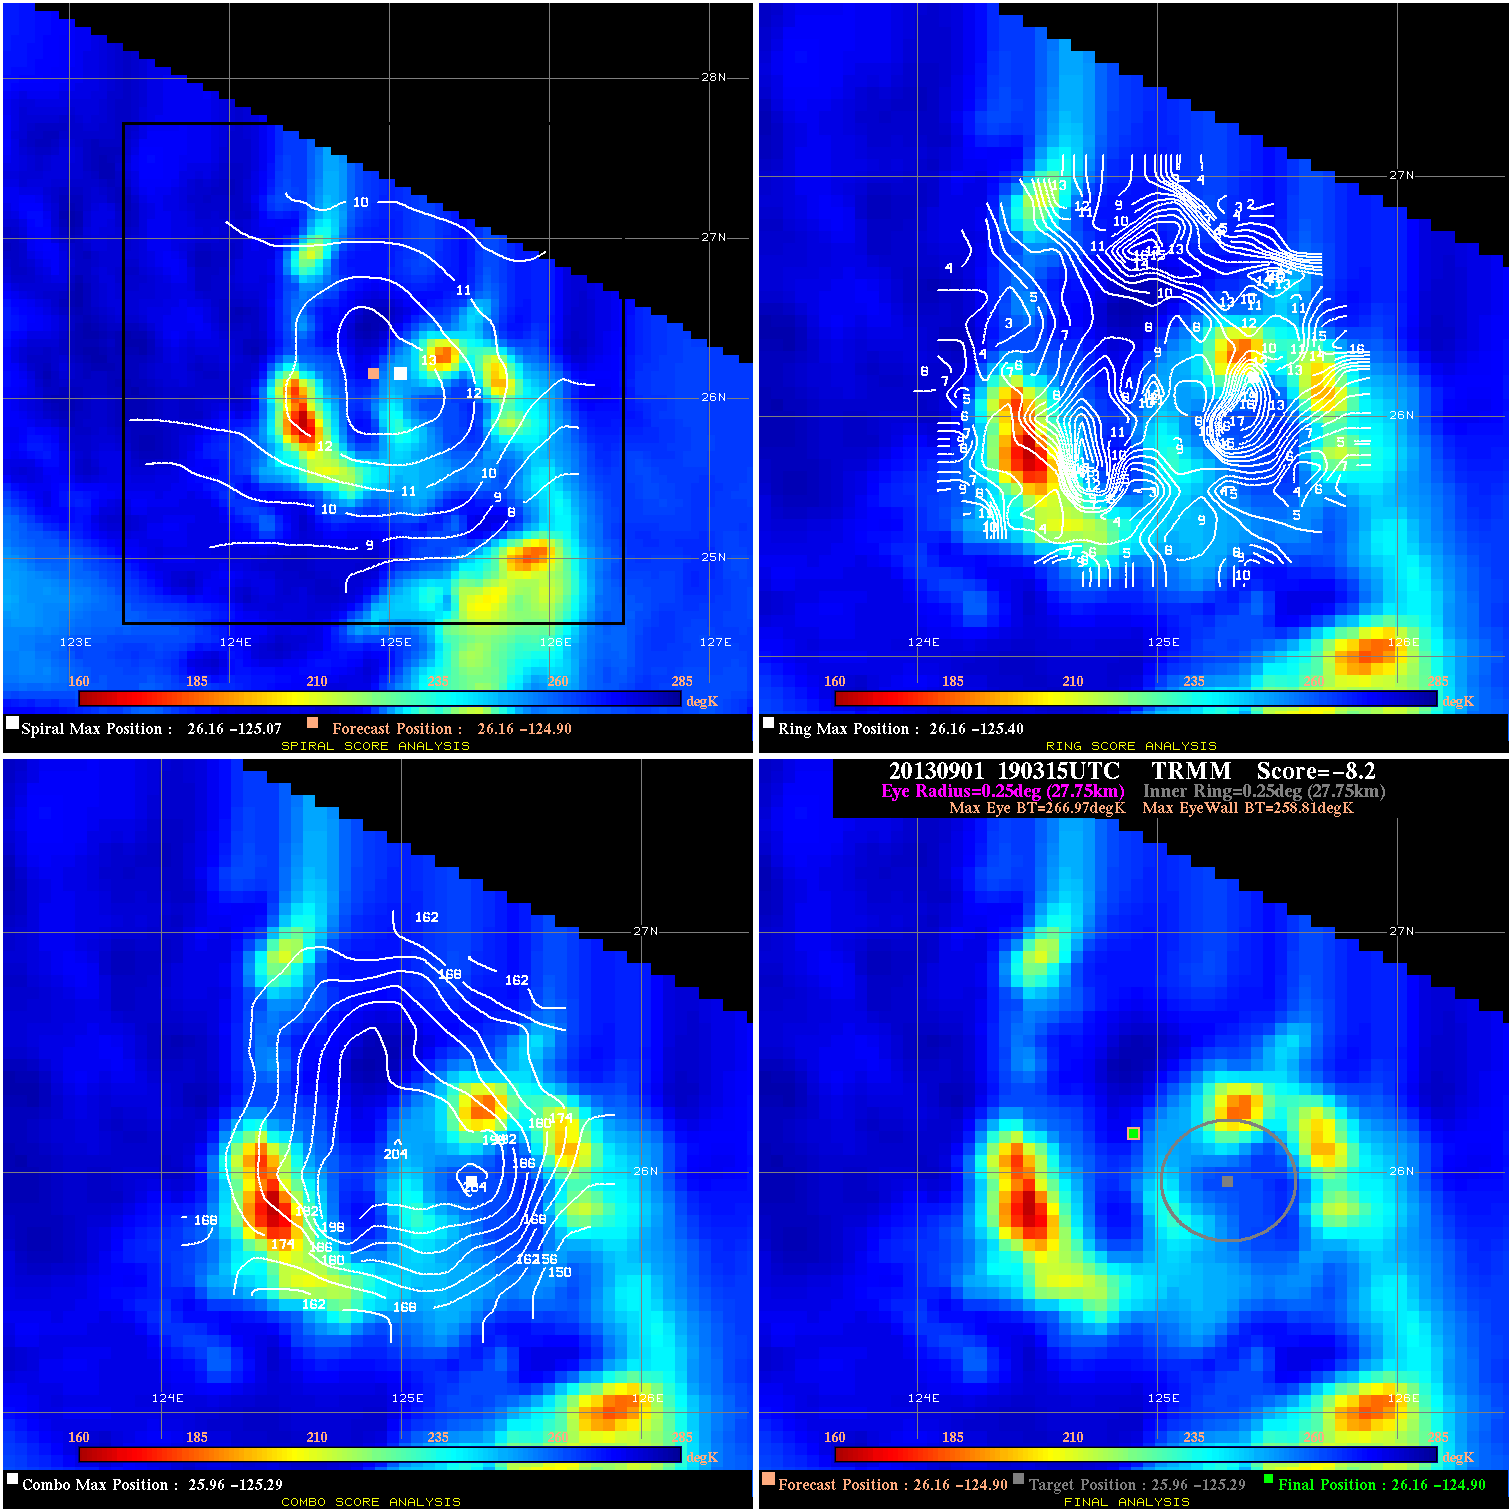
20130901 190315 -8.2 N/A 27.4% 55.55 8.16 30.0 TRMM 26.2 -124.9 26.2 -124.9 26.0 -125.3 Analysis Plot
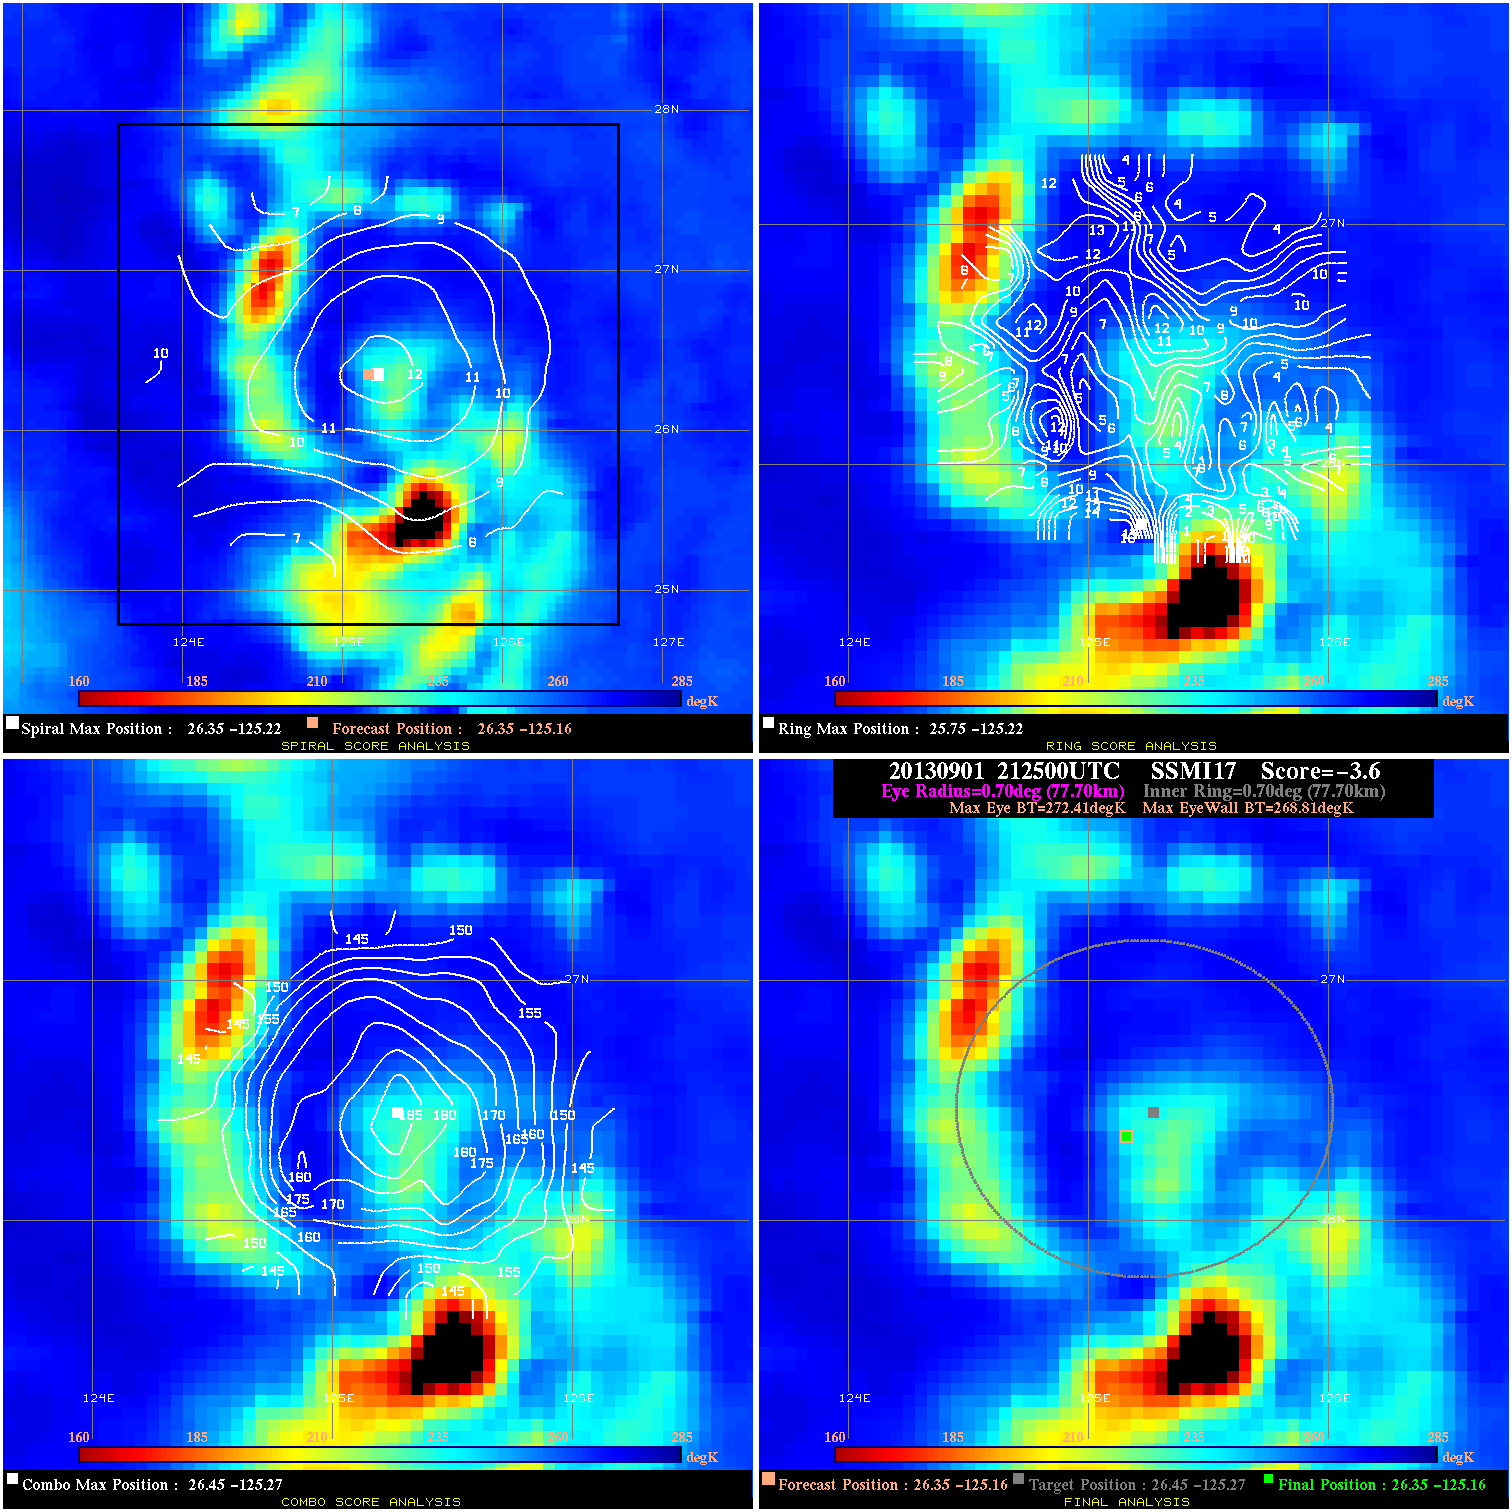
20130901 212500 -3.6 N/A 21.9% 155.54 3.60 30.0 SSMI17 26.4 -125.2 26.4 -125.2 26.5 -125.3 Analysis Plot
20130901 234400 -1.2 N/A 27.4% 122.21 1.18 30.0 SSMI18 26.5 -125.3 26.5 -125.3 26.7 -125.4 Analysis Plot
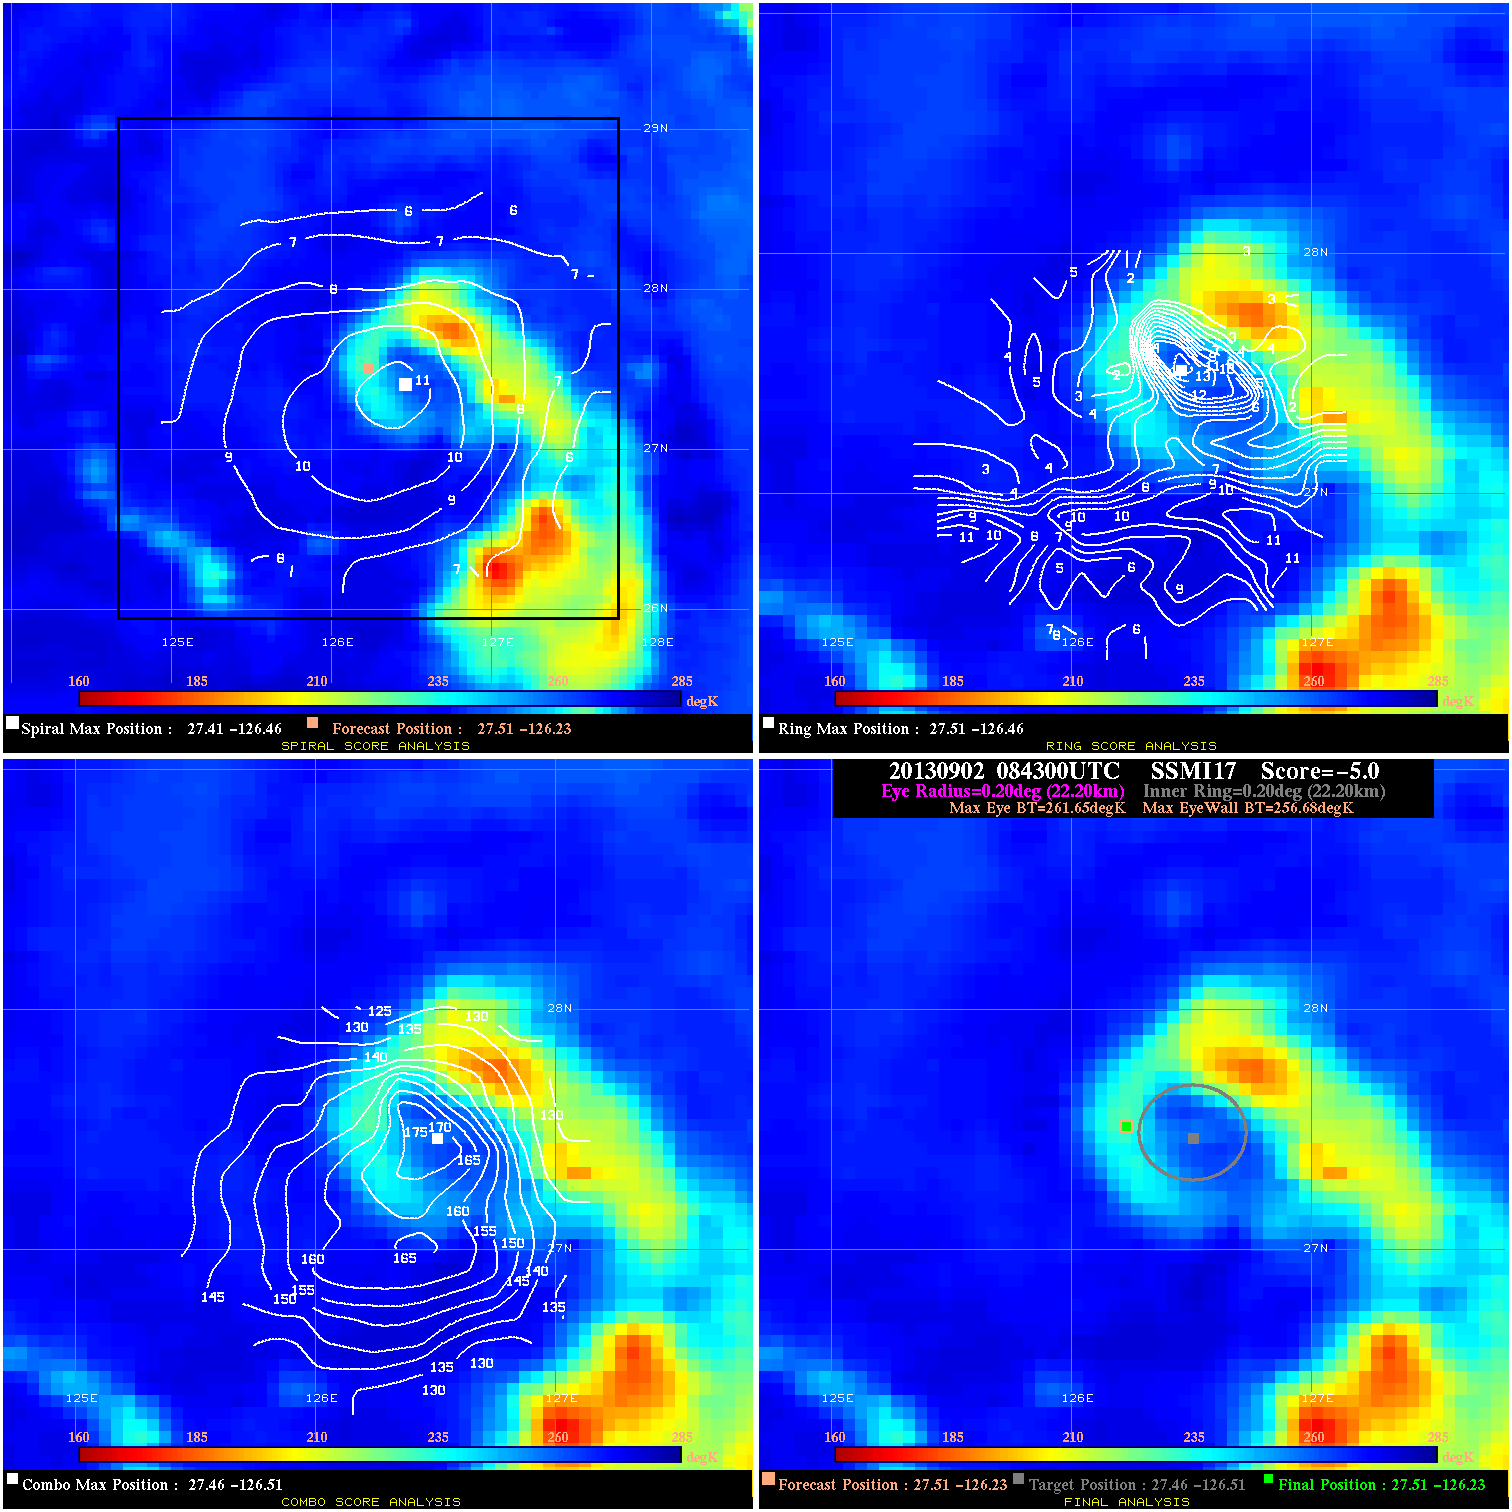
20130902 084300 -5.0 N/A 23.3% 44.44 4.97 35.0 SSMI17 27.5 -126.2 27.5 -126.2 27.5 -126.5 Analysis Plot
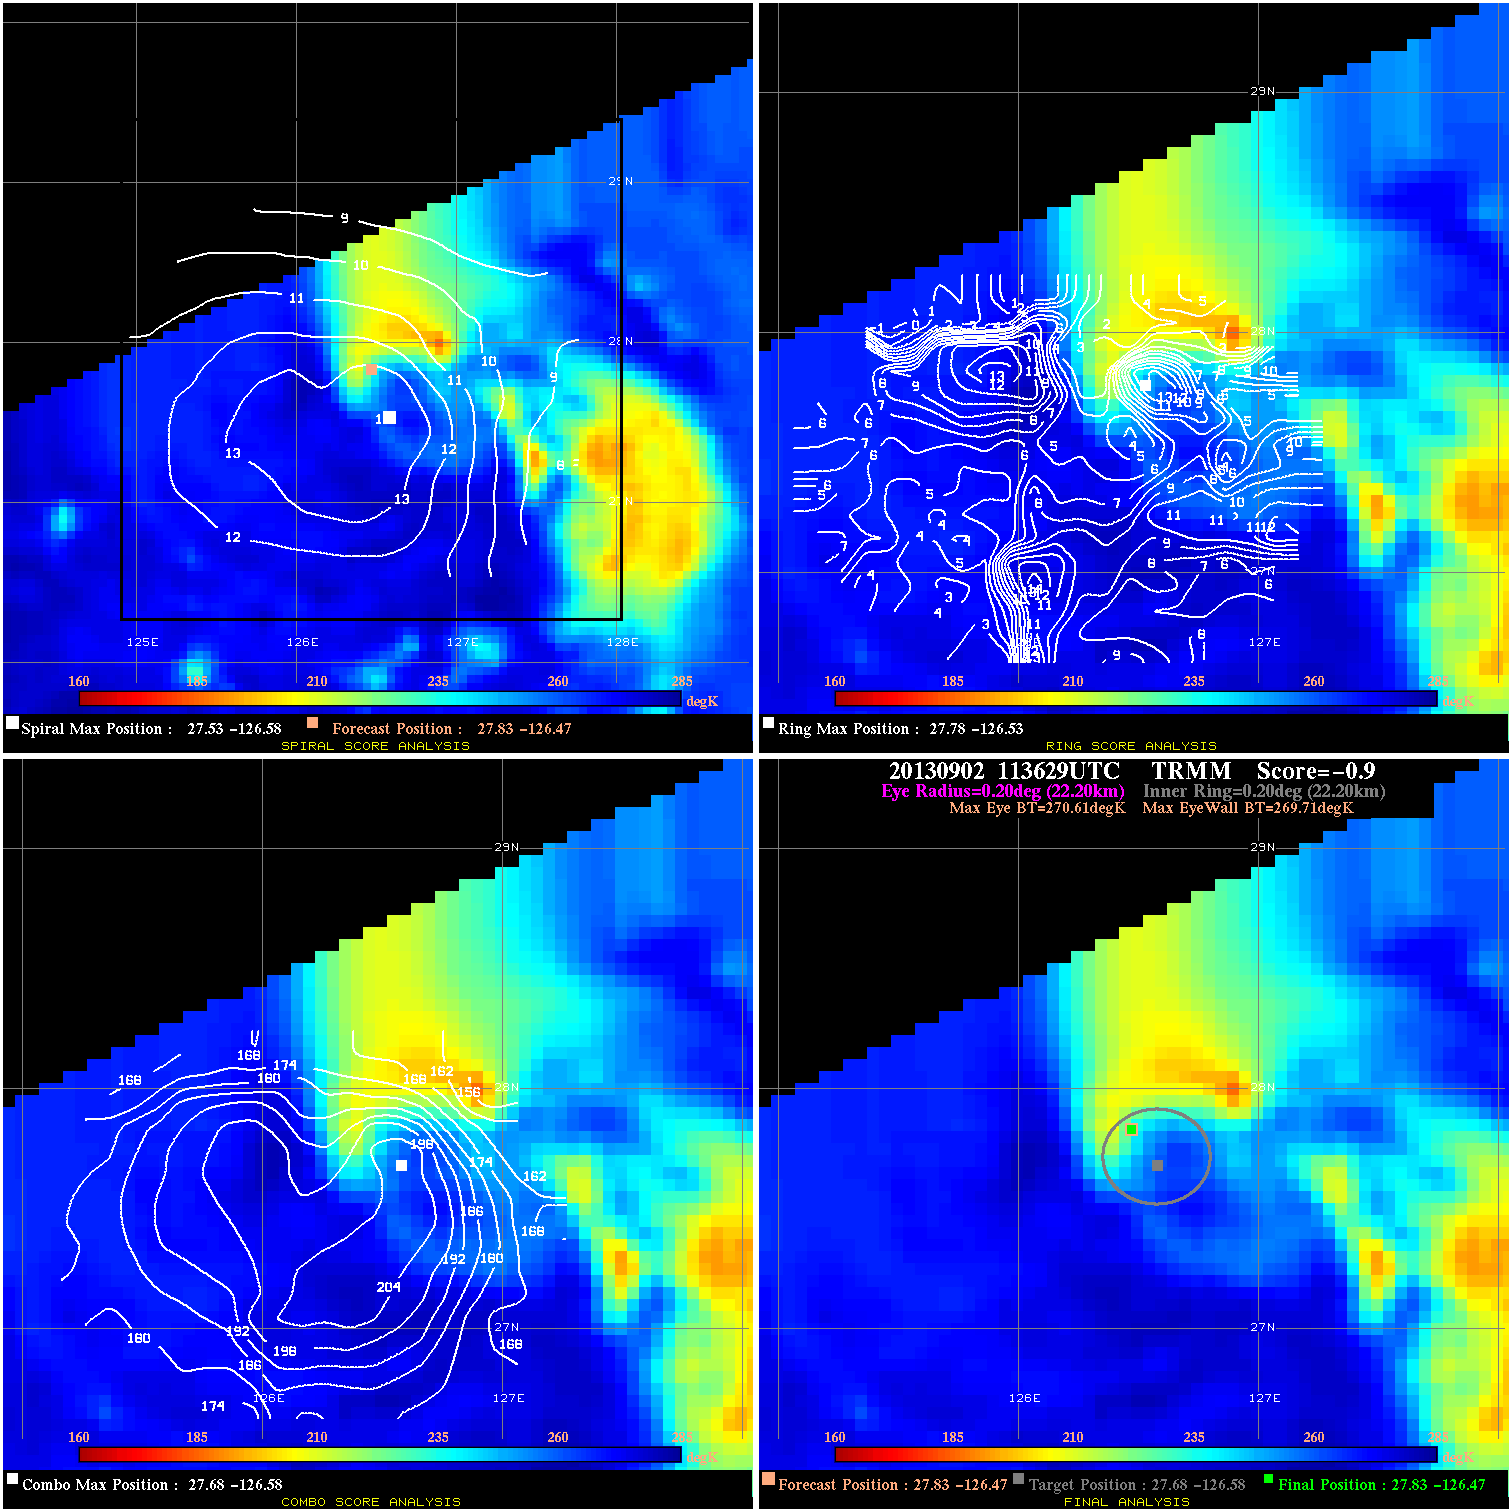
20130902 113629 -0.9 N/A 1.4% 44.44 .90 35.0 TRMM 27.8 -126.5 27.8 -126.5 27.7 -126.6 Analysis Plot
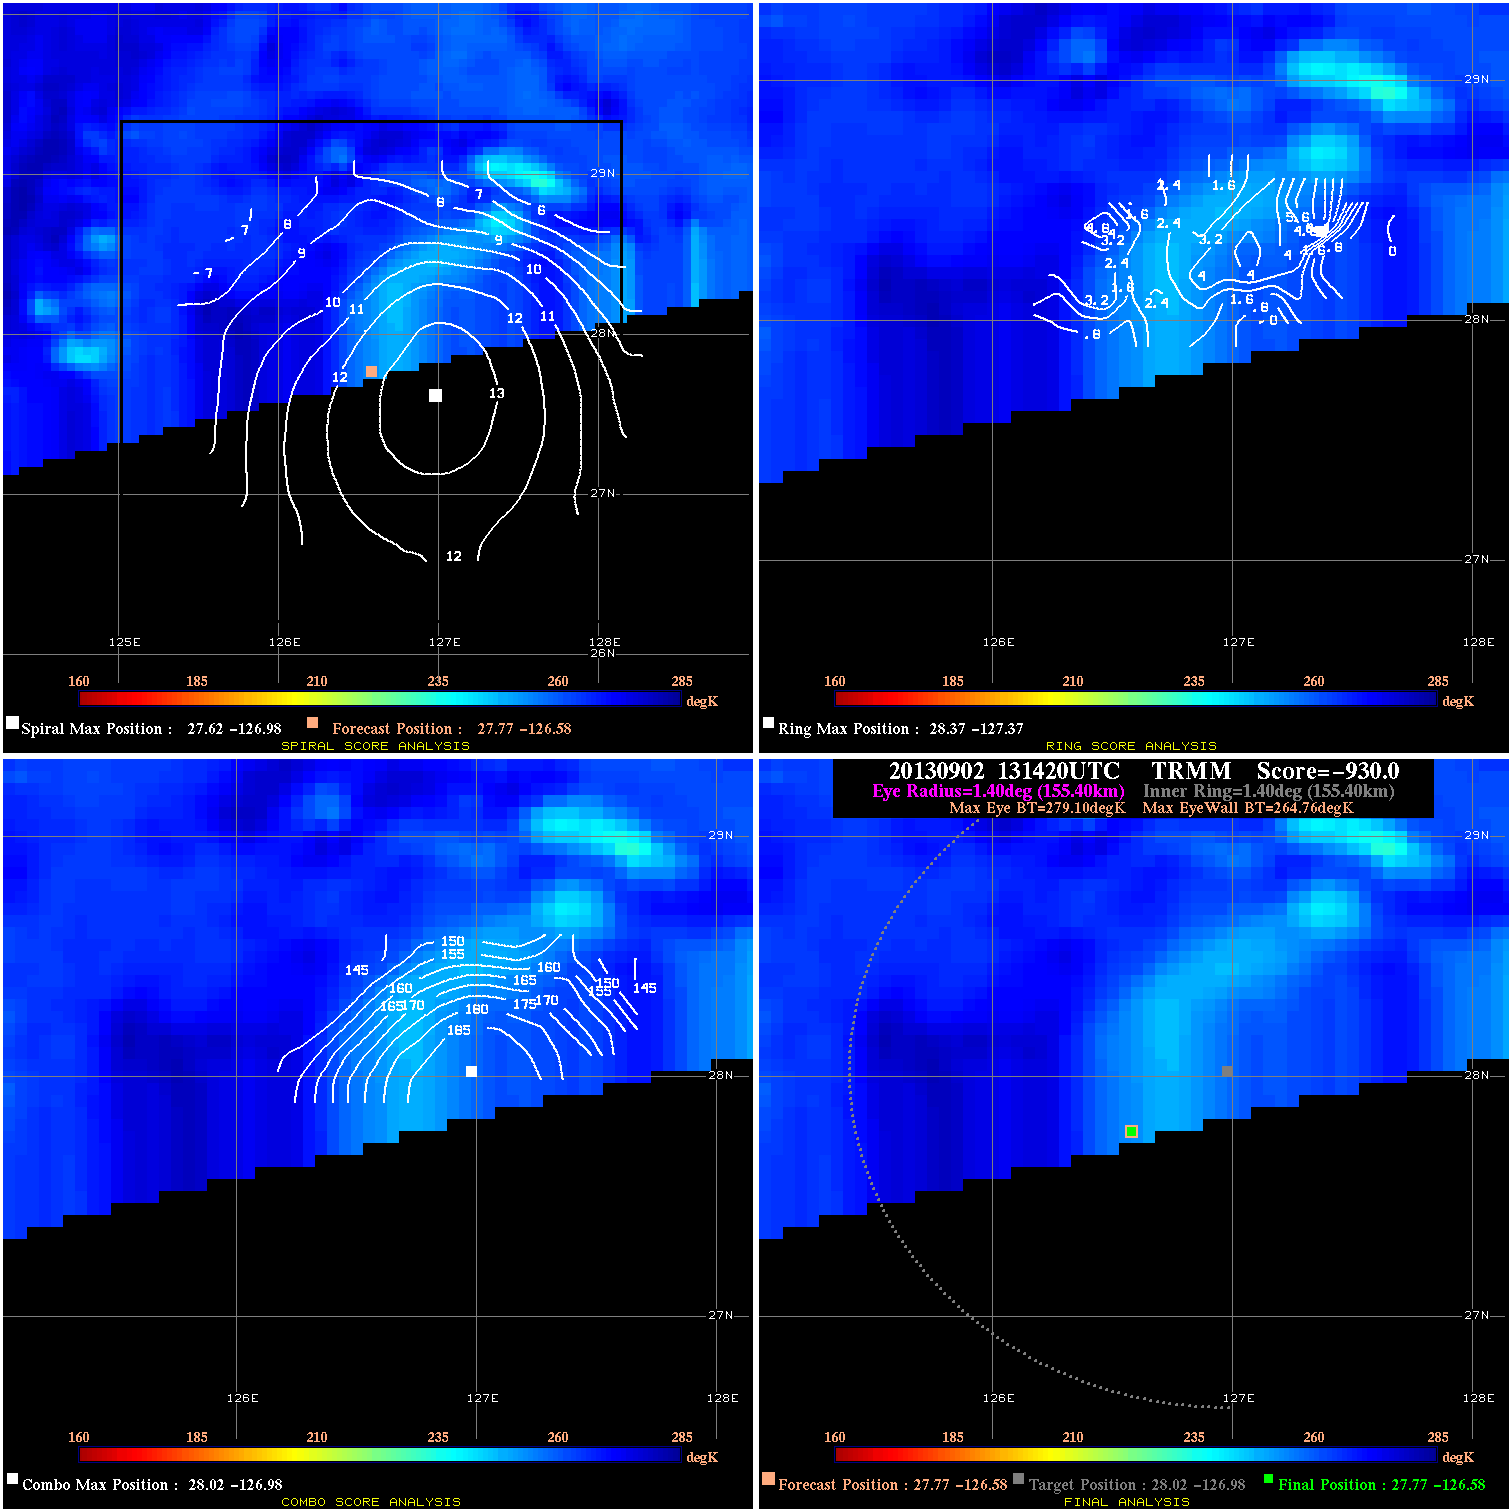
20130902 131420 -930.0 N/A N/A 311.08 14.34 35.0 TRMM 27.8 -126.6 27.8 -126.6 28.0 -127.0 Analysis Plot
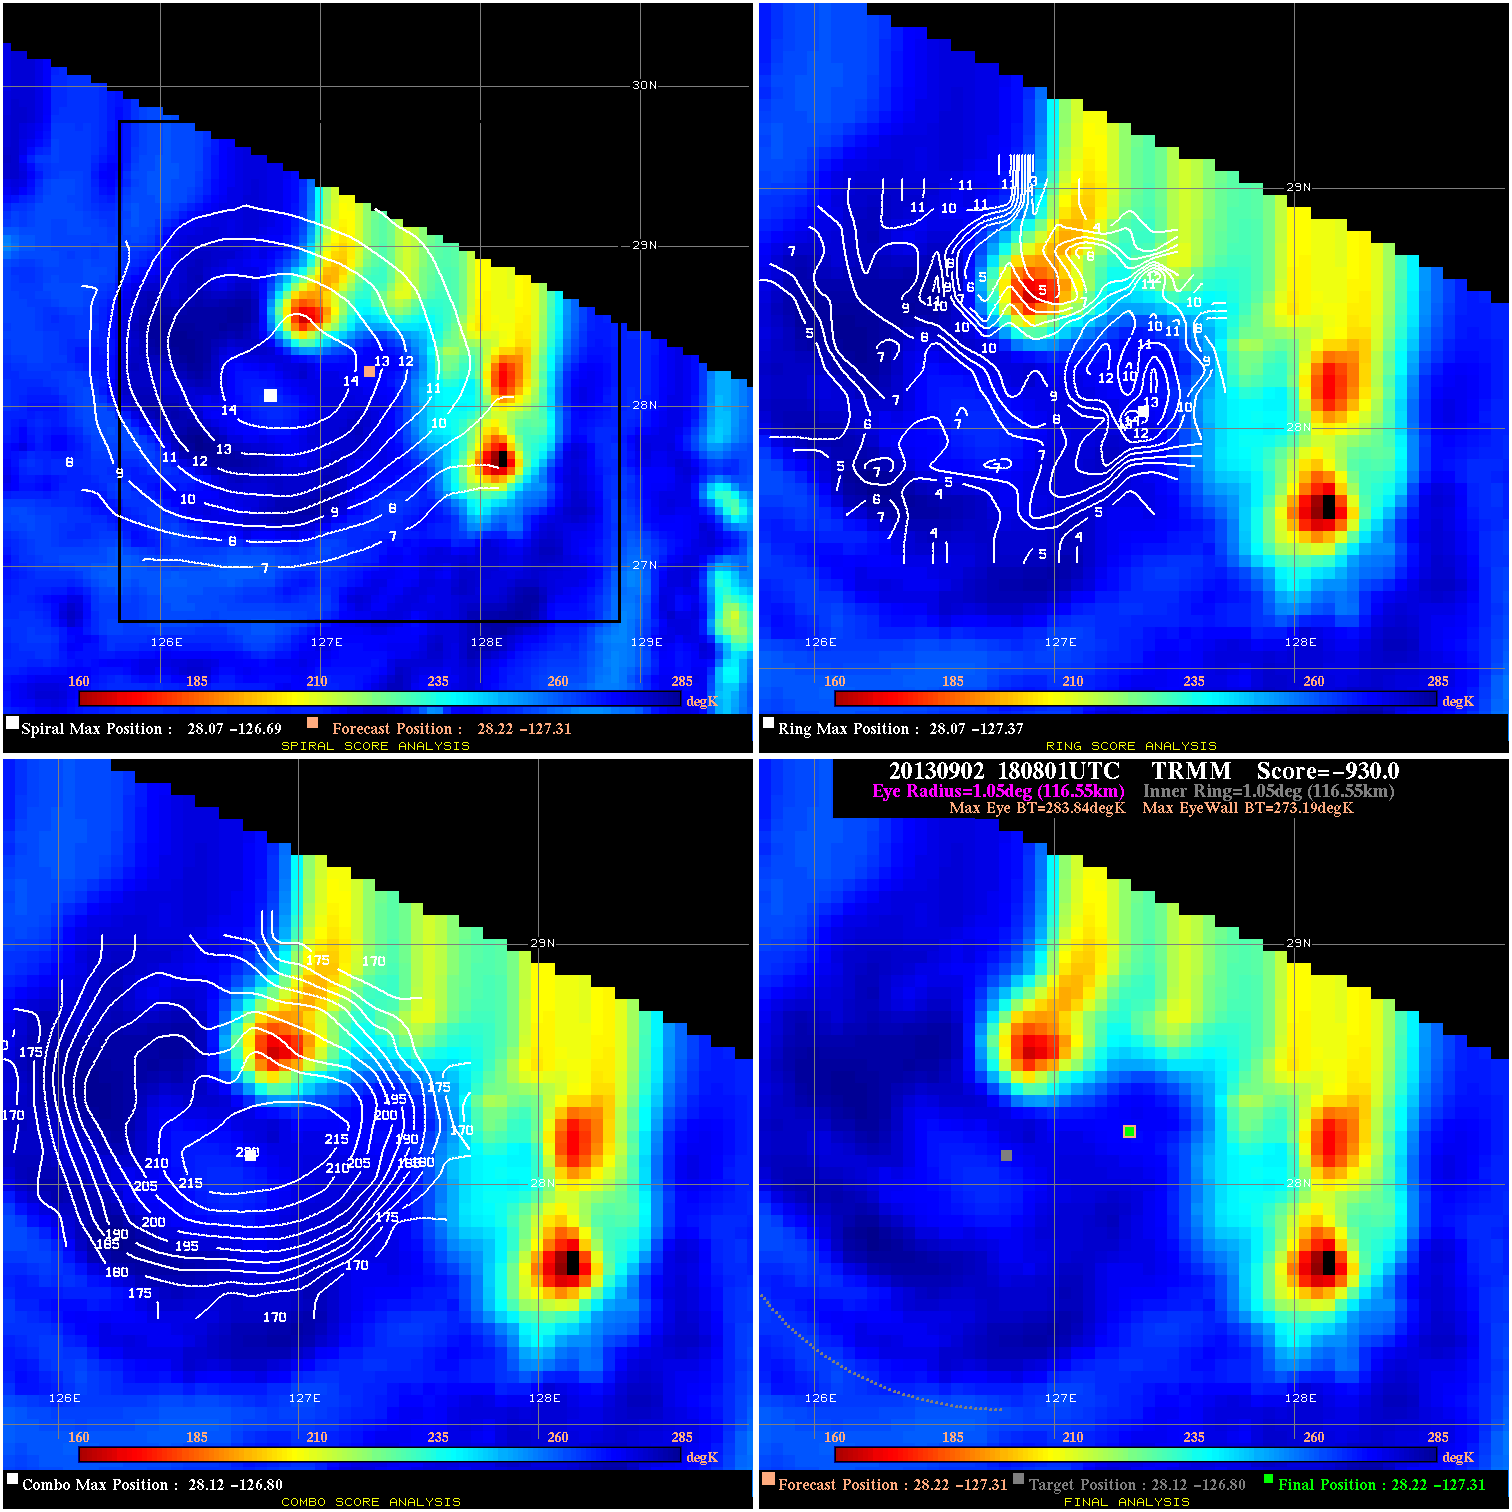
20130902 180801 -930.0 N/A N/A 233.31 10.65 40.0 TRMM 28.2 -127.3 28.2 -127.3 28.1 -126.8 Analysis Plot
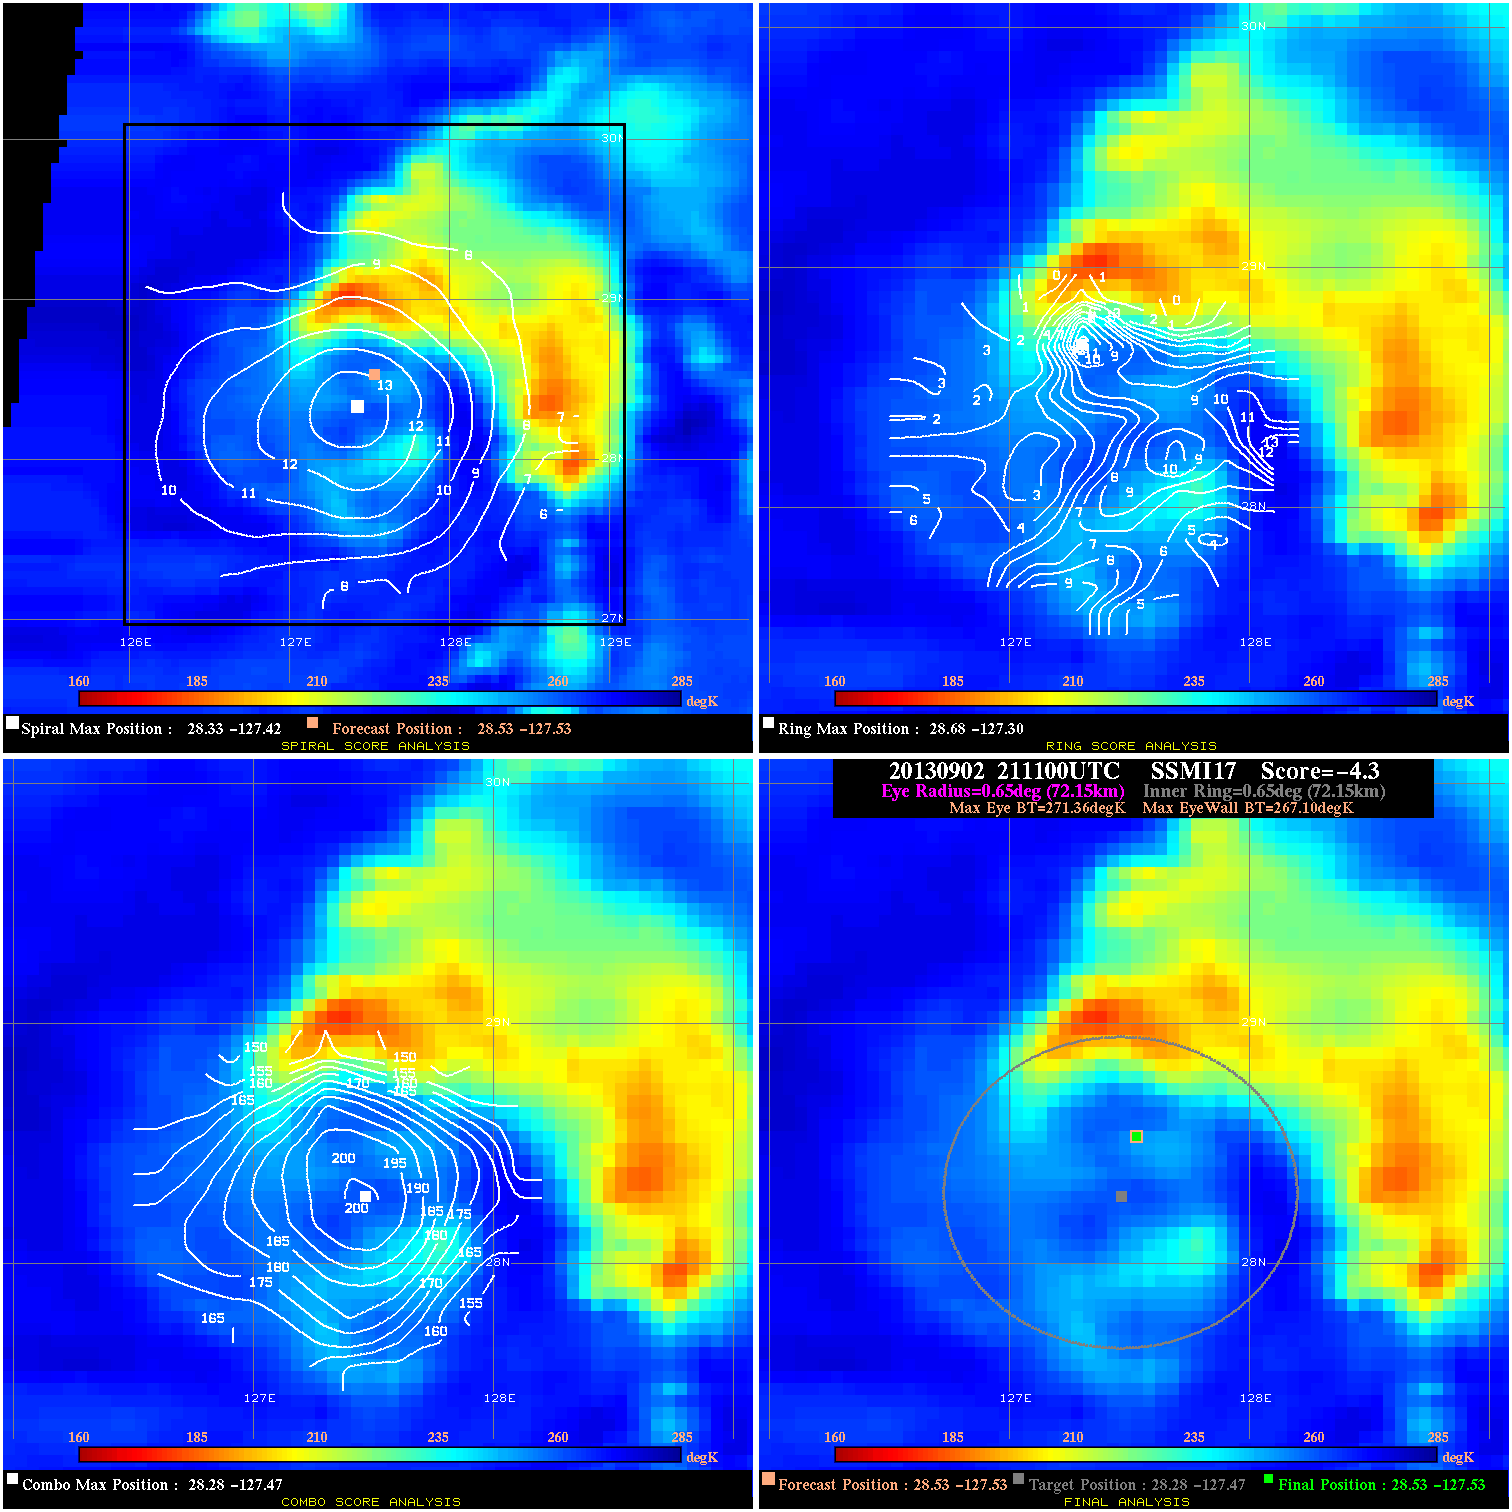
20130902 211100 -4.3 N/A 38.4% 144.43 4.26 40.0 SSMI17 28.5 -127.5 28.5 -127.5 28.3 -127.5 Analysis Plot
20130902 233100 -3.2 N/A 45.2% 66.66 3.18 40.0 SSMI18 28.7 -127.7 28.7 -127.7 28.7 -127.5 Analysis Plot
20130903 121846 -3.3 N/A 50.7% 144.43 3.28 50.0 TRMM 30.3 -129.0 30.3 -129.0 30.5 -129.8 Analysis Plot
20130903 153450 -8.1 N/A 20.5% 88.88 8.13 50.0 TRMM 30.5 -129.3 30.5 -129.3 30.9 -130.1 Analysis Plot
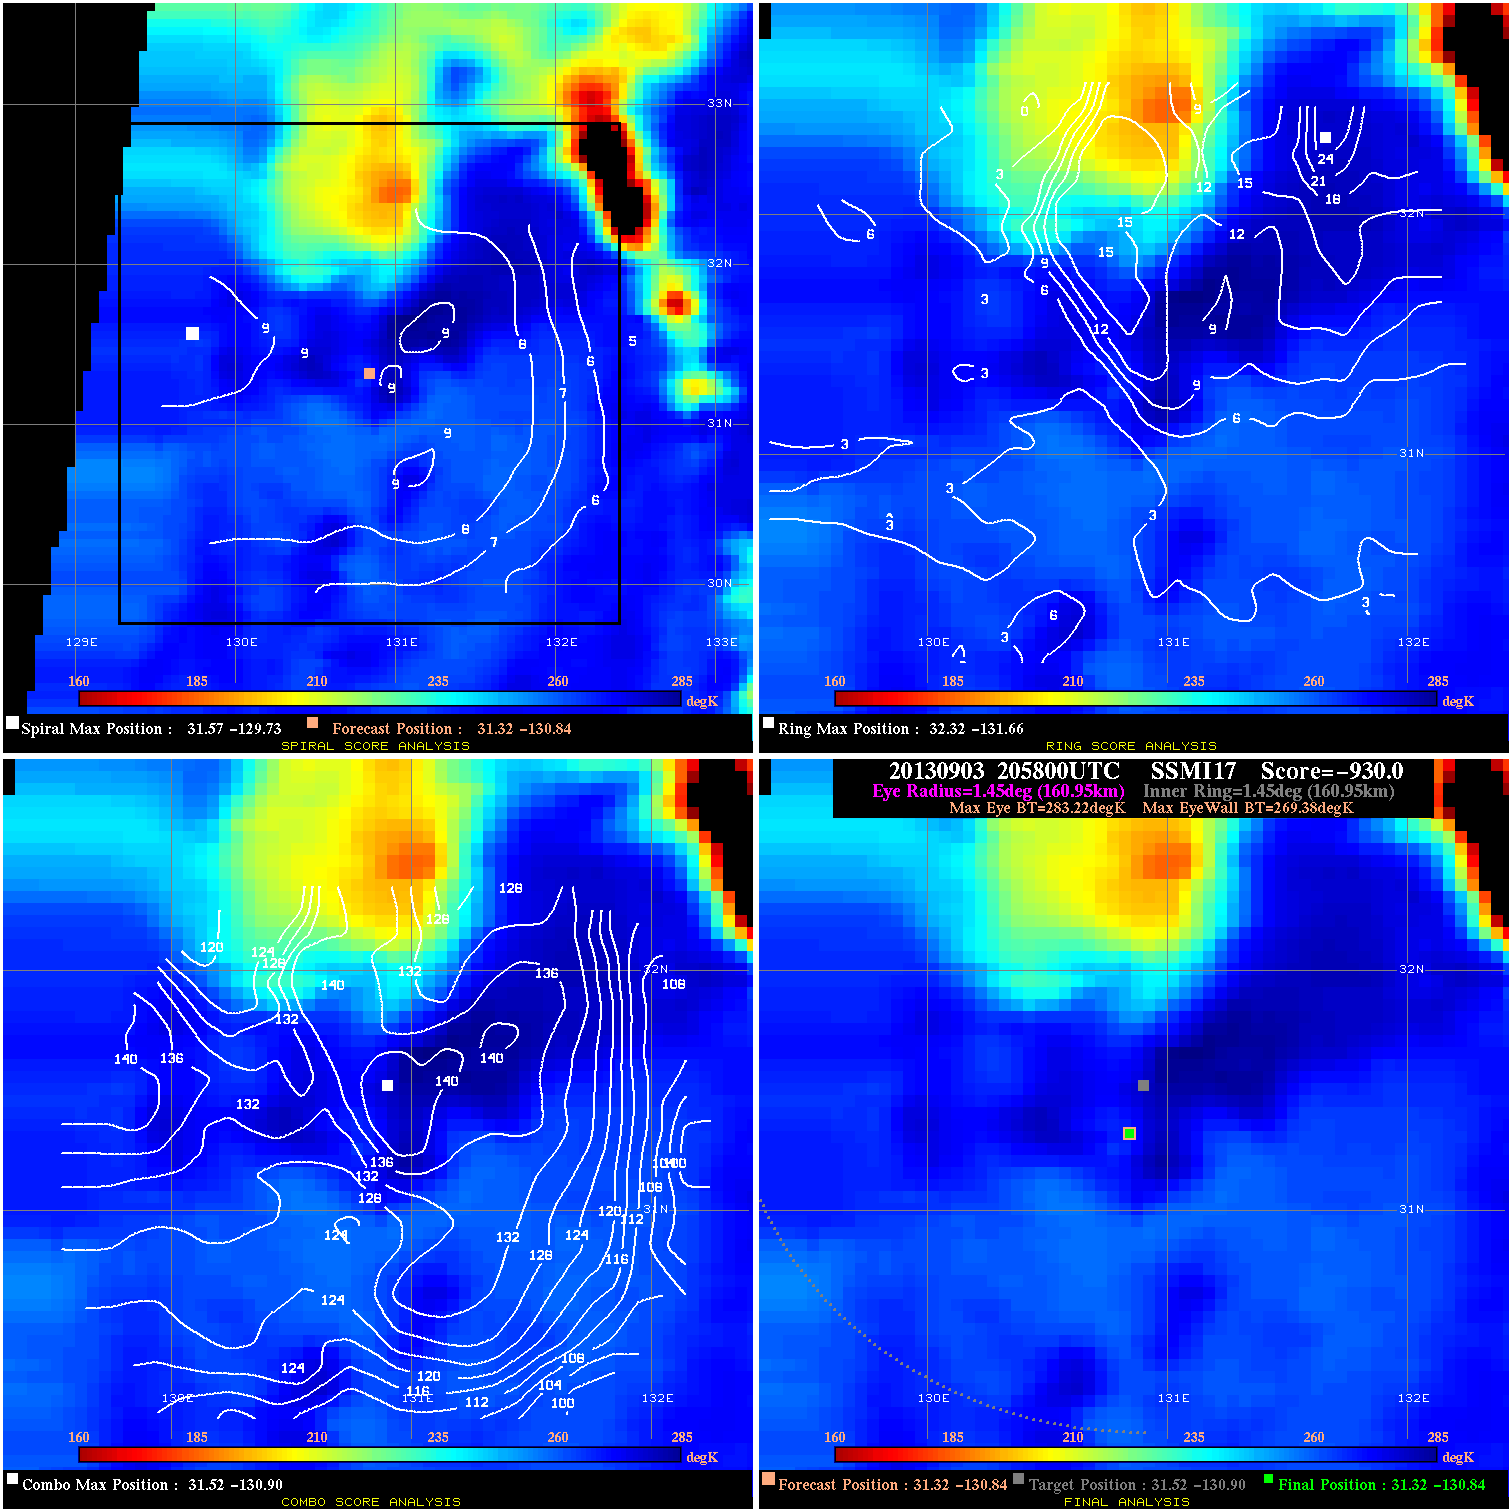
20130903 205800 -930.0 N/A N/A 322.19 13.84 45.0 SSMI17 31.3 -130.8 31.3 -130.8 31.5 -130.9 Analysis Plot
20130904 081800 -1.6 N/A N/A 11.11 1.63 40.0 SSMI17 33.2 -133.8 33.2 -133.8 32.5 -134.2 Analysis Plot
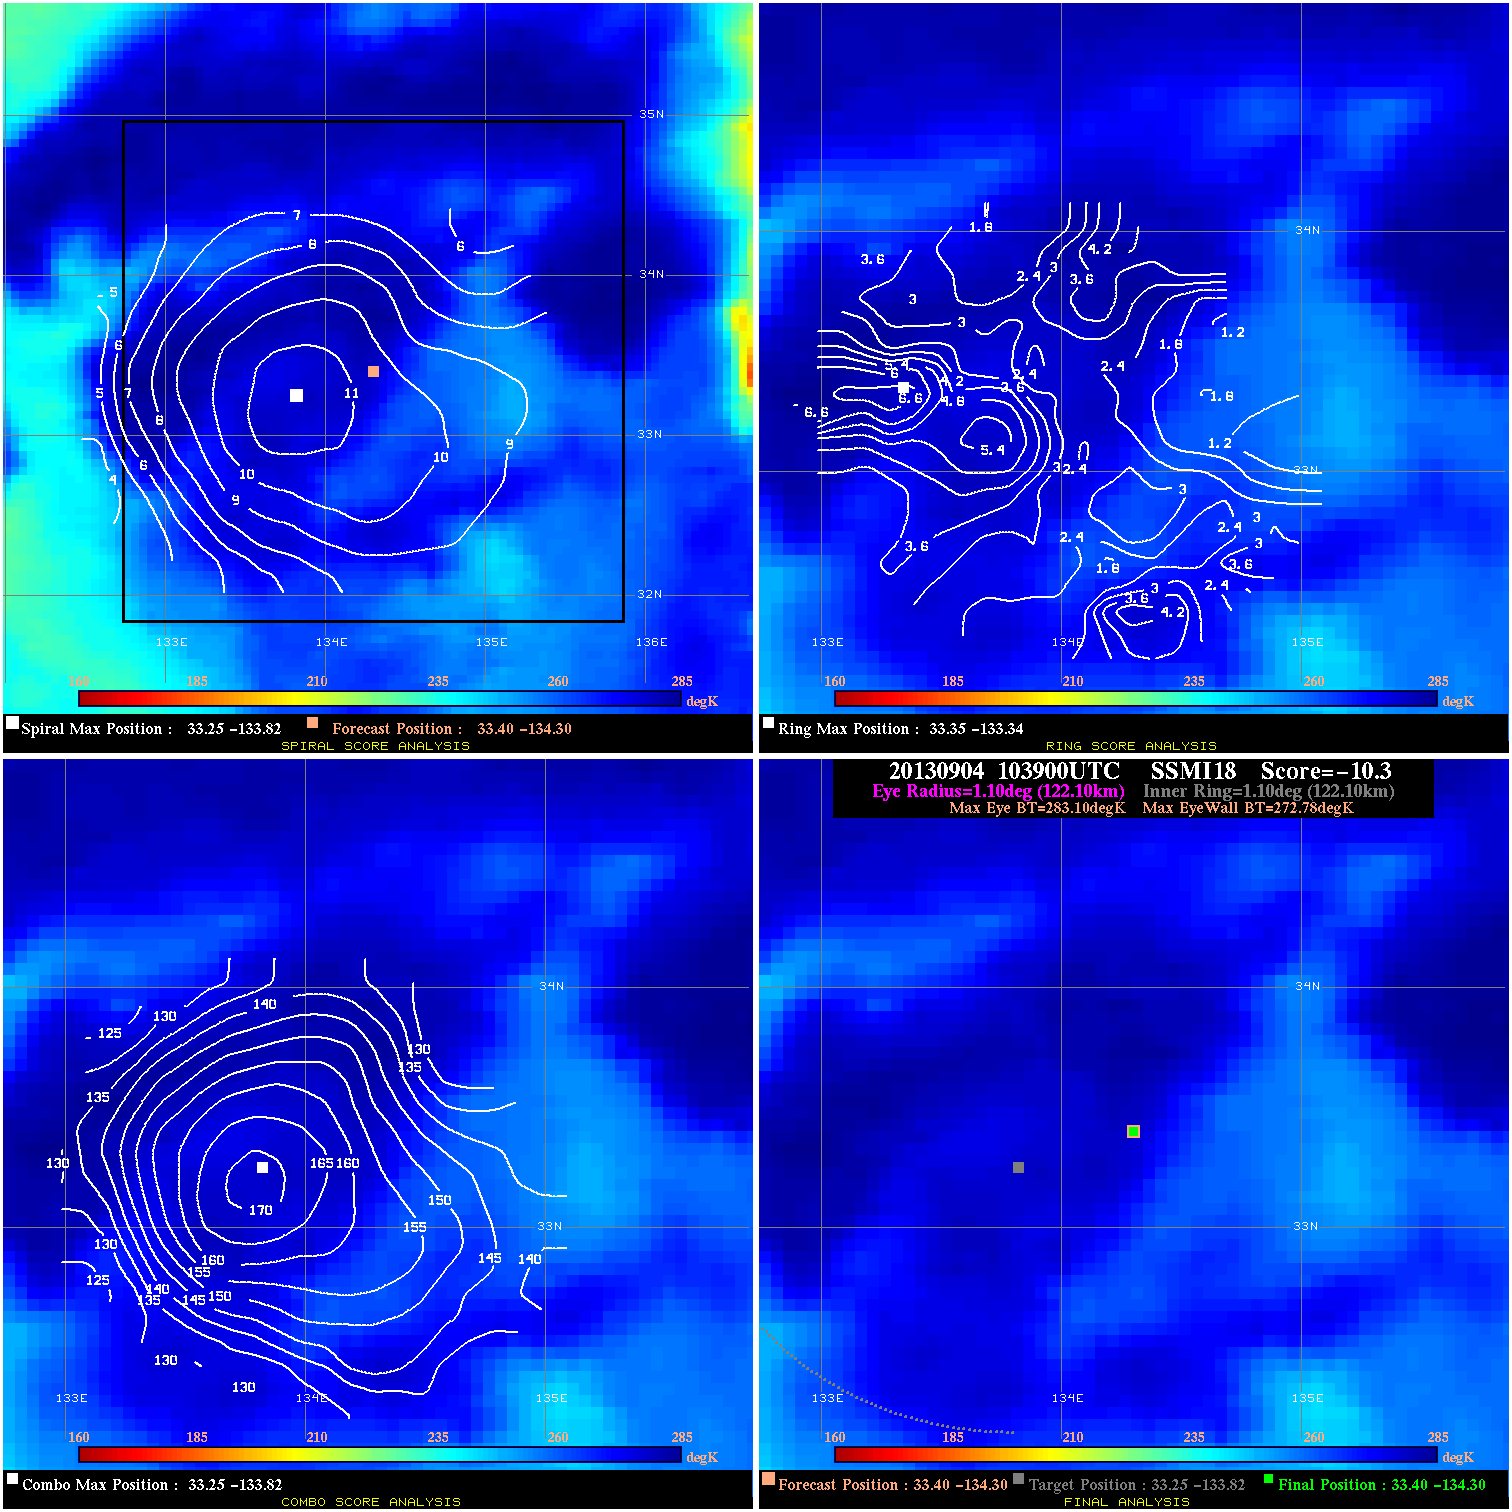
20130904 103900 -10.3 N/A N/A 244.42 10.32 40.0 SSMI18 33.4 -134.3 33.4 -134.3 33.3 -133.8 Analysis Plot
20130904 112446 -11.9 N/A 1.4% 244.42 11.91 40.0 TRMM 33.5 -134.6 33.5 -134.6 33.2 -133.7 Analysis Plot
20130904 130218 -2.6 N/A N/A 99.99 2.63 40.0 TRMM 33.7 -134.9 33.7 -134.9 33.9 -134.0 Analysis Plot
20130904 144000 -1.7 N/A N/A 44.44 1.65 40.0 TRMM 33.8 -135.2 33.8 -135.2 33.6 -134.1 Analysis Plot
20130904 204300 -3.3 N/A N/A 144.43 3.30 40.0 SSMI17 34.5 -136.5 34.5 -136.5 34.0 -135.9 Analysis Plot
|
|
Legend: - Date/Time are determined from PMW imagery at Forecast (initial guess) Lat/Lon position. - Positive/Negative Latitude = North/South Hemisphere; Longitude = Western/Eastern Hemisphere. - "Ring Diam" value indicates the estimated surface eyewall diameter in km (the MI eyewall edge diameter minus 10 km). - "Ring Pct" is the percentage of the "ring" (eyewall inner boundary) that is 1) colder than the "hot spot" (warmest eye pixel) in the eye by 20K, or 2) the percentage that is a) colder than 232K and b) colder than the "hot spot" by 10K, whichever is greater. - Values are red if Ring % <= 65, yellow/brown if Ring % <= 85 and green if Ring % > 85. - "Tb diff" is the difference between the "hot spot" (warmest eye pixel) and the warmest pixel on the eyewall. - Intensity score are listed as negative, and not used, when the JTWC or NHC estimated Vmax is <55 kts in order to rule out weak but highly symmetric TCs. - Error messages in intensity scores: -920 is used when the hottest pixel in the eye is <200K, to prevent false positives; -930 means <85% of eyewall has observations/data. |