Tropical Depression 01L
|
Passive Microwave (PMW) Intensity Information Advanced Dvorak Technique (ADT) Version 8.2.1 |
Overpass Inten Ring Ring Wind Forecast Final Target
Date Time Score Meaning Pct Diam BTdiff Est Sat Lat Lon Lat Lon Lat Lon
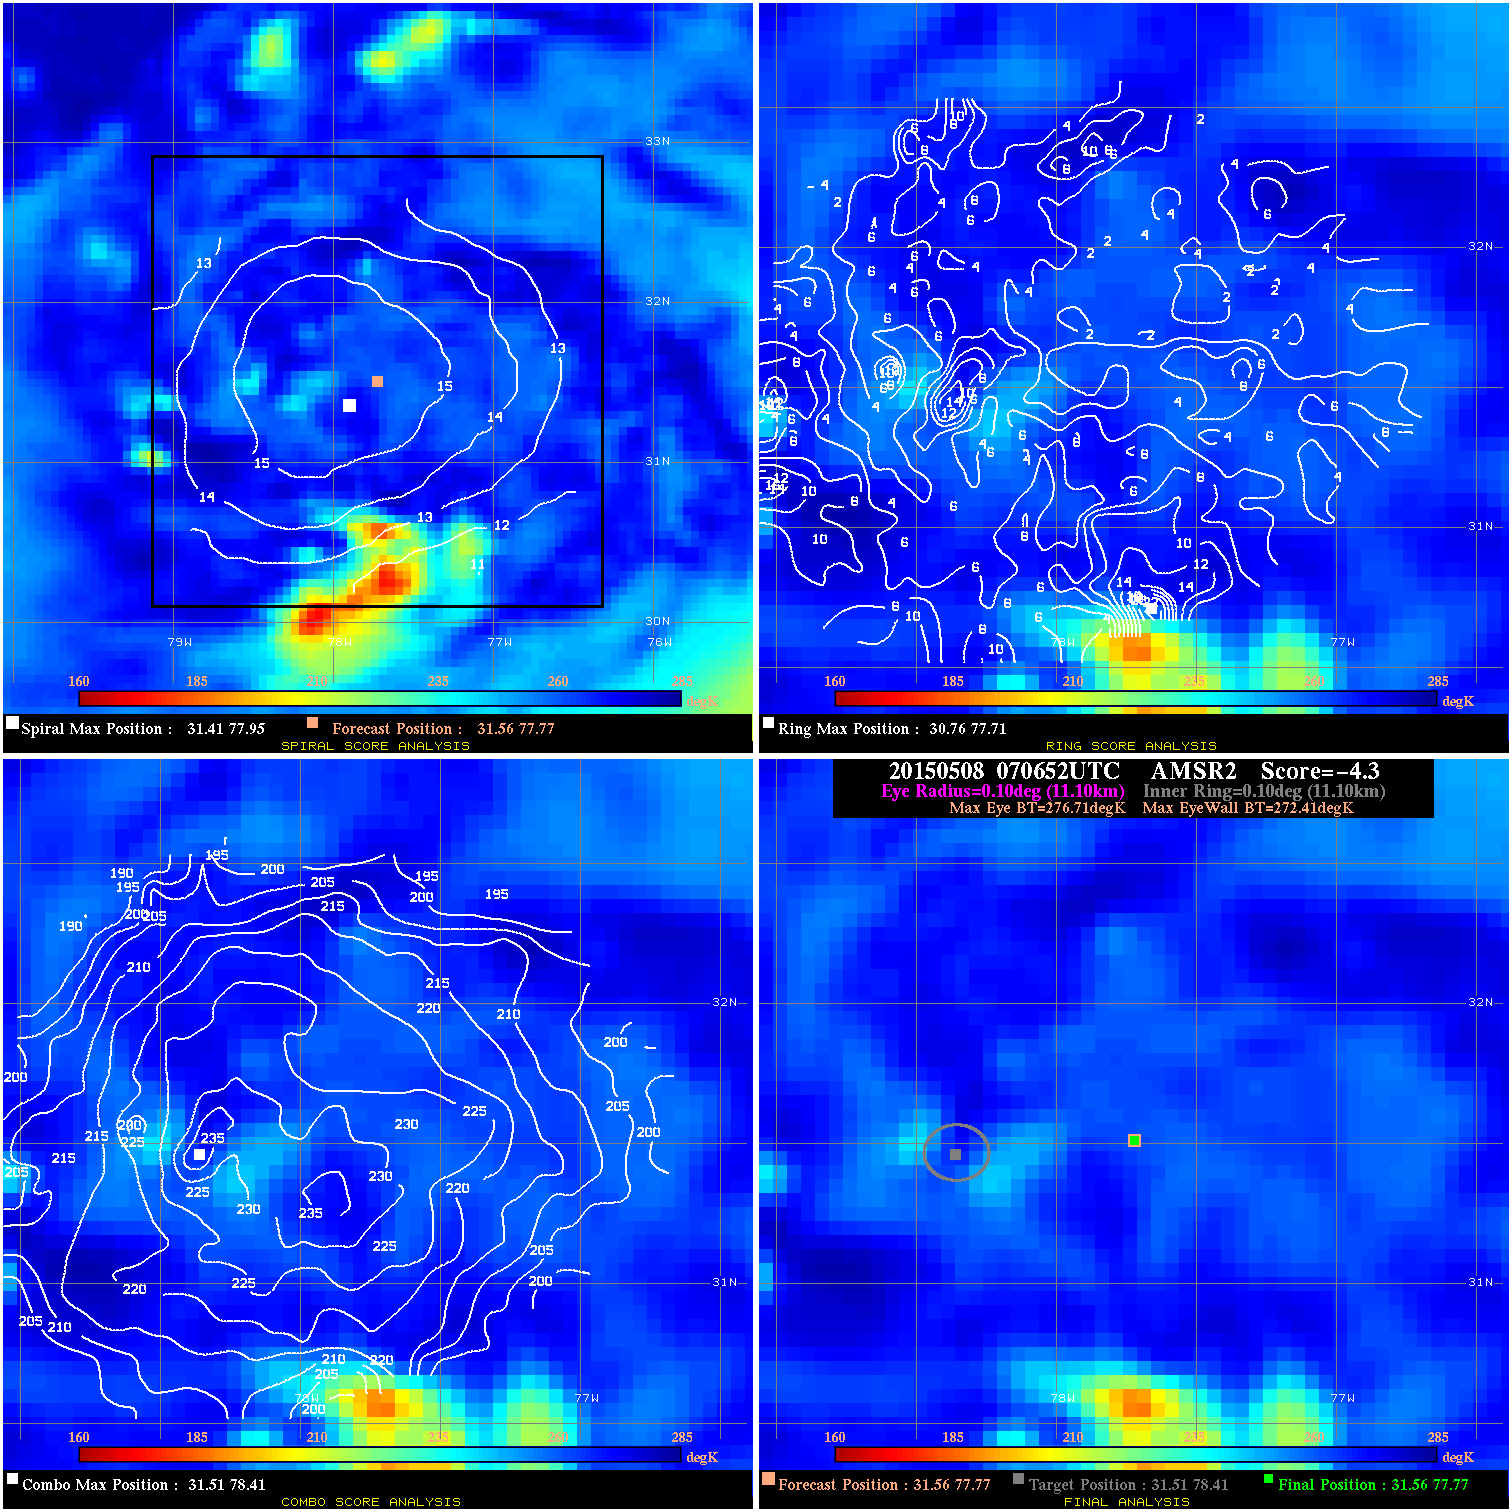
20150508 070652 -4.3 N/A N/A 22.22 4.30 40.0 AMSR2 31.6 77.8 31.6 77.8 31.5 78.4 Analysis Plot
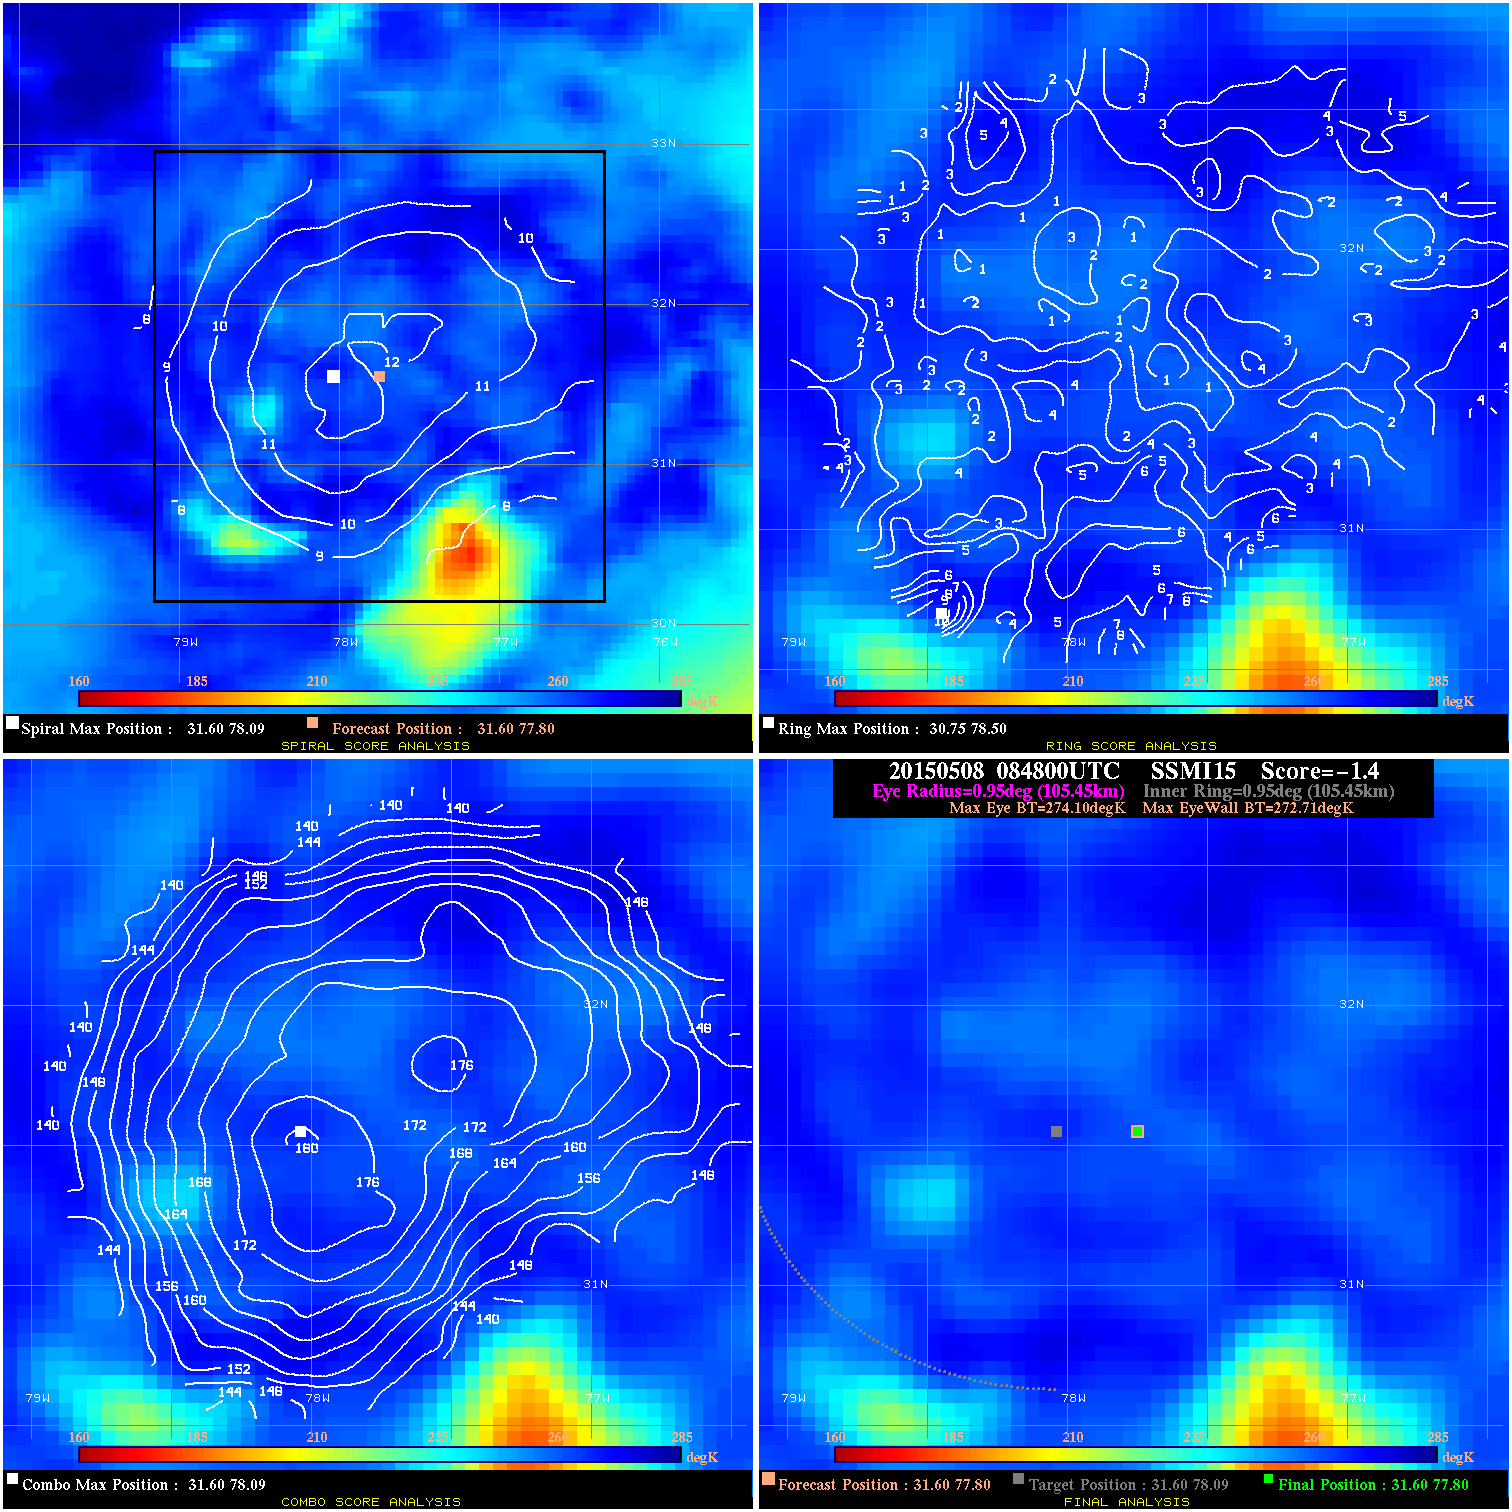
20150508 084800 -1.4 N/A N/A 211.09 1.39 40.0 SSMI15 31.6 77.8 31.6 77.8 31.6 78.1 Analysis Plot
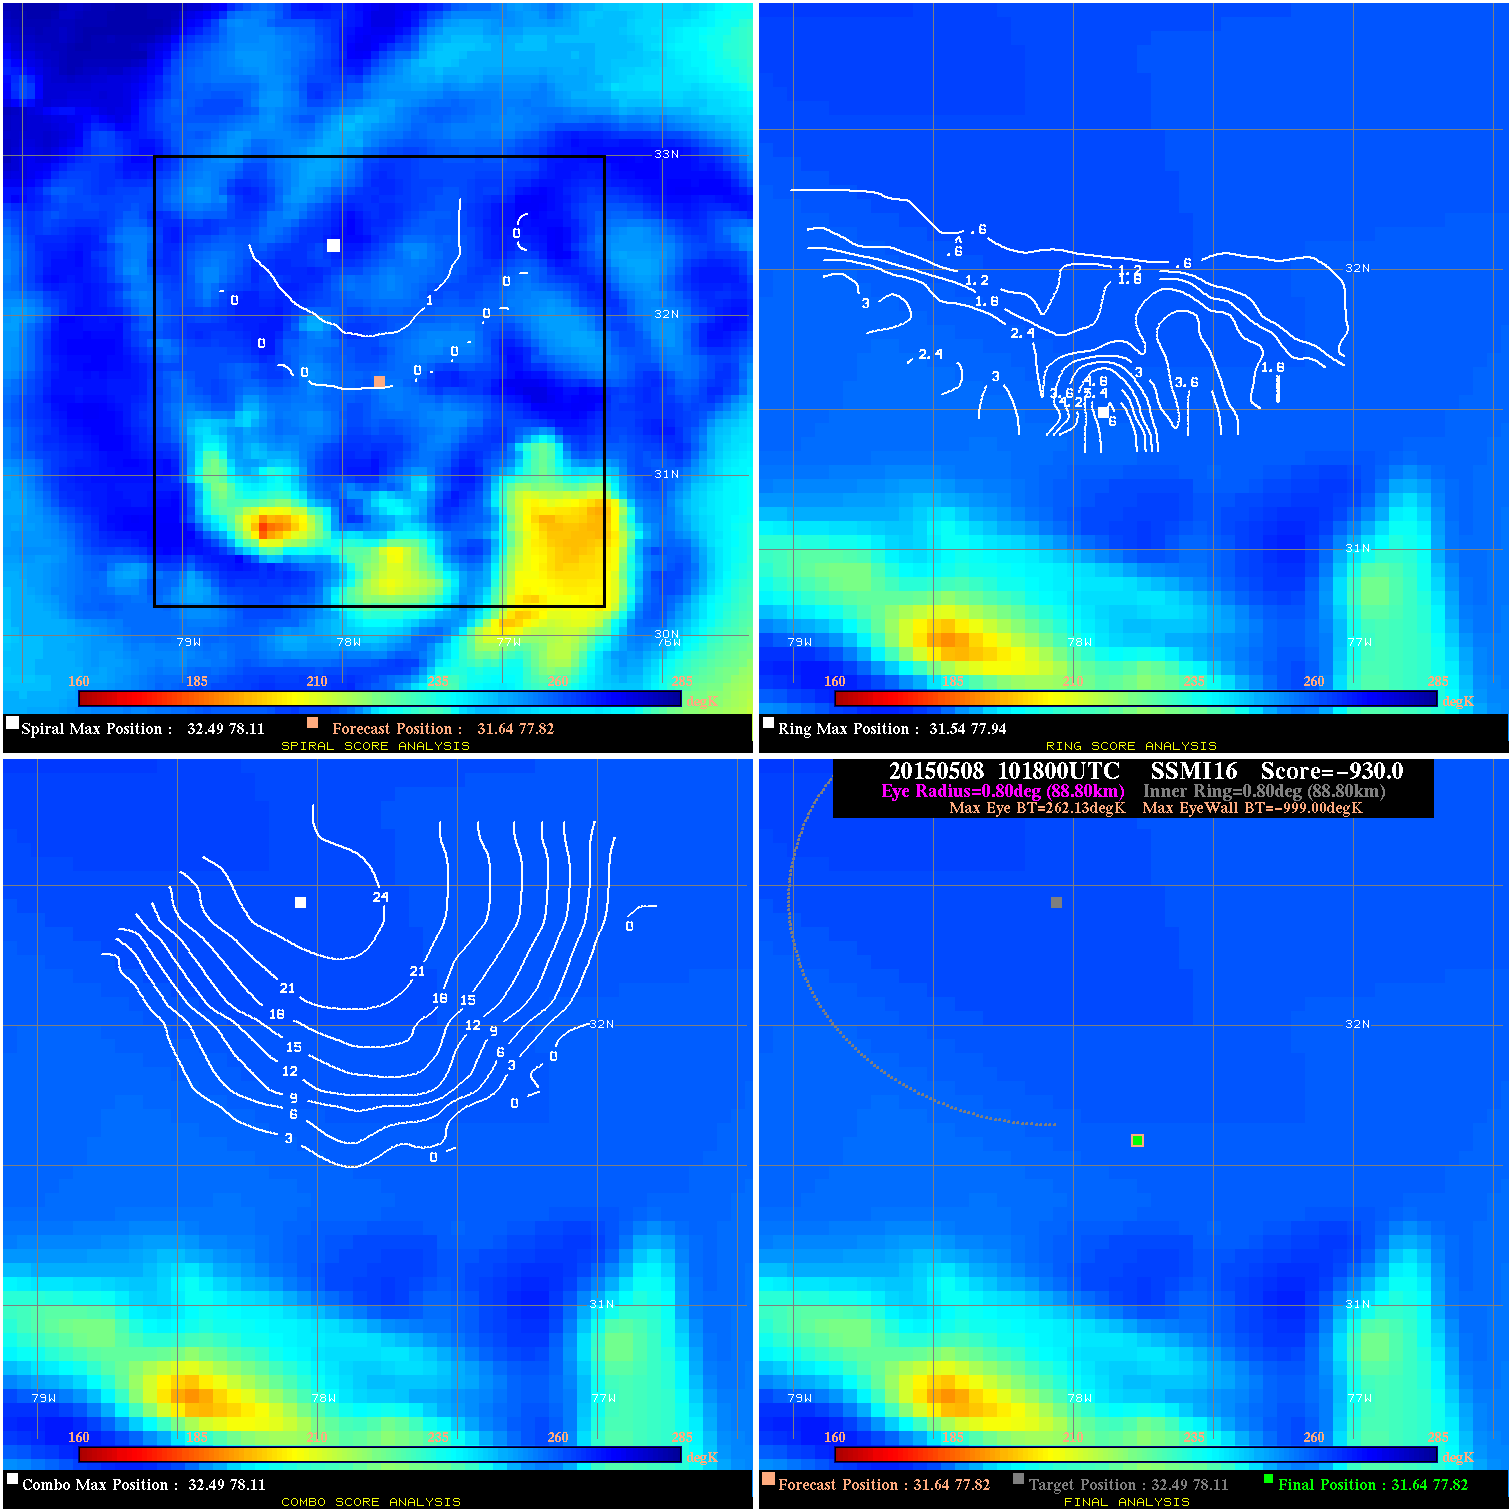
20150508 101800 -930.0 N/A N/A 177.76 1261.1 40.0 SSMI16 31.6 77.8 31.6 77.8 32.5 78.1 Analysis Plot
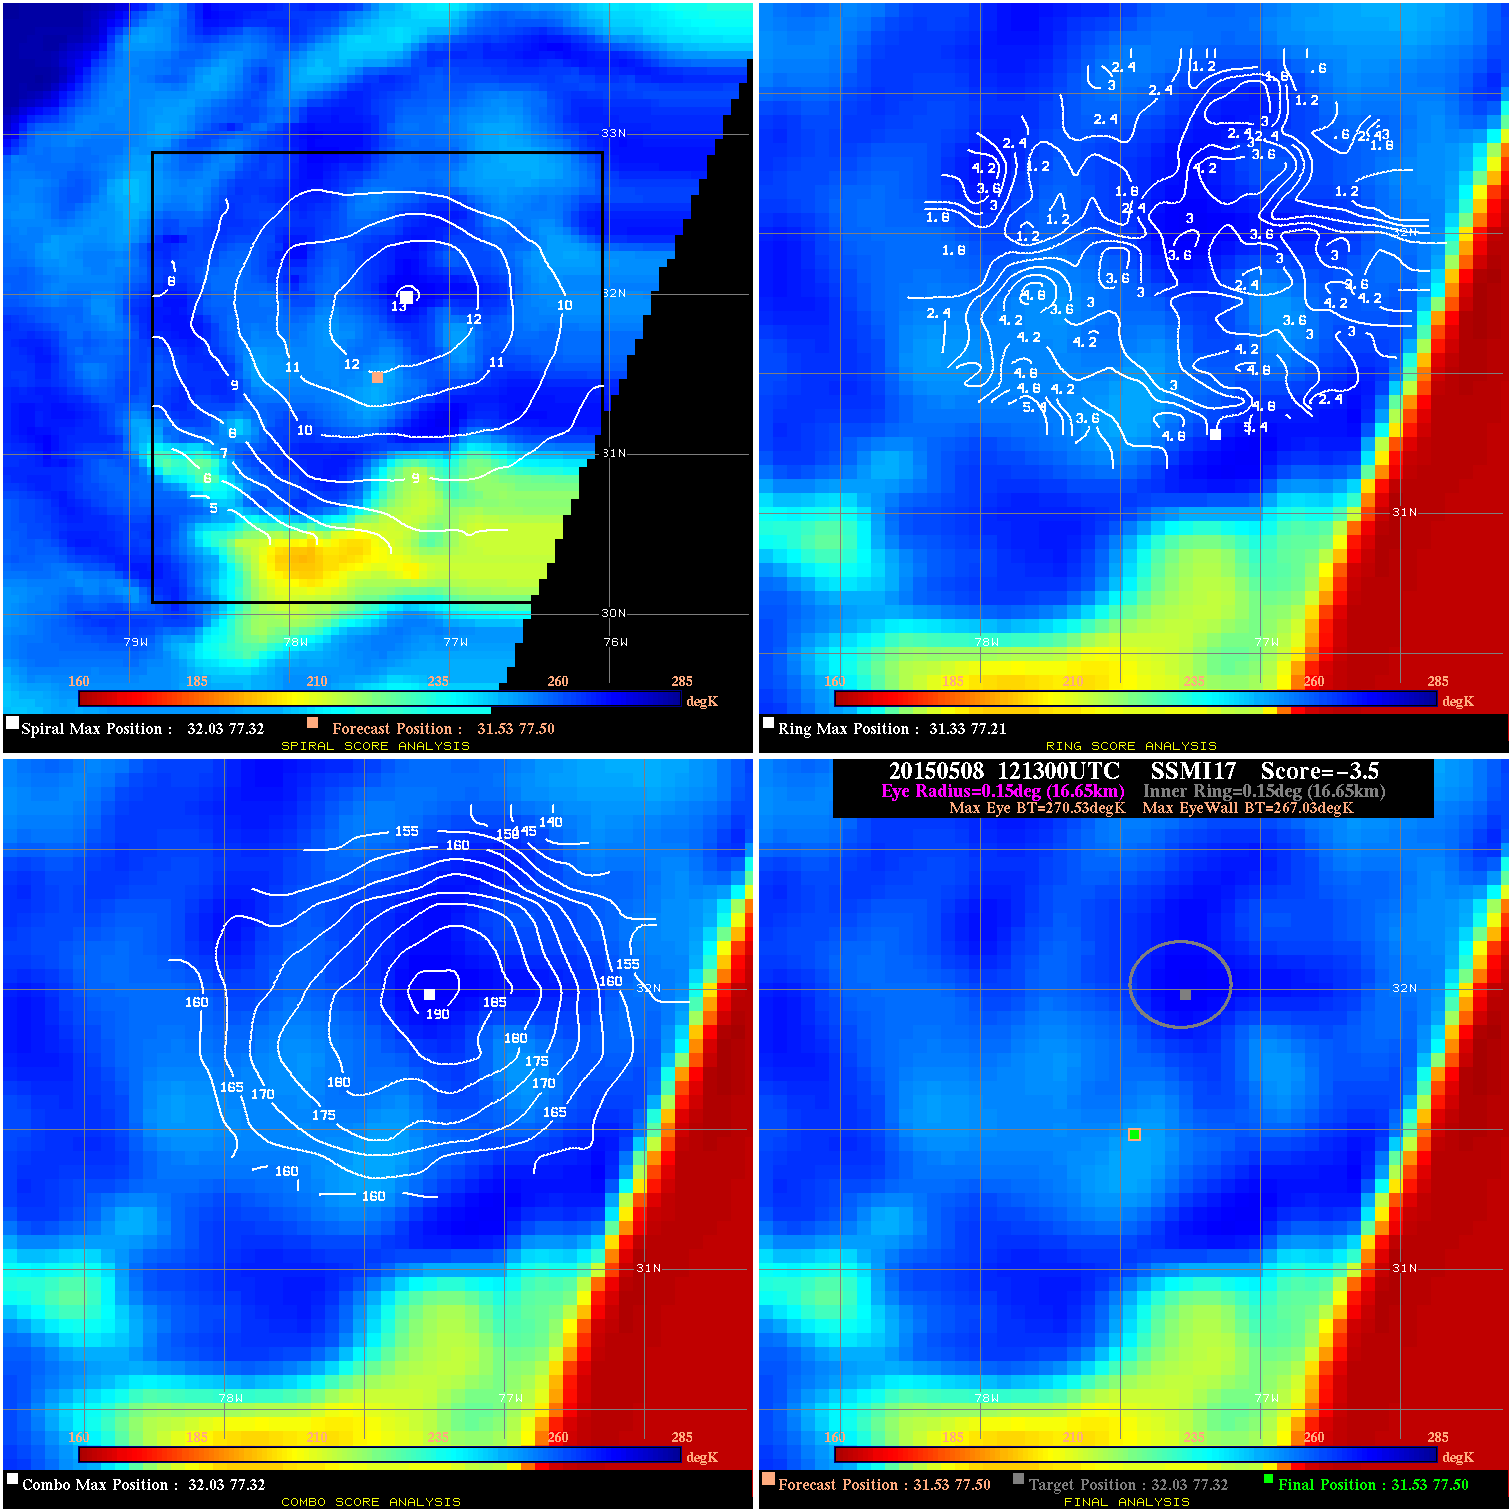
20150508 121300 -3.5 N/A N/A 33.33 3.50 40.0 SSMI17 31.5 77.5 31.5 77.5 32.0 77.3 Analysis Plot
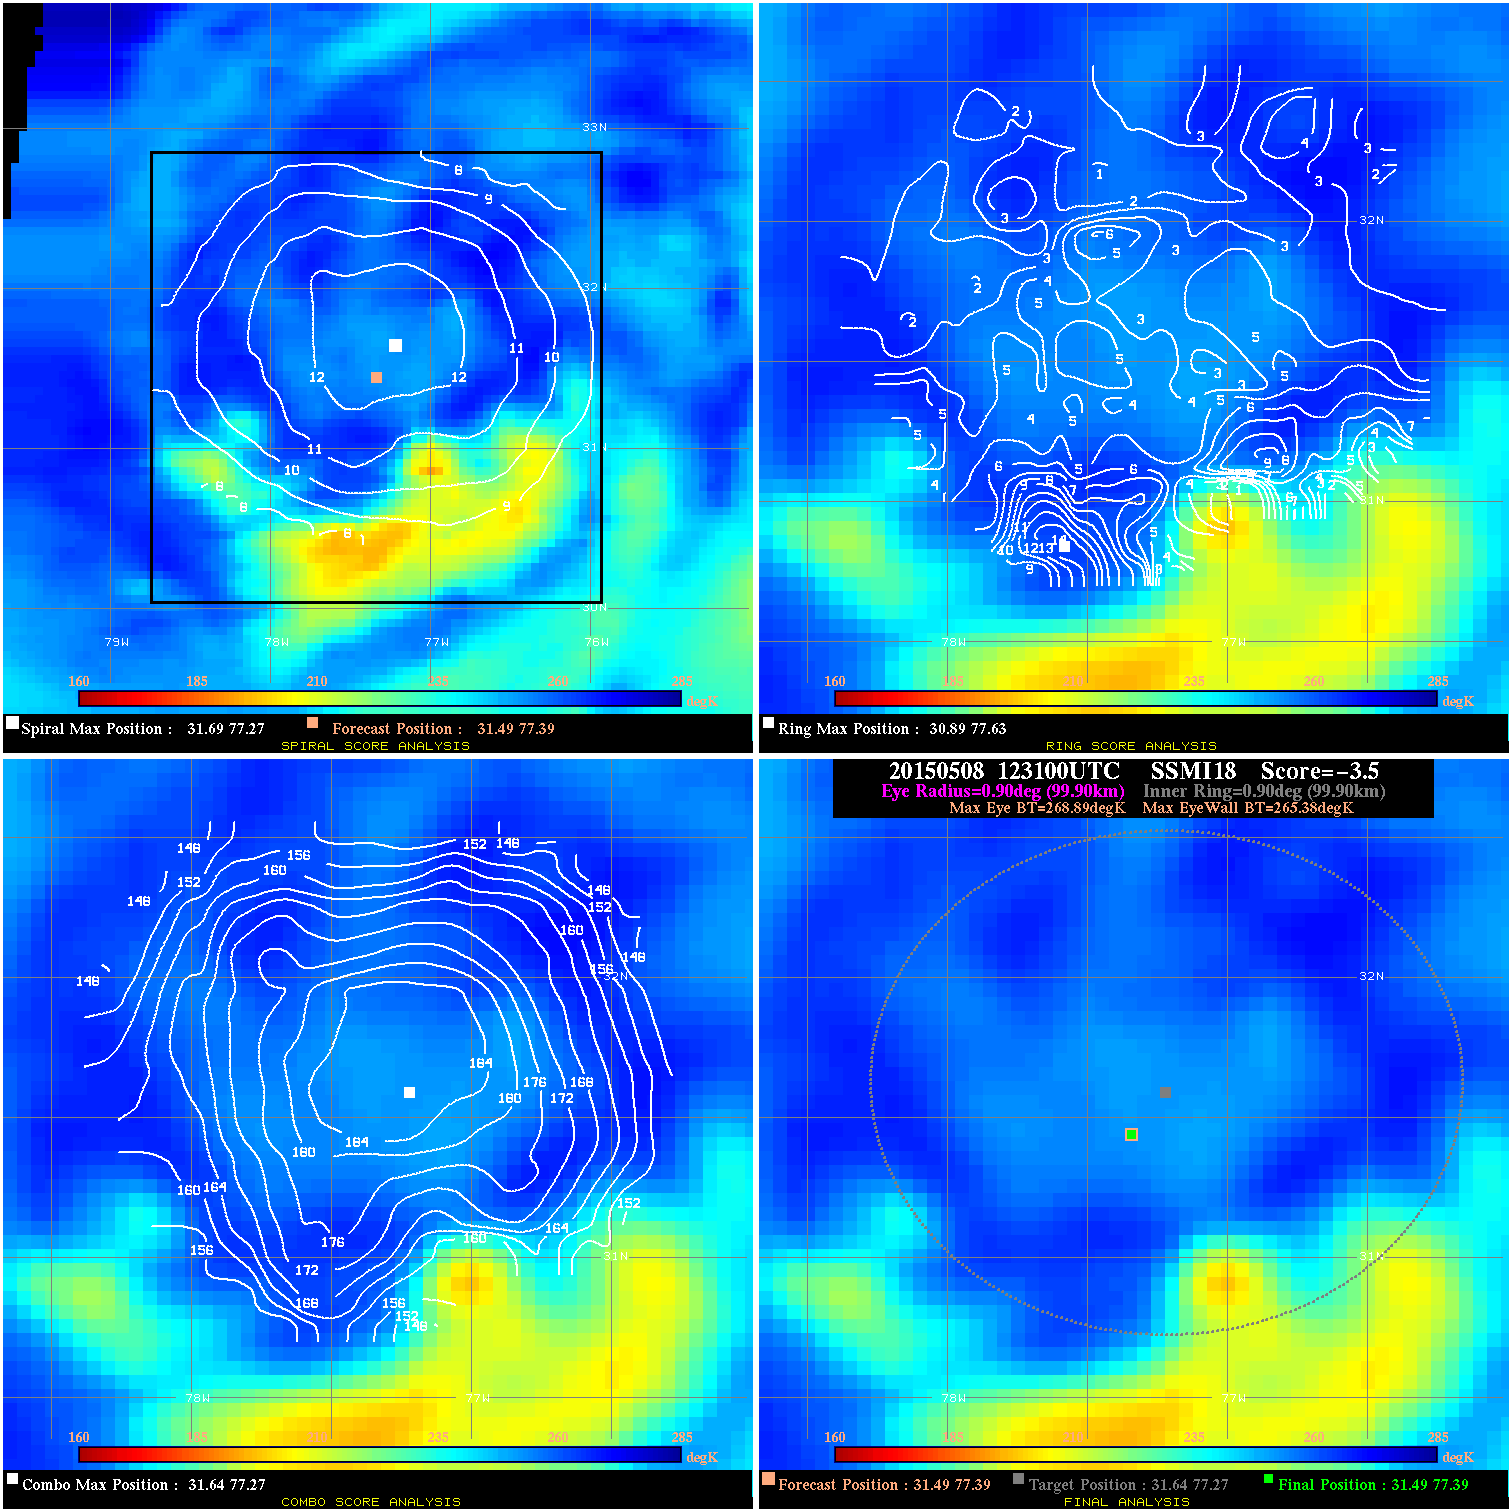
20150508 123100 -3.5 N/A 26.0% 199.98 3.51 40.0 SSMI18 31.5 77.4 31.5 77.4 31.6 77.3 Analysis Plot
20150508 211135 -6.0 N/A 8.2% 188.87 6.02 40.0 SSMI15 31.6 77.4 31.6 77.4 31.7 77.3 Analysis Plot
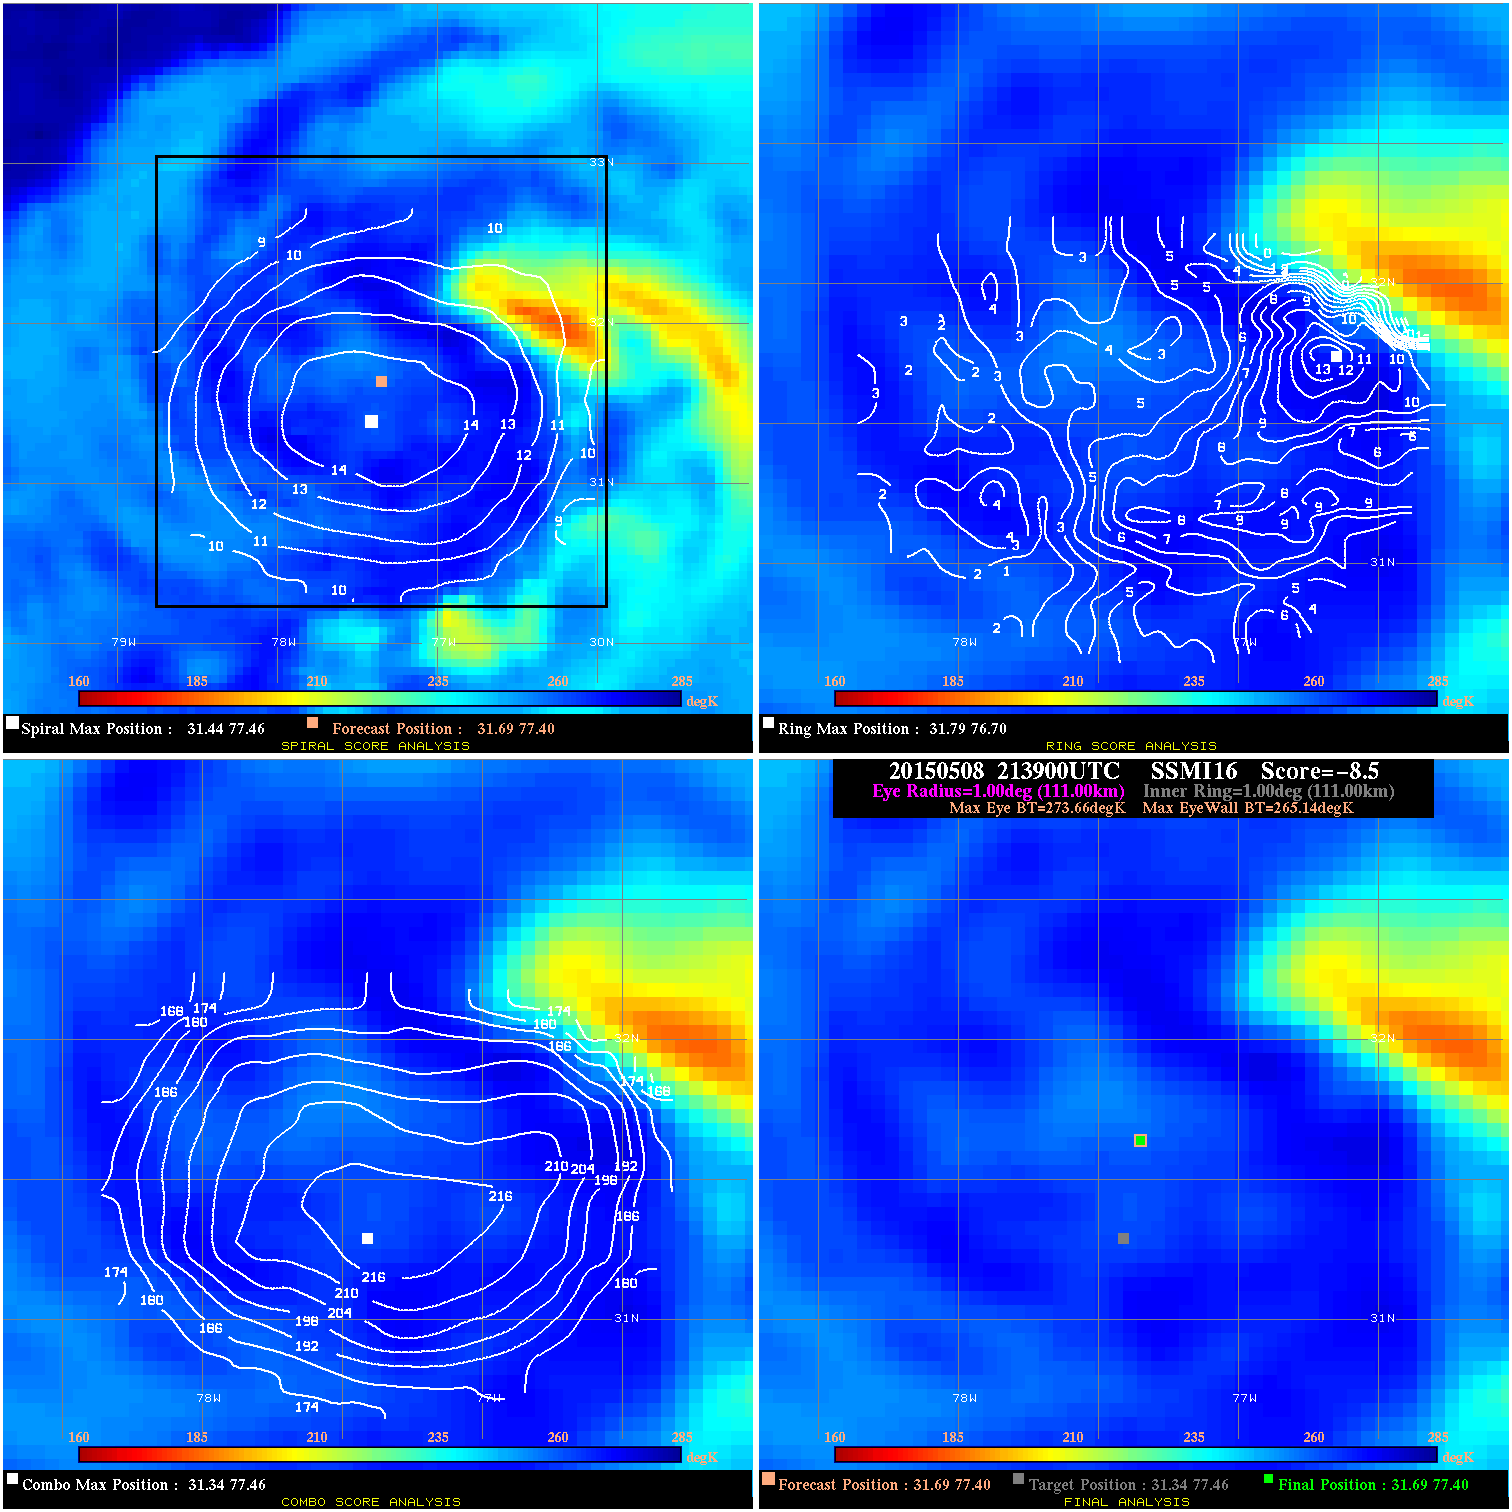
20150508 213900 -8.5 N/A 19.2% 222.20 8.52 40.0 SSMI16 31.7 77.4 31.7 77.4 31.3 77.5 Analysis Plot
20150508 235400 -930.0 N/A N/A 122.21 1271.5 50.0 SSMI19 32.0 77.3 32.0 77.3 31.9 76.6 Analysis Plot
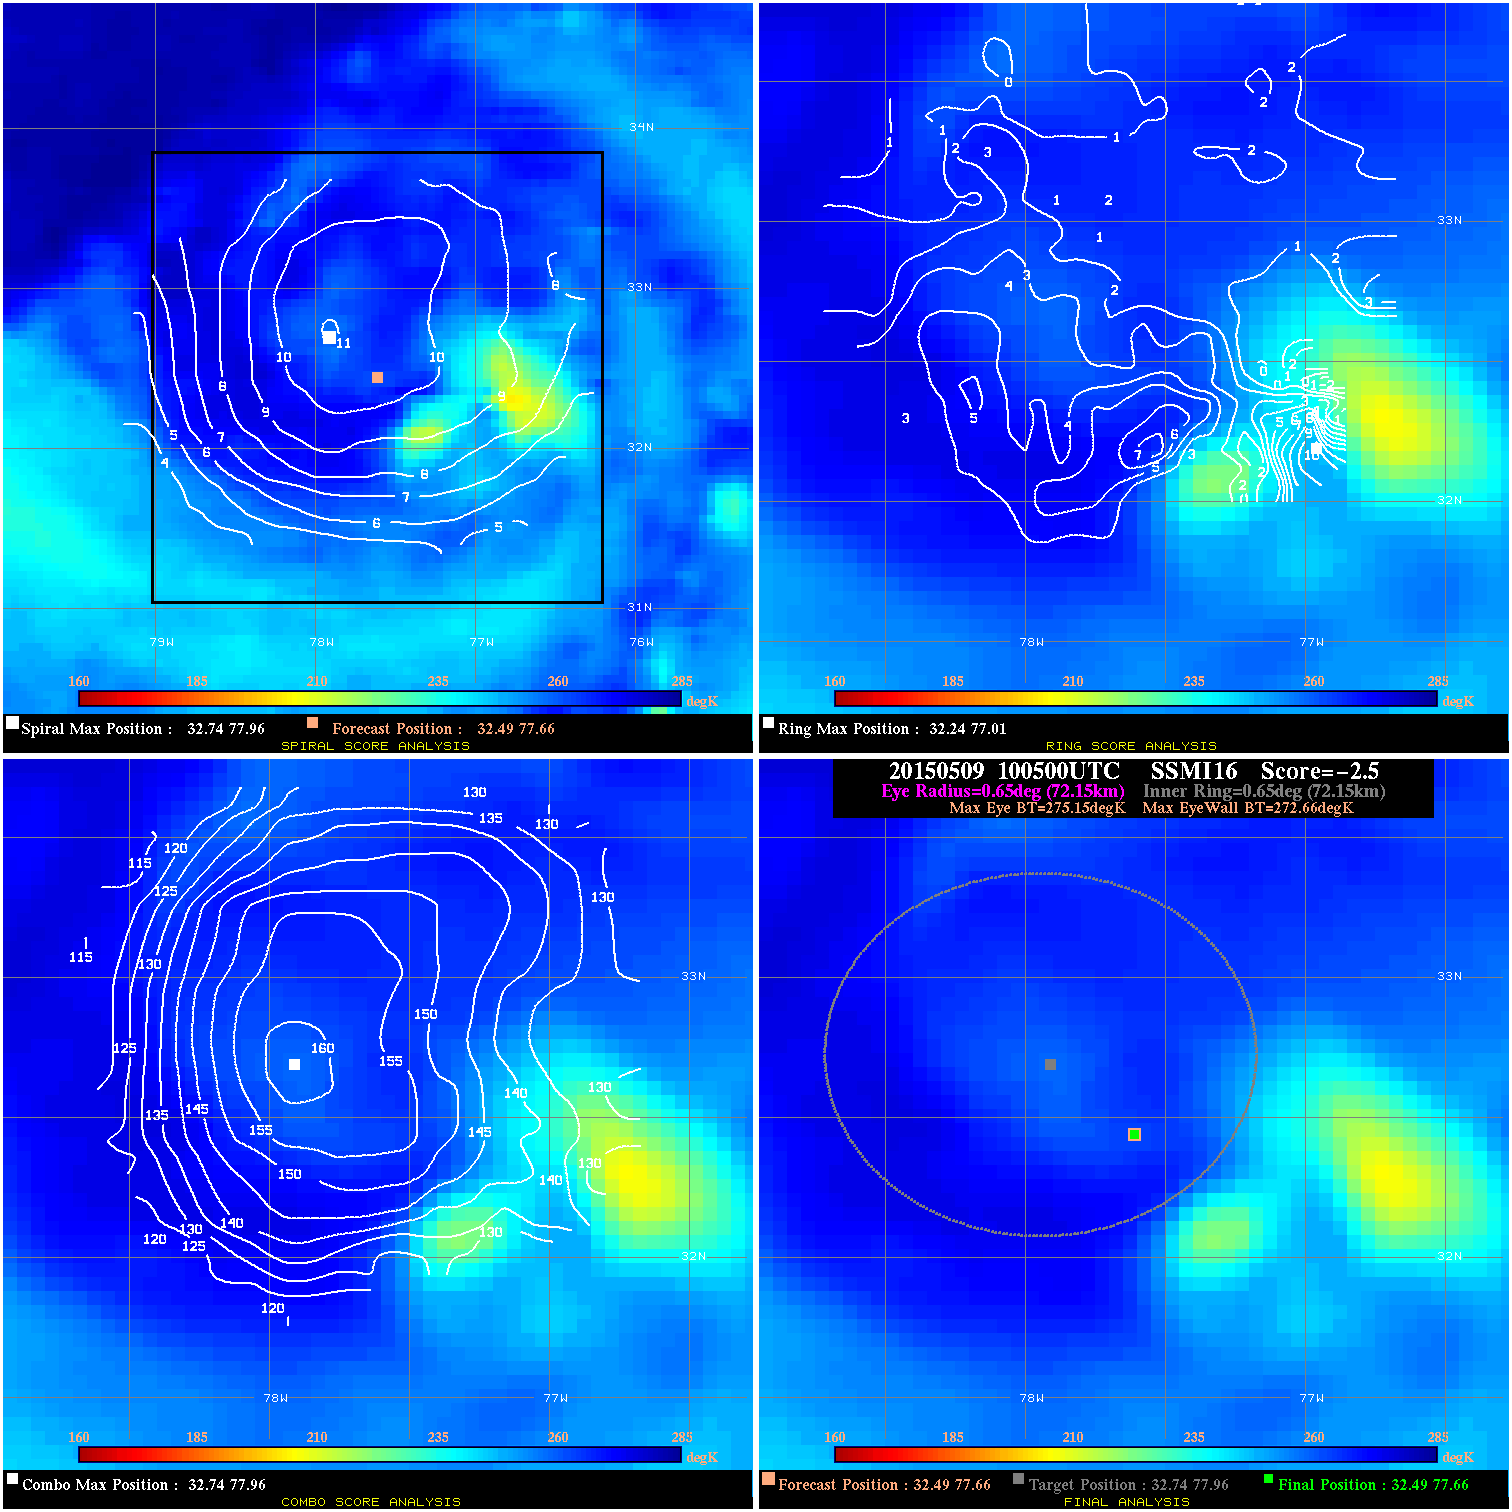
20150509 100500 -2.5 N/A 5.5% 144.43 2.49 50.0 SSMI16 32.5 77.7 32.5 77.7 32.7 78.0 Analysis Plot
20150509 115800 -1.0 N/A 13.7% 144.43 1.04 50.0 SSMI17 32.6 77.8 32.6 77.8 32.4 78.2 Analysis Plot
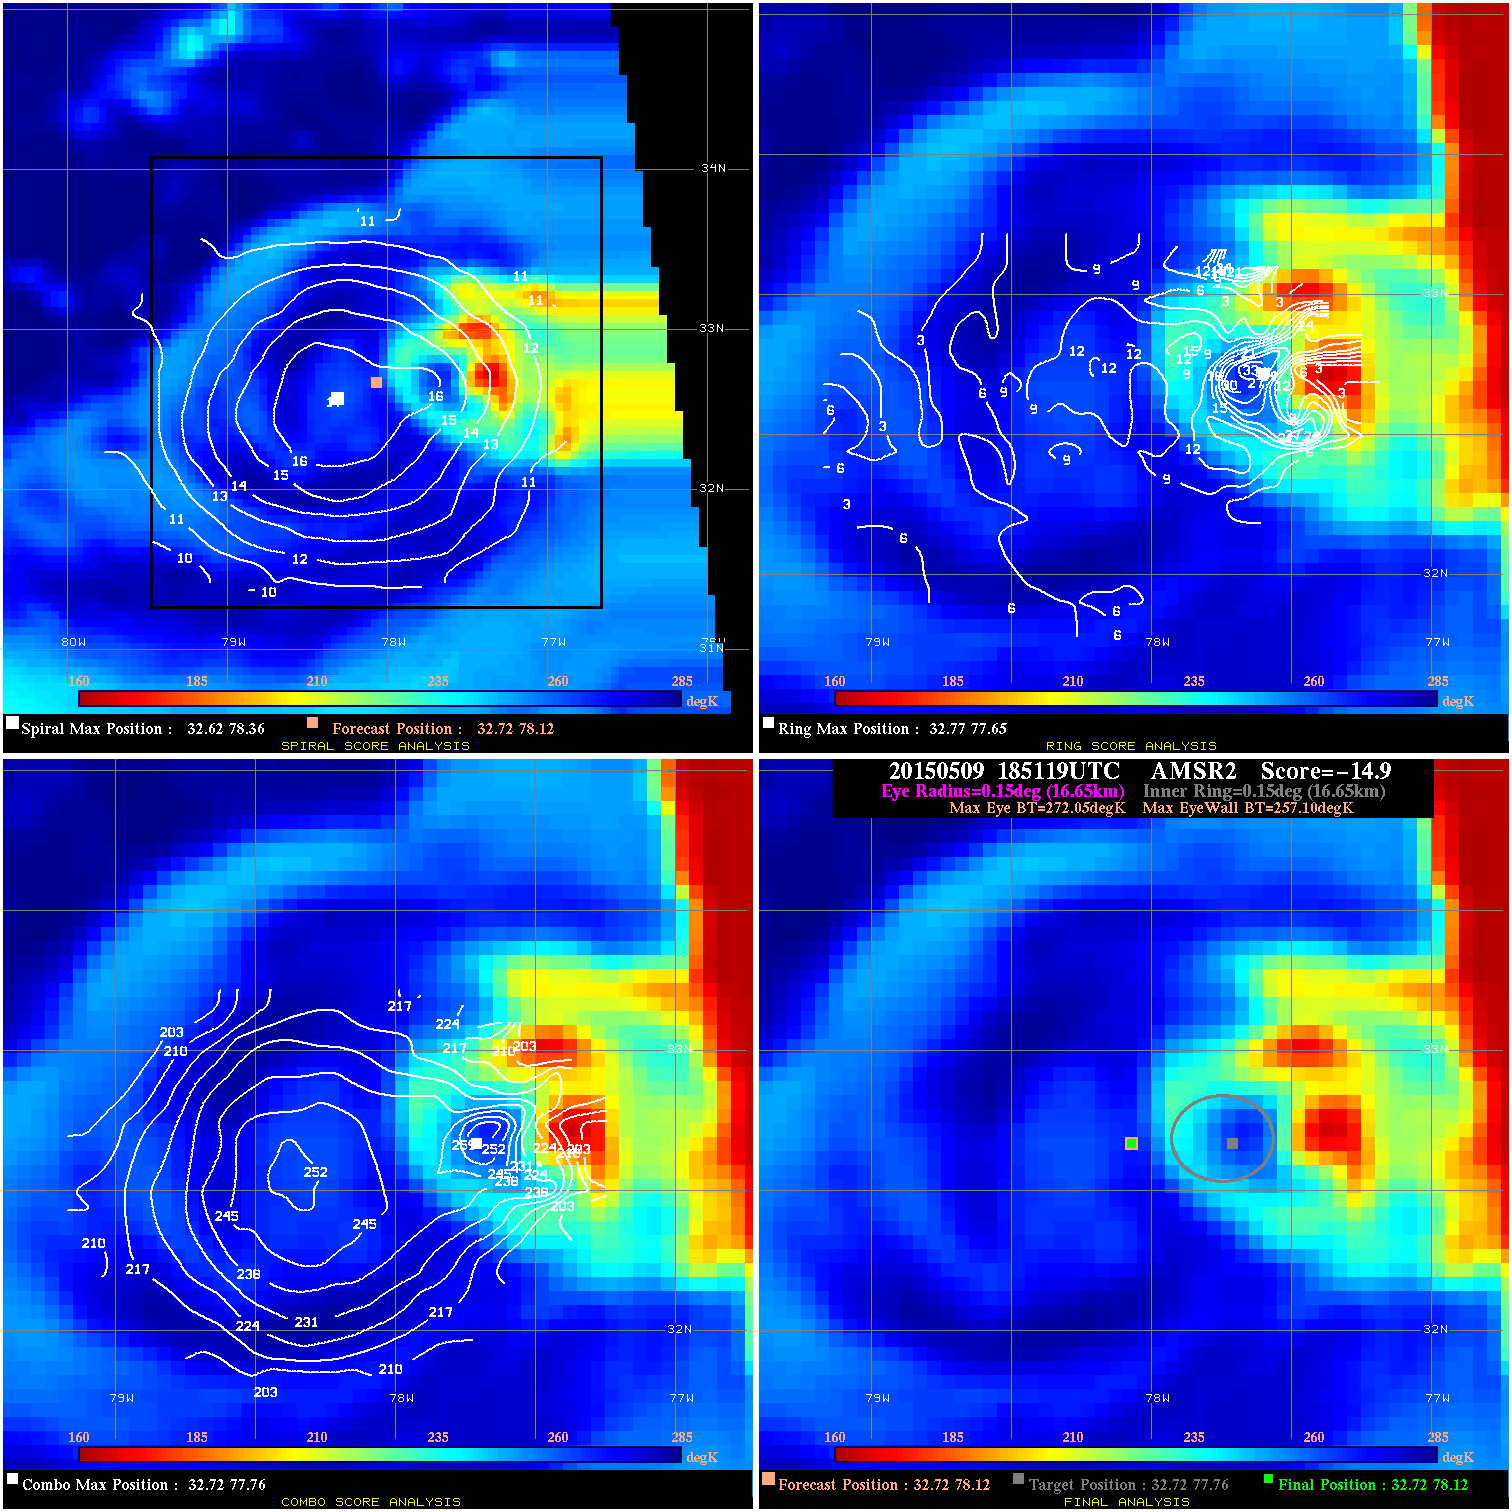
20150509 185119 -14.9 N/A 13.7% 33.33 14.95 50.0 AMSR2 32.7 78.1 32.7 78.1 32.7 77.8 Analysis Plot
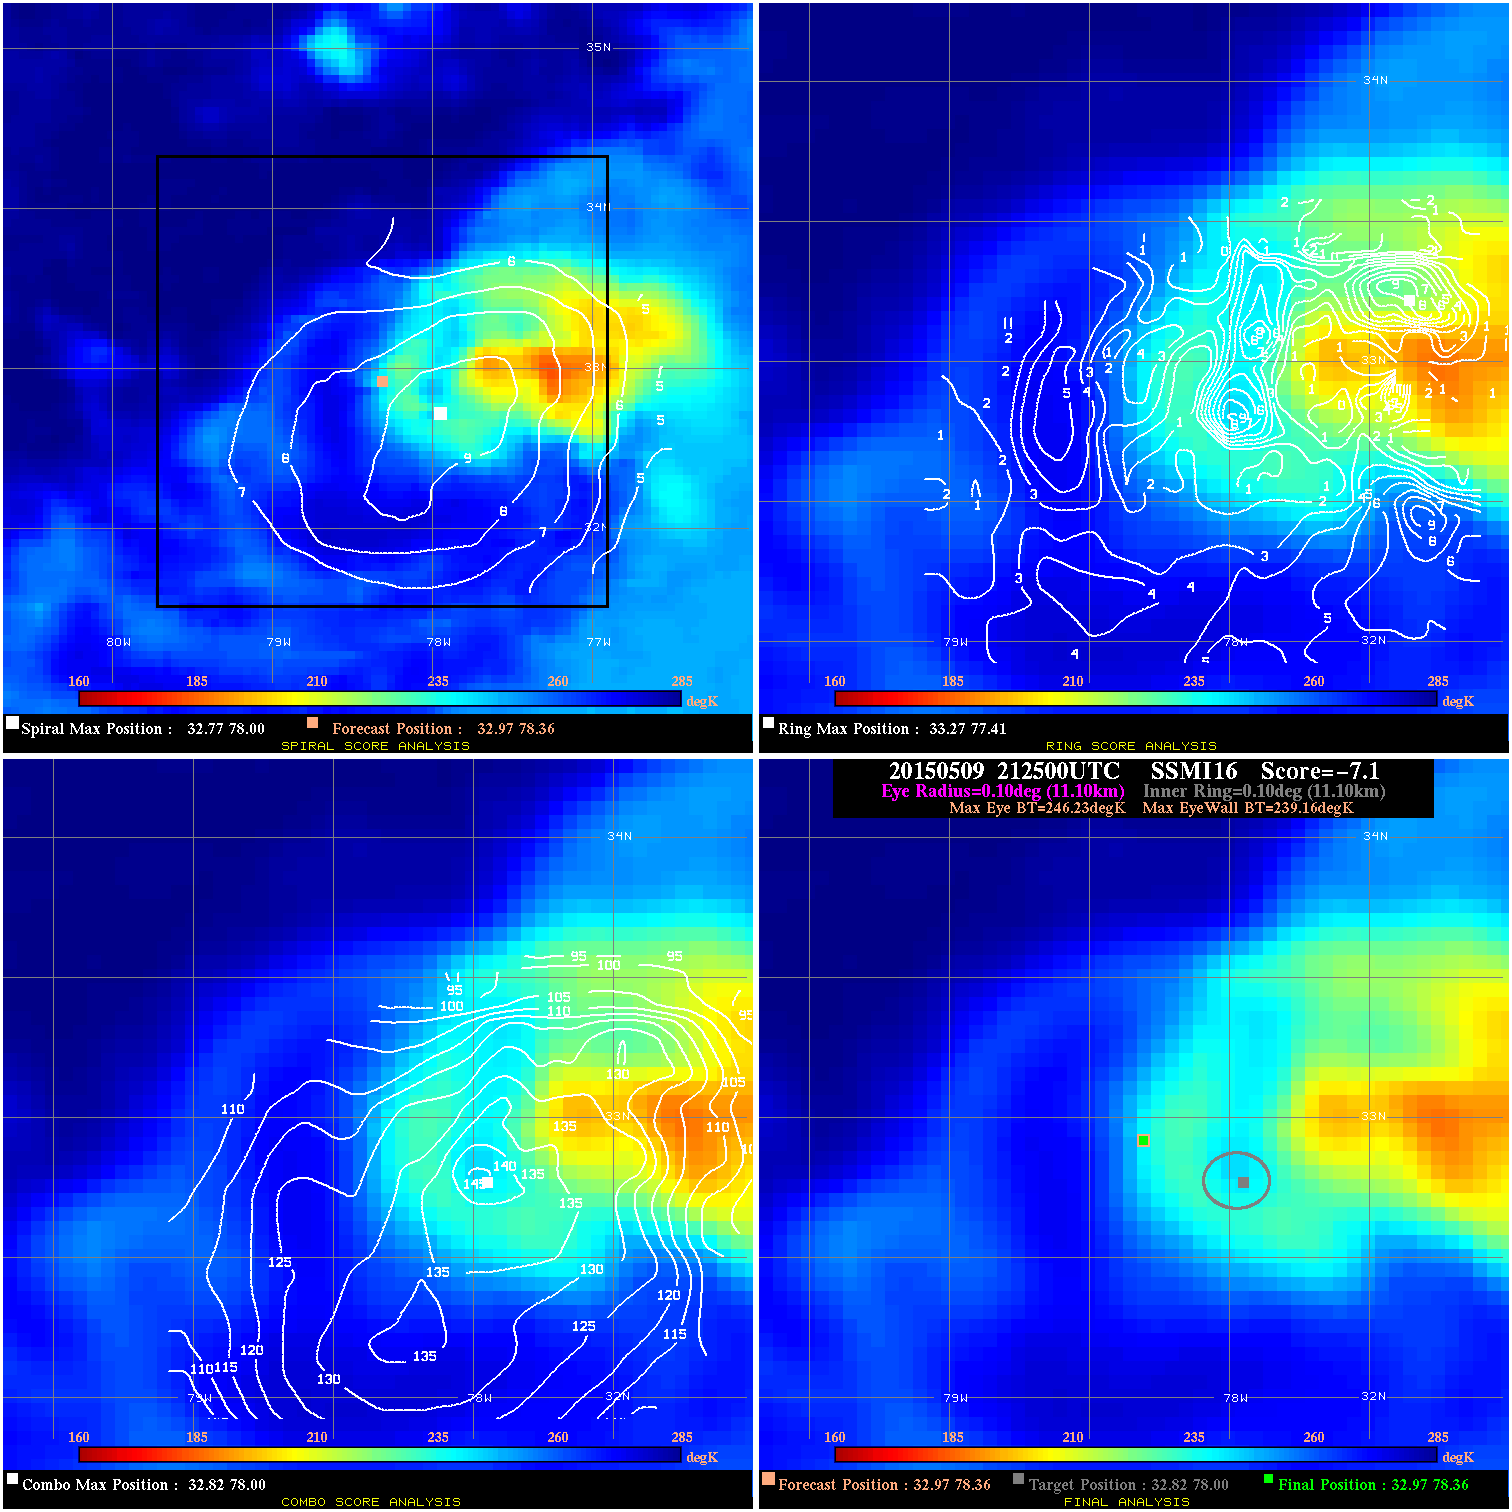
20150509 212500 -7.1 N/A 74.0% 22.22 7.07 50.0 SSMI16 33.0 78.4 33.0 78.4 32.8 78.0 Analysis Plot
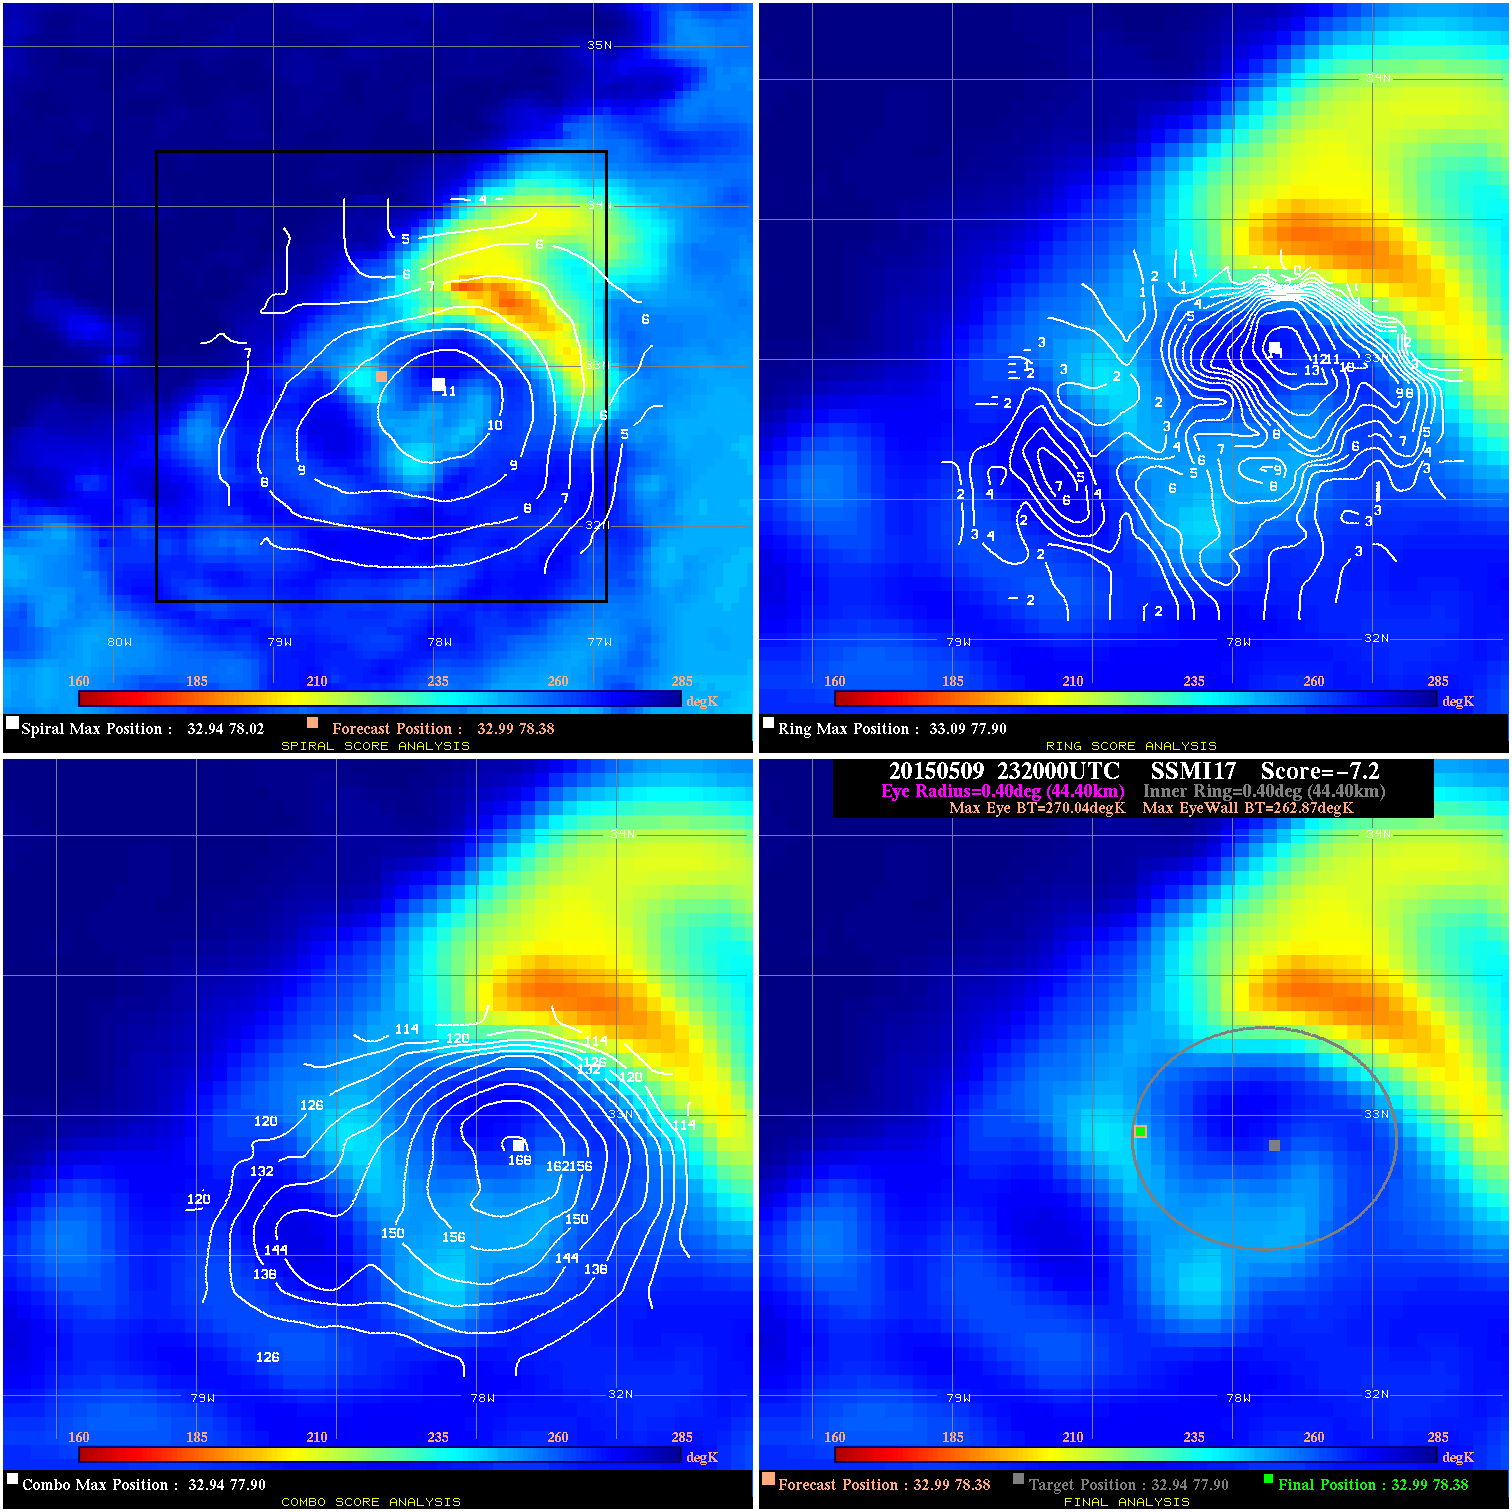
20150509 232000 -7.2 N/A 31.5% 88.88 7.17 50.0 SSMI17 33.0 78.4 33.0 78.4 32.9 77.9 Analysis Plot
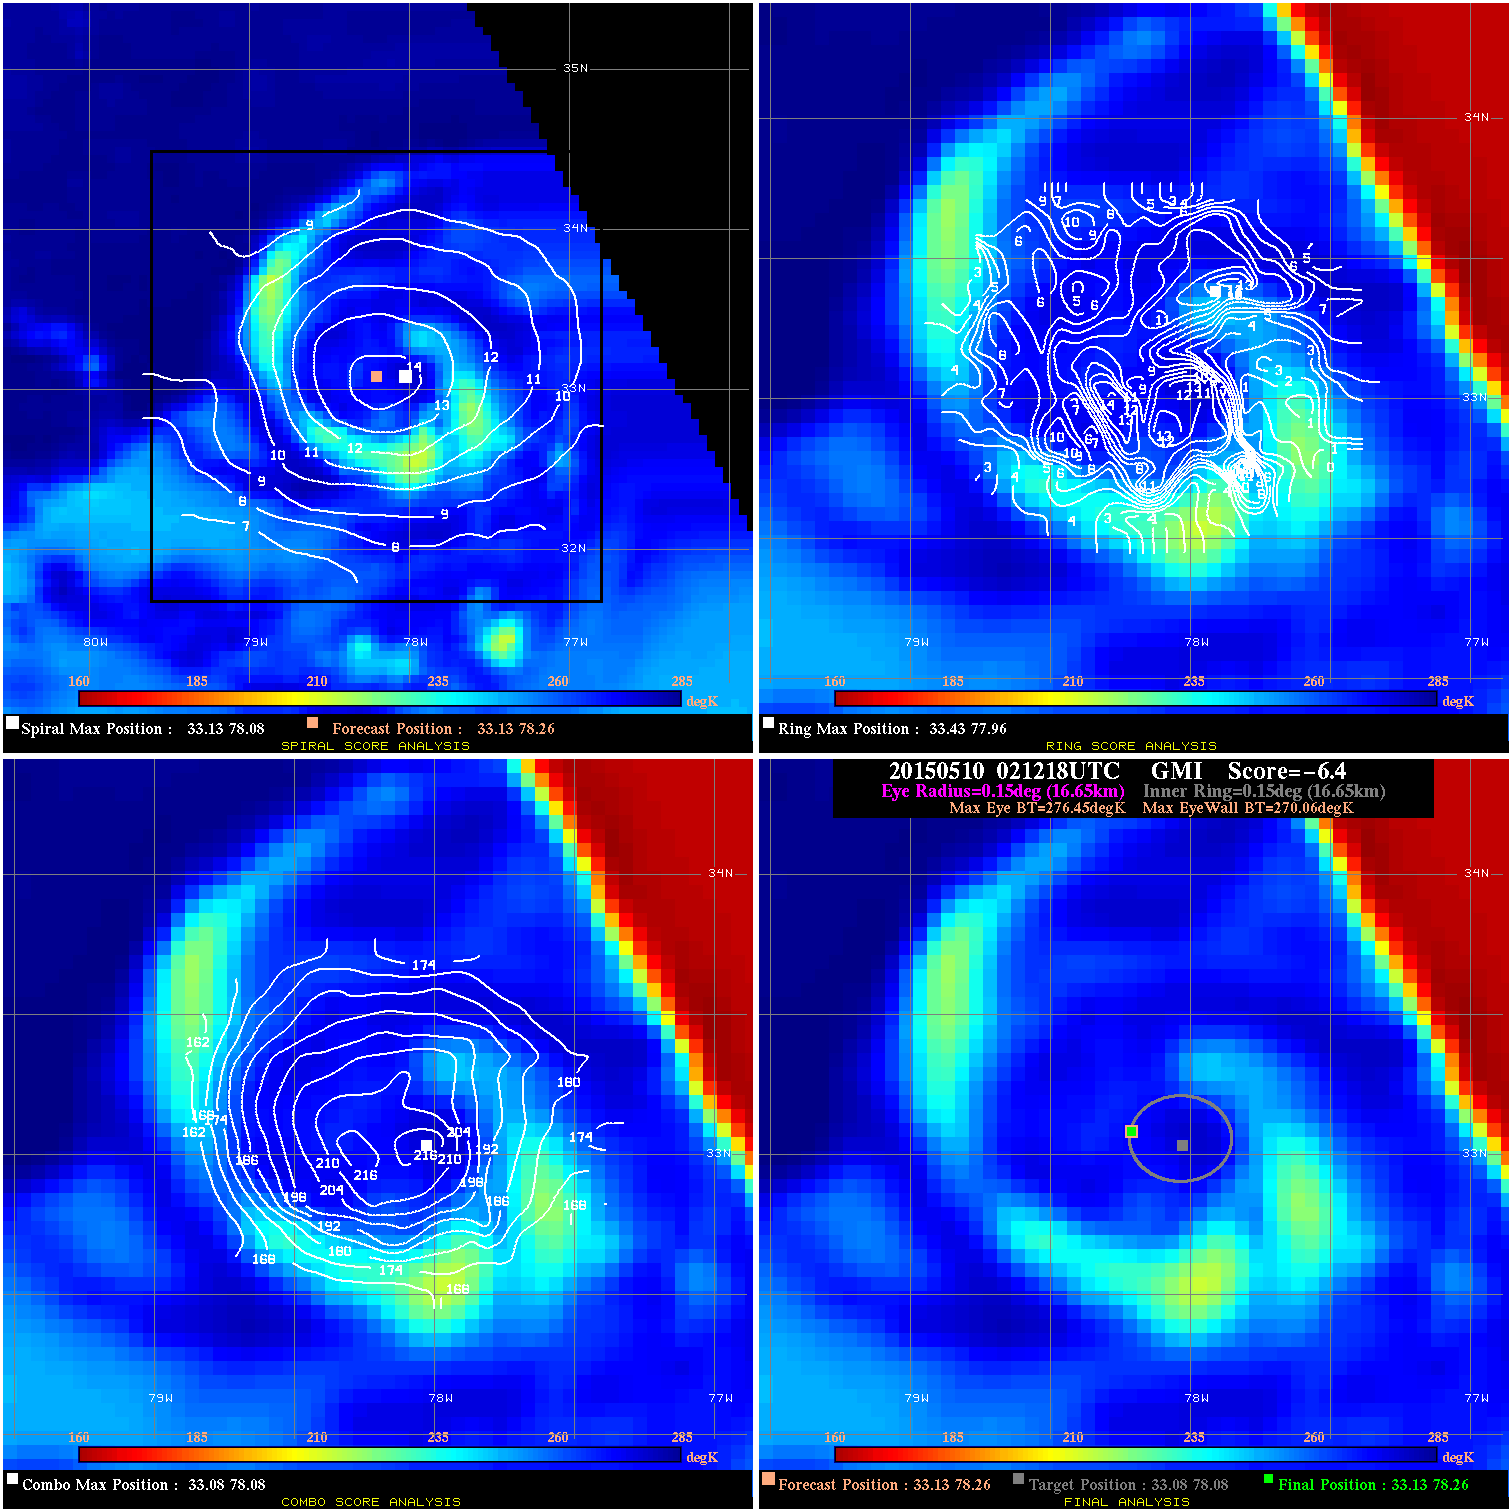
20150510 021218 -6.4 N/A N/A 33.33 6.39 50.0 GMI 33.1 78.3 33.1 78.3 33.1 78.1 Analysis Plot
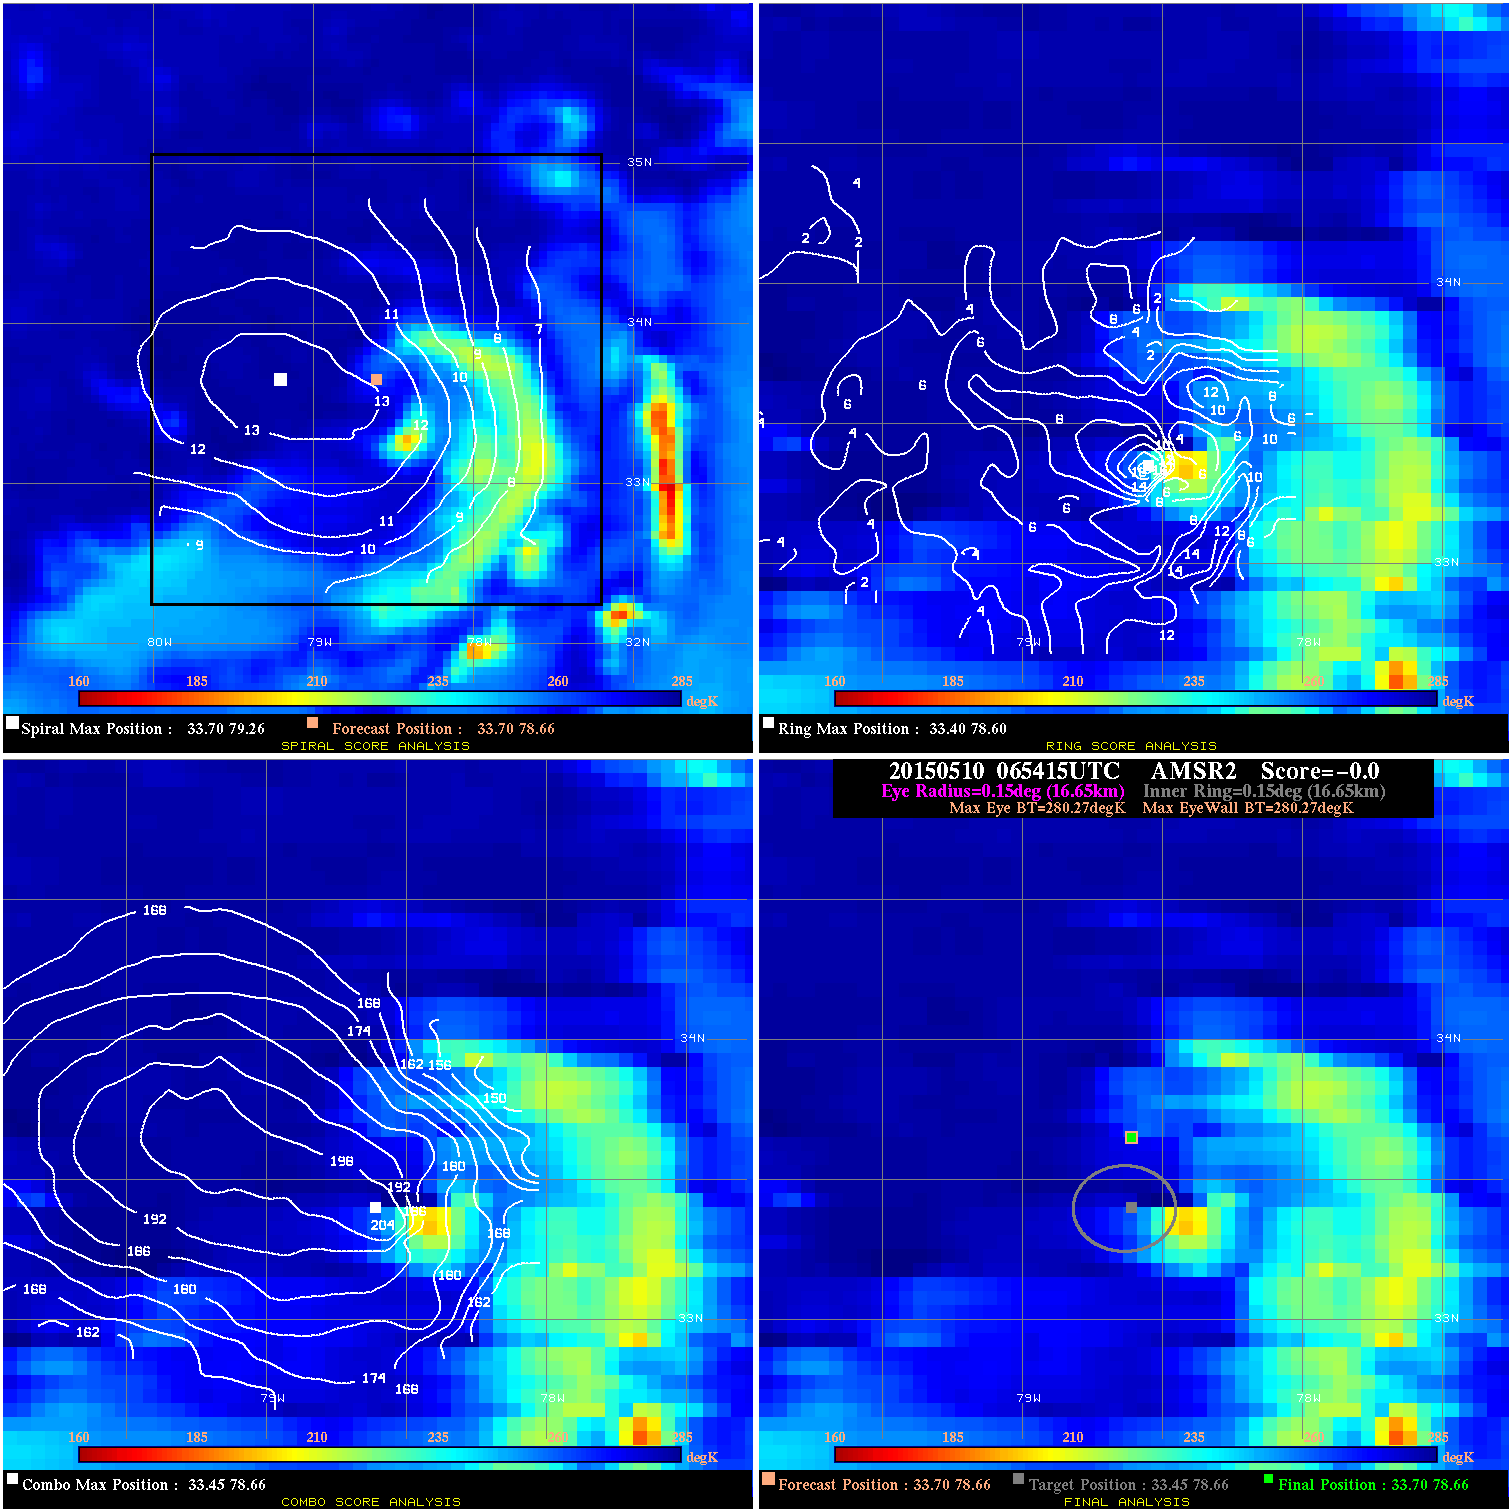
20150510 065415 -0.0 N/A N/A N/A 0.00 40.0 AMSR2 33.7 78.7 33.7 78.7 33.5 78.7 Analysis Plot
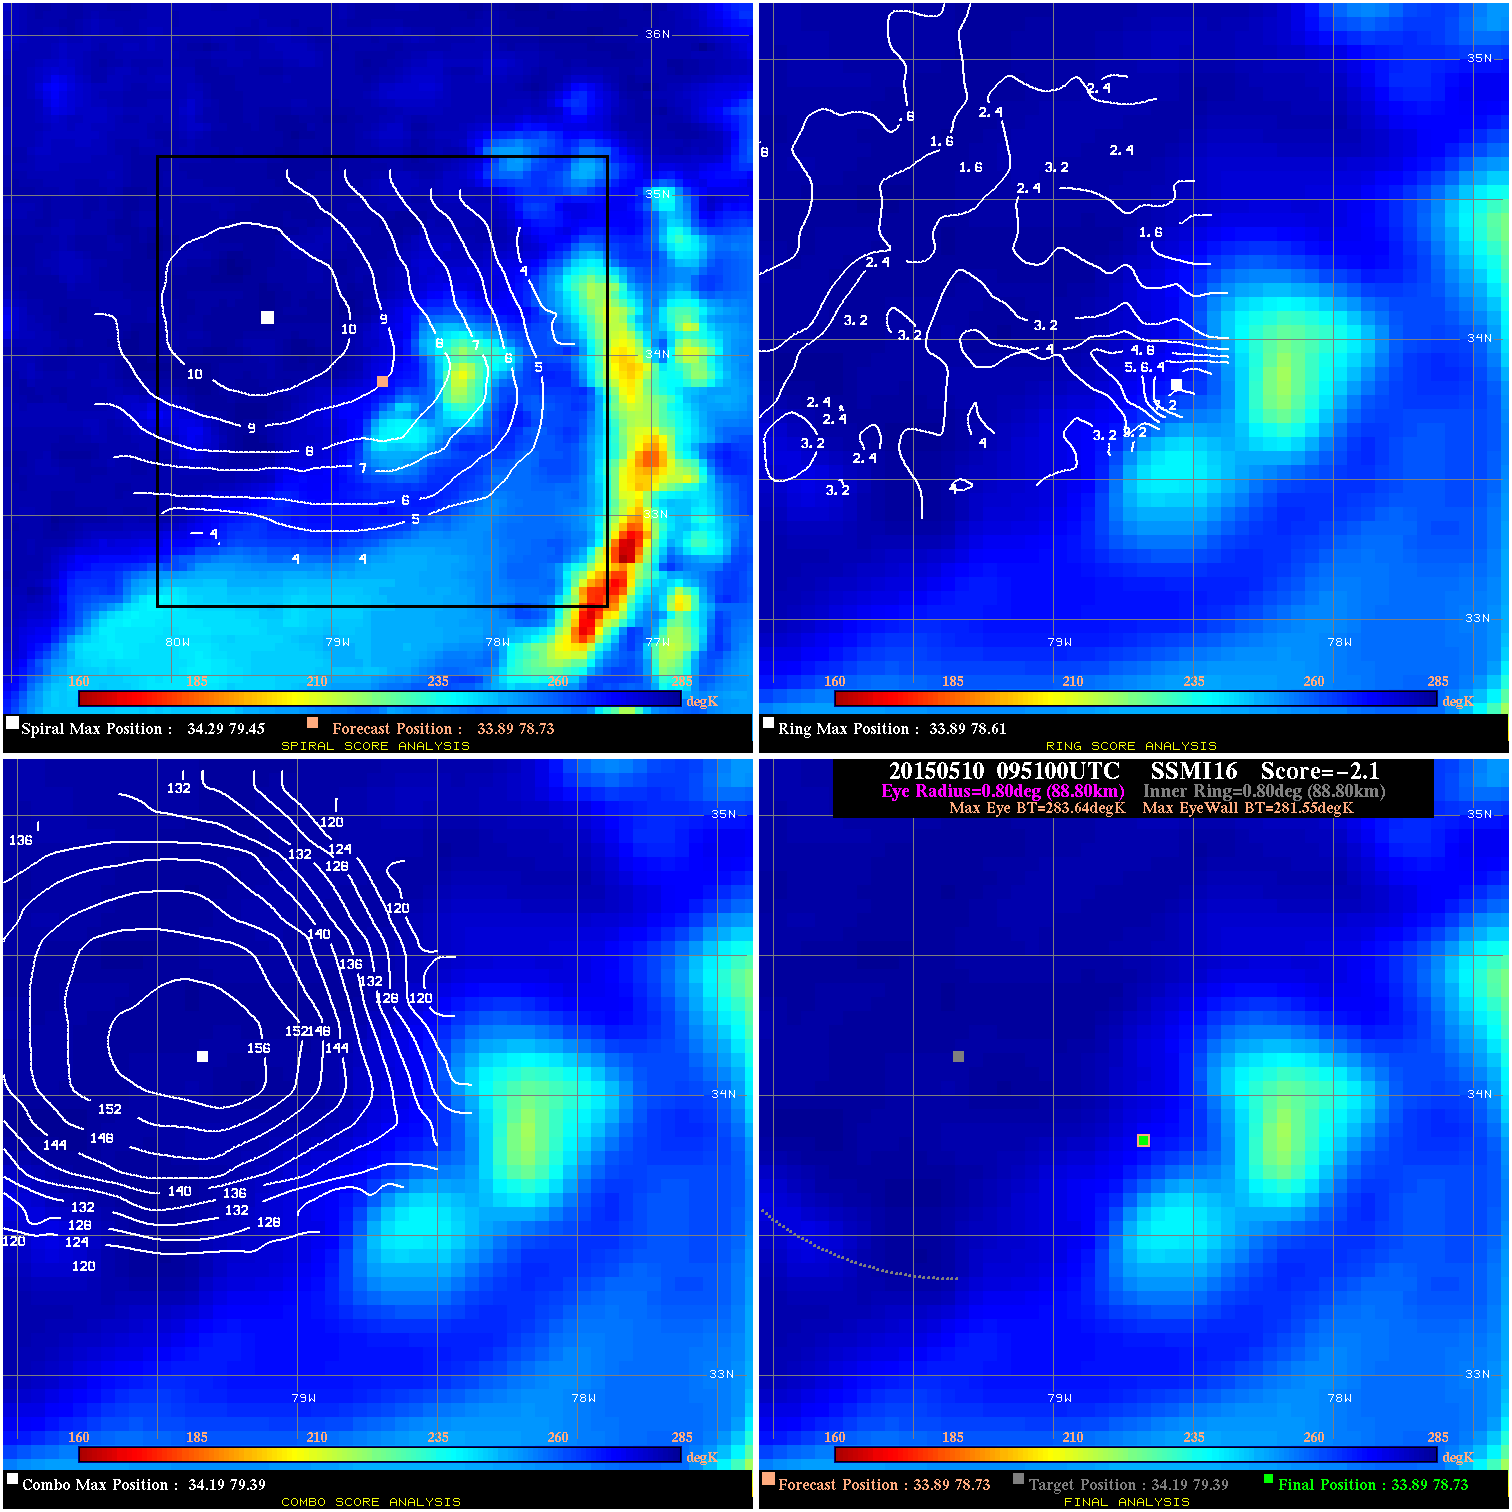
20150510 095100 -2.1 N/A 1.4% 177.76 2.09 40.0 SSMI16 33.9 78.7 33.9 78.7 34.2 79.4 Analysis Plot
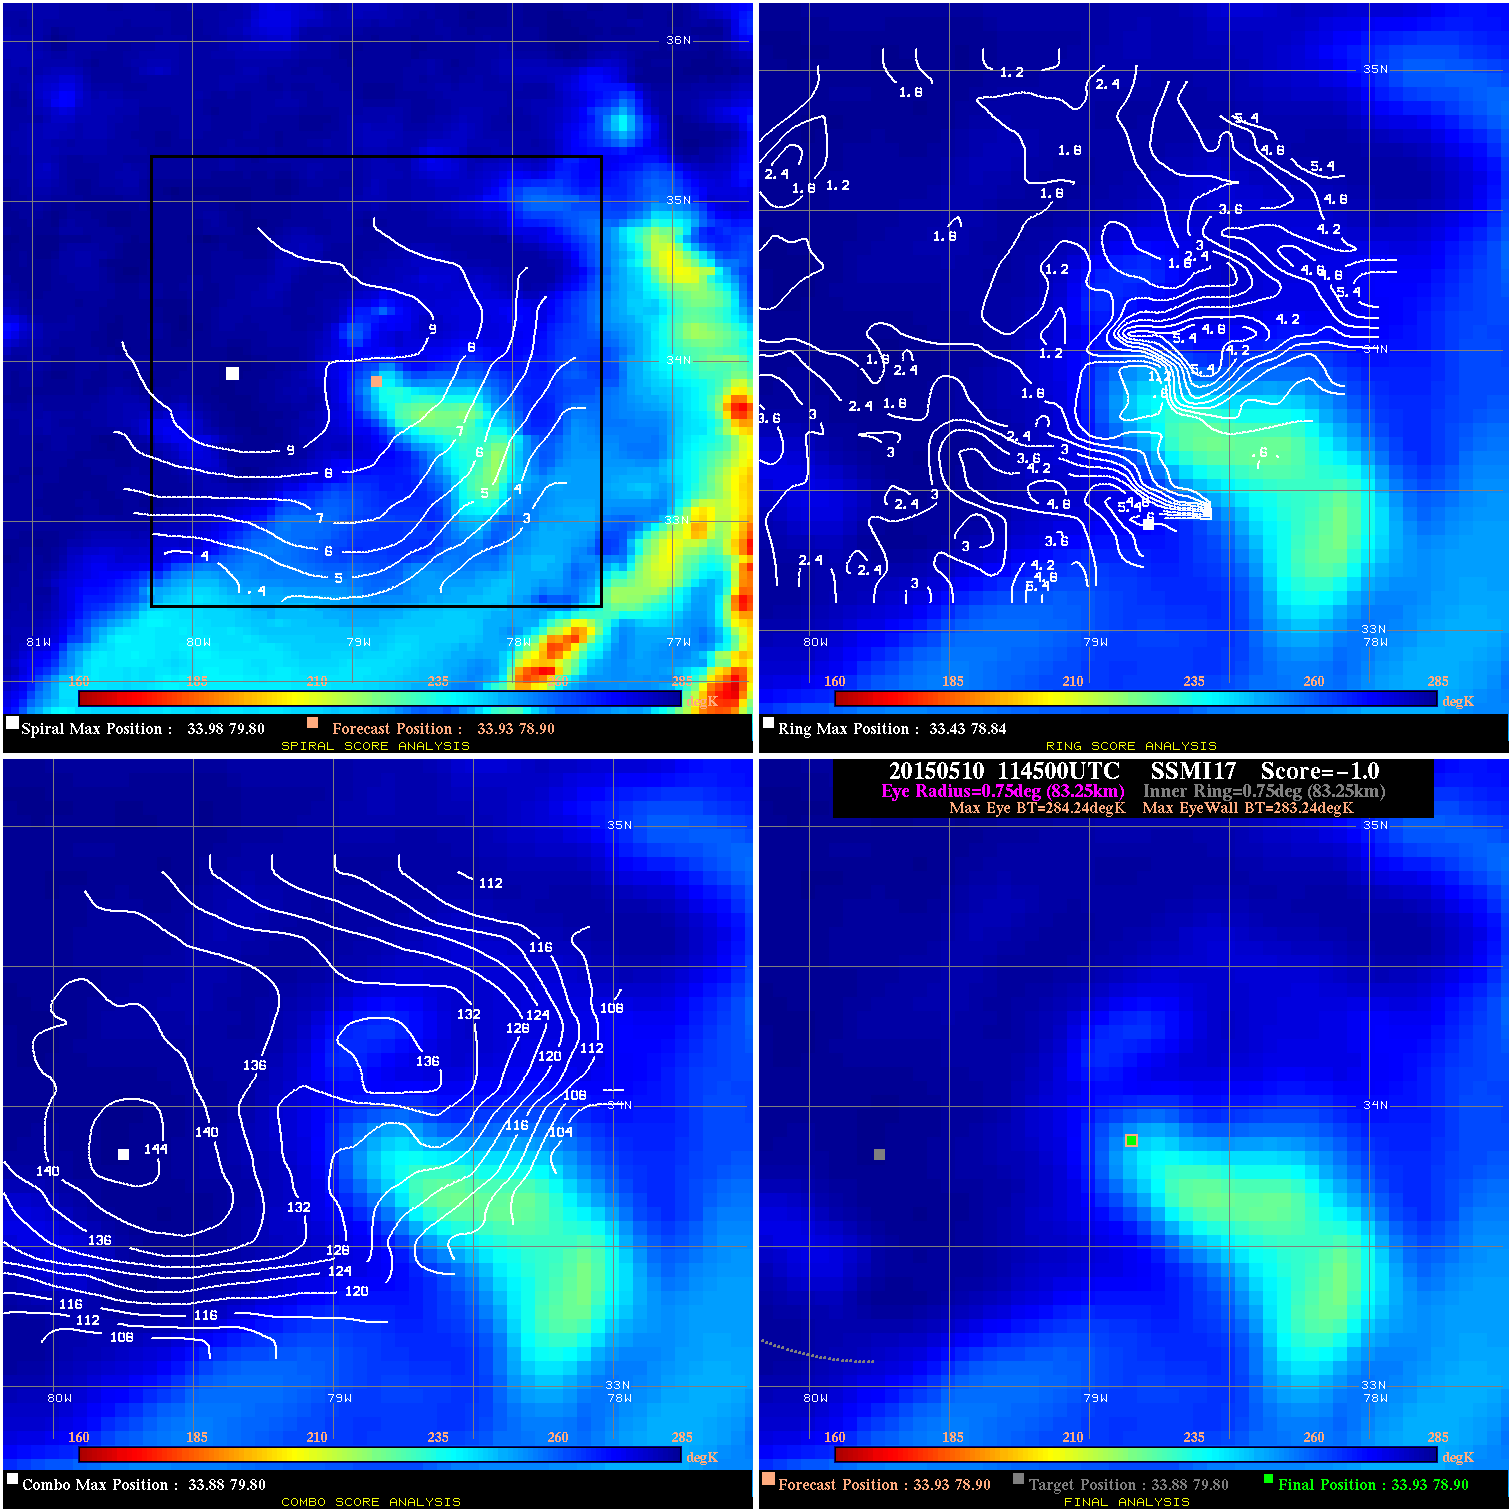
20150510 114500 -1.0 N/A N/A 166.65 1.00 35.0 SSMI17 33.9 78.9 33.9 78.9 33.9 79.8 Analysis Plot
20150510 120500 -1.6 N/A N/A 22.22 1.61 35.0 SSMI19 34.0 78.9 34.0 78.9 34.1 78.9 Analysis Plot
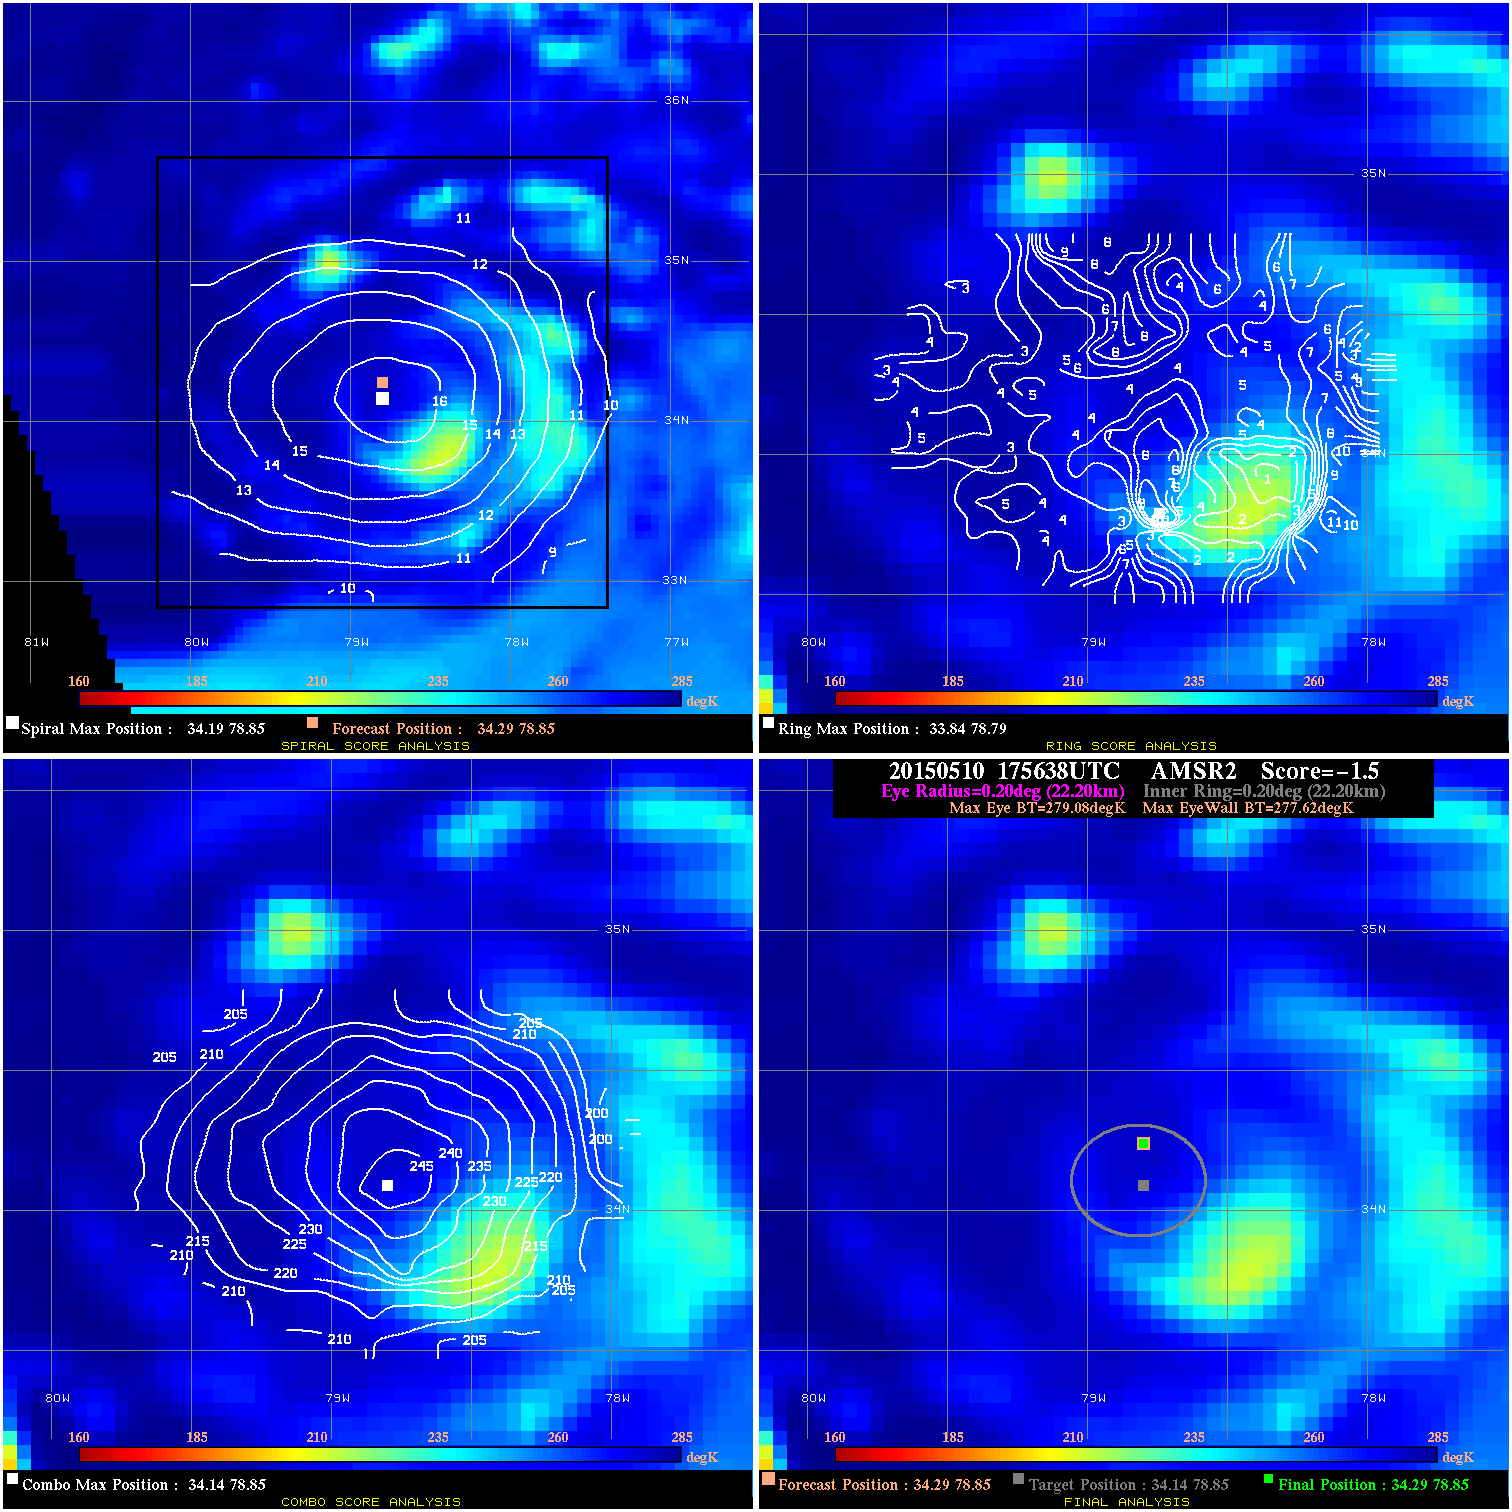
20150510 175638 -1.5 N/A 8.2% 44.44 1.46 35.0 AMSR2 34.3 78.8 34.3 78.8 34.1 78.8 Analysis Plot
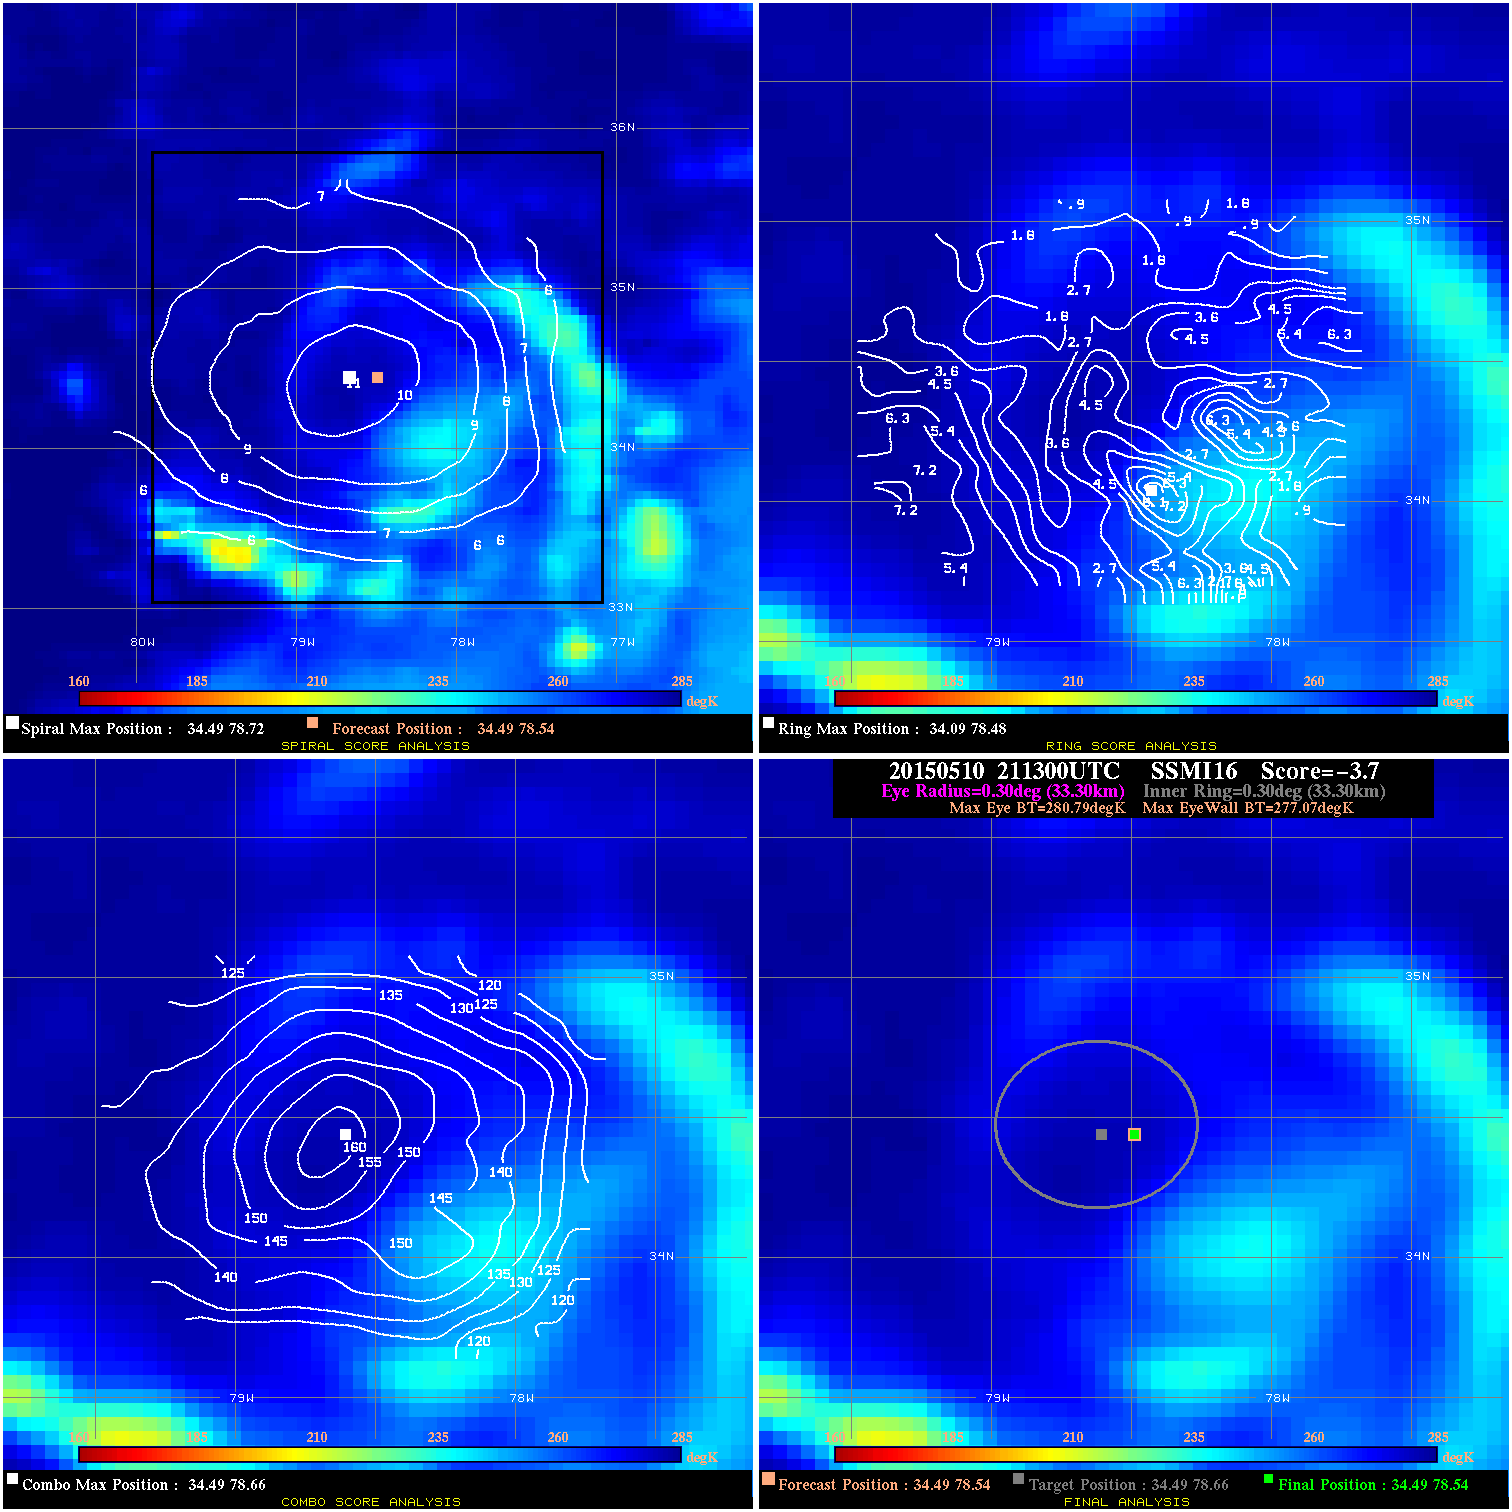
20150510 211300 -3.7 N/A N/A 66.66 3.72 30.0 SSMI16 34.5 78.5 34.5 78.5 34.5 78.7 Analysis Plot
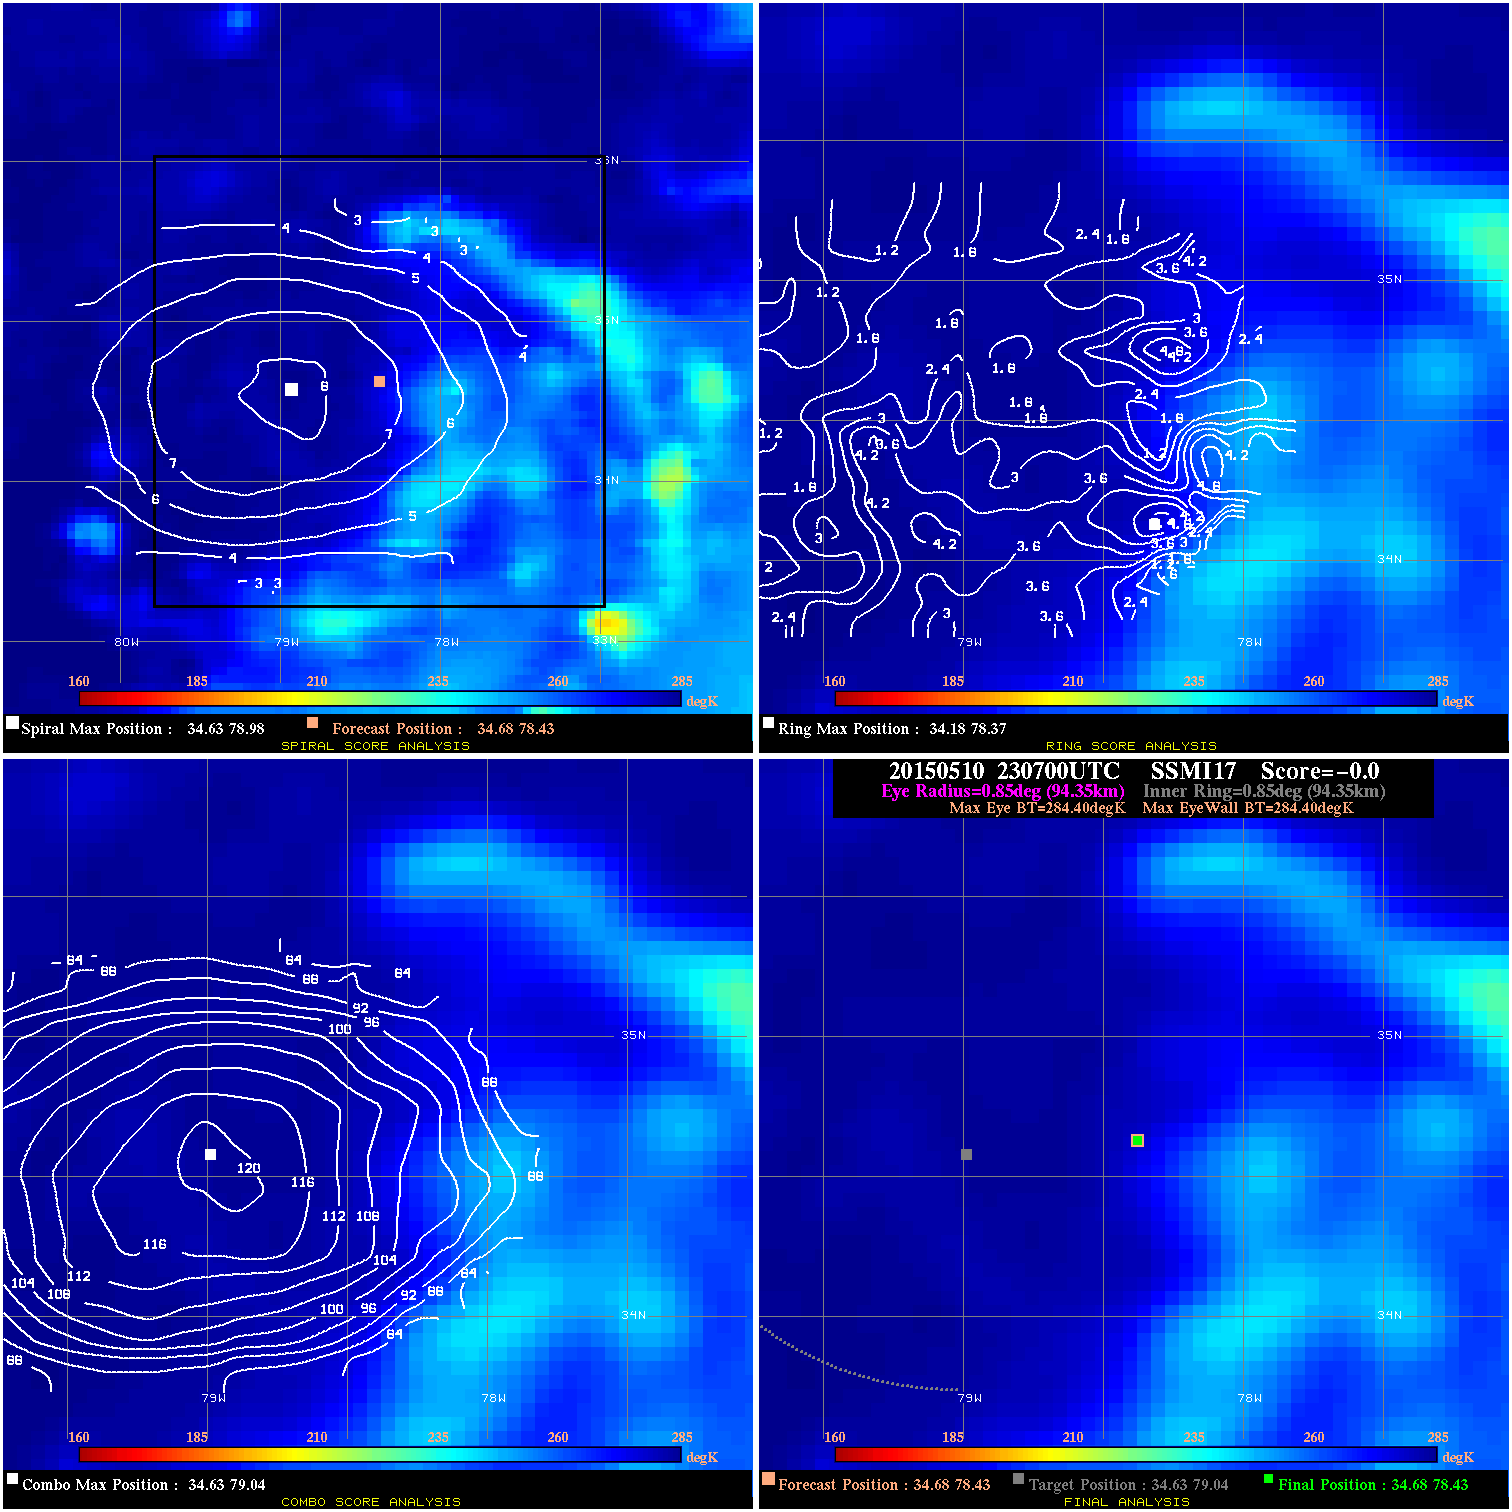
20150510 230700 -0.0 N/A N/A N/A 0.00 30.0 SSMI17 34.7 78.4 34.7 78.4 34.6 79.0 Analysis Plot
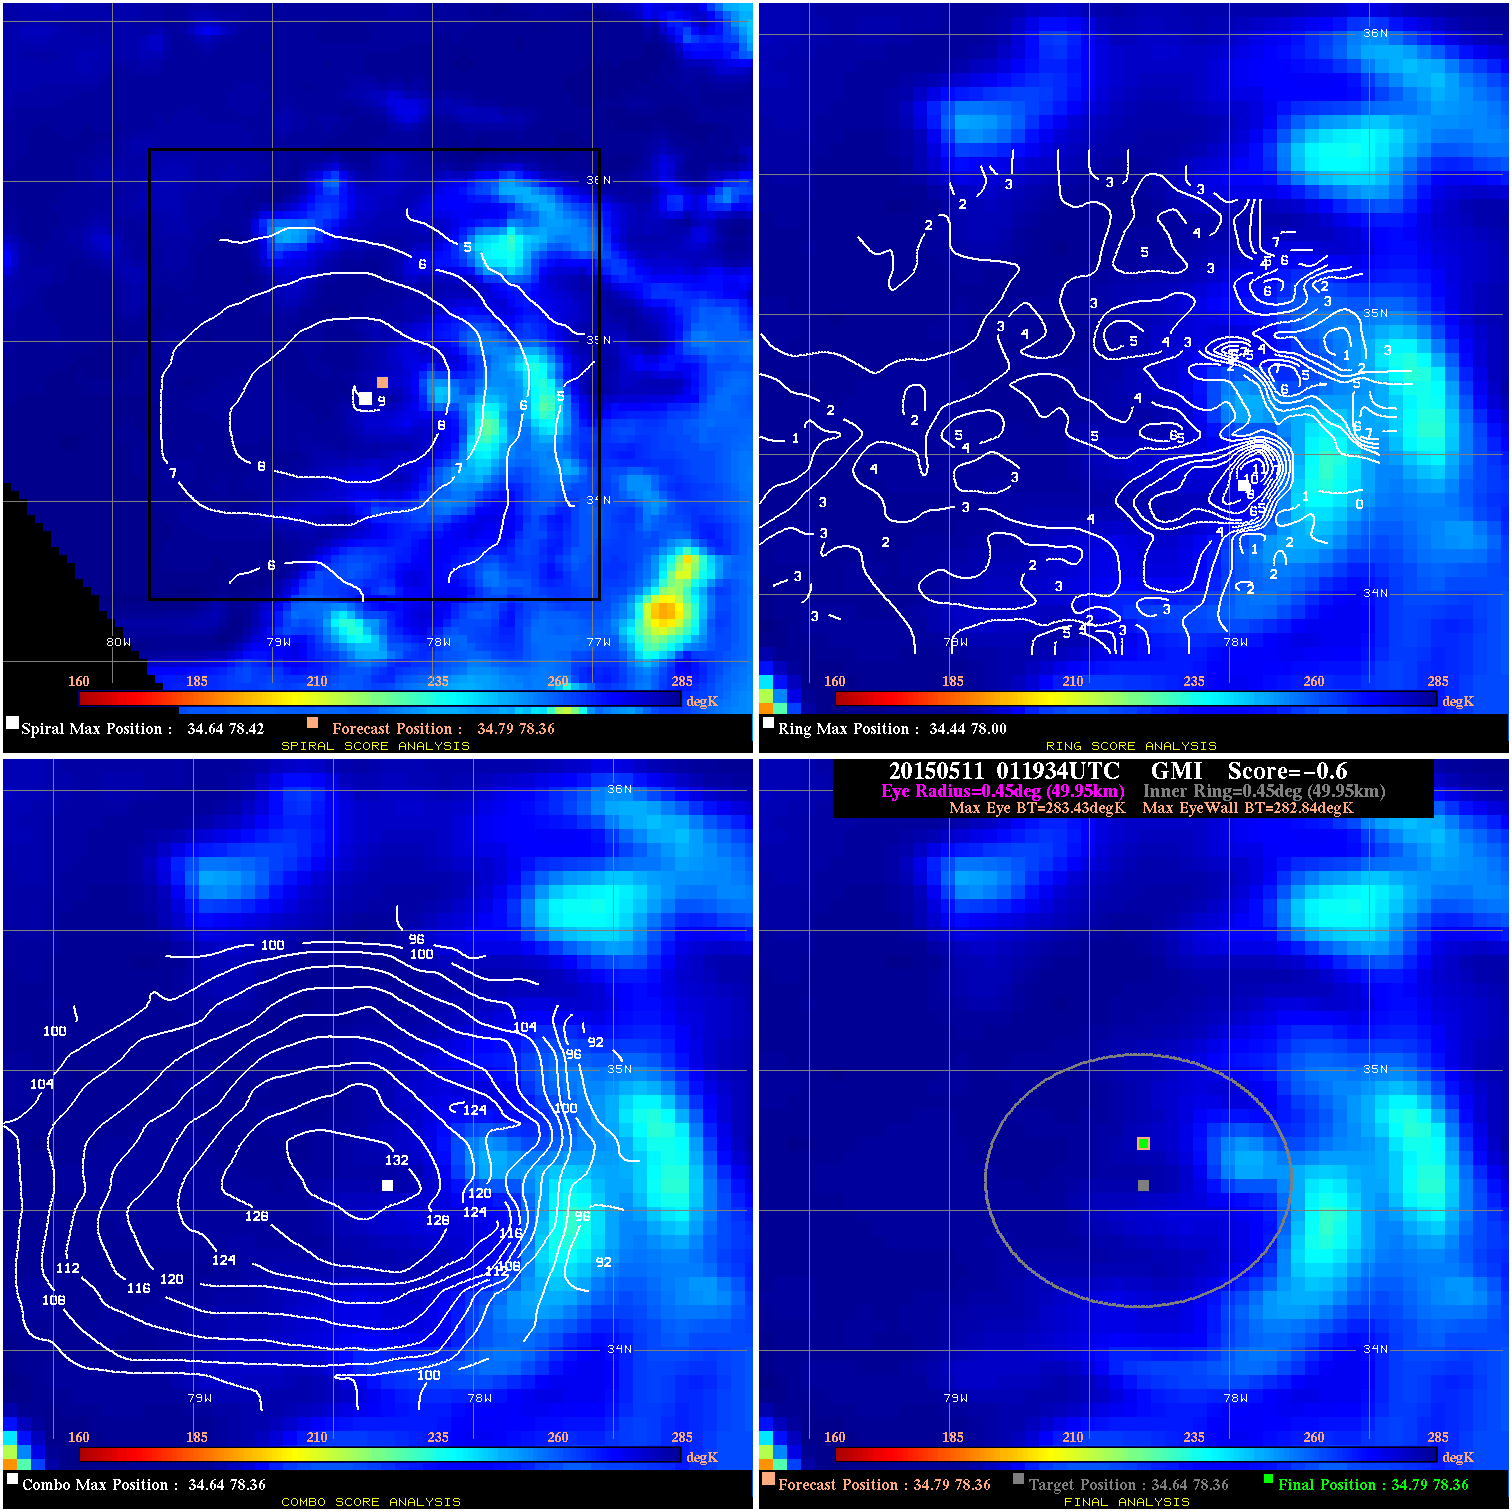
20150511 011934 -0.6 N/A N/A 99.99 .59 30.0 GMI 34.8 78.4 34.8 78.4 34.6 78.4 Analysis Plot
|
|
Legend: - Date/Time are determined from PMW imagery at Forecast (initial guess) Lat/Lon position. - Positive/Negative Latitude = North/South Hemisphere; Longitude = Western/Eastern Hemisphere. - "Ring Diam" value indicates the estimated surface eyewall diameter in km (the MI eyewall edge diameter minus 10 km). - "Ring Pct" is the percentage of the "ring" (eyewall inner boundary) that is 1) colder than the "hot spot" (warmest eye pixel) in the eye by 20K, or 2) the percentage that is a) colder than 232K and b) colder than the "hot spot" by 10K, whichever is greater. - Values are red if Ring % <= 65, yellow/brown if Ring % <= 85 and green if Ring % > 85. - "Tb diff" is the difference between the "hot spot" (warmest eye pixel) and the warmest pixel on the eyewall. - Intensity score are listed as negative, and not used, when the JTWC or NHC estimated Vmax is <55 kts in order to rule out weak but highly symmetric TCs. - Error messages in intensity scores: -920 is used when the hottest pixel in the eye is <200K, to prevent false positives; -930 means <85% of eyewall has observations/data. |