Tropical Depression 12W
|
Passive Microwave (PMW) Intensity Information Advanced Dvorak Technique (ADT) Version 8.2.1 |
Overpass Inten Ring Ring Wind Forecast Final Target
Date Time Score Meaning Pct Diam BTdiff Est Sat Lat Lon Lat Lon Lat Lon
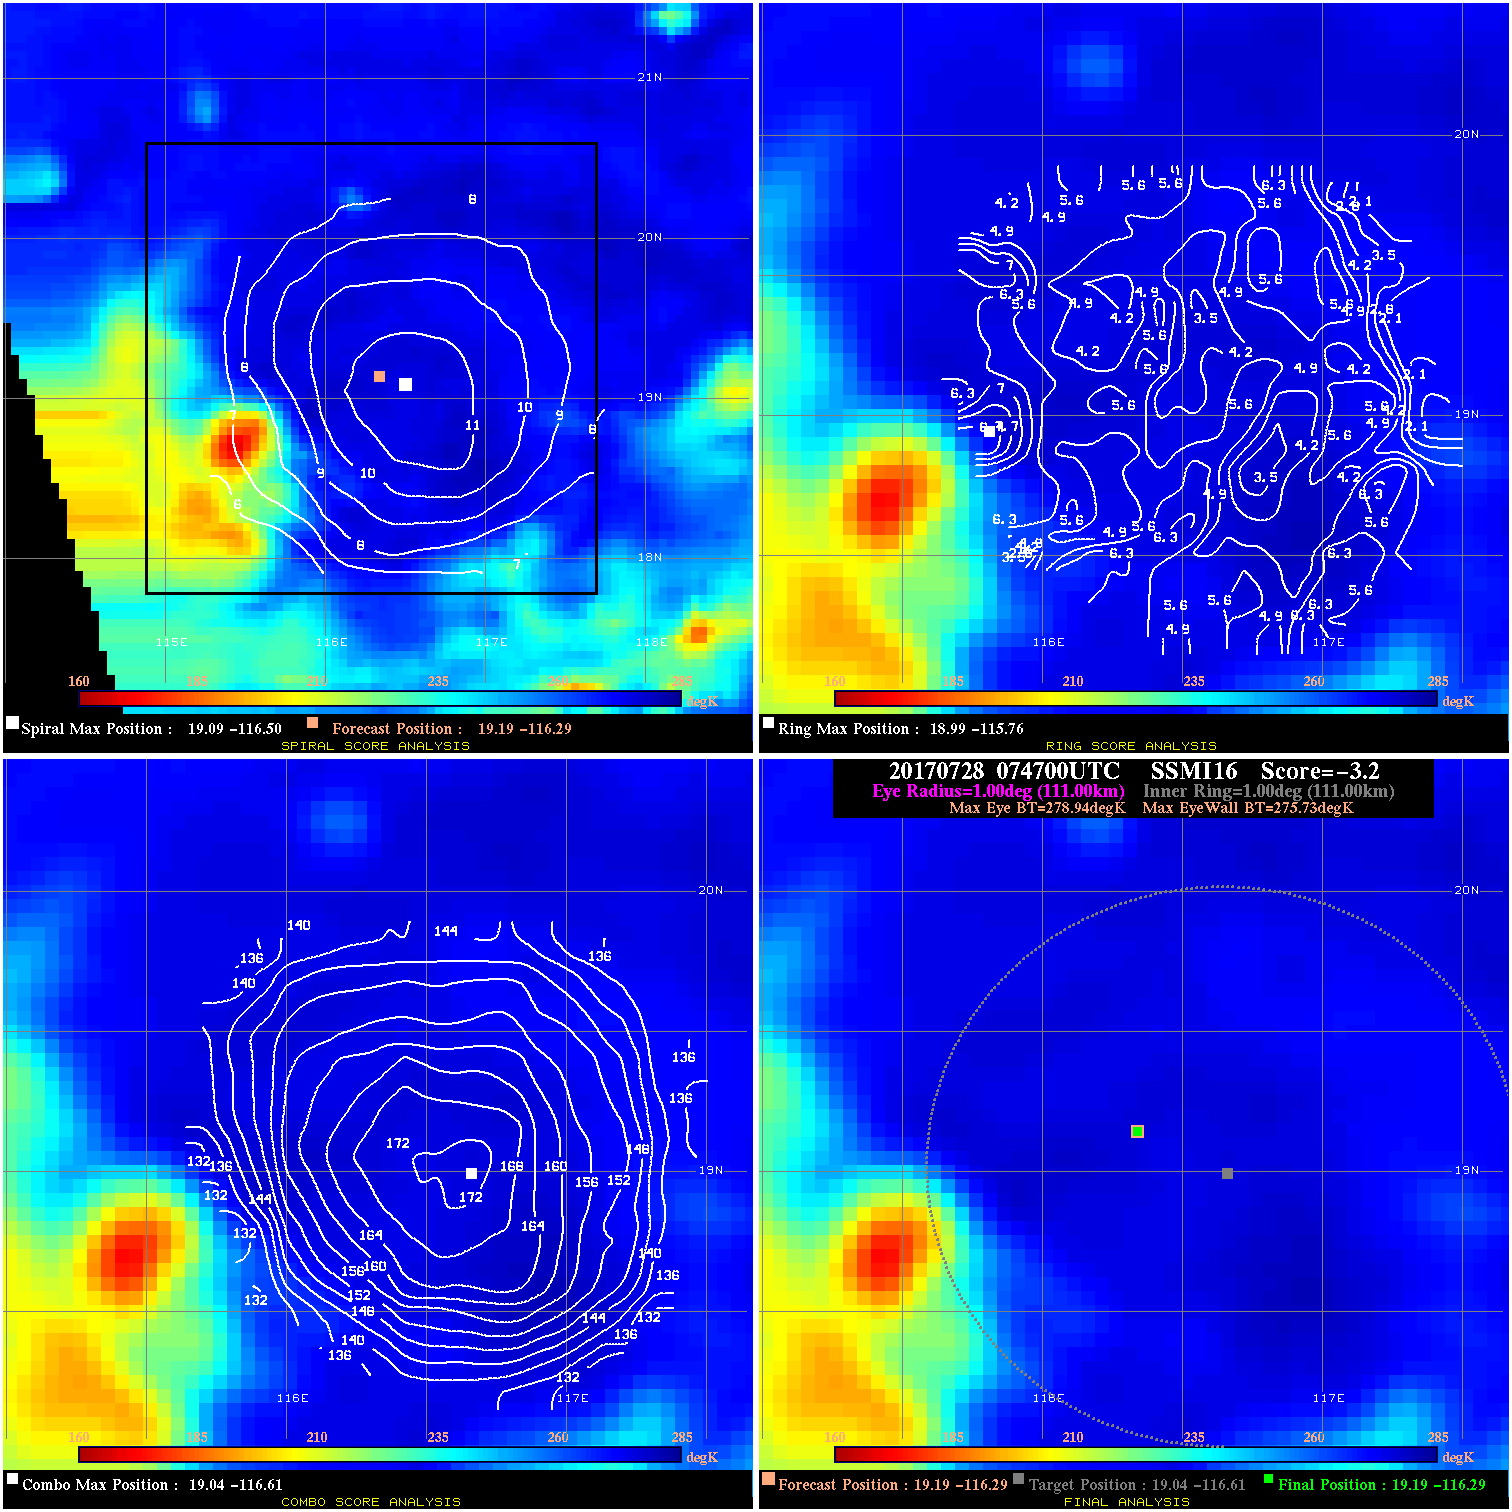
20170728 074700 -3.2 N/A 8.2% 222.20 3.21 30.0 SSMI16 19.2 -116.3 19.2 -116.3 19.0 -116.6 Analysis Plot
20170728 103900 -5.6 N/A 11.9% 255.53 5.64 30.0 SSMI18 19.1 -116.1 19.1 -116.1 18.9 -116.3 Analysis Plot
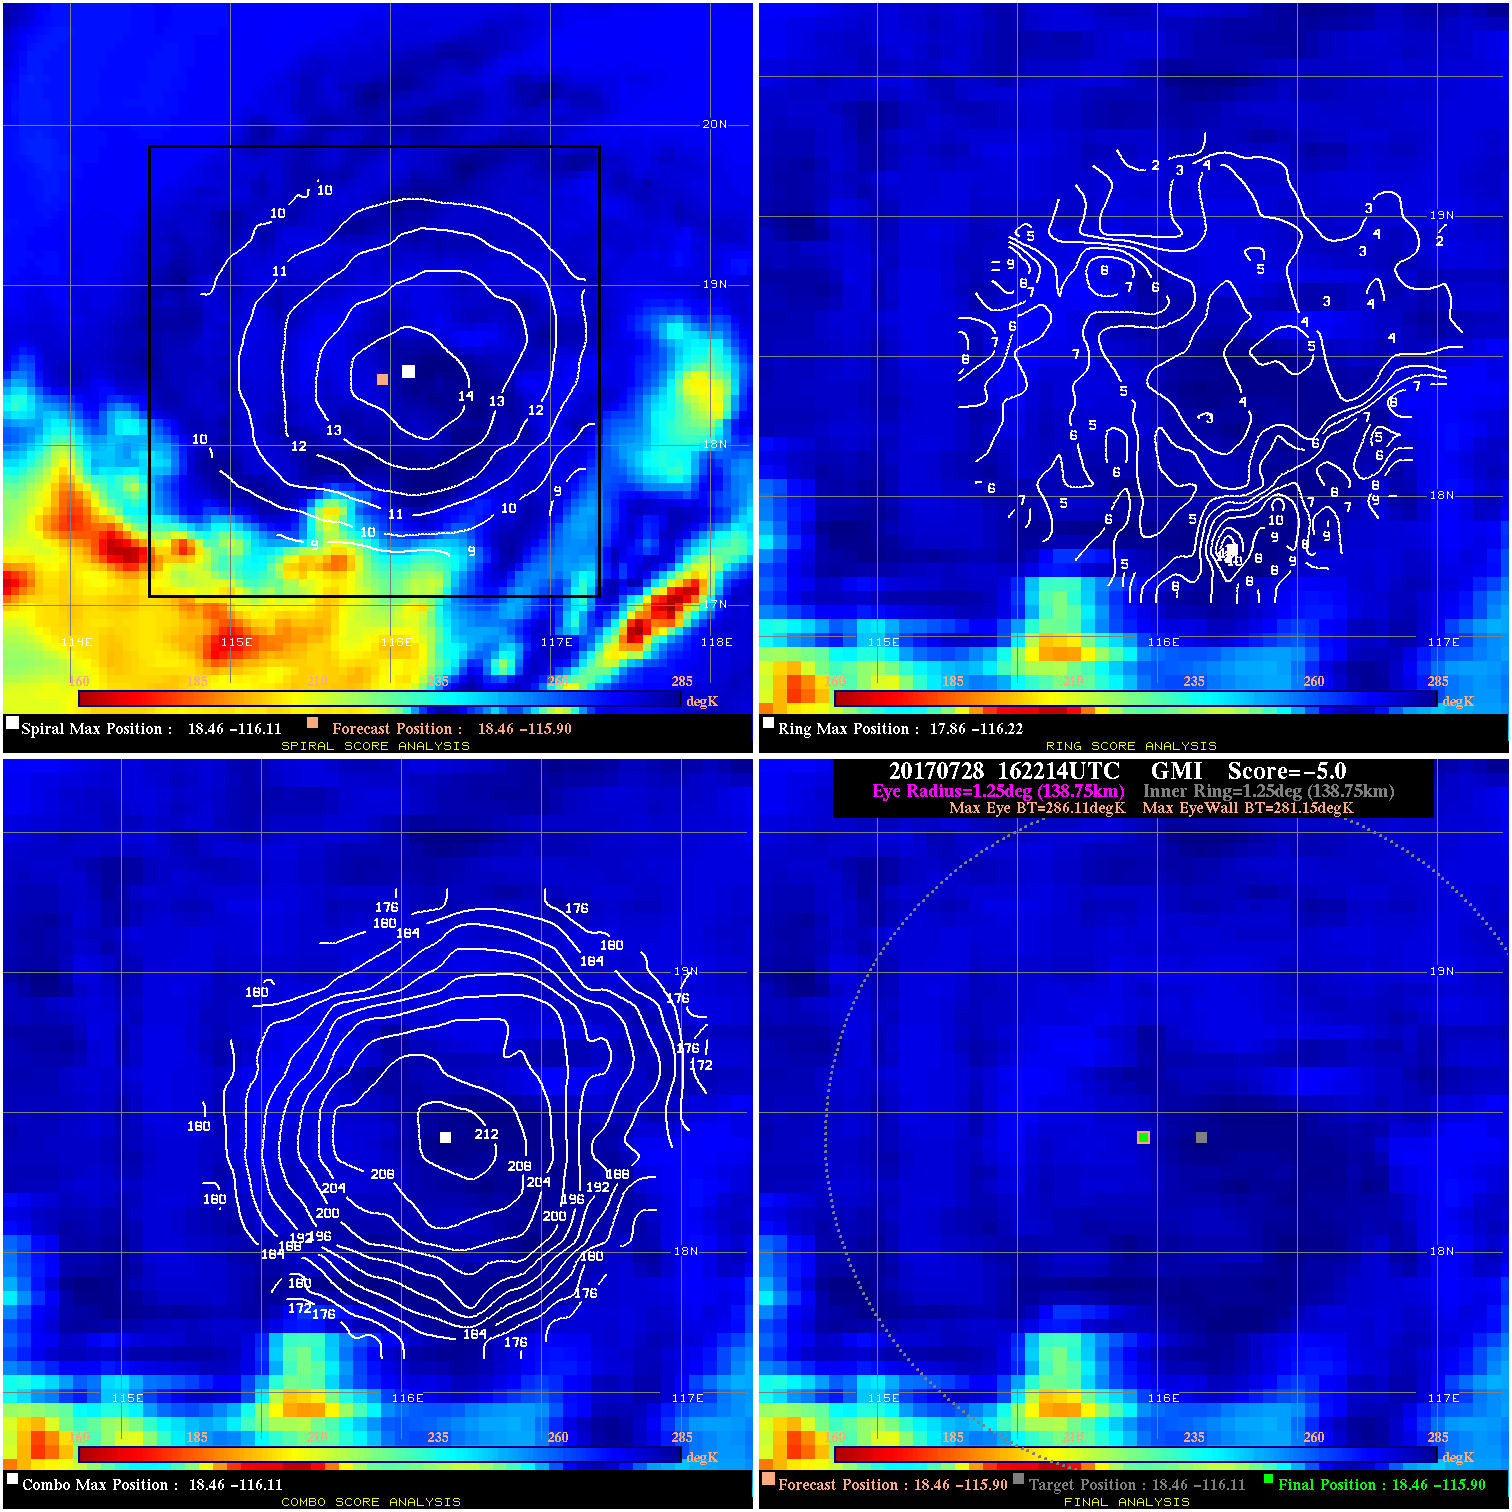
20170728 162214 -5.0 N/A 12.3% 277.75 4.96 30.0 GMI 18.5 -115.9 18.5 -115.9 18.5 -116.1 Analysis Plot
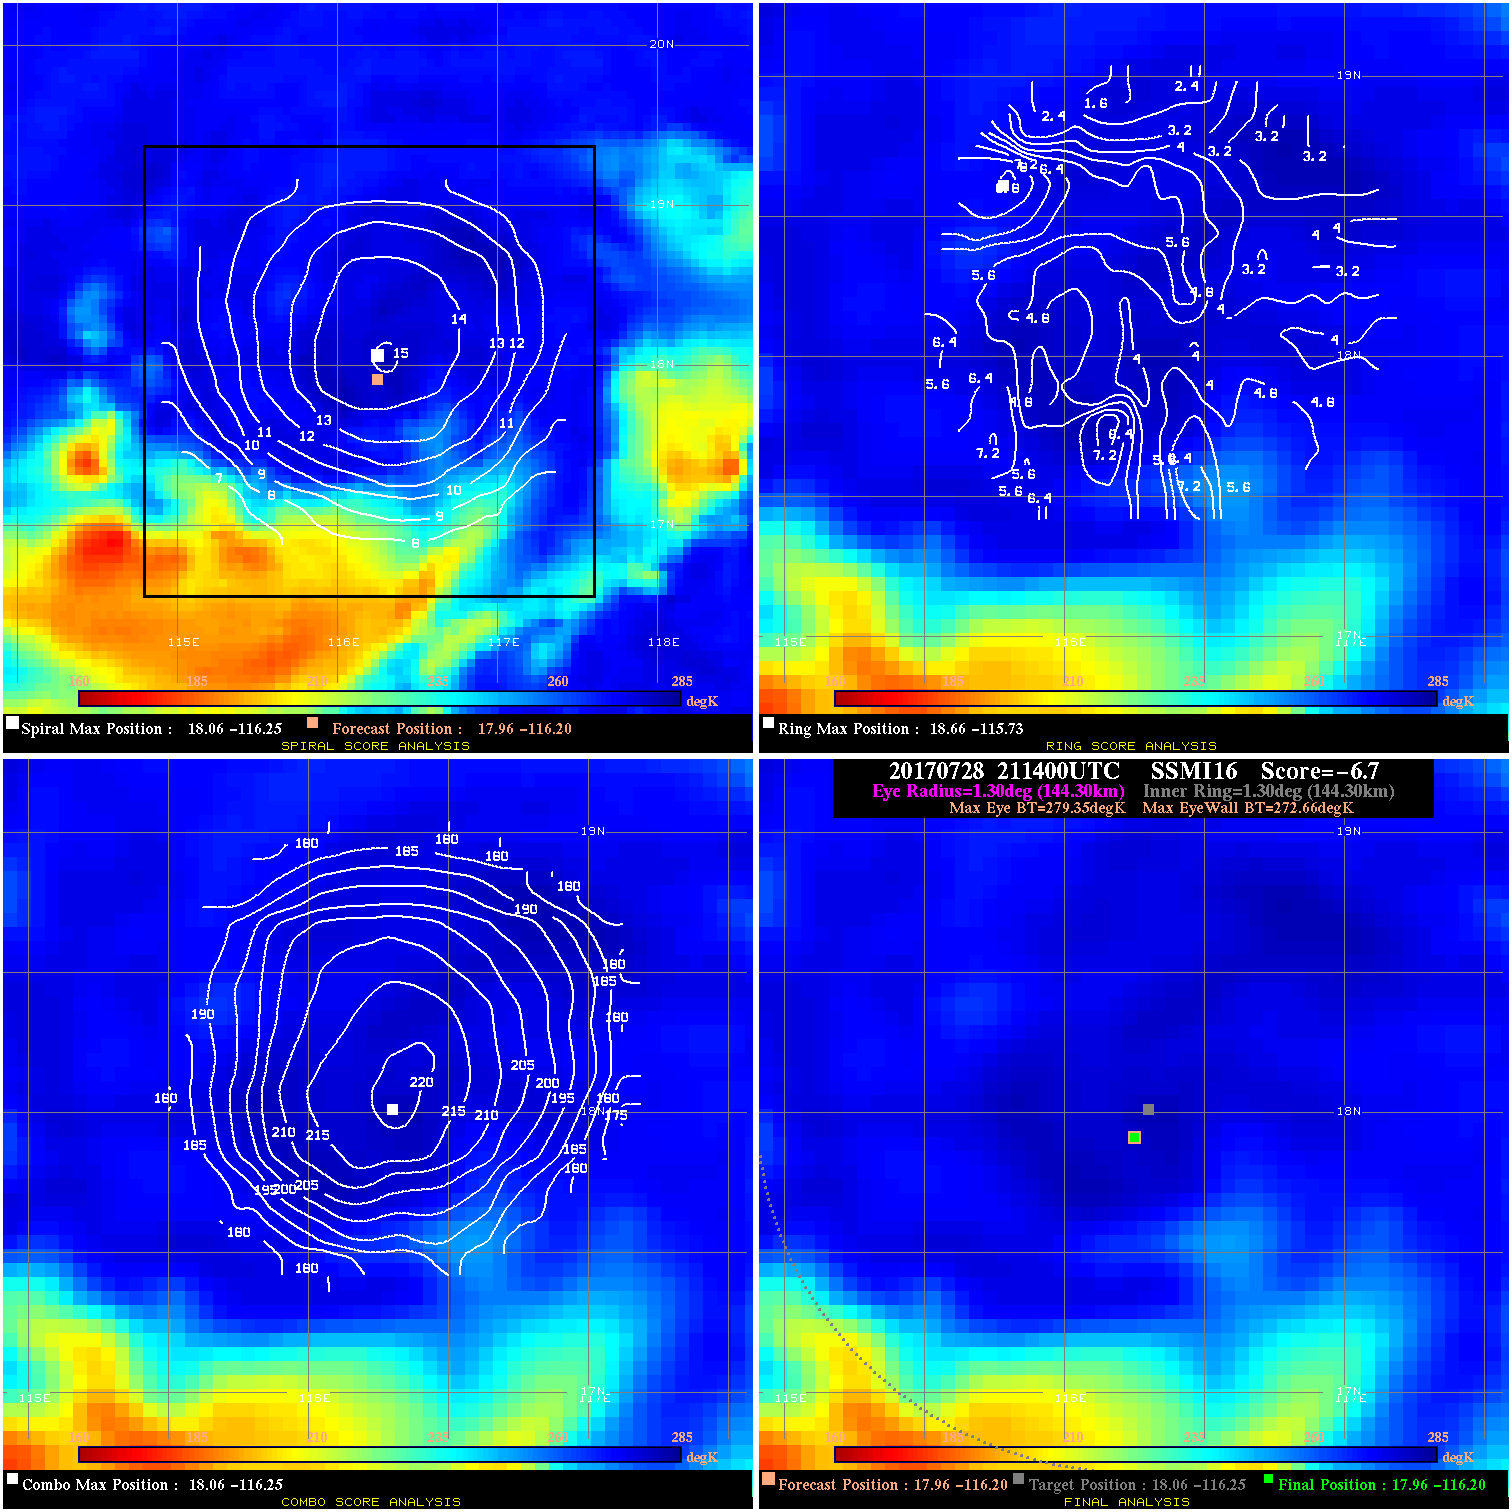
20170728 211400 -6.7 N/A 24.7% 288.86 6.69 30.0 SSMI16 18.0 -116.2 18.0 -116.2 18.1 -116.3 Analysis Plot
20170728 231400 -3.0 N/A 9.6% 155.54 2.97 30.0 SSMI18 18.0 -116.4 18.0 -116.4 18.4 -116.2 Analysis Plot
20170729 054028 -4.3 N/A 8.2% 133.32 4.30 30.0 GMI 18.6 -117.0 18.6 -117.0 18.7 -117.1 Analysis Plot
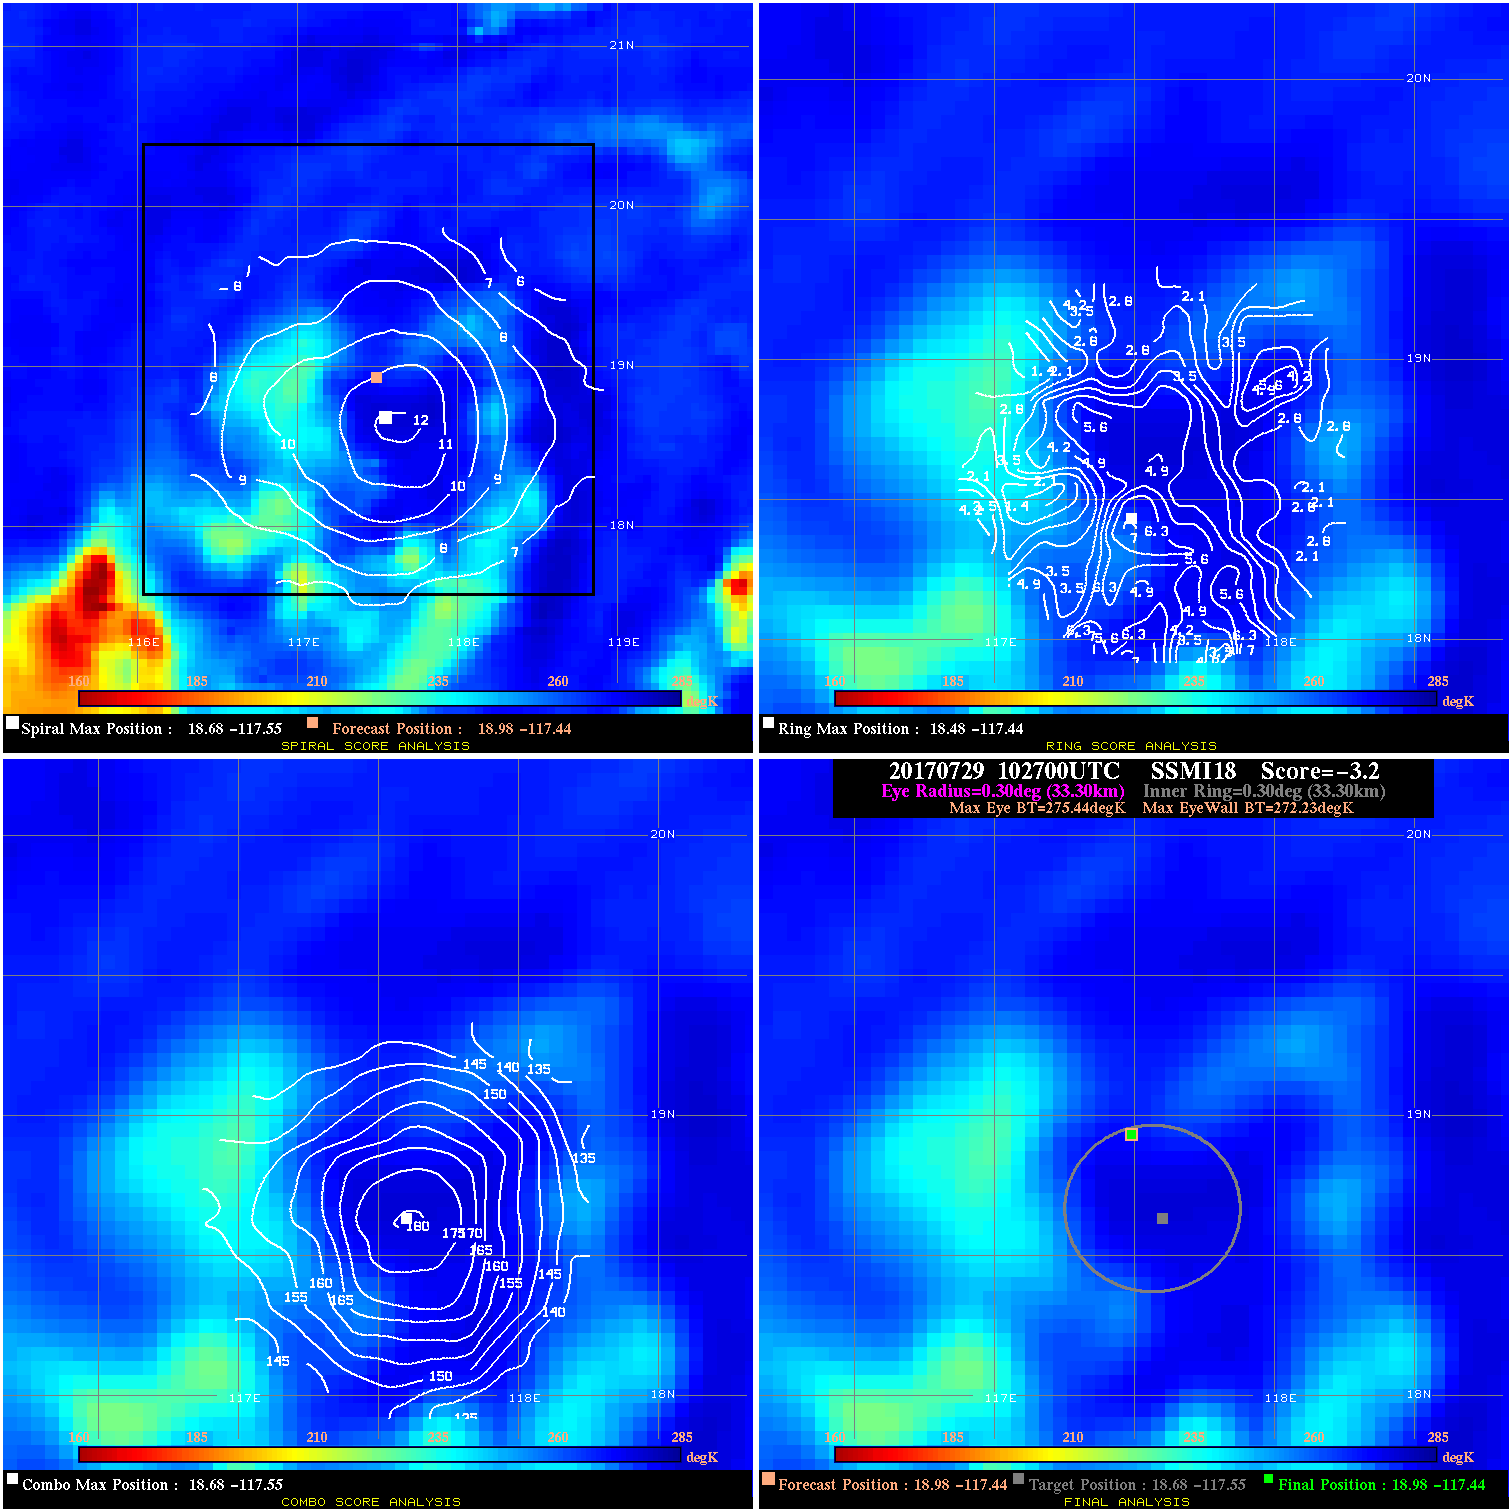
20170729 102700 -3.2 N/A N/A 66.66 3.21 40.0 SSMI18 19.0 -117.4 19.0 -117.4 18.7 -117.6 Analysis Plot
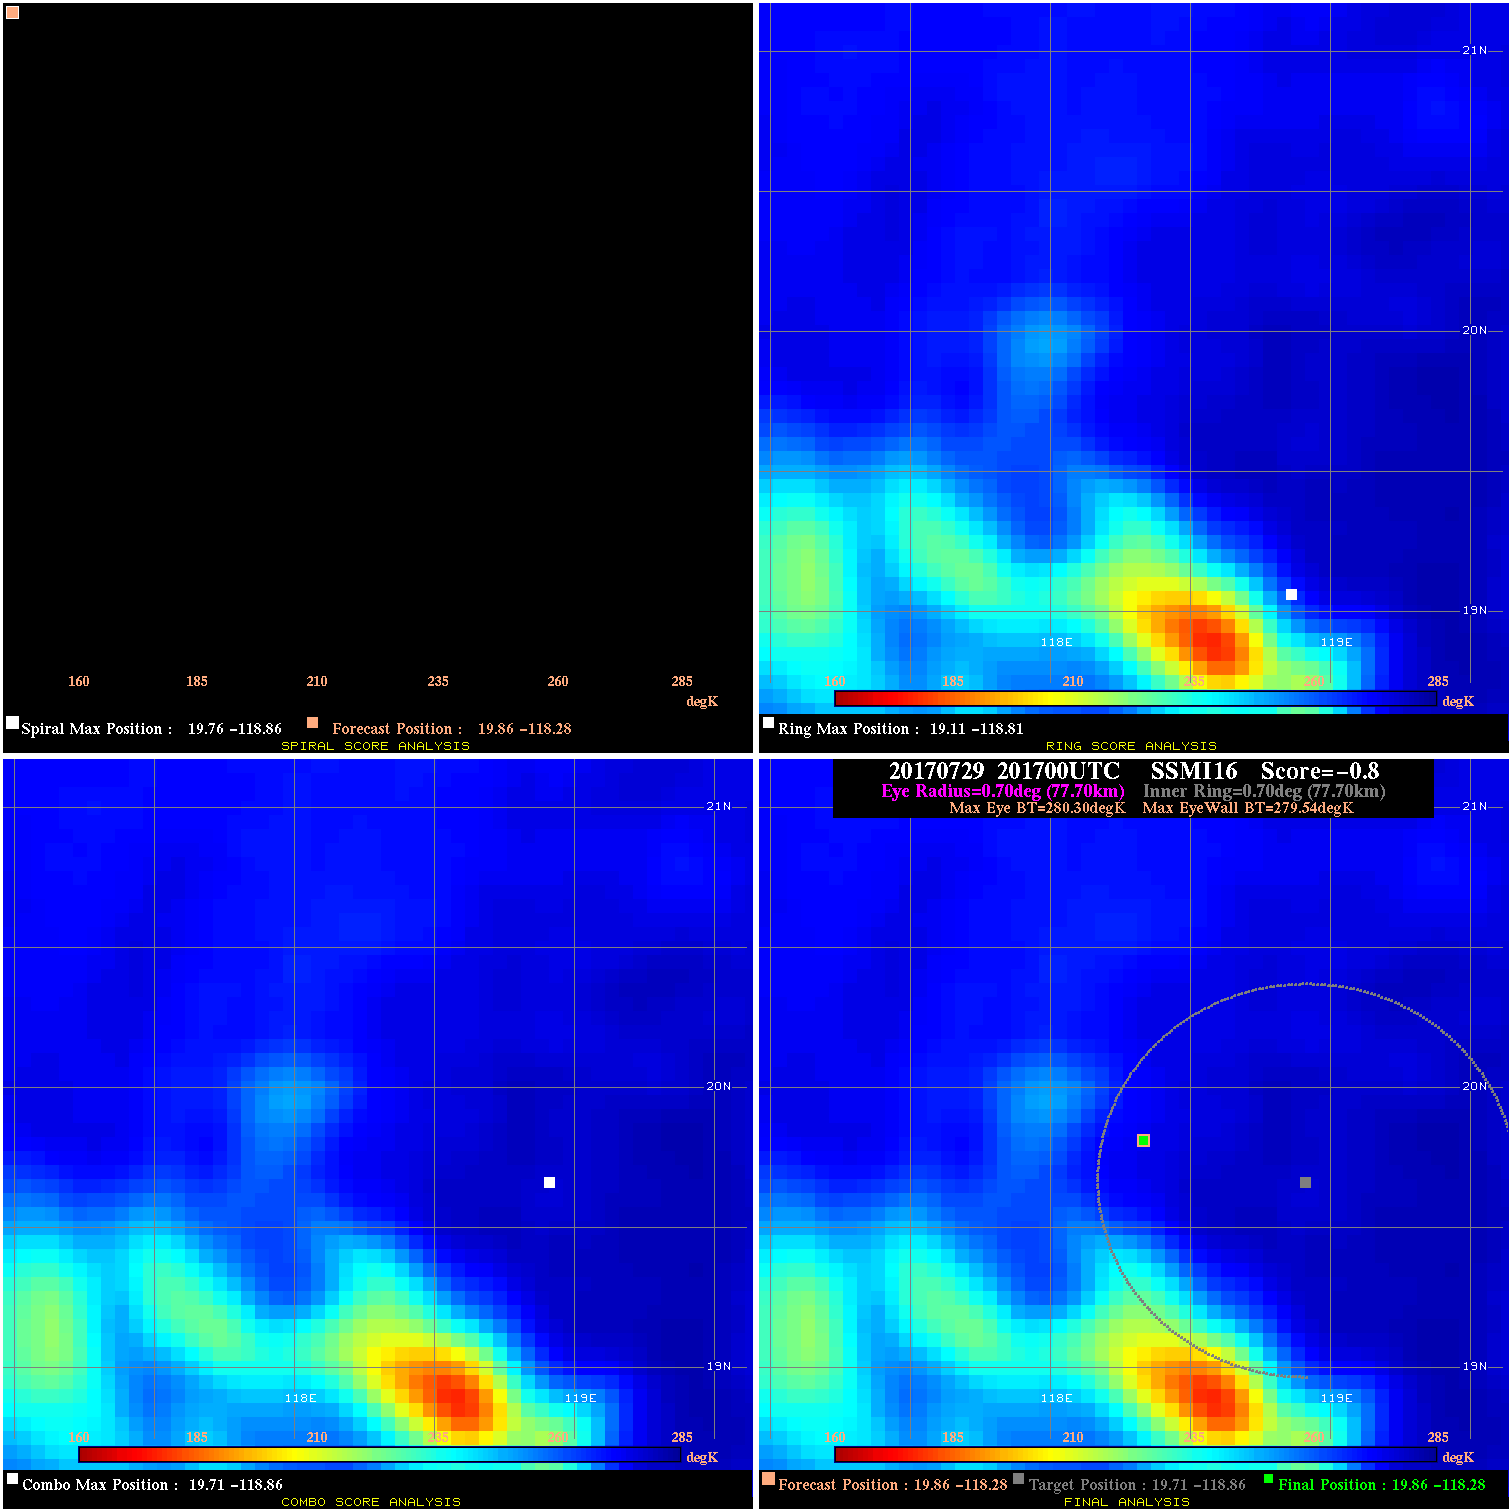
20170729 201700 -0.8 N/A 15.1% 155.54 .76 35.0 SSMI16 19.9 -118.3 19.9 -118.3 19.7 -118.9 Analysis Plot
20170730 044914 -0.9 N/A 60.3% 88.88 .86 35.0 GMI 21.2 -119.9 21.2 -119.9 21.0 -119.9 Analysis Plot
20170730 084842 -1.1 N/A N/A 66.66 1.13 35.0 SSMI15 21.8 -120.2 21.8 -120.2 22.4 -119.8 Analysis Plot
20170730 100600 -3.1 N/A 68.5% 99.99 3.15 35.0 SSMI17 22.5 -120.1 22.5 -120.1 22.3 -119.9 Analysis Plot
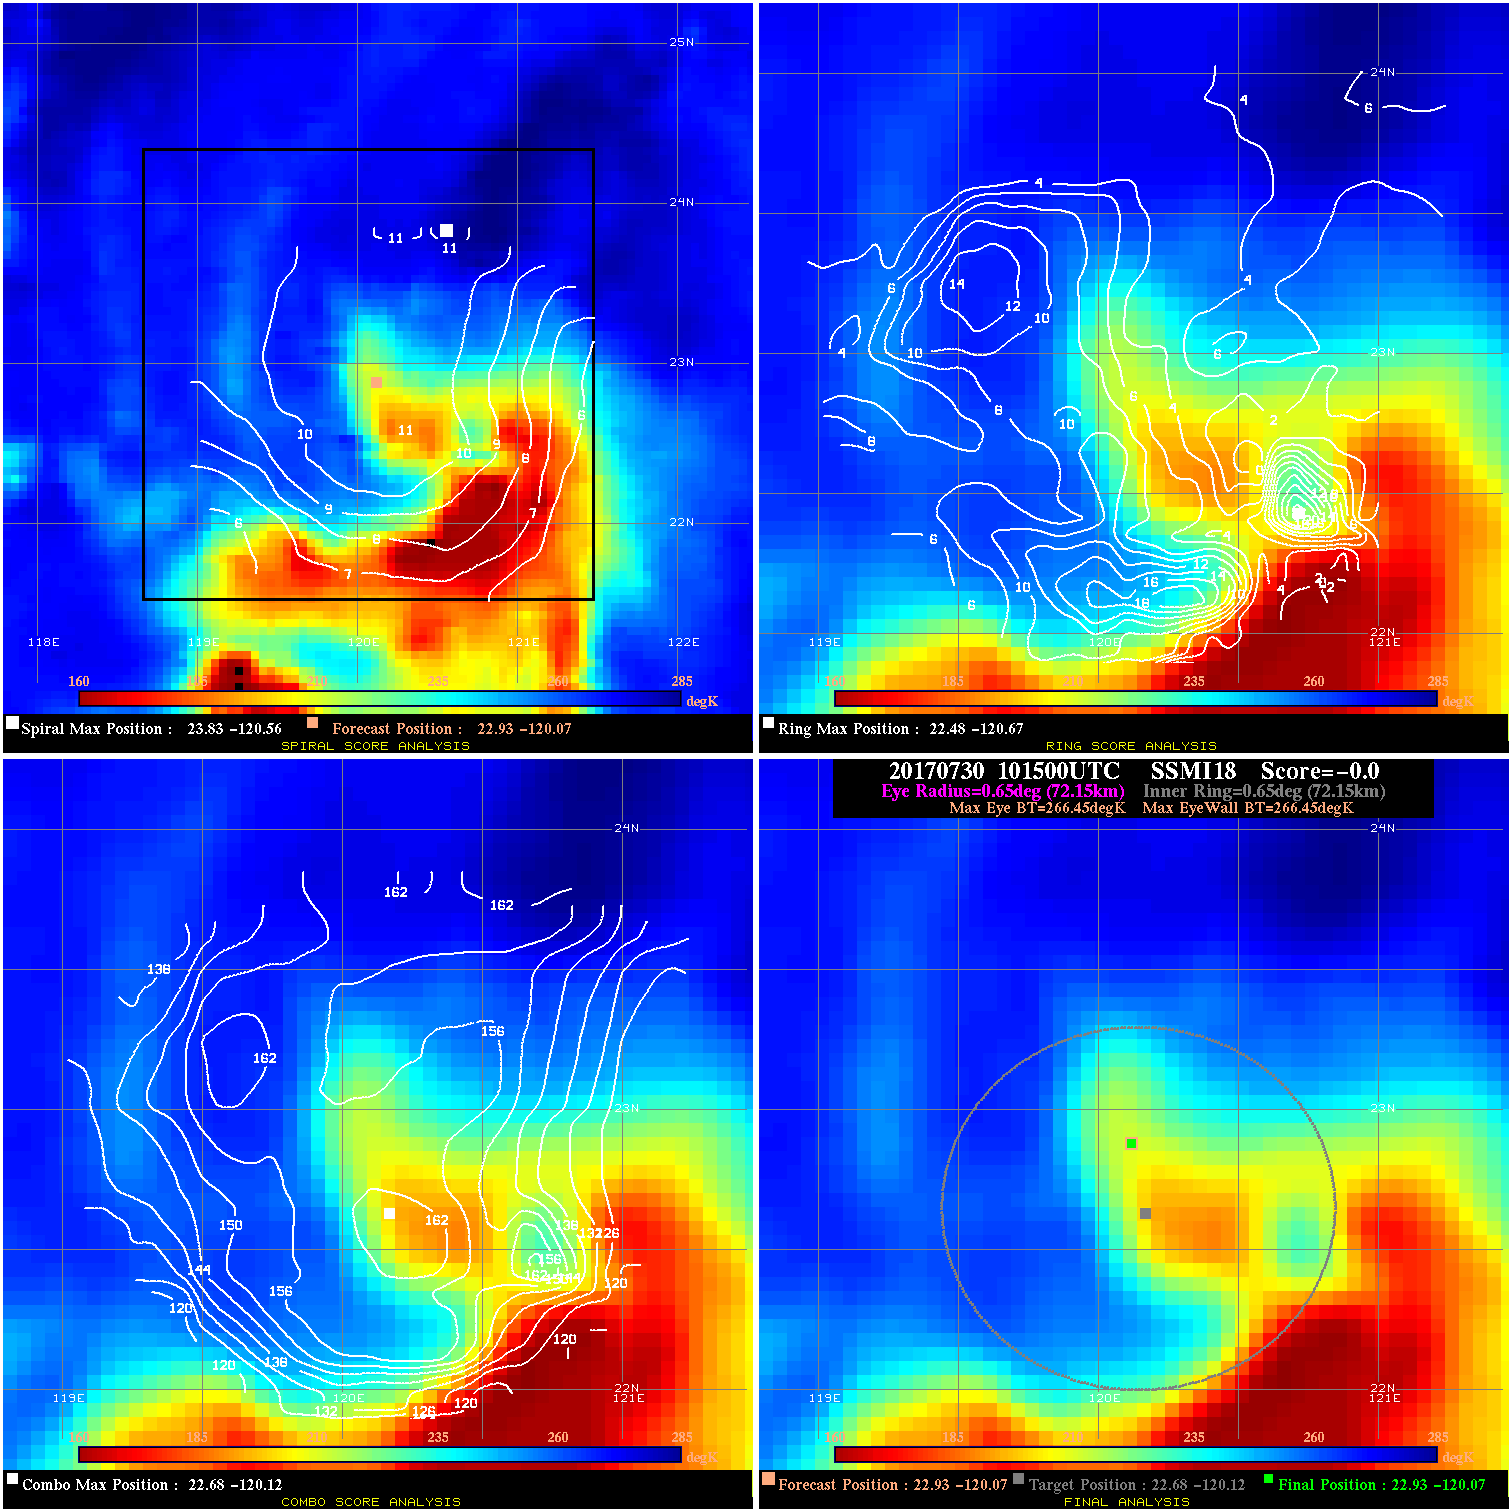
20170730 101500 -0.0 N/A N/A N/A 0.00 35.0 SSMI18 22.9 -120.1 22.9 -120.1 22.7 -120.1 Analysis Plot
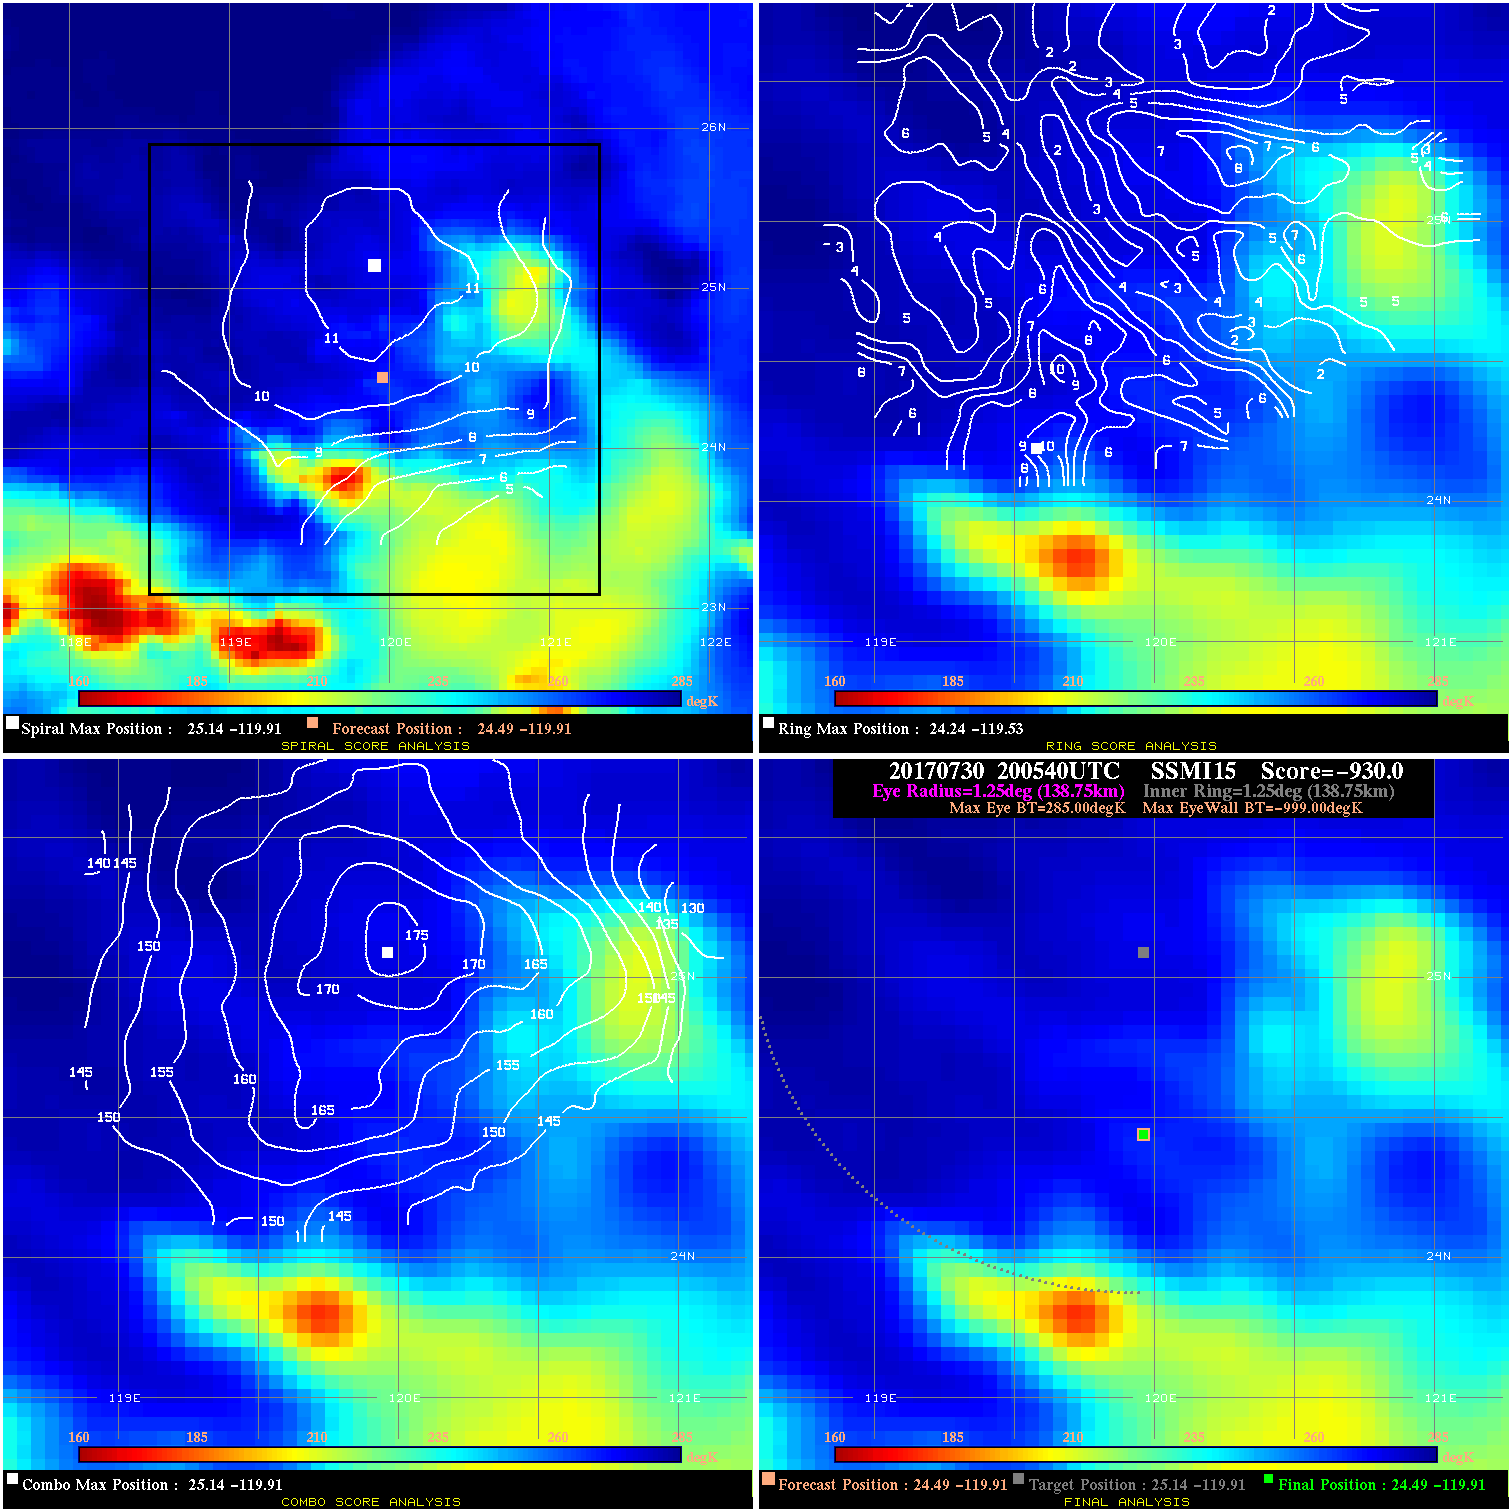
20170730 200540 -930.0 N/A N/A N/A 0.00 35.0 SSMI15 24.5 -119.9 24.5 -119.9 25.1 -119.9 Analysis Plot
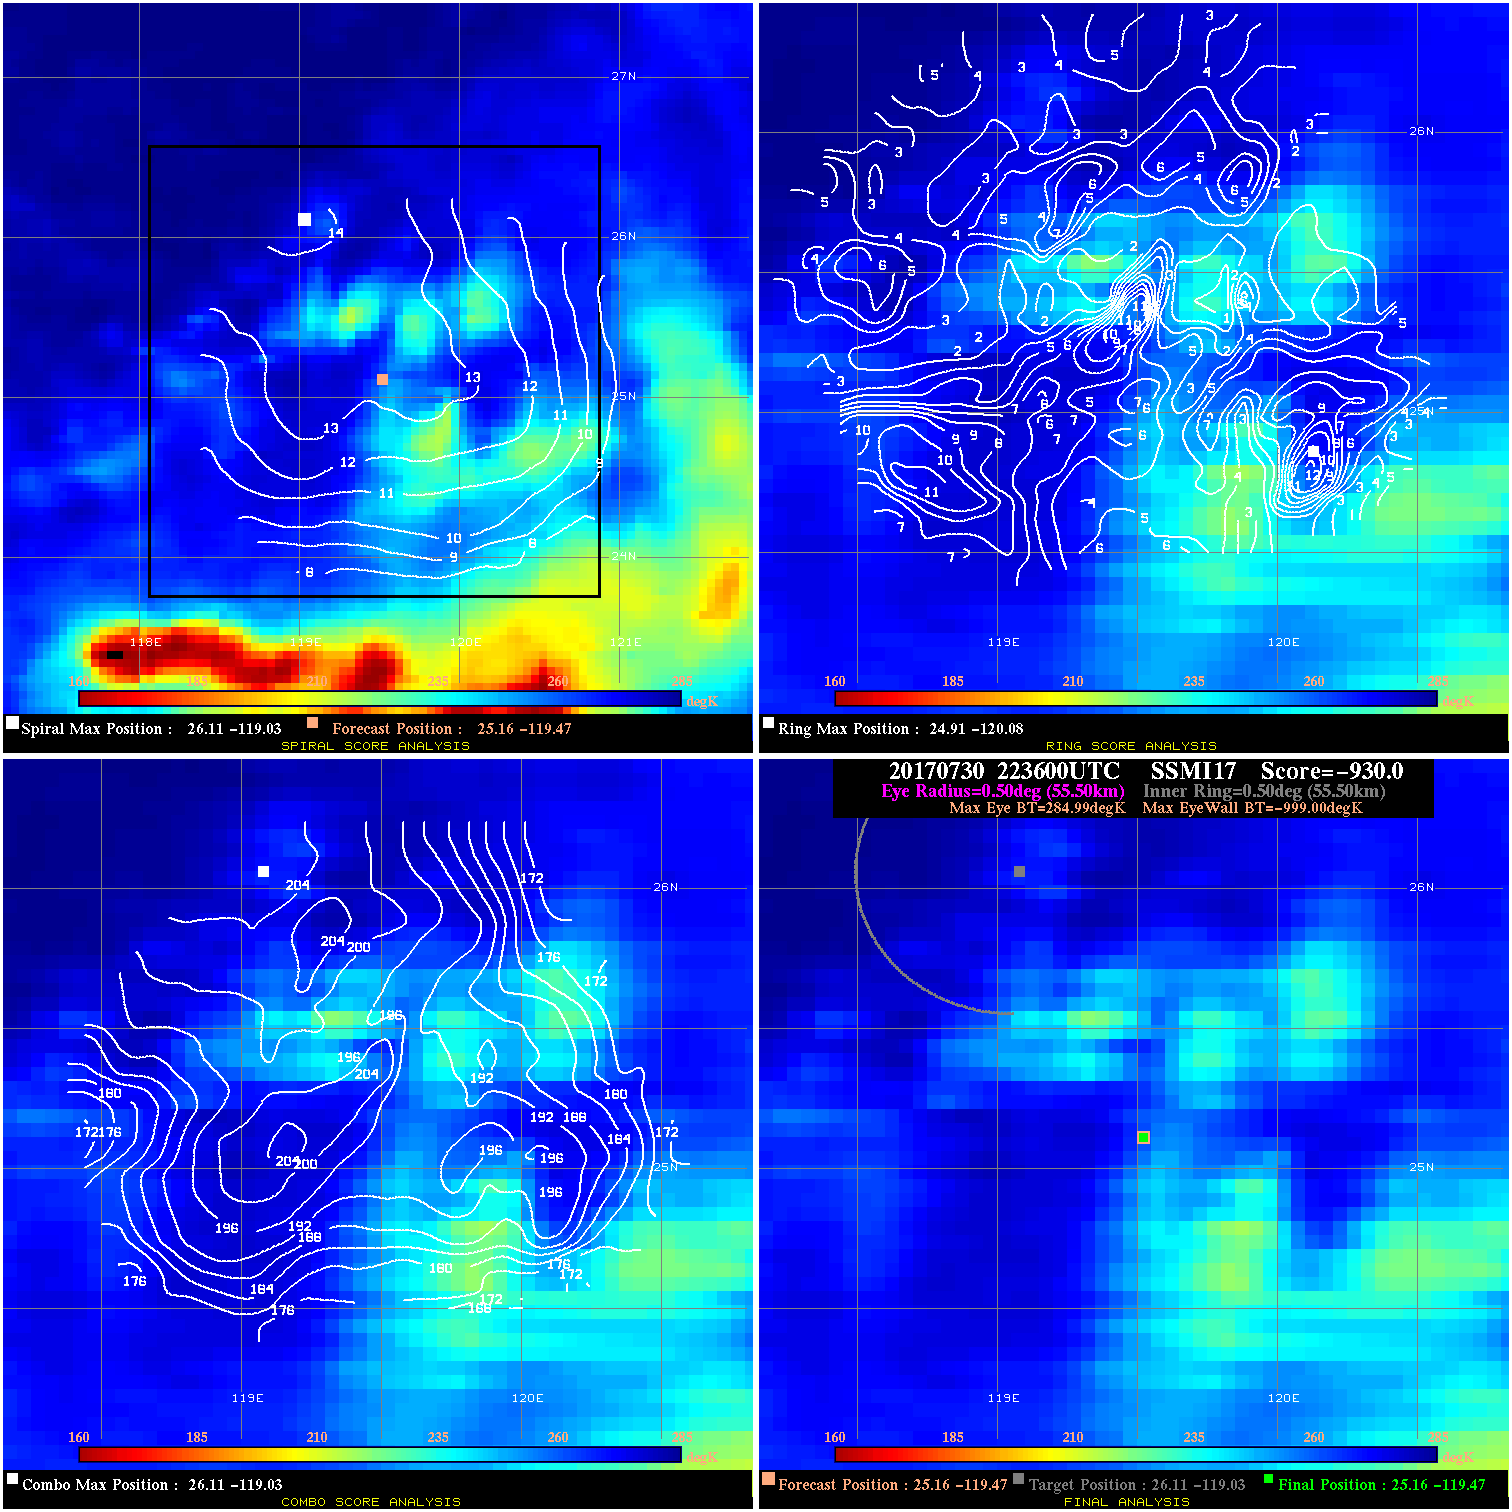
20170730 223600 -930.0 N/A N/A N/A 0.00 35.0 SSMI17 25.2 -119.5 25.2 -119.5 26.1 -119.0 Analysis Plot
20170730 224600 -930.0 N/A N/A N/A 0.00 35.0 SSMI18 25.2 -119.4 25.2 -119.4 26.3 -118.6 Analysis Plot
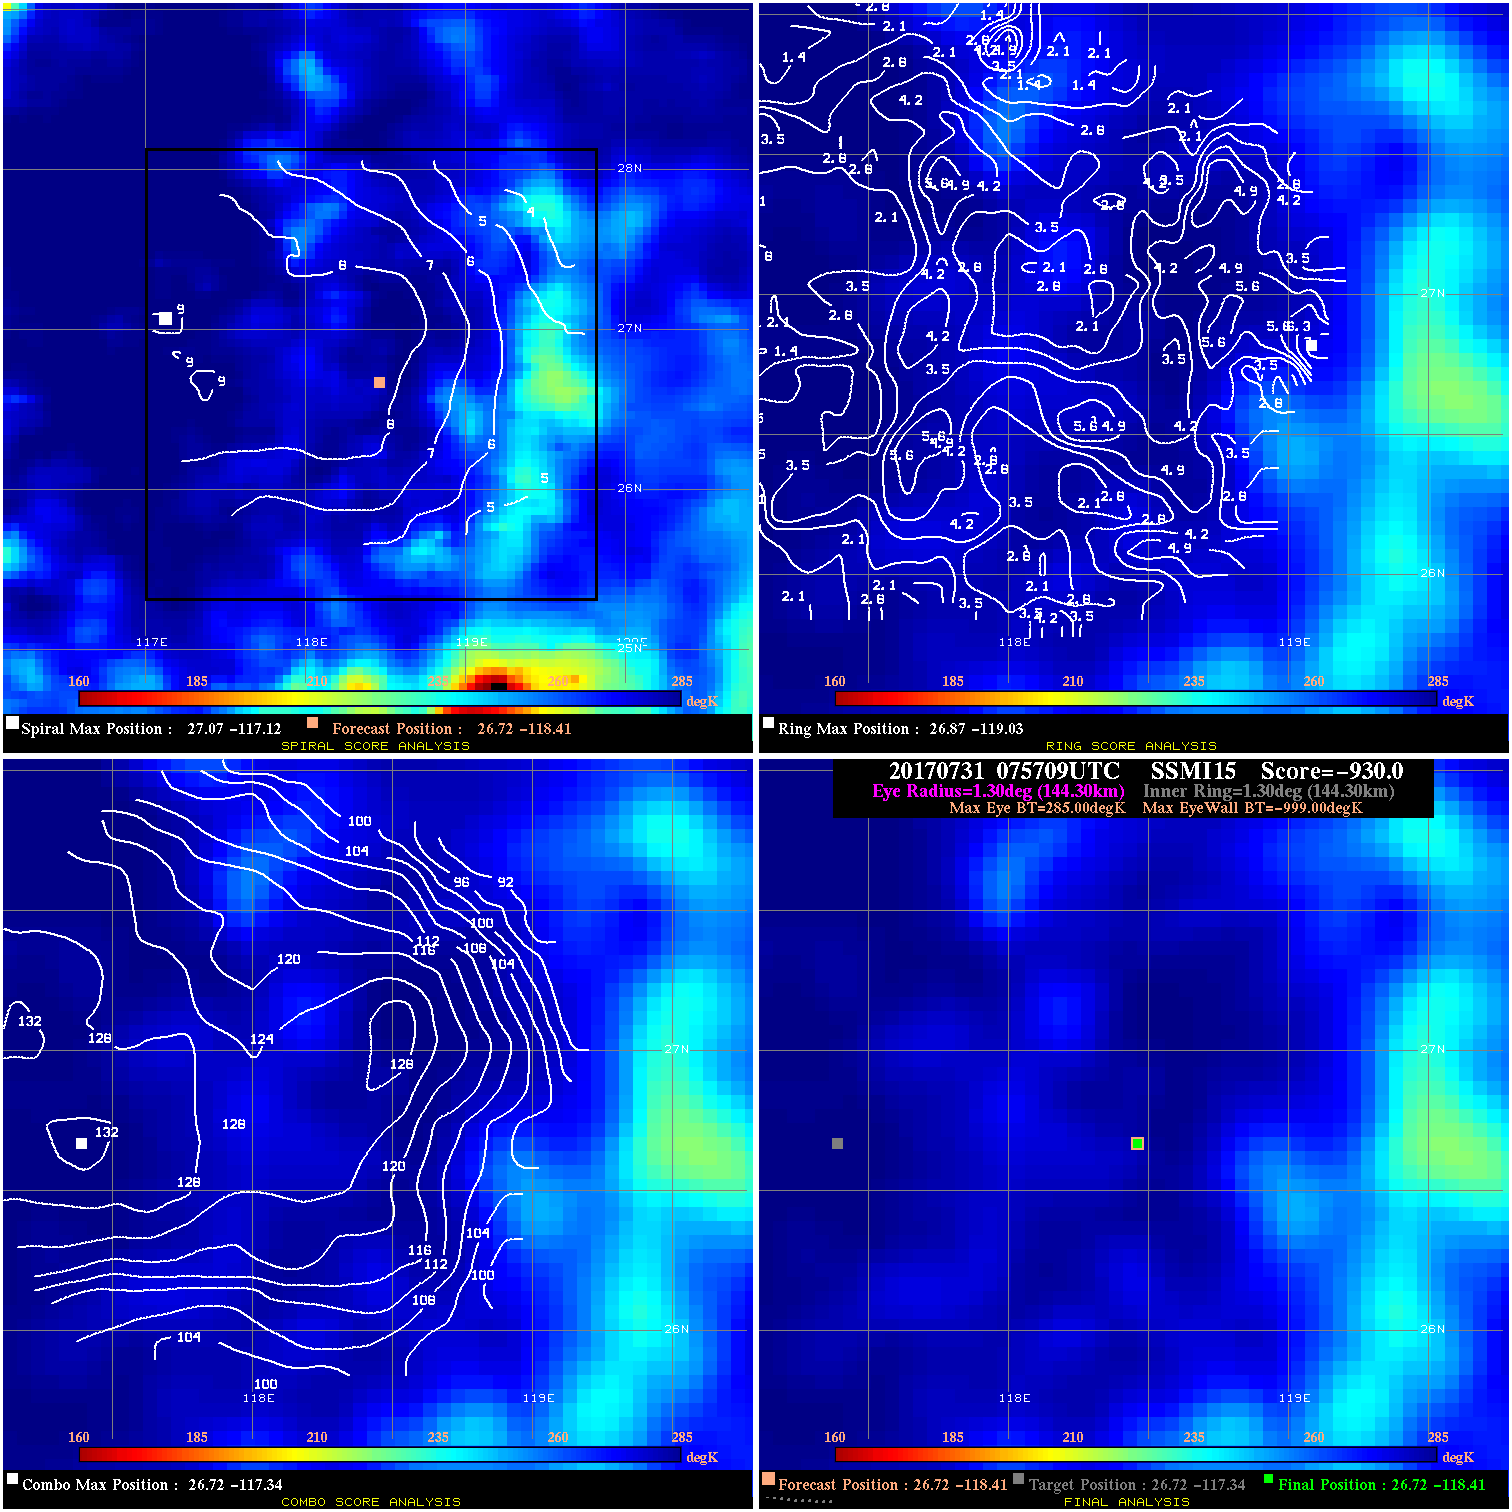
20170731 075709 -930.0 N/A N/A N/A 0.00 30.0 SSMI15 26.7 -118.4 26.7 -118.4 26.7 -117.3 Analysis Plot
20170731 100400 -0.9 N/A N/A 88.88 .91 30.0 SSMI18 27.3 -118.0 27.3 -118.0 26.7 -117.7 Analysis Plot
20170731 151831 -0.0 N/A N/A N/A 0.00 30.0 GMI 28.4 -117.2 28.4 -117.2 27.6 -116.5 Analysis Plot
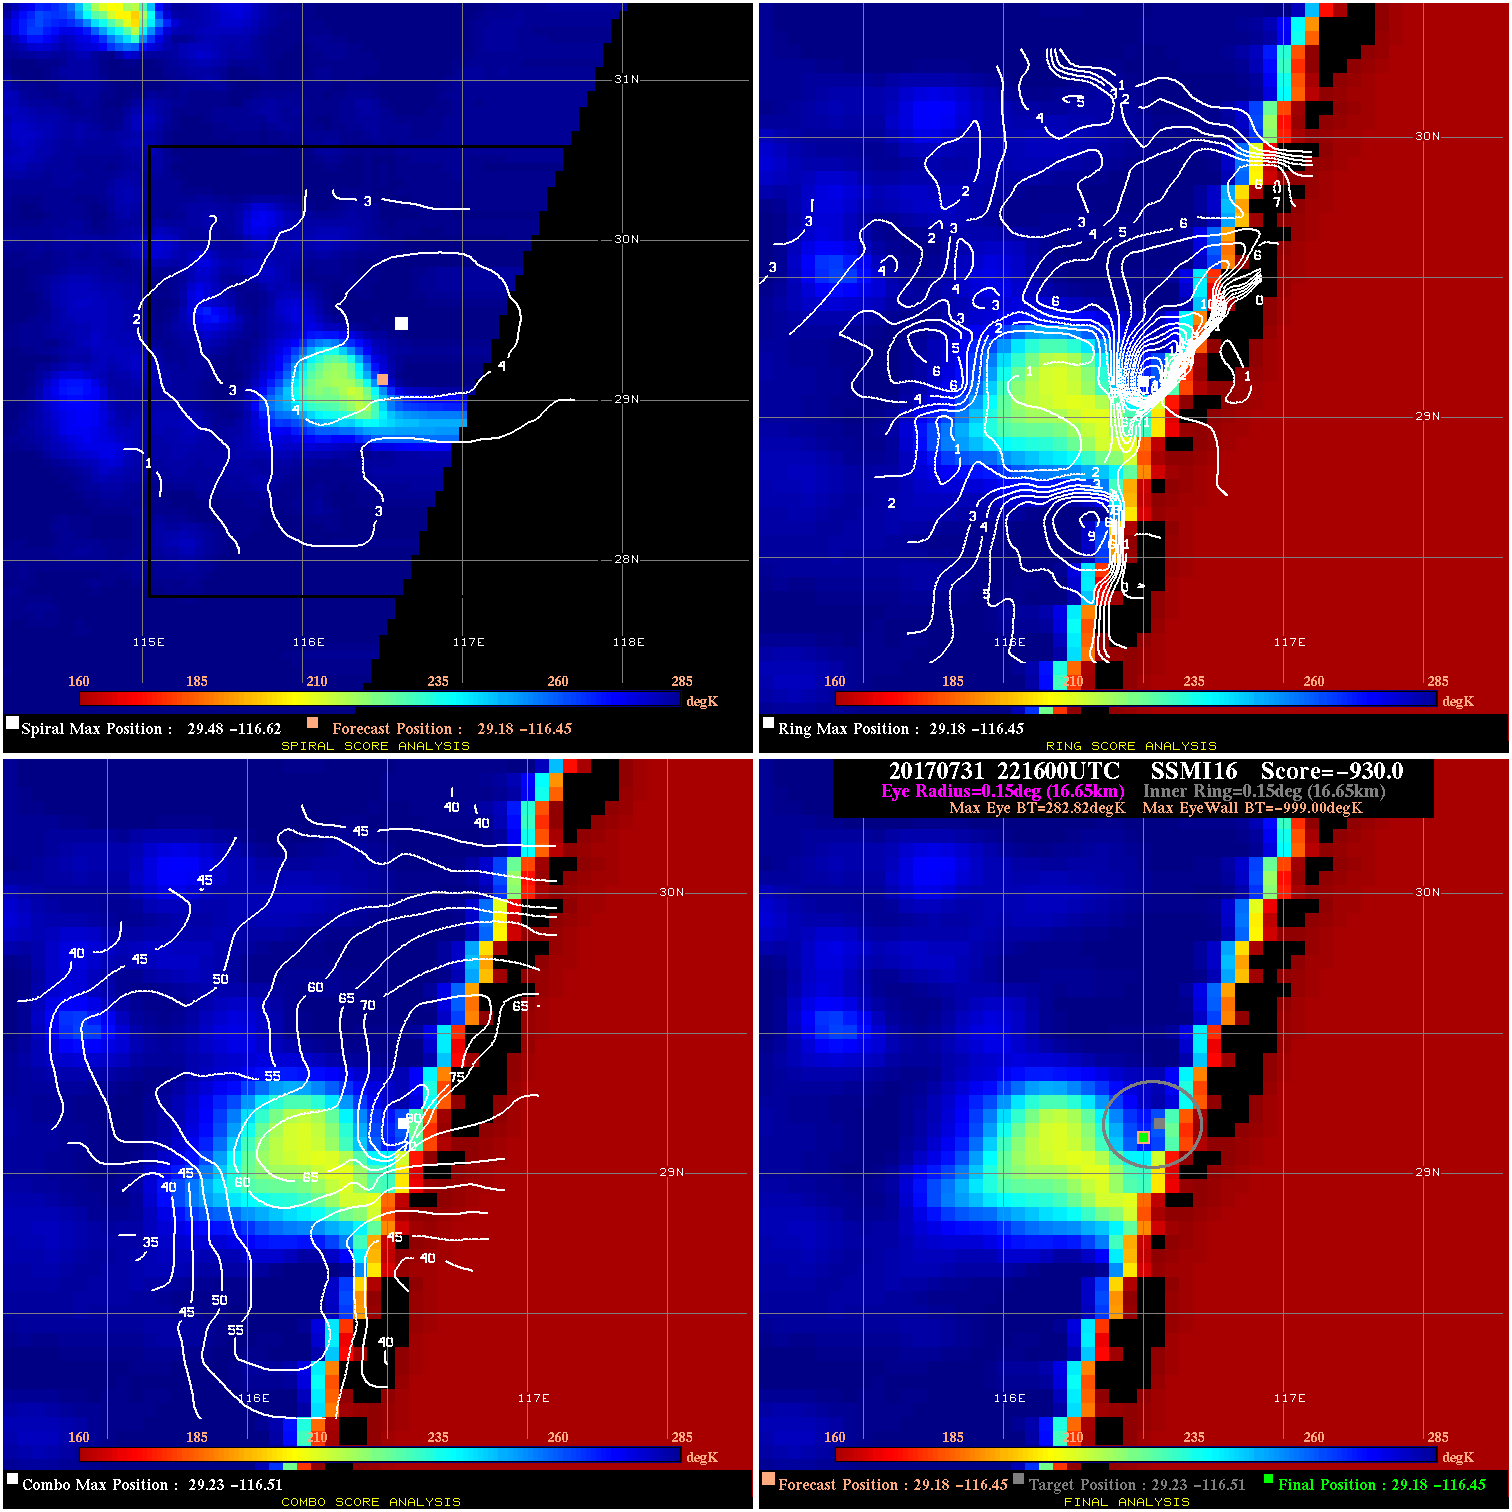
20170731 221600 -930.0 N/A N/A N/A 0.00 30.0 SSMI16 29.2 -116.4 29.2 -116.4 29.2 -116.5 Analysis Plot
|
|
Legend: - Date/Time are determined from PMW imagery at Forecast (initial guess) Lat/Lon position. - Positive/Negative Latitude = North/South Hemisphere; Longitude = Western/Eastern Hemisphere. - "Ring Diam" value indicates the estimated surface eyewall diameter in km (the MI eyewall edge diameter minus 10 km). - "Ring Pct" is the percentage of the "ring" (eyewall inner boundary) that is 1) colder than the "hot spot" (warmest eye pixel) in the eye by 20K, or 2) the percentage that is a) colder than 232K and b) colder than the "hot spot" by 10K, whichever is greater. - Values are red if Ring % <= 65, yellow/brown if Ring % <= 85 and green if Ring % > 85. - "Tb diff" is the difference between the "hot spot" (warmest eye pixel) and the warmest pixel on the eyewall. - Intensity score are listed as negative, and not used, when the JTWC or NHC estimated Vmax is <55 kts in order to rule out weak but highly symmetric TCs. - Error messages in intensity scores: -920 is used when the hottest pixel in the eye is <200K, to prevent false positives; -930 means <85% of eyewall has observations/data. |