Tropical Depression 16W
|
Passive Microwave (PMW) Intensity Information Advanced Dvorak Technique (ADT) Version 8.2.1 |
Overpass Inten Ring Ring Wind Forecast Final Target
Date Time Score Meaning Pct Diam BTdiff Est Sat Lat Lon Lat Lon Lat Lon
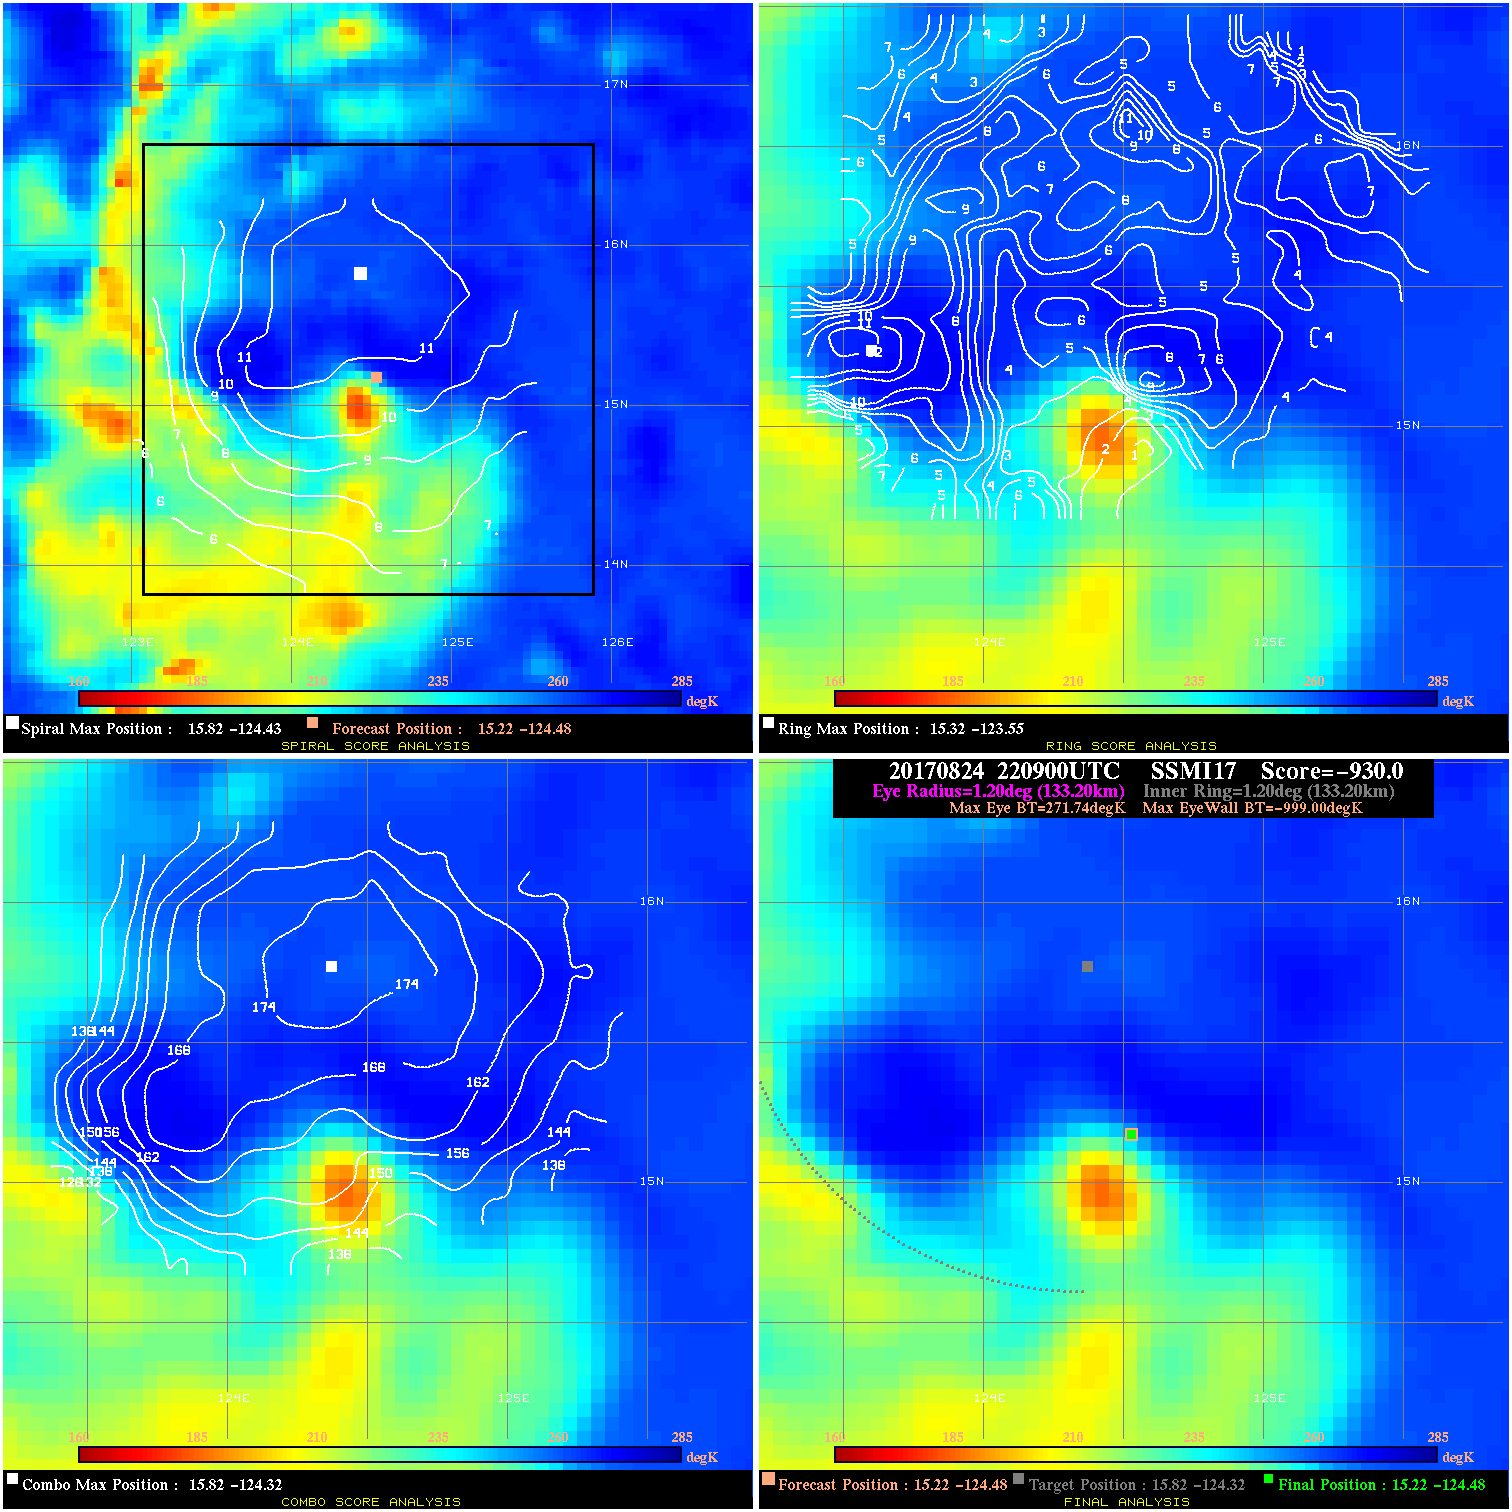
20170824 200900 -23.5 N/A 97.3% 44.44 8.53 35.0 SSMI16 15.1 -125.1 15.1 -125.1 14.9 -124.5 Analysis Plot
20170824 220900 -930.0 N/A N/A N/A 0.00 35.0 SSMI17 15.2 -124.5 15.2 -124.5 15.8 -124.3 Analysis Plot
20170824 224100 -6.7 N/A 39.7% 133.32 6.69 35.0 SSMI18 15.2 -124.4 15.2 -124.4 15.0 -124.2 Analysis Plot
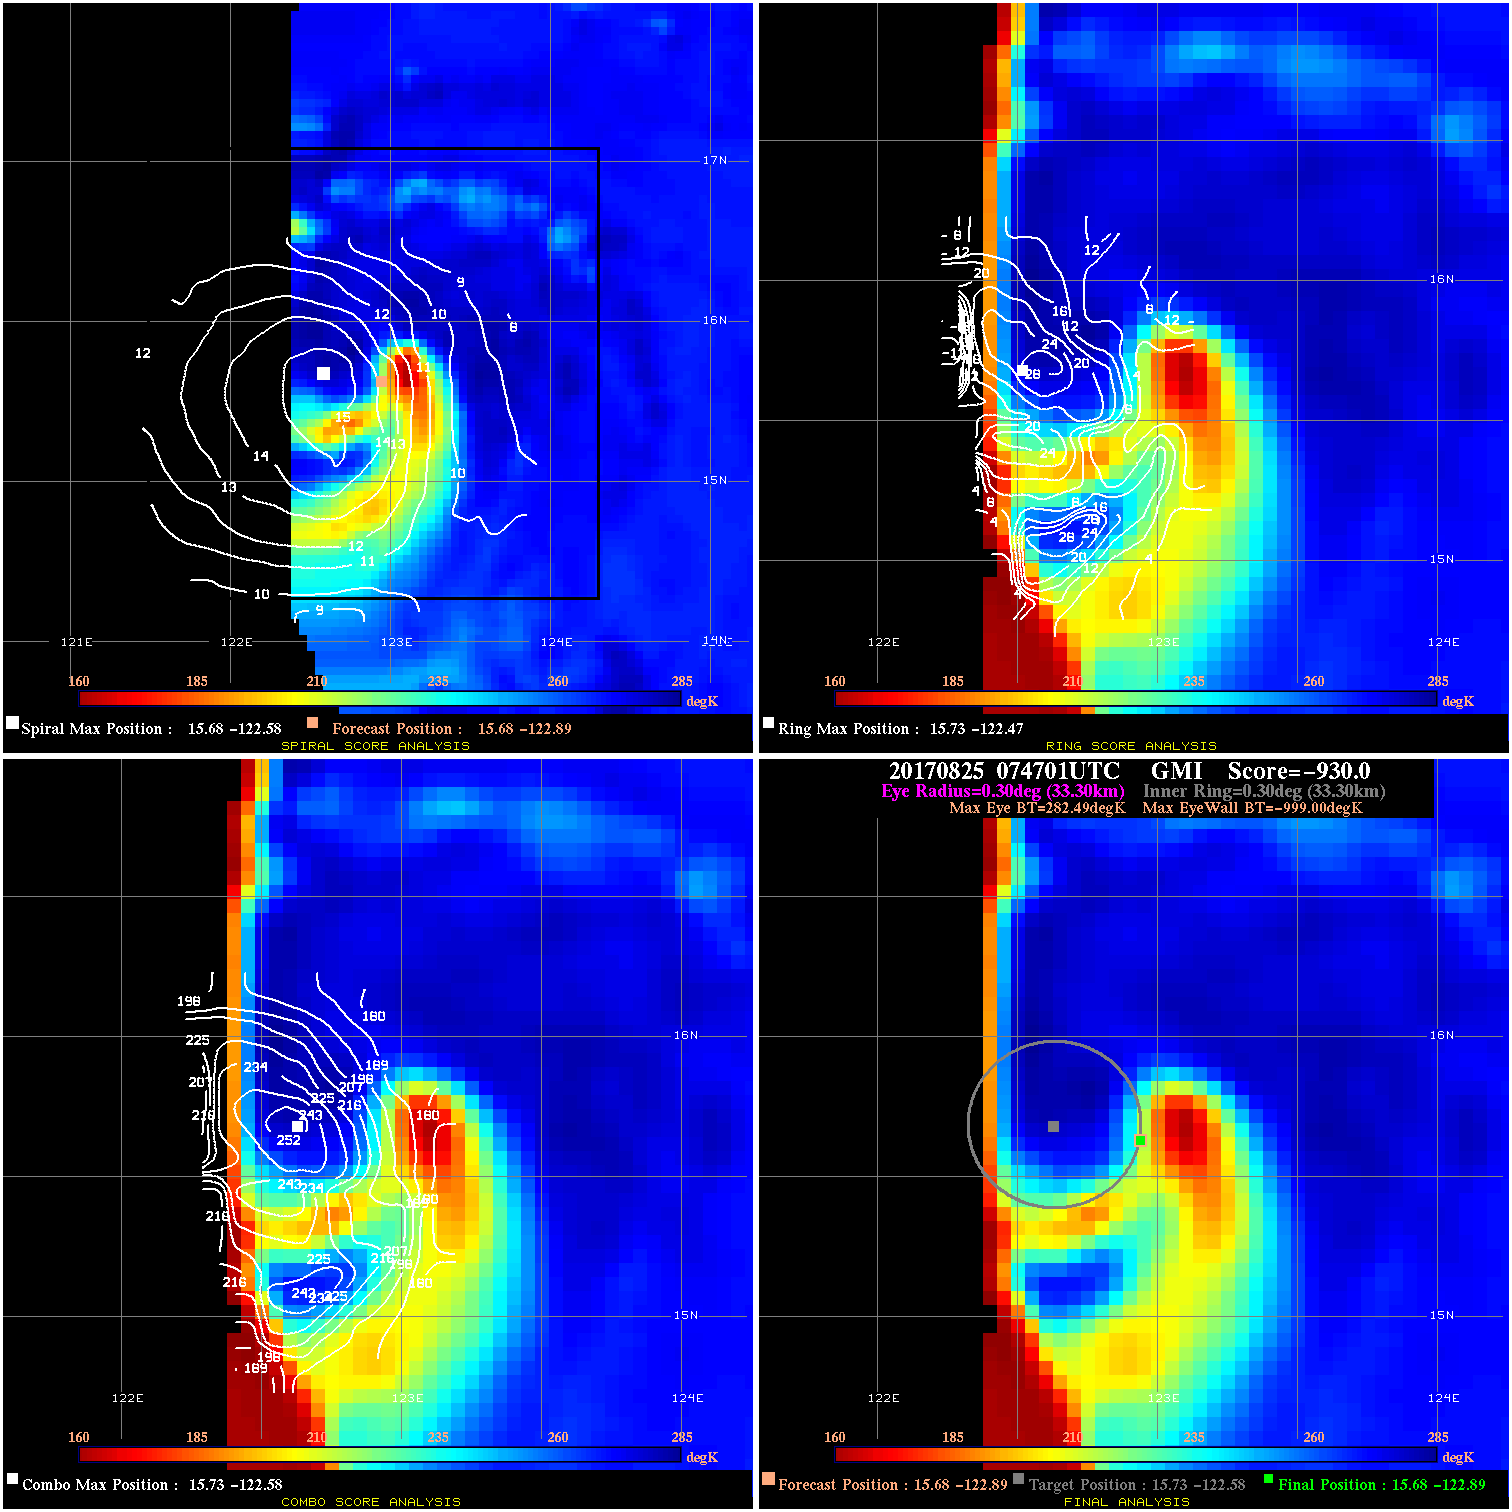
20170825 074701 -930.0 N/A N/A N/A 0.00 35.0 GMI 15.7 -122.9 15.7 -122.9 15.7 -122.6 Analysis Plot
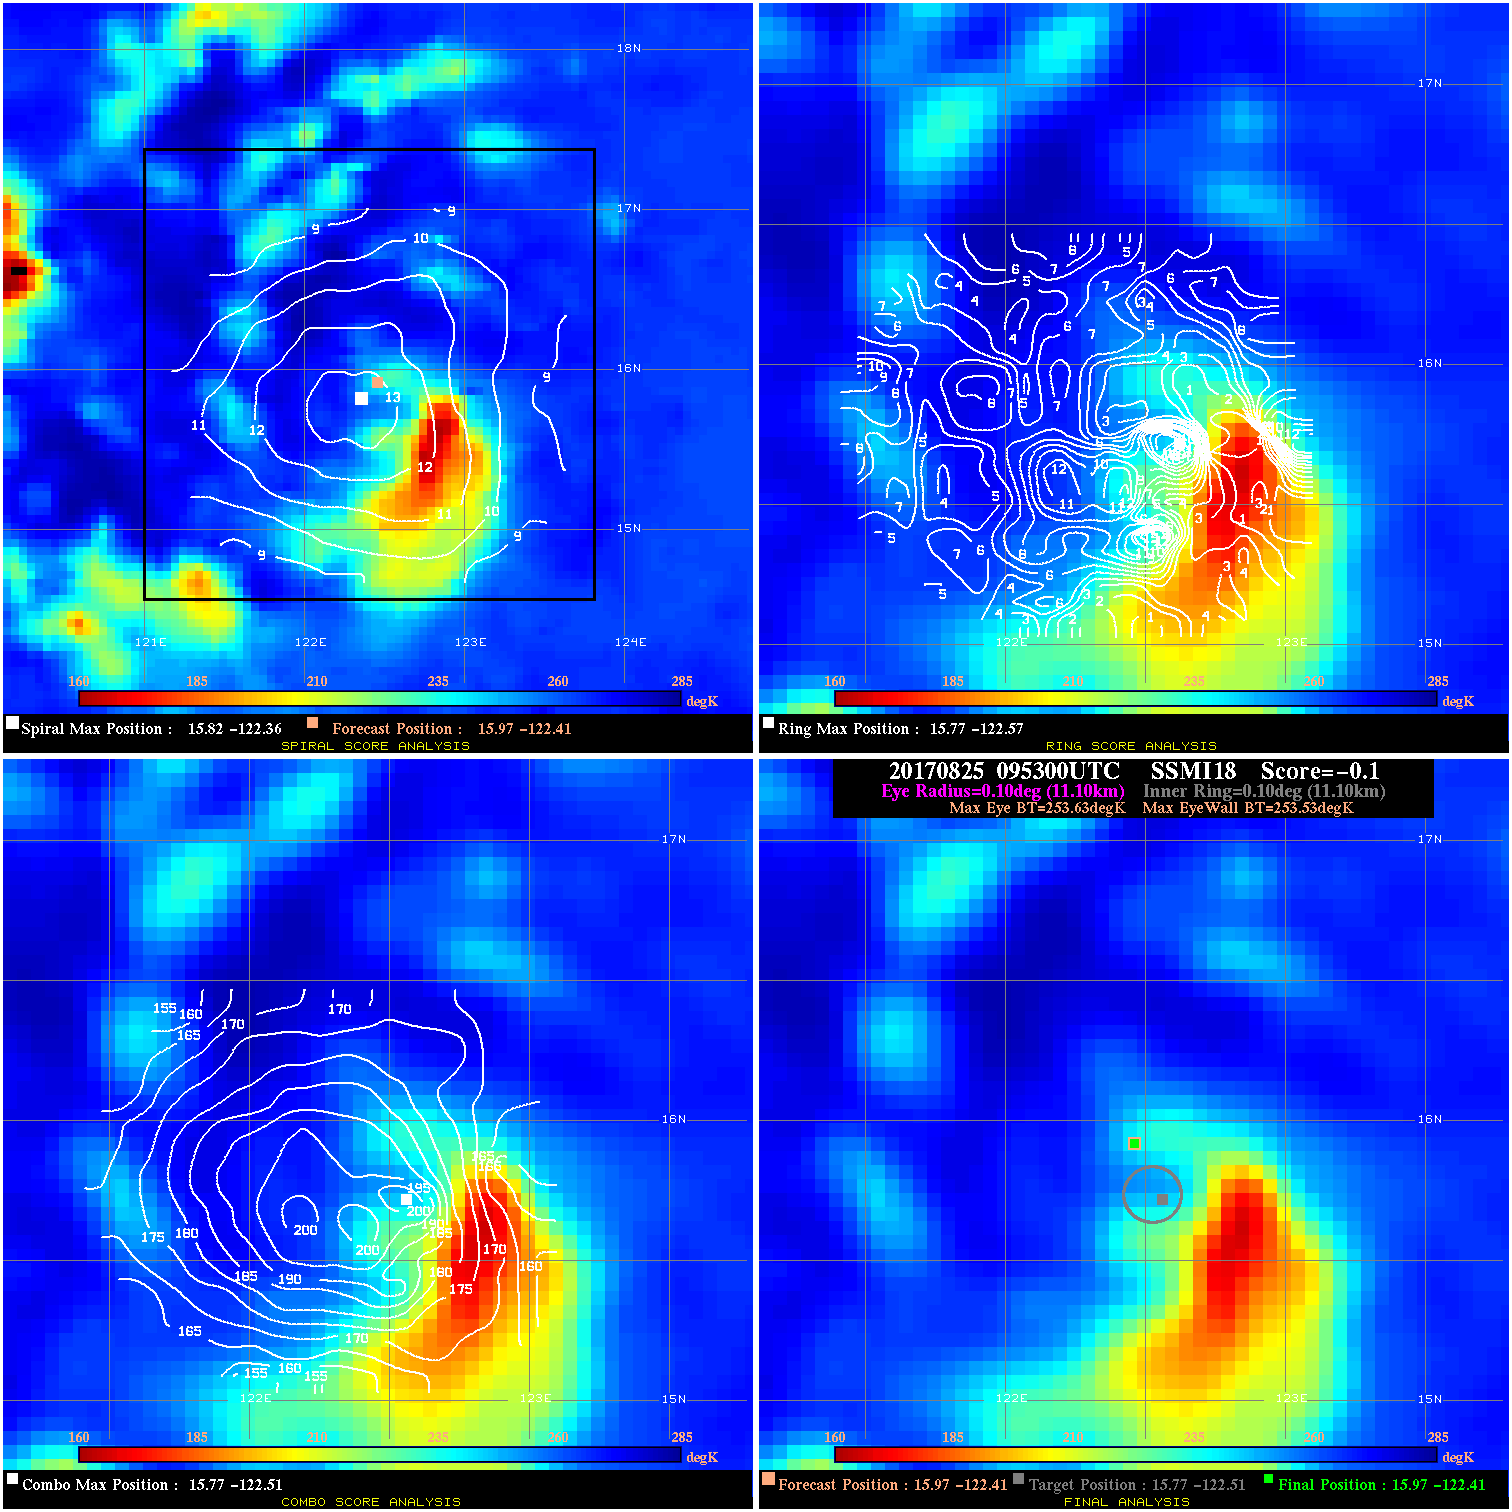
20170825 095300 -0.1 N/A 39.7% 22.22 .10 35.0 SSMI18 16.0 -122.4 16.0 -122.4 15.8 -122.5 Analysis Plot
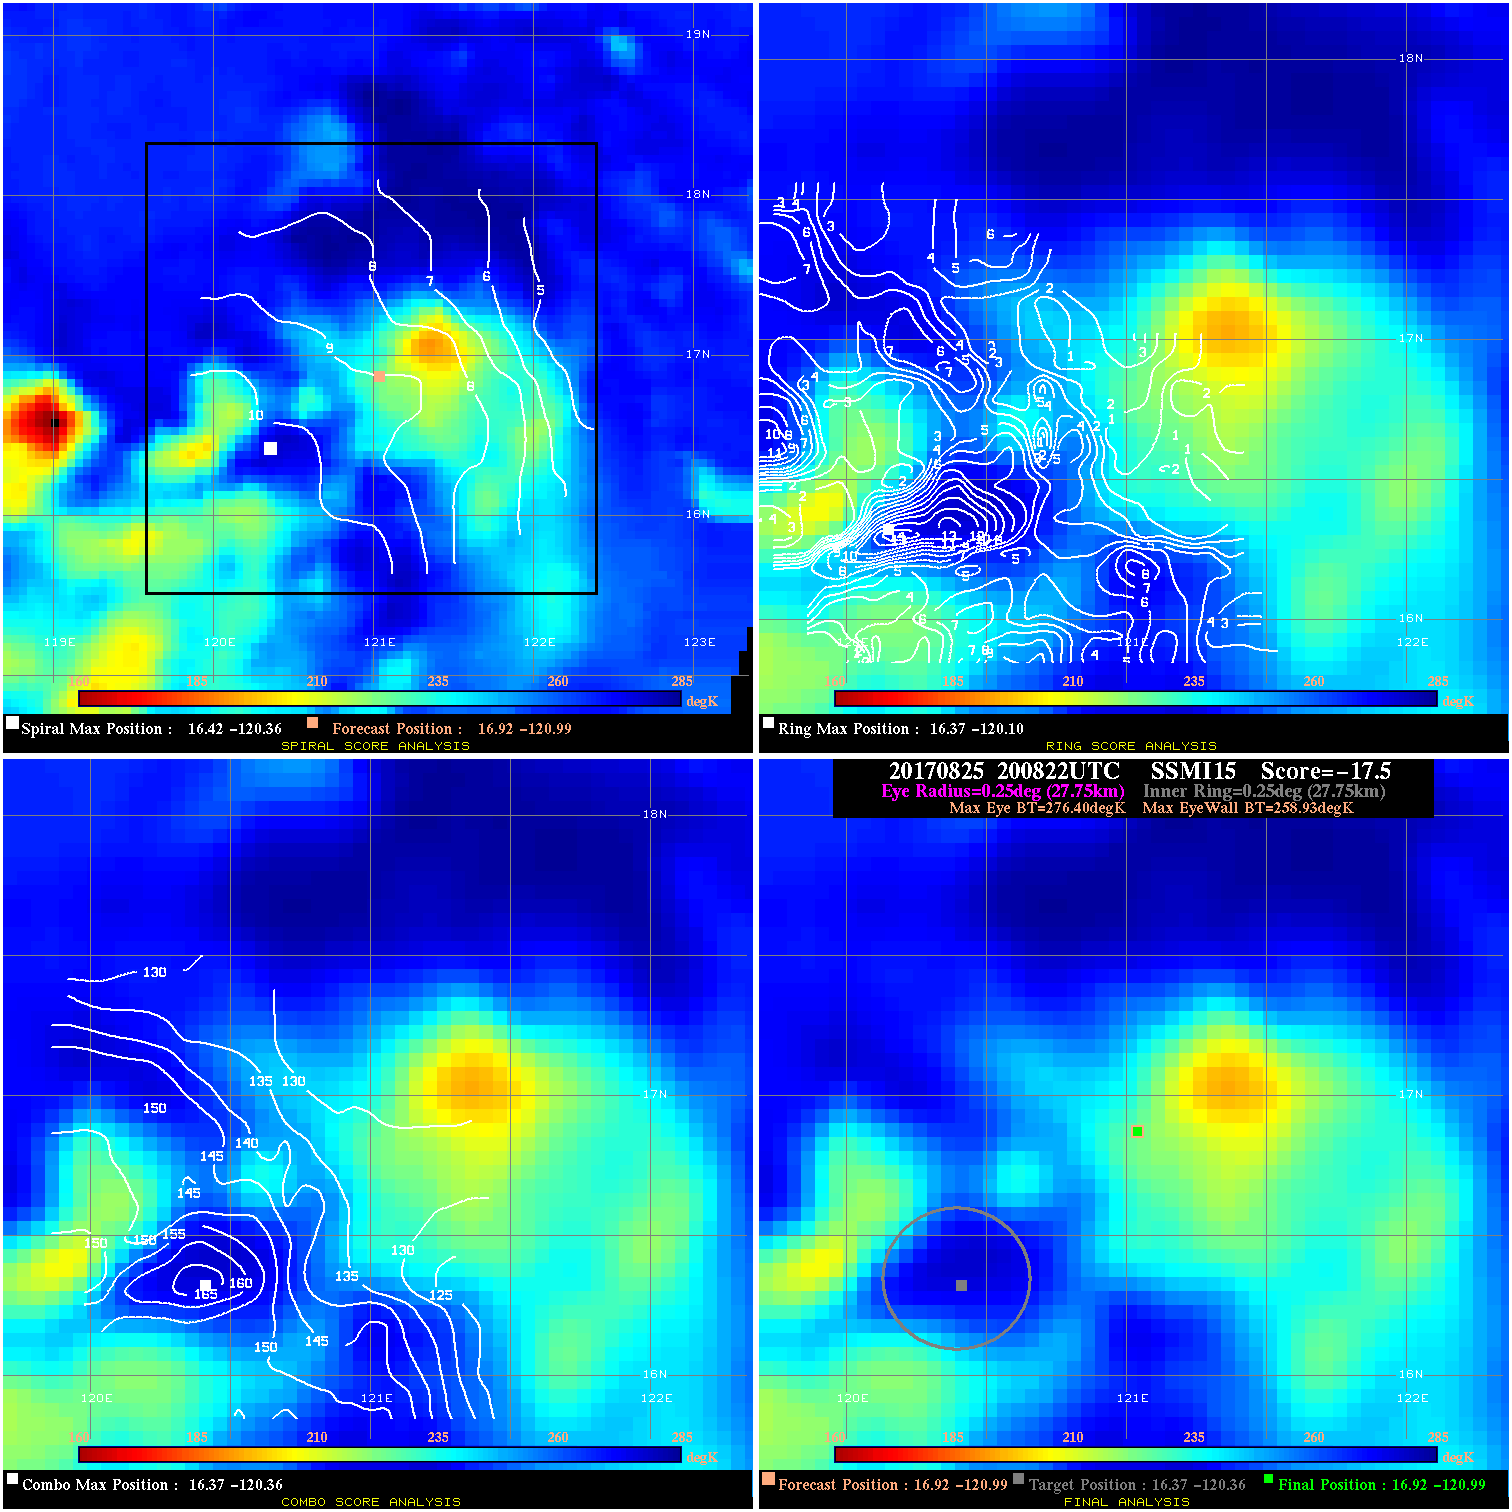
20170825 200822 -17.5 N/A 31.5% 55.55 17.47 35.0 SSMI15 16.9 -121.0 16.9 -121.0 16.4 -120.4 Analysis Plot
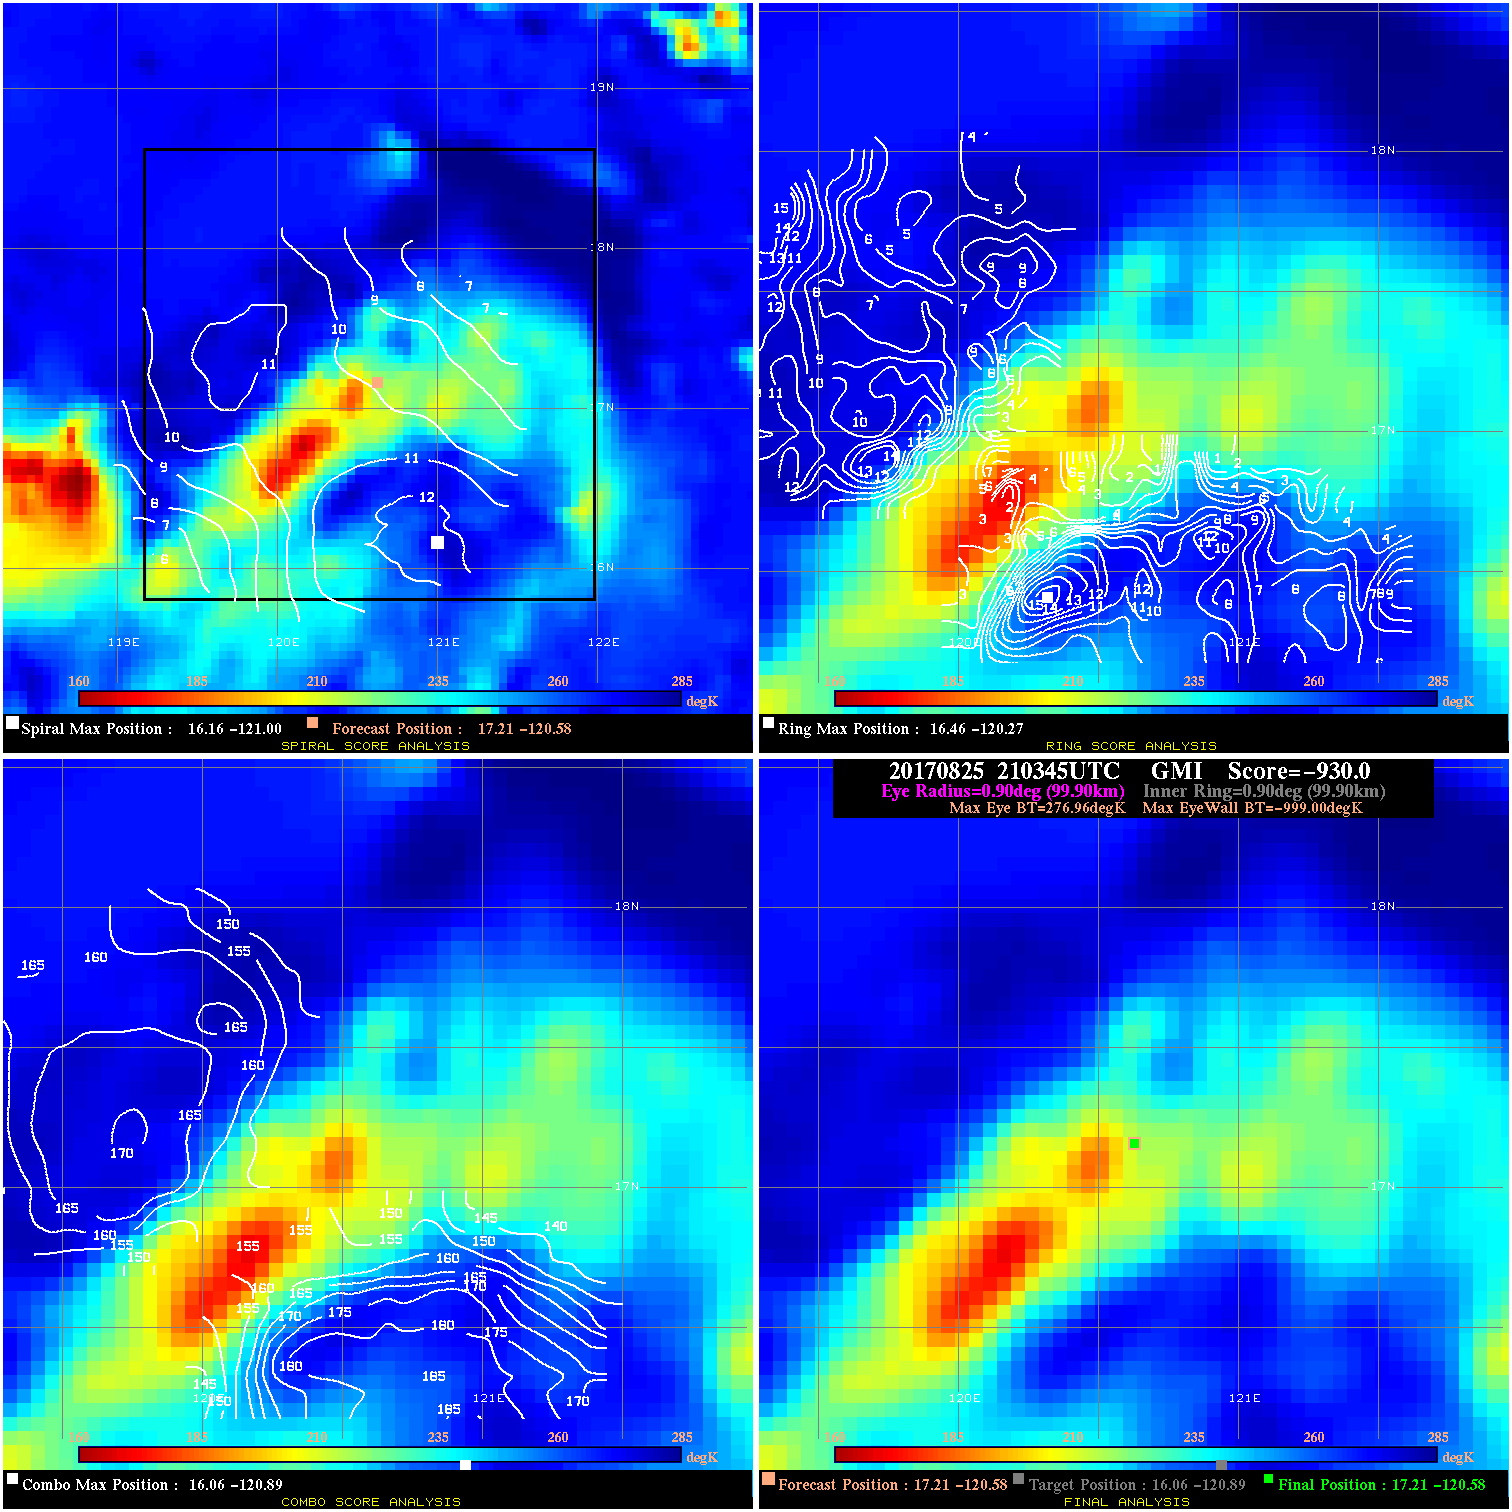
20170825 210345 -930.0 N/A N/A N/A 0.00 35.0 GMI 17.2 -120.6 17.2 -120.6 16.1 -120.9 Analysis Plot
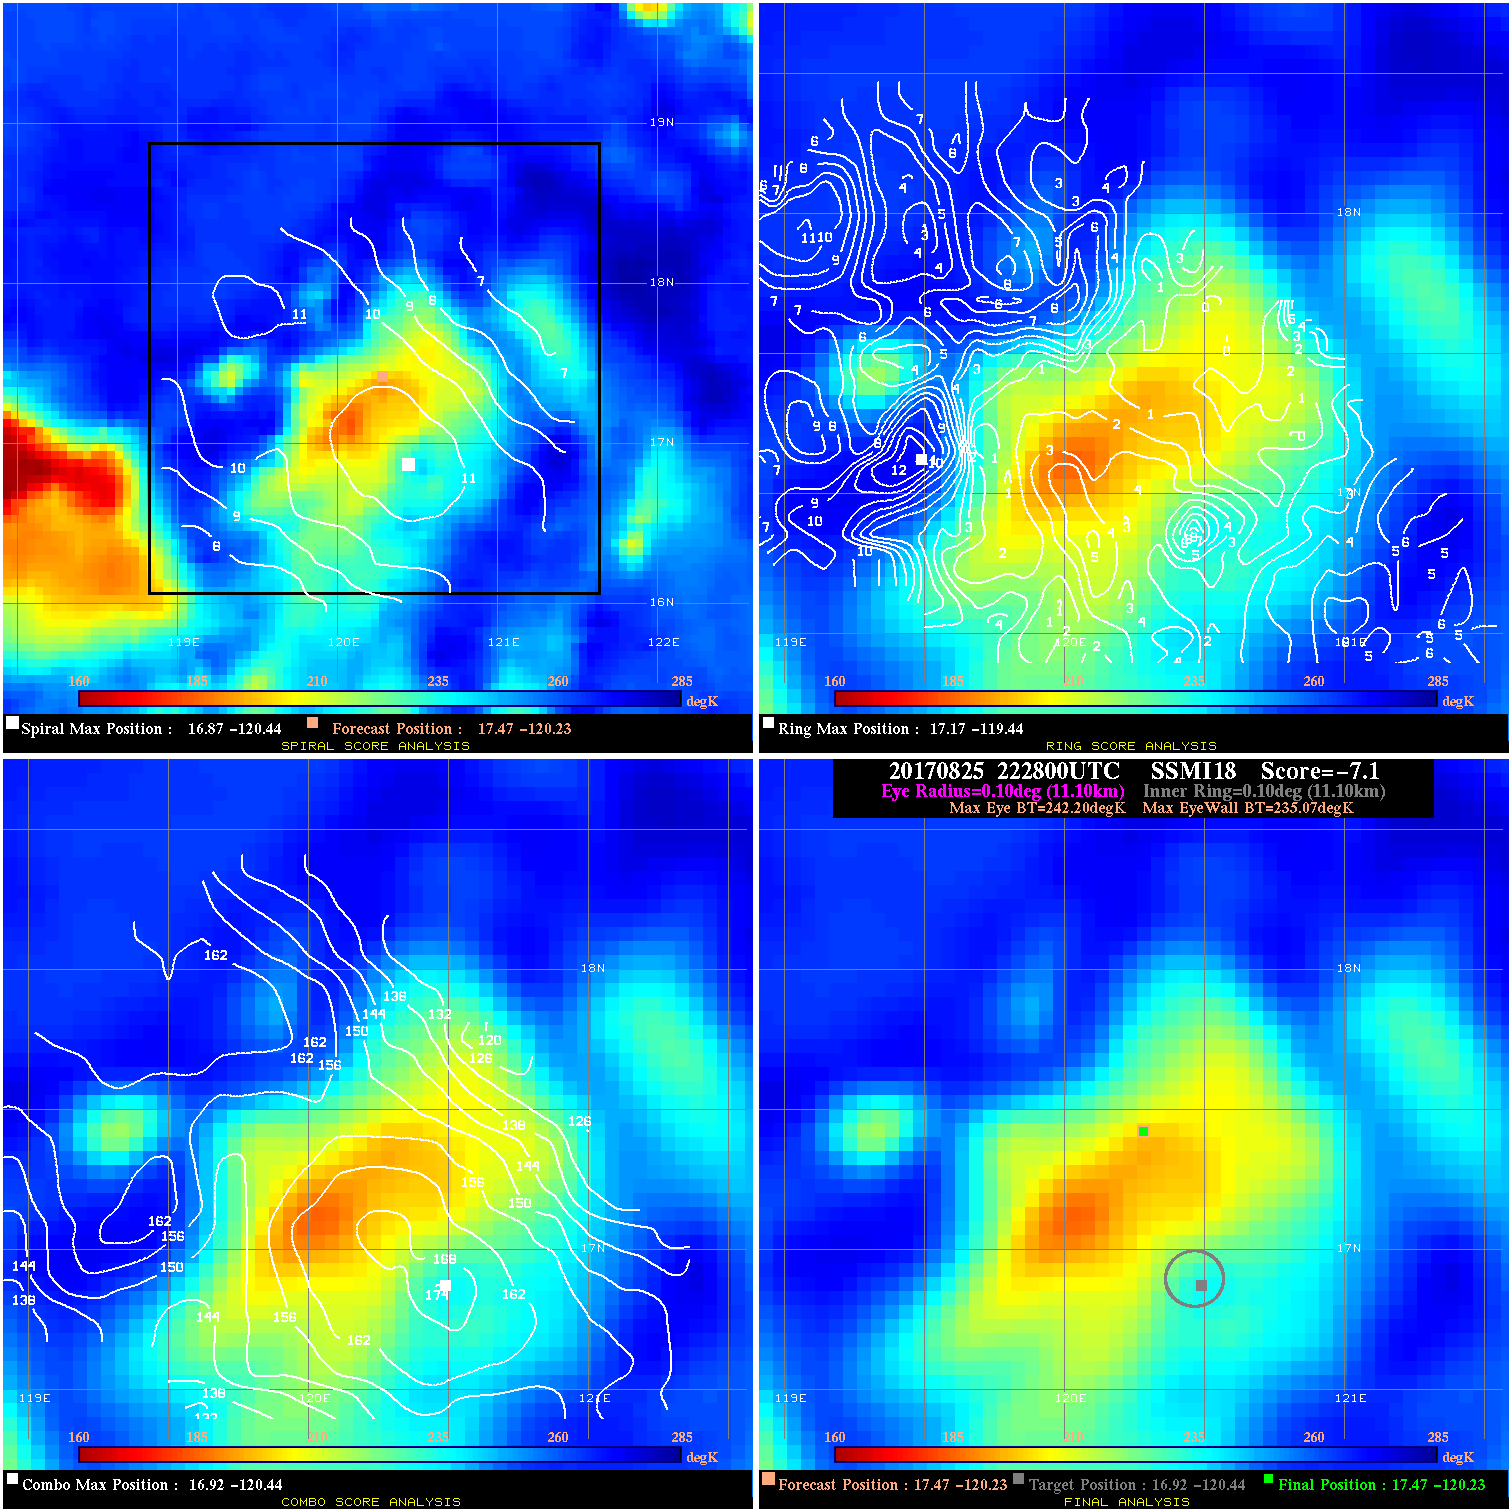
20170825 222800 -7.1 N/A 63.0% 22.22 7.13 35.0 SSMI18 17.5 -120.2 17.5 -120.2 16.9 -120.4 Analysis Plot
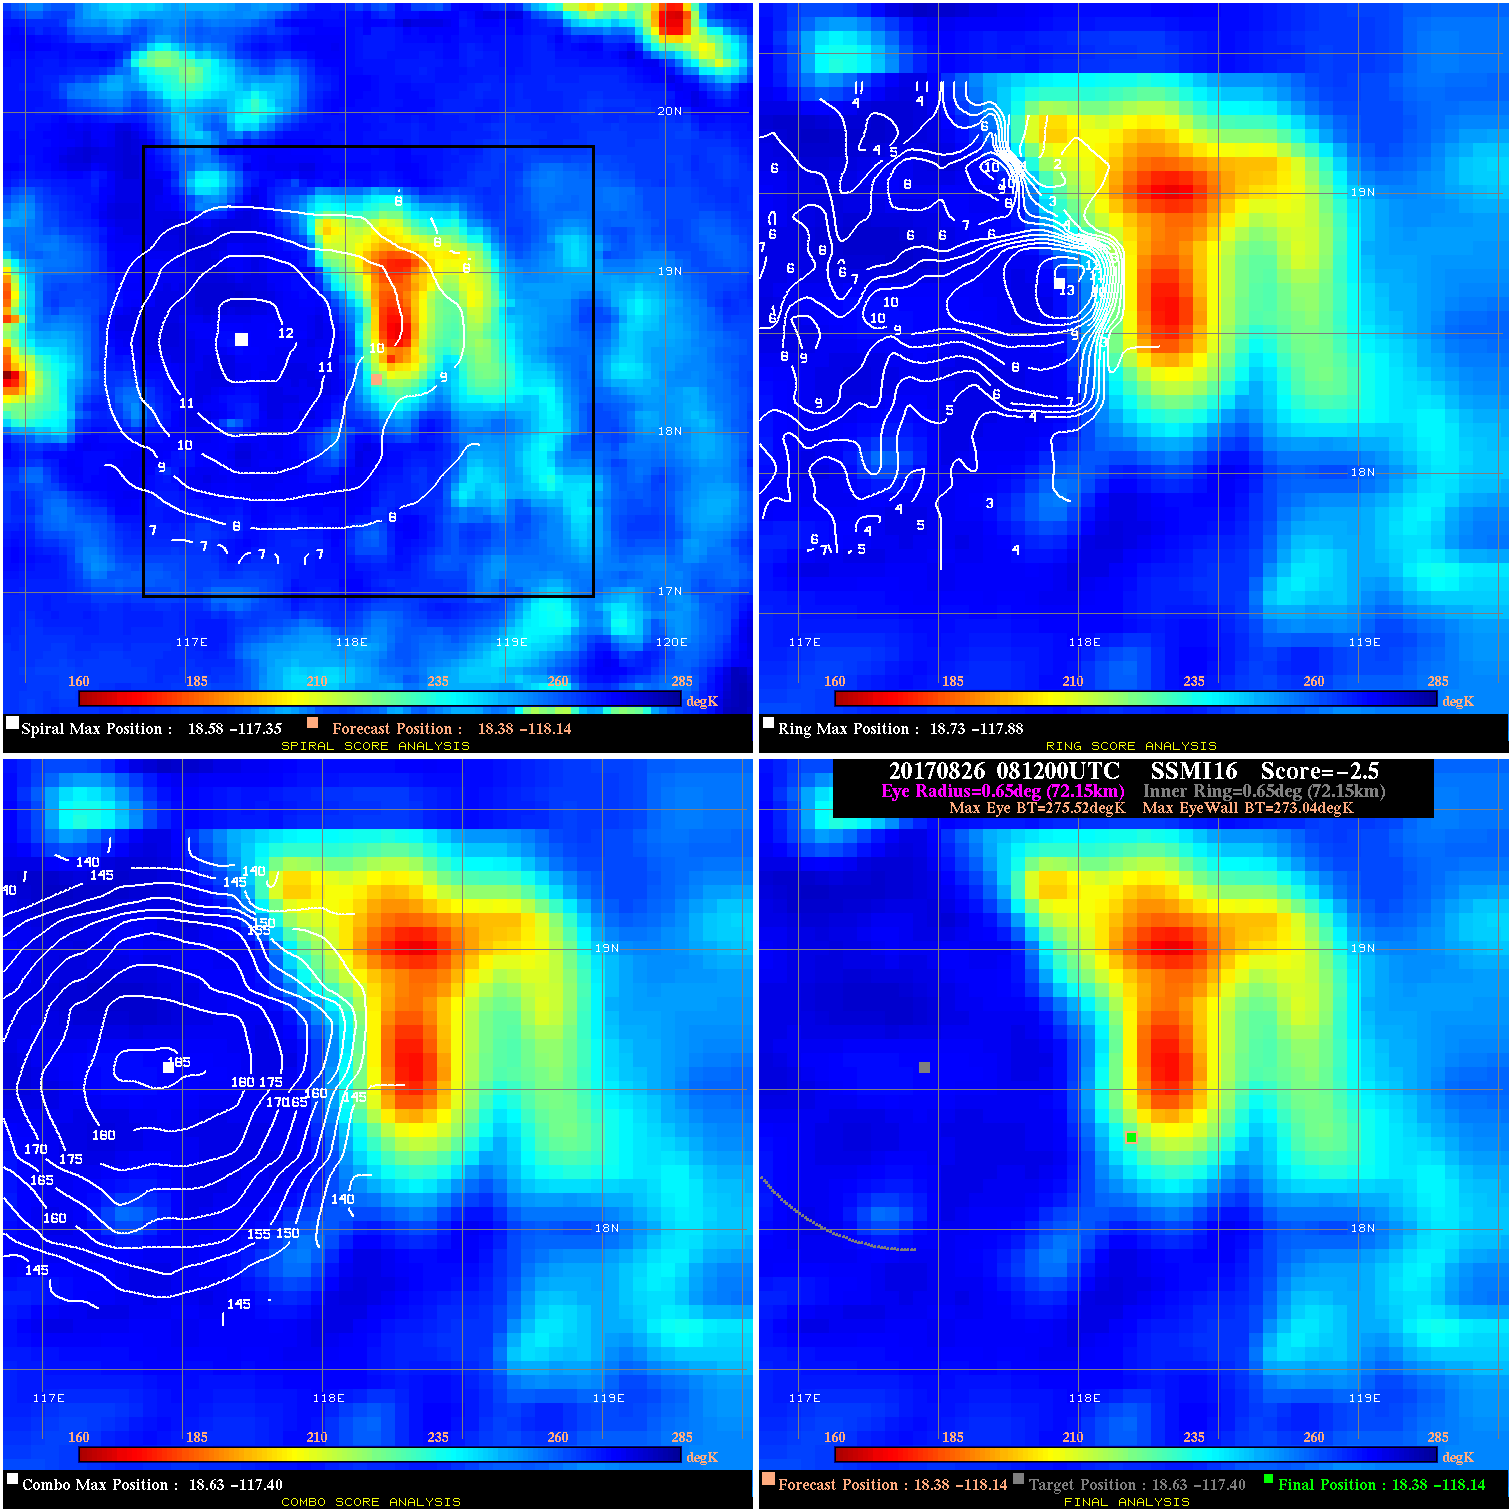
20170826 081200 -2.5 N/A 20.5% 144.43 2.48 40.0 SSMI16 18.4 -118.1 18.4 -118.1 18.6 -117.4 Analysis Plot
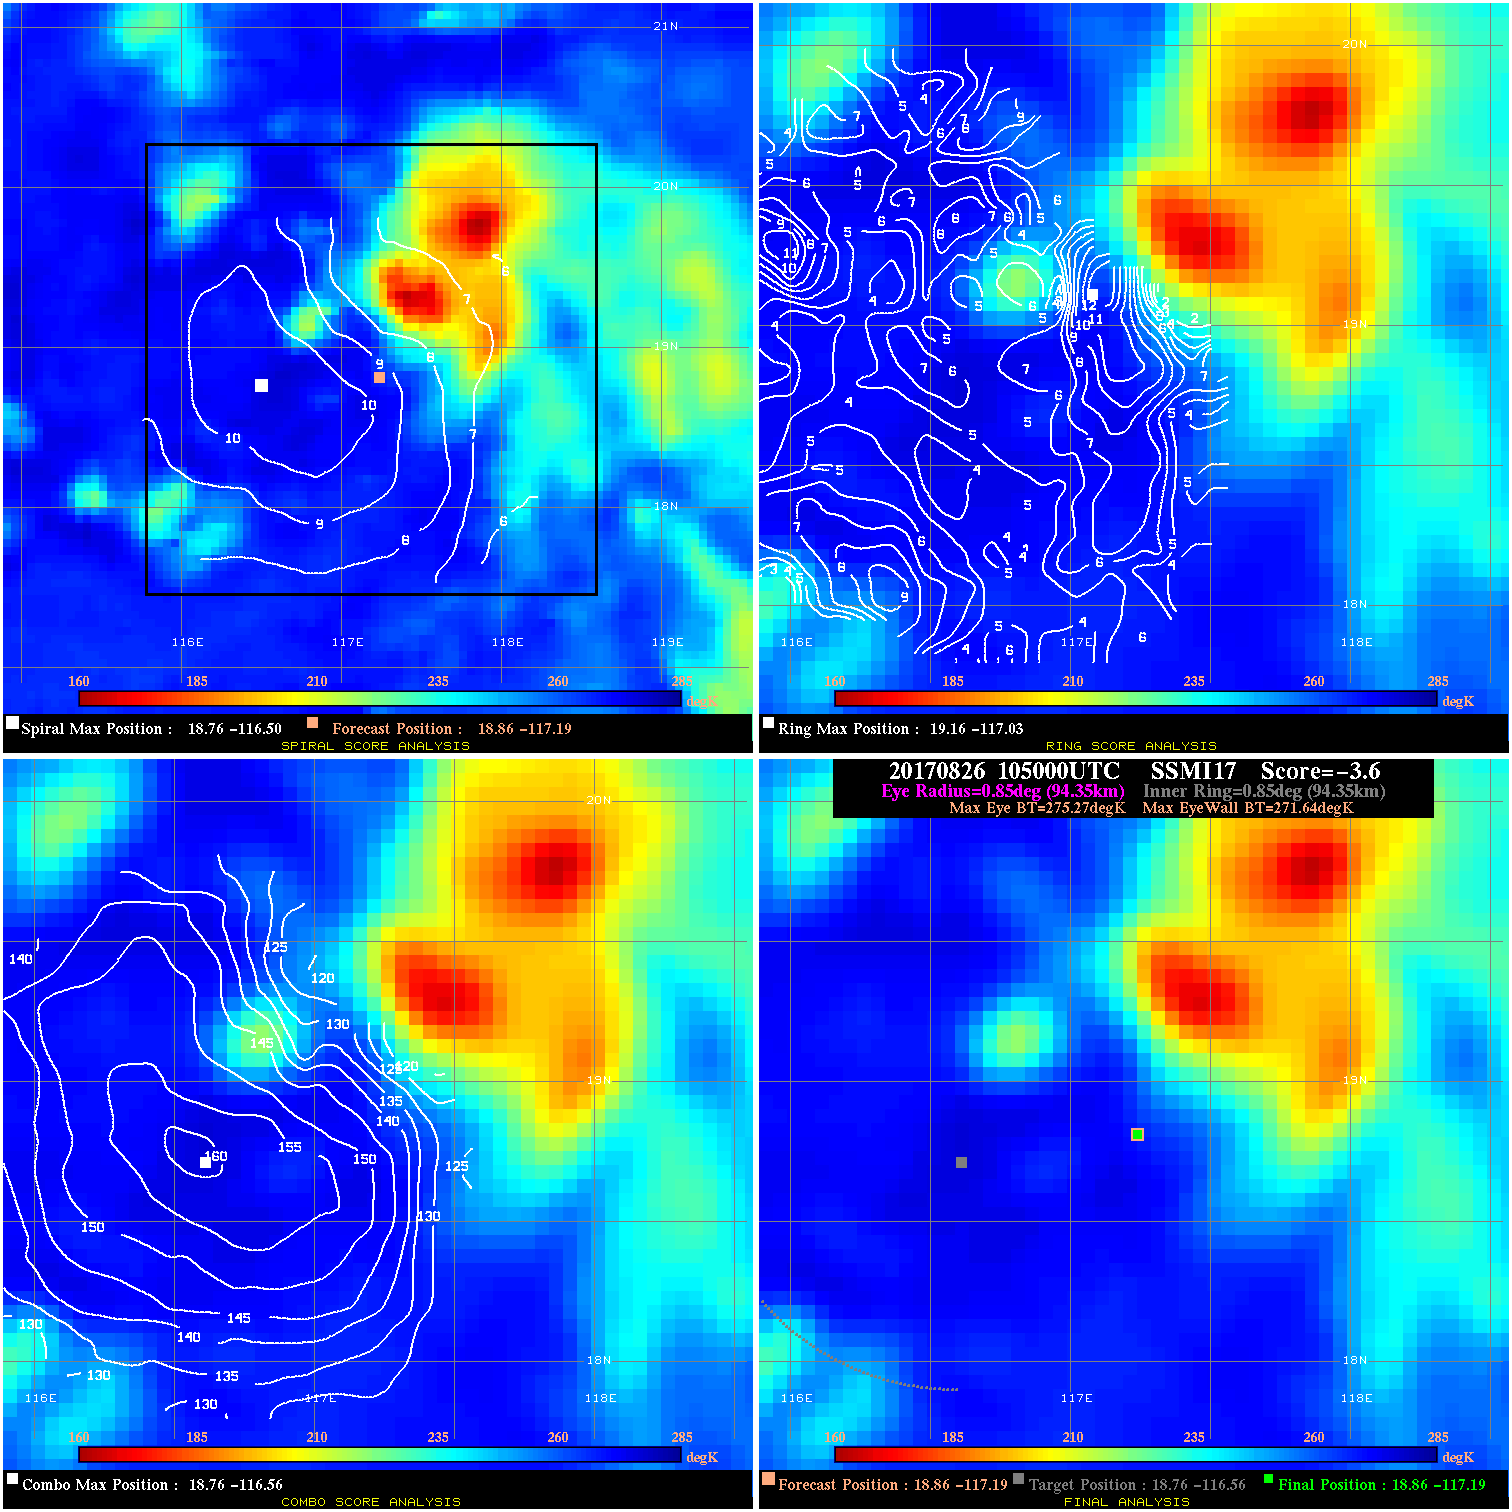
20170826 105000 -3.6 N/A 13.7% 188.87 3.63 40.0 SSMI17 18.9 -117.2 18.9 -117.2 18.8 -116.6 Analysis Plot
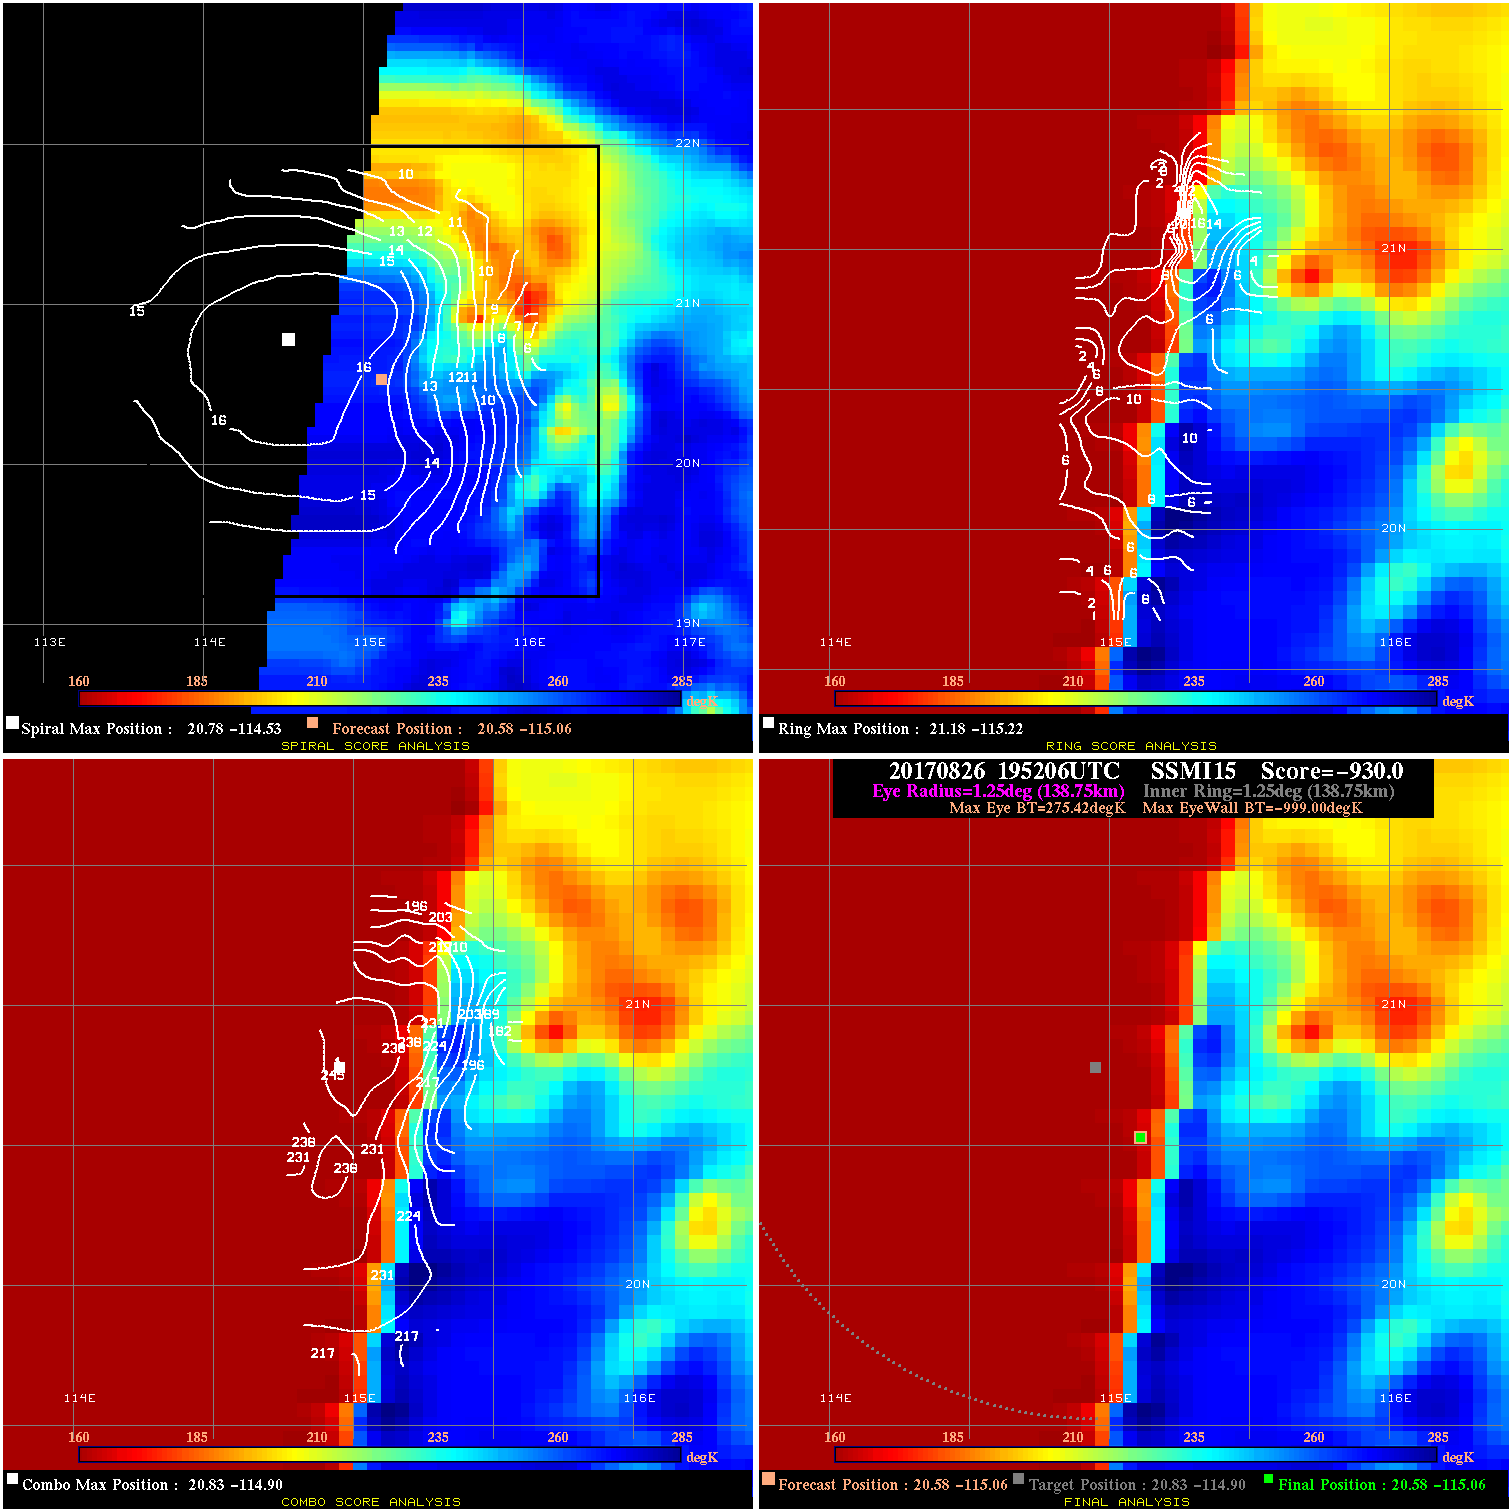
20170826 195206 -930.0 N/A N/A N/A 0.00 45.0 SSMI15 20.6 -115.1 20.6 -115.1 20.8 -114.9 Analysis Plot
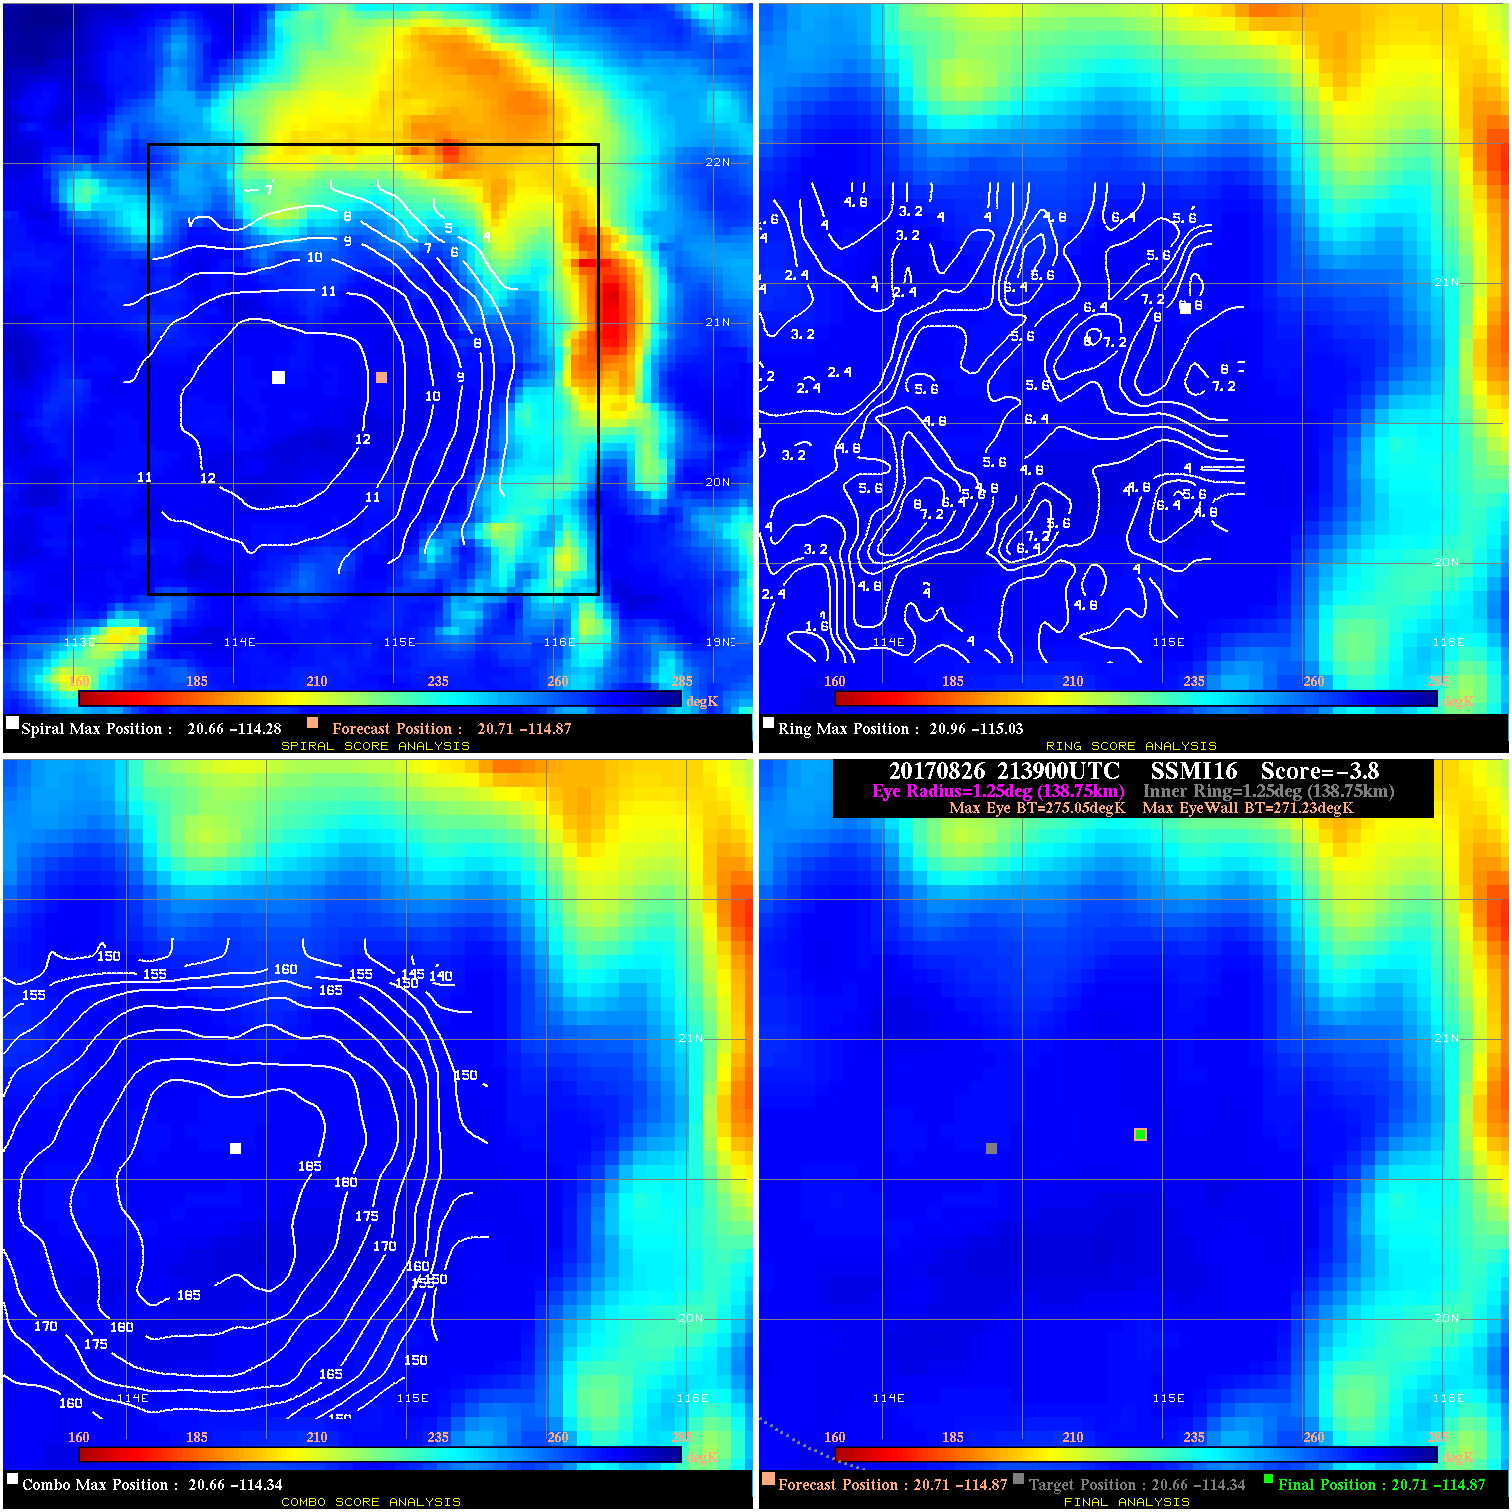
20170826 213900 -3.8 N/A 23.5% 277.75 3.82 45.0 SSMI16 20.7 -114.9 20.7 -114.9 20.7 -114.3 Analysis Plot
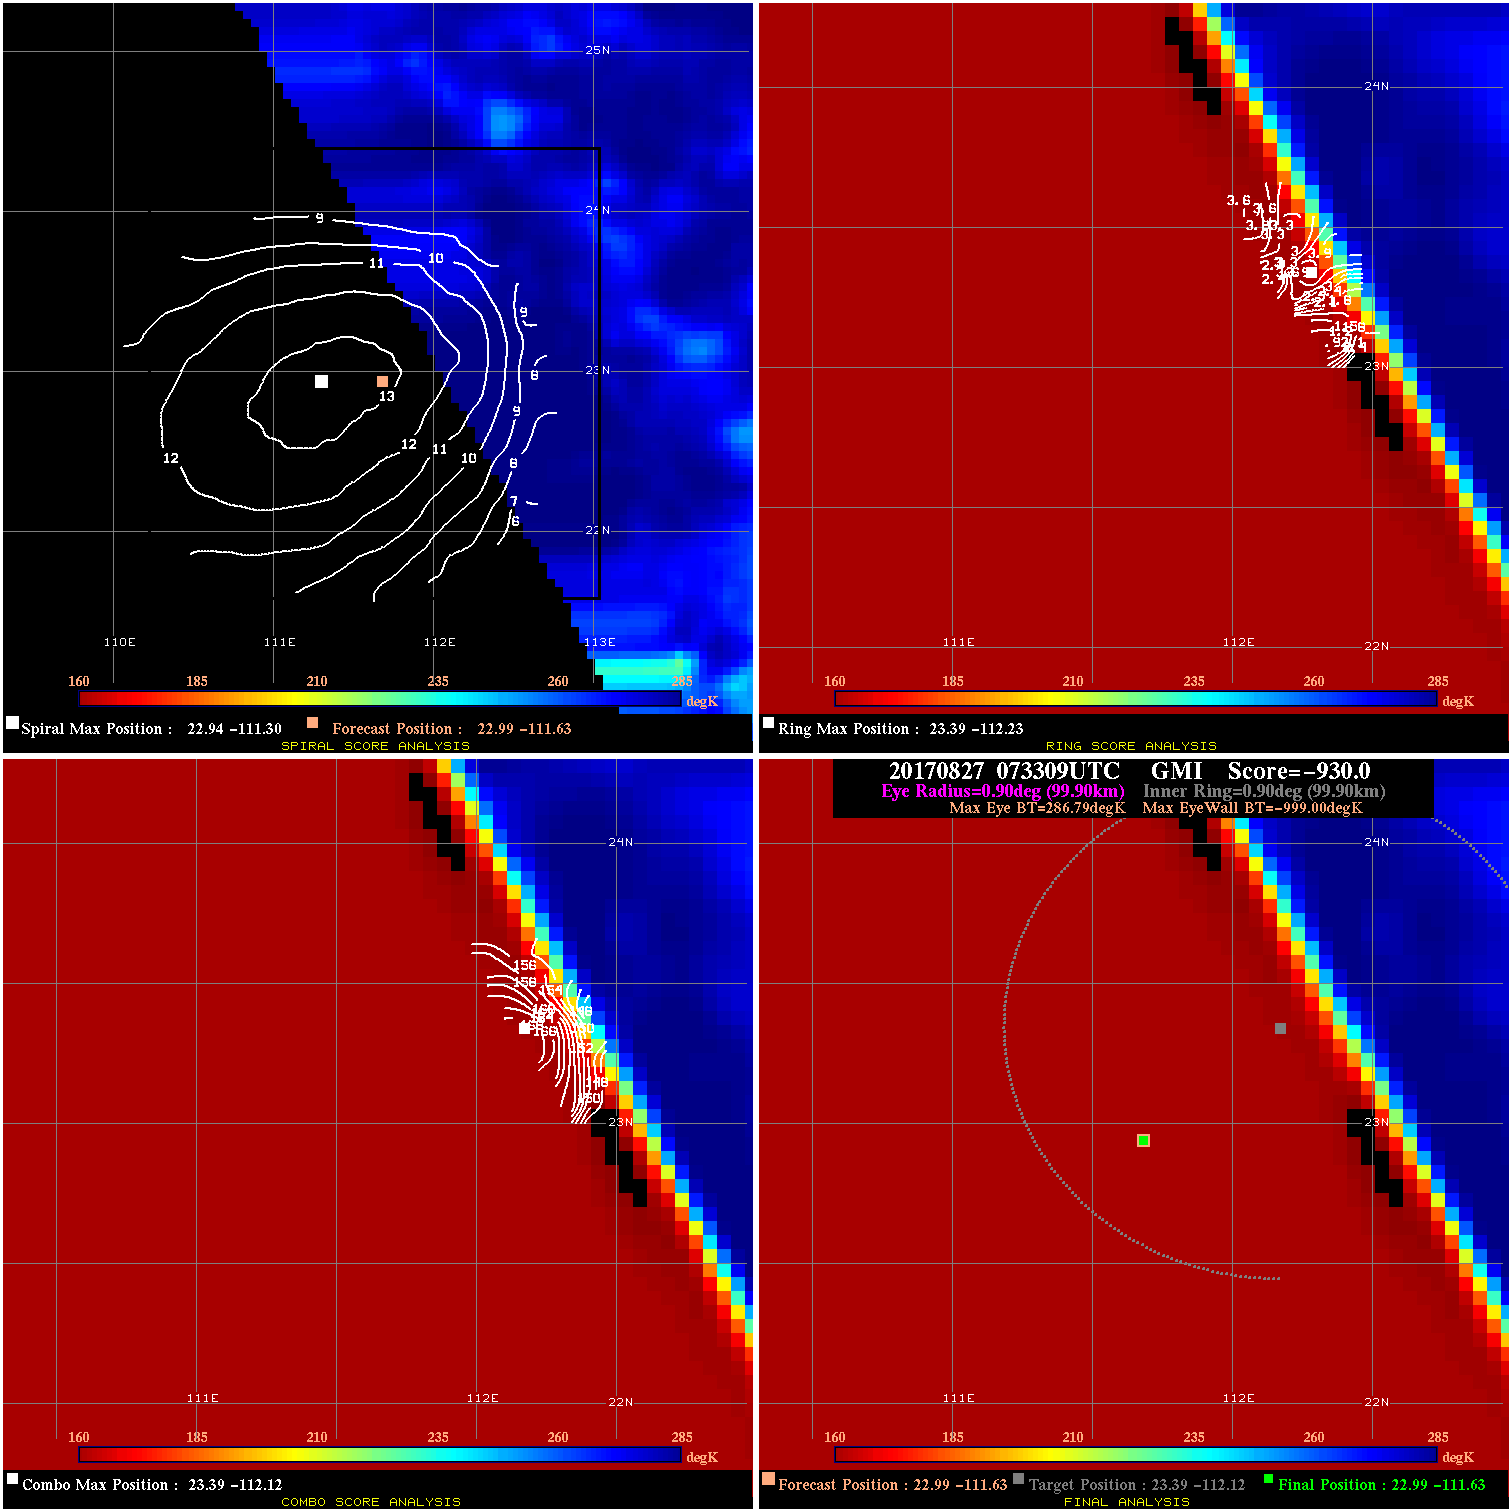
20170827 073309 -930.0 N/A N/A N/A 0.00 55.0 GMI 23.0 -111.6 23.0 -111.6 23.4 -112.1 Analysis Plot
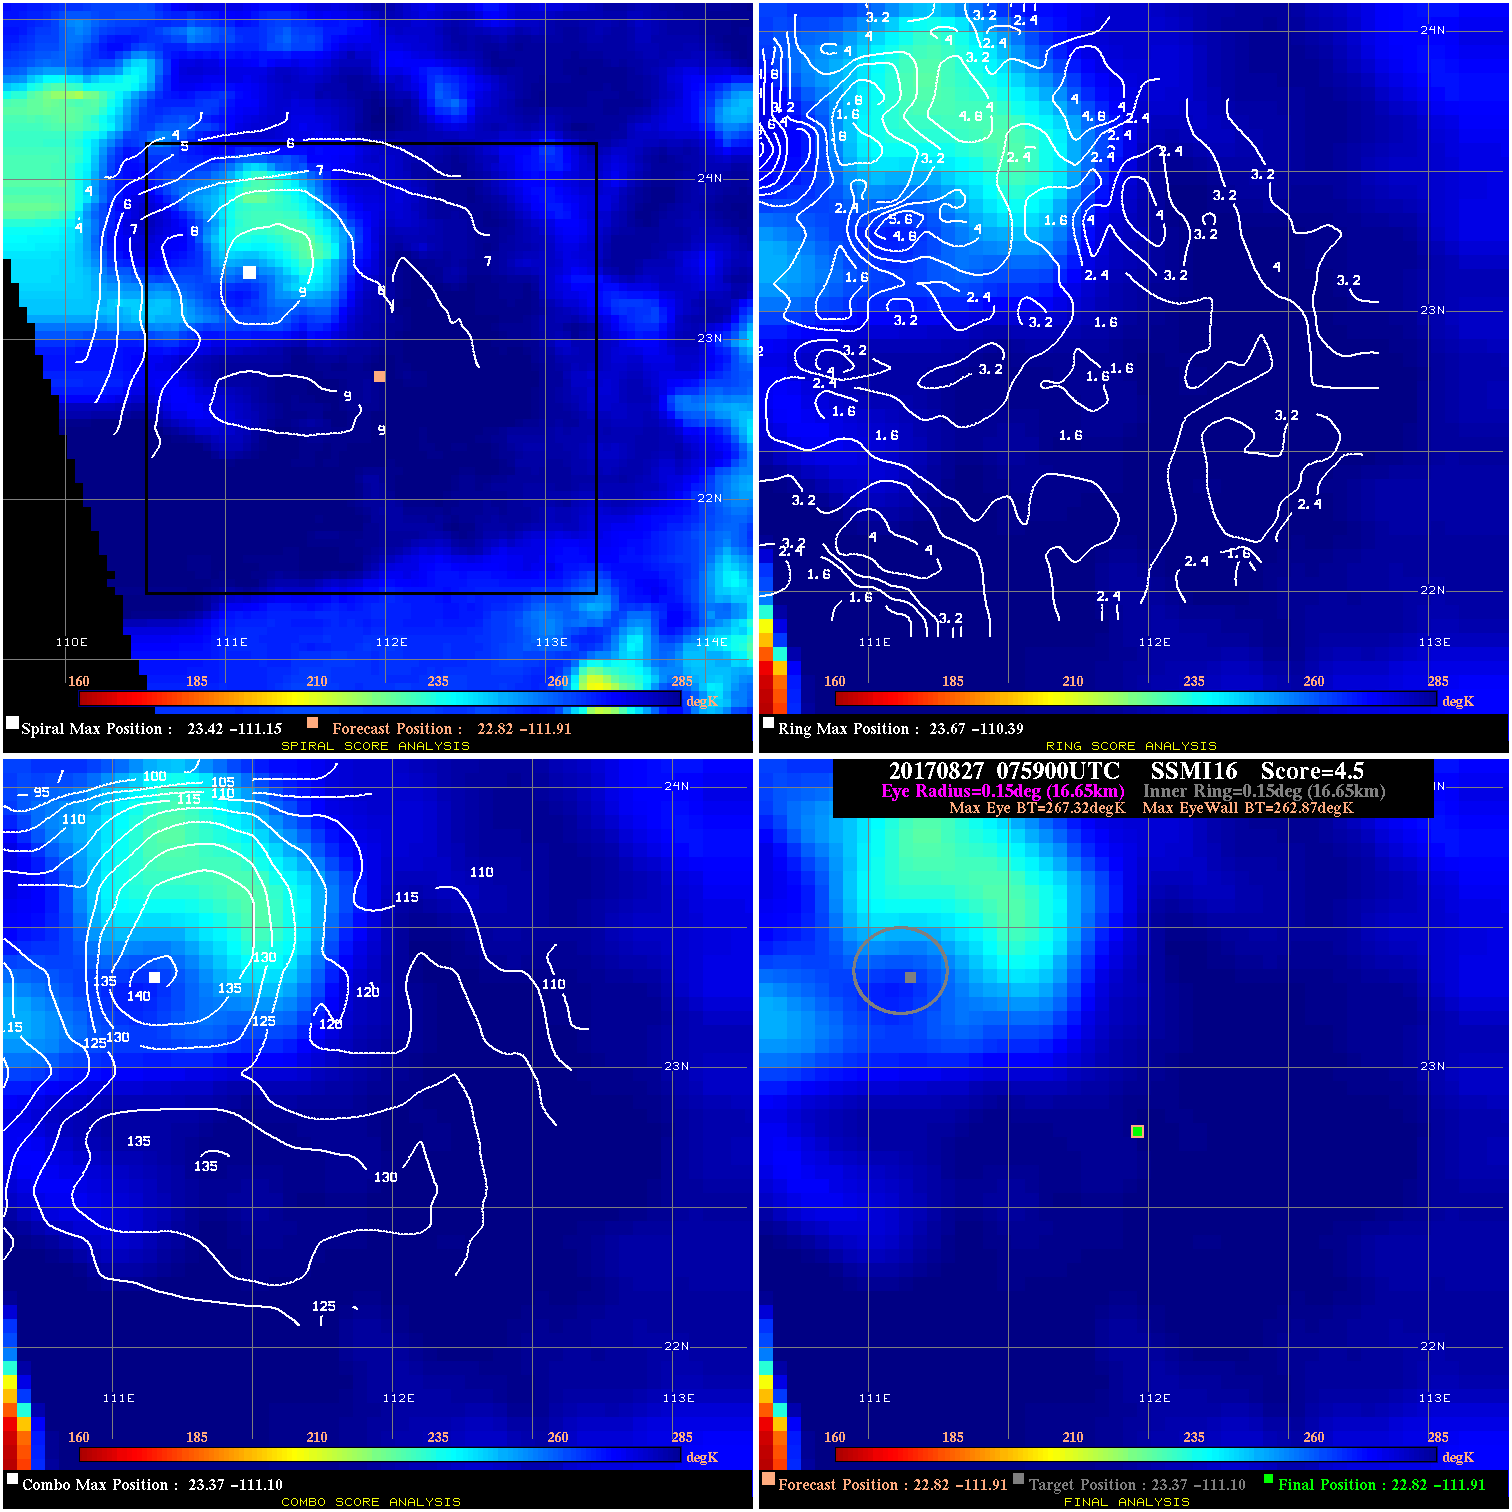
20170827 075900 4.5 N/A N/A 33.33 4.45 55.0 SSMI16 22.8 -111.9 22.8 -111.9 23.4 -111.1 Analysis Plot
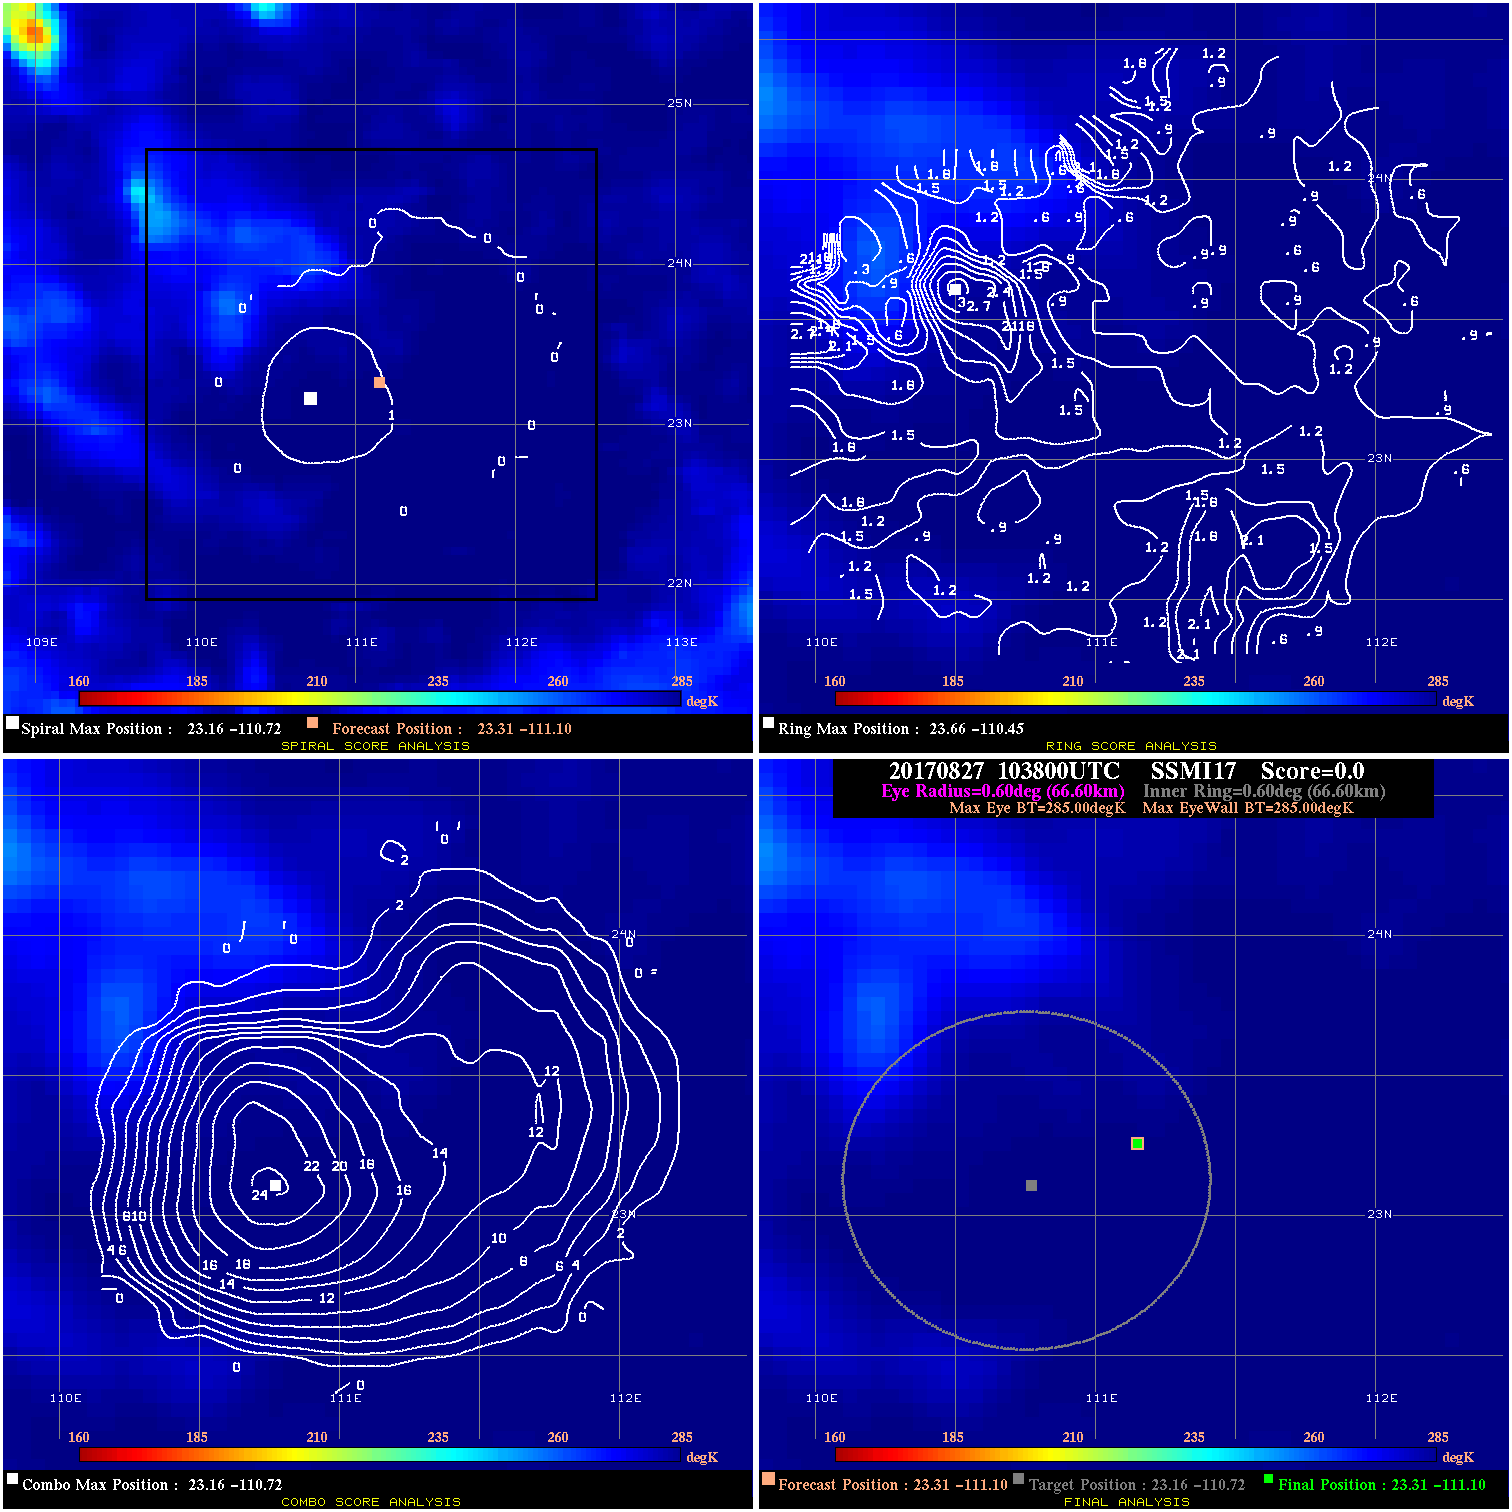
20170827 103800 -0.0 N/A N/A N/A 0.00 55.0 SSMI17 23.3 -111.1 23.3 -111.1 23.2 -110.7 Analysis Plot
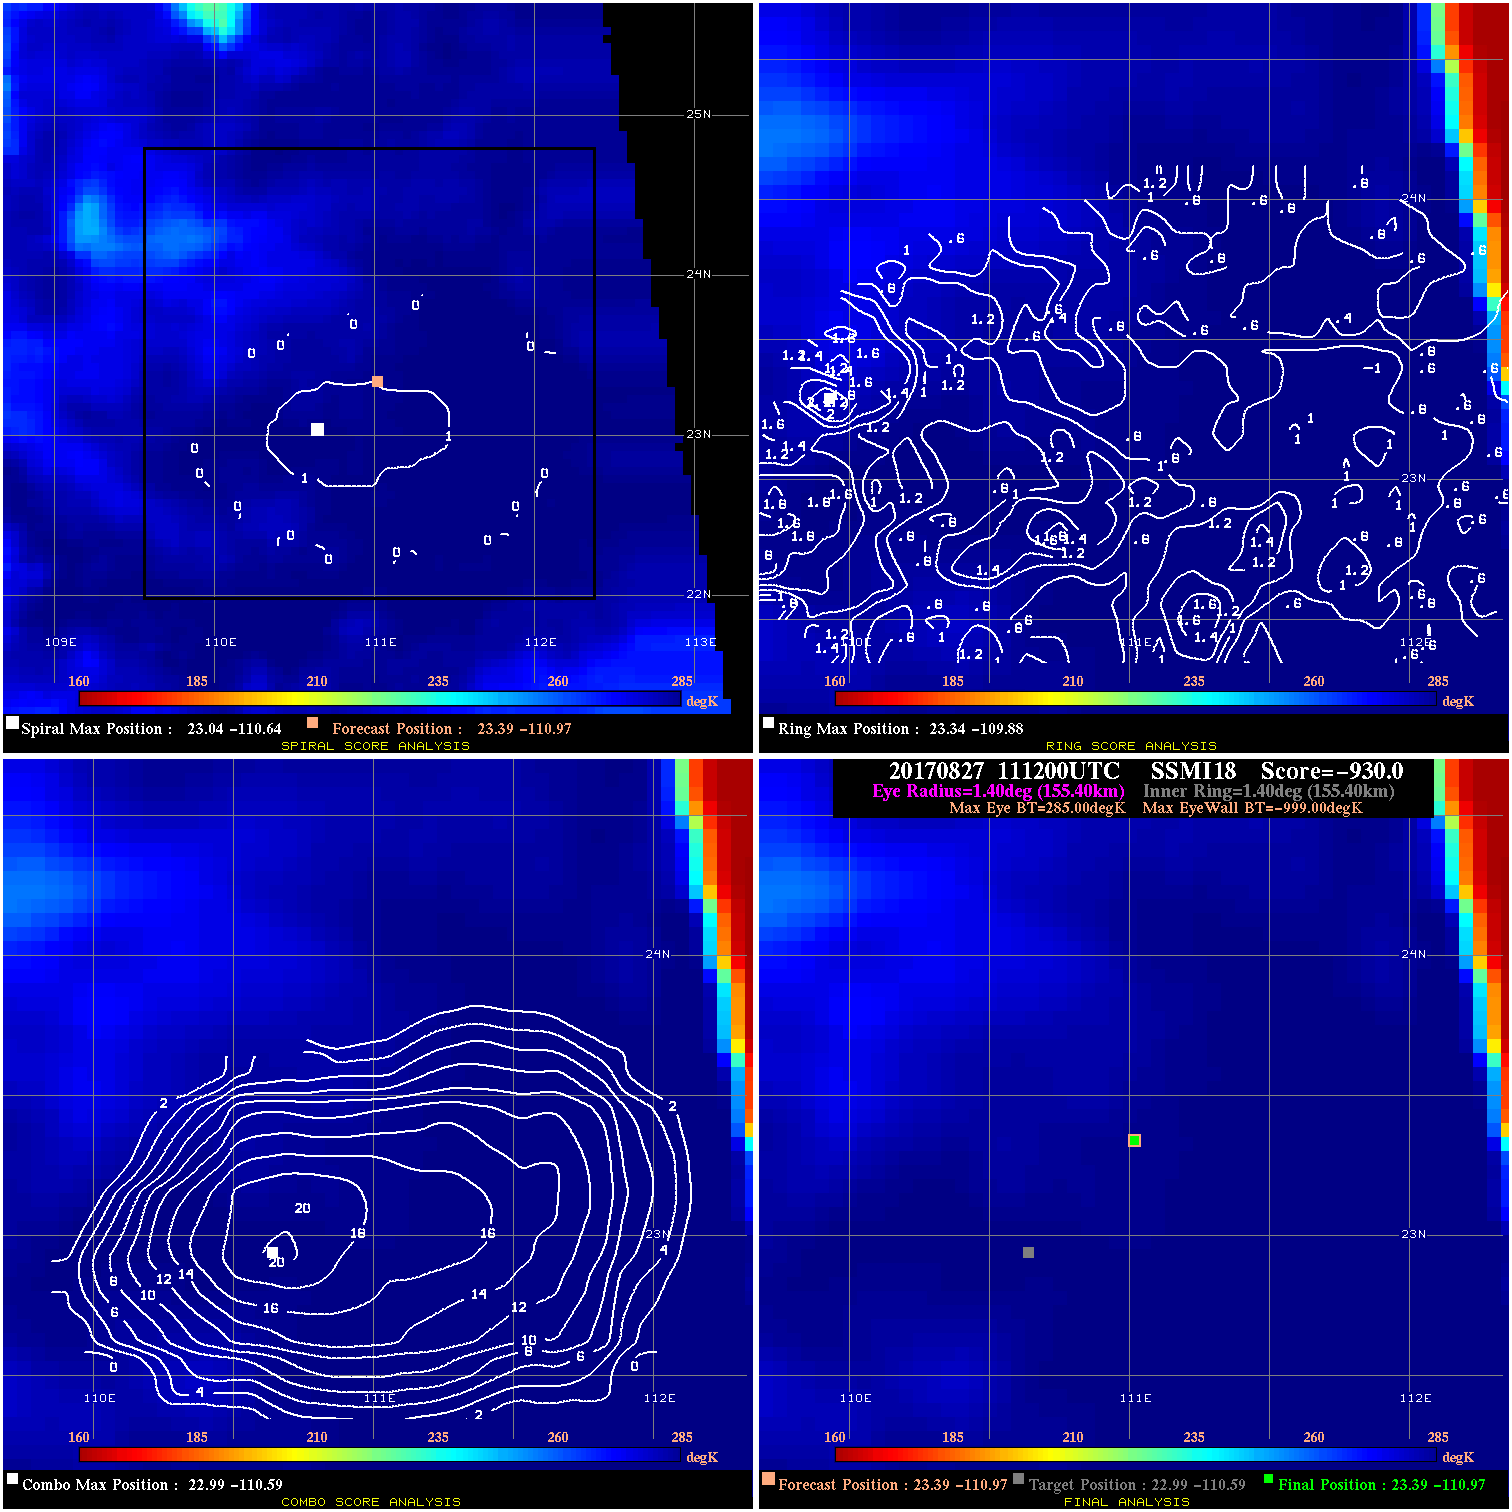
20170827 111200 -930.0 N/A N/A N/A 0.00 55.0 SSMI18 23.4 -111.0 23.4 -111.0 23.0 -110.6 Analysis Plot
|
|
Legend: - Date/Time are determined from PMW imagery at Forecast (initial guess) Lat/Lon position. - Positive/Negative Latitude = North/South Hemisphere; Longitude = Western/Eastern Hemisphere. - "Ring Diam" value indicates the estimated surface eyewall diameter in km (the MI eyewall edge diameter minus 10 km). - "Ring Pct" is the percentage of the "ring" (eyewall inner boundary) that is 1) colder than the "hot spot" (warmest eye pixel) in the eye by 20K, or 2) the percentage that is a) colder than 232K and b) colder than the "hot spot" by 10K, whichever is greater. - Values are red if Ring % <= 65, yellow/brown if Ring % <= 85 and green if Ring % > 85. - "Tb diff" is the difference between the "hot spot" (warmest eye pixel) and the warmest pixel on the eyewall. - Intensity score are listed as negative, and not used, when the JTWC or NHC estimated Vmax is <55 kts in order to rule out weak but highly symmetric TCs. - Error messages in intensity scores: -920 is used when the hottest pixel in the eye is <200K, to prevent false positives; -930 means <85% of eyewall has observations/data. |