Tropical Storm 27W
|
Passive Microwave (PMW) Intensity Information Advanced Dvorak Technique (ADT) Version 8.2.1 |
Overpass Inten Ring Ring Wind Forecast Final Target
Date Time Score Meaning Pct Diam BTdiff Est Sat Lat Lon Lat Lon Lat Lon
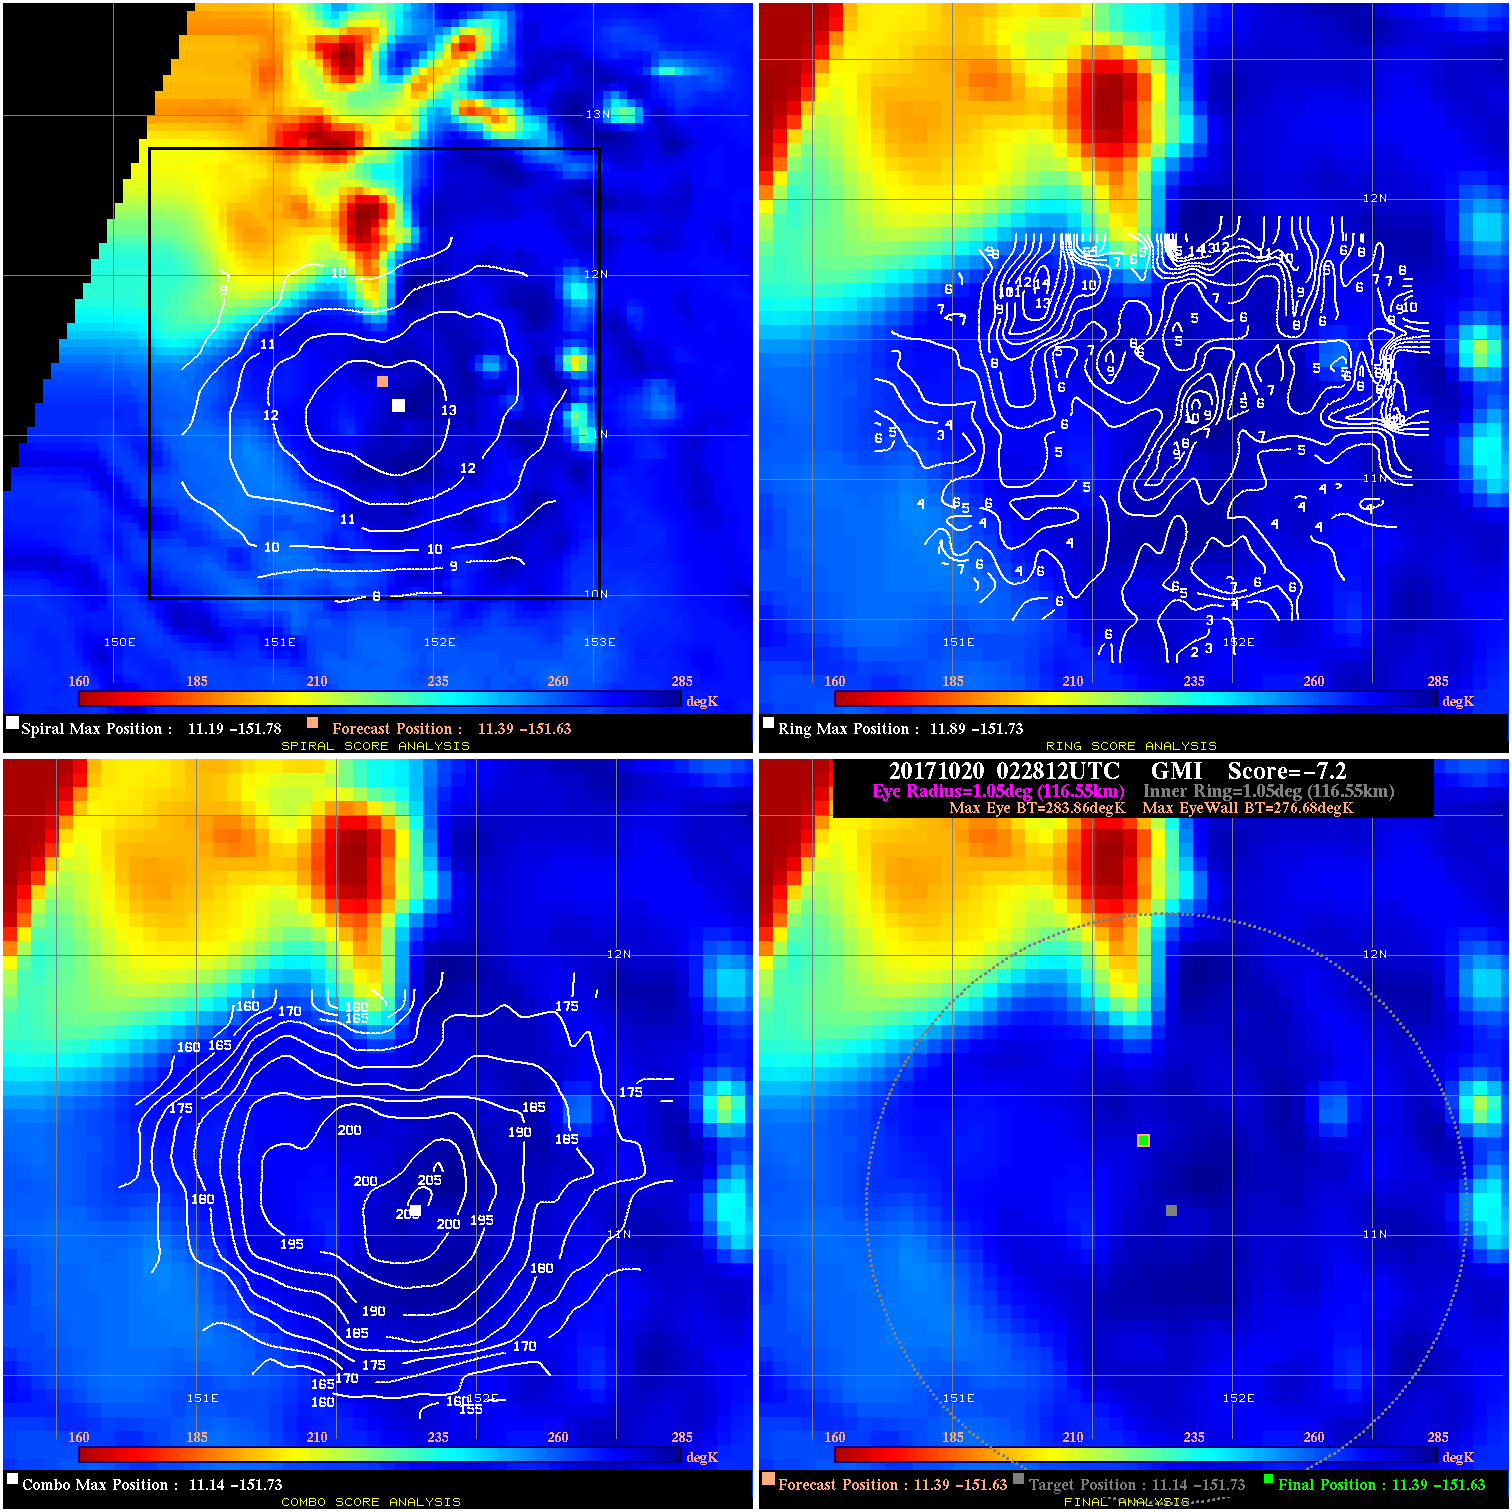
20171020 022812 -7.2 N/A 16.4% 233.31 7.18 35.0 GMI 11.4 -151.6 11.4 -151.6 11.1 -151.7 Analysis Plot
20171020 031021 -6.8 N/A 26.0% 222.20 6.82 35.0 AMSR2 11.4 -151.6 11.4 -151.6 11.4 -151.6 Analysis Plot
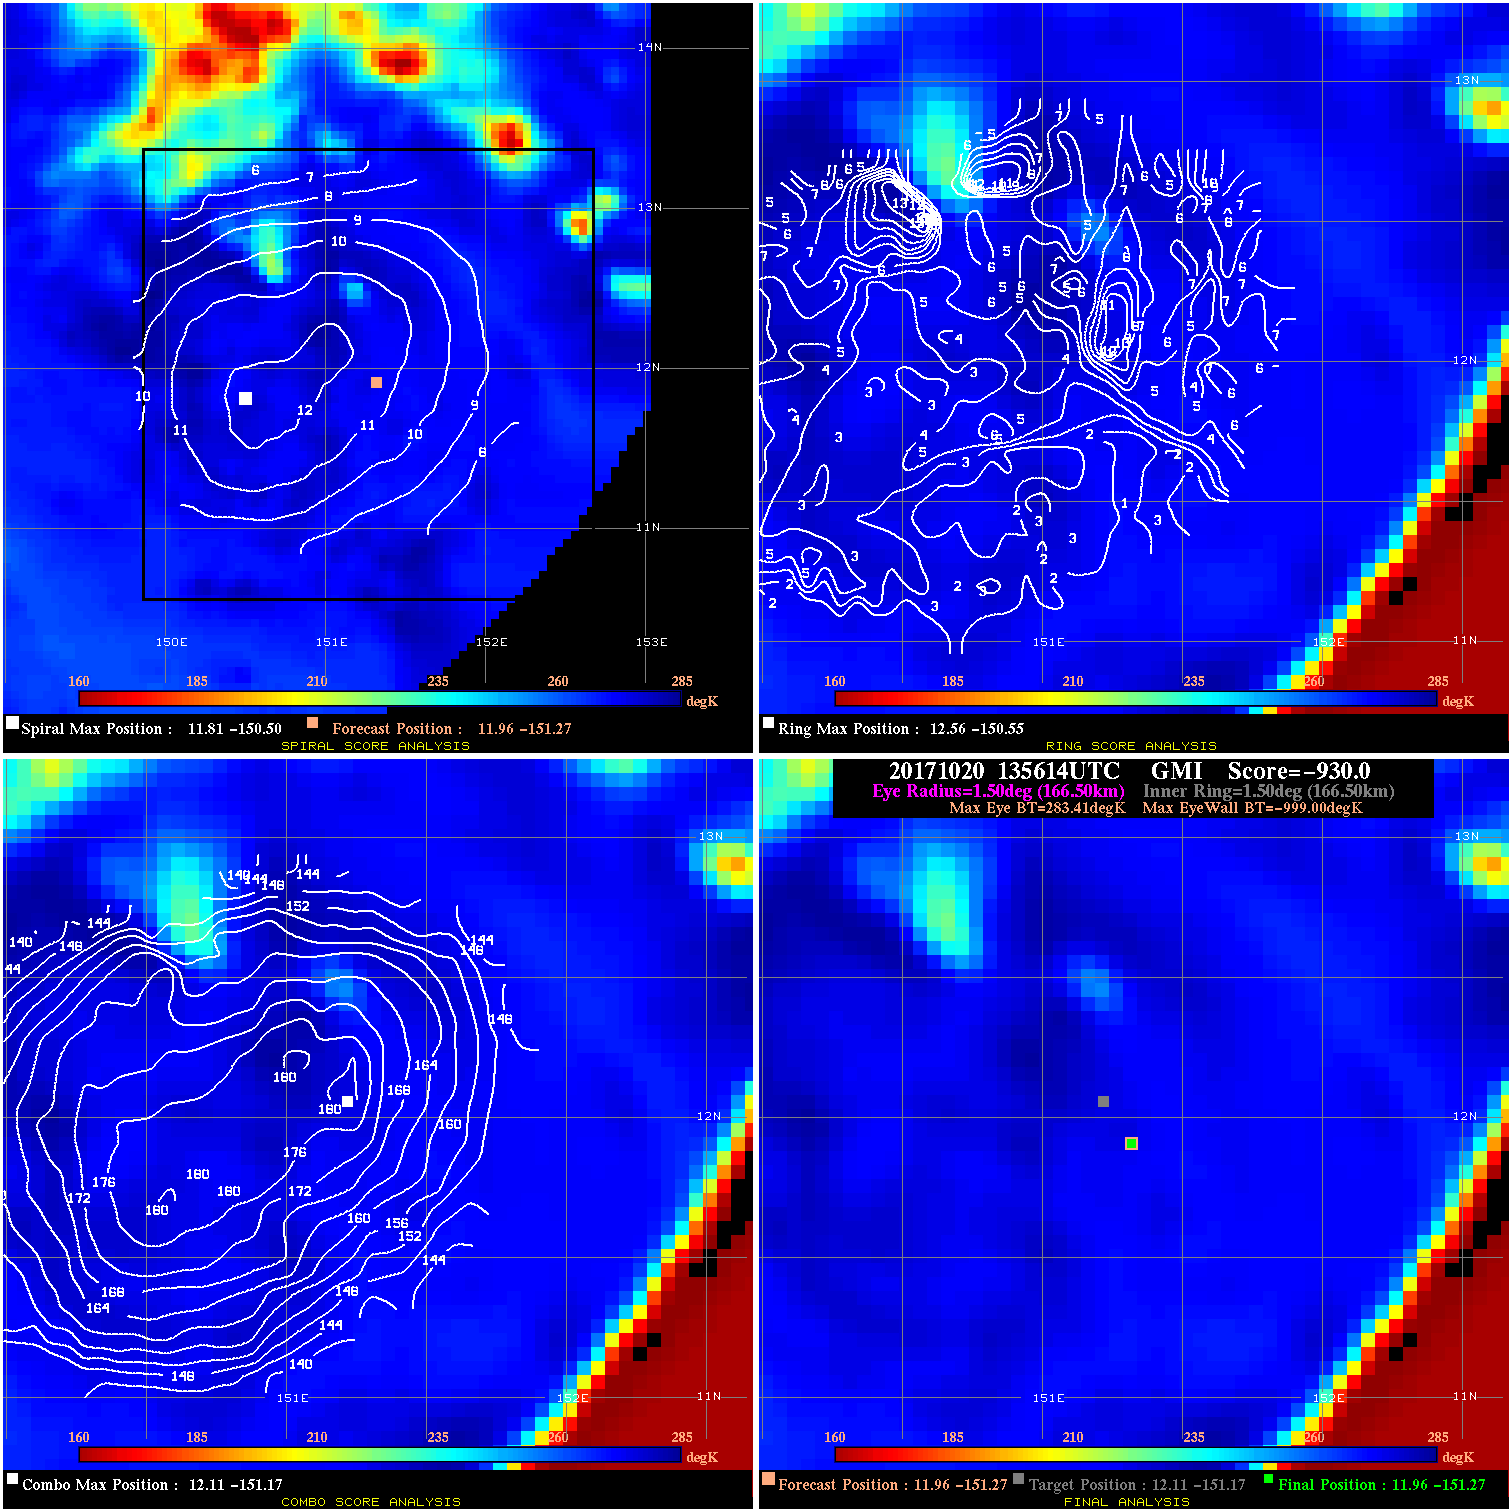
20171020 135614 -930.0 N/A N/A N/A 0.00 30.0 GMI 12.0 -151.3 12.0 -151.3 12.1 -151.2 Analysis Plot
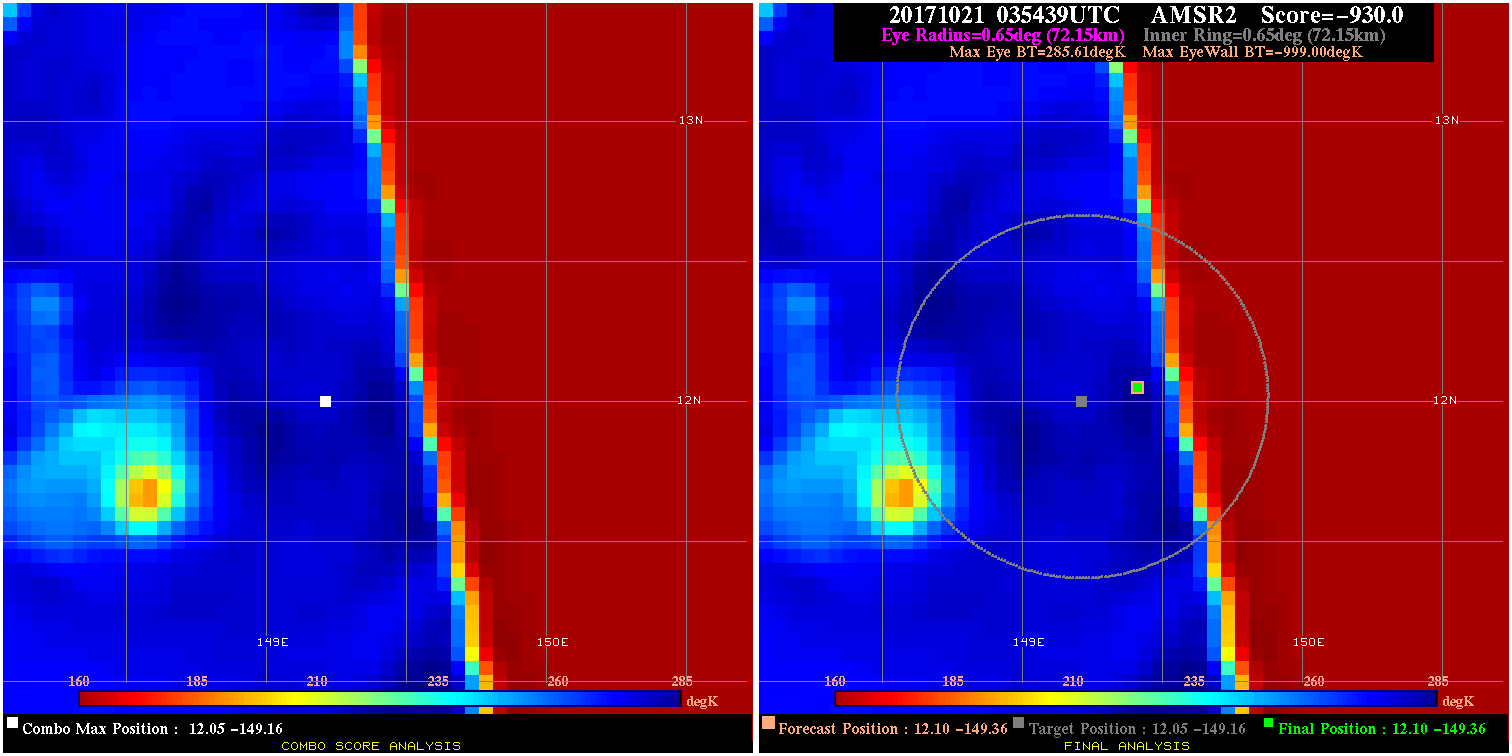
20171021 035439 -930.0 N/A N/A N/A 0.00 30.0 AMSR2 12.1 -149.4 12.1 -149.4 12.1 -149.2 Analysis Plot
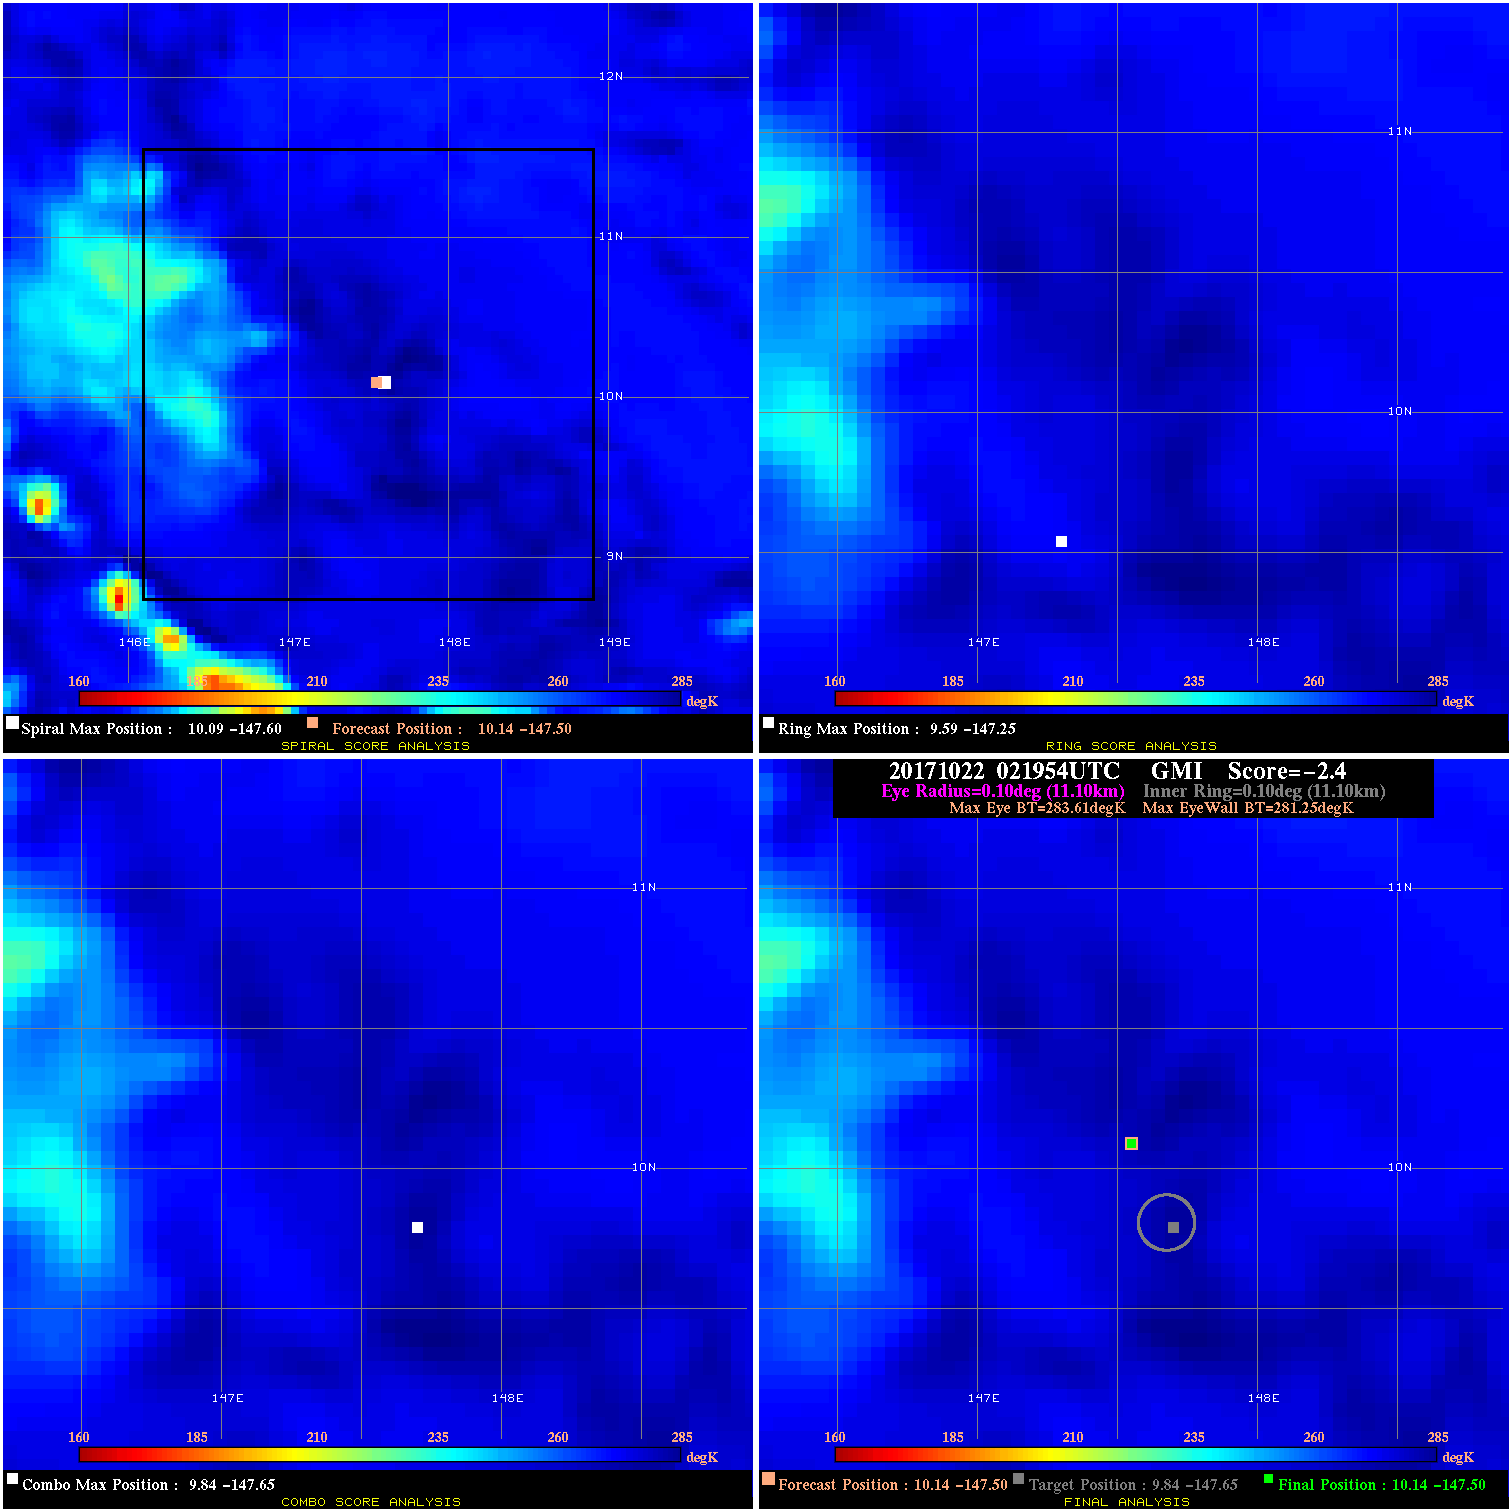
20171022 021954 -2.4 N/A N/A 22.22 2.36 30.0 GMI 10.1 -147.5 10.1 -147.5 9.8 -147.6 Analysis Plot
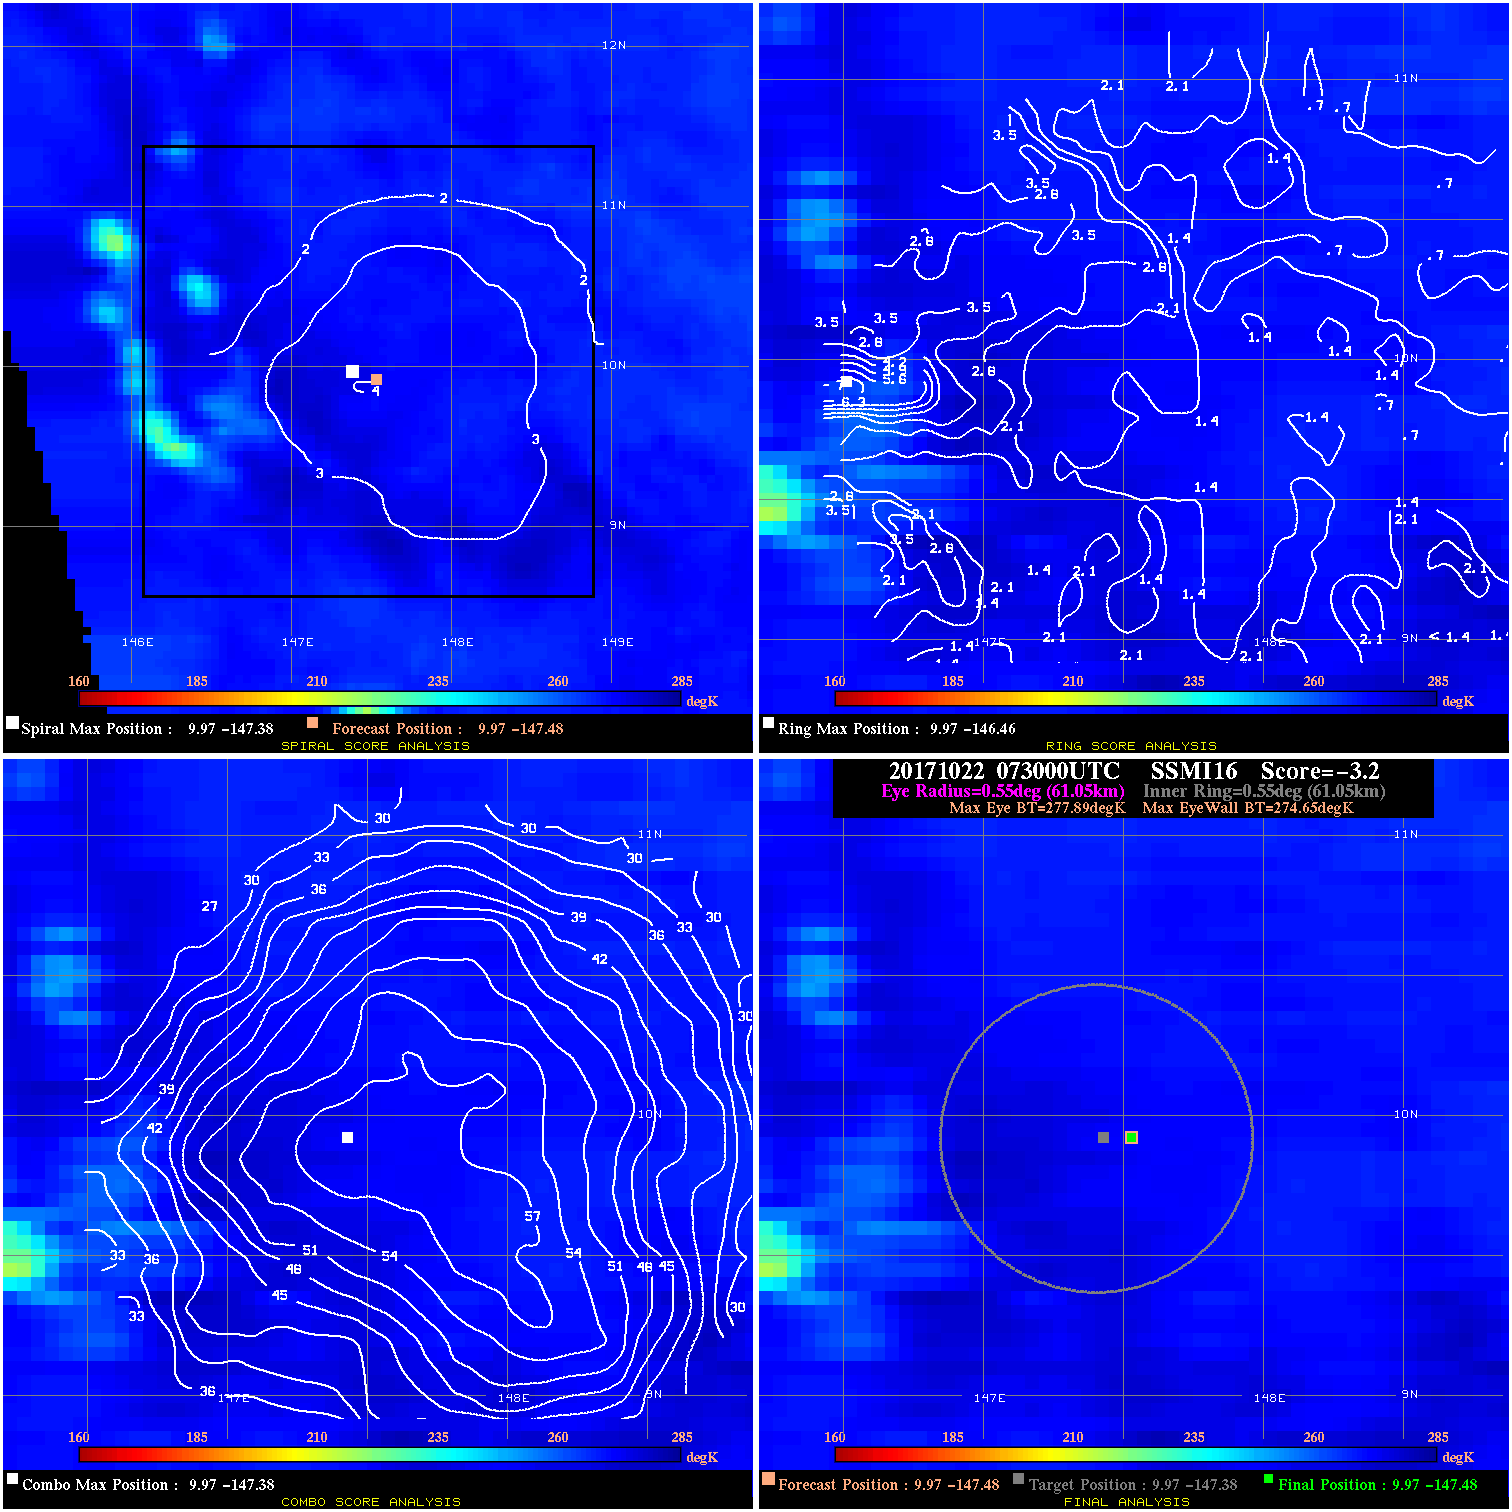
20171022 073000 -3.2 N/A N/A 122.21 3.24 30.0 SSMI16 10.0 -147.5 10.0 -147.5 10.0 -147.4 Analysis Plot
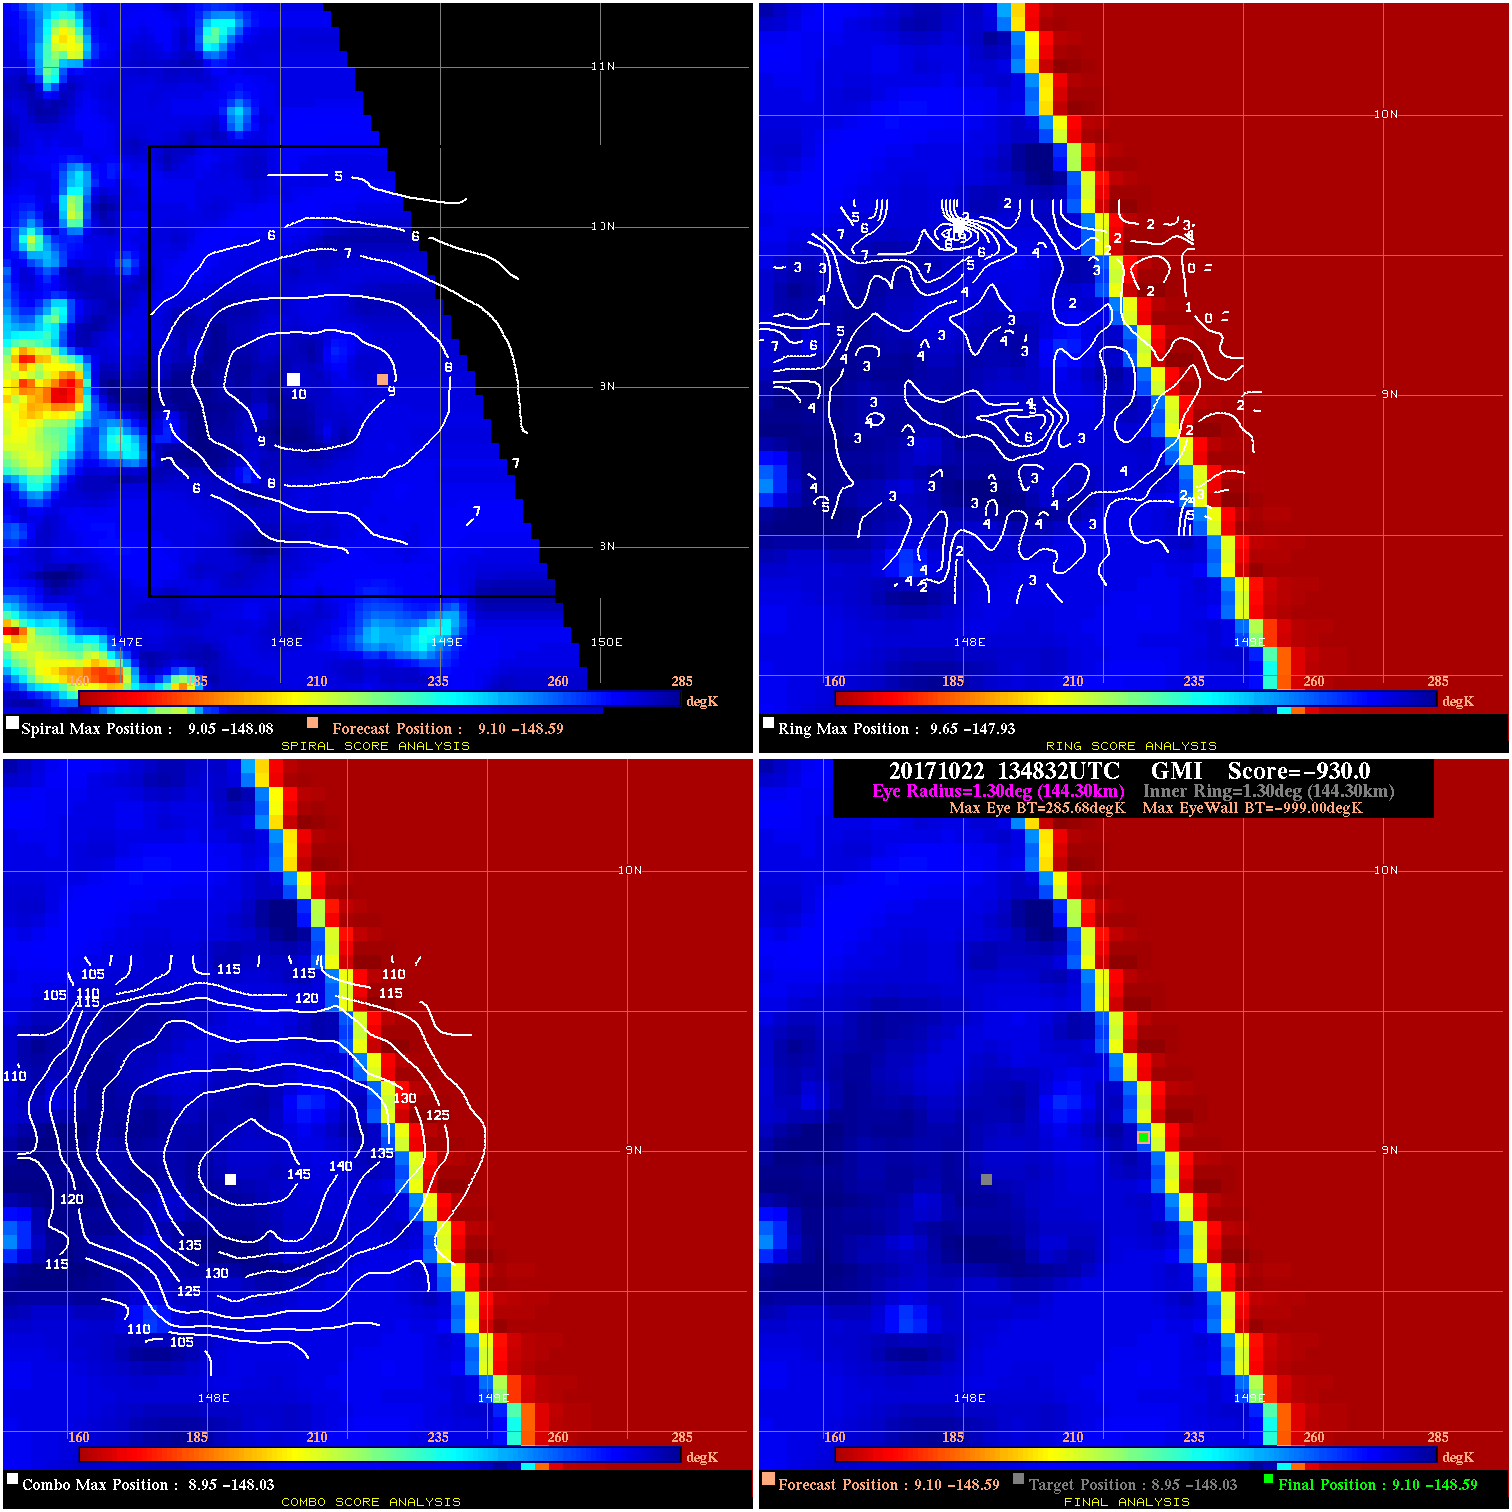
20171022 134832 -930.0 N/A N/A N/A 0.00 30.0 GMI 9.1 -148.6 9.1 -148.6 8.9 -148.0 Analysis Plot
20171023 034031 -930.0 N/A N/A N/A 0.00 30.0 AMSR2 9.5 -146.9 9.5 -146.9 9.4 -147.6 Analysis Plot
20171023 155642 -930.0 N/A N/A N/A 0.00 40.0 AMSR2 10.0 -145.0 10.0 -145.0 10.1 -144.0 Analysis Plot
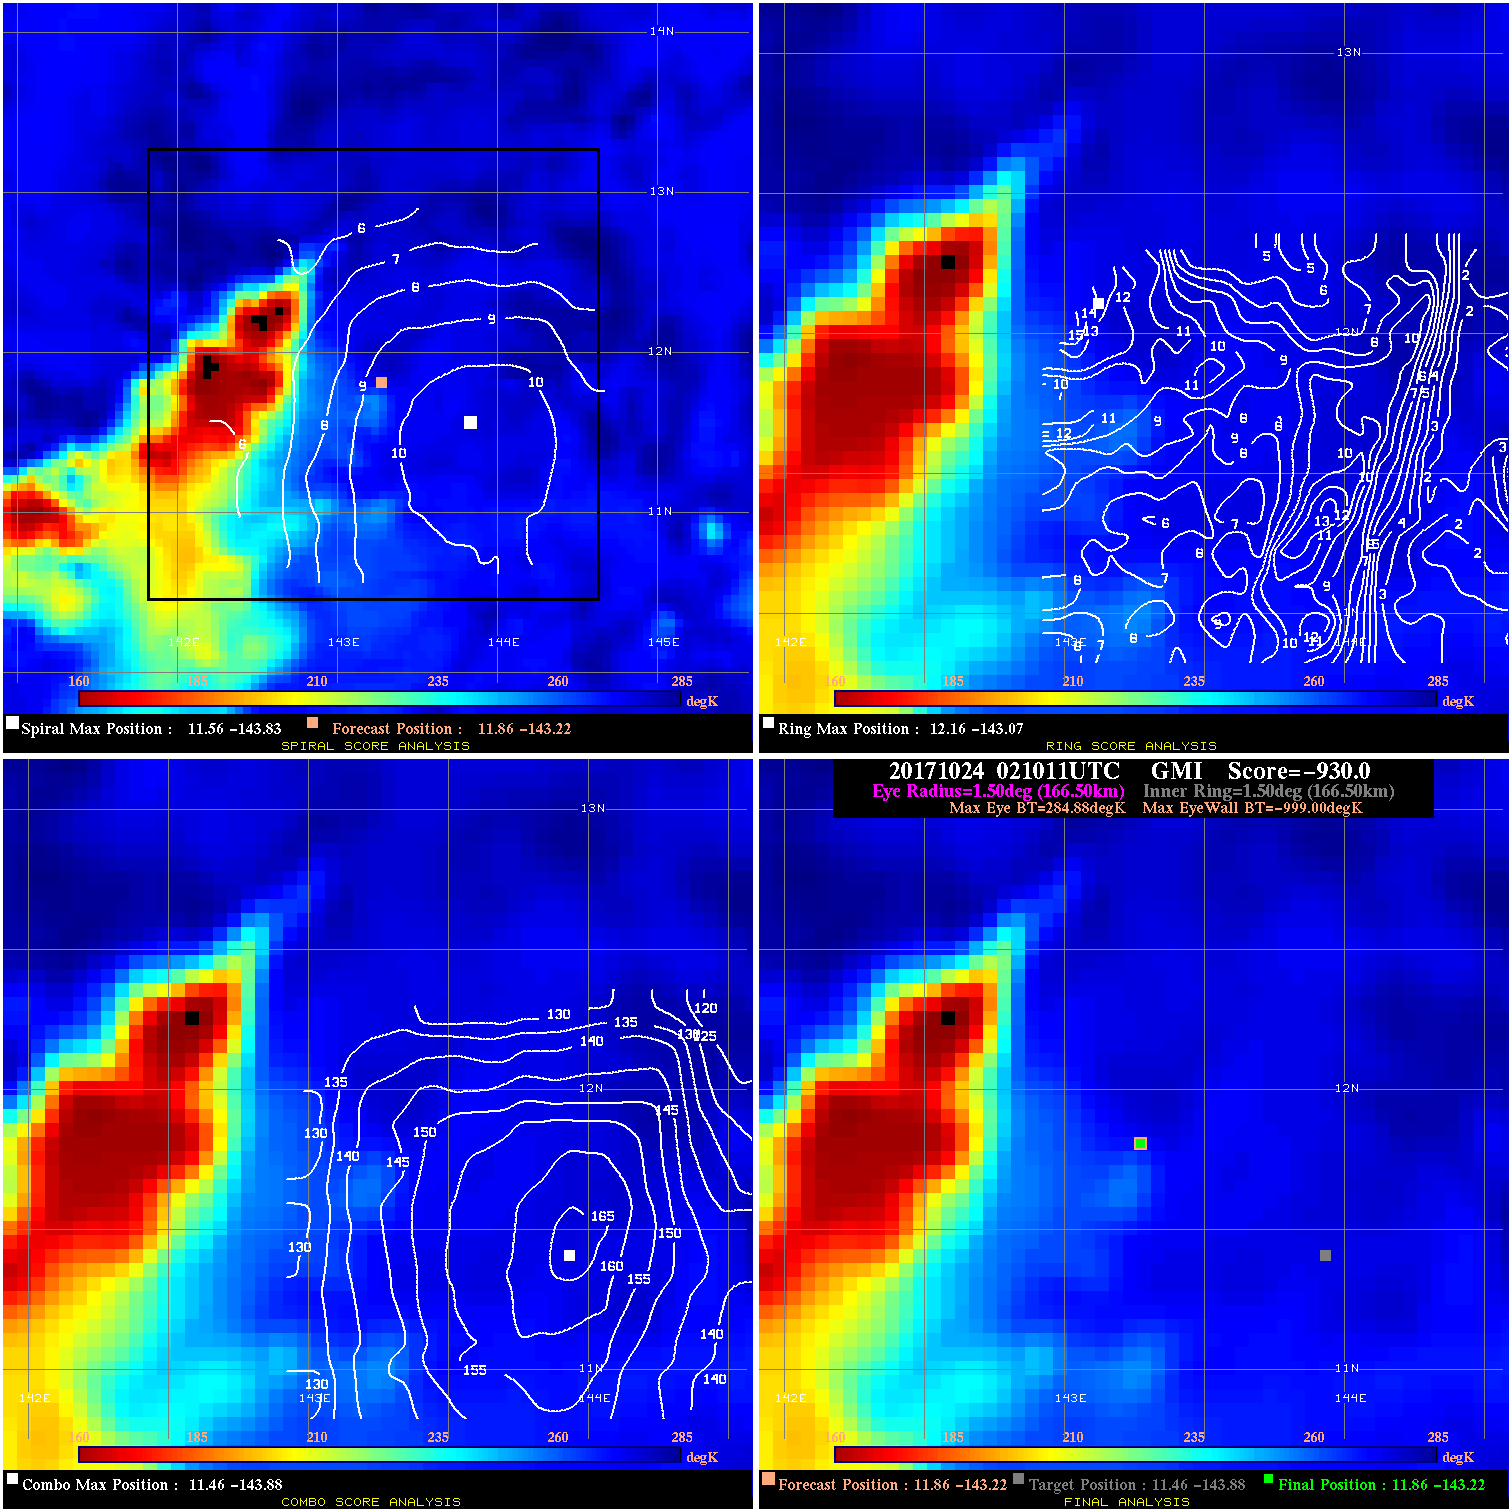
20171024 021011 -930.0 N/A N/A N/A 0.00 40.0 GMI 11.9 -143.2 11.9 -143.2 11.5 -143.9 Analysis Plot
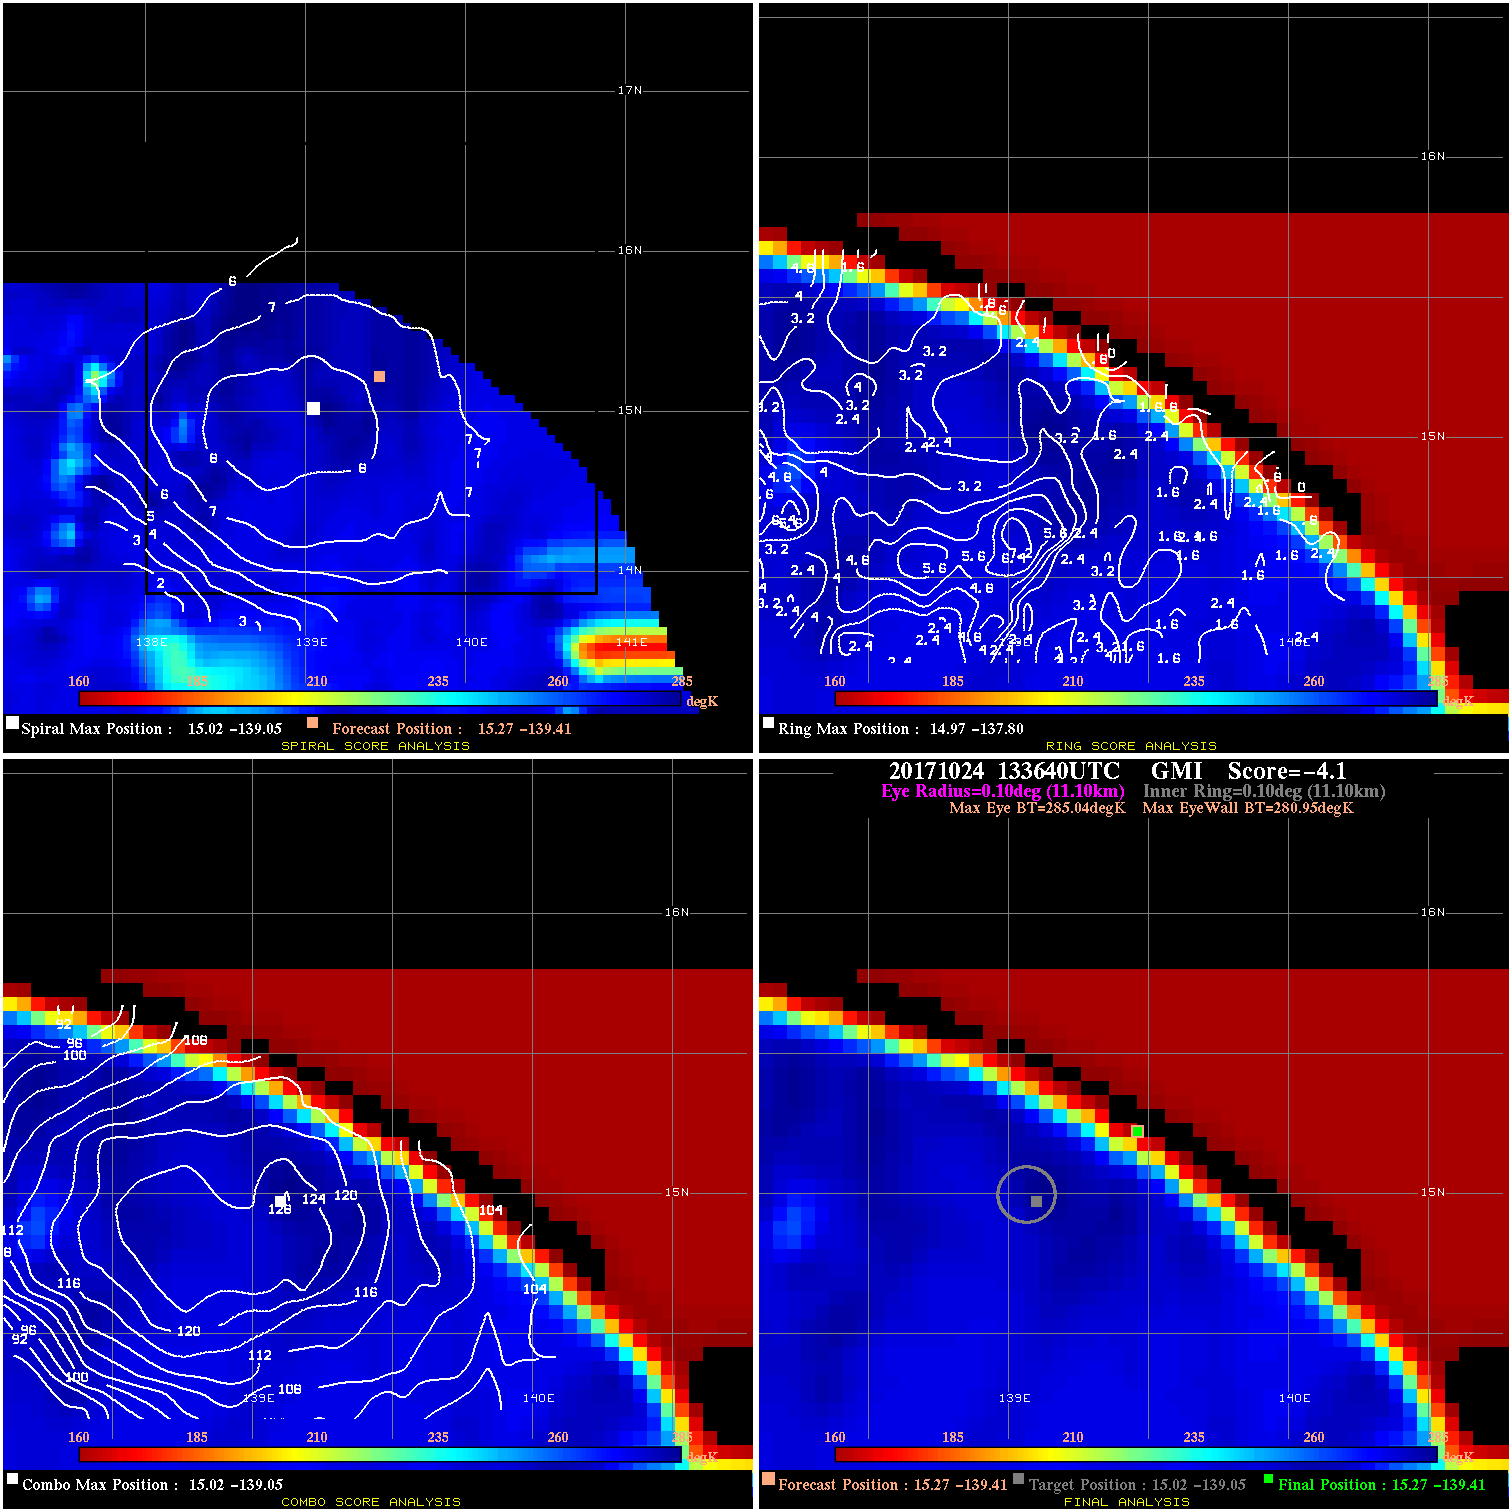
20171024 133640 -4.1 N/A N/A 22.22 4.09 40.0 GMI 15.3 -139.4 15.3 -139.4 15.0 -139.1 Analysis Plot
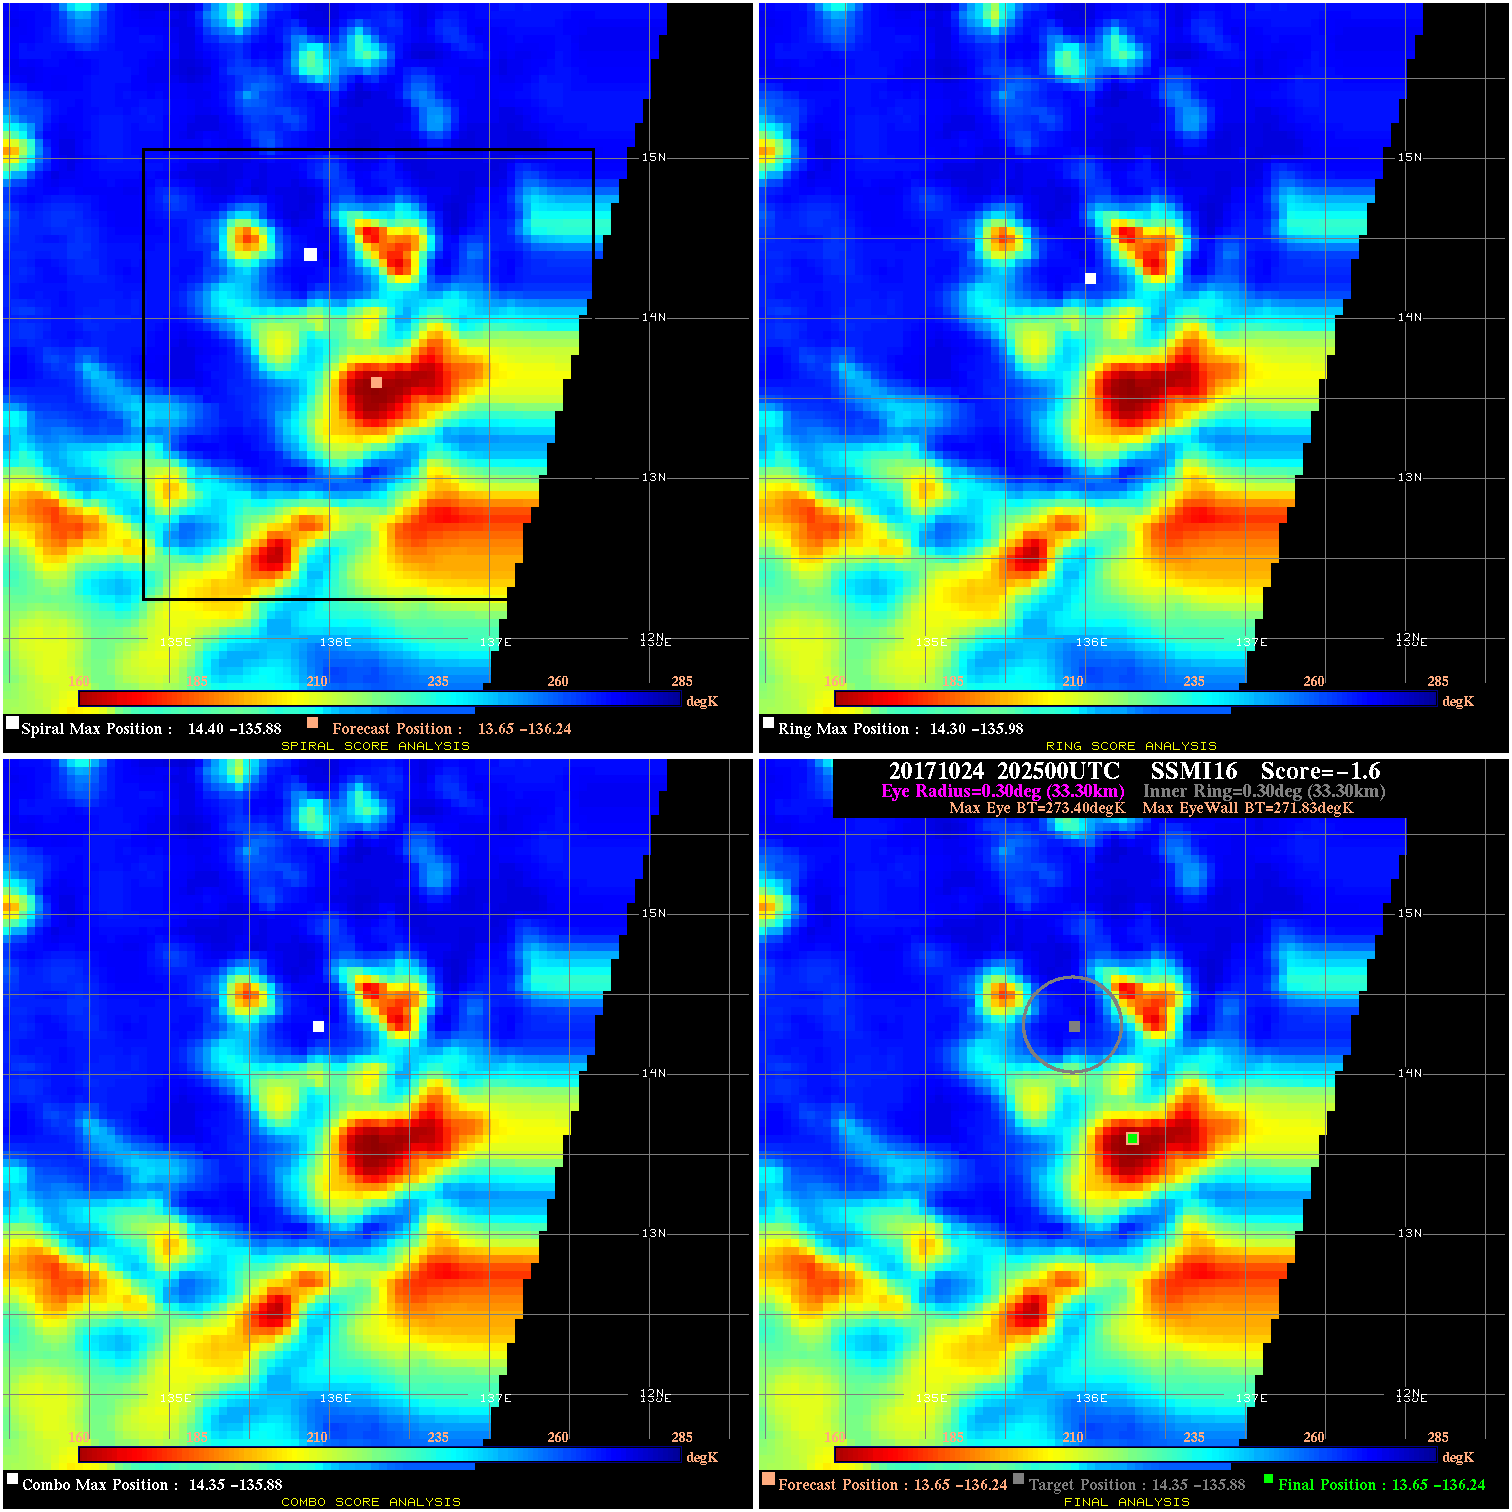
20171024 202500 -1.6 N/A 45.2% 66.66 1.57 35.0 SSMI16 13.6 -136.2 13.6 -136.2 14.4 -135.9 Analysis Plot
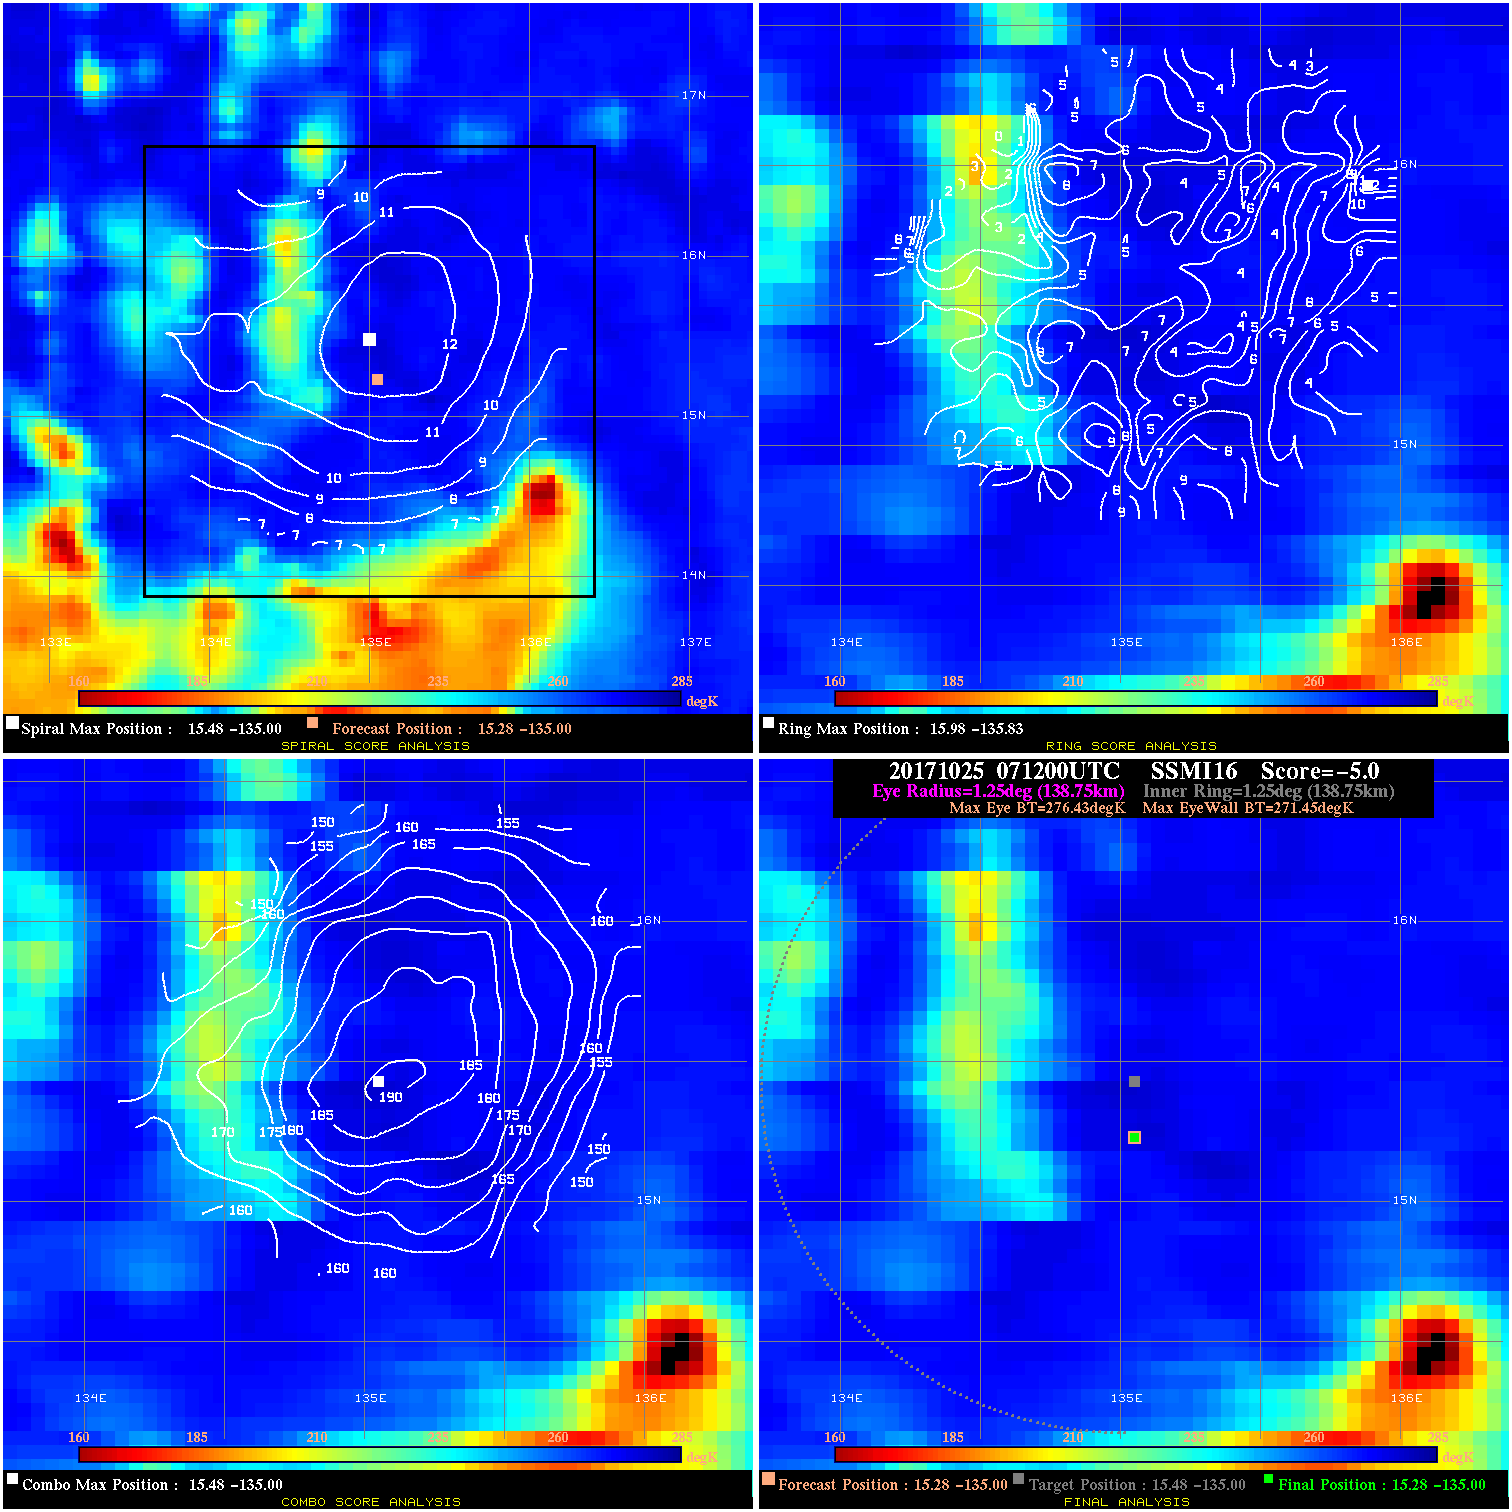
20171025 071200 -5.0 N/A 19.2% 277.75 4.98 40.0 SSMI16 15.3 -135.0 15.3 -135.0 15.5 -135.0 Analysis Plot
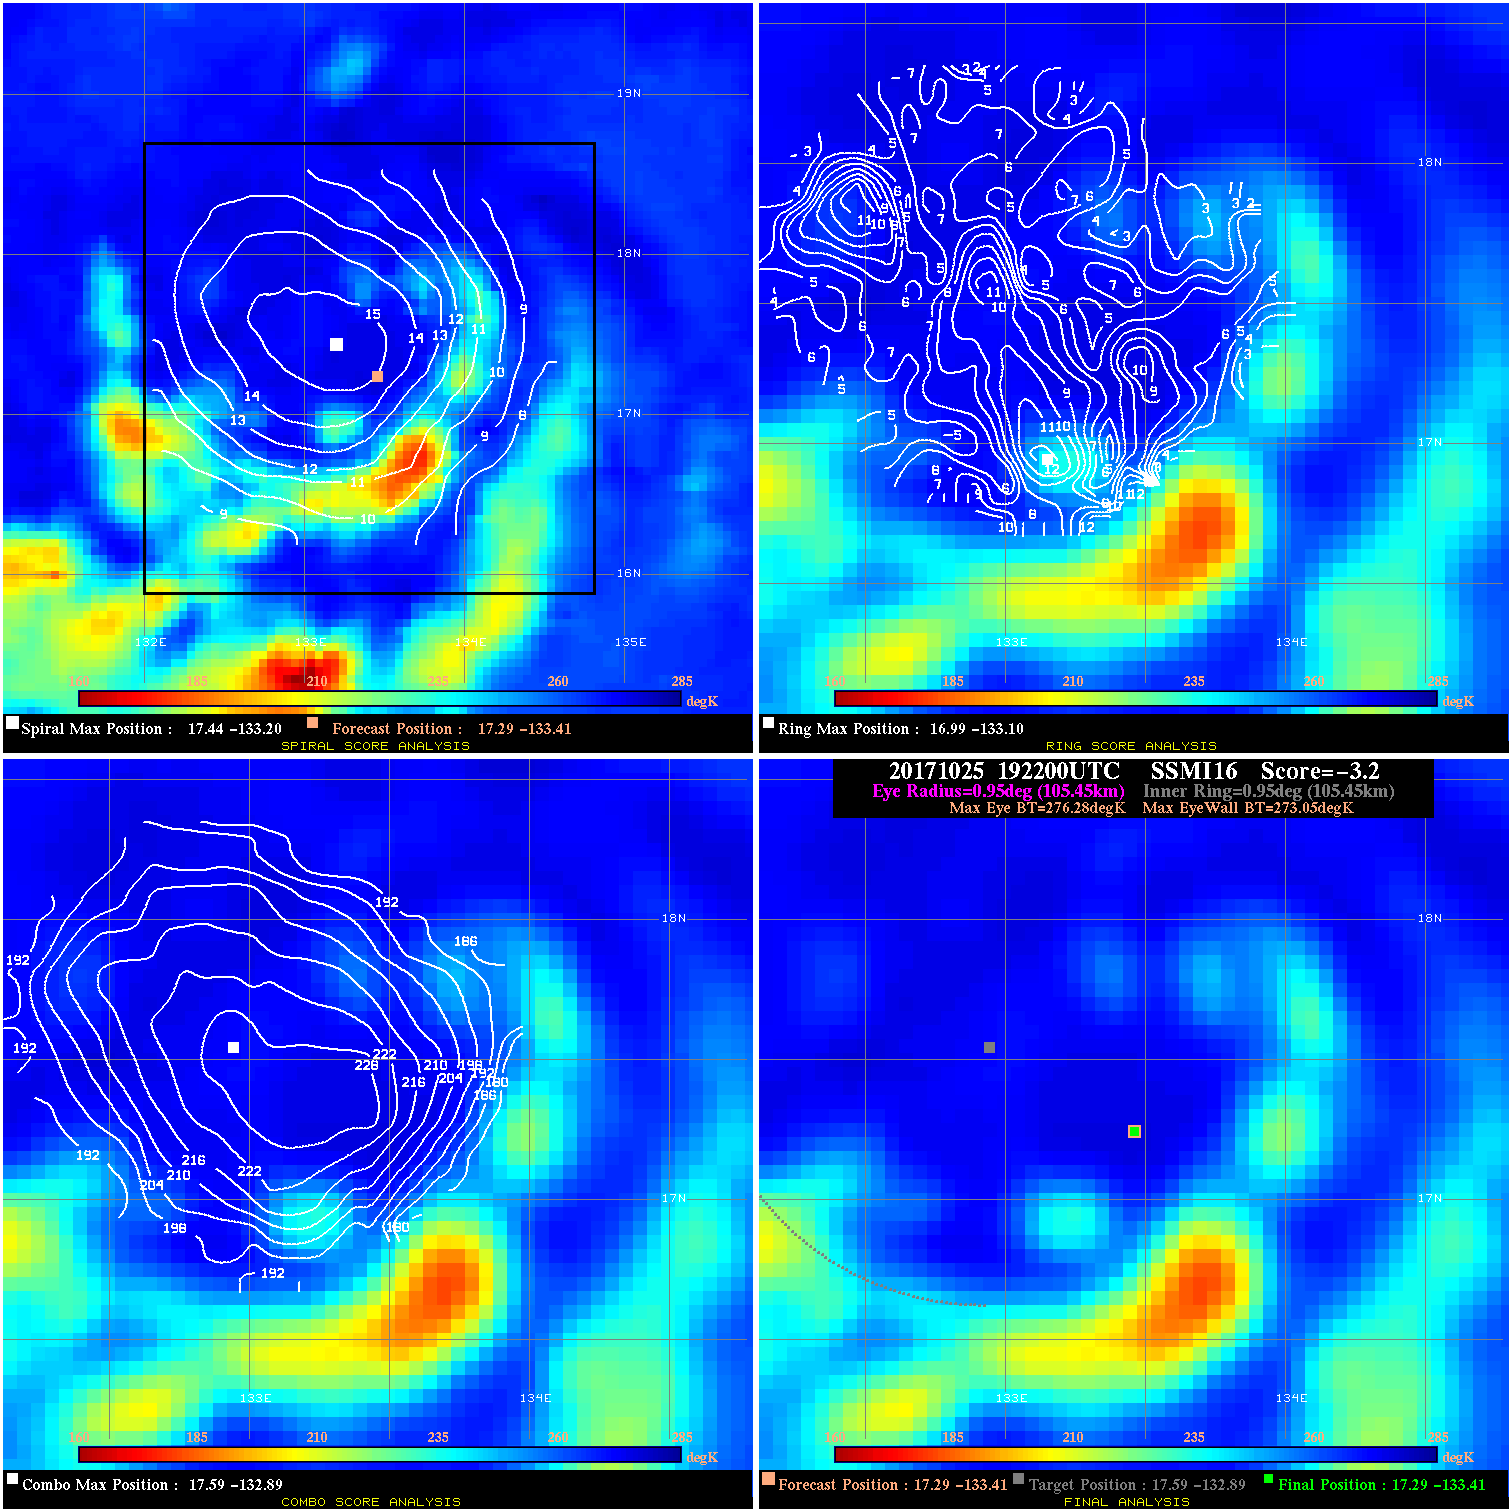
20171025 192200 -3.2 N/A 30.1% 211.09 3.23 50.0 SSMI16 17.3 -133.4 17.3 -133.4 17.6 -132.9 Analysis Plot
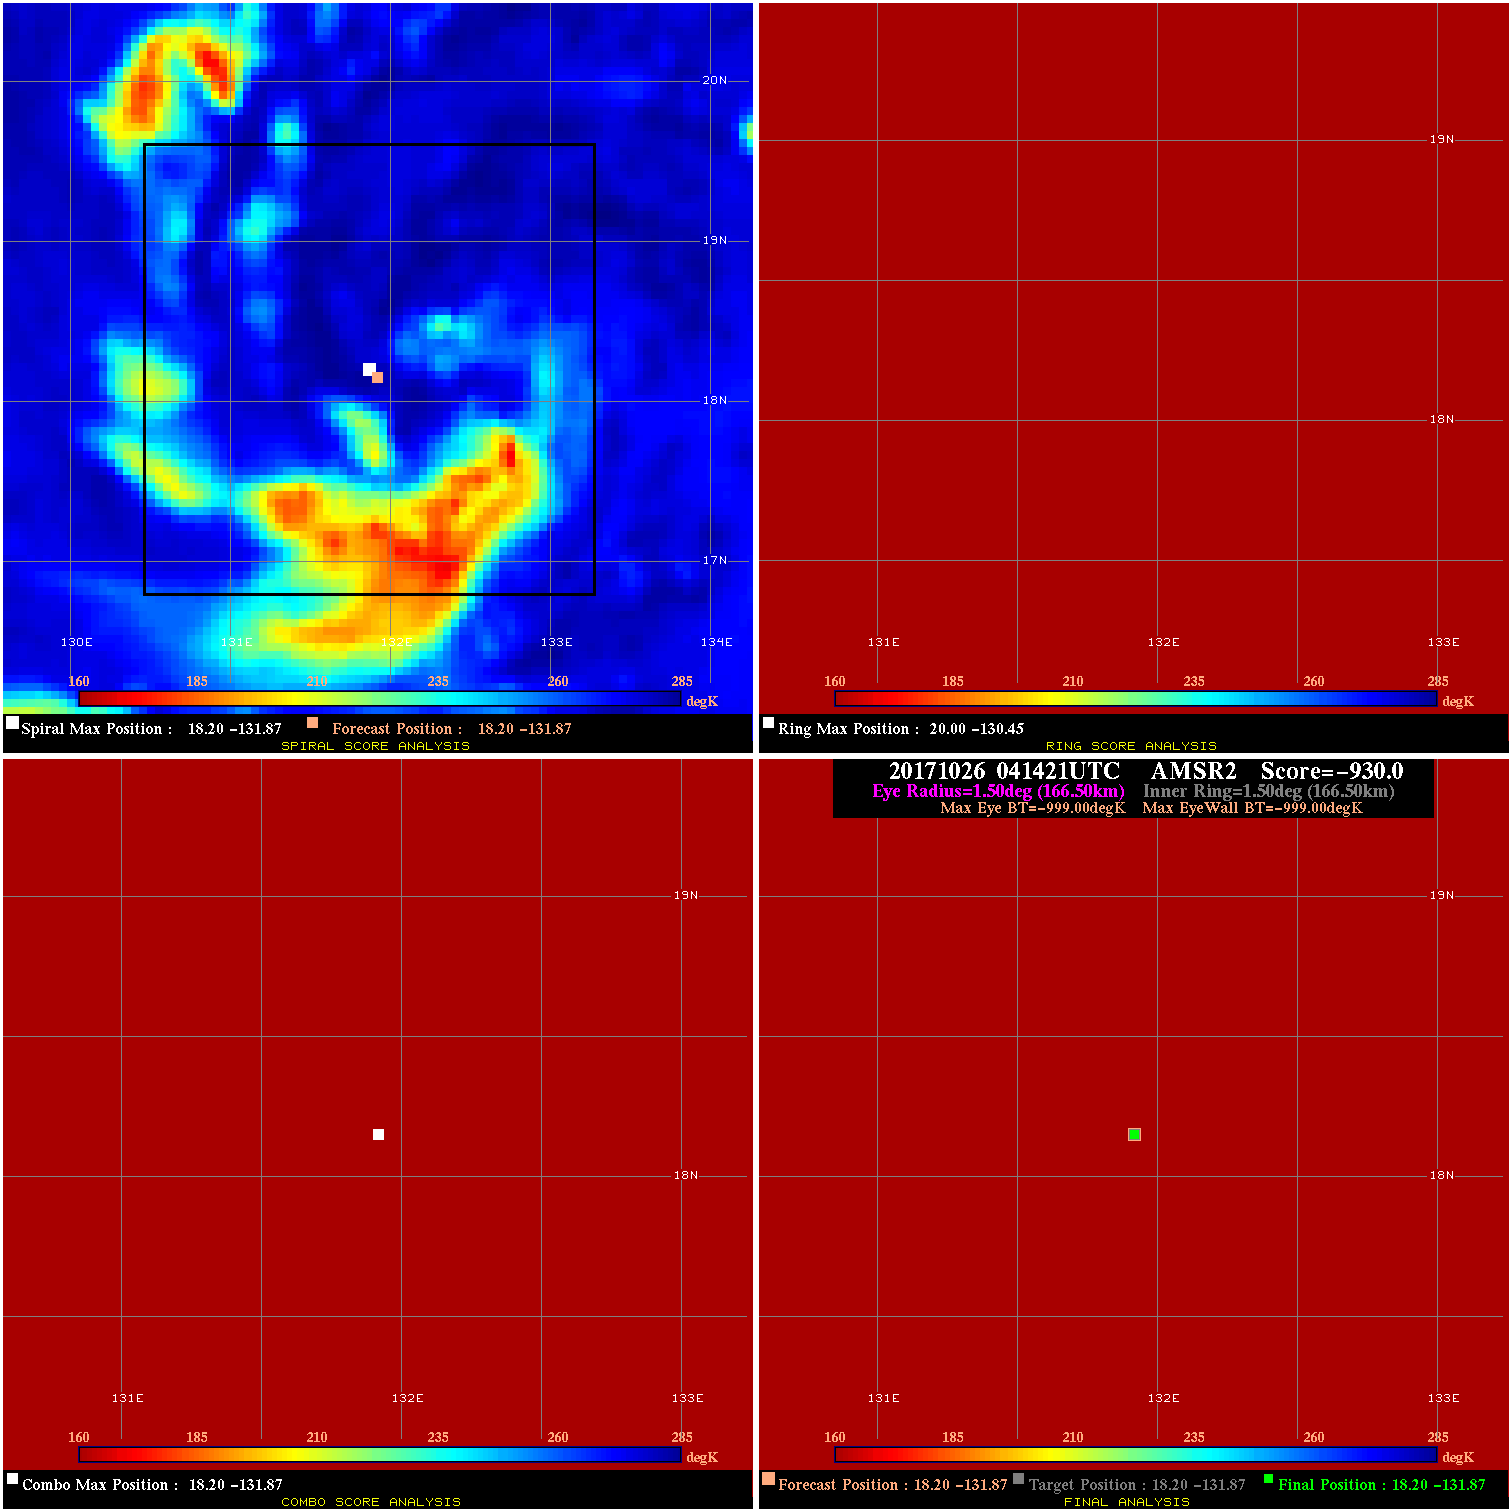
20171026 041421 -0.0 N/A N/A N/A 0.00 45.0 AMSR2 18.2 -131.9 18.2 -131.9 18.2 -131.9 Analysis Plot
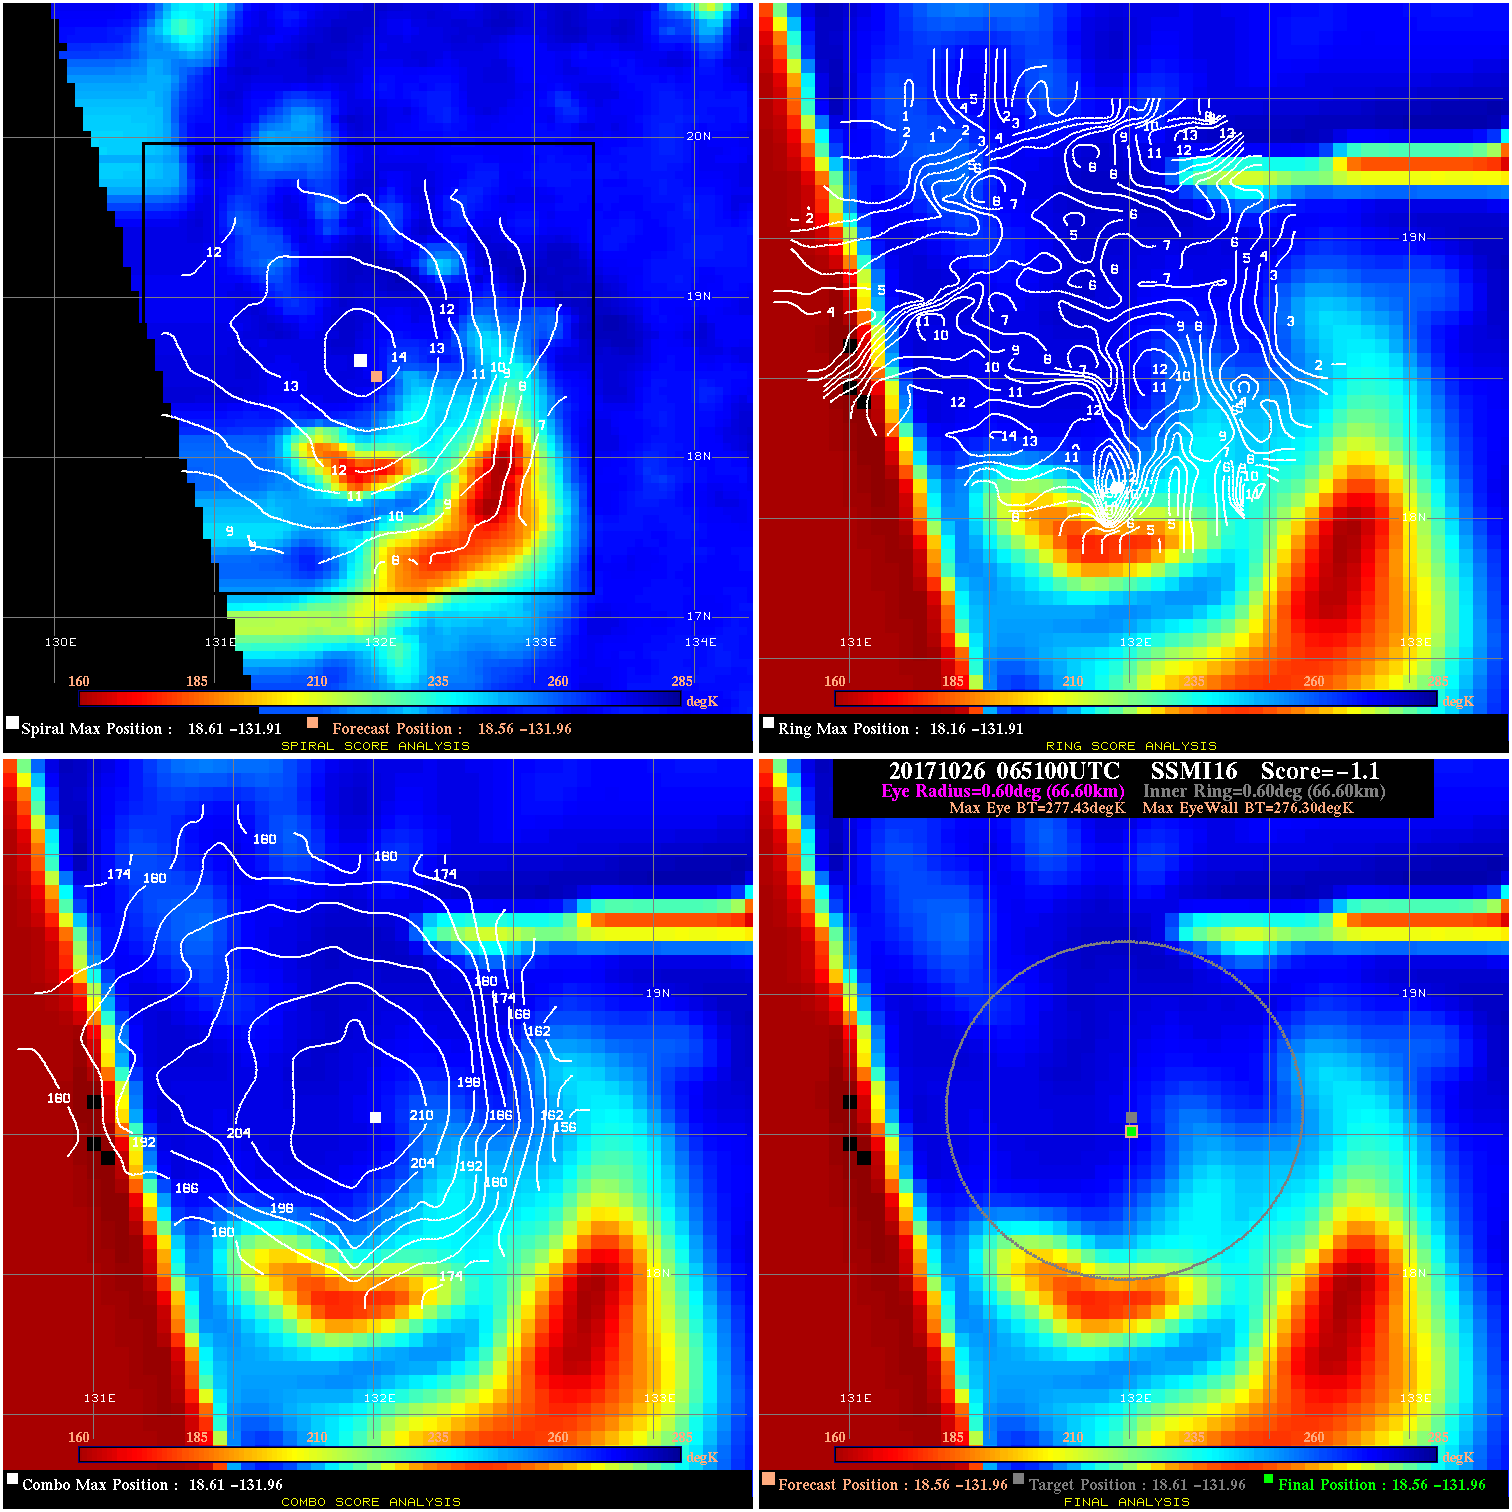
20171026 065100 -1.1 N/A 29.6% 133.32 1.13 45.0 SSMI16 18.6 -132.0 18.6 -132.0 18.6 -132.0 Analysis Plot
20171026 132512 -930.0 N/A N/A N/A 0.00 45.0 GMI 19.4 -131.2 19.7 -131.0 19.7 -131.0 Analysis Plot
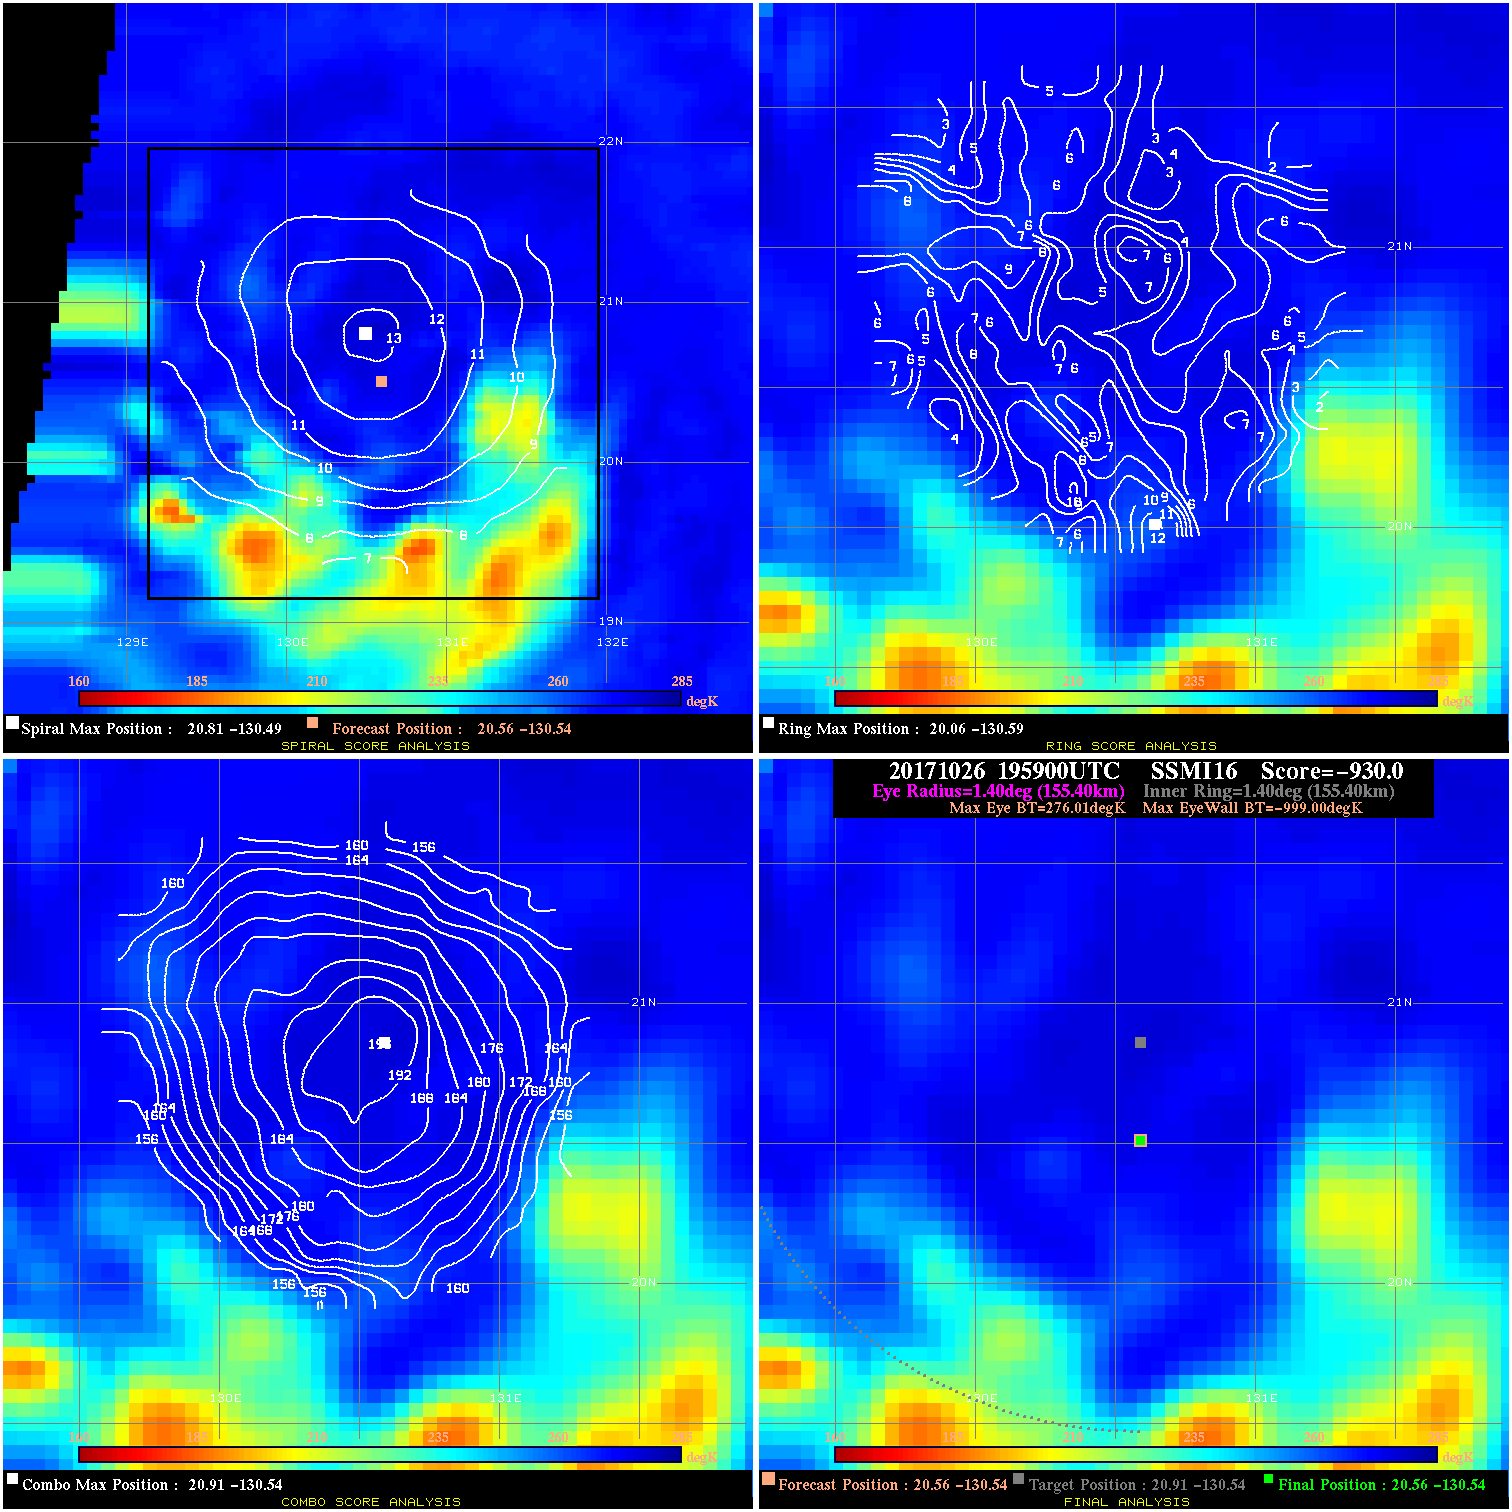
20171026 195900 -930.0 N/A N/A N/A 0.00 45.0 SSMI16 20.6 -130.5 20.6 -130.5 20.9 -130.5 Analysis Plot
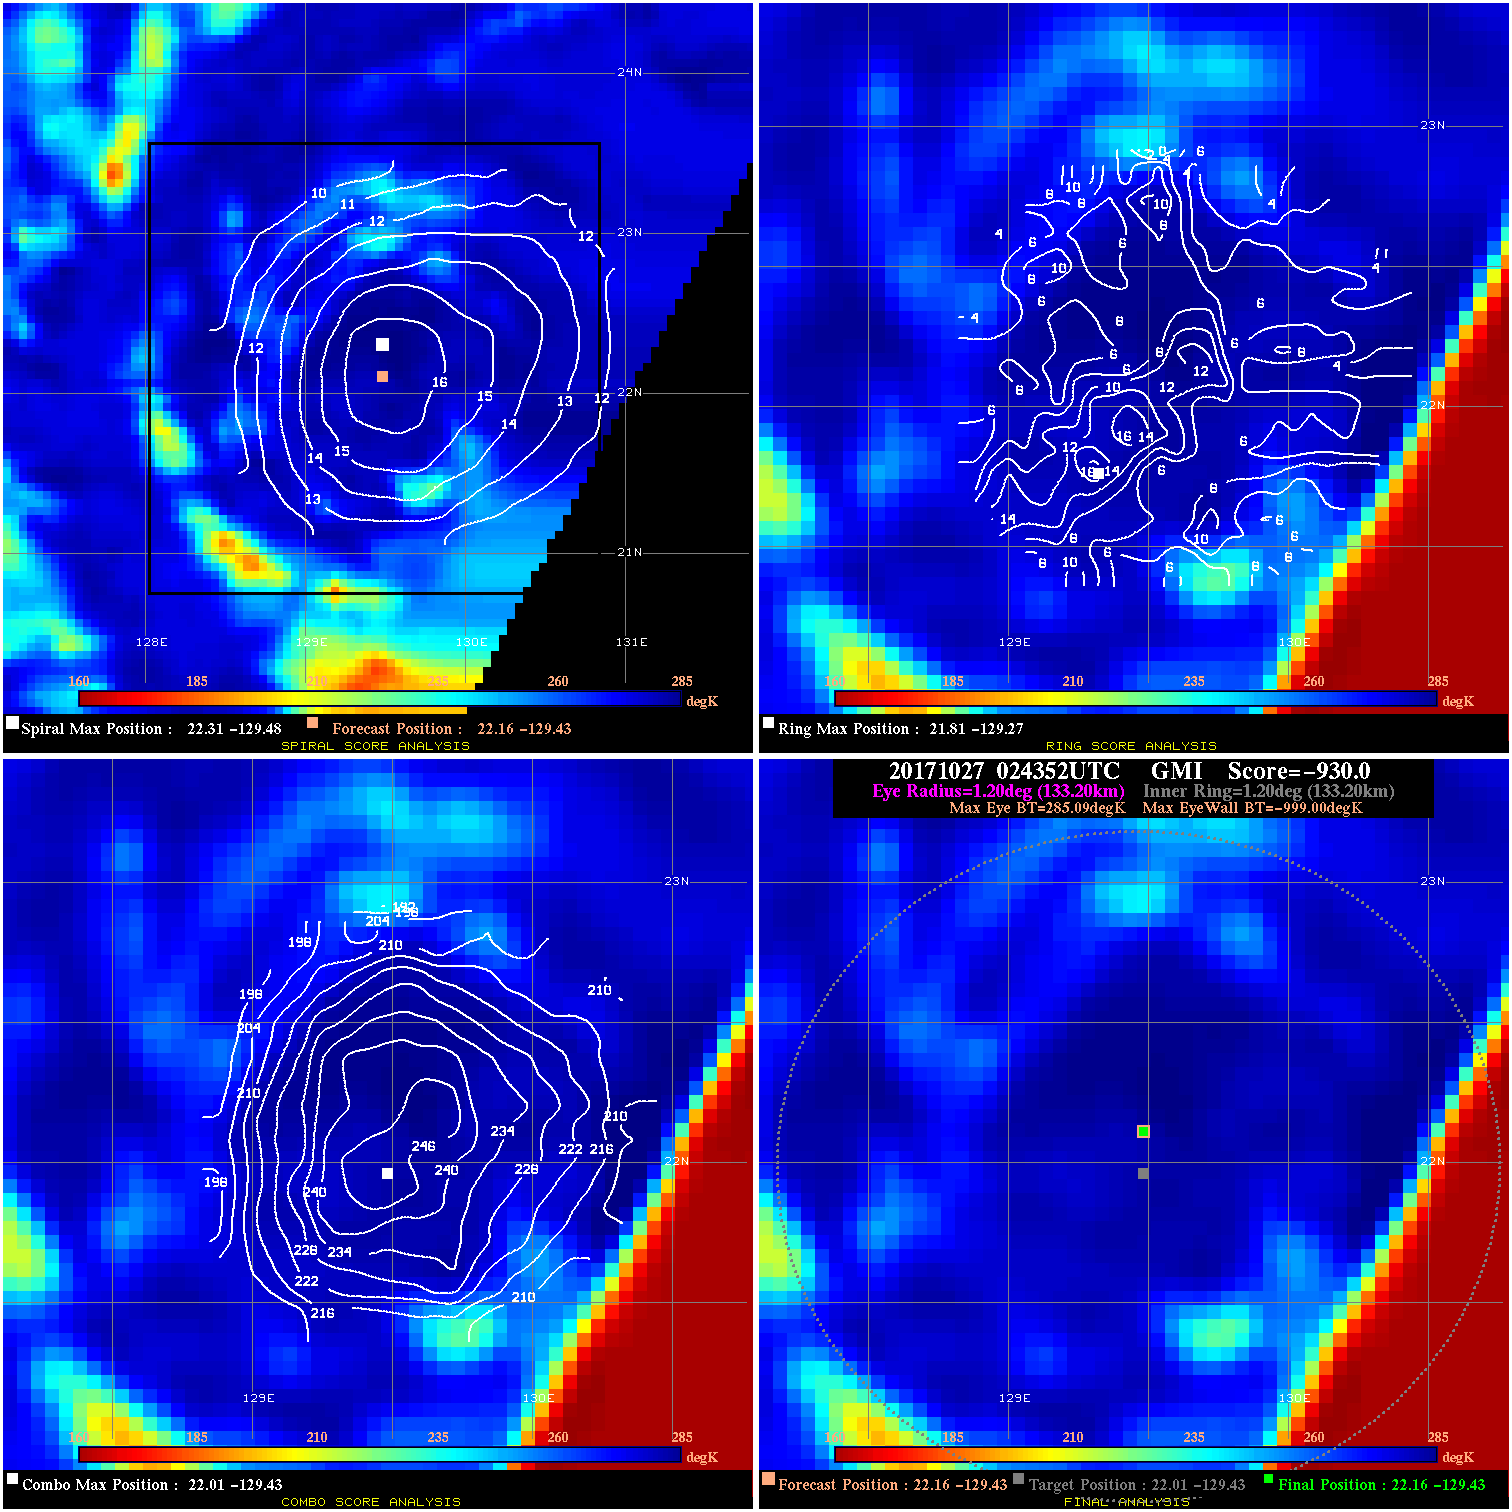
20171027 024352 -930.0 N/A N/A N/A 0.00 50.0 GMI 22.2 -129.4 22.2 -129.4 22.0 -129.4 Analysis Plot
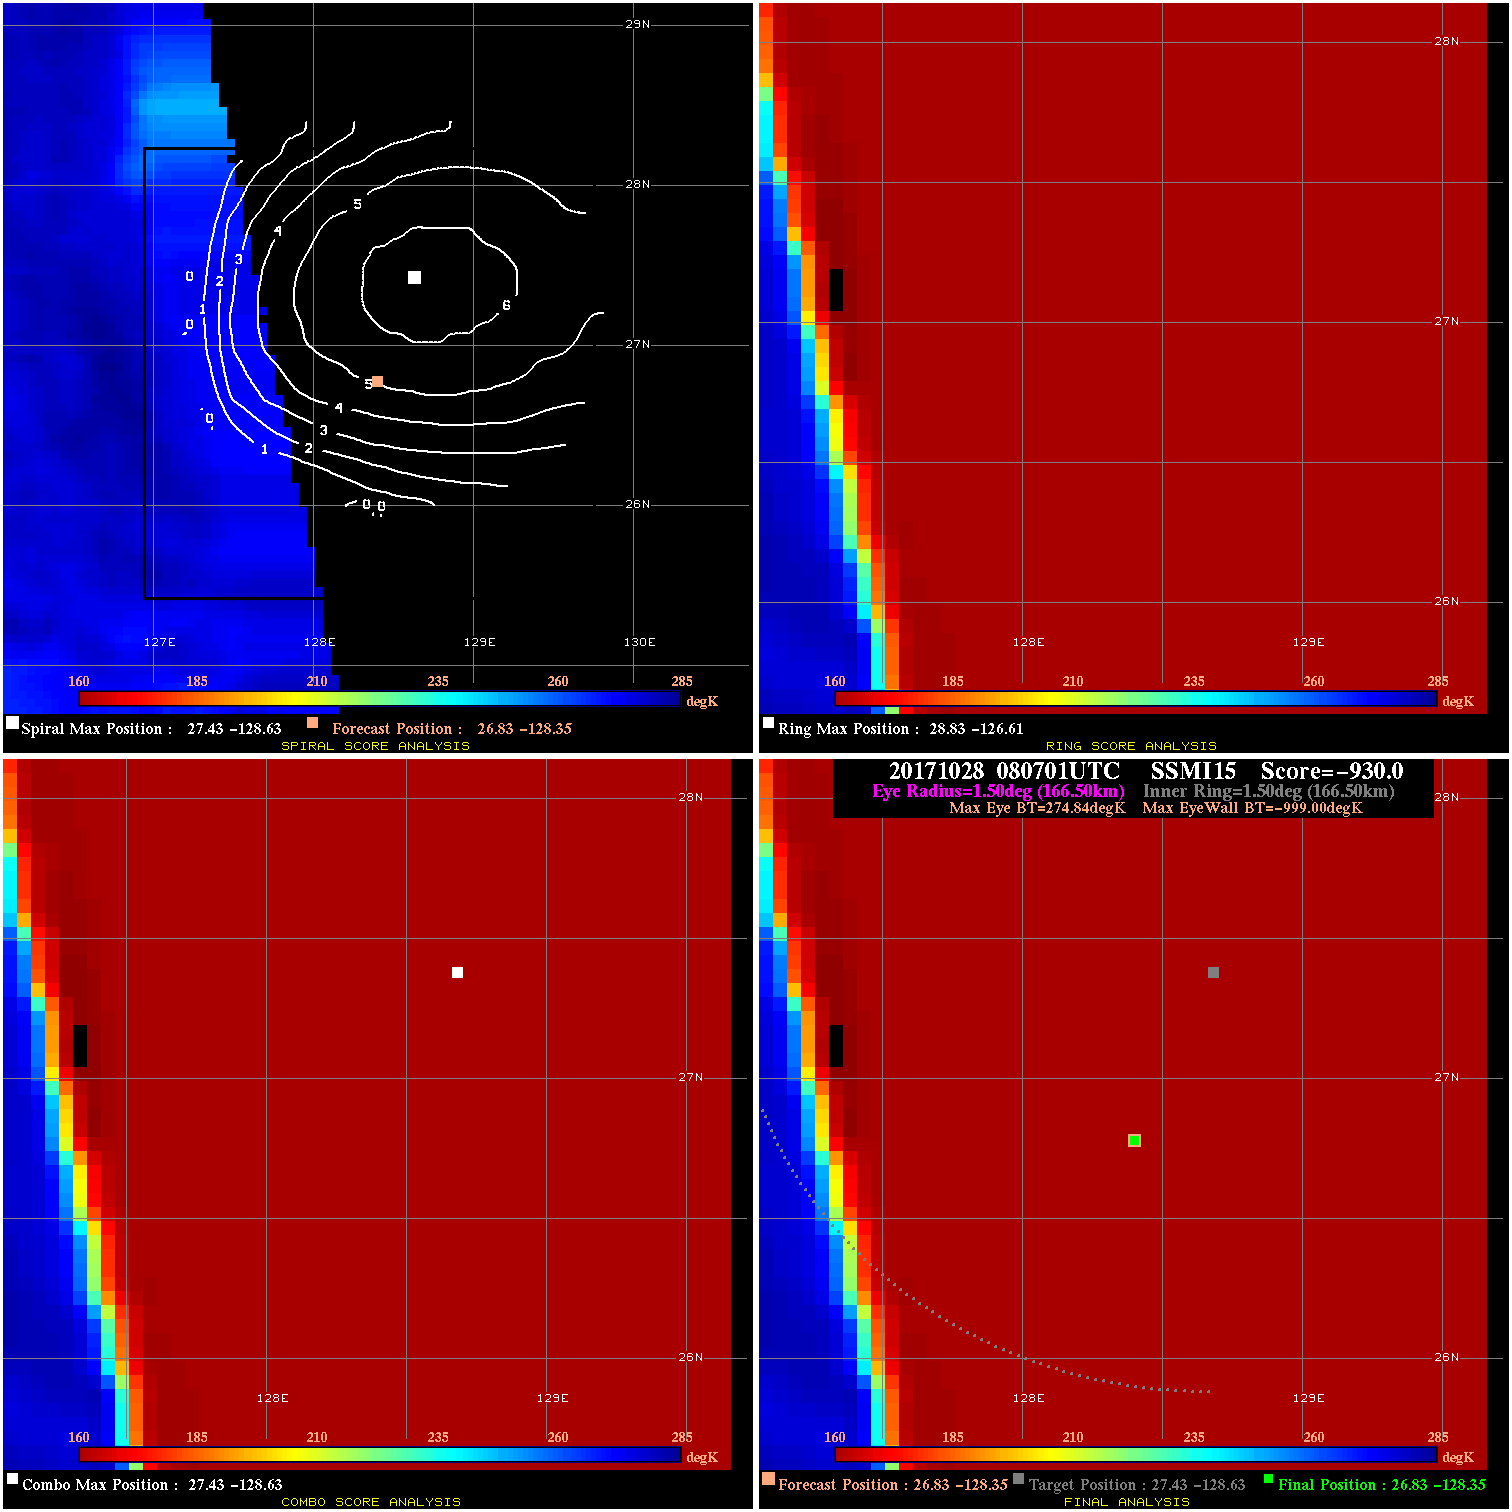
20171028 080701 -930.0 N/A N/A N/A 0.00 65.0 SSMI15 26.8 -128.4 26.8 -128.4 27.4 -128.6 Analysis Plot
20171029 081600 -930.0 N/A N/A N/A 0.00 60.0 SSMI18 33.3 -136.9 33.3 -136.9 33.4 -138.0 Analysis Plot
20171029 104444 -930.0 N/A N/A N/A 0.00 60.0 GMI 34.7 -139.3 34.7 -139.3 34.7 -139.3 Analysis Plot
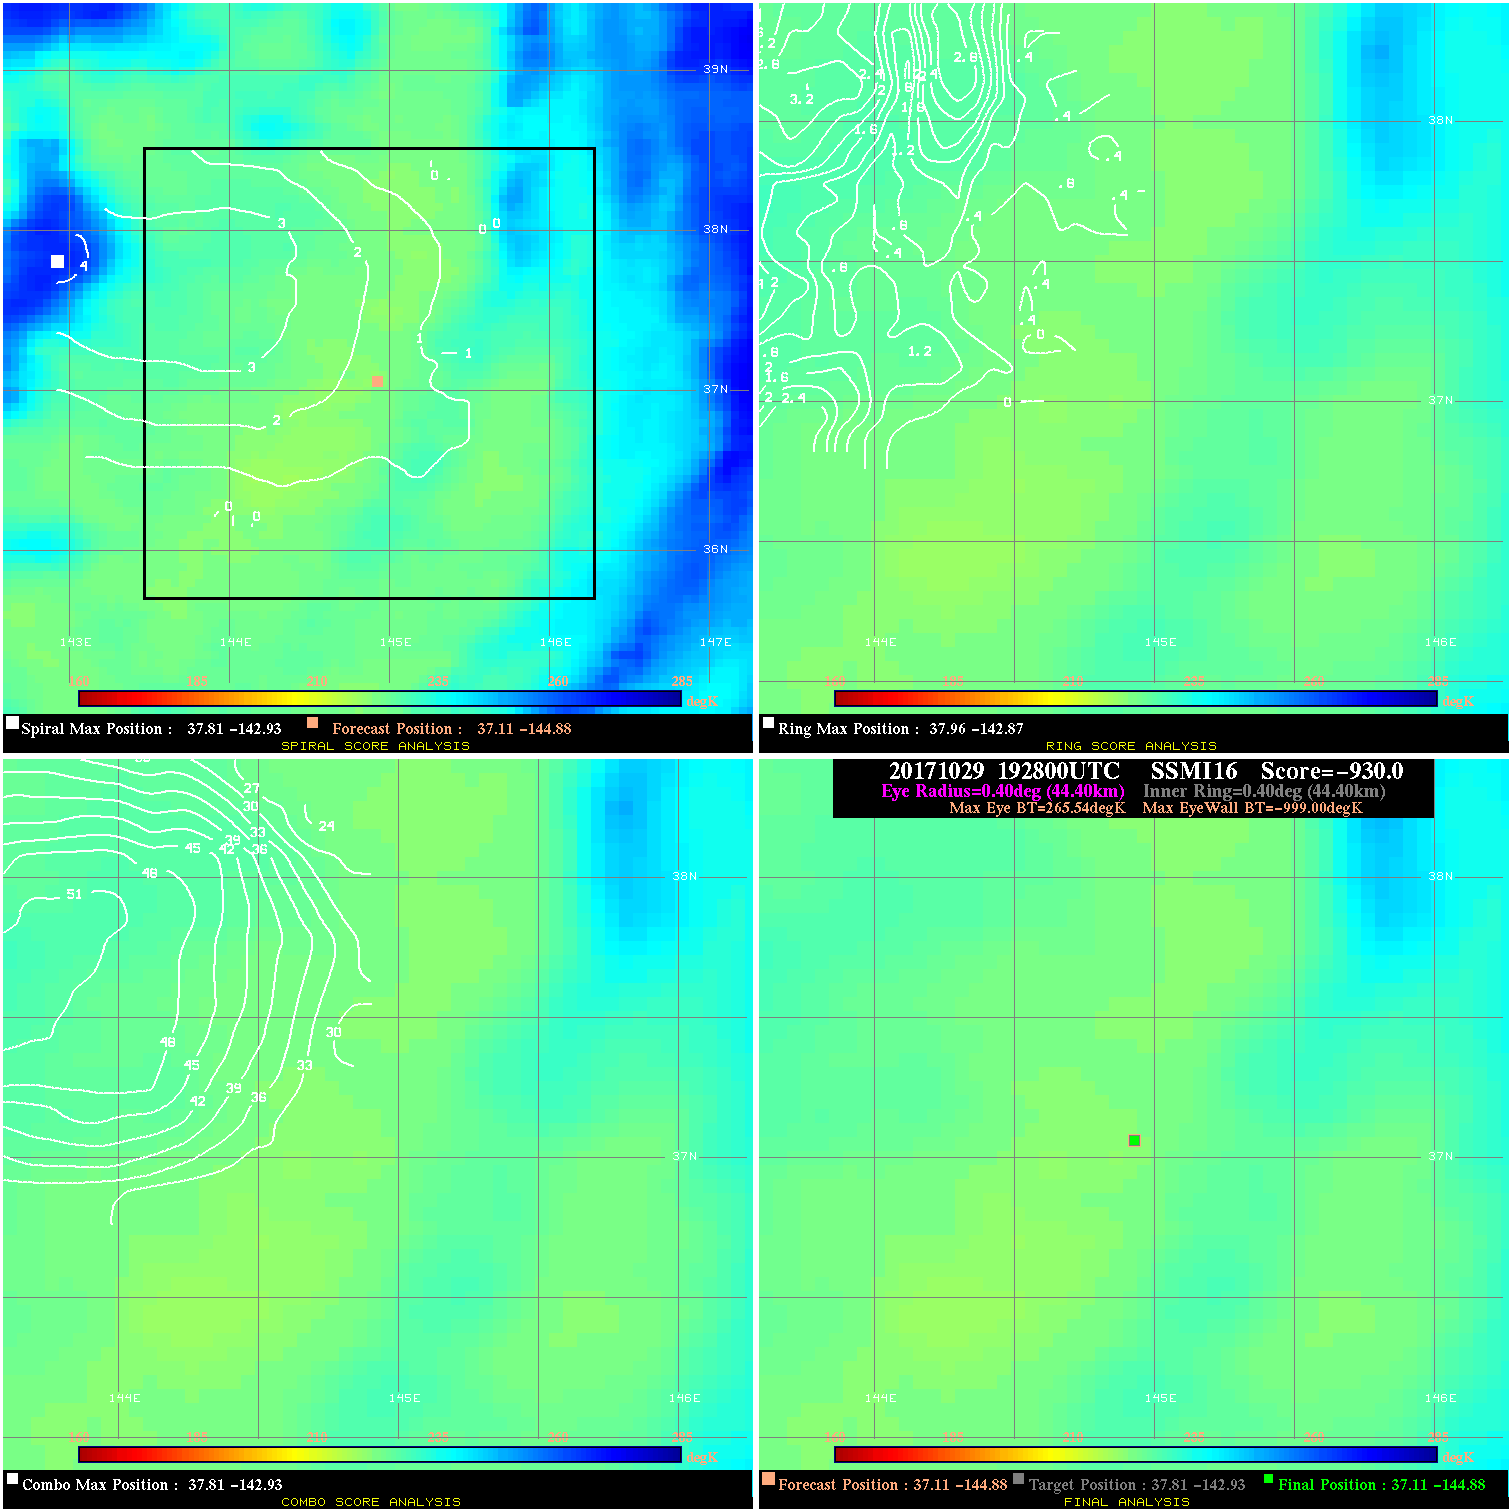
20171029 192800 -930.0 N/A N/A N/A 0.00 55.0 SSMI16 37.1 -144.9 37.1 -144.9 37.8 -142.9 Analysis Plot
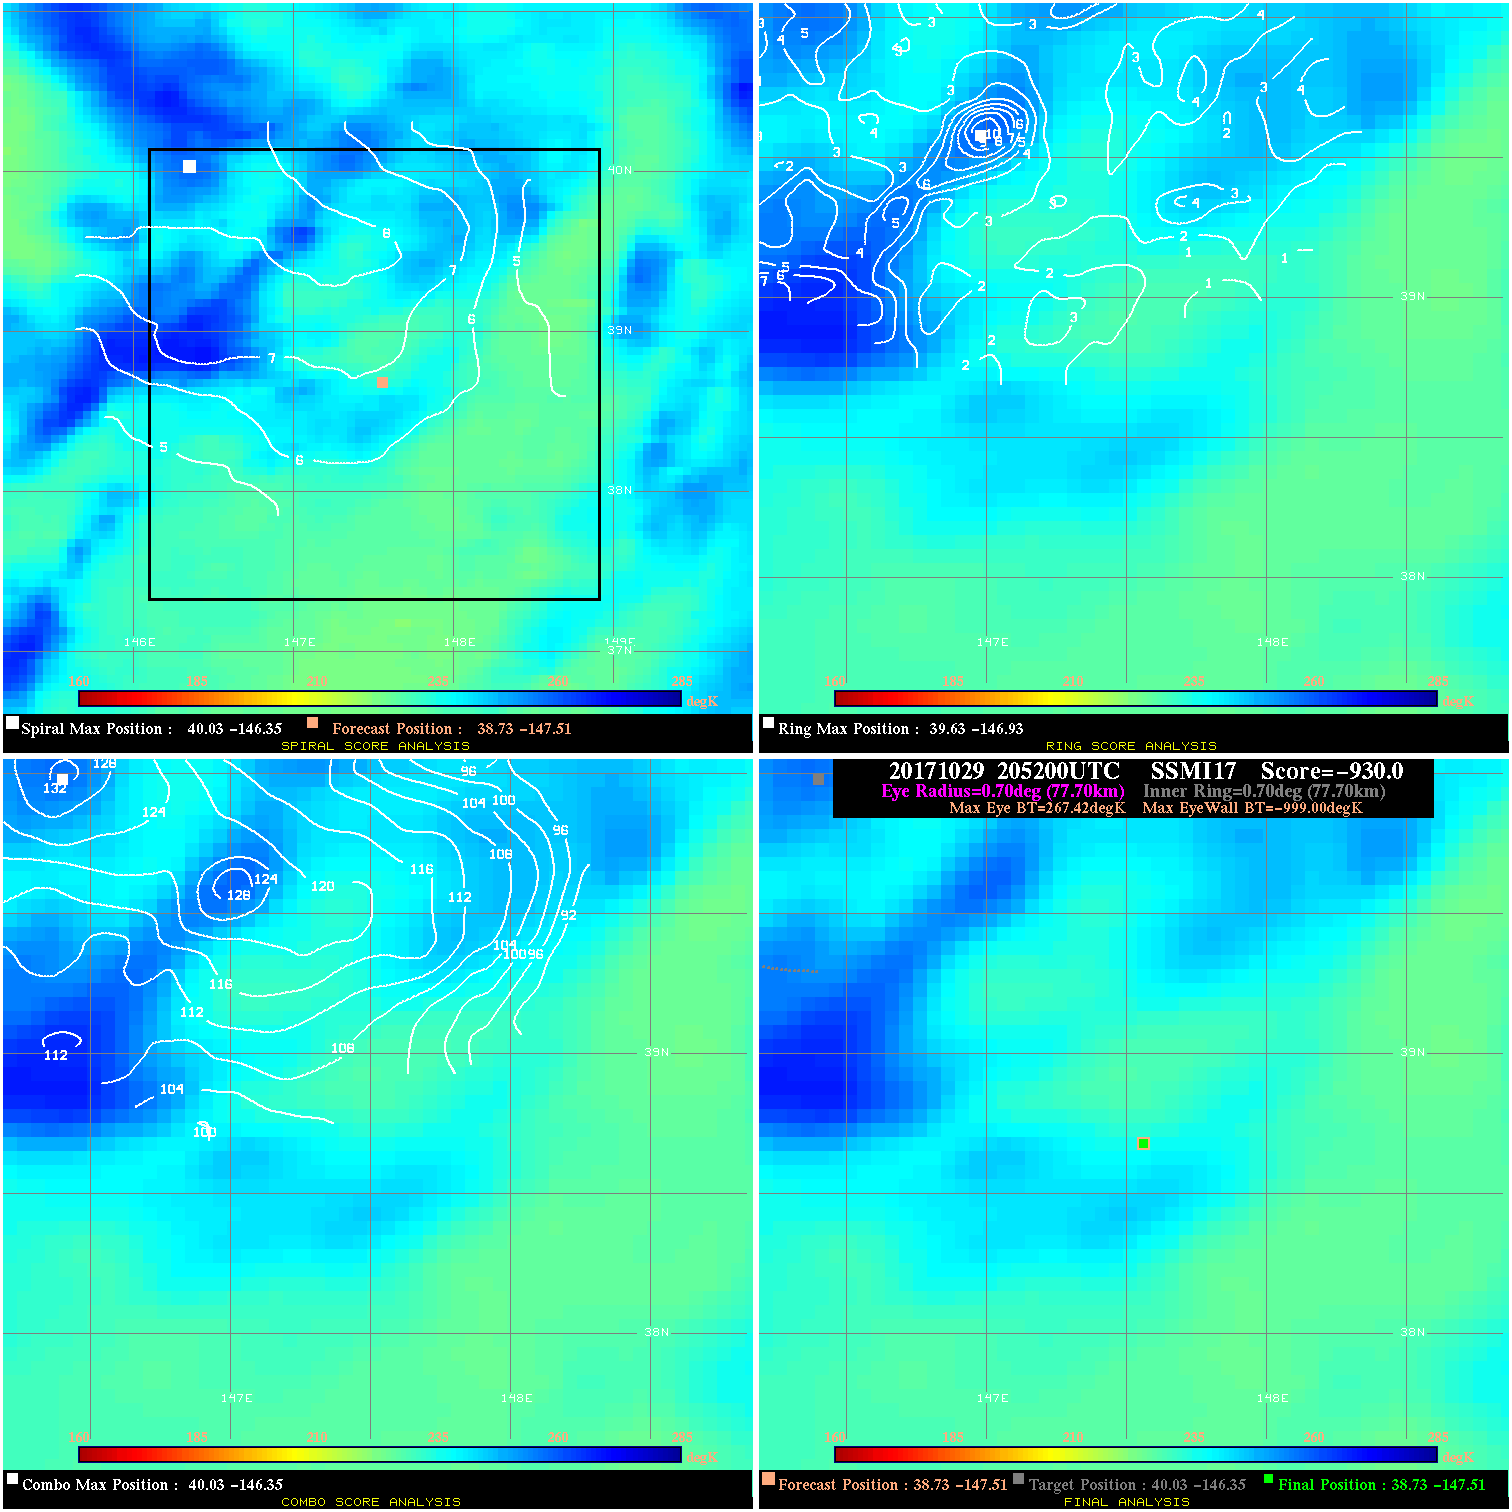
20171029 205200 -930.0 N/A N/A N/A 0.00 55.0 SSMI17 38.7 -147.5 38.7 -147.5 40.0 -146.4 Analysis Plot
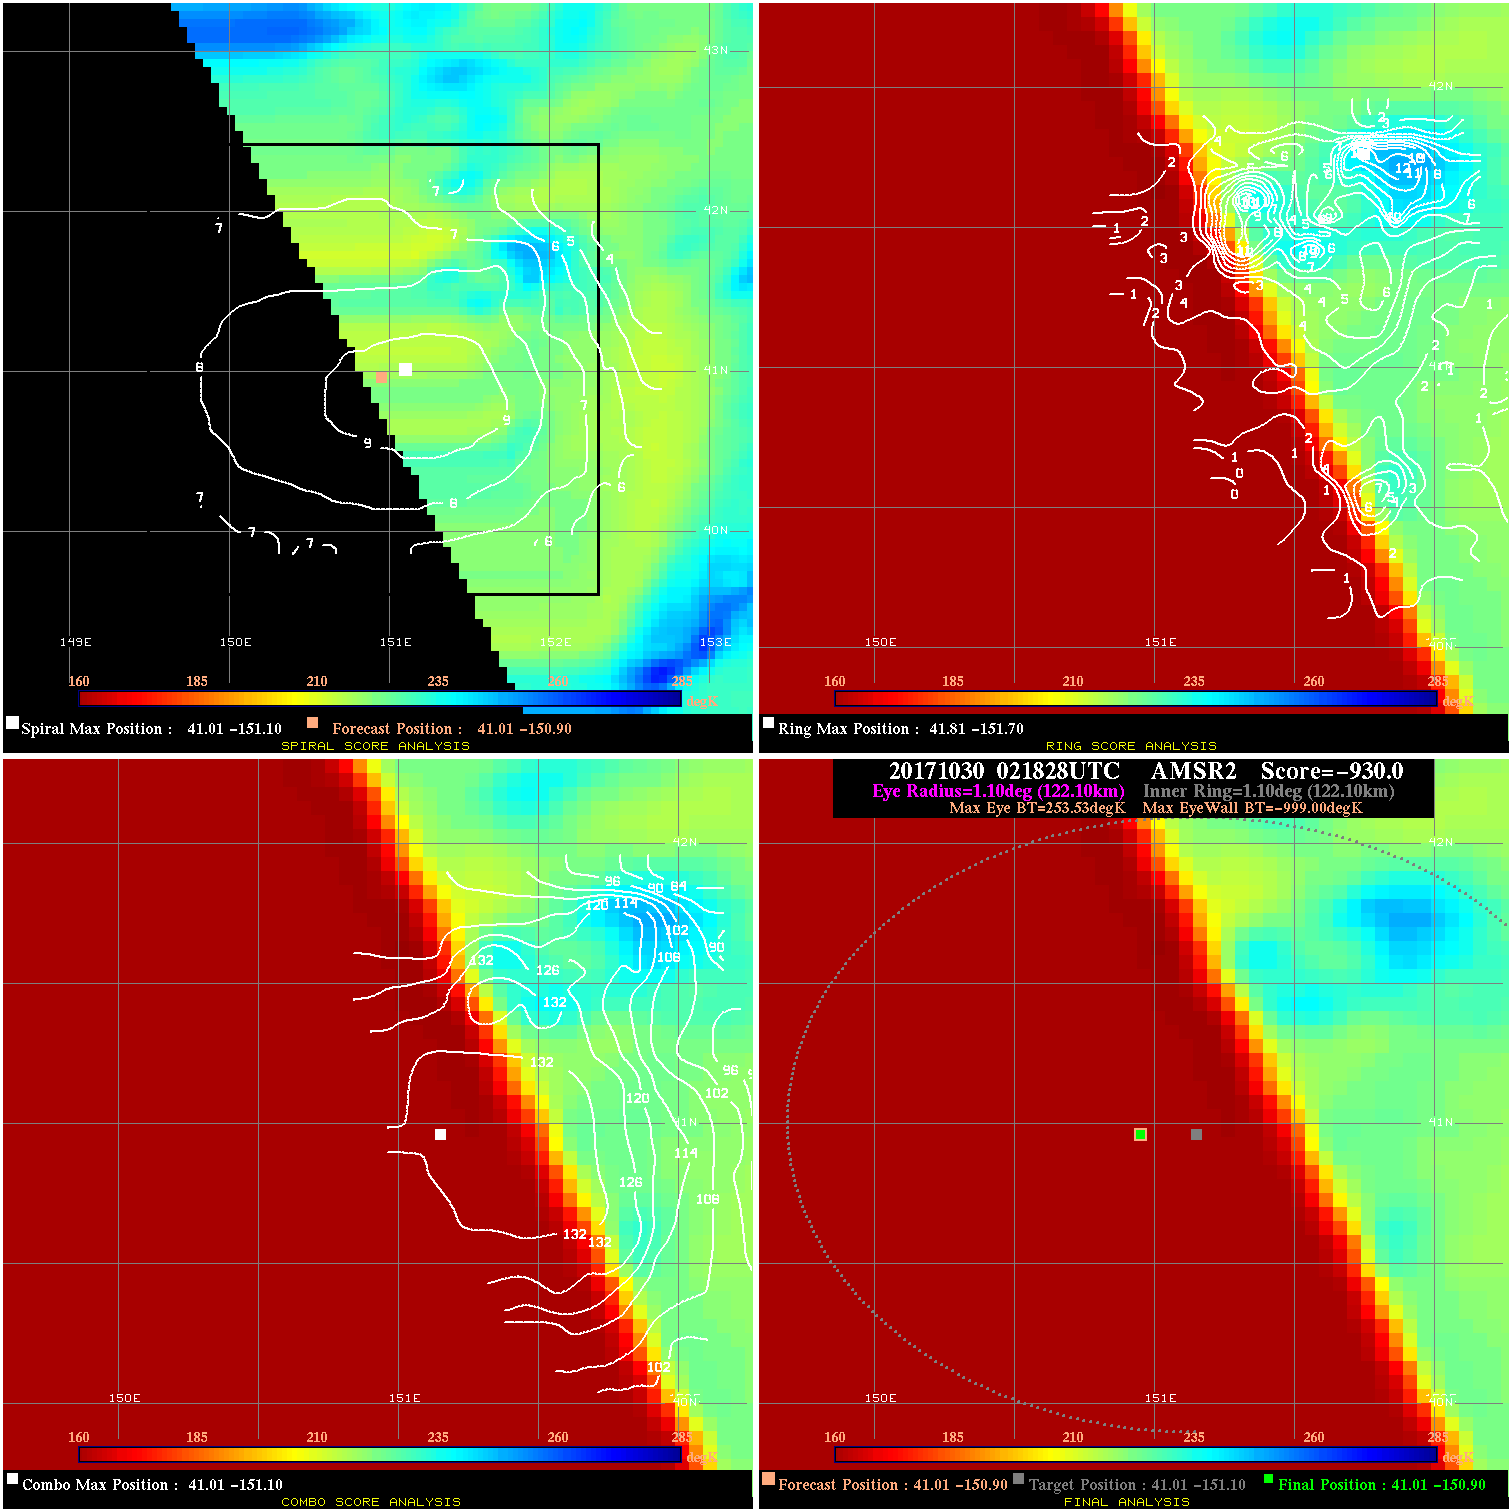
20171030 021828 -930.0 N/A N/A N/A 0.00 55.0 AMSR2 41.0 -150.9 41.0 -150.9 41.0 -151.1 Analysis Plot
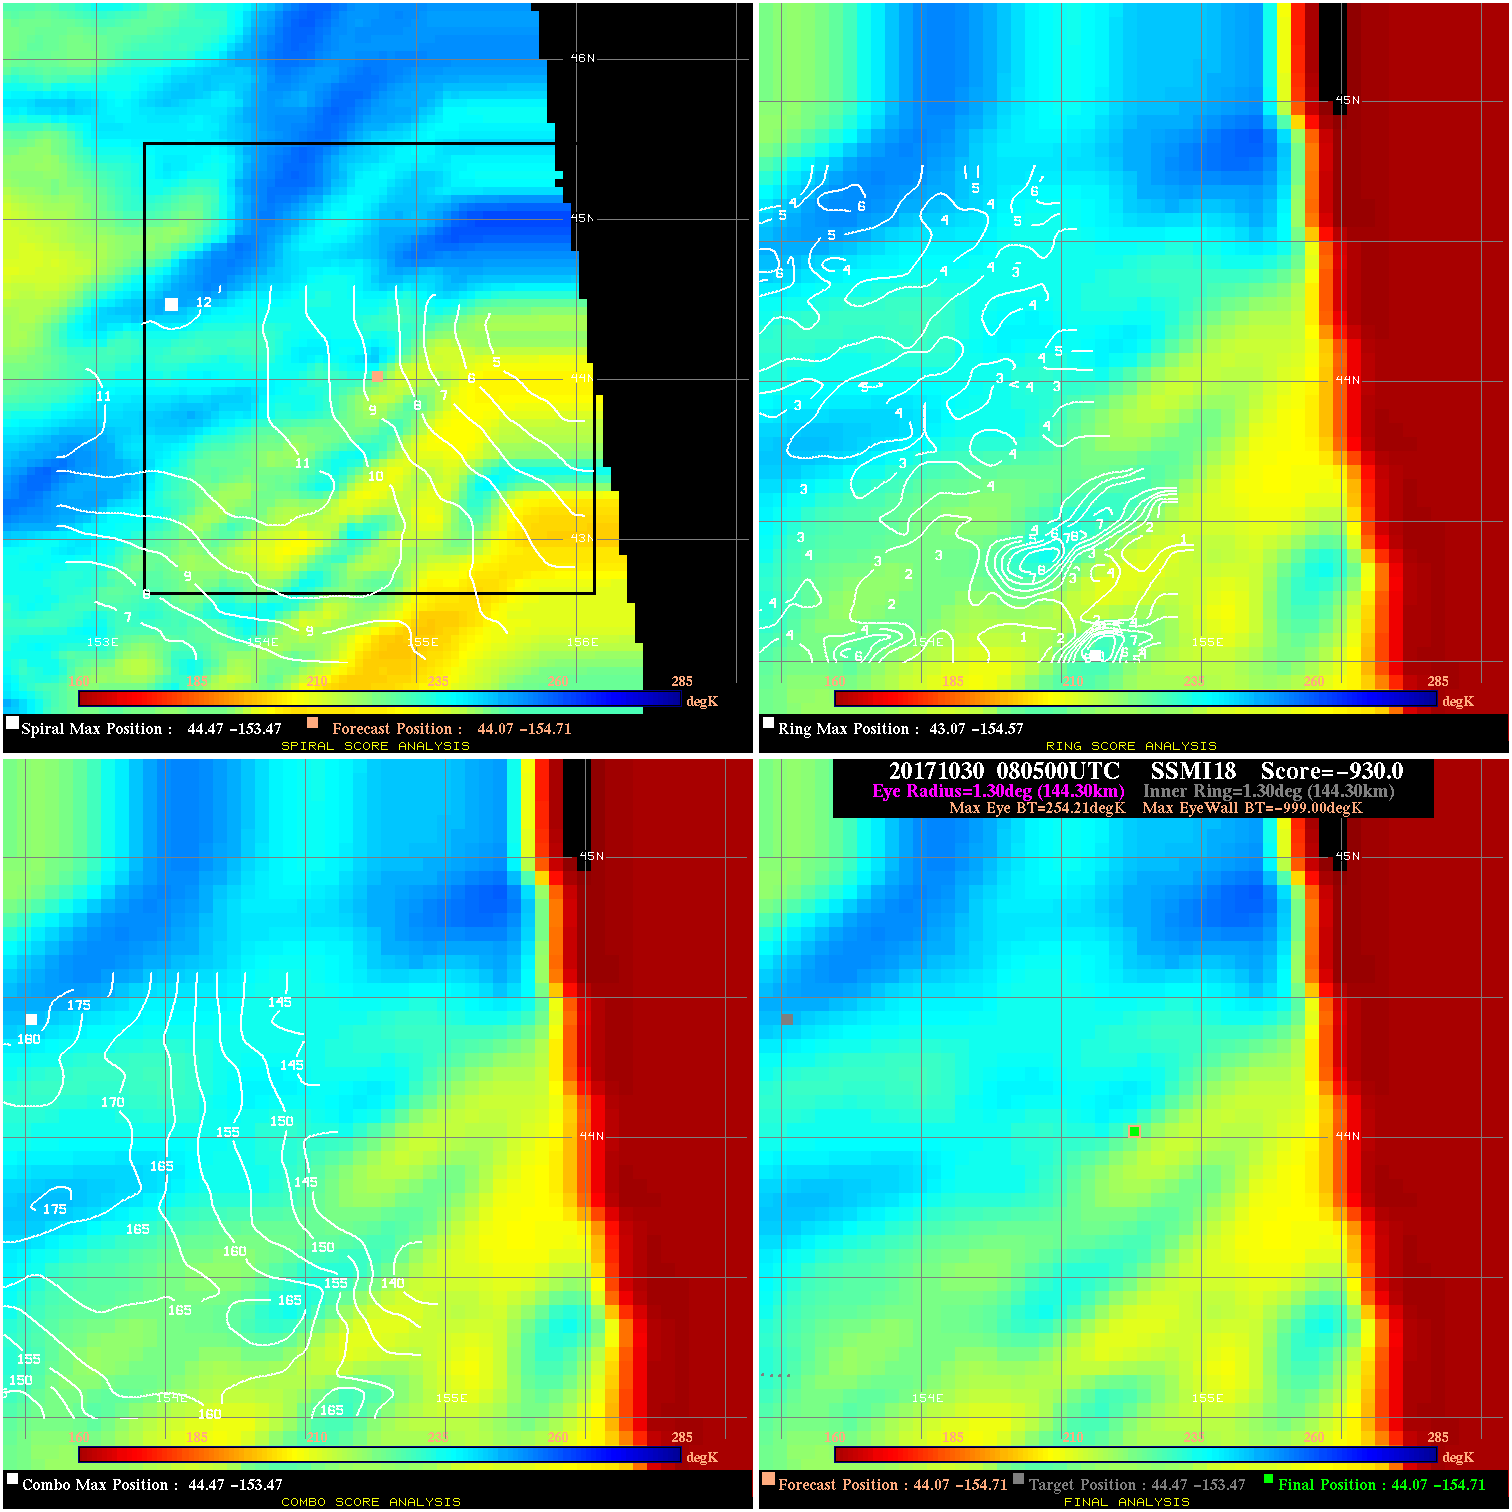
20171030 080500 -930.0 N/A N/A N/A 0.00 55.0 SSMI18 44.1 -154.7 44.1 -154.7 44.5 -153.5 Analysis Plot
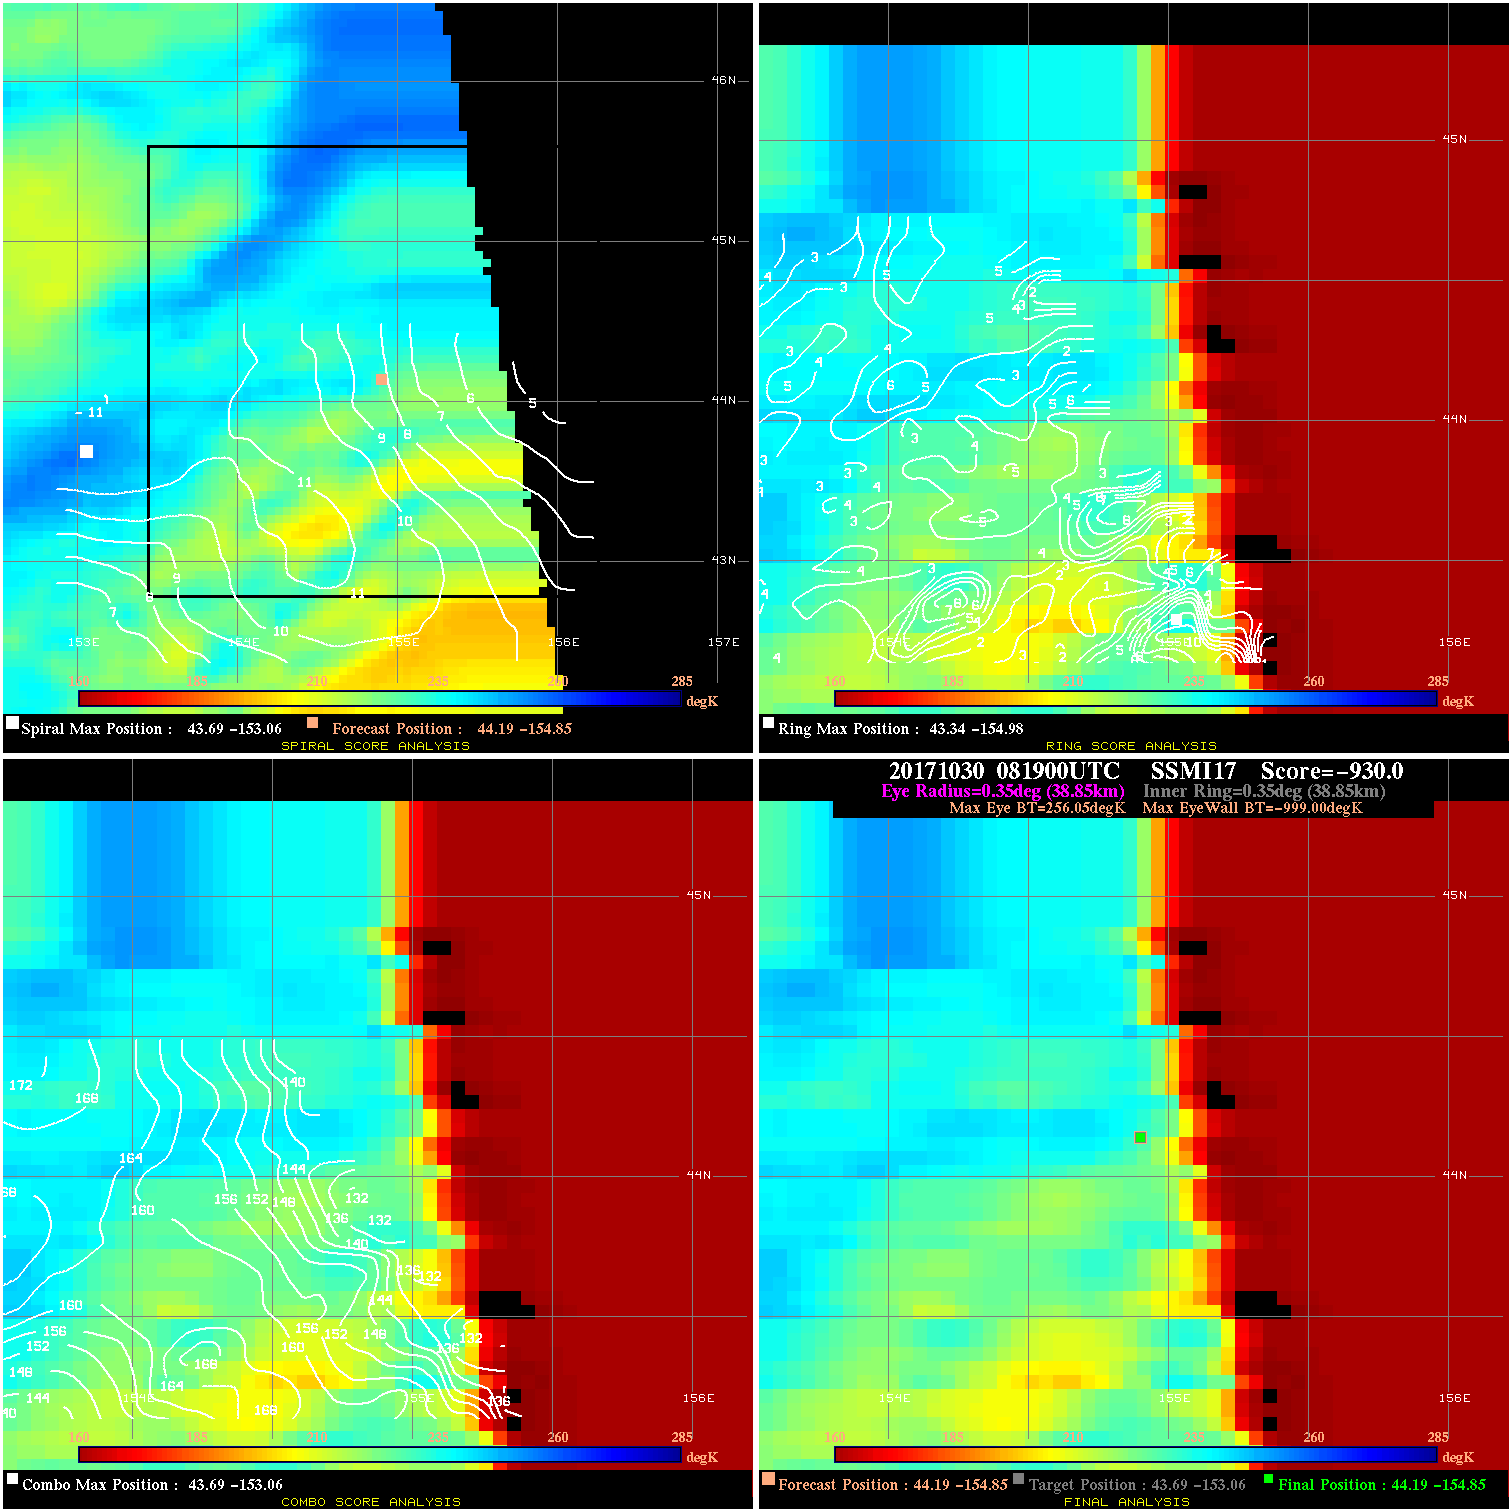
20171030 081900 -930.0 N/A N/A N/A 0.00 55.0 SSMI17 44.2 -154.9 44.2 -154.9 43.7 -153.1 Analysis Plot
|
|
Legend: - Date/Time are determined from PMW imagery at Forecast (initial guess) Lat/Lon position. - Positive/Negative Latitude = North/South Hemisphere; Longitude = Western/Eastern Hemisphere. - "Ring Diam" value indicates the estimated surface eyewall diameter in km (the MI eyewall edge diameter minus 10 km). - "Ring Pct" is the percentage of the "ring" (eyewall inner boundary) that is 1) colder than the "hot spot" (warmest eye pixel) in the eye by 20K, or 2) the percentage that is a) colder than 232K and b) colder than the "hot spot" by 10K, whichever is greater. - Values are red if Ring % <= 65, yellow/brown if Ring % <= 85 and green if Ring % > 85. - "Tb diff" is the difference between the "hot spot" (warmest eye pixel) and the warmest pixel on the eyewall. - Intensity score are listed as negative, and not used, when the JTWC or NHC estimated Vmax is <55 kts in order to rule out weak but highly symmetric TCs. - Error messages in intensity scores: -920 is used when the hottest pixel in the eye is <200K, to prevent false positives; -930 means <85% of eyewall has observations/data. |