Tropical Storm 02A
|
Passive Microwave (PMW) Intensity Information Advanced Dvorak Technique (ADT) Version 8.2.1 |
Overpass Inten Ring Ring Wind Forecast Final Target
Date Time Score Meaning Pct Diam BTdiff Est Sat Lat Lon Lat Lon Lat Lon
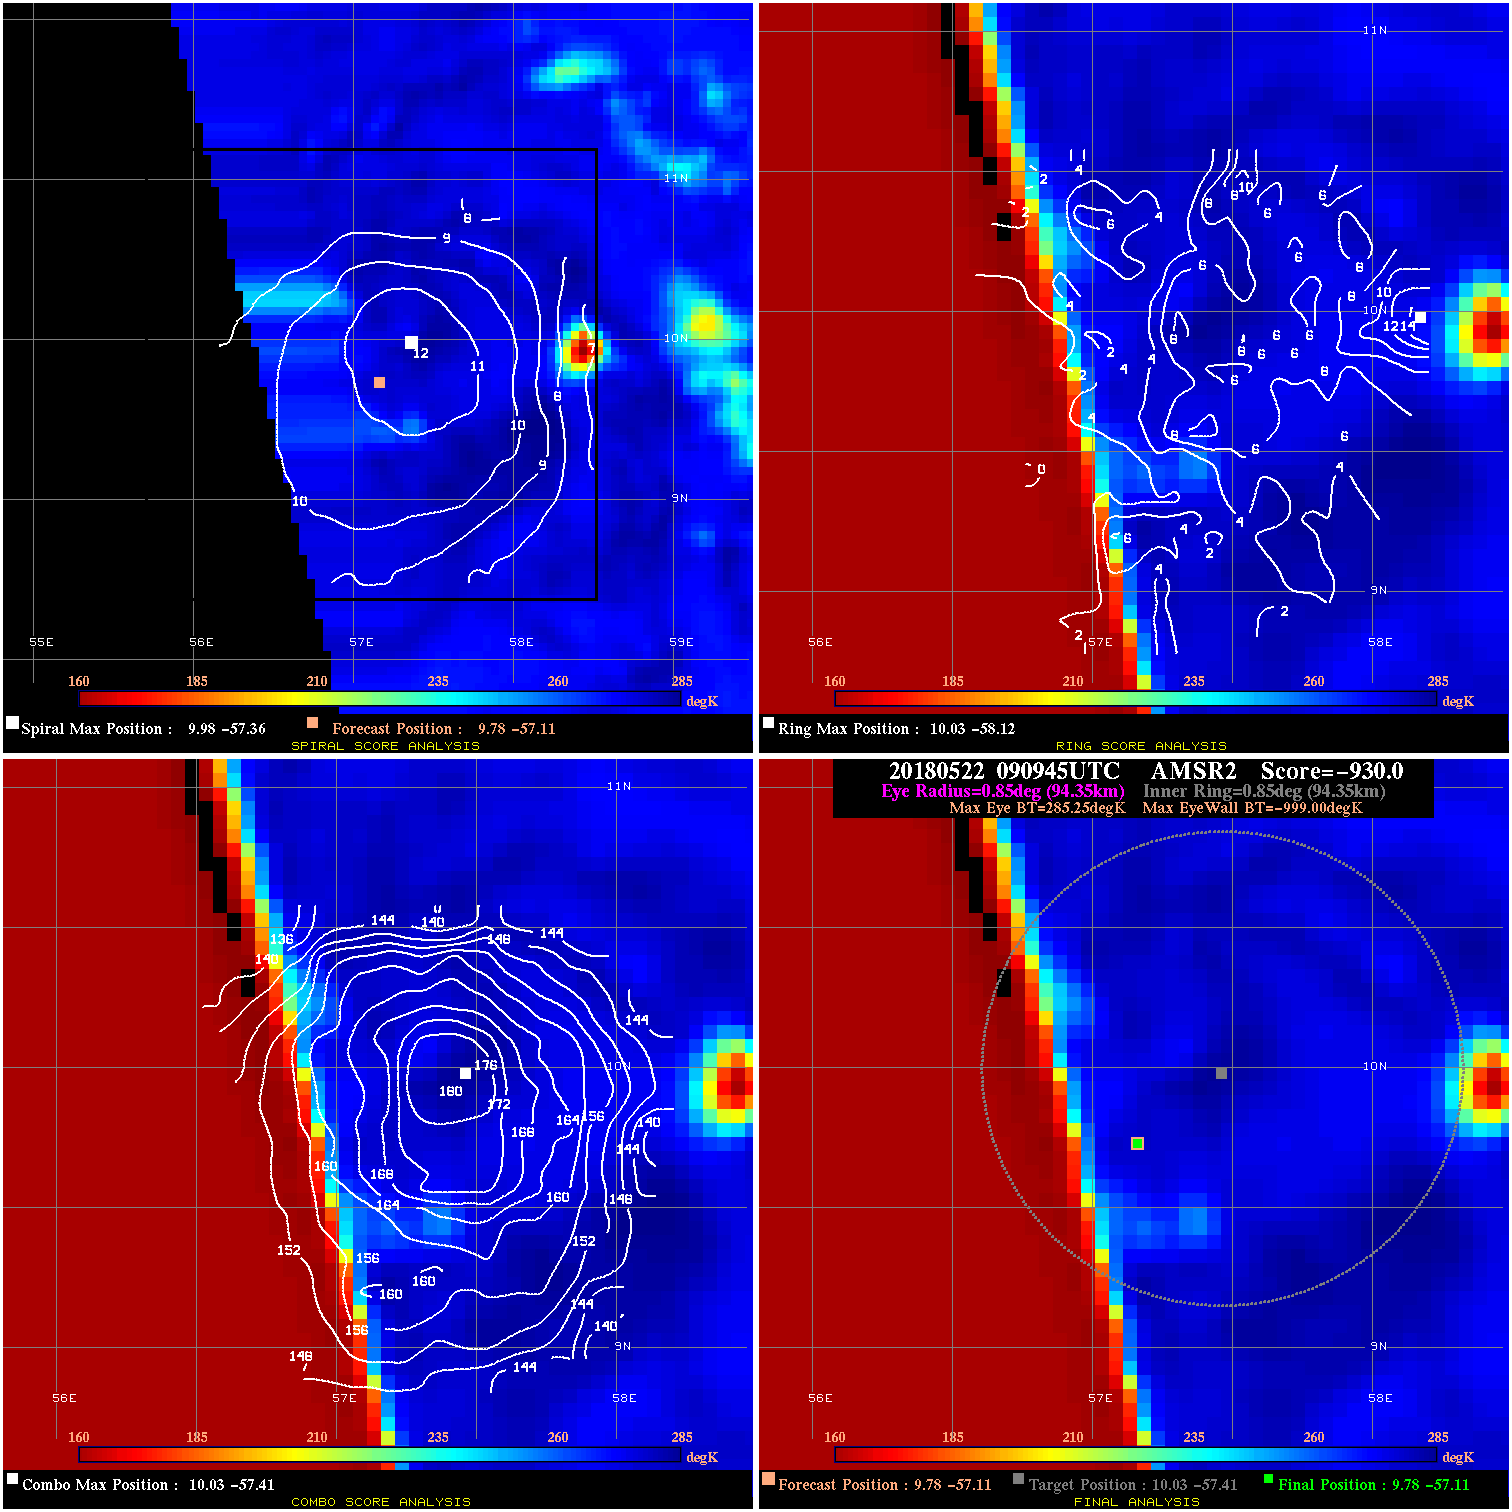
20180522 090945 -930.0 N/A N/A N/A 0.00 35.0 AMSR2 9.8 -57.1 9.8 -57.1 10.0 -57.4 Analysis Plot
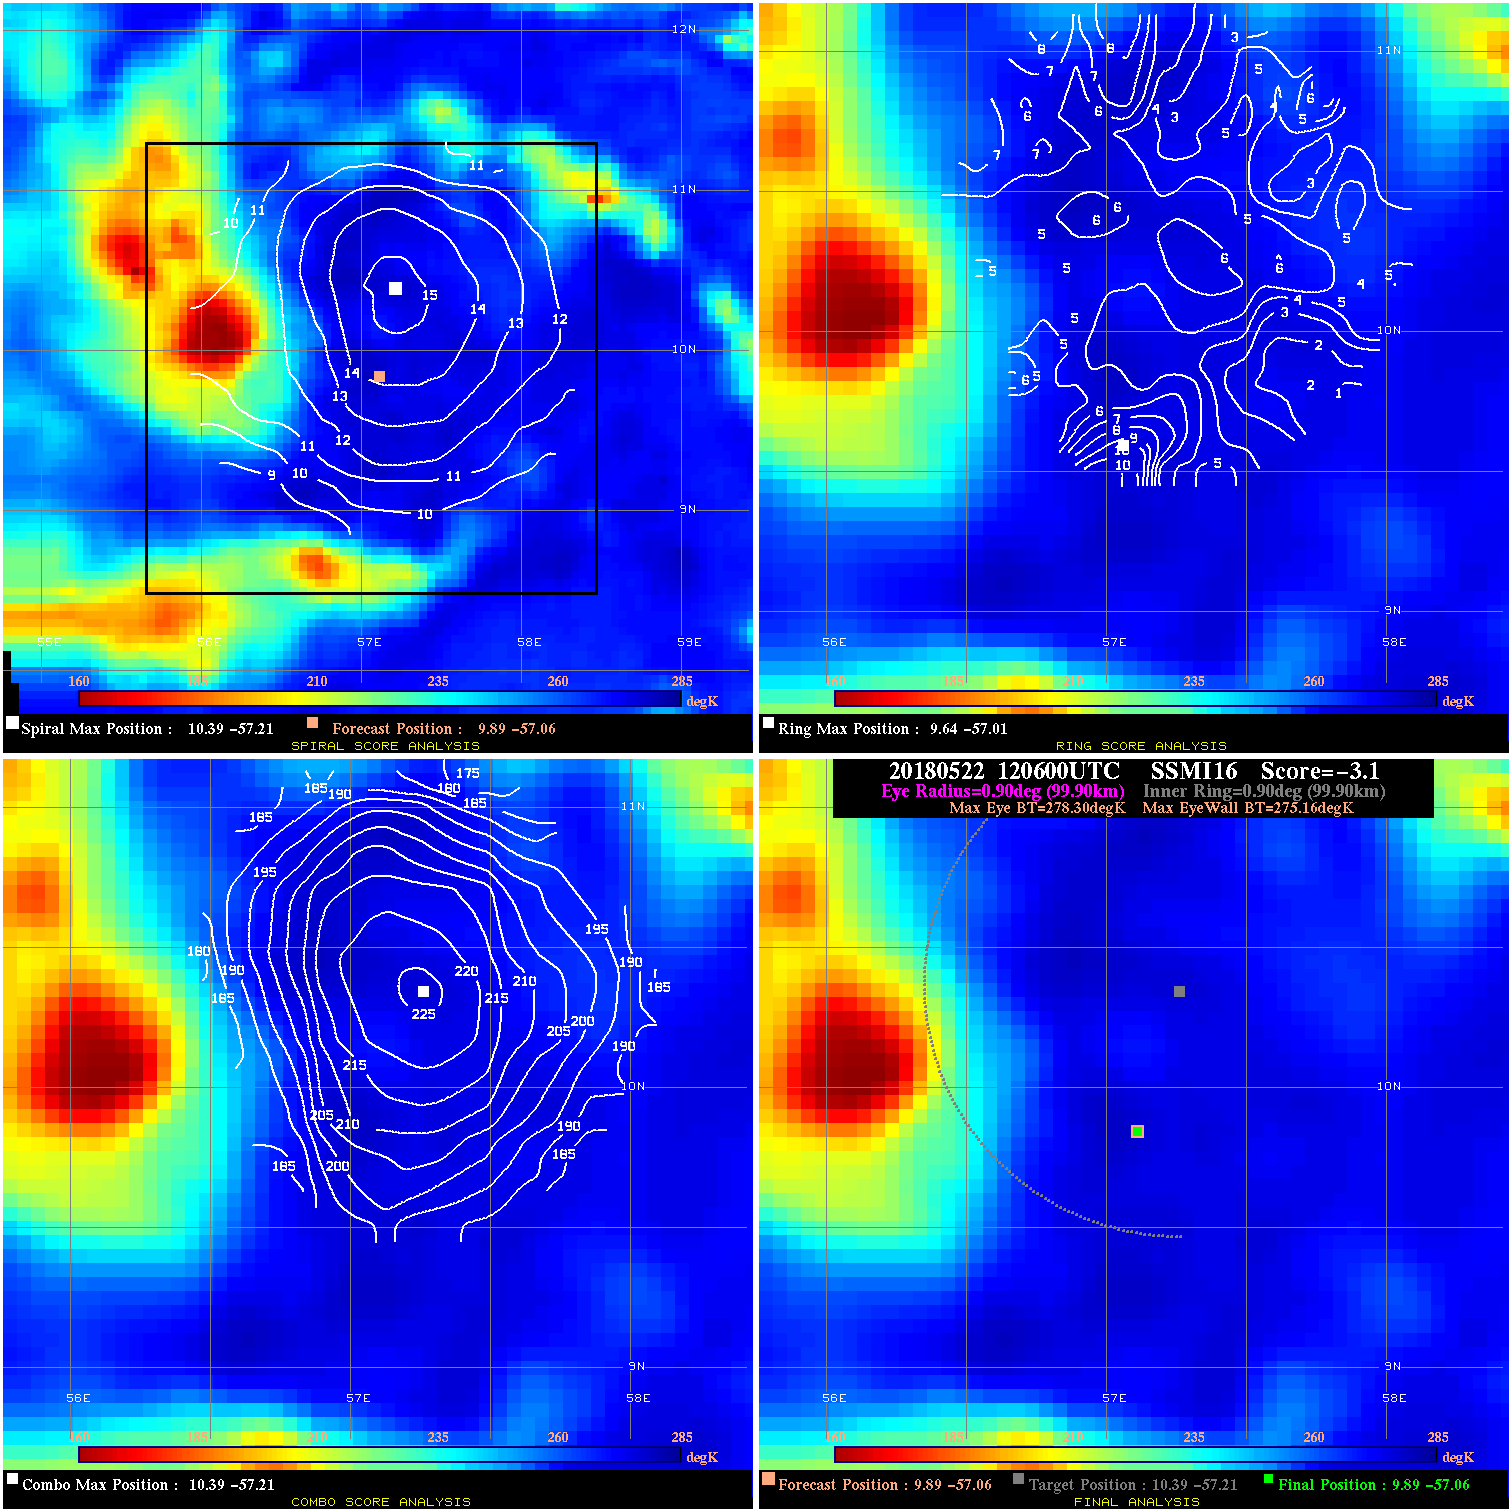
20180522 120600 -3.1 N/A 6.8% 199.98 3.14 35.0 SSMI16 9.9 -57.1 9.9 -57.1 10.4 -57.2 Analysis Plot
20180522 142500 -1.1 N/A 19.2% 155.54 1.10 40.0 SSMI18 10.6 -56.8 10.6 -56.8 10.7 -56.8 Analysis Plot
20180522 181106 -2.5 N/A 6.8% 177.76 2.51 40.0 GMI 11.0 -56.7 11.0 -56.7 11.3 -56.6 Analysis Plot
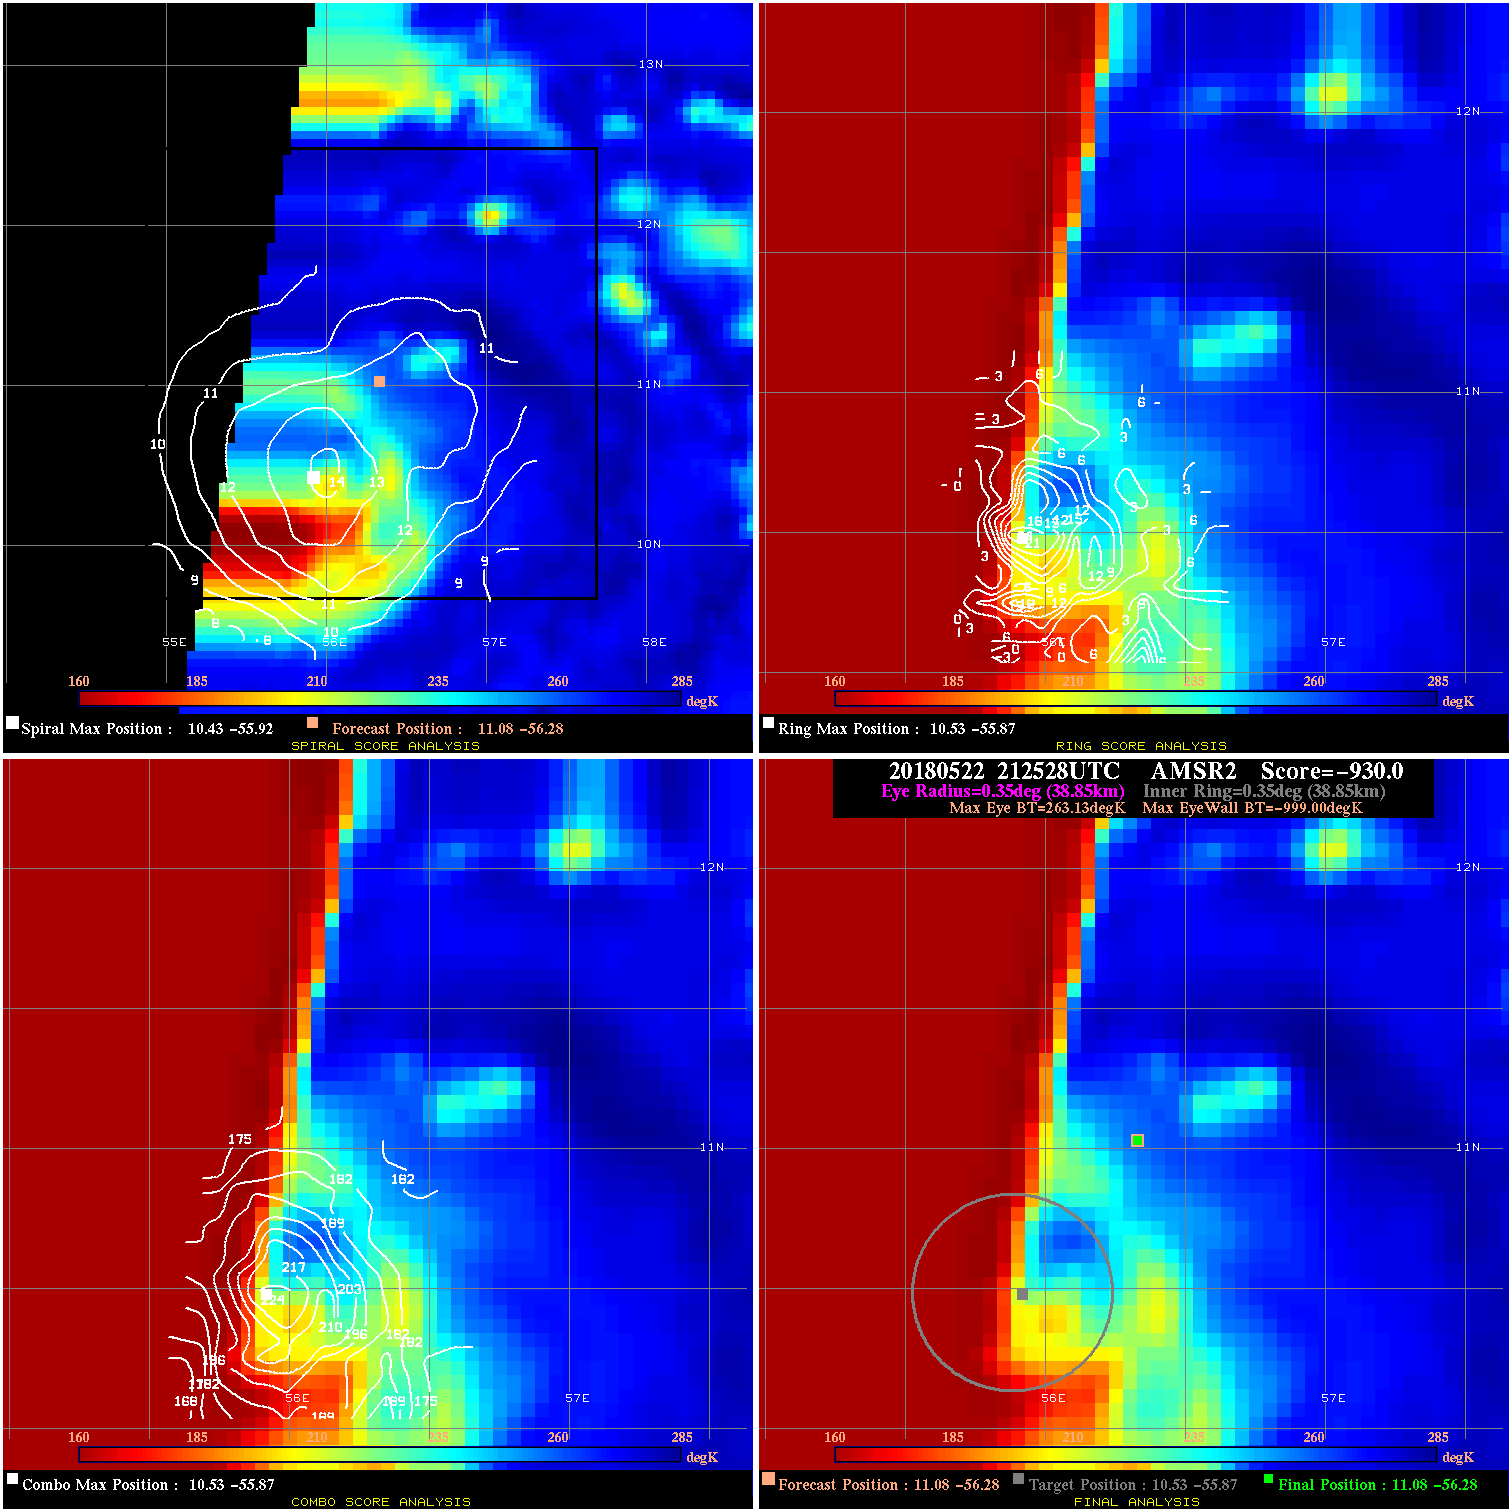
20180522 212528 -930.0 N/A N/A N/A 0.00 45.0 AMSR2 11.1 -56.3 11.1 -56.3 10.5 -55.9 Analysis Plot
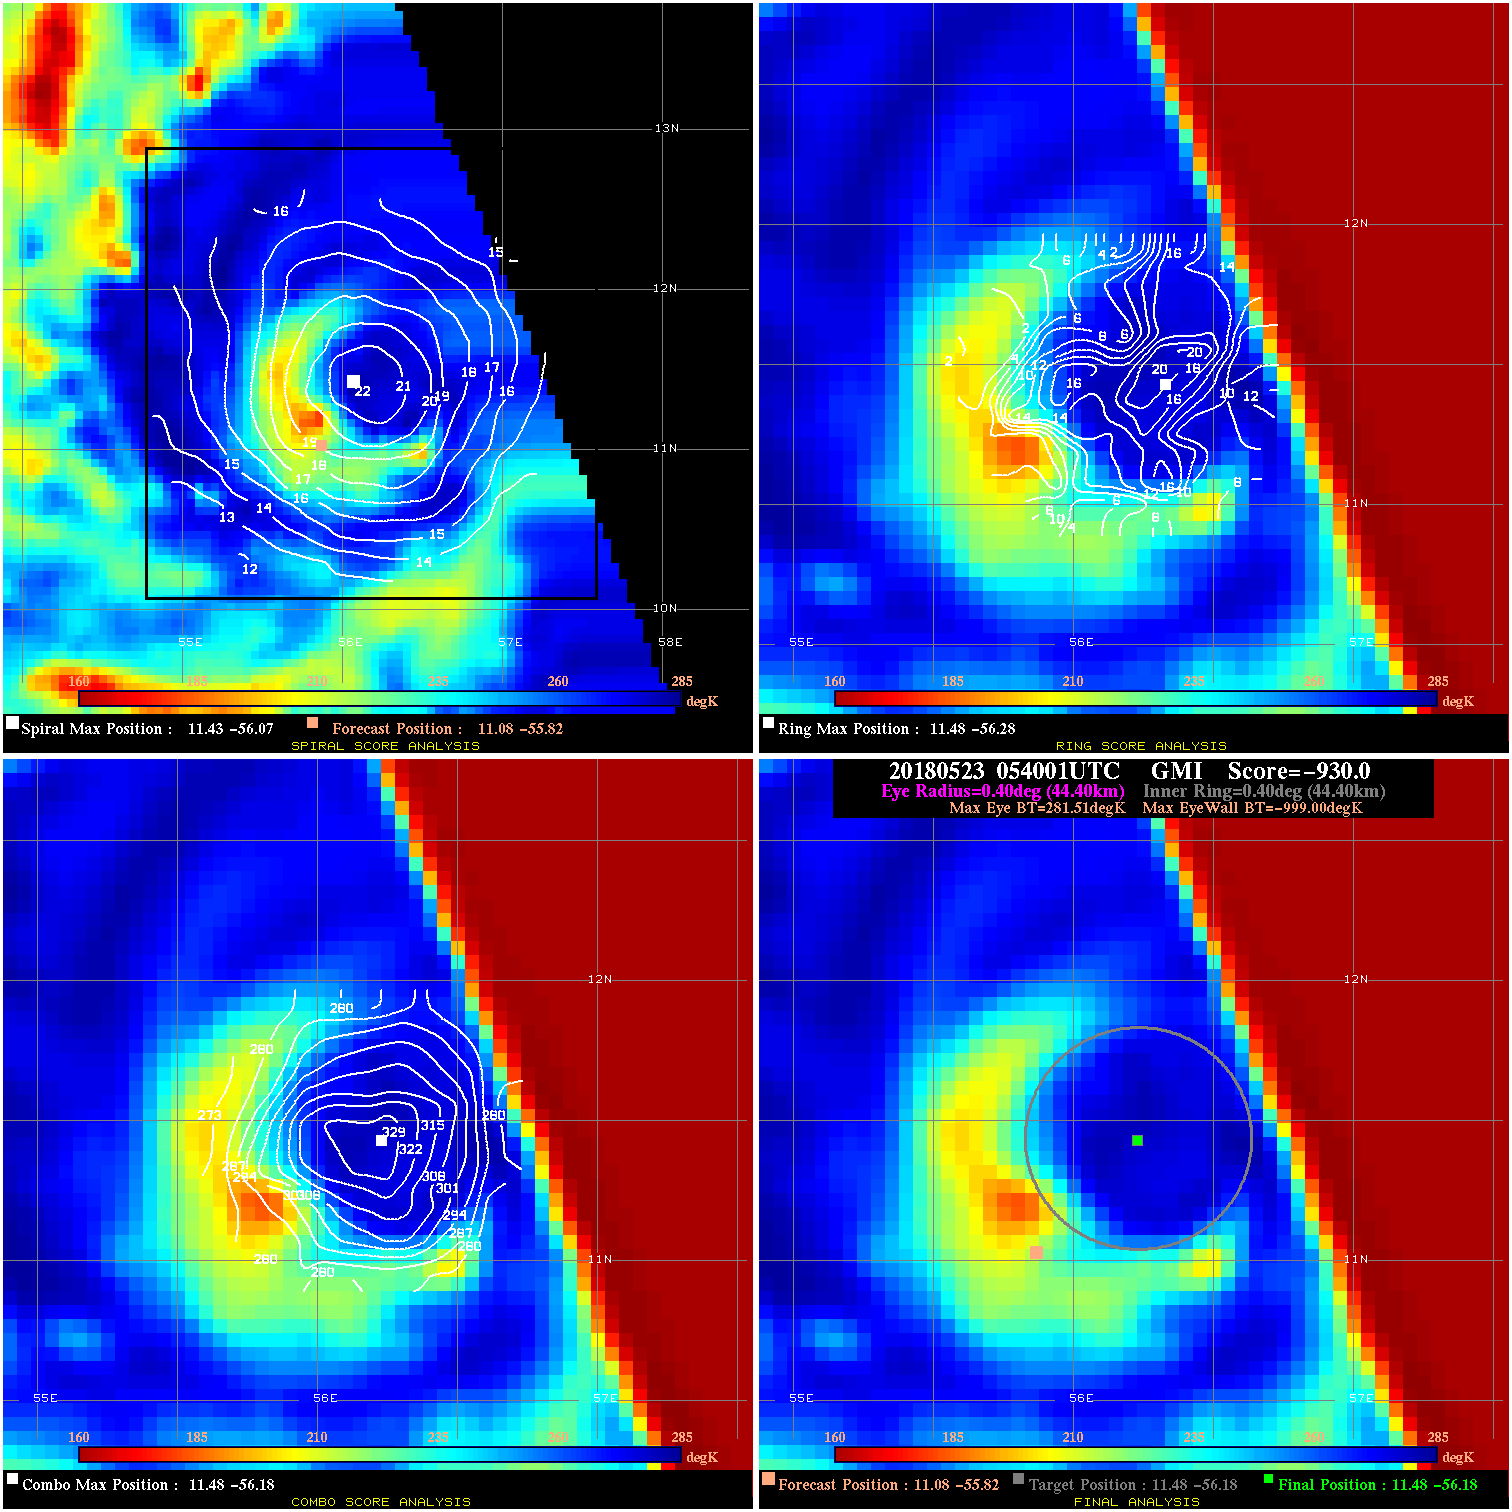
20180523 054001 -930.0 N/A N/A N/A 0.00 55.0 GMI 11.1 -55.8 11.5 -56.2 11.5 -56.2 Analysis Plot
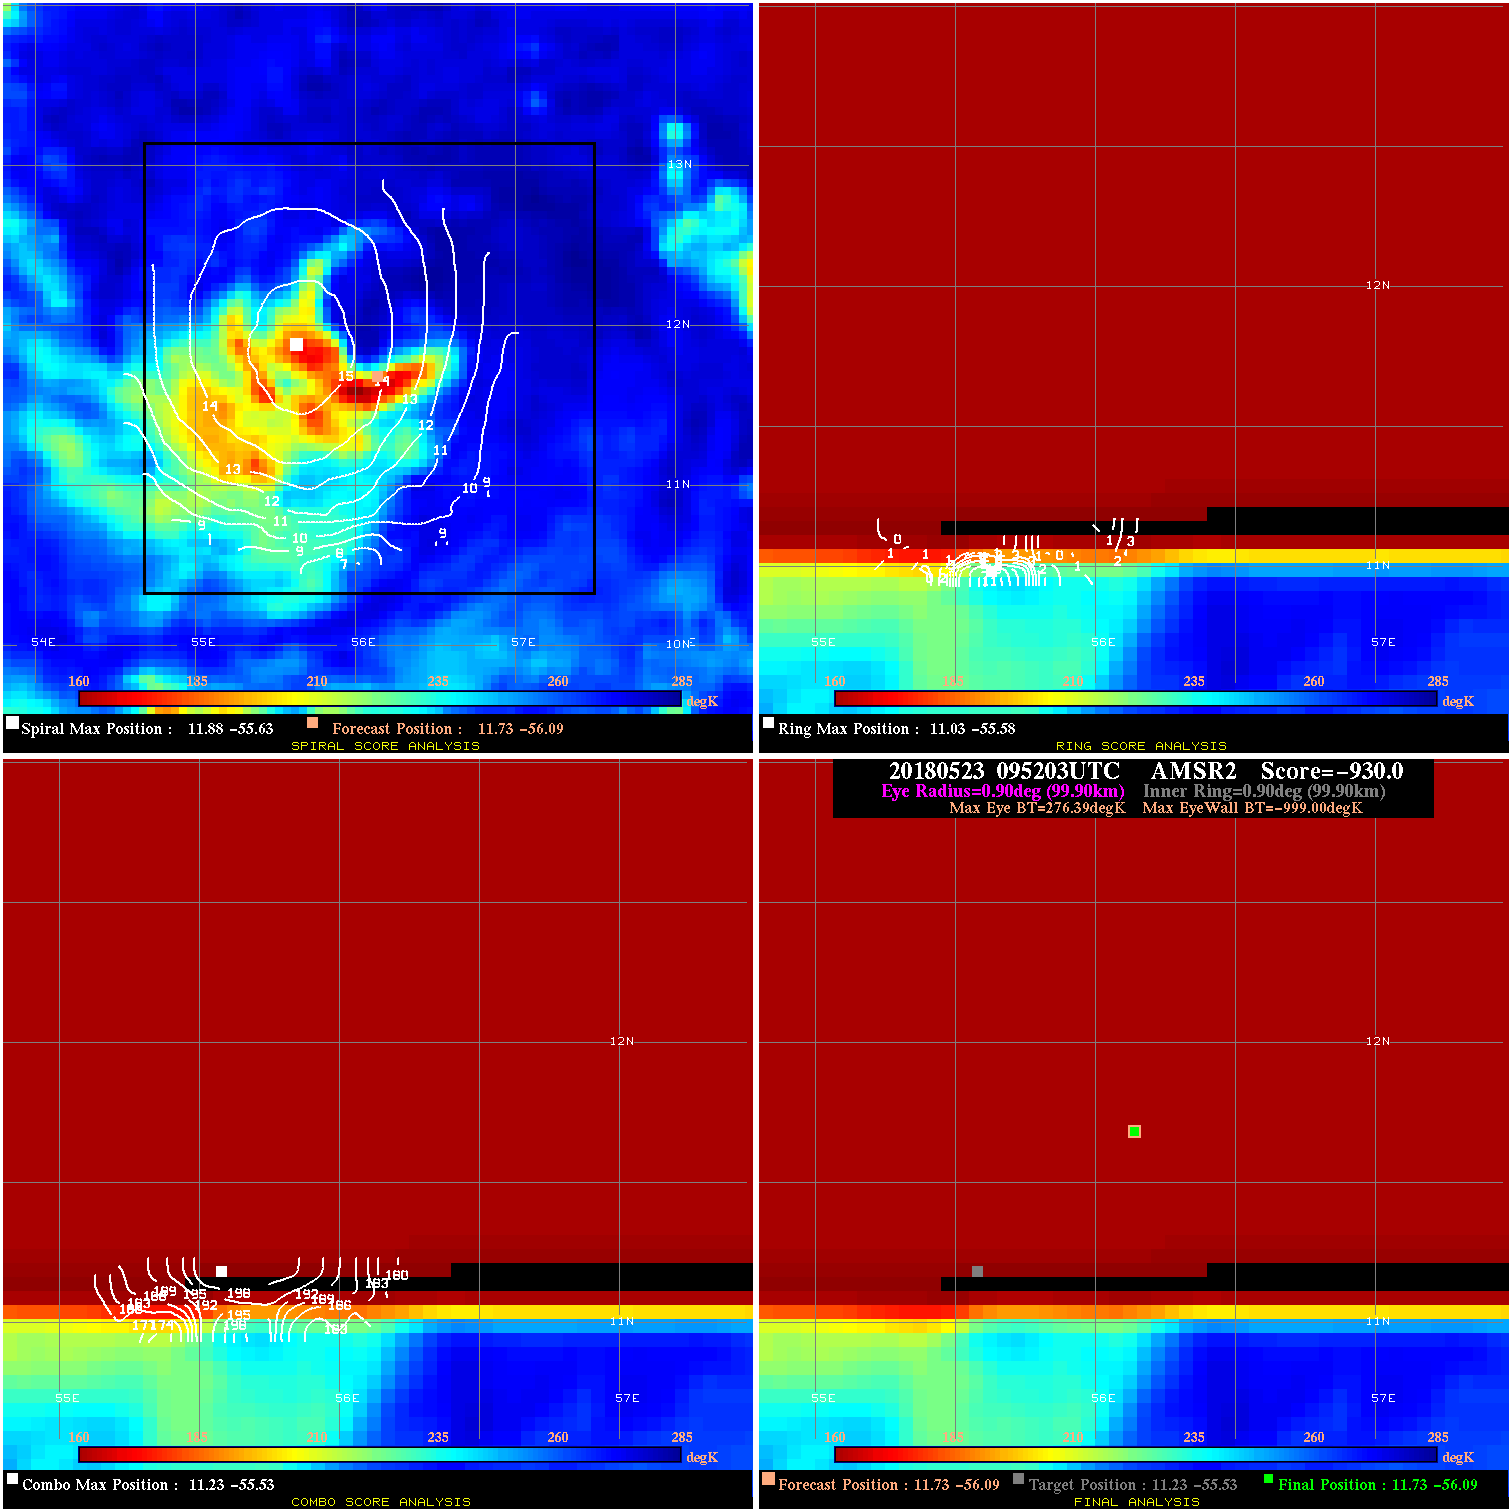
20180523 095203 -930.0 N/A N/A N/A 0.00 60.0 AMSR2 11.7 -56.1 11.7 -56.1 11.2 -55.5 Analysis Plot
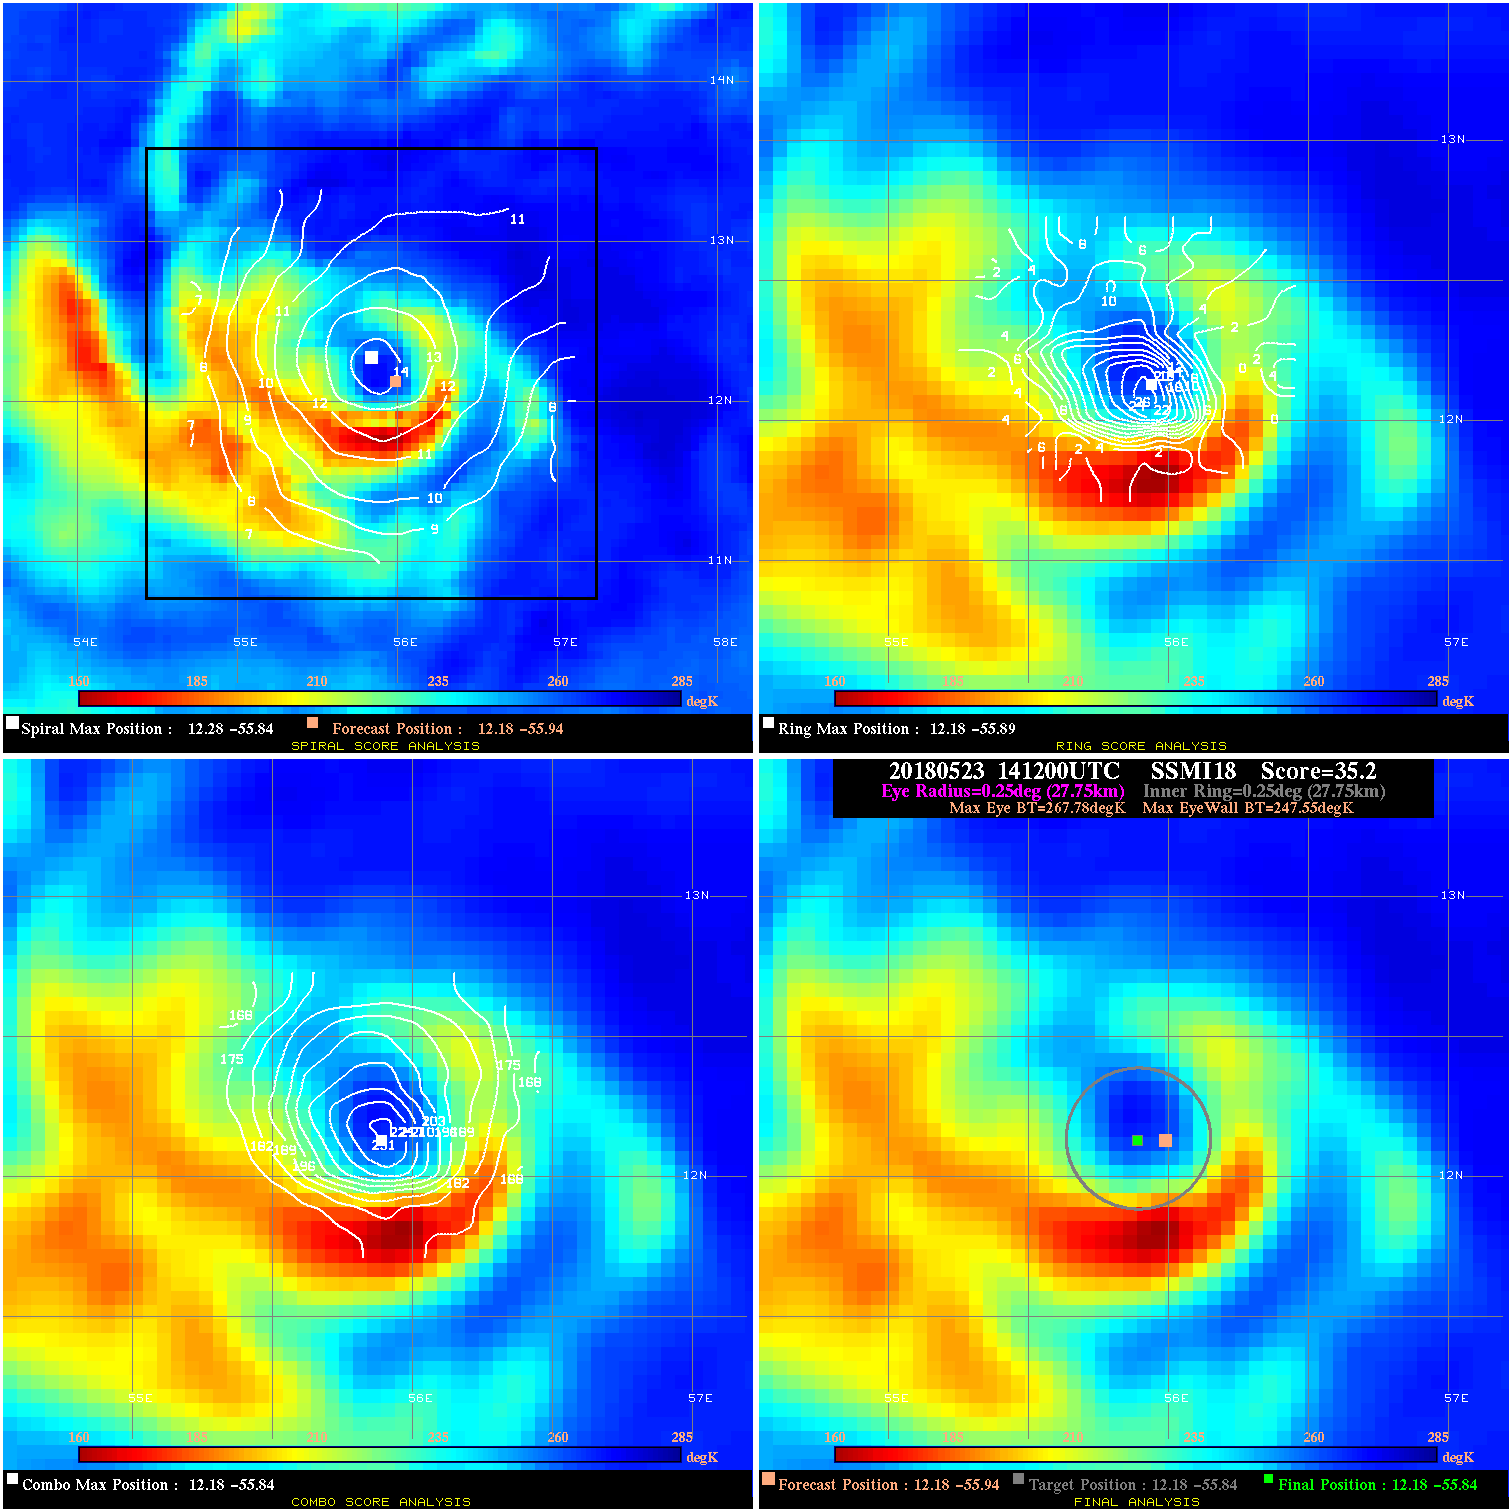
20180523 141200 35.2 >65 kts 100.0% 55.55 20.23 65.0 SSMI18 12.2 -55.9 12.2 -55.8 12.2 -55.8 Analysis Plot
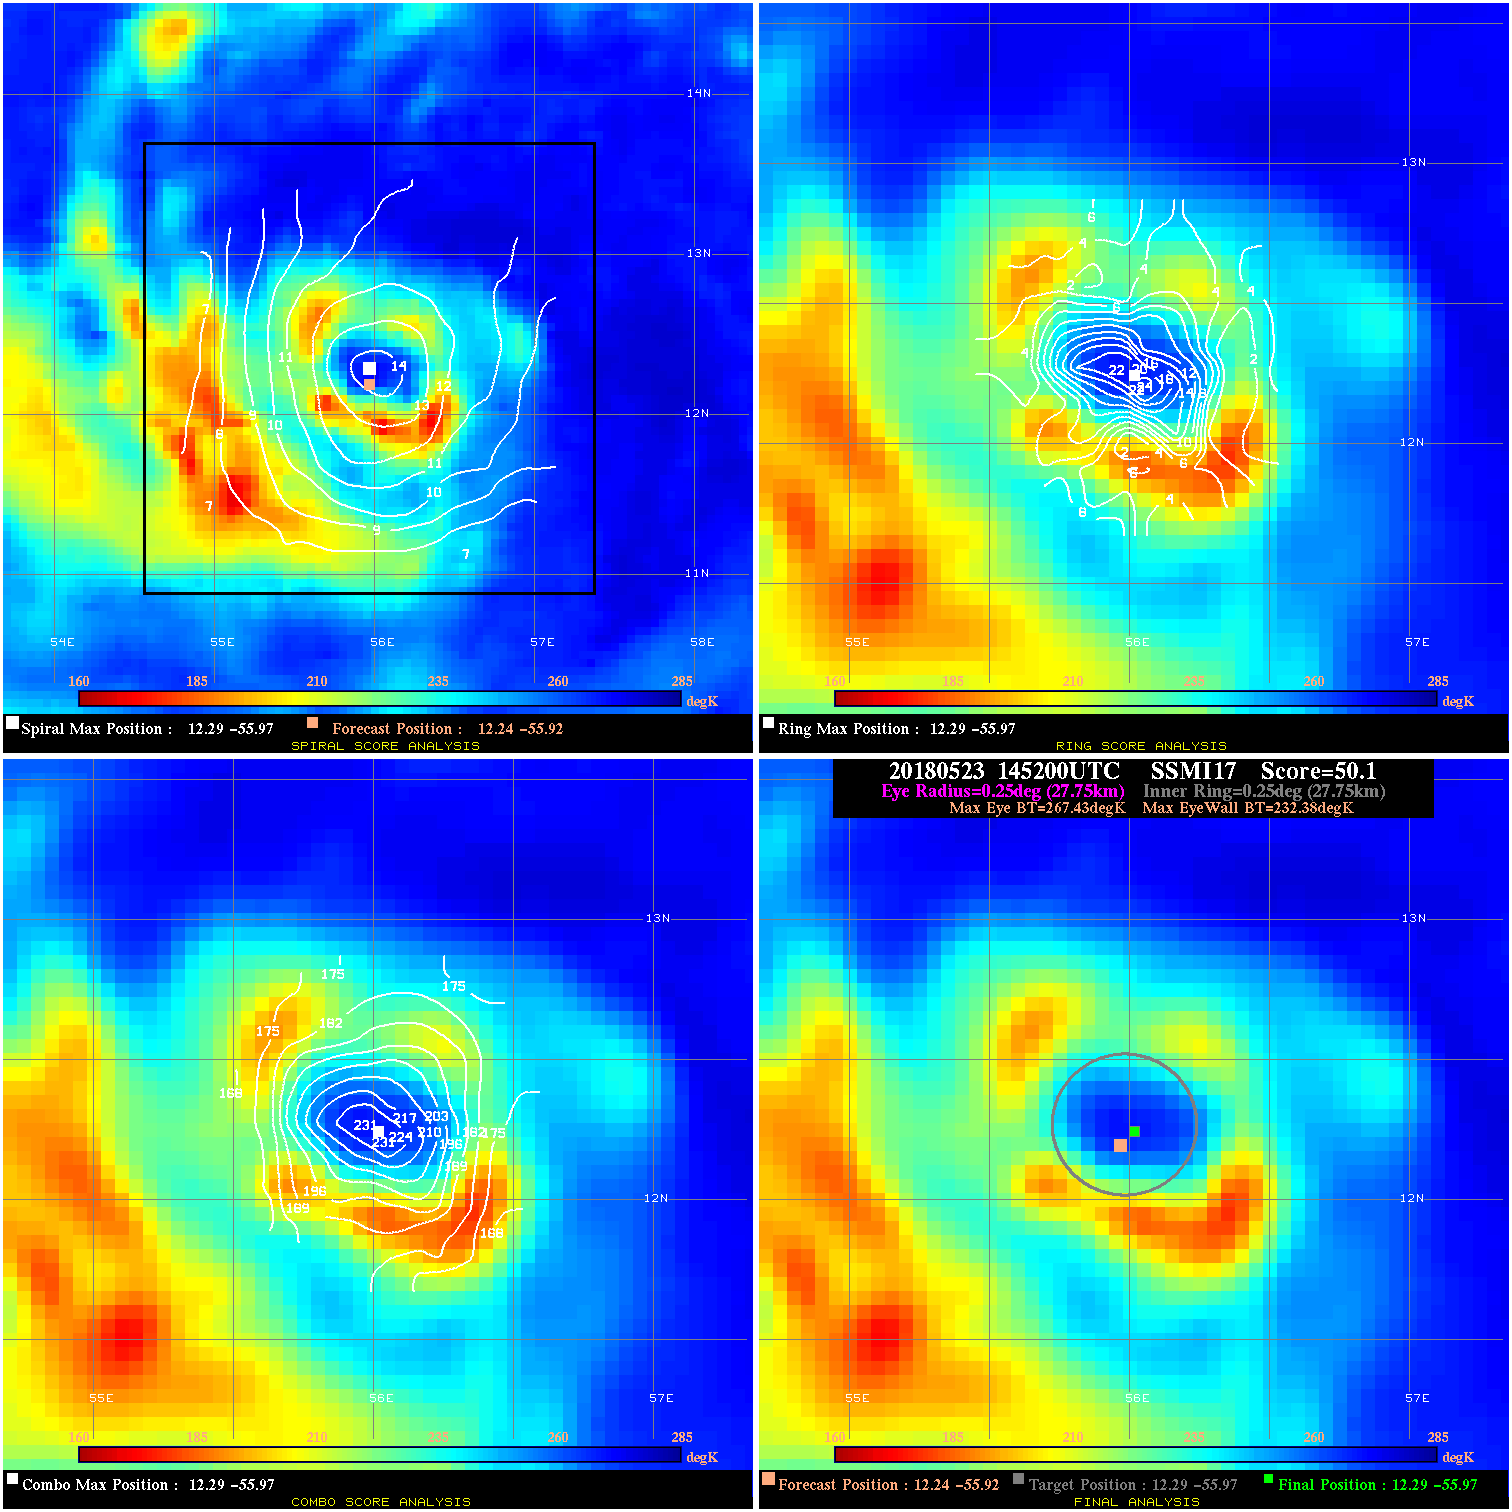
20180523 145200 50.1 >65 kts 100.0% 55.55 35.05 65.0 SSMI17 12.2 -55.9 12.3 -56.0 12.3 -56.0 Analysis Plot
20180523 220647 17.3 N/A 42.5% 44.44 17.29 65.0 AMSR2 13.0 -55.7 12.8 -55.6 12.8 -55.6 Analysis Plot
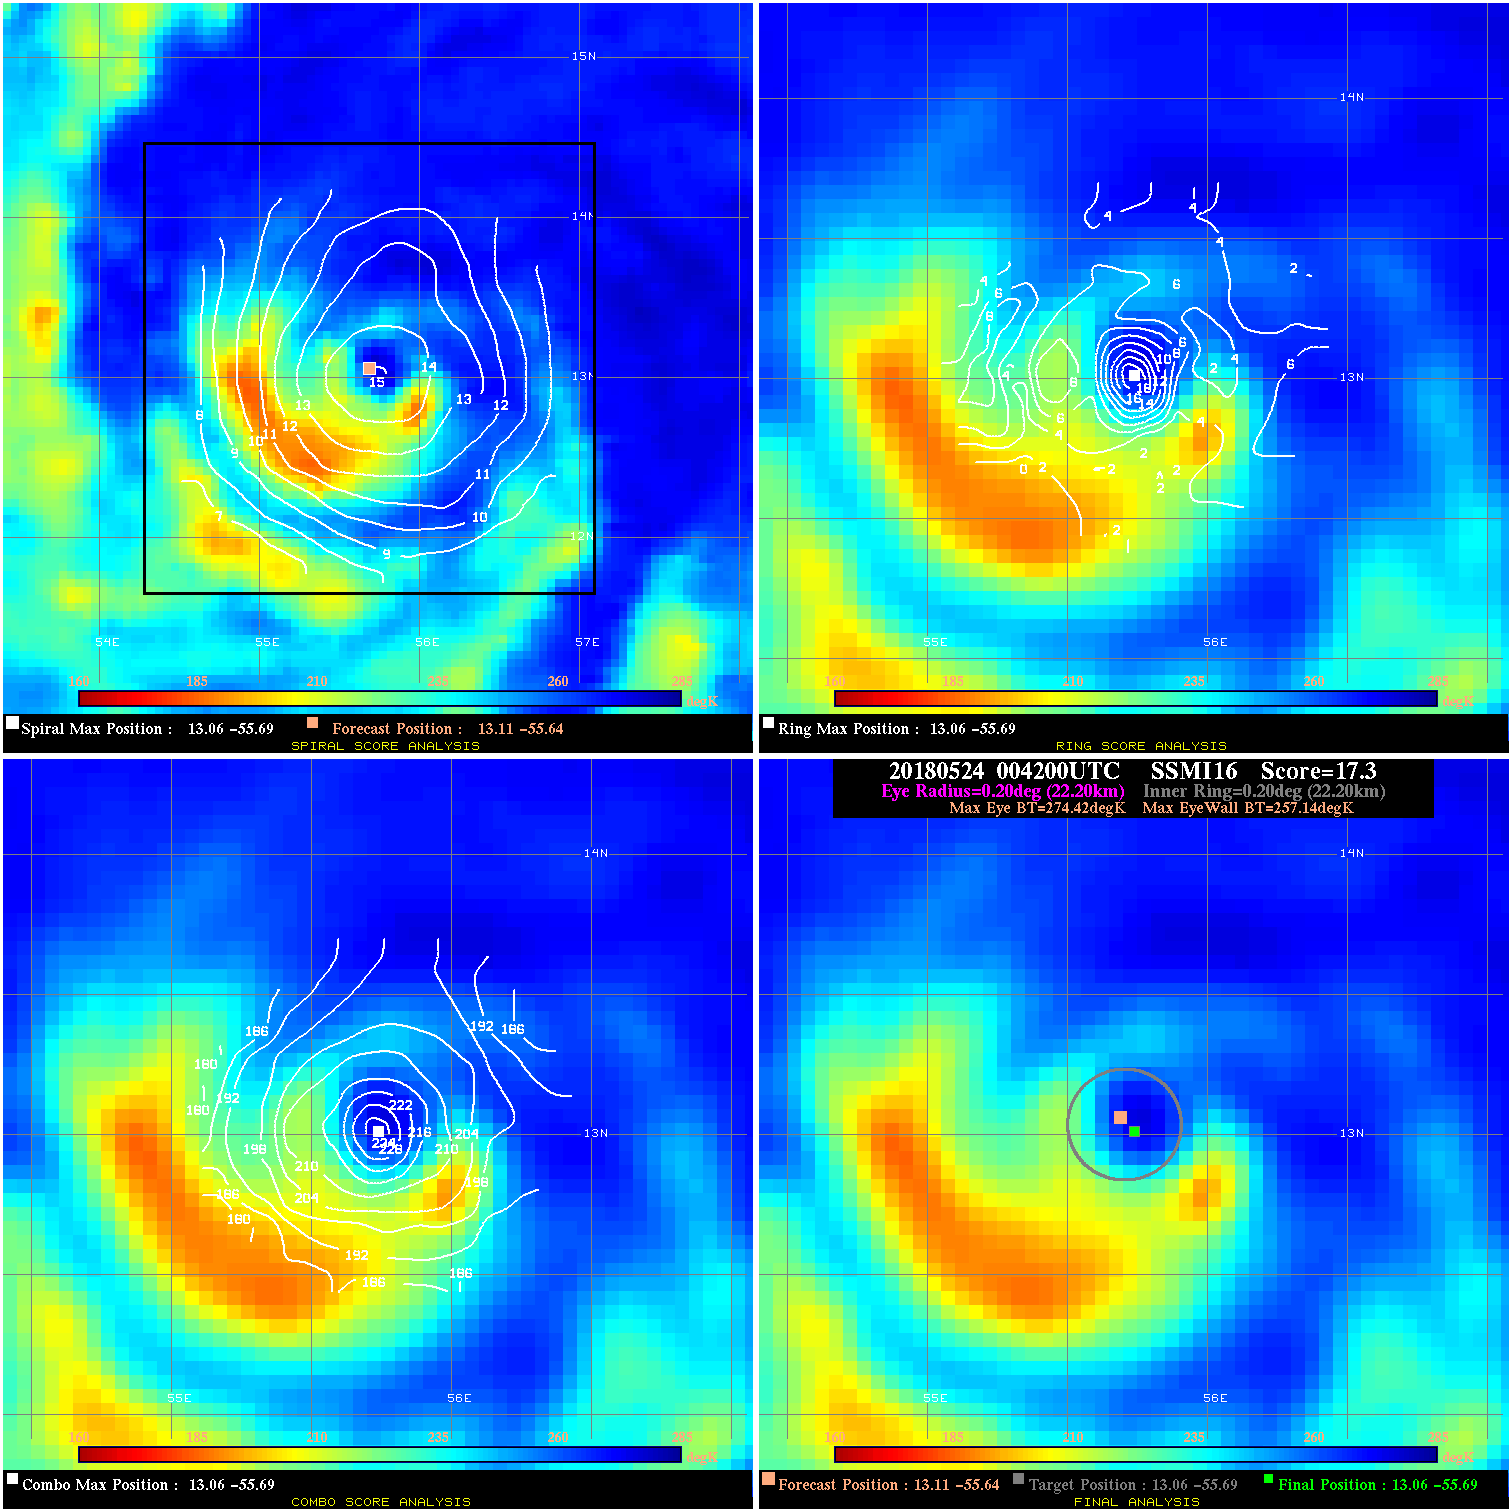
20180524 004200 17.3 N/A 60.3% 44.44 17.28 75.0 SSMI16 13.1 -55.6 13.1 -55.7 13.1 -55.7 Analysis Plot
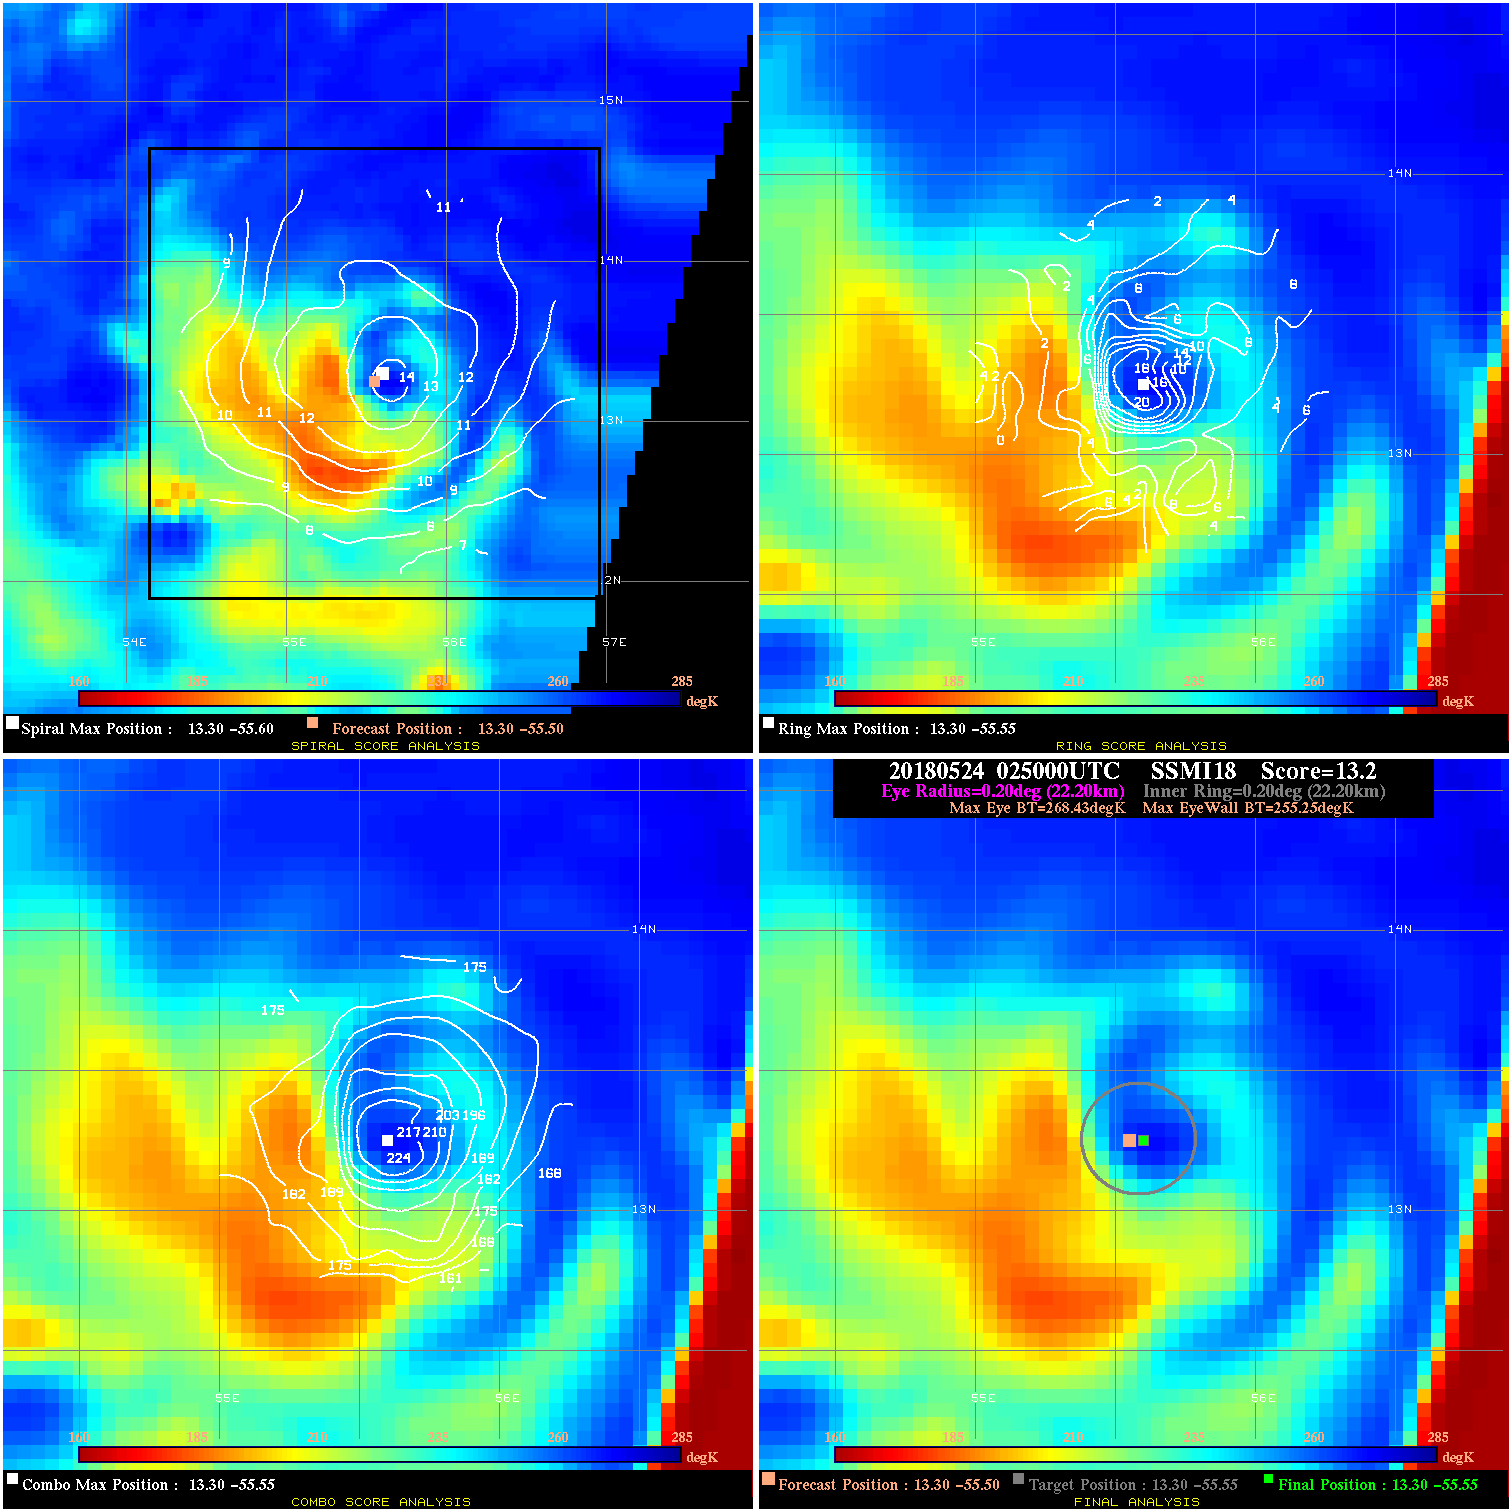
20180524 025000 13.2 N/A 54.8% 44.44 13.18 80.0 SSMI18 13.3 -55.5 13.3 -55.5 13.3 -55.5 Analysis Plot
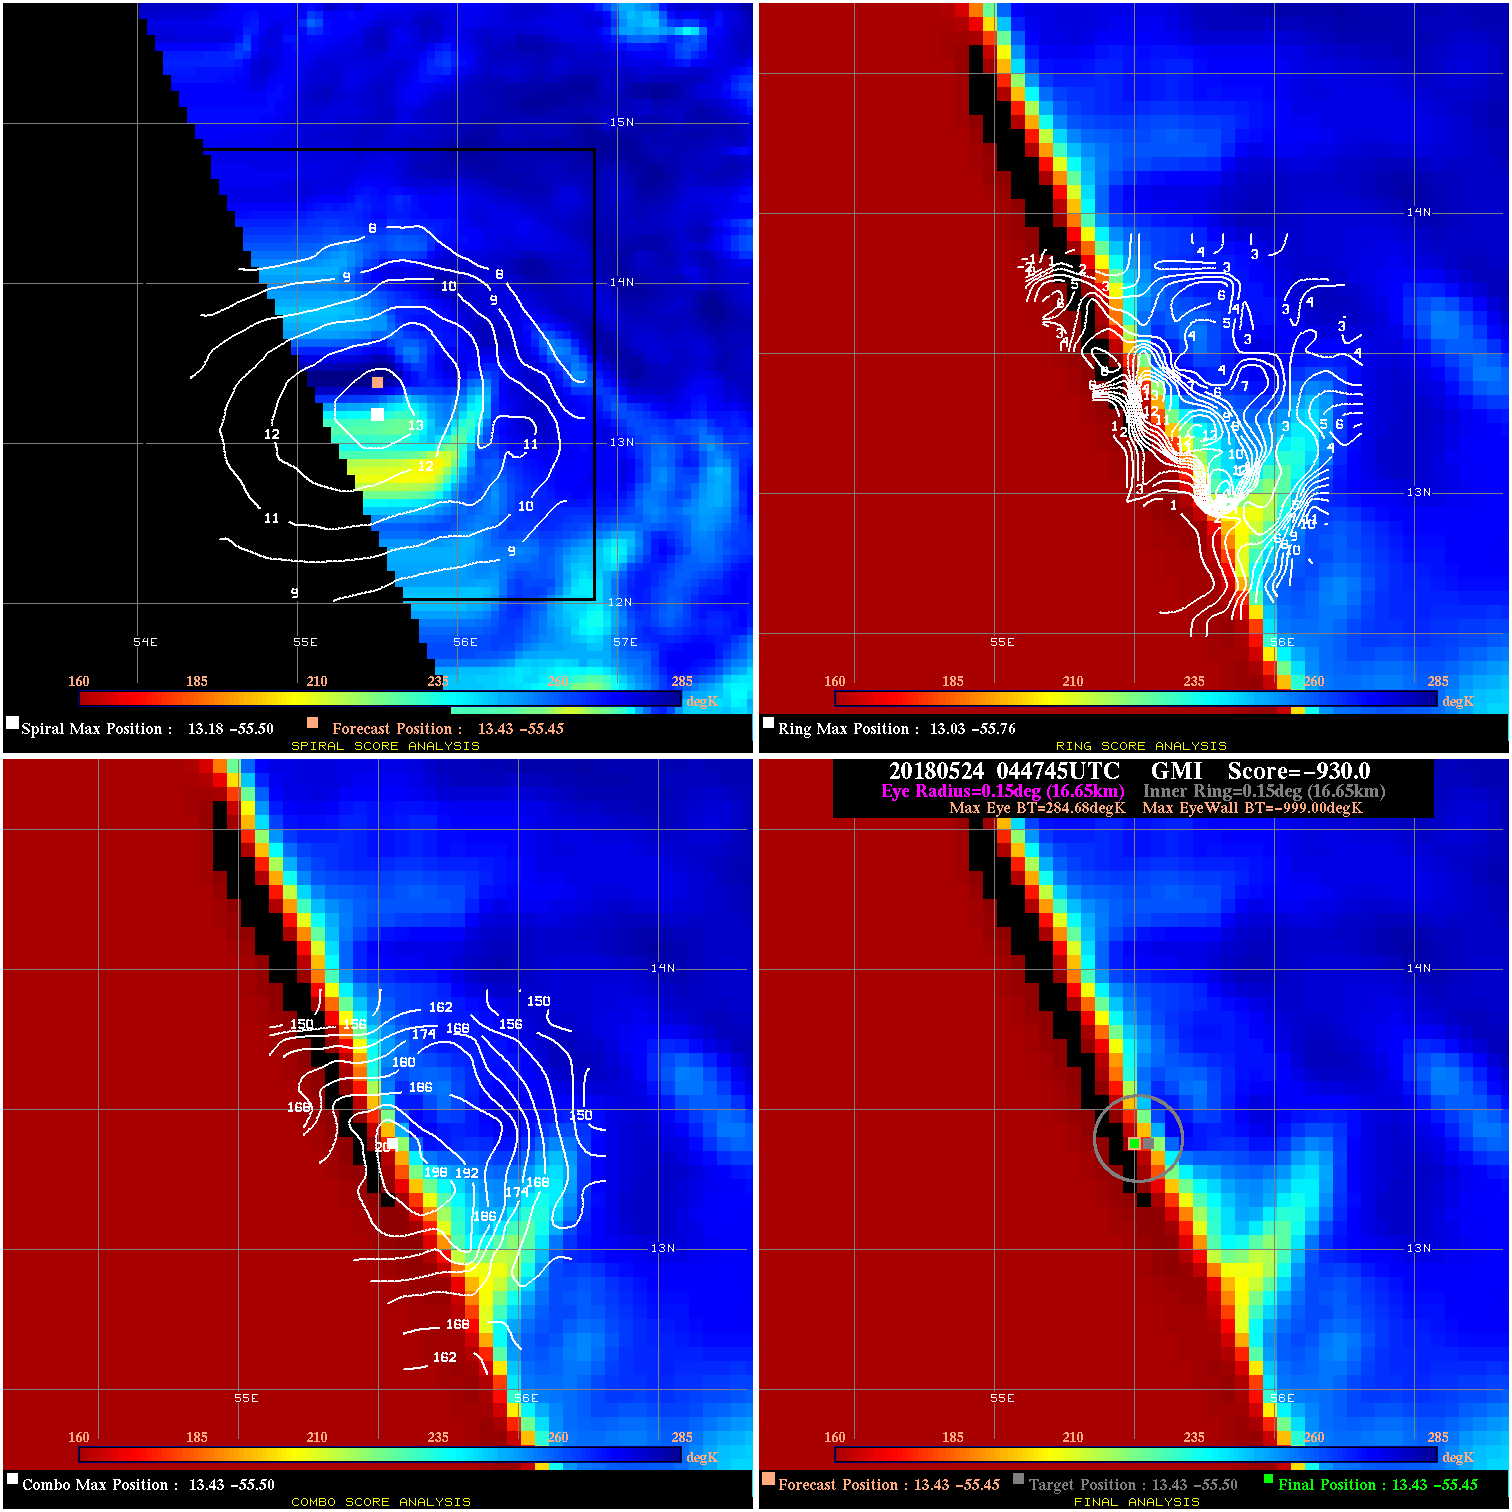
20180524 044745 -930.0 N/A N/A N/A 0.00 80.0 GMI 13.4 -55.5 13.4 -55.5 13.4 -55.5 Analysis Plot
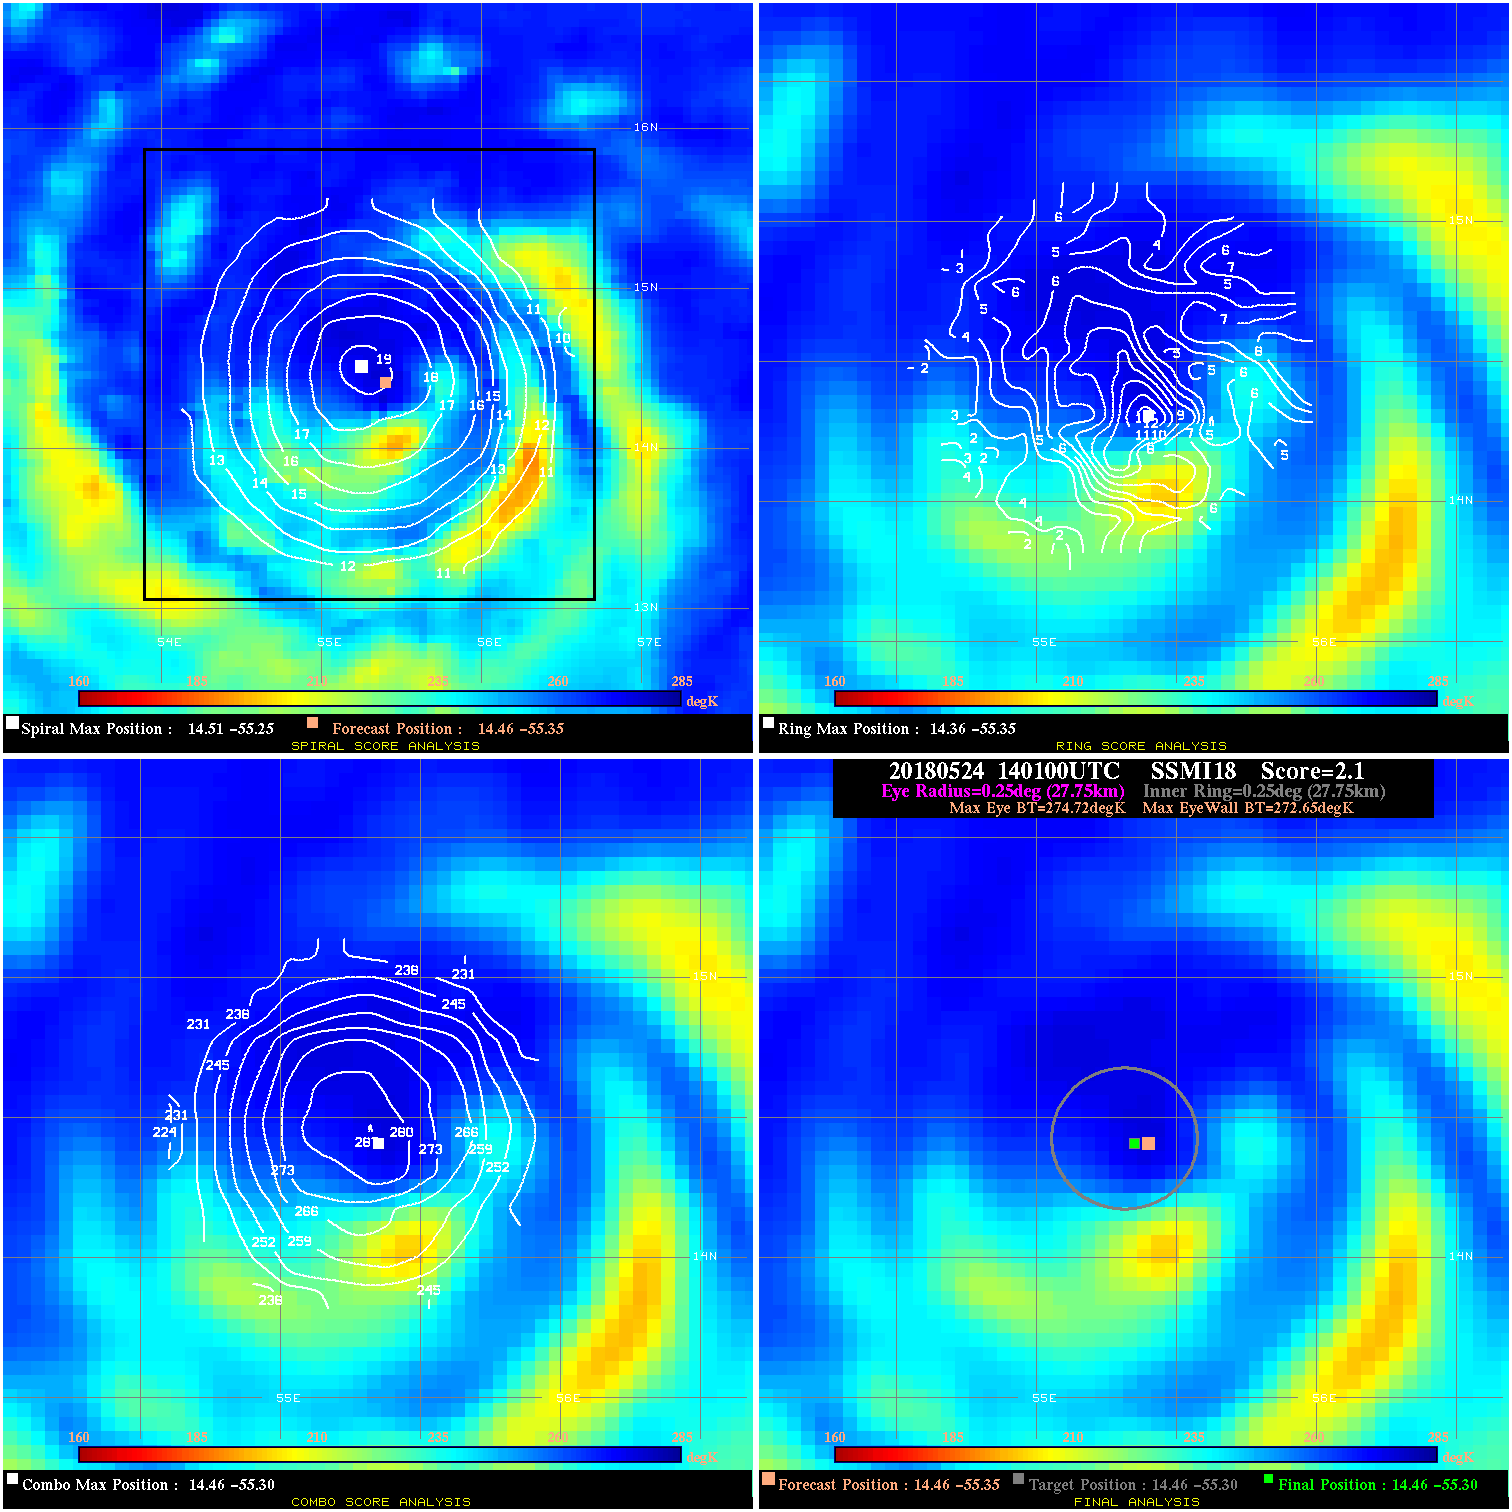
20180524 140100 2.1 N/A 15.1% 55.55 2.07 75.0 SSMI18 14.5 -55.3 14.5 -55.3 14.5 -55.3 Analysis Plot
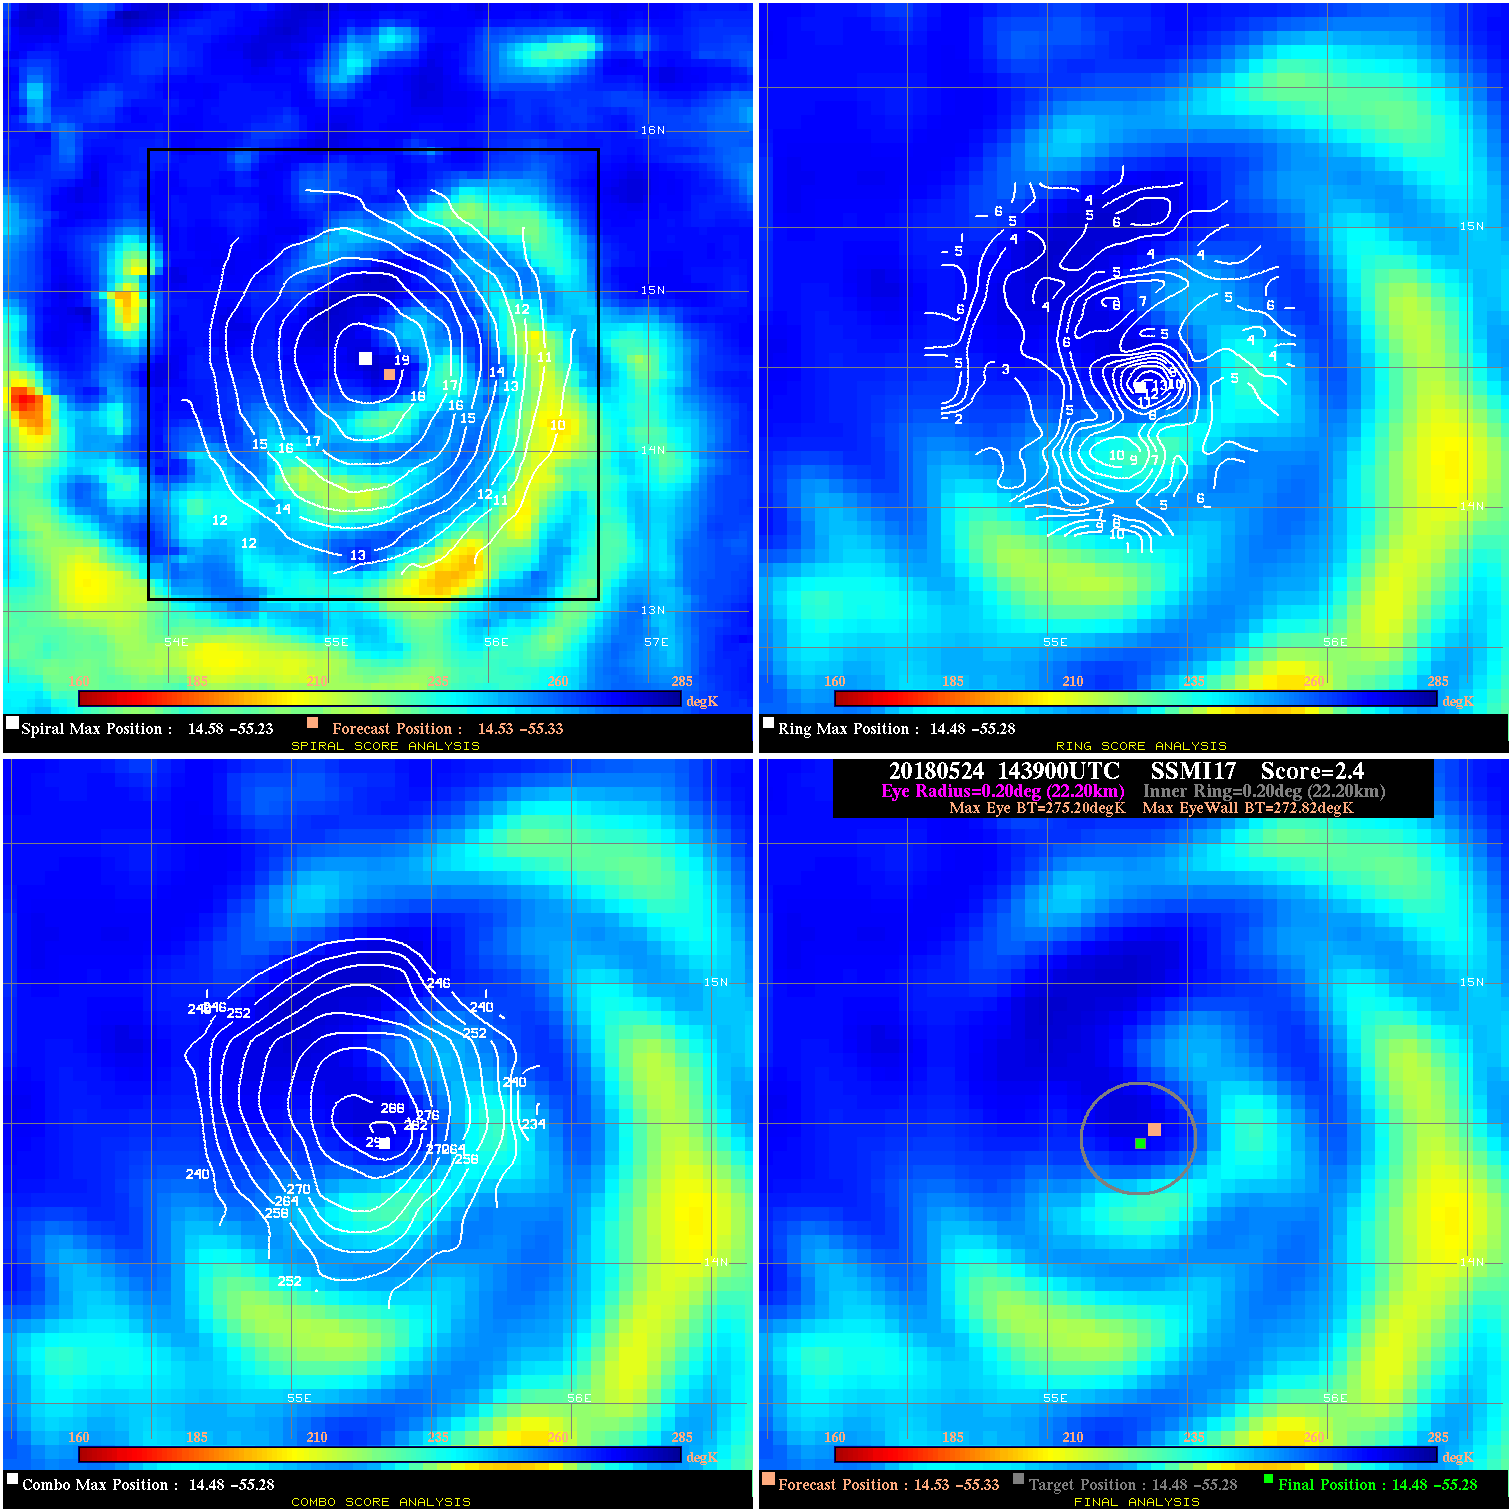
20180524 143900 2.4 N/A 16.4% 44.44 2.38 75.0 SSMI17 14.5 -55.3 14.5 -55.3 14.5 -55.3 Analysis Plot
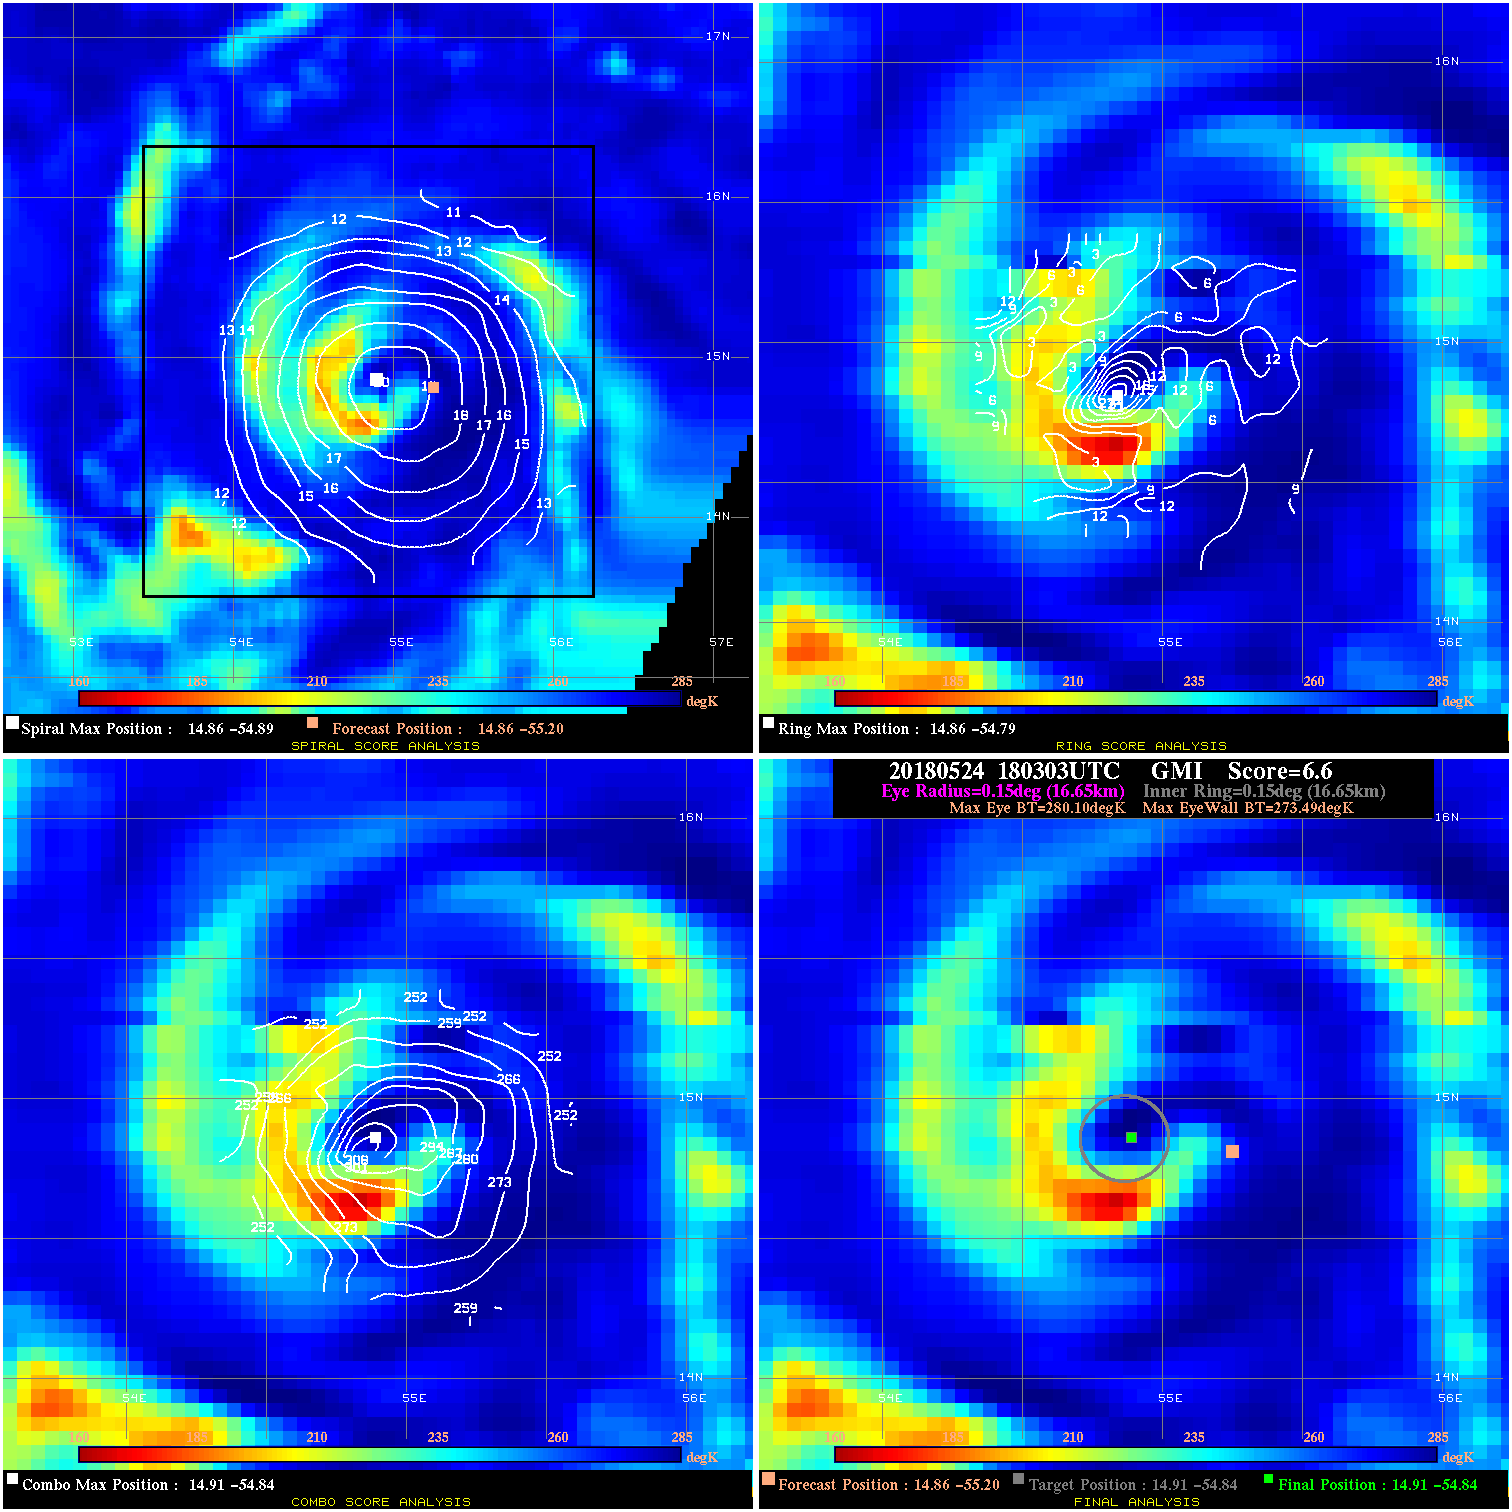
20180524 180303 6.6 N/A 1.4% 33.33 6.61 75.0 GMI 14.9 -55.2 14.9 -54.8 14.9 -54.8 Analysis Plot
20180525 094054 30.0 >65 kts 94.5% 22.22 14.95 90.0 AMSR2 16.0 -54.5 16.2 -54.3 16.2 -54.3 Analysis Plot
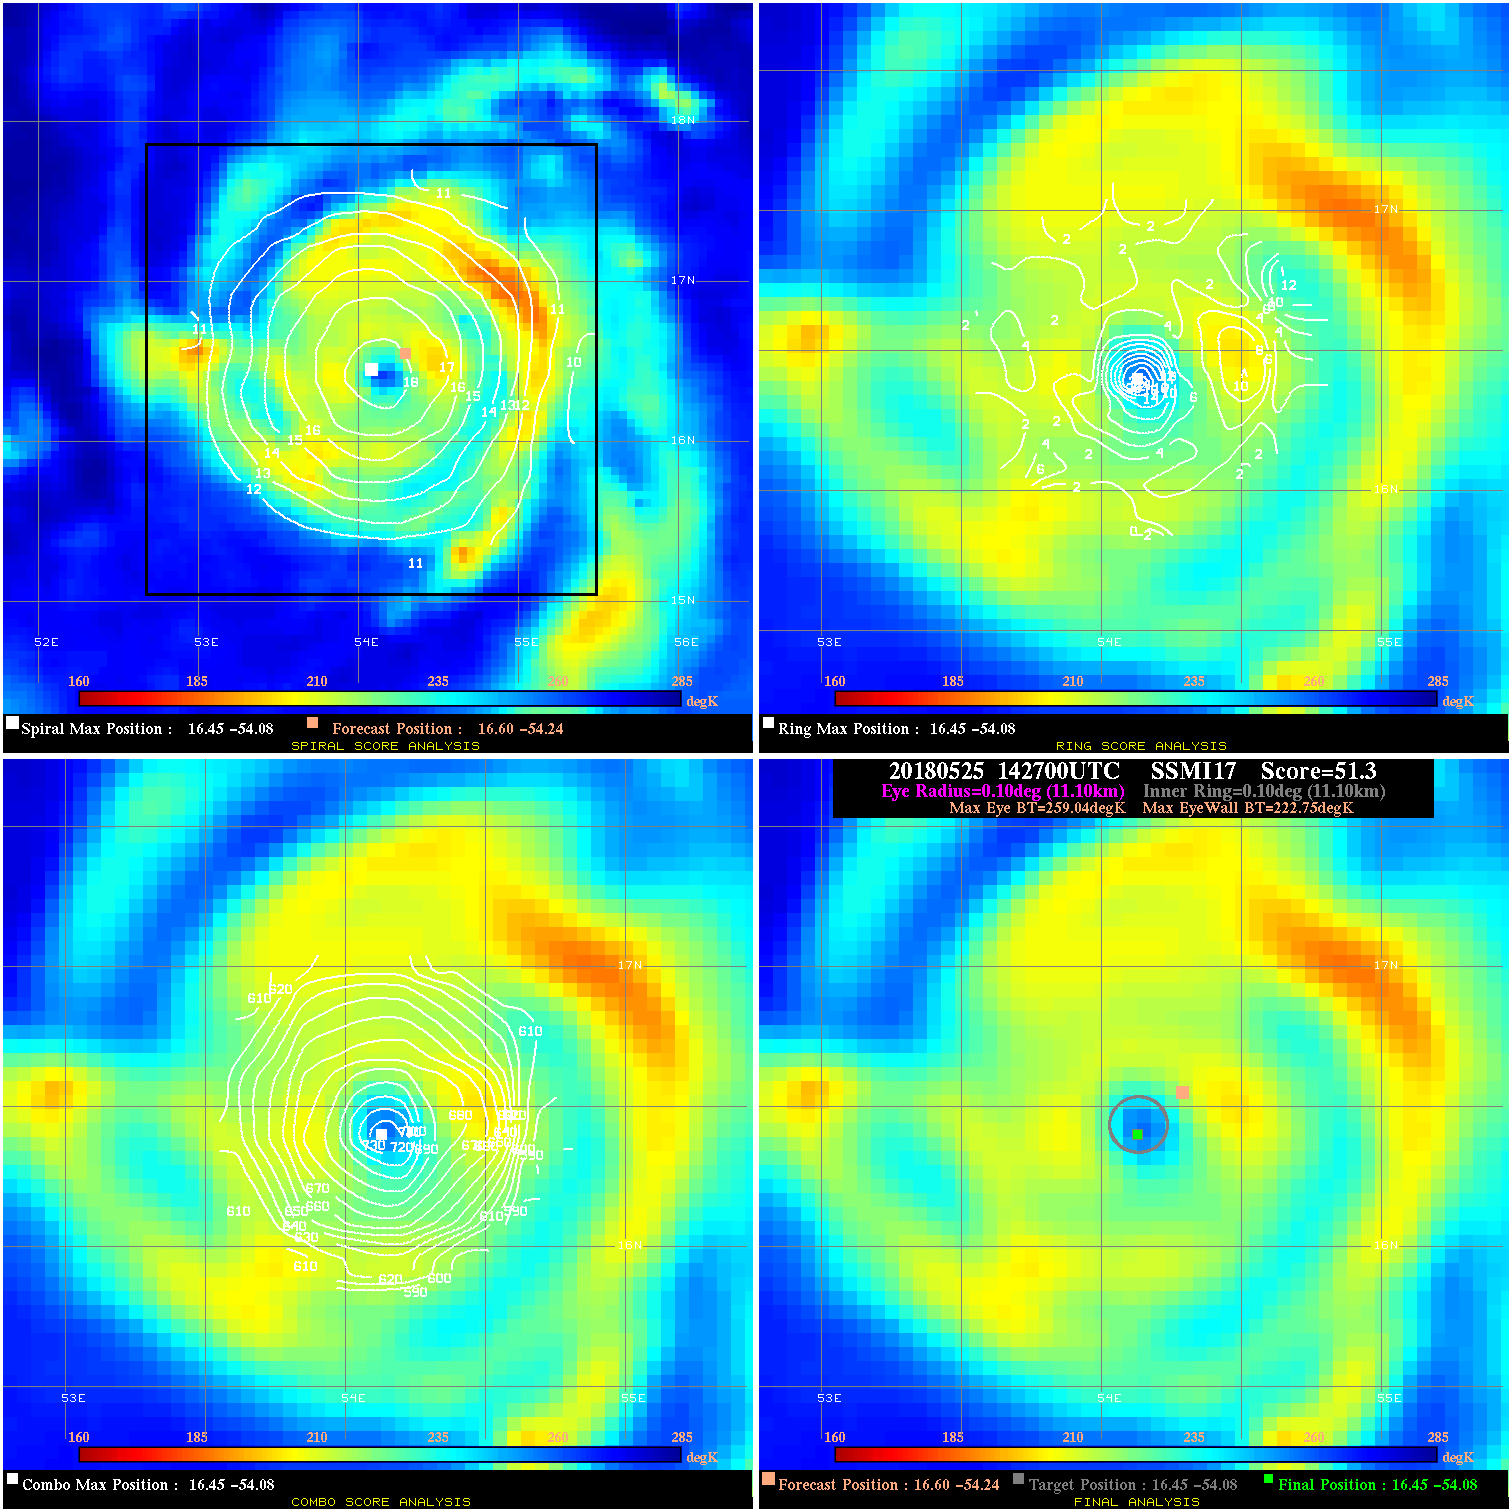
20180525 142700 51.3 >65 kts 100.0% 22.22 36.29 100.0 SSMI17 16.6 -54.2 16.5 -54.1 16.5 -54.1 Analysis Plot
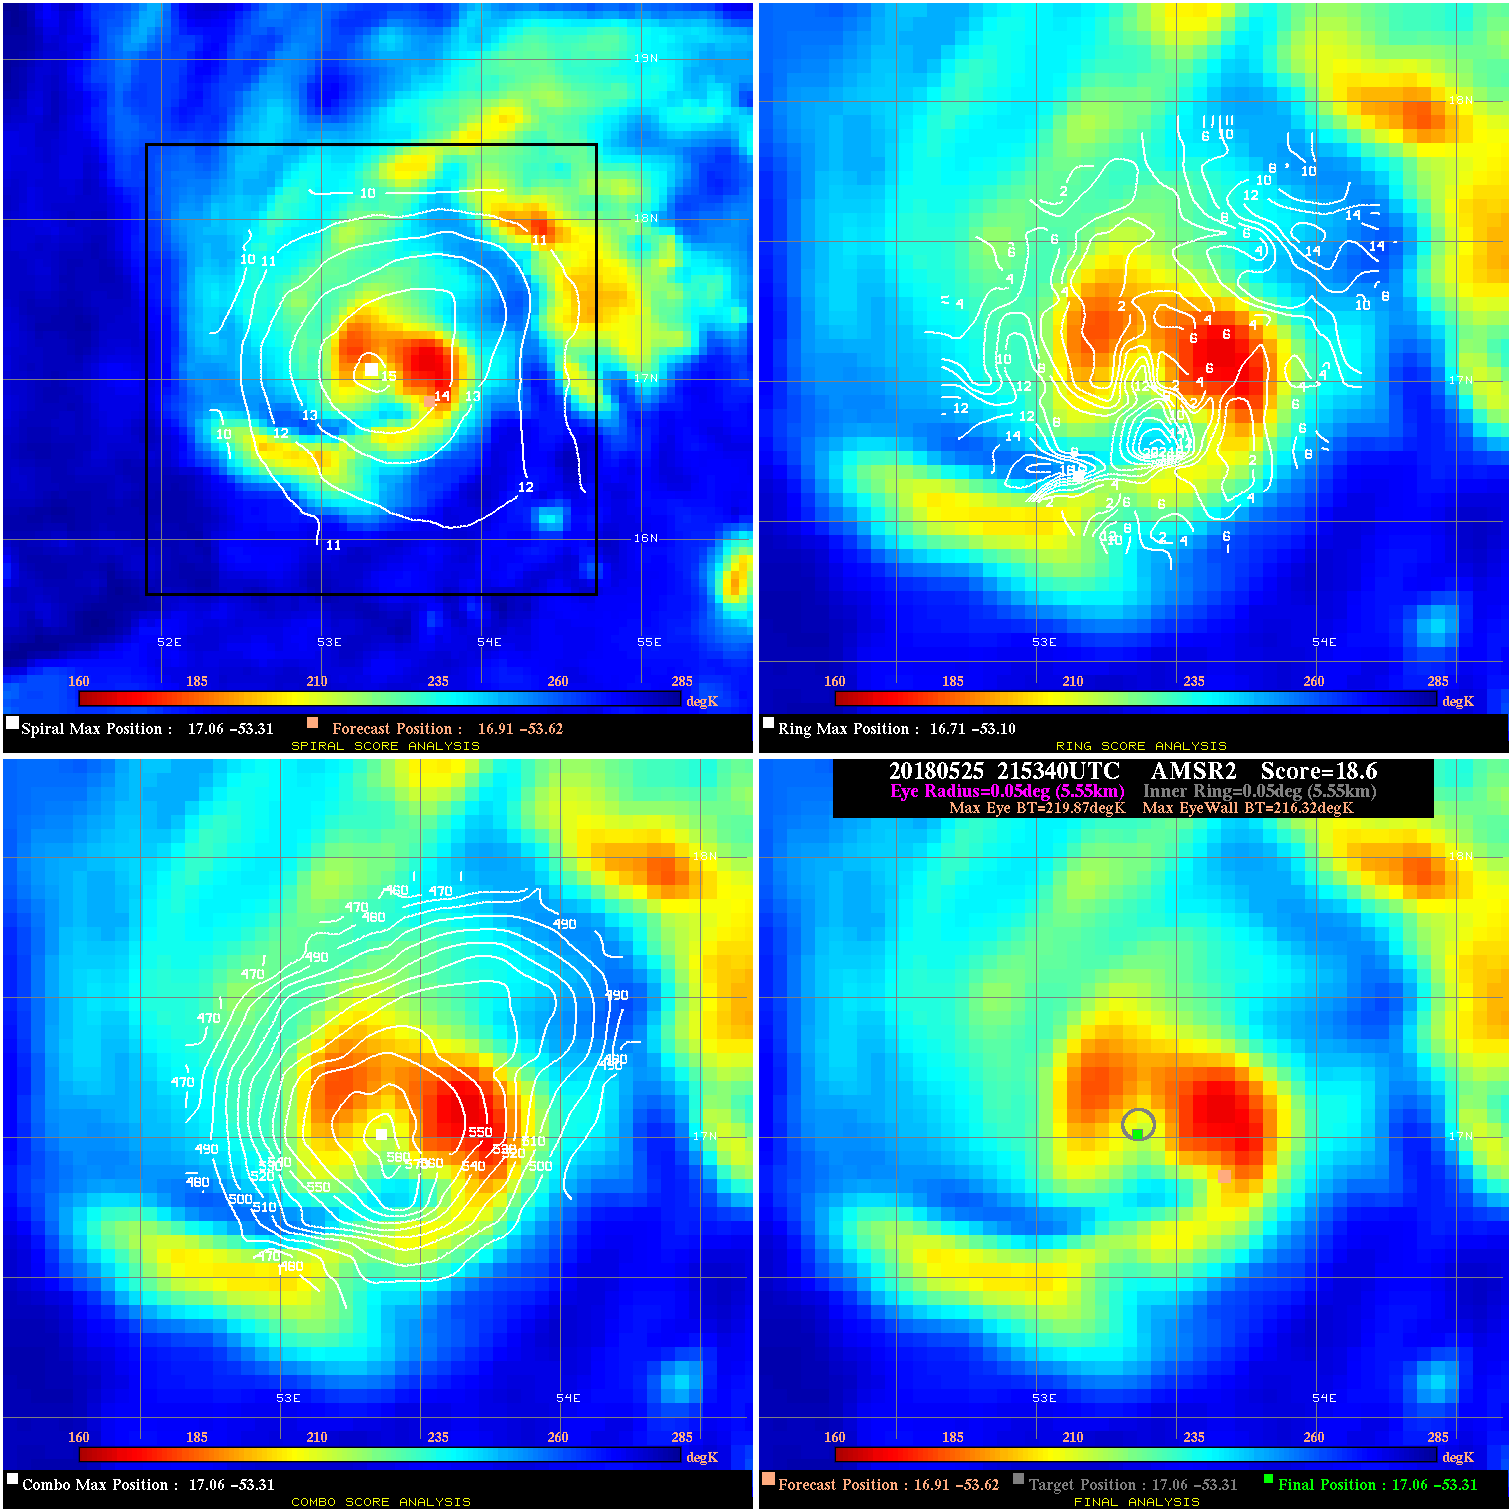
20180525 215340 18.6 N/A 100.0% 11.11 3.55 100.0 AMSR2 16.9 -53.6 17.1 -53.3 17.1 -53.3 Analysis Plot
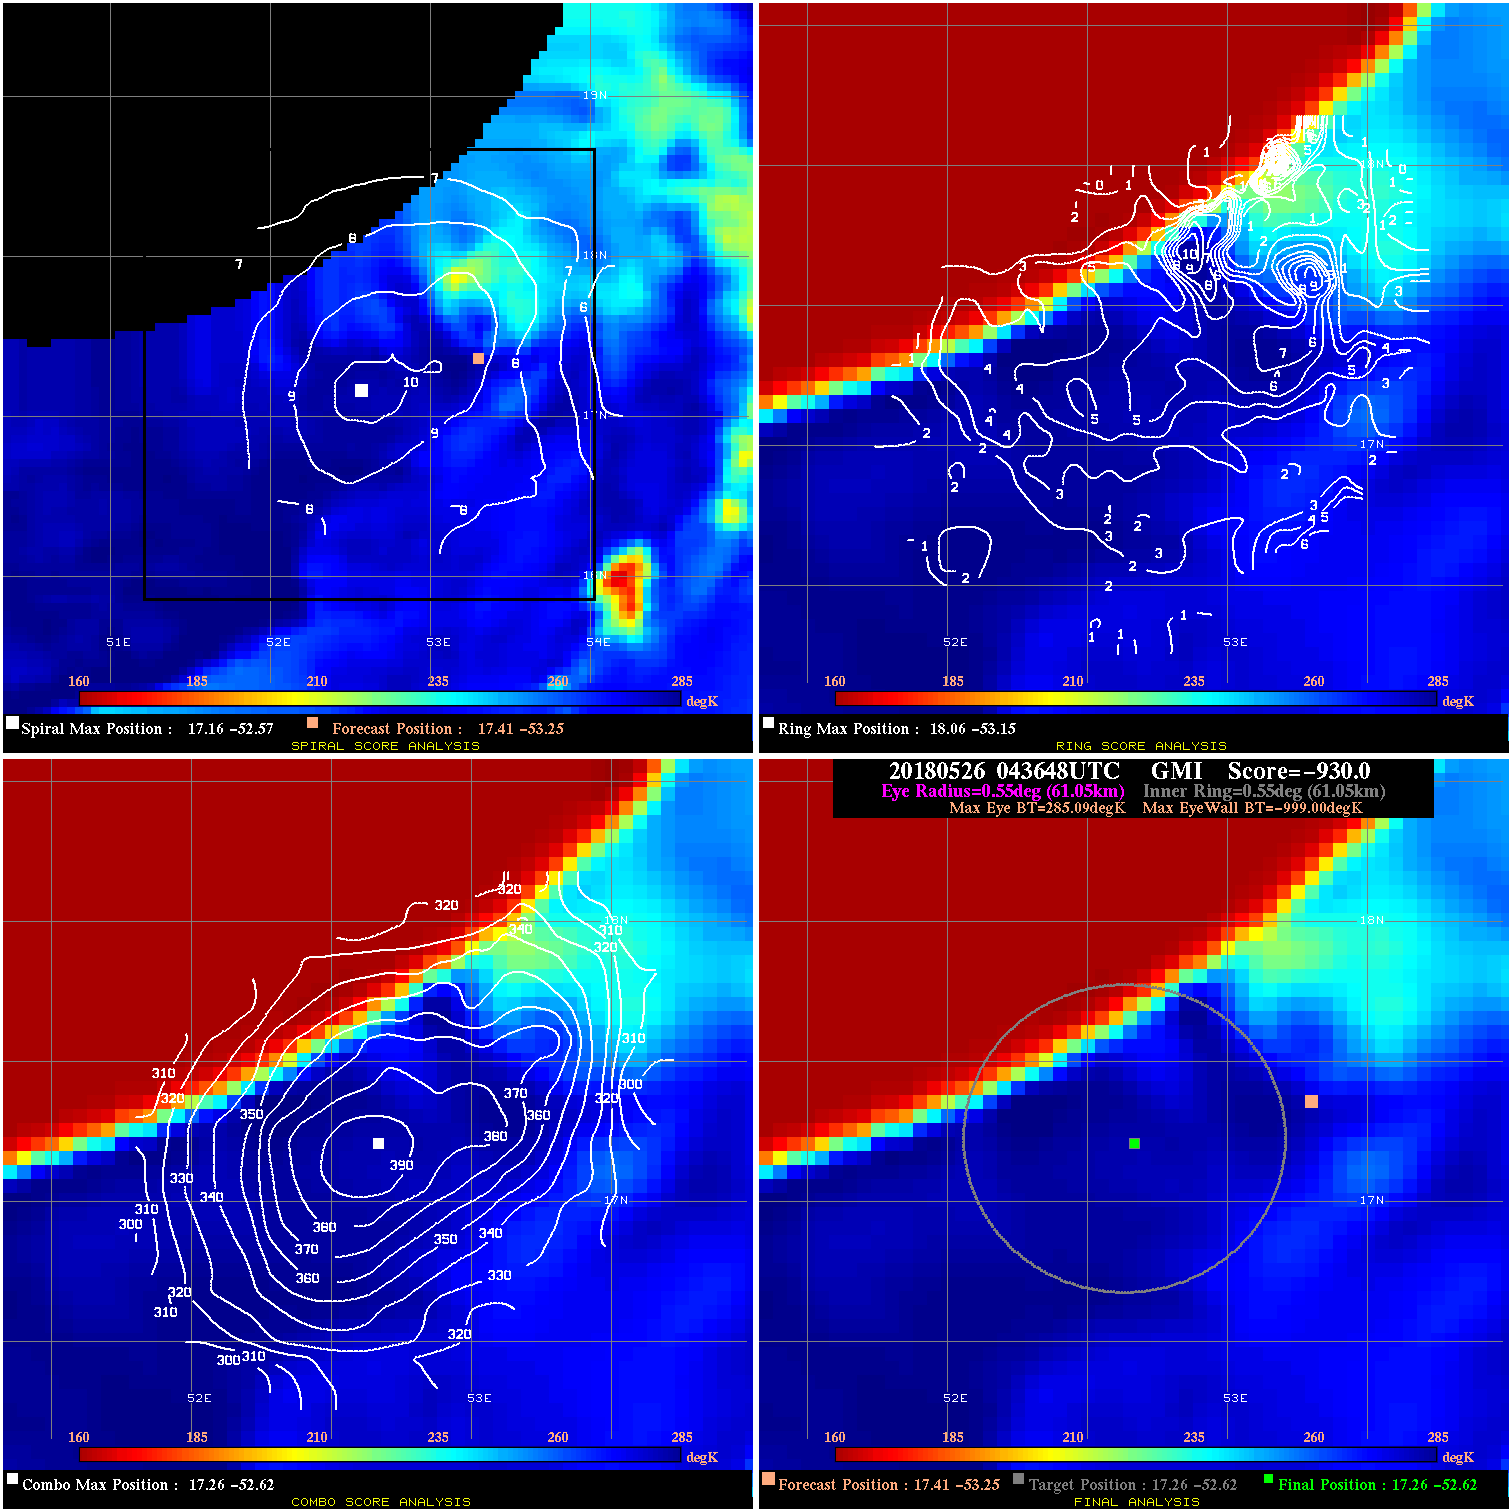
20180526 043648 -930.0 N/A N/A N/A 0.00 85.0 GMI 17.4 -53.3 17.3 -52.6 17.3 -52.6 Analysis Plot
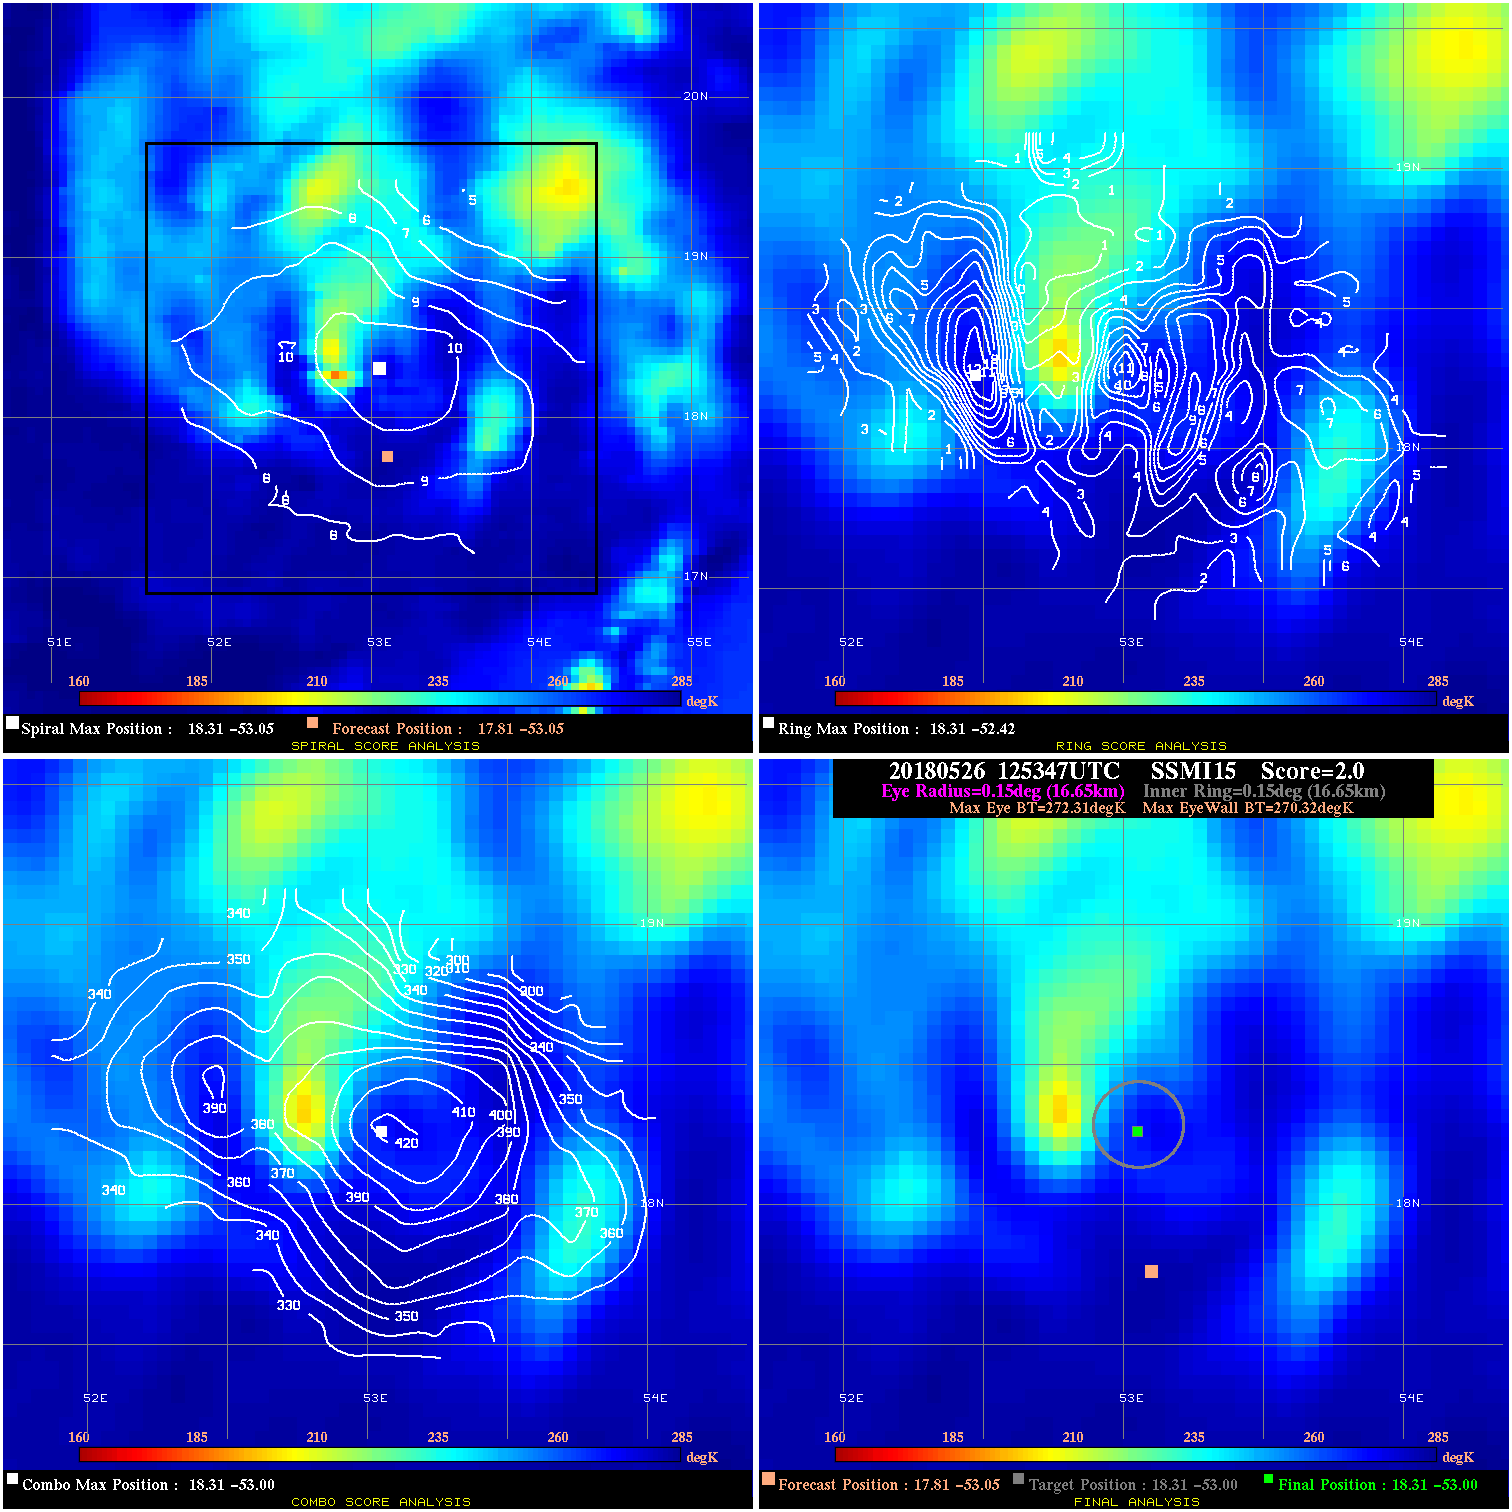
20180526 125347 2.0 N/A N/A 33.33 1.99 85.0 SSMI15 17.8 -53.0 18.3 -53.0 18.3 -53.0 Analysis Plot
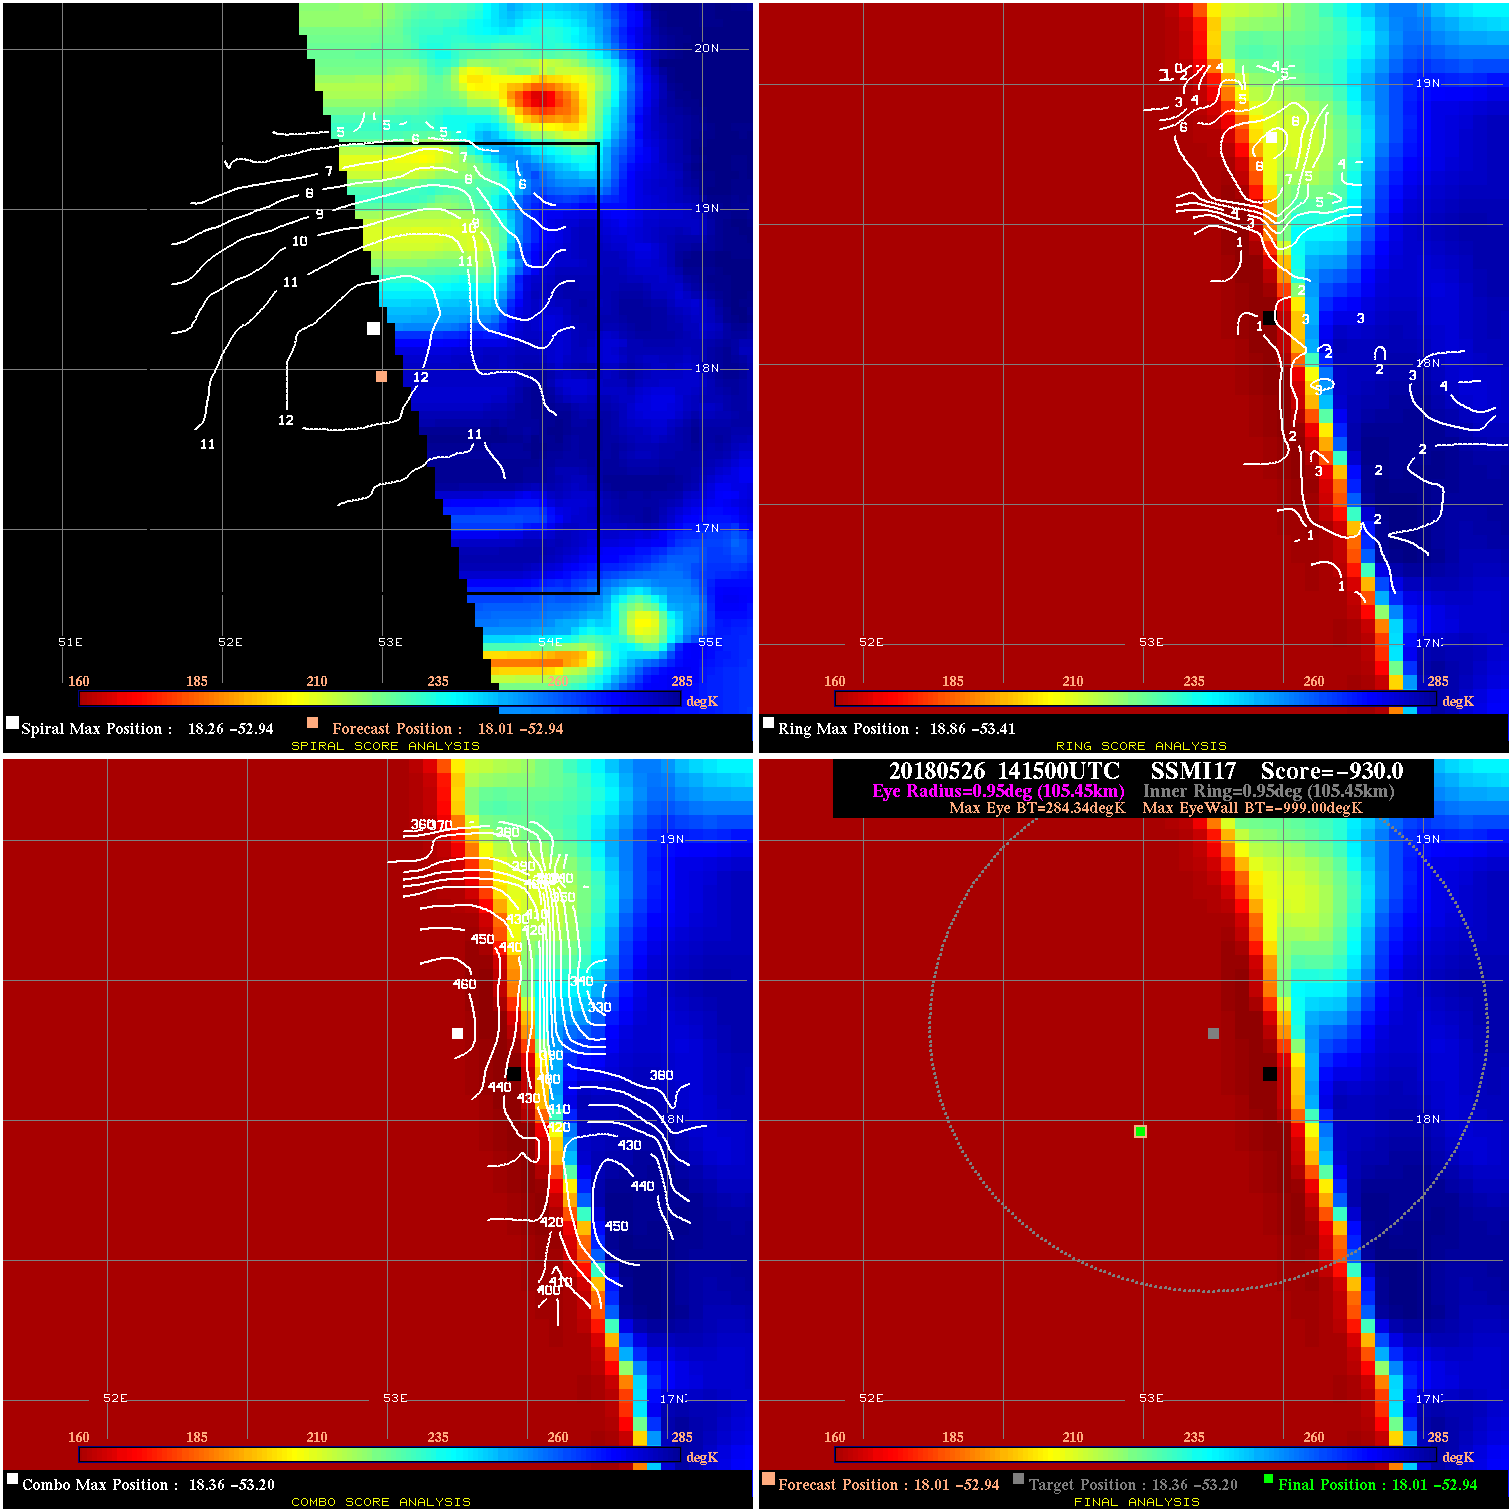
20180526 141500 -930.0 N/A N/A N/A 0.00 85.0 SSMI17 18.0 -52.9 18.0 -52.9 18.4 -53.2 Analysis Plot
|
|
Legend: - Date/Time are determined from PMW imagery at Forecast (initial guess) Lat/Lon position. - Positive/Negative Latitude = North/South Hemisphere; Longitude = Western/Eastern Hemisphere. - "Ring Diam" value indicates the estimated surface eyewall diameter in km (the MI eyewall edge diameter minus 10 km). - "Ring Pct" is the percentage of the "ring" (eyewall inner boundary) that is 1) colder than the "hot spot" (warmest eye pixel) in the eye by 20K, or 2) the percentage that is a) colder than 232K and b) colder than the "hot spot" by 10K, whichever is greater. - Values are red if Ring % <= 65, yellow/brown if Ring % <= 85 and green if Ring % > 85. - "Tb diff" is the difference between the "hot spot" (warmest eye pixel) and the warmest pixel on the eyewall. - Intensity score are listed as negative, and not used, when the JTWC or NHC estimated Vmax is <55 kts in order to rule out weak but highly symmetric TCs. - Error messages in intensity scores: -920 is used when the hottest pixel in the eye is <200K, to prevent false positives; -930 means <85% of eyewall has observations/data. |