Tropical Storm 11S
|
Passive Microwave (PMW) Intensity Information Advanced Dvorak Technique (ADT) Version 8.2.1 |
Overpass Inten Ring Ring Wind Forecast Final Target
Date Time Score Meaning Pct Diam BTdiff Est Sat Lat Lon Lat Lon Lat Lon
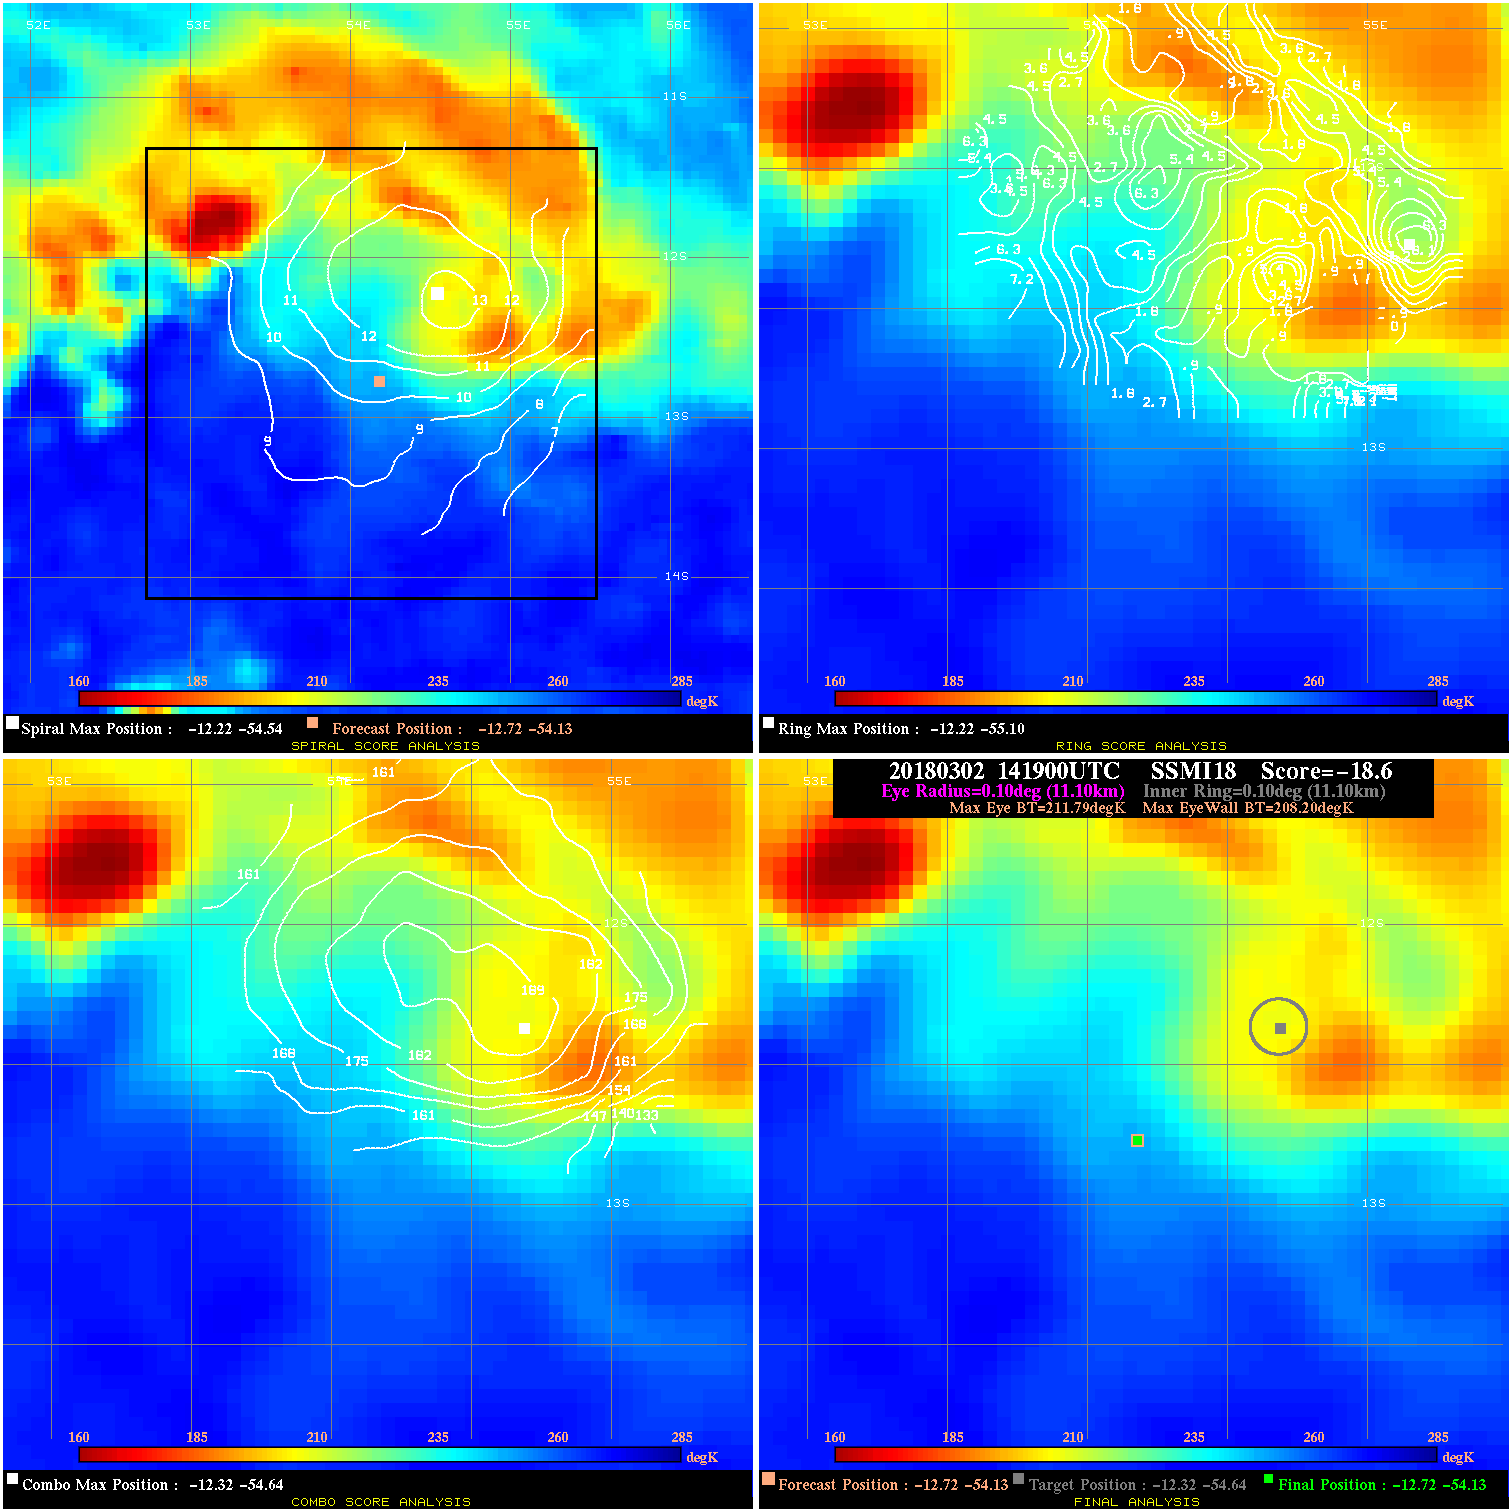
20180302 141900 -18.6 N/A 100.0% 22.22 3.59 35.0 SSMI18 -12.7 -54.1 -12.7 -54.1 -12.3 -54.6 Analysis Plot
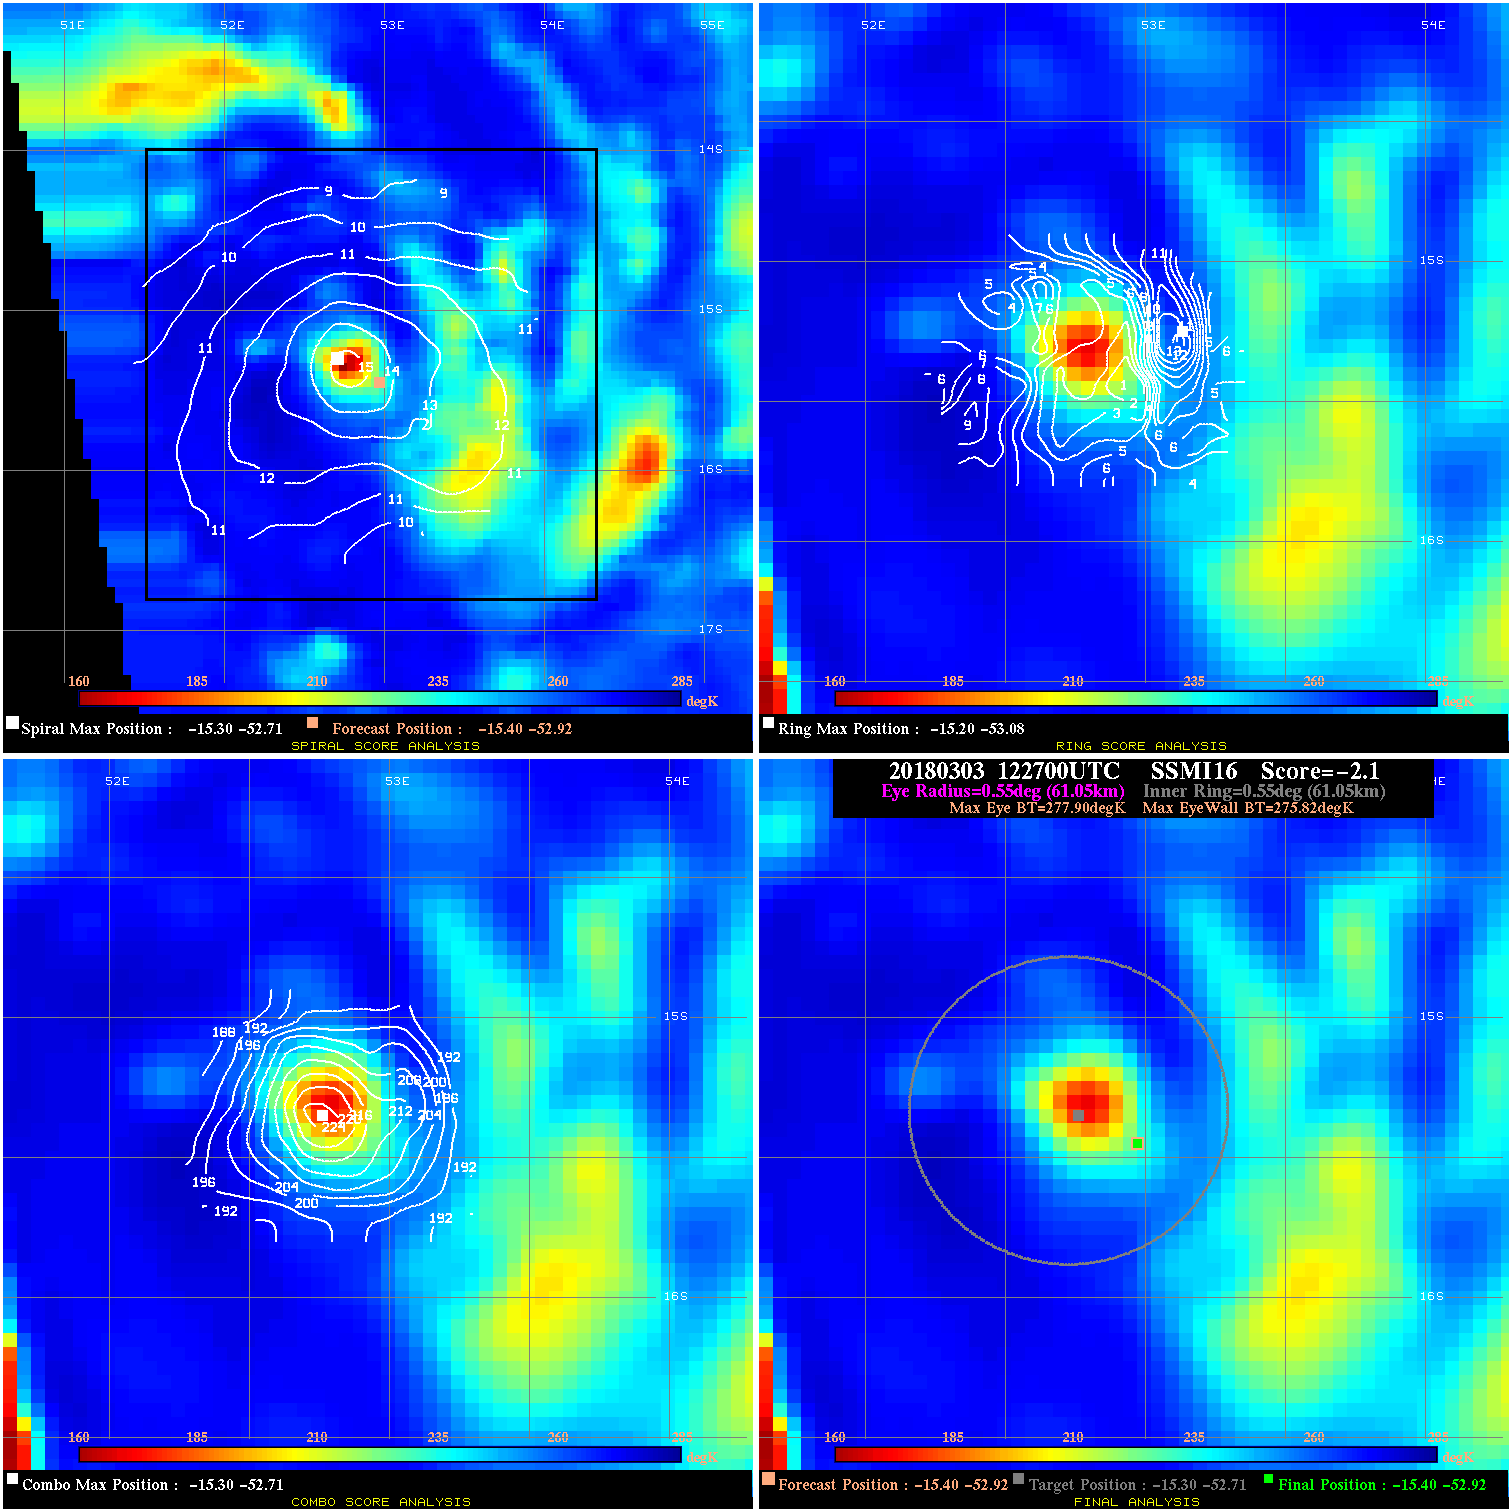
20180303 122700 -2.1 N/A 8.2% 122.21 2.08 45.0 SSMI16 -15.4 -52.9 -15.4 -52.9 -15.3 -52.7 Analysis Plot
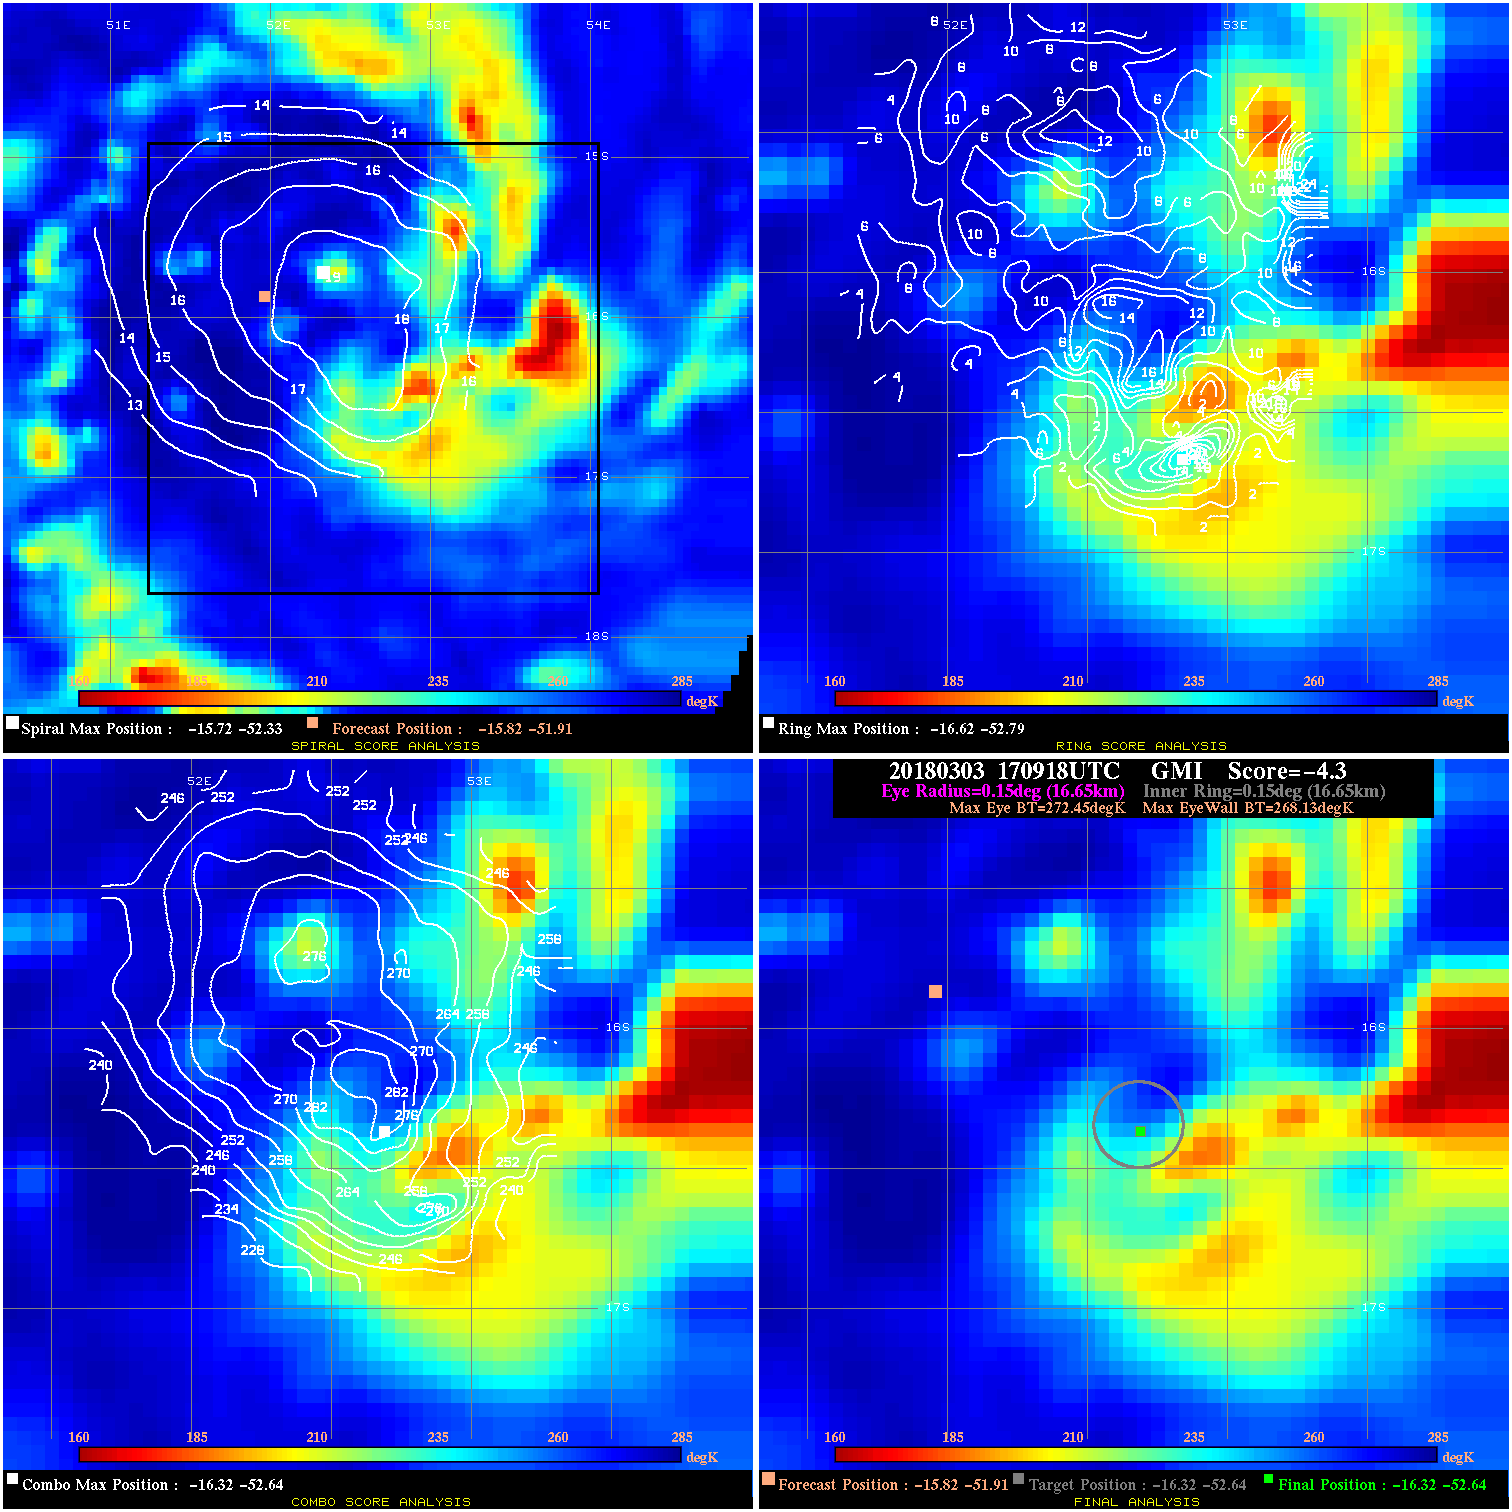
20180303 170918 -4.3 N/A 53.4% 33.33 4.32 45.0 GMI -15.8 -51.9 -16.3 -52.6 -16.3 -52.6 Analysis Plot
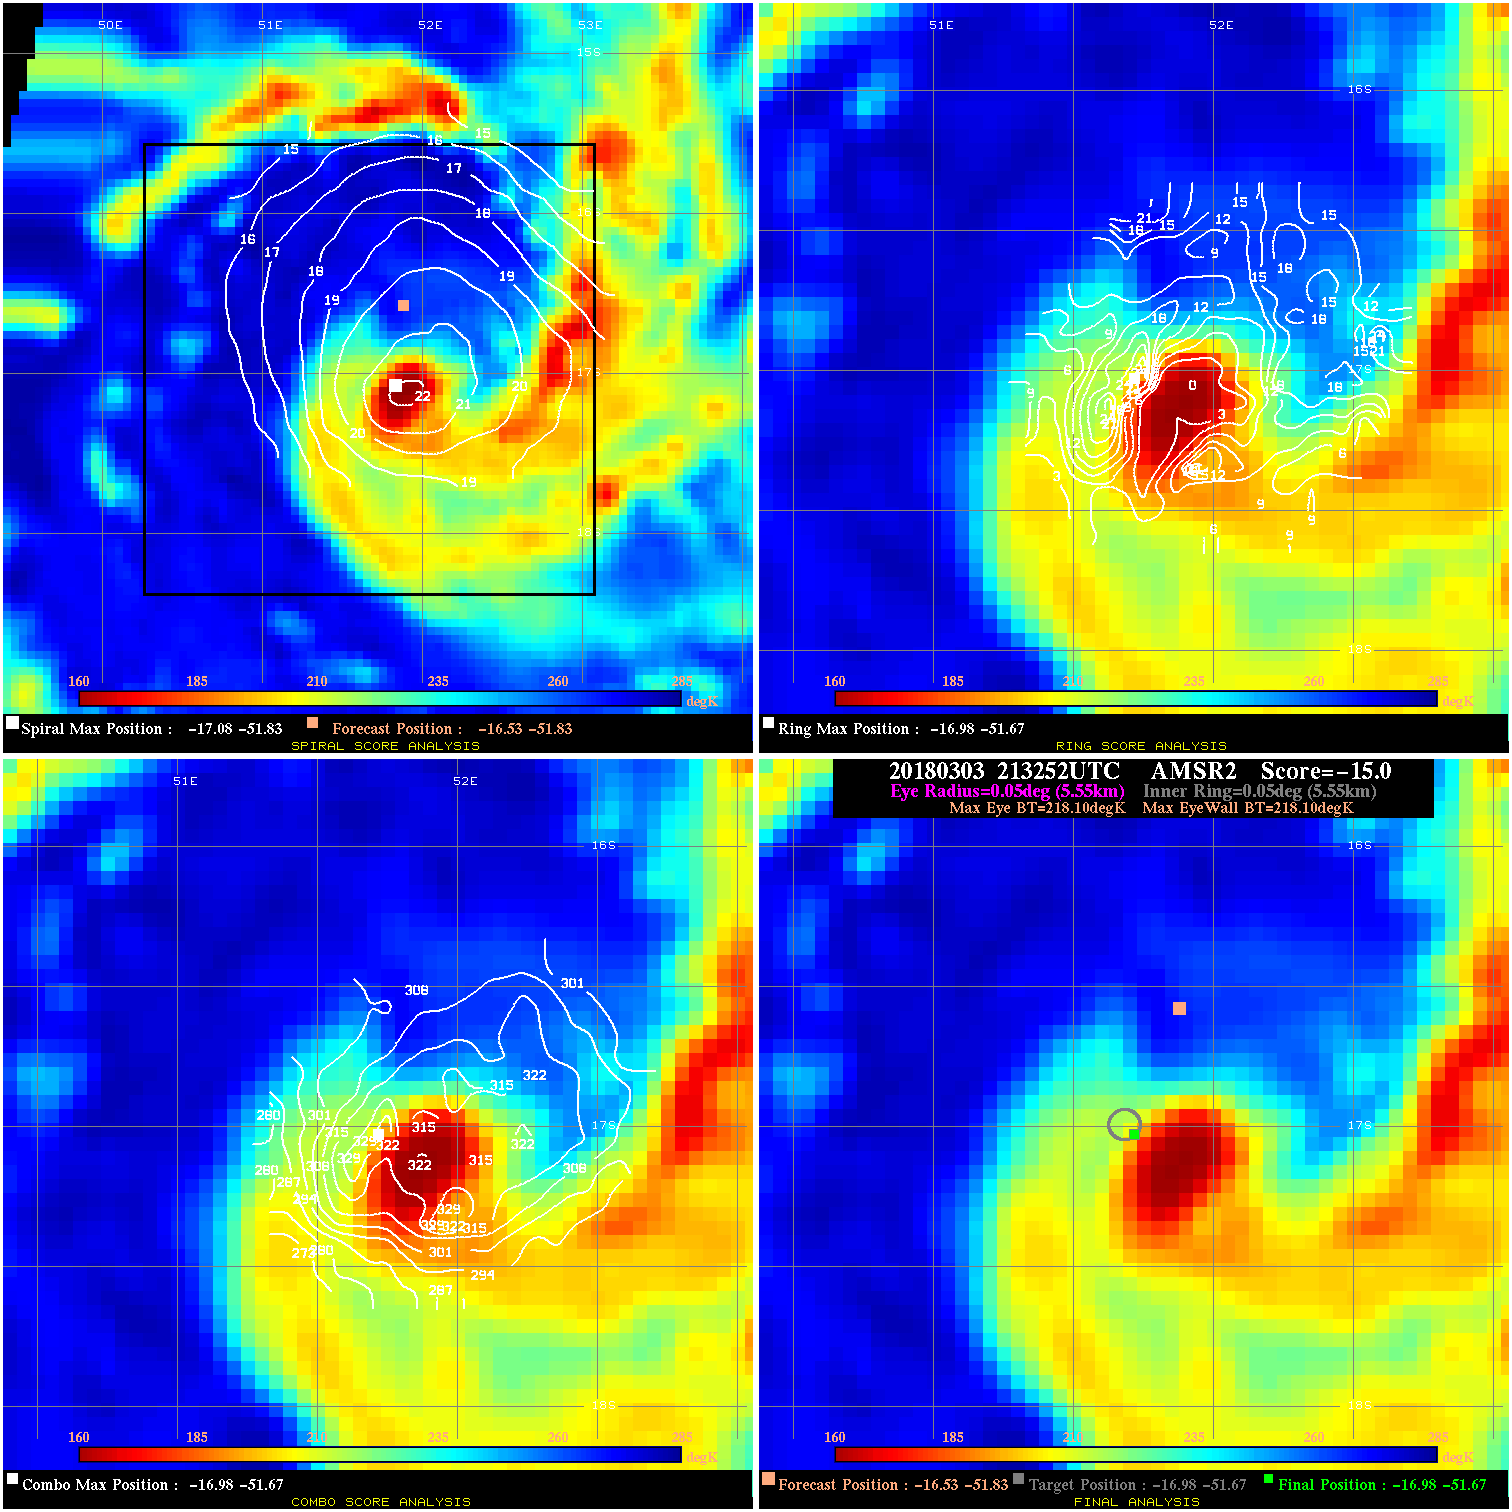
20180303 213252 -0.0 N/A N/A N/A 0.00 50.0 AMSR2 -16.5 -51.8 -17.0 -51.7 -17.0 -51.7 Analysis Plot
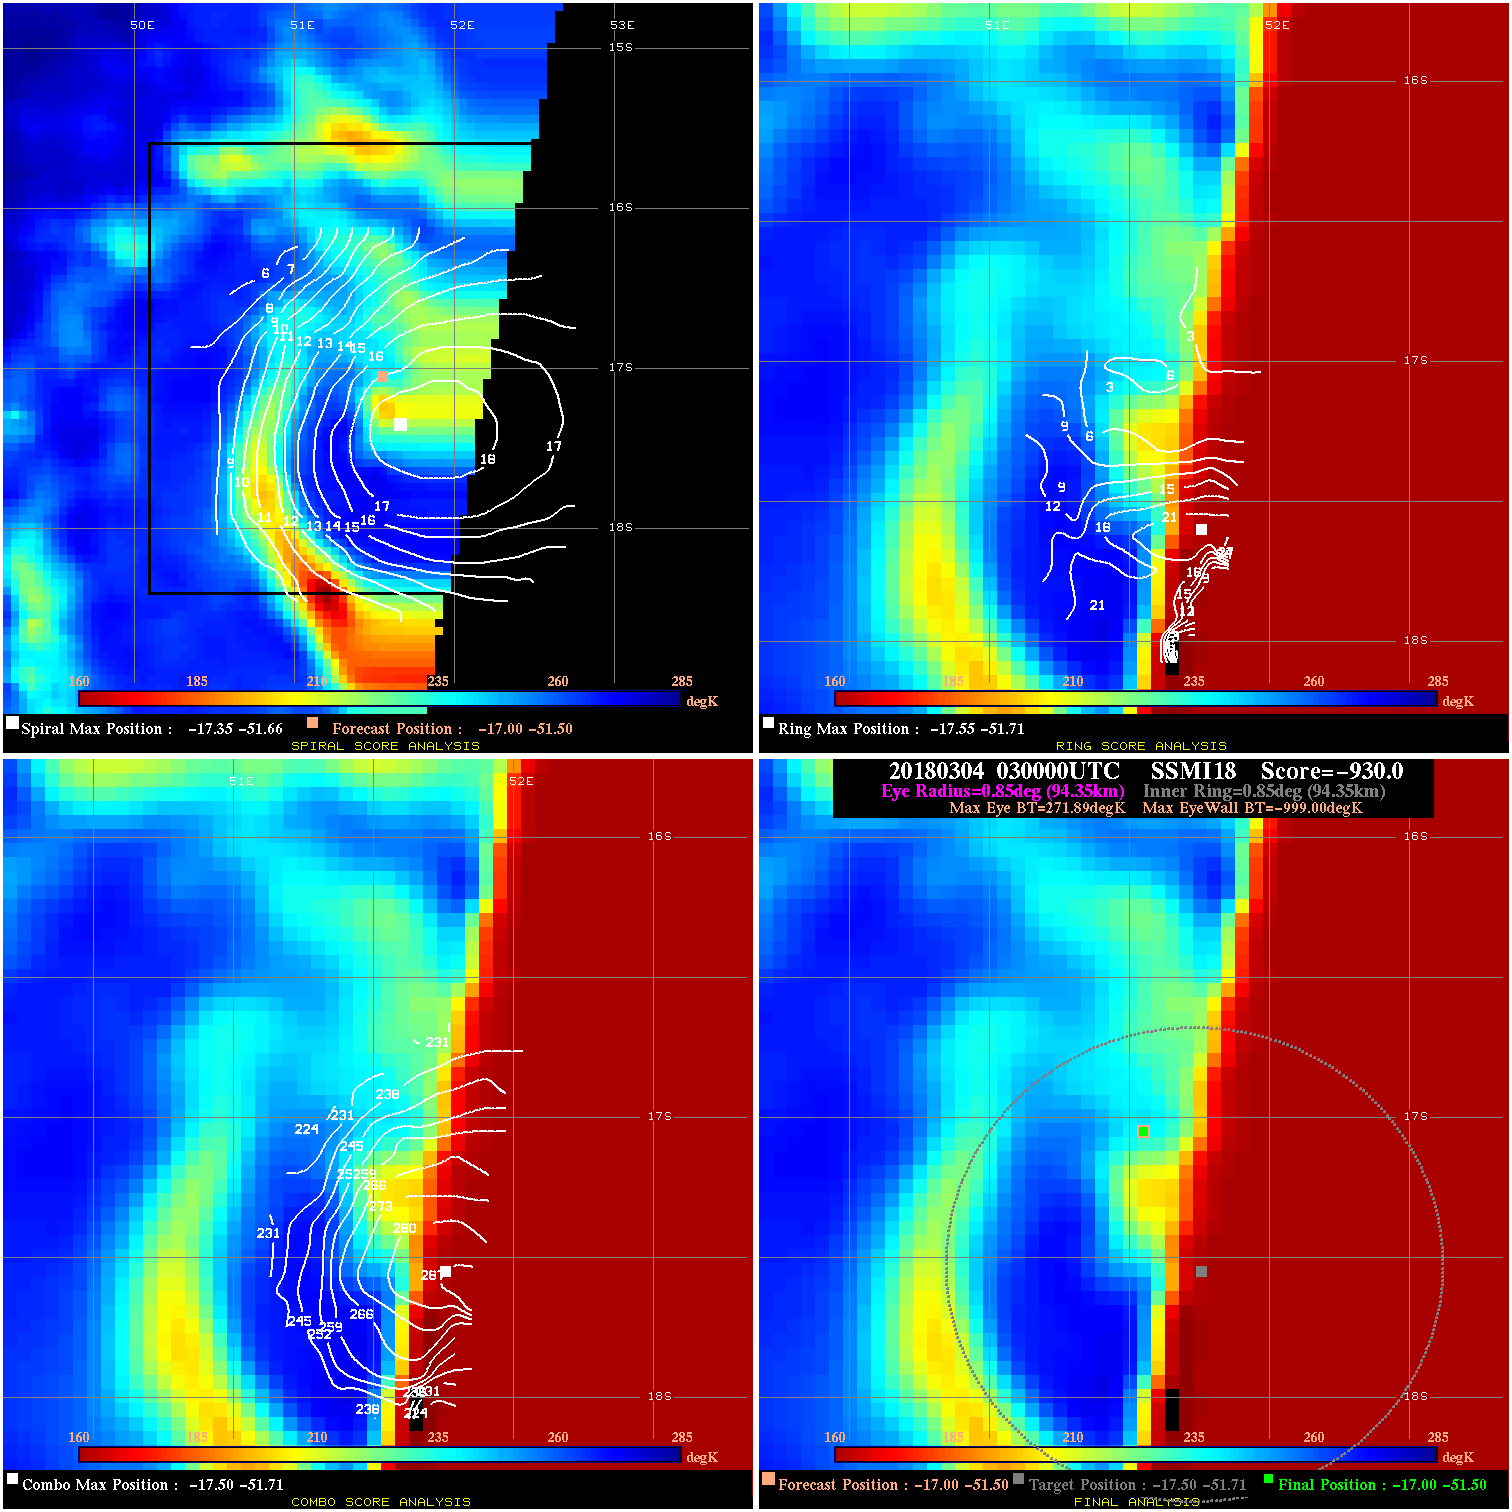
20180304 030000 -930.0 N/A N/A N/A 0.00 65.0 SSMI18 -17.0 -51.5 -17.0 -51.5 -17.5 -51.7 Analysis Plot
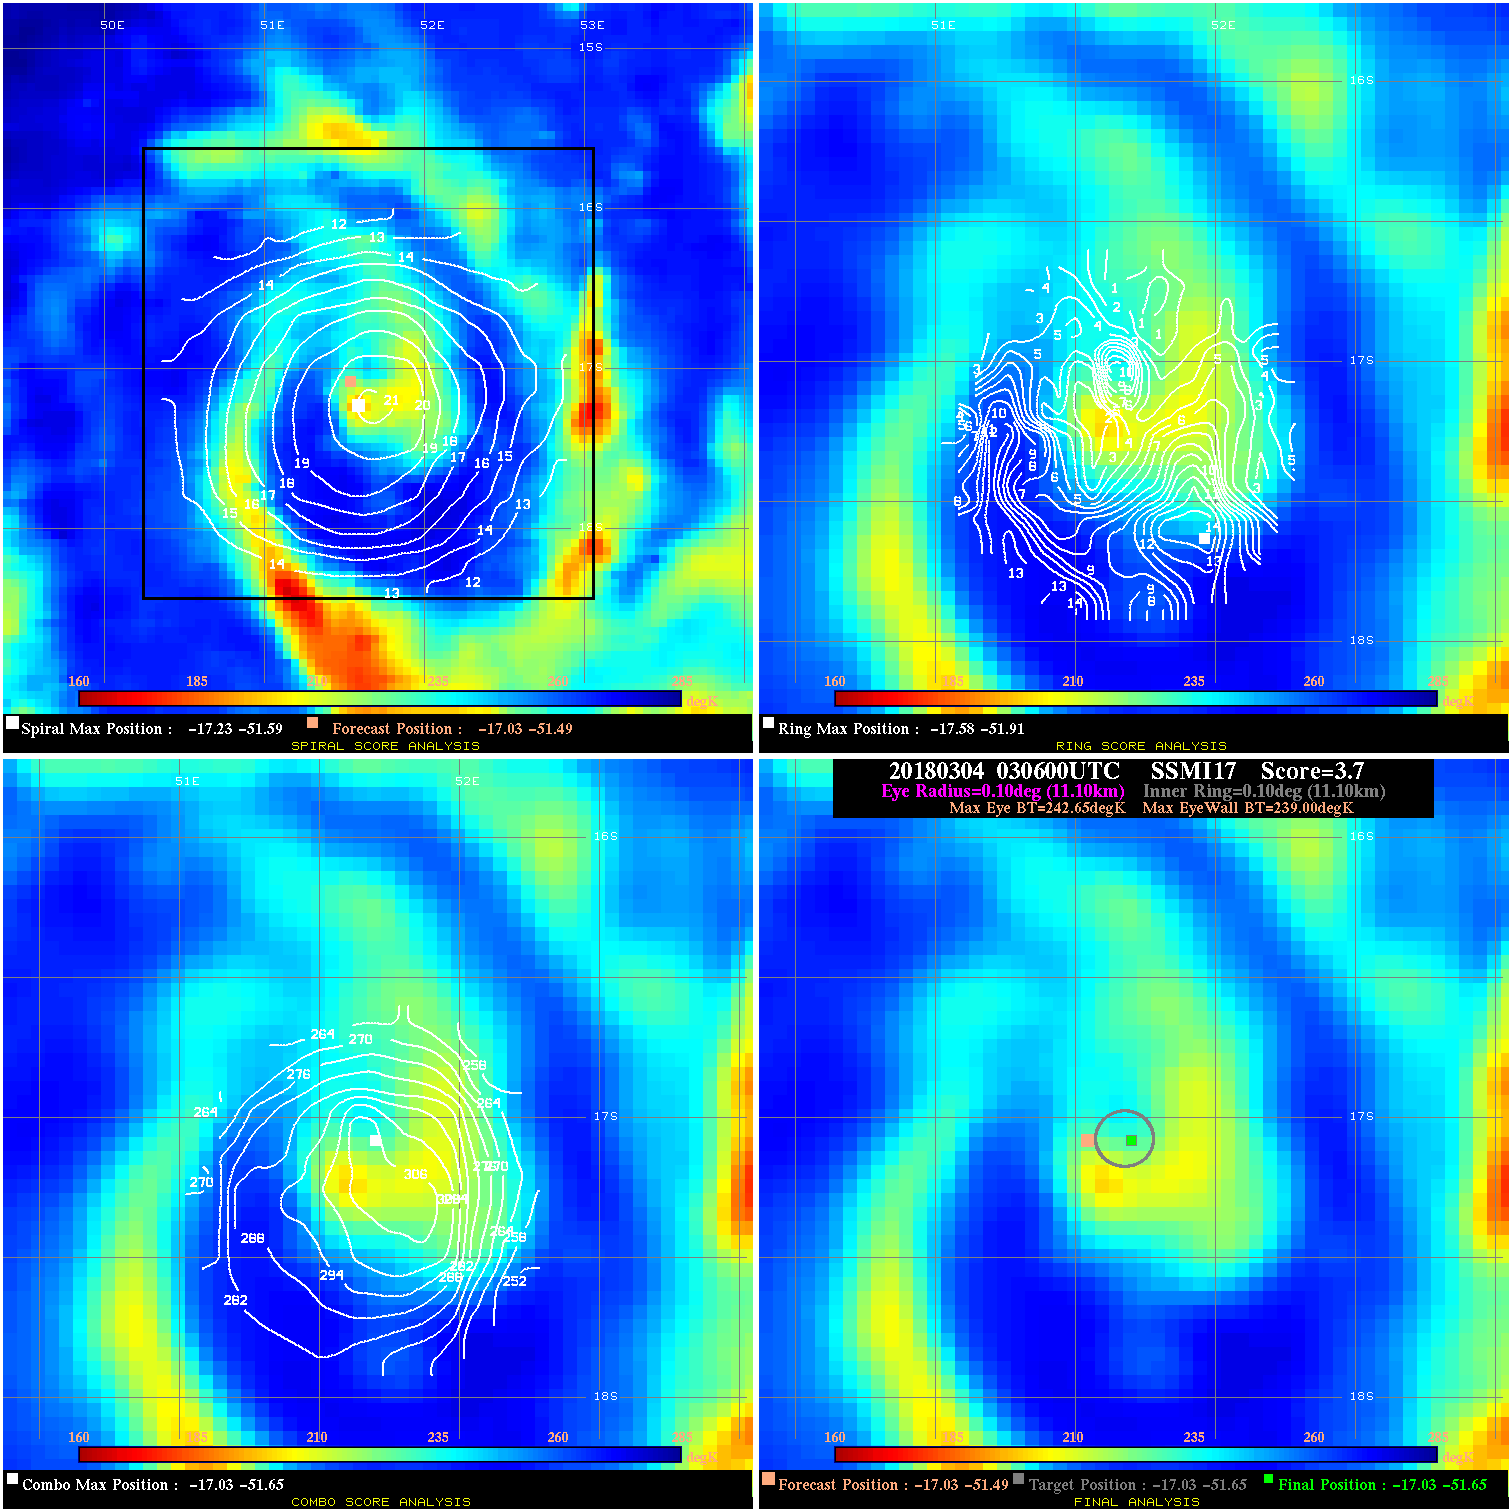
20180304 030600 3.7 N/A 79.5% 22.22 3.65 65.0 SSMI17 -17.0 -51.5 -17.0 -51.7 -17.0 -51.7 Analysis Plot
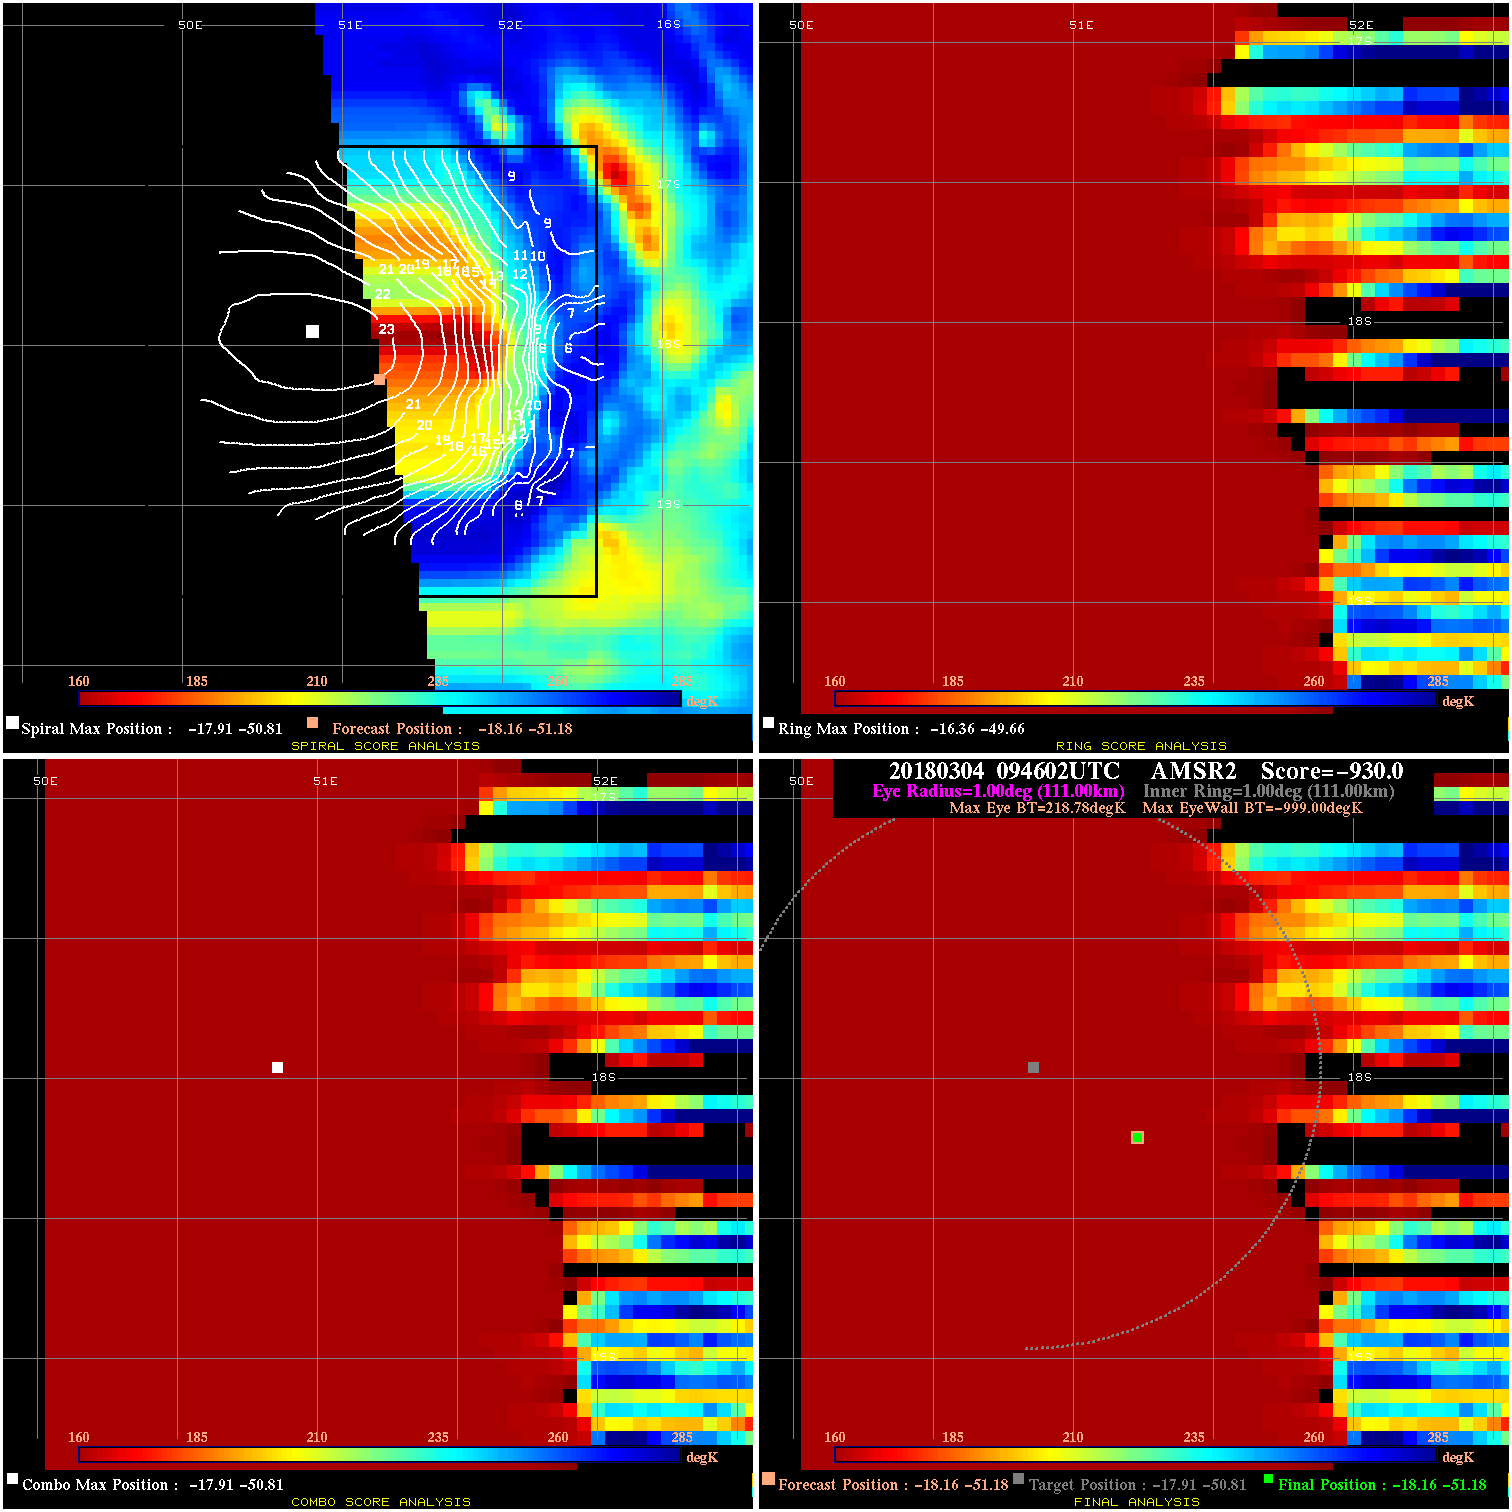
20180304 094602 -930.0 N/A N/A N/A 0.00 70.0 AMSR2 -18.2 -51.2 -18.2 -51.2 -17.9 -50.8 Analysis Plot
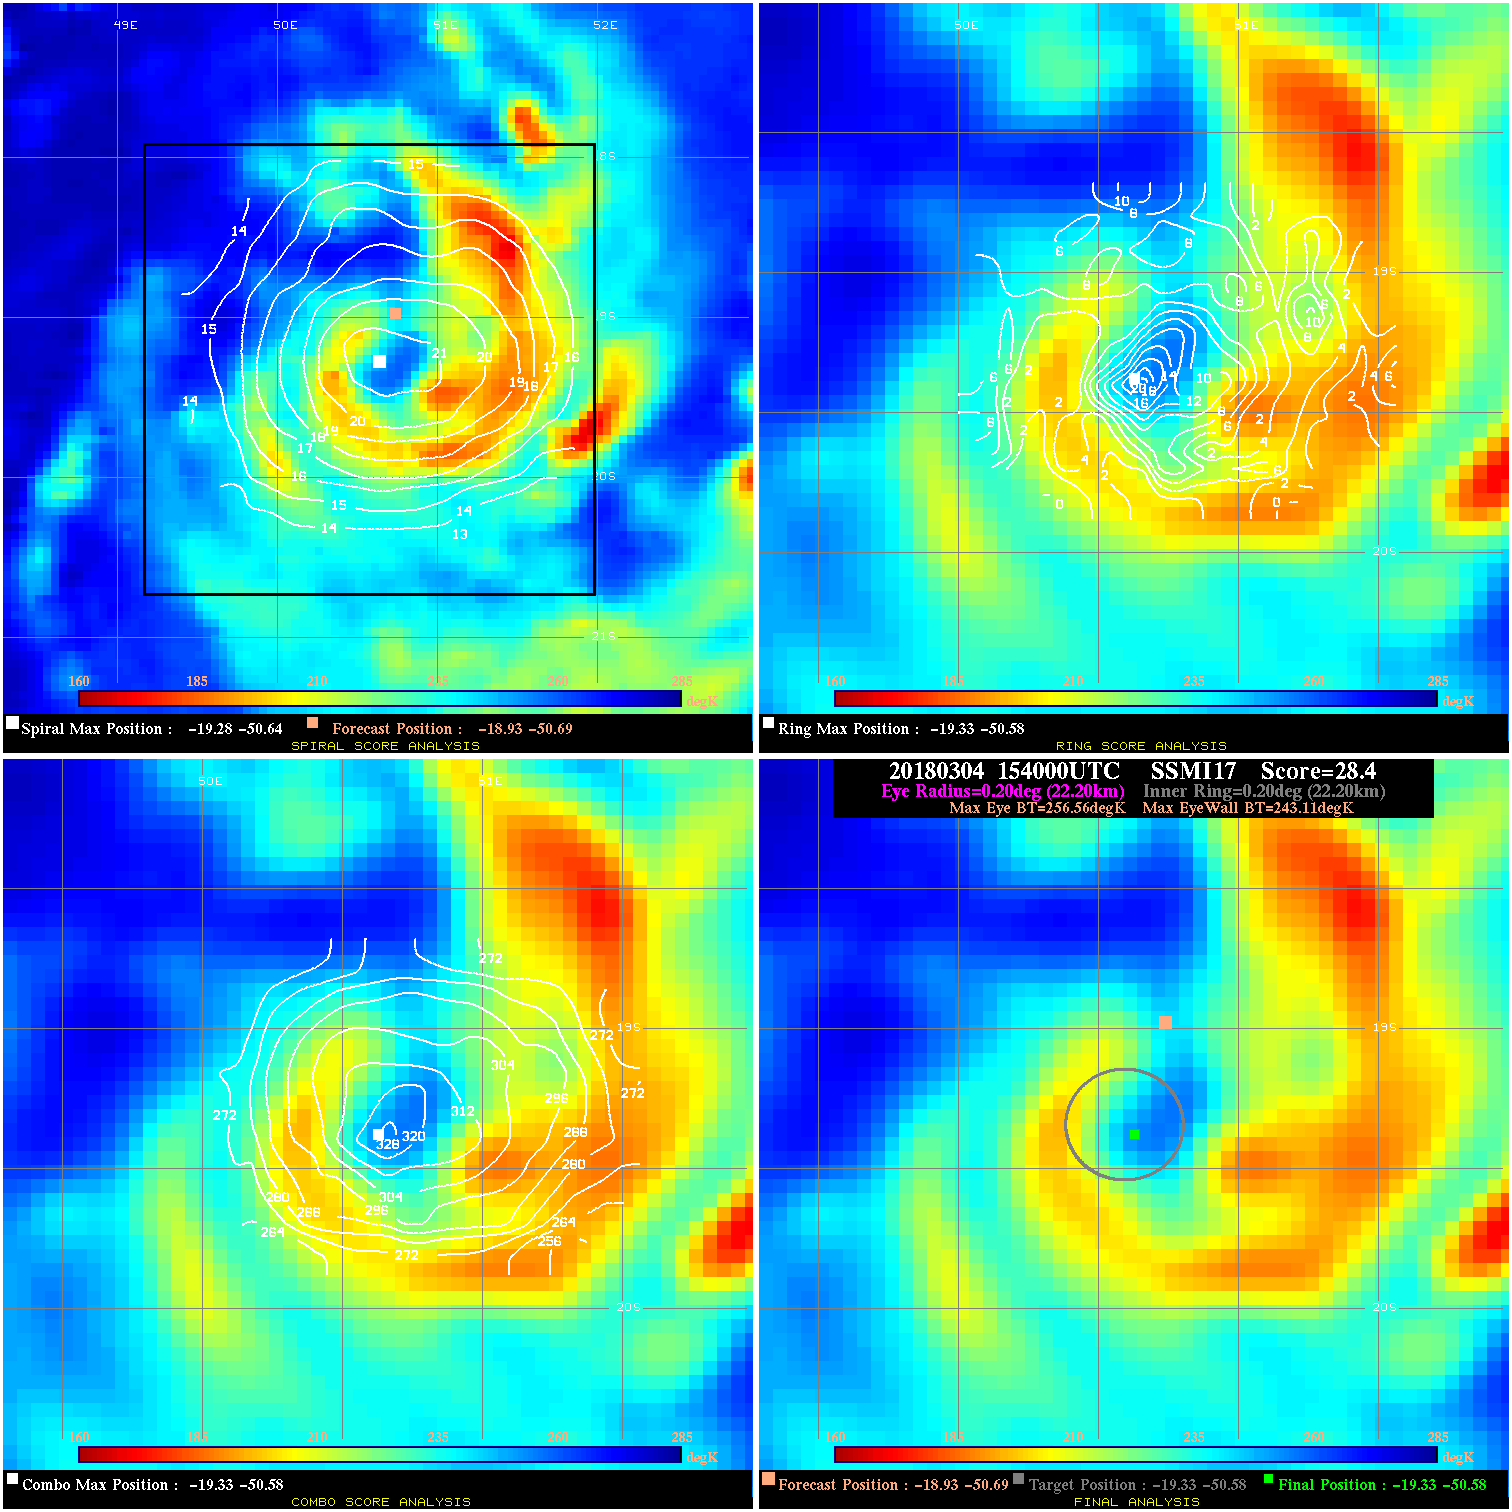
20180304 154000 28.4 >65 kts 93.2% 44.44 13.45 80.0 SSMI17 -18.9 -50.7 -19.3 -50.6 -19.3 -50.6 Analysis Plot
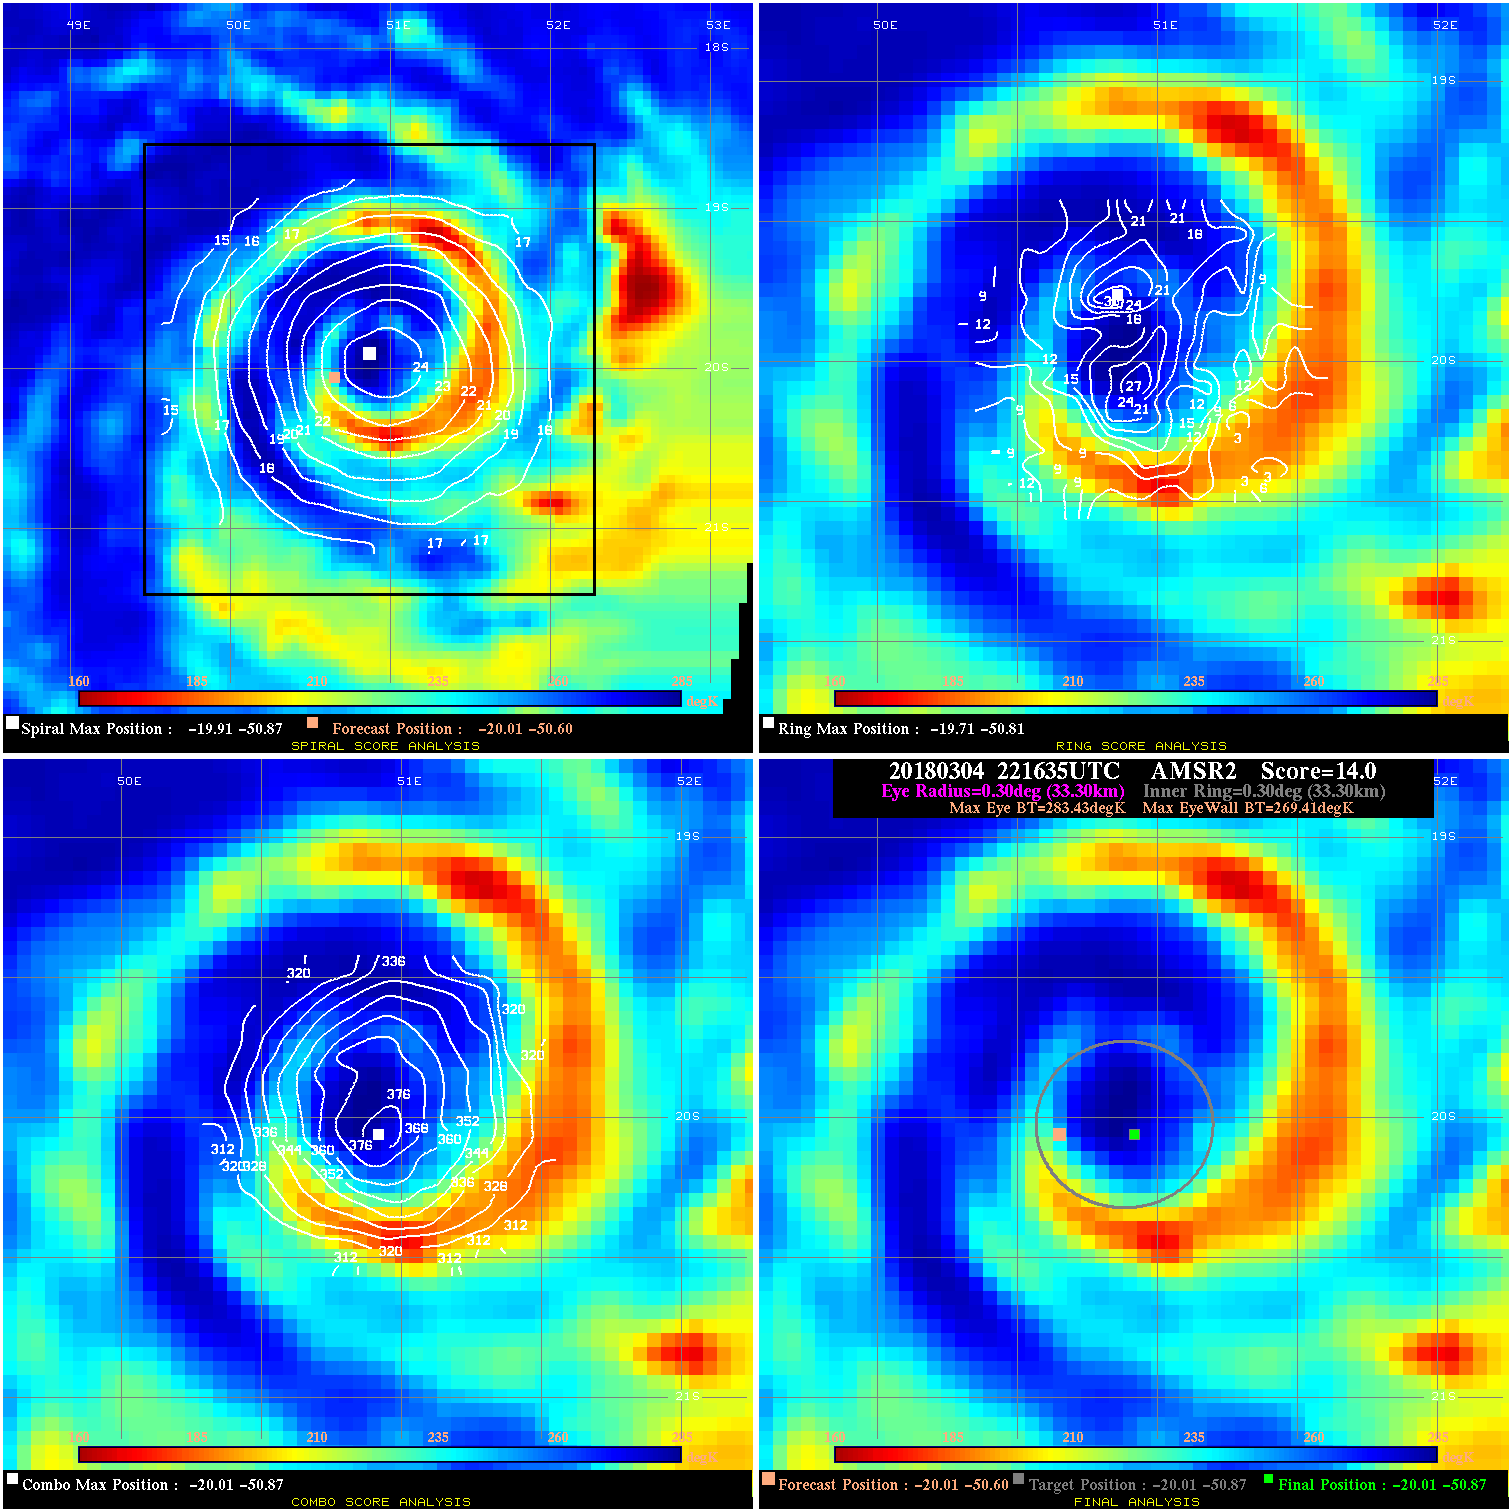
20180304 221635 14.0 N/A 49.3% 66.66 14.02 80.0 AMSR2 -20.0 -50.6 -20.0 -50.9 -20.0 -50.9 Analysis Plot
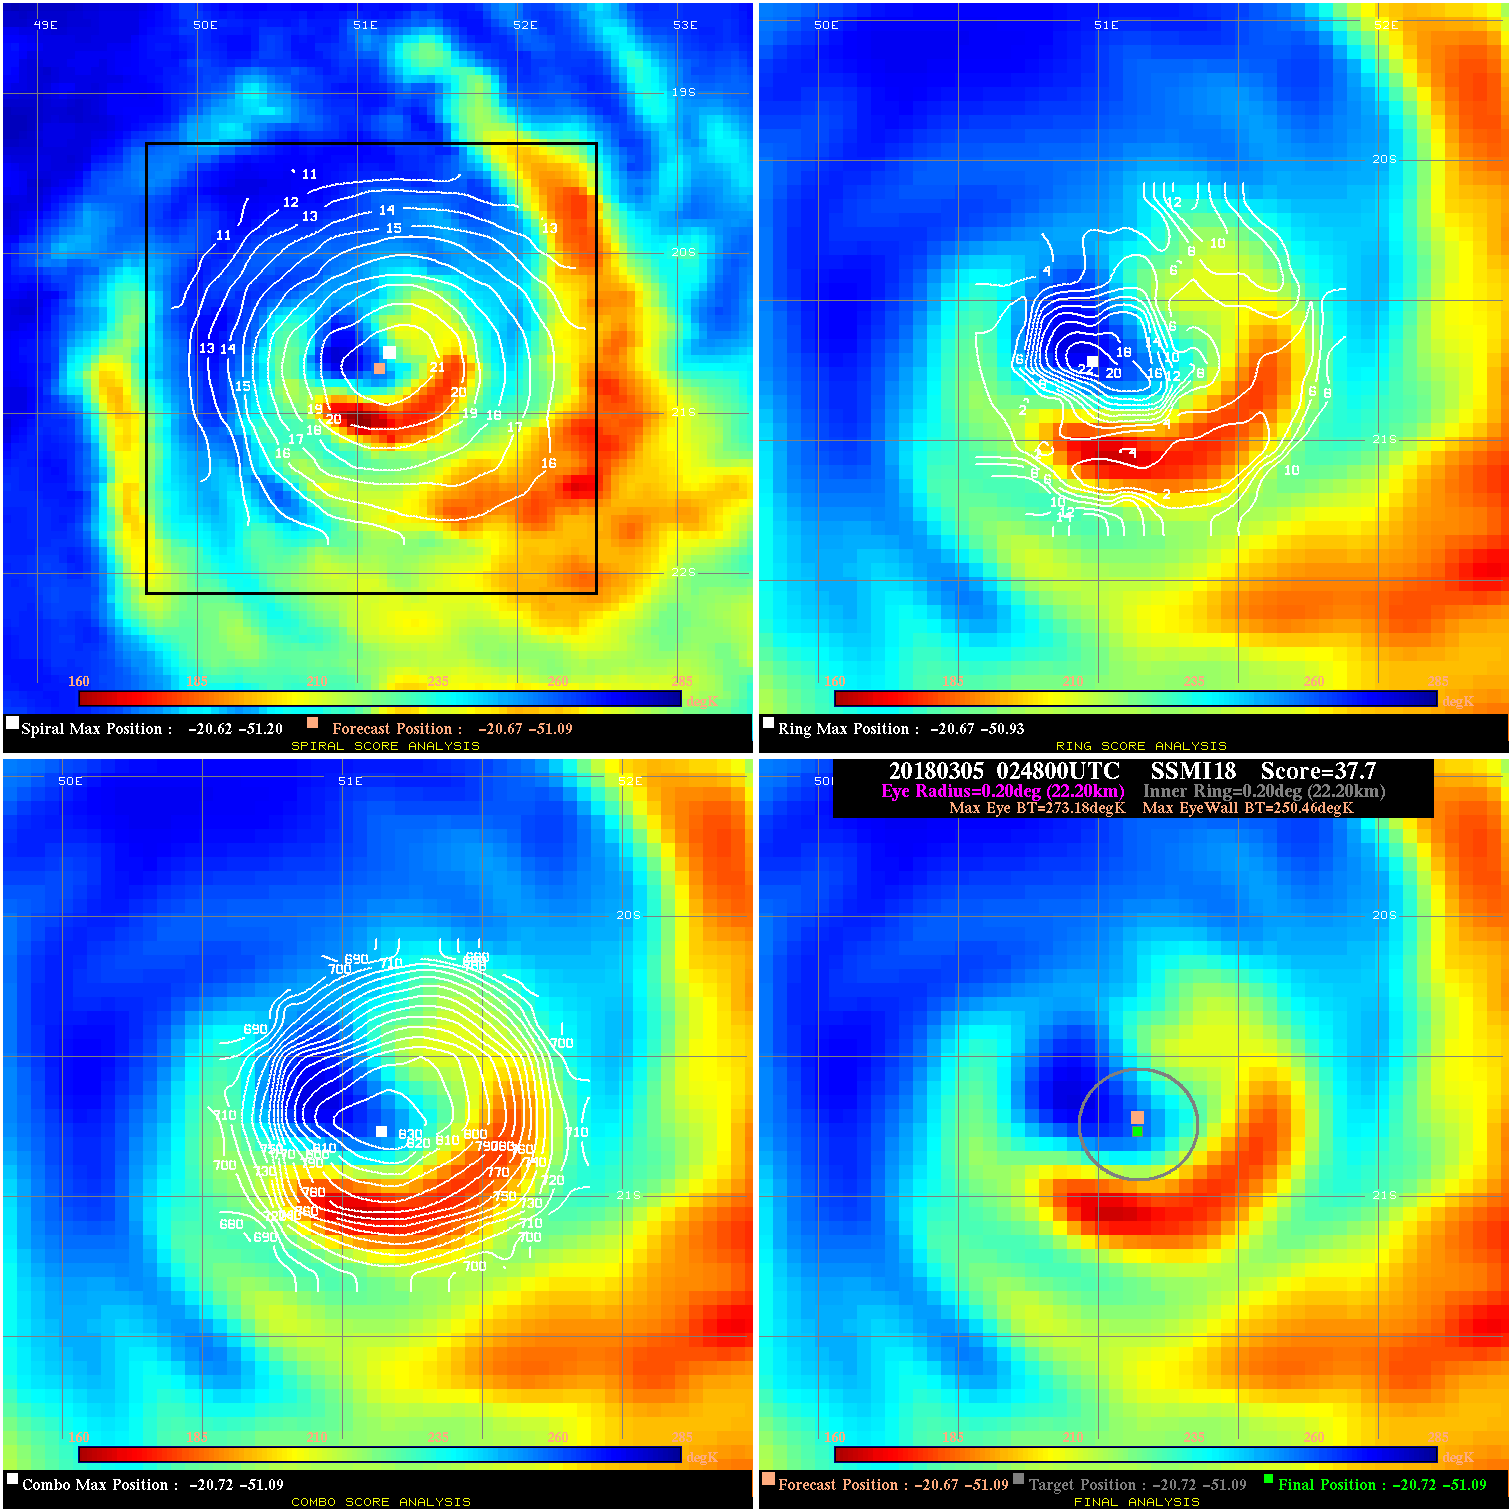
20180305 024800 37.7 >65 kts 100.0% 44.44 22.72 90.0 SSMI18 -20.7 -51.1 -20.7 -51.1 -20.7 -51.1 Analysis Plot
20180305 053443 27.5 >65 kts 65.1% 66.66 27.52 90.0 GMI -21.0 -51.2 -21.0 -51.3 -21.0 -51.3 Analysis Plot
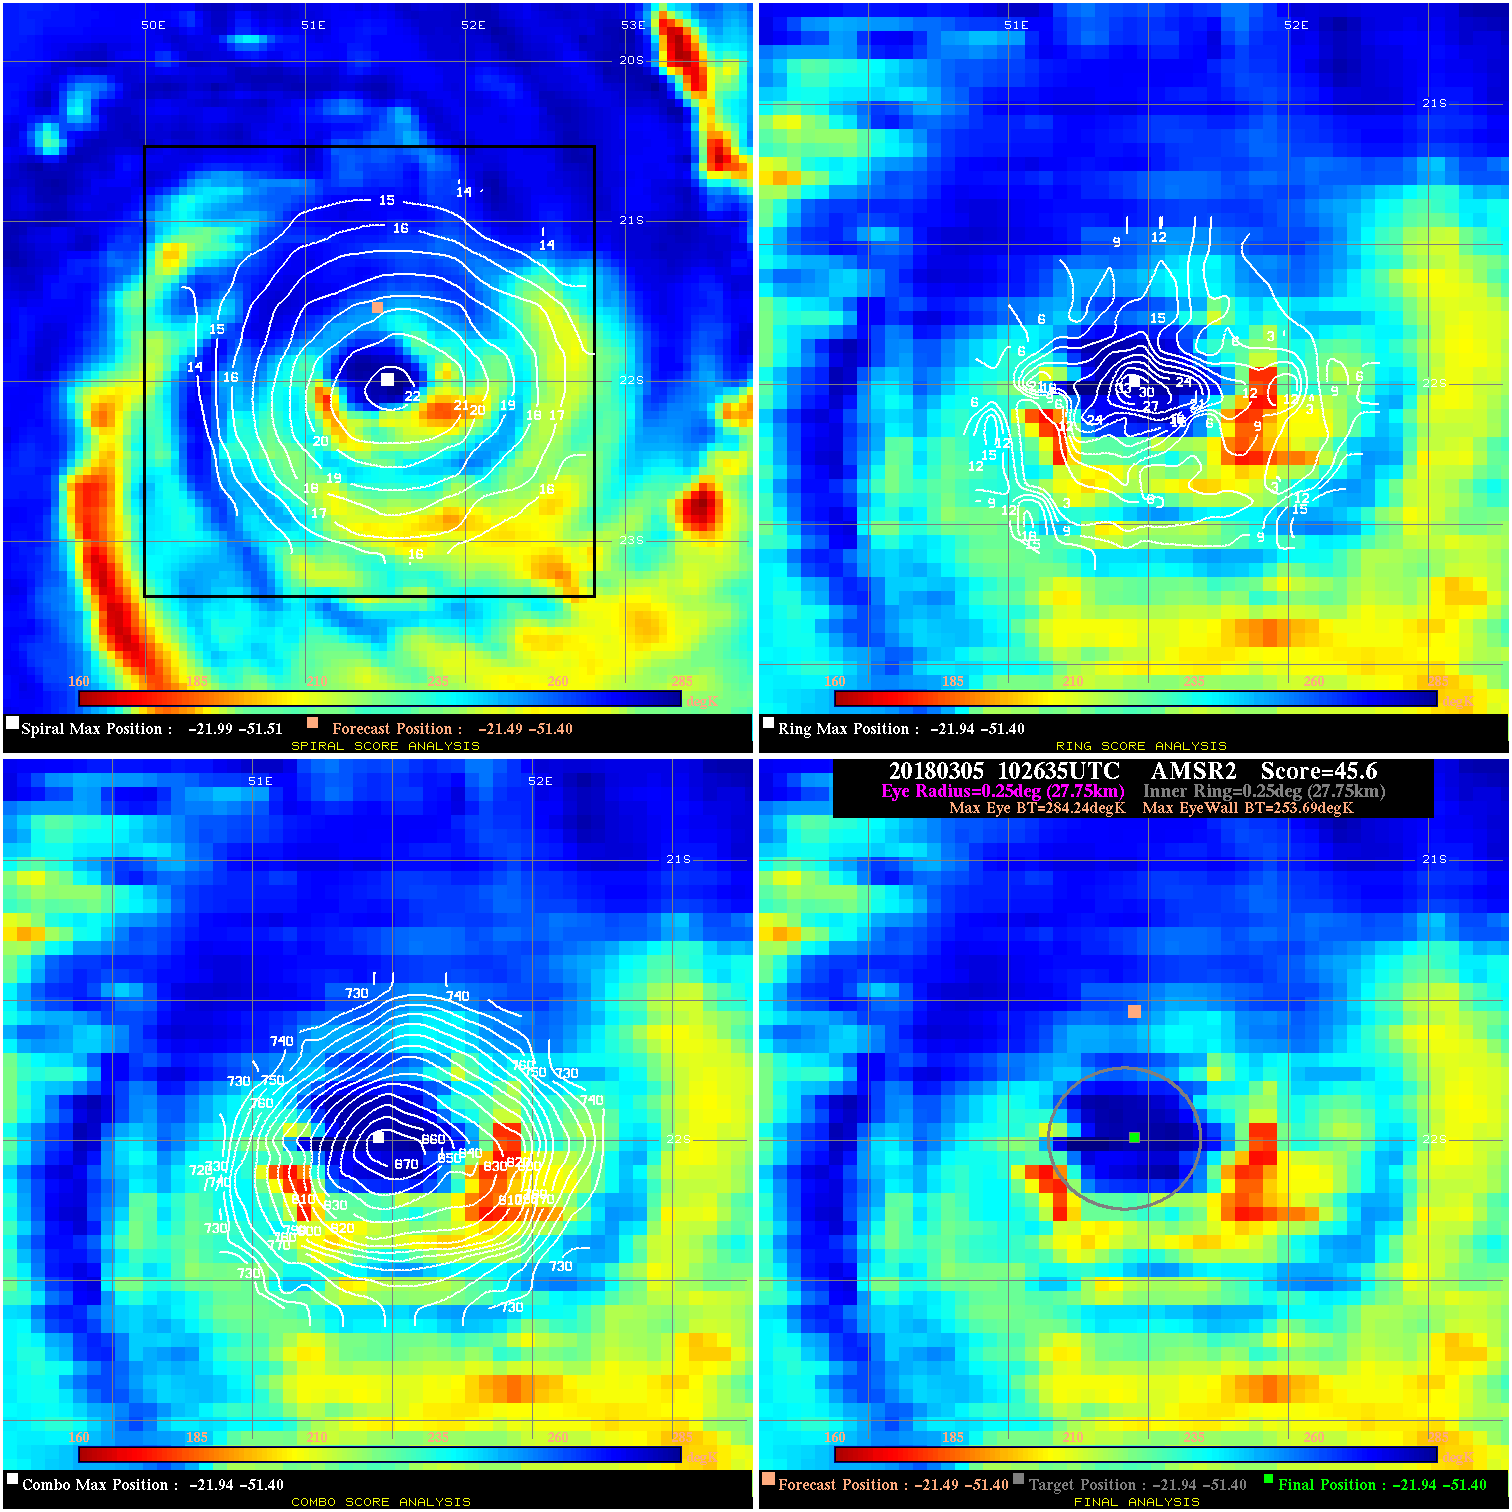
20180305 102635 45.6 >65 kts 100.0% 55.55 30.55 90.0 AMSR2 -21.5 -51.4 -21.9 -51.4 -21.9 -51.4 Analysis Plot
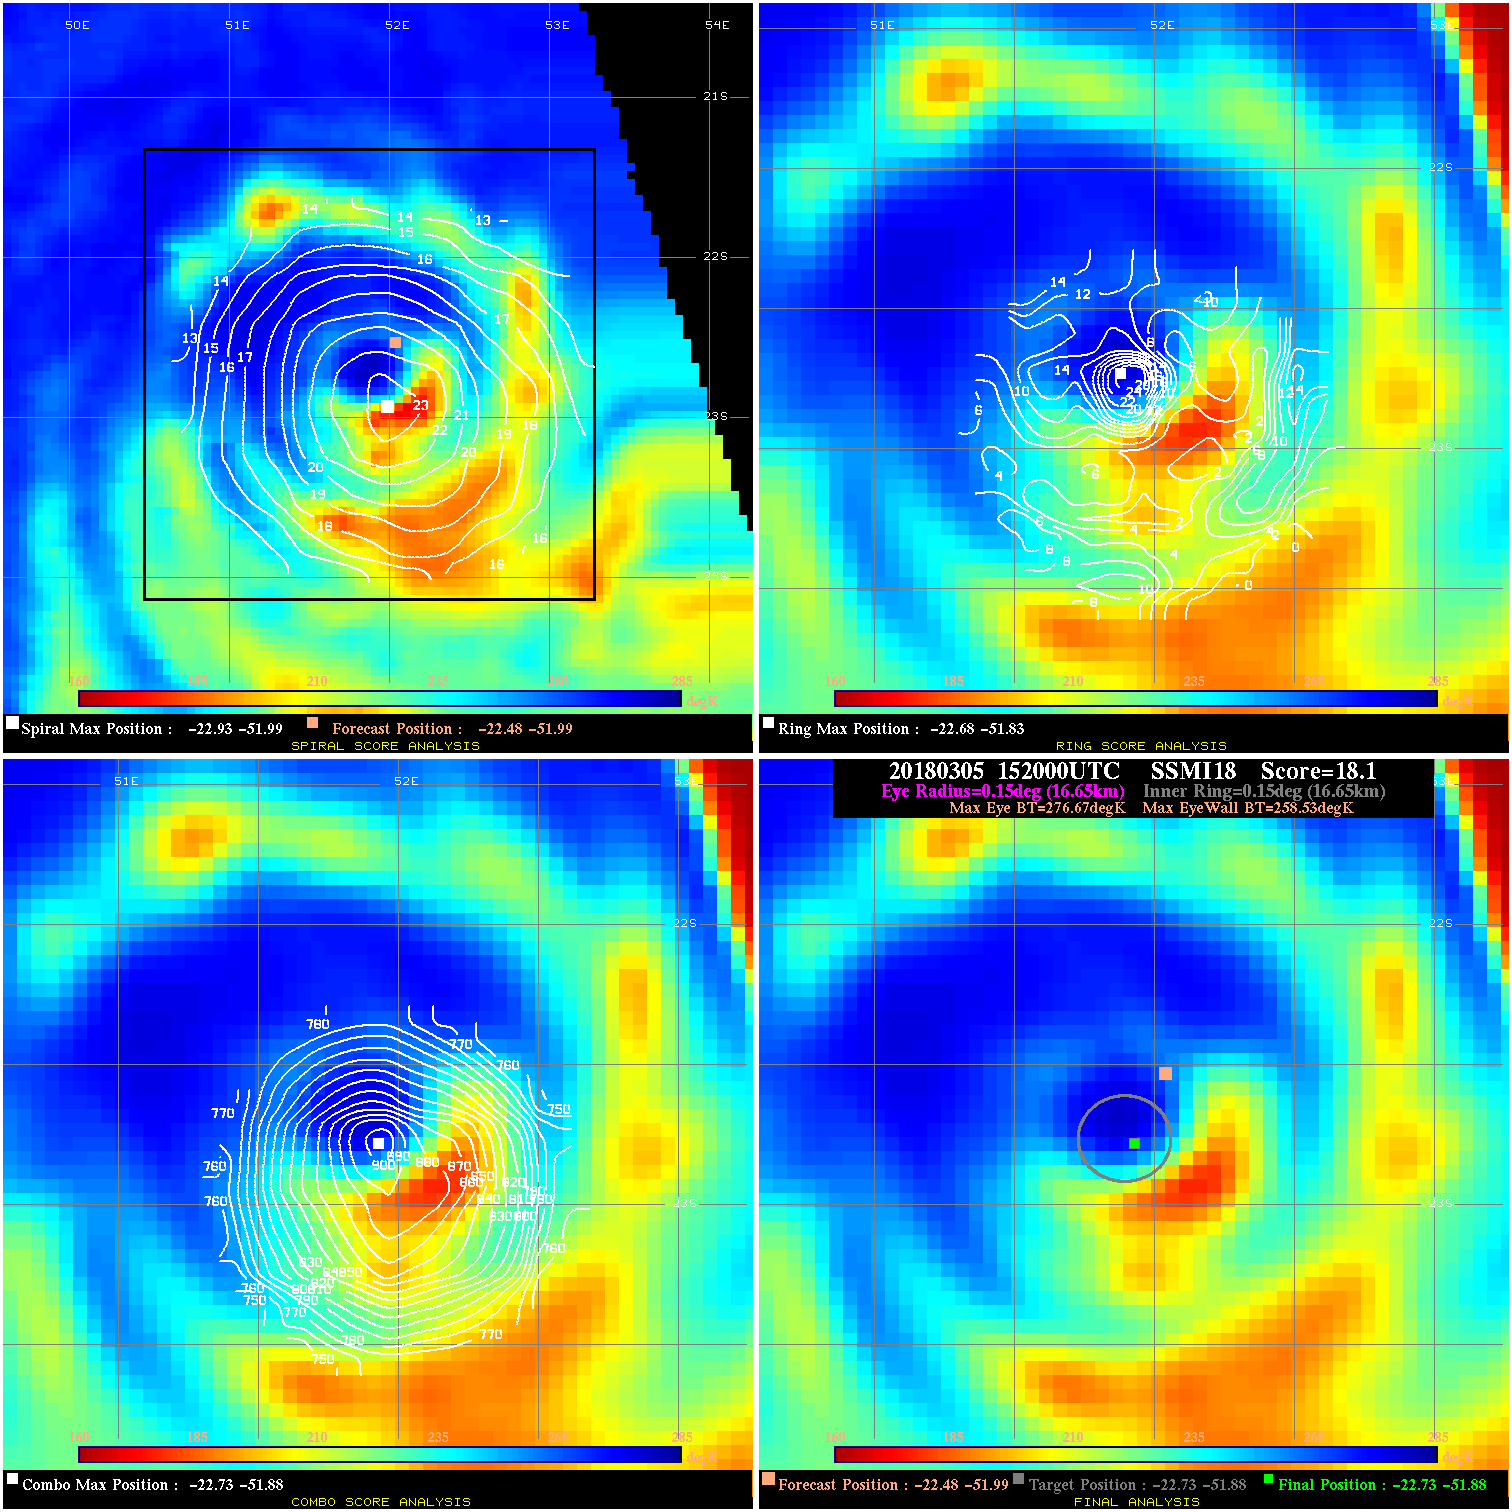
20180305 152000 18.1 N/A 56.2% 33.33 18.14 105.0 SSMI18 -22.5 -52.0 -22.7 -51.9 -22.7 -51.9 Analysis Plot
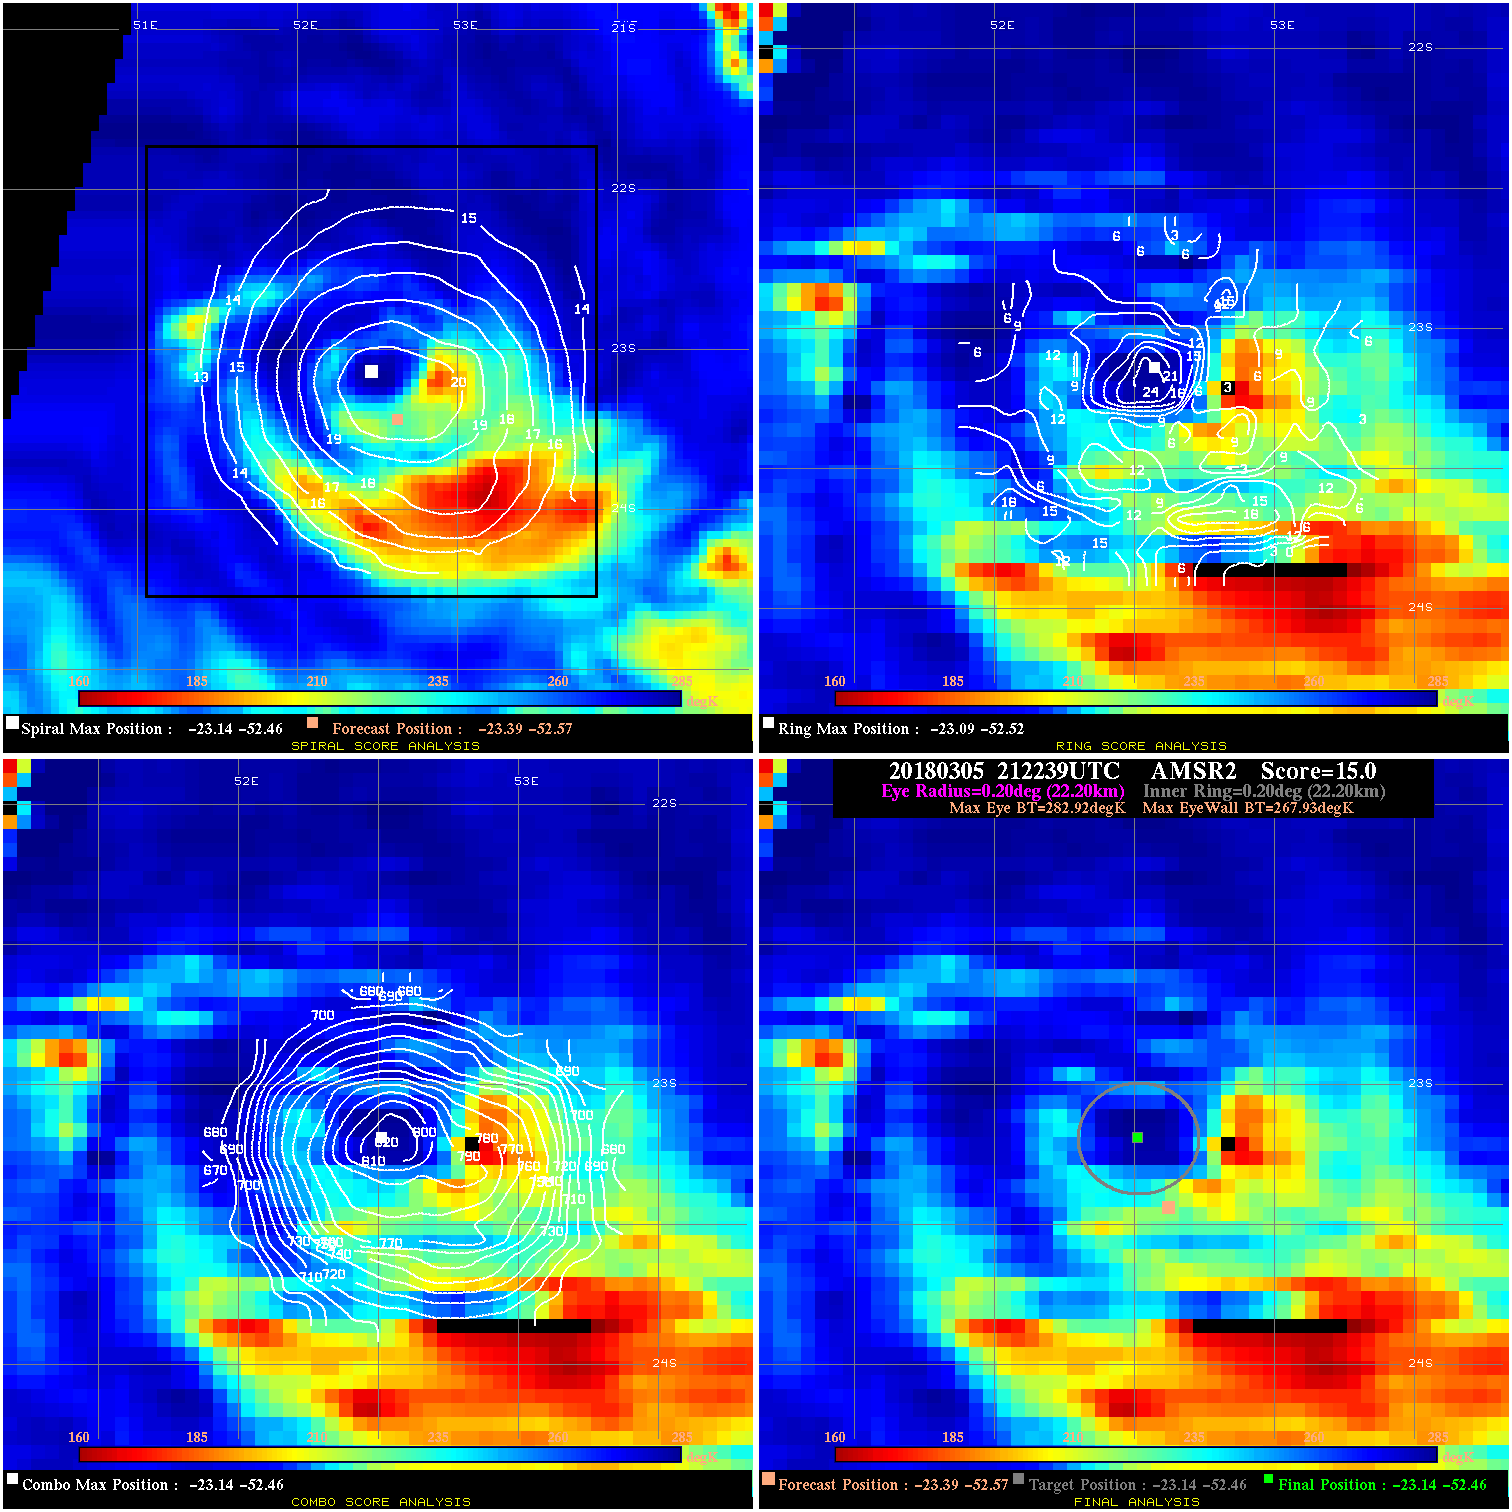
20180305 212239 15.0 N/A 38.4% 44.44 14.99 100.0 AMSR2 -23.4 -52.6 -23.1 -52.5 -23.1 -52.5 Analysis Plot
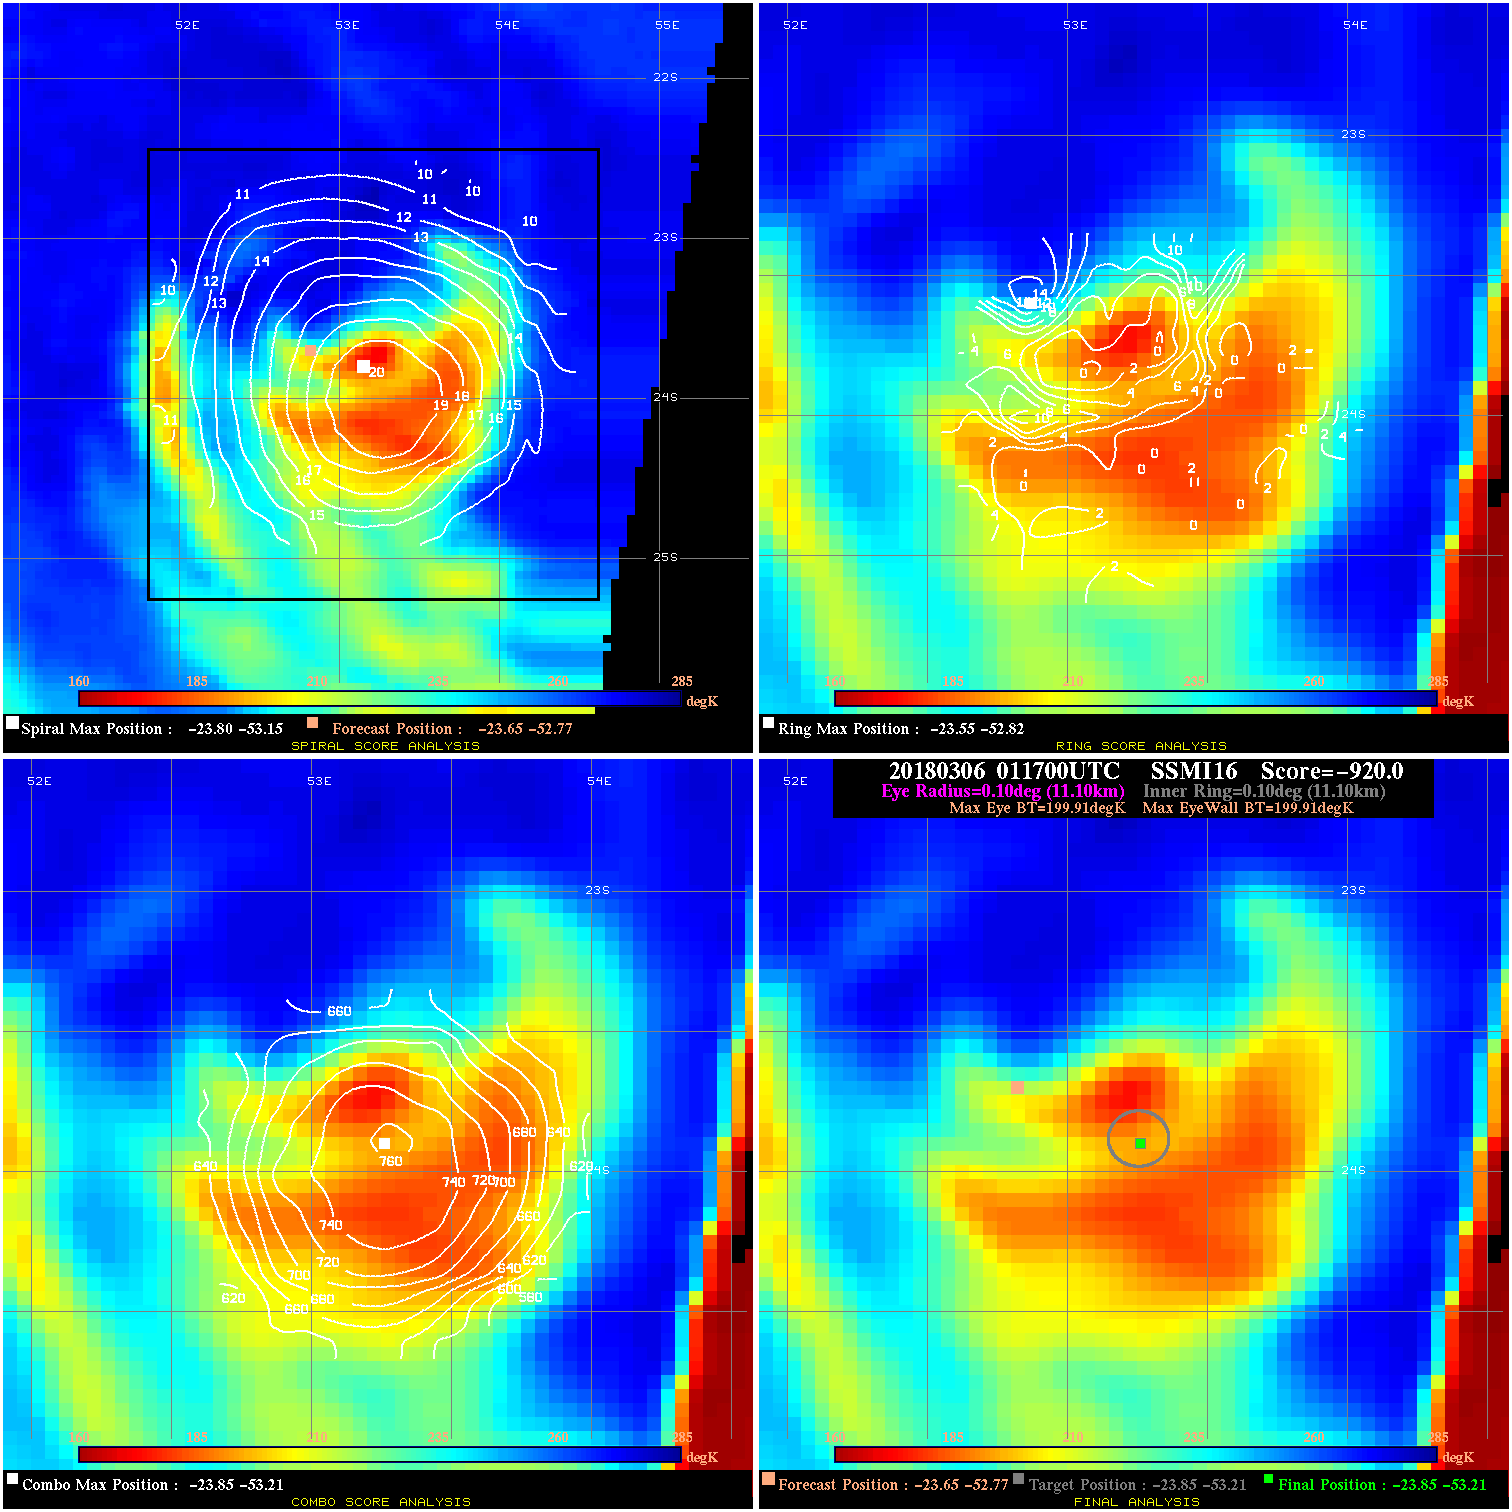
20180306 011700 -0.0 N/A N/A N/A 0.00 100.0 SSMI16 -23.6 -52.8 -23.9 -53.2 -23.9 -53.2 Analysis Plot
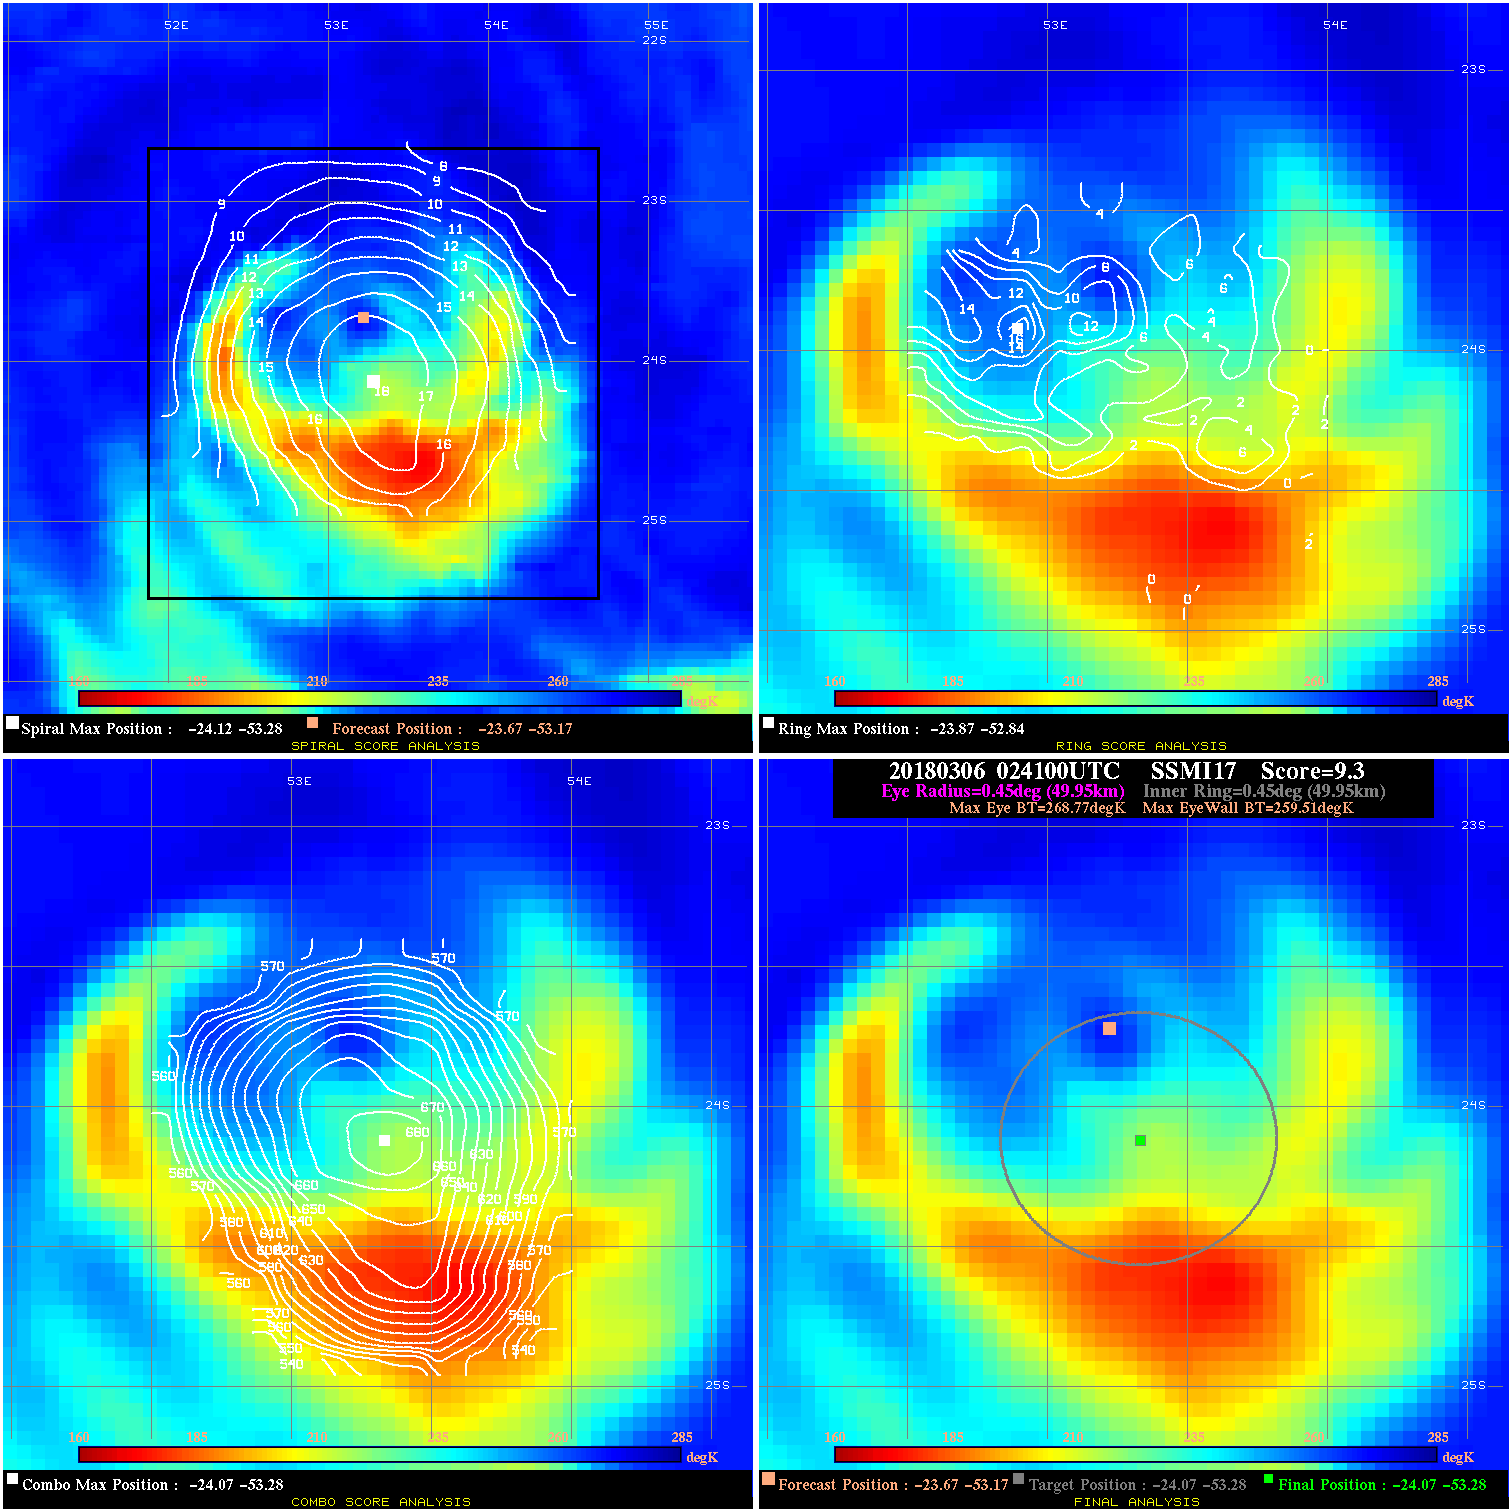
20180306 024100 9.3 N/A 57.5% 99.99 9.26 100.0 SSMI17 -23.7 -53.2 -24.1 -53.3 -24.1 -53.3 Analysis Plot
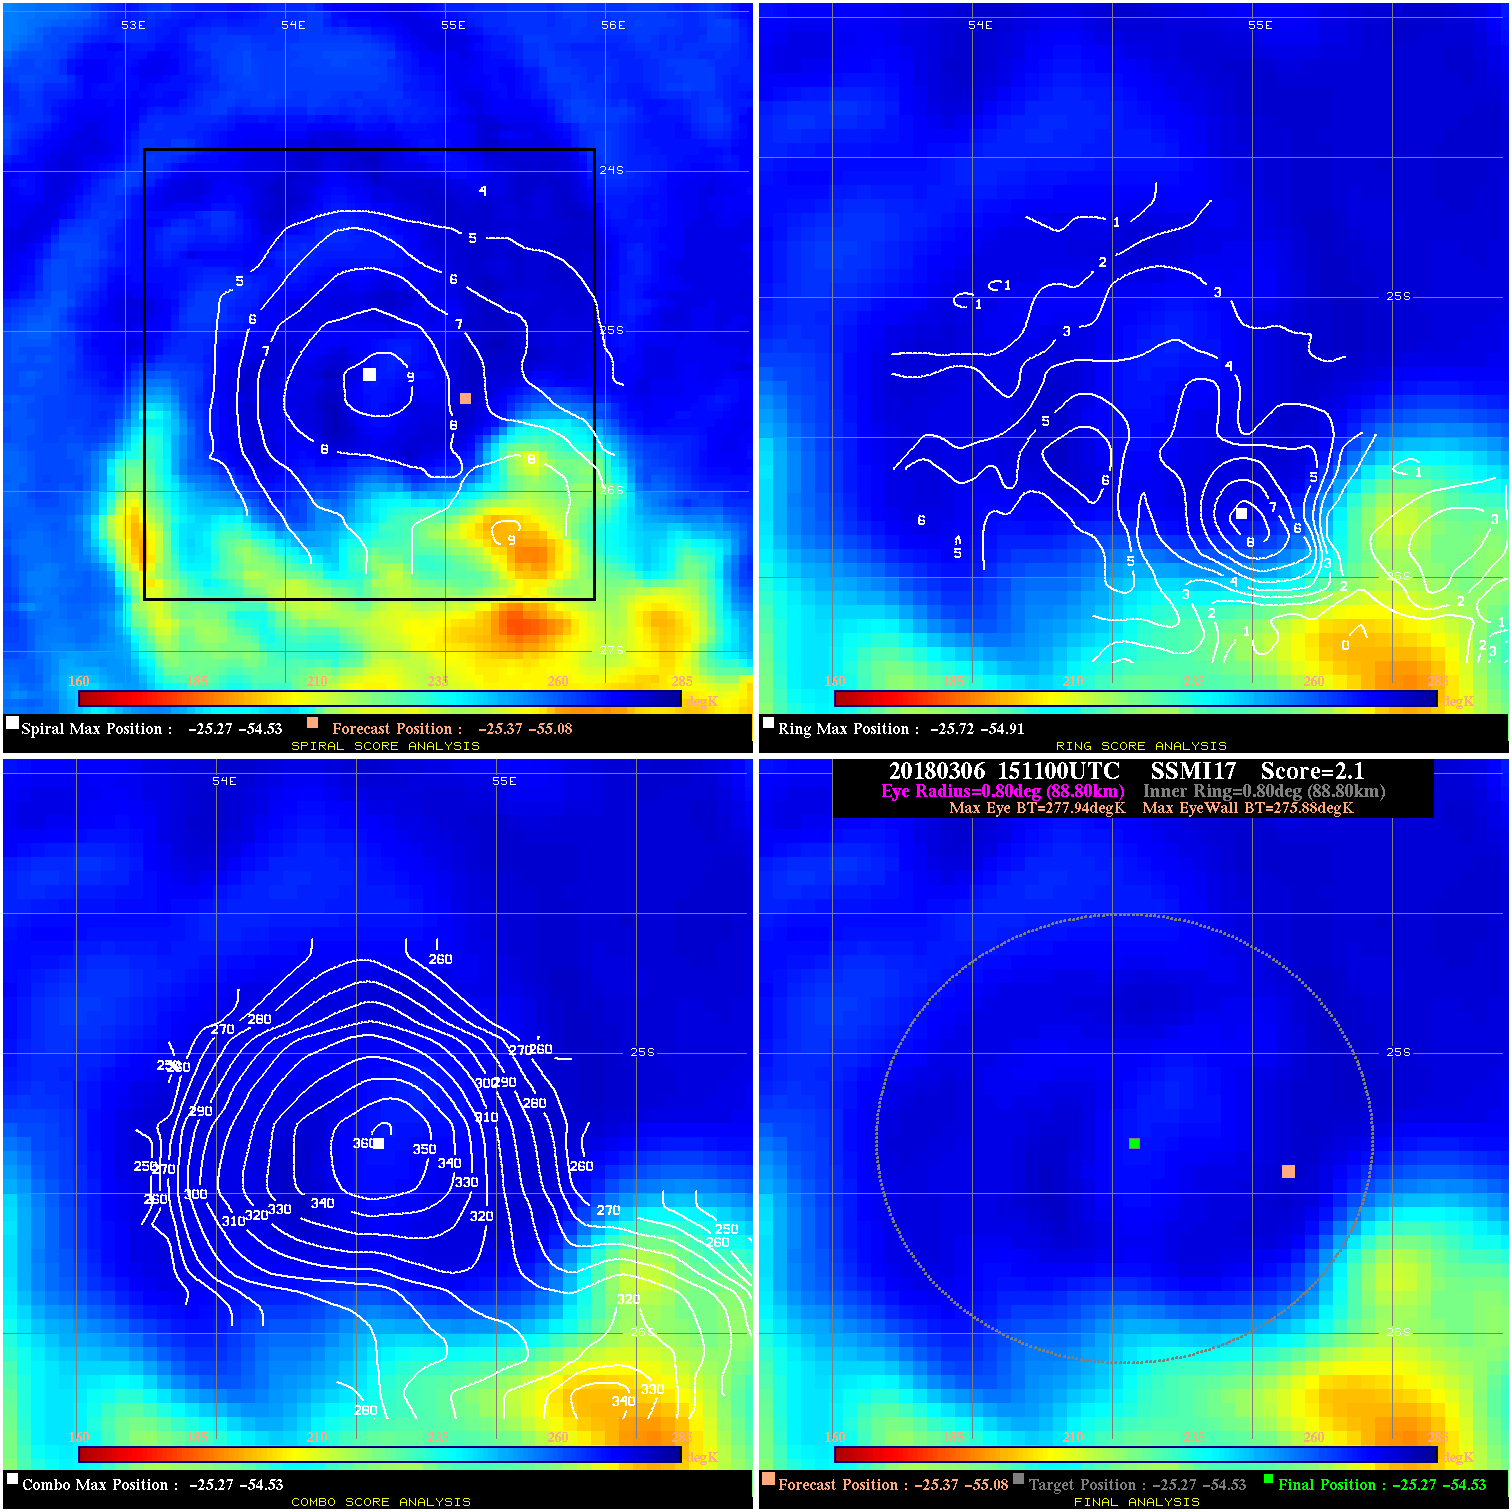
20180306 151100 2.1 N/A 16.4% 177.76 2.06 90.0 SSMI17 -25.4 -55.1 -25.3 -54.5 -25.3 -54.5 Analysis Plot
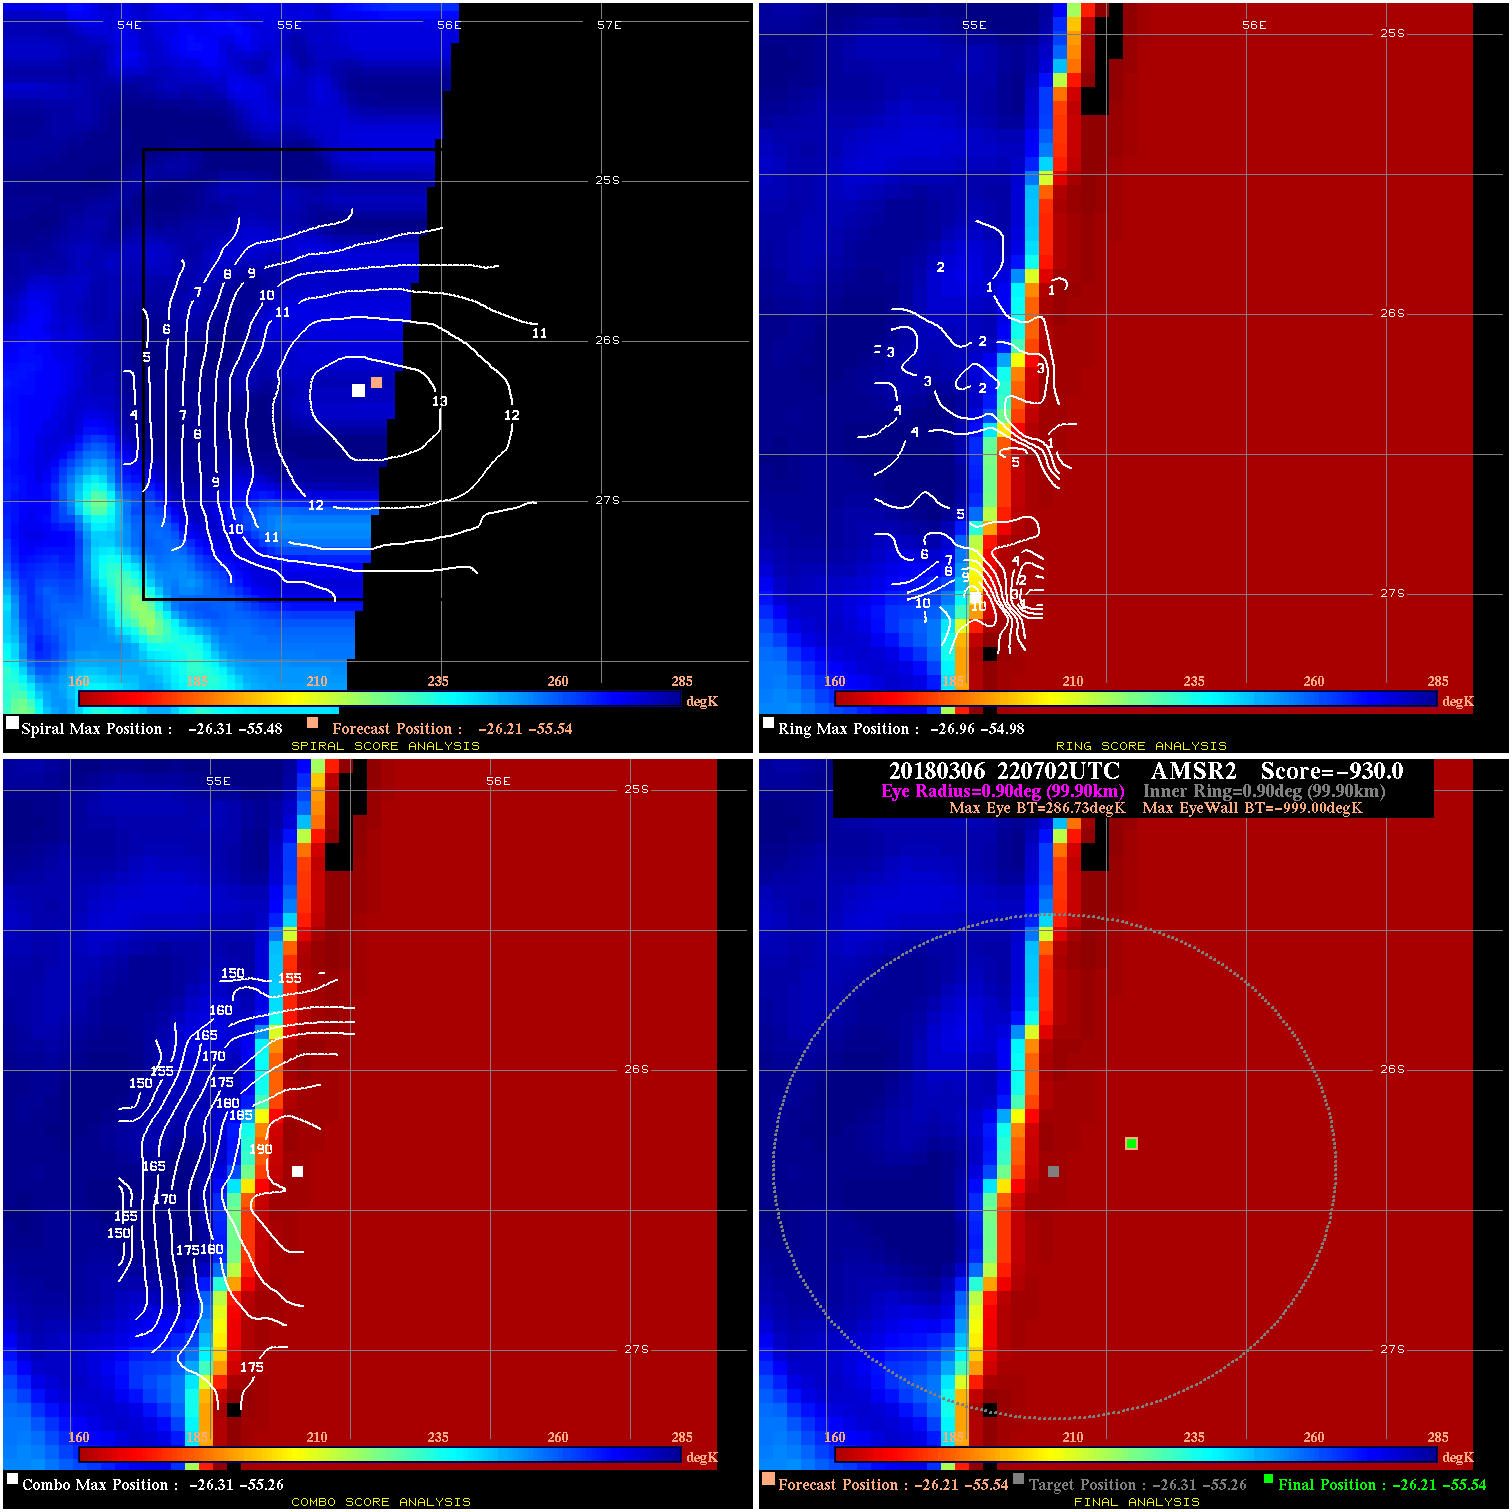
20180306 220702 -930.0 N/A N/A N/A 0.00 70.0 AMSR2 -26.2 -55.5 -26.2 -55.5 -26.3 -55.3 Analysis Plot
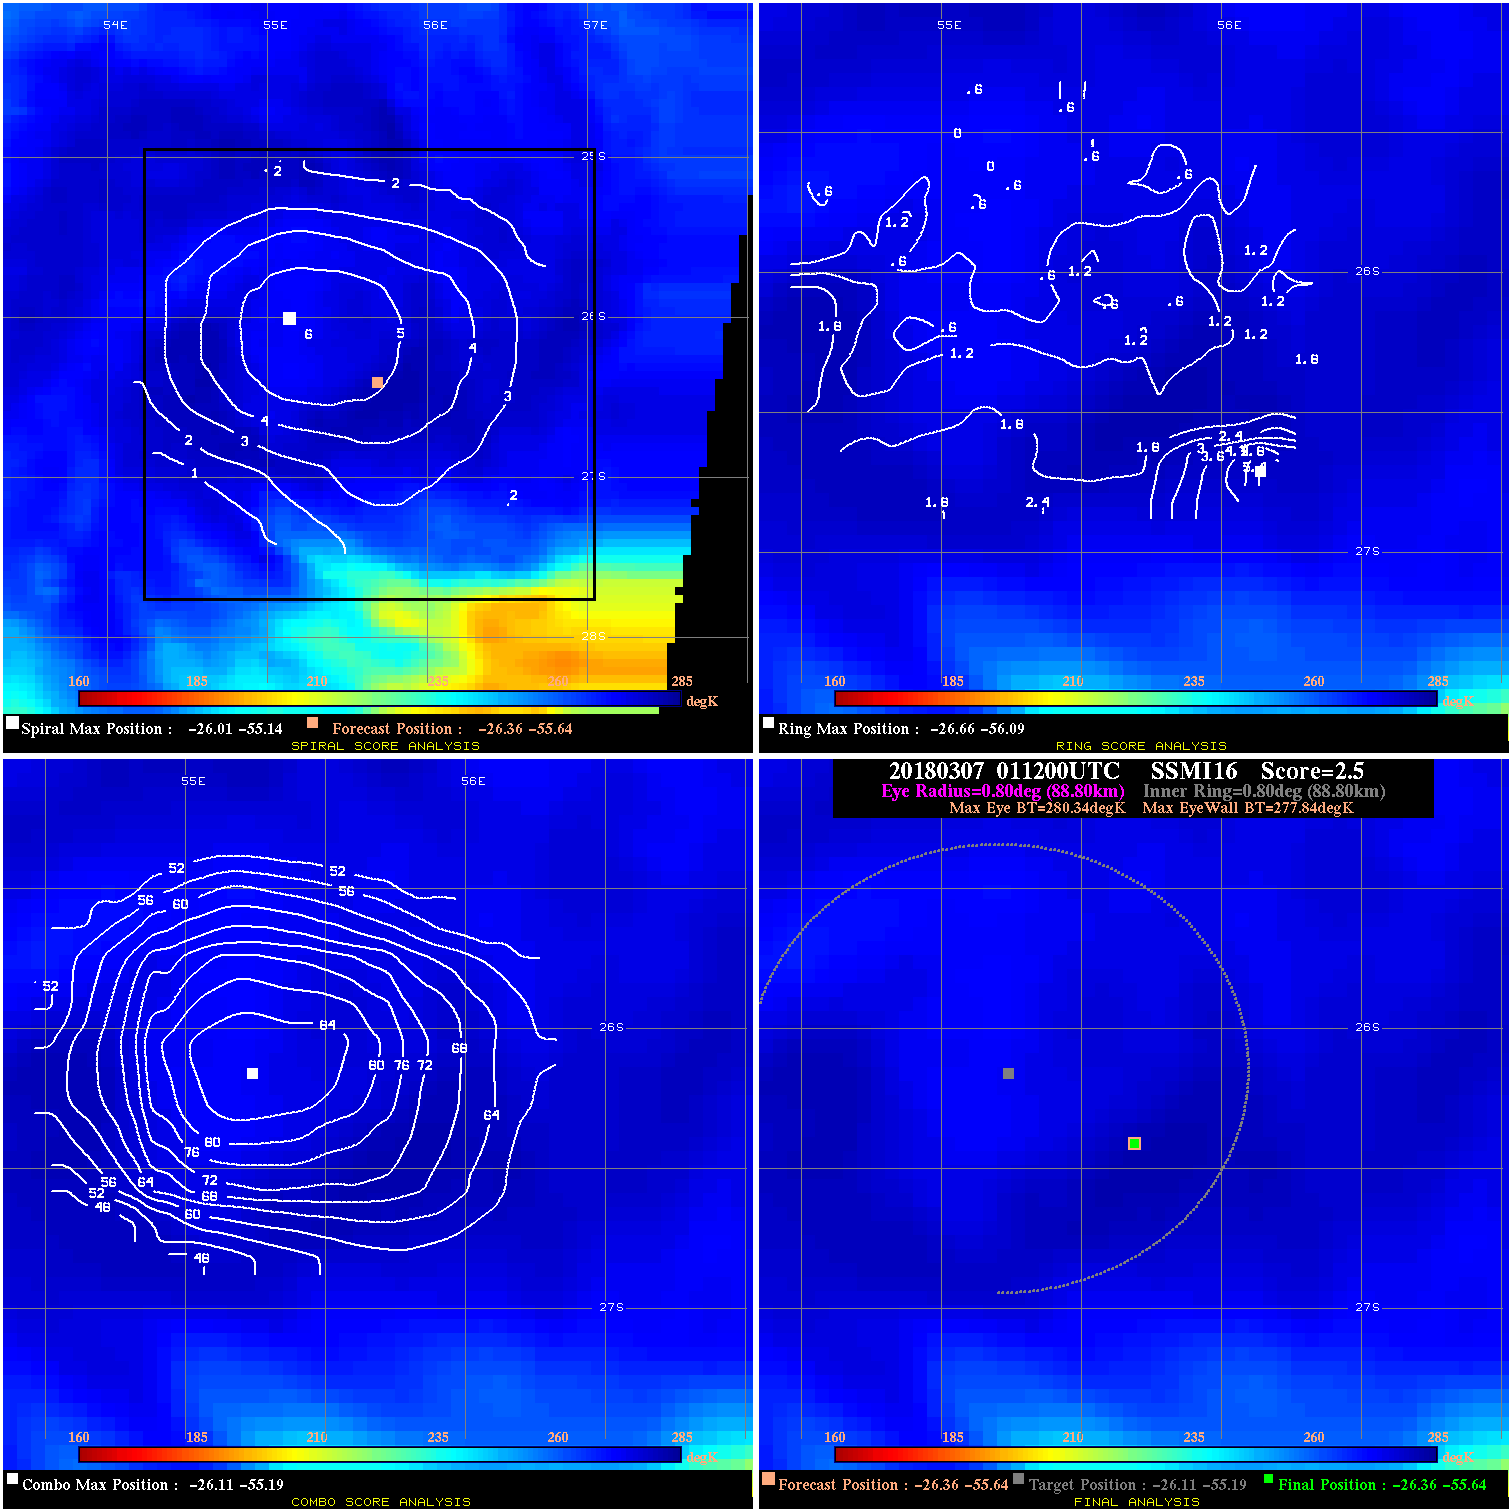
20180307 011200 2.5 N/A N/A 177.76 2.50 70.0 SSMI16 -26.4 -55.6 -26.4 -55.6 -26.1 -55.2 Analysis Plot
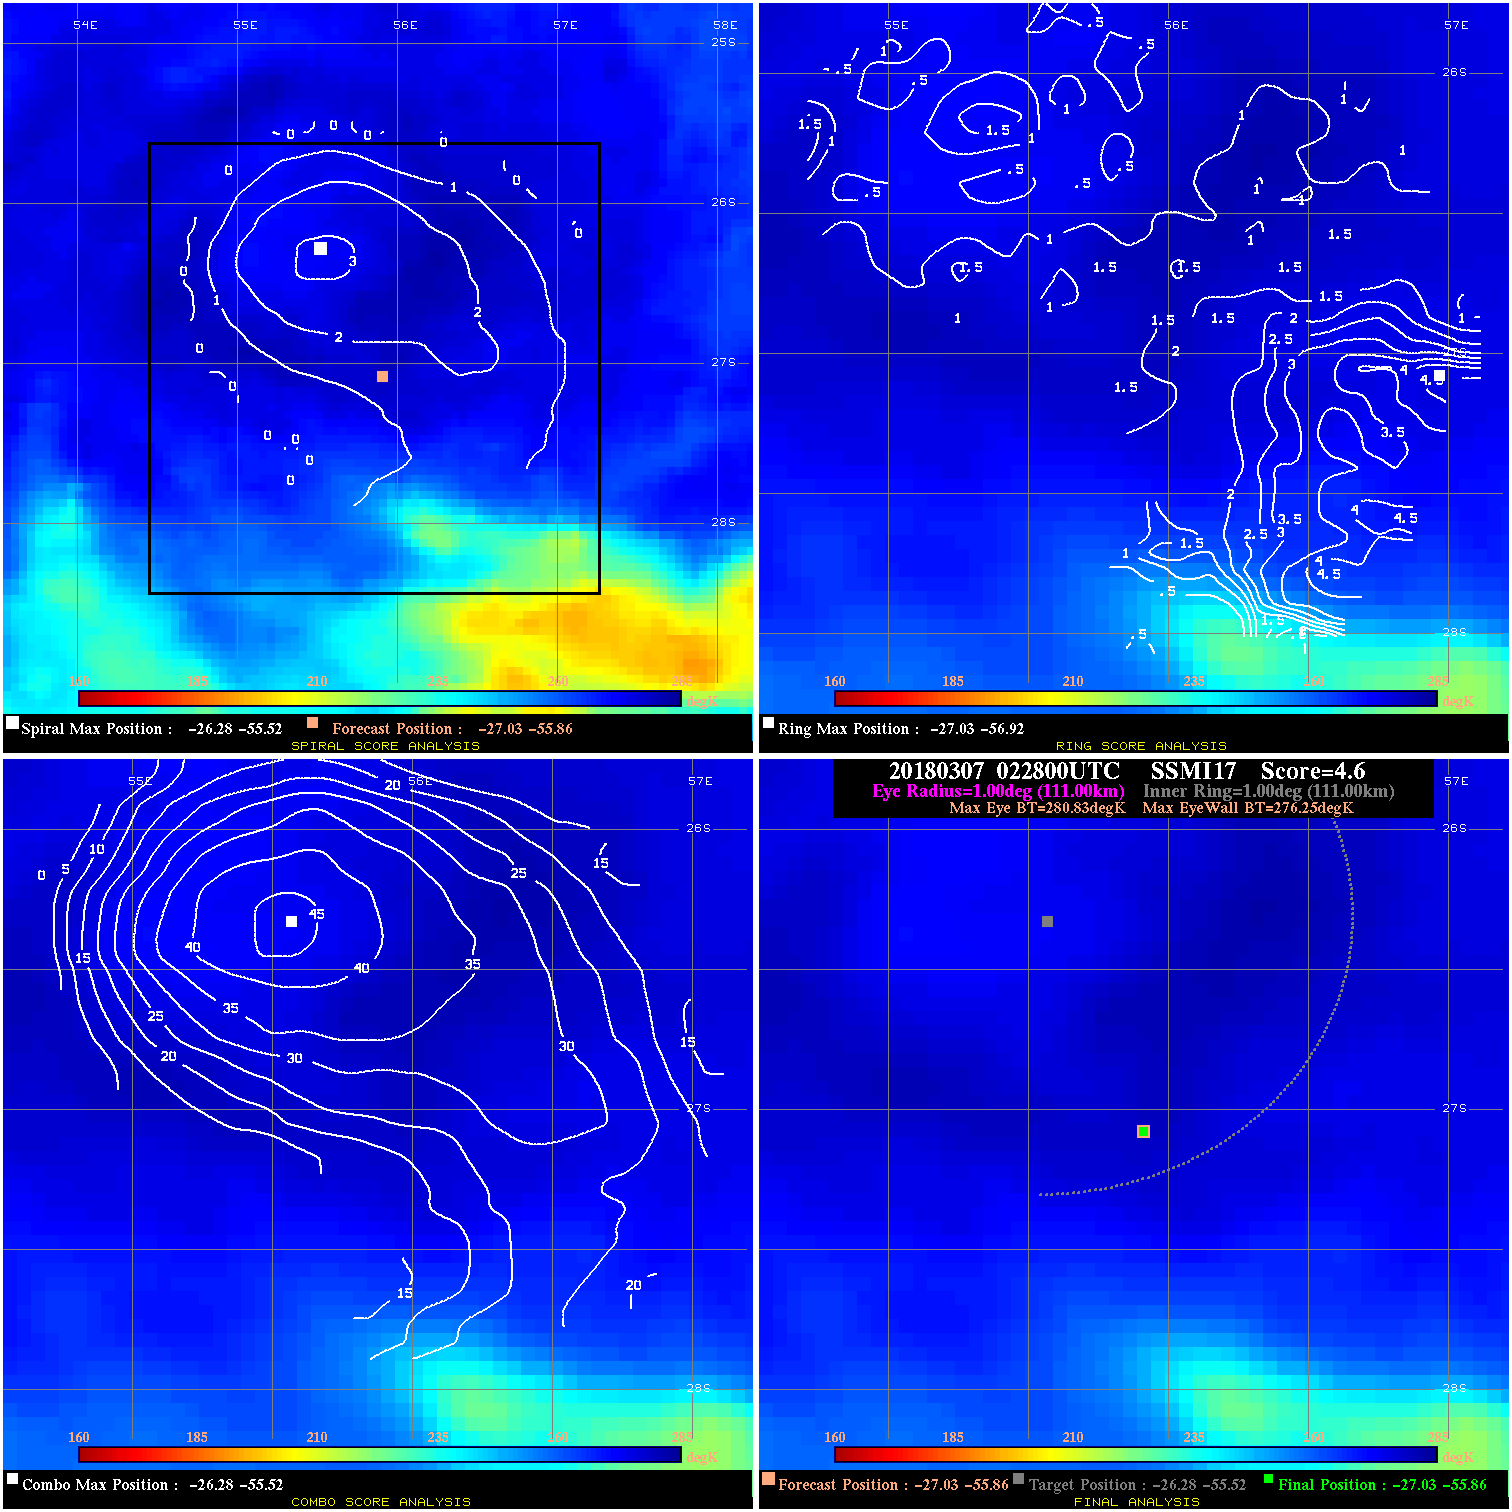
20180307 022800 4.6 N/A N/A 222.20 4.58 55.0 SSMI17 -27.0 -55.9 -27.0 -55.9 -26.3 -55.5 Analysis Plot
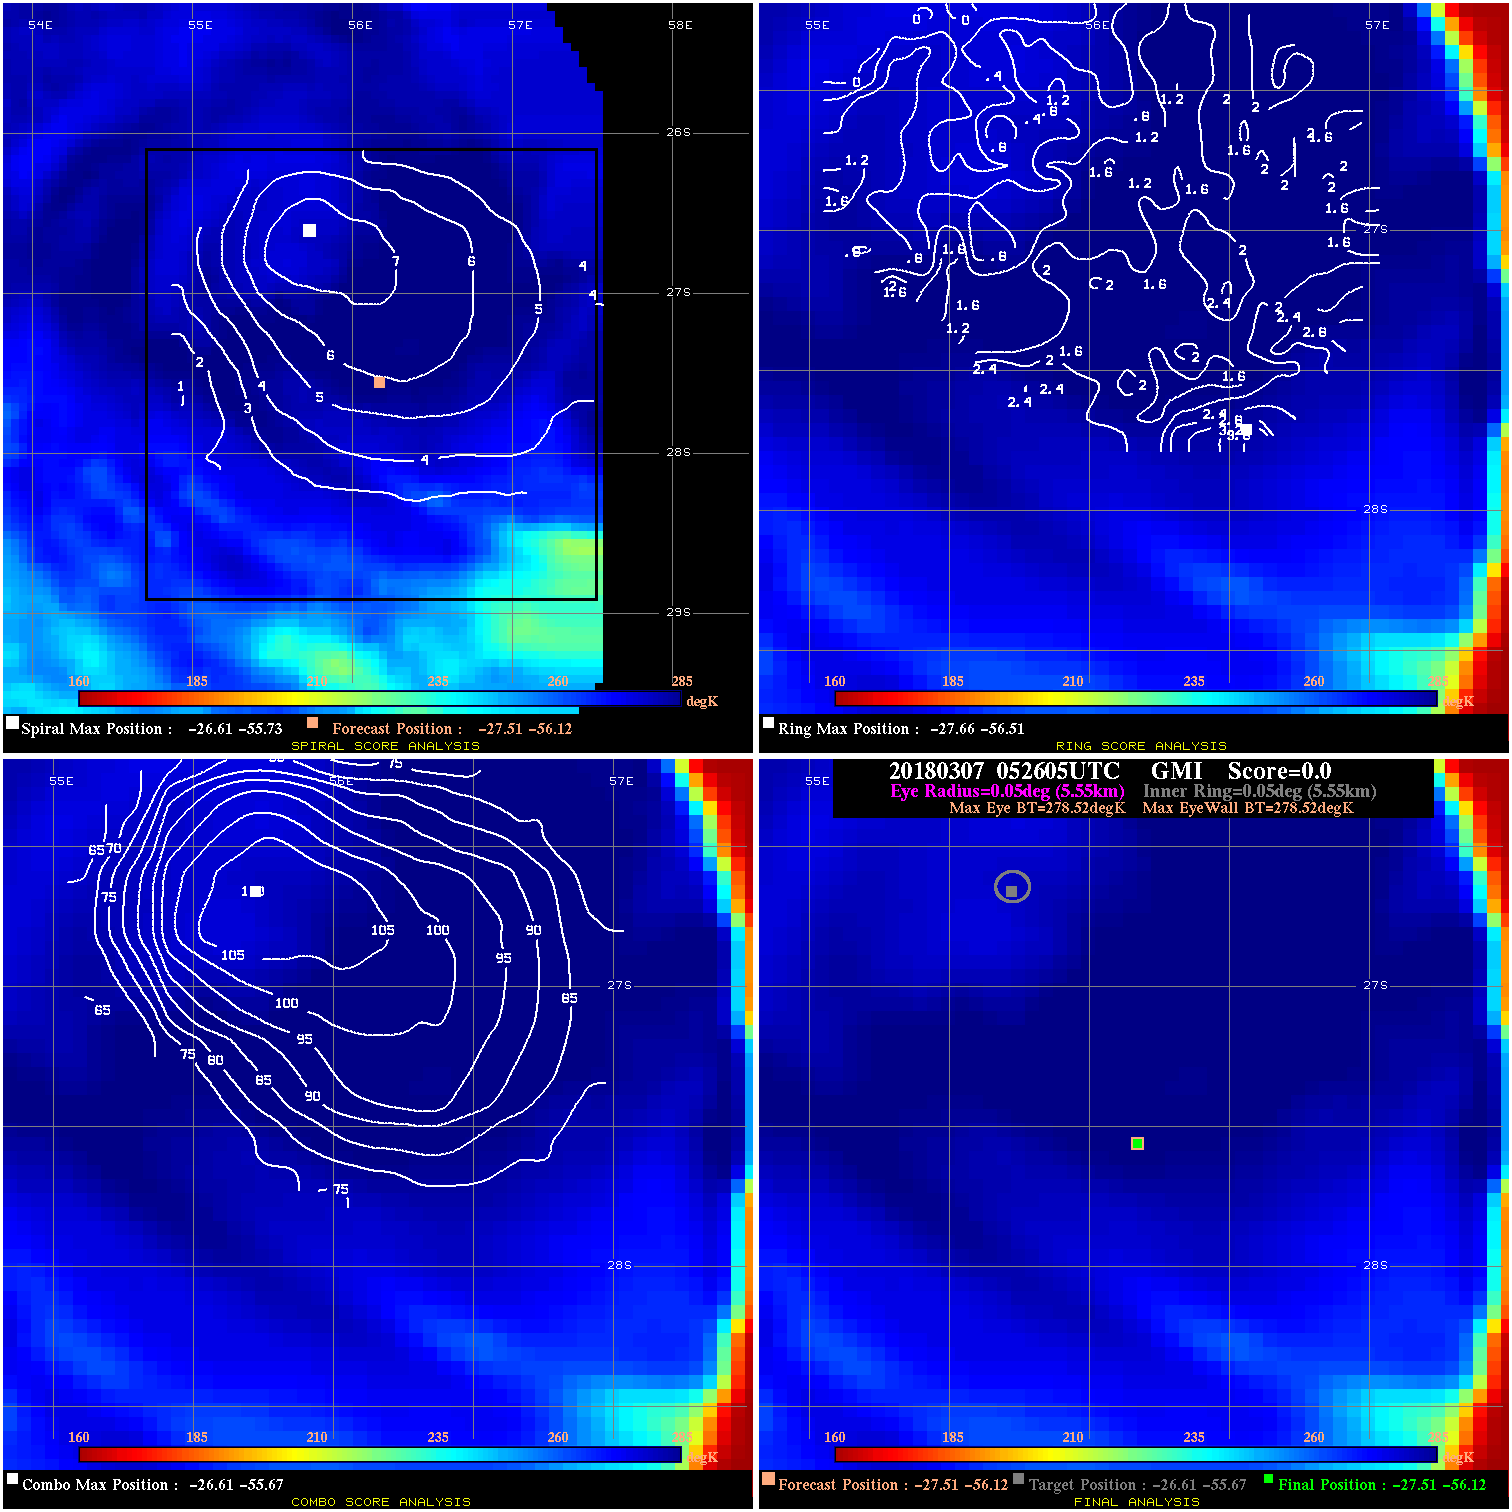
20180307 052605 -0.0 N/A N/A N/A 0.00 55.0 GMI -27.5 -56.1 -27.5 -56.1 -26.6 -55.7 Analysis Plot
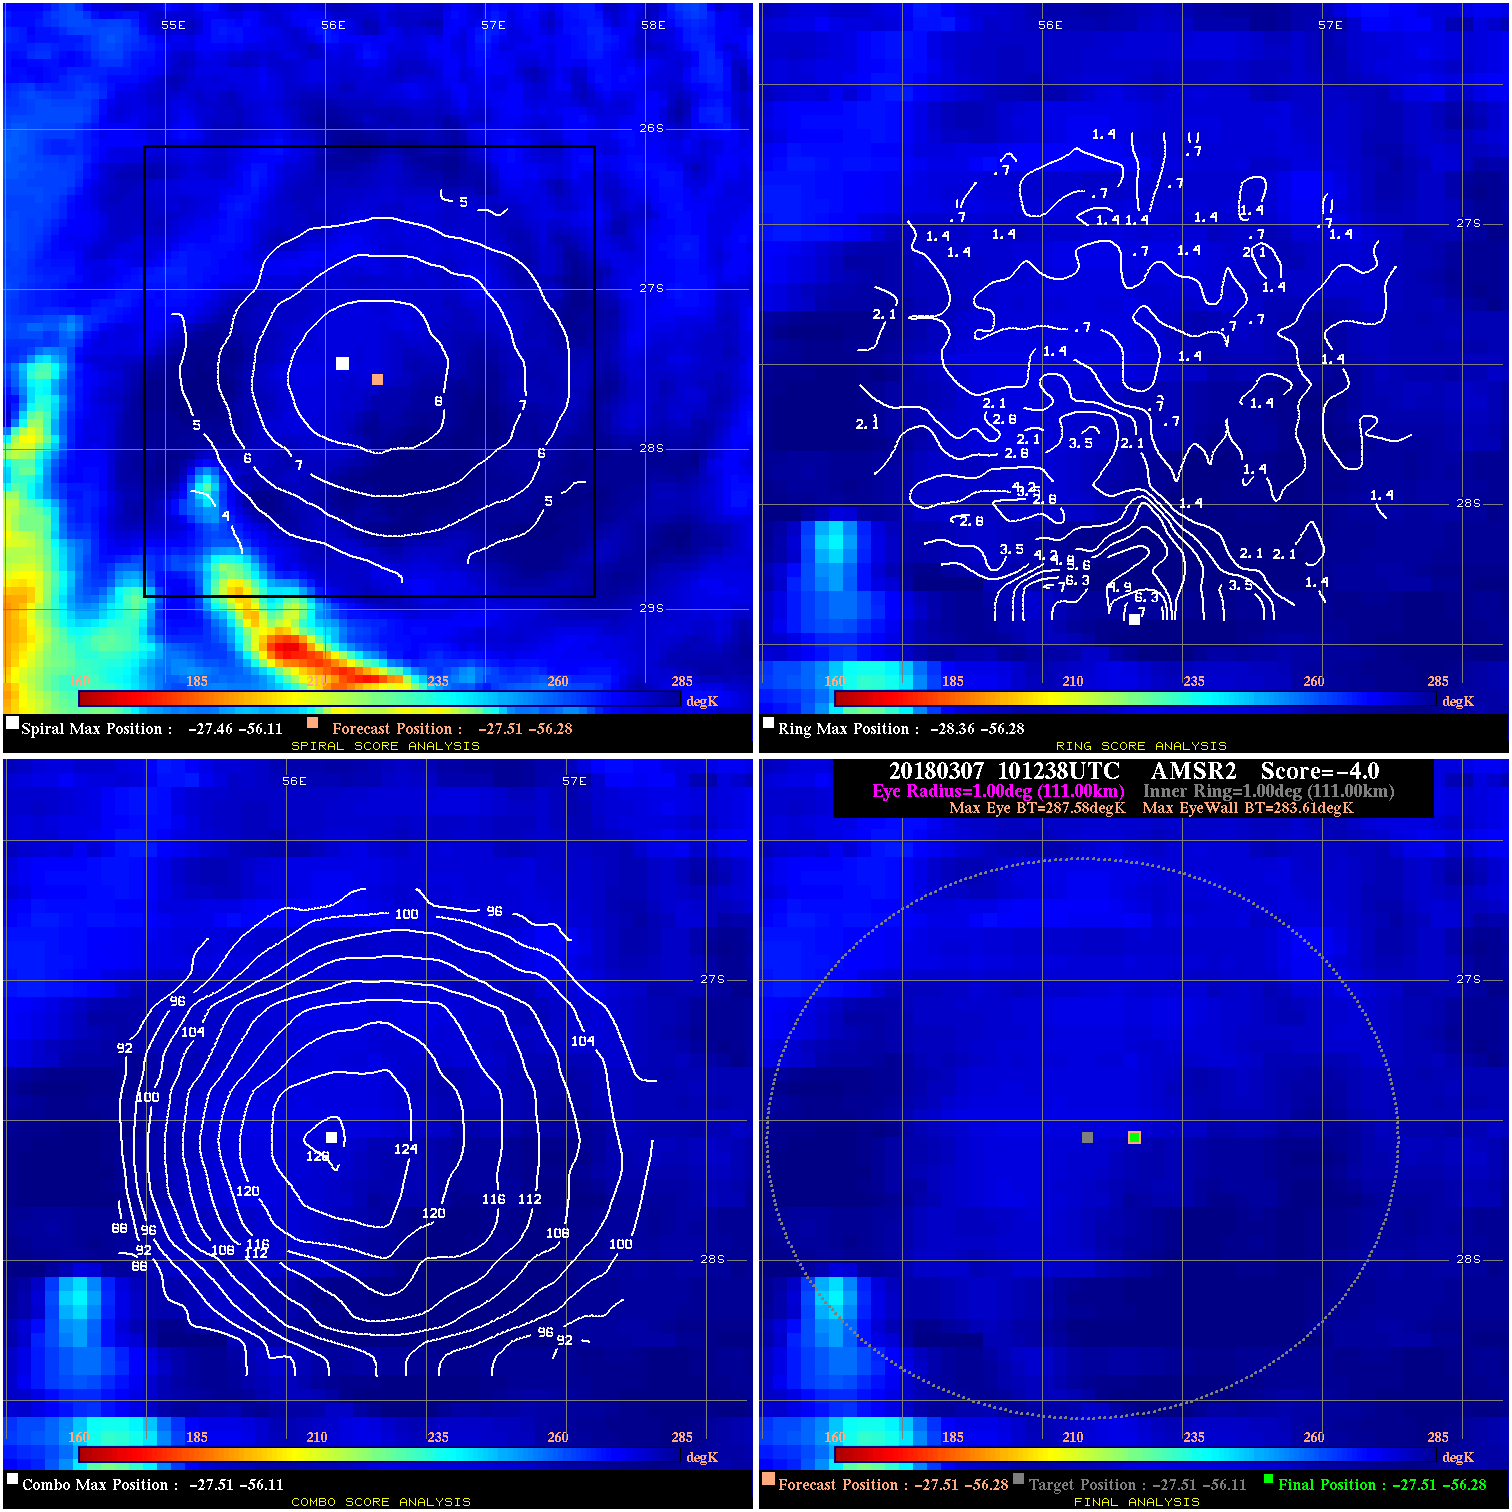
20180307 101238 -4.0 N/A N/A 222.20 3.97 45.0 AMSR2 -27.5 -56.3 -27.5 -56.3 -27.5 -56.1 Analysis Plot
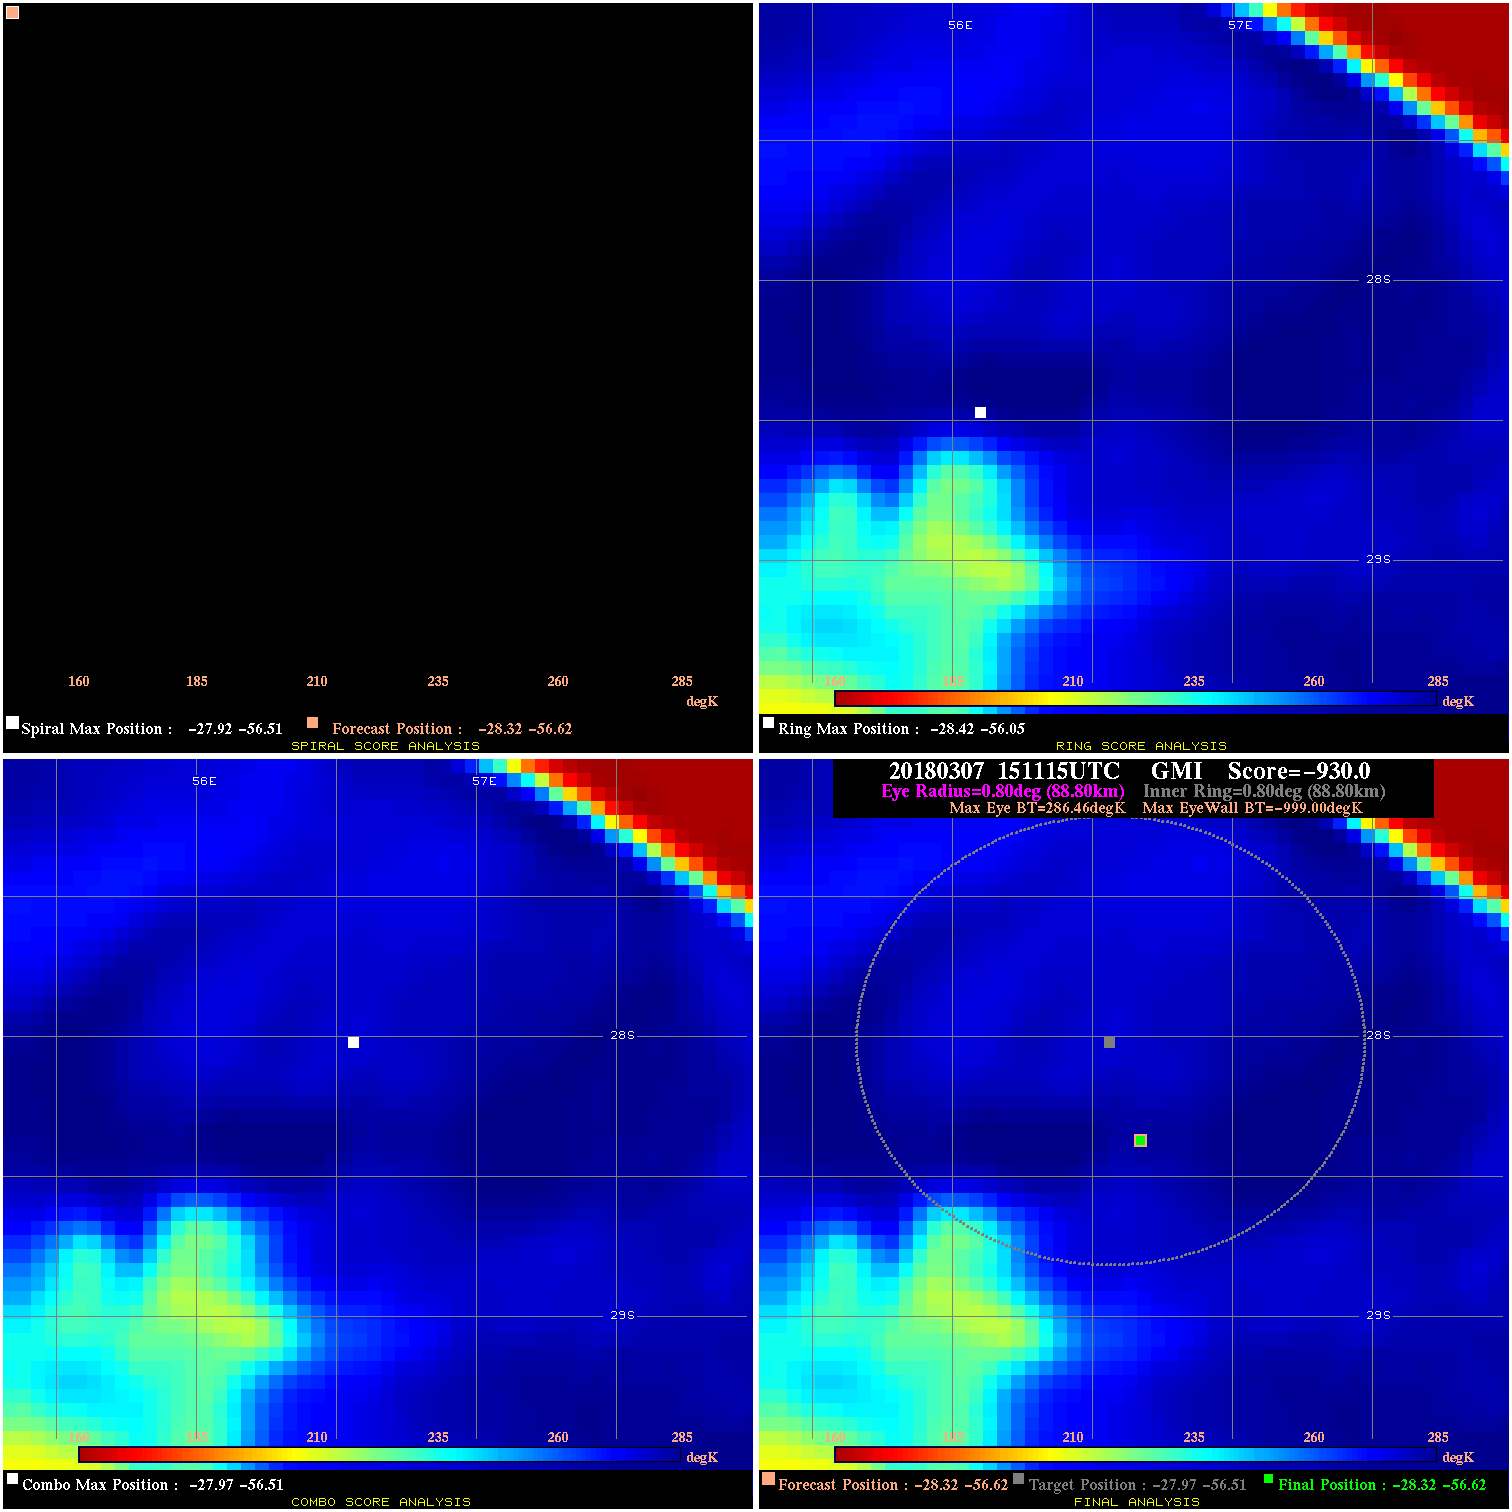
20180307 151115 -930.0 N/A N/A N/A 0.00 40.0 GMI -28.3 -56.6 -28.3 -56.6 -28.0 -56.5 Analysis Plot
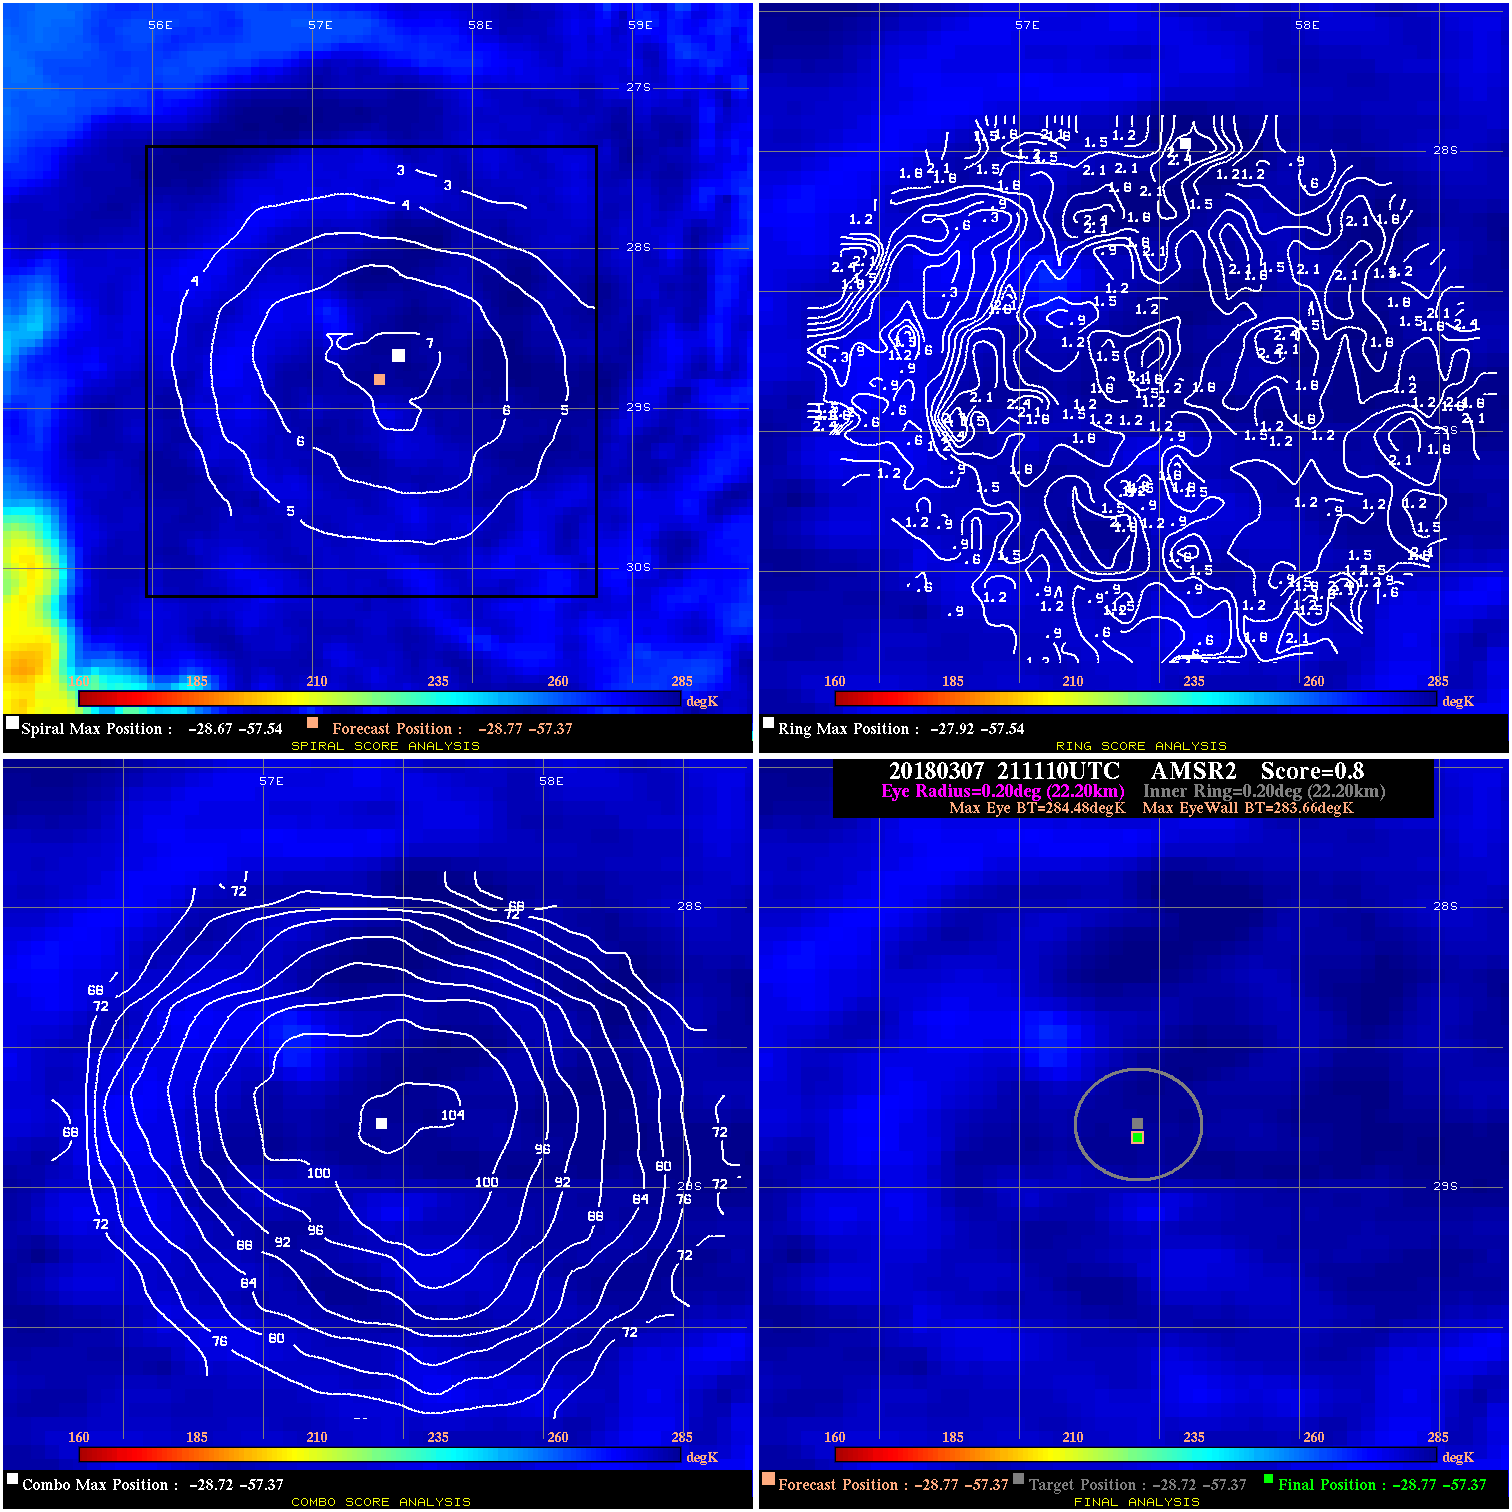
20180307 211110 0.8 N/A N/A 44.44 .82 55.0 AMSR2 -28.8 -57.4 -28.8 -57.4 -28.7 -57.4 Analysis Plot
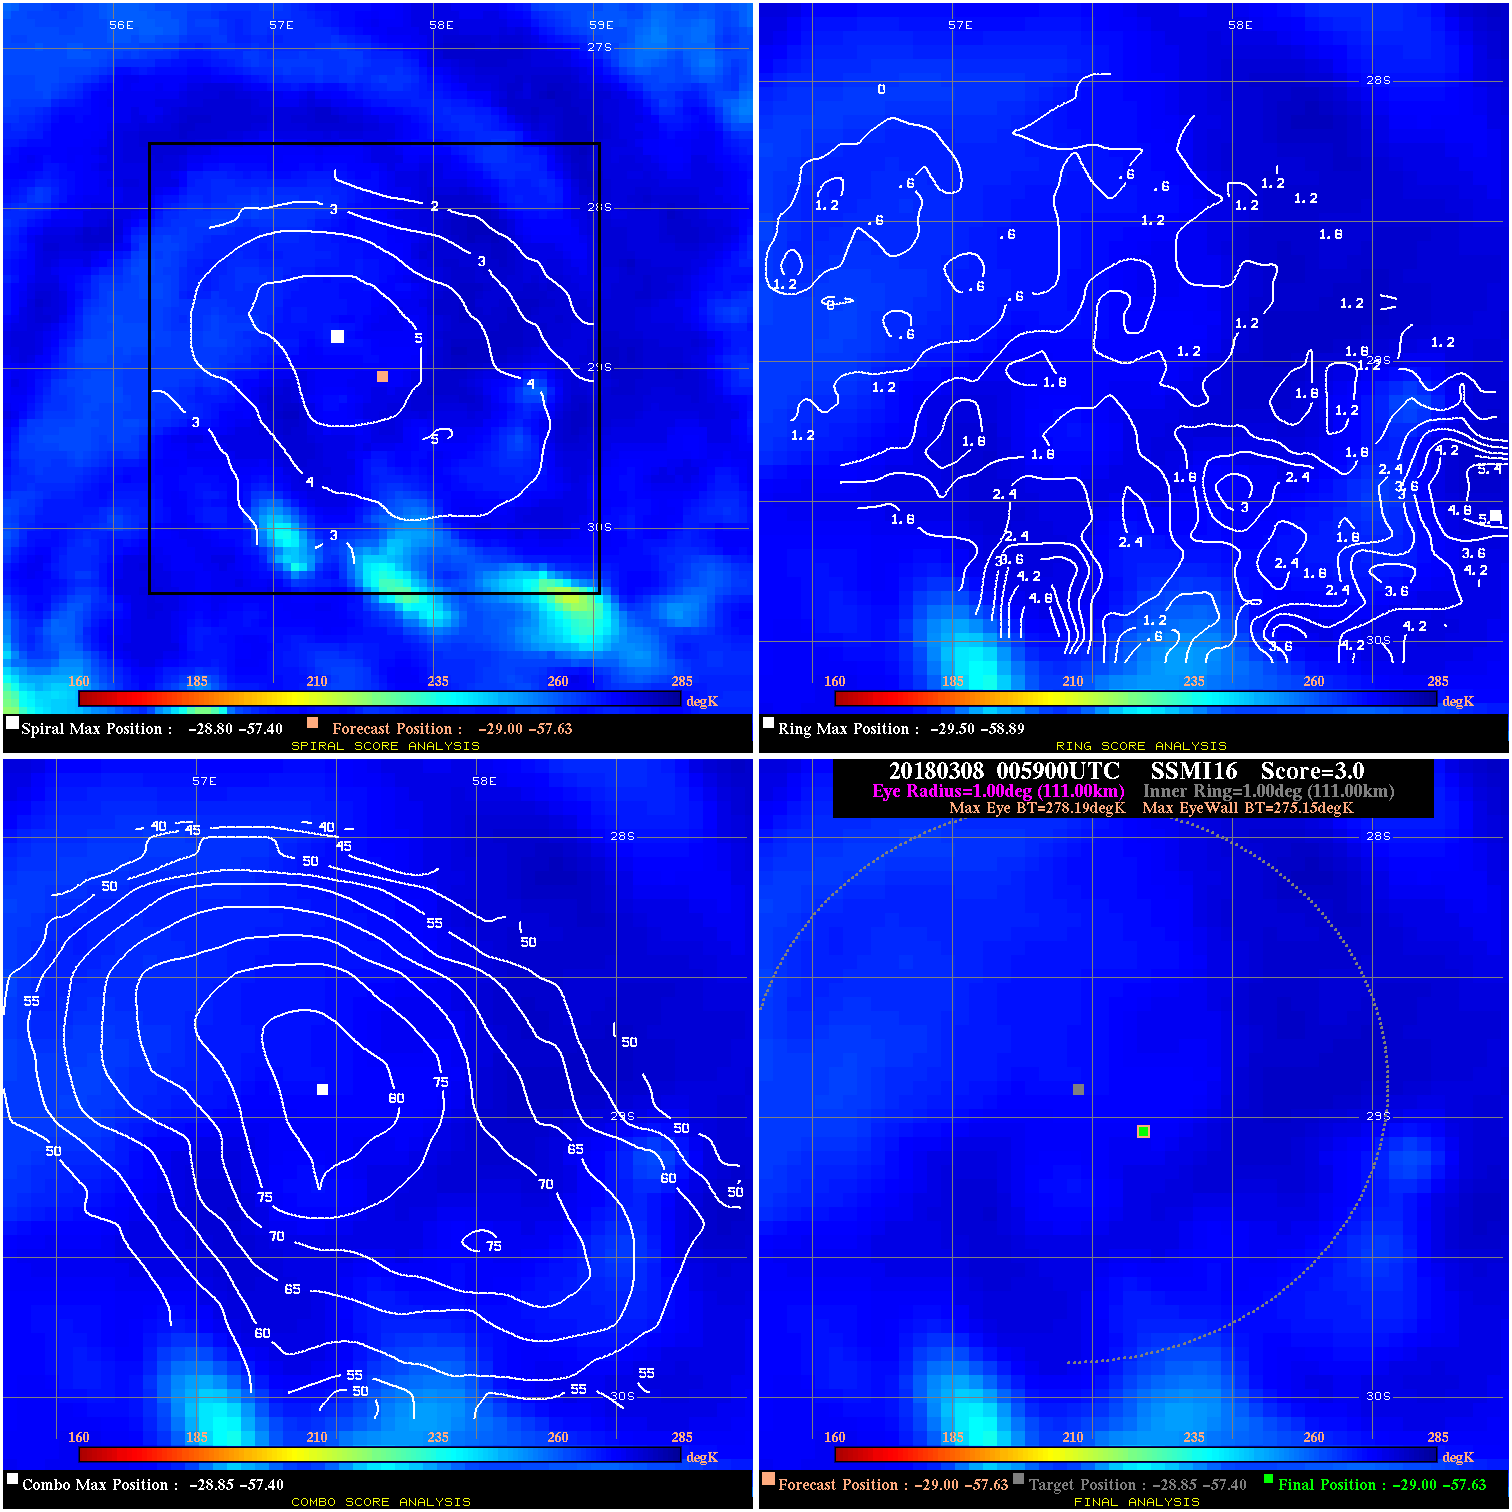
20180308 005900 3.0 N/A N/A 222.20 3.04 55.0 SSMI16 -29.0 -57.6 -29.0 -57.6 -28.9 -57.4 Analysis Plot
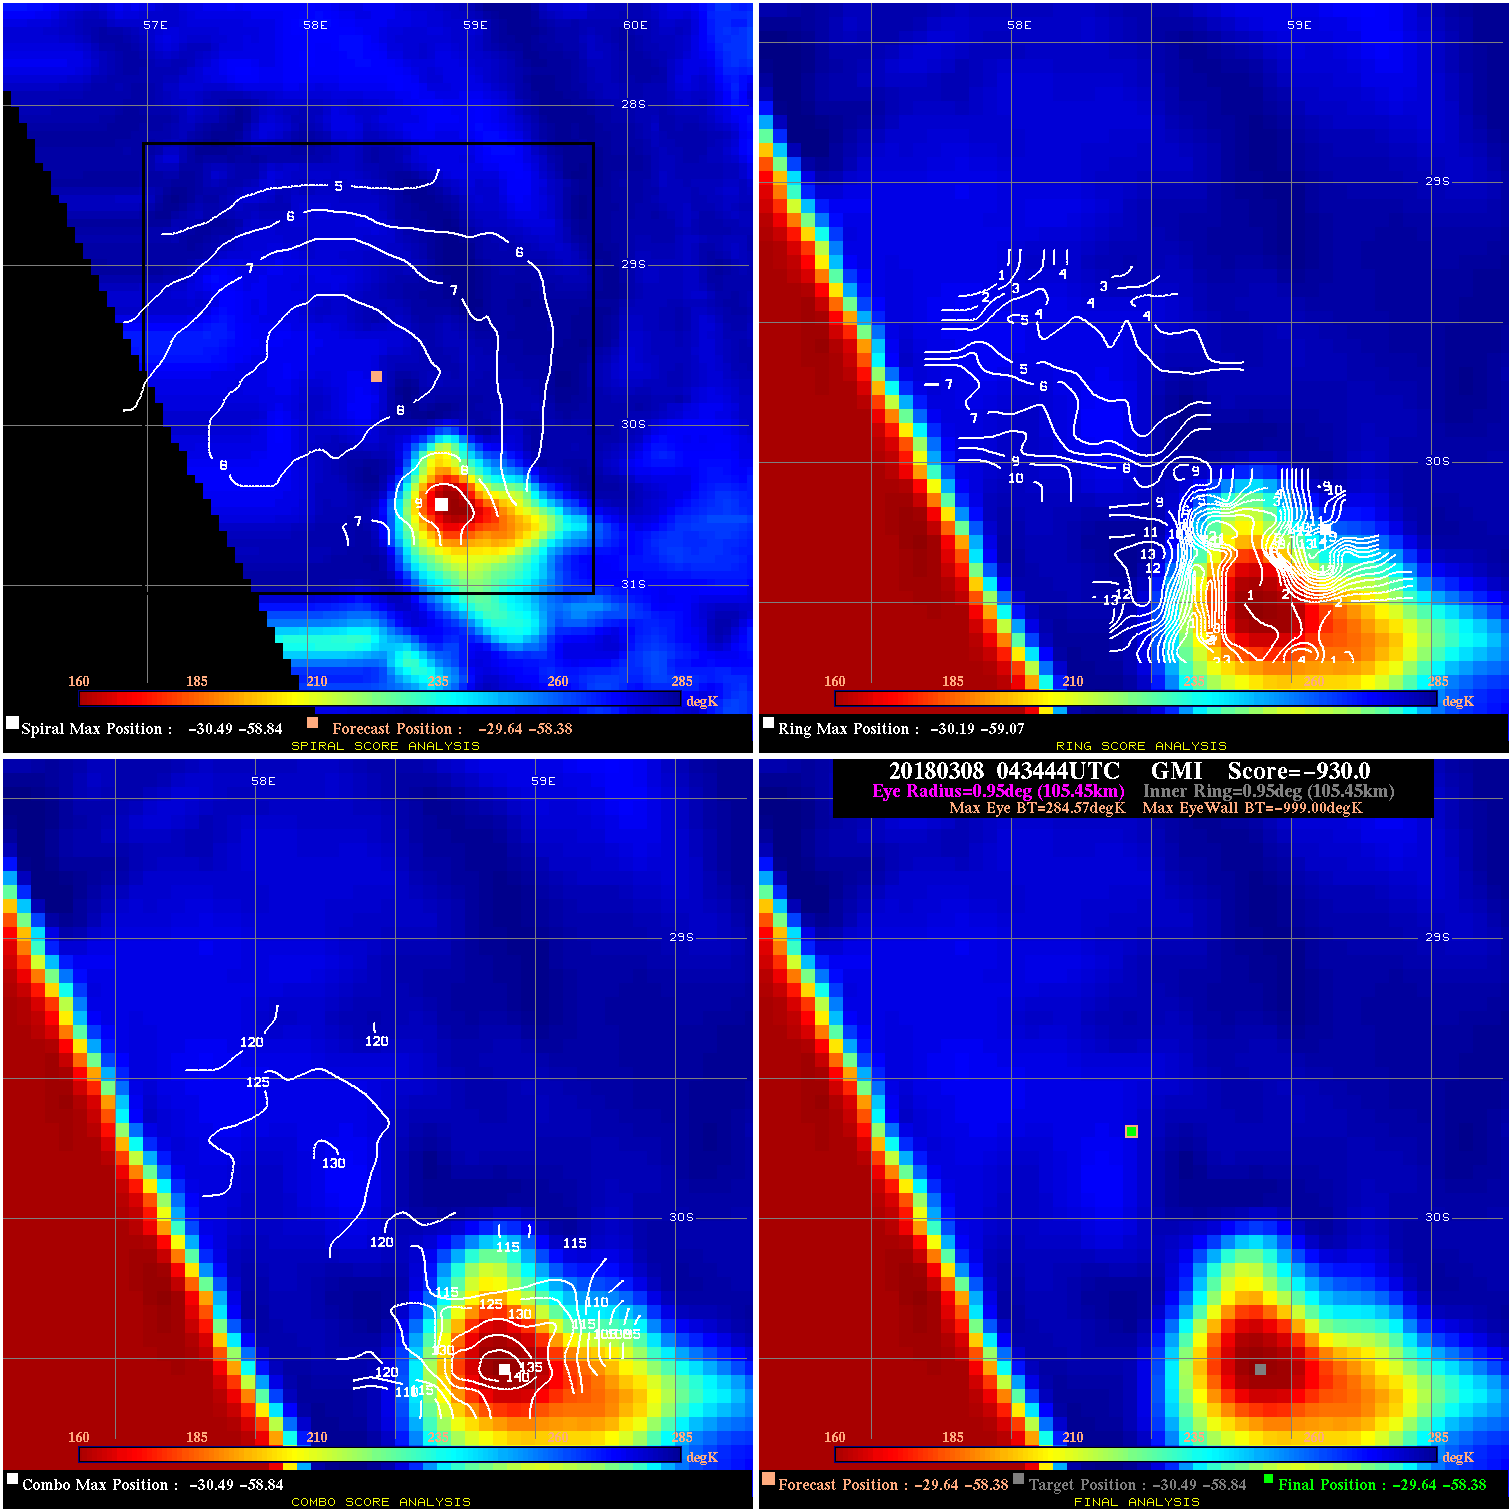
20180308 043444 -930.0 N/A N/A N/A 0.00 55.0 GMI -29.6 -58.4 -29.6 -58.4 -30.5 -58.8 Analysis Plot
|
|
Legend: - Date/Time are determined from PMW imagery at Forecast (initial guess) Lat/Lon position. - Positive/Negative Latitude = North/South Hemisphere; Longitude = Western/Eastern Hemisphere. - "Ring Diam" value indicates the estimated surface eyewall diameter in km (the MI eyewall edge diameter minus 10 km). - "Ring Pct" is the percentage of the "ring" (eyewall inner boundary) that is 1) colder than the "hot spot" (warmest eye pixel) in the eye by 20K, or 2) the percentage that is a) colder than 232K and b) colder than the "hot spot" by 10K, whichever is greater. - Values are red if Ring % <= 65, yellow/brown if Ring % <= 85 and green if Ring % > 85. - "Tb diff" is the difference between the "hot spot" (warmest eye pixel) and the warmest pixel on the eyewall. - Intensity score are listed as negative, and not used, when the JTWC or NHC estimated Vmax is <55 kts in order to rule out weak but highly symmetric TCs. - Error messages in intensity scores: -920 is used when the hottest pixel in the eye is <200K, to prevent false positives; -930 means <85% of eyewall has observations/data. |