Tropical Depression 12W
|
Passive Microwave (PMW) Intensity Information Hurricane Intensity Estimation (HIE) Algorithm Version 9.0 |
Overpass Inten Ring Ring Wind Forecast Final Target
Date Time Score Meaning Pct Diam BTdiff Est Sat Lat Lon Lat Lon Lat Lon
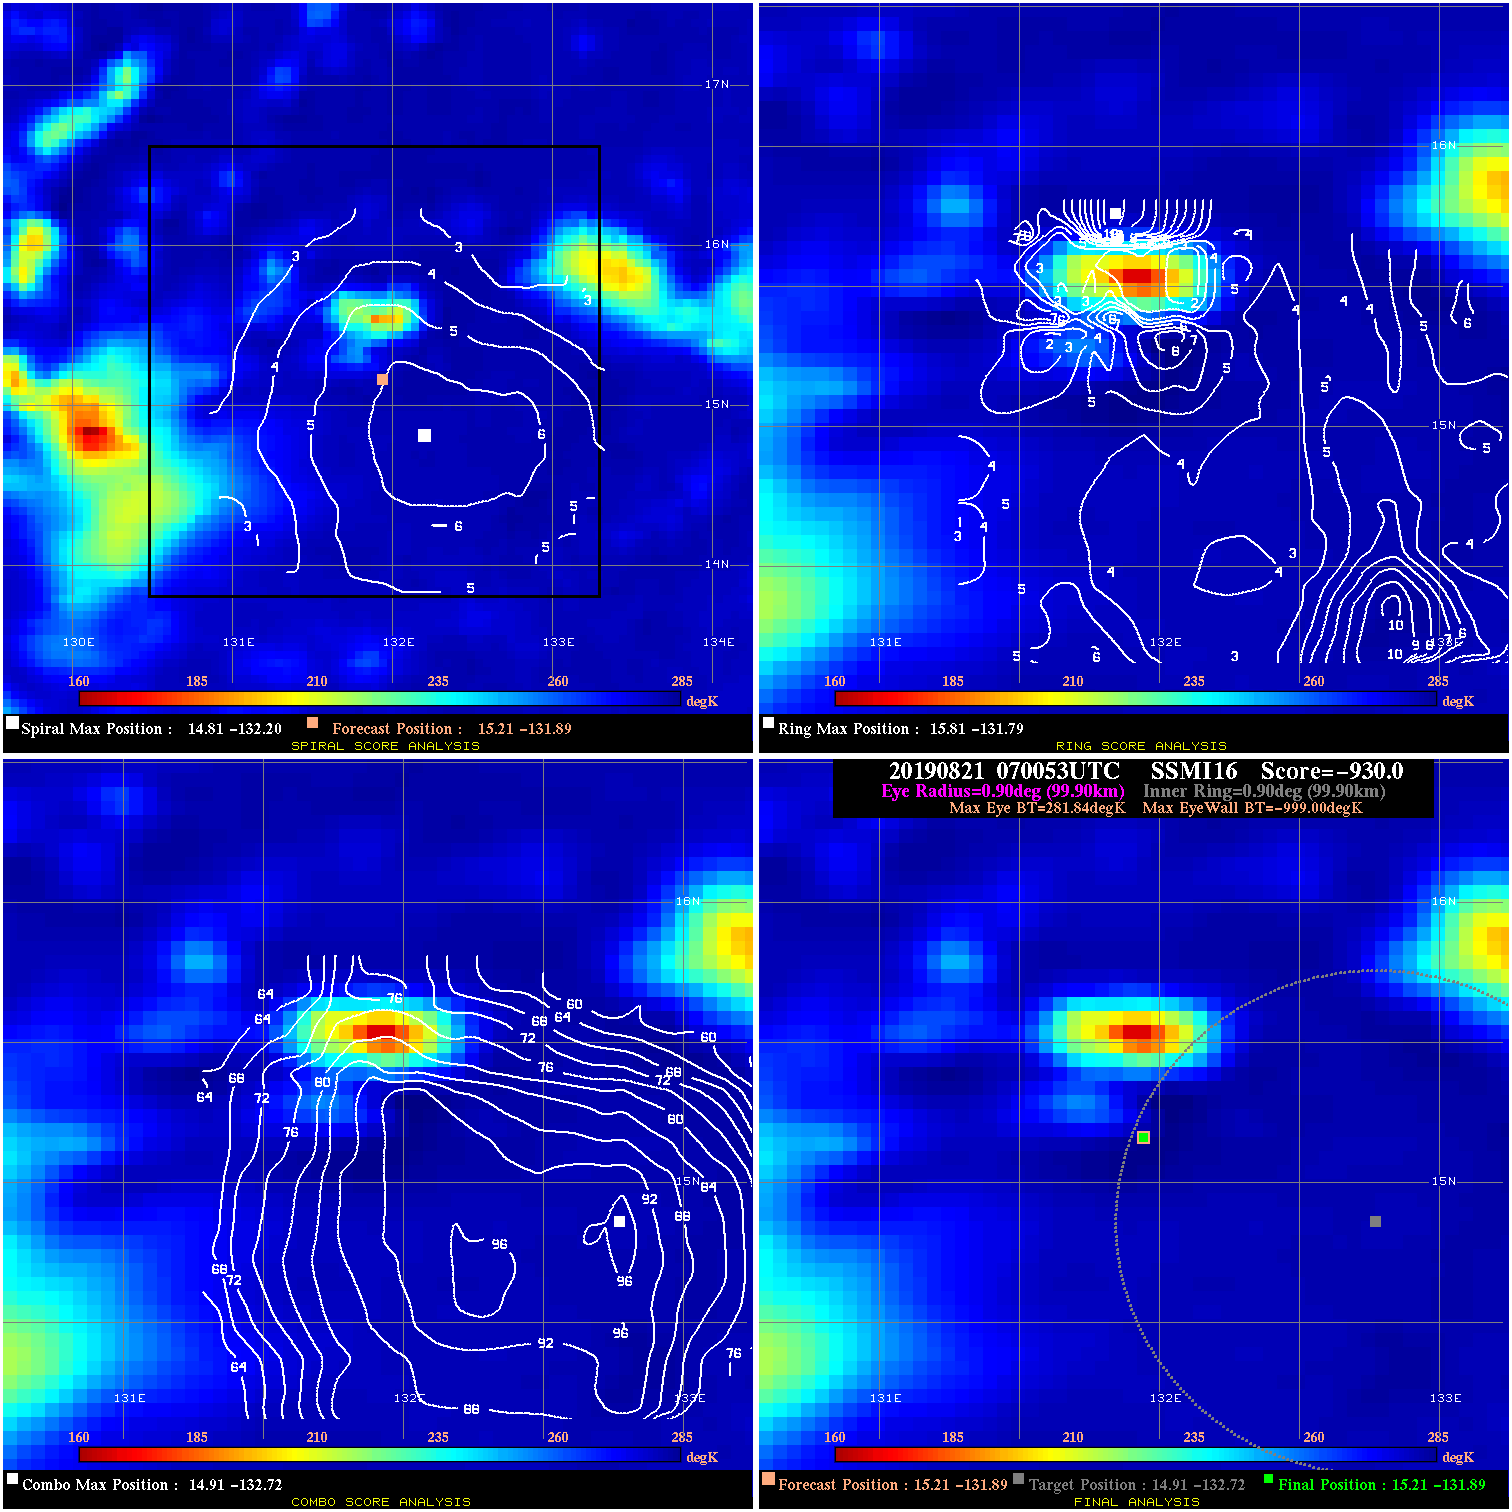
20190821 070053 -930.0 N/A N/A N/A 0.00 25.0 SSMI16 15.2 -131.9 15.2 -131.9 14.9 -132.7 Analysis Plot
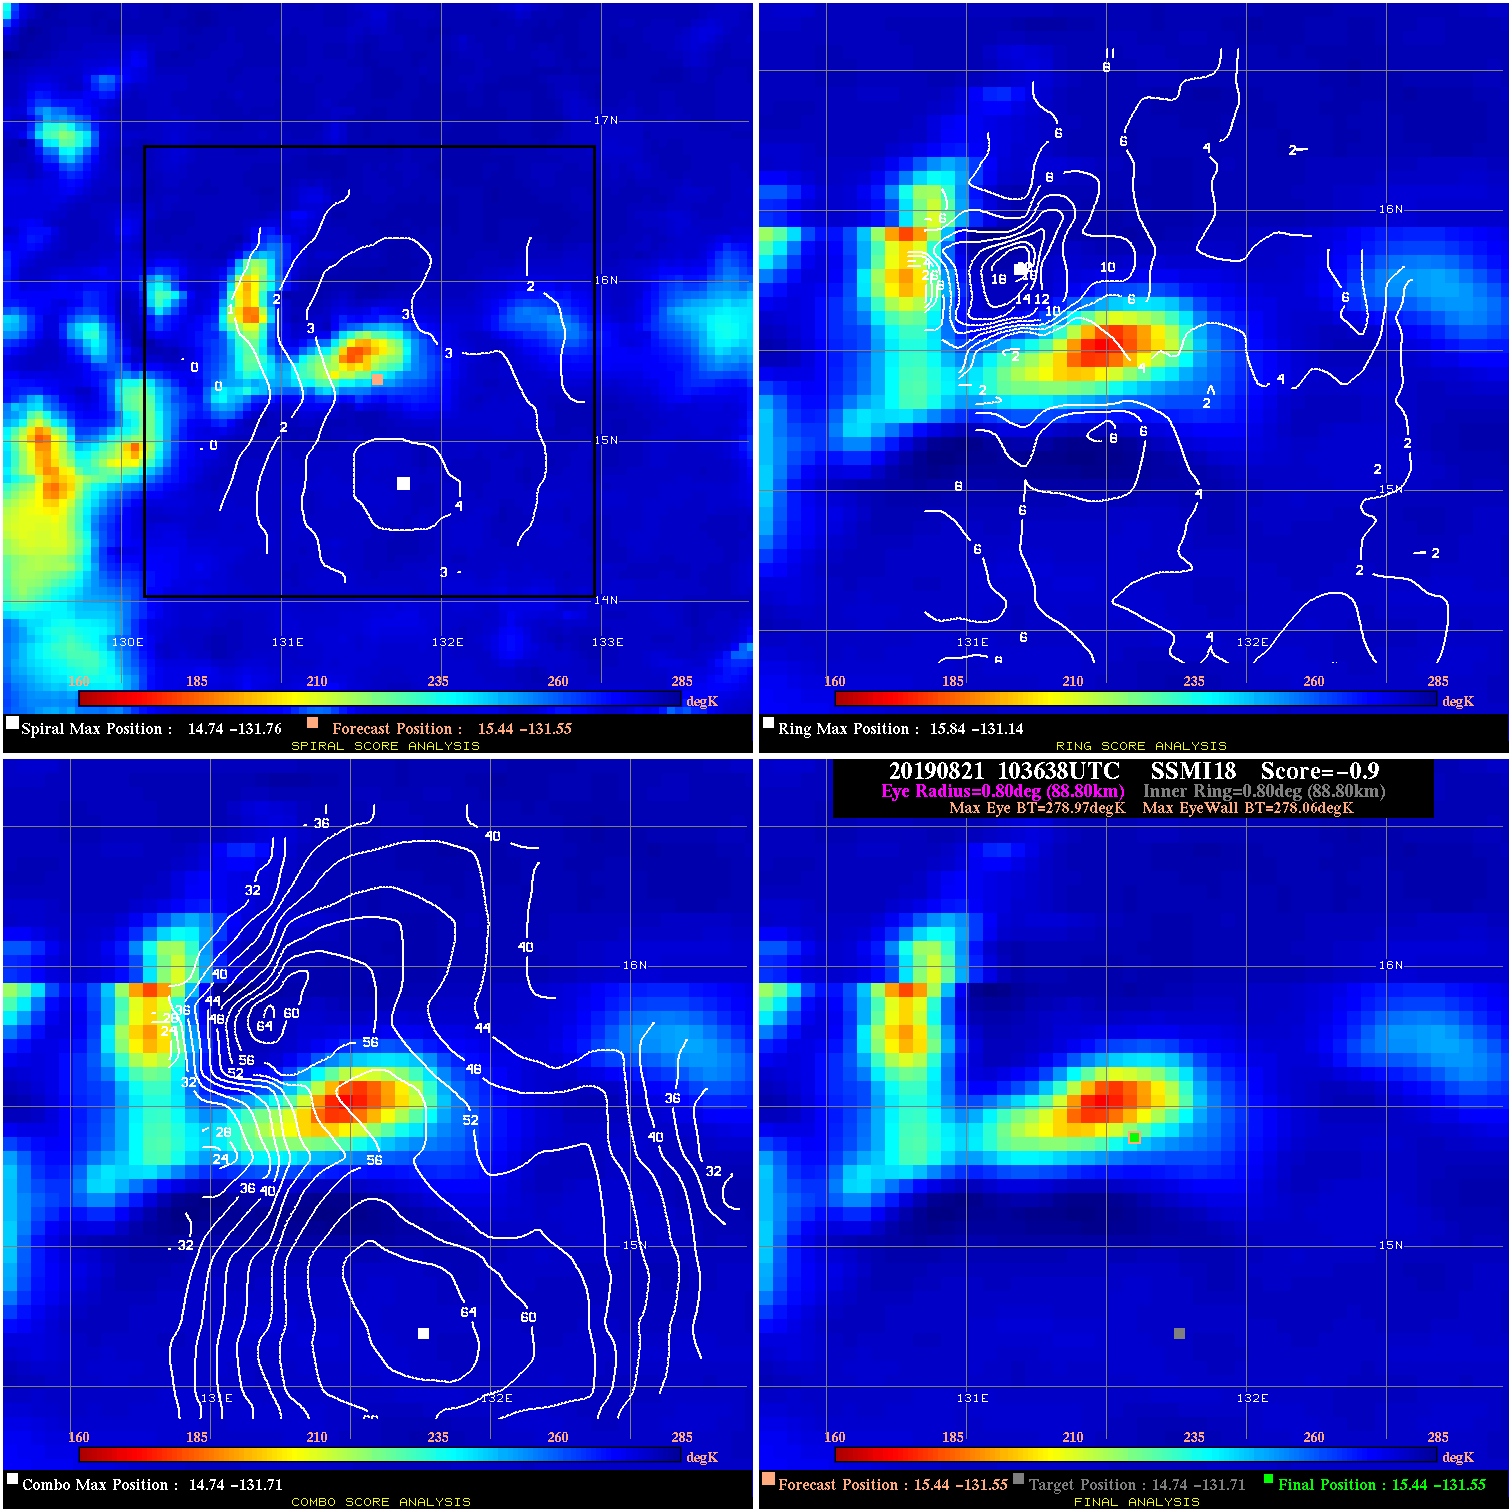
20190821 103638 -0.9 N/A 8.2% 177.76 .91 25.0 SSMI18 15.4 -131.6 15.4 -131.6 14.7 -131.7 Analysis Plot
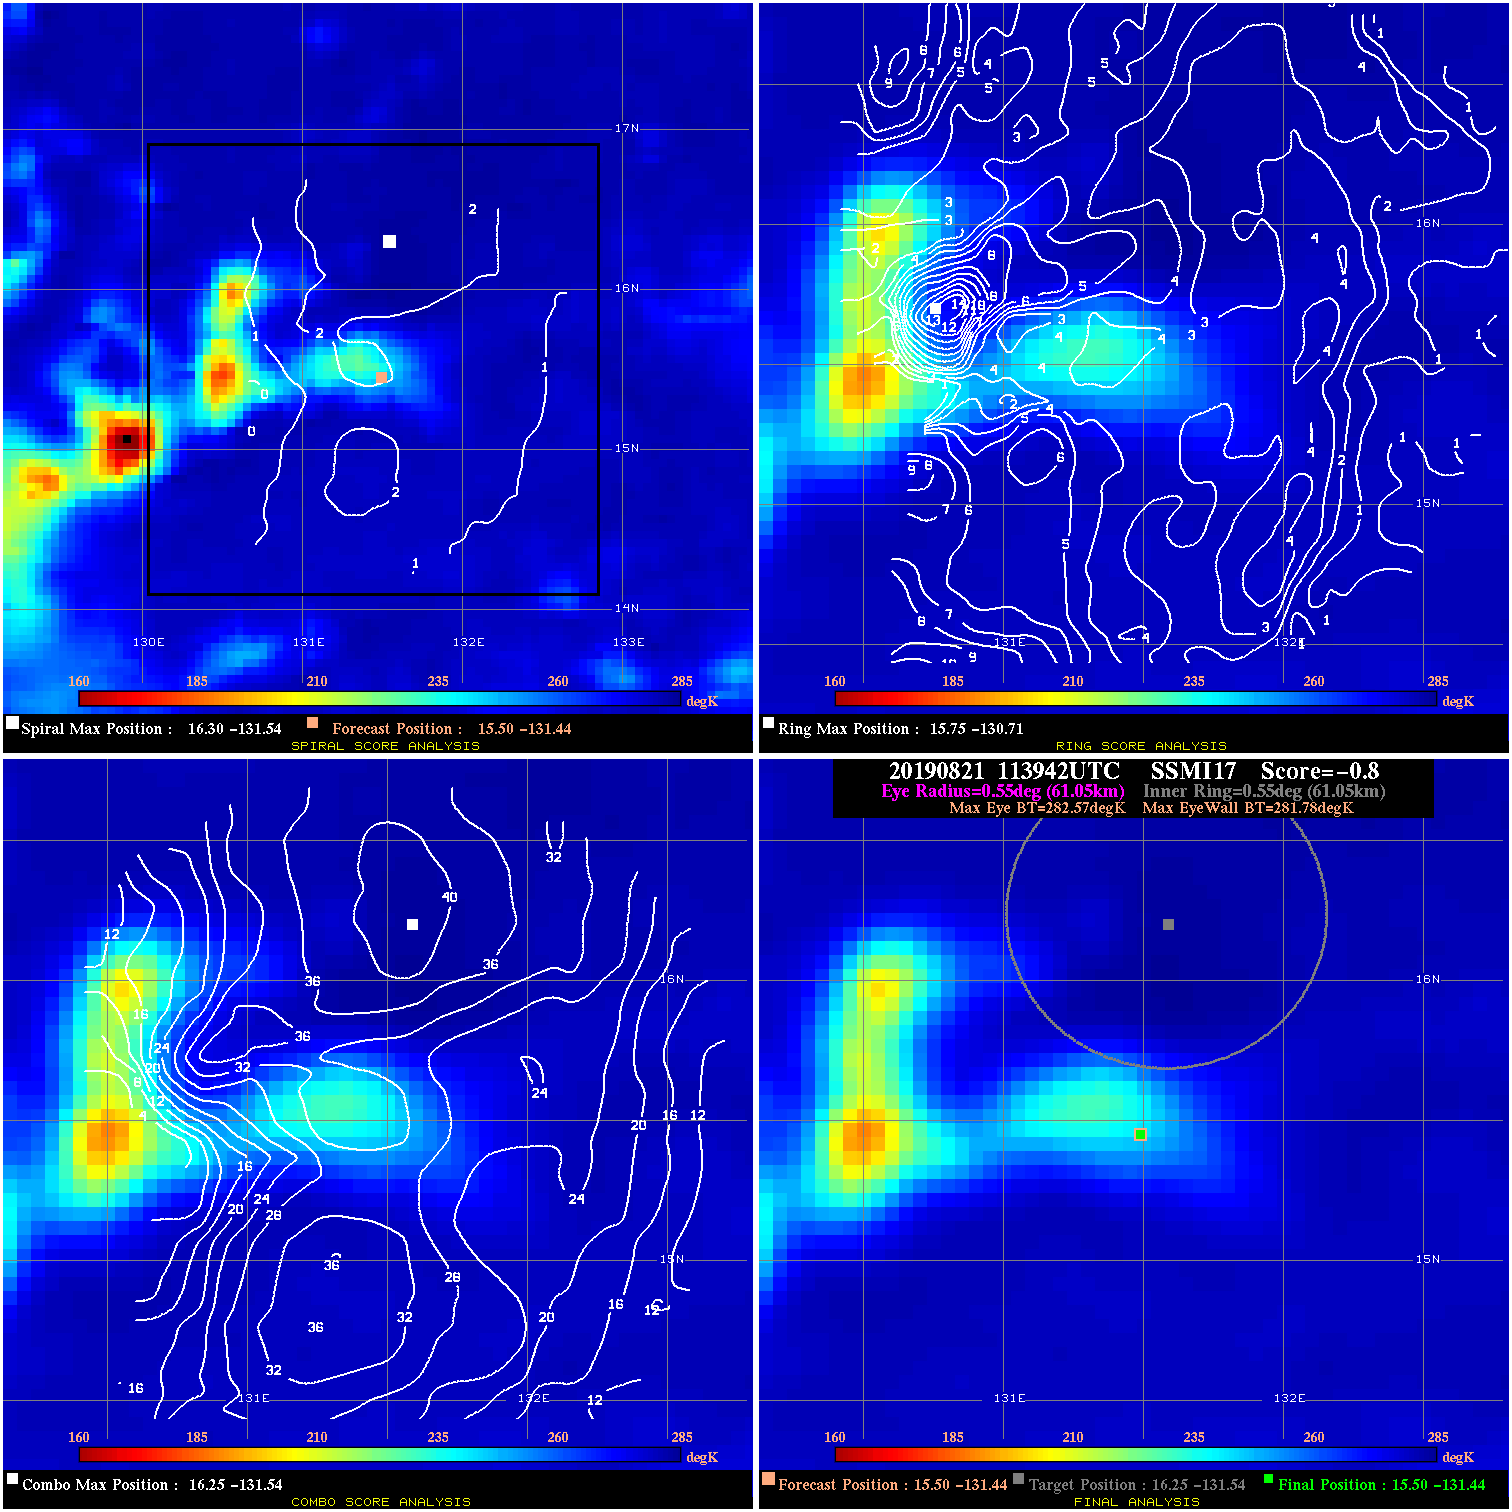
20190821 113942 -0.8 N/A N/A 122.21 .79 25.0 SSMI17 15.5 -131.4 15.5 -131.4 16.3 -131.5 Analysis Plot
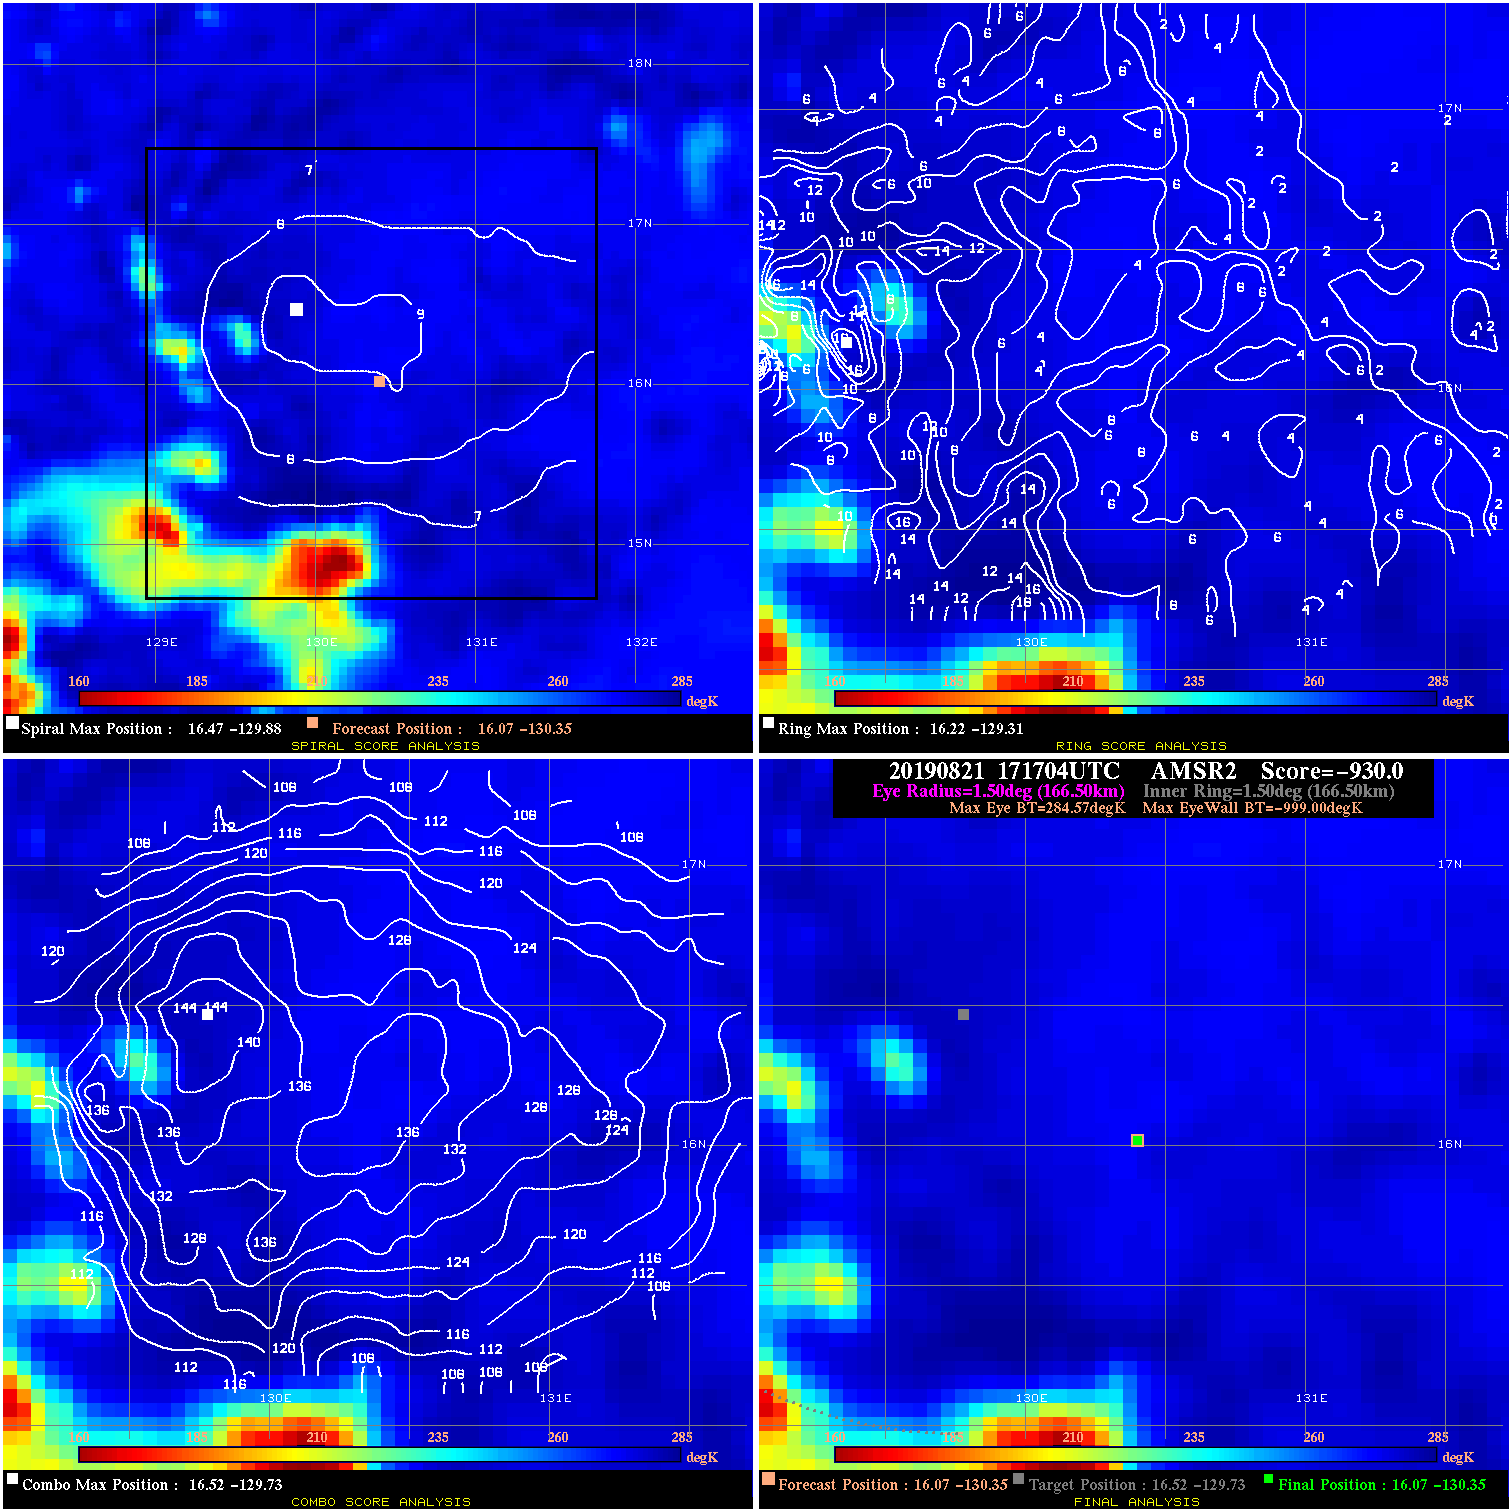
20190821 171704 -930.0 N/A N/A N/A 0.00 30.0 AMSR2 16.1 -130.4 16.1 -130.4 16.5 -129.7 Analysis Plot
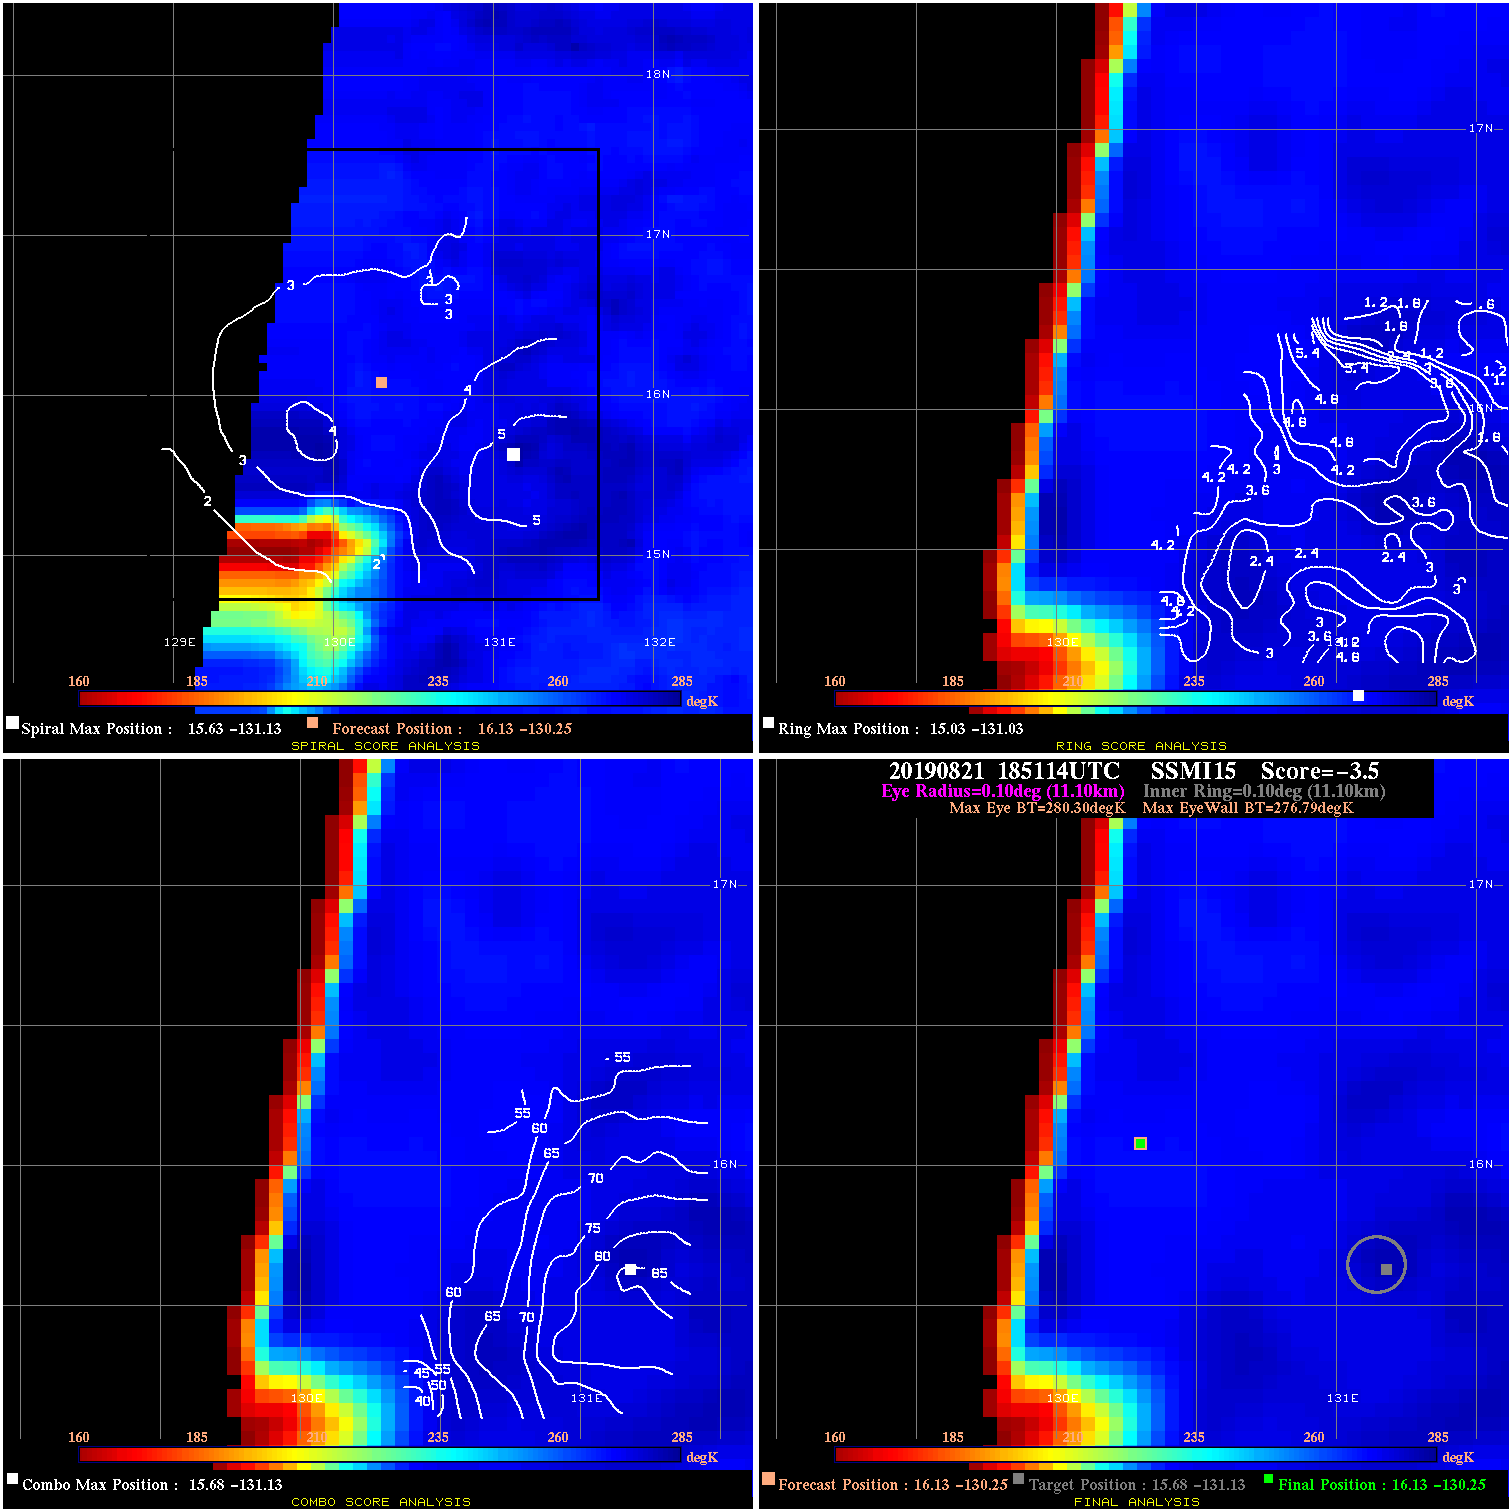
20190821 185114 -3.5 N/A N/A 22.22 3.51 30.0 SSMI15 16.1 -130.3 16.1 -130.3 15.7 -131.1 Analysis Plot
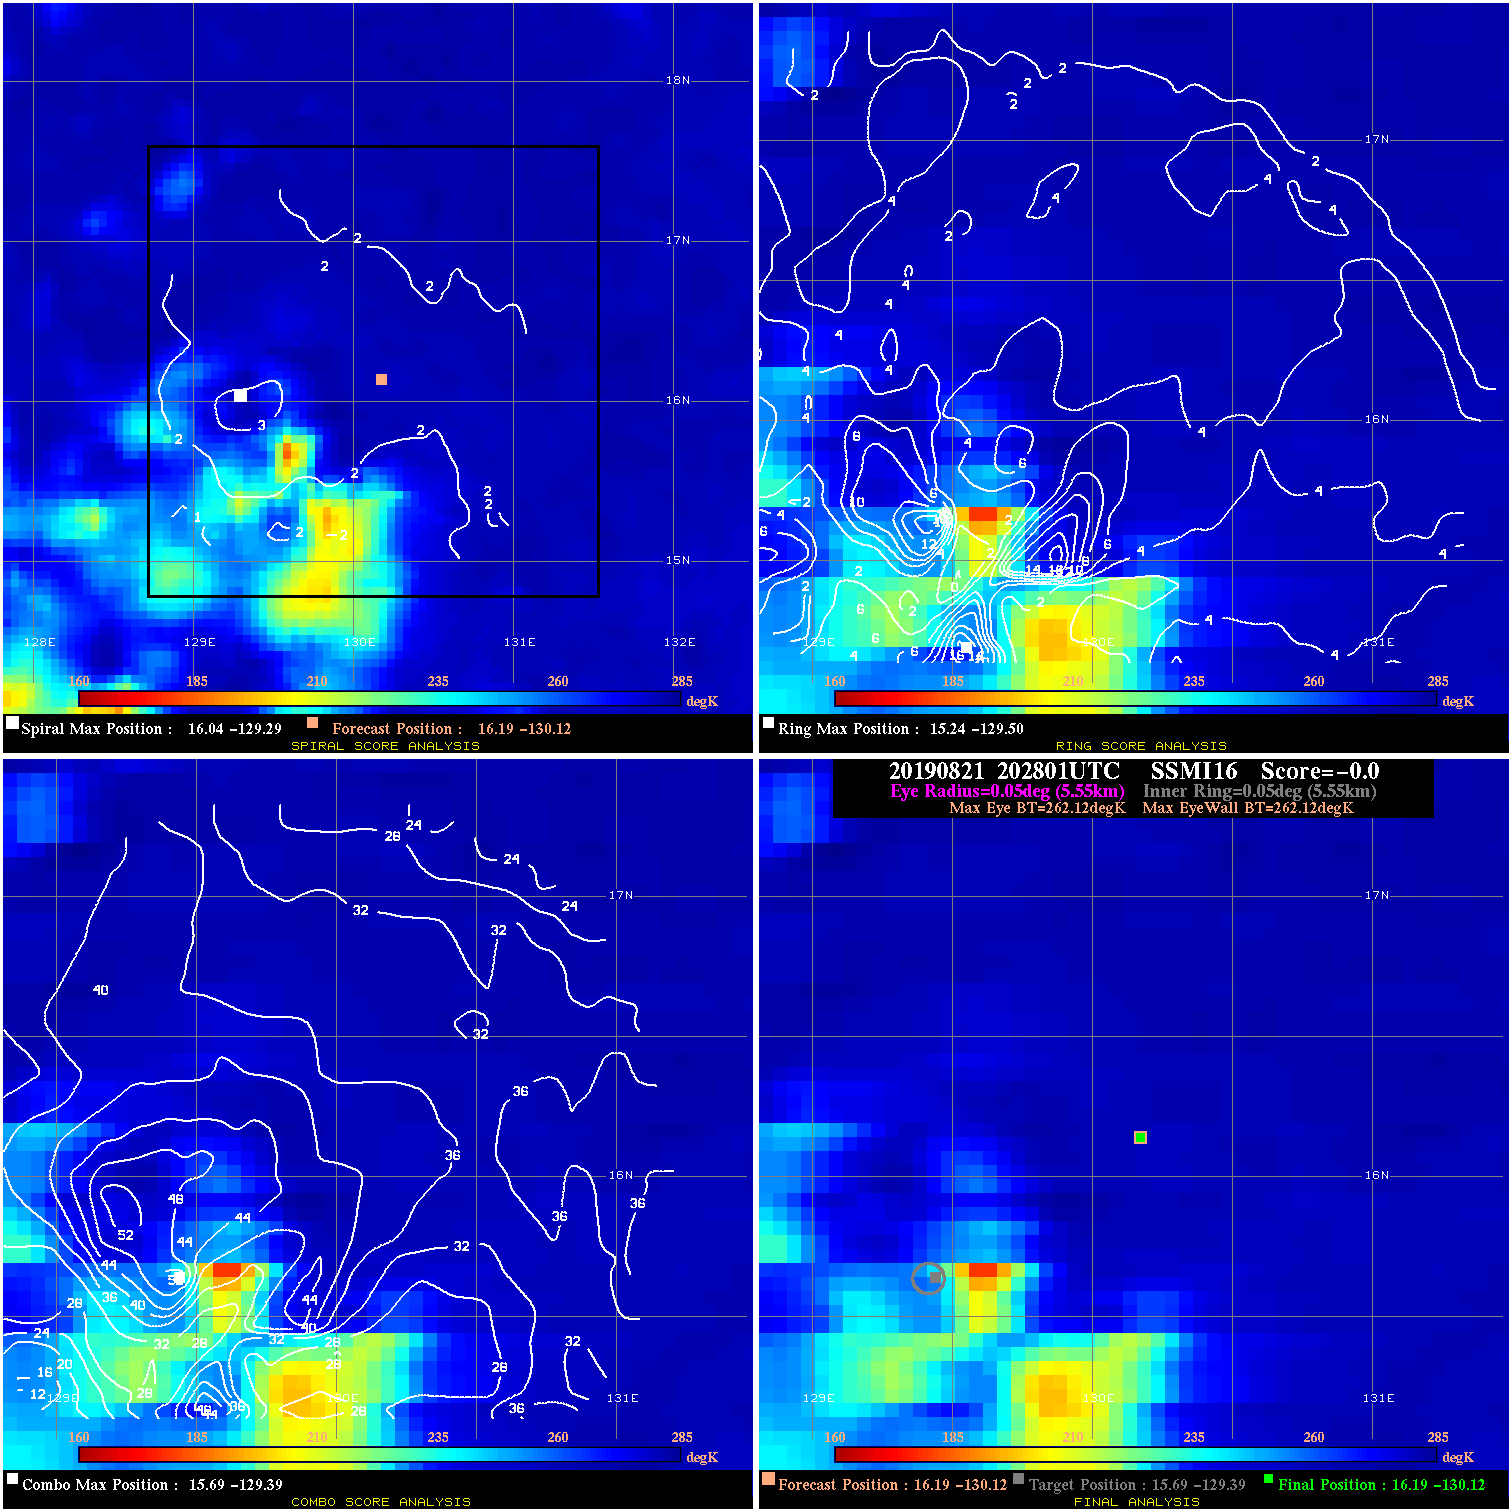
20190821 202801 N/A N/A N/A N/A N/A 35.0 SSMI16 16.2 -130.1 16.2 -130.1 15.7 -129.4 Analysis Plot
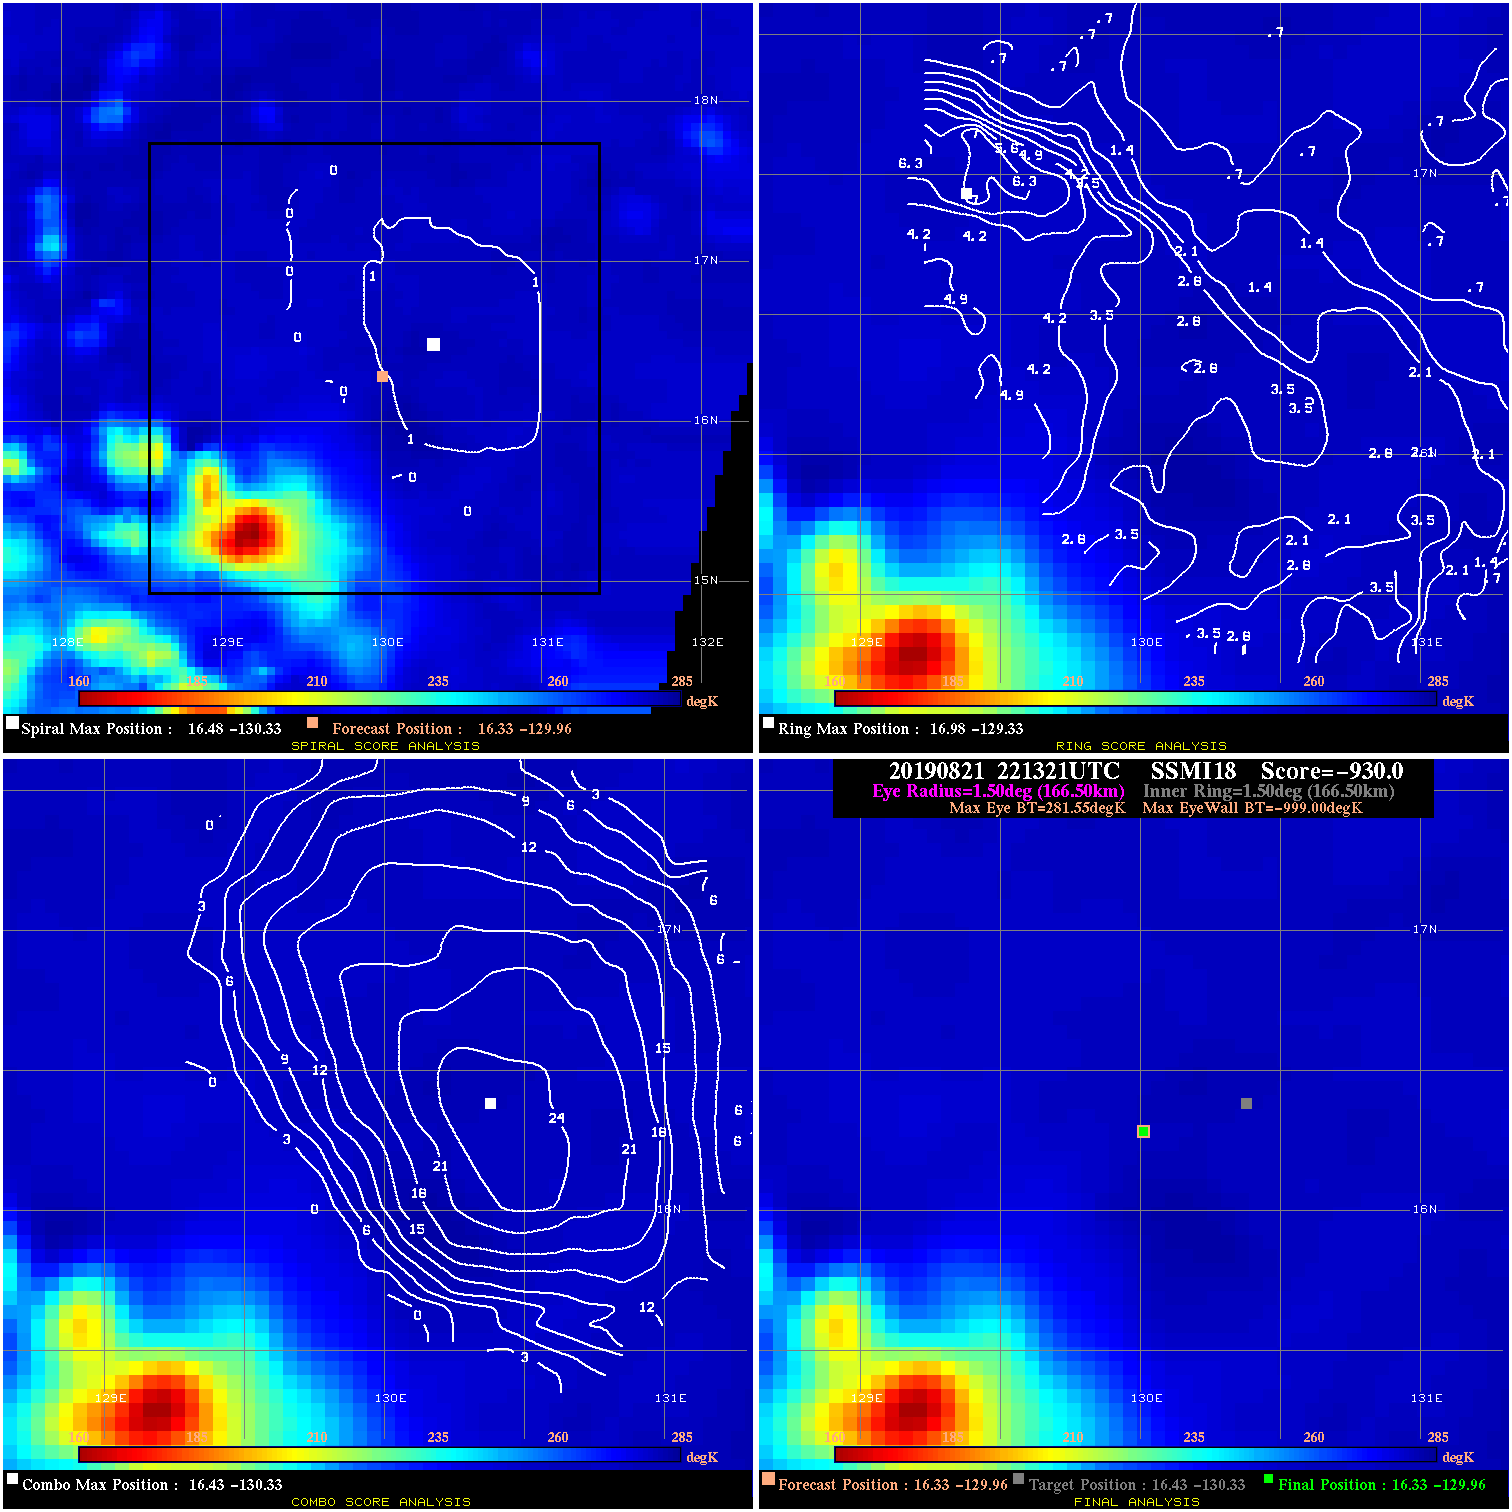
20190821 221321 -930.0 N/A N/A N/A 0.00 35.0 SSMI18 16.3 -130.0 16.3 -130.0 16.4 -130.3 Analysis Plot
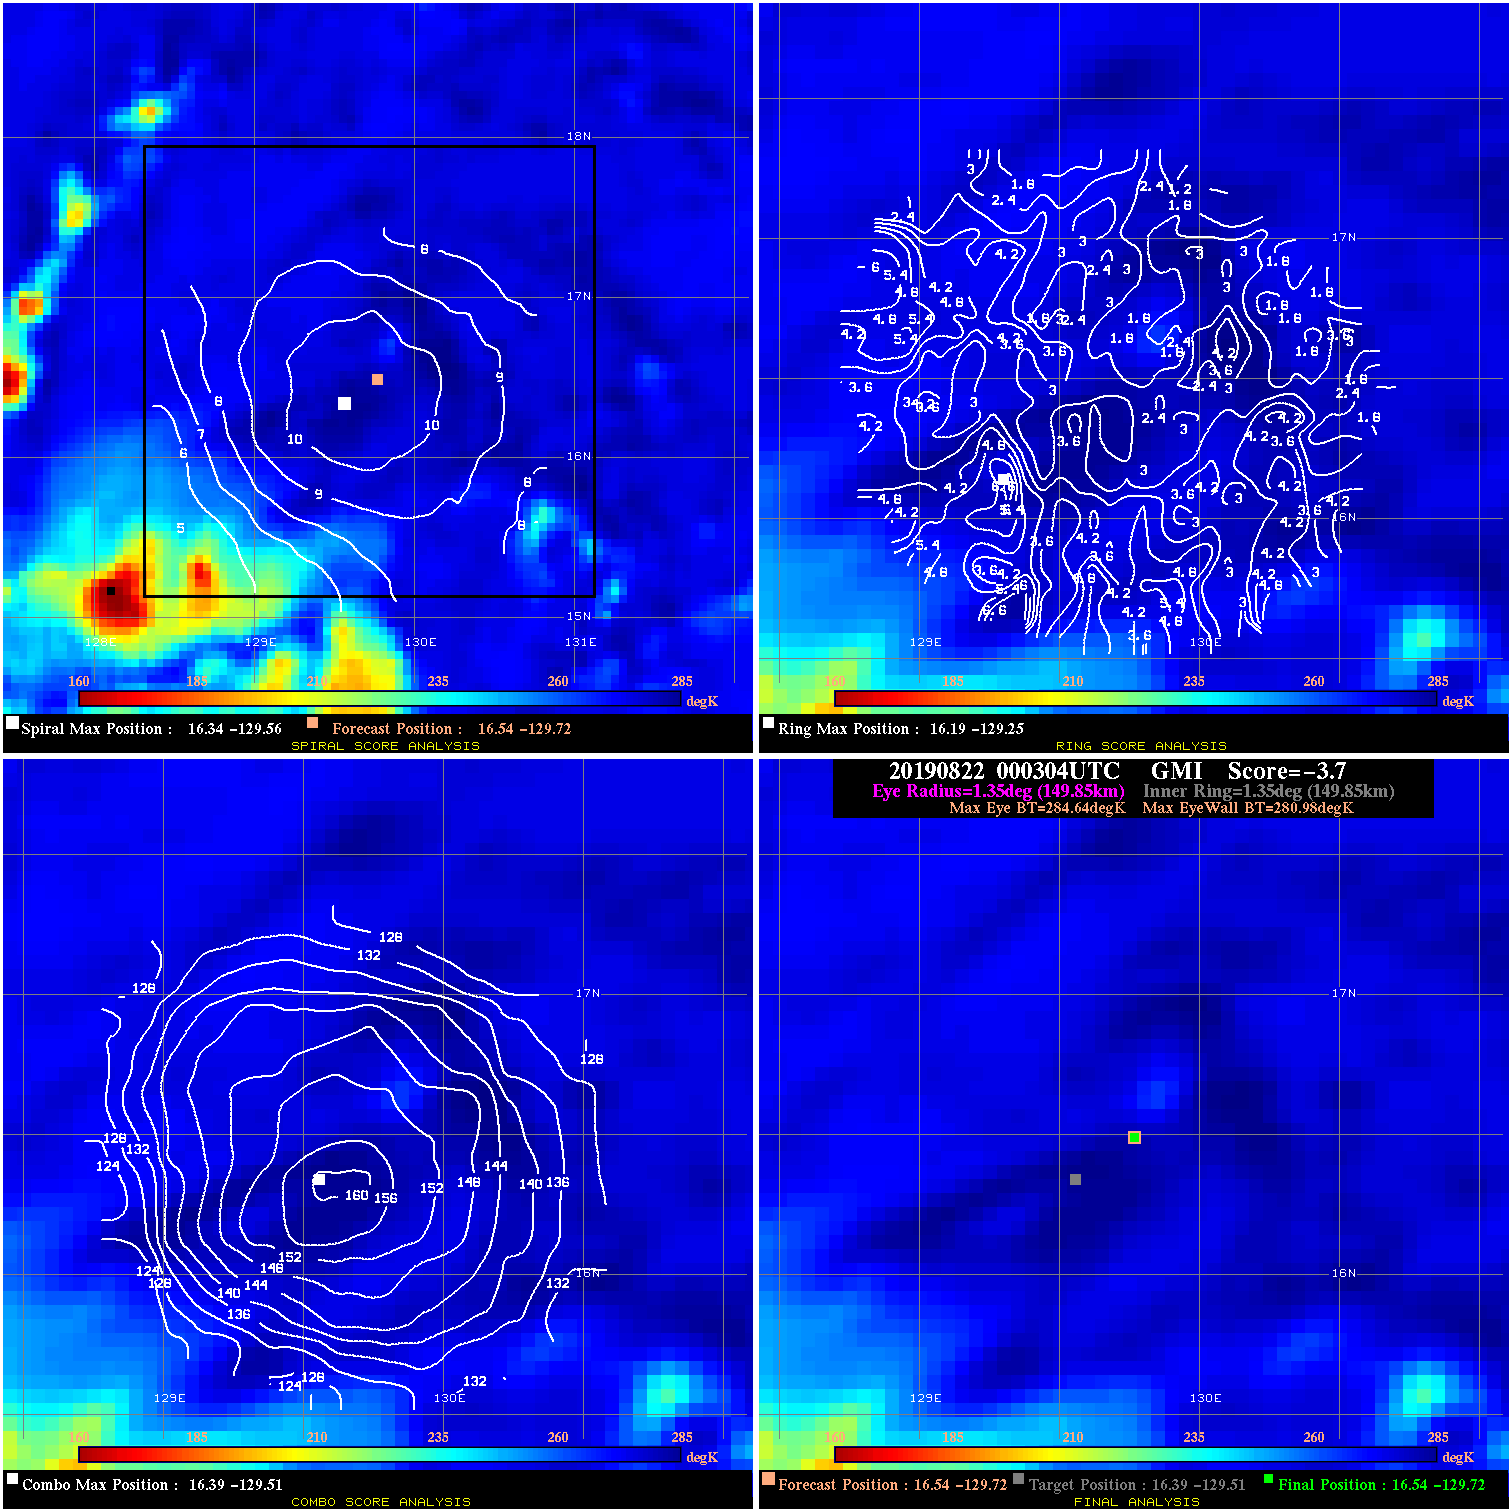
20190822 000304 -3.7 N/A 9.6% 299.97 3.66 35.0 GMI 16.5 -129.7 16.5 -129.7 16.4 -129.5 Analysis Plot
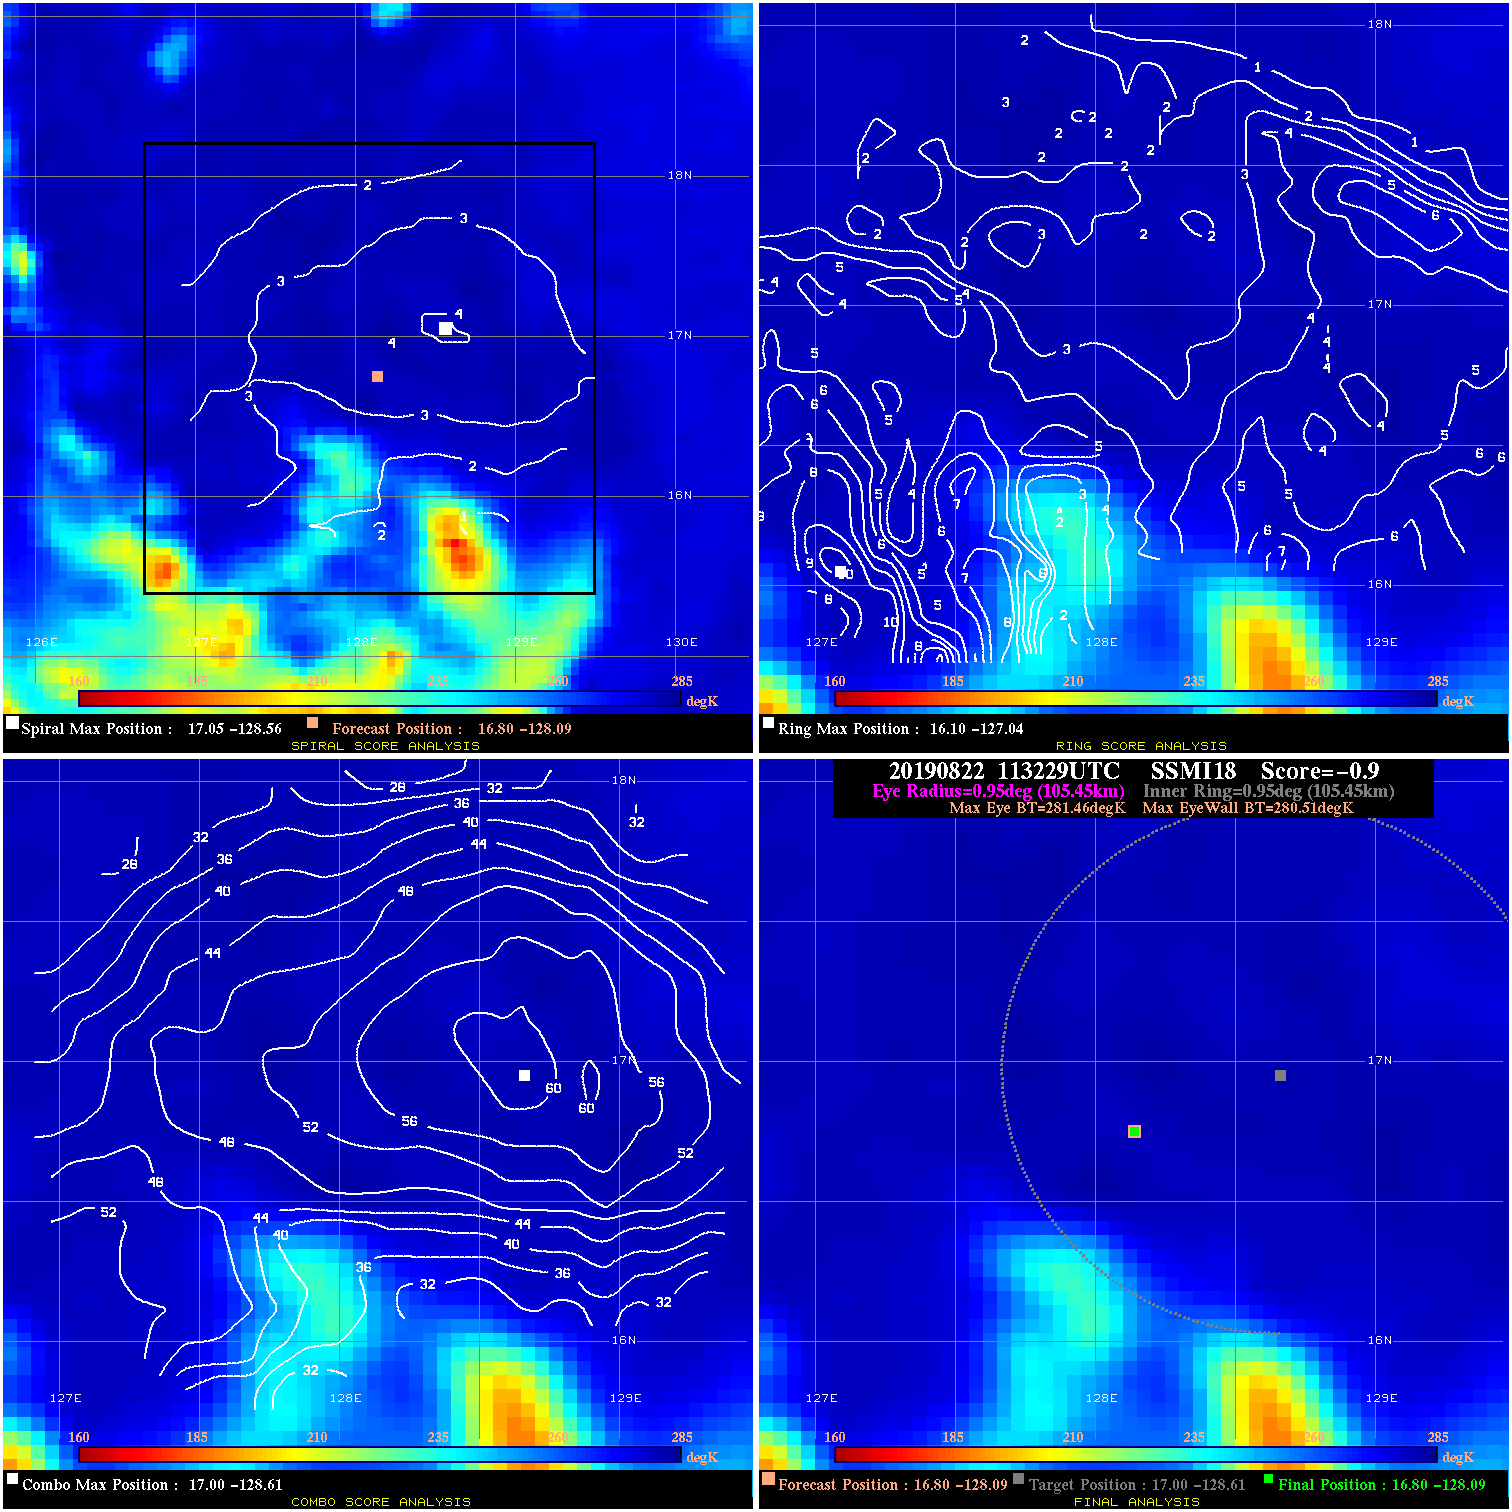
20190822 113229 -0.9 N/A 6.2% 211.09 .95 45.0 SSMI18 16.8 -128.1 16.8 -128.1 17.0 -128.6 Analysis Plot
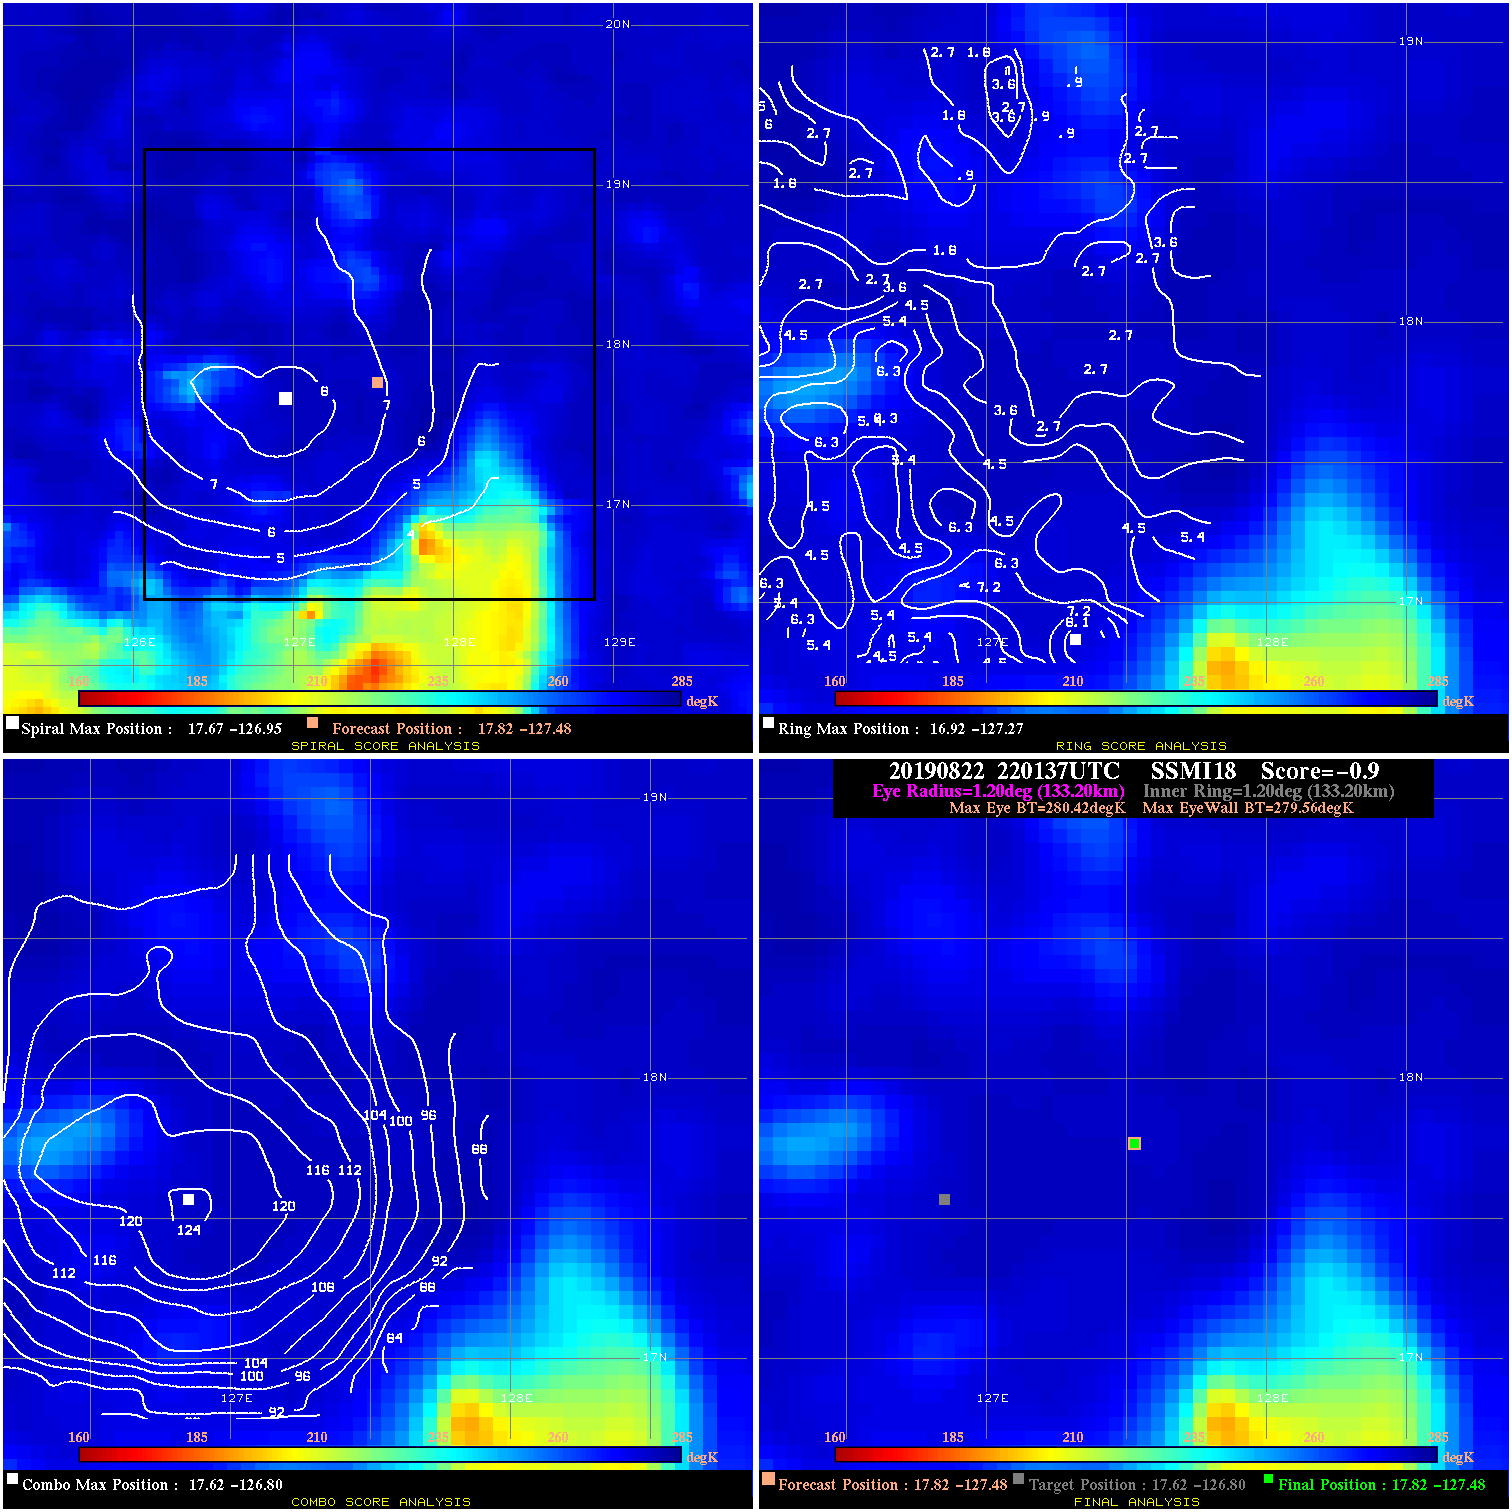
20190822 220137 -0.9 N/A 9.6% 266.64 .86 50.0 SSMI18 17.8 -127.5 17.8 -127.5 17.6 -126.8 Analysis Plot
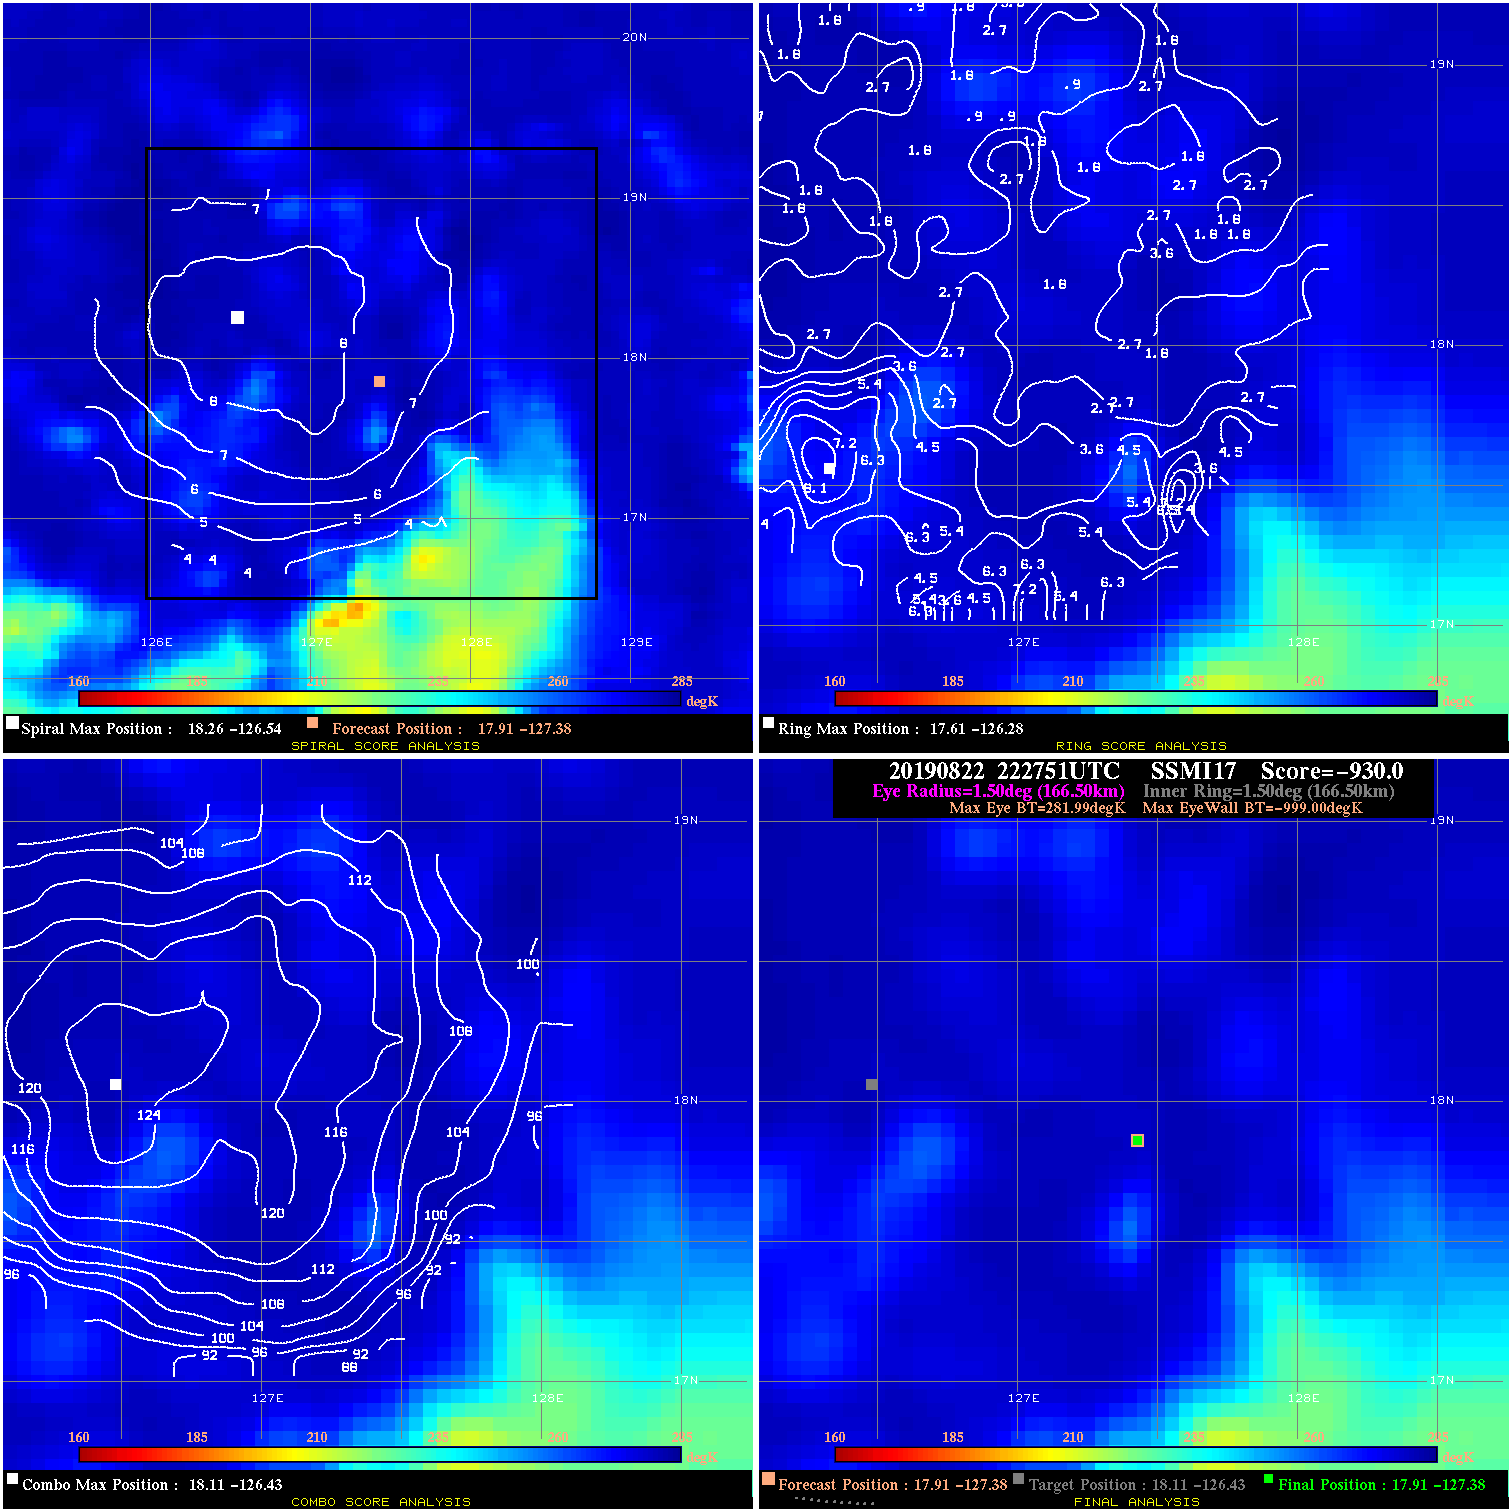
20190822 222751 -930.0 N/A N/A N/A 0.00 50.0 SSMI17 17.9 -127.4 17.9 -127.4 18.1 -126.4 Analysis Plot
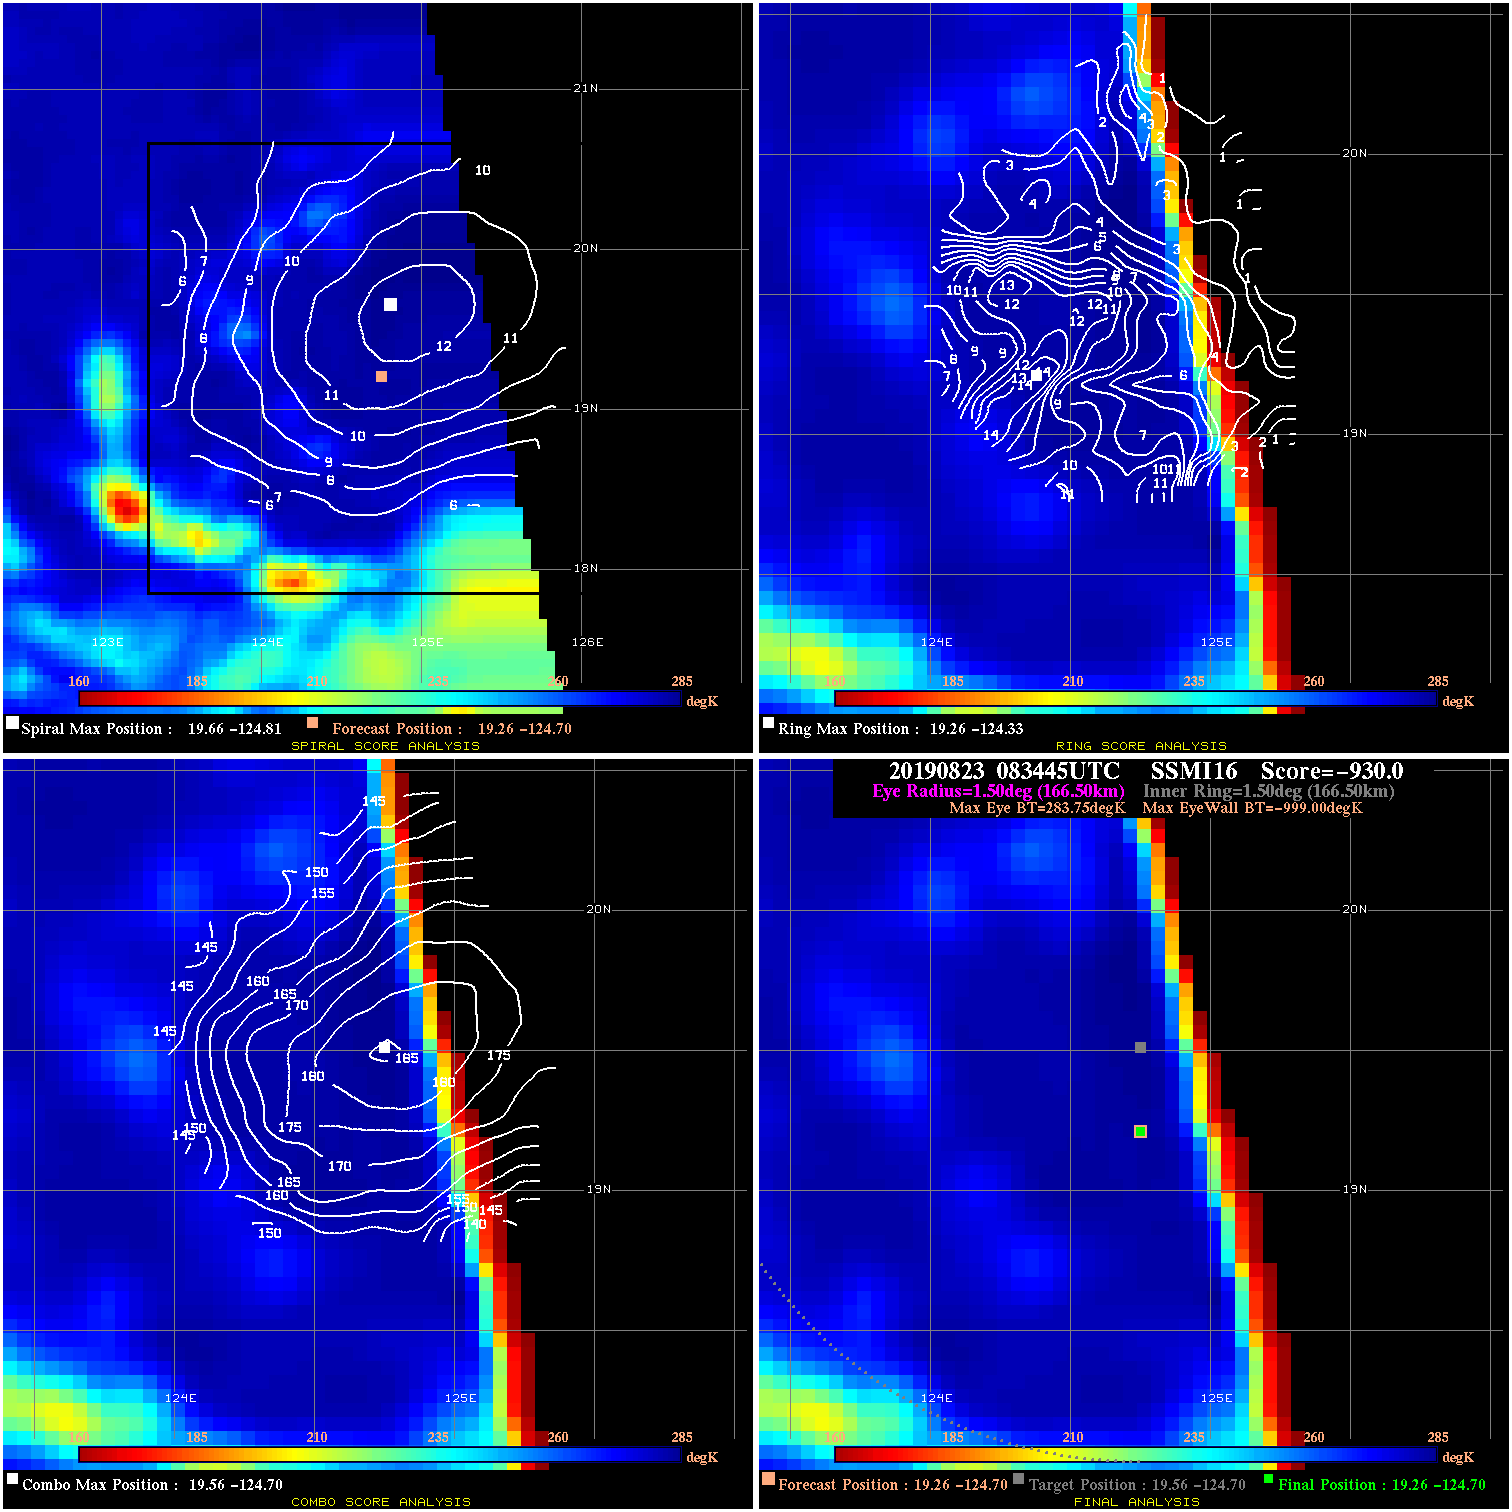
20190823 083445 -930.0 N/A N/A N/A 0.00 45.0 SSMI16 19.3 -124.7 19.3 -124.7 19.6 -124.7 Analysis Plot
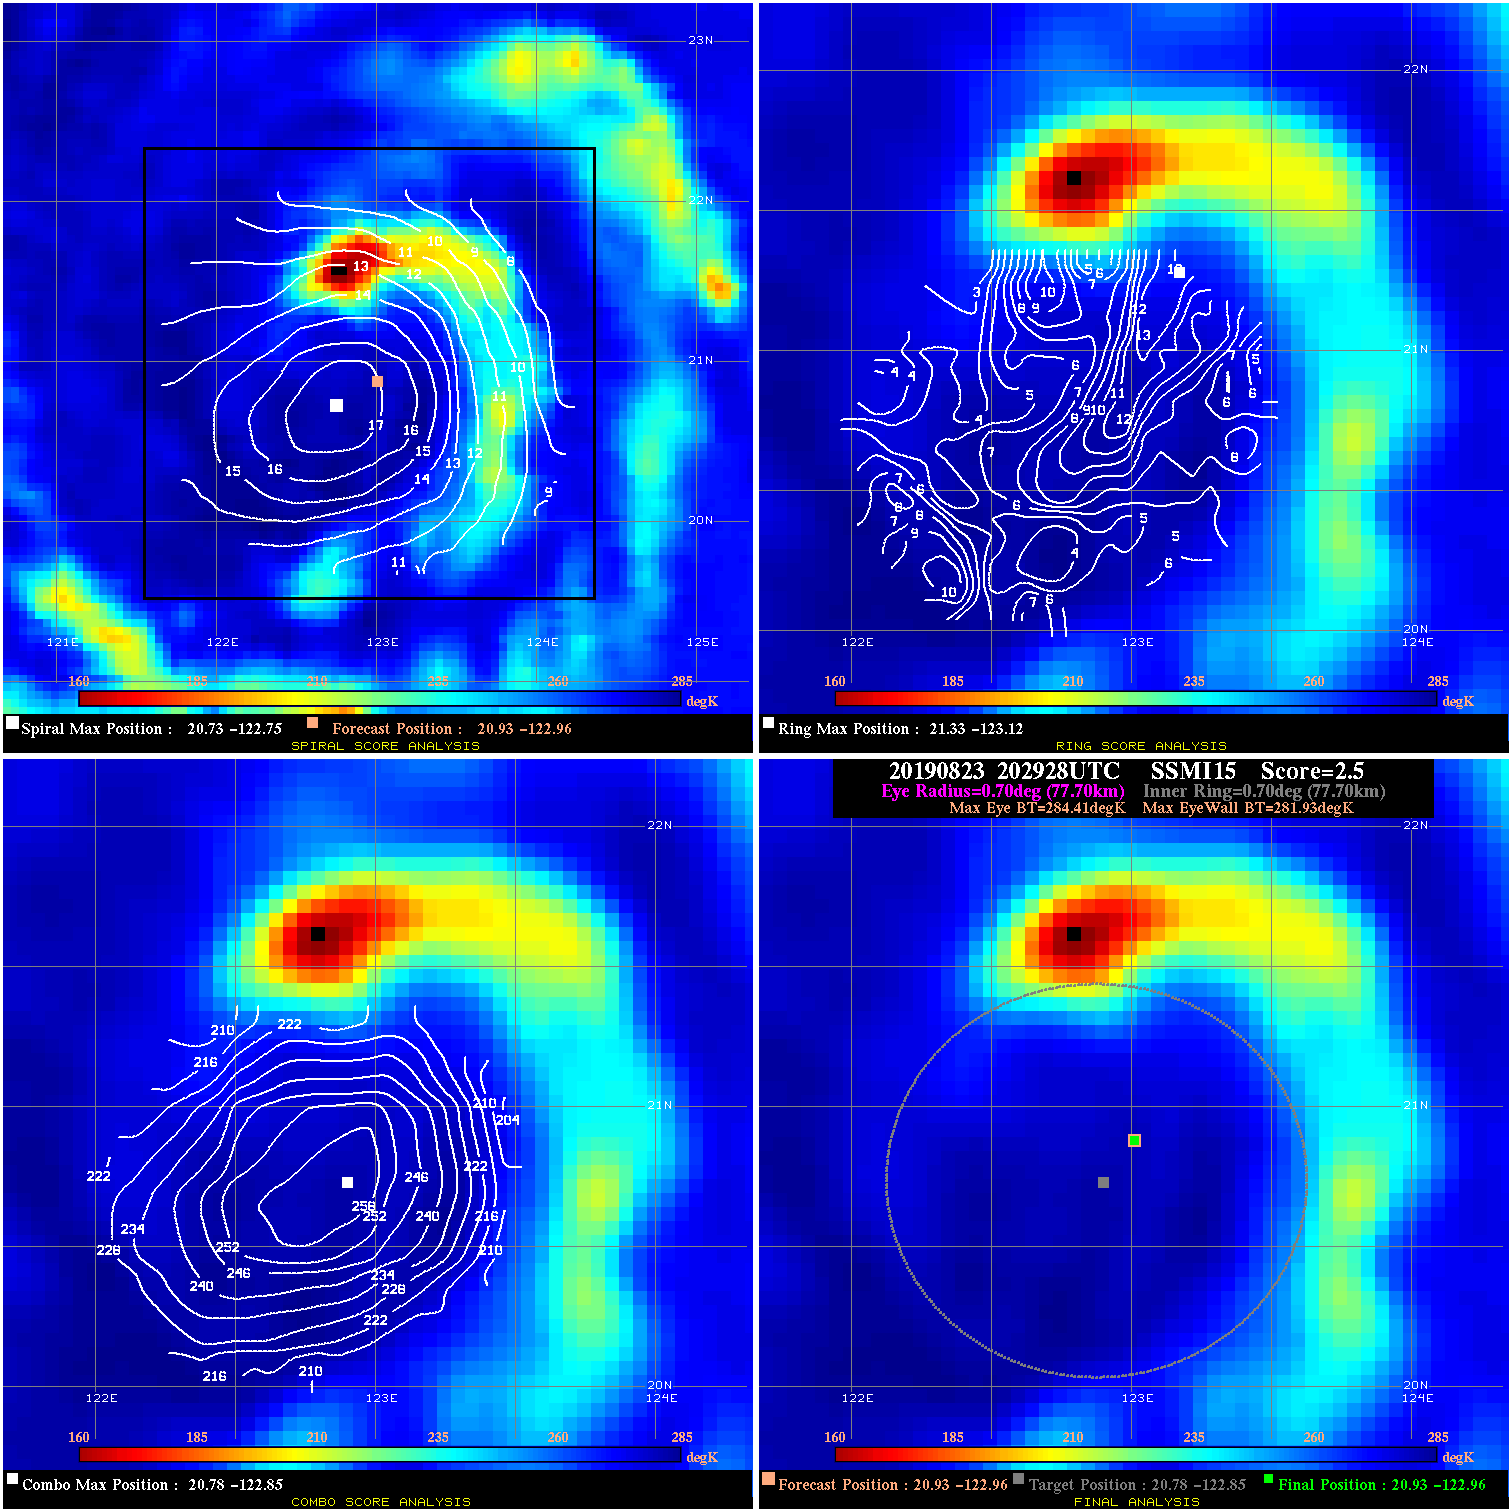
20190823 202928 2.5 N/A 23.3% 155.54 2.48 55.0 SSMI15 20.9 -123.0 20.9 -123.0 20.8 -122.8 Analysis Plot
20190823 214814 -930.0 N/A N/A N/A 0.00 55.0 SSMI18 21.1 -122.7 21.1 -122.7 21.0 -122.5 Analysis Plot
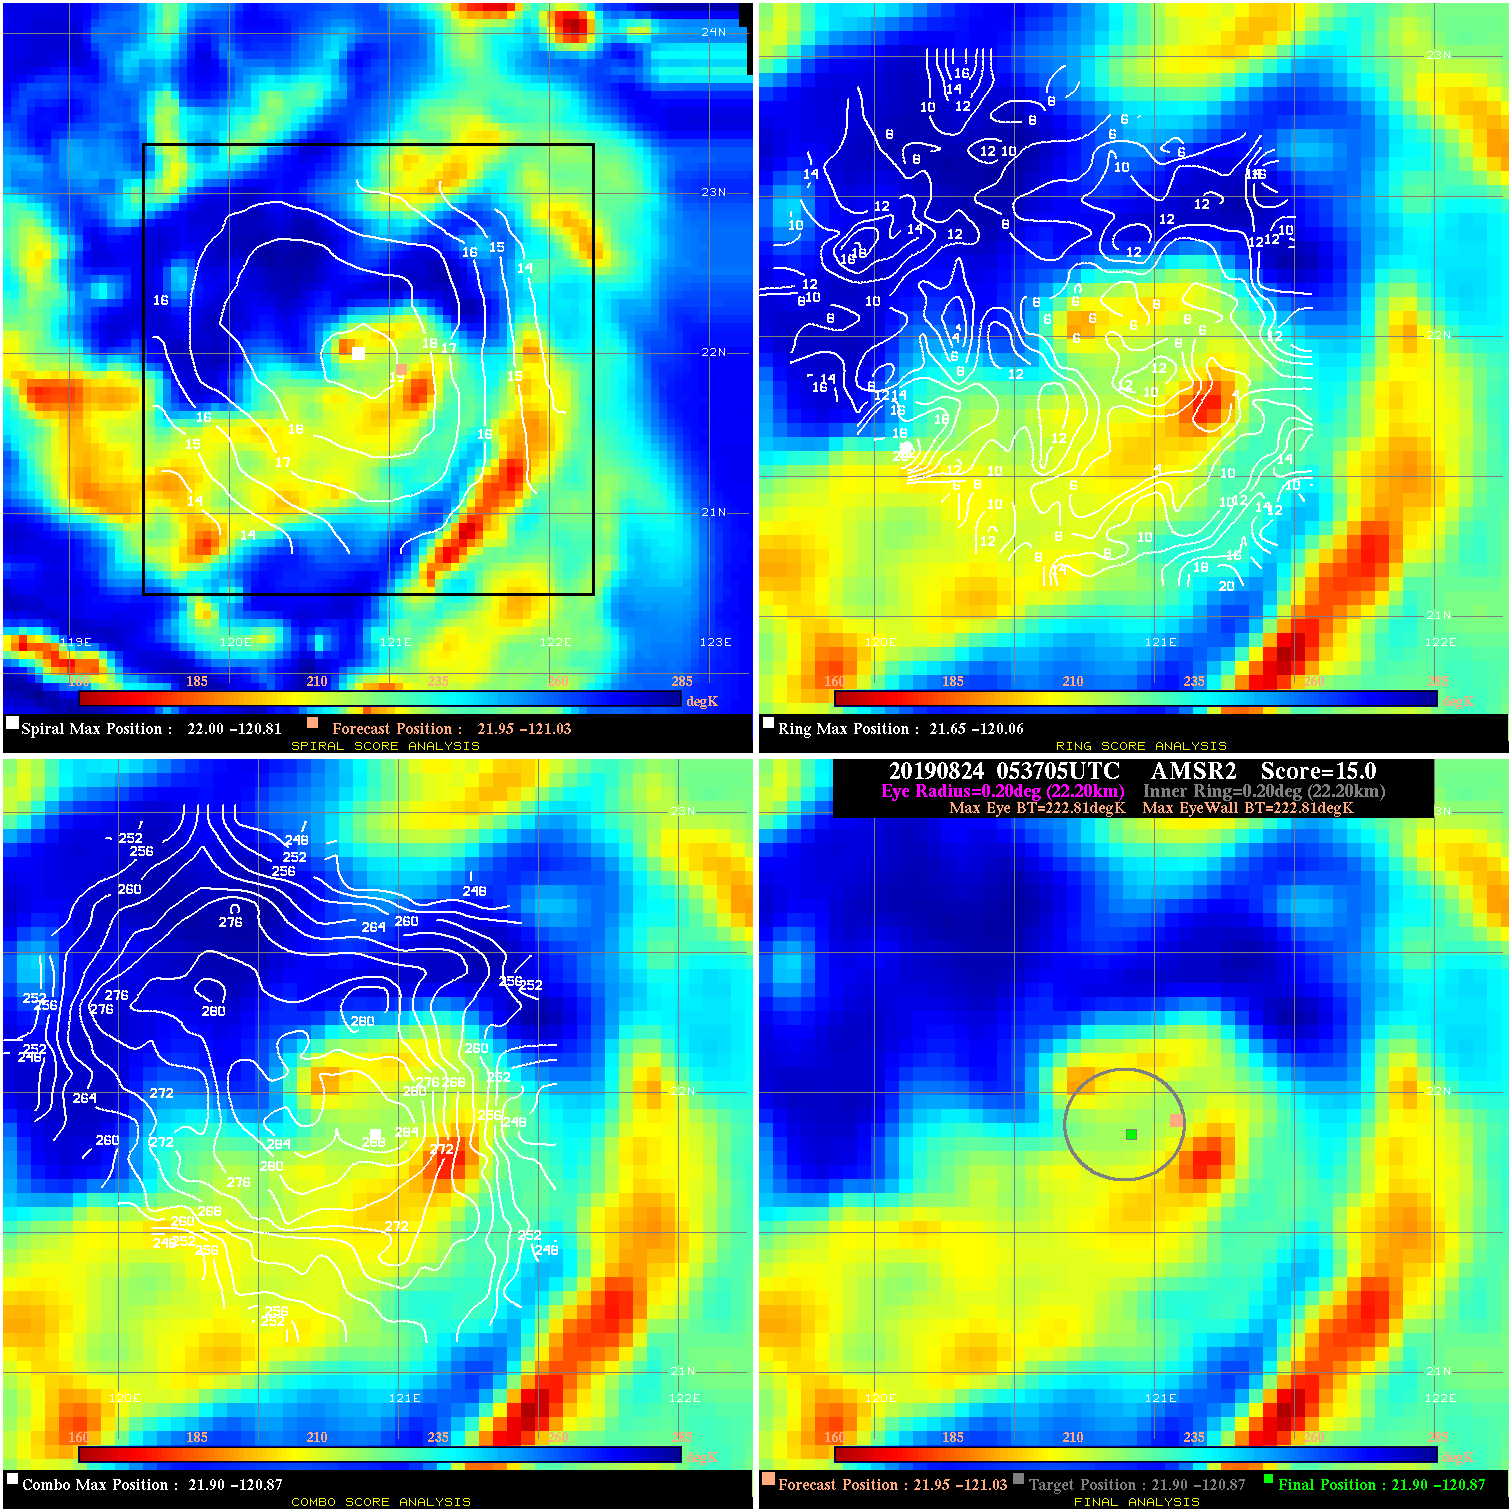
20190824 053705 N/A N/A N/A N/A N/A 55.0 AMSR2 22.0 -121.0 21.9 -120.9 21.9 -120.9 Analysis Plot
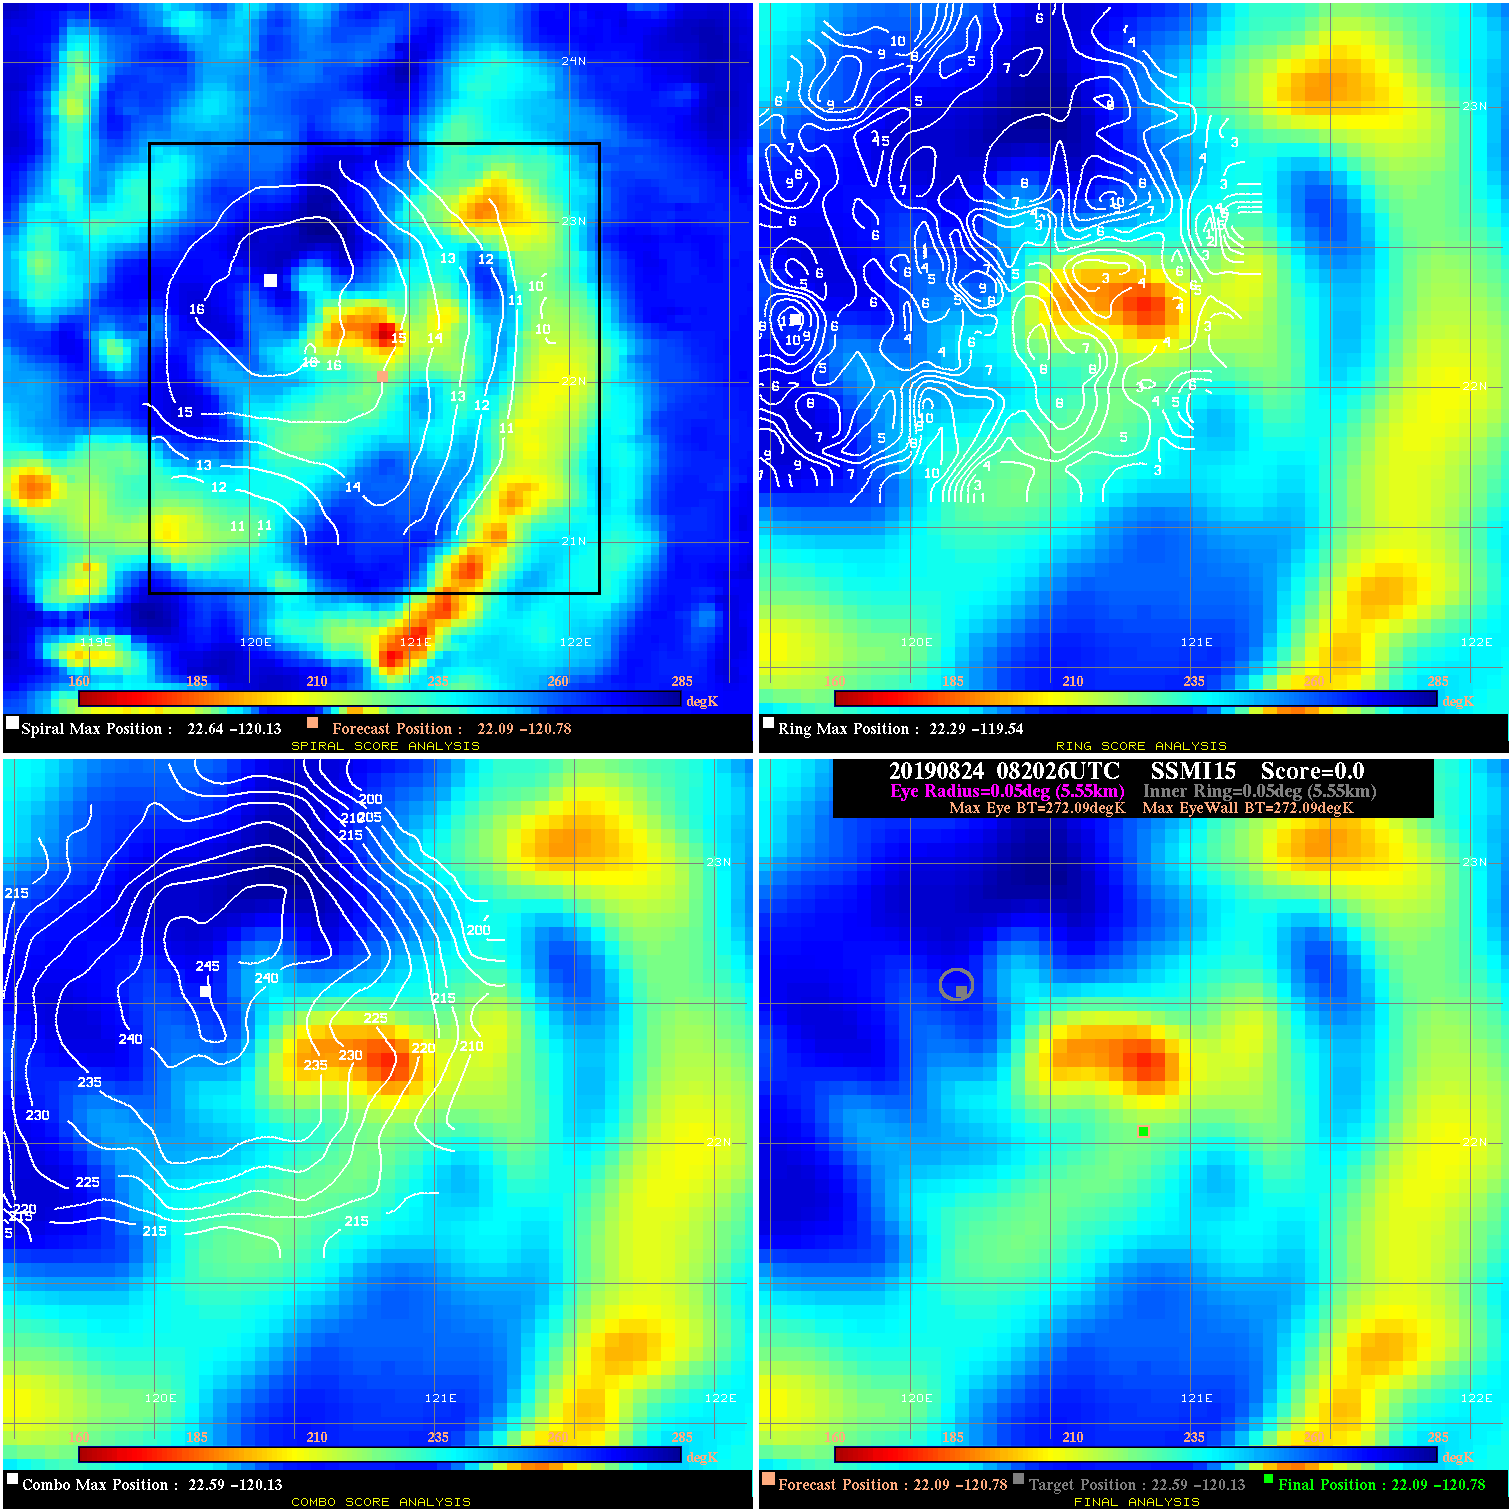
20190824 082026 N/A N/A N/A N/A N/A 55.0 SSMI15 22.1 -120.8 22.1 -120.8 22.6 -120.1 Analysis Plot
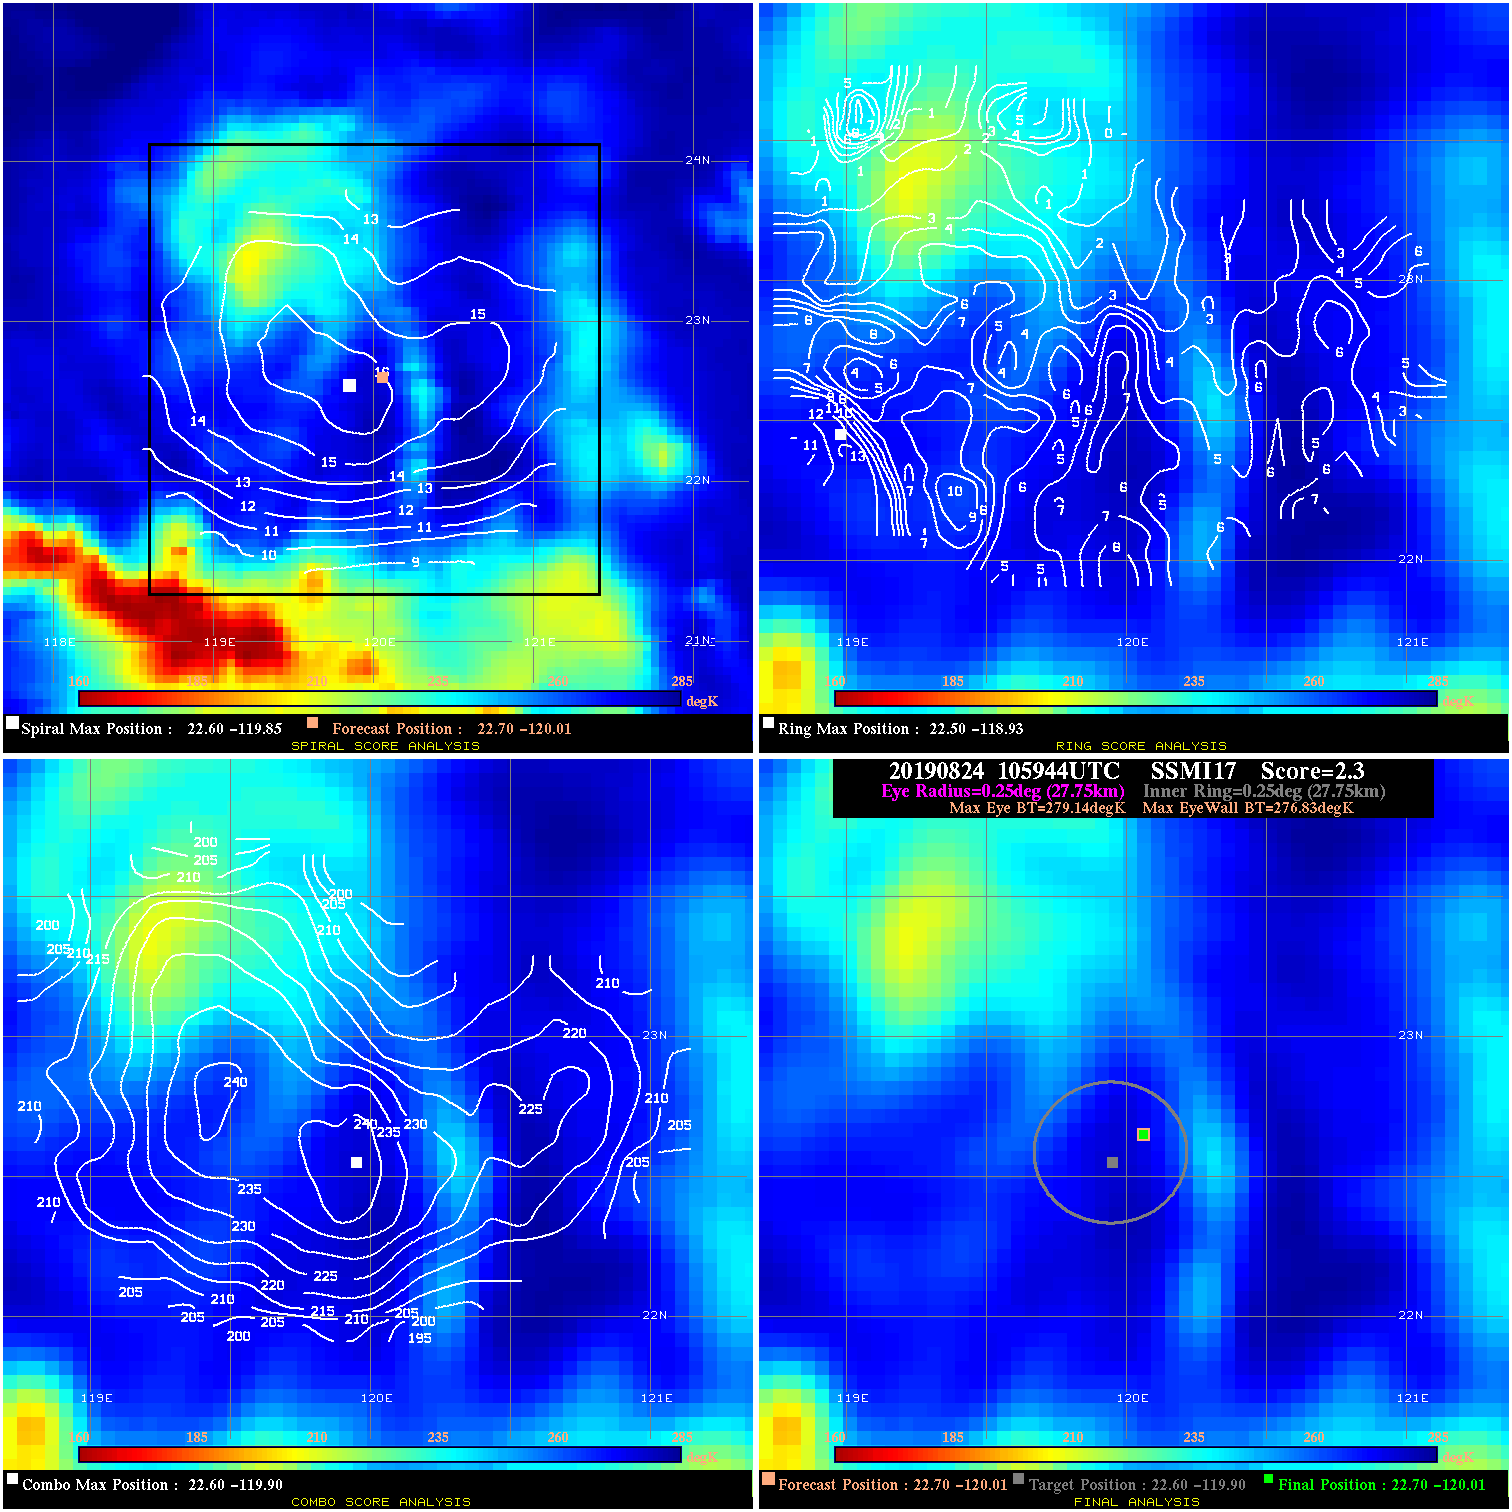
20190824 105944 2.3 N/A N/A 55.55 2.31 55.0 SSMI17 22.7 -120.0 22.7 -120.0 22.6 -119.9 Analysis Plot
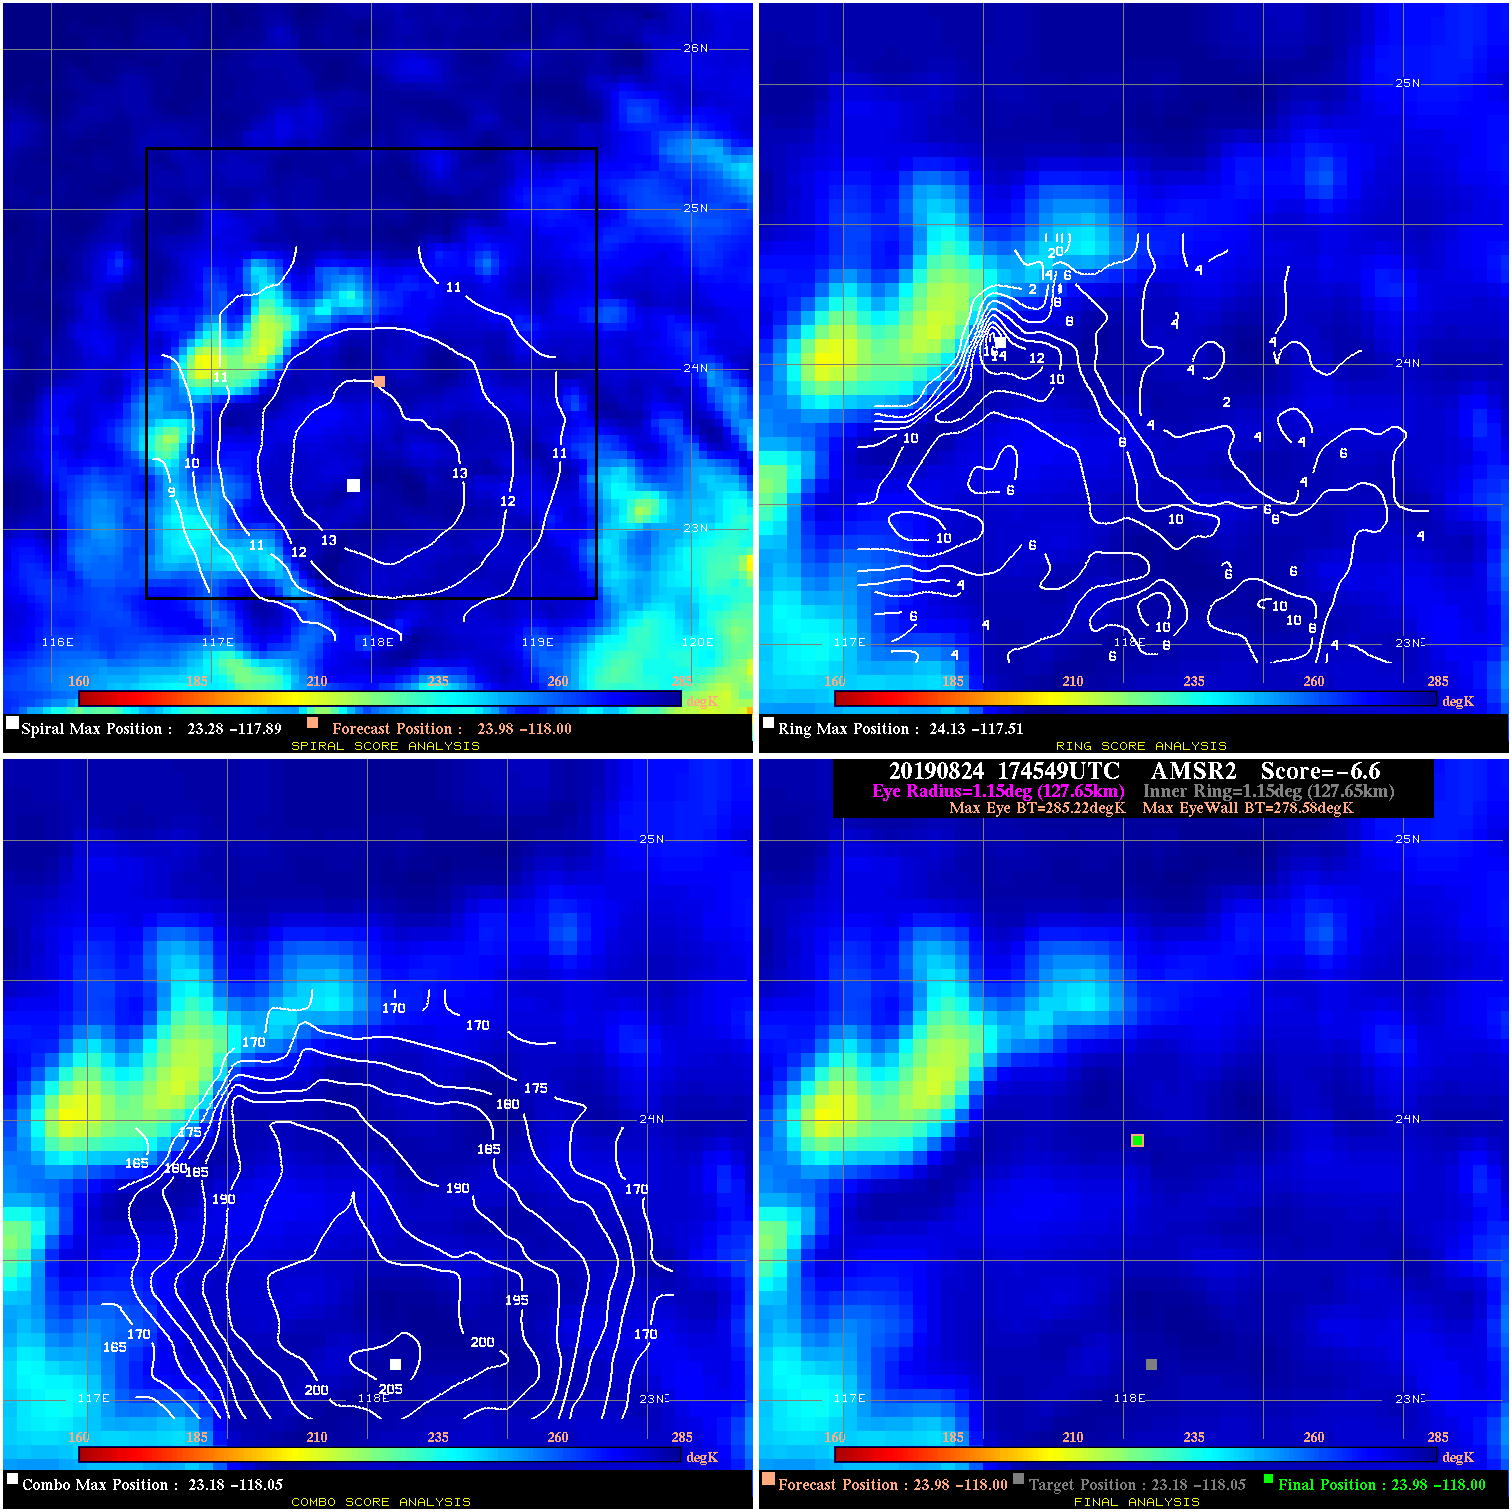
20190824 174549 -6.6 N/A 6.8% 255.53 6.64 50.0 AMSR2 24.0 -118.0 24.0 -118.0 23.2 -118.1 Analysis Plot
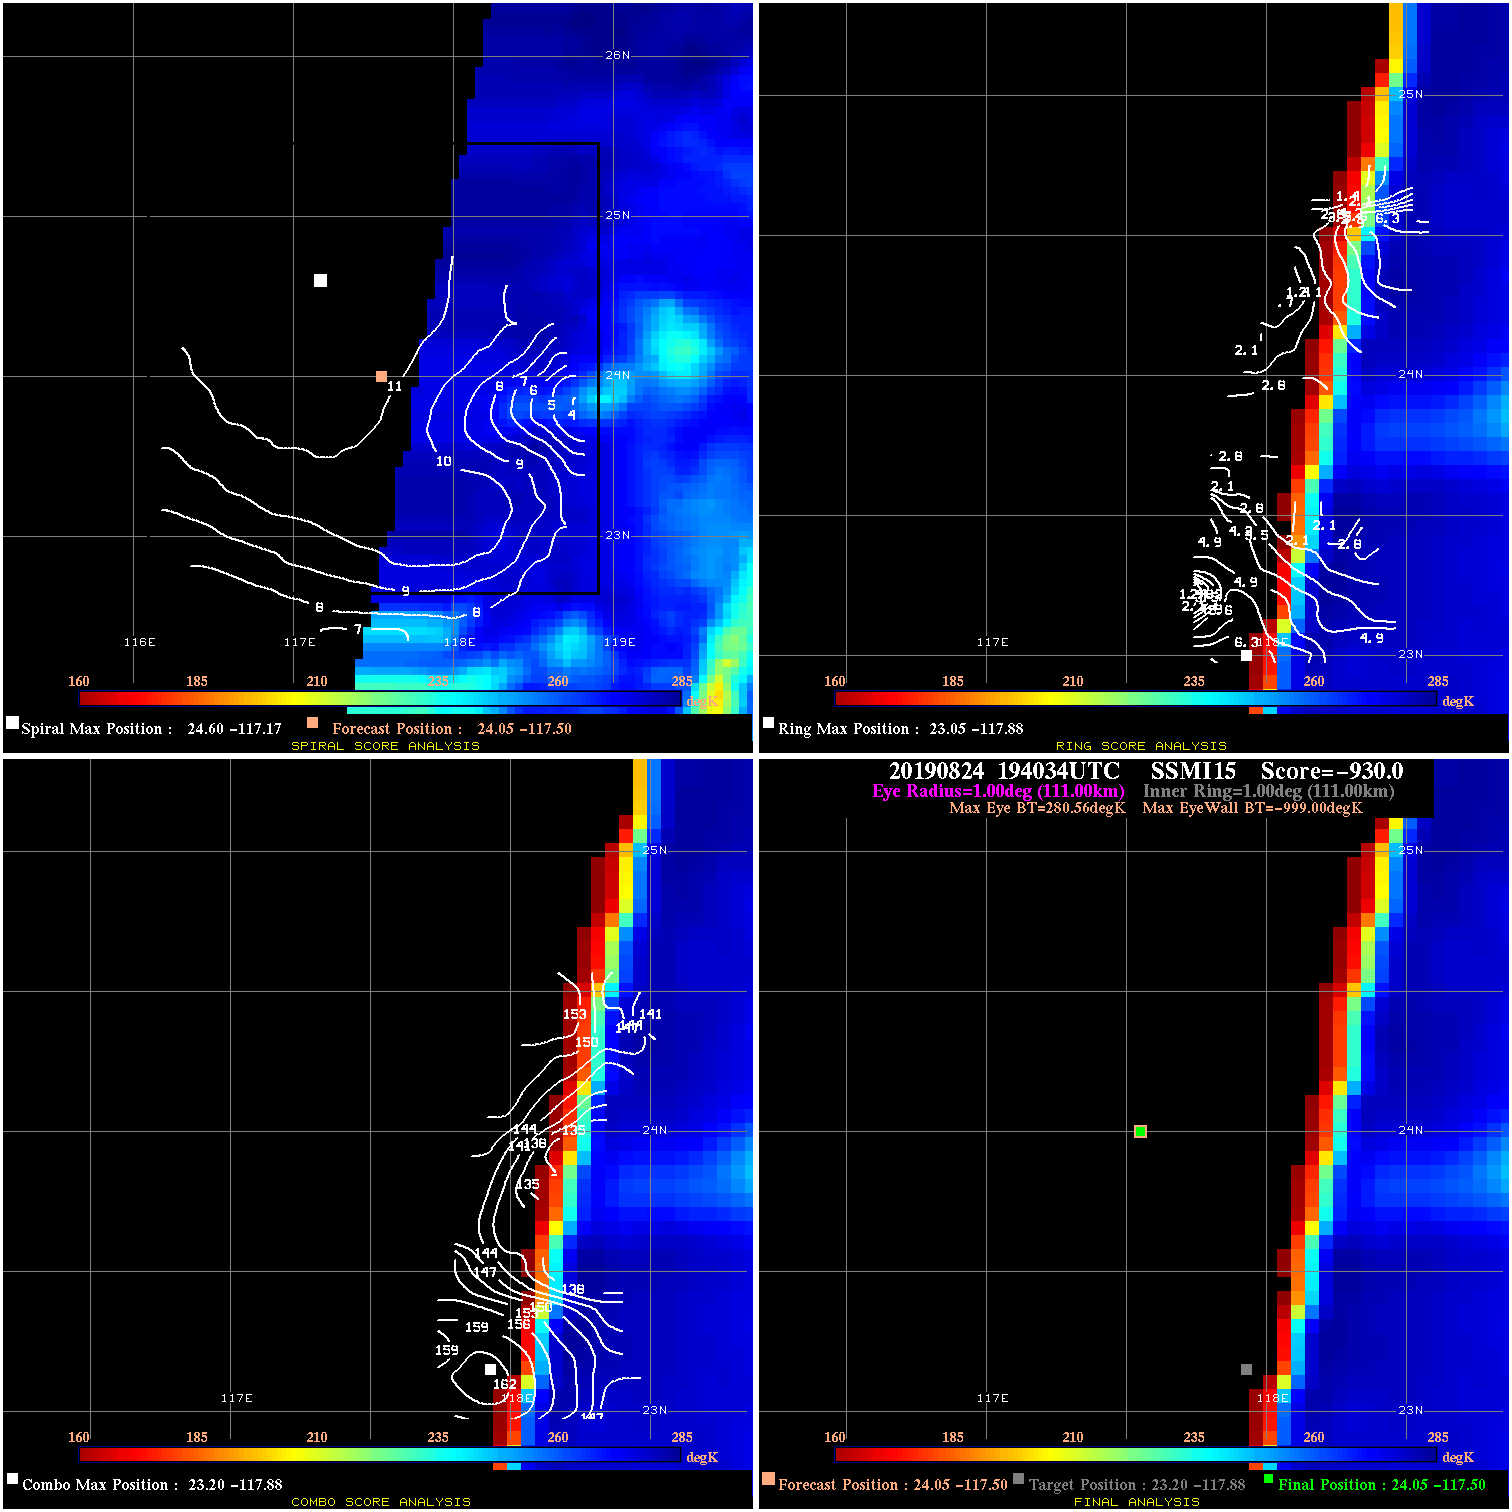
20190824 194034 -930.0 N/A N/A N/A 0.00 40.0 SSMI15 24.0 -117.5 24.0 -117.5 23.2 -117.9 Analysis Plot
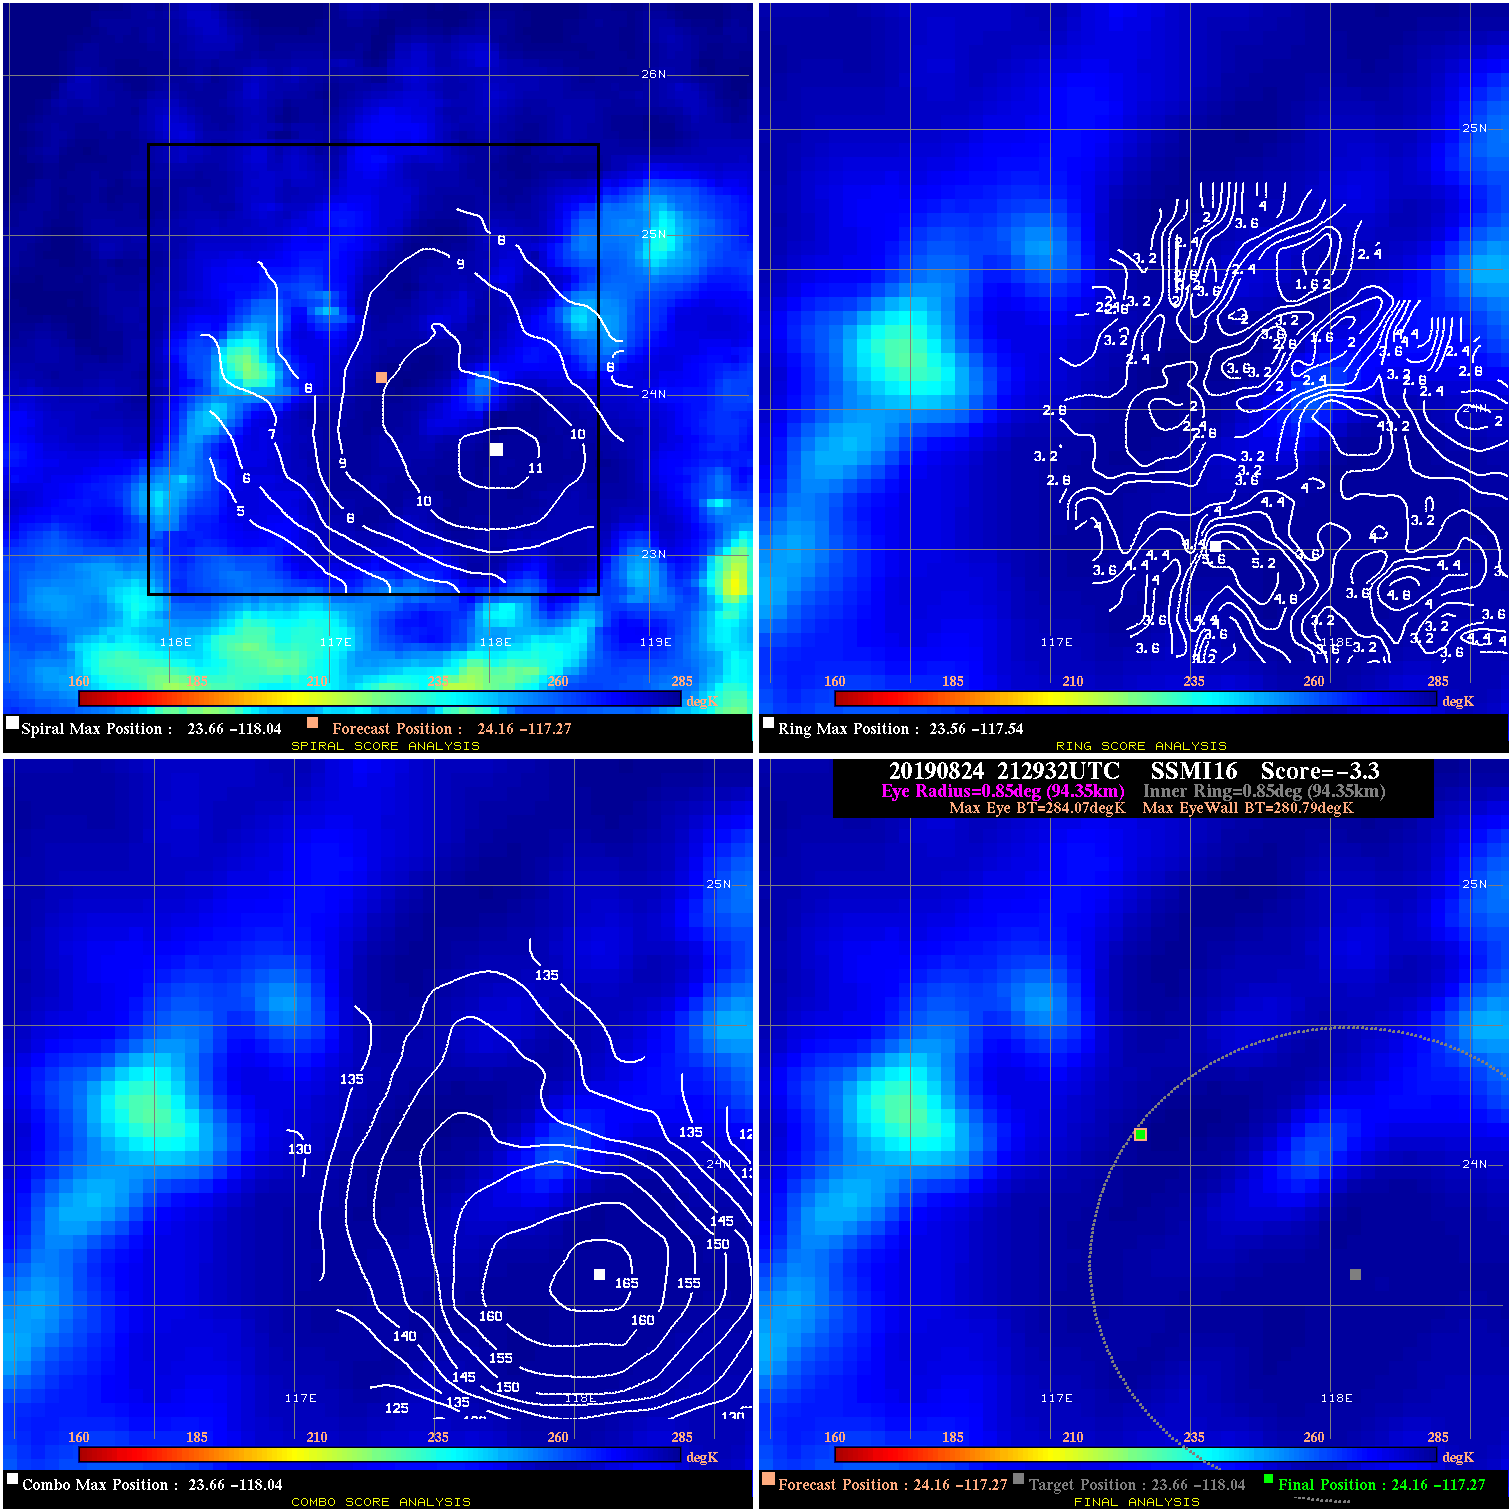
20190824 212932 -3.3 N/A N/A 188.87 3.28 40.0 SSMI16 24.2 -117.3 24.2 -117.3 23.7 -118.0 Analysis Plot
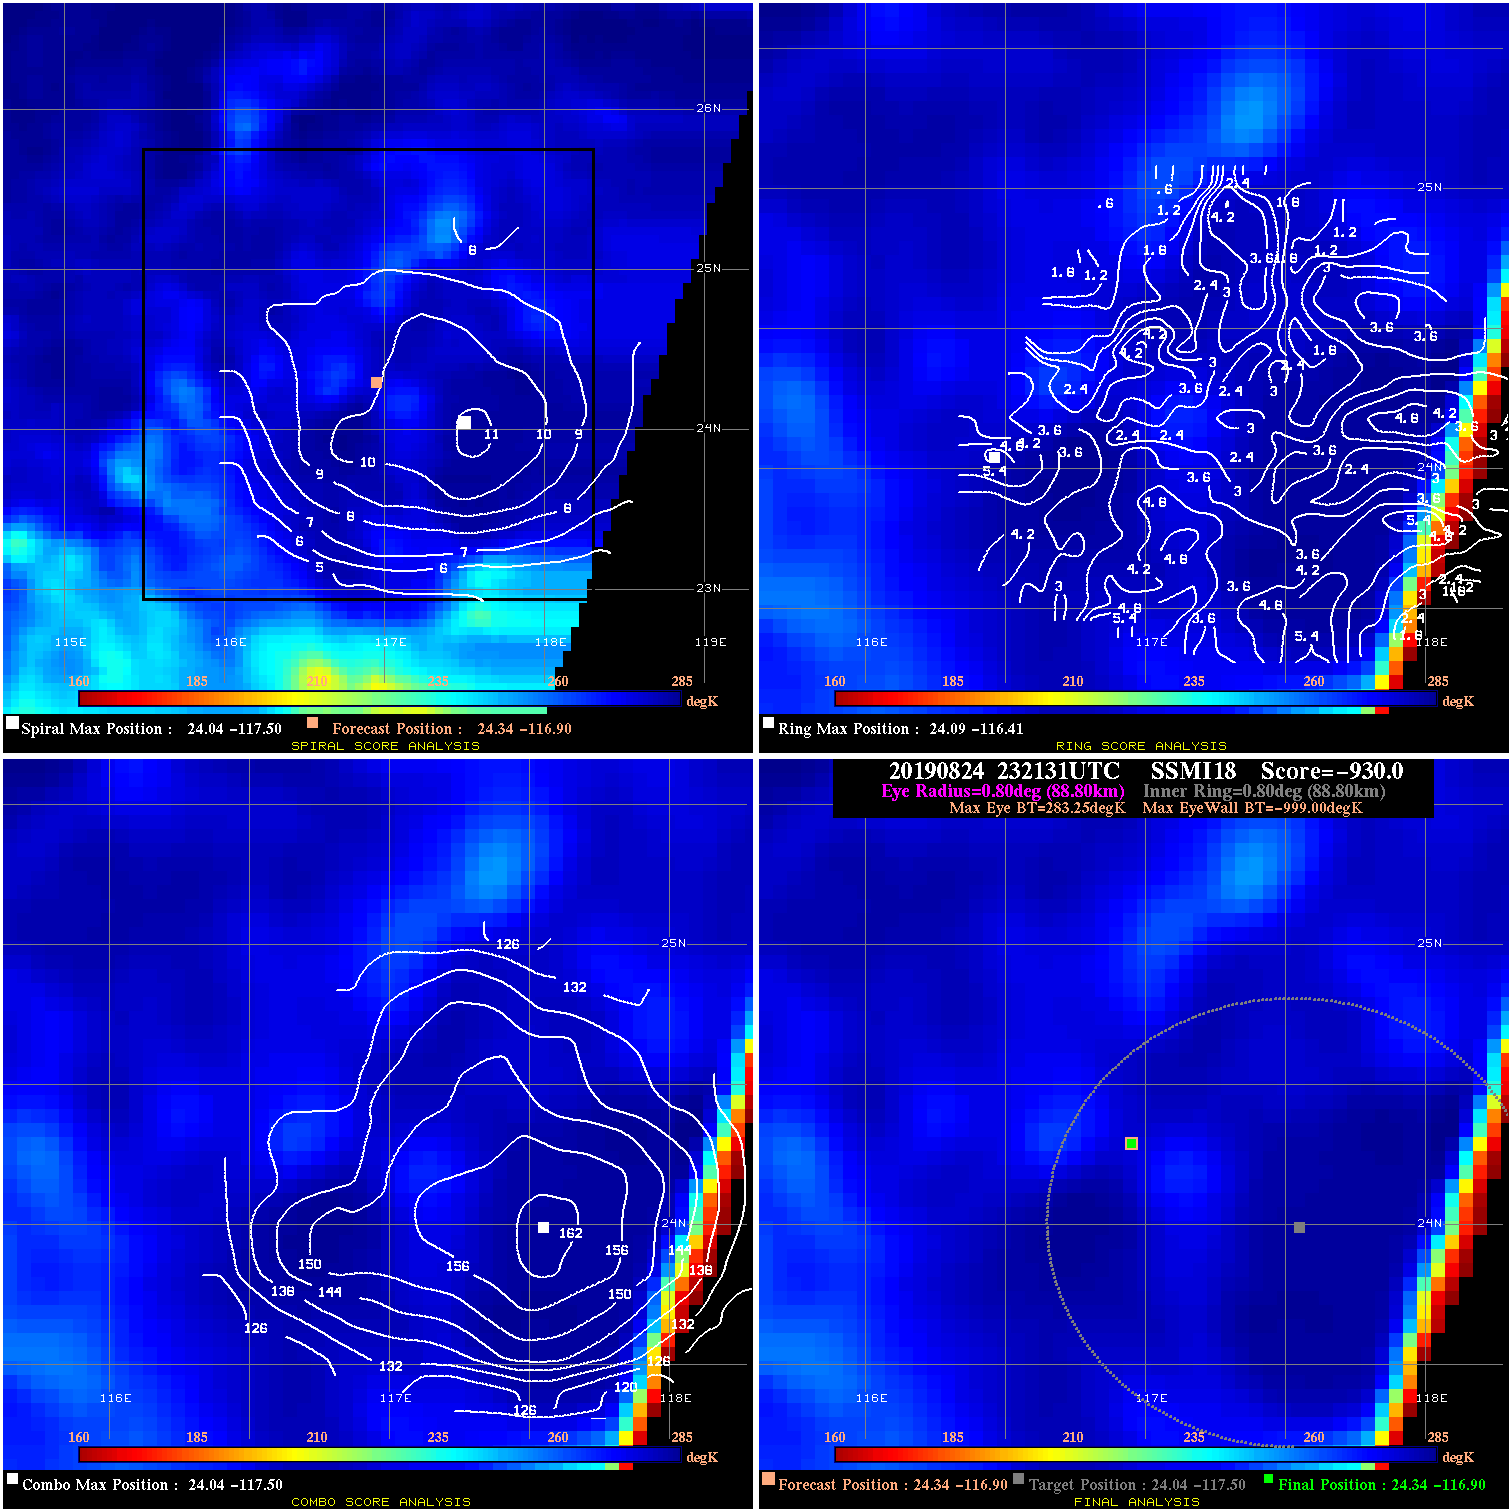
20190824 232131 -930.0 N/A N/A N/A 0.00 40.0 SSMI18 24.3 -116.9 24.3 -116.9 24.0 -117.5 Analysis Plot
20190825 001853 -3.1 N/A N/A 166.65 3.13 40.0 SSMI17 24.4 -116.7 24.4 -116.7 24.2 -117.3 Analysis Plot
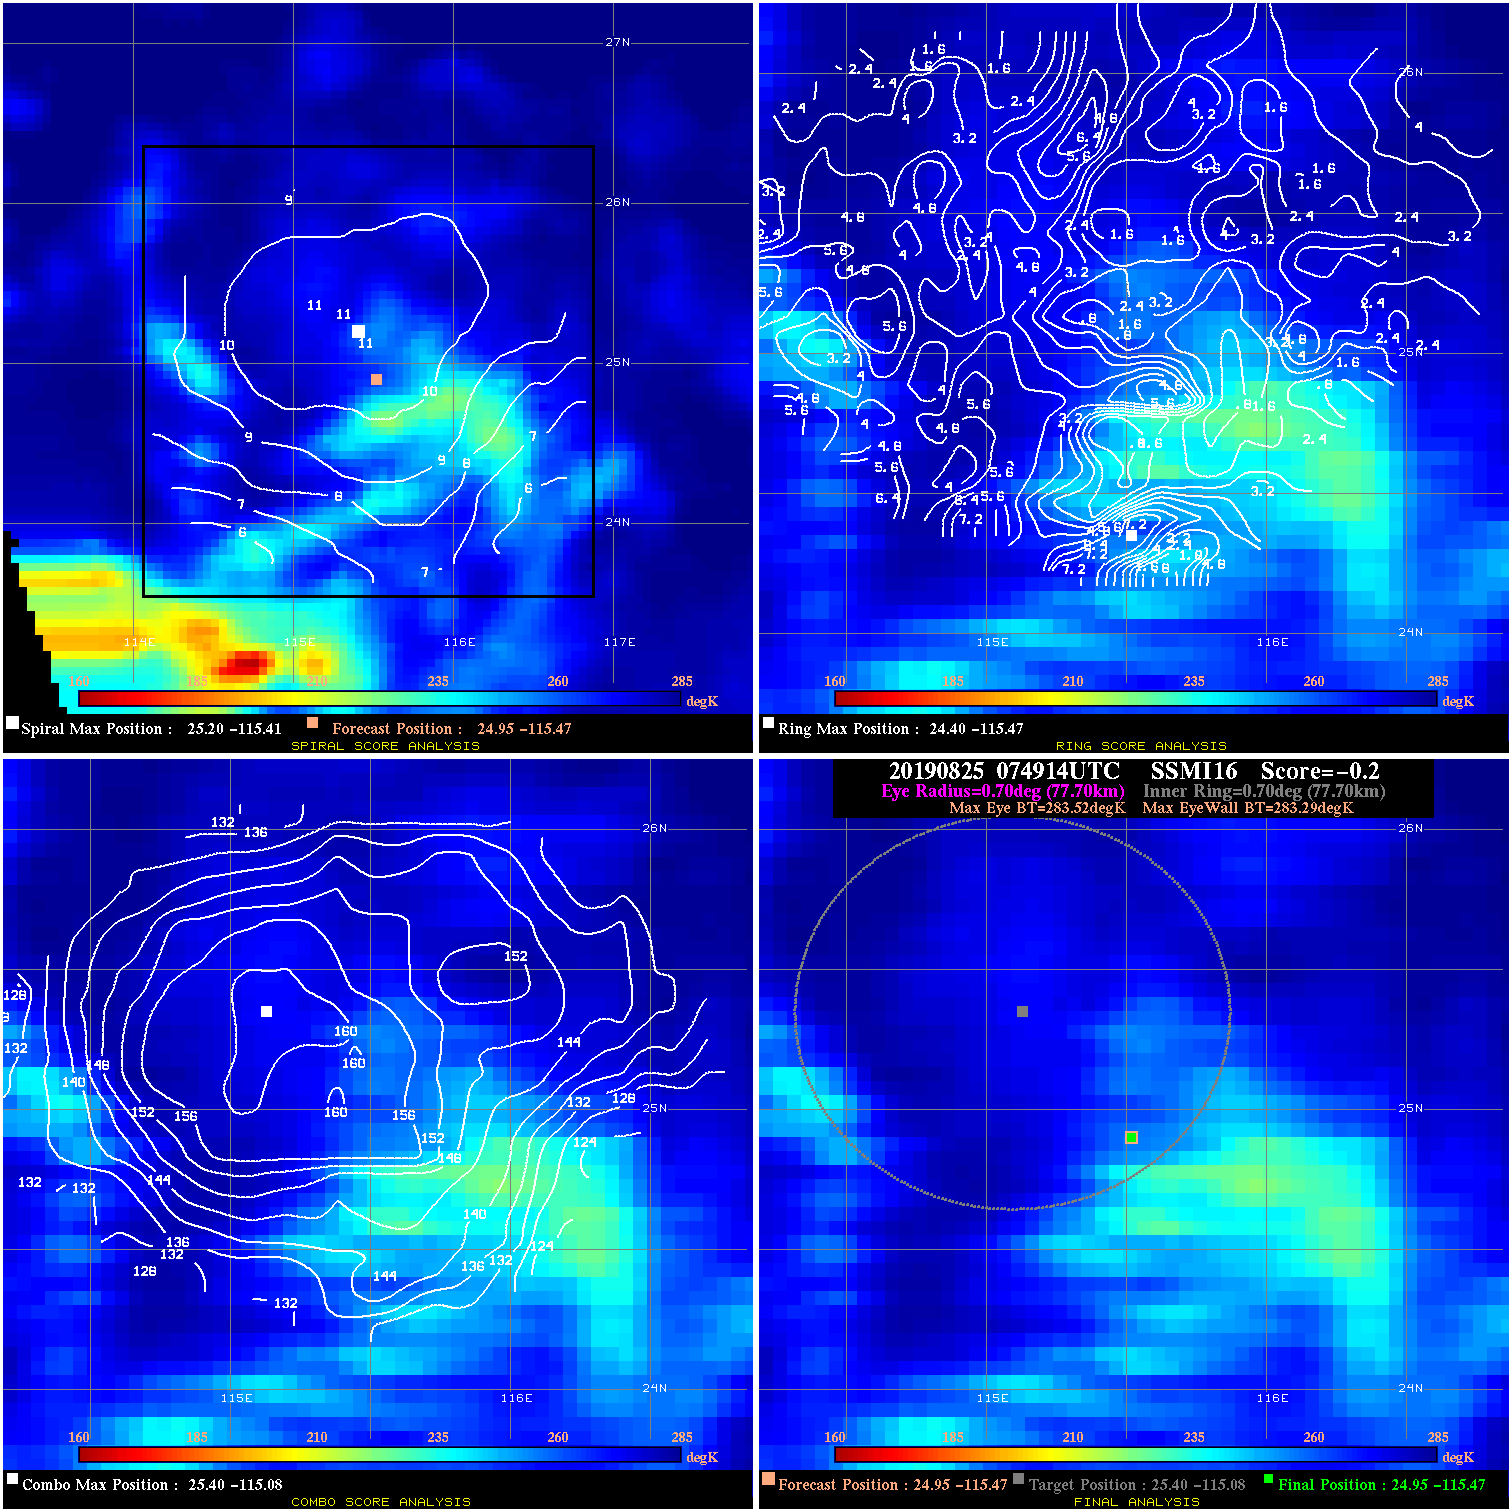
20190825 074914 -0.2 N/A 4.1% 155.54 .23 40.0 SSMI16 25.0 -115.5 25.0 -115.5 25.4 -115.1 Analysis Plot
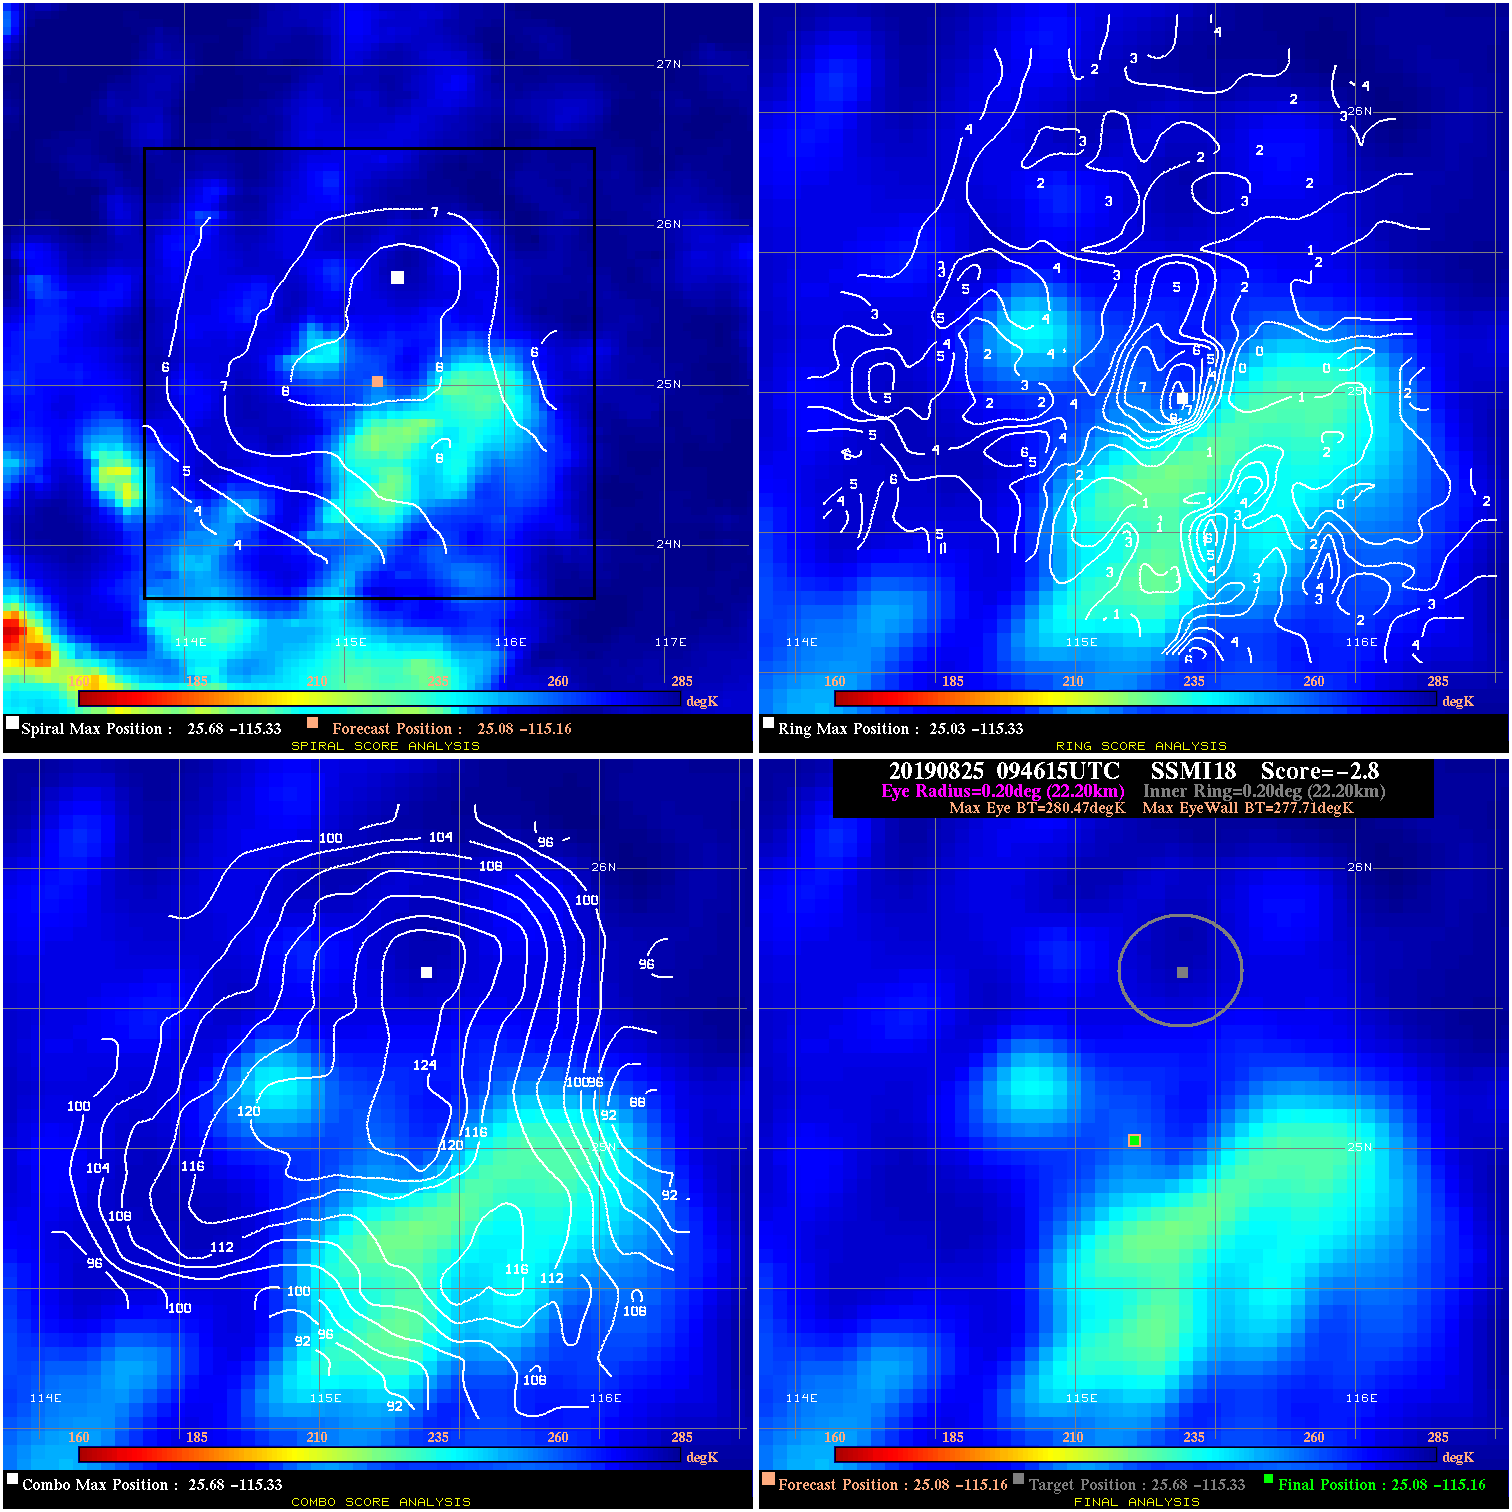
20190825 094615 -2.8 N/A N/A 44.44 2.76 40.0 SSMI18 25.1 -115.2 25.1 -115.2 25.7 -115.3 Analysis Plot
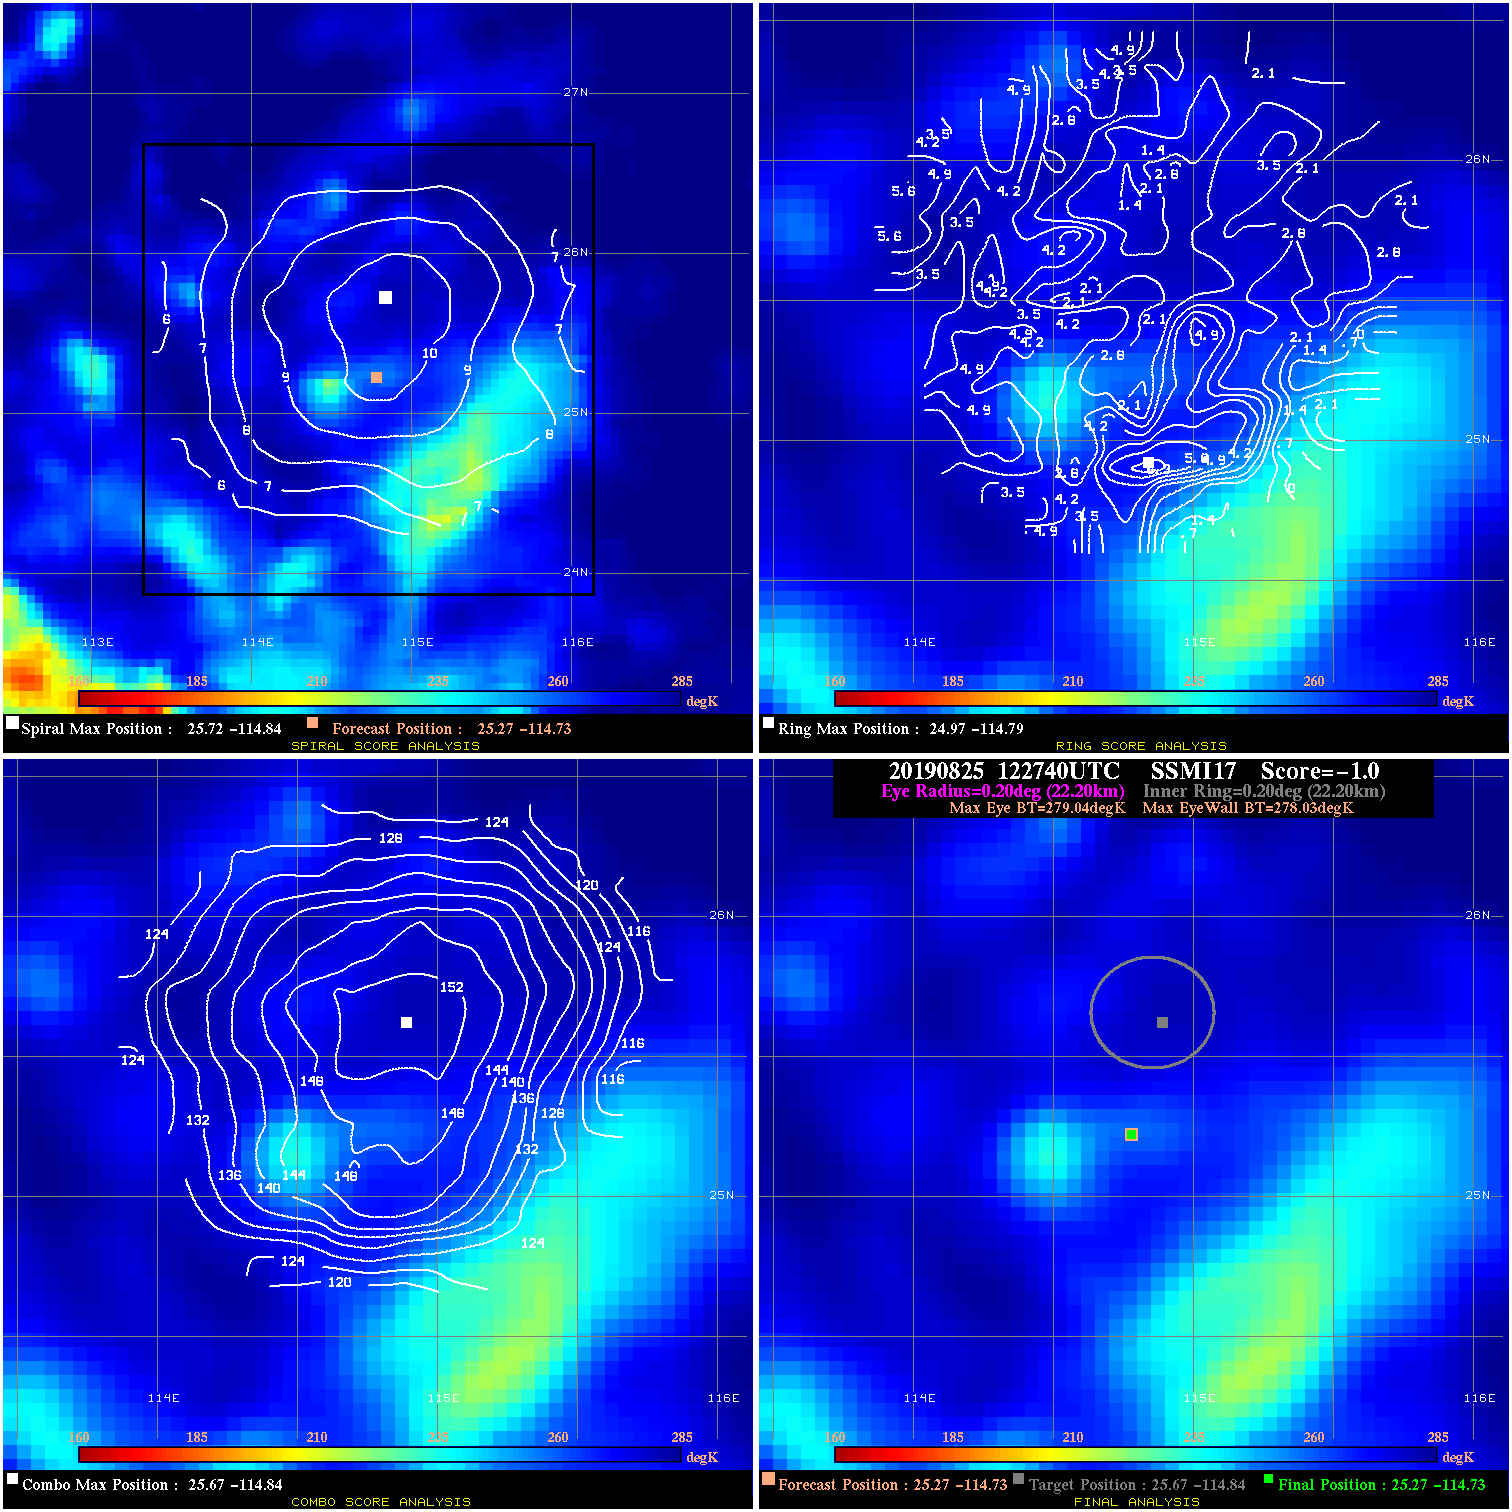
20190825 122740 -1.0 N/A N/A 44.44 1.01 40.0 SSMI17 25.3 -114.7 25.3 -114.7 25.7 -114.8 Analysis Plot
|
|
Legend: - Date/Time are determined from PMW imagery at Forecast (initial guess) Lat/Lon position. - Positive/Negative Latitude = North/South Hemisphere; Longitude = Western/Eastern Hemisphere. - "Ring Diam" value indicates the estimated surface eyewall diameter in km (the MI eyewall edge diameter minus 10 km). - "Ring Pct" is the percentage of the "ring" (eyewall inner boundary) that is 1) colder than the "hot spot" (warmest eye pixel) in the eye by 20K, or 2) the percentage that is a) colder than 232K and b) colder than the "hot spot" by 10K, whichever is greater. - Values are red if Ring % <= 65, yellow/brown if Ring % <= 85 and green if Ring % > 85. - "Tb diff" is the difference between the "hot spot" (warmest eye pixel) and the warmest pixel on the eyewall. - Intensity score are listed as negative, and not used, when the JTWC or NHC estimated Vmax is <55 kts in order to rule out weak but highly symmetric TCs. - Error messages in intensity scores: -920 is used when the hottest pixel in the eye is <200K, to prevent false positives; -930 means <85% of eyewall has observations/data. |