Tropical Depression 21E
|
Passive Microwave (PMW) Intensity Information Hurricane Intensity Estimation (HIE) Algorithm Version 9.0 |
Overpass Inten Ring Ring Wind Forecast Final Target
Date Time Score Meaning Pct Diam BTdiff Est Sat Lat Lon Lat Lon Lat Lon
20191116 114239 -930.0 N/A N/A N/A 0.00 30.0 SSMI16 9.2 99.5 9.2 99.5 9.6 98.5 Analysis Plot
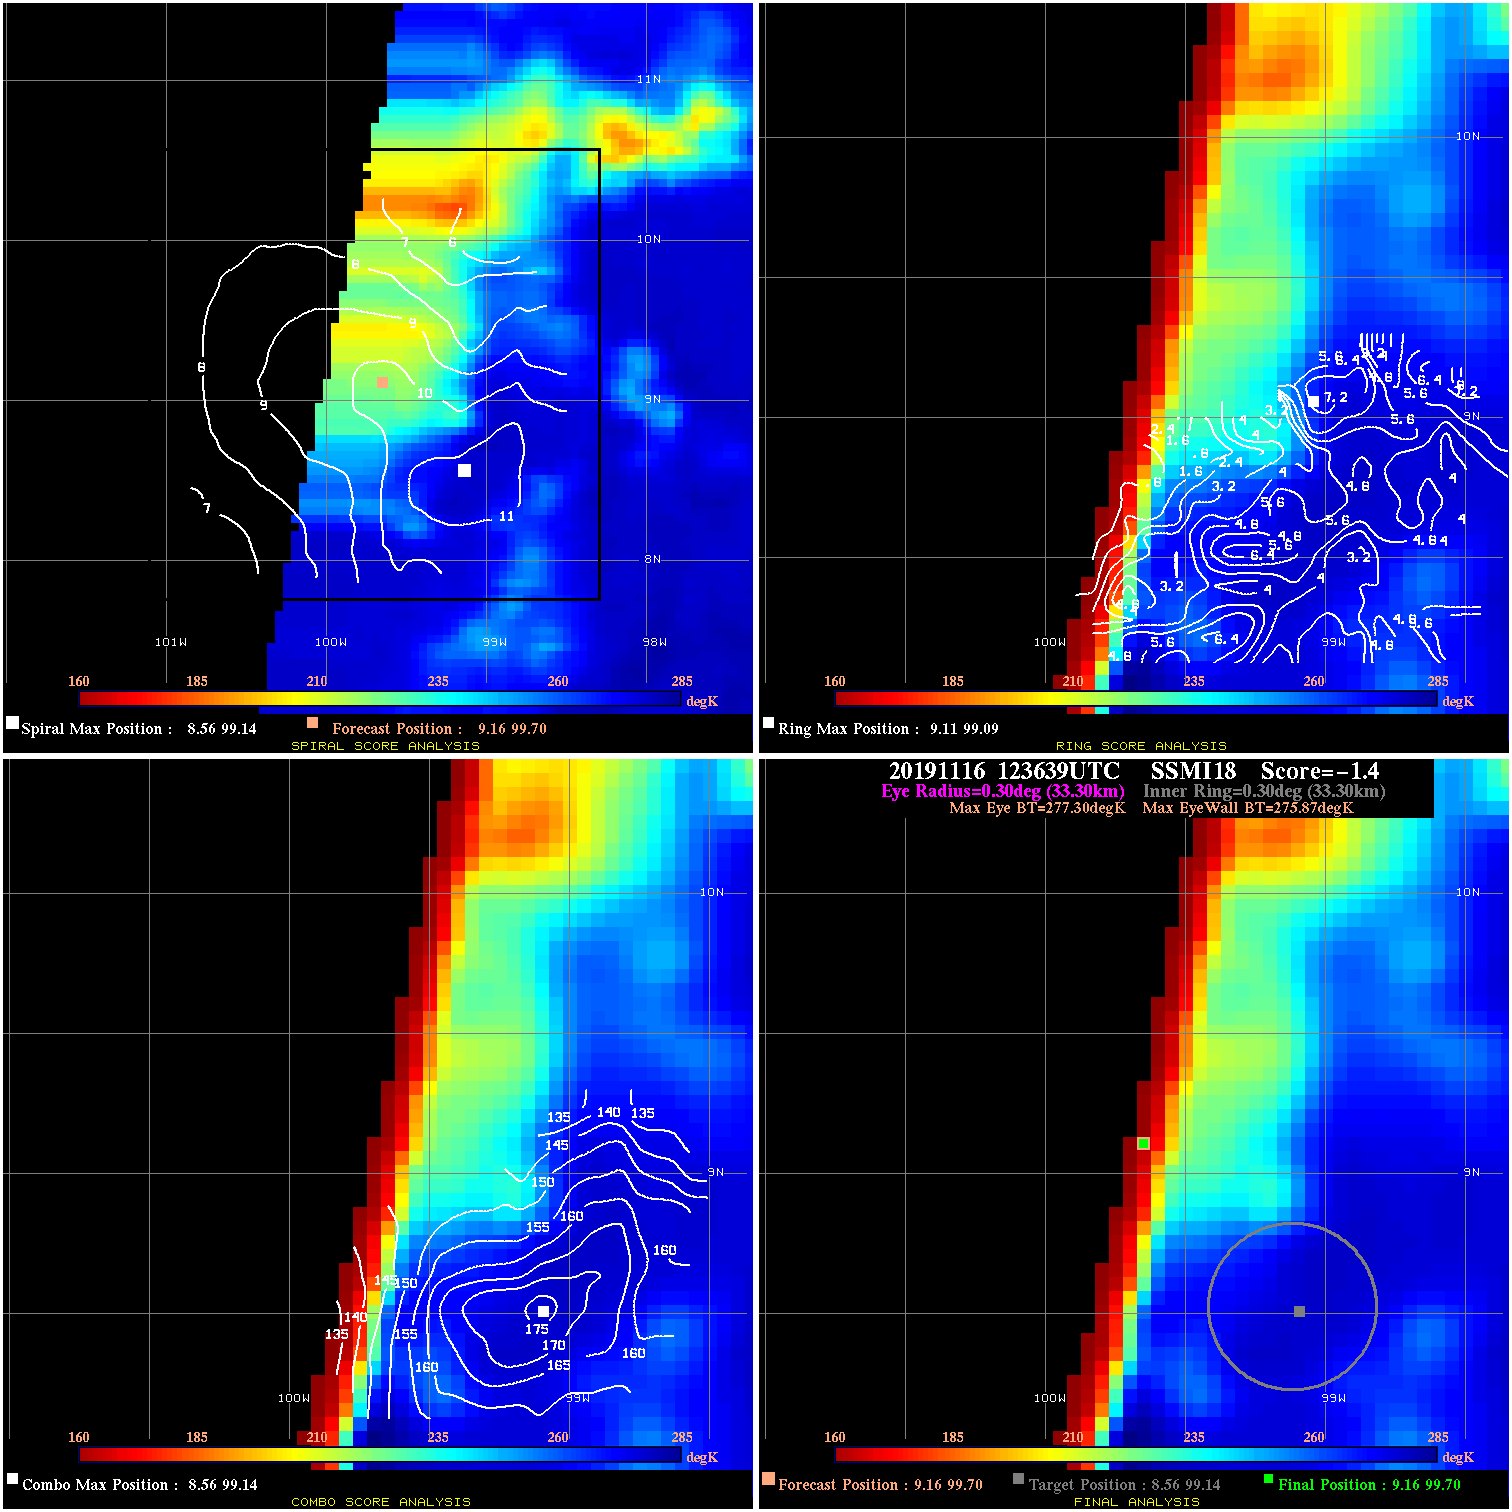
20191116 123639 -1.4 N/A 10.0% 66.66 1.43 30.0 SSMI18 9.2 99.7 9.2 99.7 8.6 99.1 Analysis Plot
20191116 195906 -4.4 N/A 23.3% 122.21 4.40 30.0 AMSR2 9.5 100.9 9.5 100.9 9.9 101.5 Analysis Plot
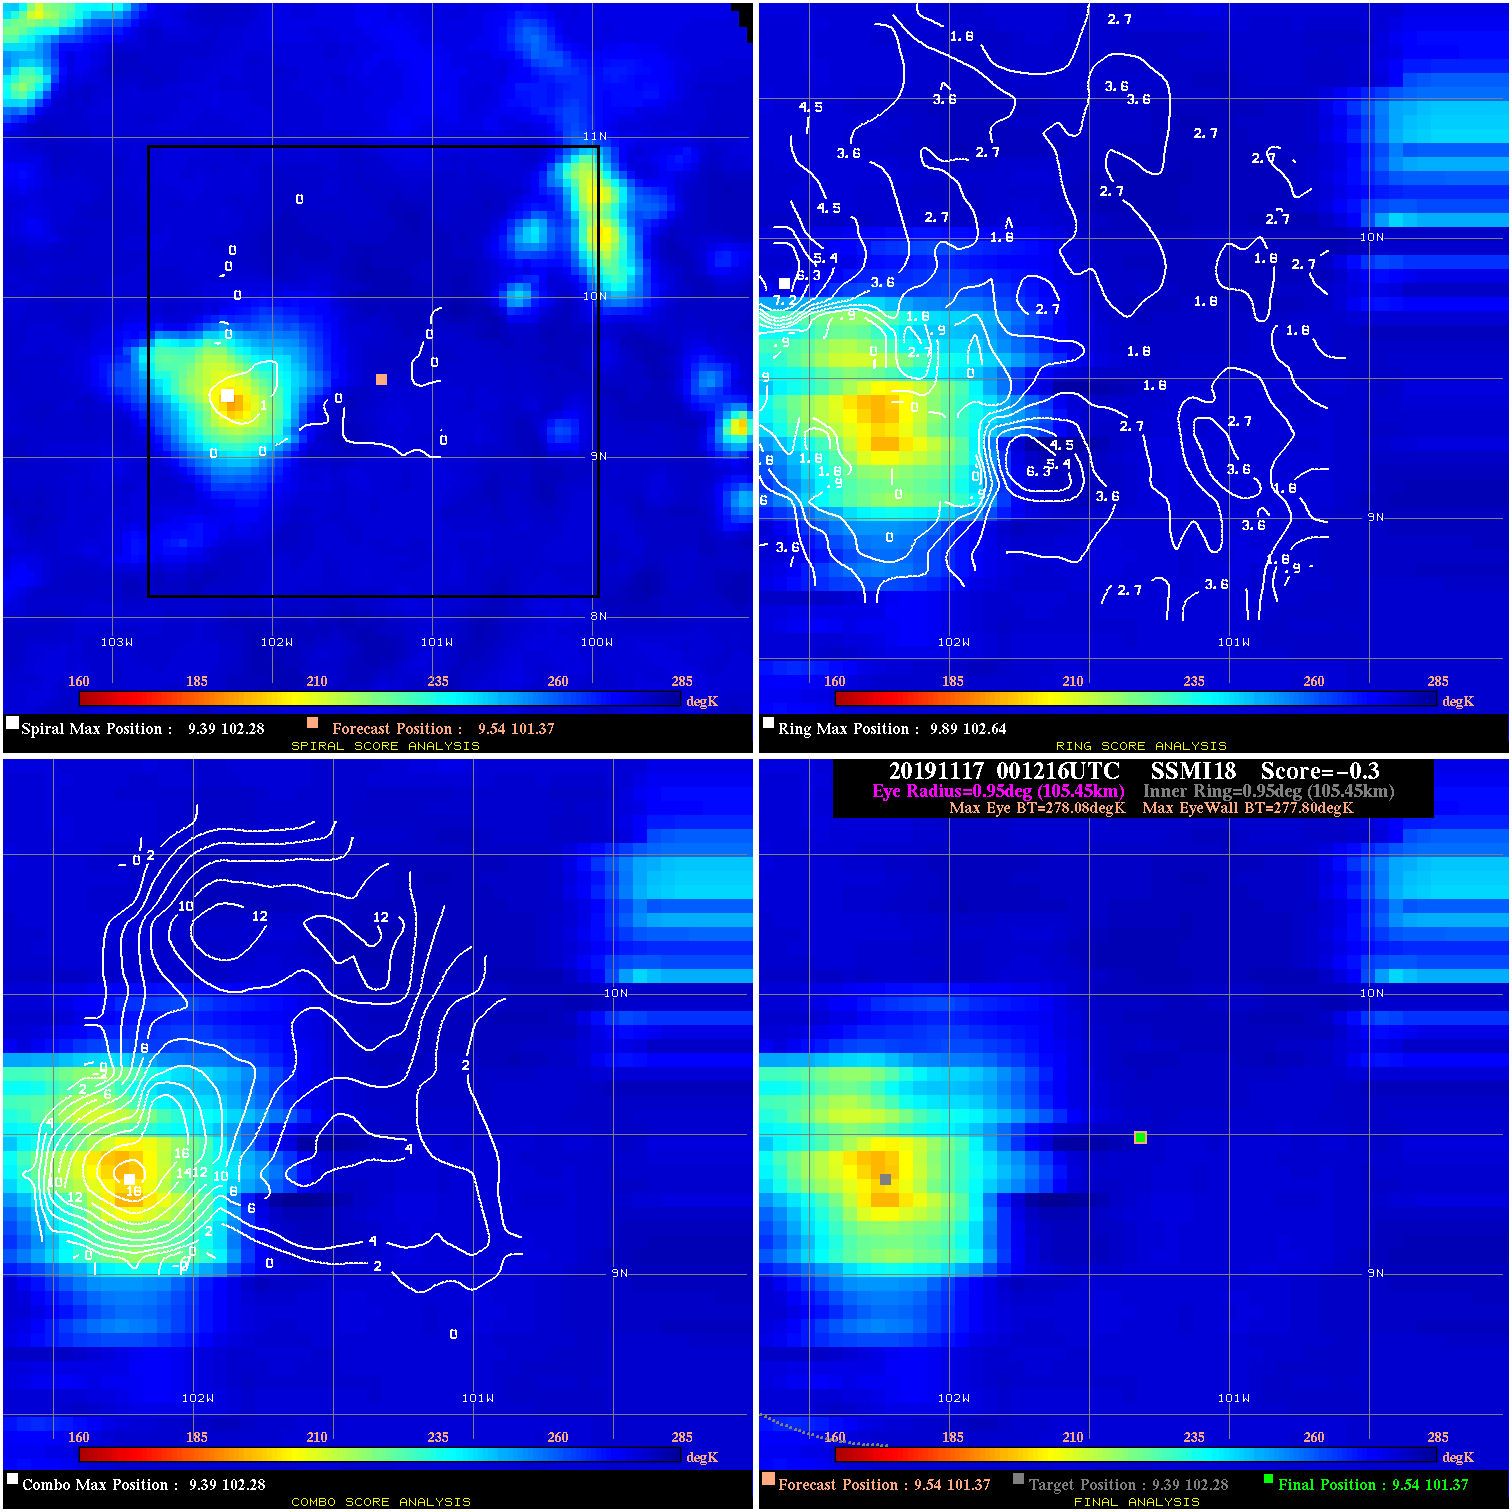
20191117 001216 -0.3 N/A N/A 211.09 .28 30.0 SSMI18 9.5 101.4 9.5 101.4 9.4 102.3 Analysis Plot
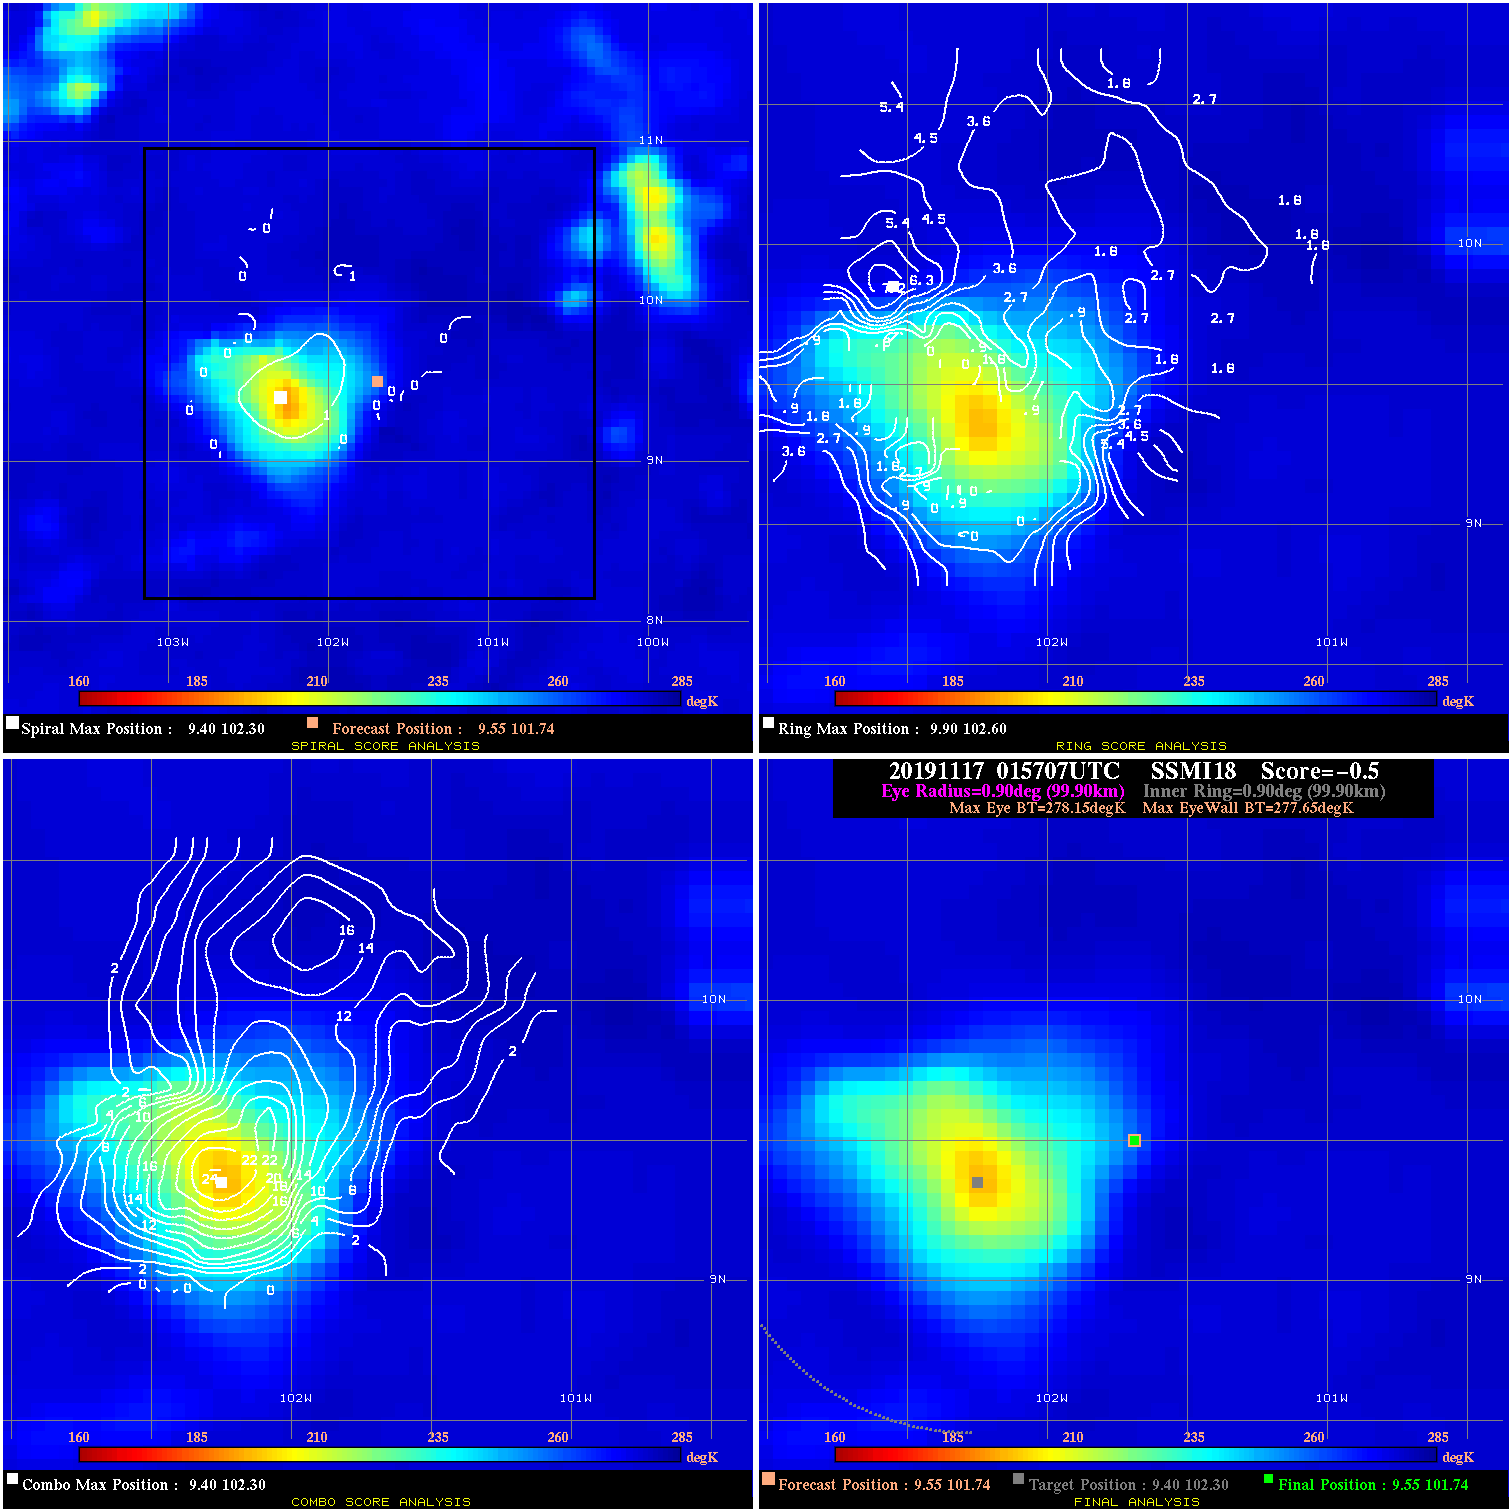
20191117 015707 -0.5 N/A N/A 199.98 .50 30.0 SSMI18 9.6 101.7 9.6 101.7 9.4 102.3 Analysis Plot
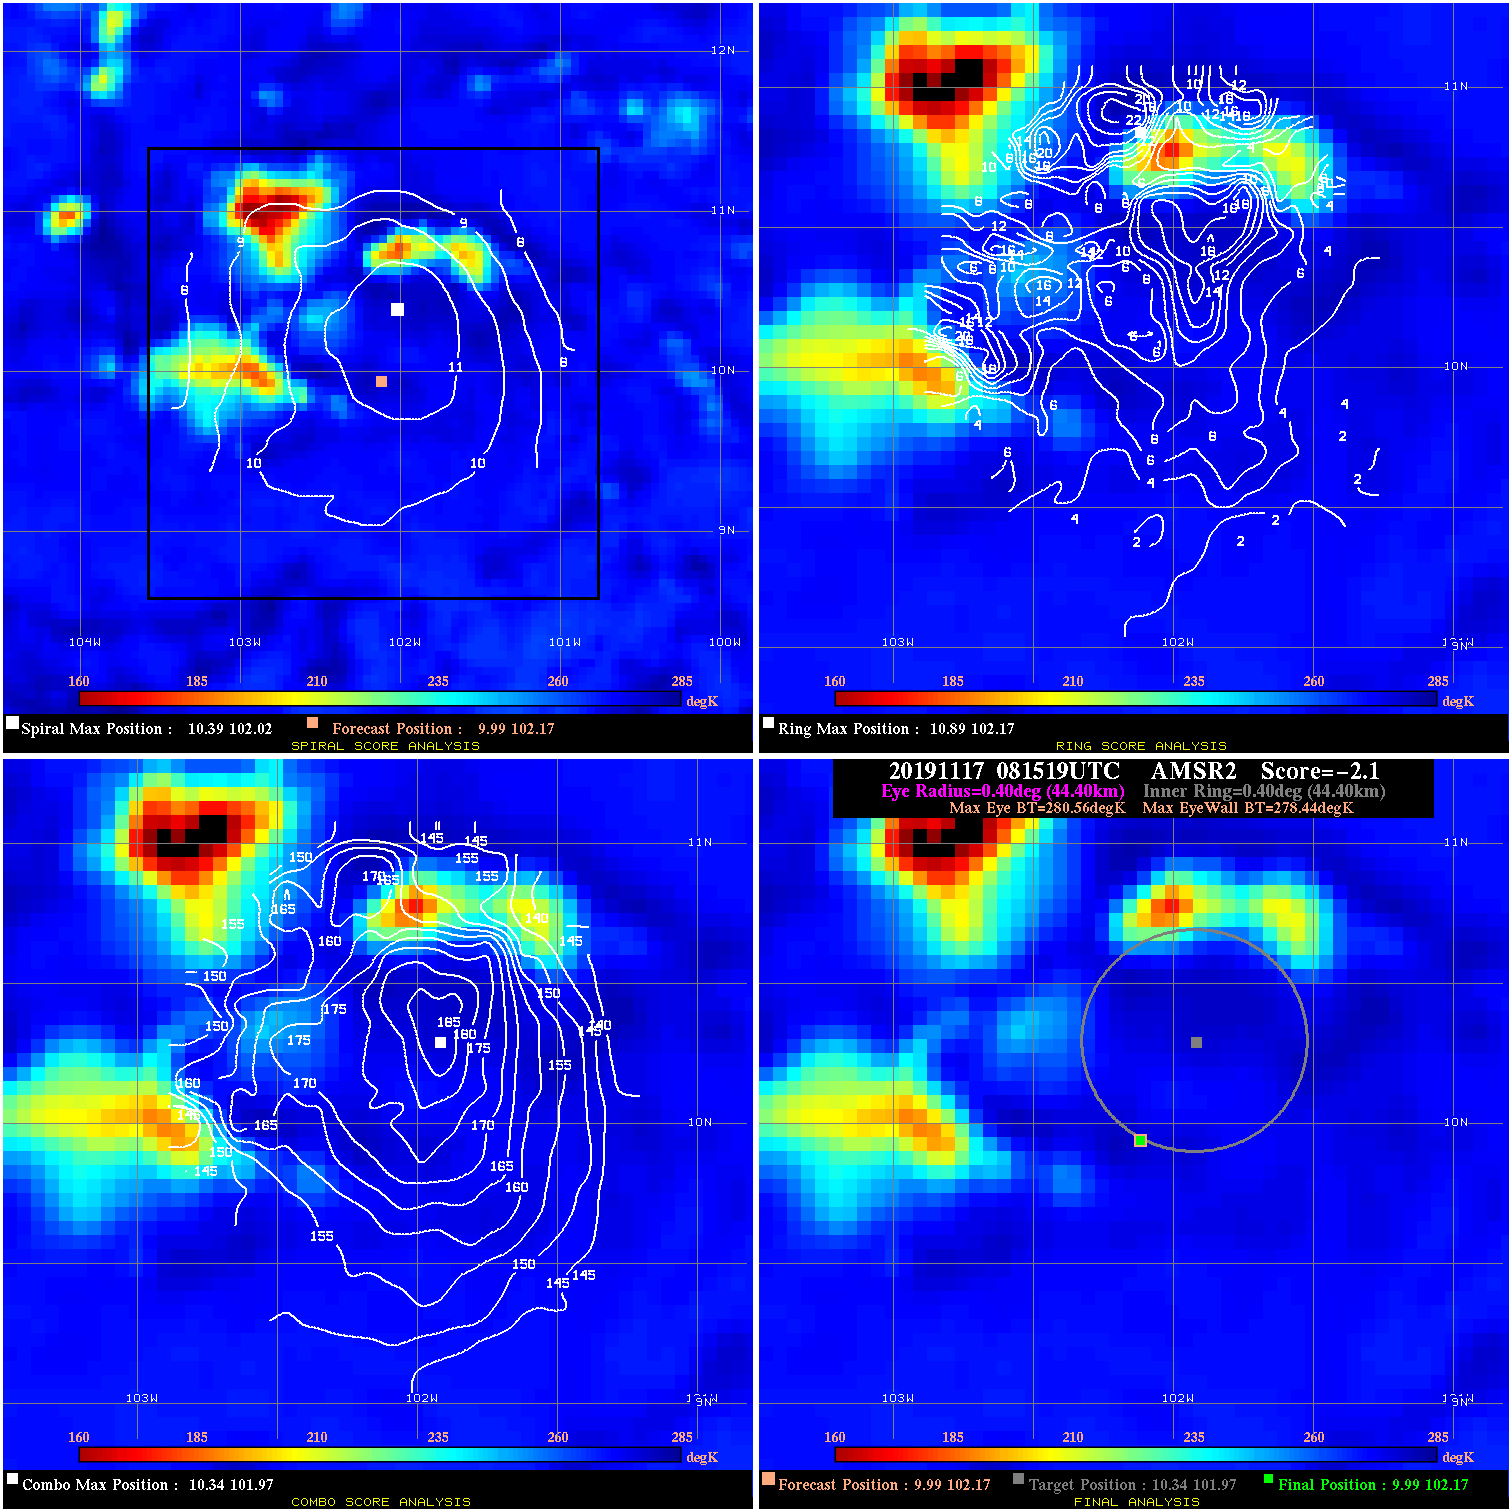
20191117 081519 -2.1 N/A 11.0% 88.88 2.12 25.0 AMSR2 10.0 102.2 10.0 102.2 10.3 102.0 Analysis Plot
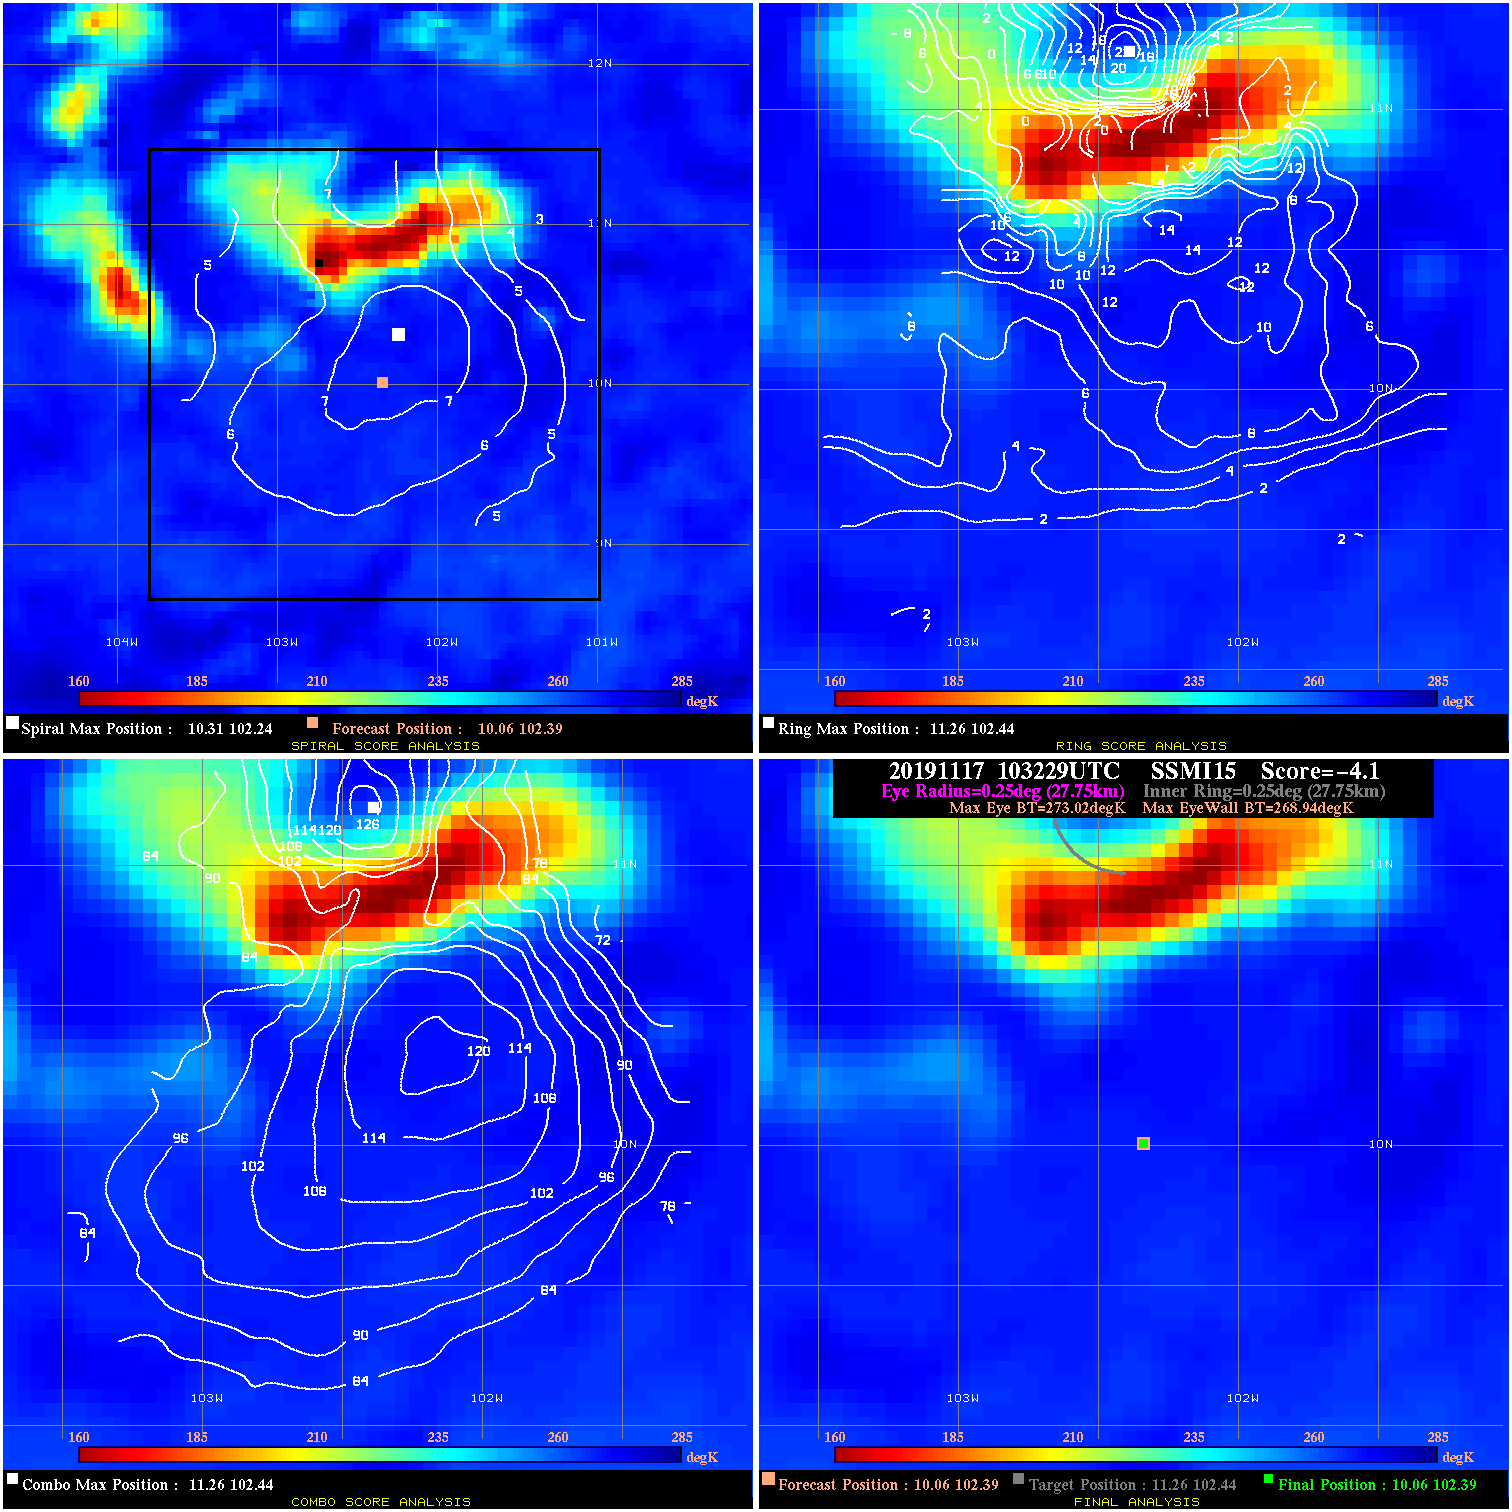
20191117 103229 -4.1 N/A 56.2% 55.55 4.08 25.0 SSMI15 10.1 102.4 10.1 102.4 11.3 102.4 Analysis Plot
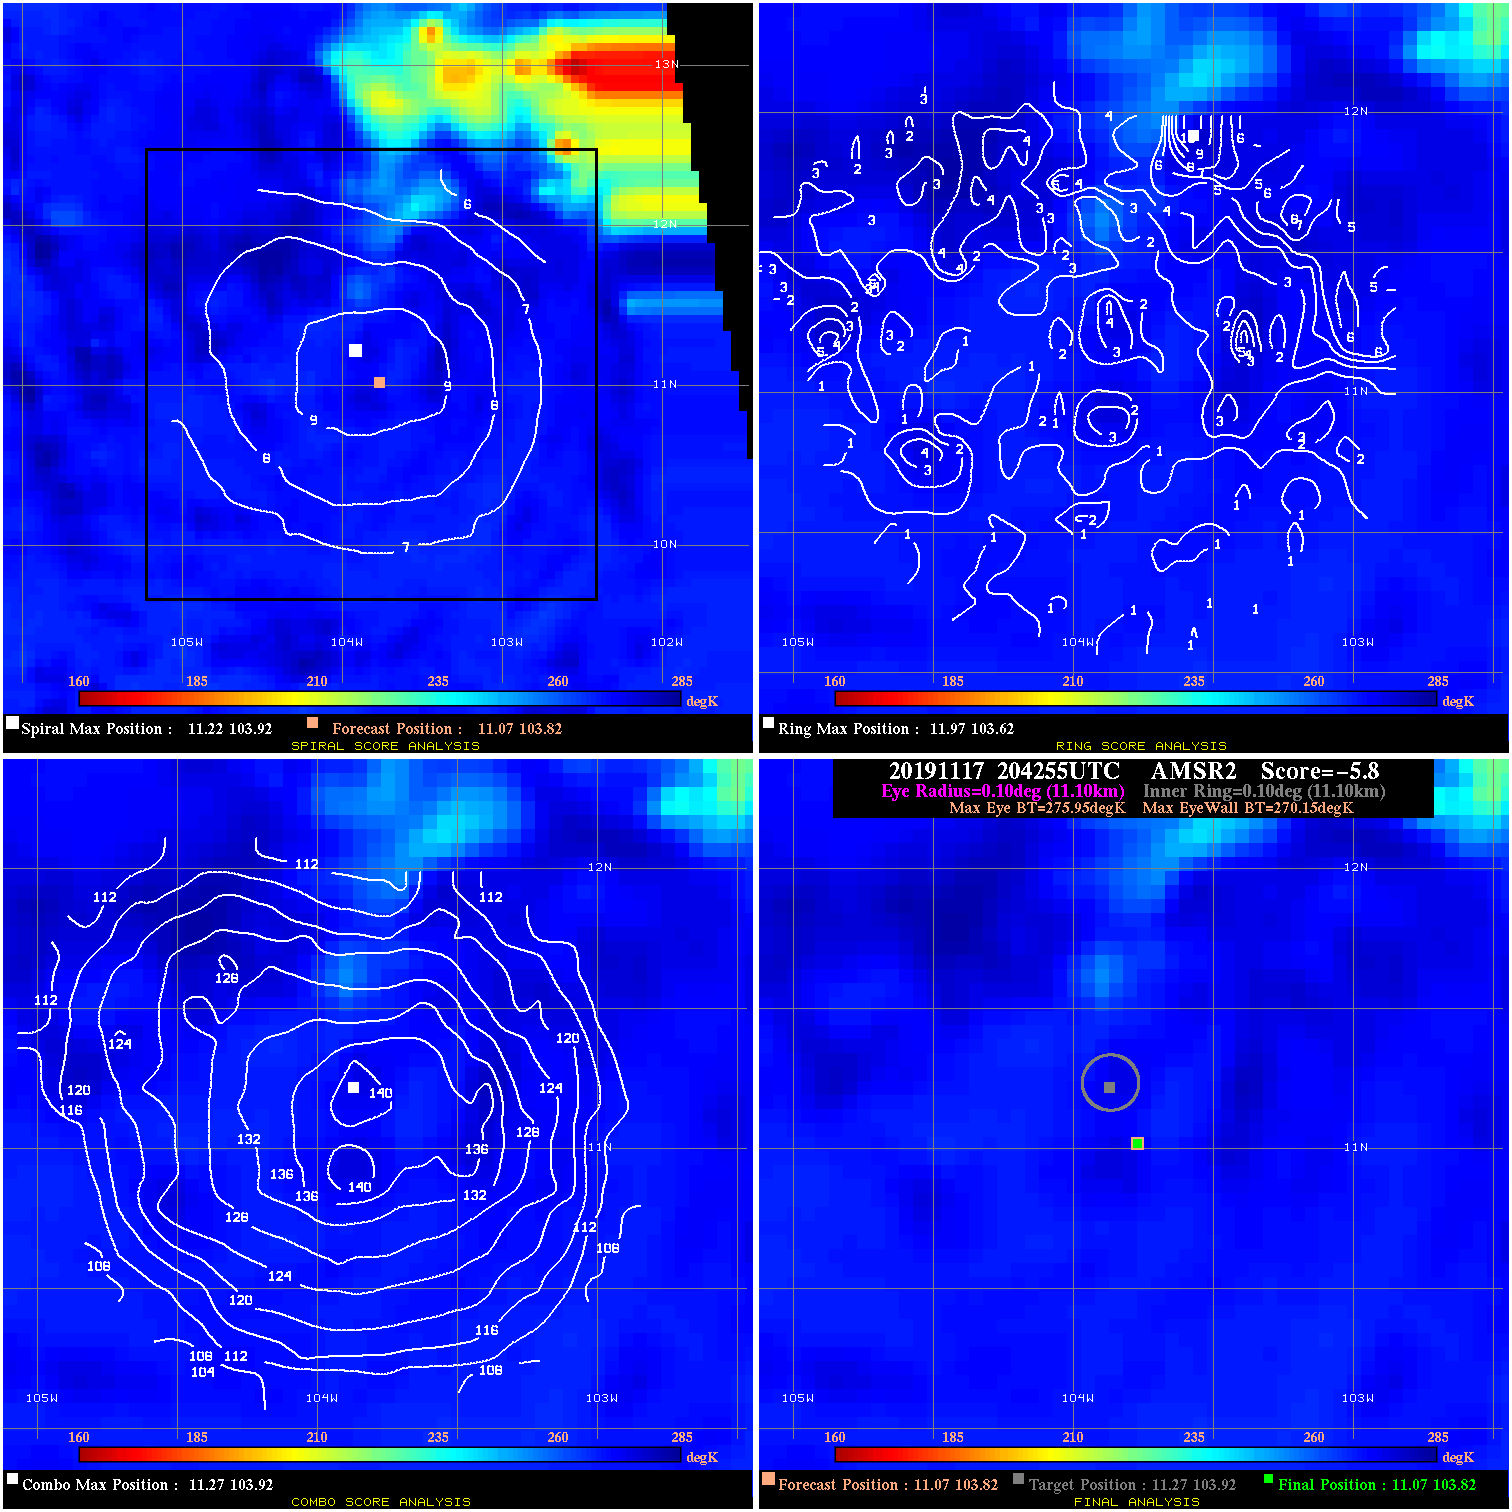
20191117 204255 -5.8 N/A N/A 22.22 5.80 25.0 AMSR2 11.1 103.8 11.1 103.8 11.3 103.9 Analysis Plot
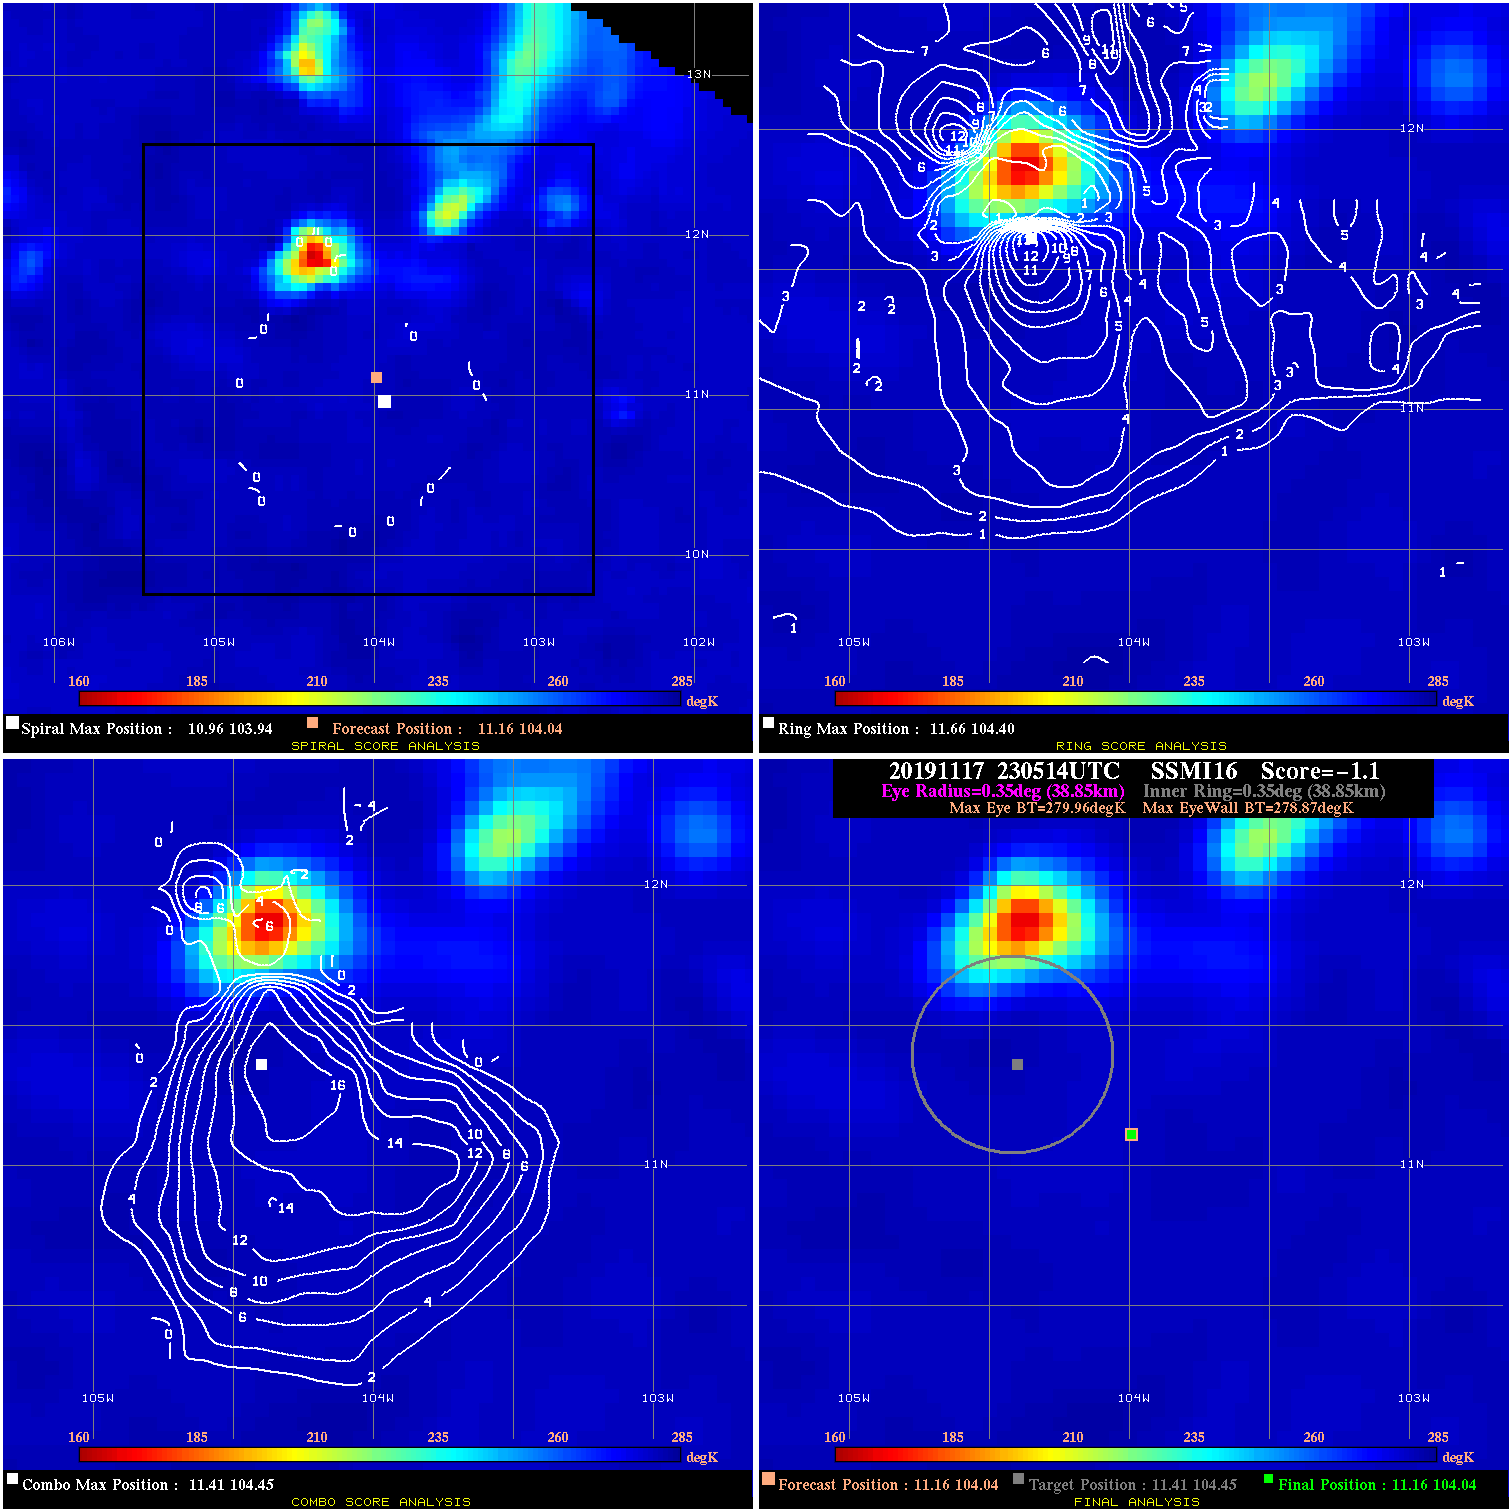
20191117 230514 -1.1 N/A 15.1% 77.77 1.09 25.0 SSMI16 11.2 104.0 11.2 104.0 11.4 104.4 Analysis Plot
20191117 230514 -1.1 N/A 15.1% 77.77 1.09 25.0 SSMI18 11.2 104.0 11.2 104.0 11.4 104.4 Analysis Plot
20191118 005343 -1.5 N/A N/A 77.77 1.51 25.0 SSMI16 11.2 104.2 11.2 104.2 11.4 104.4 Analysis Plot
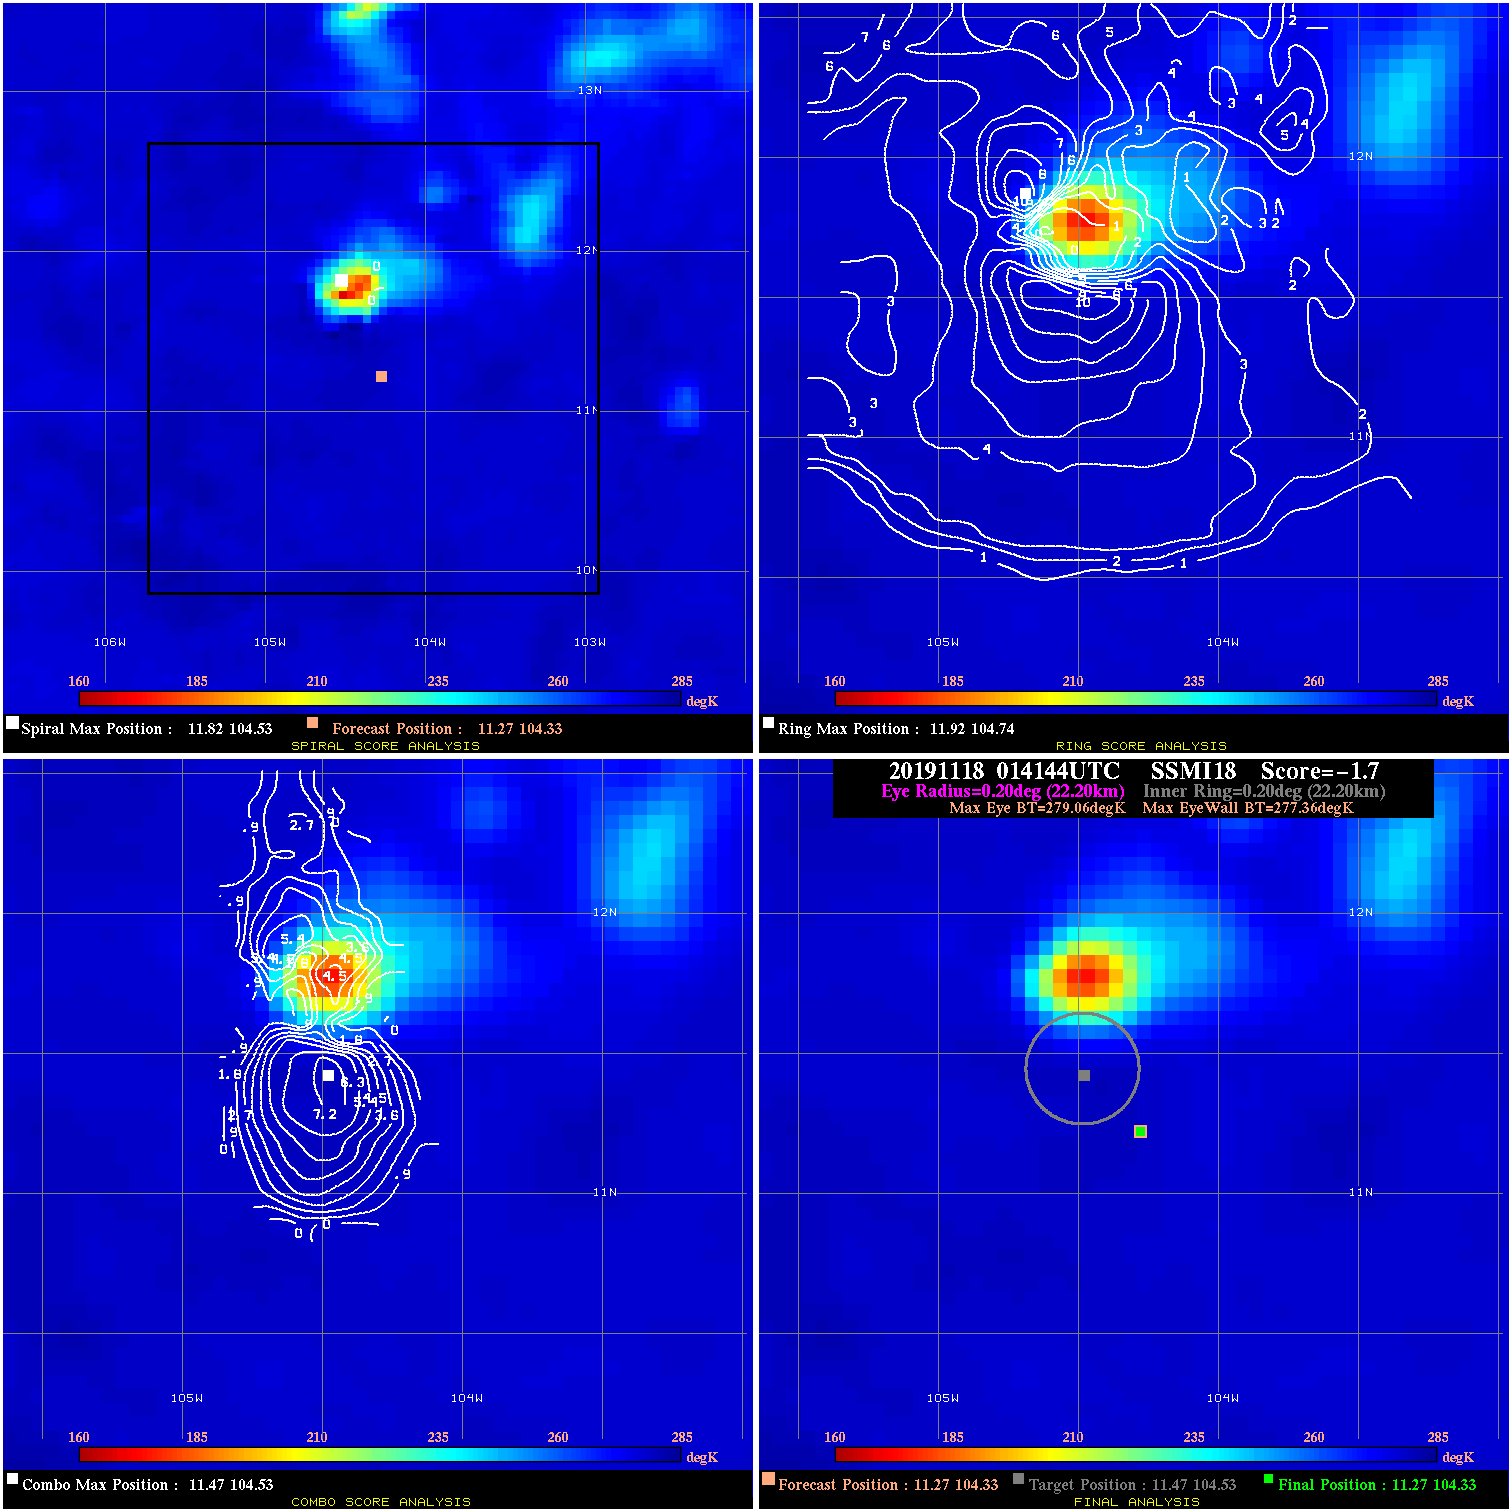
20191118 014144 -1.7 N/A N/A 44.44 1.70 25.0 SSMI18 11.3 104.3 11.3 104.3 11.5 104.5 Analysis Plot
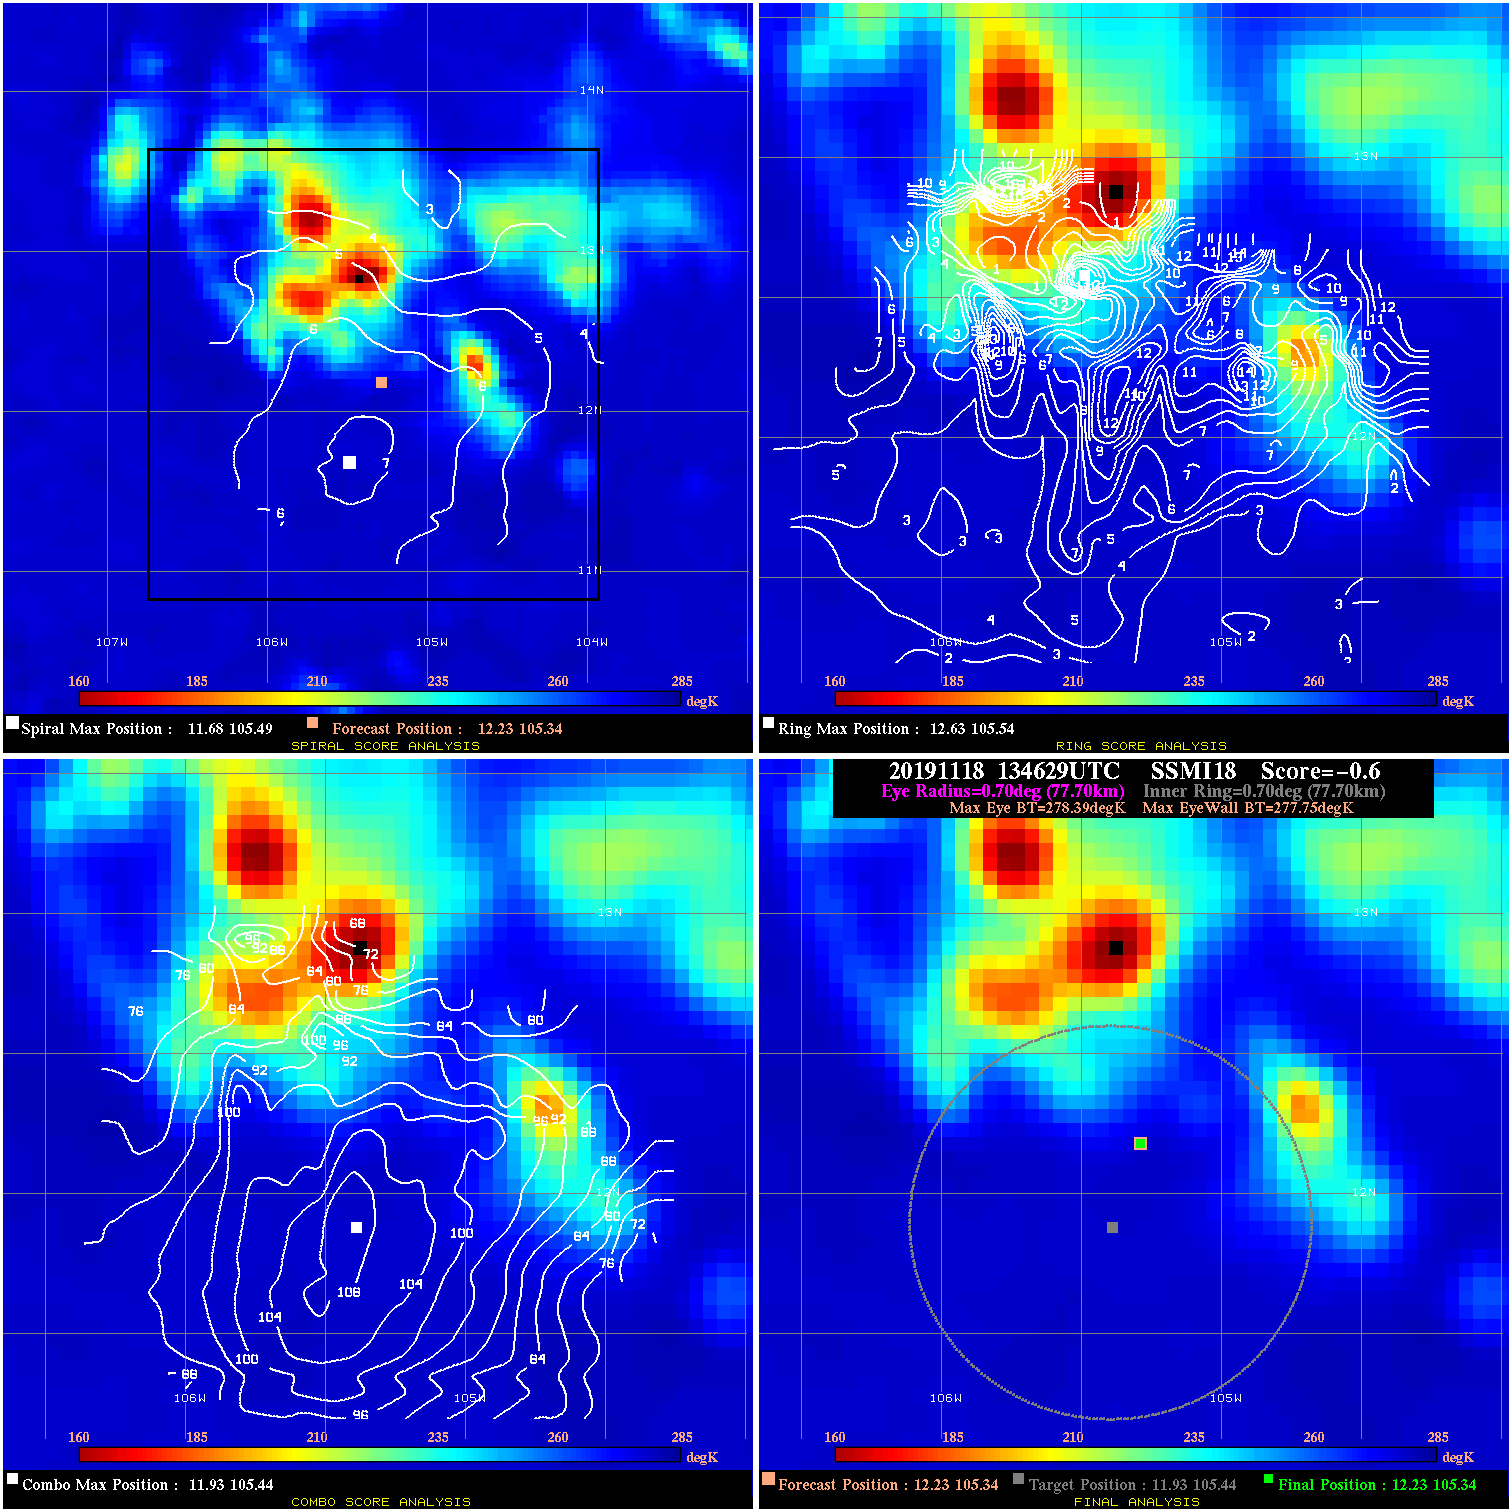
20191118 134629 -0.6 N/A 21.9% 155.54 .64 25.0 SSMI18 12.2 105.3 12.2 105.3 11.9 105.4 Analysis Plot
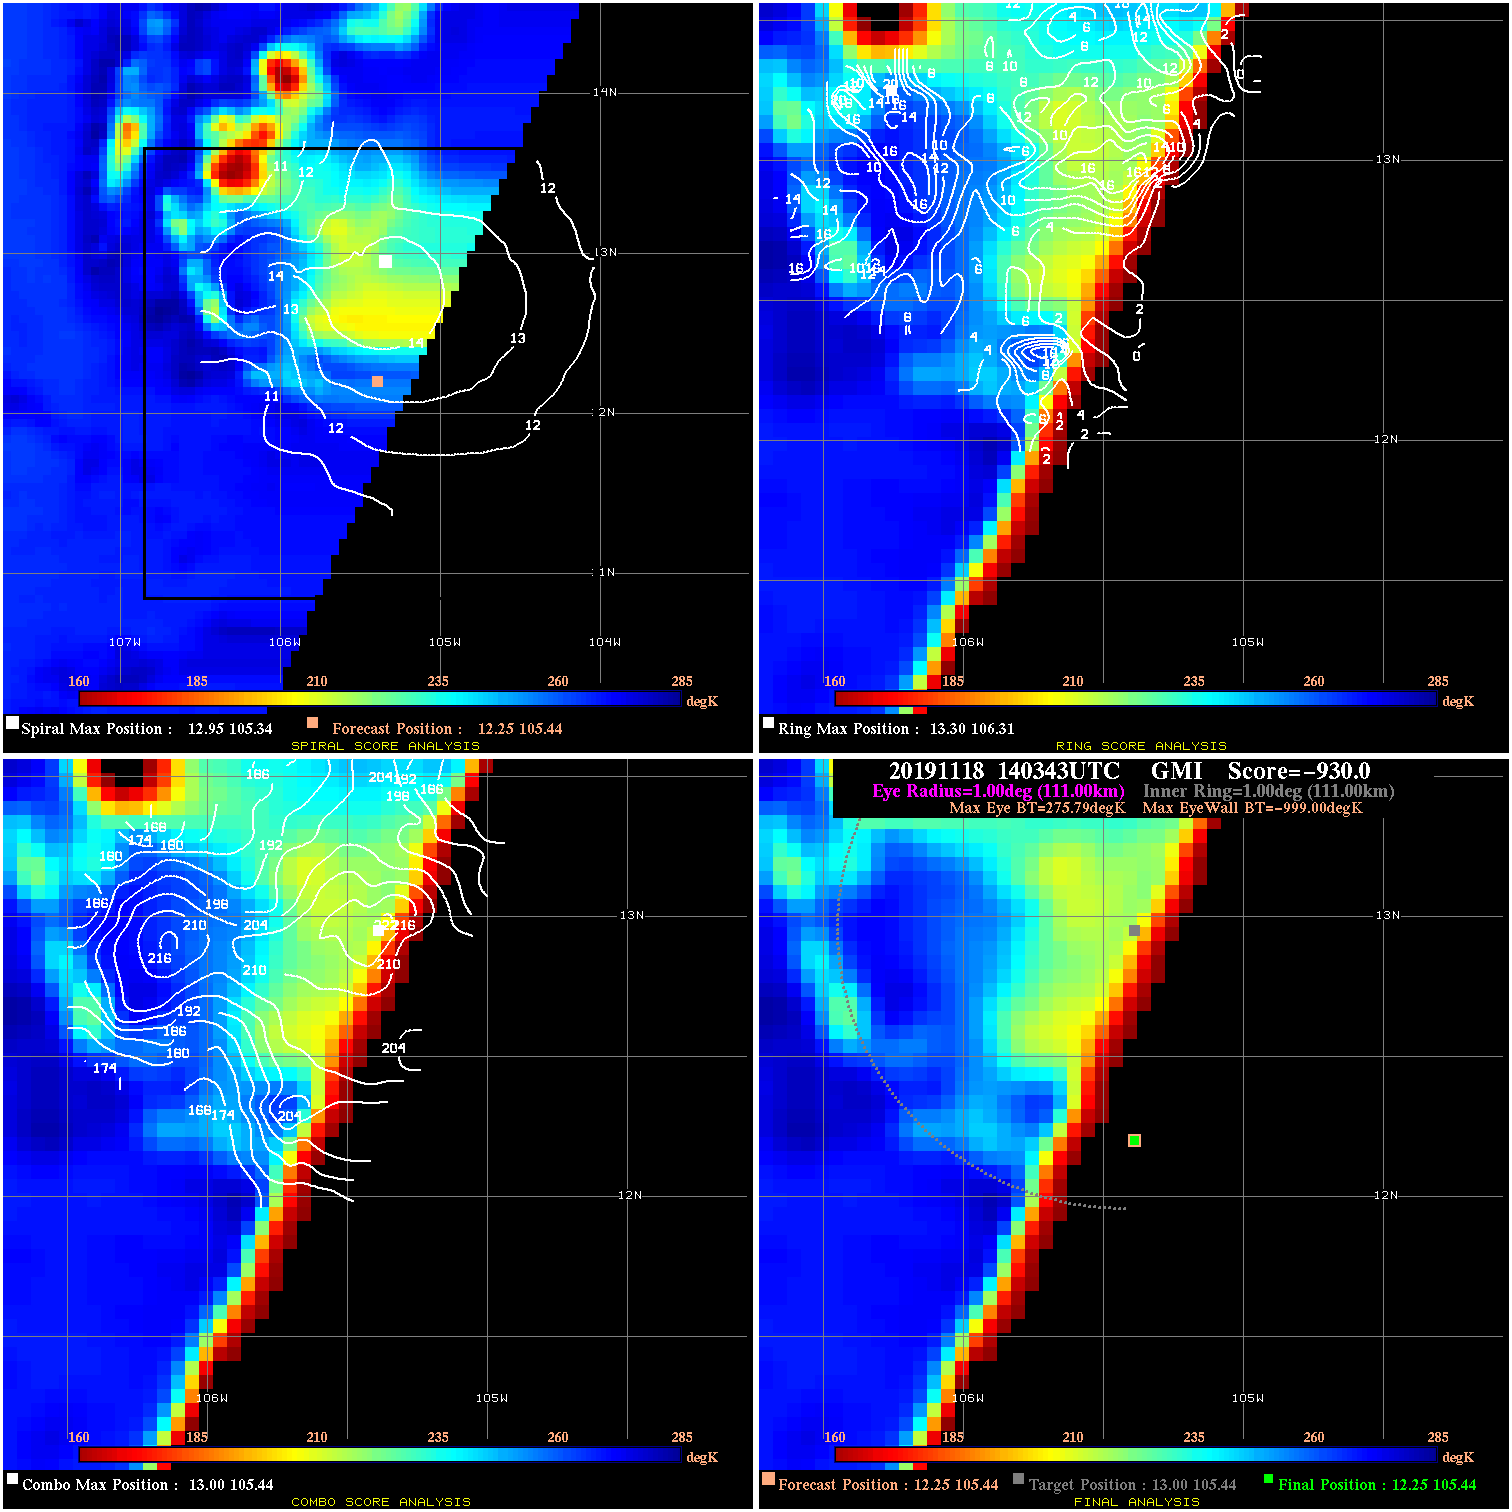
20191118 140343 -930.0 N/A N/A N/A 0.00 25.0 GMI 12.3 105.4 12.3 105.4 13.0 105.4 Analysis Plot
|
|
Legend: - Date/Time are determined from PMW imagery at Forecast (initial guess) Lat/Lon position. - Positive/Negative Latitude = North/South Hemisphere; Longitude = Western/Eastern Hemisphere. - "Ring Diam" value indicates the estimated surface eyewall diameter in km (the MI eyewall edge diameter minus 10 km). - "Ring Pct" is the percentage of the "ring" (eyewall inner boundary) that is 1) colder than the "hot spot" (warmest eye pixel) in the eye by 20K, or 2) the percentage that is a) colder than 232K and b) colder than the "hot spot" by 10K, whichever is greater. - Values are red if Ring % <= 65, yellow/brown if Ring % <= 85 and green if Ring % > 85. - "Tb diff" is the difference between the "hot spot" (warmest eye pixel) and the warmest pixel on the eyewall. - Intensity score are listed as negative, and not used, when the JTWC or NHC estimated Vmax is <55 kts in order to rule out weak but highly symmetric TCs. - Error messages in intensity scores: -920 is used when the hottest pixel in the eye is <200K, to prevent false positives; -930 means <85% of eyewall has observations/data. |