Tropical Depression 13W
|
Passive Microwave (PMW) Intensity Information Hurricane Intensity Estimation (HIE) Algorithm Version 9.0 |
Overpass Inten Ring Ring Wind Forecast Final Target
Date Time Score Meaning Pct Diam BTdiff Est Sat Lat Lon Lat Lon Lat Lon
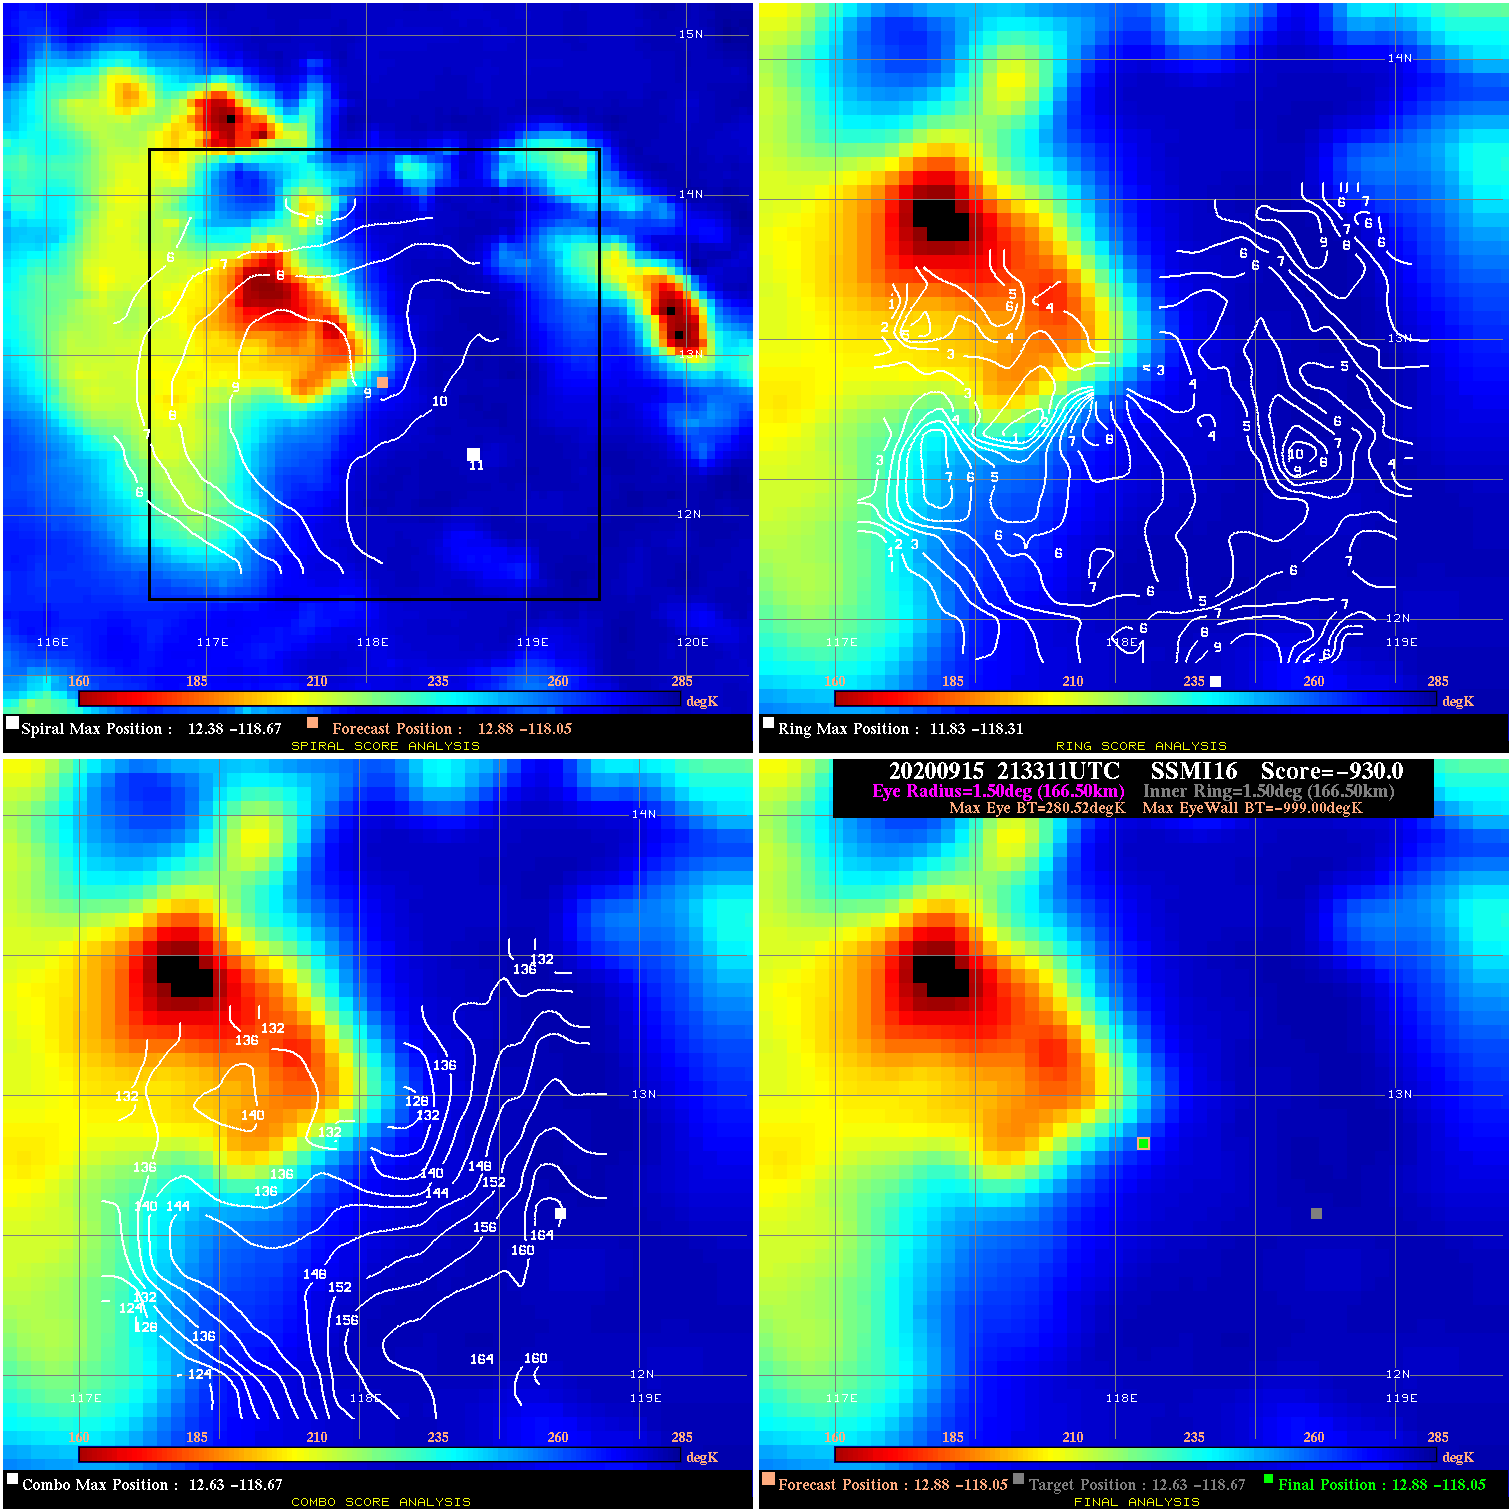
20200915 213311 -930.0 N/A N/A N/A 0.00 35.0 SSMI16 12.9 -118.1 12.9 -118.1 12.6 -118.7 Analysis Plot
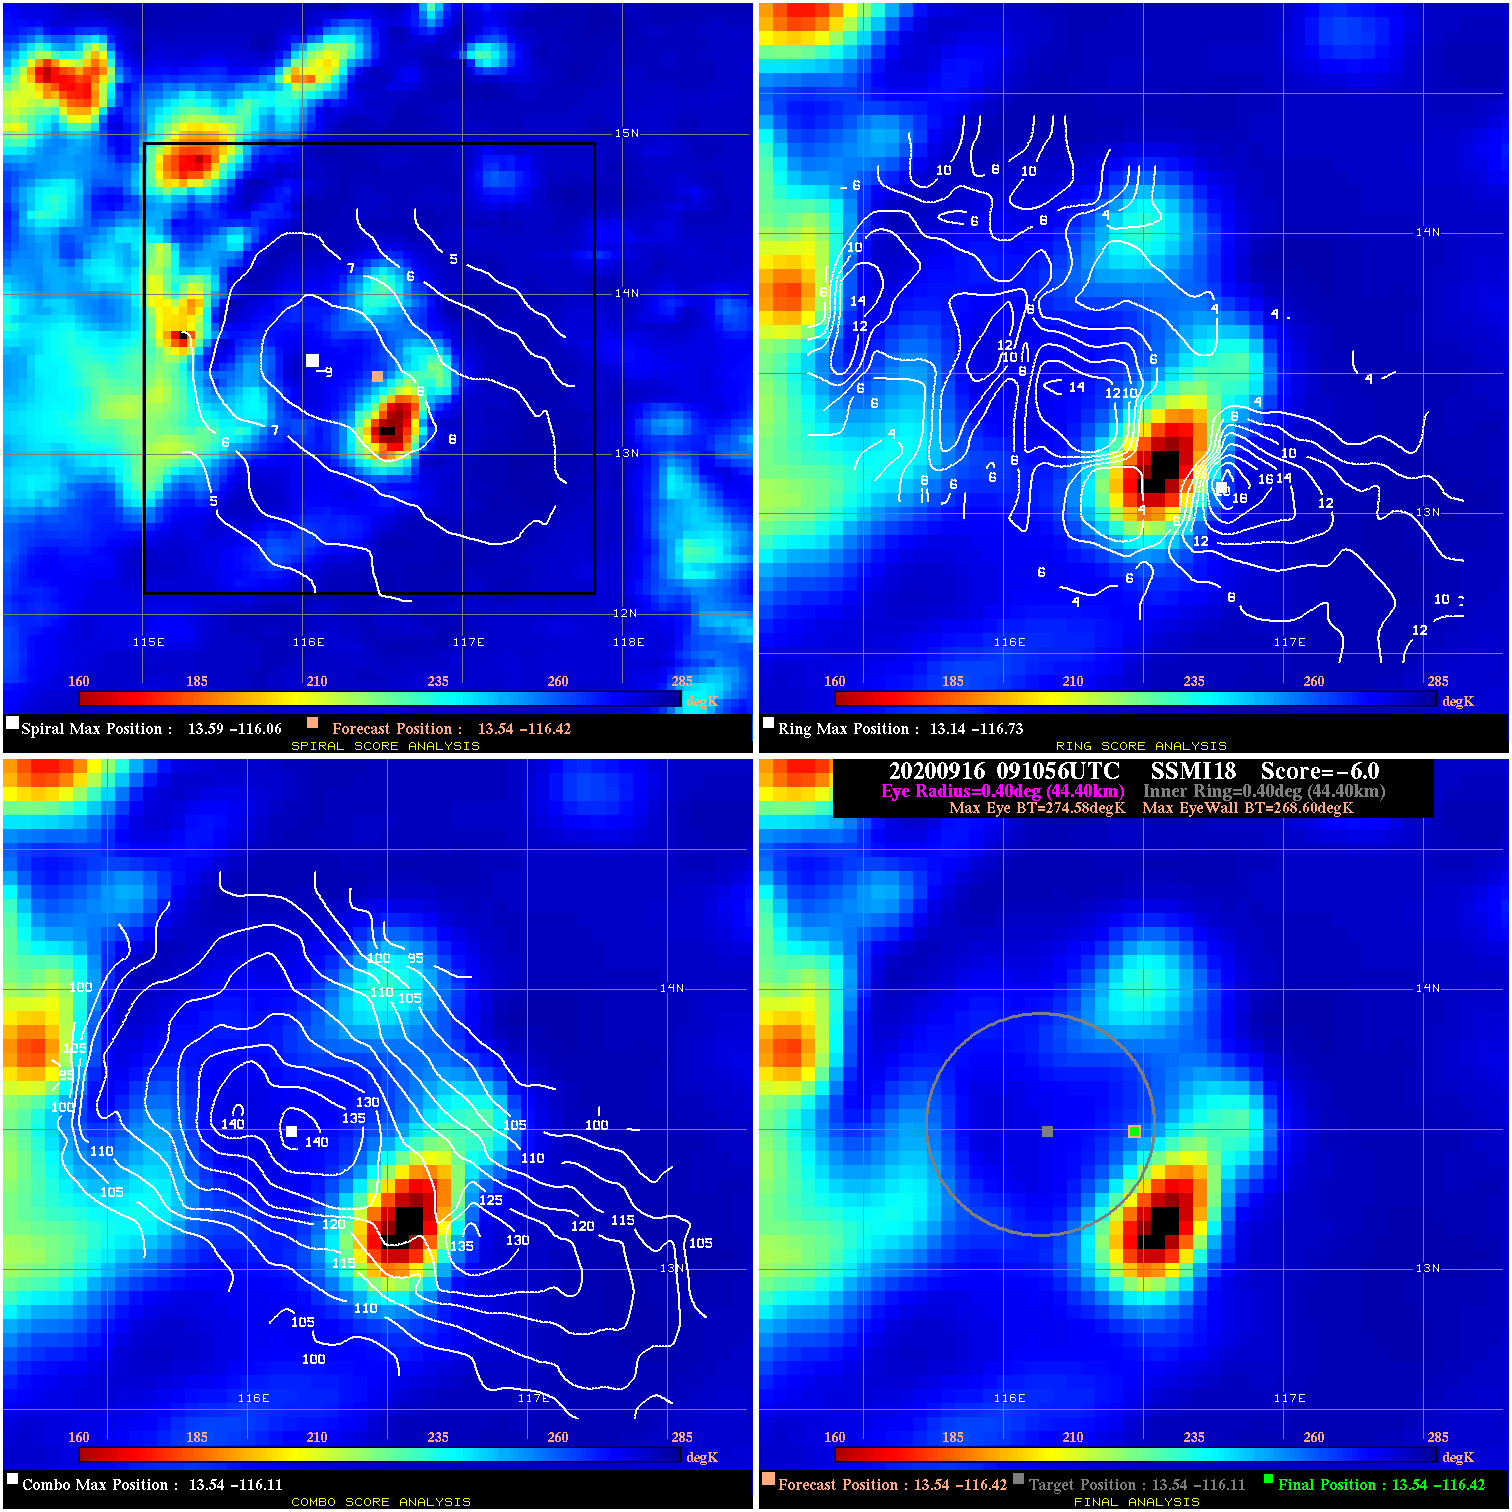
20200916 091056 -6.0 N/A 16.4% 88.88 5.98 45.0 SSMI18 13.5 -116.4 13.5 -116.4 13.5 -116.1 Analysis Plot
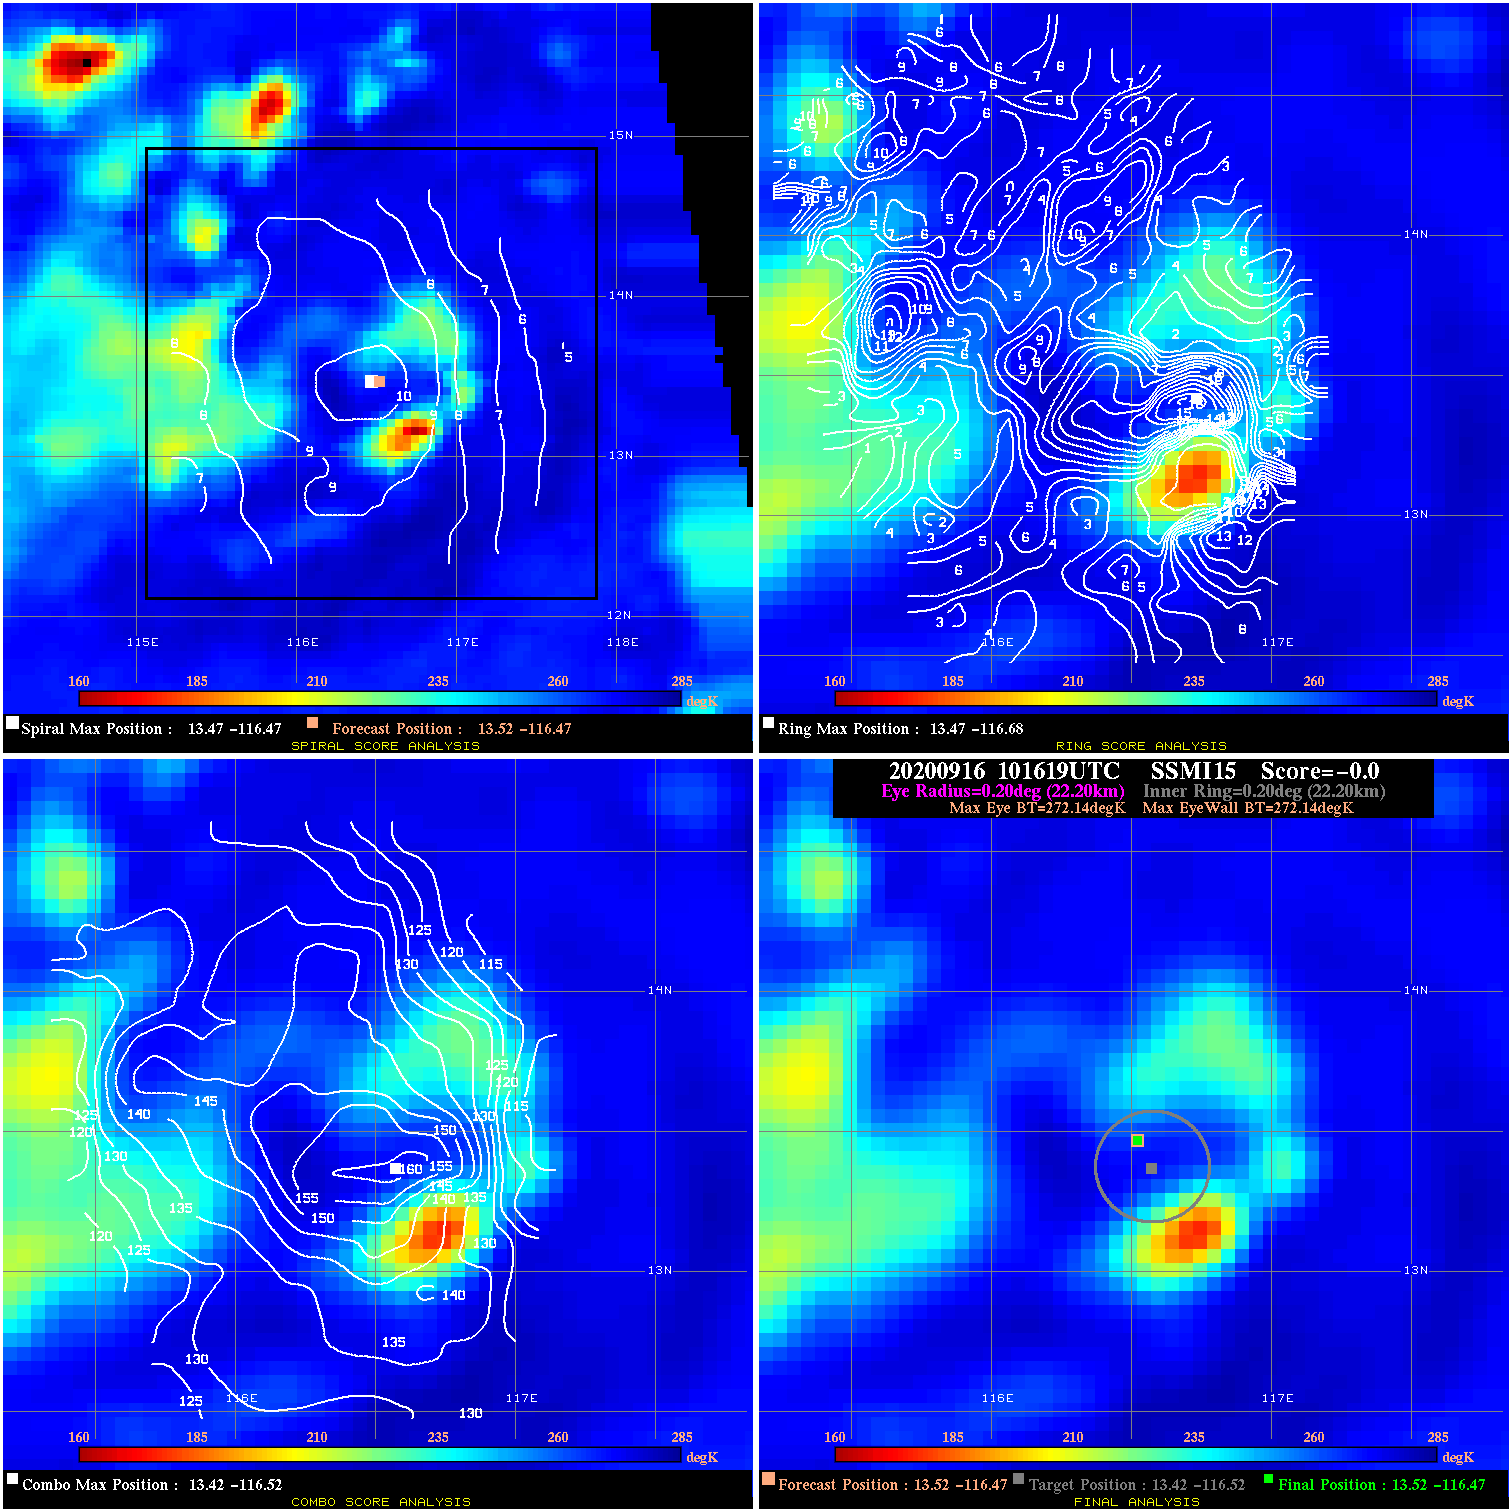
20200916 101619 N/A N/A N/A N/A N/A 45.0 SSMI15 13.5 -116.5 13.5 -116.5 13.4 -116.5 Analysis Plot
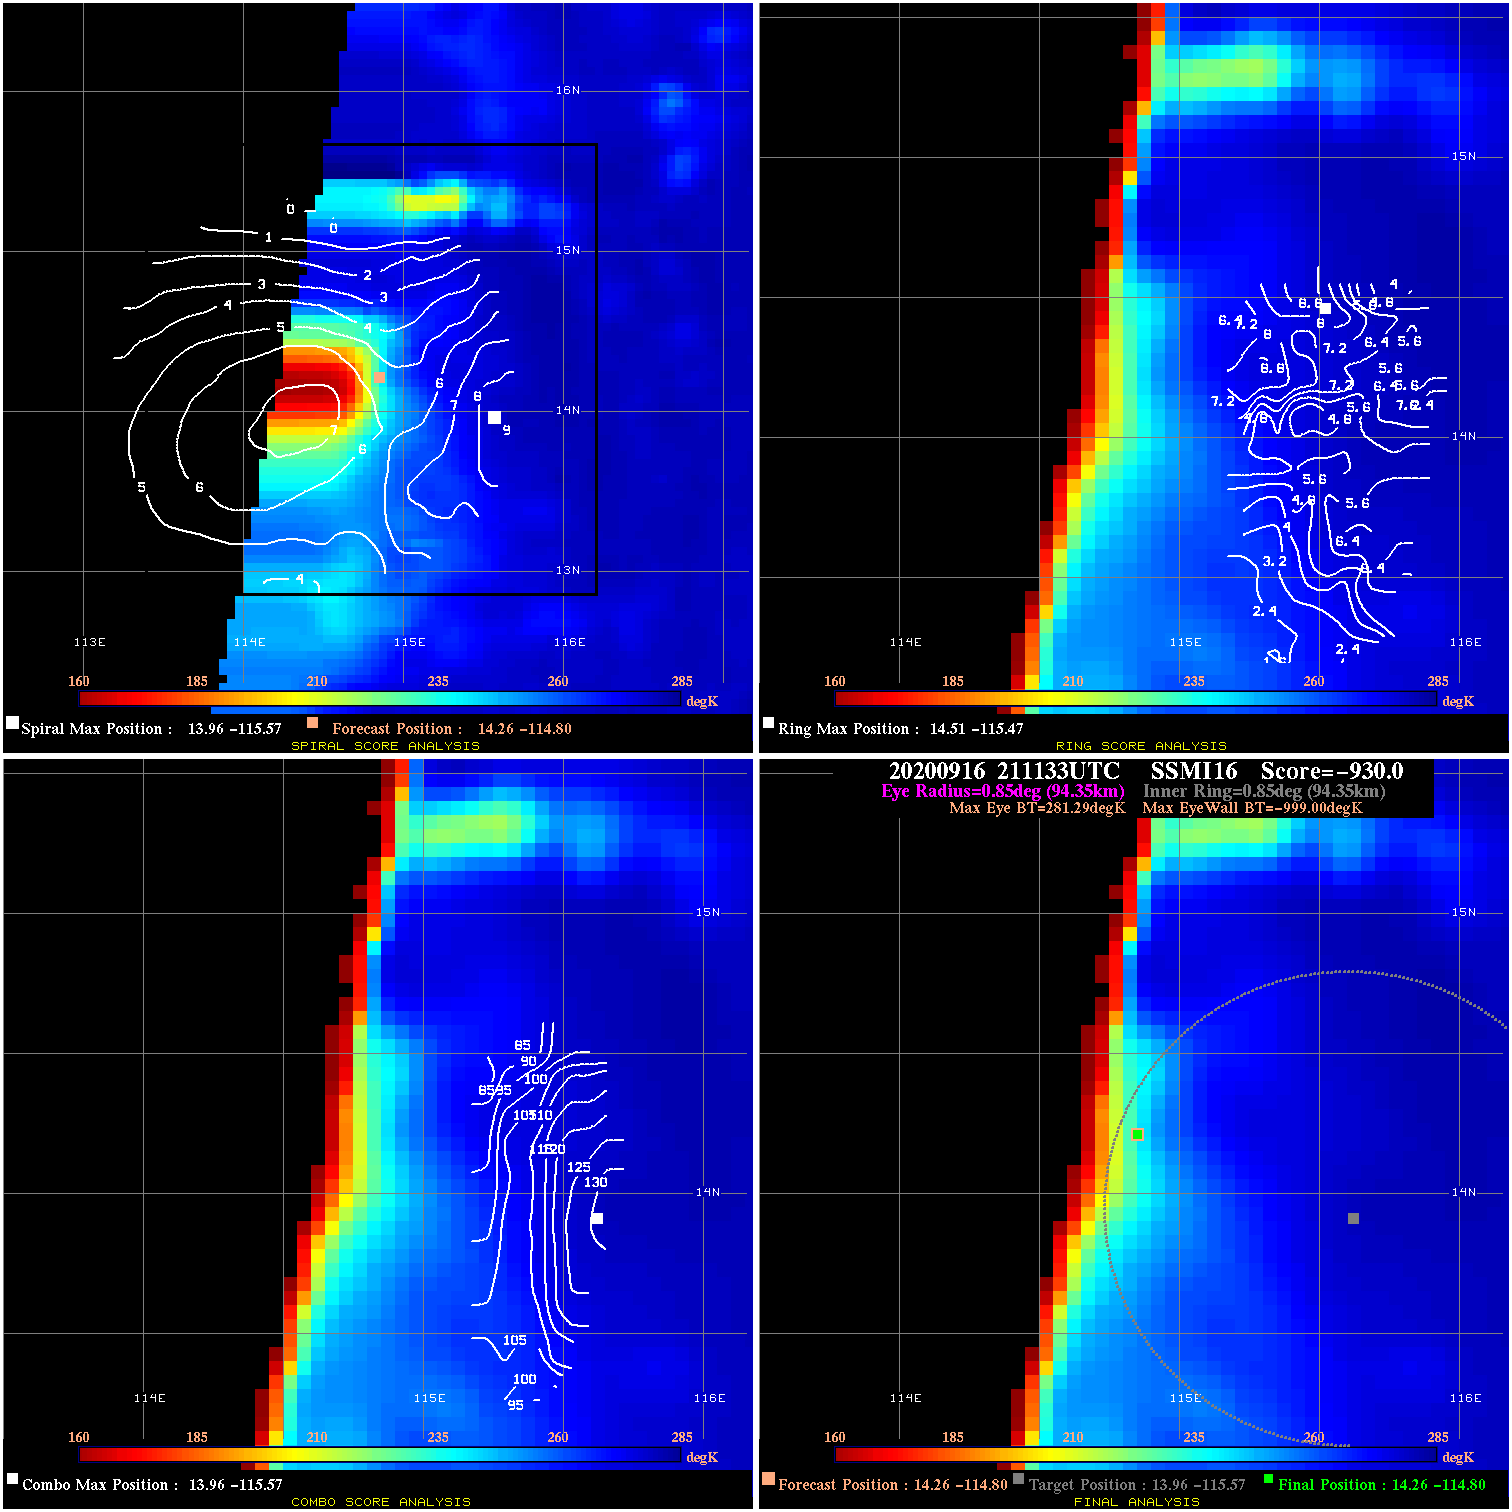
20200916 211133 -930.0 N/A N/A N/A 0.00 45.0 SSMI16 14.3 -114.8 14.3 -114.8 14.0 -115.6 Analysis Plot
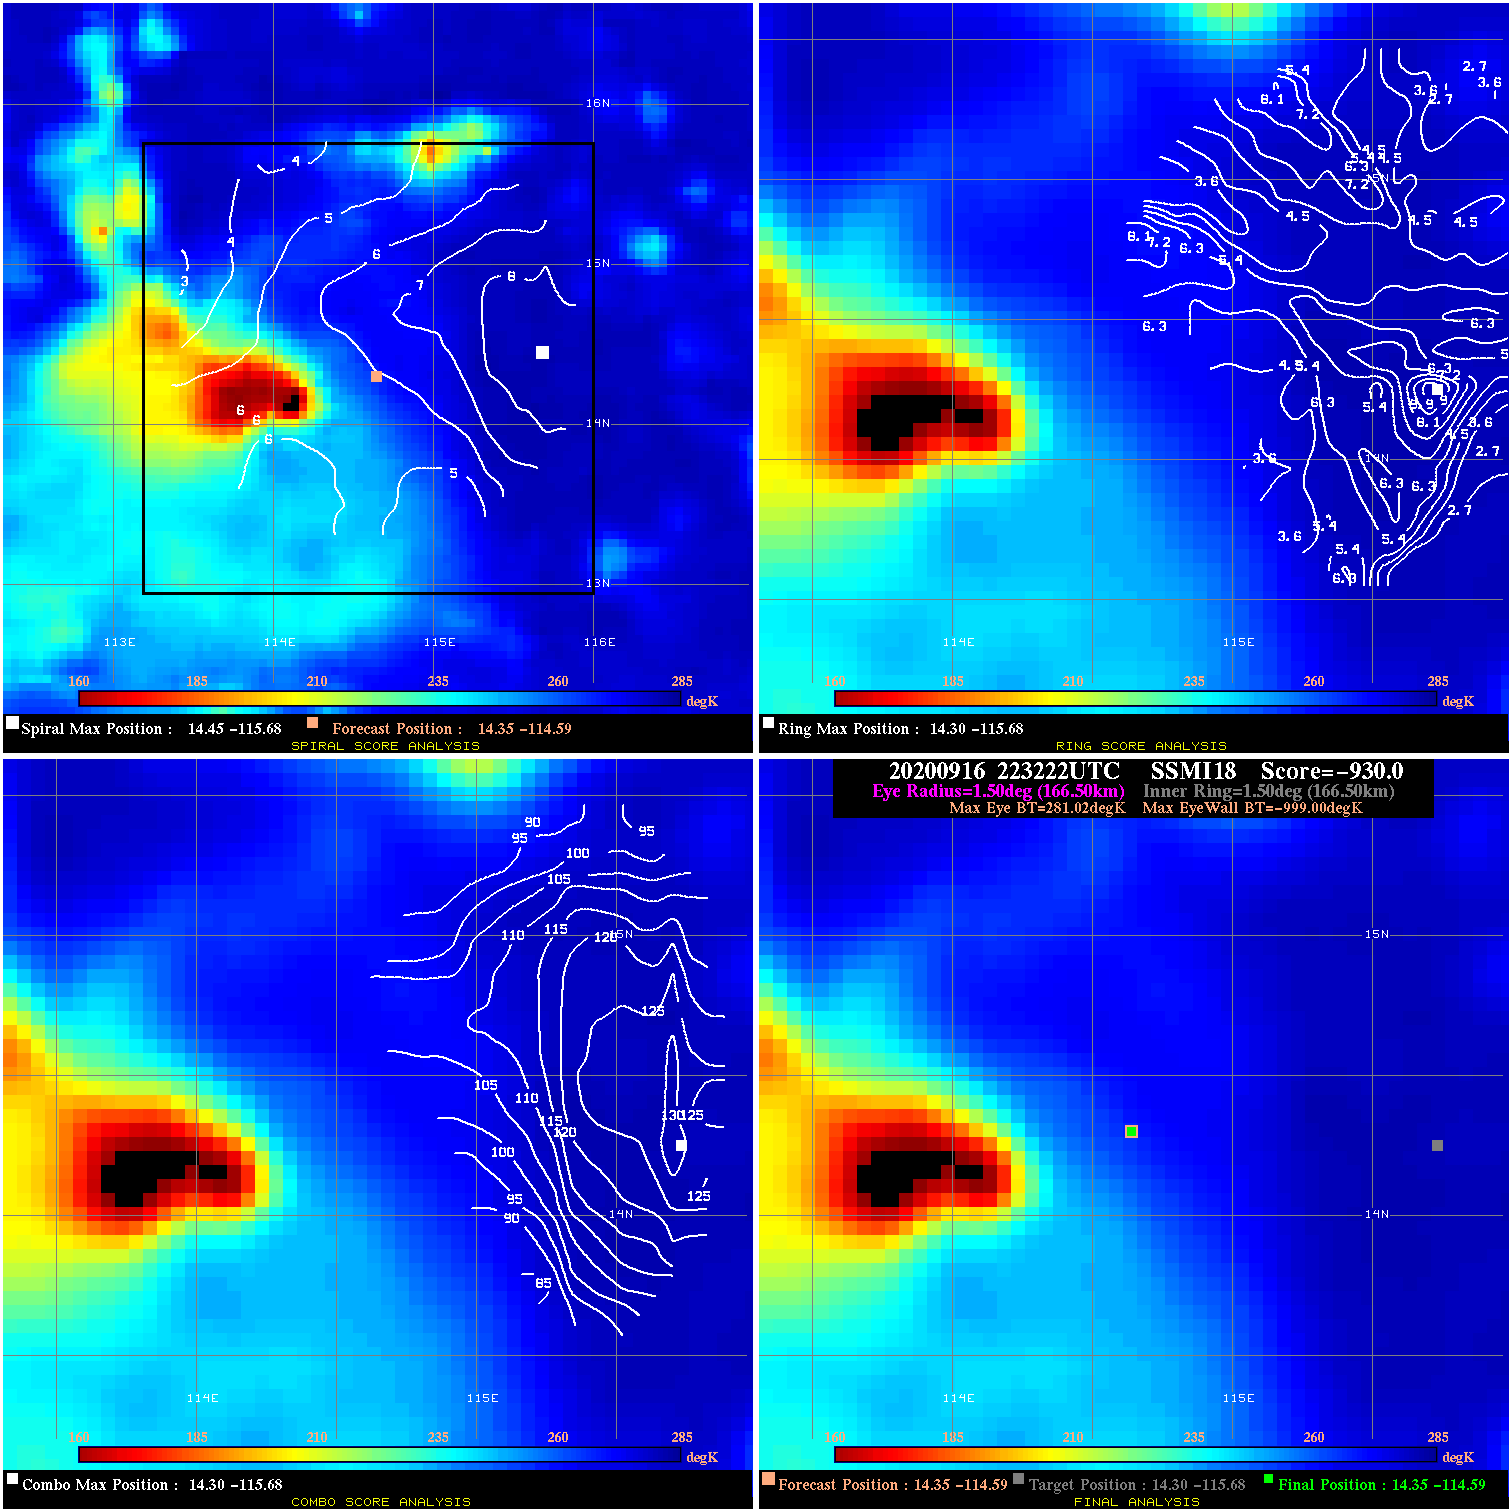
20200916 223222 -930.0 N/A N/A N/A 0.00 45.0 SSMI18 14.4 -114.6 14.4 -114.6 14.3 -115.7 Analysis Plot
20200917 085817 -1.5 N/A 12.3% 144.43 1.49 45.0 SSMI18 15.7 -112.6 15.7 -112.6 16.2 -112.1 Analysis Plot
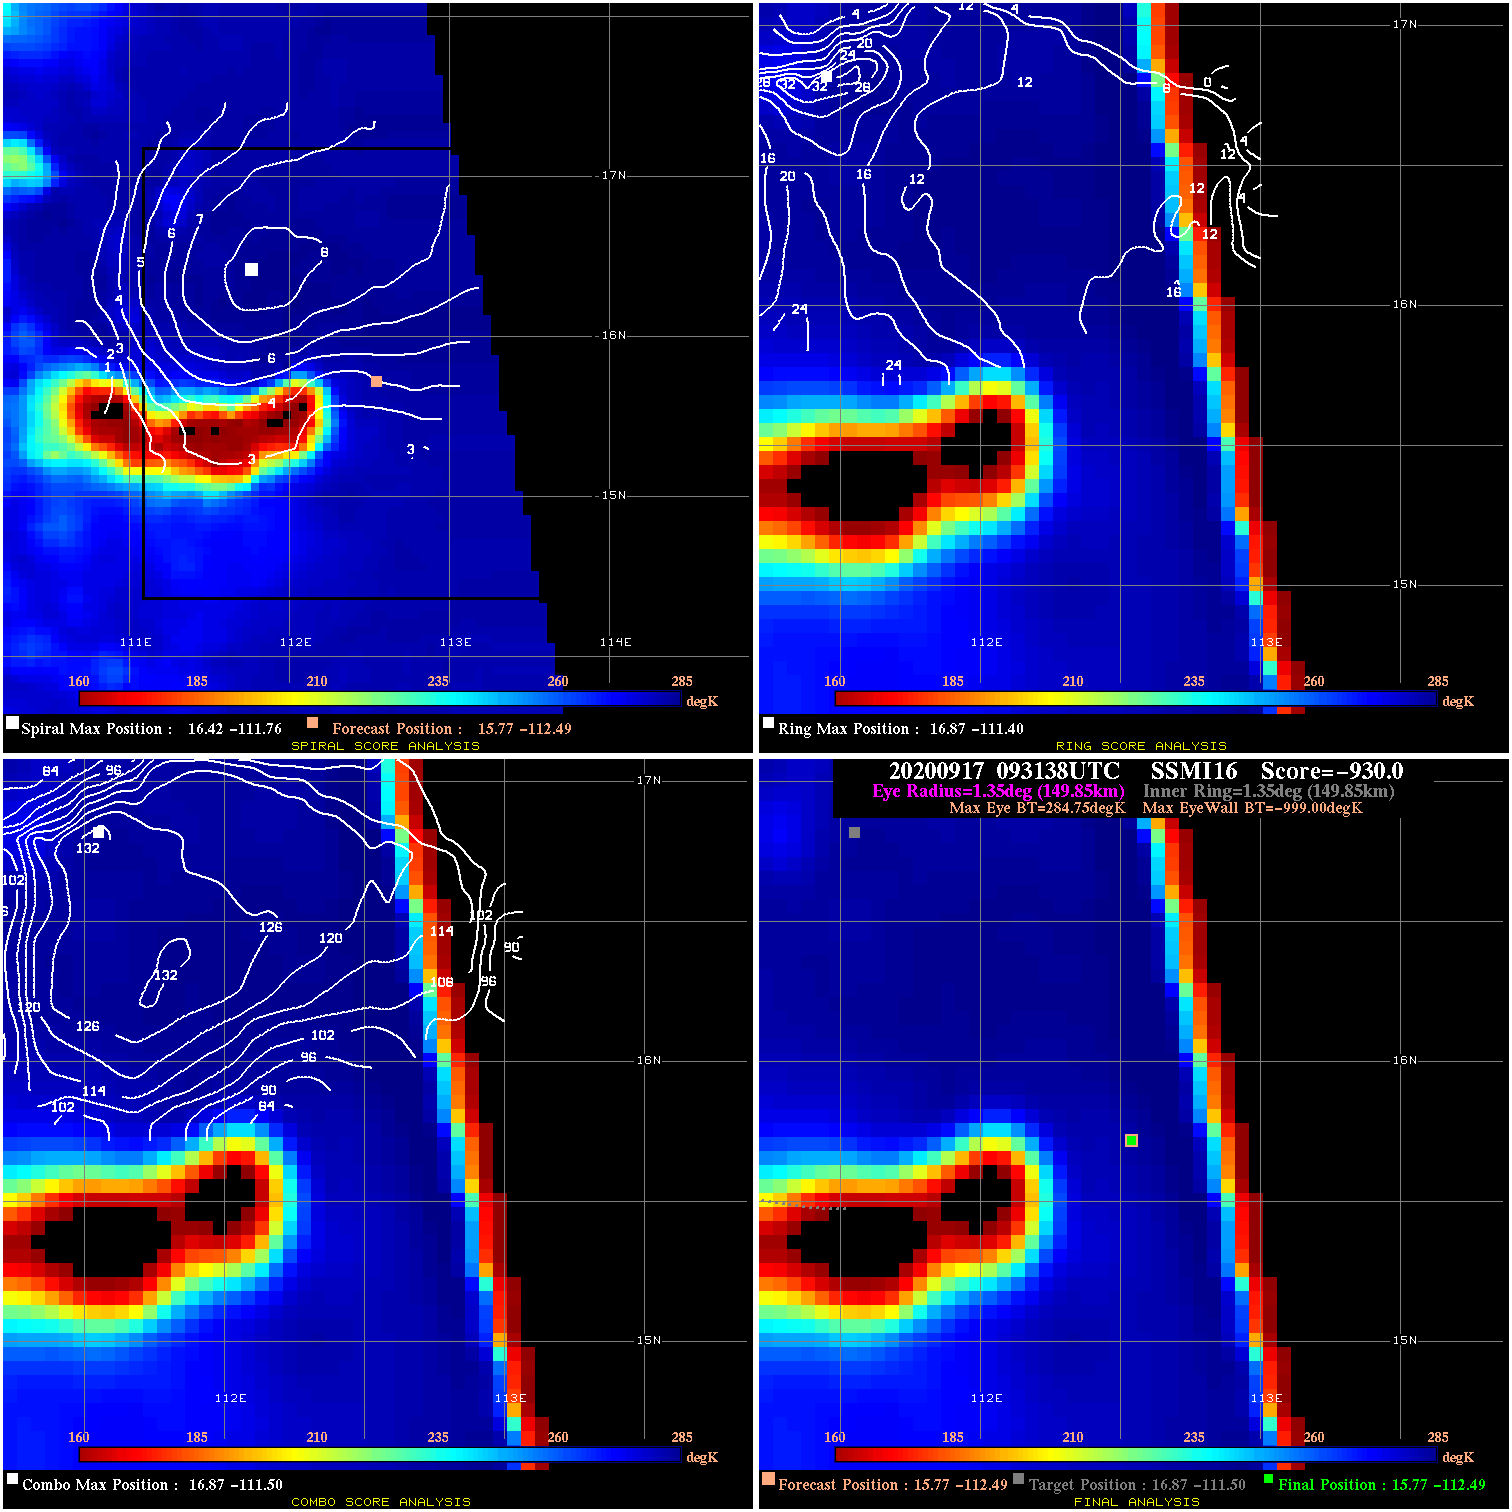
20200917 093138 -930.0 N/A N/A N/A 0.00 45.0 SSMI16 15.8 -112.5 15.8 -112.5 16.9 -111.5 Analysis Plot
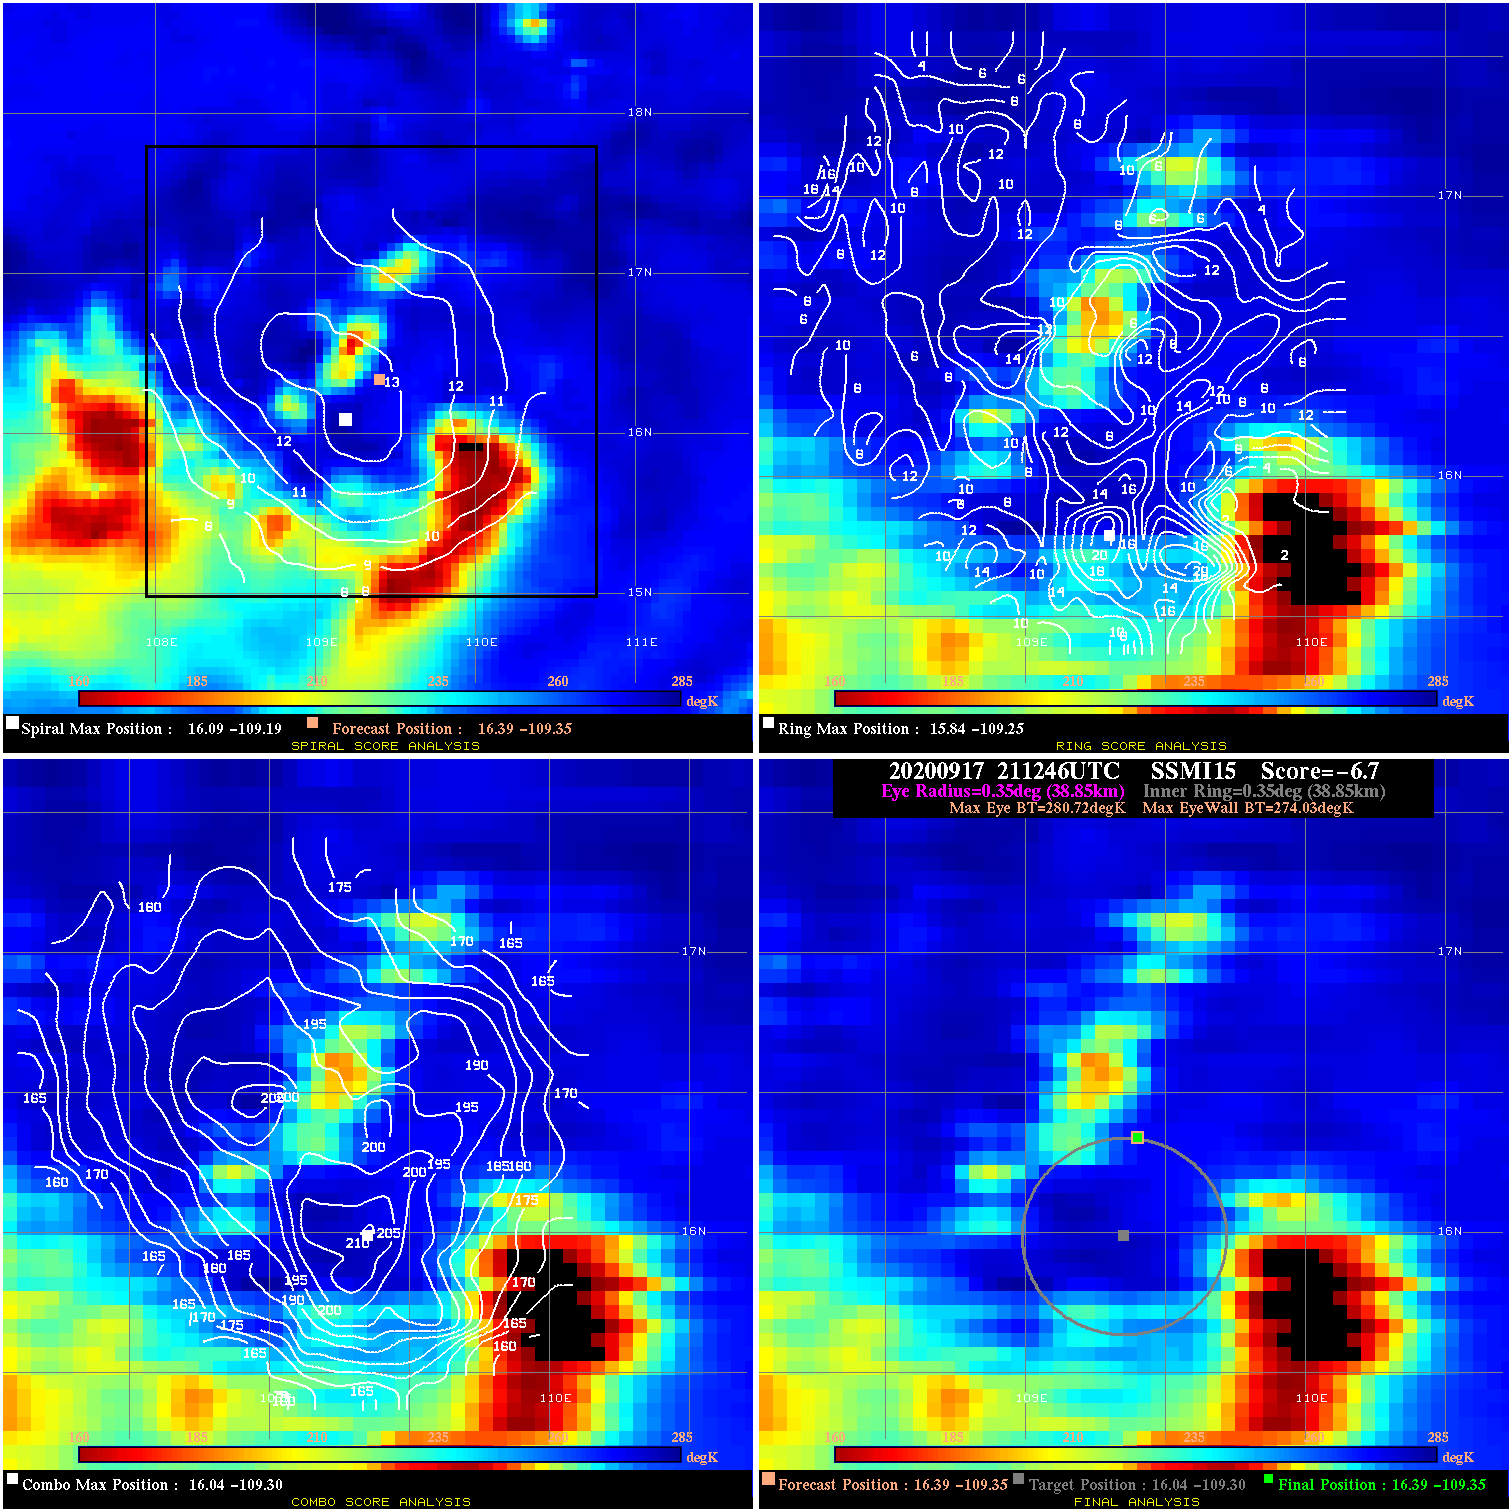
20200917 211246 -6.7 N/A 26.0% 77.77 6.69 50.0 SSMI15 16.4 -109.3 16.4 -109.3 16.0 -109.3 Analysis Plot
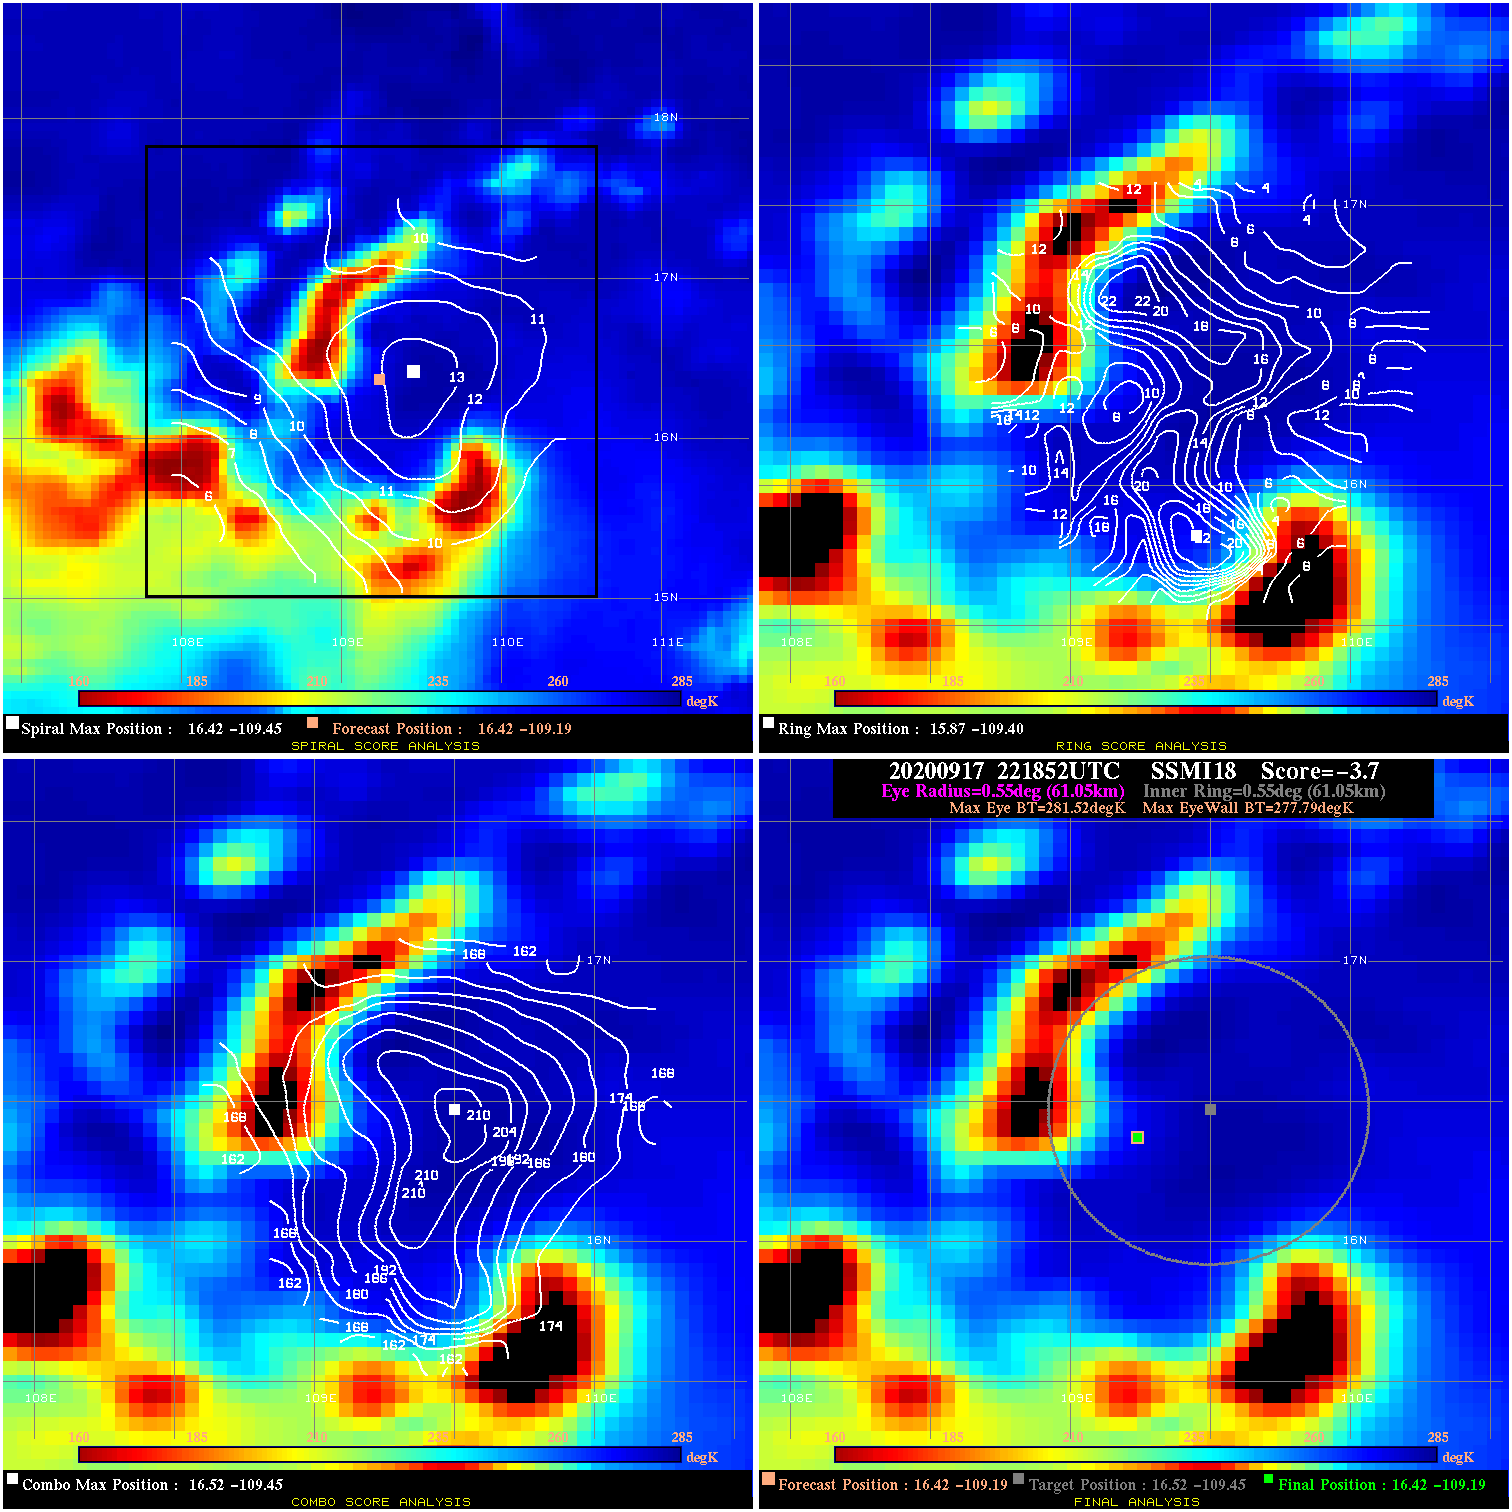
20200917 221852 -3.7 N/A 28.8% 122.21 3.73 50.0 SSMI18 16.4 -109.2 16.4 -109.2 16.5 -109.4 Analysis Plot
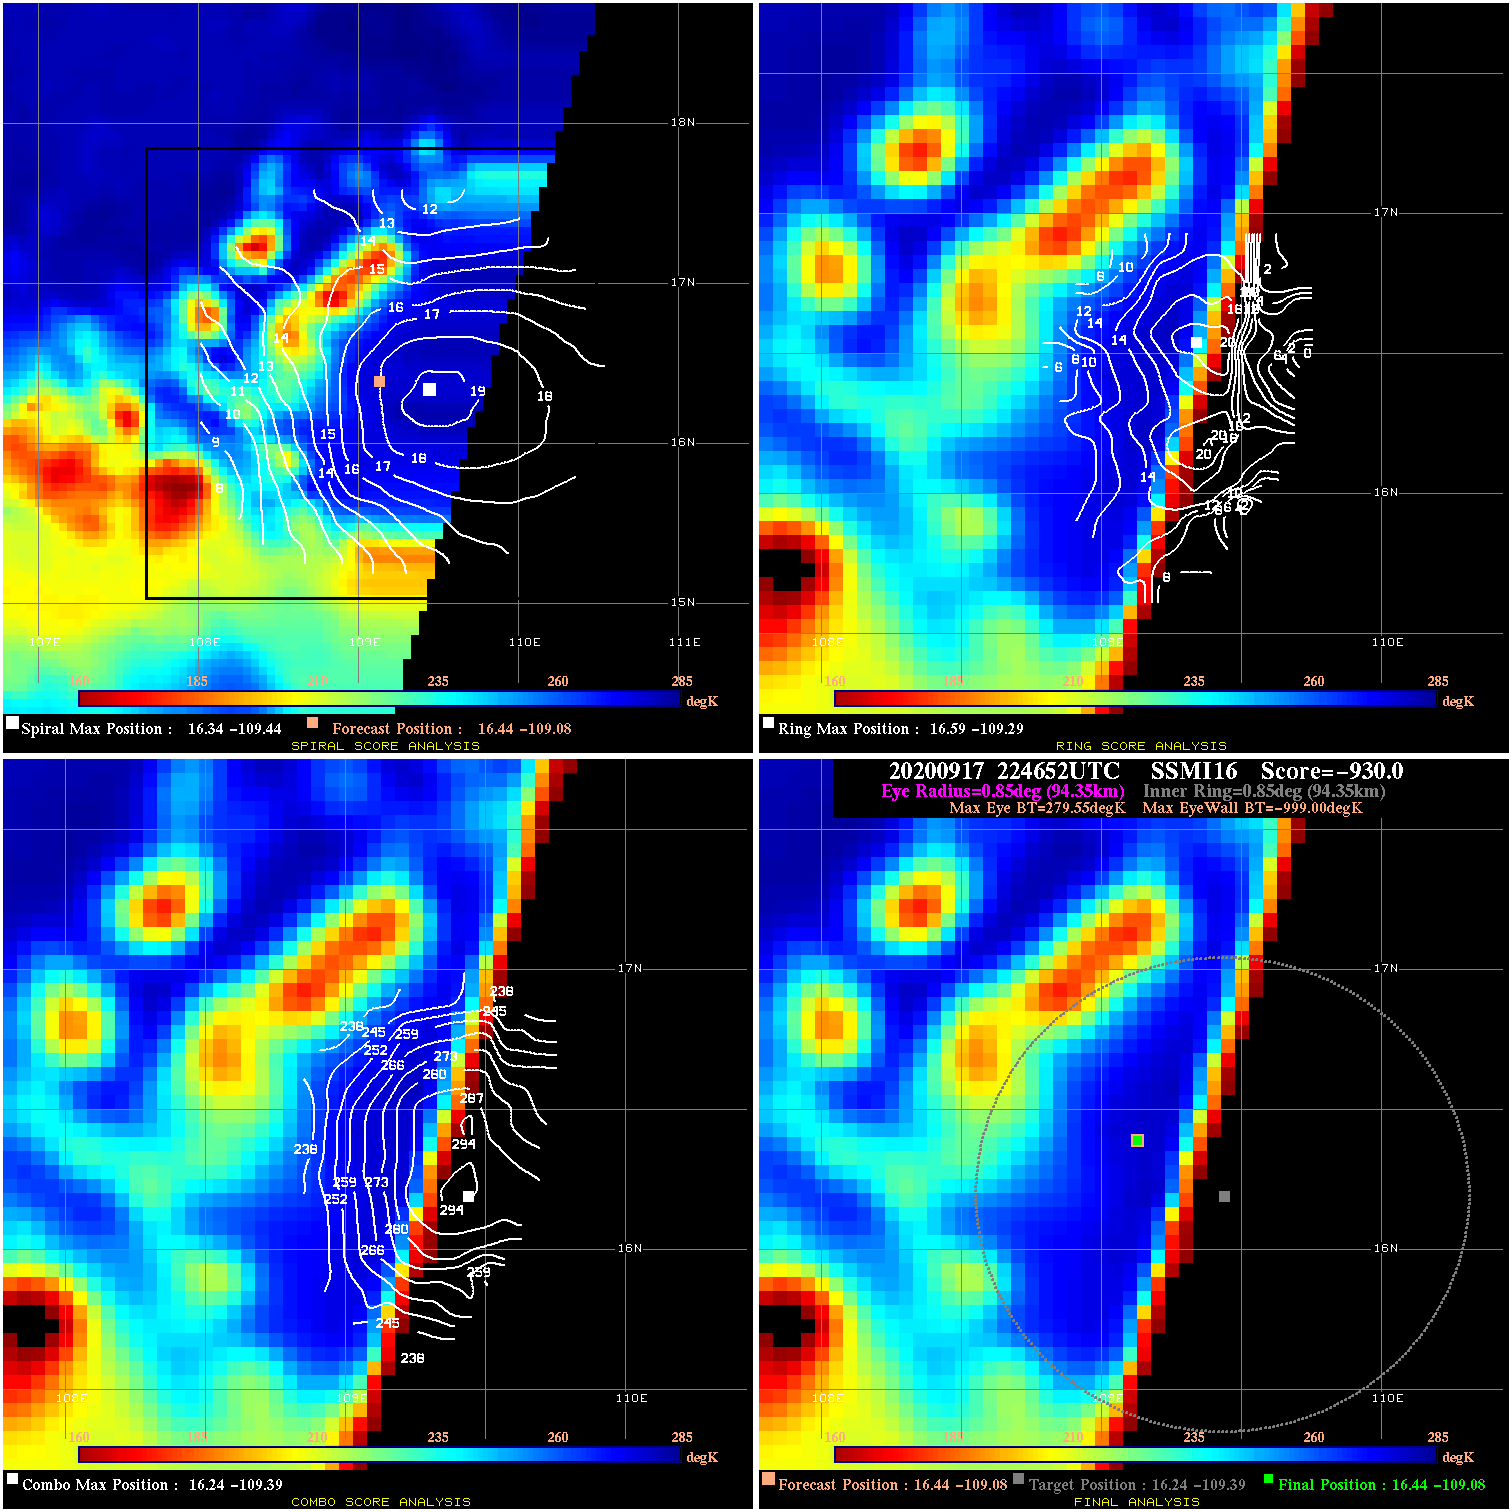
20200917 224652 -930.0 N/A N/A N/A 0.00 50.0 SSMI16 16.4 -109.1 16.4 -109.1 16.2 -109.4 Analysis Plot
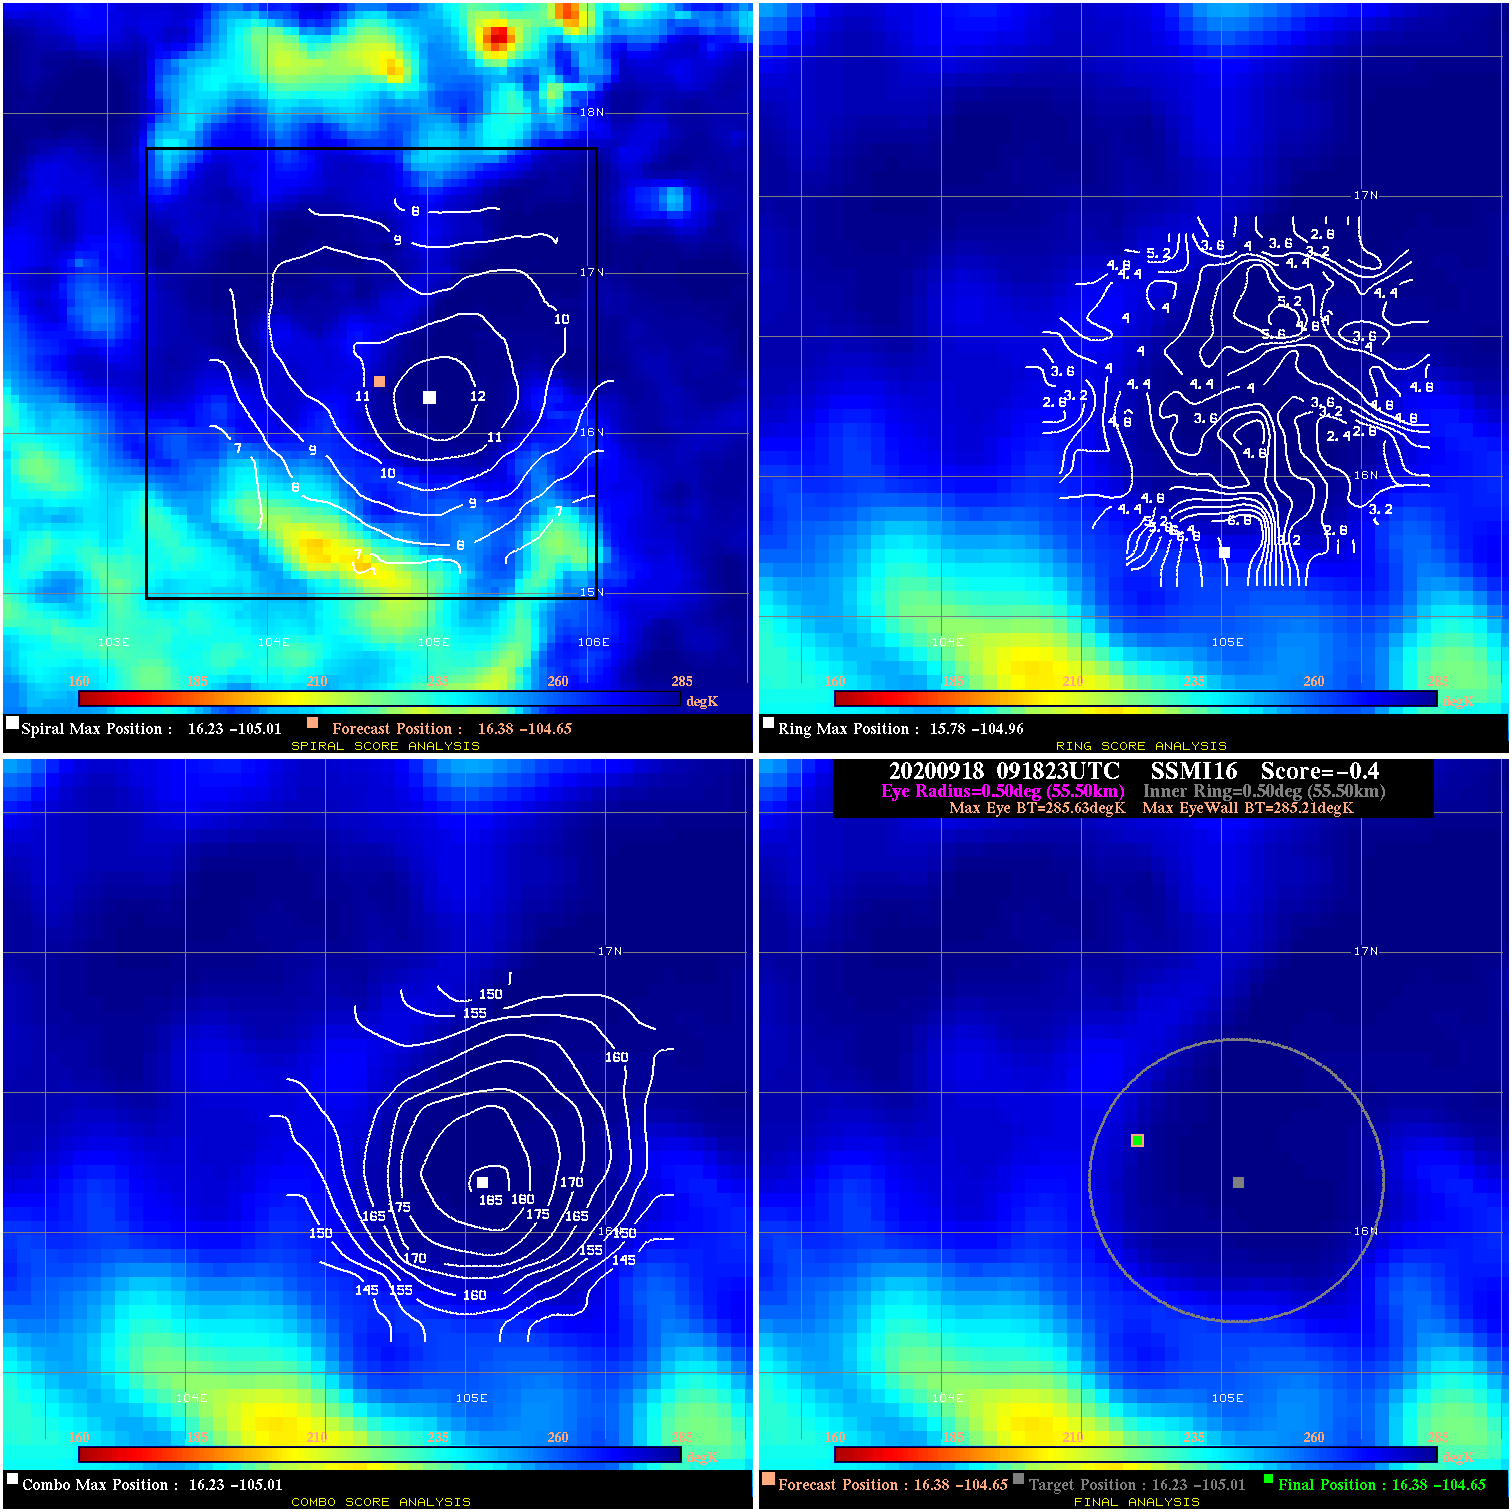
20200918 091823 -0.4 N/A N/A 111.10 .42 40.0 SSMI16 16.4 -104.7 16.4 -104.7 16.2 -105.0 Analysis Plot
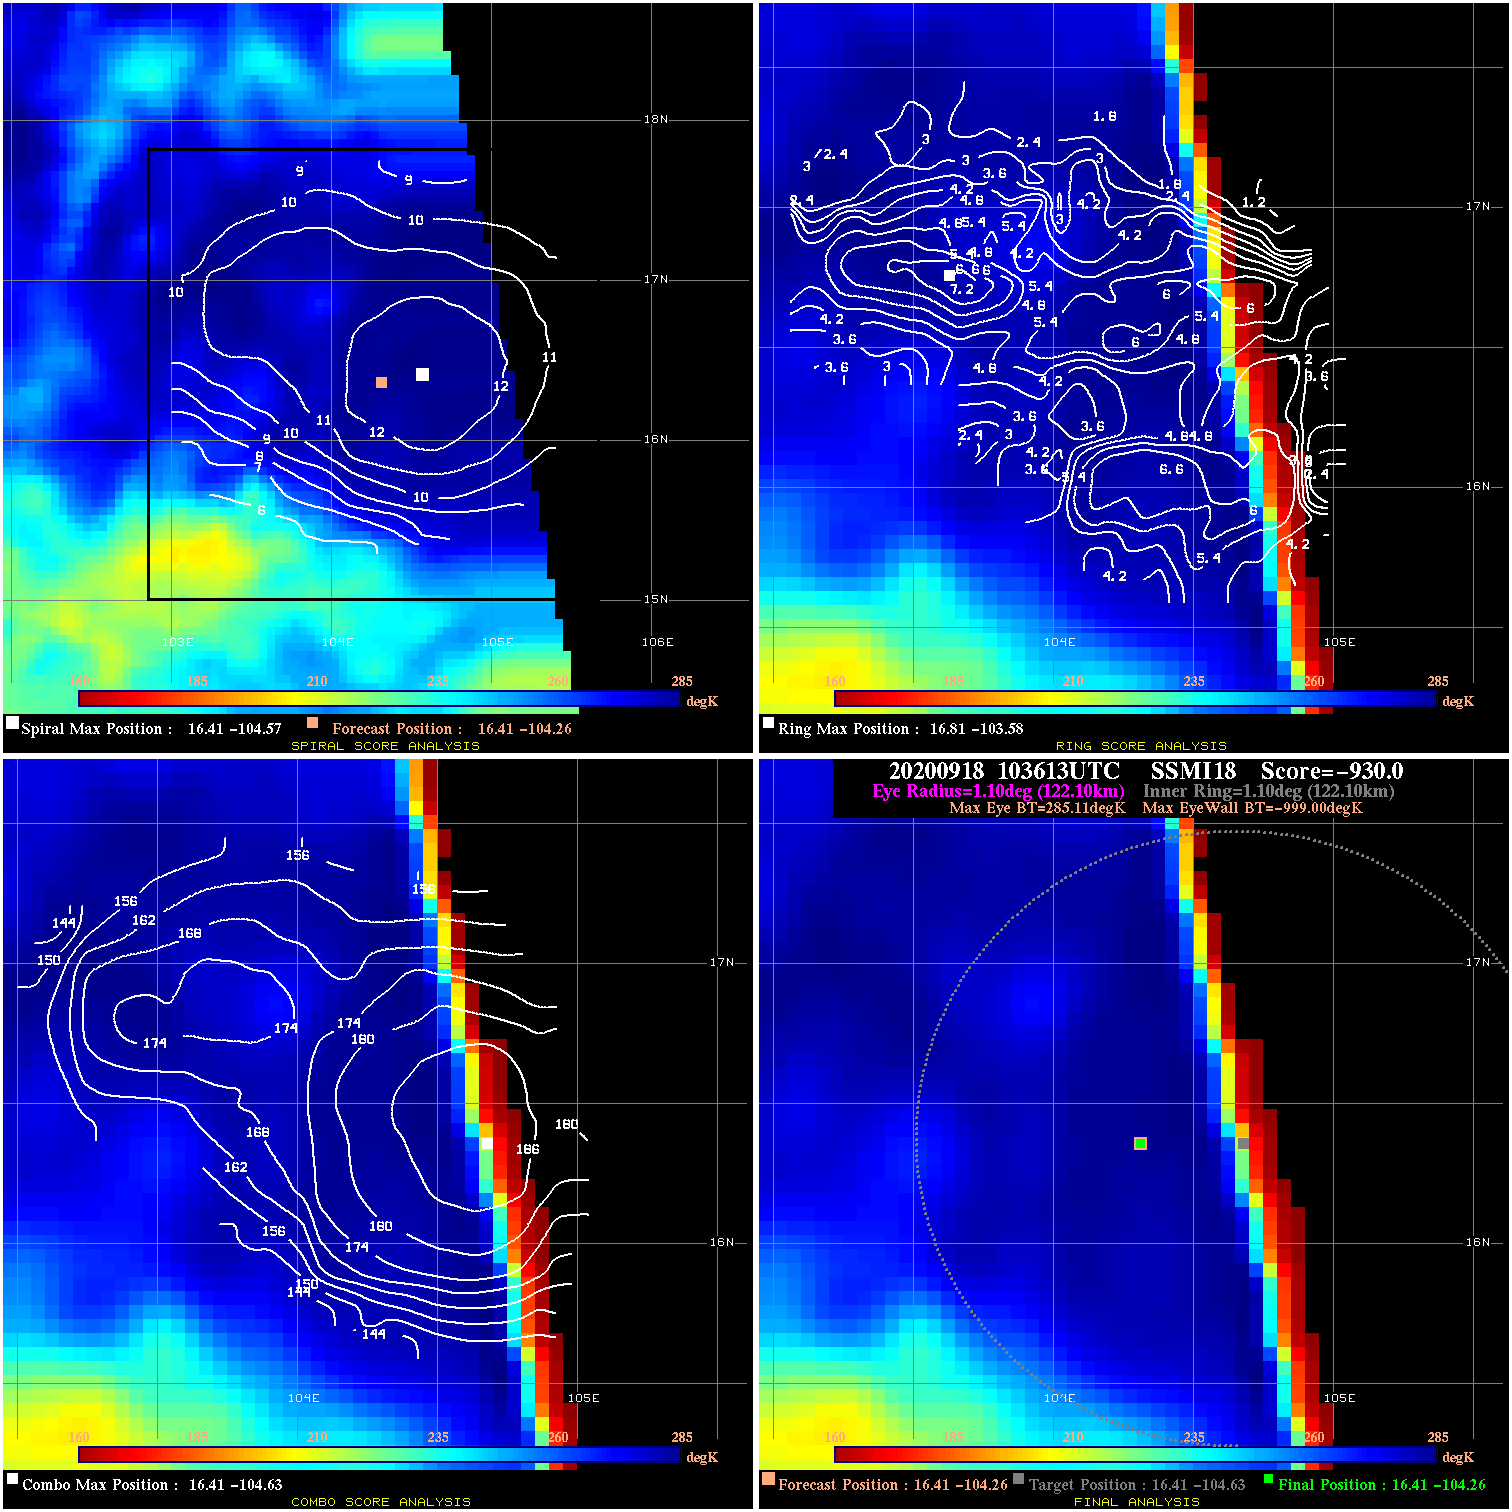
20200918 103613 -930.0 N/A N/A N/A 0.00 40.0 SSMI18 16.4 -104.3 16.4 -104.3 16.4 -104.6 Analysis Plot
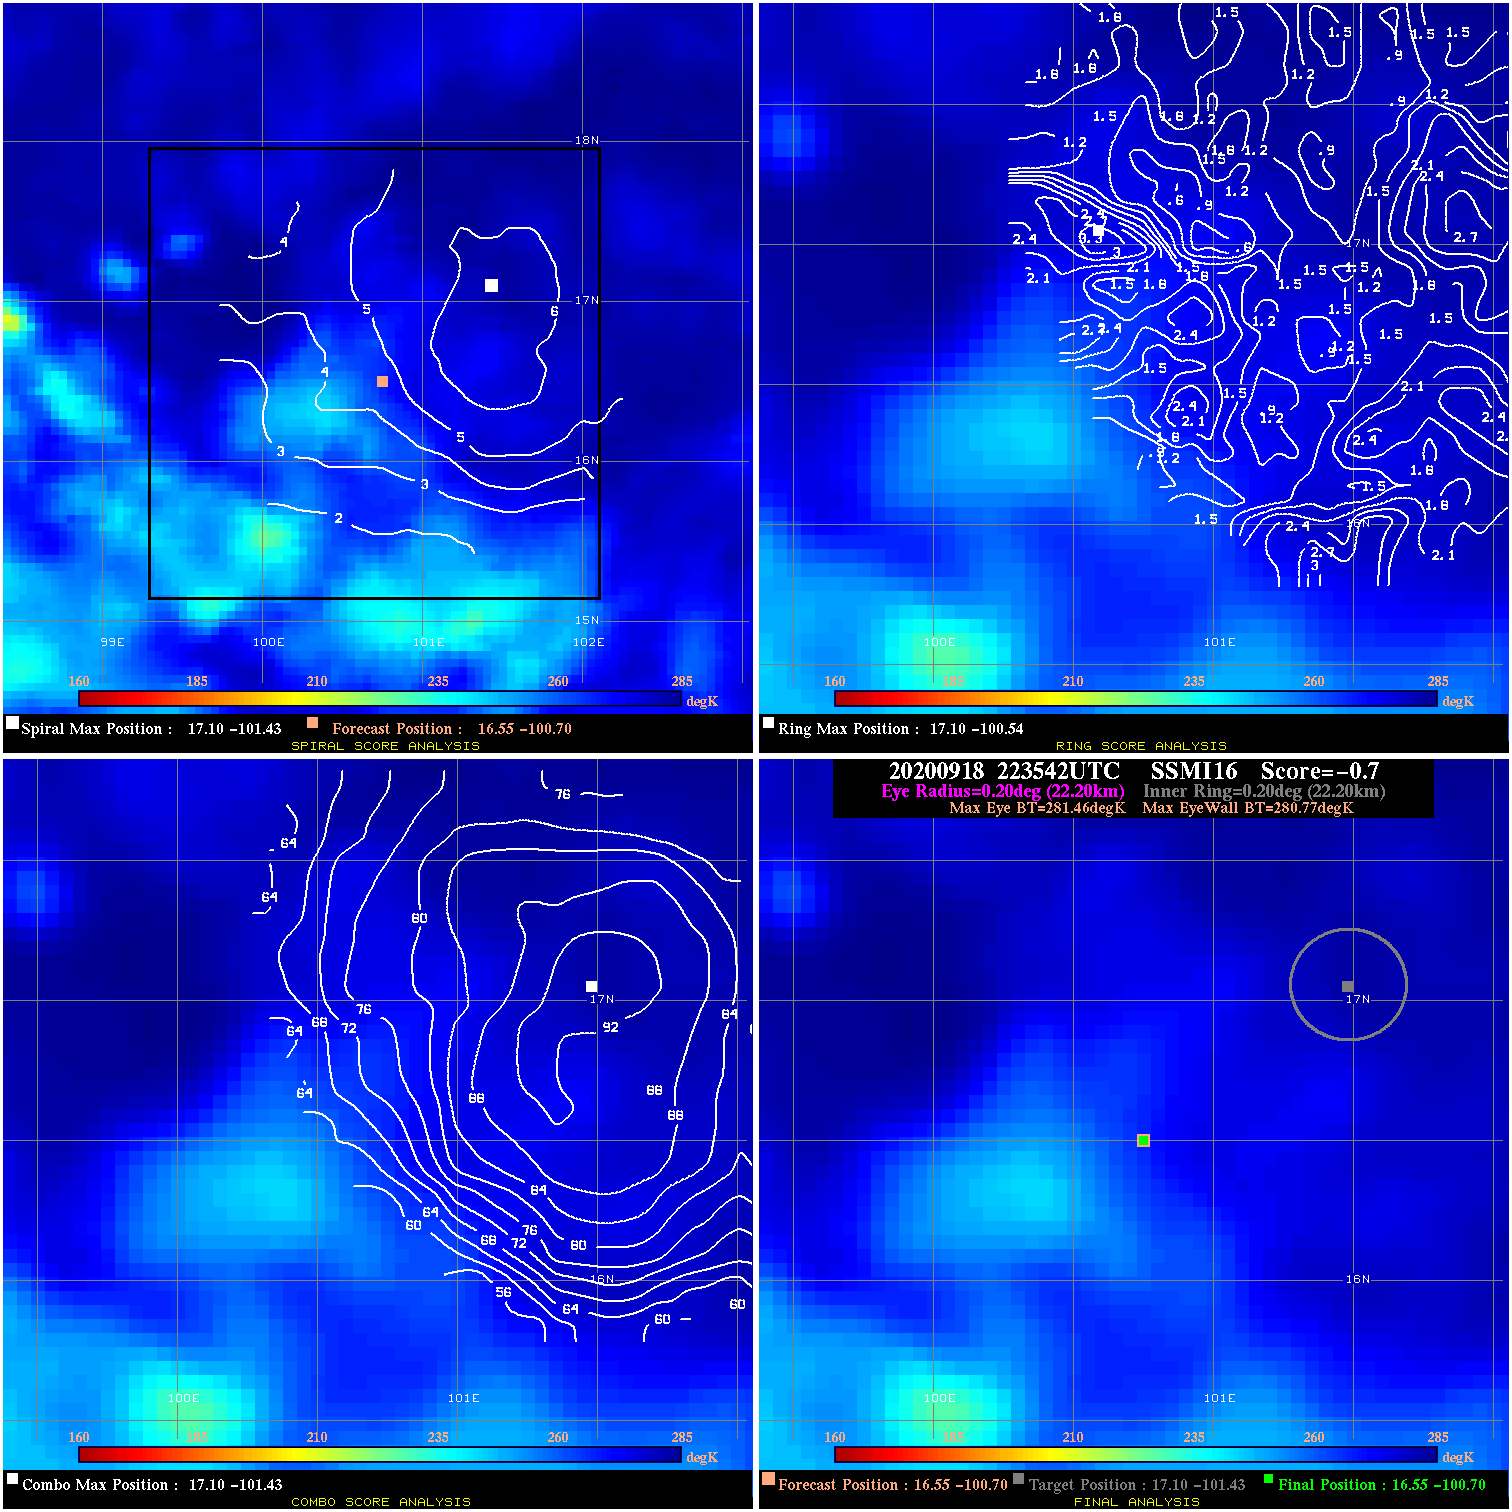
20200918 223542 -0.7 N/A N/A 44.44 .69 40.0 SSMI16 16.5 -100.7 16.5 -100.7 17.1 -101.4 Analysis Plot
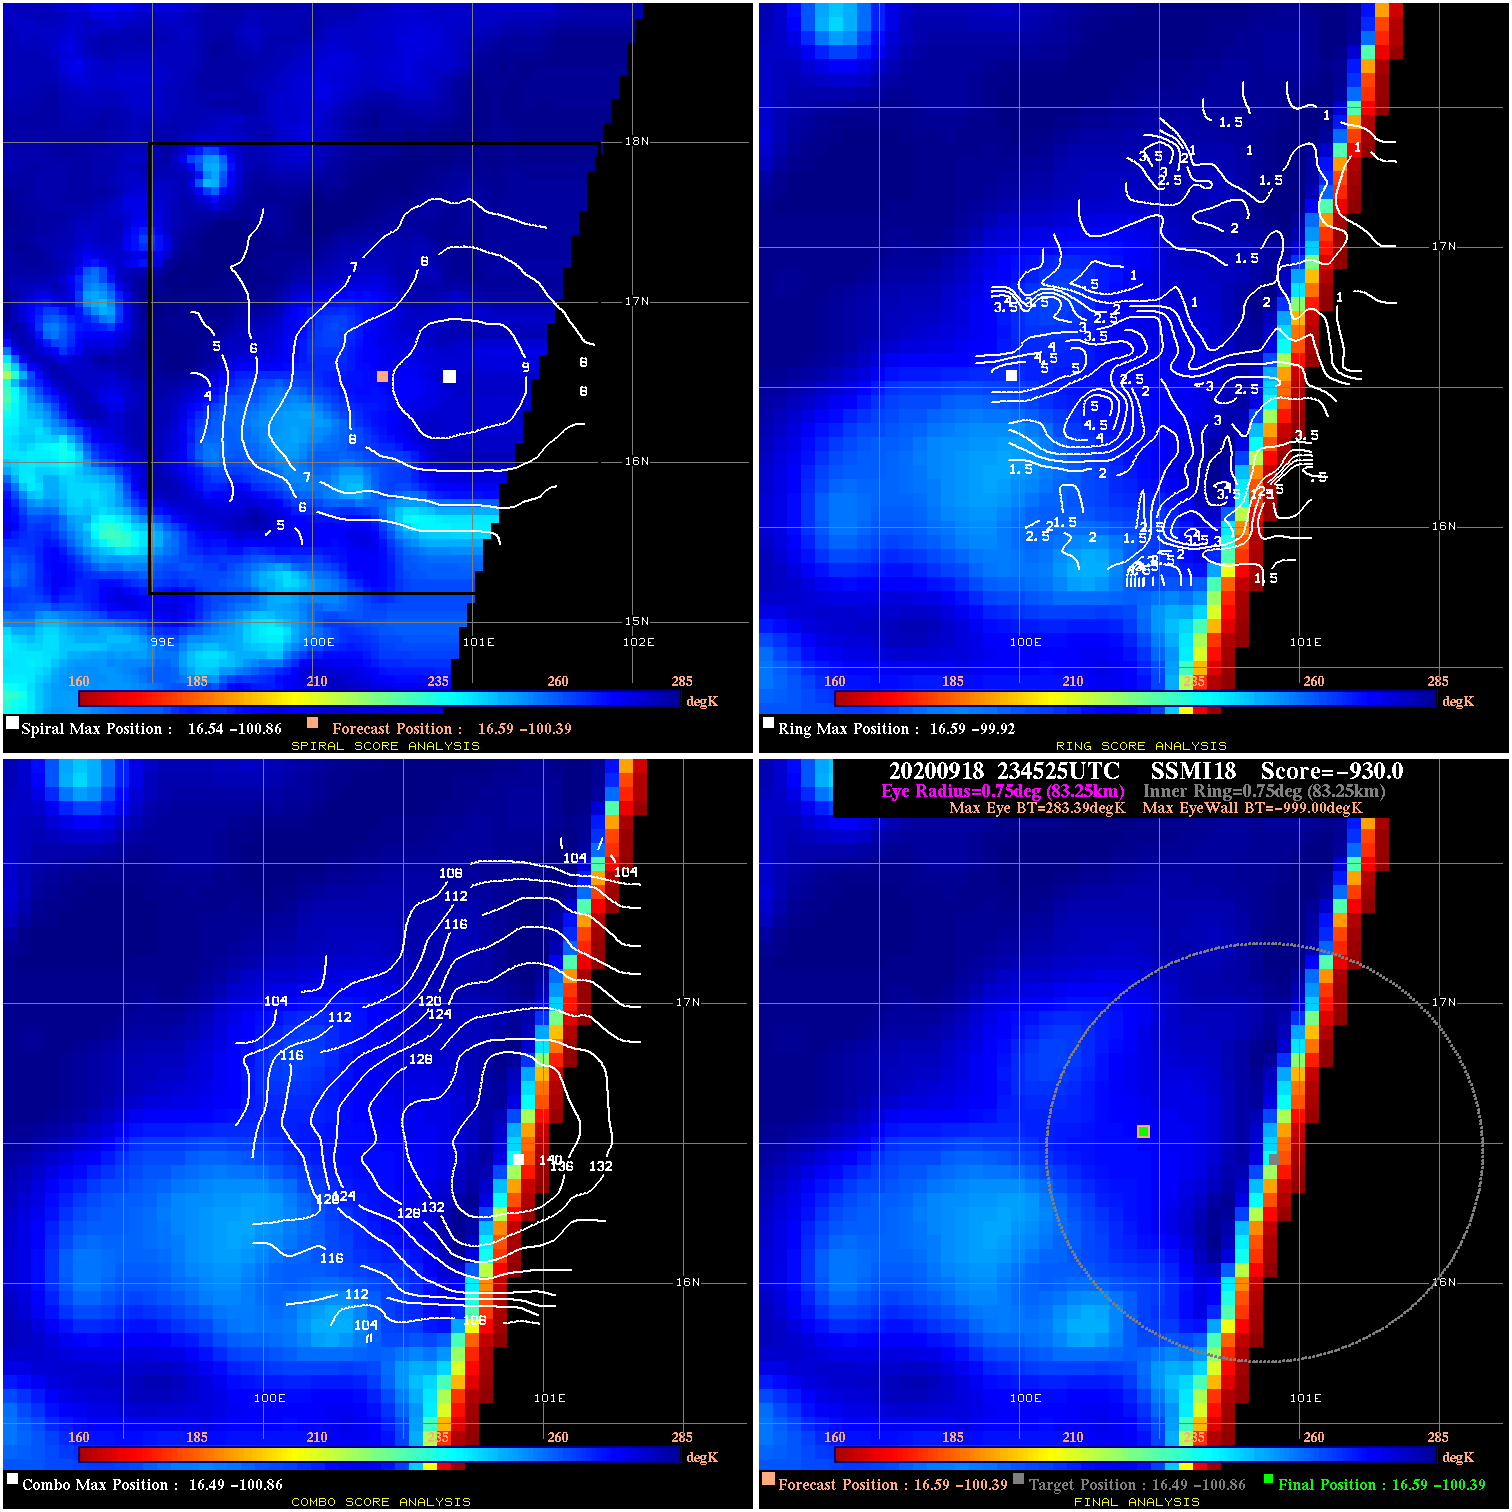
20200918 234525 -930.0 N/A N/A N/A 0.00 40.0 SSMI18 16.6 -100.4 16.6 -100.4 16.5 -100.9 Analysis Plot
|
|
Legend: - Date/Time are determined from PMW imagery at Forecast (initial guess) Lat/Lon position. - Positive/Negative Latitude = North/South Hemisphere; Longitude = Western/Eastern Hemisphere. - "Ring Diam" value indicates the estimated surface eyewall diameter in km (the MI eyewall edge diameter minus 10 km). - "Ring Pct" is the percentage of the "ring" (eyewall inner boundary) that is 1) colder than the "hot spot" (warmest eye pixel) in the eye by 20K, or 2) the percentage that is a) colder than 232K and b) colder than the "hot spot" by 10K, whichever is greater. - Values are red if Ring % <= 65, yellow/brown if Ring % <= 85 and green if Ring % > 85. - "Tb diff" is the difference between the "hot spot" (warmest eye pixel) and the warmest pixel on the eyewall. - Intensity score are listed as negative, and not used, when the JTWC or NHC estimated Vmax is <55 kts in order to rule out weak but highly symmetric TCs. - Error messages in intensity scores: -920 is used when the hottest pixel in the eye is <200K, to prevent false positives; -930 means <85% of eyewall has observations/data. |