Tropical Depression 05S
|
Passive Microwave (PMW) Intensity Information Advanced Dvorak Technique Version 9.1 |
Overpass Inten Ring Ring Wind Forecast Final
Date Time Score Meaning Pct Diam BTdiff Est Sat Lat Lon Lat Lon
20221228 141844 N/A N/A N/A N/A N/A 55.0 SSMISF17 -21.8 75.0 -22.0 75.8 Analysis Plot
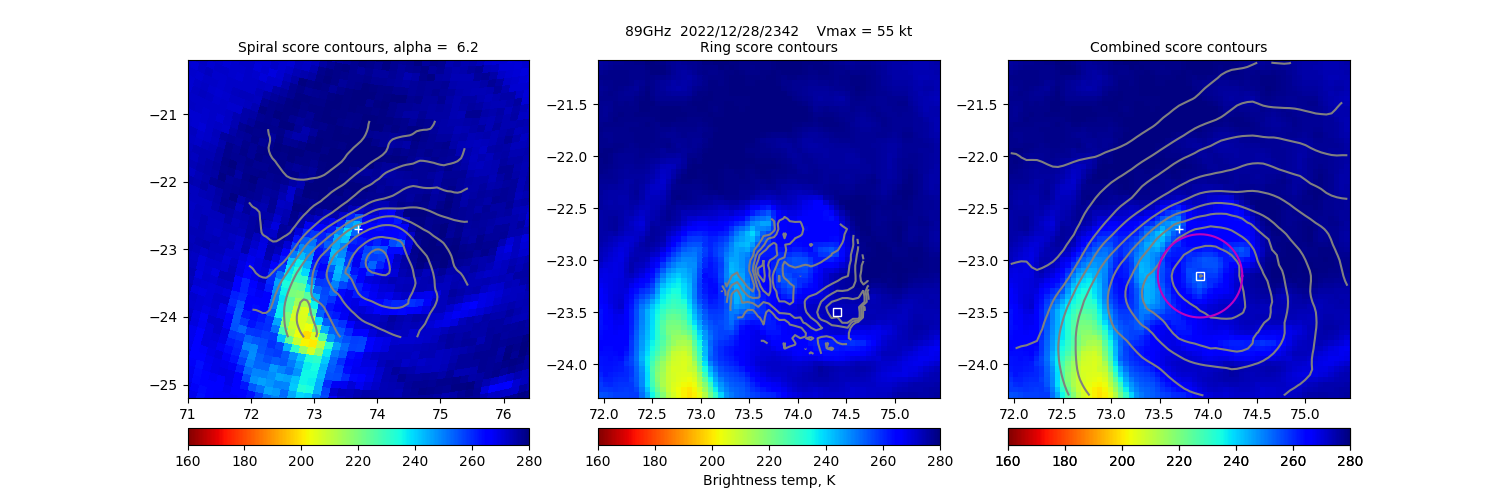
20221228 234251 N/A N/A N/A N/A N/A 55.0 SSMISF18 -22.7 73.7 -23.1 73.9 Analysis Plot
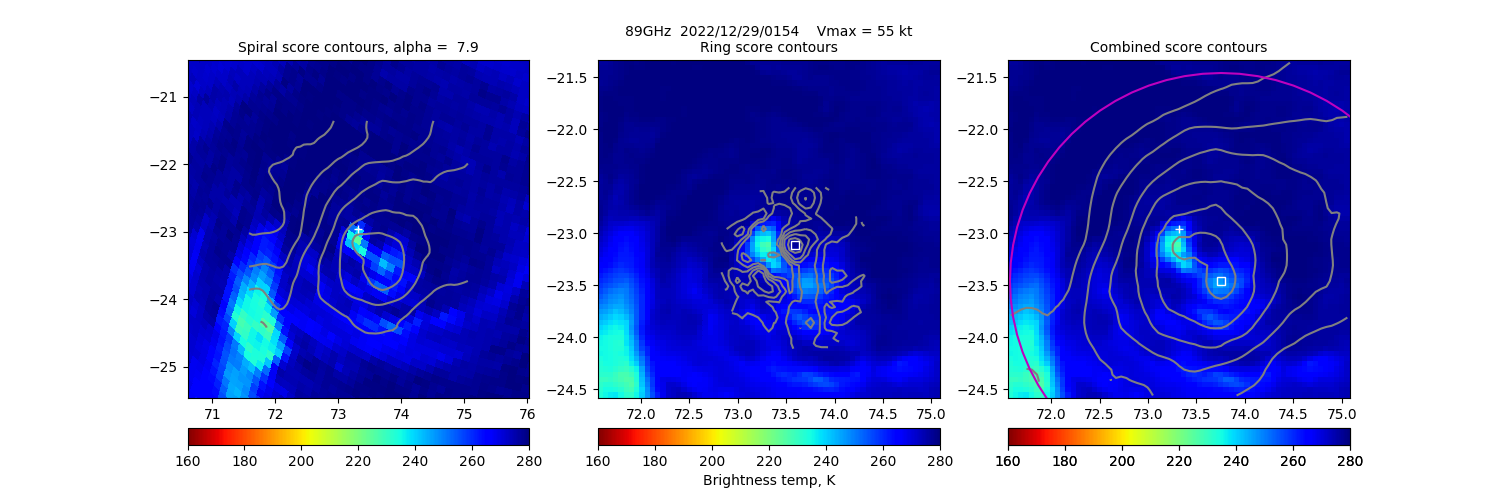
20221229 015407 N/A N/A N/A N/A N/A 55.0 SSMISF17 -23.0 73.3 -23.5 73.8 Analysis Plot
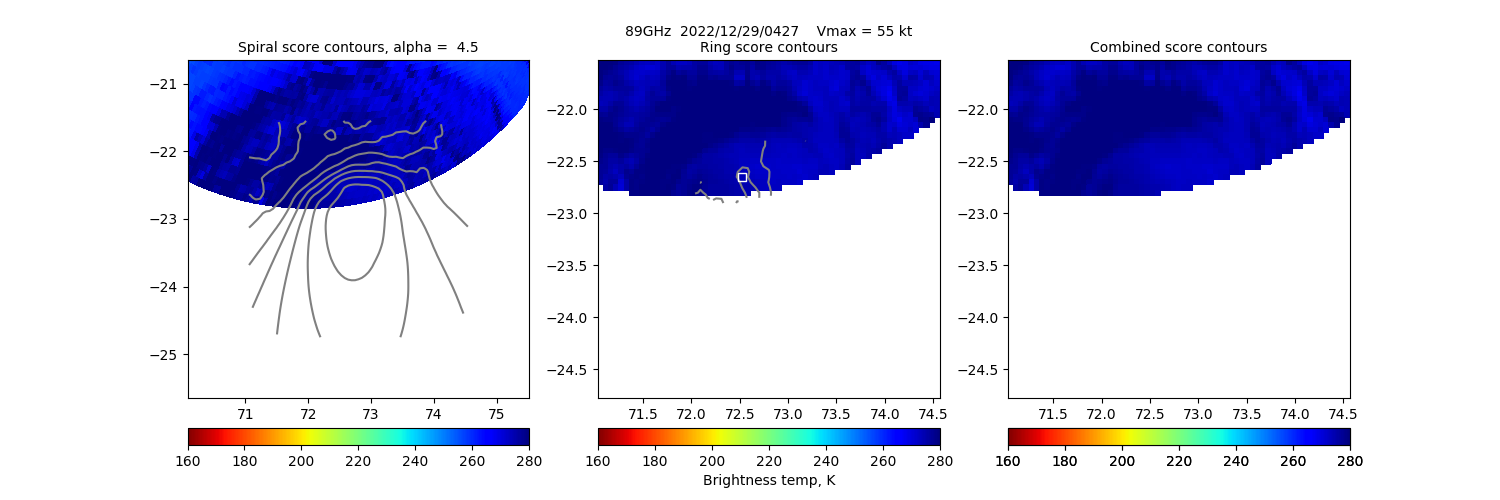
20221229 042723 N/A N/A N/A N/A N/A 55.0 GMI -23.1 72.8 -23.1 72.8 Analysis Plot
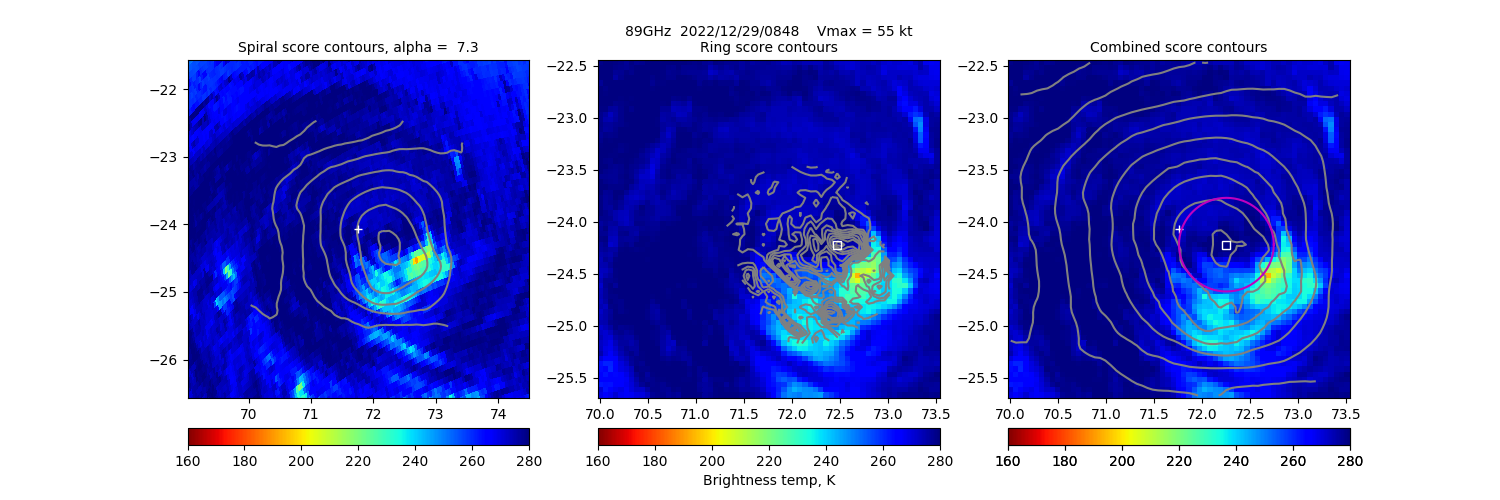
20221229 084834 3.48 N/A 0.14% 90.06 3.48 55.0 AMSR2 -24.1 71.8 -24.2 72.3 Analysis Plot
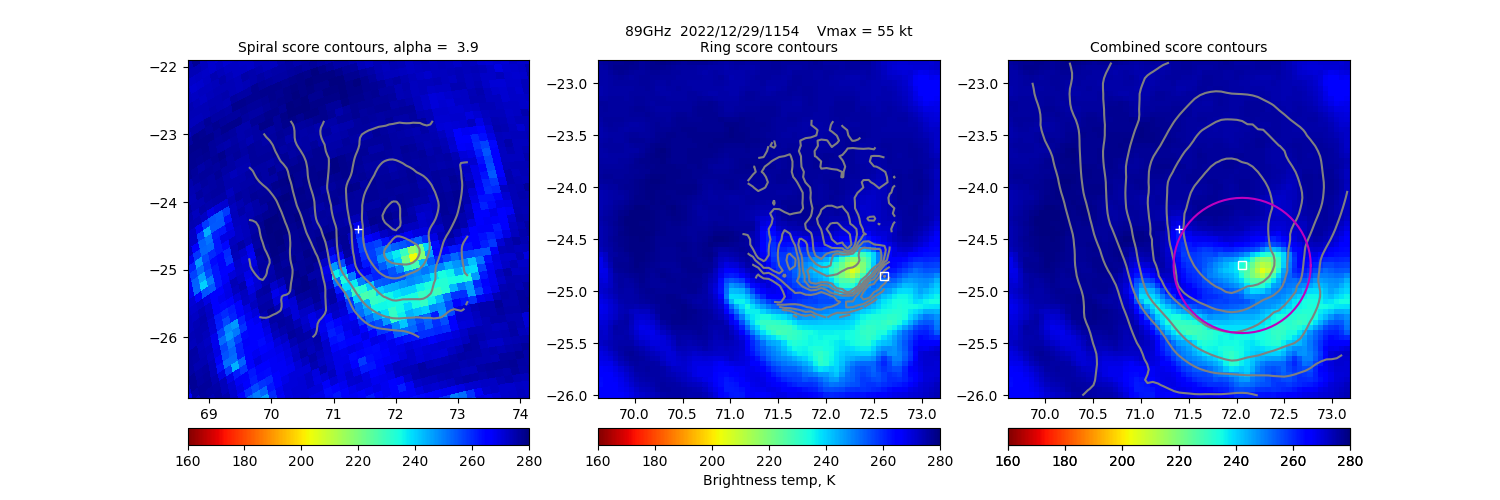
20221229 115419 0.72 N/A 0.10% 134.53 0.72 55.0 SSMISF18 -24.4 71.4 -24.8 72.1 Analysis Plot
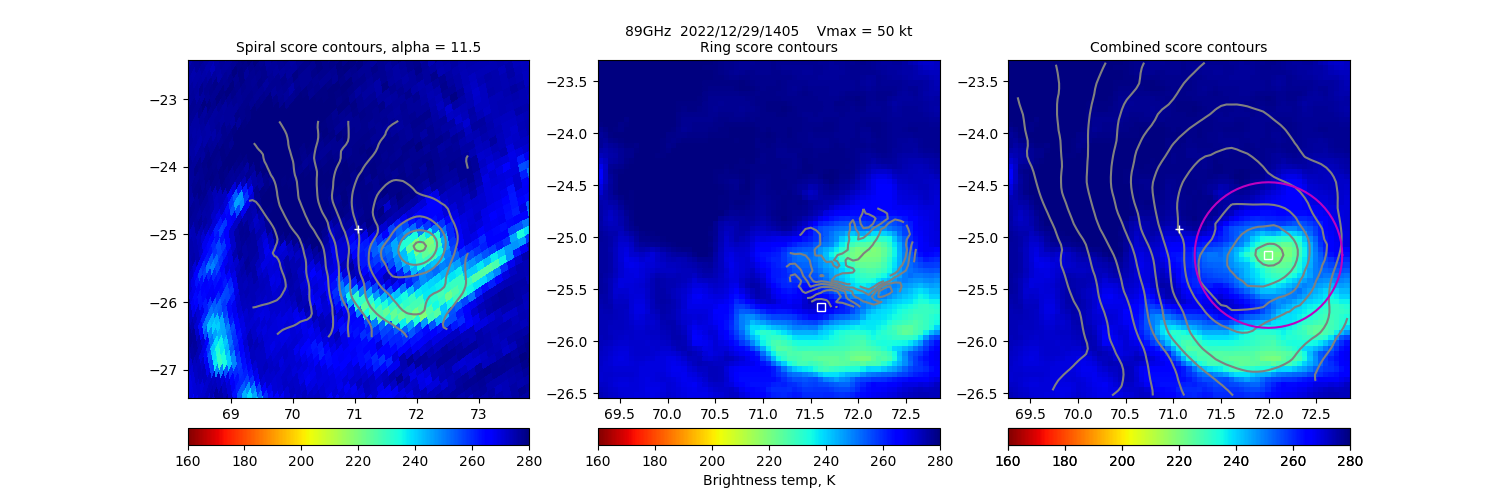
20221229 140515 N/A N/A N/A N/A N/A 50.0 SSMISF17 -24.9 71.1 -25.2 72.0 Analysis Plot
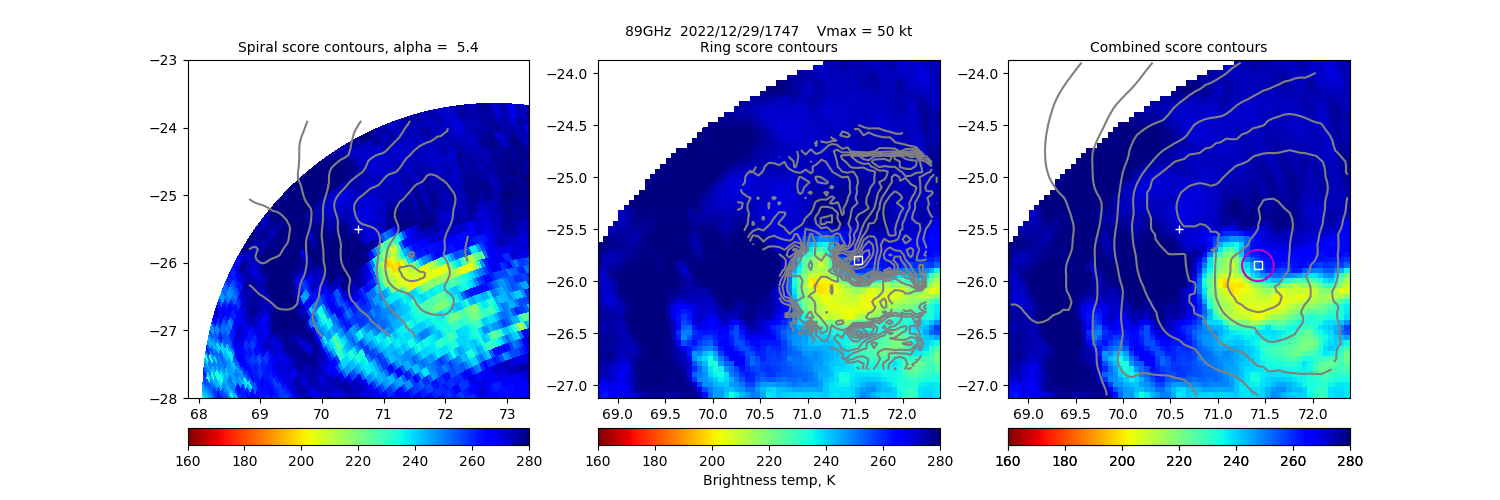
20221229 174742 N/A N/A N/A N/A N/A 50.0 GMI -25.5 70.6 -25.9 71.4 Analysis Plot
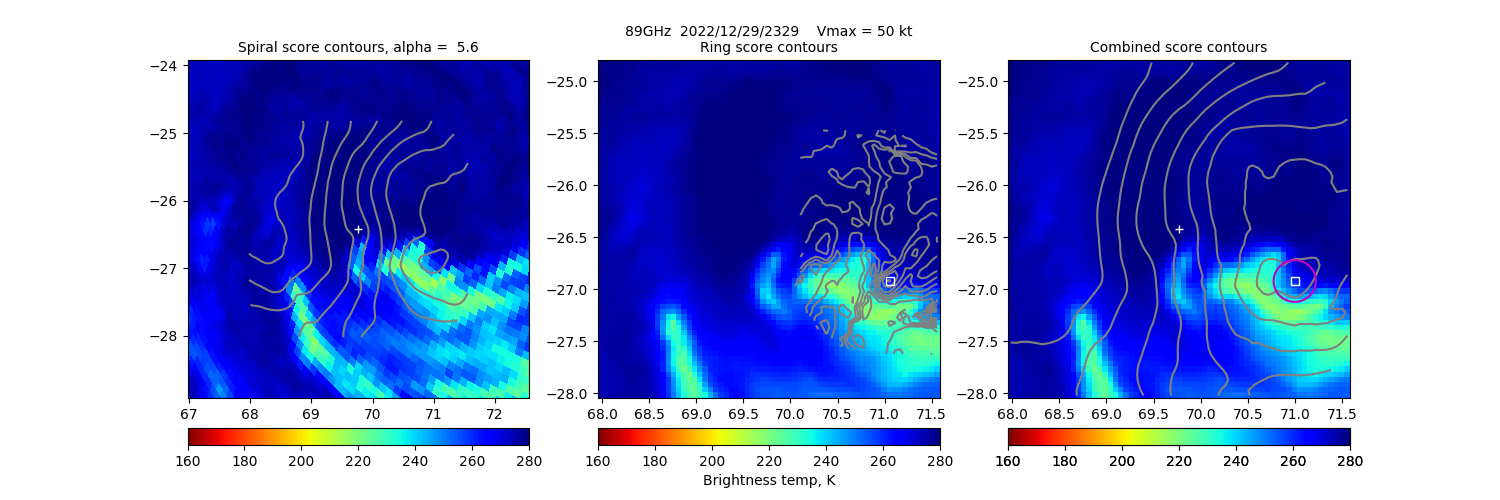
20221229 232954 N/A N/A N/A N/A N/A 50.0 SSMISF18 -26.4 69.8 -26.9 71.0 Analysis Plot
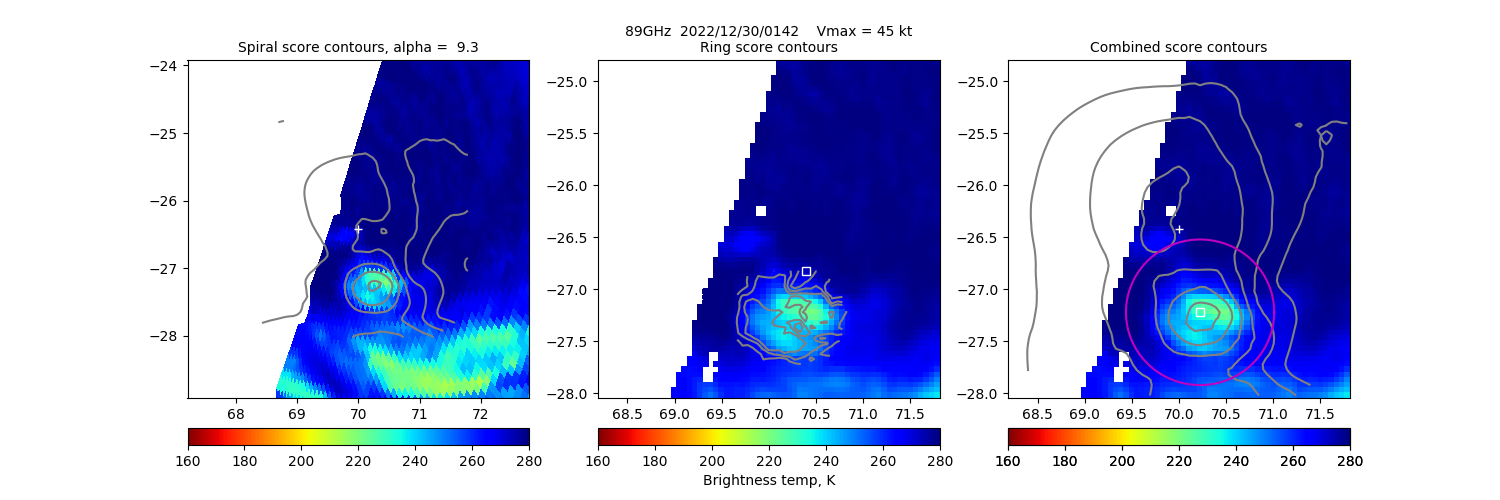
20221230 014206 N/A N/A N/A N/A N/A 45.0 SSMISF17 -26.4 70.0 -27.2 70.2 Analysis Plot
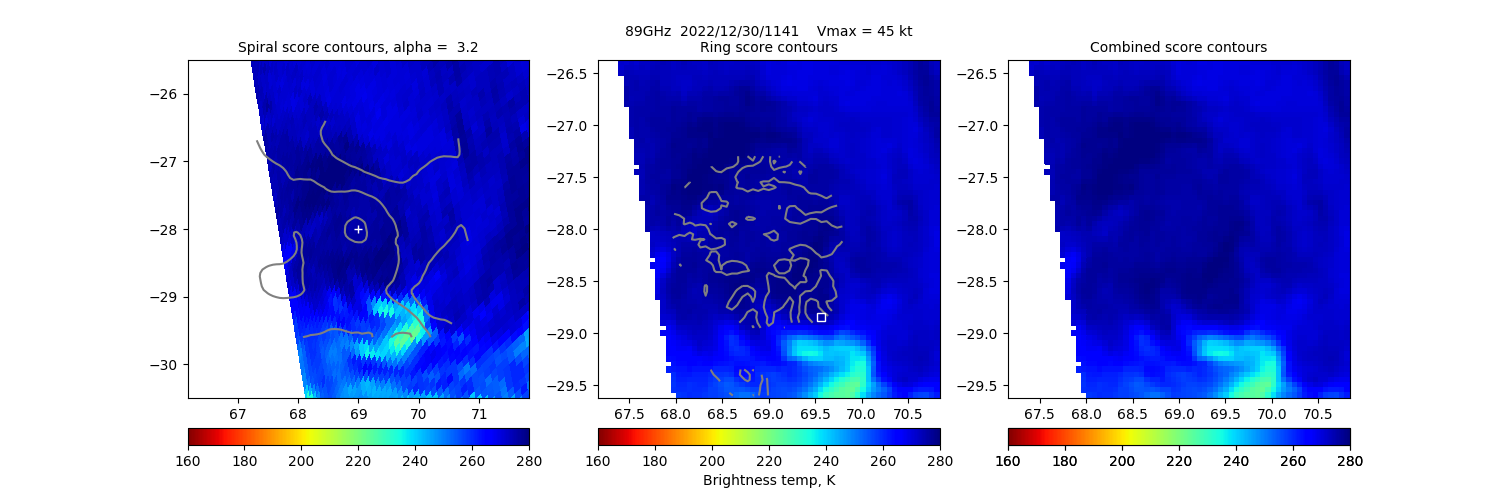
20221230 114140 N/A N/A N/A N/A N/A 45.0 SSMISF18 -28.0 69.0 -28.0 69.0 Analysis Plot
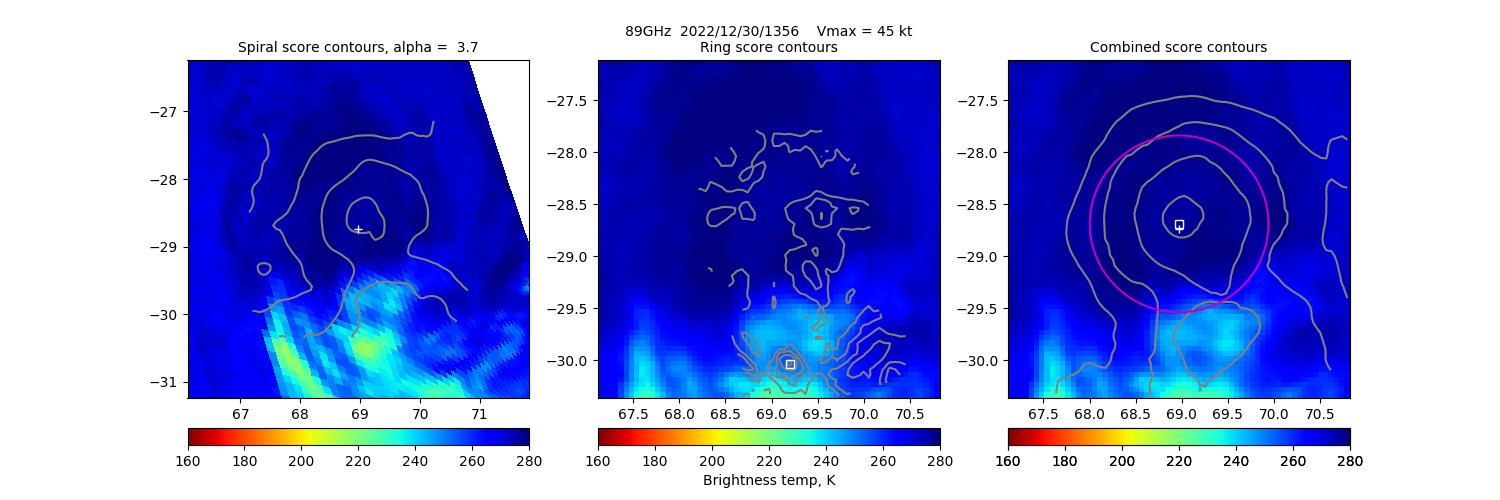
20221230 135643 -0.62 N/A N/A 179.01 0.62 45.0 SSMISF16 -28.7 69.0 -28.7 69.0 Analysis Plot
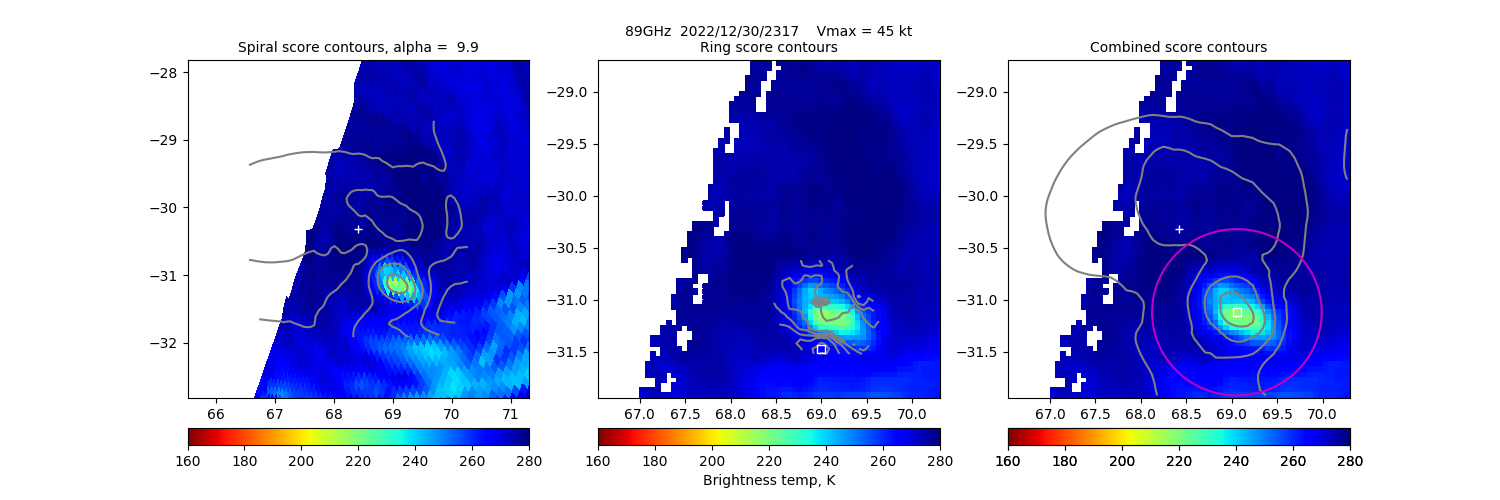
20221230 231702 N/A N/A N/A N/A N/A 45.0 SSMISF18 -30.3 68.4 -31.1 69.1 Analysis Plot
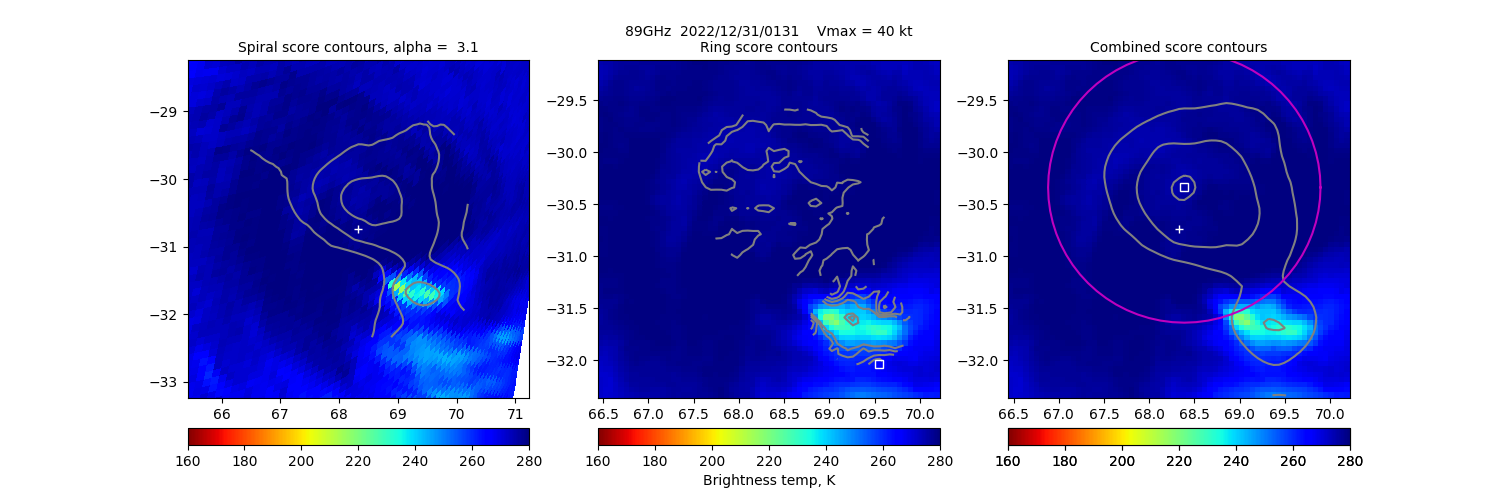
20221231 013155 N/A N/A N/A N/A N/A 40.0 SSMISF16 -30.7 68.3 -30.3 68.4 Analysis Plot
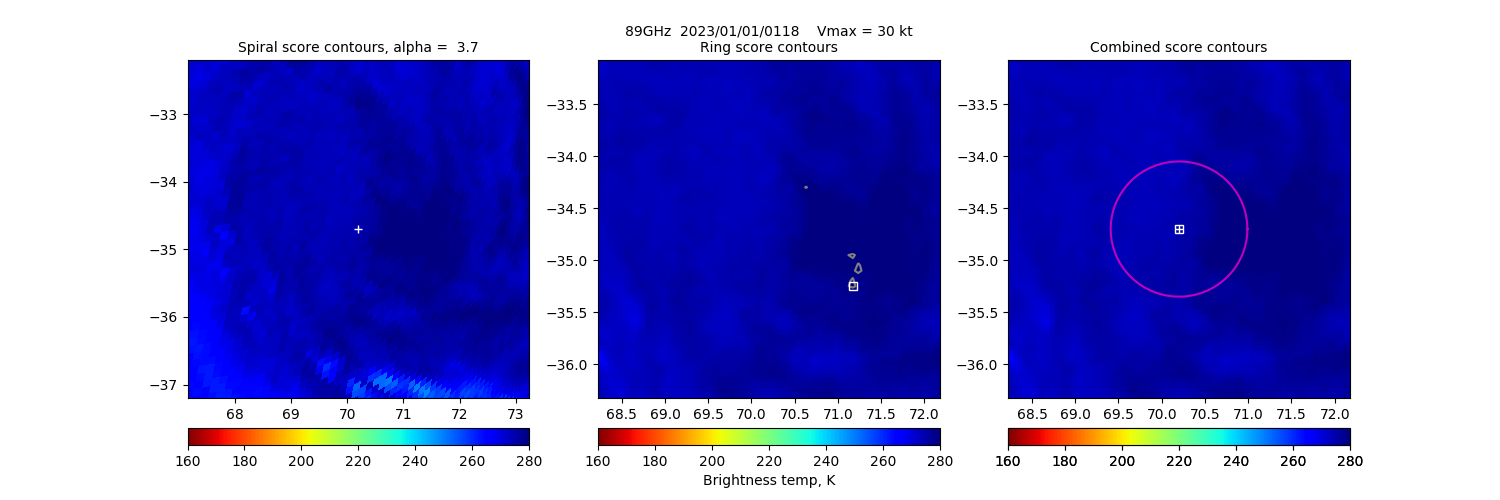
20230101 011846 -0.33 N/A N/A 134.53 0.33 30.0 SSMISF16 -34.7 70.2 -34.7 70.2 Analysis Plot
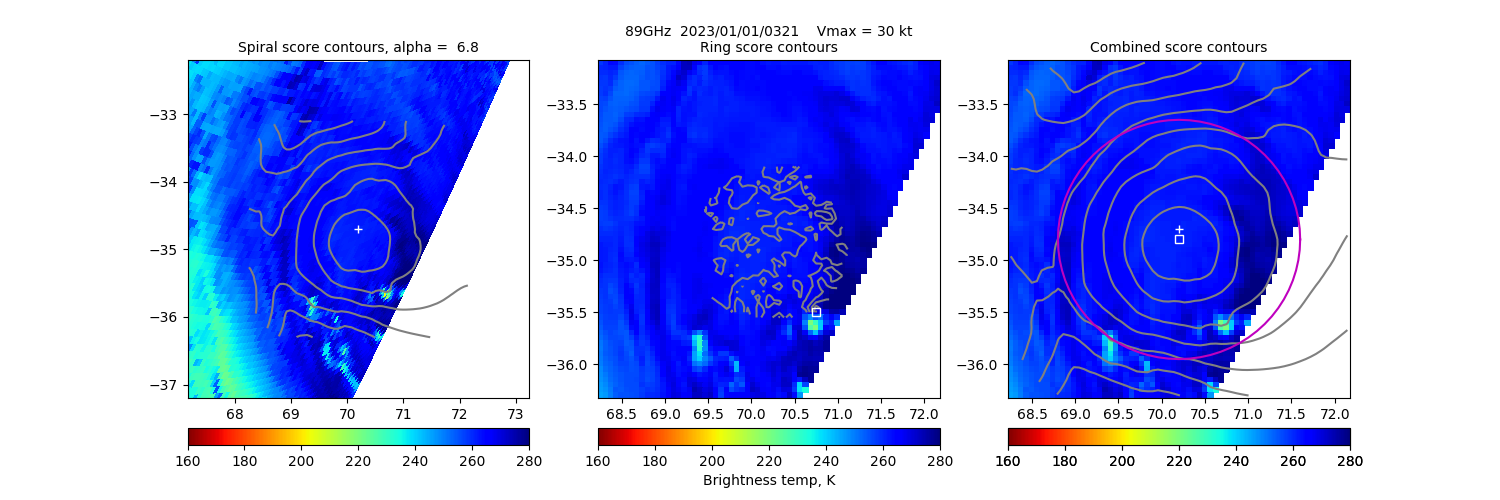
20230101 032136 N/A N/A N/A N/A N/A 30.0 GMI -34.7 70.2 -34.8 70.2 Analysis Plot
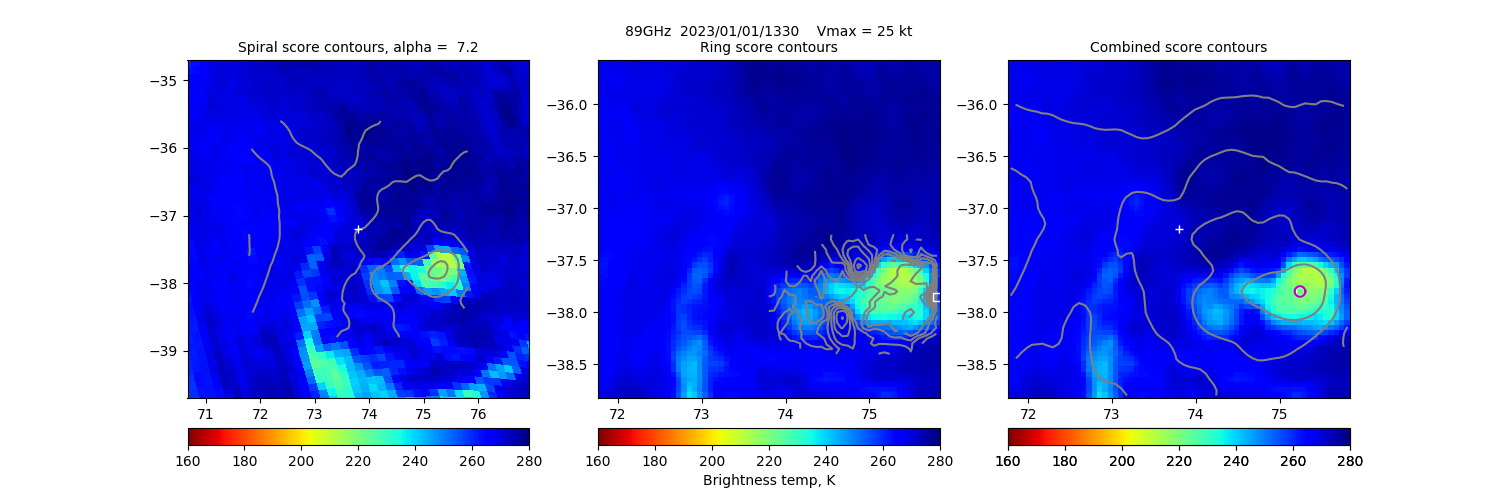
20230101 133047 N/A N/A N/A N/A N/A 25.0 SSMISF16 -37.2 73.8 -37.8 75.2 Analysis Plot
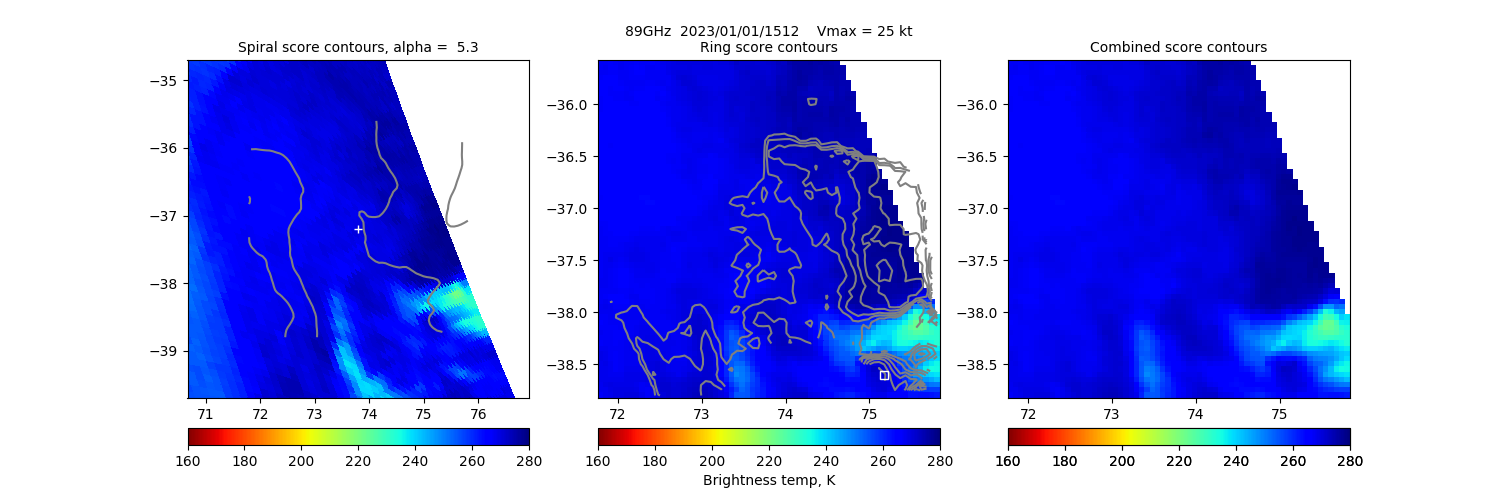
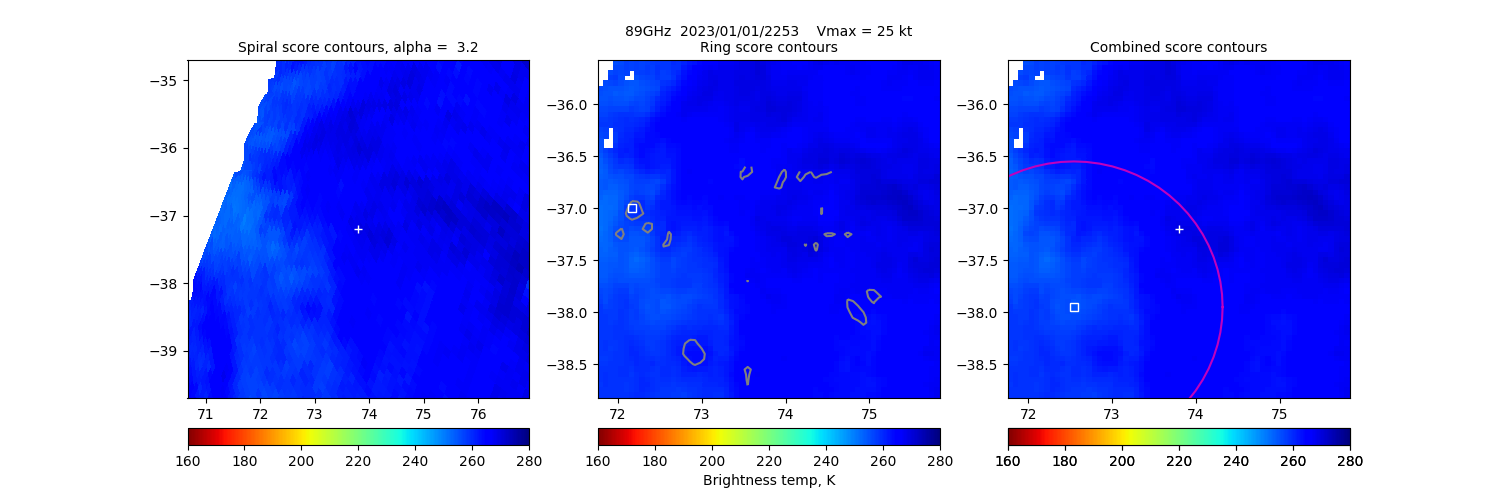
20230101 151256 N/A N/A N/A N/A N/A 25.0 SSMISF17 -37.2 73.8 -37.3 74.2 Analysis Plot
20230101 225307 N/A N/A N/A N/A N/A 25.0 SSMISF18 -37.2 73.8 -38.0 72.5 Analysis Plot
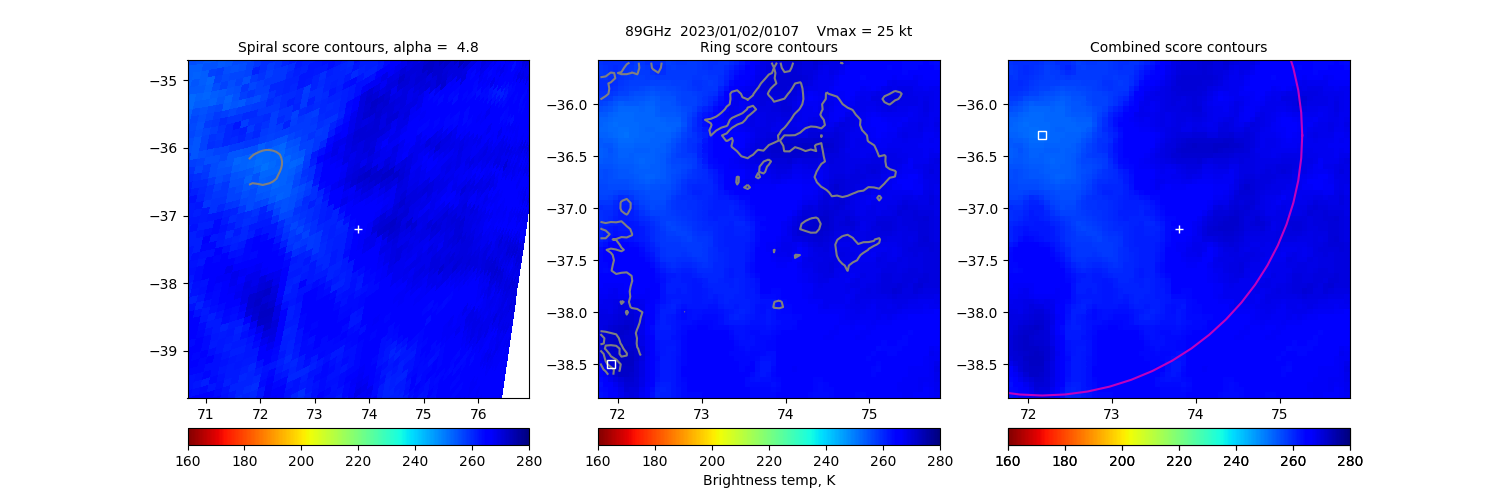
20230102 010759 N/A N/A N/A N/A N/A 25.0 SSMISF16 -37.2 73.8 -36.3 72.2 Analysis Plot
|
|
Legend: - Date/Time are determined from PMW imagery at Forecast (initial guess) Lat/Lon position. - Positive/Negative Latitude = North/South Hemisphere; Longitude = Western/Eastern Hemisphere. - "Ring Diam" value indicates the estimated surface eyewall diameter in km (the MI eyewall edge diameter minus 10 km). - "Ring Pct" is the percentage of the "ring" (eyewall inner boundary) that is 1) colder than the "hot spot" (warmest eye pixel) in the eye by 20K, or 2) the percentage that is a) colder than 232K and b) colder than the "hot spot" by 10K, whichever is greater. - Values are red if Ring % <= 65, yellow/brown if Ring % <= 85 and green if Ring % > 85. - "Tb diff" is the difference between the "hot spot" (warmest eye pixel) and the warmest pixel on the eyewall. - Intensity score are listed as negative, and not used, when the JTWC or NHC estimated Vmax is <55 kts in order to rule out weak but highly symmetric TCs. - Error messages in intensity scores: -920 is used when the hottest pixel in the eye is <200K, to prevent false positives; -930 means <85% of eyewall has observations/data. |